00017047152023FYfalseP1Y11111http://fasb.org/us-gaap/2023#PropertyPlantAndEquipmentAndFinanceLeaseRightOfUseAssetAfterAccumulatedDepreciationAndAmortizationhttp://fasb.org/us-gaap/2023#PropertyPlantAndEquipmentAndFinanceLeaseRightOfUseAssetAfterAccumulatedDepreciationAndAmortizationhttp://fasb.org/us-gaap/2023#OtherAssetsNoncurrenthttp://fasb.org/us-gaap/2023#OtherAssetsNoncurrenthttp://fasb.org/us-gaap/2023#LongTermDebtAndCapitalLeaseObligationsCurrenthttp://fasb.org/us-gaap/2023#LongTermDebtAndCapitalLeaseObligationsCurrenthttp://www.alphametresources.com/20231231#AccruedLiabilitiesAndOtherLiabilitiesCurrenthttp://www.alphametresources.com/20231231#AccruedLiabilitiesAndOtherLiabilitiesCurrenthttp://fasb.org/us-gaap/2023#LongTermDebtAndCapitalLeaseObligationshttp://fasb.org/us-gaap/2023#LongTermDebtAndCapitalLeaseObligationshttp://fasb.org/us-gaap/2023#OtherLiabilitiesNoncurrenthttp://fasb.org/us-gaap/2023#OtherLiabilitiesNoncurrenthttp://www.alphametresources.com/20231231#TradingSecuritiesMemberhttp://www.alphametresources.com/20231231#TradingSecuritiesMemberhttp://www.alphametresources.com/20231231#TradingSecuritiesMemberhttp://www.alphametresources.com/20231231#AcquisitionRelatedObligationsChangesInFairValueGainLosshttp://www.alphametresources.com/20231231#AcquisitionRelatedObligationsChangesInFairValueGainLosshttp://fasb.org/us-gaap/2023#FairValueMeasuredAtNetAssetValuePerShareMemberhttp://fasb.org/us-gaap/2023#FairValueMeasuredAtNetAssetValuePerShareMember00017047152023-01-012023-12-3100017047152023-06-30iso4217:USD00017047152024-02-19xbrli:shares00017047152022-01-012022-12-3100017047152021-01-012021-12-31iso4217:USDxbrli:shares00017047152023-12-3100017047152022-12-3100017047152021-12-3100017047152020-12-310001704715us-gaap:CommonStockMember2020-12-310001704715us-gaap:AdditionalPaidInCapitalMember2020-12-310001704715us-gaap:AccumulatedOtherComprehensiveIncomeMember2020-12-310001704715us-gaap:TreasuryStockCommonMember2020-12-310001704715us-gaap:RetainedEarningsMember2020-12-310001704715us-gaap:RetainedEarningsMember2021-01-012021-12-310001704715us-gaap:AccumulatedOtherComprehensiveIncomeMember2021-01-012021-12-310001704715us-gaap:CommonStockMember2021-01-012021-12-310001704715us-gaap:AdditionalPaidInCapitalMember2021-01-012021-12-310001704715us-gaap:TreasuryStockCommonMember2021-01-012021-12-310001704715us-gaap:CommonStockMember2021-12-310001704715us-gaap:AdditionalPaidInCapitalMember2021-12-310001704715us-gaap:AccumulatedOtherComprehensiveIncomeMember2021-12-310001704715us-gaap:TreasuryStockCommonMember2021-12-310001704715us-gaap:RetainedEarningsMember2021-12-310001704715us-gaap:RetainedEarningsMember2022-01-012022-12-310001704715us-gaap:AccumulatedOtherComprehensiveIncomeMember2022-01-012022-12-310001704715us-gaap:CommonStockMember2022-01-012022-12-310001704715us-gaap:AdditionalPaidInCapitalMember2022-01-012022-12-310001704715us-gaap:TreasuryStockCommonMember2022-01-012022-12-310001704715us-gaap:CommonStockMember2022-12-310001704715us-gaap:AdditionalPaidInCapitalMember2022-12-310001704715us-gaap:AccumulatedOtherComprehensiveIncomeMember2022-12-310001704715us-gaap:TreasuryStockCommonMember2022-12-310001704715us-gaap:RetainedEarningsMember2022-12-310001704715us-gaap:RetainedEarningsMember2023-01-012023-12-310001704715us-gaap:AccumulatedOtherComprehensiveIncomeMember2023-01-012023-12-310001704715us-gaap:CommonStockMember2023-01-012023-12-310001704715us-gaap:AdditionalPaidInCapitalMember2023-01-012023-12-310001704715us-gaap:TreasuryStockCommonMember2023-01-012023-12-310001704715us-gaap:CommonStockMember2023-12-310001704715us-gaap:AdditionalPaidInCapitalMember2023-12-310001704715us-gaap:AccumulatedOtherComprehensiveIncomeMember2023-12-310001704715us-gaap:TreasuryStockCommonMember2023-12-310001704715us-gaap:RetainedEarningsMember2023-12-310001704715srt:MinimumMemberamr:MiningEquipmentBuildingsandOtherFixedAssetsMember2023-12-310001704715amr:MiningEquipmentBuildingsandOtherFixedAssetsMembersrt:MaximumMember2023-12-310001704715us-gaap:MiningPropertiesAndMineralRightsMember2023-01-012023-12-310001704715us-gaap:MiningPropertiesAndMineralRightsMember2022-01-012022-12-310001704715us-gaap:MiningPropertiesAndMineralRightsMember2021-01-012021-12-310001704715amr:MinePermitsMember2023-12-310001704715amr:MinePermitsMember2022-12-310001704715amr:MinePermitsMember2023-01-012023-12-310001704715amr:MinePermitsMember2022-01-012022-12-310001704715amr:MinePermitsMember2021-01-012021-12-310001704715us-gaap:CoalSupplyAgreementsMember2023-01-012023-12-310001704715us-gaap:CoalSupplyAgreementsMember2022-01-012022-12-310001704715us-gaap:CoalSupplyAgreementsMember2021-01-012021-12-310001704715amr:FreightHaulingAndTransportationServicesBusinessMember2023-01-012023-01-310001704715amr:FreightHaulingAndTransportationServicesBusinessMember2023-01-310001704715amr:MiningEquipmentComponentManufacturingAndRebuildingBusinessMember2022-12-012022-12-310001704715amr:MiningEquipmentComponentManufacturingAndRebuildingBusinessMember2022-12-310001704715us-gaap:WorkersCompensationInsuranceMember2023-12-310001704715us-gaap:WorkersCompensationInsuranceMember2022-12-31amr:segment0001704715country:US2023-01-012023-12-310001704715us-gaap:NonUsMemberamr:CoalMetMember2023-01-012023-12-310001704715us-gaap:NonUsMemberamr:CoalMetMember2022-01-012022-12-310001704715us-gaap:NonUsMemberamr:CoalMetMember2021-01-012021-12-310001704715amr:CoalThermalMemberus-gaap:NonUsMember2023-01-012023-12-310001704715amr:CoalThermalMemberus-gaap:NonUsMember2022-01-012022-12-310001704715amr:CoalThermalMemberus-gaap:NonUsMember2021-01-012021-12-310001704715us-gaap:NonUsMemberus-gaap:PublicUtilitiesInventoryCoalMember2023-01-012023-12-310001704715us-gaap:NonUsMemberus-gaap:PublicUtilitiesInventoryCoalMember2022-01-012022-12-310001704715us-gaap:NonUsMemberus-gaap:PublicUtilitiesInventoryCoalMember2021-01-012021-12-310001704715amr:CoalMetMembercountry:US2023-01-012023-12-310001704715amr:CoalMetMembercountry:US2022-01-012022-12-310001704715amr:CoalMetMembercountry:US2021-01-012021-12-310001704715amr:CoalThermalMembercountry:US2023-01-012023-12-310001704715amr:CoalThermalMembercountry:US2022-01-012022-12-310001704715amr:CoalThermalMembercountry:US2021-01-012021-12-310001704715us-gaap:PublicUtilitiesInventoryCoalMembercountry:US2023-01-012023-12-310001704715us-gaap:PublicUtilitiesInventoryCoalMembercountry:US2022-01-012022-12-310001704715us-gaap:PublicUtilitiesInventoryCoalMembercountry:US2021-01-012021-12-310001704715amr:CoalMetMember2023-01-012023-12-310001704715amr:CoalMetMember2022-01-012022-12-310001704715amr:CoalMetMember2021-01-012021-12-310001704715amr:CoalThermalMember2023-01-012023-12-310001704715amr:CoalThermalMember2022-01-012022-12-310001704715amr:CoalThermalMember2021-01-012021-12-310001704715us-gaap:PublicUtilitiesInventoryCoalMember2023-01-012023-12-310001704715us-gaap:PublicUtilitiesInventoryCoalMember2022-01-012022-12-310001704715us-gaap:PublicUtilitiesInventoryCoalMember2021-01-012021-12-3100017047152024-01-012023-12-3100017047152025-01-012023-12-3100017047152026-01-012023-12-3100017047152027-01-012023-12-3100017047152028-01-012023-12-310001704715us-gaap:AccumulatedDefinedBenefitPlansAdjustmentMember2022-12-310001704715us-gaap:AccumulatedDefinedBenefitPlansAdjustmentMember2023-01-012023-12-310001704715us-gaap:AccumulatedDefinedBenefitPlansAdjustmentMember2023-12-310001704715us-gaap:AccumulatedDefinedBenefitPlansAdjustmentMember2021-12-310001704715us-gaap:AccumulatedDefinedBenefitPlansAdjustmentMember2022-01-012022-12-310001704715us-gaap:AccumulatedDefinedBenefitPlansAdjustmentMember2020-12-310001704715us-gaap:AccumulatedDefinedBenefitPlansAdjustmentMember2021-01-012021-12-310001704715us-gaap:AccumulatedDefinedBenefitPlansAdjustmentNetUnamortizedGainLossMemberus-gaap:ReclassificationOutOfAccumulatedOtherComprehensiveIncomeMember2023-01-012023-12-310001704715us-gaap:AccumulatedDefinedBenefitPlansAdjustmentNetUnamortizedGainLossMemberus-gaap:ReclassificationOutOfAccumulatedOtherComprehensiveIncomeMember2022-01-012022-12-310001704715us-gaap:AccumulatedDefinedBenefitPlansAdjustmentNetUnamortizedGainLossMemberus-gaap:ReclassificationOutOfAccumulatedOtherComprehensiveIncomeMember2021-01-012021-12-310001704715us-gaap:ReclassificationOutOfAccumulatedOtherComprehensiveIncomeMemberamr:AccumulatedDefinedBenefitPlantAdjustmentSettlementGainLossAttributableToParentMember2023-01-012023-12-310001704715us-gaap:ReclassificationOutOfAccumulatedOtherComprehensiveIncomeMemberamr:AccumulatedDefinedBenefitPlantAdjustmentSettlementGainLossAttributableToParentMember2022-01-012022-12-310001704715us-gaap:ReclassificationOutOfAccumulatedOtherComprehensiveIncomeMemberamr:AccumulatedDefinedBenefitPlantAdjustmentSettlementGainLossAttributableToParentMember2021-01-012021-12-310001704715us-gaap:ReclassificationOutOfAccumulatedOtherComprehensiveIncomeMemberus-gaap:AccumulatedDefinedBenefitPlansAdjustmentMember2023-01-012023-12-310001704715us-gaap:ReclassificationOutOfAccumulatedOtherComprehensiveIncomeMemberus-gaap:AccumulatedDefinedBenefitPlansAdjustmentMember2022-01-012022-12-310001704715us-gaap:ReclassificationOutOfAccumulatedOtherComprehensiveIncomeMemberus-gaap:AccumulatedDefinedBenefitPlansAdjustmentMember2021-01-012021-12-310001704715us-gaap:EmployeeStockOptionMember2023-01-012023-12-310001704715us-gaap:EmployeeStockOptionMember2022-01-012022-12-310001704715us-gaap:EmployeeStockOptionMember2021-01-012021-12-310001704715us-gaap:StockCompensationPlanMember2023-01-012023-12-310001704715us-gaap:StockCompensationPlanMember2022-01-012022-12-310001704715us-gaap:StockCompensationPlanMember2021-01-012021-12-3100017047152023-02-2100017047152023-10-3100017047152022-03-042023-12-310001704715amr:AnnualDividendMember2022-05-032022-05-0300017047152022-05-032022-05-0300017047152023-02-212023-02-2100017047152023-04-032023-04-0300017047152023-05-032023-05-0300017047152023-07-052023-07-0500017047152023-08-022023-08-0200017047152023-10-032023-10-0300017047152023-10-312023-10-3100017047152023-12-152023-12-1500017047152016-07-2600017047152022-12-1500017047152023-03-1500017047152023-06-150001704715amr:PlantandMiningEquipmentMember2023-12-310001704715amr:PlantandMiningEquipmentMember2022-12-310001704715us-gaap:MineDevelopmentMember2023-12-310001704715us-gaap:MineDevelopmentMember2022-12-310001704715us-gaap:LandMember2023-12-310001704715us-gaap:LandMember2022-12-310001704715amr:OfficeEquipmentSoftwareandOtherMember2023-12-310001704715amr:OfficeEquipmentSoftwareandOtherMember2022-12-310001704715us-gaap:ConstructionInProgressMember2023-12-310001704715us-gaap:ConstructionInProgressMember2022-12-310001704715amr:DepreciationDepletionandAmortizationMember2023-01-012023-12-310001704715amr:DepreciationDepletionandAmortizationMember2022-01-012022-12-310001704715amr:DepreciationDepletionandAmortizationMember2021-01-012021-12-310001704715amr:EquipmentPurchaseCommitmentsMember2023-12-310001704715amr:DominionTerminalAssociatesLLPMember2023-12-31xbrli:pure0001704715amr:ABLFacilityMemberus-gaap:RevolvingCreditFacilityMember2021-12-060001704715amr:ABLFacilityMemberus-gaap:LetterOfCreditMember2021-12-060001704715amr:ABLFacilityMemberus-gaap:LineOfCreditMember2021-12-062021-12-060001704715amr:ABLFacilityMemberus-gaap:RevolvingCreditFacilityMemberamr:SecuredOvernightFinancingRateSOFRMemberus-gaap:LineOfCreditMember2021-12-062021-12-060001704715amr:ABLFacilityMemberus-gaap:RevolvingCreditFacilityMemberus-gaap:BaseRateMemberus-gaap:LineOfCreditMember2021-12-062021-12-060001704715amr:ABLFacilityMemberus-gaap:RevolvingCreditFacilityMemberus-gaap:LineOfCreditMember2022-12-310001704715amr:ABLFacilityMemberus-gaap:LetterOfCreditMember2021-12-062021-12-060001704715amr:ABLFacilityMemberus-gaap:LineOfCreditMember2022-12-310001704715amr:ABLFacilityMember2023-10-272023-10-270001704715us-gaap:RevolvingCreditFacilityMemberamr:NewAssetBasedRevolvingCreditFacilityMember2023-10-270001704715us-gaap:LetterOfCreditMemberamr:NewAssetBasedRevolvingCreditFacilityMember2023-10-270001704715us-gaap:LetterOfCreditMemberamr:NewAssetBasedRevolvingCreditFacilityMember2023-12-310001704715us-gaap:LetterOfCreditMemberamr:NewAssetBasedRevolvingCreditFacilityMember2023-10-272023-10-270001704715amr:SecuredOvernightFinancingRateSOFRMemberamr:NewAssetBasedRevolvingCreditFacilityMember2023-10-272023-10-270001704715us-gaap:BaseRateMemberamr:NewAssetBasedRevolvingCreditFacilityMember2023-10-272023-10-270001704715us-gaap:RevolvingCreditFacilityMemberamr:NewAssetBasedRevolvingCreditFacilityMember2023-10-272023-10-270001704715amr:NewAssetBasedRevolvingCreditFacilityMember2023-12-310001704715amr:ContingentRevenueObligationMember2023-12-310001704715amr:ContingentRevenueObligationMember2022-12-310001704715amr:EnvironmentalSettlementObligationsMember2023-12-310001704715amr:EnvironmentalSettlementObligationsMember2022-12-310001704715amr:ContingentRevenueObligationThresholdOneMember2018-11-090001704715amr:ContingentRevenueObligationThresholdTwoMember2018-11-090001704715us-gaap:FairValueMeasurementsRecurringMember2023-12-310001704715us-gaap:FairValueMeasurementsRecurringMemberus-gaap:FairValueInputsLevel1Member2023-12-310001704715us-gaap:FairValueInputsLevel2Memberus-gaap:FairValueMeasurementsRecurringMember2023-12-310001704715us-gaap:FairValueInputsLevel3Memberus-gaap:FairValueMeasurementsRecurringMember2023-12-310001704715us-gaap:FairValueMeasurementsRecurringMember2022-12-310001704715us-gaap:FairValueMeasurementsRecurringMemberus-gaap:FairValueInputsLevel1Member2022-12-310001704715us-gaap:FairValueInputsLevel2Memberus-gaap:FairValueMeasurementsRecurringMember2022-12-310001704715us-gaap:FairValueInputsLevel3Memberus-gaap:FairValueMeasurementsRecurringMember2022-12-310001704715us-gaap:FairValueInputsLevel3Member2022-12-310001704715us-gaap:FairValueInputsLevel3Member2023-01-012023-12-310001704715us-gaap:FairValueInputsLevel3Member2023-12-310001704715us-gaap:FairValueInputsLevel3Member2021-12-310001704715us-gaap:FairValueInputsLevel3Member2022-01-012022-12-310001704715us-gaap:DomesticCountryMemberamr:IRSSection382LimitationOneMember2023-12-310001704715amr:IRSSection382LimitationTwoMemberus-gaap:DomesticCountryMember2023-12-310001704715us-gaap:CapitalLossCarryforwardMemberus-gaap:DomesticCountryMember2023-12-310001704715us-gaap:TaxYear2016Memberus-gaap:DomesticCountryMember2021-09-300001704715amr:ANRInc.andAlphaNaturalResourcesHoldingsInc.Member2018-11-092018-11-09amr:plan0001704715amr:ANRInc.andAlphaNaturalResourcesHoldingsInc.Memberus-gaap:PensionPlansDefinedBenefitMemberamr:FrozenDefinedBenefitPensionPlanPre2004BalanceMember2023-12-310001704715amr:ANRInc.andAlphaNaturalResourcesHoldingsInc.Memberus-gaap:PensionPlansDefinedBenefitMemberamr:FrozenDefinedBenefitPensionPlanPost2004BalanceMember2023-12-310001704715us-gaap:PensionPlansDefinedBenefitMember2022-12-310001704715us-gaap:PensionPlansDefinedBenefitMember2021-12-310001704715us-gaap:PensionPlansDefinedBenefitMember2023-01-012023-12-310001704715us-gaap:PensionPlansDefinedBenefitMember2022-01-012022-12-310001704715us-gaap:PensionPlansDefinedBenefitMember2023-12-310001704715us-gaap:PensionPlansDefinedBenefitMember2021-01-012021-12-310001704715us-gaap:PensionPlansDefinedBenefitMembersrt:ScenarioForecastMember2024-01-012024-12-310001704715us-gaap:DefinedBenefitPlanEquitySecuritiesMemberus-gaap:PensionPlansDefinedBenefitMembersrt:ScenarioForecastMember2024-12-310001704715us-gaap:DefinedBenefitPlanEquitySecuritiesMemberus-gaap:PensionPlansDefinedBenefitMember2023-12-310001704715us-gaap:PensionPlansDefinedBenefitMemberus-gaap:DefinedBenefitPlanDebtSecurityMembersrt:ScenarioForecastMember2024-12-310001704715us-gaap:PensionPlansDefinedBenefitMemberus-gaap:DefinedBenefitPlanDebtSecurityMember2023-12-310001704715us-gaap:PensionPlansDefinedBenefitMembersrt:ScenarioForecastMemberamr:DefinedBenefitPlanOtherInvestmentsMember2024-12-310001704715us-gaap:PensionPlansDefinedBenefitMemberamr:DefinedBenefitPlanOtherInvestmentsMember2023-12-310001704715us-gaap:PensionPlansDefinedBenefitMembersrt:ScenarioForecastMember2024-12-310001704715us-gaap:PensionPlansDefinedBenefitMembersrt:MaximumMember2023-12-310001704715us-gaap:PensionPlansDefinedBenefitMemberus-gaap:EquitySecuritiesMember2023-12-310001704715us-gaap:PensionPlansDefinedBenefitMemberus-gaap:DebtSecuritiesMember2023-12-31amr:fundedStatusLevel0001704715us-gaap:PensionPlansDefinedBenefitMembersrt:MaximumMember2021-12-310001704715us-gaap:FairValueInputsLevel12And3Memberus-gaap:DefinedBenefitPlanEquitySecuritiesMemberus-gaap:PensionPlansDefinedBenefitMember2023-12-310001704715us-gaap:DefinedBenefitPlanEquitySecuritiesMemberus-gaap:PensionPlansDefinedBenefitMemberus-gaap:FairValueInputsLevel1Member2023-12-310001704715us-gaap:DefinedBenefitPlanEquitySecuritiesMemberus-gaap:PensionPlansDefinedBenefitMemberus-gaap:FairValueInputsLevel2Member2023-12-310001704715us-gaap:FairValueInputsLevel3Memberus-gaap:DefinedBenefitPlanEquitySecuritiesMemberus-gaap:PensionPlansDefinedBenefitMember2023-12-310001704715us-gaap:FairValueInputsLevel12And3Memberus-gaap:PensionPlansDefinedBenefitMemberus-gaap:DefinedBenefitPlanDebtSecurityMember2023-12-310001704715us-gaap:PensionPlansDefinedBenefitMemberus-gaap:DefinedBenefitPlanDebtSecurityMemberus-gaap:FairValueInputsLevel1Member2023-12-310001704715us-gaap:PensionPlansDefinedBenefitMemberus-gaap:FairValueInputsLevel2Memberus-gaap:DefinedBenefitPlanDebtSecurityMember2023-12-310001704715us-gaap:FairValueInputsLevel3Memberus-gaap:PensionPlansDefinedBenefitMemberus-gaap:DefinedBenefitPlanDebtSecurityMember2023-12-310001704715us-gaap:FairValueInputsLevel12And3Memberus-gaap:DefinedBenefitPlanCashAndCashEquivalentsMemberus-gaap:PensionPlansDefinedBenefitMember2023-12-310001704715us-gaap:DefinedBenefitPlanCashAndCashEquivalentsMemberus-gaap:PensionPlansDefinedBenefitMemberus-gaap:FairValueInputsLevel1Member2023-12-310001704715us-gaap:DefinedBenefitPlanCashAndCashEquivalentsMemberus-gaap:PensionPlansDefinedBenefitMemberus-gaap:FairValueInputsLevel2Member2023-12-310001704715us-gaap:FairValueInputsLevel3Memberus-gaap:DefinedBenefitPlanCashAndCashEquivalentsMemberus-gaap:PensionPlansDefinedBenefitMember2023-12-310001704715us-gaap:FairValueInputsLevel12And3Memberus-gaap:PensionPlansDefinedBenefitMemberamr:DefinedBenefitPlanGuaranteeInsuranceContractMember2023-12-310001704715us-gaap:PensionPlansDefinedBenefitMemberamr:DefinedBenefitPlanGuaranteeInsuranceContractMemberus-gaap:FairValueInputsLevel1Member2023-12-310001704715us-gaap:PensionPlansDefinedBenefitMemberus-gaap:FairValueInputsLevel2Memberamr:DefinedBenefitPlanGuaranteeInsuranceContractMember2023-12-310001704715us-gaap:FairValueInputsLevel3Memberus-gaap:PensionPlansDefinedBenefitMemberamr:DefinedBenefitPlanGuaranteeInsuranceContractMember2023-12-310001704715us-gaap:FairValueInputsLevel12And3Memberus-gaap:PensionPlansDefinedBenefitMemberamr:DefinedBenefitPlanAssetsBeforeReceivablesForInvestmentsSoldMember2023-12-310001704715us-gaap:PensionPlansDefinedBenefitMemberamr:DefinedBenefitPlanAssetsBeforeReceivablesForInvestmentsSoldMemberus-gaap:FairValueInputsLevel1Member2023-12-310001704715us-gaap:PensionPlansDefinedBenefitMemberamr:DefinedBenefitPlanAssetsBeforeReceivablesForInvestmentsSoldMemberus-gaap:FairValueInputsLevel2Member2023-12-310001704715us-gaap:FairValueInputsLevel3Memberus-gaap:PensionPlansDefinedBenefitMemberamr:DefinedBenefitPlanAssetsBeforeReceivablesForInvestmentsSoldMember2023-12-310001704715amr:DefinedBenefitPlanReceivablesMemberus-gaap:PensionPlansDefinedBenefitMember2023-12-310001704715us-gaap:PensionPlansDefinedBenefitMemberamr:DefinedBenefitPlanAssetsAfterReceivablesForInvestmentsSoldMember2023-12-310001704715us-gaap:PensionPlansDefinedBenefitMemberus-gaap:PrivateEquityFundsMember2023-12-310001704715us-gaap:FairValueInputsLevel3Memberus-gaap:PensionPlansDefinedBenefitMember2022-12-310001704715us-gaap:FairValueInputsLevel3Memberus-gaap:PensionPlansDefinedBenefitMember2023-01-012023-12-310001704715us-gaap:FairValueInputsLevel3Memberus-gaap:PensionPlansDefinedBenefitMember2023-12-310001704715us-gaap:FairValueInputsLevel12And3Memberus-gaap:DefinedBenefitPlanEquitySecuritiesMemberus-gaap:PensionPlansDefinedBenefitMember2022-12-310001704715us-gaap:DefinedBenefitPlanEquitySecuritiesMemberus-gaap:PensionPlansDefinedBenefitMemberus-gaap:FairValueInputsLevel1Member2022-12-310001704715us-gaap:DefinedBenefitPlanEquitySecuritiesMemberus-gaap:PensionPlansDefinedBenefitMemberus-gaap:FairValueInputsLevel2Member2022-12-310001704715us-gaap:FairValueInputsLevel3Memberus-gaap:DefinedBenefitPlanEquitySecuritiesMemberus-gaap:PensionPlansDefinedBenefitMember2022-12-310001704715us-gaap:FairValueInputsLevel12And3Memberus-gaap:PensionPlansDefinedBenefitMemberus-gaap:DefinedBenefitPlanDebtSecurityMember2022-12-310001704715us-gaap:PensionPlansDefinedBenefitMemberus-gaap:DefinedBenefitPlanDebtSecurityMemberus-gaap:FairValueInputsLevel1Member2022-12-310001704715us-gaap:PensionPlansDefinedBenefitMemberus-gaap:FairValueInputsLevel2Memberus-gaap:DefinedBenefitPlanDebtSecurityMember2022-12-310001704715us-gaap:FairValueInputsLevel3Memberus-gaap:PensionPlansDefinedBenefitMemberus-gaap:DefinedBenefitPlanDebtSecurityMember2022-12-310001704715us-gaap:FairValueInputsLevel12And3Memberus-gaap:DefinedBenefitPlanCashAndCashEquivalentsMemberus-gaap:PensionPlansDefinedBenefitMember2022-12-310001704715us-gaap:DefinedBenefitPlanCashAndCashEquivalentsMemberus-gaap:PensionPlansDefinedBenefitMemberus-gaap:FairValueInputsLevel1Member2022-12-310001704715us-gaap:DefinedBenefitPlanCashAndCashEquivalentsMemberus-gaap:PensionPlansDefinedBenefitMemberus-gaap:FairValueInputsLevel2Member2022-12-310001704715us-gaap:FairValueInputsLevel3Memberus-gaap:DefinedBenefitPlanCashAndCashEquivalentsMemberus-gaap:PensionPlansDefinedBenefitMember2022-12-310001704715us-gaap:FairValueInputsLevel12And3Memberus-gaap:PensionPlansDefinedBenefitMemberamr:DefinedBenefitPlanGuaranteeInsuranceContractMember2022-12-310001704715us-gaap:PensionPlansDefinedBenefitMemberamr:DefinedBenefitPlanGuaranteeInsuranceContractMemberus-gaap:FairValueInputsLevel1Member2022-12-310001704715us-gaap:PensionPlansDefinedBenefitMemberus-gaap:FairValueInputsLevel2Memberamr:DefinedBenefitPlanGuaranteeInsuranceContractMember2022-12-310001704715us-gaap:FairValueInputsLevel3Memberus-gaap:PensionPlansDefinedBenefitMemberamr:DefinedBenefitPlanGuaranteeInsuranceContractMember2022-12-310001704715us-gaap:FairValueInputsLevel12And3Memberus-gaap:PensionPlansDefinedBenefitMemberamr:DefinedBenefitPlanAssetsBeforeReceivablesForInvestmentsSoldMember2022-12-310001704715us-gaap:PensionPlansDefinedBenefitMemberamr:DefinedBenefitPlanAssetsBeforeReceivablesForInvestmentsSoldMemberus-gaap:FairValueInputsLevel1Member2022-12-310001704715us-gaap:PensionPlansDefinedBenefitMemberamr:DefinedBenefitPlanAssetsBeforeReceivablesForInvestmentsSoldMemberus-gaap:FairValueInputsLevel2Member2022-12-310001704715us-gaap:FairValueInputsLevel3Memberus-gaap:PensionPlansDefinedBenefitMemberamr:DefinedBenefitPlanAssetsBeforeReceivablesForInvestmentsSoldMember2022-12-310001704715amr:DefinedBenefitPlanReceivablesMemberus-gaap:PensionPlansDefinedBenefitMember2022-12-310001704715us-gaap:PensionPlansDefinedBenefitMemberamr:DefinedBenefitPlanAssetsAfterReceivablesForInvestmentsSoldMember2022-12-310001704715us-gaap:PensionPlansDefinedBenefitMemberus-gaap:PrivateEquityFundsMember2022-12-310001704715us-gaap:FairValueInputsLevel3Memberus-gaap:PensionPlansDefinedBenefitMember2021-12-310001704715us-gaap:FairValueInputsLevel3Memberus-gaap:PensionPlansDefinedBenefitMember2022-01-012022-12-310001704715us-gaap:DefinedBenefitPostretirementHealthCoverageMember2023-01-012023-12-310001704715us-gaap:DefinedBenefitPostretirementHealthCoverageMember2022-01-012022-12-310001704715us-gaap:DefinedBenefitPostretirementHealthCoverageMember2021-01-012021-12-310001704715us-gaap:DefinedBenefitPostretirementHealthCoverageMember2022-12-310001704715us-gaap:DefinedBenefitPostretirementHealthCoverageMember2021-12-310001704715us-gaap:DefinedBenefitPostretirementHealthCoverageMember2023-12-310001704715us-gaap:DefinedBenefitPostretirementHealthCoverageMemberamr:CurrentLiabilitiesMember2023-12-310001704715us-gaap:DefinedBenefitPostretirementHealthCoverageMemberamr:CurrentLiabilitiesMember2022-12-310001704715us-gaap:DefinedBenefitPostretirementHealthCoverageMemberamr:NoncurrentLiabilitiesMember2023-12-310001704715us-gaap:DefinedBenefitPostretirementHealthCoverageMemberamr:NoncurrentLiabilitiesMember2022-12-310001704715us-gaap:DefinedBenefitPostretirementLifeInsuranceMember2023-12-310001704715us-gaap:DefinedBenefitPostretirementLifeInsuranceMemberamr:CurrentLiabilitiesMember2023-12-310001704715us-gaap:DefinedBenefitPostretirementLifeInsuranceMember2022-12-310001704715us-gaap:DefinedBenefitPostretirementLifeInsuranceMemberamr:CurrentLiabilitiesMember2022-12-3100017047152022-07-012022-09-300001704715amr:ManagementIncentivePlanMember2023-12-310001704715amr:LongTermIncentivePlanMember2023-12-310001704715amr:ANRInc.2017EquityIncentivePlanMember2018-11-092018-11-090001704715amr:ANRInc.2017EquityIncentivePlanMember2023-12-31amr:award_type0001704715us-gaap:SellingGeneralAndAdministrativeExpensesMember2023-01-012023-12-310001704715us-gaap:SellingGeneralAndAdministrativeExpensesMember2022-01-012022-12-310001704715us-gaap:SellingGeneralAndAdministrativeExpensesMember2021-01-012021-12-310001704715amr:ManagementIncentivePlanAndLongTermIncentivePlanMember2023-01-012023-12-310001704715amr:ManagementIncentivePlanAndLongTermIncentivePlanMember2022-01-012022-12-310001704715amr:ManagementIncentivePlanAndLongTermIncentivePlanMember2021-01-012021-12-310001704715srt:BoardOfDirectorsChairmanMemberus-gaap:RestrictedStockUnitsRSUMemberus-gaap:ShareBasedPaymentArrangementNonemployeeMember2023-01-012023-12-310001704715amr:LongTermIncentivePlanMemberamr:RestrictedStockUnitsRSUsTimeBasedMember2023-01-012023-12-310001704715us-gaap:ShareBasedPaymentArrangementEmployeeMemberamr:PerformanceBasedRestrictedStockUnitsMemberamr:LongTermIncentivePlanMember2023-01-012023-12-310001704715us-gaap:ShareBasedPaymentArrangementEmployeeMemberamr:PerformanceBasedRestrictedStockUnitsMembersrt:MinimumMember2023-01-012023-12-310001704715us-gaap:ShareBasedPaymentArrangementEmployeeMemberamr:PerformanceBasedRestrictedStockUnitsMembersrt:MaximumMember2023-01-012023-12-310001704715us-gaap:ShareBasedPaymentArrangementEmployeeMemberamr:OperationalPerformanceBasedRestrictedStockUnitsMemberamr:LongTermIncentivePlanMember2023-01-012023-12-310001704715us-gaap:ShareBasedPaymentArrangementEmployeeMemberamr:LongTermIncentivePlanMemberamr:RelativePerformanceBasedRestrictedStockUnitsMember2023-01-012023-12-310001704715us-gaap:ShareBasedPaymentArrangementEmployeeMemberamr:LongTermIncentivePlanMemberamr:RelativePerformanceBasedRestrictedStockUnitsMemberamr:ClosingStockPriceOnTradingDayBeforeGrantDateMember2023-01-012023-12-310001704715us-gaap:ShareBasedPaymentArrangementEmployeeMemberamr:MonteCarloSimulationMemberamr:LongTermIncentivePlanMemberamr:RelativePerformanceBasedRestrictedStockUnitsMember2023-01-012023-12-310001704715amr:RelativePerformanceBasedRestrictedStockUnitsMember2023-12-310001704715amr:RelativePerformanceBasedRestrictedStockUnitsMember2023-01-012023-12-310001704715amr:RelativePerformanceBasedRestrictedStockUnitsMember2022-01-012022-12-31utr:D0001704715amr:ManagementIncentivePlanAndLongTermIncentivePlanMemberamr:RestrictedStockUnitsRSUsTimeBasedMember2022-01-012022-12-310001704715us-gaap:ShareBasedPaymentArrangementEmployeeMemberamr:PerformanceBasedRestrictedStockUnitsMemberamr:LongTermIncentivePlanMember2022-01-012022-12-310001704715us-gaap:ShareBasedPaymentArrangementEmployeeMemberamr:PerformanceBasedRestrictedStockUnitsMembersrt:MinimumMemberamr:LongTermIncentivePlanMember2022-01-012022-12-310001704715us-gaap:ShareBasedPaymentArrangementEmployeeMemberamr:PerformanceBasedRestrictedStockUnitsMemberamr:LongTermIncentivePlanMembersrt:MaximumMember2022-01-012022-12-310001704715us-gaap:ShareBasedPaymentArrangementEmployeeMemberamr:OperationalPerformanceBasedRestrictedStockUnitsMemberamr:LongTermIncentivePlanMember2022-01-012022-12-310001704715us-gaap:ShareBasedPaymentArrangementEmployeeMemberamr:LongTermIncentivePlanMemberamr:RelativePerformanceBasedRestrictedStockUnitsMember2022-01-012022-12-310001704715us-gaap:ShareBasedPaymentArrangementEmployeeMemberamr:MonteCarloSimulationMemberamr:LongTermIncentivePlanMemberamr:RelativePerformanceBasedRestrictedStockUnitsMember2022-01-012022-12-310001704715amr:RelativePerformanceBasedRestrictedStockUnitsMember2022-12-310001704715amr:RelativePerformanceBasedRestrictedStockUnitsMember2021-01-012021-12-310001704715us-gaap:ShareBasedPaymentArrangementEmployeeMemberamr:LongTermIncentivePlanMemberamr:PerformanceBasedCashIncentiveAwardsMember2022-01-012022-12-310001704715us-gaap:ShareBasedPaymentArrangementEmployeeMembersrt:MinimumMemberamr:LongTermIncentivePlanMemberamr:PerformanceBasedCashIncentiveAwardsMember2022-01-012022-12-310001704715us-gaap:ShareBasedPaymentArrangementEmployeeMemberamr:LongTermIncentivePlanMembersrt:MaximumMemberamr:PerformanceBasedCashIncentiveAwardsMember2022-01-012022-12-310001704715us-gaap:ShareBasedPaymentArrangementEmployeeMemberamr:A2022LongTermIncentivePlanMemberamr:PerformanceBasedCashIncentiveAwardsMember2023-12-310001704715us-gaap:ShareBasedPaymentArrangementEmployeeMemberamr:A2022LongTermIncentivePlanMemberamr:PerformanceBasedCashIncentiveAwardsMember2022-12-310001704715us-gaap:ShareBasedPaymentArrangementEmployeeMemberamr:MonteCarloSimulationMemberamr:LongTermIncentivePlanMemberamr:PerformanceBasedCashIncentiveAwardsMember2022-01-012022-12-310001704715amr:PerformanceBasedCashIncentiveAwardsMember2022-12-310001704715amr:PerformanceBasedCashIncentiveAwardsMember2022-01-012022-12-310001704715amr:PerformanceBasedCashIncentiveAwardsMember2021-01-012021-12-310001704715amr:ManagementIncentivePlanAndLongTermIncentivePlanMemberamr:RestrictedStockUnitsRSUsTimeBasedMember2021-01-012021-12-310001704715us-gaap:ShareBasedPaymentArrangementEmployeeMemberamr:PerformanceBasedRestrictedStockUnitsMemberamr:LongTermIncentivePlanMember2021-01-012021-12-310001704715us-gaap:ShareBasedPaymentArrangementEmployeeMemberamr:PerformanceBasedRestrictedStockUnitsMembersrt:MinimumMemberamr:LongTermIncentivePlanMember2021-01-012021-12-310001704715us-gaap:ShareBasedPaymentArrangementEmployeeMemberamr:PerformanceBasedRestrictedStockUnitsMemberamr:LongTermIncentivePlanMembersrt:MaximumMember2021-01-012021-12-310001704715us-gaap:ShareBasedPaymentArrangementEmployeeMemberamr:OperationalPerformanceBasedRestrictedStockUnitsMemberamr:LongTermIncentivePlanMember2021-01-012021-12-310001704715us-gaap:ShareBasedPaymentArrangementEmployeeMemberamr:LongTermIncentivePlanMemberamr:RelativePerformanceBasedRestrictedStockUnitsMember2021-01-012021-12-310001704715us-gaap:ShareBasedPaymentArrangementEmployeeMemberamr:MonteCarloSimulationMemberamr:LongTermIncentivePlanMemberamr:RelativePerformanceBasedRestrictedStockUnitsMember2021-01-012021-12-310001704715amr:RelativePerformanceBasedRestrictedStockUnitsMember2021-12-310001704715amr:RelativePerformanceBasedRestrictedStockUnitsMember2020-01-012020-12-310001704715us-gaap:ShareBasedPaymentArrangementEmployeeMemberamr:LongTermIncentivePlanMemberamr:PerformanceBasedCashIncentiveAwardsMember2021-01-012021-12-310001704715us-gaap:ShareBasedPaymentArrangementEmployeeMembersrt:MinimumMemberamr:LongTermIncentivePlanMemberamr:PerformanceBasedCashIncentiveAwardsMember2021-01-012021-12-310001704715us-gaap:ShareBasedPaymentArrangementEmployeeMemberamr:LongTermIncentivePlanMembersrt:MaximumMemberamr:PerformanceBasedCashIncentiveAwardsMember2021-01-012021-12-310001704715us-gaap:ShareBasedPaymentArrangementEmployeeMemberamr:A2021LongTermIncentivePlanMemberamr:PerformanceBasedCashIncentiveAwardsMember2023-12-310001704715us-gaap:ShareBasedPaymentArrangementEmployeeMemberamr:A2021LongTermIncentivePlanMemberamr:PerformanceBasedCashIncentiveAwardsMember2022-12-310001704715us-gaap:ShareBasedPaymentArrangementEmployeeMemberamr:MonteCarloSimulationMemberamr:LongTermIncentivePlanMemberamr:PerformanceBasedCashIncentiveAwardsMember2021-01-012021-12-310001704715amr:PerformanceBasedCashIncentiveAwardsMember2021-12-310001704715amr:PerformanceBasedCashIncentiveAwardsMember2020-01-012020-12-310001704715amr:RestrictedStockUnitsRSUsTimeBasedMember2022-12-310001704715amr:RestrictedStockUnitsRSUsTimeBasedMember2023-01-012023-12-310001704715amr:RestrictedStockUnitsRSUsTimeBasedMember2023-12-310001704715amr:RestrictedStockUnitsRSUsShareUnitsDeferredSettlementMember2023-01-012023-12-310001704715amr:RestrictedStockUnitsRSUsTimeBasedMember2022-01-012022-12-310001704715amr:RestrictedStockUnitsRSUsTimeBasedMember2021-01-012021-12-310001704715amr:OperationalPerformanceBasedRestrictedStockUnitsMember2022-12-310001704715amr:OperationalPerformanceBasedRestrictedStockUnitsMember2023-01-012023-12-310001704715amr:OperationalPerformanceBasedRestrictedStockUnitsMember2023-12-310001704715amr:ThirtyDayVolumeWeightedAveragePriceStockOptionsMember2022-12-310001704715amr:ThirtyDayVolumeWeightedAveragePriceStockOptionsMember2022-01-012022-12-310001704715amr:ThirtyDayVolumeWeightedAveragePriceStockOptionsMember2023-01-012023-12-310001704715amr:ThirtyDayVolumeWeightedAveragePriceStockOptionsMember2023-12-310001704715amr:PerformanceBasedCashIncentiveAwardsMember2023-01-012023-12-310001704715amr:PerformanceBasedCashIncentiveAwardsMember2023-12-310001704715amr:PrivatelyNegotiatedTransactionWithAContingentRevenueObligationCreditorMemberamr:ShareholderMember2021-01-012021-12-310001704715amr:PrivatelyNegotiatedTransactionWithAContingentRevenueObligationCreditorMemberamr:ShareholderMember2021-12-310001704715us-gaap:RoyaltyAgreementsMemberus-gaap:PublicUtilitiesInventoryCoalMember2023-12-310001704715amr:CoalPurchaseAgreementsMember2023-12-310001704715amr:CoalTransportationAgreementsMember2023-12-310001704715amr:CoalTransportationAgreementsMemberamr:DominionTerminalAssociatesDTAMember2023-12-310001704715amr:AdditionalDTAInvestmentMember2023-12-310001704715amr:CumberlandBackToBackCoalSupplyAgreementsMember2023-01-012023-06-30utr:T0001704715amr:CumberlandBackToBackCoalSupplyAgreementsMember2022-01-012022-12-310001704715us-gaap:SuretyBondMember2023-12-310001704715amr:ReclamationRelatedObligationsMemberus-gaap:CollateralPledgedMember2023-12-310001704715amr:WorkersCompensationAndBlackLungObligationMember2023-12-310001704715amr:WorkersCompensationAndBlackLungObligationMember2022-12-310001704715amr:ReclamationRelatedObligationsMember2023-12-310001704715amr:ReclamationRelatedObligationsMember2022-12-310001704715amr:FinancialPaymentsAndOtherPerformanceObligationsMember2023-12-310001704715amr:FinancialPaymentsAndOtherPerformanceObligationsMember2022-12-310001704715amr:ContingentRevenueObligationMember2023-12-310001704715amr:ContingentRevenueObligationMember2022-12-310001704715amr:WorkersCompensationObligationsMember2023-12-310001704715amr:WorkersCompensationObligationsMember2022-12-310001704715amr:OtherOperatingAgreementsMember2023-12-310001704715amr:OtherOperatingAgreementsMember2022-12-310001704715us-gaap:DefinedBenefitPostretirementHealthCoverageMember2020-02-210001704715us-gaap:DefinedBenefitPostretirementHealthCoverageMember2020-02-200001704715us-gaap:DefinedBenefitPostretirementHealthCoverageMember2022-02-100001704715us-gaap:DefinedBenefitPostretirementHealthCoverageMembersrt:MinimumMember2023-01-310001704715us-gaap:DefinedBenefitPostretirementHealthCoverageMembersrt:MaximumMember2023-01-310001704715amr:ExportCoalRevenueMember2023-01-012023-12-310001704715amr:ExportCoalRevenueMember2022-01-012022-12-310001704715amr:ExportCoalRevenueMember2021-01-012021-12-310001704715us-gaap:CustomerConcentrationRiskMemberus-gaap:SalesRevenueNetMemberamr:CustomerOneMember2023-01-012023-12-310001704715us-gaap:CustomerConcentrationRiskMemberus-gaap:SalesRevenueNetMemberamr:CustomerOneMember2022-01-012022-12-310001704715us-gaap:CustomerConcentrationRiskMemberus-gaap:SalesRevenueNetMemberamr:CustomerOneMember2021-01-012021-12-310001704715us-gaap:CustomerConcentrationRiskMemberus-gaap:SalesRevenueNetMemberamr:TopTenCustomersMember2023-01-012023-12-310001704715us-gaap:CustomerConcentrationRiskMemberus-gaap:SalesRevenueNetMemberamr:TopTenCustomersMember2022-01-012022-12-310001704715us-gaap:CustomerConcentrationRiskMemberus-gaap:SalesRevenueNetMemberamr:TopTenCustomersMember2021-01-012021-12-310001704715us-gaap:CustomerConcentrationRiskMemberus-gaap:SalesRevenueNetMember2023-12-31amr:customer0001704715us-gaap:CustomerConcentrationRiskMemberus-gaap:SalesRevenueNetMember2022-12-310001704715us-gaap:CustomerConcentrationRiskMemberus-gaap:SalesRevenueNetMember2021-12-310001704715us-gaap:CustomerConcentrationRiskMemberus-gaap:AccountsReceivableMember2023-12-310001704715us-gaap:CustomerConcentrationRiskMemberus-gaap:AccountsReceivableMember2022-12-310001704715us-gaap:CustomerConcentrationRiskMemberus-gaap:AccountsReceivableMember2021-12-310001704715amr:DomesticCoalRevenueMemberus-gaap:SalesRevenueNetMemberus-gaap:GeographicConcentrationRiskMember2023-01-012023-12-310001704715amr:DomesticCoalRevenueMemberus-gaap:SalesRevenueNetMemberus-gaap:GeographicConcentrationRiskMember2022-01-012022-12-310001704715amr:DomesticCoalRevenueMemberus-gaap:SalesRevenueNetMemberus-gaap:GeographicConcentrationRiskMember2021-01-012021-12-310001704715us-gaap:SalesRevenueNetMemberamr:ExportCoalRevenueMemberus-gaap:GeographicConcentrationRiskMember2023-01-012023-12-310001704715us-gaap:SalesRevenueNetMemberamr:ExportCoalRevenueMemberus-gaap:GeographicConcentrationRiskMember2022-01-012022-12-310001704715us-gaap:SalesRevenueNetMemberamr:ExportCoalRevenueMemberus-gaap:GeographicConcentrationRiskMember2021-01-012021-12-310001704715us-gaap:ProductConcentrationRiskMemberamr:SalesVolumeProductLineMemberamr:CoalMetMember2023-01-012023-12-310001704715us-gaap:ProductConcentrationRiskMemberamr:SalesVolumeProductLineMemberamr:CoalMetMember2022-01-012022-12-310001704715us-gaap:ProductConcentrationRiskMemberamr:SalesVolumeProductLineMemberamr:CoalMetMember2021-01-012021-12-310001704715us-gaap:ProductConcentrationRiskMemberamr:CoalThermalMemberamr:SalesVolumeProductLineMember2023-01-012023-12-310001704715us-gaap:ProductConcentrationRiskMemberamr:CoalThermalMemberamr:SalesVolumeProductLineMember2022-01-012022-12-310001704715us-gaap:ProductConcentrationRiskMemberamr:CoalThermalMemberamr:SalesVolumeProductLineMember2021-01-012021-12-310001704715amr:MetMemberstpr:VAus-gaap:OperatingSegmentsMember2023-01-012023-12-31amr:mineamr:plant0001704715stpr:WVamr:MetMemberus-gaap:OperatingSegmentsMember2023-01-012023-12-310001704715stpr:WVamr:OtherOperatingSegmentsAndIntersegmentEliminationsMember2023-01-012023-12-310001704715amr:MetMemberus-gaap:OperatingSegmentsMember2023-01-012023-12-310001704715amr:OtherOperatingSegmentsAndIntersegmentEliminationsMember2023-01-012023-12-310001704715amr:MetMemberus-gaap:OperatingSegmentsMember2022-01-012022-12-310001704715amr:OtherOperatingSegmentsAndIntersegmentEliminationsMember2022-01-012022-12-310001704715amr:MetMemberus-gaap:OperatingSegmentsMember2021-01-012021-12-310001704715amr:OtherOperatingSegmentsAndIntersegmentEliminationsMember2021-01-012021-12-3100017047152023-10-012023-12-31
UNITED STATES
SECURITIES AND EXCHANGE COMMISSION
Washington, D.C. 20549
Form 10-K
|
|
|
|
|
|
| (Mark One) |
| ☒ |
ANNUAL REPORT PURSUANT TO SECTION 13 OR 15(d) OF THE SECURITIES EXCHANGE ACT OF 1934 |
For the fiscal year ended December 31, 2023
OR
|
|
|
|
|
|
| ☐ |
TRANSITION REPORT PURSUANT TO SECTION 13 OR 15(d) OF THE SECURITIES EXCHANGE ACT OF 1934 |
For the transition period from to
Commission File Number 001-38735
ALPHA METALLURGICAL RESOURCES, INC.
(Exact name of registrant as specified in its charter)
|
|
|
|
|
|
|
|
|
| Delaware |
|
81-3015061 |
| (State or other jurisdiction of incorporation or organization) |
|
(I.R.S. Employer Identification Number) |
|
|
|
| 340 Martin Luther King Jr. Blvd. |
Bristol, Tennessee 37620 |
| (Address of principal executive offices, zip code) |
(423) 573-0300 |
| (Registrant’s telephone number, including area code) |
Securities registered or to be registered pursuant to Section 12(b) of the Act:
|
|
|
|
|
|
|
|
|
| Title of each class |
Trading Symbol(s) |
Name of each exchange on which registered |
| Common Stock, par value $0.01 per share |
AMR |
New York Stock Exchange |
Securities registered or to be registered pursuant to Section 12(g) of the Act:
None
(Title of Class)
Indicate by check mark if the registrant is a well-known seasoned issuer, as defined in Rule 405 of the Securities Act.
x Yes ¨ No
Indicate by check mark if the registrant is not required to file reports pursuant to Section 13 or Section 15(d) of the Act.
¨ Yes x No
Indicate by check mark whether the registrant (1) has filed all reports required to be filed by Section 13 or 15(d) of the Securities Exchange Act of 1934 during the preceding 12 months (or for such shorter period that the registrant was required to file such reports), and (2) has been subject to such filing requirements for the past 90 days.
x Yes ¨ No Indicate by check mark whether the registrant has submitted electronically every Interactive Data File required to be submitted pursuant to Rule 405 of Regulation S-T (Sec.232.405 of this chapter) during the preceding 12 months (or for such shorter period that the registrant was required to submit such files). x Yes ¨ No
Indicate by check mark whether the registrant is a large accelerated filer, an accelerated filer, a non-accelerated filer, a smaller reporting company or an emerging growth company. See the definitions of “large accelerated filer,” “accelerated filer,” “smaller reporting company,” and “emerging growth company” in Rule 12b-2 of the Exchange Act.
|
|
|
|
|
|
|
|
|
|
|
|
|
|
|
| Large accelerated filer |
☒ |
|
Accelerated filer |
☐ |
| Non-accelerated filer |
☐ |
|
Smaller reporting company |
☐ |
|
|
|
Emerging growth company |
☐ |
If an emerging growth company, indicate by check mark if the registrant has elected not to use the extended transition period for complying with any new or revised financial accounting standards provided pursuant to Section 13(a) of the Exchange Act. ¨
Indicate by check mark whether the registrant has filed a report on and attestation to its management’s assessment of the effectiveness of its internal control over financial reporting under Section 404(b) of the Sarbanes-Oxley Act (15 U.S.C. 7262(b)) by the registered public accounting firm that prepared or issued its audit report. ☒
If securities are registered pursuant to Section 12(b) of the Act, indicate by check mark whether the financial statements of the registrant included in the filing reflect the correction of an error to previously issued financial statements. ¨
Indicate by check mark whether any of those error corrections are restatements that required a recovery analysis of incentive-based compensation received by any of the registrant’s executive officers during the relevant recovery period pursuant to §240.10D-1(b). ¨
Indicate by check mark whether the registrant is a shell company (as defined in Rule 12b-2 of the Exchange Act) ☐ Yes x No
The aggregate market value of the Common Stock held by non-affiliates of the registrant (excluding outstanding shares beneficially owned by directors, executive officers, and other affiliates) on June 30, 2023, was approximately $1.3 billion based on the closing price of the Company’s common stock as reported that date on the New York Stock Exchange of $164.36 per share. Such assumptions should not be deemed to be conclusive for any other purpose.
Number of shares of the registrant’s Common Stock, $0.01 par value, outstanding as of February 19, 2024: 12,994,558
DOCUMENTS INCORPORATED BY REFERENCE
Part III incorporates certain information by reference from the registrant’s definitive proxy statement for the 2024 annual meeting of stockholders (the “Proxy Statement”), which will be filed no later than 120 days after the close of the registrant’s fiscal year ended December 31, 2023.
CAUTIONARY NOTE REGARDING FORWARD-LOOKING STATEMENTS
This report includes statements of our expectations, intentions, plans and beliefs that constitute “forward-looking statements.” These statements, which involve risks and uncertainties, relate to analyses and other information that are based on forecasts of future results and estimates of amounts not yet determinable and may also relate to our future prospects, developments and business strategies. We have used the words “anticipate,” “believe,” “could,” “estimate,” “expect,” “intend,” “may,” “plan,” “predict,” “project,” “should” and similar terms and phrases, including references to assumptions, in this report to identify forward-looking statements, but these terms and phrases are not the exclusive means of identifying such statements. These forward-looking statements are made based on expectations and beliefs concerning future events affecting us and are subject to uncertainties and factors relating to our operations and business environment, all of which are difficult to predict and many of which are beyond our control, that could cause our actual results to differ materially from those expressed in or implied by these forward-looking statements.
The following factors are among those that may cause actual results to differ materially from our forward-looking statements:
•the financial performance of the company;
•our liquidity, results of operations and financial condition;
•our ability to generate sufficient cash or obtain financing to fund our business operations;
•depressed levels or declines in coal prices;
•railroad, barge, truck, port and other transportation availability, performance and costs;
•changes in domestic or international environmental laws and regulations, and court decisions, including those directly affecting our coal mining and production and those affecting our customers’ coal usage, including potential climate change initiatives;
•steel and coke producers switching to alternative energy sources such as natural gas, renewables and coal from basins where we do not operate;
•our ability to obtain or renew surety bonds on acceptable terms or maintain our current bonding status;
•worldwide market demand for coal and steel, including demand for U.S. coal exports, and competition in coal markets;
•attracting and retaining key personnel and other employee workforce factors, such as labor relations;
•our ability to execute our share repurchase program;
•our ability to self-insure certain of our black lung obligations without a significant increase in required collateral;
•our ability to meet collateral requirements and fund employee benefit obligations;
•inflationary pressures on supplies and labor and significant or rapid increases in commodity prices;
•disruptions in delivery or changes in pricing from third-party vendors of key equipment and materials that are necessary for our operations, such as diesel fuel, steel products, explosives, tires and purchased coal;
•our ability to consummate financing or refinancing transactions, and other services, and the form and degree of these services available to us, which may be significantly limited by the lending, investment and similar policies of financial institutions and insurance companies regarding carbon energy producers and the environmental impacts of coal combustion;
•failures in performance, or non-performance, of services by third-party contractors, including contract mining and reclamation contractors;
•disruption in third-party coal supplies;
•cybersecurity attacks or failures, threats to physical security, extreme weather conditions or other natural disasters;
•the imposition or continuation of barriers to trade, such as tariffs;
•increased volatility and uncertainty regarding worldwide markets, seaborne transportation and our customers as a result of developments in and around Ukraine and the Middle East;
•changes in, renewal or acquisition of, terms of and performance of customers under coal supply arrangements and the refusal by our customers to receive coal under agreed-upon contract terms;
•reductions or increases in customer coal inventories and the timing of those changes;
•our production capabilities and costs;
•our ability to obtain, maintain or renew any necessary permits or rights;
•inherent risks of coal mining, including those that are beyond our control;
•changes in, interpretations of, or implementations of domestic or international tax or other laws and regulations, including the Inflation Reduction Act of 2022 and its related regulations;
•our relationships with, and other conditions affecting, our customers, including the inability to collect payments from our customers if their creditworthiness declines;
•our indebtedness as we may incur it from time to time;
•reclamation and mine closure obligations; and
•our assumptions concerning economically recoverable coal reserve estimates.
The list of factors identified above is not exhaustive. We caution readers not to place undue reliance on any forward looking statements, which are based on information currently available to us and speak only as of the dates on which they are made. When considering these forward-looking statements, you should keep in mind the cautionary statements in this report. We do not undertake any responsibility to publicly revise these forward-looking statements to take into account events or circumstances that occur after the date of this report. Additionally, except as expressly required by federal securities laws, we do not undertake any responsibility to update you on the occurrence of any unanticipated events, which may cause actual results to differ from those expressed or implied by the forward-looking statements contained in this report.
Part I
Item 1. Business
Unless otherwise indicated or the context otherwise requires, references in this “Item 1. Business” section to “the combined company,” “we,” “us” and other similar terms refer to Alpha Metallurgical Resources, Inc. and its consolidated subsidiaries (previously Contura Energy, Inc. and its consolidated subsidiaries). Disclosures in this “Item 1. Business” section should be read in conjunction with “Item 1A. Risk Factors” for further discussion of factors impacting our business. Effective February 1, 2021, we changed our corporate name from Contura Energy, Inc. to Alpha Metallurgical Resources, Inc. to more accurately reflect our strategic focus on the production of metallurgical coal. Following the effectiveness of our name change, our ticker symbol on the New York Stock Exchange changed from “CTRA” to “AMR” effective on February 4, 2021.
Our Company
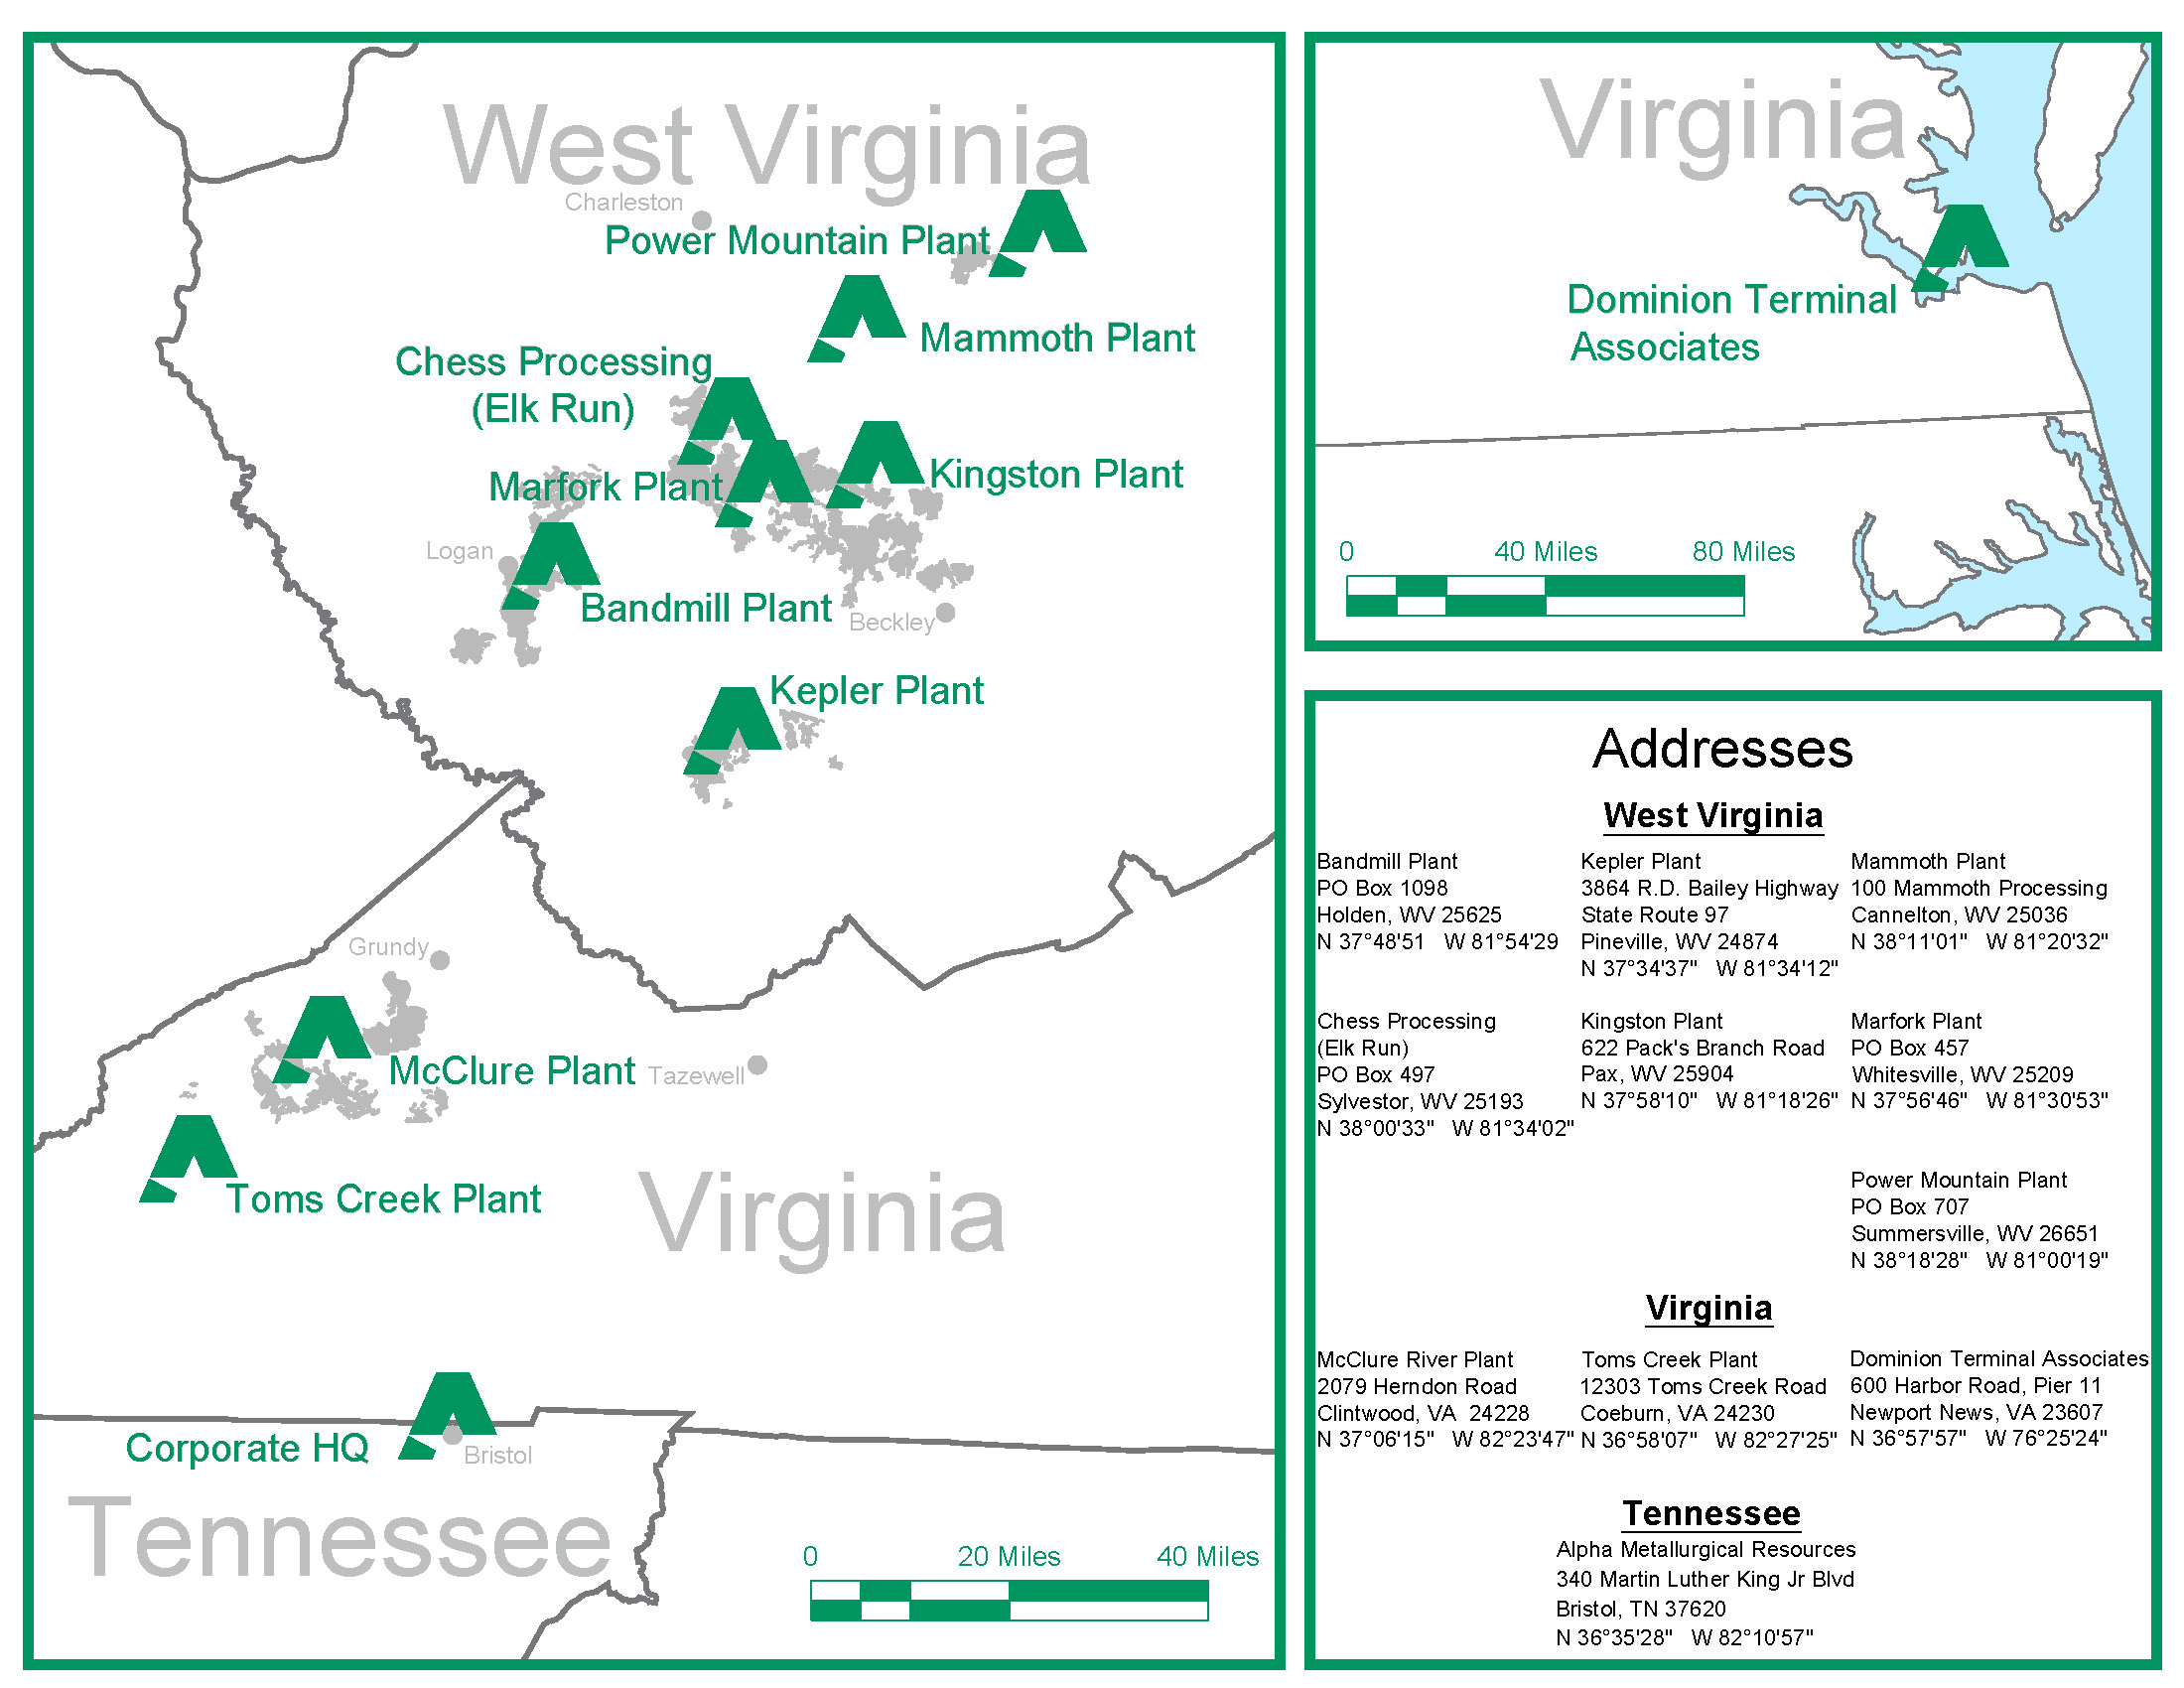
We are a Tennessee-based mining company with operations in Virginia and West Virginia. With customers across the globe, high-quality reserves and significant port capacity, we reliably supply metallurgical coal products to the steel industry. We operate highly productive, cost-competitive coal mines across the CAPP coal basin. Our portfolio of mining operations consists of 15 underground mines, seven surface mines and nine coal preparation plants. We own a 65.0% interest in Dominion Terminal Associates (“DTA”), a coal export terminal in Newport News, Virginia. DTA provides us with the ability to fulfill a broad range of customer coal quality requirements through coal blending, while also providing storage capacity and transportation flexibility.
We predominantly produce metallurgical (“met”) coal, which is shipped to domestic and international steel and coke producers. Although our strategic focus is on the production of met coal, we also produce thermal coal as byproduct and it is primarily sold to large utilities and industrial customers both in the United States and across the world. Refer to Notes 22 and 23 to the Consolidated Financial Statements for geographical information about our coal sales and additional segment information.
We have a substantial reserve base of 316.0 million tons of proven and probable reserves as of December 31, 2023. Our reserve base consists of 303.0 million tons of proven and probable metallurgical reserves, and 12.9 million tons of proven and probable thermal reserves.
Through our operations across the CAPP coal basin in Virginia and West Virginia, we are able to source coal from multiple mines to meet the needs of a long-standing global customer base, many of which have been served by us or our predecessors for decades. We are continuously evaluating opportunities to strategically cultivate current relationships to drive new business in our target growth markets. In addition, our experienced management team regularly analyzes potential acquisitions, joint ventures and other opportunities that would be accretive and synergistic to our existing asset portfolio.
Other Business Developments
During 2023, development was completed and production began at our Rolling Thunder and Checkmate Powellton mines within our Power Mountain and Elk Run mining complexes, respectively, which produce High-Vol. B quality met coal from the Powellton coal seam.
In August 2023, we completed our transition to a pure-play metallurgical producer with the closure of Slabcamp, which was our last remaining thermal mine.
Our History
We were formed in 2016 to acquire and operate certain of Alpha Natural Resources, Inc.’s former core coal operations, as part of the Alpha Natural Resources, Inc. Plan of Reorganization. We entered into various settlement agreements with the Debtors, their bankruptcy successor, and third parties as part of the Debtors’ bankruptcy reorganization process. We assumed acquisition-related obligations through those settlement agreements, which became effective on July 26, 2016, the effective date of the Debtors’ Plan of Reorganization. As of December 31, 2023, we did not have any remaining acquisition-related obligations. Refer to Note 14 to the Consolidated Financial Statements for further information on our acquisition-related obligations.
On December 8, 2017, we closed a transaction with Blackjewel to sell our Western Mines located in the PRB, Wyoming, along with related coal reserves, equipment, infrastructure and other real properties. On October 4, 2019, we closed on the ESM Transaction in connection with Blackjewel’s subsequent bankruptcy filing.
On May 29, 2020, certain of our subsidiaries (Contura Coal West, LLC and Contura Wyoming Land, LLC), one of which held the mining permits for the Western Mines, were merged with certain subsidiaries of ESM to become wholly-owned subsidiaries of ESM and to complete the permit transfer process in connection with the ESM Transaction.
On November 9, 2018, we merged with Alpha Natural Resources Holdings, Inc. and ANR, Inc. Upon the consummation of the transactions contemplated by a definitive merger agreement (the “Merger Agreement”), our common stock began trading on the New York Stock Exchange under the ticker “CTRA.” Previously, our shares traded on the OTC market under the ticker “CNTE.”
On December 10, 2020, we closed on a transaction with Iron Senergy Holdings, LLC, to sell our thermal coal mining operations located in Pennsylvania consisting primarily of our Cumberland mining complex and related property (our former NAPP operations). This transaction accelerated our strategic exit from thermal coal production to shift our focus to met coal production.
Effective February 1, 2021, we changed our corporate name from Contura Energy, Inc. to Alpha Metallurgical Resources, Inc. to more accurately reflect our strategic focus on the production of met coal. Following the effectiveness of our name change, our ticker symbol on the New York Stock Exchange changed from “CTRA” to “AMR” effective on February 4, 2021.
Our Mining Operations and Properties
The following table provides a summary of information regarding our active mining complexes as of December 31, 2023 (see also “Item 2. Properties” for further information):
|
|
|
|
|
|
|
|
|
|
|
|
|
|
|
|
|
|
|
|
|
|
|
|
|
|
|
|
|
|
|
|
|
|
|
|
|
|
|
|
|
|
|
|
|
|
|
|
|
|
|
|
|
|
|
|
|
|
|
|
|
|
|
(Amounts in thousands, except for mine data) |
|
|
|
|
|
Tons Sold (4) |
|
|
|
|
| Mining Complex |
|
Location |
|
Acquired |
|
Mines (1) |
|
Equipment (2) |
|
Rail (3) |
|
2023 |
|
2022 |
|
2021 |
|
Carrying Value (5) |
|
Reserves (6) |
| Aracoma |
|
WV |
|
2018 |
|
3 |
|
CM |
|
CSX |
|
2,607 |
|
|
2,643 |
|
|
2,221 |
|
|
$ |
174,652 |
|
|
41,276 |
|
| Kepler |
|
WV |
|
2018 |
|
1 |
|
CM |
|
CSX/NS |
|
1,958 |
|
|
1,897 |
|
|
1,571 |
|
|
$ |
235,203 |
|
|
41,190 |
|
| Kingston |
|
WV |
|
2018 |
|
4 |
|
CM/S/H |
|
CSX |
|
2,254 |
|
|
1,935 |
|
|
2,348 |
|
|
$ |
34,208 |
|
|
38,657 |
|
| Marfork |
|
WV |
|
2018 |
|
6 |
|
CM/S/H |
|
CSX |
|
4,345 |
|
|
4,106 |
|
|
4,032 |
|
|
$ |
322,733 |
|
|
97,653 |
|
| McClure/Toms Creek |
|
VA |
|
2016 |
|
5 |
|
CM/S/H |
|
CSX/NS |
|
4,071 |
|
|
3,703 |
|
|
4,033 |
|
|
$ |
114,530 |
|
|
68,747 |
|
| Power Mountain |
|
WV |
|
2016 |
|
2 |
|
CM |
|
NS |
|
718 |
|
|
832 |
|
|
837 |
|
|
$ |
70,594 |
|
|
— |
|
| Elk Run |
|
WV |
|
2018 |
|
1 |
|
CM |
|
CSX |
|
— |
|
|
— |
|
|
— |
|
|
$ |
35,535 |
|
|
28,434 |
|
(1) Number of active mines as of December 31, 2023.
(2) Equipment: S = Shovel/Excavator/Loader/Trucks; CM = Continuous Miner; H = Highwall Miner
(3) CSX = CSX Transportation; NS = Norfolk Southern Railway Company
(4) Tons of coal purchased from third parties and not processed are not included.
(5) Net book value of property, plant and equipment and owned and leased mineral rights as of December 31, 2023.
(6) Proven and probable reserves as of December 31, 2023. Refer to Item 2. Properties for further information. Feasibility/Pre-feasibility study not considered cost beneficial for Power Mountain complex.
Aracoma – Aracoma is a mining complex located in Logan, Mingo, and Boone counties, West Virginia. The complex has three active underground mines which produce primarily High-Vol. B quality met coal from the Upper Chilton, Upper Cedar Grove, and No. 2 Gas coal seams. Mine lives range from 5 to 16 years. Coal is processed at the Bandmill Preparation Plant and loaded onto CSX rail for delivery to customers.
Kepler – Kepler is a mining complex located in Wyoming, McDowell, and Raleigh counties, West Virginia. The complex has one active underground mine (with an estimated life of 15 years) which produces primarily Low-Vol. quality met coal from the Pocahontas No. 3 coal seam. Coal is processed at the Kepler Preparation Plant and either loaded onto NS rail or trucked to the Feats Loadout and loaded onto the CSX rail for delivery to customers.
Kingston – Kingston is a mining complex located in Fayette and Raleigh counties, West Virginia. The complex has one active underground mine, which produces primarily Mid-Vol. quality met coal from the Douglas coal seam. The complex also has three active surface mines which produced High-Vol. A quality met coal as well as some thermal quality coal as a by-product of mining from multiple coal seams. Mine lives range from 2 to 11 years. Coal from the underground mine is processed at the Kingston Preparation Plant and trucked to the Pax Loadout to be loaded onto CSX rail for delivery to customers. Coal from the surface mines may be processed through the Kingston Preparation Plant, trucked to and processed through the Mammoth Plant, or trucked directly to the Pax Loadout or Marmet Dock for delivery to customers.
Marfork – Marfork is a mining complex located in Raleigh, Boone, Kanawha, and Fayette counties, West Virginia. The complex has three active underground mines which produce High-Vol. A quality met coal from the Eagle coal seam and one active underground mine that produces mid-vol quality met coal from the Glen Alum Tunnel seam. The complex also has two active surface mines which produce High-Vol. A quality met coal as well as some thermal quality coal as a by-product of mining from multiple coal seams. Mine lives range from 2 to 17 years. Coal from the underground mines is processed at the Marfork Preparation Plant and loaded onto the CSX rail for delivery to customers. Coal from the surface mines may be processed through the Marfork Preparation Plant or trucked directly to the Pax Loadout or the Marmet Dock for delivery to customers.
McClure/Toms Creek – McClure/Toms Creek is a mining complex located in Dickenson, Buchanan, Russell, and Wise counties, Virginia. The complex has three active underground mines which produce High-Vol. A and Mid-Vol. quality met coal from the Upper Banner, Lower Banner, and Jawbone coal seams. The complex also has two active surface mines which produce primarily High-Vol. A quality met coal as well as some thermal quality coal as a by-product of mining from multiple coal seams. Mine lives range from 2 to 27 years. Coal is processed at either the McClure Preparation Plant or the Toms Creek Preparation Plant and loaded on the CSX or NS rail, respectively for delivery to customers.
Power Mountain – Power Mountain is a mining complex located in Nicholas County, West Virginia. The complex has one active underground mine (with an estimated life of 3 years) which produces High-Vol. B quality met coal from the Eagle coal seam. Coal is processed at the Power Mountain Preparation Plant and loaded onto NS rail for delivery to customers. In addition, during 2023 development was completed and production began at a second underground mine (with an estimated life of 15 years) which produces High-Vol. B quality met coal from the Powellton coal seam. Coal from the mine is currently trucked to and processed through the Mammoth Preparation Plant. Following the expected development of a haul road in 2024, coal is expected to be trucked to and processed through the Power Mountain Preparation Plant.
Elk Run – Elk Run is a mining complex located in Boone County, West Virginia. During 2023, development was completed and production began at an underground mine (with an estimated life of 22 years) which produces High-Vol. B quality met coal from the Powellton coal seam. Coal from the mine is processed at the Chess Processing Plant and loaded onto CSX rail for delivery to customers.
Equipment
Our plant and equipment, including underground and surface equipment, are of varying age, in good operational condition, and are regularly maintained and serviced by a dedicated maintenance workforce and third-party suppliers, including scheduled preventive maintenance.
Preparation Plants, Loadouts, and Docks
The following is a summary of information regarding our active preparation plants as of December 31, 2023:
|
|
|
|
|
|
|
|
|
|
|
|
|
|
|
|
|
|
|
|
|
|
|
|
|
|
|
| Preparation Plant |
|
Year Constructed/Upgraded |
|
Processing Capacity (Tons per hour) |
|
Utilization % |
|
Power Source |
| Bandmill |
|
2010 |
|
1,200 |
|
66% |
|
American Electric Power |
| Kepler |
|
1967 |
|
900 |
|
54% |
|
American Electric Power |
| Kingston |
|
1974/2001 |
|
700 |
|
73% |
|
American Electric Power |
| Marfork |
|
1994/2019 |
|
2,400 |
|
70% |
|
American Electric Power |
| McClure |
|
1979/2019 |
|
1,100 |
|
53% |
|
American Electric Power |
| Toms Creek |
|
1980/2004 |
|
1,100 |
|
43% |
|
American Electric Power |
| Power Mountain |
|
1985/2010 |
|
1,200 |
|
26% |
|
American Electric Power |
Chess Processing (1) |
|
1980/1998 |
|
2,200 |
|
N/A |
|
American Electric Power |
| Mammoth |
|
1950/2008 |
|
1,200 |
|
18% |
|
American Electric Power |
(1) Plant refurbished in 2023. Produced tons received during the fourth quarter of 2023 but not processed until the first quarter of 2024.
The following is a summary of information regarding our active loadouts and docks as of December 31, 2023:
|
|
|
|
|
|
|
|
|
|
|
|
|
|
|
| Loadout/Dock |
|
Year Constructed |
|
Loading Capacity (Tons per hour) |
| Pax Loadout |
|
2006 |
|
3,500 |
| Feats Loadout |
|
1975 |
|
3,500 |
| Marmet Dock |
|
1986 |
|
1,600 |
Export Terminal
The following is a summary of information regarding DTA (in which we own a 65% interest) as of December 31, 2023:
|
|
|
|
|
|
|
|
|
|
|
|
|
|
|
|
|
|
|
|
|
Export Terminal |
|
Year Constructed |
|
Loading Capacity (Tons per hour) |
|
Storage Capacity (Net tons) |
| DTA |
|
1984 |
|
Up to 6,500 |
|
1.7 million |
Coal Mining Techniques
We use four different mining techniques to extract coal from the ground: room-and-pillar mining, truck-and-shovel mining and truck and front-end loader mining, contour mining, and highwall mining. We do not use mountaintop removal mining and currently have no plans to do so in the future.
Room-and-Pillar Mining
Certain of our mines in CAPP use room-and-pillar mining methods. In this type of mining, main airways and transportation entries are developed and maintained while remote-controlled continuous miners extract coal from the seam, leaving pillars to support the roof. Shuttle cars or battery coal haulers are used to transport coal from the continuous miner to the conveyor belt for transport to the surface. This method is more flexible than longwall mining and often used to mine smaller coal blocks or thinner seams of coal. Ultimate seam recovery of in-place reserves is less than that achieved with longwall mining. All of this production is also processed in preparation plants to remove rock and impurities before it becomes saleable clean coal.
Truck-and-Shovel Mining and Truck and Front-End Loader Mining
We utilize truck/shovel and truck/front-end loader mining methods at some of our CAPP surface mines. These methods are similar and involve using large, electric or hydraulic-powered shovels or diesel-powered front-end loaders to remove earth and rock (overburden) covering a coal seam which is later used to refill the excavated coal pits after the coal is removed. The loading equipment places the coal into trucks for transportation to a preparation plant or loadout area. Ultimate seam recovery of in-place reserves on average exceeds 90%. Depending on geology and market destination, surface-mined coal may need to be processed in a preparation plant before sale. In the case of some metallurgical grade coals, as much as 80% of surface mined coal may need to be processed in a preparation plant to enhance the sales value of the coal. Productivity depends on overburden and coal thickness (strip ratio), equipment utilized and geologic factors.
Contour Mining
We use contour mining at certain of our CAPP surface mines, which limits the overburden removal from above a coal seam or series of coal seams. In contour mining, surface mining machinery follows the contours of a coal seam or seams around a ridge, excavating the overburden and recovering the coal seam or seams as a “contour bench” around the ridge is created. This contour bench is then backfilled and graded in accordance with an approved reclamation plan. Highwall mining methods are used in connection with some contour mining operations. Depending on geology and market destination, coal mined by contour mining may need to be processed in preparation plants to remove rock and impurities before it becomes a saleable clean coal.
Highwall Mining
We utilize highwall mining methods at certain of our CAPP surface mines. A highwall mining system consists of a remotely controlled continuous miner, which extracts coal and conveys it via augers or belt conveyors to the surface. The cut is typically a rectangular, horizontal opening in the highwall (the unexcavated face of exposed overburden and coal in a surface mine) 9-feet or 11-feet wide and reaching depths of up to 1,000 feet. Multiple parallel openings are driven into the highwall, separated by narrow pillars that extend the full depth of the hole. All of the coal mined at our highwall mining operations is processed in preparation plants to remove rock and impurities before it becomes saleable clean coal.
Financial Information About Reportable Segments and Geographic Areas
Refer to “Item 7. Management’s Discussion and Analysis of Financial Condition—Results of Operations” and Notes 22 and 23 to the Consolidated Financial Statements for financial information about our reportable segment and geographic areas.
Marketing, Sales and Customer Contracts
We market coal produced at our operations and purchase and resell coal mined by others. We have coal supply commitments with a wide range of steel and coke manufacturers, industrial customers, and electric utilities. Our marketing efforts are centered on meeting customer needs and requirements. By offering coal of various grades, we are able to provide the specific qualities relevant to our customers and to serve a global customer base. Through this global platform, our coals are shipped to customers on five continents. Our broad customer and product base allows us to adjust to changing market conditions. Many of our larger customers are well-established steel manufacturers and public utilities.
Our coal volumes include coal produced and processed by us, our “captive coal,” as well as coal purchased from third-party producers to blend with our produced coal in order to meet customer specifications. These volumes are processed by us, meaning that we washed, crushed or blended the coal at one of our preparation plants or loading facilities prior to resale. Our coal volumes within our Met segment operations also include met coal volumes purchased from domestic third-party producers and sold into international markets.
Our export shipments serviced customers in 25 and 26 countries during the years ended December 31, 2023 and 2022, respectively. Asia was our largest export market for the years ended December 31, 2023 and 2022, with coal sales to Asia accounting for approximately 46% and 53%, respectively of export coal revenues and 34% and 43%, respectively, of coal revenues. All of our sales are conducted in U.S. dollars. Refer to Note 22 to the Consolidated Financial Statements for additional export coal revenue information.
Met coal accounted for approximately 95% of our coal revenues for each of the years ended December 31, 2023 and 2022. Our met coal sales are typically made with customers with whom we have a long-term relationship. Domestic met customers typically enter into one-year agreements with a fixed price for the entire contract year. Any longer-term agreement would generally have a renegotiation of price each subsequent contract year. Export sales are generally made on an annual, quarterly, or spot cargo basis. Annual and quarterly agreements typically have market-indexed pricing that changes with the market monthly. Any export agreement with a term greater than one year would generally have a renegotiation of pricing terms for each subsequent contract year. Volume for future years is generally contingent on both parties agreeing to a pricing mechanism to cover the contract year.
Thermal coal accounted for approximately 5% of our coal revenues for each of the years ended December 31, 2023 and 2022. We sometimes enter into long-term contracts with our thermal coal customers. Terms of these agreements may address coal quality requirements, quantity parameters, flexibility and adjustment mechanisms, permitted sources of supply, treatment of environmental constraints, options to extend, force majeure, suspension, termination and assignment issues, the allocation between the parties of the cost of complying with future governmental regulations and many other matters.
Generally, our long-term thermal coal agreements contain committed volumes and fixed prices for a period or a certain number of periods pursuant to which thermal coal will be delivered under these agreements. After a fixed price period elapses, the long-term agreement may provide for a price negotiation/determination period prior to the commencement of the pending unpriced contract period. The price negotiations generally consider either then current market prices and/or relevant market indices. Provisions of this sort increase the difficulty of predicting the exact prices a coal supplier will receive for its coal during the course of the long-term agreement. During the years ended December 31, 2023 and 2022, approximately 21% and 54%, respectively, of our thermal coal sales volume were delivered pursuant to long-term contracts.
Distribution and Transportation
Coal consumed domestically is usually sold at the mine and transportation costs are normally borne by the purchaser. Export coal is usually sold at the loading port, with purchasers responsible for further transportation.
For our export sales, we negotiate transportation agreements with various providers, including railroads, trucks, barge lines, and terminal facilities to transport shipments to the relevant loading port. We coordinate with customers, mining facilities and transportation providers to establish shipping schedules that meet each customer’s needs. Our captive coal is loaded from our preparation plants, loadout facilities, and in certain cases directly from our mines. The coal we purchase is loaded in some cases directly from mines and preparation plants operated by third parties or from an export terminal. Virtually all of our coal is transported from the mine to our preparation plants by truck or belt conveyor systems. It is transported from preparation plants and loading facilities to the customer by means of railroads, trucks, barge lines, and lake-going and ocean-going vessels from terminal facilities.
We depend upon rail, barge, trucking and other systems to deliver coal to markets. In the years ended December 31, 2023 and 2022, our produced coal was transported from the mines and to the customer primarily by rail, with the main rail carriers being CSX Transportation and Norfolk Southern Railway Company. Rail shipments constituted approximately 89% and 84% of total shipments of coal volume from our mines during the years ended December 31, 2023 and 2022, respectively. The balance was shipped from our preparation plants, loadout facilities or mines via truck or barge. Our export sales are primarily shipped to DTA and Pier 6 (Lambert’s Point) shipping ports in the Hampton Roads area of Virginia. We may ship limited export quantities through other U.S. ports when warranted by logistics and economics.
Procurement
Principal goods and services used in our business include mining equipment, replacement parts and materials such as explosives, diesel fuel, tires, conveyance structure, ventilation supplies, lubricants, steel, magnetite and other raw materials, maintenance and repair services, electricity, and roof control and support items. We rely substantially on third-party suppliers to provide mining materials and equipment. Although there continues to be consolidation, which has resulted in a limited number of suppliers for certain types of equipment and supplies, we believe that adequate substitute suppliers are available.
In the first quarter of 2023, we completed a series of transactions to acquire a number of coal trucks and related equipment and facilities to secure trucking services for our operations. In December 2022, we purchased substantially all of the assets of a mining equipment component manufacturing and rebuild business to help secure the supply of certain underground mining equipment parts needed for our operations.
We incur substantial expenses each year to procure goods and services in support of our respective business activities in addition to capital expenditures. We use suppliers for a significant portion of our equipment rebuilds and repairs, as well as construction and reclamation activities.
We have a centralized sourcing group, which sets sourcing policy and strategy focusing primarily on major supplier contract negotiation and administration, including but not limited to the purchase of major capital goods in support of the mining operations. We promote competition between suppliers and seek to develop relationships with suppliers that focus on lowering our costs while improving quality and service. We seek suppliers who identify and concentrate on implementing continuous improvement opportunities within their area of expertise.
Competition
The coal industry is highly competitive, both in the U.S. and internationally. In the met coal market, of the approximately 72.4 million tons produced in the U.S. in 2023, we produced approximately 14.8 million tons, or 20%. A significant portion of U.S. met coal production is shipped internationally, where it competes directly with international sources of production. Approximately 71% of our met coal tons sold were shipped internationally in 2023.
In the thermal market, of the approximately 502.0 million tons produced in the U.S. in 2023, we produced approximately 1.9 million tons, or less than 1%. Only a small portion of overall U.S. thermal production is shipped internationally, but there is strong competition in the domestic market. Approximately 66% of our thermal coal tons sold were shipped internationally in 2023. We compete for U.S. sales with numerous coal producers in the Appalachian region and the Illinois basin, and in some cases with western coal producers.
Demand for met coal and the prices that we are able to obtain for it depend to a large extent on the demand and price for steel in the U.S. and internationally. This demand is influenced by factors beyond our control, including overall economic activity and the availability and relative cost of substitute materials. In the export met coal market, we compete with producers from Australia and Canada and with other international producers on many of the same factors as in the U.S. market. Competition in the export market is also affected by fluctuations in relative foreign exchange rates and costs of inland and ocean transportation, among other factors.
Demand for thermal coal and the prices that we are able to obtain for it are closely linked to coal consumption patterns of the domestic electric generation industry. These coal consumption patterns are influenced by many factors beyond our control, including the demand for electricity, which is significantly dependent upon summer and winter temperatures, and commercial and industrial outputs in the U.S., environmental and other government regulations, technological developments and the location, availability, quality and price of competing sources of power. These competing sources include natural gas, nuclear, fuel oil and increasingly, renewable sources such as solar and wind power. Demand for thermal coal and the prices that we are able to obtain for it are affected by each of the above factors.
Human Capital Resources
As of December 31, 2023, we had approximately 4,160 employees, all of which were full-time employees, with 74% of our total workforce being hourly workers. Our employees were almost entirely located in the United States, with three employees located outside the United States. Approximately 97% of our total workforce was union-free as of December 31, 2023. Certain of our subsidiaries have wage agreements with the UMWA representing roughly 3% of our workforce. Certain of our subsidiaries have wage agreements with the UMWA that are subject to termination by either the employer or the UMWA, without cause, on July 31, 2025 and one on February 28, 2026. We strive to maintain positive working relationships with organized labor. Relations with our employees are important to our success, and we believe that we have good relations with our workforce.
As of December 31, 2023, we had approximately 3,900 employees working at our mining operations across Central Appalachia in Virginia and West Virginia, while the remainder of our personnel were employed at our headquarters in Bristol, Tennessee, in Julian, West Virginia, or at other administrative offices throughout the region. As of December 31, 2023, approximately 37% of our total workforce had at least ten years of service with our Company, while approximately 25% had fifteen or more years of service with our Company.
Employee Compensation and Benefits
We require a skilled workforce with mining experience and proficiency as well as qualified managers and supervisors to run our business. In addition, we depend on the experience and industry knowledge of our officers and other key employees to design and execute our business plans. We, along with the mining industry generally, face a shortage of skilled and experienced employees. Therefore, we offer employees competitive compensation and benefits to attract and retain a skilled and qualified workforce. We offer our employees competitive fixed base pay; a bonus incentive program for administrative positions tied to company safety, environmental stewardship, and financial performance; an operations bonus incentive program tied to site-specific safety, environmental stewardship and production goals; retention programs; paid time-off including holidays; a comprehensive benefits package that includes medical, dental, and vision coverage; disability and life insurance coverages; and a 401(k) retirement savings program with an employer match. All employees have access to our Employee Assistance Program (“EAP”) at no cost, which gives them and their family access to licensed professionals for help with mental health, stress, addiction, grievances, relationship issues, childcare and eldercare services, legal and personal finance services and other work/life balance matters. To help retain key employees in certain positions, our long-term incentive program awards cash or equity grants with time-based and performance-based vesting conditions. Certain key employees are also eligible to participate in our non-qualified deferred compensation plan.
Employee Training and Development
At Alpha, we strive to maintain a positive culture where employees can contribute their best work, take pride in doing the right thing, and work to improve and strengthen the organization. To have a successful operation, we endeavor to establish and maintain relationships with and among our employees that are built upon mutual respect, trust, and appreciation.
Due to the industry shortage of skilled and experienced employees, we have an extensive in-house apprentice miner training program. Selected participants are given robust safety and mining training over a six-month period in order to obtain their required miner’s certification. We frequently provide training opportunities for operations employees to obtain certifications for Emergency Medical Technician (“EMT”), Mechanical Engineering Technology (“MET”), foreman and supervisory certifications, and electrical certifications in addition to providing apprentice miner training and supervisor training programs.
In addition to various training programs that we require employees in certain skilled positions to complete, all of our employees are provided with employee handbooks and are expected to follow policies and procedures concerning employment matters at Alpha and our affiliates including, but not limited to: anti-harassment, workplace violence, code of business ethics, drug and alcohol policies, safety policies and vehicle policies.
Employee Safety, Health, and Welfare
Safety is one of our core values and is the foundation for how we manage every aspect of our business. Our employees are empowered with the skills, training, resources, and responsibility to perform their jobs in a safe manner and are accountable for their own safety as well as the safety of their co-workers. Every employee has a voice in the safety process at each of our mines and other operating sites.
Our behavior-based safety process empowers employees to engage in the elimination of at-risk behaviors in the workplace and in incident prevention and continuous improvement. In recognition of the interdependence between safety and operations, our “Safe Production” process promotes the effective utilization of procedures, developing safety action plans at each operating group and sharing of best practices, safety alerts and lessons learned across the entire organization.
Safety leadership and training programs are based upon the concepts of situational awareness and observation, changing behaviors and, most importantly, employee involvement. The core elements of our safety training include identification of critical behaviors and the frequency of those behaviors, employee feedback, and removal of barriers for continuous improvement. All employees are empowered to champion the safety process and are challenged to identify hazards and initiate prompt corrective actions. All levels of the organization are expected to be proactive and commit to continuous improvement and implementation of new safety processes that promote a safe and healthy work environment.
In 2023, we achieved an overall Non-fatal days lost (“NFDL”) safety incident rate that was 41% better than the U.S. industry average NFDL safety incident rate per 200,000 hours worked. The industry rate is based on available data for the first three quarters of 2023 and the Alpha rate reflects full year 2023.
Alpha’s mine operations routinely collaborate with academic institutions as well as federal and state agencies to facilitate testing of new concepts and technologies and to utilize them whenever possible to provide the best safety and protection for our employees.
We also believe in taking precautions to avoid incidents and prevent them from occurring. Our Incident Response Plan and Mine Emergency Response Drills have been developed and widely disseminated to appropriate operations and corporate personnel to build the framework for a prompt and coordinated response in the event an incident occurs. Alpha’s award winning mine rescue teams undergo highly specialized training and compete in regional and national mine rescue events to test their skills in first aid, firefighting, mine ventilation, and critical decision-making.
As posted on our Company website, several of our mine operations have been recognized on numerous occasions for outstanding performance and have received several awards in the areas of safety and mine rescue. In 2023, Alpha mine rescue teams won two overall grand champion awards along with several other first-place awards in both overall competition honors and technical category titles.
Refer to Exhibit 95 Mine Safety Disclosure included in this Annual Report on Form 10-K for additional mine safety information.
Legal Proceedings
We could become party to legal proceedings from time to time. These proceedings, as well as governmental examinations, could involve various business units and a variety of claims, including, but not limited to, contract disputes, personal injury claims, property damage claims (including those resulting from blasting, subsidence, trucking and flooding), environmental and safety issues, and employment matters. While some legal matters may specify the damages claimed by the plaintiffs, many seek an unquantified amount of damages. Even when the amount of damages claimed against us or our subsidiaries is stated, (i) the claimed amount may be exaggerated or unsupported; (ii) the claim may be based on a novel legal theory or involve a large number of parties; (iii) there may be uncertainty as to the likelihood of a class being certified or the ultimate size of the class; (iv) there may be uncertainty as to the outcome of pending appeals or motions; and/or (v) there may be significant factual issues to be resolved. As a result, if such legal matters arise in the future, we may be unable to estimate a range of possible loss for matters that have not yet progressed sufficiently through discovery and development of important factual information and legal issues. We record accruals based on an estimate of the ultimate outcome of these matters, but these estimates can be difficult to determine and involve significant judgment. For additional information about the Company’s legal proceedings, refer to Note 21, part (d), to the Consolidated Financial Statements, which is incorporated herein by reference.
ENVIRONMENTAL AND OTHER REGULATORY MATTERS
Federal, state and local authorities regulate the U.S. coal mining industry and the industries it serves with respect to matters such as employee health and safety, permitting and licensing requirements, air quality standards, water quality, plant and wildlife protection, the reclamation of mining properties after mining has been completed, the discharge of materials into the environment, surface subsidence from underground mining, and the effects of mining on groundwater quality and availability. These laws and regulations, which are extensive, subject to change, and have tended to become stricter over time, have had, and will continue to have, a significant effect on our production costs and our competitive position relative to certain other sources of electricity generation. Future legislation, regulations or orders, as well as future interpretations and more rigorous enforcement of existing laws, regulations or orders, may require substantial increases in equipment and operating costs to us and delays, interruptions, or a termination of operations, the likelihood or extent of which we cannot predict. In particular, the U.S. Securities and Exchange Commission (“SEC”) continues to work to finalize regulations it proposed in March 2022 intended to standardize climate-related disclosures. We intend to continue to comply with regulatory requirements as they evolve by timely implementing necessary modifications to facilities or operating procedures. Future legislation, regulations, orders or regional or international arrangements, agreements or treaties, as well as efforts by private organizations, including those relating to global climate change, may continue to cause coal to become more heavily regulated.
We endeavor to conduct our mining operations in compliance with all applicable federal, state, and local laws and regulations. We have certain procedures in place that are designed to enable us to comply with these laws and regulations. However, due to the complexity and interpretation of these laws and regulations, we cannot guarantee that we have been or will be at all times in complete compliance, and violations are likely to occur from time to time. None of the violations or the monetary penalties assessed upon us have been material. Future liability under or compliance with environmental and safety requirements could, however, have a material adverse effect on our operations or competitive position. Under some circumstances, substantial fines and penalties, including revocation, denial or suspension of mining permits, may be imposed under the laws described below.
Monetary sanctions, expensive compliance measures and, in severe circumstances, criminal sanctions may be imposed for failure to comply with these laws.
As of December 31, 2023, we had accrued $205.4 million for reclamation liabilities and mine closures, including $38.9 million of current liabilities.
Mining Permits and Approvals
Numerous governmental permits or approvals are required for mining operations pursuant to certain federal, state and local laws applicable to our operations. When we apply for these permits and approvals, we may be required to prepare and present data to federal, state or local authorities pertaining to the effect or impact that any proposed production or processing of coal may have upon the environment and measures we will take to minimize and mitigate those impacts. The requirements imposed by any of these authorities may be costly and time consuming and may delay commencement or continuation of mining operations.
In order to obtain mining permits and approvals from federal and state regulatory authorities, mine operators, including us, must submit a reclamation plan for restoring, upon the completion of mining operations, the mined property to its prior or better condition, productive use or other permitted condition. Typically, we submit the necessary permit applications several months, or even years, before we plan to begin mining a new area. Mining permits generally are approved months or even years after a completed application is submitted. Therefore, we cannot be assured that we will obtain future mining permits in a timely manner.
Permitting requirements also require, under certain circumstances, that we obtain surface owner consent if the surface estate has been severed from the mineral estate. This requires us to negotiate with third parties for surface rights that overlie coal we control or intend to control. These negotiations can be costly and time-consuming, lasting years in some instances, which can create additional delays in the permitting process. If we cannot successfully negotiate for surface rights, we could be denied a permit to mine coal we already control.
On October 4, 2019, the WV Bankruptcy Court entered an order approving the sale by Blackjewel of the Western Assets to ESM. The ESM Transaction occurred on October 18, 2019. We were the former owner of the Western Assets, having sold them to Blackjewel in December 2017 (the “2017 Blackjewel Sale”). As the mine permit transfer process relating to our sale of the Western Assets to Blackjewel had not been completed prior to Blackjewel’s and certain of its affiliates’ filing petitions for relief under chapter 11 of title 11 of the U.S. Code (the “Bankruptcy Code”), we remained the permitholder in good standing for both mines.
In connection with ESM’s acquisition of the Western Assets from Blackjewel, on October 18, 2019, we and ESM finalized an agreement that provided, among other items, for the eventual transfer of the Western Asset permits from us to ESM and replacement by ESM of our surety bonds associated with these properties. In furtherance of certain objectives contemplated under that agreement, we and ESM agreed to the merger of two of our now-former subsidiaries, i.e., Contura Coal West, LLC (“CCW”), which held and still holds the Western Asset permits, and Contura Wyoming Land, LLC (“CWL”), with certain entities formed by ESM for purposes of acquiring CCW and CWL. The ESM entities involved in the mergers were ESM Coal West SPV, LLC (“First Merging Entity”) and ESM Wyoming Land SPV, LLC (“Second Merging Entity”). The mergers were consummated effective May 29, 2020, with the First Merging Entity merging with and into CCW, with CCW as the surviving entity (the “First Surviving Entity”), and the Second Merging Entity merging with and into CWL, with CWL as the surviving entity (the “Second Surviving Entity”). Upon the mergers becoming effective, each of the First Surviving Entity and the Second Surviving Entity became wholly-owned subsidiaries of ESM. As such, the Western Asset permits are still held by the same entity, Contura Coal West, LLC, but said entity is no longer a subsidiary of ours, and we no longer have surety bonds associated with these permits and properties.
Surface Mining Control and Reclamation Act
SMCRA, which is administered by the Office of Surface Mining Reclamation and Enforcement (“OSM”), establishes mining, environmental protection, reclamation, and closure standards for all aspects of surface mining as well as many aspects of underground mining that effect surface expressions. Mine operators must obtain SMCRA permits and permit renewals from the OSM or from the applicable state agency if the state agency has obtained primary control of administration and enforcement of the SMCRA program, or primacy. A state agency may obtain primacy if OSM concludes that the state regulatory agency’s mining regulatory program is no less stringent than the federal mining program under SMCRA. States where we have active mining operations have achieved primacy and issue permits in lieu of OSM. OSM maintains oversight of how the states administer their programs.
SMCRA permit provisions include a complex set of requirements which include: coal prospecting; mine plan development; topsoil or growth medium removal, storage and replacement; selective handling of overburden materials; mine pit backfilling and grading; protection of the hydrologic balance, including outside the permit area; subsidence control for underground mines; surface drainage control; mine drainage and mine discharge control and treatment; and re-vegetation and reclamation.
The mining permit application process is initiated by collecting baseline data to adequately characterize the pre-mine environmental condition of the permit area. This work includes, but is not limited to, surveys of cultural and historical resources, soils, vegetation, wildlife, assessment of surface and ground water hydrology, climatology, and wetlands. In conducting this work, we collect geologic data to define and model the soil and rock structures associated with the coal that we will mine. We develop mining and reclamation plans by utilizing this geologic data and incorporating elements of the environmental data. The mining and reclamation plan incorporates the provisions of SMCRA, the state programs, and the complementary environmental programs that affect coal mining. Also included in the permit application are documents defining ownership and agreements pertaining to coal, minerals, oil and gas, water rights, rights of way and surface land, and documents required of the OSM’s Applicant Violator System (“AVS”), including the mining and compliance history of officers, directors and principal owners of the entity.
Regulations under SMCRA and its state analogues provide that a mining permit or modification can, under certain circumstances, be delayed, refused or revoked if we or any entity that owns or controls us or is under common ownership or control with us have unabated permit violations or have been the subject of permit or reclamation bond revocation or suspension. These regulations define certain relationships, such as owning over 50% of stock in an entity or having the authority to determine the manner in which the entity conducts mining operations, as constituting ownership and control. Certain other relationships are presumed to constitute ownership or control, including being an officer or director of an entity or owning between 10% and 50% of the mining operator. This presumption, in some cases, can be rebutted where the person or entity can demonstrate that it in fact does not or did not have authority directly or indirectly to determine the manner in which the relevant coal mining operation is conducted. Thus, past or ongoing violations of federal and state mining laws by us or by coal mining operations owned or controlled by our significant stockholders, directors or officers or certain other third-party affiliates could provide a basis to revoke existing permits and to deny the issuance of additional permits or modifications or amendments of existing permits. This is known as being “permit-blocked.” In recent years, the permitting required for coal mining has been the subject of increasingly stringent regulatory and administrative requirements and extensive litigation by environmental groups.
Once a permit application is prepared and submitted to the regulatory agency, it goes through a completeness review and technical review. Public notice of the proposed permit is given, which also provides for a comment period before a permit can be issued. Some SMCRA mine permits take over a year to prepare, depending on the size and complexity of the mine and may take months or even years to be issued.
Regulatory authorities have considerable discretion in the timing of the permit issuance and the public and other agencies have rights to comment on and otherwise engage in the permitting process, including through intervention in the courts.
The Abandoned Mine Land Fund, which is part of SMCRA, requires a fee on all coal produced. The proceeds are used to reclaim mine lands closed or abandoned prior to SMCRA’s adoption in 1977. The current fee, which is effective through September 30, 2034, is $0.224 per ton on surface-mined coal and $0.096 per ton on deep-mined coal. For each of the years ended December 31, 2023 and 2022, we recorded $2.0 million of expense related to these fees.
While SMCRA is a comprehensive statute, SMCRA does not supersede the need for compliance with other major environmental statutes, including the Endangered Species Act; Clean Air Act; Clean Water Act; Resource Conservation and Recovery Act (“RCRA”) and Comprehensive Environmental Response, Compensation and Liability Act (“CERCLA” or “Superfund”).
Surety Bonds
Federal and state laws require us to obtain surety bonds or other approved forms of security to cover the costs of certain long-term obligations, including mine closure or reclamation costs under SMCRA, federal and state workers’ compensation costs, coal leases and other miscellaneous obligations. As of December 31, 2023 and 2022, our posted third-party surety bond amount in all states where we operate was approximately $177.1 million and $165.6 million, respectively, which was used to primarily secure the performance of our reclamation and lease obligations.
Posting of a bond or other security with respect to the performance of reclamation obligations is a condition to the issuance of a permit under SMCRA. Under the terms of agreements we and Alpha Natural Resources, Inc. entered into in connection with the Alpha Natural Resources, Inc. Restructuring, we and Alpha Natural Resources, Inc. were required to replace Alpha Natural Resources, Inc.’s self-bonds with surety bonds, collateralized bonds, or other financial assurance mechanisms, over time and under applicable regulations. Self-bonding may not be available to us as a means to comply with our reclamation bonding obligations for the foreseeable future. In August 2016, OSM announced its decision to pursue a rulemaking to evaluate self-bonding for coal mines, including eligibility standards. OSM has not yet issued a proposed rule to address this issue.
Clean Air Act
The Clean Air Act and comparable state laws that regulate air emissions affect coal mining operations both directly and indirectly. Direct impacts on coal mining and processing operations include Clean Air Act permitting requirements and emission control requirements relating to particulate matter (“PM”), which may include controlling fugitive dust. The Clean Air Act indirectly affects coal mining operations by extensively regulating air emissions of particulate matter, sulfur dioxide, nitrogen oxides, mercury and other compounds emitted by coal-fired electricity generating plants or the use of met coal in connection with steelmaking operations. In recent years, Congress has considered legislation that would require increased reductions in emissions of sulfur dioxide, nitrogen oxide, and mercury. The general effect of emission regulations on coal-fired power plants could be to reduce demand for coal.
In addition to the greenhouse gas (“GHG”) issues discussed below, the air emissions programs that may materially and adversely affect our operations, financial results, liquidity, and demand for coal, directly or indirectly, include, but are not limited to, the following:
•Acid Rain. Title IV of the Clean Air Act requires reductions of sulfur dioxide emissions by electric utilities. Affected electricity generators have sought to meet these requirements by, among other compliance methods, switching to lower sulfur fuels, installing pollution control devices, reducing electricity generating levels or purchasing or trading sulfur dioxide emission allowances. We cannot accurately predict the effect of these provisions of the Clean Air Act on us in future years.
•NAAQS for Criteria Pollutants. The Clean Air Act requires the EPA to set standards, referred to as National Ambient Air Quality Standards (“NAAQS”), for six common air pollutants, including nitrogen oxide, sulfur dioxide, particulate matter, and ozone. Areas that are not in compliance (referred to as “non- attainment areas”) with these standards must take steps to reduce emissions levels. Over the past several years, the EPA has revised its NAAQS for nitrogen oxide, sulfur dioxide, particulate matter and ozone, in each case making the standards more stringent. As a result, some states will be required to amend their existing individual state implementation plans (“SIPs”) to achieve compliance with the new air quality standards. Other states will be required to develop new plans for areas that were previously in “attainment,” but do not meet the revised standards. On December 7, 2020, the EPA announced the agency’s final
decision to retain the existing National Ambient Air Quality Standards for particulate matter set by the Obama-Biden Administrations without changes. However, on January 6, 2023, the EPA proposed to revise the primary (health-based) annual standard for PM2.5, from its current level of 12.0 parts per billion (ppb or µg/m3) to within the range of 9.0 to 10.0 µg/m3. The EPA also proposed revisions to some other provisions of the PM NAAQS, including revisions to the air quality index and monitoring requirements, but did not propose to change other key aspects of the standard: (i) the secondary (welfare-based) annual PM2.5 standard; (ii) the primary and secondary 24-hour PM2.5 standards and (iii) the primary and secondary 24-hour PM10 standards. On February 7, 2024, the EPA revised the primary (health-based) annual standard for PM2.5, from its current level of 12.0 µg/m3 to 9.0 µg/m3. The EPA retained the 24-hour standard and the current primary 24-hour standard for PM10, which provides protection against coarse particles. The EPA is not changing the secondary (welfare-based) standards for fine particles and coarse particles at this time.
In October 2015, the EPA finalized the NAAQS for ozone pollution and reduced the limit to 70 ppb from the previous 75 ppb standard. The EPA made the majority of area designations related to this rule on November 16, 2017 and June 4, 2018 and finalized designations for the remaining regions of the country on July 25, 2018. Under the revised NAAQS for ozone in particular, significant additional emissions control expenditures may be required at coal-fired power plants. The final rules and new standards may impose additional emissions control requirements on our customers in the electric generation, steelmaking, and coke industries. Although coal mining and processing operations may emit certain criteria pollutants, we operate in material compliance with our permits. However, our operations could be affected if the attainment status of the areas in which we operate changes in the future.
A suit by industry in the D.C. Circuit challenged the EPA’s 2015 Ozone NAAQS (Murray Energy Corp. v. EPA), which resulted in the court upholding the rule with the exception of the secondary NAAQS standards addressing protection of animals, crops and vegetation, which were sent back to the EPA for further consideration. On December 23, 2020, the EPA announced its decision to retain, without changes, the 2015 ozone National Ambient Air Quality Standards set by the Obama-Biden Administration.
•NOx SIP Call. The NOx SIP Call program was established by the EPA in October of 1998 to reduce the transport of nitrogen oxide and ozone on prevailing winds from the Midwest and South to states in the Northeast, which said they could not meet federal air quality standards because of migrating pollution. The program is designed to reduce nitrogen oxide emissions by one million tons per year in 22 eastern states and the District of Columbia. As a result of the program, many power plants have been or will be required to install additional emission control measures, such as selective catalytic reduction devices. Installation of additional emission control measures will make it more costly to operate coal-fired power plants, potentially making coal a less attractive fuel. On February 26, 2019, the EPA published a final rule amending the NOx SIP Call regulations to allow states to establish alternative monitoring and reporting requirements for certain sources.
On March 15, 2023, the EPA issued its Good Neighbor Plan rules (the “Good Neighbor Plan”), which secure significant reductions in cross-state air pollution of ozone-forming emissions of nitrogen oxides (NOx) from power plants and industrial facilities. The Good Neighbor Plan is intended to reduce seasonal ozone-forming emissions of NOx from power plants and industrial facilities in 23 states. Industry groups and the State of Ohio have filed lawsuits challenging the Good Neighbor Plan. Due to court orders staying implementation of certain aspect of the Good Neighbor Plan, the EPA is implementing the Good Neighbor Plan only in certain states. As of September 21, 2023, the Good Neighbor Plan's “Group 3” ozone-season NOx control program for power plants is being implemented in the following states: Illinois, Indiana, Maryland, Michigan, New Jersey, New York, Ohio, Pennsylvania, Virginia, and Wisconsin. Due to the court orders, the EPA is not currently implementing the Good Neighbor Plan “Group 3” ozone-season NOx control program for power plants in the following states: Alabama, Arkansas, Kentucky, Louisiana, Minnesota, Mississippi, Missouri, Nevada, Oklahoma, Texas, Utah, and West Virginia. On December 20, 2023, the United States Supreme Court agreed to hear oral argument in four consolidated cases challenging the Good Neighbor Plan. The Court has scheduled oral argument for the cases in its February 2024 term and directed the parties to address, among other issues, whether the emissions controls imposed by the Good Neighbor Plan are reasonable regardless of the number of states subject to the Good Neighbor Plan.
•Cross-State Air Pollution Rule. In June 2011, the EPA finalized the CSAPR, which required 28 states in the Midwest and the eastern seaboard of the U.S. to reduce power plant emissions that cross state lines and contribute to ozone and/or fine particle pollution in other states. Nitrogen oxide and sulfur dioxide emission reductions were scheduled to commence in 2012, with further reductions effective in 2014. However, implementation of CSAPR’s requirements were delayed due to litigation. In October 2014, the EPA issued an interim final rule reconciling the CSAPR with the Court’s order, which called for Phase 1 implementation in 2015 and Phase 2 implementation in 2017.
In September 2016, the EPA finalized an update to the CSAPR ozone season program by issuing the Final CSAPR Update rule. The Final CSAPR Update rule is the subject of a pending legal challenge in the D.C. Circuit by five states. In September 2019, the D.C. Circuit concluded that the rule was valid in certain respects but that it failed to ensure that pollution from upwind states would not prevent downwind states from meeting air quality standards in a timely manner. The court directed the EPA to revise the rule to address this failure. For states to meet their requirements under the Final CSAPR Update rule, a number of coal-fired electric generating units will likely need to be retired, rather than retrofitted with the necessary emission control technologies, reducing demand for thermal coal. On October 15, 2020, the EPA proposed the Revised CSAPR Update rule in order to fully address 21 states’ outstanding interstate pollution transport obligations for the 2008 ozone National Ambient Air Quality Standards. The EPA finalized the Revised CSAPR Update rule on April 30, 2021. The EPA estimated that the Revised CSAPR Update rule will reduce NOX emissions from power plants in 12 states in the eastern United States by 17,000 tons in 2021 compared to projections without the rule, yielding public health and climate benefits that are valued, on average, at up to $2.8 billion each year from 2021 to 2040. An industry group challenged the Revised CSAPR Update rule in the U.S. Court of Appeals for the District of Columbia. On March 3, 2023, the Court rejected this challenge.
•Mercury and Hazardous Air Pollutants. In February 2012, the EPA formally adopted a rule to regulate emissions of mercury and other metals, fine particulates, and acid gases such as hydrogen chloride from coal- and oil-fired power plants, referred to as “MATS.” In March 2013, the EPA finalized reconsideration of the MATS rule as it pertains to new power plants, principally adjusting emissions limits for new coal-fired units to levels considered attainable by existing control technologies. In subsequent litigation, the U.S. Supreme Court struck down the MATS rule based on the EPA’s failure to take costs into consideration. The D.C. Circuit allowed the current rule to stay in place until the EPA issued a new finding. In April 2016, the EPA issued a final finding that it is appropriate and necessary to set standards for emissions of air toxics from coal- and oil-fired power plants. However, in April 2017, the EPA indicated in a court filing that it may reconsider this finding, and on April 27, 2017, the D.C. Circuit stayed the litigation. In August 2018, the EPA stated that it plans on sending a draft proposal to the White House questioning the EPA’s earlier finding and intends to reevaluate the MATS rule itself.
On December 27, 2018, the EPA issued a proposed revised Supplemental Cost Finding for MATS, as well as the Clean Air Act required “risk and technology review.” After taking account of both the cost to coal- and oil-fired power plants of complying with the MATS rule and the benefits attributable to regulating hazardous air pollutant (“HAP”) emissions from these power plants, the EPA proposed to determine that it is not “appropriate and necessary” to regulate HAP emissions from power plants under Section 112 of the Clean Air Act. The emission standards and other requirements of the MATS rule, first promulgated in 2012, would remain in place, however, since the EPA did not propose to remove coal- and oil-fired power plants from the list of sources that are regulated under Section 112 of the Act.
On April 15, 2020, the EPA established a new subcategory in the MATS for electric utility steam generating units (“EGU’s”) that burn eastern bituminous coal refuse (“EBCR”). Coal refuse includes low-quality coal mixed with rock, clay and other material. The EPA is also establishing emission standards from these facilities. The new subcategory and emission standards will affect six existing EGUs that burn EBCR.
On May 22, 2020, the EPA published the completed reconsideration of the appropriate and necessary finding for the MATS. The EPA concluded that it is not “appropriate and necessary” to regulate electric utility steam generating units under Section 112 of the Clean Air Act. The EPA is also taking final action on the residual risk and technology review that is required by the CAA Section 112. The EPA states, “emissions of HAP have been reduced such that residual risk is at acceptable levels, that there are no developments in HAP emissions controls to achieve further cost-effective reductions beyond the current standard, and, therefore, no changes to the MATS rule are warranted.”
On February 15, 2023, however, the EPA revoked its 2020 finding that it was not appropriate and necessary to regulate coal- and oil-fired power plants under Section 112 of the Clean Air Act, which regulates HAP emissions. The EPA reviewed the 2020 finding and stated that it considered updated information on both (i) the public health burden associated with HAP emissions from coal- and oil-fired power plants; and (ii) the costs associated with reducing those emissions under the MATS rule. On April 3, 2023, the EPA issued a proposed rule that the EPA said would strengthen and update the MATS for power plants to reflect recent developments in control technologies and the performance of these plants.
Apart from MATS, several states have enacted or proposed regulations requiring reductions in mercury emissions from coal-fired power plants, and federal legislation to reduce mercury emissions from power plants has been proposed. Regulation of mercury emissions by the EPA (and in particular, the reconsideration by the current EPA of any rulemaking relating to the MATS rule during the prior presidential administration), states, Congress, or pursuant to an international treaty may further decrease the demand for coal.
Like CSAPR, MATS and other similar future regulations could accelerate the retirement of a significant number of coal-fired power plants, in addition to the significant number of plants and units that have already been retired as a result of environmental and regulatory requirements and uncertainties adversely impacting coal-fired generation. Such retirements would likely adversely impact our business.
•Regional Haze, New Source Review and Methane. The EPA’s regional haze program is intended to protect and improve visibility at and around national parks, national wilderness areas and international parks. In December 2011, the EPA issued a final rule under which the emission caps imposed under CSAPR for a given state would supplant the obligations of that state with regard to visibility protection. In May 2012, the EPA finalized a rule that allows the trading programs in CSAPR to serve as an alternative to determining source-by-source Best Available Retrofit Technology (“BART”). This rule provides that states in the CSAPR region can substitute participation in CSAPR for source-specific BART for sulfur dioxide and/or nitrogen oxides emissions from power plants. This program may result in additional emissions restrictions from new coal-fueled power plants whose operations may impair visibility at and around federally protected areas. This program may also require certain existing coal-fueled power plants to install additional control measures designed to limit haze causing emissions, such as sulfur dioxide, nitrogen oxides, volatile organic chemicals and particulate matter. These limitations could result in additional coal plant closures and affect the future market for coal. A final Regional Haze rule was published on January 10, 2017.
In addition, the EPA’s new source review program under certain circumstances requires existing coal-fired power plants, when modifications to those plants significantly change emissions, to install the more stringent air emissions control equipment required of new plants.
Litigation seeking to force the EPA to list coal mines as a category of air pollution sources that endanger public health or welfare under Section 111 of the CAA and establish standards to reduce emissions from sources of methane and other emissions related to coal mines was dismissed by the D.C. Circuit in May 2014. In that case, the Court denied a rulemaking petition citing agency discretion and budgetary restrictions, and ruled that the EPA has reasonable discretion to carry out its delegated responsibilities, which include determining the timing and relative priority of its regulatory agenda. In July 2014, the D.C. Circuit denied a petition seeking a rehearing of the case en banc. Litigation regarding these issues may continue and could result in the need for additional air pollution controls for coal-fired units and our operations.
Global Climate Change
Global climate change initiatives and public perceptions have resulted, and are expected to continue to result, in decreased coal-fired power plant capacity and utilization, phasing out and closing many existing coal-fired power plants, reducing or eliminating construction of new coal-fired power plants in the United States and certain other countries, increased costs to mine coal and decreased demand and prices for thermal coal.
There are three important sources of GHGs associated with the coal industry: first, the end use of our coal by our customers in electricity generation, coke plants, and steelmaking is a source of GHGs; second, combustion of fuel for mining equipment used in coal production; and third, coal mining can release methane, a GHG, directly into the atmosphere. GHG emissions from coal consumption and production are subject to pending and proposed regulation as part of initiatives to address global climate change.
The Kyoto Protocol to the 1992 United Nations Framework Convention on Climate Change (the “Kyoto Protocol”) became effective in 2005 and bound those developed countries that ratified it (which the U.S. did not do) to reduce their global GHG emissions. In December 2015, the United States and almost 200 nations agreed to the Paris Agreement, which entered into force on November 4, 2016 and has the long-term goal to limit global warming to below two degrees Celsius by 2100 from temperatures in the pre-industrial era. Although this agreement does not create any binding obligations for nations to limit their GHG emissions, it does include pledges to voluntarily limit or reduce future emissions. On June 1, 2017, the Trump administration announced that the U.S. would withdraw from the Paris Agreement. This withdrawal formally took effect on November 4, 2020. However, on February 19, 2021, the U.S. formally rejoined the Paris Agreement. In addition, numerous U.S. governors, mayors and businesses have pledged their commitments to the goals of the Paris Agreement. The Glasgow Climate Pact reached at the 2021 United Nations Climate Change Conference (COP26), though not legally binding, contains a plan to reduce use of coal by 40%. The COP28 United Nations Climate Change Conference was held in Dubai, the United Arab Emirates, held from November 30 to December 13, 2023. COP28 was intended to evaluate the world’s efforts to address climate change under the Paris Agreement. At the end of the COP28 conference, the participating countries agreed to a call on governments worldwide to speed up the transition away from fossil fuels to renewables such as wind and solar power.
These commitments and agreements could further reduce demand and prices for our coal.
In 2009, the EPA issued a finding that emissions of carbon dioxide, methane and other GHGs present an endangerment to public health and the environment. The EPA has since adopted regulations under existing provisions of the CAA pursuant to this finding. For example, the EPA has adopted rules requiring the monitoring and reporting of GHG emissions from specified large GHG emission sources in the U.S., including coal-fired electric power plants and steel-making operations. The EPA has also promulgated the Tailoring Rule, which requires that all new or modified stationary sources of GHGs that will emit more than 75,000 tons of carbon dioxide per year and are otherwise subject to CAA regulation, and any other facilities that will emit more than 100,000 tons of carbon dioxide per year, to undergo prevention of significant deterioration (“PSD”) permitting, which requires that the permitted entity adopt the best available control technology.
In June 2014, the U.S. Supreme Court addressed whether the EPA’s regulation of GHG emissions from new motor vehicles properly triggered GHG permitting requirements for stationary sources under the CAA as well as the validity of the Tailoring Rule under the CAA. The decision reversed, in part, and affirmed, in part, a 2012 D.C. Circuit decision that upheld the Tailoring Rule. Specifically, the Court held that the EPA exceeded its statutory authority when it interpreted the CAA to require PSD and Title V permitting for stationary sources based on their potential GHG emissions. However, the Court also held that the EPA’s determination that a source already subject to the PSD program due to its emission of conventional pollutants may be required to limit its GHG emissions by employing the “best available control technology” was permissible. As a result, the EPA is now requiring new sources already subject to the PSD program, including coal-fired power plants, to undergo control technology reviews for GHGs (predominately carbon dioxide) as a condition of permit issuance. These reviews may impose limits on GHG emissions, or otherwise be used to compel consideration of alternative fuels and generation systems, as well as increase litigation risk for-and so discourage development of-coal-fired power plants.
On August 3, 2015, the EPA released a final rule establishing New Source Performance Standards (“NSPS”) for emissions of carbon dioxide for new, modified and reconstructed fossil fuel-fired electric generating units (“Power Plant NSPS”). The final rule requires that newly constructed fossil fuel-fired steam generating units achieve an emission standard for carbon dioxide of 1,400 lb CO2/MWh-gross. The standard is based on the performance of a supercritical pulverized coal boiler implementing partial carbon capture and storage (“CCS”). Modified and reconstructed fossil fuel fired steam generating units must implement the most efficient generation achievable through a combination of best operating practices and equipment upgrades, to meet an emission standard consistent with best historical performance.
Reconstructed units must implement the most efficient generating technology based on the size of the unit (supercritical steam conditions for larger units, to meet a standard of 1,800 lb CO2/MWh-gross, and subcritical conditions for smaller units to meet a standard of 2,000 lb CO2/MWh-gross). Numerous legal challenges to the final rule are currently pending. There is a risk that CCS technology may not be commercially practical in limiting emissions as otherwise required by the rule or similar rules that may be proposed in the future. If such legislative or regulatory programs are adopted or maintained, and economic, commercially available carbon capture technology for power plants is not developed or adopted in a timely manner, it would negatively affect our customers and would further reduce the demand for coal as a fuel source, causing coal prices and sales of our coal to decline, perhaps materially.
In August 2015, the EPA issued the Clean Power Plan (“CPP”), a final rule that establishes carbon pollution standards for existing power plants, called CO2 emission performance rates. The EPA expected each state to develop implementation plans for power plants in its state to meet the individual state targets established in the CPP. The CPP was immediately subject to legal challenges and was stayed before it was implemented. On July 8, 2019, the EPA, published the ACE Rule, a replacement of the CPP. In contrast to the CPP, which called for the shifting of electricity generation away from coal-fired sources toward natural gas and renewables, the ACE Rule focuses on reducing GHG emissions from existing coal-fired plants by requiring states to mandate the implementation of a range of technologies at power plants designed to improve their heat rate (i.e., decrease the amount of fuel necessary to generate the same amount of electricity). However, on January 19, 2021, the Court of Appeals of the District of Columbia struck down the ACE rule. The EPA has since announced an intent to consider new regulations governing carbon emissions from existing power plants. More stringent standards for carbon dioxide emissions as a result of these rulemakings could further reduce demand for coal, and our business would be adversely impacted.
The United States Congress has, from time to time, considered legislation to reduce GHG emissions, such as a resolution referred to as the Green New Deal, which was introduced in the U.S. House of Representatives in February 2019 and similar legislation may be introduced in the current Congressional term. To date, Congress has not passed a bill specifically addressing GHG regulation. In addition, various states and regions have adopted initiatives to reduce, and in some cases phase out, GHG emissions and certain governmental bodies, including the states of Virginia and California, have considered or are considering the imposition of fees or taxes based on the emission of GHGs by certain facilities. A number of states have enacted legislative mandates requiring electricity suppliers to use renewable energy sources to generate a certain percentage of power.
For example, on September 10, 2018, California adopted a law that requires all electricity consumed by the state to be generated from renewable sources such as solar, wind and hydropower by 2045.
On October 7, 2023, California Governor Gavin Newsom signed three landmark climate disclosure bills that are more stringent than the proposed SEC rules. California’s group of new laws address (i) GHG emissions reporting in compliance with the Greenhouse Gas Protocol (“GHG Protocol”), (ii) climate-related financial risk reporting in accordance with the recommendations of the Task Force on Climate-Related Financial Disclosures (“TCFD”), and (iii) disclosure of information about certain emissions claims and the sale and use of carbon offsets. Although the SEC’s climate disclosure proposal includes GHG Protocol and TCFD requirements, unlike the SEC’s proposed rule, the California requirements apply to certain private and public companies with business activities in California. AB 1305 addresses voluntary carbon market disclosures. It applies to entities that (i) operate and make emissions claims within California; or (ii) buy or sell carbon offsets within California. SB 253 is the Climate Corporate Data Accountability Act. It applies only to business entities with annual revenue over $1 billion that do business in California. It requires disclosure of scope 1, scope 2, and scope 3 GHG emissions. Annual reporting of scope 1 and scope 2 GHC emissions will be required for covered entities beginning in 2026 (for the 2025 fiscal year). Annual reporting of scope 3 GHG emissions will be required beginning in 2027. SB 261 addresses climate-related financial risks of greenhouse gases. It applies to business entities that do business in California if their annual revenue exceeds $500 million. Disclosure will be required on or before January 1, 2026 and biennially thereafter. The Company currently does not do business in California.
In addition, certain banks and other financing sources have taken actions to limit available financing for the development of new coal-fueled power plants, which also may adversely affect the future global demand for coal. Further, there have been recent efforts by members of the general financial and investment communities, such as investment advisors, sovereign wealth funds, public pension funds, universities and other groups, to divest themselves and to promote the divestment of securities issued by companies involved in the fossil fuel extraction market, such as coal producers. Those entities also have been pressuring lenders to limit financing available to such companies. These efforts may adversely affect the market for our securities and our ability to access capital and financial markets in the future.
Furthermore, several well-funded non-governmental organizations have explicitly undertaken campaigns to minimize or eliminate the use of coal as a source of electricity generation. These efforts, as well as concerted conservation and efficiency efforts that result in reduced electricity consumption, could cause coal prices and sales of our coal to materially decline and possibly increase our operating costs.
These and other current or future global climate change laws, regulations, court orders or other legally enforceable mechanisms, or related public perceptions regarding climate change, are expected to require additional controls on coal-fired power plants and industrial boilers and may cause some users of coal to further switch from coal to alternative sources of fuel, thereby depressing demand and pricing for coal.
Clean Water Act
The CWA and corresponding state and local laws and regulations affect coal mining operations by restricting the discharge of pollutants, including dredged or fill materials, into waters of the United States. The CWA provisions and associated state and federal regulations are complex and subject to amendments, legal challenges and changes in implementation. Legislation that seeks to clarify the scope of CWA jurisdiction has also been considered by Congress. Recent court decisions, regulatory actions and proposed legislation have created uncertainty over CWA jurisdiction and permitting requirements.
CWA requirements that may directly or indirectly affect our operations include the following:
Wastewater Discharge
Prior to discharging any pollutants into waters of the United States, coal mining companies must obtain a National Pollutant Discharge Elimination System (“NPDES”) permit from the appropriate state or federal permitting authority. Section 402 of the CWA creates a process for establishing effluent limitations for discharges to streams that are protective of water quality standards through the NPDES program, and corresponding programs implemented by state regulatory agencies. Regular monitoring, reporting and compliance with performance standards are preconditions for the issuance and renewal of NPDES permits that govern discharges into waters of the United States. Failure to comply with the CWA or NPDES permits can lead to the imposition of significant penalties, litigation, compliance costs and delays in coal production. Furthermore, the imposition of future restrictions on the discharge of certain pollutants into waters of the United States could increase the difficulty of obtaining and complying with NPDES permits, which could impose additional time and cost burdens on our operations.
For instance, waters that states have designated as impaired (i.e., as not meeting present water quality standards) are subject to Total Maximum Daily Load regulations, which may lead to the adoption of more stringent discharge standards for our coal mines and could require more costly treatment.
In addition, when water quality in a receiving stream is of high quality, states are required to conduct an anti-degradation review before approving discharge permits. Anti-degradation policies may increase the cost, time and difficulty associated with obtaining and complying with NPDES permits and may also require more costly treatment.
On March 5, 2014, the EPA, the U.S. Department of Justice (“DOJ”), West Virginia Department of Environmental Protection, the Pennsylvania Department of Environmental Protection and the Kentucky Energy and Environment Cabinet filed a Complaint against Alpha Natural Resources, Inc. and its permit holding subsidiaries in Kentucky, Pennsylvania, Tennessee, Virginia and West Virginia alleging that Alpha Natural Resources, Inc.’s mining affiliates in those states and in Tennessee and Virginia exceeded certain water discharge permit limits during the period of 2006 to 2013 and simultaneously entered into a Consent Decree with Alpha Natural Resources, Inc. resolving their claims. The Consent Decree was entered by the Southern District of West Virginia on November 26, 2014 and amended on June 12, 2016 and again on February 28, 2018 (the “Alpha Natural Resources, Inc. Consent Decree”). As part of the Alpha Natural Resources, Inc. Consent Decree, Alpha Natural Resources, Inc. agreed to implement an integrated environmental management system and an expanded auditing/reporting protocol, install selenium and osmotic pressure treatment facilities at specific locations, and certain other measures. The Alpha Natural Resources, Inc. Consent Decree required Alpha Natural Resources, Inc. to pay $27.5 million in civil penalties, to be divided among the federal government and state agencies. All required water treatment systems have been constructed, the environmental management system has been implemented, and the other terms and conditions of the Alpha Natural Resources, Inc. Consent Decree have been substantially satisfied. On February 25, 2020, partial termination of the Consent Decree was granted by the EPA for all but 6 of the Alpha Natural Resources, Inc. Defendants. On January 29, 2021, full termination of the Consent Decree was granted for all the Defendants.
Dredge and Fill Permits
Many mining activities, including the development of settling ponds and the construction of certain sediment control structures, valley fills and surface impoundments, require permits from the U.S. Army Corps of Engineers (“COE”) under Section 404 of the CWA. Generally speaking, these Section 404 permits allow the placement of dredge and fill materials into navigable waters of the United States, including wetlands, streams, and other regulated areas. The COE has issued general “nationwide” permits for specific categories of activities that are similar in nature and that are determined to have minimal adverse effects on the environment. Permits issued pursuant to Nationwide Permits 5, 21, 49 and 50 generally authorize the disposal of dredged or fill material from surface coal mining activities into waters of the United States, subject to certain restrictions. Nationwide Permits are typically reissued for a five-year period and require appropriate mitigation, and permit holders must receive explicit authorization from the COE before proceeding with proposed mining activities. On December 27, 2021 (affecting Nationwide Permit numbers including 5 and 49) and January 13, 2021 (affecting Nationwide Permit numbers including 21 and 50), the COE published its final rules reissuing and modifying its Nationwide Permits. These Nationwide Permits now expire on March 14, 2026. The January 13, 2021 final rule finalized the proposed removal of the 300 linear foot limit for losses of stream bed from several of the Nationwide permits. Expansion of our mining operations into new areas may trigger the need for individual COE approvals, which could be more costly and take more time to obtain.
In January 2020, the EPA and the COE issued a final rule that attempts to clarify the Clean Water Act's (“CWA”) jurisdictional reach over waters of the United States, referred to as the Navigable Waters Protection Rule (“NWPR”). The rule replaces a rule issued in June 2015 by the previous presidential administration, the Clean Water Rule. The Clean Water Rule was the subject of extensive legal challenges, injunctions and administrative action, and was formally repealed in December 2019. After the U.S. District Court for the District of Arizona vacated and remanded the NWPR on August 30, 2021, the EPA and the COE halted implementation of the NWPR nationwide and are interpreting “waters of the United States” consistent with the pre-2015 regulatory regime. On December 30, 2022, the EPA and COE announced the final Revised Definition of Waters of the United States rule, which reasserts the agencies’ CWA jurisdiction over wetlands and certain ephemeral streams. On January 18, 2023, the rule was published in the Federal Register. The rule was effective on March 20, 2023. Like the NWPR, the Revised Definition of Waters of the United States rule has been the subject of legal challenges. On May 25, 2023, the U.S. Supreme Court’s decision in Sackett v. EPA limited the jurisdiction of the EPA and the COE over wetlands. While the January 18, 2023 rule was not directly before the Court, the Court considered the jurisdictional standards set forth in the rule. In Sackett, the Court held that the Clean Water Act’s use of “waters” encompasses only those relatively permanent, standing or continuously flowing bodies of water forming geographical features that are described in ordinary parlance as streams, oceans, rivers, and lakes.
On August 29, 2023, the EPA and the COE issued a final rule to amend the January 2023 rule, to conform the definition of “waters of the United States” to the Supreme Court’s decision in Sackett. This conforming rule amends the provisions of the January 18, 2023 definition of “waters of the United States” that are invalid under the Supreme Court’s interpretation of the Clean Water Act in the Sackett decision. The final amended conforming rule became effective on September 8, 2023. Its ultimate impact on our operations remains uncertain until the agencies regularly implement and apply the rule.
Cooling Water Intake
In May 2014, the EPA issued a new final rule pursuant to Section 316(b) of the CWA that affects the cooling water intake structures at power plants in order to reduce fish impingement and entrainment. The rule is expected to affect over 500 power plants. These requirements could increase our customers’ costs and may adversely affect the demand for coal, which may materially impact our results or operations.
Effluent Guidelines
On November 3, 2015, the EPA published the final rule for Effluent Limitations Guidelines and Standards (“ELGS”), revising the regulations for the Steam Electric Power Generating category, which became effective on January 4, 2016. It establishes the first federal limits on the levels of arsenic, mercury, selenium and nitrate-nitrites in flue gas desulfurization that can be discharged as wastewater from power plants, based on technology improvements over the last three decades. On April 25, 2017, the EPA stayed the implementation of the rule indefinitely to allow for reconsideration. On August 31, 2020, the EPA finalized the rule to revise the ELGS. The 2020 rule changes the technology basis for treatment of Flue Gas Desulfurization Wastewater and Bottom Ash Transport Water.
Endangered Species Act
The ESA and counterpart state legislation protect species threatened with possible extinction. Protection of threatened and endangered species may have the effect of prohibiting or delaying us from obtaining mining permits and mine plan modifications and approvals, and may include restrictions on timber harvesting, road building and other mining activities in areas containing the affected species or their habitats. We may also need to obtain additional permits or approvals if the incidental take of these species in the course of otherwise lawful activity may occur, which could take more time, be more costly and have adverse effects on operations. A number of species indigenous to properties we control or surrounding areas are protected under the ESA including the Guyandotte River Crayfish and the Big Sandy River Crayfish. On January 28, 2020 the U.S. Fish & Wildlife Service (“FWS”) officially published the draft critical habitat designation for the Guyandotte River Crayfish and the Big Sandy River Crayfish in the Federal Register, starting the public comment period on the draft designations. On July 10, 2020, the FWS issued guidance regarding the preparation of protection and enhancement plans (“PEPs”) for coal mining operations located in the Guyandotte River Crayfish habitat in southern West Virginia. The guidance contains several suggestions for requirements to be included in PEPs for proposed mining operations, such as minimizing fill placement, retaining 100 foot vegetative buffers around streams and constructing stream crossings in periods of low flow. Certain other sensitive species that are not currently protected by the ESA may also require protection and mitigation efforts consistent with federal and state requirements.
After the Stream Protection Rule and the accompanying 2016 Biological Opinion were repealed in February 2017, OSM issued a Section 7(d) determination that reinitiated consultation with the FWS to develop a new Biological Opinion. The new Biological Opinion was released on October 16, 2020. One of the most notable changes is the incidental take coverage if there is no agreement between the state regulatory authority and the FWS at the conclusion of the dispute resolution process and the regulatory authority issues the permit. The new Biological Opinion states that “any prohibited take of listed species incidental to that permit action will not be exempted through this incidental take statement.” The Biological Opinion also includes discussion of OSM enforcement powers in primacy states potentially allowing the FWS to effect a permit veto via OSM enforcement actions. The new Biological Opinion could make the permitting process more difficult and expensive.
Resource Conservation and Recovery Act
RCRA affects coal mining operations by establishing requirements for the treatment, storage, and disposal of hazardous wastes. The EPA determined that coal combustion residuals (“CCR”) do not warrant regulation as hazardous wastes under RCRA in May 2000. Most state hazardous waste laws do not regulate CCR as hazardous wastes. The EPA also concluded that beneficial uses of CCR, other than for mine filling, pose no significant risk and no additional national regulations of such beneficial uses are needed. However, the EPA determined that national non-hazardous waste regulations under RCRA are warranted for certain wastes generated from coal combustion, such as coal ash, when the wastes are disposed of in surface impoundments or landfills or used as minefill.
In December 2014, the EPA finalized regulations that address the management of coal ash as a non-hazardous solid waste under Subtitle D. The rules impose engineering, structural and siting standards on surface impoundments and landfills that hold coal combustion wastes and mandate regular inspections. The rules also require fugitive dust controls and impose various monitoring, cleanup, and closure requirements. In July 2018, the EPA published a final rule extending certain deadlines under the original rules, granting certain authority to states with authorized CCR programs and establishing groundwater protection standards for certain constituents. The EPA and OSM plan additional rulemaking relating to CCR.
There have also been several legislative proposals that would require the EPA to further regulate the storage of CCR. For example, in December 2016, Congress passed the Water Infrastructure Improvements for the Nation Act, which allows states to establish permit programs to regulate the disposal of CCR units in lieu of the EPA’s CCR regulations. These requirements, as well as any future changes in the management of CCR, could increase our customers’ operating costs and potentially reduce their ability or need to purchase coal. In addition, contamination caused by the past disposal of CCR, including coal ash, can lead to material liability for our customers under RCRA or other federal or state laws and potentially further reduce the demand for coal.
Comprehensive Environmental Response, Compensation and Liability Act
CERCLA and similar state laws affect coal mining operations by, among other things, imposing cleanup requirements for threatened or actual releases of hazardous substances into the environment. Under CERCLA and similar state laws, joint and several liability may be imposed on hazardous substance generators, site owners, transporters, lessees and others regardless of fault or the legality of the original disposal activity. Although the EPA currently excludes most wastes generated by coal mining and processing operations from the primary hazardous waste laws, the disposal, release or spilling of some products used by coal companies in operations, such as chemicals, could trigger the liability provisions of CERCLA or similar state laws. Thus, we may be subject to liability under CERCLA and similar state laws for our current or former owned, leased or operated coal mines and property or those of our predecessors. We may be liable under CERCLA or similar state laws for the cleanup of hazardous substance contamination and natural resource damages at sites where we control surface rights. These liabilities could be significant and materially and adversely affect our financial results and liquidity.
Use of Explosives. Our surface mining operations are subject to numerous regulations relating to blasting activities. Pursuant to these regulations, we incur costs to design and implement blast schedules and to conduct pre-blast surveys and blast monitoring. In addition, the storage of explosives is subject to regulatory requirements. For example, pursuant to a rule issued by the U.S. Department of Homeland Security (“DHS”) in 2007, facilities in possession of chemicals of interest (including ammonium nitrate at certain threshold levels) are required to complete a screening review. In 2011, the DHS published proposed regulations of ammonium nitrate under the Ammonium Nitrate Security Rule. Many of the requirements of the proposed regulations would be duplicative of those in place under the Bureau of Alcohol, Tobacco, Firearms and Explosives, including registration and background checks, and DHS has moved its 2011 rulemaking to a non-active status because the approach proposed was unlikely to deliver appreciable security benefits. Additional requirements may include tracking and verifications for each transaction related to ammonium nitrate. The outcome of these rulemakings could materially adversely affect our cost or ability to conduct our mining operations.
Other Environmental Laws
We are required to comply with numerous other federal, state and local environmental laws and regulations in addition to those previously discussed. These additional laws include, for example, the Safe Drinking Water Act, the Toxic Substances Control Act and transportation laws adopted to ensure the appropriate transportation of our coal both nationally and internationally. Laws, regulations, and treaties of other countries may also adversely impact our export sales by reducing demand for our coal as a source of power generation in those countries.
Federal and State Nuclear Material Regulations
Many of our operations use equipment with radioactive sources primarily for coal density measurement. Use of this equipment must be approved by the U. S. Nuclear Regulatory Authority or the state agency that has been delegated this authority.
Mine Safety and Health
Stringent health and safety standards have been in effect since Congress enacted the Coal Mine Health and Safety Act of 1969. The Federal Mine Safety and Health Act of 1977 (“Mine Act”) significantly expanded the enforcement of safety and health standards and imposed safety and health standards on all aspects of mining operations. All of the states in which we operate also have state programs for mine safety and health regulation and enforcement.
Collectively, federal and state safety and health regulation in the coal mining industry is among the most comprehensive and pervasive systems for protection of employee health and safety affecting any segment of U.S. industry. The Mine Act is a strict liability statute that requires mandatory inspections of surface and underground coal mines and preparation plants and requires the issuance of enforcement action when it is believed that a standard has been violated. While this regulation has a significant effect on our operating costs, our U.S. competitors are subject to the same degree of regulation.
In 2006, in response to underground mine accidents, Congress enacted the Mine Improvement and New Emergency Response Act (the “MINER Act”). The MINER Act significantly amended the Mine Act, requiring, among other items, improvements in mine safety practices, increasing criminal penalties and establishing a maximum civil penalty for non-compliance, and expanding the scope of federal oversight, inspection and enforcement activities. Since the passage of the MINER Act, enforcement scrutiny has increased, including more inspection hours at mine sites, an increase in the number of inspections and an increase in the number of issuances and related penalties. Various states also have enacted their own new laws and regulations addressing many of these same subjects. The U.S. Mine Safety and Health Administration (“MSHA”) continues to interpret and implement various provisions of the MINER Act, along with introducing new proposed regulations and standards. For example, the second phase of MSHA’s respirable coal mine dust rule went into effect in February 2016 and requires increased sampling frequency and the use of continuous personal dust monitors. In August 2016, the third and final phase of the rule became effective, reducing the overall respirable dust standard in coal mines from 2.0 to 1.5 milligrams per cubic meter of air. Additionally, MSHA’s proposed rule, Lowering Miners’ Exposure to Respirable Crystalline Silica and Improving Respiratory Protection, was published in the federal register on July 13, 2023. The proposed rule would set the permissible exposure limit of respirable crystalline silica at 50 micrograms per cubic meter of air (µg/m3) for a full shift exposure, calculated as an 8-hour time weighted average, for all miners. The proposal also includes other requirements to protect miner health and update existing respiratory protection requirements. The written comment period on the proposed rule was originally scheduled to end on August 28, 2023, and was later extended to September 11, 2023. MSHA held three public hearings to give stakeholders the opportunity to present testimony, written comments, and other documentary evidence on the proposed rule. The final rule is anticipated to be published in 2024. Our compliance with these or any other new mine health and safety regulations could increase our mining costs. If we were found to be in violation of these regulations we could face penalties or restrictions that may materially and adversely affect our operations, financial results and liquidity. Under the Black Lung Benefits Revenue Act of 1977 and the Black Lung Benefits Reform Act of 1977, as amended in 1981, each coal mine operator must secure payment of federal black lung benefits to claimants who are current and former employees and to a trust fund for the payment of benefits and medical expenses to claimants who last worked in the coal industry prior to July 1, 1973. Effective January 1, 2022, the trust fund was funded by an excise tax on coal sold of $0.50 per ton for deep-mined coal and $0.25 per ton for surface-mined coal, neither amount to exceed 2% of the gross sales price. Effective October 1, 2022, the trust fund was funded by an excise tax on coal sold of $1.10 per ton for deep-mined coal and $0.55 per ton for surface-mined coal, neither amount to exceed 4.4% of the gross sales price. The excise tax does not apply to coal shipped outside the United States. For the years ended December 31, 2023 and 2022, we recorded $4.6 million and $2.6 million, respectively, of expense related to this excise tax.
The Patient Protection and Affordable Care Act (“PPACA”) introduced significant changes to the federal black lung program, including an automatic survivor benefit paid upon the death of a miner with an awarded black lung claim, and established a rebuttable presumption with regard to pneumoconiosis among miners with 15 or more years of coal mine employment that are totally disabled by a respiratory condition. On January 18, 2023, the U.S. Department of Labor announced a notice of proposed rulemaking by its Office of Workers’ Compensation Programs to revise regulations governing the standards related to self-insurance by coal mine operators. The proposed rule would update the standards coal operators must meet to self-insure, modernize and streamline the application process and fix the amount of security applicants must post. The proposed rule would also clarify acceptable forms of security and establish an appeals process. Comments on the proposed rule were originally due no later than March 20, 2023. The Department of Labor subsequently extended the deadline for comments until April 19, 2023, and has not yet issued a final rule.
Coal Industry Retiree Health Benefit Act of 1992
Unlike many companies in the coal business, we do not have any liability under the Coal Industry Retiree Health Benefit Act of 1992 (the “Coal Act”), which requires the payment of substantial sums to provide lifetime health benefits to union-represented miners (and their dependents) who retired before 1992, because liabilities under the Coal Act that had been imposed on Alpha Natural Resources, Inc. were settled in the bankruptcy process.
GLOSSARY
Acquisition. Refers to the transaction by which the Company acquired certain of Alpha Natural Resources Inc.’s core coal operations as part of the Alpha Natural Resources, Inc. Restructuring.
Alpha. Alpha Metallurgical Resources, Inc. (the “Company”) (previously named Contura Energy, Inc.).
Alpha Natural Resources, Inc. Restructuring. On August 3, 2015, Alpha Natural Resources, Inc. and each of its wholly owned domestic subsidiaries other than ANR Second Receivables Funding LLC (collectively, the “Debtors”) filed voluntary petitions for relief under Chapter 11 of the U.S. Bankruptcy Code in the United States Bankruptcy Court for the Eastern District of Virginia (the “VA Bankruptcy Court”). The VA Bankruptcy Court approved the Debtors’ Plan of Reorganization on July 7, 2016. On July 26, 2016, a consortium of former creditors of the Debtors acquired the Company’s common stock in exchange for a partial release of their creditor claims pursuant to the Debtors’ bankruptcy settlement. The Debtors, collectively, were a coal producer with operations in Central Appalachia, Northern Appalachia, and the Powder River Basin.
Ash. Impurities consisting of iron, alumina and other incombustible matter that are contained in coal. Since ash increases the weight of coal, it adds to the cost of handling and can affect the burning characteristics of coal.
Bituminous coal. Coal used primarily to generate electricity and to make coke for the steel industry with a heat value ranging between 10,500 and 15,500 BTUs per pound.
British Thermal Unit or BTU. A measure of the thermal energy required to raise the temperature of one pound of pure liquid water one degree Fahrenheit at the temperature at which water has its greatest density (39 degrees Fahrenheit).
Central Appalachia or CAPP. Coal producing area in eastern Kentucky, Virginia, southern West Virginia and a portion of eastern Tennessee.
Coal reserves. The economically mineable part of a measured or indicated coal resource, which includes diluting materials and allowances for losses that may occur when coal is mined or extracted.
Coal resources. Coal deposits in such form, quality, and quantity that there are reasonable prospects for economic extraction.
Coal seam. Coal deposits occur in layers. Each layer is called a “seam.”
Coke. A hard, dry carbon substance produced by heating coal to a very high temperature in the absence of air. Coke is used in the manufacture of iron and steel. Its production results in a number of useful byproducts.
Coking coal. Coal used to produce coke, the primary source of carbon used in steelmaking.
Cumberland Back-to-Back Coal Supply Agreement. Certain agreements with Iron Senergy under which Iron Senergy would sell to the Company all of the coal that the Company was obligated to sell to customers under Cumberland coal supply agreements (“Cumberland CSAs”) which existed as of the transaction closing date but did not transfer to Iron Senergy at closing (each, a “Cumberland Back-to-Back Coal Supply Agreement”). Each Cumberland Back-to-Back Coal Supply Agreement had economic terms identical to, but offsetting, the related Cumberland CSA. If a Cumberland customer subsequently consented to assign a Cumberland CSA to Iron Senergy after closing, the related Cumberland CSA would immediately and automatically transfer to Iron Senergy and the related Cumberland Back-to-Back Coal Supply Agreements executed by the parties would thereupon terminate as set forth therein.
Development stage property. A property with disclosed coal reserves but no material extraction.
ESG. Environmental, social and governance sustainability criteria.
ESM Transaction. The sale by Blackjewel L.L.C. (“Blackjewel”) of the Eagle Butte and Belle Ayr mines located in Wyoming (the “Western Mines” or “Western Assets”) to Eagle Specialty Materials (“ESM”), an affiliate of FM Coal, LLC on October 18, 2019. The ESM Transaction was approved by the United States Bankruptcy Court for the Southern District of West Virginia (the “WV Bankruptcy Court”) pursuant to an order on October 4, 2019. The Company was the former owner of the Western Assets, having sold them to Blackjewel in December 2017.
Exploration stage property. A property with no disclosed coal reserves.
High-Vol A. A coking coal used in steel production with a volatile matter content between 31% and 34.5% on a dry basis.
High-Vol B. A coking coal used in steel production with a volatile matter content between 34.5% and 38% on a dry basis.
Indicated coal resource. That part of a coal resource for which quantity and quality are estimated on the basis of adequate geological evidence and sampling sufficient to establish geological and quality continuity with reasonable certainty.
Inferred coal resource. That part of a coal resource for which quantity and quality are estimated on the basis of limited geological evidence and sampling sufficient to establish that geological and quality continuity are more likely than not. Given the higher level of geological uncertainty, inferred coal resources are not considered when assessing the economic viability of a mining project or determining coal reserves.
Initial assessment. A preliminary technical and economic study of the economic potential of all or parts of mineralization to support the disclosure of mineral resources.
In situ coal resources. Coal resources stated on an in-seam dry basis (excluding surface and inherent moisture) with no consideration for dilution or losses that may occur when coal is mined or extracted.
Longwall mining. The most productive underground mining method in the United States. A rotating drum is advanced mechanically across the face of coal, and a hydraulic system supports the roof of the mine while the drum advances through the coal. Chain conveyors then move the loosened coal to a standard underground mine conveyor system for delivery to the surface.
Low-Vol. A coking coal used in steel production with a volatile matter content between 16% - 23% on a dry basis.
Marketable coal reserves. Coal reserves on a moist basis (including surface and inherent moisture) after considering dilution and losses that may occur when coal in mined or extracted.
Measured coal resource. That part of a coal resource for which quantity and quality are estimated on the basis of conclusive geological evidence and sampling sufficient to test and confirm geological and quality continuity.
Merger. Merger with ANR, Inc. and Alpha Natural Resources Holdings, Inc. completed on November 9, 2018.
Metallurgical coal. The various grades of coal suitable for carbonization to make coke for steel manufacture. Also known as “met” coal, its quality is primarily differentiated based on volatility or its percent of volatile matter. Met coal typically has a particularly high BTU but low ash and sulfur content.
Mid-Vol. A coking coal used in steel production with a volatile matter content between 23% -31% on a dry basis.
Northern Appalachia or NAPP. Coal producing area in Maryland, Ohio, Pennsylvania and northern West Virginia.
Operating Margin. Coal revenues less cost of coal sales.
Powder River Basin or PRB. Coal producing area in northeastern Wyoming and southeastern Montana.
Pre-feasibility study. A comprehensive study of a range of options for the technical and economic viability of a mineral project that has advanced to a stage where a preferred method of mining or pit configuration, an effective method of mineral processing and an effective plan to sell the product has been determined.
Preparation plant. A preparation plant is a facility for crushing, sizing and washing coal to remove impurities and prepare it for use by a particular customer. The washing process has the added benefit of removing some of the coal’s sulfur content. A preparation plant is usually located on a mine site, although one plant may serve several mines.
Probable mineral reserve. The economically mineable part of an indicated and, in some cases, a measured coal resource.
Production stage property. A property with material extraction of coal reserves.
Productivity. As used in this report, refers to clean metric tons of coal produced per underground man hour worked, as published by the MSHA.
Proven mineral reserve. The economically mineable part of a measured coal resource.
Qualified person. A mineral industry professional as defined in subpart 1300 of Regulation S-K.
Reclamation. The process of restoring land and the environment to their original state following mining activities. The process commonly includes “recontouring” or reshaping the land to its approximate original appearance, restoring topsoil and planting native grass and ground covers. Reclamation operations are usually under way before the mining of a particular site is completed. Reclamation is closely regulated by both state and federal law.
Roof. The stratum of rock or other mineral above a coal seam; the overhead surface of a coal working place.
Surface mine. A mine in which the coal lies near the surface and can be extracted by removing the covering layer of soil.
Thermal coal. Coal used by power plants and industrial steam boilers to produce electricity, steam or both. It generally is lower in BTU heat content and higher in volatile matter than metallurgical coal.
Tons. A “short” or net ton is equal to 2,000 pounds. A “long” or British ton is equal to 2,240 pounds; a “metric” ton (or “tonne”) is approximately 2,205 pounds. Tonnage amounts are stated in short tons, unless otherwise indicated.
UMWA. United Mine Workers of America.
Underground mine. Also known as a “deep” mine. Usually located several hundred feet below the earth’s surface, an underground mine’s coal is removed mechanically and transferred by shuttle car and conveyor to the surface.
Item 1A. Risk Factors
Summary
Investment in our common stock is subject to various risks, including risks and uncertainties inherent in our business. As detailed in the following pages, these risks include, but are not limited to, the following:
•Risks relating to our industry and the global economy, such as those associated with declines in coal prices, loss of customers, our ability to obtain financing and other services, competition, decreased demand for coal, customer creditworthiness and global economic disruptions.
•Risks relating to regulatory and legal developments, such as those associated with regulatory requirements and costs, healthcare regulations and costs, permit approvals, climate change regulations, social and governance initiatives and regulations, environmental laws and treaties, unfavorable tax actions, decreased demand for energy, environmental cleanup costs and maintenance of internal controls.
•Risks relating to our operations, such as those associated with mining and other conditions, many of which are beyond our control, decreased demand for coal, disruptions in transportation services, the availability of skilled workers, higher than estimated employee benefit costs, the availability of coal reserves, equipment availability, equipment breakdown, higher than anticipated property reclamation or mine closure costs, unionization, cybersecurity, artificial intelligence, the complexity of mining in Central Appalachia, our dependence upon third parties and our ability to make capital investments.
•Risks relating to our liquidity, such as our ability to obtain or renew surety bonds, our need to maintain capacity for required letters of credit (“LCs”), limitations imposed on us by our revolving credit facility or any future debt instruments and access to funds when needed.
•Risks relating to the ownership of our common stock, such as those associated with compliance with securities laws, the availability of an orderly trading market for our common stock, our ability to continue to repurchase common shares, as the Board may determine from time to time, dilution or other effects resulting from the issuance of additional securities, impediments to our acquisition by a third party and limited fora for stockholder litigation matters.
These risks, and others, are reviewed in greater detail below. The realization of any of these risks could cause an investment in our securities to decline and result in a loss. Additional risks and uncertainties not currently known to us or that we currently deem to be immaterial also may materially adversely affect our business, financial condition and/or operating results.
Risks Relating to Our Industry and the Global Economy
Declines in coal prices would adversely affect our revenues, operating results, cash flows, financial condition, stock price and the value of our coal reserves.
Our results of operations are substantially dependent upon the prices we receive for our coal. Those prices depend upon factors beyond our control (some of which are described in more detail in other risk factors below), including but not limited to:
•the demand for domestic and foreign coal and coke, which depends significantly on the demand for steel;
•the price and availability of natural gas, other alternative fuels and alternative steel production technologies;
•domestic and foreign economic conditions, including economic downturns and the strength of the global and U.S. economies;
•the consumption pattern of industrial customers;
•factors affecting the timely delivery of our products to customers;
•the proximity to and availability, reliability and cost of transportation and port facilities;
•the legal, regulatory and tax environment for our industry and those of our customers;
•the quantity, quality and pricing of coal available in the resale market;
•the effects of emissions control measures;
•adverse weather, climactic or other natural conditions, natural disasters, epidemics, pandemics (such as the COVID-19 virus) and other public health challenges; and
•competition from other suppliers of coal and other energy sources.
A period of sustained low coal prices in the U.S. and other countries would materially adversely affect our operating results and cash flows, as well as the value of our coal reserves, and would cause a number of other risks that we face to increase in likelihood, magnitude and duration.
A period of sustained low demand for coal, particularly for metallurgical coal (or “met coal”), by U.S. and foreign customers and the potential for negative trade impacts resulting from changing tariff policies could reduce the price of our coal, which would reduce our revenues.
Alpha produces coal that is sold directly to both U.S. and foreign customers and indirectly to foreign customers through U.S.-based companies. Coal export revenues accounted for approximately 74% of our coal revenues for the year ended December 31, 2023.
Met coal accounted for approximately 95% of our coal revenues for the year ended December 31, 2023. Any deterioration in conditions in the U.S. or foreign steel industries, including the demand for steel and the continued financial viability of the industry, could reduce the demand for our met coal and could impact the collectability of our accounts receivable from U.S. or foreign steel industry customers.
The demand for foreign-produced steel both in foreign markets and in the U.S. market also depends on factors such as tariff rates on steel. For example, in 2018, the U.S. imposed tariffs on imports of steel mill products and a tariff on imports of wrought and unwrought aluminum. These tariffs led to generally higher rates of steel production in the U.S. and therefore greater domestic demand for met coal. However, Alpha’s export customers include foreign steel producers who may be affected by these and similar tariffs to the extent their imports into the U.S. are curtailed as a result of tariffs. Retaliatory tariffs by foreign nations have already limited international trade and may adversely impact global economic conditions. Additional or augmented tariffs could be imposed following the 2024 U.S. presidential election, which could in turn provoke additional retaliatory tariffs.
In addition, the steel industry’s demand for met coal is affected by a number of factors, including the variable nature of that industry’s business, technological developments in the steel-making process and the availability of substitutes for steel, such as aluminum, composites and plastics. The U.S. steel industry increasingly relies on processes to make steel that do not use coke, such as electric arc furnaces or pulverized coal processes. As this trend continues, the amount of met coal that we sell and the prices that we receive for it could decrease, thereby reducing our revenues and adversely impacting our earnings and the value of our coal reserves. Lower demand for met coal in international markets would reduce the amount of met coal that we sell and the prices that we receive for it, thereby reducing our revenues and adversely impacting our earnings and the value of our coal reserves. Foreign government policies related to coal production and consumption could also negatively impact pricing and demand for our products.
Our ability to obtain financing and other services, and the form and degree of these services available to us, may be significantly limited by the lending, investment and similar policies of financial institutions and insurance companies regarding carbon energy producers and the environmental impacts of coal combustion.
Certain financial institutions, including banks and insurance companies, have adopted policies that prevent or limit those institutions from providing financing, insurance, bonding, and other services to entities that produce, generate power from or use fossil fuels. These policies, and others that may be adopted in the future, may limit our ability to obtain financing, insurance, surety bonds, and other services and may have similar effects upon our customers, which may in turn reduce future global demand for coal. Further, some investors and investment advisors support divestiture of securities issued by companies, such as us, involved in the fossil fuel extraction market. These developments may negatively affect the market for our securities, our access to capital and financial markets and our ability to obtain insurance in the future, which may in turn have significant negative effects on our business, financial condition and results of operations.
The concurrent loss of, or significant reduction in, purchases by several of our largest customers could materially and adversely affect our revenues and profitability.
Coal sales to our largest customer during the year ended December 31, 2023 accounted for approximately 13% of our total revenues, and coal sales to our 10 largest customers accounted for approximately 74% of our total revenues. These customers could decide to discontinue purchasing coal from us in the volumes that they have previously purchased or decide not to purchase coal from us at all. If several of these customers were concurrently and significantly to reduce their purchases of coal, or if we were unable to sell coal to them on terms as favorable to us as previous sales, we could face a significant reduction in sales while we attempt to sell the coal to other customers in the global marketplace. If such concurrent loss of large customers or a significant reduction in our sales volume to such customers were to happen, our revenues and profitability could be materially and adversely affected.
Competition within the coal industry may adversely affect our ability to sell coal, and excess production capacity in the industry could put downward pressure on coal prices.
We compete with numerous other coal producers in various regions of the U.S. for domestic and international sales. We also compete in international markets against coal producers in other countries. International demand for U.S. coal exports also affects coal demand in the U.S. This competition affects domestic and international coal prices and our ability to retain or attract coal customers. The threat of increased production from competing mines and natural gas price declines with large basis differentials have all historically contributed, and may in the future contribute, to lower coal prices.
In the past, high demand for coal and attractive pricing brought new investors to the coal industry, leading to the development of new mines and added production capacity. Subsequent overcapacity in the industry contributed, and may in the future contribute, to lower coal prices.
Potential changes to international trade agreements, trade concessions, foreign currency fluctuations or other political and economic arrangements may benefit coal producers operating in countries other than the United States. Additionally, North American steel producers face competition from foreign steel producers, which could adversely impact the financial condition and business of our customers. We cannot provide assurance that we will be able to compete on the basis of price or other factors with companies that in the future may benefit from favorable foreign trade policies or other arrangements.
Coal is priced internationally in U.S. dollars, and, as a result, general economic conditions in foreign markets and changes in foreign currency exchange rates may provide our foreign competitors with a competitive advantage. If our competitors’ currencies decline against the U.S. dollar or against our foreign customers’ local currencies, those competitors may be able to offer lower prices for coal to customers. Furthermore, if the currencies of our overseas customers were to significantly decline in value in comparison to the U.S. dollar, those customers may seek decreased prices for the coal we sell to them. Consequently, currency fluctuations could adversely affect the competitiveness of our coal in international markets, which could have a material adverse effect on our business, financial condition, results of operations and cash flows. See “Item 1. Business—Competition.” Similarly, currency fluctuations could adversely affect demand for U.S. steel.
Downturns and disruptions in the global economy and financial markets have had, and could in the future have, a material adverse effect on the demand for and price of coal, which could have a material negative effect on our sales, costs, margins and profitability and ability to obtain financing.
Downturns and disruptions in the global economy and financial markets have from time to time resulted in, among other things, extreme volatility in securities prices, severely diminished liquidity and credit availability, rating downgrades of certain investments and declining valuations of others, including real estate. Significant economic disruptions can result from numerous unpredictable factors, including but not limited to market forces, natural disasters, pandemics, trade disputes and armed conflicts. For example:
•During the COVID-19 pandemic, global supply chain disruptions, including COVID-19-related factory closures and port congestion reduced our ability to obtain some materials used in our operations, reduced the demand for steel, and therefore for met coal, and affected railroad and other transportation systems.
•The Chinese government has from time to time implemented regulations and promulgated new laws or restrictions on its domestic coal industry, sometimes with little advance notice, which may affect worldwide coal demand, supply and prices.
•Although we do not have assets in the Middle East, we do have customers in the region, and if the scope of the ongoing conflicts in that region were to expand materially, the international transport of some goods could become more difficult, even to certain areas outside the Middle East, and shipping costs could increase substantially.
Future disruptions of this sort, and in particular the tightening of credit in financial markets or any other disruption that negatively affects global economic growth, could adversely affect our customers’ ability to obtain financing for operations and result in a decrease in demand, lower coal prices, the cancellation of some orders for our coal and the restructuring of agreements with some of our customers. Changes in the value of the U.S. dollar relative to other currencies, particularly where imported products are required for the mining process, could result in materially increased operating expenses. Any prolonged global, national or regional economic recession or other similar events could have a material adverse effect on the demand for and price of coal, on our sales, margins and profitability, and on our own ability to obtain financing.
We are unable to predict the timing, duration and severity of any potential future disruptions in financial markets and potential future adverse economic conditions in the U.S. and other countries and the impact these events may have on our operations and the industry in general.
The Russia-Ukraine war, and sanctions brought by the United States and other countries against Russia, have caused significant market disruptions that may lead to increased volatility in the price of certain commodities, including oil, natural gas, coal and other sources of energy.
The ongoing military conflict between Russia and Ukraine has resulted in substantial sanctions upon Russia and certain supply and market disruptions, particularly in energy markets. Many governments have banned imports from Russia, including commodities such as oil, natural gas and coal. These events have caused volatility in the aforementioned commodity markets. Although we have not experienced any material adverse effect on its results of operations, financial condition or cash flows as a result of the war or the resulting volatility as of the date of this report, such volatility, including market expectations of potential changes in coal prices and inflationary pressures on steel products, may significantly affect prices for our coal or the cost of supplies and equipment, as well as the prices of competing sources of energy for our customers, like natural gas.
This conflict may cause additional, severe adverse effects in the region and for international markets. Resulting disruptions could reduce demand for steel made through the use of metallurgical coal and coal-fired electricity, causing a reduction in our revenues or an increase in our costs and thereby materially and adversely affecting our results of operations, financial condition and cash flows.
Our ability to collect payments from our customers could be impaired if their creditworthiness and financial health deteriorate.
Our ability to receive payment for coal sold and delivered depends on the continued creditworthiness and financial health of our customers. Competition with other coal suppliers could force us to extend credit to customers and on terms that could increase the risk we bear on payment default. In recent years, downturns in the economy and disruptions in the global financial markets have, from time to time, affected the creditworthiness of our customers and limited their liquidity and credit availability. In addition, purchasers of our met coal may increasingly be required to implement costly new emissions and other technologies, thereby increasing the risk we bear for customer payment default.
For the year ended December 31, 2023 we derived 74% of our coal revenues from coal sales made to customers outside the U.S. Our customers in other countries may be subject to other pressures and uncertainties that may also affect their ability to pay, including trade barriers, exchange controls and local economic conditions, threat of military action, and political conditions.
Continuing low demand for thermal coal, or further declines in demand, by North American electric power generators could reduce the price of our thermal coal, which would reduce our revenues.
Thermal coal accounted for approximately 5% of our coal revenues for the year ended December 31, 2023. The majority of our sales of thermal coal were to U.S. electric power generators. The North American demand for thermal coal is affected primarily by the overall demand for electricity, the availability, quality and price of competing fuels, such as natural gas, nuclear fuel, oil and alternative energy sources such as wind, solar, and hydroelectric power, increasingly stringent environmental and other governmental regulations and the coal inventories of utilities.
A reduction in the amount of coal consumed by North American electric power generators would reduce the amount of thermal coal that we sell and the price that we receive for it, thereby reducing our revenues and adversely impacting our earnings and the value of our coal reserves. In addition, uncertainty caused by federal and state regulations could cause thermal coal customers to be uncertain of their coal requirements in future years, which could adversely affect our ability to sell coal to such customers under multi-year sales contracts.
Risks Relating to Regulatory and Legal Developments
The increasingly stringent regulation of the mining industry imposes significant costs on us, and future regulations or violations could increase those costs or limit our ability to produce coal.
Our operations are subject to a wide variety of federal, state and local environmental, health and safety, transportation, labor and other laws and regulations relating to matters such as:
•blasting;
•controls on emissions and discharges;
•the effects of operations on surface water and groundwater quality and availability;
•the storage, treatment and disposal of wastes and the authorizations necessary to create new waste management facilities;
•the remediation of contaminated soil, surface water and groundwater;
•surface subsidence from underground mining;
•the classification of plant and animal species near our mines as endangered or threatened species;
•the reclamation of mined sites; and
•employee health and safety, and benefits for current and former employees (described in more detail below).
These laws and regulations are becoming increasingly stringent. For example:
•federal and state agencies and citizen groups have increasingly focused on the amount of selenium and other constituents in mine-related water discharges;
•The U.S. Mine Safety and Health Administration (“MSHA”) and the states of Virginia and West Virginia have implemented and proposed changes to mine safety and health requirements to impose more stringent health and safety controls, enhance mine inspection and enforcement practices, increase sanctions, and expand monitoring and reporting; and
•Greenhouse gas (“GHG”) emissions reductions are being considered that could increase our costs, require additional controls, or compel us to limit our current operations.
In addition, these laws and regulations require us to obtain numerous governmental permits and comply with the requirements of those permits, which are described in more detail below.
We incur substantial costs to comply with the laws, regulations and permits that apply to our mining and other operations and to address the outcome of inspections. The required compliance and actions to address inspection outcomes are often time consuming and costly and may delay commencement or continuation of exploration or production. In addition, due in part to the extensive and comprehensive regulatory requirements, violations of laws, regulations and permits occur at our operations from time to time and may result in significant costs to us to correct the violations, as well as substantial civil or criminal penalties and limitations or shutdowns of our operations. In particular, President Biden’s administration has expressed support for policies that may result in stricter environmental, health and safety standards applicable to our operations and those of our customers. See “Item 1. Business—Environmental and Other Regulatory Matters—Clean Water Act—Wastewater Discharge.”
MSHA and state regulators may also order the temporary or permanent closing of a mine in the event of certain violations of safety rules, accidents or imminent dangers. In addition, regulators may order changes to mine plans or operations due to their interpretation or application of existing or new laws or regulations. Any required changes to mine plans or operations may result in temporary idling of production or addition of costs.
These factors have had and will continue to have a significant effect on our costs of production and competitive position and, as a result, on our results of operations, cash flows and financial condition. New laws and regulations, as well as future interpretations or different enforcement of existing laws and regulations, may have a similar or more significant impact on us, including delays, interruptions or a termination of operations.
Increasing attention to environmental, social and governance (ESG) matters may negatively affect our business and financial results.
Increasing attention has been given to corporate activities related to ESG matters in public discourse and the investment community. A number of advocacy groups, both domestically and internationally, have campaigned for governmental and private action to promote ESG-related change at public companies, including, but not limited to, through the investment and voting practices of investment advisers, pension funds, universities and other members of the investing community. These activities have also aimed to increase the attention on and demand for action related to various ESG matters, which has contributed to increasing societal, investor, and legislative focus and pressure on ESG practices and disclosures, including those related to climate change, GHG emissions targets, business resilience under the assumptions of demand-constrained scenarios, net-zero ambitions, transition plans, actions related to diversity and inclusion, political activities, racial equity audits, and governance standards. As a result, we may face increasing pressure regarding our ESG practices and disclosures, which could in turn result in the cancellation or delay of projects, the revocation or delay of permits, termination of contracts, lawsuits, regulatory action, and policy change that may adversely affect our business strategy, increase our costs, and adversely affect our reputation and financial performance.
These developments could result in the implementation of certain ESG practices and/or disclosure requirements that present heightened legal, regulatory and reputational risks for us, and complying with these requirements may be costly and time-consuming.
Climate change or carbon dioxide emissions reduction initiatives could significantly reduce the demand for coal and reduce the value of our coal assets.
Global climate issues continue to attract considerable public and scientific attention. Numerous reports have expressed concern about the impacts of human activity, and in particular the emissions of GHG, such as carbon dioxide and methane, on global climate issues. Combustion of fossil fuels like coal results in the creation of carbon dioxide, which is emitted into the atmosphere by coal end users such as coal-fired electric power generators, coke plants and steelmaking plants, and, to a lesser extent, by the combustion of fossil fuels by the mining equipment we use. In addition, coal mining can release methane from the mine, directly into the atmosphere. Concerns associated with global climate change, and GHG emissions reduction initiatives designed to address them, have resulted, and are expected to continue to result, in materially increased operating costs for steel producers who use met coal, particularly in Europe.
Emissions from coal consumption and production are subject to pending and proposed regulations as part of regulatory initiatives to address global climate change and global warming. Various international, federal, regional, foreign and state proposals are currently in place or being considered to limit emissions of GHGs, including possible future U.S. treaty commitments, new federal or state legislation, and regulation under existing environmental laws by the EPA and other regulatory agencies and litigation by private parties. These include:
•the 2015 Paris climate summit agreement, which resulted in voluntary commitments by 197 countries to reduce their GHG emissions and could result in additional firm commitments by various nations and states with respect to future GHG emissions. On June 1, 2017, the Trump administration announced that the U.S. would withdraw from the agreement, however, on February 19, 2021, the U.S. formally rejoined the Paris Agreement;
•the EPA’s regulations to reduce the transport of nitrogen oxide and ozone on prevailing winds from the Midwest and South U.S. to states in the Northeast;
•proposed EPA regulations to increase the stringency of the National Ambient Air Quality Standards for particulate matter emissions;
•the EPA's February 2024 regulations increasing the stringency of the National Ambient Air Quality Standards for the primary (health-based) annual standard for PM2.5;
•state and regional climate change initiatives implementing renewable portfolio standards or cap-and-trade schemes;
•challenges to or denials of permits for new coal-fired power plants or retrofits to existing plants by state regulators and environmental organizations due to concerns related to GHG emissions from the new or existing plants;
•private litigation against coal companies or power plant operators based on GHG-related concerns;
•the Glasgow Climate Pact resulting from the 2021 United Nations Climate Change Conference (COP26) held from October 31 to November 13, 2021, which, though not legally binding, contains a plan to reduce use of coal by 40%; and
•the agreement of the participating countries at the 2023 COP28 conference to call on governments worldwide to speed up the transition away from fossil fuels to renewables such as wind and solar power.
On August 3, 2015, the EPA released a final rule establishing the Power Plant NSPS. The final rule requires that newly constructed fossil fuel-fired steam generating units achieve an emission standard for carbon dioxide of 1,400 lb CO2/MWh-gross. The standard is based on the performance of a supercritical pulverized coal boiler implementing partial CCS. Modified and reconstructed fossil fuel fired steam generating units must implement the most efficient generation achievable through a combination of best operating practices and equipment upgrades, to meet an emission standard consistent with best historical performance.
In addition, on July 8, 2019, the EPA published the ACE Rule, a replacement of the CPP. In contrast to the CPP, which called for the shifting of electricity generation away from coal-fired sources towards natural gas and renewables, the ACE Rule focuses on reducing GHG emissions from existing coal-fired plants by requiring states to mandate the implementation of a range of technologies at power plants designed to improve their heat rate (i.e., decrease the amount of fuel necessary to generate the same amount of electricity). However, on January 19, 2021, the Court of Appeals of the District of Columbia struck down the ACE rule. The EPA has since announced an intent to consider new regulations governing carbon emissions from existing power plants. The EPA’s draft strategic plan issued in November 2021 emphasizes climate change and environmental justice as its top two priorities. More stringent standards for carbon dioxide pollution as a result of these rulemakings could further reduce demand for coal, and our business would be adversely impacted. In addition, certain banks and other financing sources have taken actions to limit available financing for the development of new coal-fueled power plants, which also may adversely impact the future global demand for coal.
Furthermore, several well-funded non-governmental organizations have explicitly undertaken campaigns to minimize or eliminate the use of coal as a source of electricity generation. These efforts, as well as concerted conservation and efficiency efforts that result in reduced electricity consumption and consumer and corporate preferences for non-coal fuel sources, could cause coal prices and sales of our coal to materially decline and could cause our costs to increase.
Any future laws, regulations or other policies or initiatives of the nature described above may adversely impact our business in material ways. The degree to which any particular law, regulation or policy impacts us will depend on several factors, including the substantive terms involved, the relevant time periods for enactment and any related transition periods. Considerable uncertainty is associated with these regulatory initiatives and legal developments, as the content of proposed legislation and regulation is not yet fully determined and many of the new regulatory initiatives remain subject to governmental and judicial review. In particular, President Biden’s administration has expressed support for the regulation of GHG emissions. In prior Congressional sessions, legislative proposals regulating GHG emissions (such as the Green New Deal) have been introduced, and Congressional leadership may introduce similar legislation this Congressional term. We routinely attempt to evaluate the potential impact on us of any proposed laws, regulations or policies, which requires that we make certain material assumptions. From time to time, we may determine that the impact of one or more such laws, regulations or policies, if adopted and ultimately implemented as proposed, may result in materially adverse impacts on our operations, financial condition or cash flow; however, we often are not able to reasonably quantify such impacts.
In general, any laws, regulations or other policies aimed at reducing GHG emissions have imposed, and are likely to continue to impose, significant costs on many coal-fired power plants, steel-making plants and industrial boilers, which may make them unprofitable. Accordingly, some existing power generators have switched to other fuels that generate fewer emissions and others are likely to switch, some power plants have closed and others are likely to close, and fewer new coal-fired plants are being constructed, all of which reduce demand for coal and the amount of coal that we sell and the prices that we receive for it, thereby reducing our revenues and adversely impacting our earnings and the value of our coal reserves.
Other extensive environmental laws, including existing and potential future legislation, treaties and regulatory requirements relating to air emissions, waste management and water discharges, affect our customers and could further reduce the demand for coal as a fuel source and cause prices and sales of our coal to materially decline.
Our customers’ operations are subject to extensive laws and regulations relating to environmental matters, including air emissions, wastewater discharges and the storage, treatment and disposal of wastes and operational permits. In particular, the Clean Air Act and similar state and local laws extensively regulate the amount of sulfur dioxide, particulate matter, nitrogen oxides, mercury and other compounds emitted into the air from fossil fuel fired power plants, which are the largest end-users of our thermal coal. A series of more stringent requirements will or may become effective in coming years, including:
•implementation of the current and more stringent proposed ambient air quality standards for sulfur dioxide, nitrogen oxides, particulate matter and ozone, including the EPA’s issuance of NAAQS in October 2015 of a more stringent ambient air quality standard for ozone and the EPA’s determinations of attainment designations with respect to these rules;
•implementation of the EPA's February 2024 revised primary (health-based) annual standard for PM2.5, from 12.0 µg/m3 to 9.0 µg/m3;
•implementation of the EPA’s Revised CSAPR to significantly reduce nitrogen oxide and sulfur dioxide emissions from power plants in 12 states in the eastern United States;
•continued implementation of the EPA’s MATS, which impose stringent limits on emissions of mercury and other toxic air pollutants from electric power generators, issued in December 2011 and in effect pending completion of judicial review proceedings;
•the EPA’s Good Neighbor Plan rules, which secured significant reductions in ozone-forming emissions of nitrogen oxides (NOx) from power plants and industrial facilities in 23 states;
•multiple and inconsistent future GHG emission reporting obligations imposed in federal and state laws;
•the exposure of workers to silica dust;
•implementation of the EPA’s August 2014 final rule on cooling water intake structures for power plants;
•more stringent EPA requirements governing management and disposal of coal ash pursuant to a rule finalized in December 2014 and new amendments effective as of August 2018;
•implementation of the COE/EPA final rule revising and reissuing Nationwide Permits under Section 404 of the Clean Water Act and applying the conforming rule Revised Definition of Waters of the United States; and
•implementation of the EPA’s November 2015 final rule setting effluent discharge limits on the levels of metals that can be discharged from power plants.
These environmental laws and regulations impose significant costs on our customers, which are increasing as these requirements become more stringent. These costs make coal more expensive to use and make it a less attractive fuel source of energy for our customers. Accordingly, some existing power generators have switched to other fuels that generate fewer emissions and others are likely to switch, some power plants have closed and others are likely to close, and no coal-fired plants are currently being constructed in the U.S., all of which reduce demand for coal, the amount of coal that we sell and the prices that we receive for it, thereby reducing our revenues and adversely impacting our earnings and the value of our coal reserves.
In addition, regulations regarding sulfur dioxide emissions under the Clean Air Act, including caps on emissions and the price of emissions allowances, have a potentially significant impact on the demand for our coal based on its sulfur content. We sell both higher sulfur and low sulfur coal. More widespread installation by power generators of technology that reduces sulfur emissions may make high sulfur coal more competitive with our low sulfur coal. Decreases in the price of emissions allowances could have a similar effect. Significant increases in the price of emissions allowances could reduce the competitiveness of higher sulfur coal compared to low sulfur coal and possibly natural gas at power plants not equipped to reduce sulfur dioxide emissions. Any of these consequences could result in a decrease in revenues from some of our operations, which could adversely affect our business and results of operations.
We may be unable to obtain and renew permits, mine plan modifications and approvals, leases or other rights necessary for our operations, which would reduce our production, cash flows and profitability.
Mining companies must obtain numerous regulatory permits that impose strict conditions on various environmental and safety matters in connection with coal mining. The permitting rules are complex and change over time, potentially in ways that may make our ability to comply with the applicable requirements more difficult or impractical or even preclude the continuation of ongoing operations or the development of future mining operations. Further, regulatory agencies responsible for the review and approval of these permits may not do so in a timely fashion due to lack of resources or other factors. The public, including special interest groups and individuals, have certain rights under various statutes to comment upon, submit objections to and otherwise engage in the permitting process, including bringing citizens’ lawsuits or administrative actions to challenge permits or mining activities. In the states where we operate, applicable laws and regulations also provide that a mining permit or modification can, under certain circumstances, be delayed, refused or revoked if we or any entity that owns or controls or is under common ownership or control with us or is determined to be linked to us under OSM’s AVS, have unabated permit violations or have been the subject of permit or reclamation bond revocation or suspension. These regulations define certain relationships, such as owning over 50% of stock in an entity or having the authority to determine the manner in which the entity conducts mining operations, as constituting ownership and control. Certain other relationships are presumed to constitute ownership or control, including being an officer or director of an entity or owning between 10% and 50% of the mining operator. This presumption, in some cases, can be rebutted where the person or entity can demonstrate that it in fact does not or did not have authority directly or indirectly to determine the manner in which the relevant coal mining operation is conducted. Thus, past or ongoing violations of federal and state mining laws by us or by coal mining operations owned or controlled by our significant stockholders, directors or officers or by entities linked to us through OSM’s AVS could provide a basis to revoke existing permits and to deny the issuance of additional permits or modification or amendment of existing permits. This is known as being “permit-blocked.” In recent years, the permitting required for coal mining has been the subject of increasingly stringent regulatory and administrative requirements and extensive litigation by environmental groups.
As a result, the permitting process is costly and time-consuming, required permits may not be issued or renewed in a timely fashion (or at all), and permits that are issued may be conditioned in a manner that may restrict our ability to conduct our mining activities efficiently. In some circumstances, regulators could seek to revoke permits previously issued. We are required under certain permits to provide data on the impact on the environment of proposed exploration for or production of coal to governmental authorities.
In particular, certain of our activities require a dredge and fill permit from the COE under Section 404 of the CWA. In recent years, the Section 404 permitting process has been subject to increasingly stringent regulatory and administrative requirements and a series of court challenges, which have resulted in increased costs and delays in the permitting process.
Additionally, we may rely on nationwide permits under the CWA Section 404 program for some of our operations. These nationwide permits are issued every five years, and the 2021 nationwide permit program was reissued in 2021. If we are unable to use the nationwide permits and require an individual permit for certain work, that could delay operations.
Many of our permits are subject to renewal from time to time, and renewed permits may contain more restrictive conditions than our existing permits. For example, many of our permits governing surface stream and groundwater discharges and impacts will be subject to new and more stringent conditions to address various new water quality requirements upon renewal over the next several years. Although we have no estimates at this time, our costs to satisfy these conditions could be substantial.
Future changes or challenges to the permitting and mine plan modification and approval process could cause additional increases in the costs, time, and difficulty associated with obtaining and complying with the permits and could delay or prevent commencing or continuing exploration or production operations and, as a result, adversely affect our coal production, cash flows and profitability.
Recent actions by the EPA, including the Good Neighbor Plan, the EPA’s February 2024 revision of the primary (health-based) annual standard for PM2.5, from 12.0 µg/m3 to 9.0 µg/m3, the proposed rule for more stringent emission standards for particulate matter emissions, and the proposed MATS rule to regulate emissions of mercury and other metals, fine particulates, and acid gases such as hydrogen chloride from coal- and oil-fired power plants, referred to as “MATS,” may make it more difficult for our customers to continue to use our coal in their operations.
Proposed SEC GHG reporting rules, if finalized and upheld by the courts, could potentially act as a deterrent to the use of our coal due to pressure from customers, shareholders and/or the media. California’s enactment of its own GHG reporting laws in October 2023 also suggests the possibility of inconsistent and/or duplicative future GHG reporting requirements, which would likely add to our operating costs.
Our operations may impact the environment or cause exposure to hazardous substances, and our properties may have environmental contamination, which could result in material liabilities to us.
Our operations use certain hazardous materials, and, from time to time, we generate limited quantities of hazardous wastes. We may be subject to claims under federal or state law for toxic torts, natural resource damages and other damages as well as for the investigation and clean-up of soil, surface water, sediments, groundwater and other natural resources. Such claims may arise out of current or former conditions at sites that we own or operate, or formerly owned or operated, and at contaminated sites owned or operated by third parties to which we sent wastes for treatment, storage or disposal. Our liability for such claims may be joint and several, so that we may be held responsible for more than our share of the contamination or other damages, or even for the entire share.
We operate and maintain a number of coal slurry impoundments. These impoundments are subject to extensive regulation. Some slurry impoundments maintained by other coal mining operations have failed, causing extensive damage to the environment and natural resources, as well as liability for related personal injuries and property damages. Some of our impoundments overlie mined out areas, which can pose a heightened risk of failure and of resulting damages. If one of our impoundments were to fail, we could be subject to substantial claims for the resulting environmental contamination and associated liability, as well as for fines and penalties, and potential third-party claims for personal injury, property damage or other losses. In addition, we may become subject to such claims related to surface expressions of methane gas, which can result from underground coal mining activities.
These and other environmental impacts that our operations may have, as well as exposures to hazardous substances or wastes associated with our operations, could result in costs and liabilities that could render continued operations at certain mines economically unfeasible or impractical or otherwise materially and adversely affect our financial condition and results of operations.
Decreases in consumer demand for electricity and changes in general energy consumption patterns attributable to energy conservation trends could adversely affect our business, financial condition and results of operations.
Due to efforts to promote energy conservation in recent years, there is a risk that both the demand for electricity and the general energy consumption patterns of consumers worldwide will decrease. The ability of energy conservation technologies, public initiatives and government incentives to reduce electricity consumption or to support other forms of renewable energy could also lead to a reduction in the demand for and the price of coal. If prices for coal are not competitive, our business, financial condition and results of operations may be materially harmed.
Our systems and procedures for internal control over financial reporting or the disclosure controls related to them may in the future have material weaknesses, which may adversely affect the value of our common stock.
We are responsible for maintaining systems and documentation necessary to evaluate the effectiveness of our internal control over financial reporting. These activities may divert management’s attention from other business concerns. To maintain and improve our controls and procedures, we must commit significant resources, may be required to hire additional staff and need to continue to provide effective management oversight, which could have a material adverse effect on our business, financial condition, results of operations and cash flows.
Federal and state regulatory agencies have the authority to order any of our facilities to be temporarily or permanently closed under certain circumstances, which could materially adversely affect our ability to meet our customers’ demands.
Federal and state regulatory agencies have the authority following significant health and safety incidents, such as fatalities, to order a facility to be temporarily or permanently closed. If this were to occur, we may be required to incur capital expenditures to re-open the facility. In the event that these agencies order the closing of our facilities, our coal sales agreements and our take-or-pay contracts related to our export terminals may permit us to issue force majeure notices, which suspend our obligations to deliver coal under these contracts. However, our customers may challenge our issuances of force majeure notices. If these challenges are successful, we may have to purchase coal from third-party sources, if it is available, to fulfill these obligations, incur capital expenditures to re-open the facilities and/or negotiate settlements with the customers, which may include price reductions, the reduction of commitments or the extension of time for delivery, or terminate customers’ contracts. Any of these actions could have a material adverse effect on our business and results of operations.
Certain U.S. federal income tax provisions currently available with respect to coal percentage depletion and exploration and development may be eliminated by future legislation.
From time to time, legislation is proposed that could result in the reduction or elimination of certain U.S. federal income tax provisions currently available to companies engaged in the exploration, development, and production of coal reserves. These proposals have included, but are not limited to: (1) the elimination of current deductions, the 60-month amortization period and the 10-year amortization period for exploration and development costs relating to coal and other hard mineral fossil fuels, (2) the repeal of the percentage depletion allowance with respect to coal properties and (3) the repeal of capital gains treatment of coal and lignite royalties. The passage of these or other similar proposals could increase our taxable income and negatively impact our cash flows and the value of an investment in our common stock.
Changes in tax laws, in the areas of both income taxes and non-income taxes, may materially affect our results of operations and could cause our financial position and profitability to deteriorate.
We pay non-income taxes on the coal we produce. A substantial portion of our non-income taxes are levied as a percentage of gross revenues, while others are levied on a per ton basis. If such liabilities were to arise, or if non-income tax rates were to increase significantly, our results of operations could be materially and adversely affected.
Further, changes in tax laws may materially affect our results of operations and could cause our financial position and profitability to deteriorate. On August 16, 2022, the Inflation Reduction Act of 2022 (“IRA”) was signed into law. Among other provisions, the IRA enacted a 15% corporate alternative minimum tax and a 1% excise tax on repurchases of corporate stock for tax years beginning after December 31, 2022. As of December 31, 2023, we have accrued a stock repurchase excise tax of $4.7 million related to our share repurchase program, which is recorded in treasury stock at cost. Our income is taxable in the U.S., with a significant portion qualifying for preferential treatment as foreign-derived intangible income (“FDII”). If U.S. tax rates increase or the FDII deduction is eliminated or reduced, both of which have been proposed by the current U.S. presidential administration, our provision for income taxes, results of operations, net income, and cash flows would be adversely affected. Also, if our customers move manufacturing operations to the U.S., our FDII deduction may be reduced. Beginning in 2026, the FDII deduction will be reduced from 37.5% to 21.875% of FDII.
Risks Relating to Our Operations
Our coal mining production and delivery is subject to conditions and events, many of which are beyond our control, that could result in higher operating expenses and decreased production and sales. The occurrence of a significant accident or other event that is not fully insured could adversely affect our business and operating results and could result in impairments to our assets.
Our coal production at our mines is subject to operating conditions and events, many of which are beyond our control, that could disrupt operations, affect production and the cost of mining for varying lengths of time and have a significant impact on our operating results. Adverse operating conditions and events that we have experienced in the past and/or may experience in the future include:
•changes or variations in geologic, hydrologic or other conditions, such as the thickness of the coal deposits and the amount of rock, clay or other non-coal material embedded in or overlying the coal deposit;
•mining, processing and loading equipment failures and unexpected maintenance problems;
•limited availability or increased costs of mining, processing and loading equipment and parts and other materials from suppliers;
•difficulties associated with mining under or around surface obstacles;
•unfavorable conditions with respect to proximity to and availability, reliability and cost of transportation facilities;
•adverse weather and natural disasters, such as heavy snows, heavy rains and flooding, lightning strikes, hurricanes or earthquakes;
•accidental mine water discharges, coal slurry releases and failures of an impoundment or refuse area, including inadvertent environmental impacts to the local community;
•mine safety accidents, including fires and explosions from methane and other sources;
•hazards or occurrences that could result in personal injury and loss of life;
•a shortage of skilled and unskilled labor;
•security breaches, cyber attacks or terroristic acts;
•strikes and other labor-related interruptions;
•delays or difficulties in, the unavailability of, or unexpected increases in the cost of acquiring, developing or permitting new acquisitions from the federal government and other new mining reserves and surface rights;
•competition and/or conflicts with other natural resource extraction activities and production within our operating areas;
•the termination of material contracts by state or other governmental authorities; and
•fatalities, personal injuries or property damage arising from train derailments, mined material or overburden leaving permit boundaries, underground mine blowouts, impoundment failures, subsidence or other unexpected incidents.
If any of these or other conditions or events occur in the future at any of our mines or affect deliveries of our coal to customers, they may increase our cost of mining, delay or halt production or sales to our customers, result in regulatory action or lead to customers initiating claims against us. Any of these consequences could adversely affect our operating results or result in impairments to our assets.
In addition, our mining operations are concentrated in a small number of material mines. As a result, the effects of any of these conditions or events may be exacerbated and may have a disproportionate impact on our results of operations and assets.
We maintain insurance policies that provide limited coverage for some, but not all, of these risks. Even where covered by insurance, these risks may not be fully covered, and insurers may contest their obligations to make payments. Failures by insurers to make payments could have a material adverse effect on our cash flows, results of operations or financial condition.
Disruptions in transportation services or port facilities, and increased transportation costs, could impair our ability to supply coal to our customers, reduce demand and adversely affect our business.
For the year ended December 31, 2023, 89% of our coal volume was transported from our shipping points to a vessel loading point or customer location by rail. Deterioration in the reliability of the service provided by rail carriers because of, for example, insufficient allocation of resources to us by rail companies or a strike by railroad workers, would result in increased internal coal handling costs and decreased shipping volumes. If we were unable to find alternatives, our business would be adversely affected, possibly materially. Most of our operations are serviced by a single rail carrier. Due to the difficulty in arranging alternative transportation, these operations are particularly at risk of disruptions, capacity issues or other difficulties with that carrier’s transportation services, which could adversely and materially affect our revenues and results of operations.
Further, we depend significantly upon the reliable operation of the DTA coal export terminal in Newport News, Virginia. DTA, in which we hold a 65.0% ownership interest, provides us with the ability to fulfill a broad range of customer coal quality requirements through coal blending, while also providing storage capacity and transportation flexibility. Any significant disruption in DTA’s functions and operations or other limitations upon the capacity of DTA or other transportation facilities could adversely and materially affect our revenues and results of operations.
We also depend upon trucks, barges and ocean vessels to deliver coal to our customers. In addition, much of our coal is transported from our mines to our loading facilities by trucks owned and operated by third parties. Disruption of any of these transportation services due to weather-related problems, mechanical difficulties, fuel and supply costs, strikes, lockouts, bottlenecks, accidents, terrorist attacks or other events could impair our ability to supply coal to our customers, resulting in decreased shipments and revenue. Disruption in shipment levels over long periods of time could cause our customers to look to other sources for their coal needs, negatively affecting our revenues and results of operations.
An increase in transportation costs could have an adverse effect on our ability to increase or to maintain production on a profit-making basis and could therefore adversely affect our revenues and earnings. Because transportation costs represent a significant portion of the total cost of coal for our customers, increases in transportation costs could also reduce overall demand for coal or make our coal production less competitive than coal produced from other sources or other regions.
Expenditures for certain employee benefits could be materially higher than we have anticipated, which could increase our costs and adversely affect our financial results. Litigation regarding employee compensation could have a material adverse effect upon our liquidity and results of operations.
We are responsible for certain liabilities under a variety of benefit plans and other arrangements with employees. The unfunded status of these obligations as of December 31, 2023 included $63.2 million of workers’ compensation obligations, net of expected insurance receivable amounts, $101.9 million of pension obligations and $107.3 million of black lung obligations. These obligations have been estimated based on assumptions including actuarial estimates, discount rates, and changes in health care costs. We could be required to expend greater amounts than anticipated. In addition, future regulatory and accounting changes relating to these benefits could result in increased obligations or additional costs, which could also have a material adverse effect on our financial results. Several states in which we operate consider changes in workers’ compensation laws from time to time, which, if enacted, could adversely affect us. In addition, the U.S. Department of Labor has a legislative directive to periodically review operators’ financial standing and federal black lung liabilities, which could result in a substantial increase in required security, negatively impacting liquidity. The Department of Labor has proposed for public comment new regulations which, if adopted, would substantially increase the collateral required to secure self-insured federal black lung obligations. Under the proposed 120% minimum collateral requirement, we estimate we could be required to provide approximately $80.0 million to $100.0 million of collateral to secure certain of our black lung obligations. A significant increase in these collateral obligations would have a materially adverse effect on our liquidity.
We are party to litigation that has been initiated against certain of our subsidiaries in which the plaintiffs allege violations of the Fair Labor Standards Act due to alleged failure to compensate for time “donning” and “doffing” equipment and to account for the effects in the calculation of overtime rates and pay. The plaintiffs seek collective action certification. We cannot reasonably estimate a range of potential exposure at this time. We believe the plaintiffs’ claims are without merit, but if we were ultimately unsuccessful in defending against this litigation, it could have a material, adverse effect upon our liquidity and results of operations.
We require a skilled workforce and a dedicated senior management team to run our business. If we cannot hire and retain qualified persons, including to meet replacement or expansion needs, we may not be able to achieve planned results.
Efficient coal mining using modern techniques and equipment requires skilled laborers with mining experience and proficiency as well as qualified managers, supervisors and other staff. We, along with the mining industry generally, are currently facing a significant shortage of operating staff. Moreover, we are seeing an increasing number of those who leave our employment accept new positions outside the coal industry, further reducing the number of skilled employees available to us and leading to increased labor costs. When coal producers compete for skilled miners, recruiting becomes more difficult, and employee turnover rates typically increase, each of which negatively affect operating efficiency and costs. If we are unable to train or retain the necessary number of staff, it could adversely affect our productivity, costs and ability to maintain or expand production.
In addition, we depend on the experience and industry knowledge of our officers and other key employees to design and execute our business plans. If we experience a substantial turnover in our leadership and other key employees, and those persons are not replaced by individuals with comparable skills, our performance could be materially adversely impacted. Furthermore, we may be unable to attract and retain additional qualified executives as needed in the future. We believe that our future success will depend on our continued ability to attract and retain highly skilled and qualified personnel. There is a high level of competition for experienced, successful personnel in our industry. Our inability to meet our executive staffing requirements in the future could impair our growth and harm our business.
Cybersecurity attacks, natural disasters, terrorist attacks and other similar crises or disruptions may negatively affect our business, financial condition and results of operations, or those of our customers and suppliers.
Our business, or the businesses of our customers and suppliers, may be impacted by disruptions such as terrorist or cybersecurity attacks or failures, threats to physical security, and extreme weather conditions or other natural disasters. These disruptions or any significant increases in energy prices that follow could result in government-imposed price controls. Our insurance, or the insurance of third-party service providers, may not protect us against such occurrences. It is possible that any of these occurrences, or a combination of them, could have a material adverse effect on our business, financial condition and results of operations.
We have become increasingly dependent upon digital technologies, including information systems, infrastructure and cloud applications and services, to operate our businesses, process and record financial and operating data, communicate with our employees and business partners, analyze seismic and drilling information, estimate quantities of met coal reserves, as well as other activities related to our businesses. We own and operate some of these systems and applications while others are owned and operated by our third-party service providers. In the ordinary course of business, we and our service providers collect, process, transmit and store data, such as proprietary business information and personally identifiable information.
Our IT systems and those of third parties, including third-party service providers, are vulnerable to malicious and intentional cyberattacks involving ransomware, malware and viruses, accidental or inadvertent incidents, the exploitation of security vulnerabilities or “bugs” in software or hardware, among other scenarios. Both the frequency and magnitude of cyberattacks are expected to increase, and attackers are becoming more sophisticated, particularly given the increasing availability and sophistication of “artificial intelligence” systems. Further, security vulnerabilities may be introduced from the use of artificial intelligence by us, our customers or third parties. The development of quantum computing technology, if successful, may also eventually pose very significant encryption and other data security risks. Geopolitical tensions or conflicts, such as Russia’s invasion of Ukraine, conflicts in the Middle East or increased tension with China, may also create a heightened risk of cybersecurity attacks.
A cyber-attack may involve persons gaining unauthorized access to our digital systems for purposes of gathering, monitoring, releasing, misappropriating or corrupting proprietary or confidential information, or causing operational disruption. Unauthorized physical access to one of our facilities or electronic access to our information systems could result in, among other things, unfavorable publicity and reputational harm, litigation by affected parties, damage to sources of competitive advantage, disruptions to our operations, loss of customers, financial obligations for damages related to the theft or misuse of such information and costs to remediate such security vulnerabilities, any of which could have a substantial impact on our results of operations, financial condition or cash flows. Additionally, we may be unable to anticipate, detect or prevent future attacks, particularly as the methodologies utilized by attackers change frequently or are not recognized until launched, and we may be unable to investigate or remediate incidents because attackers are increasingly using techniques and tools designed to circumvent controls, to avoid detection, and to remove or obfuscate forensic evidence.
Strategic targets, such as energy-related assets, may be at greater risk of future cybersecurity attacks than other targets in the U.S. Our defensive preparedness against cybersecurity attacks includes limited technological capabilities for prevention and detection of cybersecurity disruptions; internal governance processes that assist to identify, protect, and remediate security risks routinely; non-technological measures such as threat information sharing with industry groups; internal training and awareness campaigns including testing of employee awareness and an emphasis on resiliency. If the measures we and our cloud service providers are taking to protect against cybersecurity disruptions prove to be insufficient or if our proprietary data is otherwise not protected, we as well as our customers, employees, or third parties could be adversely affected. Cybersecurity disruptions could cause physical harm to people or the environment; damage or destroy assets; compromise business systems; result in proprietary information being altered, lost, or stolen; result in employee, customer, or third-party information being compromised; or otherwise disrupt our business operations. We could incur significant costs to remedy the effects of a major cybersecurity disruption in addition to costs in connection with resulting regulatory actions, litigation or reputational harm. Further, as cybersecurity attacks continue to evolve, we may be required to expend additional resources to continue to modify or enhance our protective measures or to investigate and remediate any vulnerability to cybersecurity attacks.
If the assumptions underlying our accruals for reclamation and mine closure obligations prove to be inaccurate, we could be required to expend greater amounts than anticipated.
SMCRA establishes operational, reclamation and closure standards for all aspects of surface mining as well as deep mining. We accrue for the costs of current mine disturbance and final mine closure, including the cost of treating mine water discharge where necessary. Our estimated total reclamation and mine-closing liabilities were $205.4 million as of December 31, 2023, based upon permit requirements, the historical experience at our operations and a number of variables involving assumptions and estimates. Total reclamation and mine-closing liabilities are, therefore, subject to change due to a variety of factors, including estimates of future asset retirement costs and the timing of these costs, estimates of proven reserves, assumptions involving profit margins of third-party contractors, inflation rates and discount rates. Our future operating results and financial position could be materially adversely affected by these factors. In addition, significant changes from period to period could result in significant variability in our operating results, which could reduce comparability between periods and impact our liquidity. See “Item 7. Management’s Discussion and Analysis of Financial Condition and Results of Operations—Critical Accounting Policies and Estimates” for a description of our estimated costs of these liabilities.
Decreased availability or increased costs of key equipment and materials, including certain items mandated by regulations, increased commodities costs, sustained inflation or increased costs of coal that we purchase from third parties, could increase our cost of production and decrease our profitability.
We depend on reliable supplies of mining equipment, replacement parts and materials such as explosives, diesel fuel, tires, steel, magnetite and other raw materials and consumables, which in some cases, do not have ready substitutes. Some equipment and materials are needed to comply with regulations, such as proximity detection devices on continuous mining machines. The supplier base providing mining materials and equipment has been relatively consistent in recent years, although there continues to be consolidation, which has resulted in a limited number of suppliers for certain types of equipment and supplies.
Any significant reduction in availability or increase in cost of any mining equipment or key supplies could adversely affect our operations and increase our costs, which could adversely affect our operating results and cash flows. Diesel fuel is one of our largest variable costs and a sustained shortage of diesel fuel could negatively and materially impact our results of operations.
In addition, the prices we pay for materials are strongly influenced by the global commodities markets. Coal mines consume large quantities of these commodities, such as steel, copper, rubber products, explosives and diesel and other liquid fuels. A rapid or significant increase in the cost of these commodities would increase our mining costs. Further, if the value of the U.S. dollar declines relative to foreign currencies with respect to certain imported supplies or other products, our operating expenses will increase, which could materially adversely impact our profitability.
The U.S. and global economies have recently experienced high levels of inflation. If inflation were to remain at high levels for an extended period, or increase further, a related increase in our input costs could materially adversely affect our profitability.
We purchase coal from third parties, for use in coal blending and for other purposes, for which ready substitutes may not be immediately available. The failure of these third parties to provide coal in a timely fashion or a significant reduction in availability or an increase in the cost of these supplies could adversely affect our operations and increase our costs, which could adversely affect our operating results and cash flows.
A decline in demand for met coal would limit our ability to sell our high quality thermal coal as higher-priced met coal, which would reduce our revenues and profitability, and could affect the economic viability of some of our mines with higher operating costs.
We are able to mine, process and market some of our coal reserves as either met coal or high-quality thermal coal. In deciding our approach to these reserves, we assess the conditions in the met and thermal coal markets, including factors such as the current and anticipated future market prices of met coal and thermal coal, the generally higher price of met coal as compared to thermal coal, the lower volume of saleable tons that results when producing coal for sale in the met market rather than the thermal market, the increased costs of producing met coal, the likelihood of being able to secure a longer term sales commitment for thermal coal and our contractual commitments to deliver different types of coal to our customers. A decline in demand for met coal relative to thermal coal could cause us to shift coal from the met market to the thermal market, thereby reducing our revenues and profitability.
Our business will be adversely affected if we are unable to timely develop or acquire additional coal reserves that are economically recoverable.
Our profitability depends substantially on our ability to mine in a cost-effective manner coal reserves of the quality our customers need. Although we have coal reserves that we believe could support current production levels for multiple decades, estimating the size and quality of reserves requires significant judgment and could prove to be inaccurate. We may not be able to mine all of our reserves as profitably as we do at our current operations. Under adverse market conditions, some reserves could not be mined profitably at all. In addition, in order to develop our reserves, we must receive various governmental permits. As discussed above, some of these permits are becoming increasingly more difficult and expensive to obtain, and the review process continues to lengthen. We may be unable to obtain the necessary permits on terms that would allow us to operate profitably or at all.
Because our reserves are depleted as we mine our coal, our future success and growth depend in part on our ability to timely acquire additional coal reserves that are economically recoverable. Our planned development projects and acquisition activities may not result in significant additional reserves, and we may not succeed in developing new mines or expanding existing mines beyond our existing reserves. Replacement reserves may not be available when required or, if available, may not be able to be mined at costs comparable to those of the depleting mines. We may not be able to accurately assess the geological characteristics of any reserves that we now own or subsequently acquire, which may adversely affect our profitability and financial condition.
Exhaustion of reserves at particular mines also may have an adverse effect on our operating results due to lost production capacity from diminished or discontinued operations at those mines, as well as lay-offs, write-off charges and other costs, potentially causing an adverse effect that is disproportionate to the percentage of overall production represented by those mines. Our ability to acquire other reserves in the future could be limited by restrictions under our existing or future debt agreements, competition from other coal companies for attractive properties or the lack of suitable acquisition candidates available on commercially reasonable terms, among other factors. If we are unable to replace or increase our coal reserves on acceptable terms, our production and revenues will decline as our reserves are depleted.
If we are unable to acquire surface rights to access our coal reserves, we may be unable to obtain a permit to mine coal we own and may be required to employ expensive techniques to mine around those sections of land we cannot access in order to access other sections of coal reserves, which could materially and adversely affect our business and our results of operations.
After we acquire coal reserves, we are required to obtain a permit to mine the reserves through the applicable state agencies prior to mining the acquired coal. In part, permitting requirements provide that, under certain circumstances, we must obtain surface owner consent if the surface estate has been severed from the mineral estate, which is commonly known as a “severed estate.” At certain of our mines where we have obtained the underlying coal and the surface is held by one or more third-party owners, we are engaged in negotiations for surface rights with multiple parties. If we are unable to successfully negotiate surface rights with any or all of these surface owners, or to do so on commercially reasonable terms, we may be denied a permit to mine some or all of our coal or may find that we cannot mine the coal at a profit. If we are denied a permit, that would create significant delays in our mining operations and materially and adversely impact our business and results of operations. Furthermore, if we decide to alter our plans to mine around the affected areas, we could incur significant additional costs to do so, which could increase our operating expenses considerably and could materially and adversely affect our results of operations.
Conflicts with competing holders of mineral rights and rights to use adjacent, overlying or underlying lands could materially and adversely affect our ability to mine coal or do so on a cost-effective basis.
Our operations at times face potential conflicts with holders of other mineral interests such as coalbed methane, natural gas and oil reserves. Some of these minerals are located on, or are adjacent to, some of our coal reserves and active operations, potentially creating conflicting interests between us and the holders of those interests. From time to time we acquire these minerals ourselves to prevent conflicting interests from arising. If, however, conflicting interests arise and we do not acquire the competing mineral rights, we may be required to negotiate our ability to mine with the holder of the competing mineral rights. Furthermore, the rights of third parties for competing uses of adjacent, overlying or underlying lands, such as oil and gas activity, coalbed methane, pipelines, roads, easements and public facilities, may affect our ability to operate as planned if our title is not superior or arrangements cannot be negotiated. If we are unable to reach an agreement with the holders of such rights, or to do so on a cost-effective basis, we may incur increased costs, and our ability to mine could be impaired, which could materially and adversely affect our business and results of operations.
Mining in Central Appalachia is more complex and involves more regulatory constraints than mining in other areas of the U.S., which could affect our mining operations and cost structures in these areas.
The geological characteristics of Central Appalachian coal reserves, such as depth of overburden and coal seam thickness, make them complex and costly to mine. As mines become depleted, replacement reserves may not be available or, if available, may not be able to be mined at costs comparable to those of the depleting or depleted mines. In addition, compared to mines in other areas of the country, permitting, licensing and other environmental and regulatory requirements in Central Appalachia are more costly and time consuming to satisfy. These factors could materially adversely affect the mining operations and cost structures of, and our customers’ ability to use coal produced by, our mines in Central Appalachia.
We contract with third parties to operate or reclaim certain of our mines, and our results of operations could be adversely affected if those third-party operators are ineffective.
We contract with third parties to operate certain of our mines. Under those arrangements, we retain certain contractual rights of oversight over these mines, which are operated under our permits or leases, but we do not control, and our employees do not participate in, the day-to-day operations of these mines. Operational difficulties at these mines, increased competition for contract miners from other coal producers and other factors beyond our control could affect the availability, cost and quality of coal produced for us by contractors. Disruption in our supply of contractor-produced coal could impair our ability to fill our customers’ orders or require us to pay higher prices to obtain the required coal from other sources. Any increase in the per-ton compensation for services we pay for the production of contractor-produced coal could increase our costs and, therefore, lower our earnings and adversely affect our results of operations.
We also contract with third parties to perform reclamation services for properties that are no longer in operation. If these third parties fail to meet their obligations under those contracts or are otherwise ineffective, it could increase our costs and, therefore, lower our earnings and adversely affect our results of operations.
Estimates of our economically recoverable coal reserves and coal resources involve uncertainties, and any inaccuracies in our estimates could result in lower than expected revenues, higher than expected costs, decreased profitability and asset impairments.
Our estimates of economically recoverable coal reserves and coal resources are based on engineering, economic and geological data and assumptions. Our estimates as to the quantity and quality of the coal in our reserves depend upon a variety of factors and estimates, many of which involve uncertainties and factors beyond our control and may vary considerably from actual results, such as:
•geological and mining conditions that may not be fully identified by available exploration data or that may differ from experience in current operations;
•historical production from the area compared with production from other similar producing areas;
•the assumed ability to obtain future permits and effects of regulation and taxes by governmental agencies; and
•assumptions about coal prices, operating costs, mining technology improvements, development costs and reclamation costs.
For these reasons, estimates of the economically recoverable quantities and qualities attributable to any particular property, classifications of reserves and coal resources based on risk of recovery and estimates of net cash flows expected from particular reserves prepared by different engineers or by the same engineers at different times may vary substantially. In addition, actual coal tonnage recovered from identified reserve areas or properties and revenues and expenditures with respect to our reserves and resources may vary materially from estimates. Accordingly, our estimates may not accurately reflect our actual reserves and resources. Any inaccuracy in our reserve estimates could result in lower than expected revenues, higher than expected costs, decreased profitability and asset impairments.
Provisions in our lease agreements, defects in title in our mine properties or loss of leasehold rights could limit our ability to recover coal from our properties or result in significant unanticipated costs.
We conduct a significant part of our mining operations on properties that we lease. Title to most of our leased properties and mineral rights is not thoroughly verified until a permit to mine the property is obtained, and, in some cases, title is not verified at all. Accordingly, actual or alleged defects in title or boundaries may exist, which may result in the loss of our right to mine on the property or in unanticipated costs to obtain leases or mining contracts to allow us to conduct our mining operations on the property, which could adversely affect our business and profitability. Furthermore, some leases require us to produce a minimum quantity of coal and/or pay minimum production royalties. If those requirements are not met, the leasehold interest may terminate.
Strategic transactions, including acquisitions, involve a number of risks, any of which could result in a material adverse effect on our business, financial condition or results of operations.
We have in the past, and may in the future, undertake strategic transactions such as the acquisition or disposition of coal mining and related infrastructure assets, interests in coal mining companies, joint ventures or other strategic transactions involving companies with coal mining or other energy assets. Our ability to complete these transactions is subject to the availability of attractive opportunities, including potential acquisition targets that can be successfully integrated into our existing business and provide us with complementary capabilities, products or services on terms acceptable to us, as well as general market conditions, among other things.
Risks inherent in these strategic transactions include, but are not limited to:
•accurately assessing the geological conditions of acquired properties;
•the ability to obtain and maintain surety bonds, at acceptable rates, related to acquired properties and other obligations;
•uncertainties in assessing the value, strengths, and potential profitability, and identifying the extent of all weaknesses, risks, contingent liabilities and other liabilities of acquisition candidates and strategic partners;
•the potential loss of key customers, management and employees of an acquired business;
•the ability to achieve identified operating and financial synergies from an acquisition or other strategic transactions in the amounts and on the time frame due to inaccurate assumptions underlying estimates of expected cost savings, the deterioration of general industry and business conditions, unanticipated legal, insurance and financial compliance costs, or other factors;
•the ability of management to manage successfully our exposure to pending and potential litigation and regulatory obligations;
•the ability of a purchaser to complete the transfer of operating permits related to our divested operations and to otherwise properly fulfill all assumed contractual, legal and regulatory obligations;
•unanticipated increases in competition that limit our ability to expand our business or capitalize on expected business opportunities, including retaining current customers; and
•unanticipated changes in business, industry, market, or general economic conditions that differ from the assumptions underlying our rationale for pursuing the acquisition or other strategic transactions.
The ultimate success of any strategic transaction we may undertake will depend in part on our ability to continue to realize the anticipated synergies, business opportunities and growth prospects from those transactions. We may not be able to successfully integrate the companies, businesses or properties that we acquire, invest in or partner with. Problems that could arise from the integration of an acquired business may involve:
•coordinating management and personnel and managing different corporate cultures;
•applying our safety and environmental programs at acquired mines and facilities;
•establishing, testing and maintaining effective internal control processes and systems of financial reporting for the acquired business;
•the diversion of our management’s and our finance and accounting staff’s resources and time commitments, and the disruption of either our or the acquired company’s ongoing businesses;
•tax costs or inefficiencies; and
•inconsistencies in standards, information technology systems, procedures or policies.
Any one or more of these factors could cause us not to realize the benefits anticipated from a strategic transaction, adversely affect our ability to maintain relationships with clients, employees or other third parties or reduce our earnings.
Moreover, any strategic transaction we pursue could materially affect our liquidity and capital resources and may require us to incur indebtedness, seek equity capital or both. Future transactions could also result in our assuming more long-term liabilities relative to the value of the acquired assets. Further, acquisition accounting rules require changes in certain assumptions made subsequent to the measurement period, as defined in current accounting standards, to be recorded in current period earnings, which could affect our results of operations.
Our business requires substantial capital investment and maintenance expenditures, which we may be unable to provide.
Our business plan and strategy require substantial capital expenditures. We require capital for, among other purposes, acquisition of surface rights, equipment and the development of our mining operations, capital renovations, maintenance and expansions of plants and equipment and compliance with safety, health and environmental laws and regulations. Future debt or equity financing may not be available on satisfactory terms or at all or, if available, may result in dilution. If we are unable to obtain additional capital, we may not be able to maintain or increase our existing production rates, and we could be forced to reduce or delay capital expenditures or change our business strategy, sell assets or restructure or refinance our indebtedness, all of which could have a material adverse effect on our business or financial condition.
Our workforce could become increasingly unionized in the future and our unionized or union-free workforce could strike, which could adversely affect the stability of our production and reduce our profitability.
Approximately 97% of our total workforce and approximately 96% of our hourly workforce was union-free as of December 31, 2023. However, under the National Labor Relations Act, employees have the right at any time to form or affiliate with a union. Any further unionization of our employees or the employees of third-party contractors who mine coal for us could adversely affect the stability of our production and reduce our profitability.
Our union-represented employees could strike, which would disrupt our production, increase our costs and disrupt shipments of coal to our customers, and could result in the closure of affected mines, all of which could reduce our profitability.
Certain provisions in our coal supply agreements may result in economic penalties upon our failure to meet specifications.
Most of our coal supply agreements contain provisions requiring us to deliver coal meeting quality thresholds for certain characteristics such as BTUs, sulfur content, ash content, grindability, moisture and ash fusion temperature. Failure to meet these specifications could result in economic penalties, including price adjustments, the rejection of deliveries or termination of the contracts. Further, some of our coal supply agreements allow our customers to terminate the contract in the event of regulatory changes that restrict the type of coal the customer may use at its facilities or the use of that coal or increase the price of coal or the cost of using coal beyond specified limits. In addition, our coal supply agreements typically contain force majeure provisions allowing temporary suspension of performance by us or the customer during specified events beyond the control of the affected party. As a result of these issues, we may not achieve the revenue or profit we expect to achieve from our coal supply agreements.
Risks Relating to Our Liquidity
The need to maintain capacity for required LCs could limit our ability to provide financial assurance for self-insured obligations and negatively impact our ability to fund future working capital, capital expenditure or other general corporate requirements.
On October 27, 2023, we terminated our existing Second Amended and Restated Asset-Based Revolving Credit Agreement dated December 6, 2021 (“ABL Agreement”) and along with certain of our directly and indirectly owned subsidiaries entered into a new Credit Agreement (the “New ABL Agreement”). The New ABL Agreement continues to include an asset-based revolving credit facility (the “New ABL Facility”), which among other things, provides for the issuance of LCs.
Obligations secured by LCs may increase in the future, for example due to increased collateral obligations associated with black lung obligations. If we do not maintain sufficient borrowing capacity under our letter of credit facilities, we may be unable to provide financial assurance for self-insured obligations which could negatively impact our ability to fund future working capital, capital expenditure or other general corporate requirements.
The terms of our New ABL Facility impose operating and financial restrictions on us, which may limit our ability to respond to changing business and economic conditions.
Under the New ABL Facility, we may borrow cash or obtain LCs, on a revolving basis, in an aggregate amount of up to $155.0 million. We may request an increase to the capacity of the facility of up to $75.0 million provided that $25.0 million may be solely for the purpose of providing additional availability to obtain cash collateralized LCs. Availability under the New ABL Facility is calculated monthly and fluctuates based on qualifying amounts of coal inventory, trade accounts receivable and in certain circumstances specified amounts of cash. We must maintain minimum Liquidity, as defined in the New ABL Agreement, of $75.0 million. The New ABL Facility matures on October 27, 2027. As part of the transition from the previous ABL Facility to the New ABL Facility, we temporarily cash collateralized outstanding LCs until replacement LCs could be issued under the New ABL Facility. As of December 31, 2023, we had $31 thousand of cash collateralized LCs remaining to be replaced. During the first quarter of 2024, the remaining cash collateralized LCs from the previous ABL Facility were cancelled with no replacement required and the cash collateral was returned.
The terms of the New ABL Facility impose operating and financial restrictions on us and our subsidiaries, which may limit our ability to respond to changing business and economic conditions. For example, we are limited in our ability to incur additional indebtedness, make particular types of investments, incur certain types of liens, engage in fundamental corporate changes, enter into transactions with affiliates, make substantial asset sales, make certain restricted payments, enter into amendments or waivers to certain agreements, conduct certain sale leasebacks or enter into certain burdensome agreements. These covenants could adversely affect our ability to finance our future operations or capital needs or to execute preferred business strategies. In addition, complying with these covenants may make it more difficult for us to successfully execute our business strategy and compete against companies who are not subject to such restrictions. We regularly evaluate opportunities to enhance our capital structure and financial flexibility through a variety of methods, including repayment or repurchase of outstanding debt, amendment of our credit facility and other facilities, and other methods. As a result of any of these actions, the restrictions and covenants that apply to us may become more restrictive or otherwise change.
Any failure to comply with those covenants may constitute a breach under the New ABL Facility that could result in the acceleration of all or a substantial portion of any outstanding indebtedness and termination of revolving credit commitments under the New ABL Facility. As of December 31, 2023, we are in compliance with the operating and financial covenants under the New ABL Facility. Our inability in the future to maintain our New ABL Facility could materially adversely affect our liquidity and our business.
Operating results below current levels, or other adverse factors, including a significant increase in interest rates, could result in our being unable to comply with our covenants and payment obligations contained in our borrowing arrangements. If we violate these covenants or obligations under any of these agreements and are unable to obtain waivers from our lenders, our debt under all of these agreements would be in default and could be accelerated by our lenders. If our indebtedness is accelerated, we may not be able to repay our debt or borrow sufficient funds to refinance it. Even if we were able to obtain new financing, it may not be on commercially reasonable terms or on terms that are acceptable to us. If our debt is in default for any reason, our business, financial condition, results of operations and cash flows could be materially and adversely affected.
Failure to obtain or renew surety bonds on acceptable terms could affect our ability to secure reclamation and coal lease obligations, which could adversely affect our ability to mine or lease coal.
Federal and state laws require us to obtain surety bonds to secure payment of certain long-term obligations such as mine closure or reclamation costs, federal and state workers’ compensation costs (including related to black lung), coal leases and other obligations. These bonds are typically renewable annually. Under applicable regulations, self-bonding may not be available to us as a means to comply with our reclamation bonding obligations for the foreseeable future. Surety bond issuers and holders may not continue to renew the bonds, may demand less favorable terms upon renewal or may impose new or increased collateral requirements. As of December 31, 2023, we had outstanding surety bonds with third parties of approximately $177.1 million. Surety bond issuers and holders may demand additional collateral, unfavorable terms or higher fees. Our failure to retain, or inability to acquire, surety bonds or to provide a suitable alternative could adversely affect our ability to mine or lease coal, which would materially adversely affect our business and results of operations. That failure could result from a variety of factors, including lack of availability, higher expense or unfavorable market terms, the exercise by third-party surety bond issuers of their right to refuse to renew the surety bonds, restrictions on availability of collateral for current and future third-party surety bond issuers under the terms of any credit arrangements then in place, or our inability to comply with our reclamation bonding obligations through self-bonding. In addition, as a result of increasing credit pressures on the coal industry, it is possible that surety bond providers could demand cash collateral as a condition to providing or maintaining surety bonds. Any such demands, depending on the amount of any cash collateral required, could have a material adverse impact on our liquidity and financial position. If we are unable to meet cash collateral requirements and cannot otherwise obtain or retain required surety bonds, we may be unable to satisfy legal requirements necessary to conduct our mining operations.
Difficulty in acquiring surety bonds, or additional collateral requirements, would increase our costs and likely require greater use of alternative sources of funding for this purpose, which would reduce our liquidity. If we are unable to provide the financial assurance that is required by state and federal law to secure our reclamation and coal lease obligations, our ability to mine or lease coal and, as a result, our results of operations could be materially and adversely affected.
Pressure on our business, cash flow and liquidity could materially and adversely affect our ability to fund our business operations or react to and withstand changing market and industry conditions. Additional sources of funds may not be available.
A significant source of liquidity is our cash balance. Access to additional funds from liquidity-generating transactions or other sources of external financing may not be available to us and, if available, would be subject to market conditions and certain limitations, including our credit rating and covenant restrictions in our revolving credit facility.
Our indebtedness, as it may exist from time to time, exposes us to various risks.
At December 31, 2023, we had $10.4 million of indebtedness outstanding, of which $8.6 million is scheduled to mature in the next three years.
Our indebtedness could have important consequences to our business, particularly if the amount of our indebtedness should materially increase in the future. For example, it could:
•make it more difficult for us to pay or refinance our debts as they become due during adverse economic and industry conditions because any related decrease in revenues could cause us to not have sufficient cash flows from operations to make our scheduled debt payments;
•force us to seek additional capital, restructure or refinance our debts, or sell assets;
•cause us to be less able to take advantage of significant business opportunities such as acquisition opportunities and to react to changes in market or industry conditions;
•cause us to use a portion of our cash flow from operations for debt service, reducing the availability of working capital and delaying or preventing investments, capital expenditures, research and development and other business activities;
•cause us to be more vulnerable to general adverse economic and industry conditions;
•expose us to the risk of increased interest rates because certain of our borrowings are at variable rates of interest;
•expose us to the risk of foreclosure on substantially all of our assets and those of most of our subsidiaries, which secure certain of our indebtedness if we default on payment or are unable to comply with covenants or restrictions in any of the agreements;
•limit our ability to borrow additional monies in the future to fund working capital, capital expenditures and other general corporate purposes; and
•result in a downgrade in the credit ratings of our indebtedness, which could harm our ability to incur additional indebtedness and result in more restrictive borrowing terms, including increased borrowing costs and more restrictive covenants, all of which could affect our internal cost of capital estimates and therefore impact operational and investment decisions.
We may incur additional secured or unsecured indebtedness in the future, subject to compliance with covenants in our existing debt agreements. Our ability to meet future debt service obligations will depend on our future cash flow from operations and our ability to restructure or refinance our debt, which will depend on the condition of the capital markets and our financial condition at that time. Any refinancing of our debt could be at higher interest rates and may require us to comply with more onerous covenants, which could further restrict our business operations. These alternative measures may not be successful and may not permit us to meet our scheduled debt service obligations, and the terms of existing or future debt instruments may restrict us from adopting some of these alternatives.
Risks Relating to the Ownership of Our Common Stock
The requirements of being a public company, including compliance with the reporting requirements of the Securities Exchange Act of 1934, as amended (the “Exchange Act”), and the requirements of the Sarbanes-Oxley Act, require application of significant resources and management attention, and we may be unable to comply with these requirements in a timely or cost-effective manner.
As a public company, we must comply with laws, regulations and requirements, certain corporate governance provisions of the Sarbanes-Oxley Act of 2002, related regulations of the SEC and the requirements of the New York Stock Exchange. Complying with these statutes, regulations and requirements occupies a significant amount of time for our Board of Directors (the “Board”) and management and requires us to incur significant costs. We are required to:
•maintain a comprehensive compliance function;
•comply with rules promulgated by the New York Stock Exchange;
•prepare and distribute periodic public reports in compliance with our obligations under the federal securities laws;
•maintain internal policies; and
•engage outside counsel and accountants in the above activities.
We are responsible for assessing the operating effectiveness of internal controls over financial reporting and we may conclude that our internal controls over financial reporting are ineffective. Additionally, our independent registered public accounting firm may issue an adverse report indicating that our internal controls are not effective due to deficiencies in how our controls are documented, designed, operated or reviewed. Efforts to remediate any such deficiencies and otherwise comply with these requirements may strain our resources, and we may be unable to do so in a timely or cost-effective manner.
Our share repurchase program could affect the price of our common stock and increase volatility and may be suspended or terminated at any time, which may result in a decrease in the trading price of our common stock.
On February 21, 2023 and October 31, 2023, the Board approved increases to the existing common share repurchase program adopted March 4, 2022, bringing the total authorization to repurchase the Company’s stock to $1.2 billion and $1.5 billion, respectively. This share repurchase program does not obligate us to repurchase any dollar amount or number of shares of our common stock and may be suspended or discontinued at any time, which could cause the market price of our common stock to decline.
Repurchases pursuant to our share repurchase program could affect the price of our common stock and increase its volatility. Important factors that could cause us to limit, suspend or delay our share repurchases, without prior notice, and that could in any event impact our management’s exercise of our discretion as to the amount and timing of such repurchases, include market conditions, the trading price of the stock, applicable legal requirements, compliance with the provisions of our debt agreements, and other factors. The existence of our share repurchase program could cause the price of our common stock to be higher than it would be in the absence of such a program and could potentially reduce the market liquidity for our common stock. Additionally, repurchases under our share repurchase program would diminish our cash reserves, which could adversely affect our operating results.
There can be no assurance that any share repurchases would enhance stockholder value because the market price of our common stock may decline below the levels at which we repurchased such shares. Any failure to repurchase shares could negatively impact our reputation, investor confidence in us and our stock price.
Dividends on our common stock are only payable if declared by the Board and permitted by Delaware law.
Although we have done so in the past, we do not currently pay dividends on our common stock. Dividends on our common stock may be paid only if declared by the Board. The Board is not legally obligated or required to declare dividends on our common stock even if we have funds available for that purpose. In addition, even if the Board wishes to declare a dividend, we cannot make payments of cash in respect of dividends to the extent such payments are not permitted under Delaware law. If we do not declare and pay dividends on our common stock as expected, the market price of our common stock is likely to be adversely affected.
An active, liquid and orderly trading market for our common stock may not be maintained, and our stock price may be volatile.
Alpha’s common stock trades on the New York Stock Exchange under the ticker symbol “AMR.” Active, liquid and orderly trading markets usually result in less price volatility and more efficiency in carrying out investors’ purchase and sale orders. An active, liquid and orderly trading market for our common stock may not be maintained, however. The market price of our common stock could vary significantly as a result of a number of factors, some of which are beyond our control. In the event of a drop in the market price of our common stock, shareholders could lose a substantial part or all of their investment in our common stock.
The following factors, among others, could affect our stock price:
•our operating and financial performance, including reserve estimates;
•an unexpected mine or environmental incident;
•quarterly variations in the rate of growth of our financial indicators, such as net income per share, net income and revenues;
•the public reaction to our press releases, our other public announcements and our filings with the SEC;
•strategic actions by our competitors;
•changes in revenue or earnings estimates, or changes in recommendations or withdrawal of research coverage, by equity research analysts;
•speculation in the press or investment community;
•research analysts’ coverage of our common stock, or their failure to cover our common stock;
•sales of our common stock by us, our directors or officers or the selling stockholders or the perception that such sales may occur;
•our payment of dividends;
•changes in accounting principles, policies, guidance, interpretations or standards;
•additions or departures of key management personnel;
•actions by our stockholders;
•general market conditions, including fluctuations in commodity prices;
•public sentiment regarding climate change and fossil fuels;
•domestic and international economic, legal and regulatory factors unrelated to our performance; and
•the realization of any of the other risks described under this “Risk Factors” section or described elsewhere in this document.
The stock markets in general have experienced extreme volatility that has often been unrelated to the operating performance of particular companies. One factor fueling this volatility has been information available in public media published by third parties, including blogs, articles, message boards and social and other media, that may include statements not attributable to the company under discussion and may not be reliable or accurate. Broad market fluctuations or inaccurate and unreliable information about our company may adversely affect the trading price of our common stock.
Future sales of our common stock in the public market, or the perception that such sales may occur, could reduce our stock price, and any additional capital raised by us through the sale of equity or convertible securities may dilute your ownership.
We may issue additional shares of common stock or convertible securities in subsequent public offerings. We cannot predict the size of future issuances of our common stock or securities convertible into common stock or the effect, if any, that future issuances and sales of shares of our common stock will have on the market price of our common stock or the dividend amount payable per share on our common stock, if any.
Sales of substantial amounts of our common stock (including shares issued in connection with an acquisition), or the perception that such sales could occur, may adversely affect prevailing market prices of our common stock or the dividend amount payable per share on our common stock.
We may issue preferred stock with terms that could adversely affect the voting power or value of our common stock.
Our second amended and restated certificate of incorporation authorizes us to issue, without the approval of our stockholders, one or more classes or series of preferred stock having such designations, preferences, limitations and relative rights, including preferences over our common stock respecting dividends and distributions, as the Board may determine. The terms of one or more classes or series of preferred stock could adversely impact the voting power or value of our common stock. For example, we might grant holders of preferred stock the right to elect some number of our directors in all events or on the happening of specified events or the right to veto specified transactions. Similarly, the repurchase or redemption rights or liquidation preferences we might assign to holders of preferred stock could affect the residual value of the common stock, as the Board may determine.
Provisions in our organizational documents and the instruments governing our debt may discourage a takeover attempt, even if doing so might be beneficial to our stockholders.
Provisions contained in our certificate of incorporation and bylaws, as amended, could impose impediments to the ability of a third party to acquire us even if a change of control would be beneficial to our stockholders. Provisions of our certificate of incorporation and bylaws impose various procedural and other requirements, which could make it more difficult for stockholders to effect certain corporate actions. For example, our certificate of incorporation authorizes the Board to determine the rights, preferences, privileges and restrictions of unissued series of preferred stock, without any vote or action by our stockholders. Thus, the Board can authorize the issuance of shares of preferred stock with voting or conversion rights that could adversely affect the voting or other rights of holders of our common stock. These provisions may have the effect of delaying or deterring a change of control of our company and could limit the price that certain investors might be willing to pay in the future for shares of our common stock.
A change of control (as defined under the instruments governing our debt) is an event of default, permitting our lenders to accelerate the maturity of certain borrowings. Further, our borrowing arrangements impose other restrictions on us, including with respect to mergers or consolidations with other companies and the sale of substantially all of our assets. These provisions could prevent or deter a third-party from acquiring us even where the acquisition could be beneficial to our stockholders.
Our bylaws provide, subject to certain exceptions, that the Court of Chancery of the State of Delaware and the federal district courts of the United States are the exclusive forums for certain stockholder litigation matters, which could limit our stockholders’ ability to obtain a favorable judicial forum for disputes with us or our directors, officers, employees or stockholders.
Our bylaws provide, subject to limited exceptions, that the Court of Chancery of the State of Delaware is, to the fullest extent permitted by law, the sole and exclusive forum for (i) any derivative action or proceeding brought on our behalf; (ii) any action asserting a claim of breach of a fiduciary duty owed by any of our directors, officers or other employees to us or our stockholders; (iii) any action asserting a claim against us, any director or our officers or employees arising pursuant to any provision of the Delaware General Corporation Law, our certificate of incorporation (including any certificate of designations relating to any class or series of preferred stock) or our bylaws; or (iv) any action asserting a claim against us, any director or our officers or employees that is governed by the internal affairs doctrine. This provision does not apply to suits brought to enforce a duty or liability under the Exchange Act or any other claim for which the U.S. federal courts have exclusive jurisdiction. In addition, our bylaws provide that the federal district courts of the United States of America will be the exclusive forum for resolving any complaint asserting a cause of action arising under the Securities Act. Any person or entity purchasing or otherwise acquiring any interest in shares of our capital stock shall be deemed to have notice of and to have consented to the provisions of our bylaws described above. This choice of forum provision may limit a stockholder’s ability to bring a claim in a judicial forum that it finds favorable for disputes with us or any of our directors, officers, other employees or stockholders which may discourage lawsuits with respect to such claims. Alternatively, if a court were to find the choice of forum provision that is contained in our bylaws to be inapplicable or unenforceable in an action, we may incur additional costs associated with resolving such action in other jurisdictions, which could materially adversely affect our business, financial condition and results of operations.
Item 1B. Unresolved Staff Comments
None.
Item 1C. Cybersecurity
Cybersecurity Risk Management and Strategy
Risk Assessment and Management
We have become increasingly dependent upon digital technologies, including information systems, infrastructure and cloud applications and services, to operate our businesses, process and record financial and operating data, communicate with our employees and business partners, analyze seismic and drilling information, estimate quantities of met coal reserves, as well as other activities related to our businesses. We own and operate some of these systems and applications while others are owned and operated by third-party service providers.
We maintain a cybersecurity program employing many components and strategies to mitigate and remediate day-to-day cybersecurity threats and exposures. This program, along with a robust information technology internal controls framework, helps to ensure the confidentiality, integrity and availability of our information systems. The program includes elements for identifying, assessing and managing material risks from cybersecurity threats. Our incident response and change management policies and procedures were designed based on guidelines from the National Institute of Standards and Technology Cybersecurity Framework.
We take a risk-based approach to cybersecurity, which begins with the identification and evaluation of cybersecurity risks or threats that could affect our operations, finances, legal or regulatory compliance, or reputation. We employ continuous monitoring systems and other technologies and security controls to assist us with the identification of cybersecurity risks and threats. At least annually we conduct a third-party risk assessment to identify cybersecurity risks associated with third-party vendors and service providers. When cybersecurity risks are identified, we prioritize mitigation strategies based upon risks’ potential impact, likelihood, velocity and vulnerability, considering both quantitative and qualitative factors. These strategies include, among others, the application, adoption or modification of cybersecurity policies and procedures, implementation of administrative, technical and physical controls and employee training, education and awareness initiatives.
Our cybersecurity risk management includes continuous monitoring of networks and systems for potential signs of suspicious activity. Our Information Systems and Technology Department (the “IT Department”) monitors security alerts or indicators and initiates triage, verification and remediation actions when needed. We also provide mechanisms and training for employees to report to the IT Department any unusual or potentially malicious activity they observe for proper identification and analysis.
In the event of a significant cybersecurity incident, we establish an incident response team that works in conjunction with the IT Department to identify, contain, eradicate and, if necessary, recover from a cybersecurity incident. Through third parties we are also able to rapidly deploy forensic analysis, legal services, notification and call center services and credit and identity monitoring if required.
We track key performance indicators and cybersecurity metrics to evaluate the efficacy of our cybersecurity controls and practices. Further, our cybersecurity program is periodically reviewed by senior members of management and adjusted as needed in an effort to maintain the program’s agility and responsiveness as circumstances and technologies evolve, new cybersecurity threats emerge and regulations change.
We separately operate an enterprise risk management (“ERM”) program to identify, evaluate and manage risks. Cybersecurity risks are evaluated alongside other critical business risks under the ERM program to align cybersecurity efforts with our broader business goals and objectives. We believe that integrating cybersecurity risks into our ERM program fosters a proactive and holistic approach to cybersecurity, which helps safeguard our operations, financial condition and reputation in an ever-evolving threat landscape. Cybersecurity risks are further considered and evaluated as part of an annual risk assessment performed independently by our internal audit department.
Incident Response
We maintain an incident response policy and program focused upon detecting, managing, documenting and reporting incidents affecting our systems and data, including those specific to cybersecurity. In the event of a significant cybersecurity incident, we appoint a dedicated incident team, including a team leader, responsible for managing and coordinating incident response efforts.
These efforts may include detecting, identifying, defending against, responding to and, if necessary, recovering from cybersecurity incidents. Incidents that meet certain thresholds are escalated to senior members of management, internal legal advisors, communication specialists and other key stakeholders for additional guidance and action.
Use of Third Parties
Cybersecurity Service Providers and Third-Party Consultants. At least annually we engage independent cybersecurity consultants, auditors and other third parties to assess and enhance our cybersecurity risk assessment and practices. These third parties conduct independent assessments, penetration testing and vulnerability assessments to identify weaknesses and recommend improvements. Additionally, we employ a number of third-party tools and technologies as part of our efforts to enhance cybersecurity functions and monitoring.
Oversight of Third-Party Service Providers. We use third-party service providers to support our operations and many of our technology initiatives, including third parties that house financial or sensitive information. Our technology acquisition policy and our internal controls framework require us to obtain and review attestation reports regarding these third-party service providers and their sub-service processors or providers and their internal controls, complementary user entity controls and contractual obligations, including those specific to cybersecurity. We evaluate cybersecurity risks associated with our use of third-party service providers, which may include a review of a service provider’s cybersecurity posture or a recommendation of specific mitigation controls. We determine and prioritize service provider risk based on potential threat impact and likelihood and these risk determinations determine the level of due diligence and ongoing compliance monitoring required for each service provider.
Risks from Material Cybersecurity Threats
As of the date of this report, we have not identified any cybersecurity threats that have materially affected or are reasonably anticipated to have a material effect on the organization. Although we have not previously experienced cybersecurity incidents that are individually, or in the aggregate, material, we have experienced cyberattacks in the past, which we believe have thus far been deflected or mitigated by our preventative, detective and responsive measures. For additional discussion of our cybersecurity related risks, see “Item 1.A Risk Factors.”
Cybersecurity Governance
Board Oversight
The Board is responsible for overseeing management’s assessments of major risks facing the Company and for reviewing options to mitigate these risks. The Board’s oversight of cybersecurity risks occurs at both the Board level and through its Audit Committee.
The Board. The Chief Executive Officer, the Chief Operating Officer, the Chief Financial Officer, other members of senior management and other personnel and advisors, as requested by the Board, report on our financial, operating and commercial strategies, as well as major related risks, which may include cybersecurity risks, at regularly scheduled meetings of the Board. The Board may request follow-up data and presentations to address any specific concerns or recommendations.
The Audit Committee. The Audit Committee reviews with our management team, including our Senior Vice President – Information Systems and Technology, our cybersecurity frameworks, policies, technologies, programs, opportunities, strategies and risks. These presentations highlight any significant cybersecurity incidents, the cyber threat landscape, cybersecurity program enhancements, cybersecurity risks, related remediation and mitigation activities, security user awareness and reporting training program and any other relevant cybersecurity topics. In addition, members of our Legal Department advise the Audit Committee as needed regarding cybersecurity-related legal matters, including disclosure requirements. Management believes that these reports help to provide the Audit Committee with an informed understanding of our cybersecurity program, risks and strategies. The Audit Committee may request follow-up data and presentations to address any specific concerns or recommendations. In addition to this periodic reporting, significant cybersecurity risks or threats may also be escalated to the Audit Committee as needed based upon our cyber incident reporting process. The Audit Committee reports regularly to the entire Board and reviews with the Board any major issues that arise at the committee level, which may include cybersecurity risks.
Management’s Role
Our IT Department addresses current and emerging cybersecurity matters. This function is led by our Senior Vice President – Information Systems and Technology, who reports to our Chief Financial Officer. The IT Department’s security team, a cross-functional group composed of members with substantial professional and technical information technology experience, oversees the cybersecurity program to help ensure the confidentiality, integrity and availability of the company’s systems and mitigate day-to-day threats and exposures. It is responsible for measuring and managing cybersecurity risk, including the prevention, detection, mitigation and remediation of cybersecurity incidents and also for implementing cybersecurity policies, programs, procedures and strategies. The security team reports significant cybersecurity incidents to senior management, internal legal advisors, communication specialists and other key stakeholders as required.
Item 2. Properties
Our Properties
Refer to “Item 1. Business” for information on our active mining properties.
Our corporate headquarters consists of approximately 50,000 square feet of leased office space at 340 Martin Luther King Jr. Boulevard in Bristol, Tennessee.
Coal Reserves and Resources
As of December 31, 2023, we estimate that we owned or controlled approximately 316.0 million tons of marketable proven and probable bituminous coal reserves and approximately 513.5 million tons of in situ bituminous coal resources. Our coal reserve and resource estimates were prepared by Marshall Miller & Associates, Inc. (“Marshall Miller”), an independent professional mine engineering and geological consulting firm. Technical Summary Reports prepared by Marshall Miller, as a qualified person, for each of our material mining properties are filed as exhibits to this Annual Report on Form 10-K and incorporated herein by reference.
Coal reserve and resource estimates are based on data obtained from drilling activities and other available geologic data. Estimating reserves and resources requires the use of a geologic, engineering, and economic assumptions. Our engineering, land and operational support personnel work closely with Marshall Miller to ensure the integrity and accuracy of the data used to calculate the estimates as well as to ensure the assumptions used are reasonable based on our historical results as well as current and future anticipated mine plans. We provide Marshall Miller with historical property information including property maps, deed, lease, and permit information, drilling and lab results, mine plans, production quantities, development, capital, and operating costs as well as market information. For our active and certain idled Met mining properties, Marshall Miller performs an initial assessment and based on the level of geological evidence estimates our coal resources and classifies such resources as either inferred, indicated or measured. When considered cost beneficial by the Company, Marshall Miller further conducts a pre-feasibility study to estimate our coal reserves and classify such reserves as either proven or probable. The estimates and reports prepared by Marshall Miller are reviewed by our personnel to ensure such reports have been prepared in accordance with applicable rules and regulations and that estimates are based on reasonable assumptions and reflect known facts and circumstances updated through year-end.
Economic analysis is a required part of the process of estimating coal reserves and resources. For a coal reserve or resource to be considered economic, generally revenue generated from its sale must exceed its total cost of production (including consideration of development, capital, and operating costs).
In determining coal reserves as of December 31, 2023, the following estimated market pricing was utilized:
|
|
|
|
|
|
| Coal quality |
Market Pricing Per Ton (1) (2) |
| High-Vol. A |
$162 |
| High- Vol. B |
$140 |
| Mid-Vol. |
$163 |
| Low-Vol. |
$163 |
| Thermal |
$74 |
(1) Market pricing shown on U.S. East Coast basis.
(2) Met and thermal pricing based on 10-year and 3-year average, respectively of forecasted pricing from pricing services.
The following is a summary of our estimated marketable proven and probable coal reserves as of December 31, 2023 as determined by Marshall Miller:
|
|
|
|
|
|
|
|
|
|
|
|
|
|
|
|
|
|
|
|
|
|
|
|
|
|
|
|
|
|
|
|
|
|
|
|
|
|
|
|
|
|
|
|
|
|
|
|
|
|
|
| Coal Reserves (Tons in thousands) |
|
|
|
|
Marketable Coal Reserves (1) |
|
Reserve Control |
|
Stage / Permit Status Production Stage |
| Mining Complex |
|
Location |
|
Total |
|
Proven |
|
Probable |
|
Owned |
|
Leased |
|
Permitted |
|
Not Permitted |
| Met |
|
|
|
|
|
|
|
|
|
|
|
|
|
|
|
|
| Aracoma |
|
WV |
|
41,276 |
|
|
26,252 |
|
|
15,024 |
|
|
5,473 |
|
|
35,803 |
|
|
22,664 |
|
|
18,612 |
|
| Kepler |
|
WV |
|
41,190 |
|
|
23,031 |
|
|
18,159 |
|
|
258 |
|
|
40,932 |
|
|
15,065 |
|
|
26,125 |
|
| Kingston |
|
WV |
|
38,657 |
|
|
23,051 |
|
|
15,606 |
|
|
632 |
|
|
38,025 |
|
|
22,024 |
|
|
16,633 |
|
| Marfork |
|
WV |
|
97,653 |
|
|
53,333 |
|
|
44,320 |
|
|
2,214 |
|
|
95,439 |
|
|
50,651 |
|
|
47,002 |
|
| McClure/Toms Creek |
|
VA |
|
68,747 |
|
|
47,753 |
|
|
20,994 |
|
|
— |
|
|
68,747 |
|
|
38,648 |
|
|
30,099 |
|
| Elk Run |
|
WV |
|
28,434 |
|
|
17,341 |
|
|
11,093 |
|
|
139 |
|
|
28,295 |
|
|
4,724 |
|
|
23,710 |
|
| Total |
|
|
|
315,957 |
|
|
190,761 |
|
|
125,196 |
|
|
8,716 |
|
|
307,241 |
|
|
153,776 |
|
|
162,181 |
|
(1) Minimum seam height generally 30 inches for underground mines.
|
|
|
|
|
|
|
|
|
|
|
|
|
|
|
|
|
|
|
|
|
|
|
|
|
|
|
|
|
|
|
|
|
|
|
|
|
|
|
|
|
|
|
|
|
|
|
|
|
|
|
|
|
|
|
|
|
| Coal Reserves (Tons in thousands) |
|
|
|
|
Coal Type/Quality |
|
|
|
|
|
|
Met Coal by Volatility |
|
Thermal |
|
Sulfur |
|
Recovery Percentage (2) |
| Mining Complex |
|
Location |
|
High-Vol A |
|
High-Vol B |
|
Mid-Vol |
|
Low-Vol |
|
Thermal (1) |
|
< 1% |
|
> 1% |
|
| Met |
|
|
|
|
|
|
|
|
|
|
|
|
|
|
|
|
|
|
| Aracoma |
|
WV |
|
— |
|
|
41,276 |
|
|
— |
|
|
— |
|
|
— |
|
|
36,836 |
|
|
4,440 |
|
|
28 |
% |
| Kepler |
|
WV |
|
— |
|
|
— |
|
|
5,026 |
|
|
36,164 |
|
|
— |
|
|
41,190 |
|
|
— |
|
|
42 |
% |
| Kingston |
|
WV |
|
20,584 |
|
|
— |
|
|
1,632 |
|
|
9,722 |
|
|
6,719 |
|
|
10,528 |
|
|
28,129 |
|
|
41 |
% |
| Marfork |
|
WV |
|
64,318 |
|
|
— |
|
|
2,555 |
|
|
26,132 |
|
|
4,648 |
|
|
88,588 |
|
|
9,065 |
|
|
30 |
% |
| McClure/Toms Creek |
|
VA |
|
6,265 |
|
|
— |
|
|
60,936 |
|
|
— |
|
|
1,546 |
|
|
68,747 |
|
|
— |
|
|
31 |
% |
| Elk Run |
|
WV |
|
— |
|
|
28,434 |
|
|
— |
|
|
— |
|
|
— |
|
|
28,434 |
|
|
— |
|
|
21 |
% |
| Total |
|
|
|
91,167 |
|
|
69,710 |
|
|
70,149 |
|
|
72,018 |
|
|
12,913 |
|
|
274,323 |
|
|
41,634 |
|
|
|
(1) Kingston thermal reserves primarily proven and >1% sulfur; Marfork and McClure/Toms Creek thermal reserves primarily probable and <1% sulfur.
(2) Recovery percentage defined as estimated coal reserves divided by related estimated in situ measured and indicated coal resources.
In performing an initial assessment for purposes of determining coal resources as of December 31, 2023, the following estimated market pricing was utilized:
|
|
|
|
|
|
| Complex |
Market Pricing Per Ton (1) (2) |
| Aracoma |
$154 |
| Kepler |
$167 |
| Kingston |
$181 |
| Marfork |
$171 |
| McClure/Toms Creek |
$177 |
| Power Mountain |
$154 |
| Elk Run |
$150 |
(1) Market pricing shown on U.S. East Coast basis.
(2) Pricing shown for primary product judgmentally selected by qualified person based on review of historical average pricing for each complexes coal products over the past 5 years.
The following is a summary of the Company’s estimated in situ inferred, indicated, and measured coal resources (exclusive of coal reserves) as of December 31, 2023 as determined by Marshall Miller:
|
|
|
|
|
|
|
|
|
|
|
|
|
|
|
|
|
|
|
|
|
|
|
|
|
|
|
|
|
|
|
|
|
|
|
|
|
|
|
|
|
|
|
|
|
|
|
|
|
|
|
Coal Resources (1) (Tons in thousands) |
|
|
|
|
In Situ Coal Resources (2) |
|
Resource Control |
|
Stage / Permit Status Exploration Stage |
| Mining Complex |
|
Location |
|
Total |
|
Indicated |
|
Measured |
|
Owned |
|
Leased |
|
Permitted |
|
Not Permitted |
| Met |
|
|
|
|
|
|
|
|
|
|
|
|
|
|
|
|
| Aracoma |
|
WV |
|
131,383 |
|
|
49,707 |
|
|
81,676 |
|
|
46,592 |
|
|
84,791 |
|
|
20,668 |
|
|
110,715 |
|
| Kepler |
|
WV |
|
32,866 |
|
|
25,857 |
|
|
7,009 |
|
|
596 |
|
|
32,270 |
|
|
3,901 |
|
|
28,965 |
|
| Kingston |
|
WV |
|
26,662 |
|
|
10,957 |
|
|
15,705 |
|
|
13,864 |
|
|
12,798 |
|
|
— |
|
|
26,662 |
|
| Marfork |
|
WV |
|
156,436 |
|
|
47,377 |
|
|
109,059 |
|
|
61,168 |
|
|
95,268 |
|
|
12,408 |
|
|
144,028 |
|
| McClure/Toms Creek |
|
VA |
|
43,629 |
|
|
13,102 |
|
|
30,527 |
|
|
— |
|
|
43,629 |
|
|
19,060 |
|
|
24,569 |
|
| Power Mountain |
|
WV |
|
54,683 |
|
|
23,739 |
|
|
30,944 |
|
|
16,695 |
|
|
37,988 |
|
|
22,446 |
|
|
32,237 |
|
| Elk Run |
|
WV |
|
67,883 |
|
|
22,360 |
|
|
45,523 |
|
|
— |
|
|
67,883 |
|
|
8,681 |
|
|
59,202 |
|
| Total |
|
|
|
513,542 |
|
|
193,099 |
|
|
320,443 |
|
|
138,915 |
|
|
374,627 |
|
|
87,164 |
|
|
426,378 |
|
(1) Amounts shown exclusive of coal reserves.
(2) Inferred Resources were not considered material and have not been presented.
|
|
|
|
|
|
|
|
|
|
|
|
|
|
|
|
|
|
|
|
|
|
|
|
|
|
|
|
|
|
|
|
|
|
|
|
|
|
|
|
|
|
|
|
|
|
|
|
|
|
|
|
|
|
|
|
|
Coal Resources (1) (Tons in thousands) |
|
|
|
|
Coal Type/Quality |
|
|
|
|
|
|
Met Coal by Volatility |
|
Thermal |
|
Sulfur |
|
Expected Recovery Percentage (2) |
| Mining Complex |
|
Location |
|
High-Vol A |
|
High-Vol B |
|
Mid-Vol |
|
Low-Vol |
|
Thermal |
|
< 1% |
|
> 1% |
|
| Met |
|
|
|
|
|
|
|
|
|
|
|
|
|
|
|
|
|
|
| Aracoma |
|
WV |
|
— |
|
|
131,383 |
|
|
— |
|
|
— |
|
|
— |
|
|
58,564 |
|
|
72,819 |
|
|
21 |
% |
| Kepler |
|
WV |
|
— |
|
|
— |
|
|
6,948 |
|
|
25,918 |
|
|
— |
|
|
30,514 |
|
|
2,352 |
|
|
48 |
% |
| Kingston |
|
WV |
|
— |
|
|
— |
|
|
3,189 |
|
|
23,473 |
|
|
— |
|
|
26,662 |
|
|
— |
|
|
27 |
% |
| Marfork |
|
WV |
|
104,124 |
|
|
— |
|
|
3,684 |
|
|
43,799 |
|
|
4,829 |
|
|
60,693 |
|
|
95,743 |
|
|
30 |
% |
| McClure/Toms Creek |
|
VA |
|
8,049 |
|
|
— |
|
|
35,580 |
|
|
— |
|
|
— |
|
|
23,724 |
|
|
19,905 |
|
|
24 |
% |
| Power Mountain |
|
WV |
|
— |
|
|
54,683 |
|
|
— |
|
|
— |
|
|
— |
|
|
5,938 |
|
|
48,745 |
|
|
31 |
% |
| Elk Run |
|
WV |
|
— |
|
|
67,883 |
|
|
— |
|
|
— |
|
|
— |
|
|
— |
|
|
67,883 |
|
|
28 |
% |
| Total |
|
|
|
112,173 |
|
|
253,949 |
|
|
49,401 |
|
|
93,190 |
|
|
4,829 |
|
|
206,095 |
|
|
307,447 |
|
|
|
(1) Amounts shown exclusive of coal reserves.
(2) Expected recovery percentage defined as potential estimated recoverable tons divided by estimated in situ measured and indicated coal resources.
Our coal reserves and resources are owned or are controlled through leases with third parties, which have varied expiration dates and either have options to renew or are expected to be renewed until all mineable and merchantable coal is exhausted. Leases require the payment of production royalties to lessors based on a stated percentage of sales revenue less freight cost and may contain annual minimum payment requirements. We permit coal reserves and resources in advance of mining. Currently, there are no known permitting issues that would impact the reporting of our coal reserves or resources. However, also refer to “Item 1. Business—Environmental and Other Regulatory Matters” and “Item 1A. Risks Factors—Risks relating to regulatory and legal developments.”
Our coal reserve and resource estimates are updated periodically to reflect coal production, acquisitions and dispositions of mineral interests, new drilling, mine or geological data, and changes in regulations, market conditions or other economic factors. As coal seams in the United States have been mined for many years and are well established, we do not conduct material exploration activity. However, we periodically conduct drilling of additional core holes to provide additional geological evidence as part of our routine mine permitting and planning processes. The following is a summary of the changes in our coal reserves and resources for the year-ended December 31, 2023:
|
|
|
|
|
|
|
|
|
|
|
|
|
|
|
|
|
|
|
|
|
|
|
|
|
|
|
|
|
|
|
|
|
|
|
|
|
|
|
|
|
|
|
|
|
| Changes in Coal Reserves (Tons in thousands) |
|
|
12/31/2022 |
|
|
|
|
|
|
|
|
|
|
|
12/31/2023 |
| Mining Complex |
|
Coal Reserves |
|
Acquired/Leased |
|
Pre-Feasibility(1) |
|
Change in Mine Plan |
|
Divested (2) |
|
Production |
|
Coal Reserves |
| Met |
|
|
|
|
|
|
|
|
|
|
|
|
|
|
| Aracoma |
|
40,114 |
|
|
— |
|
|
2,957 |
|
|
820 |
|
|
— |
|
|
(2,615) |
|
|
41,276 |
|
| Kepler |
|
43,954 |
|
|
— |
|
|
— |
|
|
116 |
|
|
(917) |
|
|
(1,963) |
|
|
41,190 |
|
| Kingston |
|
32,892 |
|
|
— |
|
|
6,262 |
|
|
1,724 |
|
|
— |
|
|
(2,221) |
|
|
38,657 |
|
| Marfork |
|
106,210 |
|
|
354 |
|
|
— |
|
|
(4,455) |
|
|
— |
|
|
(4,456) |
|
|
97,653 |
|
| McClure/Toms Creek |
|
72,094 |
|
|
— |
|
|
612 |
|
|
(274) |
|
|
— |
|
|
(3,685) |
|
|
68,747 |
|
| Elk Run |
|
41,442 |
|
|
— |
|
|
— |
|
|
— |
|
|
(12,985) |
|
|
(23) |
|
|
28,434 |
|
| Total |
|
336,706 |
|
|
354 |
|
|
9,831 |
|
|
(2,069) |
|
|
(13,902) |
|
|
(14,963) |
|
|
315,957 |
|
(1) Mineral areas subjected to Pre-feasibility study in current period.
(2) Mineral control released through transfer, termination or lapse of lease, or sale of property.
|
|
|
|
|
|
|
|
|
|
|
|
|
|
|
|
|
|
|
|
|
|
|
|
|
|
|
|
|
|
|
|
|
|
|
|
|
|
|
|
|
|
|
|
|
| Changes in Coal Resources (Tons in thousands) |
|
|
12/31/2022 |
|
|
|
|
|
|
|
|
|
|
|
12/31/2023 |
| Mining Complex |
|
Coal Resources |
|
Initial Assessment (1) |
|
Pre-Feasibility (2) |
|
Change in Mine Plan |
|
Divested |
|
Production |
|
Coal Resources |
| Met |
|
|
|
|
|
|
|
|
|
|
|
|
|
|
| Aracoma |
|
143,815 |
|
|
— |
|
|
(14,029) |
|
|
1,597 |
|
|
— |
|
|
— |
|
|
131,383 |
|
| Kepler |
|
34,246 |
|
|
— |
|
|
— |
|
|
(994) |
|
|
(386) |
|
|
— |
|
|
32,866 |
|
| Kingston |
|
21,453 |
|
|
5,209 |
|
|
— |
|
|
— |
|
|
— |
|
|
— |
|
|
26,662 |
|
| Marfork |
|
159,115 |
|
|
— |
|
|
— |
|
|
(2,679) |
|
|
— |
|
|
— |
|
|
156,436 |
|
| McClure/Toms Creek |
|
43,044 |
|
|
— |
|
|
(2,692) |
|
|
3,277 |
|
|
— |
|
|
— |
|
|
43,629 |
|
| Power Mountain |
|
57,777 |
|
|
— |
|
|
— |
|
|
(953) |
|
|
— |
|
|
(2,141) |
|
|
54,683 |
|
| Elk Run |
|
67,883 |
|
|
— |
|
|
— |
|
|
— |
|
|
— |
|
|
— |
|
|
67,883 |
|
| Total |
|
527,333 |
|
|
5,209 |
|
|
(16,721) |
|
|
248 |
|
|
(386) |
|
|
(2,141) |
|
|
513,542 |
|
(1) Mineral areas subjected to initial assessment in current year.
(2) Mineral areas subjected to Pre-feasibility study in the current year.
Internal Controls Disclosure
The preparation of coal reserve and resource estimates is conducted in accordance with the Company’s prescribed internal control procedures, which are designed to ensure the reliability of such estimates. On an annual basis, Company personnel meet with the independent qualified person to provide updates to the data and assumptions to be used in performing the reserve and resource estimates. Company personnel review the work of the qualified person to ensure such work is prepared in accordance with applicable rules and regulations and that the data and assumptions used are supportable based on historical results and current and future mine plans and reflect known facts and circumstances through the reporting date. For example, the Company’s land personnel verify the property maps and control areas used by the qualified person based on review of underlying deed and lease records. The Company’s engineering personnel ensure estimates are based on current mine plans, incorporate the most recent drilling and lab data, properly reflect changes in permitting status, consider known encumbrances, and are consistent with operating knowledge and expectations in terms of mining methods, recovery rates, minimum seam heights or maximum strip ratios, and saleable qualities. The Company’s operations support personnel endeavor to ensure that estimates are prepared in accordance with applicable rules and regulations, that rationale for changes in estimates from prior years are reasonable and supportable, and that cash flow projections are based on reasonable and supportable assumptions with respect to forecasted production rates, coal pricing, and operating and capital costs.
The Company’s drilling, sample preparation and laboratory analysis are conducted in accordance with internal policies and procedures. For example, core drilling is conducted by reputable third-party drillers and core samples are tagged. Laboratory testing is performed by American National Standards Institute (“ANSI”) certified laboratories and samples are analyzed in accordance with procedures defined under American Society for Testing and Materials (“ASTM”) standards. Core drilling and laboratory testing results are logged into a database with restricted access. In addition, the Company’s qualified person performs independent data verification procedures to ensure data is of sufficient quantity and reliability to reasonably support the coal reserve and resource estimates.
Coal reserve and resource amounts are estimates and as estimates have inherent risks due to data accuracy, uncertainty from geologic interpretation, mine plan assumptions, uncontrolled property rights and permit availability, uncertainty with respect to future market supply and demand, and changes in laws and regulations. The Company’s current coal reserves and resource estimates are based on the best information available and are subject to re-assessment when conditions change. Also refer to Item 1A. Risk Factors for further discussion of risks associated with the estimates of the Company’s reserves and resources.
The following map shows the locations of our material mining properties and corporate headquarters:
Item 3. Legal Proceedings
For a description of the Company’s legal proceedings, refer to Note 21, part (d), to the Consolidated Financial Statements, which is incorporated herein by reference.
Item 4. Mine Safety Disclosures
Information concerning mine safety violations or other regulatory matters required by Section 1503(a) of the Dodd-Frank Wall Street Reform and Consumer Protection Act and Item 104 of Regulation S-K is included in Exhibit 95 to this Annual Report on Form 10-K.
Part II
Item 5. Market for Registrant’s Common Equity, Related Stockholder Matters and Issuer Purchases of Equity Securities
Upon the consummation of the transactions contemplated by the Merger Agreement, we began trading on the New York Stock Exchange under the ticker “CTRA” on November 9, 2018. Following the effectiveness of our name change on February 1, 2021, our ticker symbol on the New York Stock Exchange changed from “CTRA” to “AMR” effective on February 4, 2021.
As of December 31, 2023, there were 86 registered holders of record of our common stock. The transfer agent and registrar for our common stock is Computershare Trust Company, N.A. Our common stock is registered by book-entry only.
The section of our Proxy Statement entitled “Stock Performance Graph” is incorporated herein by reference. For information on securities authorized for issuance under our equity compensation plans, see “Item 12. Security Ownership of Certain Beneficial Owners and Management and Related Stockholder Matters.”
Dividend Policy
Pursuant to the dividend policy adopted by the Board on May 3, 2022, the Board declared quarterly cash dividends on the Company’s common stock during the years ended December 31, 2023 and 2022. The holders of the Company’s common stock are entitled to receive such dividends, if any, when they are declared by the Board. The decision to declare and pay cash dividends will be made by the Board and will depend on the Company’s earnings, financial condition and other relevant factors. On August 2, 2023, the Board determined to end the Company’s fixed dividend program following the quarterly dividend declared and paid in the fourth quarter of 2023. Refer to Note 7 for further information related to the Company’s dividend program.
Repurchase of Common Stock
The following table summarizes information about shares of common stock that were repurchased during the fourth quarter of 2023.
|
|
|
|
|
|
|
|
|
|
|
|
|
|
|
|
|
|
|
|
|
|
|
|
|
Total Number of Shares Purchased (1) |
|
Average Price Paid per Share |
|
Total Number of Shares Purchased as Part of Publicly Announced Plans or Programs (2) |
|
Approximate Dollar Value of Shares that May Yet Be Purchased Under the Plans or Programs (In thousands) (2)(3)(4) |
| October 1, 2023 through October 31, 2023 |
132,460 |
|
|
$ |
232.02 |
|
|
132,460 |
|
|
$ |
626,717 |
|
| November 1, 2023 through November 30, 2023 |
264,425 |
|
|
$ |
253.67 |
|
|
264,425 |
|
|
$ |
559,639 |
|
| December 1, 2023 through December 31, 2023 |
124,118 |
|
|
$ |
318.41 |
|
|
101,989 |
|
|
$ |
527,619 |
|
|
521,003 |
|
|
|
|
498,874 |
|
|
|
(1) Includes 22,129 common shares repurchased from employees to satisfy the employees’ statutory tax withholdings upon the vesting of stock grants. Shares that are repurchased to satisfy the employees’ statutory tax withholdings are recorded in treasury stock at cost.
(2) On February 21, 2023 and October 31, 2023, the Board approved increases to the existing common share repurchase program adopted March 4, 2022, bringing the total authorization to repurchase the Company’s stock to $1.2 billion and $1.5 billion, respectively. Refer to Note 7 for additional information.
(3) The Company adopted a capital return program in 2019, including a stock repurchase plan with no expiration date that permitted the Company to repurchase up to an aggregate amount of $100 million of the Company’s common stock. The Company suspended this stock repurchase plan on October 1, 2019 and does not currently intend to make further repurchases under it.
(4) We cannot estimate the number of shares that will be repurchased because decisions to purchase are subject to market and business conditions, levels of available liquidity, our cash needs, restrictions under agreements or obligations, legal or regulatory requirements or restrictions, and other relevant factors. This amount does not include stock repurchase related fees and excise taxes.
Item 6. [Reserved]
Item 7. Management’s Discussion and Analysis of Financial Condition and Results of Operations
The following discussion and analysis provides a narrative of our results of operations and financial condition for the years ended December 31, 2023 and 2022. The following discussion and analysis should be read in conjunction with our Consolidated Financial Statements and related notes and the risk factors included elsewhere in this Annual Report on Form 10-K. For discussion on results of operations and financial condition pertaining to 2021 and year-over-year comparisons between 2022 and 2021, refer to “Management’s Discussion and Analysis of Financial Condition and Results of Operations” in Part II, Item 7 of our Annual Report on Form 10-K for the year ended December 31, 2022.
The following discussion includes forward-looking statements about our business, financial condition and results of operations, including discussions about management’s expectations for our business. These statements represent projections, beliefs and expectations based on current circumstances and conditions and in light of recent events and trends, and you should not construe these statements either as assurances of performance or as promises of a given course of action. Instead, various known and unknown factors are likely to cause our actual performance and management’s actions to vary, and the results of these variances may be both material and adverse. See “Cautionary Statement Regarding Forward-Looking Statements” and “Item 1A. Risk Factors.”
Market Overview
Throughout 2023, metallurgical coal markets generally showed strength with periods of volatility in the face of economic pressures, geopolitical uncertainty, and global recessionary fears.
Macroeconomic conditions around the world remain inconsistent, with some economies, like the United States, exhibiting continued resilience to these external pressures, while others, like the European Union, having experienced a significant downturn. While central bankers in the United States and Europe are expected to lower interest rates within the 2024 calendar year in response to easing inflation, uncertainty remains regarding when those actions may be taken and how quickly they may impact overall economic conditions. Organizations such as the International Monetary Fund and The World Bank have issued muted expectations about global growth prospects for 2024-2025, citing a slower-than-historical-average pace of expansion and downside risks related to geopolitical shocks, supply disruptions, or prolonged tight monetary conditions.
Geopolitical strife—namely the Russian war in Ukraine and the violence in the Middle East—has impacted coal markets by upending natural trade flows and, at times, causing shipping delays due to violence stemming from these conflicts. Continued volatility in metallurgical markets is possible as these macroeconomic and geopolitical circumstances evolve.
Metallurgical coal indices ended the fourth quarter within a few percentage points of where they started in October 2023, with the U.S. East Coast High Volatile B index representing the largest move, an increase of 6%, of the four indices Alpha closely monitors. The Australian Premium Low Volatile index decreased from $333.00 per metric ton at the start of the fourth quarter to $323.75 metric ton at the end of December. The U.S. East Coast Low Volatile index increased from $258.00 per metric ton at the beginning of October to $268.00 per metric ton at the end of December. The U.S. East Coast High Volatile A index moved from $288.00 per metric ton at the start of the fourth quarter to $281.00 per metric ton at quarter close, and the U.S. East Coast High Volatile B index increased from $238.00 per metric ton to $252.00 per metric ton at the end of the year. Since then, all four indices have softened. The Australian Premium Low Volatile declined from its quarter-close level to $315.00 per metric ton on February 15, 2024. The U.S. East Coast indices of Low Volatile, High Volatile A and High Volatile B measured $265.00, $262.00, and $221.00 per ton, respectively, as of the same date.
The world manufacturing Purchasing Managers’ Index (“PMI”) increased to 50.0 in January 2024, up from 49.0 in December 2023 and breaking a 16-month stretch of below-50.0 contractionary levels. India, an important market for Alpha, recorded January 2024 PMI of 56.5, up from 54.9 in December 2023. PMI data for the United States rose to 50.7 in January 2024, up from a December 2023 level of 47.9, marking the strongest improvement in operating conditions since September 2022. Brazilian PMI also progressed from its December 2023 level of 48.4, with the January 2024 PMI of 52.8 representing an 18-month high for the country’s manufacturing economy. China’s headline PMI was unchanged from December 2023 to January 2024, coming in at 50.8. While still firmly in contractionary territory, Europe’s PMI data show positive momentum, with the January 2024 manufacturing PMI hitting a 10-month high of 46.6, up significantly from 44.4 in December 2023.
As compiled by the World Steel Association (“WSA”), December 2023 global crude steel production of 135.7 million metric tons from 71 countries represented a decrease of 5.3% in comparison to the year-ago period. The largest steel-producing country, China, produced 67.4 million metric tons in December 2023, 14.9% less than it produced in December 2022. The next largest producer, India, posted an increased December 2023 production level of 12.1 million metric tons, up 9.5% from its December 2022 level. Crude steel production in the United States of 6.8 million metric tons in December 2023 represented an increase of 7.6% from the year-ago period.
South Korea produced 5.4 million metrics tons of steel in December 2023, an increase of 2.7% over production from December 2022. Turkey and Iran produced 3.2 million metric tons and 2.9 million metric tons in December 2023, which represented the two largest year-over-year percentage increases (21.2% and 12.1%, respectively) among the top ten steel-producing countries. In terms of regional analysis, December 2023 crude steel production represented an increase against the year-ago period for all reporting regions but the Asia and Oceania region, which contains both India and China, and South America. Asia and Oceania produced 96.4 million metric tons of crude steel for the month, a 9.7% decrease from December 2022, while South America’s 3.2 million metric tons was a 3.2% decrease from December 2022.
The American Iron and Steel Institute’s capacity utilization rate for U.S. steel mills was 77.0% for the week ending February 10, 2024. This is lower than the year-ago period when the capacity utilization rate was 80.5%.
In the seaborne thermal market, the API2 index started the fourth quarter at $124.85 per metric ton and decreased to $103.85 per metric ton at the end of December 2023.
Business Overview
We are a Tennessee-based mining company with operations across Virginia and West Virginia. With customers across the globe, high-quality reserves and significant port capacity, we are a leading supplier of metallurgical coal products to the steel industry. We operate high-quality, cost-competitive coal mines across the CAPP coal basin. As of December 31, 2023, our operations consisted of twenty-two active mines and nine coal preparation and load-out facilities, with approximately 4,160 employees. We produce, process, and sell met coal and thermal coal. We also sell coal produced by others, some of which is processed and/or blended with coal produced from our mines prior to resale, with the remainder purchased for resale. As of December 31, 2023, we had 316.0 million tons of reserves, which included 303.0 million tons of proven and probable metallurgical reserves and 12.9 million tons of proven and probable thermal reserves.
We began operations on July 26, 2016, with mining operations in NAPP, CAPP, and the PRB. Through the Acquisition, we acquired a significant reserve base. We also acquired Alpha Natural Resources Inc.’s 40.6% interest in the DTA coal export terminal in Newport News, Virginia, and on March 31, 2017, we acquired a portion of another partner’s ownership stake and increased our interest to 65.0%. We merged with Alpha Natural Resources Holdings, Inc. and ANR, Inc. on November 9, 2018.
On December 8, 2017, we closed a transaction with Blackjewel to sell our Western Mines located in the PRB, Wyoming, along with related coal reserves, equipment, infrastructure and other real properties (our former PRB operations). On October 4, 2019, we closed on the ESM Transaction in connection with Blackjewel’s subsequent bankruptcy filing. On May 29, 2020, certain of our subsidiaries (Contura Coal West, LLC and Contura Wyoming Land, LLC), one of which held the mining permits for the Western Mines, were merged with certain subsidiaries of ESM to become wholly-owned subsidiaries of ESM and to complete the permit transfer process in connection with the ESM Transaction.
On December 10, 2020, we closed on a transaction with Iron Senergy Holdings, LLC, to sell our thermal coal mining operations located in Pennsylvania consisting primarily of our Cumberland mining complex and related property (our former NAPP operations). The disposition of our former NAPP operations accelerated our strategic exit from thermal coal production to shift our focus toward met coal production.
For the years ended December 31, 2023 and 2022, sales of met coal were 15.3 million tons and 14.2 million tons, respectively, and accounted for approximately 90% and 87%, respectively, of our coal sales volume. Sales of thermal coal were 1.8 million tons and 2.2 million tons, respectively, and accounted for approximately 10% and 13%, respectively, of our coal sales volume.
Our sales of met coal were made primarily to steel companies in the northeastern and midwestern regions of the United States and in several countries in Asia, Europe, and the Americas. Our sales of thermal coal were made primarily to large utilities and industrial customers both in the United States and across the world. For the years ended December 31, 2023 and 2022 approximately 74% and 81%, respectively, of our coal revenues were derived from coal sales made to customers outside the United States.
In addition, we generate other revenues from equipment sales, rentals, terminal and processing fees, coal and environmental analysis fees, royalties and the sale of natural gas. We also record freight and handling fulfillment revenue within coal revenues for freight and handling services provided in delivering coal to certain customers, which are a component of the contractual selling price.
As of December 31, 2023, we have one reportable segment: Met. Our Met segment operations consist of high-quality met coal mines, including Deep Mine 41, Road Fork 52, Black Eagle, and Lynn Branch. The coal produced by our Met segment operations is predominantly met coal with some amounts of thermal coal being produced as a byproduct of mining. In addition to the one reportable segment, our All Other category includes general corporate overhead and corporate assets and liabilities, our former CAPP - Thermal operations consisting of one preparation plant in West Virginia, and the elimination of certain intercompany activity, as well as expenses associated with certain idled/closed mines. Refer to Notes 22 and 23 for additional disclosures on our reportable segment, geographic areas, and export coal revenue information.
As discussed in the “Market Overview” presented above, monetary tightening in the United States and Europe, weak economic conditions across the globe, and geopolitical unrest from the ongoing war between Russia and Ukraine and violence in the Middle East influenced metallurgical coal markets in 2023. Our year ended December 31, 2023 results of operations were impacted by volatility in coal indices stemming from these factors.
Other Business Developments
During 2023, development was completed and production began at our Rolling Thunder and Checkmate Powellton mines within our Power Mountain and Elk Run mining complexes, respectively, which produce High-Vol. B quality met coal from the Powellton coal seam.
In August 2023, we completed our transition to a pure-play metallurgical producer with the closure of Slabcamp, which was our last remaining thermal mine.
In the first quarter of 2023, we completed a series of transactions to acquire a number of coal trucks and related equipment and facilities to secure trucking services for our operations. In December 2022, we purchased substantially all of the assets of a mining equipment component manufacturing and rebuild business to help secure the supply of certain underground mining equipment parts needed for our operations. Refer to Note 2 for additional information.
Factors Affecting Our Results of Operations
Sales Agreements
We manage our commodity price risk for coal sales through the use of coal supply agreements. As of February 14, 2024, we had sales commitments for 2024 as follows:
|
|
|
|
|
|
|
|
|
|
|
|
|
|
|
|
|
|
|
Tons |
|
% Priced |
|
Average Realized Price per Ton |
| Met - Domestic |
|
|
|
|
$161.63 |
|
| Met - Export |
|
|
|
|
$196.05 |
|
| Met Total |
16.0 million |
|
35 |
% |
|
$171.33 |
|
| Thermal |
1.1 million |
|
100 |
% |
|
$77.14 |
|
| Met Segment |
17.1 million |
|
40 |
% |
|
$154.68 |
|
Realized Pricing. Our realized price per ton of coal is influenced by many factors that vary by region, including (i) coal quality, which includes energy (heat content), sulfur, ash, volatile matter and moisture content; (ii) differences in market conventions concerning transportation costs and volume measurement; and (iii) regional supply and demand.
•Coal Quality. The energy content or heat value of thermal coal is a significant factor influencing coal prices as higher energy coal is more desirable to consumers and typically commands a higher price in the market. The heat value of coal is commonly measured in British thermal units or the amount of heat needed to raise the temperature of one pound of water by one-degree Fahrenheit. Coal from the Eastern and Midwest regions of the United States tends to have a higher heat value than coal found in the western United States. Coal volatility is a significant factor influencing met coal pricing as coal with a lower volatility has historically been more highly valued and typically commands a higher price in the market. The volatility refers to the loss in mass, less moisture, when coal is heated in the absence of air. The volatility of met coal determines the percentage of feed coal that becomes coke, known as coke yield, with lower volatility producing a higher coke yield.
•Market Conventions. Coal sales contracts are priced according to conventions specific to the market into which such coal is to be sold. Our domestic sales contracts are typically priced free on board (“FOB”) at our mines and on a short ton basis. Our international sales contracts are typically priced FOB at the shipping port from which such coal is delivered and on a metric ton basis. Accordingly, for international sales contracts, we typically bear the cost of transportation from our mines to the applicable outbound shipping port, and our coal sales realization per ton calculation reflects the conversion of such tonnage from metric tons into short tons, as well as the elimination of the freight and handling fulfillment component of coal sales revenue. In addition, for domestic sales contracts, as customers typically bear the cost of transportation from our mines, our operations located further away from the end user of the coal may command lower prices.
•Regional Supply and Demand. Our realized price per ton is influenced by market forces of the regional market into which such coal is to be sold. Market pricing may vary according to region and lead to different discounts or premiums to the most directly comparable benchmark price for such coal product.
Costs. Our results of operations are dependent upon our ability to maximize productivity and control costs. Our primary expenses are for operating supply costs, repair and maintenance expenditures, cost of purchased coal, royalties, wages and benefits, freight and handling costs and taxes incurred in selling our coal. The principal goods and services we use in our operations include maintenance and repair parts and services, electricity, fuel, roof control and support items, explosives, tires, conveyance structure, ventilation supplies and lubricants. Our management strives to aggressively control costs and improve operating performance to mitigate external cost pressures. We experience volatility in operating costs related to fuel, explosives, steel, tires, contract services and healthcare, among others, and take measures to mitigate the increases in these costs at all operations. We have a centralized sourcing group for major supplier contract negotiation and administration, for the negotiation and purchase of major capital goods, and to support the business units. We promote competition between suppliers and seek to develop relationships with suppliers that focus on lowering our costs. We seek suppliers who identify and concentrate on implementing continuous improvement opportunities within their area of expertise. To the extent upward pressure on costs exceeds our ability to realize sales increases, or if we experience unanticipated operating or transportation difficulties, our operating margins would be negatively impacted. We may also experience difficult geologic conditions, delays in obtaining permits, labor shortages, unforeseen equipment problems, and unexpected shortages of critical materials such as tires, fuel and explosives that may result in adverse cost increases and limit our ability to produce at forecasted levels.
Results of Operations
Our results of operations for the years ended December 31, 2023 and 2022 are discussed in these “Results of Operations” presented below.
Year Ended December 31, 2023 Compared to the Year Ended December 31, 2022
Revenues
The following table summarizes information about our revenues during the years ended December 31, 2023 and 2022:
|
|
|
|
|
|
|
|
|
|
|
|
|
|
|
|
|
|
|
|
|
|
|
|
|
Year Ended December 31, |
|
Increase (Decrease) |
| (In thousands, except for per ton data) |
2023 |
|
2022 |
|
$ or Tons |
|
% |
| Coal revenues |
$ |
3,456,630 |
|
|
$ |
4,092,987 |
|
|
$ |
(636,357) |
|
|
(15.5) |
% |
| Other revenues |
14,787 |
|
|
8,605 |
|
|
6,182 |
|
|
71.8 |
% |
| Total revenues |
$ |
3,471,417 |
|
|
$ |
4,101,592 |
|
|
$ |
(630,175) |
|
|
(15.4) |
% |
|
|
|
|
|
|
|
|
| Tons sold |
17,072 |
|
|
16,378 |
|
|
694 |
|
|
4.2 |
% |
Coal revenues. Coal revenues decreased $636.4 million, or 15.5%, for the year ended December 31, 2023 compared to the prior year period. The decrease was primarily due to a 20.7% reduction in average coal sales realization within our Met segment as pricing moderated from the higher levels experienced during the prior year, partially offset by a 6.9% increase in coal sales volumes. The elevated coal sales pricing environment in the prior year period was driven by increased coal demand, resulting from improved economic activity, coupled with limited supply response. Coal revenues within our All Other category also declined due to the closure of Slabcamp, which was our last remaining thermal mine, in August of 2023. Refer to the “Non-GAAP Coal revenues” section below for further detail on coal revenues for the year ended December 31, 2023 compared to the prior year period.
Cost and Expenses
The following table summarizes information about our costs and expenses during the years ended December 31, 2023 and 2022:
|
|
|
|
|
|
|
|
|
|
|
|
|
|
|
|
|
|
|
|
|
|
|
|
|
Year Ended December 31, |
|
Increase (Decrease) |
| (In thousands) |
2023 |
|
2022 |
|
$ |
|
% |
| Cost of coal sales (exclusive of items shown separately below) |
$ |
2,356,138 |
|
|
$ |
2,285,969 |
|
|
$ |
70,169 |
|
|
3.1 |
% |
| Depreciation, depletion and amortization |
136,869 |
|
|
107,620 |
|
|
29,249 |
|
|
27.2 |
% |
| Accretion on asset retirement obligations |
25,500 |
|
|
23,765 |
|
|
1,735 |
|
|
7.3 |
% |
| Amortization of acquired intangibles, net |
8,523 |
|
|
19,498 |
|
|
(10,975) |
|
|
(56.3) |
% |
| Selling, general and administrative expenses (exclusive of depreciation, depletion and amortization shown separately above) |
82,390 |
|
|
71,618 |
|
|
10,772 |
|
|
15.0 |
% |
| Total other operating loss (income): |
|
|
|
|
|
|
|
| Mark-to-market adjustment for acquisition-related obligations |
— |
|
|
8,880 |
|
|
(8,880) |
|
|
(100.0) |
% |
| Other (income) expense |
(1,088) |
|
|
3,363 |
|
|
(4,451) |
|
|
(132.4) |
% |
| Total costs and expenses |
$ |
2,608,332 |
|
|
$ |
2,520,713 |
|
|
$ |
87,619 |
|
|
3.5 |
% |
Cost of coal sales. Cost of coal sales increased $70.2 million, or 3.1%, for the year ended December 31, 2023 compared to the prior year period as a result of increased costs due to inflationary pressure and increased levels of coal purchases partially offset by lower royalties, taxes, and freight and handling costs due to the lower coal pricing environment.
Depreciation, depletion and amortization. Depreciation, depletion and amortization increased $29.2 million, or 27.2%, for the year ended December 31, 2023 compared to the prior year period. The increase was primarily due to an increase in capital expenditures.
Amortization of acquired intangibles, net. Amortization of acquired intangibles, net decreased $11.0 million, or 56.3%, for the year ended December 31, 2023 compared to the prior year period. The decrease was primarily driven by accelerated prior period amortization of certain acquired mine permits as a result of an update to the estimated life of the associated mines.
Selling, general and administrative. Selling, general and administrative expenses increased $10.8 million, or 15.0%, for the year ended December 31, 2023 compared to the prior year period. This increase was primarily related to increases of $10.8 million in stock compensation expense and $1.7 million in wages and benefits expense, partially offset by decreases of $2.0 million in professional services fees and $0.7 million in incentive pay.
Mark-to-market adjustment for acquisition-related obligations. The mark-to-market adjustment for acquisition-related obligations was $8.9 million for the year ended December 31, 2022. As the royalty period for our Contingent Revenue Obligation ended on December 31, 2022, there was no mark-to-market adjustment recorded during the year ended December 31, 2023. Refer to Notes 14 and 16 for additional information on the Contingent Revenue Obligation.
Other (income) expense. Other income increased $4.5 million, or 132.4%, for the year ended December 31, 2023 compared to the prior year period, primarily due to an increase in income on sale of assets in the current period.
Total Other Expense, Net
The following table summarizes information about our total other expense, net during the years ended December 31, 2023 and 2022:
|
|
|
|
|
|
|
|
|
|
|
|
|
|
|
|
|
|
|
|
|
|
|
|
|
Year Ended December 31, |
|
Increase (Decrease) |
| (In thousands) |
2023 |
|
2022 |
|
$ |
|
% |
| Total other expense, net |
$ |
(17,626) |
|
|
$ |
(26,129) |
|
|
$ |
8,503 |
|
|
32.5 |
% |
Total other expense, net decreased $8.5 million, or 32.5%, for the year ended December 31, 2023 compared to the prior year period, primarily related to decreased interest expense due to a reduction in outstanding debt and increased interest income due to rising interest rates, partially offset by an increase in net periodic benefit costs for pension obligations.
Income Tax Expense
The following table summarizes information about our income tax expense during the years ended December 31, 2023 and 2022:
|
|
|
|
|
|
|
|
|
|
|
|
|
|
|
|
|
|
|
|
|
|
|
|
|
Year Ended December 31, |
|
Increase (Decrease) |
| (In thousands) |
2023 |
|
2022 |
|
$ |
|
% |
| Income tax expense |
$ |
(123,503) |
|
|
$ |
(106,205) |
|
|
$ |
(17,298) |
|
|
(16.3) |
% |
Income taxes. Income tax expense of $123.5 million was recorded for the year ended December 31, 2023 on income before income taxes of $845.5 million. The effective tax rate differs from the federal statutory rate of 21% primarily due to favorable permanent differences for the percentage depletion allowance and the foreign-derived intangible income deduction.
Income tax expense of $106.2 million was recorded for the year ended December 31, 2022 on income before income taxes of $1,554.8 million. The effective tax rate differs from the federal statutory rate of 21% primarily due to the decrease in the valuation allowance and favorable permanent differences for the percentage depletion allowance and the foreign-derived intangible income deduction. Refer to Note 17 for additional information.
Non-GAAP Financial Measures
The discussion below contains “non-GAAP financial measures.” These are financial measures that either exclude or include amounts that are not excluded or included in the most directly comparable measures calculated and presented in accordance with generally accepted accounting principles in the United States (“U.S. GAAP” or “GAAP”). Specifically, we make use of the non-GAAP financial measures “Adjusted EBITDA,” “non-GAAP coal revenues,” “non-GAAP cost of coal sales,” and “non-GAAP coal margin.” We use Adjusted EBITDA to measure the operating performance of our segments and allocate resources to the segments. Adjusted EBITDA does not purport to be an alternative to net income (loss) as a measure of operating performance or any other measure of operating results, financial performance, or liquidity presented in accordance with GAAP. Moreover, this measure is not calculated identically by all companies and therefore may not be comparable to similarly titled measures used by other companies. Adjusted EBITDA is presented because management believes it is a useful indicator of the financial performance of our coal operations. We use non-GAAP coal revenues to present coal revenues generated, excluding freight and handling fulfillment revenues. Non-GAAP coal sales realization per ton for our operations is calculated as non-GAAP coal revenues divided by tons sold. We use non-GAAP cost of coal sales to adjust cost of coal sales to remove freight and handling costs, depreciation, depletion and amortization - production (excluding the depreciation, depletion and amortization related to selling, general and administrative functions), accretion on asset retirement obligations, amortization of acquired intangibles, net, and idled and closed mine costs. Non-GAAP cost of coal sales per ton for our operations is calculated as non-GAAP cost of coal sales divided by tons sold. Non-GAAP coal margin per ton for our coal operations is calculated as non-GAAP coal sales realization per ton for our coal operations less non-GAAP cost of coal sales per ton for our coal operations. The presentation of these measures should not be considered in isolation, or as a substitute for analysis of our results as reported under GAAP.
Management uses non-GAAP financial measures to supplement GAAP results to provide a more complete understanding of the factors and trends affecting the business than GAAP results alone. The definition of these non-GAAP measures may be changed periodically by management to adjust for significant items important to an understanding of operating trends and to adjust for items that may not reflect the trend of future results by excluding transactions that are not indicative of our core operating performance. Furthermore, analogous measures are used by industry analysts to evaluate the Company’s operating performance. Because not all companies use identical calculations, the presentations of these measures may not be comparable to other similarly titled measures of other companies and can differ significantly from company to company depending on long-term strategic decisions regarding capital structure, the tax jurisdictions in which companies operate, capital investments and other factors.
Included below are reconciliations of non-GAAP financial measures to GAAP financial measures.
The following tables summarize certain financial information relating to our coal operations for the years ended December 31, 2023 and 2022:
|
|
|
|
|
|
|
|
|
|
|
|
|
|
|
|
|
|
|
Year Ended December 31, 2023 |
| (In thousands, except for per ton data) |
Met |
|
All Other |
|
Consolidated |
| Coal revenues |
$ |
3,406,643 |
|
|
$ |
49,987 |
|
|
$ |
3,456,630 |
|
| Less: Freight and handling fulfillment revenues |
(438,783) |
|
|
(227) |
|
|
(439,010) |
|
| Non-GAAP Coal revenues |
$ |
2,967,860 |
|
|
$ |
49,760 |
|
|
$ |
3,017,620 |
|
| Tons sold |
16,543 |
|
|
529 |
|
|
17,072 |
|
| Non-GAAP Coal sales realization per ton |
$ |
179.40 |
|
|
$ |
94.06 |
|
|
$ |
176.76 |
|
|
|
|
|
|
|
| Cost of coal sales (exclusive of items shown separately below) |
$ |
2,303,129 |
|
|
$ |
53,009 |
|
|
$ |
2,356,138 |
|
Depreciation, depletion and amortization - production (1) |
125,716 |
|
|
9,952 |
|
|
135,668 |
|
| Accretion on asset retirement obligations |
14,886 |
|
|
10,614 |
|
|
25,500 |
|
| Amortization of acquired intangibles, net |
8,523 |
|
|
— |
|
|
8,523 |
|
| Total Cost of coal sales |
$ |
2,452,254 |
|
|
$ |
73,575 |
|
|
$ |
2,525,829 |
|
| Less: Freight and handling costs |
(438,783) |
|
|
(227) |
|
|
(439,010) |
|
Less: Depreciation, depletion and amortization - production (1) |
(125,716) |
|
|
(9,952) |
|
|
(135,668) |
|
| Less: Accretion on asset retirement obligations |
(14,886) |
|
|
(10,614) |
|
|
(25,500) |
|
| Less: Amortization of acquired intangibles, net |
(8,523) |
|
|
— |
|
|
(8,523) |
|
| Less: Idled and closed mine costs |
(16,983) |
|
|
(10,015) |
|
|
(26,998) |
|
| Non-GAAP Cost of coal sales |
$ |
1,847,363 |
|
|
$ |
42,767 |
|
|
$ |
1,890,130 |
|
| Tons sold |
16,543 |
|
|
529 |
|
|
17,072 |
|
| Non-GAAP Cost of coal sales per ton |
$ |
111.67 |
|
|
$ |
80.84 |
|
|
$ |
110.72 |
|
(1) Depreciation, depletion and amortization - production excludes the depreciation, depletion and amortization related to selling, general and administrative functions.
|
|
|
|
|
|
|
|
|
|
|
|
|
|
|
|
|
|
|
Year Ended December 31, 2023 |
| (In thousands, except for per ton data) |
Met |
|
All Other |
|
Consolidated |
| Coal revenues |
$ |
3,406,643 |
|
|
$ |
49,987 |
|
|
$ |
3,456,630 |
|
| Less: Total Cost of coal sales (per table above) |
(2,452,254) |
|
|
(73,575) |
|
|
(2,525,829) |
|
| GAAP Coal margin |
$ |
954,389 |
|
|
$ |
(23,588) |
|
|
$ |
930,801 |
|
| Tons sold |
16,543 |
|
|
529 |
|
|
17,072 |
|
| GAAP Coal margin per ton |
$ |
57.69 |
|
|
$ |
(44.59) |
|
|
$ |
54.52 |
|
|
|
|
|
|
|
| GAAP Coal margin |
$ |
954,389 |
|
|
$ |
(23,588) |
|
|
$ |
930,801 |
|
Add: Depreciation, depletion and amortization - production (1) |
125,716 |
|
|
9,952 |
|
|
135,668 |
|
| Add: Accretion on asset retirement obligations |
14,886 |
|
|
10,614 |
|
|
25,500 |
|
| Add: Amortization of acquired intangibles, net |
8,523 |
|
|
— |
|
|
8,523 |
|
| Add: Idled and closed mine costs |
16,983 |
|
|
10,015 |
|
|
26,998 |
|
| Non-GAAP Coal margin |
$ |
1,120,497 |
|
|
$ |
6,993 |
|
|
$ |
1,127,490 |
|
| Tons sold |
16,543 |
|
|
529 |
|
|
17,072 |
|
| Non-GAAP Coal margin per ton |
$ |
67.73 |
|
|
$ |
13.22 |
|
|
$ |
66.04 |
|
(1) Depreciation, depletion and amortization - production excludes the depreciation, depletion and amortization related to selling, general and administrative functions.
|
|
|
|
|
|
|
|
|
|
|
|
|
|
|
|
|
|
|
Year Ended December 31, 2022 |
| (In thousands, except for per ton data) |
Met |
|
All Other |
|
Consolidated |
| Coal revenues |
$ |
4,018,515 |
|
|
$ |
74,472 |
|
|
$ |
4,092,987 |
|
| Less: Freight and handling fulfillment revenues |
(529,043) |
|
|
(20) |
|
|
(529,063) |
|
| Non-GAAP Coal revenues |
$ |
3,489,472 |
|
|
$ |
74,452 |
|
|
$ |
3,563,924 |
|
| Tons sold |
15,478 |
|
|
900 |
|
|
16,378 |
|
| Non-GAAP Coal sales realization per ton |
$ |
225.45 |
|
|
$ |
82.72 |
|
|
$ |
217.60 |
|
|
|
|
|
|
|
| Cost of coal sales (exclusive of items shown separately below) |
$ |
2,225,771 |
|
|
$ |
60,198 |
|
|
$ |
2,285,969 |
|
Depreciation, depletion and amortization - production (1) |
100,584 |
|
|
6,036 |
|
|
106,620 |
|
| Accretion on asset retirement obligations |
13,590 |
|
|
10,175 |
|
|
23,765 |
|
| Amortization of acquired intangibles, net |
15,699 |
|
|
3,799 |
|
|
19,498 |
|
| Total Cost of coal sales |
$ |
2,355,644 |
|
|
$ |
80,208 |
|
|
$ |
2,435,852 |
|
| Less: Freight and handling costs |
(529,043) |
|
|
(20) |
|
|
(529,063) |
|
Less: Depreciation, depletion and amortization - production (1) |
(100,584) |
|
|
(6,036) |
|
|
(106,620) |
|
| Less: Accretion on asset retirement obligations |
(13,590) |
|
|
(10,175) |
|
|
(23,765) |
|
| Less: Amortization of acquired intangibles, net |
(15,699) |
|
|
(3,799) |
|
|
(19,498) |
|
| Less: Idled and closed mine costs |
(21,646) |
|
|
(6,911) |
|
|
(28,557) |
|
| Non-GAAP Cost of coal sales |
$ |
1,675,082 |
|
|
$ |
53,267 |
|
|
$ |
1,728,349 |
|
| Tons sold |
15,478 |
|
|
900 |
|
|
16,378 |
|
| Non-GAAP Cost of coal sales per ton |
$ |
108.22 |
|
|
$ |
59.19 |
|
|
$ |
105.53 |
|
(1) Depreciation, depletion and amortization - production excludes the depreciation, depletion and amortization related to selling, general and administrative functions.
|
|
|
|
|
|
|
|
|
|
|
|
|
|
|
|
|
|
|
Year Ended December 31, 2022 |
| (In thousands, except for per ton data) |
Met |
|
All Other |
|
Consolidated |
| Coal revenues |
$ |
4,018,515 |
|
|
$ |
74,472 |
|
|
$ |
4,092,987 |
|
| Less: Total Cost of coal sales (per table above) |
(2,355,644) |
|
|
(80,208) |
|
|
(2,435,852) |
|
| GAAP Coal margin |
$ |
1,662,871 |
|
|
$ |
(5,736) |
|
|
$ |
1,657,135 |
|
| Tons sold |
15,478 |
|
|
900 |
|
|
16,378 |
|
| GAAP Coal margin per ton |
$ |
107.43 |
|
|
$ |
(6.37) |
|
|
$ |
101.18 |
|
|
|
|
|
|
|
| GAAP Coal margin |
$ |
1,662,871 |
|
|
$ |
(5,736) |
|
|
$ |
1,657,135 |
|
Add: Depreciation, depletion and amortization - production (1) |
100,584 |
|
|
6,036 |
|
|
106,620 |
|
| Add: Accretion on asset retirement obligations |
13,590 |
|
|
10,175 |
|
|
23,765 |
|
| Add: Amortization of acquired intangibles, net |
15,699 |
|
|
3,799 |
|
|
19,498 |
|
| Add: Idled and closed mine costs |
21,646 |
|
|
6,911 |
|
|
28,557 |
|
| Non-GAAP Coal margin |
$ |
1,814,390 |
|
|
$ |
21,185 |
|
|
$ |
1,835,575 |
|
| Tons sold |
15,478 |
|
|
900 |
|
|
16,378 |
|
| Non-GAAP Coal margin per ton |
$ |
117.22 |
|
|
$ |
23.54 |
|
|
$ |
112.08 |
|
(1) Depreciation, depletion and amortization - production excludes the depreciation, depletion and amortization related to selling, general and administrative functions.
|
|
|
|
|
|
|
|
|
|
|
|
|
|
|
|
|
|
|
|
|
|
|
|
|
Year Ended December 31, |
|
Increase (Decrease) |
| (In thousands, except for per ton data) |
2023 |
|
2022 |
|
$ or Tons |
|
% |
| Met segment operations: |
|
|
|
|
|
|
|
| Tons sold |
16,543 |
|
|
15,478 |
|
|
1,065 |
|
|
6.9 |
% |
| Non-GAAP Coal revenues |
$ |
2,967,860 |
|
|
$ |
3,489,472 |
|
|
$ |
(521,612) |
|
|
(14.9) |
% |
| Non-GAAP Coal sales realization per ton |
$ |
179.40 |
|
|
$ |
225.45 |
|
|
$ |
(46.05) |
|
|
(20.4) |
% |
|
|
|
|
|
|
|
|
| All Other category: |
|
|
|
|
|
|
|
| Tons sold |
529 |
|
|
900 |
|
|
(371) |
|
|
(41.2) |
% |
| Non-GAAP Coal revenues |
$ |
49,760 |
|
|
$ |
74,452 |
|
|
$ |
(24,692) |
|
|
(33.2) |
% |
| Non-GAAP Coal sales realization per ton |
$ |
94.06 |
|
|
$ |
82.72 |
|
|
$ |
11.34 |
|
|
13.7 |
% |
Non-GAAP Coal revenues. Met segment operations non-GAAP coal revenues decreased $521.6 million, or 14.9%, for the year ended December 31, 2023 compared to the prior year period. The decrease was primarily due to a $46.05, or 20.4%, reduction in average non-GAAP coal sales realization as prices moderated from the higher levels experienced during the prior year period, partially offset by a 6.9% increase in Met coal sales volumes. The elevated coal sales pricing environment in the prior year period was driven by increased coal demand, resulting from improved economic activity, coupled with limited supply response.
All Other category non-GAAP coal revenues decreased $24.7 million, or 33.2%, for the year ended December 31, 2023 compared to the prior year period primarily due to a decline in coal sales volumes with the closure of Slabcamp, which was our last remaining thermal mine, in August of 2023.
|
|
|
|
|
|
|
|
|
|
|
|
|
|
|
|
|
|
|
|
|
|
|
|
|
Year Ended December 31, |
|
Increase (Decrease) |
| (In thousands, except for per ton data) |
2023 |
|
2022 |
|
$ |
|
% |
| Met segment operations: |
|
|
|
|
|
|
|
| Non-GAAP Cost of coal sales |
$ |
1,847,363 |
|
|
$ |
1,675,082 |
|
|
$ |
172,281 |
|
|
10.3 |
% |
| Non-GAAP Cost of coal sales per ton |
$ |
111.67 |
|
|
$ |
108.22 |
|
|
$ |
3.45 |
|
|
3.2 |
% |
| Non-GAAP Coal margin per ton |
$ |
67.73 |
|
|
$ |
117.22 |
|
|
$ |
(49.49) |
|
|
(42.2) |
% |
|
|
|
|
|
|
|
|
| All Other category: |
|
|
|
|
|
|
|
| Non-GAAP Cost of coal sales |
$ |
42,767 |
|
|
$ |
53,267 |
|
|
$ |
(10,500) |
|
|
(19.7) |
% |
| Non-GAAP Cost of coal sales per ton |
$ |
80.84 |
|
|
$ |
59.19 |
|
|
$ |
21.65 |
|
|
36.6 |
% |
| Non-GAAP Coal margin per ton |
$ |
13.22 |
|
|
$ |
23.54 |
|
|
$ |
(10.32) |
|
|
(43.8) |
% |
Non-GAAP cost of coal sales. Met segment operations non-GAAP cost of coal sales increased $172.3 million, or 10.3%, for the year ended December 31, 2023 compared to the prior year period. The increase was primarily driven by a 6.9% increase in Met coal sales volumes combined with a 3.2% increase in average non-GAAP cost of coal sales per ton. The increase in average non-GAAP cost of coal sales per ton was primarily driven by inflationary pressures and increased levels of coal purchases, partially offset by lower royalties and taxes as a result of a lower coal pricing environment.
All Other category non-GAAP cost of coal sales decreased $10.5 million, or 19.7%, for the year ended December 31, 2023 compared to the prior year period primarily due to the closure of Slabcamp, which was our last remaining thermal mine, in August of 2023.
Adjusted EBITDA
The following tables present a reconciliation of net income (loss) to Adjusted EBITDA for the years ended December 31, 2023 and 2022:
|
|
|
|
|
|
|
|
|
|
|
|
|
|
|
|
|
|
|
Year Ended December 31, 2023 |
| (In thousands) |
Met |
|
All Other |
|
Consolidated |
| Net income (loss) |
$ |
938,495 |
|
|
$ |
(216,539) |
|
|
$ |
721,956 |
|
| Interest expense |
731 |
|
|
6,192 |
|
|
6,923 |
|
| Interest income |
(644) |
|
|
(11,289) |
|
|
(11,933) |
|
| Income tax expense |
— |
|
|
123,503 |
|
|
123,503 |
|
| Depreciation, depletion and amortization |
125,716 |
|
|
11,153 |
|
|
136,869 |
|
| Non-cash stock compensation expense |
96 |
|
|
18,921 |
|
|
19,017 |
|
| Loss on extinguishment of debt |
— |
|
|
2,753 |
|
|
2,753 |
|
| Accretion on asset retirement obligations |
14,886 |
|
|
10,614 |
|
|
25,500 |
|
| Amortization of acquired intangibles, net |
8,523 |
|
|
— |
|
|
8,523 |
|
| Adjusted EBITDA |
$ |
1,087,803 |
|
|
$ |
(54,692) |
|
|
$ |
1,033,111 |
|
|
|
|
|
|
|
|
|
|
|
|
|
|
|
|
|
|
|
|
Year Ended December 31, 2022 |
| (In thousands) |
Met |
|
All Other |
|
Consolidated |
| Net income (loss) |
$ |
1,647,104 |
|
|
$ |
(198,559) |
|
|
$ |
1,448,545 |
|
| Interest expense |
202 |
|
|
21,600 |
|
|
21,802 |
|
| Interest income |
(541) |
|
|
(2,646) |
|
|
(3,187) |
|
| Income tax expense |
— |
|
|
106,205 |
|
|
106,205 |
|
| Depreciation, depletion and amortization |
100,584 |
|
|
7,036 |
|
|
107,620 |
|
| Non-cash stock compensation expense |
4 |
|
|
7,480 |
|
|
7,484 |
|
| Mark-to-market adjustment - acquisition-related obligations |
— |
|
|
8,880 |
|
|
8,880 |
|
| Accretion on asset retirement obligations |
13,590 |
|
|
10,175 |
|
|
23,765 |
|
| Amortization of acquired intangibles, net |
15,699 |
|
|
3,799 |
|
|
19,498 |
|
| Adjusted EBITDA |
$ |
1,776,642 |
|
|
$ |
(36,030) |
|
|
$ |
1,740,612 |
|
The following table summarizes Adjusted EBITDA for our Met segment operations and All Other category:
|
|
|
|
|
|
|
|
|
|
|
|
|
|
|
|
|
|
|
|
|
|
|
|
|
Year Ended December 31, |
|
Increase (Decrease) |
| (In thousands) |
2023 |
|
2022 |
|
$ |
|
% |
| Adjusted EBITDA |
|
|
|
|
|
|
|
| Met operations |
$ |
1,087,803 |
|
|
$ |
1,776,642 |
|
|
$ |
(688,839) |
|
|
(38.8) |
% |
| All Other |
(54,692) |
|
|
(36,030) |
|
|
(18,662) |
|
|
(51.8) |
% |
| Total |
$ |
1,033,111 |
|
|
$ |
1,740,612 |
|
|
$ |
(707,501) |
|
|
(40.6) |
% |
Met segment operations. Adjusted EBITDA decreased $688.8 million, or 38.8%, for the year ended December 31, 2023 compared to the prior year period. The decrease in Adjusted EBITDA was primarily driven by decreased coal margin and lower non-GAAP coal sales realization per ton in the current period.
All Other category. Adjusted EBITDA decreased $18.7 million, or 51.8%, for the year ended December 31, 2023 compared to the prior year period. The decrease in Adjusted EBITDA was primarily driven by a decrease in tons sold and decreased coal margin, partially offset by higher non-GAAP coal sales realization per ton in the current period.
Liquidity and Capital Resources
Overview
Our primary sources of liquidity are derived from existing unrestricted cash balances, proceeds from future coal sales, and amounts available under our revolving credit agreement. Our primary capital resource requirements stem from the cost of our coal production and purchases, selling and administrative expenses, taxes, capital expenditures, debt service obligations, reclamation obligations, and collateral requirements.
We believe that cash on hand and cash generated from our operations will be sufficient to meet our working capital, anticipated capital expenditure, income tax, debt service, collateral and reclamation obligations requirements for the next 12 months and the reasonably foreseeable future. We may also use cash in accordance with our share repurchase program. We rely on a number of assumptions in budgeting for our future activities. These include the costs for mine development to sustain capacity of our operating mines, our cash flows from operations, effects of regulation and taxes by governmental agencies, mining technology improvements and reclamation costs. These assumptions are inherently subject to significant business, political, economic, regulatory, environmental and competitive uncertainties, pending and existing climate-related initiatives, contingencies and risks, all of which are difficult to predict and many of which are beyond our control. For example, if the new authorization process for all self-insured coal mine operators is adopted, it would substantially increase the collateral required to secure our self-insured federal black lung obligations. Refer to the DCMWC Reauthorization Process section below for more information. Increased scrutiny of ESG matters specific to the coal sector could negatively influence our ability to raise capital in the future and result in a reduced number of surety and insurance providers. We may need to raise additional funds if market conditions deteriorate, if one or more of our assumptions prove to be incorrect or if we choose to expand our acquisition or development efforts or any other activity more rapidly than we presently anticipate and we may not be able to do so in a timely fashion, on terms acceptable to us, or at all. Additionally, we may elect to raise additional funds before we need them if the conditions for raising capital are favorable. We may seek to sell equity or debt securities or obtain additional bank credit facilities. The sale of equity securities could result in dilution to our stockholders. The incurrence of additional indebtedness could result in increased fixed obligations and additional covenants that could restrict our operations.
Liquidity
The following table summarizes our total liquidity as of December 31, 2023:
|
|
|
|
|
|
(in thousands) |
December 31, 2023 |
| Cash and cash equivalents |
$ |
268,207 |
|
Credit facility availability (1) |
94,104 |
|
| Minimum liquidity requirement |
(75,000) |
|
| Total liquidity |
$ |
287,311 |
|
(1) Comprised of our unused commitments available under our New ABL Agreement after considering $60.9 million of outstanding LCs, subject to limitations described therein.
Cash Collateral
We are required to provide cash collateral to secure our obligations under certain worker’s compensation, black lung, reclamation-related obligations, financial payments and other performance obligations, and other operating agreements. Future regulatory changes relating to these obligations could result in increased obligations, additional costs, or additional collateral requirements which could require greater use of alternative sources of funding for this purpose, which would reduce our liquidity. Refer to the DCMWC Reauthorization Process section below for information related to the new authorization process for self-insured coal mine operators being implemented by the U.S. Department of Labor (Division of Coal Mine Workers’ Compensation). As of December 31, 2023, we had the following cash collateral on our Consolidated Balance Sheets:
|
|
|
|
|
|
(in thousands) |
December 31, 2023 |
| Long-term restricted cash |
$ |
115,918 |
|
| Long-term restricted investments |
40,597 |
|
| Short-term and long-term deposits |
5,382 |
|
| Total cash collateral |
$ |
161,897 |
|
Off-Balance Sheet Arrangements
We are required to provide financial assurance in order to perform the post-mining reclamation required by our mining permits, pay workers’ compensation claims under workers’ compensation laws in various states, pay federal black lung benefits, and perform certain other obligations. In order to provide the required financial assurance, we generally use surety bonds for post-mining reclamation and workers’ compensation obligations. We also use bank LCs to collateralize certain obligations. As of December 31, 2023, we had the following outstanding surety bonds and LCs:
|
|
|
|
|
|
(in thousands) |
December 31, 2023 |
| Surety bonds |
$ |
177,109 |
|
Letters of credit (1) |
$ |
60,896 |
|
(1) The LCs outstanding are under the New ABL Agreement dated October 27, 2023.
Refer to Note 21, part (c) for further disclosures on off-balance sheet arrangements.
Debt Financing and Related Transactions
On October 27, 2023, we terminated our existing ABL Agreement and entered into a New ABL Agreement. Under the New ABL Facility, we may borrow cash or obtain LCs, on a revolving basis, in an aggregate amount of up to $155.0 million. We may request an increase to the capacity of the facility of up to $75.0 million provided that $25.0 million may be solely for the purpose of providing additional availability to obtain cash collateralized LCs. Availability under the New ABL Facility is calculated monthly and fluctuates based on qualifying amounts of coal inventory and trade accounts receivable (the “Borrowing Base”). Generally, under the terms of the New ABL Facility, to the extent outstanding borrowings and LC’s exceed the Borrowing Base, the specified amount of cash would be restricted and used to collateralize any excess outstanding amounts. The New ABL Facility matures on October 27, 2027.
Refer to Note 13 for additional disclosures on long-term debt.
Acquisition-Related Obligations
During the first quarter of 2023, we paid the final calculated payment pursuant to terms of the Contingent Revenue Obligation. At December 31, 2023, we had no acquisition-related obligations outstanding. Refer to Note 14 for additional disclosures on acquisition-related obligations.
Capital Requirements
Our capital expenditures for the year ended December 31, 2023 were $245.4 million. We expect to spend between $210.0 million and $240.0 million on capital expenditures during 2024. At the midpoint of guidance, this total includes approximately $171 million in sustaining maintenance capital, approximately $33 million in planned projects to invest in mine development, and approximately $21 million in carryover from 2023 due to timing and availability of supplies and contract labor.
Contractual Obligations
The following is a summary of our significant contractual obligations as of December 31, 2023:
|
|
|
|
|
|
|
|
|
|
|
|
|
|
|
|
|
|
|
|
|
|
|
|
|
|
|
|
|
|
|
|
|
|
|
|
|
|
|
|
|
|
(in thousands) |
2024 |
|
2025 |
|
2026 |
|
2027 |
|
2028 |
|
After 2028 |
|
Total |
| Minimum royalties |
$ |
14,357 |
|
|
$ |
14,394 |
|
|
$ |
13,160 |
|
|
$ |
11,901 |
|
|
$ |
11,851 |
|
|
$ |
89,025 |
|
|
$ |
154,688 |
|
| Coal purchase commitments |
236,848 |
|
|
— |
|
|
— |
|
|
— |
|
|
— |
|
|
— |
|
|
236,848 |
|
Unconditional purchase obligations (1) |
251,038 |
|
|
66,675 |
|
|
— |
|
|
— |
|
|
— |
|
|
— |
|
|
317,713 |
|
| Total |
$ |
502,243 |
|
|
$ |
81,069 |
|
|
$ |
13,160 |
|
|
$ |
11,901 |
|
|
$ |
11,851 |
|
|
$ |
89,025 |
|
|
$ |
709,249 |
|
(1) Includes contractual commitments related to the purchase of equipment, diesel fuel, and electricity as well as for rail freight and export terminal costs, including approximately $48.4 million in 2024 for expected DTA funding. See below for further discussion.
Additionally, we have long-term liabilities relating to asset retirement obligations, pension benefits, black lung benefits, postretirement life insurance benefits, and workers’ compensation benefits. The table below reflects the estimated undiscounted cash flows for these obligations:
|
|
|
|
|
|
|
|
|
|
|
|
|
|
|
|
|
|
|
|
|
|
|
|
|
|
|
|
|
|
|
|
|
|
|
|
|
|
|
|
|
|
| (in thousands) |
2024 |
|
2025 |
|
2026 |
|
2027 |
|
2028 |
|
After 2028 |
|
Total |
| Asset retirement obligation |
$ |
39,888 |
|
|
$ |
36,295 |
|
|
$ |
28,783 |
|
|
$ |
37,462 |
|
|
$ |
39,623 |
|
|
$ |
304,521 |
|
|
$ |
486,572 |
|
Pension benefit obligation (1) |
31,491 |
|
|
31,496 |
|
|
31,392 |
|
|
31,333 |
|
|
31,180 |
|
|
852,913 |
|
|
1,009,805 |
|
| Black lung benefit obligation |
10,687 |
|
|
10,301 |
|
|
10,082 |
|
|
9,937 |
|
|
9,857 |
|
|
177,711 |
|
|
228,575 |
|
| Postretirement life insurance benefit obligation |
613 |
|
|
607 |
|
|
602 |
|
|
601 |
|
|
603 |
|
|
12,922 |
|
|
15,948 |
|
| Workers’ compensation benefit obligation |
8,661 |
|
|
5,990 |
|
|
5,162 |
|
|
4,632 |
|
|
4,363 |
|
|
56,898 |
|
|
85,706 |
|
| Total |
$ |
91,340 |
|
|
$ |
84,689 |
|
|
$ |
76,021 |
|
|
$ |
83,965 |
|
|
$ |
85,626 |
|
|
$ |
1,404,965 |
|
|
$ |
1,826,606 |
|
(1) The estimated undiscounted cash flows are expected to be paid from the defined benefit pension plan assets held within the defined benefit pension plan trust. Refer to Note 18 for further disclosures related to this obligation.
Business Updates
On August 3, 2023, S&P Global Ratings upgraded its issuer credit rating on the Company to B+ from B based on the strength of our balance sheet. The rating outlook was noted as stable. On November 6, 2023, S&P Global Ratings affirmed our B+ issuer credit rating and stable rating outlook on the New ABL Facility. On July 18, 2023, Moody’s Investors Service upgraded our Corporate Family Rating to B1 from B2, upgraded our Probability of Default Rating to B1-PD from B2-PD, and affirmed our B1 rating on the ABL Facility. Our Speculative Grade Liquidity Rating remained unchanged at SGL-2. The rating outlook was revised to stable from positive. On November 3, 2023, Moody’s Investors Service maintained our B1 Corporate Family Rating, B1-PD Probability of Default Rating, and SGL-2 Speculative Grade Liquidity Rating, and affirmed our B1 rating on the New ABL Facility. Should we receive any negative outlook ratings in the future, such negative outlook ratings would result in potential liquidity risks for us, including the risks of declines in our stock value, declines in our cash and cash equivalents, less availability and higher costs of additional credit, and requests for additional collateral by surety providers.
We own a 65.0% interest in DTA, a coal export terminal in Newport News, Virginia. DTA provides us with the ability to fulfill a broad range of customer coal quality requirements through coal blending, while also providing storage capacity and transportation flexibility. DTA is in need of capital investment to maximize functionality and minimize downtime due to mechanical issues. Under the terms of our partnership related agreements with respect to our investment in DTA, we are required to fund our proportionate share of DTA’s ongoing operating and capital costs. Beyond our share of routine operating costs, we expect we will invest up to an incremental $25.0 million per year for infrastructure and equipment upgrades at DTA over the next 6 years. Our 2024 funding of DTA (including routine operating and capital costs and infrastructure and equipment upgrades) is expected to total approximately $48.4 million.
We continually strive to enhance our capital structure and financial flexibility. As opportunities arise, we will continue to consider the possibility of refinancing or repayment of any outstanding debt and amendment of our credit facility, and may consider the sale of other assets or businesses, and such other measures as we believe circumstances warrant. We may decide to pursue or not pursue these opportunities at any time. Access to additional funds from liquidity-generating transactions or other sources of external financing is subject to market conditions and certain limitations, including our credit rating and covenant restrictions in our credit facilities.
As a regular part of our business, we review opportunities for, and engage in discussions and negotiations concerning, the acquisition or disposition of coal mining and related infrastructure assets and interests in coal mining companies, and acquisitions or dispositions of, or combinations or other strategic transactions involving companies with coal mining or other energy assets. When we believe that these opportunities are consistent with our strategic plans and our acquisition or disposition criteria, we will make bids or proposals and/or enter into letters of intent and other similar agreements. These bids or proposals, which may be binding or non-binding, are customarily subject to a variety of conditions and usually permit us to terminate the discussions and any related agreement if, among other things, we are not satisfied with the results of due diligence. Any acquisition opportunities we pursue could materially affect our liquidity and capital resources and may require us to incur indebtedness, seek equity capital or both. There can be no assurance that additional financing will be available on terms acceptable to us, or at all.
Income Taxes
During the year ended December 31, 2023, we paid federal and state income taxes of $79.2 million. Refer to Note 17 for further income tax disclosures.
Pension Plan
We sponsored three qualified non-contributory pension plans (“Pension Plans”) which covered certain salaried and non-union hourly employees. Effective as of December 31, 2023, the assets and liabilities of the Pension Plans were merged into one qualified non-contributory defined benefit pension plan (“Pension Plan”). Participants accrued benefits either based on certain formulas, the participant’s compensation prior to retirement or plan specified amounts for each year of service. Benefits are frozen under the Pension Plan. Annual funding contributions to the Pension Plan are made as recommended by consulting actuaries based upon the Employee Retirement Income Security Act of 1974, as amended (“ERISA”) funding standards. Funding decisions also consider certain funded status thresholds defined by the Pension Protection Act of 2006. We contributed $25.0 million to the Pension Plan in 2023 and expect to contribute $25.0 million in 2024, including amounts above the estimated minimum required contributions for the respective plan years. Refer to Note 18 for further disclosures related to the Pension Plan and the related obligation.
DCMWC Reauthorization Process
In July 2019, the U.S. Department of Labor (Division of Coal Mine Workers’ Compensation or “DCMWC”) began implementing a new authorization process for all self-insured coal mine operators. As requested by DCMWC, we filed an application and supporting documentation for reauthorization to self-insure certain of our black lung obligations in October 2019. As a result of this application, the DCMWC notified us in a letter dated February 21, 2020 that we were reauthorized to self-insure certain of our black lung obligations for a period of one-year from February 21, 2020. The DCMWC reauthorization was contingent, however, upon us providing collateral of $65.7 million to secure certain of our black lung obligations. This collateral requirement, which the DCMWC advises represents 70% of our estimated future liability according to the DCMWC’s estimation methodology, would have been an increase of approximately 2,400% from the approximately $2.6 million in collateral which we (previously by Alpha Natural Resources Inc. prior to the Merger) have provided since 2016 to secure these self-insured black lung obligations. Future liability has not previously been estimated by the DCMWC in connection with the reauthorization process but is now being considered as part of its new collateral-setting methodology.
The reauthorization process provided us with the right to appeal the security determination in writing within 30 days of the date of the notification, which appeal period the DCMWC agreed to extend to May 22, 2020, and we exercised this right of appeal. We strongly disagree with the DCMWC’s substantially higher collateral determination and the methodology through which the calculation was derived. In February 2021, the U.S. Department of Labor (“DOL”) withdrew its Federal Register notice seeking comments on its bulletin describing its new method of calculating collateral requirements. The DOL removed the bulletin from its website in May 2021. On February 10, 2022, a telephone conference was held with DCMWC and DOL decision makers wherein we presented facts and arguments in support of our appeal. No ruling has been made on the appeal, but during the call we indicated that we would be willing to allocate an additional $10.0 million in collateral. If our appeal is unsuccessful, we may be required to provide additional LCs in order to receive self-insurance reauthorization from the DCMWC or insure these black lung obligations through a third-party provider, which would likely also require us to provide additional collateral. In January 2023, the DOL proposed for public comment new regulations which, if adopted, would substantially increase the collateral required to secure self-insured federal black lung obligations. Under the proposed 120% minimum collateral requirement, we estimate we could be required to provide approximately $80.0 million to $100.0 million of collateral to secure certain of our black lung obligations. The DOL has indicated that it expects that some form of these new regulations could go into effect in the first quarter or early second quarter of 2024. A significant increase in these collateral obligations could have a materially adverse effect on our liquidity.
Share Repurchase Program
Refer to Note 7 and “Market for Registrant’s Common Equity, Related Stockholder Matters and Issuer Purchases of Equity Securities” for information on the share repurchase program and the shares repurchased during the current period.
Dividend Program
Refer to Note 7 for information related to our dividend program.
Cash Flows
Cash, cash equivalents, and restricted cash increased by $28.7 million and $172.8 million and decreased by $62.0 million over the years ended December 31, 2023, 2022, and 2021, respectively. The net change in cash, cash equivalents, and restricted cash was attributable to the following:
|
|
|
|
|
|
|
|
|
|
|
|
|
|
|
|
|
|
|
Year Ended December 31, |
|
2023 |
|
2022 |
|
2021 |
| Cash flows (in thousands): |
|
|
|
|
|
| Net cash provided by operating activities |
$ |
851,159 |
|
|
$ |
1,484,005 |
|
|
$ |
174,943 |
|
| Net cash used in investing activities |
(166,000) |
|
|
(329,357) |
|
|
(89,855) |
|
| Net cash used in financing activities |
(656,428) |
|
|
(981,868) |
|
|
(147,045) |
|
| Net increase (decrease) in cash and cash equivalents and restricted cash |
$ |
28,731 |
|
|
$ |
172,780 |
|
|
$ |
(61,957) |
|
Operating Activities. The decrease in net cash provided by operating activities for the year ended December 31, 2023 compared to the year ended December 31, 2022 was primarily attributable to lower coal sale realizations, increased operating costs due to inflationary pressures, and increased levels of coal purchases, partially offset by lower royalties and taxes as a result of the lower coal pricing environment.
The increase in net cash provided by operating activities for the year ended December 31, 2022 compared to the year ended December 31, 2021 was primarily attributable to the improvement in our results from operations as discussed in “Management’s Discussion and Analysis of Financial Condition and Results of Operations—Results of Operations” in Part II, Item 7 of our Annual Report on Form 10-K for the year ended December 31, 2022, primarily offset by an increase in deposits related to our January 2023 dividend payment and payments on operating liabilities.
Investing Activities. The decrease in net cash used in investing activities for the year ended December 31, 2023 compared to the year ended December 31, 2022 was primarily driven by increased cash flows from net sales and maturities of investment securities, partially offset by increased capital expenditures.
The increase in net cash used in investing activities for the year ended December 31, 2022 compared to the year ended December 31, 2021 was primarily driven by increases in net purchases of investment securities and capital expenditures. In addition, we purchased substantially all of the assets of a mining equipment component manufacturing and rebuilding business (refer to Note 2 for further information).
Financing Activities. The decrease in net cash used in financing activities for the year ended December 31, 2023 compared to the year ended December 31, 2022 was primarily driven by decreases in principal repayments of long-term debt as a result of the payoff of the Term Loan Credit Facility in the prior year period, partially offset by increases in dividend and dividend equivalents paid which included the payment of a one time dividend of $5.00 per share in 2023 and common stock repurchases under our share repurchase program during the current period.
The increase in net cash used in financing activities for the year ended December 31, 2022 compared to the year ended December 31, 2021 was primarily driven by the voluntary prepayments of our remaining outstanding principal borrowings under the Term Loan Credit Facility and the common stock repurchases under our share repurchase program during 2022.
Analysis of Material Debt Covenants
We are in compliance with all covenants under the New ABL Agreement, as of December 31, 2023, including the requirement that we maintain minimum liquidity, as defined in the New ABL Agreement, of $75.0 million. A breach of the covenants in the New ABL Agreement could result in a default under the terms of such agreement, and the respective lenders could then elect to declare any amounts borrowed due and payable and require outstanding LCs to be cash collateralized. In addition, a default under the terms of would inhibit our ability to make certain restricted payments, as defined in the New ABL Agreement, including the Company’s ability to repurchase shares of the Company’s common stock.
Critical Accounting Policies and Estimates
The preparation of financial statements in accordance with GAAP requires management to make estimates and assumptions that affect reported amounts of assets, liabilities, revenues and expenses, and related disclosure of contingent assets and liabilities.
We base our estimates on historical experience and on various other factors and assumptions, including the current economic environment, that we believe are reasonable under the circumstances, the results of which form the basis for making judgments about the carrying values of assets and liabilities that are not readily apparent from other sources. We evaluate our estimates and assumptions on an ongoing basis and adjust such estimates and assumptions as facts and circumstances require. Foreign currency and energy markets, and fluctuations in demand for steel products have combined to increase the uncertainty inherent in such estimates and assumptions. As future events and their effects cannot be determined with precision, actual results may differ significantly from these estimates. Changes in these estimates resulting from continuing changes in the economic environment will be reflected in the financial statements in future periods.
Reclamation. Our asset retirement obligations arise from the federal Surface Mining Control and Reclamation Act of 1977 and similar state statutes, which require that mine property be restored in accordance with specified standards and an approved reclamation plan. Significant reclamation activities include reclaiming refuse and slurry ponds, reclaiming the pit and support acreage at surface mines, sealing portals at deep mines, and the treatment of water. We determine the future cash flows necessary to satisfy our reclamation obligations on a permit-by-permit basis based upon current permit requirements and various estimates and assumptions, including estimates of disturbed acreage, cost estimates, and assumptions regarding productivity. We are also faced with increasingly stringent environmental regulation, much of which is beyond our control, which could increase our costs and materially increase our asset retirement obligations. Estimates of disturbed acreage are determined based on approved mining plans and related engineering data. Cost estimates are based upon third-party costs. Productivity assumptions are based on historical experience with the equipment that is expected to be utilized in the reclamation activities. Our asset retirement obligations are initially recorded at fair value. In order to determine fair value, we use assumptions including a discount rate and third-party margin. Each is discussed further below:
•Discount Rate. Asset retirement obligations are initially recorded at fair value. We utilize discounted cash flow techniques to estimate the fair value of our obligations. We base our discount rate on the rates of treasury bonds with maturities similar to expected mine lives and adjust for our credit standing as necessary after considering funding and assurance provisions. Changes in our credit standing could have a material impact on our asset retirement obligations.
•Third-Party Margin. The measurement of an obligation at fair value is based upon the amount a third party would demand to perform the obligation. Because we plan to perform a significant amount of the reclamation activities with internal resources, a third-party margin was added to the estimated costs of these activities. This margin was estimated based upon our historical experience with contractors performing similar types of reclamation activities. The inclusion of this margin will result in a recorded obligation that is greater than our estimates of our cost to perform the reclamation activities. If our cost estimates are accurate, the excess of the recorded obligation over the cost incurred to perform the work will be recorded as a reduction to Depreciation, depletion and amortization within our Consolidated Statements of Operations at the time that reclamation work is completed.
On at least an annual basis, we review our reclamation liabilities and make necessary adjustments for permit changes as granted by state authorities, additional costs resulting from accelerated mine closures, and revisions to cost estimates and productivity assumptions to reflect current experience and updated plans. At December 31, 2023, we had recorded asset retirement obligation liabilities of $205.4 million, including amounts reported as current. While the precise amount of these future costs cannot be determined with certainty, as of December 31, 2023, we estimate that the aggregate undiscounted cost of final mine closures is approximately $486.6 million. Refer to Note 15 to the Consolidated Financial Statements included elsewhere in this Annual Report on Form 10-K for reclamation disclosures including a table summarizing the changes in asset retirement obligations for the years ended December 31, 2023 and 2022.
Retirement Plans. We had three non-contributory defined benefit retirement Pension Plans covering certain of our salaried and non-union hourly employees, all of which were frozen. Effective as of December 31, 2023, the assets and liabilities of the Pension Plans were merged into one qualified non-contributory defined benefit Pension Plan. Benefits are based on either the employee’s compensation prior to retirement or stated amounts for each year of service with us. Funding of the Pension Plan is in accordance with requirements of ERISA, and our contributions can be deducted for federal income tax purposes. We contributed $25.0 million to our Pension Plan for the year ended December 31, 2023. For the year ended December 31, 2023, we recorded a net periodic benefit cost of $2.7 million for our Pension Plan and have recorded a net obligation of $101.9 million which is net of assets of $376.5 million. Refer to Note 18 to the Consolidated Financial Statements included elsewhere in this Annual Report on Form 10-K for disclosures summarizing the changes in this projected benefit obligation for the years ended December 31, 2023 and 2022.
The calculation of the net periodic benefit expense (credit) and projected benefit obligation associated with our Pension Plan requires the use of a number of assumptions, which are used by our independent actuaries to make the underlying calculations. Refer to Note 18 to the Consolidated Financial Statements included elsewhere in this Annual Report on Form 10-K for a summary of these assumptions and additional disclosures related to our Pension Plan.
Changes in these assumptions can result in different net periodic benefit expense and liability amounts, and actual experience can differ from the assumptions.
•The expected long-term rate of return on plan assets is an assumption of the rate of return on plan assets reflecting the average rate of earnings expected on the funds invested or to be invested to provide for the benefits included in the projected benefit obligation. We establish the expected long-term rate of return on plan assets at the beginning of each fiscal year based upon historical returns and projected returns on the underlying mix of invested assets. The Pension Plan investment targets are 58% equity securities and 42% fixed income funds (refer to Note 18 to the Consolidated Financial Statements included elsewhere in this Annual Report on Form 10-K for additional disclosures on this assumption). Investments are rebalanced on a periodic basis to stay within these targeted guidelines. The expected long-term rate of return on plan assets assumption used to determine net periodic benefit expense was 6.20% for the year ended December 31, 2023. The expected long-term rate of return on plan assets assumption to be used in 2024 is expected to be 6.20%. Any difference between the actual experience and the assumed experience is deferred as an unrecognized actuarial gain or loss and amortized into expense in future periods.
•The discount rate represents our estimate of the interest rate at which pension benefits could be effectively settled. Assumed discount rates are used in the measurement of the projected and accumulated benefit obligations and the interest cost component of the net periodic benefit expense. In estimating that rate, we use rates of return on high quality, fixed income investments. The weighted average discount rate used to determine the pension benefit obligation was 5.10% for the year ended December 31, 2023. The differences resulting from actual versus assumed discount rates are amortized into pension net periodic benefit expense (credit) over the remaining average life of the active plan participants. A one percentage-point increase in the discount rate would increase the net periodic pension cost for the year ended December 31, 2023 by approximately $1.7 million and decrease the projected benefit obligation as of December 31, 2023 by approximately $48.7 million. The corresponding effects of a one percentage-point decrease in discount rate would decrease the net periodic pension cost for the year ended December 31, 2023 by approximately $2.2 million and increase the projected benefit obligation as of December 31, 2023 by approximately $59.1 million.
Coal Workers’ Pneumoconiosis. We are required by federal and state statues to provide benefits to employees for awards related to coal workers’ pneumoconiosis disease (black lung). Certain of our subsidiaries are insured for black lung benefit obligations by a third-party insurance provider and certain subsidiaries are self-insured for black lung benefit obligations and may fund certain benefit payments through a Section 501(c)(21) tax-exempt trust fund. Provisions are made for estimated benefits based on annual evaluations prepared by independent actuaries. Charges are made to operations for self-insured black lung claims, as determined by an independent actuary at the present value of the actuarially computed liability for such benefits over the employee’s applicable term of service. These actuarially determined liabilities use various actuarial assumptions, including the discount rate, future cost trends, demographic assumptions, and return on plan assets to estimate the costs and obligations for these items.
•The discount rate represents our estimate of the interest rate at which black lung benefit obligations could be effectively settled. Assumed discount rates are used in the measurement of the black lung benefit obligations and the interest cost and service cost components of the net periodic benefit expense. In estimating that rate, we use rates of return on high quality, fixed income investments. The weighted average discount rate used to determine black lung benefit obligations was 5.13% for the year ended December 31, 2023. The differences resulting from actual versus assumed discount rates are amortized into black lung net periodic benefit cost over the remaining average life of the active plan participants. A one percentage-point increase in the discount rate would increase the net periodic black lung benefit cost for the year ended December 31, 2023 by approximately $0.4 million and decrease the projected benefit obligation as of December 31, 2023 by approximately $10.3 million. The corresponding effects of a one percentage-point decrease in discount rate would decrease the net periodic black lung benefit cost for the year ended December 31, 2023 by approximately $0.5 million and increase the projected benefit obligation as of December 31, 2023 by approximately $12.6 million.
If our assumptions do not materialize as expected, actual cash expenditures and costs that we incur could differ materially from our current estimates. Moreover, regulatory changes could affect our obligation to satisfy these or additional obligations. As of December 31, 2023, we had estimated black lung benefit obligations of approximately $107.3 million, including amounts reported as current, which are net of assets of $2.6 million that are held in a tax-exempt trust fund. For the year ended December 31, 2023, we recorded a net periodic benefit cost of $3.8 million for our black lung benefit obligations. Refer to Note 18 to the Consolidated Financial Statements included elsewhere in this Annual Report on Form 10-K for disclosures summarizing these underlying assumptions and the changes in these projected benefit obligations for the years ended December 31, 2023 and 2022.
Income Taxes. We recognize deferred tax assets and liabilities using enacted tax rates for the effect of temporary differences between the book and tax bases of recorded assets and liabilities. Deferred tax assets are reduced by a valuation allowance if it is more likely than not that some portion or all of the deferred tax assets will not be realized. In evaluating our ability to recover our deferred tax assets within the jurisdiction in which they arise, we consider all available positive and negative evidence, including the expected reversals of deferred tax liabilities, projected future taxable income, taxable income available via carryback to prior years, tax planning strategies, and results of recent operations. We assess the realizability of our deferred tax assets, including scheduling the reversal of our deferred tax assets and liabilities, to determine the amount of valuation allowance needed. Scheduling the reversal of deferred tax asset and liability balances requires judgment and estimation. We believe the deferred tax liabilities relied upon as future taxable income in our assessment will reverse in the same period and jurisdiction and are of the same character as the temporary differences giving rise to the deferred tax assets that will be realized. At December 31, 2023, a valuation allowance of $48.1 million has been provided on deferred tax assets not expected to provide future tax benefits. Refer to Note 17 to the Consolidated Financial Statements included elsewhere in this Annual Report on Form 10-K for additional disclosures on income taxes.
Asset Impairment. U.S. GAAP requires that a long-lived asset group that is held and used should be reviewed for impairment whenever events or changes in circumstances indicate that the carrying amount of the long-lived asset group might not be recoverable. Once indicators of potential impairment are identified, testing of a long-lived asset group for impairment is a two-step process. Step one evaluates the recoverability of an asset group by comparing its projected future net undiscounted cash flows to its carrying value. If the carrying value of an asset group exceeds its projected future net undiscounted cash flows, step two is performed whereby the fair value of the asset group is estimated and compared to its carrying amount. The amount of any potential impairment is equal to the excess of an asset group’s carrying value over its estimated fair value. The amount of any potential impairment is allocated to the individual long-lived assets within the asset group on a pro-rata basis, except that the carrying value of individual long-lived assets are not reduced below their individual estimated fair values. Long-lived assets located in a close geographic area are grouped together for purposes of impairment testing when, after considering revenue and cost interdependencies, circumstances indicate the assets are used together to produce future cash flows. Our asset groups generally consist of the assets and applicable liabilities of one or more mines and preparation plants and associated coal reserves for which cash flows are largely independent of cash flows of other mines, preparation plants and associated reserves.
We estimate the fair value of an asset group generally using discounted cash flow analysis based on estimates of future sales volumes, coal prices, production costs, and a risk-adjusted cost of capital. Changes in any of these assumptions could materially impact the estimated undiscounted cash flows of our asset groups. Refer to Note 2 to the Consolidated Financial Statements included elsewhere in this Annual Report on Form 10-K.
For a further discussion of the factors that could result in a change in our assumptions, see “Item 1A. Risk Factors” in this Annual Report on Form 10-K and our other filings with the Securities and Exchange Commission.
New Accounting Pronouncements. Refer to Note 2 to the Consolidated Financial Statements included elsewhere in this Annual Report on Form 10-K for disclosures related to new accounting policies adopted.
Item 7A. Quantitative and Qualitative Disclosures about Market Risk
Commodity Price Risk
We manage our commodity price risk for coal sales through the use of coal supply agreements. Refer to “Management’s Discussion and Analysis of Financial Condition and Results of Operations—Factors Affecting Our Results of Operations” for information on our sales commitments for 2024.
We have exposure to commodity price risk for supplies that are used directly or indirectly in the normal course of production such as diesel fuel, steel and other items such as explosives. We manage our risk for these items through strategic sourcing contracts in normal quantities with our suppliers.
The market price of diesel fuel fluctuates due to changes in production, seasonality, and other market factors generally outside of our control. Increased fuel costs may have a negative impact on our results of operations and financial condition. As of December 31, 2023, our forecasted diesel fuel usage and fixed price diesel fuel purchase commitments for 2024 are as follows:
|
|
|
|
|
|
|
|
|
|
|
|
|
|
|
|
|
|
|
Budgeted Usage in Gallons |
|
% Priced |
|
Average Realized Price per Gallon |
| Diesel fuel |
23.2 million |
|
73.7 |
% |
|
$3.41 |
|
Interest Rate Risk
As of December 31, 2023, we maintain a senior secured asset-based revolving credit facility, which was refinanced in the fourth quarter of 2023, under which we may borrow up to $155.0 million (less amounts outstanding for LCs). Any cash borrowings under the facility would bear a floating rate of interest. No cash borrowings were outstanding under the facilities as of December 31, 2023 or 2022. Refer to Note 13 for additional information.
As of December 31, 2023 and 2022, we had investments in trading securities of $40.6 million and $151.8 million respectively. While the fair value of these investments is exposed to risk with respect to changes in market rates of interest, we do not believe exposure to changes in interest rates is material to our Consolidated Financial Statements. We manage risk by investing in shorter term highly rated debt obligations (primarily U.S. government securities). As of December 31, 2023 and 2022, the remaining maturities of our acquired debt securities was less than 12 months.
Foreign Currency Risk
Our transactions are denominated in U.S. dollars, and, as a result, we do not have material exposure to currency exchange-rate risks. However, our coal is sold internationally in U.S. dollars and, as a result, general economic conditions in foreign markets and changes in foreign currency exchange rates may provide our foreign competitors with a competitive advantage. If our competitors’ currencies decline against the U.S. dollar or against our foreign customers’ local currencies, those competitors may be able to offer lower prices for coal to customers. Furthermore, if the currencies of our overseas customers were to significantly decline in value in comparison to the U.S. dollar, those customers may seek decreased prices for the coal we sell to them. Consequently, currency fluctuations could adversely affect the competitiveness of our coal in international markets, which could have a material adverse effect on our business, financial condition, results of operations, and cash flows.
Item 8. Financial Statements and Supplementary Data
Report of Independent Registered Public Accounting Firm
To the Stockholders and the Board of Directors of Alpha Metallurgical Resources, Inc.
Opinions on the Financial Statements and Internal Control Over Financial Reporting
We have audited the accompanying consolidated balance sheets of Alpha Metallurgical Resources, Inc. and subsidiaries (the Company) as of December 31, 2023 and 2022, and the related consolidated statements of operations, comprehensive income, stockholders' equity and cash flows for each of the three years in the period ended December 31, 2023, and the related notes (collectively, the financial statements). We also have audited the Company’s internal control over financial reporting as of December 31, 2023, based on criteria established in Internal Control — Integrated Framework issued by the Committee of Sponsoring Organizations of the Treadway Commission in 2013.
In our opinion, the financial statements referred to above present fairly, in all material respects, the financial position of the Company as of December 31, 2023 and 2022, and the results of its operations and its cash flows for each of the three years in the period ended December 31, 2023, in conformity with accounting principles generally accepted in the United States of America. Also in our opinion, the Company maintained, in all material respects, effective internal control over financial reporting as of December 31, 2023, based on criteria established in Internal Control — Integrated Framework issued by the Committee of Sponsoring Organizations of the Treadway Commission in 2013.
Basis for Opinions
The Company's management is responsible for these financial statements, for maintaining effective internal control over financial reporting, and for its assessment of the effectiveness of internal control over financial reporting, included in the accompanying Management’s Report on Internal Control Over Financial Reporting. Our responsibility is to express an opinion on the Company's financial statements and an opinion on the Company's internal control over financial reporting based on our audits. We are a public accounting firm registered with the Public Company Accounting Oversight Board (United States) (PCAOB) and are required to be independent with respect to the Company in accordance with U.S. federal securities laws and the applicable rules and regulations of the Securities and Exchange Commission and the PCAOB.
We conducted our audits in accordance with the standards of the PCAOB. Those standards require that we plan and perform the audit to obtain reasonable assurance about whether the financial statements are free of material misstatement, whether due to error or fraud, and whether effective internal control over financial reporting was maintained in all material respects.
Our audits of the financial statements included performing procedures to assess the risks of material misstatement of the financial statements, whether due to error or fraud, and performing procedures that respond to those risks. Such procedures included examining, on a test basis, evidence regarding the amounts and disclosures in the financial statements. Our audits also included evaluating the accounting principles used and significant estimates made by management, as well as evaluating the overall presentation of the financial statements. Our audit of internal control over financial reporting included obtaining an understanding of internal control over financial reporting, assessing the risk that a material weakness exists, and testing and evaluating the design and operating effectiveness of internal control based on the assessed risk. Our audits also included performing such other procedures as we considered necessary in the circumstances. We believe that our audits provide a reasonable basis for our opinions.
Definition and Limitations of Internal Control Over Financial Reporting
A company's internal control over financial reporting is a process designed to provide reasonable assurance regarding the reliability of financial reporting and the preparation of financial statements for external purposes in accordance with generally accepted accounting principles. A company's internal control over financial reporting includes those policies and procedures that (1) pertain to the maintenance of records that, in reasonable detail, accurately and fairly reflect the transactions and dispositions of the assets of the company; (2) provide reasonable assurance that transactions are recorded as necessary to permit preparation of financial statements in accordance with generally accepted accounting principles, and that receipts and expenditures of the company are being made only in accordance with authorizations of management and directors of the company; and (3) provide reasonable assurance regarding prevention or timely detection of unauthorized acquisition, use or disposition of the company's assets that could have a material effect on the financial statements.
Because of its inherent limitations, internal control over financial reporting may not prevent or detect misstatements. Also, projections of any evaluation of effectiveness to future periods are subject to the risk that controls may become inadequate because of changes in conditions, or that the degree of compliance with the policies or procedures may deteriorate.
Critical Audit Matter
The critical audit matter communicated below is a matter arising from the current period audit of the financial statements that was communicated or required to be communicated to the audit committee and that: (1) relates to accounts or disclosures that are material to the financial statements and (2) involved our especially challenging, subjective or complex judgments. The communication of the critical audit matter does not alter in any way our opinion on the financial statements, taken as a whole, and we are not, by communicating the critical audit matter below, providing a separate opinion on the critical audit matter or on the accounts or disclosures to which it relates.
Asset Retirement Obligations
As described in Notes 2 and 15 to the consolidated financial statements, the Company’s consolidated asset retirement obligation liability was $205 million as of December 31, 2023. The Company records the asset retirement obligation liability at fair value in the period in which the legal obligation associated with the retirement of the long-lived asset is incurred. Changes to the liability at operations that are not currently being reclaimed are offset by increasing or decreasing the carrying amount of the related long-lived asset. Changes to the liability at operations that are currently being reclaimed are recorded to depreciation, depletion, and amortization. On at least an annual basis the Company reviews its estimated future cash flows for its asset retirement obligation liability.
We identified the valuation of the asset retirement obligation liability as a critical audit matter because the estimate involves a high degree of subjectivity and auditing the significant assumptions utilized by management in estimating the amount of the liability requires judgment. In particular, the obligation liability is determined using a discounted cash flow technique and is based upon mining permit requirements and various assumptions including discount rates, inflation rate, estimates of disturbed acreage, timing of reclamation activities, and third-party reclamation costs.
Our audit procedures related to the Company’s asset retirement obligation liability included the following, among others:
–We obtained an understanding of the relevant controls related to the Company’s accounting for the asset retirement obligation liability, and tested such controls for design and operating effectiveness, including controls over management’s review of the significant assumptions and data inputs described above.
–We compared significant valuation assumptions including the discount rates and inflation rate to market data and utilized a valuation specialist to assist in testing the Company’s discounted cash flow model.
–We compared the estimates of disturbed acreage, timing of reclamation activities, and third-party reclamation costs to the prior year estimates, assessed consistency between timing of reclamation activities and projected mine lives, evaluated the appropriateness of the estimated costs based on mine type, and compared anticipated costs to recent operating data.
–We utilized an external specialist who performed observations of mine site operations, conducted interviews of engineering personnel, assessed compliance with mine closure and post closure plan regulatory requirements, and evaluated the reasonableness of the engineering estimates and assumptions.
/s/ RSM US LLP
We have served as the Company's auditor since 2020.
Atlanta, Georgia
February 26, 2024
ALPHA METALLURGICAL RESOURCES, INC. AND SUBSIDIARIES
CONSOLIDATED STATEMENTS OF OPERATIONS
(Amounts in thousands, except share and per share data)
|
|
|
|
|
|
|
|
|
|
|
|
|
|
|
|
|
|
|
Year Ended December 31, |
| |
2023 |
|
2022 |
|
2021 |
| Revenues: |
|
|
|
|
|
| Coal revenues |
$ |
3,456,630 |
|
|
$ |
4,092,987 |
|
|
$ |
2,252,624 |
|
| Other revenues |
14,787 |
|
|
8,605 |
|
|
6,062 |
|
| Total revenues |
3,471,417 |
|
|
4,101,592 |
|
|
2,258,686 |
|
| Costs and expenses: |
|
|
|
|
|
| Cost of coal sales (exclusive of items shown separately below) |
2,356,138 |
|
|
2,285,969 |
|
|
1,677,782 |
|
| Depreciation, depletion and amortization |
136,869 |
|
|
107,620 |
|
|
110,047 |
|
| Accretion on asset retirement obligations |
25,500 |
|
|
23,765 |
|
|
26,520 |
|
| Amortization of acquired intangibles, net |
8,523 |
|
|
19,498 |
|
|
13,244 |
|
| Asset impairment and restructuring |
— |
|
|
— |
|
|
(561) |
|
| Selling, general and administrative expenses (exclusive of depreciation, depletion and amortization shown separately above) |
82,390 |
|
|
71,618 |
|
|
63,901 |
|
| Total other operating loss (income): |
|
|
|
|
|
| Mark-to-market adjustment for acquisition-related obligations |
— |
|
|
8,880 |
|
|
19,525 |
|
| Other (income) expense |
(1,088) |
|
|
3,363 |
|
|
(10,972) |
|
| Total costs and expenses |
2,608,332 |
|
|
2,520,713 |
|
|
1,899,486 |
|
| Income from operations |
863,085 |
|
|
1,580,879 |
|
|
359,200 |
|
| Other (expense) income: |
|
|
|
|
|
| Interest expense |
(6,923) |
|
|
(21,802) |
|
|
(69,654) |
|
| Interest income |
11,933 |
|
|
3,187 |
|
|
336 |
|
| Loss on extinguishment of debt |
(2,753) |
|
|
— |
|
|
— |
|
| Equity loss in affiliates |
(18,263) |
|
|
(14,346) |
|
|
(4,149) |
|
| Miscellaneous (expense) income, net |
(1,620) |
|
|
6,832 |
|
|
6,465 |
|
| Total other expense, net |
(17,626) |
|
|
(26,129) |
|
|
(67,002) |
|
| Income before income taxes |
845,459 |
|
|
1,554,750 |
|
|
292,198 |
|
| Income tax expense |
(123,503) |
|
|
(106,205) |
|
|
(3,408) |
|
| Net income |
721,956 |
|
|
1,448,545 |
|
|
288,790 |
|
|
|
|
|
|
|
| Basic income per common share |
$ |
51.18 |
|
|
$ |
82.82 |
|
|
$ |
15.66 |
|
| Diluted income per common share |
$ |
49.30 |
|
|
$ |
79.49 |
|
|
$ |
15.30 |
|
|
|
|
|
|
|
| Weighted average shares - basic |
14,106,466 |
|
|
17,490,886 |
|
|
18,441,175 |
|
| Weighted average shares - diluted |
14,642,856 |
|
|
18,222,397 |
|
|
18,871,682 |
|
Refer to accompanying Notes to Consolidated Financial Statements.
ALPHA METALLURGICAL RESOURCES, INC. AND SUBSIDIARIES
CONSOLIDATED STATEMENTS OF COMPREHENSIVE INCOME
(Amounts in thousands)
|
|
|
|
|
|
|
|
|
|
|
|
|
|
|
|
|
|
|
Year Ended December 31, |
|
2023 |
|
2022 |
|
2021 |
| Net income |
$ |
721,956 |
|
|
$ |
1,448,545 |
|
|
$ |
288,790 |
|
| Other comprehensive (loss) income, net of tax: |
|
|
|
|
|
| Employee benefit plans: |
|
|
|
|
|
| Current period actuarial (loss) gain |
$ |
(34,205) |
|
|
$ |
56,485 |
|
|
$ |
47,461 |
|
| Income tax benefit (expense) |
7,588 |
|
|
(12,888) |
|
|
— |
|
|
$ |
(26,617) |
|
|
$ |
43,597 |
|
|
$ |
47,461 |
|
| Less: reclassification adjustments for amounts reclassified to earnings due to amortization of net actuarial (gain) loss and settlements |
(2,324) |
|
|
3,555 |
|
|
6,021 |
|
| Income tax benefit (expense) |
516 |
|
|
(811) |
|
|
— |
|
|
$ |
(1,808) |
|
|
$ |
2,744 |
|
|
$ |
6,021 |
|
| Total other comprehensive (loss) income, net of tax |
$ |
(28,425) |
|
|
$ |
46,341 |
|
|
$ |
53,482 |
|
| Total comprehensive income |
$ |
693,531 |
|
|
$ |
1,494,886 |
|
|
$ |
342,272 |
|
Refer to accompanying Notes to Consolidated Financial Statements.
ALPHA METALLURGICAL RESOURCES, INC. AND SUBSIDIARIES
CONSOLIDATED BALANCE SHEETS
(Amounts in thousands, except share and per share data)
|
|
|
|
|
|
|
|
|
|
|
|
|
December 31, 2023 |
|
December 31, 2022 |
| Assets |
|
|
|
| Current assets: |
|
|
|
| Cash and cash equivalents |
$ |
268,207 |
|
|
$ |
301,906 |
|
| Short-term investments |
— |
|
|
46,052 |
|
Trade accounts receivable, net of allowance for credit losses of $234 and $239 as of December 31, 2023 and 2022, respectively |
509,682 |
|
|
407,210 |
|
| Inventories, net |
231,344 |
|
|
200,574 |
|
| Short-term deposits |
32 |
|
|
84,748 |
|
| Short-term restricted cash |
— |
|
|
24,547 |
|
| Prepaid expenses and other current assets |
39,032 |
|
|
49,384 |
|
| Total current assets |
1,048,297 |
|
|
1,114,421 |
|
Property, plant, and equipment, net of accumulated depreciation and amortization of $558,905 and $491,186 as of December 31, 2023 and 2022, respectively |
588,992 |
|
|
442,645 |
|
Owned and leased mineral rights, net of accumulated depletion and amortization of $99,826 and $77,333 as of December 31, 2023 and 2022, respectively |
451,160 |
|
|
451,062 |
|
Other acquired intangibles, net of accumulated amortization of $38,543 and $53,719 as of December 31, 2023 and 2022, respectively |
46,579 |
|
|
55,102 |
|
| Long-term restricted investments |
40,597 |
|
|
105,735 |
|
| Long-term restricted cash |
115,918 |
|
|
28,941 |
|
| Deferred income taxes |
8,028 |
|
|
11,378 |
|
| Other non-current assets |
106,486 |
|
|
103,195 |
|
| Total assets |
$ |
2,406,057 |
|
|
$ |
2,312,479 |
|
| Liabilities and Stockholders’ Equity |
|
|
|
| Current liabilities: |
|
|
|
| Current portion of long-term debt |
$ |
3,582 |
|
|
$ |
3,078 |
|
| Trade accounts payable |
128,836 |
|
|
106,037 |
|
| Acquisition-related obligations - current |
— |
|
|
28,254 |
|
| Accrued expenses and other current liabilities |
177,512 |
|
|
265,256 |
|
| Total current liabilities |
309,930 |
|
|
402,625 |
|
| Long-term debt |
6,792 |
|
|
7,897 |
|
| Workers’ compensation and black lung obligations |
189,226 |
|
|
188,247 |
|
| Pension obligations |
101,908 |
|
|
110,836 |
|
| Asset retirement obligations |
166,509 |
|
|
142,048 |
|
| Deferred income taxes |
39,142 |
|
|
10,874 |
|
| Other non-current liabilities |
18,622 |
|
|
20,197 |
|
| Total liabilities |
832,129 |
|
|
882,724 |
|
Commitments and Contingencies (Note 21) |
|
|
|
| Stockholders’ Equity |
|
|
|
Preferred stock - par value $0.01, 5,000,000 shares authorized, none issued |
— |
|
|
— |
|
Common stock - par value $0.01, 50,000,000 shares authorized, 22,058,135 issued and 12,938,679 outstanding at December 31, 2023 and 21,703,163 issued and 15,552,676 outstanding at December 31, 2022 |
221 |
|
|
217 |
|
| Additional paid-in capital |
834,482 |
|
|
815,442 |
|
| Accumulated other comprehensive loss |
(40,587) |
|
|
(12,162) |
|
Treasury stock, at cost: 9,119,456 shares at December 31, 2023 and 6,150,487 shares at December 31, 2022 |
(1,189,715) |
|
|
(649,061) |
|
|
|
|
|
|
|
|
|
|
|
|
|
| Retained earnings |
1,969,527 |
|
|
1,275,319 |
|
| Total stockholders’ equity |
1,573,928 |
|
|
1,429,755 |
|
| Total liabilities and stockholders’ equity |
$ |
2,406,057 |
|
|
$ |
2,312,479 |
|
Refer to accompanying Notes to Consolidated Financial Statements.
ALPHA METALLURGICAL RESOURCES, INC. AND SUBSIDIARIES
CONSOLIDATED STATEMENTS OF CASH FLOWS
(Amounts in thousands)
|
|
|
|
|
|
|
|
|
|
|
|
|
|
|
|
|
|
|
Year Ended December 31, |
|
2023 |
|
2022 |
|
2021 |
| Operating activities: |
|
|
|
|
|
| Net income |
$ |
721,956 |
|
|
$ |
1,448,545 |
|
|
$ |
288,790 |
|
| Adjustments to reconcile net income to net cash provided by operating activities: |
|
|
|
|
|
| Depreciation, depletion and amortization |
136,869 |
|
|
107,620 |
|
|
110,047 |
|
| Amortization of acquired intangibles, net |
8,523 |
|
|
19,498 |
|
|
13,244 |
|
| Amortization of debt issuance costs and accretion of debt discount |
1,947 |
|
|
8,282 |
|
|
12,338 |
|
| Loss on extinguishment of debt |
2,753 |
|
|
— |
|
|
— |
|
| Mark-to-market adjustment for acquisition-related obligations |
— |
|
|
8,880 |
|
|
19,525 |
|
| (Gain) loss on disposal of assets, net |
(6,817) |
|
|
43 |
|
|
(9,911) |
|
| Accretion on asset retirement obligations |
25,500 |
|
|
23,765 |
|
|
26,520 |
|
| Employee benefit plans, net |
8,376 |
|
|
(4,492) |
|
|
(1,751) |
|
| Deferred income taxes |
39,722 |
|
|
(14,521) |
|
|
(163) |
|
| Stock-based compensation |
19,017 |
|
|
7,484 |
|
|
5,315 |
|
| Equity loss in affiliates |
18,263 |
|
|
14,346 |
|
|
4,149 |
|
| Other, net |
(363) |
|
|
(761) |
|
|
(5,873) |
|
| Changes in operating assets and liabilities |
|
|
|
|
|
| Trade accounts receivable, net |
(102,477) |
|
|
82,774 |
|
|
(336,240) |
|
| Inventories, net |
(27,900) |
|
|
(63,169) |
|
|
(21,331) |
|
| Prepaid expenses and other current assets |
7,596 |
|
|
(12,031) |
|
|
61,581 |
|
| Deposits |
80,729 |
|
|
(84,314) |
|
|
26,853 |
|
| Other non-current assets |
3,837 |
|
|
11,268 |
|
|
(250) |
|
| Trade accounts payable |
15,666 |
|
|
3,721 |
|
|
25,154 |
|
| Accrued expenses and other current liabilities |
(9,087) |
|
|
(6,872) |
|
|
15,961 |
|
| Acquisition-related obligations |
(28,254) |
|
|
(22,264) |
|
|
(18,121) |
|
| Asset retirement obligations |
(19,189) |
|
|
(18,699) |
|
|
(16,306) |
|
| Other non-current liabilities |
(45,508) |
|
|
(25,098) |
|
|
(24,588) |
|
| Net cash provided by operating activities |
851,159 |
|
|
1,484,005 |
|
|
174,943 |
|
| Investing activities: |
|
|
|
|
|
| Capital expenditures |
(245,373) |
|
|
(164,309) |
|
|
(83,300) |
|
| Proceeds on disposal of assets |
8,173 |
|
|
3,623 |
|
|
8,224 |
|
| Cash paid for business acquired |
(11,919) |
|
|
(24,878) |
|
|
— |
|
| Purchases of investment securities |
(207,065) |
|
|
(269,420) |
|
|
(17,985) |
|
| Sales and maturities of investment securities |
320,961 |
|
|
149,397 |
|
|
13,265 |
|
| Capital contributions to equity affiliates |
(30,812) |
|
|
(19,556) |
|
|
(6,677) |
|
| Other, net |
35 |
|
|
(4,214) |
|
|
(3,382) |
|
| Net cash used in investing activities |
(166,000) |
|
|
(329,357) |
|
|
(89,855) |
|
| Financing activities: |
|
|
|
|
|
| Repurchases of long-term debt |
— |
|
|
— |
|
|
(18,415) |
|
| Principal repayments of long-term debt |
(2,314) |
|
|
(450,622) |
|
|
(119,097) |
|
| Dividend and dividend equivalents paid |
(113,013) |
|
|
(13,360) |
|
|
— |
|
| Common stock repurchases and related expenses |
(540,071) |
|
|
(521,803) |
|
|
(786) |
|
| Proceeds from exercise of warrants |
4,322 |
|
|
5,643 |
|
|
— |
|
| Other, net |
(5,352) |
|
|
(1,726) |
|
|
(8,747) |
|
|
|
|
|
|
|
|
|
|
|
|
|
|
|
|
|
|
|
| Net cash used in financing activities |
(656,428) |
|
|
(981,868) |
|
|
(147,045) |
|
| Net increase (decrease) in cash and cash equivalents and restricted cash |
28,731 |
|
|
172,780 |
|
|
(61,957) |
|
| Cash and cash equivalents and restricted cash at beginning of period |
355,394 |
|
|
182,614 |
|
|
244,571 |
|
| Cash and cash equivalents and restricted cash at end of period |
$ |
384,125 |
|
|
$ |
355,394 |
|
|
$ |
182,614 |
|
|
|
|
|
|
|
| Supplemental cash flow information: |
|
|
|
|
|
| Cash paid for interest |
$ |
5,207 |
|
|
$ |
25,895 |
|
|
$ |
63,061 |
|
| Cash paid for income taxes |
$ |
79,221 |
|
|
$ |
139,663 |
|
|
$ |
176 |
|
| Cash received for income tax refunds |
$ |
30 |
|
|
$ |
6 |
|
|
$ |
64,498 |
|
| Supplemental disclosure of noncash investing and financing activities: |
|
|
|
|
|
| Financing leases and capital financing - equipment |
$ |
3,195 |
|
|
$ |
9,833 |
|
|
$ |
787 |
|
| Accrued capital expenditures |
$ |
25,004 |
|
|
$ |
18,456 |
|
|
$ |
9,964 |
|
| Accrued common stock repurchases |
$ |
8,118 |
|
|
$ |
3,016 |
|
|
$ |
— |
|
| Accrued dividend payable |
$ |
2,863 |
|
|
$ |
88,128 |
|
|
$ |
— |
|
The following table provides a reconciliation of cash and cash equivalents and restricted cash reported within the Consolidated Balance Sheets that sum to the total of the same such amounts shown in the Consolidated Statements of Cash Flows.
|
|
|
|
|
|
|
|
|
|
|
|
|
|
|
|
|
|
|
As of December 31, |
| |
2023 |
|
2022 |
|
2021 |
| Cash and cash equivalents |
$ |
268,207 |
|
|
$ |
301,906 |
|
|
$ |
81,211 |
|
| Short-term restricted cash |
— |
|
|
24,547 |
|
|
11,977 |
|
| Long-term restricted cash |
115,918 |
|
|
28,941 |
|
|
89,426 |
|
| Total cash and cash equivalents and restricted cash shown in the Consolidated Statements of Cash Flows |
$ |
384,125 |
|
|
$ |
355,394 |
|
|
$ |
182,614 |
|
Refer to accompanying Notes to Consolidated Financial Statements.
ALPHA METALLURGICAL RESOURCES, INC. AND SUBSIDIARIES
CONSOLIDATED STATEMENTS OF STOCKHOLDERS' EQUITY
(Amounts in thousands)
|
|
|
|
|
|
|
|
|
|
|
|
|
|
|
|
|
|
|
|
|
|
|
|
|
|
|
|
|
|
|
|
|
|
|
|
|
Common Stock |
|
Additional Paid-in Capital |
|
Accumulated Other Comprehensive (Loss) Income |
|
Treasury Stock at Cost |
|
(Accumulated Deficit) Retained Earnings |
|
Total Stockholders’ Equity |
| Balances, December 31, 2020 |
$ |
206 |
|
|
$ |
779,424 |
|
|
$ |
(111,985) |
|
|
$ |
(107,014) |
|
|
$ |
(360,529) |
|
|
$ |
200,102 |
|
| Net income |
— |
|
|
— |
|
|
— |
|
|
— |
|
|
288,790 |
|
|
288,790 |
|
| Other comprehensive income, net |
— |
|
|
— |
|
|
53,482 |
|
|
— |
|
|
— |
|
|
53,482 |
|
| Stock-based compensation and issuance of common stock for share vesting |
2 |
|
|
5,313 |
|
|
— |
|
|
— |
|
|
— |
|
|
5,315 |
|
| Common stock repurchases and related expenses |
— |
|
|
— |
|
|
— |
|
|
(786) |
|
|
— |
|
|
(786) |
|
| Warrants exercises |
— |
|
|
6 |
|
|
— |
|
|
— |
|
|
— |
|
|
6 |
|
| Balances, December 31, 2021 |
$ |
208 |
|
|
$ |
784,743 |
|
|
$ |
(58,503) |
|
|
$ |
(107,800) |
|
|
$ |
(71,739) |
|
|
$ |
546,909 |
|
| Net income |
— |
|
|
— |
|
|
— |
|
|
— |
|
|
1,448,545 |
|
|
1,448,545 |
|
| Other comprehensive income, net |
— |
|
|
— |
|
|
46,341 |
|
|
|
|
— |
|
|
46,341 |
|
| Stock-based compensation, issuance of common stock for share vesting, and common stock reissuances |
2 |
|
|
5,415 |
|
|
— |
|
|
2,067 |
|
|
— |
|
|
7,484 |
|
| Exercise of stock options |
— |
|
|
1,172 |
|
|
— |
|
|
— |
|
|
— |
|
|
1,172 |
|
| Common stock repurchases and related expenses |
— |
|
|
— |
|
|
— |
|
|
(543,328) |
|
|
— |
|
|
(543,328) |
|
| Warrants exercises |
7 |
|
|
24,112 |
|
|
— |
|
|
— |
|
|
— |
|
|
24,119 |
|
Cash dividend and dividend equivalents declared ($6.185 per share) |
— |
|
|
— |
|
|
— |
|
|
— |
|
|
(101,487) |
|
|
(101,487) |
|
| Balances, December 31, 2022 |
$ |
217 |
|
|
$ |
815,442 |
|
|
$ |
(12,162) |
|
|
$ |
(649,061) |
|
|
$ |
1,275,319 |
|
|
$ |
1,429,755 |
|
| Net income |
— |
|
|
— |
|
|
— |
|
|
— |
|
|
721,956 |
|
|
721,956 |
|
| Other comprehensive loss, net |
— |
|
|
— |
|
|
(28,425) |
|
|
— |
|
|
— |
|
|
(28,425) |
|
| Stock-based compensation, issuance of common stock for share vesting, and common stock reissuances |
2 |
|
|
12,127 |
|
|
— |
|
|
6,888 |
|
|
— |
|
|
19,017 |
|
| Exercise of stock options |
— |
|
|
225 |
|
|
— |
|
|
— |
|
|
— |
|
|
225 |
|
| Common stock repurchases and related expenses |
— |
|
|
— |
|
|
— |
|
|
(547,542) |
|
|
— |
|
|
(547,542) |
|
| Warrants exercises |
2 |
|
|
6,688 |
|
|
— |
|
|
— |
|
|
— |
|
|
6,690 |
|
Cash dividend and dividend equivalents declared ($1.940 per share) |
— |
|
|
— |
|
|
— |
|
|
— |
|
|
(27,748) |
|
|
(27,748) |
|
| Balances, December 31, 2023 |
$ |
221 |
|
|
$ |
834,482 |
|
|
$ |
(40,587) |
|
|
$ |
(1,189,715) |
|
|
$ |
1,969,527 |
|
|
$ |
1,573,928 |
|
Refer to accompanying Notes to Consolidated Financial Statements.
ALPHA METALLURGICAL RESOURCES, INC. AND SUBSIDIARIES
Notes to Consolidated Financial Statements
(Amounts in thousands except share and per share data)
(1) Business and Basis of Presentation
Business
Alpha Metallurgical Resources, Inc. (“Alpha” or the “Company”), previously named Contura Energy, Inc., is a Tennessee-based mining company with operations across Virginia and West Virginia. With customers across the globe, high-quality reserves and significant port capacity, Alpha is a leading U.S. supplier of metallurgical coal products for the steel industry.
The Company was formed to acquire and operate certain of Alpha Natural Resources, Inc.’s core coal operations, as part of the Alpha Natural Resources, Inc. bankruptcy reorganization. The Company began operations on July 26, 2016 and currently operates mines in the Central Appalachia region.
A merger with ANR, Inc. and Alpha Natural Resources Holdings, Inc. (together, the "Merger Companies”) was completed on November 9, 2018 (the “Merger”) pursuant to terms of the definitive merger agreement (the “Merger Agreement”). Upon the consummation of the transactions contemplated by the Merger Agreement, the Company began trading on the New York Stock Exchange under the ticker “CTRA.”
Effective February 1, 2021, the Company changed its corporate name from Contura Energy, Inc. to Alpha Metallurgical Resources, Inc. to more accurately reflect its strategic focus on the production of metallurgical coal. Following the effectiveness of its name change, the Company’s ticker symbol on the New York Stock Exchange changed from “CTRA” to “AMR” effective on February 4, 2021.
Basis of Presentation
Together, the consolidated statements of operations, comprehensive income, balance sheets, cash flows and stockholders’ equity for the Company are referred to as the “Consolidated Financial Statements.” The Consolidated Financial Statements are also referenced across periods as “Consolidated Statements of Operations,” “Consolidated Statements of Comprehensive Income,” “Consolidated Balance Sheets,” “Consolidated Statements of Cash Flows,” and “Consolidated Statements of Stockholders’ Equity.”
The Consolidated Financial Statements include all wholly owned subsidiaries’ results of operations for the years ended December 31, 2023, 2022, and 2021. All significant intercompany transactions have been eliminated in consolidation.
The accompanying Consolidated Financial Statements have been prepared in accordance with accounting principles generally accepted in the United States (“U.S. GAAP”).
(2) Summary of Significant Accounting Policies
Use of Estimates
The preparation of the Company’s Consolidated Financial Statements requires management to make estimates and assumptions that affect the reported amounts of assets and liabilities and disclosure of contingent assets and liabilities at the date of the Consolidated Financial Statements and the reported amounts of revenues and expenses during the reporting period. Significant items subject to such estimates and assumptions include inventories; mineral reserves and resources; long-lived asset impairments; reclamation obligations; post-employment and other employee benefit obligations; useful lives, depletion and amortization; reserves for workers’ compensation and black lung claims; deferred income taxes; income taxes payable; income taxes refundable and receivable; reserves for contingencies and litigation; and fair value of financial instruments. Estimates are based on facts and circumstances believed to be reasonable at the time; however, actual results could differ from those estimates.
Cash and Cash Equivalents
Cash and cash equivalents consist of cash held with reputable depository institutions and highly liquid, short-term investments, such as highly-rated money market funds, with original maturities of three months or less. Cash and cash equivalents are stated at cost, which approximates fair value.
ALPHA METALLURGICAL RESOURCES, INC. AND SUBSIDIARIES
Notes to Consolidated Financial Statements
(Amounts in thousands except share and per share data)
Restricted Cash
Amounts included in restricted cash represent cash and cash equivalents that are restricted as to withdrawal as required by certain agreements entered into by the Company and provide collateral to secure the certain obligations which have been written on the Company’s behalf. Refer to Note 21 for further information.
Investments
Short-term investments consist of U.S government securities. Restricted investments consist of Federal Deposit Insurance Company (“FDIC”) insured certificates of deposit, corporate fixed income, and U.S. government securities that are restricted as to withdrawal as required by certain agreements entered into by the Company and provide collateral to secure certain obligations which have been written on the Company’s behalf.
All investments are classified as trading securities as of December 31, 2023 and 2022. Trading securities are recorded initially at cost and are adjusted to fair value at each reporting period with unrealized gains and losses recorded in current period earnings or loss. Refer to Note 21 for further information.
Deposits
Deposits represent cash deposits held at third parties as required by certain agreements entered into by the Company to provide cash collateral to secure the following obligations which have been written on the Company’s behalf. Refer to Note 21 for further information.
Trade Accounts Receivable and Allowance for Credit Losses
Trade accounts receivable are recorded at their invoiced amounts and do not bear interest. The Company markets its coal primarily to international and domestic steel producers and electric utilities in the United States. Credit is extended based on an evaluation of a customer’s financial condition, including a review of third-party credit score information. Collateral is generally not required. Accounts receivable balances are monitored against approved credit limits. Credit limits are monitored and adjusted as considered necessary based on changes to a customer’s credit profile. If a customer’s credit deteriorates, the Company may reduce credit risk exposure by reducing credit limits, obtaining letters of credit (“LCs”), obtaining credit insurance, or requiring pre-payment for shipments. Credit losses have historically not been material. Account balances are written-off against the allowance after all means of collection have been exhausted and the potential for recovery is considered remote. Refer to Note 22 for further information.
Inventories
Coal is reported as inventory at the point in time the coal is extracted from the mine. Raw coal represents coal stockpiles that may be sold in current condition or may be further processed prior to shipment to a customer. Saleable coal represents coal stockpiles that require no further processing prior to shipment to a customer.
Coal inventories are valued at the lower of average cost or net realizable value. The cost of coal inventories is determined based on the average cost of production, which includes labor, supplies, equipment costs, operating overhead, depreciation, and other related costs. Net realizable value considers the projected future sales price of the product, less estimated preparation and selling costs. Material and supplies inventories are valued at average cost, less an allowance for obsolete and surplus items. Refer to Note 6 for further information.
Advanced Mining Royalties
Lease rights to coal reserves are often acquired in exchange for royalty payments. Advanced mining royalties are advanced payments made to lessors under terms of mineral lease agreements that are recoupable against future production royalties. These advanced payments are deferred and charged to operations as the coal reserves are mined. The Company regularly reviews recoverability of advanced mining royalties and establishes or adjusts the allowance for advanced mining royalties as necessary using the specific identification method. Advanced royalty balances are generally charged off against the allowance when they are no longer recoupable. Advanced mining royalties are included within Other non-current assets on the Company’s Consolidated Balance Sheets. Refer to Note 9 for further information.
ALPHA METALLURGICAL RESOURCES, INC. AND SUBSIDIARIES
Notes to Consolidated Financial Statements
(Amounts in thousands except share and per share data)
Property, Plant, and Equipment, Net
Costs for mine development incurred to expand capacity of operating mines or to develop new mines are capitalized and charged to operations on the units-of-production method over the estimated proven and probable reserve tons directly benefiting from the capital expenditures. Mine development costs include costs incurred for site preparation and development of the mines during the development stage less any incidental revenue generated during the development stage. Mining equipment, buildings, and other fixed assets are stated at cost and depreciated on a straight-line basis over estimated useful lives ranging from one to 25 years. Leasehold improvements are amortized using the straight-line method, over the shorter of the estimated useful lives or term of the lease. Major repairs and betterments that significantly extend original useful lives or improve productivity are capitalized and depreciated over the period benefited. Maintenance and repairs are expensed as incurred. When equipment is retired or disposed, the related cost and accumulated depreciation are removed from the respective accounts and any profit or loss on disposal is recognized in Other (income) expense in the Company’s Consolidated Statements of Operations. Refer to Note 8 for further information.
Owned and Leased Mineral Rights
Owned and leased mineral rights, net of accumulated depletion and amortization, for the years ended December 31, 2023 and 2022 were $451,160 and $451,062, respectively, and are reported in assets in the Company’s Consolidated Balance Sheets. These amounts include $27,473 and $20,284 of asset retirement obligation assets, net of accumulated amortization, associated with active mining operations for the years ended December 31, 2023 and 2022, respectively.
Costs to obtain owned and leased mineral rights are capitalized and amortized to operations as depletion expense using the units-of-production method. Only proven and probable reserves are included in the depletion base. Depletion expense is included in Depreciation, depletion and amortization in the accompanying Consolidated Statements of Operations and was $23,944, $23,078, and $23,541 for the years ended December 31, 2023, 2022, and 2021 respectively.
Depletion expense for the years ended December 31, 2023, 2022, and 2021 includes a credit of ($34), a credit of ($3,016), and an expense of $5,782, respectively, related to revisions to asset retirement obligations. Refer to Note 15 for further disclosures related to asset retirement obligations.
Leases
In accordance with ASC 842, the Company recognizes right of use assets and lease liabilities on the Consolidated Balance Sheets for all leases with a term longer than 12 months. Some of these leases include both lease and non-lease components which are accounted for as a single lease component as the Company has elected the practical expedient to combine these components for all leases. The discount rates used to determine the present value of the lease assets and liabilities are based on the Company’s incremental borrowing rate at the lease commencement date and commensurate with the remaining lease term. As the rates implicit in most of the Company’s leases are not readily determinable, the Company uses a collateralized incremental borrowing rate based on the information available at the lease commencement date in determining the present value of future payments. The Company uses the portfolio approach and groups leases by short-term and long-term categories, applying the corresponding incremental borrowing rates to these categories of leases. For leases with a term of 12 months or less, no right of use assets or liabilities are recognized on the Consolidated Balance Sheets and the Company recognizes the lease expense on a straight-line basis over the lease term. Additionally, the Company recognizes variable lease payments as an expense in the period incurred. The Company has elected to show net instead of gross amounts for right-of-use assets and liabilities within its Consolidated Statements of Cash Flows. Refer to Note 11 for further information.
Acquired Intangibles
The Company has recognized assets for acquired mine permits which were valued based on the replacement cost and lost profits method as of the Merger date. The balances of such assets as of December 31, 2023 and 2022, net of accumulated amortization, were $46,579 and $55,102, respectively, and are included within Other acquired intangibles, net of accumulated amortization, on the Company’s Consolidated Balance Sheets.
The acquired mine permits are amortized over the estimated life of the associated mine. Amortization expense is included in Amortization of acquired intangibles, net in the accompanying Consolidated Statements of Operations and was $8,523, $19,498, and $13,571 for the years ended December 31, 2023, 2022, and 2021, respectively.
ALPHA METALLURGICAL RESOURCES, INC. AND SUBSIDIARIES
Notes to Consolidated Financial Statements
(Amounts in thousands except share and per share data)
Additionally, the Company previously recognized assets for acquired above market-priced coal supply agreements and liabilities for acquired below market-priced coal supply agreements. The agreements were amortized over the actual number of tons shipped over the life of each contract. Amortization expense is included in Amortization of acquired intangibles, net in the accompanying Consolidated Statements of Operations and was $0, $0, and ($327) for the years ended December 31, 2023, 2022, and 2021, respectively.
Future net amortization expense related to acquired intangibles is expected to be $6,703, $5,892, $5,373, $4,790, $4,790, and $19,031 for 2024, 2025, 2026, 2027, 2028, and after 2028, respectively.
Goodwill
Goodwill represents the excess of the purchase price over the fair value of the net identifiable tangible and intangible assets of acquired companies. Goodwill for the years ended December 31, 2023 and 2022 was $11,124 and $10,736, respectively, and is included within Other non-current assets on the Company’s Consolidated Balance Sheets. In January 2023, primarily to secure additional coal trucks and related equipment and facilities, the Company purchased substantially all the assets of a freight, hauling and transportation services business for $11,919, resulting in $388 of goodwill. The acquired goodwill, related primarily to the acquired workforce and expected cost synergies, was allocated to the Company's Met reportable segment. In December 2022, the Company purchased substantially all of the assets of a mining equipment component manufacturing and rebuild business to help secure the supply of certain underground mining equipment parts needed for the Company’s operations for $24,878, which included $7,787 of working capital, $6,355 of property, plant, and equipment, and $10,736 of goodwill. The acquired goodwill, related primarily to the acquired workforce and expected cost synergies, was allocated to the Company’s Met reportable segment. Goodwill is not amortized; instead, it is tested for impairment annually as of October 31 of each year or more frequently if indicators of impairment exist.
The Company assesses goodwill for impairment on a qualitative basis. If the Company determines that more likely than not the fair value of a reporting unit containing goodwill exceeds its carrying amount, no further impairment testing is required. If the qualitative assessment indicates that an impairment potentially exists, then the Company quantitatively tests goodwill for impairment by comparing the fair value of the reporting unit to its carrying amount. If the fair value of the reporting unit is lower than its carrying amount, its goodwill is written down by the lesser of the amount by which the reporting units carrying amount exceeded its fair value or its carrying amount of goodwill.
Asset Impairment
Long-lived assets, such as property, plant, and equipment, mineral rights, and acquired intangibles subject to amortization, are reviewed for impairment whenever events or changes in circumstances indicate that the carrying amount of an asset or asset groups may not be recoverable. Recoverability of assets or asset groups to be held and used is measured by a comparison of the carrying amount of an asset or asset group to the estimated undiscounted future cash flows expected to be generated by the asset or asset group. Long-lived assets located in a close geographic area are grouped together for purposes of impairment testing when, after considering revenue and cost interdependencies, circumstances indicate the assets are used together to produce future cash flows. The Company’s asset groups generally consist of the assets and applicable liabilities of one or more mines and preparation plants and associated coal reserves for which cash flows are largely independent of cash flows of other mines, preparation plants, and associated coal reserves. If the carrying amount of an asset or asset group exceeds its estimated future cash flows, the potential impairment is equal to the amount by which the carrying amount of the asset or asset group exceeds the fair value of the asset or asset group. The Company estimates the fair value of an asset group generally using discounted cash flow analysis based on estimates of future sales volumes, coal prices, production costs, and a risk-adjusted cost of capital. These estimates generally constitute unobservable Level 3 inputs under the fair value hierarchy. The amount of impairment, if any, is allocated to the long-lived assets on a pro-rata basis, except that the carrying value of the individual long-lived assets are not reduced below their estimated fair value.
ALPHA METALLURGICAL RESOURCES, INC. AND SUBSIDIARIES
Notes to Consolidated Financial Statements
(Amounts in thousands except share and per share data)
Asset Retirement Obligations
Minimum standards for mine reclamation have been established by various regulatory agencies and dictate the reclamation requirements at the Company’s operations. The Company’s asset retirement obligations consist principally of costs to reclaim acreage disturbed at surface operations and estimated costs to reclaim support acreage, treat mine water discharge, and perform other related functions at underground mines. The Company records these reclamation obligations at fair value in the period in which the legal obligation associated with the retirement of the long-lived asset is incurred. Changes to the liability at operations that are not currently being reclaimed are offset by increasing or decreasing the carrying amount of the related long-lived asset. Changes to the liability at operations that are currently being reclaimed are recorded to Depreciation, depletion, and amortization. Over time, the liability is accreted and any capitalized cost is depreciated or depleted over the useful life of the related asset. To settle the liability, the obligation is paid, and any difference between the liability and the amount of cash paid is recorded within Depreciation, depletion and amortization within the Consolidated Statements of Operations at the time the reclamation work is completed. On at least an annual basis, the Company reviews its estimated future cash flows for its asset retirement obligations. Refer to Note 15 for further information.
Income Taxes
The Company recognizes deferred tax assets and liabilities using enacted tax rates for the effect of temporary differences between the book and tax bases of recorded assets and liabilities. Deferred tax assets are reduced by a valuation allowance if it is more likely than not that some portion or all of the deferred tax assets will not be realized. In evaluating its ability to recover deferred tax assets within the jurisdiction in which they arise, the Company considers all available positive and negative evidence, including the expected reversals of deferred tax liabilities, projected future taxable income, taxable income available via carryback to prior years, tax planning strategies, and results of recent operations. The Company assesses the realizability of its deferred tax assets, including scheduling the reversal of its deferred tax assets and liabilities, to determine the amount of valuation allowance needed. Scheduling the reversal of deferred tax asset and liability balances requires judgment and estimation. The Company believes the deferred tax liabilities relied upon as future taxable income in its assessment will reverse in the same period and jurisdiction and are of the same character as the temporary differences giving rise to the deferred tax assets that will be realized. Refer to Note 17 for further information.
Deferred Financing Costs
The costs to obtain new debt financing or amend existing financing agreements are generally deferred and amortized to interest expense over the life of the related indebtedness or credit facility using the effective interest method. Unamortized deferred financing costs are presented in the Consolidated Balance Sheets as a direct deduction from the carrying amount of the debt liability, consistent with debt discounts or premiums. Unamortized deferred financing costs associated with undrawn credit facilities are included in the Consolidated Balance Sheets within Other non-current assets.
Revenue Recognition
In accordance with ASC 606 Revenue from Contracts with Customers (“ASC 606”), the Company measures revenue based on the consideration specified in a contract with a customer and recognizes revenue as a result of satisfying its promise to transfer goods or services in a contract with a customer using the following general revenue recognition five-step model: (1) identify the contract; (2) identify performance obligations; (3) determine transaction price; (4) allocate transaction price; and (5) recognize revenue. Freight and handling costs paid to third-party carriers and invoiced to coal customers are recorded as freight and handling costs and freight and handling fulfillment revenues within cost of coal sales and coal revenues, respectively. Refer to Note 3 for further information.
Workers’ Compensation and Pneumoconiosis (Black Lung) Benefits
Workers’ Compensation
As of December 31, 2023, the Company’s subsidiaries generally utilize high-deductible insurance programs for workers’ compensation claims at its operations with the exception of certain subsidiaries in which the Company is a qualified self-insurer for workers’ compensation obligations. The liabilities for workers’ compensation claims are estimates of the ultimate losses incurred based on the Company’s experience and include a provision for incurred but not reported losses. Adjustments to the probable ultimate liabilities are made annually based on an actuarial study and adjustments to the liability are recorded based on the results of this study. These short-term and long-term obligations are included in the Consolidated Balance Sheets within Accrued expenses and other current liabilities and Workers’ compensation and black lung obligations, respectively, with the related expected insurance receivables within Prepaid expenses and other current assets and Other non-current assets.
ALPHA METALLURGICAL RESOURCES, INC. AND SUBSIDIARIES
Notes to Consolidated Financial Statements
(Amounts in thousands except share and per share data)
As of December 31, 2023 and 2022, the workers’ compensation liability was net of a discount of $22,205 and $22,824, respectively, related to fair value adjustments associated with acquisition accounting. Refer to Note 18 for further information.
Black Lung Benefits
The Company is required by federal and state statutes to provide benefits to employees for awards related to black lung. As of December 31, 2023, certain of the Company’s subsidiaries are insured for black lung obligations by a third-party insurance provider and certain subsidiaries are self-insured for state black lung obligations. Certain other subsidiaries are self-insured for federal black lung benefits and may fund benefit payments through a Section 501(c)(21) tax-exempt trust fund. Charges are made to operations for black lung claims, as determined by an independent actuary at the present value of the actuarially computed liability for such benefits over the employee’s applicable term of service. The Company recognizes in its Consolidated Balance sheets the amount of the Company’s unfunded Accumulated Benefit Obligation (“ABO”) at the end of the year. The actuarial gains and losses recognized in accumulated other comprehensive income (loss) are amortized into components of net periodic benefit cost over the expected lifetime of active participants (the Company does not use a corridor method). These short-term and long-term obligations are included in the Consolidated Balance Sheets within Accrued expenses and other current liabilities and Workers’ compensation and black lung obligations, respectively. Refer to Note 18 for further information.
Pension
The Company is required to recognize the overfunded or underfunded status of a defined benefit pension plan as an asset or liability in its Consolidated Balance Sheets and to recognize changes in that funded status in the year in which the changes occur through other comprehensive (loss) income. The actuarial gains and losses recognized in accumulated other comprehensive income (loss) are amortized into components of net periodic benefit cost over the average future lifetime of participants expected to have benefits (the Company does not use a corridor method). The Company is required to measure plan assets and benefit obligations as of the date of the Company’s fiscal year-end Consolidated Balance Sheet and provide the required disclosures as of the end of each fiscal year. Refer to Note 18 for information.
Postretirement Life Insurance Benefits
As part of the Alpha Natural Resources, Inc. bankruptcy reorganization plan and the Retiree Committee Settlement Agreement, the Company assumed the liability for life insurance benefits for certain disabled and non-union retired employees. Provisions are made for estimated benefits based on annual evaluations prepared by independent actuaries. Adjustments to the probable ultimate liabilities are made annually based on an actuarial study and adjustments to the liability are recorded based on the results of this study. These obligations are included in the Consolidated Balance Sheets as Accrued expenses and other current liabilities and Other non-current liabilities. Refer to Note 18 for further information.
Net Income per Share
Basic net income per share is computed by dividing net income by the weighted-average number of outstanding common shares for the period. Diluted earnings per share reflects the potential dilution that could occur if instruments that may require the issuance of common shares in the future were settled and the underlying common shares were issued. Diluted earnings per share is computed by increasing the weighted-average number of outstanding common shares computed in basic earnings per share to include the additional common shares that would be outstanding after issuance and adjusting net income for changes that would result from the issuance. Only those securities that are dilutive are included in the calculation. In periods of loss, the number of shares used to calculate diluted earnings is the same as basic earnings per share. Refer to Note 5 for further information.
Stock-Based Compensation
The Company recognizes expense for stock-based compensation awards based on their grant-date fair value. The expense is recorded over the respective service period of the underlying award. Liability classified stock-based compensation awards are remeasured each reporting period at fair value until the award is settled. The Company recognizes forfeitures of stock-based compensation awards as they occur. Refer to Note 19 for further information.
ALPHA METALLURGICAL RESOURCES, INC. AND SUBSIDIARIES
Notes to Consolidated Financial Statements
(Amounts in thousands except share and per share data)
Warrants
On July 26, 2016 (the “Initial Issue Date”), the Company issued warrants, which were classified as equity instruments, and were exercisable for cash or on a cashless basis at any time from the Initial Issue Date until July 26, 2023, and no fractional shares were issued upon warrant exercises. The exercise price and the warrant share number were adjusted in respect of certain dilutive events with respect to common stock. At 5:00 pm Eastern time on July 26, 2023 the Company’s Series A Warrants expired pursuant to their terms. Refer to Note 7 for additional information.
Equity Method Investments
Investments and membership interests in joint ventures are accounted for under the equity method of accounting if the Company has the ability to exercise significant influence, but not control, over the entity. Under the equity method of accounting, the Company’s proportionate share of the entity’s comprehensive income or loss each reporting period is reflected in Equity loss in affiliates in the Consolidated Statements of Operations. Equity method investments are reviewed for impairment whenever events or changes in circumstances indicate that the carrying amount of the investment may not be recoverable. The carrying values of the Company’s equity method investments are included within Other non-current assets on the Company’s Consolidated Balance Sheets. Refer to Notes 9 and 10 for additional information.
Recent Accounting Guidance
Segment Disclosures: In November 2023, the Financial Accounting Standards Board (“FASB”) issued Accounting Standards Update (“ASU”) 2023-07, Segment Reporting (Topic 280): Improvements to Reportable Segment Disclosures (“ASU 2023-07”). This update requires public entities to disclose significant segment expenses that are regularly provided to its chief operating decision maker and other segment items and to provide in interim periods all disclosures about a reportable segment’s profit or loss and assets that are currently required annually. The additional disclosures are required to be provided on a retrospective basis. The amendments are effective for fiscal years beginning after December 15, 2023, and interim periods within fiscal years beginning after December 15, 2024. The Company will provide the additional required disclosures upon adoption.
Income Tax Disclosures: In December 2023, the FASB issued ASU 2023-09, Income Taxes (Topic 740): Improvements to Income Tax Disclosures (“ASU 2023-09”). This update requires public business entities to disclose in their income tax rate reconciliation table additional categories of information about federal, state, and foreign income taxes and to provide additional details about the reconciling items in categories meeting a quantitative threshold. The guidance will also require entities to disclose income taxes paid, net of refunds, disaggregated by federal, state, and foreign taxes for annual periods and to disaggregate the information by jurisdiction based on a quantitative threshold. The additional disclosures are required to be provided on a prospective basis with the option to provide retrospectively. The amendments are effective for fiscal years beginning after December 15, 2024. The Company will provide the additional required disclosures upon adoption.
(3) Revenue
Disaggregation of Revenue from Contracts with Customers
ASC 606 requires that entities disclose disaggregated revenue information in categories (such as type of good or service, geography, market, type of contract, etc.) that depict how the nature, amount, timing, and uncertainty of revenue and cash flow are affected by economic factors. ASC 606 explains that the extent to which an entity’s revenue is disaggregated depends on the facts and circumstances that pertain to the entity’s contracts with customers and that some entities may need to use more than one type of category to meet the objective for disaggregating revenue.
ALPHA METALLURGICAL RESOURCES, INC. AND SUBSIDIARIES
Notes to Consolidated Financial Statements
(Amounts in thousands except share and per share data)
The Company earns revenues primarily through the sale of coal produced at Company operations and coal purchased from third parties. The Company extracts, processes and markets met and thermal coal from deep and surface mines for sale to steel and coke producers, industrial customers, and electric utilities. The Company conducts mining operations only in the United States with mines in Central Appalachia. The Company has one reportable segment: Met. In addition to the one reportable segment, the All Other category includes general corporate overhead and corporate assets and liabilities, the former CAPP - Thermal operations, and the elimination of certain intercompany activity, as well as expenses associated with certain idled/closed mines. Refer to Note 23 for further segment information.
The Company has disaggregated revenue between met coal and thermal coal and export and domestic revenues which depicts the pricing and contract differences between the two. Export revenue generally is derived by spot or short term contracts with pricing determined at the time of shipment or based on a market index; whereas domestic revenue is characterized by contracts that typically have a term of one year or longer and with fixed pricing terms. The following tables disaggregate the Company’s coal revenues by product category and by market to depict how the nature, amount, timing, and uncertainty of the Company’s coal revenues and cash flows are affected by economic factors:
|
|
|
|
|
|
|
|
|
|
|
|
|
|
|
|
|
|
|
Year Ended December 31, |
|
2023 |
|
2022 |
|
2021 |
| Export met coal revenues |
$ |
2,412,960 |
|
|
$ |
3,195,516 |
|
|
$ |
1,675,147 |
|
| Export thermal coal revenues |
126,108 |
|
|
107,961 |
|
|
30,879 |
|
| Total export coal revenues |
$ |
2,539,068 |
|
|
$ |
3,303,477 |
|
|
$ |
1,706,026 |
|
|
|
|
|
|
|
| Domestic met coal revenues |
$ |
865,667 |
|
|
$ |
687,795 |
|
|
$ |
396,160 |
|
| Domestic thermal coal revenues |
51,895 |
|
|
101,715 |
|
|
150,438 |
|
| Total domestic coal revenues |
$ |
917,562 |
|
|
$ |
789,510 |
|
|
$ |
546,598 |
|
|
|
|
|
|
|
| Total met coal revenues |
$ |
3,278,627 |
|
|
$ |
3,883,311 |
|
|
$ |
2,071,307 |
|
| Total thermal coal revenues |
178,003 |
|
|
209,676 |
|
|
181,317 |
|
| Total coal revenues |
$ |
3,456,630 |
|
|
$ |
4,092,987 |
|
|
$ |
2,252,624 |
|
Performance Obligations
The Company considers each individual transfer of coal on a per shipment basis to the customer a performance obligation. The pricing terms of the Company’s contracts with customers include fixed pricing, variable pricing, or a combination of both fixed and variable pricing. All the Company’s revenue derived from contracts with customers is recognized at a point in time. The following table includes estimated revenue expected to be recognized in the future related to performance obligations that are unsatisfied as of December 31, 2023.
|
|
|
|
|
|
|
|
|
|
|
|
|
|
|
|
|
|
|
|
|
|
|
|
|
|
|
|
|
|
|
|
|
|
|
|
|
2024 |
|
2025 |
|
2026 |
|
2027 |
|
2028 |
|
Total |
Estimated coal revenues (1) |
$ |
124,612 |
|
|
$ |
— |
|
|
$ |
— |
|
|
$ |
— |
|
|
$ |
— |
|
|
$ |
124,612 |
|
(1) Amounts only include estimated coal revenues associated with contracts with customers with fixed pricing with original expected duration of more than one year. The Company has elected not to disclose the aggregate amount of the transaction price allocated to the performance obligations that are unsatisfied (or partially unsatisfied) as of the end of the reporting period for performance obligations with either of the following conditions: 1) the remaining performance obligation is part of a contract that has an original expected duration of one year or less; or 2) the remaining performance obligation has variable consideration that is allocated entirely to a wholly unsatisfied performance obligation.
(4) Accumulated Other Comprehensive Loss
The following tables summarize the changes to accumulated other comprehensive loss during the years ended December 31, 2023, 2022, and 2021:
ALPHA METALLURGICAL RESOURCES, INC. AND SUBSIDIARIES
Notes to Consolidated Financial Statements
(Amounts in thousands except share and per share data)
|
|
|
|
|
|
|
|
|
|
|
|
|
|
|
|
|
|
|
|
|
|
|
|
|
Balance January 1, 2023 |
|
Other comprehensive loss before reclassifications |
|
Amounts reclassified from accumulated other comprehensive loss |
|
Balance December 31, 2023 |
| Employee benefit costs |
$ |
(12,162) |
|
|
$ |
(26,617) |
|
|
$ |
(1,808) |
|
|
$ |
(40,587) |
|
|
|
|
|
|
|
|
|
|
|
|
|
|
|
|
|
|
|
|
|
|
|
|
|
|
Balance January 1, 2022 |
|
Other comprehensive income before reclassifications |
|
Amounts reclassified from accumulated other comprehensive loss |
|
Balance December 31, 2022 |
| Employee benefit costs |
$ |
(58,503) |
|
|
$ |
43,597 |
|
|
$ |
2,744 |
|
|
$ |
(12,162) |
|
|
|
|
|
|
|
|
|
|
|
|
|
|
|
|
|
|
|
|
|
|
|
|
|
|
Balance January 1, 2021 |
|
Other comprehensive income before reclassifications |
|
Amounts reclassified from accumulated other comprehensive loss |
|
Balance December 31, 2021 |
| Employee benefit costs |
$ |
(111,985) |
|
|
$ |
47,461 |
|
|
$ |
6,021 |
|
|
$ |
(58,503) |
|
The following table summarizes the amounts reclassified from accumulated other comprehensive loss and the Consolidated Statements of Operations line items affected by the reclassification during the years ended December 31, 2023, 2022, and 2021:
|
|
|
|
|
|
|
|
|
|
|
|
|
|
|
|
|
|
|
|
|
|
|
|
| Details about accumulated other comprehensive loss components |
Amounts reclassified from accumulated other comprehensive loss |
|
Affected line item in the Consolidated Statements of Operations |
| Year Ended December 31, |
|
| 2023 |
|
2022 |
|
2021 |
|
| Employee benefit costs: |
|
|
|
|
|
|
|
Amortization of actuarial (gain) loss (1) |
$ |
(2,324) |
|
|
$ |
3,311 |
|
|
$ |
5,653 |
|
|
Miscellaneous (expense) income, net |
Settlement (1) |
— |
|
|
244 |
|
|
368 |
|
|
Miscellaneous (expense) income, net |
| Total before income tax |
$ |
(2,324) |
|
|
$ |
3,555 |
|
|
$ |
6,021 |
|
|
|
| Income tax benefit (expense) |
516 |
|
|
(811) |
|
|
— |
|
|
Income tax expense |
| Total, net of income tax |
$ |
(1,808) |
|
|
$ |
2,744 |
|
|
$ |
6,021 |
|
|
|
(1) These accumulated other comprehensive loss components are included in the computation of net periodic benefit costs (credits) for certain employee benefit plans. Refer to Note 18.
(5) Net Income per Share
The number of shares used to calculate basic net income per common share is based on the weighted average number of the Company’s outstanding common shares during the respective period. The number of shares used to calculate diluted net income per common share is based on the number of common shares used to calculate basic net income per common share plus the dilutive effect of stock options and other stock-based instruments held by the Company’s employees and directors during the period, and the Company’s outstanding warrants. The dilutive effect of outstanding stock-based instruments is determined by application of the treasury stock method. The stock options and warrants become dilutive for diluted net income per common share calculations when the market price of the Company’s common stock exceeds the exercise price. Anti-dilution also occurs in periods of a net loss, and the dilutive impact of all warrants and share-based compensation awards are excluded.
For the years ended December 31, 2023, 2022, and 2021, respectively, 1,240, 0, and 717,992 warrants, stock options, and other stock-based instruments were excluded from the computation of dilutive net income per common share because they would have been anti-dilutive. When applying the treasury stock method, anti-dilution generally occurs when the exercise prices or unrecognized compensation cost per share are higher than the Company’s average stock price during an applicable period.
The following table presents the net income per common share for the years ended December 31, 2023, 2022, and 2021:
ALPHA METALLURGICAL RESOURCES, INC. AND SUBSIDIARIES
Notes to Consolidated Financial Statements
(Amounts in thousands except share and per share data)
|
|
|
|
|
|
|
|
|
|
|
|
|
|
|
|
|
|
|
Year Ended December 31, |
|
2023 |
|
2022 |
|
2021 |
| Basic |
|
|
|
|
|
| Net income |
$ |
721,956 |
|
|
$ |
1,448,545 |
|
|
$ |
288,790 |
|
| Weighted average common shares outstanding - basic |
14,106,466 |
|
|
17,490,886 |
|
|
18,441,175 |
|
| Net income per common share - basic |
$ |
51.18 |
|
|
$ |
82.82 |
|
|
$ |
15.66 |
|
|
|
|
|
|
|
| Diluted |
|
|
|
|
|
| Weighted average common shares outstanding - basic |
14,106,466 |
|
|
17,490,886 |
|
|
18,441,175 |
|
| Diluted effect of warrants |
81,352 |
|
|
275,715 |
|
|
35,574 |
|
| Diluted effect of stock options |
1,400 |
|
|
4,171 |
|
|
1,753 |
|
| Diluted effect of other stock-based instruments |
453,638 |
|
|
451,625 |
|
|
393,180 |
|
| Weighted average common shares outstanding - diluted |
14,642,856 |
|
|
18,222,397 |
|
|
18,871,682 |
|
| Net income per common share - diluted |
$ |
49.30 |
|
|
$ |
79.49 |
|
|
$ |
15.30 |
|
(6) Inventories, net
Inventories, net consisted of the following:
|
|
|
|
|
|
|
|
|
|
|
|
|
December 31, |
| |
2023 |
|
2022 |
| Raw coal |
$ |
52,508 |
|
|
$ |
57,382 |
|
| Saleable coal |
120,000 |
|
|
91,474 |
|
| Materials, supplies and other, net |
58,836 |
|
|
51,718 |
|
| Total inventories, net |
$ |
231,344 |
|
|
$ |
200,574 |
|
(7) Capital Stock
Share Repurchase Program
On February 21, 2023, the Company’s Board of Directors (the “Board”) approved a $200,000 increase to the existing common share repurchase program that the Board adopted on March 4, 2022, bringing the total authorization to repurchase the Company’s stock to $1,200,000. On October 31, 2023, the Board approved an additional $300,000 increase to the share repurchase program, bringing the total authorization to repurchase the Company’s stock to $1,500,000. Share repurchases may be made from time to time through open market transactions, block trades, tender offers, or otherwise, and the program has no expiration date. The share repurchase program does not obligate the Company to acquire any particular amount of common stock or to acquire shares on any particular timetable, and the program may be suspended at any time at the Company’s discretion. Repurchases under the program are subject to market and business conditions, available liquidity, the Company’s cash needs, restrictions under agreements or obligations, legal or regulatory requirements or restrictions and other relevant factors. As of December 31, 2023, the Company had repurchased an aggregate of 6,475,271 shares under the program for an aggregate purchase price of approximately $1,040,128 (comprised of $1,039,934 of share repurchases and $194 of related fees). The Company has also accrued a stock repurchase excise tax of $4,665 related to the share repurchase program as of December 31, 2023, which is recorded in treasury stock at cost.
Dividend Program
On May 3, 2022, the Board adopted a dividend policy. Pursuant to this policy, the Board initially intended to pay aggregate cash dividends of $1.50 per share of common stock per year, with $0.375 per share paid each quarter. Subsequently, during the years ended December 31, 2022 and 2023 the Board increased the quarterly dividend amounts. In addition, pursuant to the terms of certain stock-based compensation awards under the Company’s Management Incentive Plan (the “MIP”) and Long-Term Incentive Plan (the “LTIP”), dividend equivalent amounts for each quarterly dividend will become payable at various vesting dates with respect to each underlying outstanding award.
ALPHA METALLURGICAL RESOURCES, INC. AND SUBSIDIARIES
Notes to Consolidated Financial Statements
(Amounts in thousands except share and per share data)
The Board declared the following dividends on the Company’s common stock during the year ended December 31, 2023:
|
|
|
|
|
|
|
|
|
|
|
|
|
|
|
|
|
|
|
|
|
|
|
|
|
|
|
|
|
|
|
| Total Dividend per Share |
|
Total Dividends Paid (1) |
|
Declaration Date |
|
Holders of Record Date |
|
Payable Date |
|
|
|
|
| $ |
0.44 |
|
|
$ |
6,602 |
|
|
February 21, 2023 |
|
March 15, 2023 |
|
April 3, 2023 |
|
|
|
|
| $ |
0.50 |
|
|
$ |
7,001 |
|
|
May 3, 2023 |
|
June 15, 2023 |
|
July 5, 2023 |
|
|
|
|
| $ |
0.50 |
|
|
$ |
6,736 |
|
|
August 2, 2023 |
|
September 15, 2023 |
|
October 3, 2023 |
|
|
|
|
| $ |
0.50 |
|
|
$ |
6,510 |
|
|
October 31, 2023 |
|
December 1, 2023 |
|
December 15, 2023 |
|
|
|
|
| $ |
1.94 |
|
|
$ |
26,849 |
|
|
|
|
|
|
|
|
|
|
|
(1) Excludes dividend equivalents paid or accrued of $899 as of December 31, 2023.
The decision to declare and pay cash dividends will be made by the Board and will depend on the Company’s earnings, financial condition and other relevant factors. On August 2, 2023, the Board determined to end the Company’s fixed dividend program following the quarterly dividend declared and paid in the fourth quarter of 2023 and to focus instead on the Company’s share repurchase program.
Warrants
On July 26, 2016, the Company issued 810,811 warrants, which were classified as equity instruments. Pursuant to the underlying warrant agreement, the warrants were exercisable for cash or on a cashless basis at any time until their expiration, and no fractional shares were to be issued upon warrant exercise. Pursuant to the underlying warrant agreement (refer to Note 2), the exercise price was adjusted from $45.086 per share to $44.972 per share as of the March 15, 2023 dividend record date and to $44.820 per share as of the June 15, 2023 dividend record date, while the warrant share number remained unchanged at 1.20. At 5:00 pm Eastern time on July 26, 2023 the Company’s Series A Warrants expired pursuant to their terms.
As of December 31, 2023, no warrants remained outstanding as the warrants expired during the third quarter of 2023. For the year ended December 31, 2023, the Company issued 169,028 shares of common stock resulting from exercises of its warrants and, pursuant to the terms of the underlying warrant agreement, withheld 20,139 of the issued shares in satisfaction of the warrant exercise price and in lieu of fractional shares, which were subsequently reclassified as treasury stock in the amount of $2,368.
As of December 31, 2022, 190,838 warrants were outstanding, with a total of 229,006 shares underlying the un-exercised warrants. For the year ended December 31, 2022, the Company issued 702,182 shares of common stock resulting from exercises of its warrants and, pursuant to the terms of the underlying warrant agreement, withheld 187,857 of the issued shares in satisfaction of the warrant exercise price and in lieu of fractional shares, which were subsequently reclassified as treasury stock in the amount of $18,509.
As of December 31, 2021, 801,246 warrants were outstanding, with a total of 921,433 shares underlying the un-exercised warrants. For the year ended December 31, 2021, the Company issued 143 shares of common stock resulting from exercises of its warrants and, pursuant to the terms of the underlying warrant agreement, withheld 17 of the issued shares in satisfaction of the warrant exercise price and in lieu of fractional shares, which were subsequently reclassified as treasury stock.
ALPHA METALLURGICAL RESOURCES, INC. AND SUBSIDIARIES
Notes to Consolidated Financial Statements
(Amounts in thousands except share and per share data)
(8) Property, Plant, and Equipment, net
Property, plant, and equipment, net, consisted of the following:
|
|
|
|
|
|
|
|
|
|
|
|
|
December 31, |
| |
2023 |
|
2022 |
| Plant and mining equipment |
$ |
890,327 |
|
|
$ |
723,056 |
|
| Mine development |
162,285 |
|
|
130,144 |
|
| Land |
32,033 |
|
|
27,937 |
|
| Office equipment, software and other |
5,356 |
|
|
3,111 |
|
| Construction in progress |
57,896 |
|
|
49,583 |
|
| Total property, equipment and mine development costs |
$ |
1,147,897 |
|
|
$ |
933,831 |
|
| Less accumulated depreciation and amortization |
(558,905) |
|
|
(491,186) |
|
| Total property, plant, and equipment, net |
$ |
588,992 |
|
|
$ |
442,645 |
|
Included in plant and mining equipment are assets under financing leases totaling $10,964 and $13,139 with accumulated depreciation of $5,015 and $7,710 as of December 31, 2023 and 2022, respectively.
Depreciation and amortization expense associated with property, plant, equipment and non-mineral asset retirement obligation assets, net, was $112,925, $84,542, and $86,506 for the years ended December 31, 2023, 2022, and 2021 respectively.
Depreciation expense for the years ended December 31, 2023, 2022, and 2021 includes an expense of $7,343, and credits of ($1,344) and ($307), respectively, related to revisions to asset retirement obligations. Refer to Note 15 for further disclosures related to asset retirement obligations.
As of December 31, 2023, the Company had unconditional purchase obligations for approximately $48,557 of new equipment purchase commitments expected to be acquired at various dates in 2024.
(9) Other Non-Current Assets
Other non-current assets consisted of the following:
|
|
|
|
|
|
|
|
|
|
|
|
|
December 31, |
|
2023 |
|
2022 |
| Advanced mining royalties |
$ |
7,493 |
|
|
$ |
7,476 |
|
| Long-term deposits |
5,350 |
|
|
1,363 |
|
| Equity method investments |
31,670 |
|
|
23,070 |
|
| Workers’ compensation receivables |
37,951 |
|
|
44,734 |
|
| Goodwill |
11,124 |
|
|
10,736 |
|
| Other |
12,898 |
|
|
15,816 |
|
| Total other non-current assets |
$ |
106,486 |
|
|
$ |
103,195 |
|
(10) Equity Method Investments
The Company holds a 65% partnership interest in Dominion Terminal Associates LLP (“DTA”) which operates a ground storage-to-vessel coal transloading facility in Newport News, Virginia for use by its partners. As the Company shares power with its minority partner through equal management committee representation, the Company does not control DTA. Under the terms of operating and throughput and handling agreements, each partner is charged its share of cash operating costs in exchange for the right to use the facility’s loading capacity and is required to make periodic cash advances to fund such costs.
ALPHA METALLURGICAL RESOURCES, INC. AND SUBSIDIARIES
Notes to Consolidated Financial Statements
(Amounts in thousands except share and per share data)
The Company’s equity method investees do not have long-term debt obligations and the Company is not contingently obligated to make any future financing-related payments with respect to its equity method investees.
(11) Leases
The Company’s lease population consists primarily of vehicle and heavy equipment leases and leases for office equipment. The Company’s building and land leases relate to corporate office space and certain site offices. The Company determines whether a contract contains a lease based on whether the Company obtains the right to control the use of specifically identifiable property, plant, and equipment for a period of time in exchange for consideration. For the years ended December 31, 2023, 2022, and 2021 the Company identified no instances requiring significant judgment in determining whether any contracts entered into during the period were or were not leases. Additionally, the Company had no material sublease agreements within the scope of ASC 842 or lease agreements for which the Company was the lessor for the years ended December 31, 2023, 2022, and 2021.
Renewal options in the Company’s lease population primarily relate to month-to-month extensions on vehicle leases and are immaterial both individually and in the aggregate. The Company includes renewal options that are reasonably certain to be exercised in the measurement of lease liabilities. As of December 31, 2023, the Company does not intend to exercise any termination options on existing leases.
As of December 31, 2023 and 2022, the Company had the following right-of-use assets and lease liabilities within the Company’s Consolidated Balance Sheets:
|
|
|
|
|
|
|
|
|
|
|
|
|
|
|
|
|
|
|
|
|
December 31, 2023 |
|
December 31, 2022 |
| Assets |
Balance Sheet Classification |
|
|
|
|
| Financing lease assets |
Property, plant, and equipment, net |
|
$ |
5,949 |
|
|
$ |
5,429 |
|
| Operating lease right-of-use assets |
Other non-current assets |
|
4,038 |
|
|
4,488 |
|
| Total lease assets |
|
|
$ |
9,987 |
|
|
$ |
9,917 |
|
|
|
|
|
|
|
| Liabilities |
Balance Sheet Classification |
|
|
|
|
| Financing lease liabilities - current |
Current portion of long-term debt |
|
$ |
1,280 |
|
|
$ |
1,052 |
|
| Operating lease liabilities - current |
Accrued expenses and other current liabilities |
|
572 |
|
|
612 |
|
| Financing lease liabilities - long-term |
Long-term debt |
|
3,997 |
|
|
3,744 |
|
| Operating lease liabilities - long-term |
Other non-current liabilities |
|
3,466 |
|
|
3,876 |
|
| Total lease liabilities |
|
|
$ |
9,315 |
|
|
$ |
9,284 |
|
Total lease costs and other lease information for the years ended December 31, 2023, 2022, and 2021 included the following:
|
|
|
|
|
|
|
|
|
|
|
|
|
|
|
|
|
|
|
Year Ended December 31, |
|
2023 |
|
2022 |
|
2021 |
Lease cost (1) |
|
|
|
|
|
| Financing lease cost: |
|
|
|
|
|
| Amortization of leased assets |
$ |
1,444 |
|
|
$ |
2,644 |
|
|
$ |
2,061 |
|
| Interest on lease liabilities |
651 |
|
|
315 |
|
|
245 |
|
| Operating lease cost |
1,127 |
|
|
1,113 |
|
|
1,383 |
|
| Short-term lease cost |
1,315 |
|
|
1,234 |
|
|
786 |
|
| Total lease cost |
$ |
4,537 |
|
|
$ |
5,306 |
|
|
$ |
4,475 |
|
(1) The Company had no variable lease costs or sublease income for the years ended December 31, 2023, 2022, and 2021.
ALPHA METALLURGICAL RESOURCES, INC. AND SUBSIDIARIES
Notes to Consolidated Financial Statements
(Amounts in thousands except share and per share data)
|
|
|
|
|
|
|
|
|
|
|
|
|
|
|
|
|
|
|
Year Ended December 31, |
|
2023 |
|
2022 |
|
2021 |
| Other information |
|
|
|
|
|
| Cash paid for amounts included in the measurement of lease liabilities |
$ |
4,571 |
|
|
$ |
5,556 |
|
|
$ |
4,478 |
|
| Operating cash flows from financing leases |
$ |
651 |
|
|
$ |
315 |
|
|
$ |
245 |
|
| Operating cash flows from operating leases |
$ |
2,443 |
|
|
$ |
2,347 |
|
|
$ |
2,169 |
|
| Financing cash flows from financing leases |
$ |
1,477 |
|
|
$ |
2,894 |
|
|
$ |
2,064 |
|
| Right-of-use assets obtained in exchange for new financing lease liabilities |
$ |
1,891 |
|
|
$ |
4,728 |
|
|
$ |
703 |
|
| Right-of-use assets obtained in exchange for new operating lease liabilities |
$ |
206 |
|
|
$ |
48 |
|
|
$ |
275 |
|
|
|
|
|
|
|
| Lease Term and Discount Rate |
|
|
|
|
|
| Weighted-average remaining lease term in years - financing leases |
5.10 |
|
5.90 |
|
1.75 |
| Weighted-average remaining lease term in years - operating leases |
6.30 |
|
7.10 |
|
7.88 |
| Weighted-average discount rate - financing leases |
12.3 |
% |
|
13.5 |
% |
|
9.6 |
% |
| Weighted-average discount rate - operating leases |
11.4 |
% |
|
11.6 |
% |
|
11.3 |
% |
The Company has elected to show net instead of gross amounts for right-of-use assets and liabilities within its Consolidated Statements of Cash Flows.
The following table summarizes the maturity of the Company’s lease liabilities on an undiscounted cash flow basis and a reconciliation to the lease liabilities recognized in the Company’s Consolidated Balance Sheets as of December 31, 2023:
|
|
|
|
|
|
|
|
|
|
|
|
|
Financing Leases |
|
Operating Leases |
| Lease cost |
|
|
|
| 2024 |
$ |
1,850 |
|
|
$ |
1,003 |
|
| 2025 |
1,740 |
|
|
952 |
|
| 2026 |
1,205 |
|
|
918 |
|
| 2027 |
646 |
|
|
747 |
|
| 2028 |
360 |
|
|
677 |
|
| Thereafter |
1,387 |
|
|
1,412 |
|
| Total future minimum lease payments |
$ |
7,188 |
|
|
$ |
5,709 |
|
| Imputed interest |
(1,911) |
|
|
(1,671) |
|
| Present value of future minimum lease payments |
$ |
5,277 |
|
|
$ |
4,038 |
|
As of December 31, 2023, the Company had no leases with future commencement dates that will create significant rights or obligations for the Company.
ALPHA METALLURGICAL RESOURCES, INC. AND SUBSIDIARIES
Notes to Consolidated Financial Statements
(Amounts in thousands except share and per share data)
(12) Accrued Expenses and Other Current Liabilities
Accrued expenses and other current liabilities consisted of the following:
|
|
|
|
|
|
|
|
|
|
|
|
|
December 31, |
| |
2023 |
|
2022 |
| Wages and benefits |
$ |
62,811 |
|
|
$ |
69,458 |
|
| Workers’ compensation |
10,482 |
|
|
11,651 |
|
| Black lung |
10,687 |
|
|
9,664 |
|
| Taxes other than income taxes |
31,236 |
|
|
24,959 |
|
| Asset retirement obligations |
38,915 |
|
|
36,963 |
|
| Dividend payable |
2,342 |
|
|
86,118 |
|
| Freight accrual |
8,461 |
|
|
7,181 |
|
| Other |
12,578 |
|
|
19,262 |
|
| Total accrued expenses and other current liabilities |
$ |
177,512 |
|
|
$ |
265,256 |
|
(13) Long-Term Debt
Long-term debt consisted of the following:
|
|
|
|
|
|
|
|
|
|
|
|
|
December 31, |
| |
2023 |
|
2022 |
| Notes payable and other |
$ |
5,097 |
|
|
$ |
6,179 |
|
| Financing leases |
5,277 |
|
|
4,796 |
|
| Total long-term debt |
$ |
10,374 |
|
|
$ |
10,975 |
|
| Less current portion |
(3,582) |
|
|
(3,078) |
|
| Long-term debt, net of current portion |
$ |
6,792 |
|
|
$ |
7,897 |
|
Second Amended and Restated Asset-Based Revolving Credit Agreement
On December 6, 2021, the Company entered into the Second Amended and Restated Asset-Based Revolving Credit Agreement (“ABL Agreement”) with Citibank N.A as administrative agent, collateral agent, swingline lender, and letter of credit (“LC”) issuer and the other lenders party thereto (the “Lenders”), and BMO Harris Bank N.A and Eclipse Business Capital LLC as co-collateral agents. The ABL Agreement included a senior secured asset-based revolving credit facility (the “ABL Facility”) under which the Company could borrow cash or obtain LCs, on a revolving basis, in an aggregate amount of up to $155,000, of which no more than $150,000 could represent outstanding LCs ($125,000 on a committed basis and another $25,000 on an uncommitted cash collateralized basis). The facility’s maturity date was December 6, 2024. Under the terms of the ABL Agreement, LCs fees were calculated at 5.25%, while borrowings bore interest based on the character of the loan (defined as either secured overnight financing rate “SOFR” Loan (“SOFR Loan”) or “Base Rate Loan”) plus an applicable rate of 4.50% for SOFR Loans and 3.50% for Base Rate Loans. Pursuant to terms of the ABL Agreement, the Company elected the character of the loan, the interest period, and could provide notice of continuation or conversion of the borrowed principal amount with the ability to repay the borrowed principal amount in advance of the maturity date without penalty. As of December 31, 2022, no borrowings were outstanding under the ABL Facility.
Any LC issued under the ABL Facility bore a commitment fee rate of 0.50%, and a fronting fee of 0.25% of the face amount under each LC. As of December 31, 2022, the Company had $61,877 LCs outstanding under the ABL Facility.
ALPHA METALLURGICAL RESOURCES, INC. AND SUBSIDIARIES
Notes to Consolidated Financial Statements
(Amounts in thousands except share and per share data)
New ABL Agreement
On October 27, 2023, the Company terminated its existing ABL Agreement and along with certain of its directly and indirectly owned subsidiaries (the “Borrowers”) entered into a new Credit Agreement (the “New ABL Agreement”) with Regions Bank, as lender, swingline lender, LC issuer, administrative agent, collateral agent, and lead arranger, along with ServisFirst Bank and Texas Capital Bank, as joint lead arrangers and the other lenders party thereto. In connection with the termination, the Company recorded a loss on extinguishment of debt of $2,753 related to the write-off of unamortized debt issuance costs for and fees paid to exiting lenders. The New ABL Agreement continues to include an asset-based revolving credit facility (the “New ABL Facility”) which allows the Company to borrow cash or obtain LCs, on a revolving basis, in an aggregate amount of up to $155,000. The Company may request an increase to the capacity of the facility of up to $75,000 provided that $25,000 may be solely for the purpose of providing additional availability to obtain cash collateralized LCs. Availability under the New ABL Facility is calculated monthly and fluctuates based on qualifying amounts of coal inventory, trade accounts receivable and in certain circumstances specified amounts of cash. The Company must maintain minimum Liquidity, as defined in the New ABL Agreement, of $75,000. The New ABL Facility matures on October 27, 2027. As part of the transition from the previous ABL Facility to the New ABL Facility, the Company temporarily cash collateralized outstanding LCs until replacement LCs could be issued under the New ABL Facility. As of December 31, 2023, the Company had $31 of cash collateralized LCs remaining to be replaced. During the first quarter of 2024, the remaining cash collateralized LCs from the previous ABL Facility were cancelled with no replacement required and the cash collateral was returned.
Under the terms of the New ABL Facility, LC fees will be calculated at 3.25% (including a fronting fee of 0.25%) while future borrowings will bear interest based on the character of the loan (defined as either a “Term Secured Overnight Financing Rate Loan” (or “Term SOFR Loan”) or a “Base Rate Loan”) plus an applicable rate of 3.10% for a Term SOFR Loan and 2.00% for a Base Rate Loan. The Company may elect the character and interest period for each loan. All amounts borrowed may be repaid prior to maturity without penalty. A commitment fee of 0.375% will be charged on any unused capacity. As of December 31, 2023, the Company had no amount borrowed and $60,896 LCs outstanding under the New ABL Facility.
The New ABL Facility is guaranteed by substantially all of Alpha’s directly and indirectly owned subsidiaries that are not Borrowers (the “Guarantors”) and is secured by all or substantially all assets of the Borrowers and Guarantors. The New ABL Agreement and related documents contain negative and affirmative covenants including certain financial covenants. The Company is in compliance with all covenants under these agreements as of December 31, 2023.
Future Maturities
Future maturities of long-term debt as of December 31, 2023 are as follows:
|
|
|
|
|
|
| 2024 |
$ |
3,582 |
|
| 2025 |
3,425 |
|
| 2026 |
1,637 |
|
| 2027 |
451 |
|
| 2028 |
200 |
|
| After 2028 |
1,079 |
|
| Total long-term debt |
$ |
10,374 |
|
(14) Acquisition-Related Obligations
Acquisition-related obligations consisted of the following:
ALPHA METALLURGICAL RESOURCES, INC. AND SUBSIDIARIES
Notes to Consolidated Financial Statements
(Amounts in thousands except share and per share data)
|
|
|
|
|
|
|
|
|
|
|
|
|
December 31, |
|
2023 |
|
2022 |
| Contingent Revenue Obligation |
$ |
— |
|
|
$ |
27,719 |
|
| Environmental Settlement Obligations |
— |
|
|
535 |
|
| Total acquisition-related obligations |
$ |
— |
|
|
$ |
28,254 |
|
| Less current portion |
— |
|
|
(28,254) |
|
| Acquisition-related obligations, net of current portion |
$ |
— |
|
|
$ |
— |
|
Contingent Revenue Obligation
As a result of the Merger, the Company assumed a contingent revenue payment obligation (the “Contingent Revenue Obligation”) to certain of the Merger Companies’ creditors pursuant to the terms stipulated within the bankruptcy settlement previously entered into by the Merger Companies. Pursuant to terms of the obligation, the annual obligation was limited to revenues derived from legacy operations for the Merger Companies and did not include revenues related to legacy Alpha Metallurgical Resources, Inc. operations. The Contingent Revenue Obligation consisted of a contingent revenue payment of 1.5% of annual gross revenues of the legacy operations for the Merger Companies up to $500,000 and 1.0% of annual gross revenue of the legacy operations for the Merger Companies in excess of $500,000 through the period ended December 31, 2022. During the first quarter of 2023, the Company paid the final calculated payment pursuant to terms of the Contingent Revenue Obligation. Refer to Note 16 for further disclosures related to the fair value assignment and methods used.
Refer to Note 20 for disclosures related to a Contingent Revenue Obligation repurchase transaction with a related party during the fourth quarter of 2021.
(15) Asset Retirement Obligations
The following table summarizes the changes in asset retirement obligations for the years ended December 31, 2023 and 2022:
|
|
|
|
|
|
| Total asset retirement obligations at December 31, 2021 |
$ |
164,172 |
|
| Accretion for the period |
23,765 |
|
| Sites added during the period |
9,602 |
|
| Revisions in estimated cash flows |
304 |
|
| Expenditures for the period |
(18,832) |
|
| Total asset retirement obligations at December 31, 2022 |
$ |
179,011 |
|
| Accretion for the period |
25,500 |
|
| Sites added during the period |
204 |
|
Revisions in estimated cash flows (1) |
20,946 |
|
| Expenditures for the period |
(20,237) |
|
| Total asset retirement obligations at December 31, 2023 |
$ |
205,424 |
|
Less current portion (2) |
(38,915) |
|
| Long-term portion |
$ |
166,509 |
|
(1) The revisions in estimated cash flows resulted primarily from a decrease in the discount rate and changes in mine plans.
(2) Included within Accrued expenses and other current liabilities on the Company’s Consolidated Balance Sheets. Refer to Note 12.
(16) Fair Value of Financial Instruments and Fair Value Measurements
The estimated fair values of financial instruments are determined based on relevant market information. These estimates involve uncertainty and cannot be determined with precision.
ALPHA METALLURGICAL RESOURCES, INC. AND SUBSIDIARIES
Notes to Consolidated Financial Statements
(Amounts in thousands except share and per share data)
The carrying amounts for cash and cash equivalents, trade accounts receivable, net, prepaid expenses and other current assets, restricted cash, deposits, trade accounts payable, notes payable and other, financing leases, accrued expenses and other current liabilities, and environmental settlement obligations approximate fair value as of December 31, 2023 and 2022 due to the short maturity of these instruments.
The following table sets forth by level, within the fair value hierarchy, the Company’s financial and non-financial assets and liabilities that were accounted for at fair value on a recurring basis as of December 31, 2023 and 2022. Financial and non-financial assets and liabilities are classified in their entirety based on the lowest level of input that is significant to the fair value measurement. The Company’s assessment of the significance of a particular input to the fair value measurement requires judgment, and may affect the determination of fair value for assets and liabilities and their placement within the fair value hierarchy levels.
|
|
|
|
|
|
|
|
|
|
|
|
|
|
|
|
|
|
|
|
|
|
|
|
| |
December 31, 2023 |
|
Total Fair Value |
|
Quoted Prices in Active Markets (Level 1) |
|
Significant Other Observable Inputs (Level 2) |
|
Significant Unobservable Inputs (Level 3) |
Trading securities (1) |
$ |
40,597 |
|
|
$ |
— |
|
|
$ |
40,597 |
|
|
$ |
— |
|
(1) Classified as Long-term restricted investments on the Company’s Consolidated Balance Sheets.
|
|
|
|
|
|
|
|
|
|
|
|
|
|
|
|
|
|
|
|
|
|
|
|
| |
December 31, 2022 |
|
Total Fair Value |
|
Quoted Prices in Active Markets (Level 1) |
|
Significant Other Observable Inputs (Level 2) |
|
Significant Unobservable Inputs (Level 3) |
| Contingent Revenue Obligation |
$ |
27,719 |
|
|
$ |
— |
|
|
$ |
— |
|
|
$ |
27,719 |
|
Trading securities (1) |
$ |
151,787 |
|
|
$ |
— |
|
|
$ |
151,787 |
|
|
$ |
— |
|
(1) Includes $46,052 classified as Short-term investments and $105,735 classified as Long-term restricted investments on the Company’s Consolidated Balance Sheets.
The following tables are reconciliations of the financial and non-financial assets and liabilities that were accounted for at fair value on a recurring basis and that were categorized within Level 3 of the fair value hierarchy:
|
|
|
|
|
|
|
|
|
|
|
|
|
|
|
|
|
|
|
|
|
|
|
|
|
|
|
|
|
|
|
December 31, 2022 |
|
Payments |
|
Loss Recognized in Earnings |
|
Transfer In (Out) of Level 3 Fair Value Hierarchy |
|
December 31, 2023 |
| Contingent Revenue Obligation |
$ |
27,719 |
|
|
$ |
(27,719) |
|
|
$ |
— |
|
|
$ |
— |
|
|
$ |
— |
|
|
|
|
|
|
|
|
|
|
|
|
|
|
|
|
|
|
|
|
|
|
|
|
|
|
|
|
|
|
|
|
December 31, 2021 |
|
Payments |
|
Loss Recognized in Earnings |
|
Transfer In (Out) of Level 3 Fair Value Hierarchy |
|
December 31, 2022 |
| Contingent Revenue Obligation |
$ |
35,005 |
|
|
$ |
(16,166) |
|
|
$ |
8,880 |
|
|
$ |
— |
|
|
$ |
27,719 |
|
(1) The loss recognized in earnings resulted primarily from an increase in forecasted future revenue as of December 31, 2022.
The following methods and assumptions were used to estimate the fair values of the assets and liabilities in the tables above:
Level 2 Fair Value Measurements
Trading Securities - Typically includes certificates of deposit, corporate fixed income, and U.S. government securities. The fair values are obtained from a third-party pricing service provider. The fair values provided by the pricing service provider are based on observable market inputs including credit spreads and broker-dealer quotes, among other inputs. The Company classifies the prices obtained from the pricing services within Level 2 of the fair value hierarchy because the underlying inputs are directly observable from active markets. However, the pricing models used entail a certain amount of subjectivity and therefore differing judgments in how the underlying inputs are modeled could result in different estimates of fair value.
ALPHA METALLURGICAL RESOURCES, INC. AND SUBSIDIARIES
Notes to Consolidated Financial Statements
(Amounts in thousands except share and per share data)
Level 3 Fair Value Measurements
Contingent Revenue Obligation - The fair value of the Contingent Revenue Obligation was estimated using a Black-Scholes pricing model. The inputs included in the Black-Scholes pricing model are the Company’s forecasted future revenue, the stated royalty rate, the remaining periods in the obligation, annual risk-free interest rate based on the U.S. Constant Maturity Treasury Curve and annualized volatility. The annualized volatility was calculated by observing volatilities for comparable companies with adjustments for the Company's size and leverage. As the royalty period ended on December 31, 2022, the fair value of the remaining obligation as of that date represents the actual final calculated payment made during the first quarter of 2023. Refer to Note 14 for additional information.
(17) Income Taxes
Significant components of income tax expense (benefit) were as follows:
|
|
|
|
|
|
|
|
|
|
|
|
|
|
|
|
|
|
|
Year Ended December 31, |
|
2023 |
|
2022 |
|
2021 |
| Current tax expense: |
|
|
|
|
|
| Federal |
$ |
80,254 |
|
|
$ |
114,106 |
|
|
$ |
2,422 |
|
| State |
3,527 |
|
|
6,620 |
|
|
1,149 |
|
| Total current |
$ |
83,781 |
|
|
$ |
120,726 |
|
|
$ |
3,571 |
|
|
|
|
|
|
|
| Deferred tax expense (benefit): |
|
|
|
|
|
| Federal |
$ |
35,824 |
|
|
$ |
(1,726) |
|
|
$ |
(3) |
|
| State |
3,898 |
|
|
(12,795) |
|
|
(160) |
|
| Total deferred |
$ |
39,722 |
|
|
$ |
(14,521) |
|
|
$ |
(163) |
|
|
|
|
|
|
|
| Total income tax expense (benefit): |
|
|
|
|
|
| Federal |
$ |
116,078 |
|
|
$ |
112,380 |
|
|
$ |
2,419 |
|
| State |
7,425 |
|
|
(6,175) |
|
|
989 |
|
| Total |
$ |
123,503 |
|
|
$ |
106,205 |
|
|
$ |
3,408 |
|
A reconciliation of statutory federal income tax expense on income to the actual income tax expense is as follows:
|
|
|
|
|
|
|
|
|
|
|
|
|
|
|
|
|
|
|
Year Ended December 31, |
|
2023 |
|
2022 |
|
2021 |
| Federal statutory income tax expense |
$ |
177,547 |
|
|
$ |
326,497 |
|
|
$ |
61,362 |
|
| Increase (decrease) in taxes due to: |
|
|
|
|
|
| Percentage depletion allowance |
(36,685) |
|
|
(50,277) |
|
|
(11,864) |
|
| Foreign-derived intangible income deduction |
(24,291) |
|
|
(69,917) |
|
|
(1,453) |
|
| Change in valuation allowances |
(5,658) |
|
|
(119,082) |
|
|
(78,043) |
|
| State taxes, net of federal tax impact |
5,932 |
|
|
14,625 |
|
|
12,440 |
|
| State apportioned tax rate change, net of federal tax impact |
2,863 |
|
|
273 |
|
|
8,751 |
|
| Capital loss carryforward expiration |
— |
|
|
140 |
|
|
10,552 |
|
| Non-deductible compensation |
9,934 |
|
|
5,573 |
|
|
1,429 |
|
| Stock-based compensation |
(6,968) |
|
|
(3,588) |
|
|
405 |
|
| Other, net |
829 |
|
|
1,961 |
|
|
(171) |
|
| Income tax expense |
$ |
123,503 |
|
|
$ |
106,205 |
|
|
$ |
3,408 |
|
ALPHA METALLURGICAL RESOURCES, INC. AND SUBSIDIARIES
Notes to Consolidated Financial Statements
(Amounts in thousands except share and per share data)
Deferred income taxes result from temporary differences between the reporting of amounts for financial statement purposes and income tax purposes. The net deferred tax assets and liabilities included in the Consolidated Balance Sheets include the following amounts:
|
|
|
|
|
|
|
|
|
|
|
|
|
Year Ended December 31, |
|
2023 |
|
2022 |
| Deferred tax assets: |
|
|
|
| Asset retirement obligations |
$ |
44,600 |
|
|
$ |
39,200 |
|
| Reserves and accruals not currently deductible |
8,141 |
|
|
10,572 |
|
| Workers’ compensation and black lung obligations |
39,432 |
|
|
38,099 |
|
| Pension obligations |
18,409 |
|
|
23,826 |
|
| Equity method investments |
1,271 |
|
|
1,555 |
|
| Net operating loss carryforwards |
35,835 |
|
|
43,716 |
|
| Capital loss carryforwards |
45,491 |
|
|
48,940 |
|
| Acquisition-related obligations |
— |
|
|
6,194 |
|
| Other |
9,496 |
|
|
7,171 |
|
| Gross deferred tax assets |
202,675 |
|
|
219,273 |
|
| Less valuation allowance |
(48,143) |
|
|
(53,801) |
|
| Deferred tax assets |
$ |
154,532 |
|
|
$ |
165,472 |
|
| Deferred tax liabilities: |
|
|
|
| Property, plant and mineral reserves |
$ |
(172,336) |
|
|
$ |
(148,189) |
|
| Acquired intangibles, net |
(9,478) |
|
|
(11,995) |
|
| Prepaid expenses |
(3,658) |
|
|
(4,215) |
|
| Restricted cash |
— |
|
|
(556) |
|
| Other |
(174) |
|
|
(13) |
|
| Total deferred tax liabilities |
(185,646) |
|
|
(164,968) |
|
| Net deferred tax (liabilities) assets |
$ |
(31,114) |
|
|
$ |
504 |
|
Changes in the valuation allowance were as follows:
|
|
|
|
|
|
|
|
|
|
|
|
|
|
|
|
|
|
|
Year Ended December 31, |
|
2023 |
|
2022 |
|
2021 |
| Valuation allowance beginning of period |
$ |
53,801 |
|
|
$ |
172,883 |
|
|
$ |
263,387 |
|
| Decrease in valuation allowance recorded to income tax expense |
(5,658) |
|
|
(119,082) |
|
|
(78,043) |
|
| Decrease in valuation allowance not affecting income tax expense |
— |
|
|
— |
|
|
(12,461) |
|
| Valuation allowance end of period |
$ |
48,143 |
|
|
$ |
53,801 |
|
|
$ |
172,883 |
|
At December 31, 2023, the Company has recorded a deferred tax asset of $26,494 for federal net operating loss carryforwards, which represents the tax-effected amount of net operating loss carryforwards mathematically available for utilization prior to statutory expiration. Underlying this deferred tax asset are approximately $12,000 of gross federal net operating loss carryforwards that are subject to an annual Internal Revenue Code Section 382 limitation of approximately $1,000 and approximately $114,000 of gross federal net operating loss carryforwards that are subject to an annual Internal Revenue Code Section 382 limitation of approximately $17,500. These federal net operating loss carryforwards were generated before 2018 and will expire between years 2035 and 2037. The Company has a gross federal capital loss carryforward of approximately $208,000. The capital loss carryforward will expire in 2025. A valuation allowance is recorded against the federal and state capital loss carryforwards and certain state net operating loss carryforwards.
The Company has no liability for uncertain tax positions for the years ended December 31, 2023, 2022, and 2021.
ALPHA METALLURGICAL RESOURCES, INC. AND SUBSIDIARIES
Notes to Consolidated Financial Statements
(Amounts in thousands except share and per share data)
The Company’s policy is to classify interest and penalties related to uncertain tax positions as part of income tax expense. As of December 31, 2023 and 2022, the Company had no accrued interest and penalties.
As of December 31, 2023, tax years 2020 – 2023 remain open to federal and state examination. During the third quarter of 2021, the IRS concluded its audit of the Company’s 2016 federal income tax return and associated net operating loss (“NOL”) carryback claim. The audit conclusion did not result in any material impact to the financial statements or related disclosures. Following the conclusion of the audit, the Company received the $64,160 carryback claim tax refund and $5,425 of accrued interest.
On August 16, 2022, the Inflation Reduction Act of 2022 (“IRA”) was signed into law. Among other provisions, the IRA enacted a 15% corporate alternative minimum tax and a 1% excise tax on repurchases of corporate stock for tax years beginning after December 31, 2022. The Company determined that it is not subject to the corporate alternative minimum tax for the year ended December 31, 2023. Refer to Note 7 for information on the excise tax on repurchases of the Company’s corporate stock.
(18) Employee Benefit Plans
The Company provides several types of benefits for its employees, including a defined benefit and defined contribution pension plan, workers’ compensation and black lung benefits, and postretirement life insurance. The Company does not participate in any multi-employer plans. The components of net periodic benefit cost (credit) other than the service cost component for black lung are included in the line item Miscellaneous (expense) income, net, in the Consolidated Statements of Operations.
Company Administered Defined Benefit Pension Plan
In connection with the Merger, the Company assumed three qualified non-contributory defined benefit pension plans, which covered certain salaried and non-union hourly employees. The qualified non-contributory defined benefit pension plans were collectively referred to as the “Pension Plans.” Effective as of December 31, 2023, the assets and liabilities of the Pension Plans were merged into one qualified non-contributory defined benefit pension plan (“Pension Plan”). Benefits are frozen under the Pension Plan. Participants accrued benefits either based on certain formulas, the participant’s compensation prior to retirement, or plan specified amounts for each year of service with the Company. The Pension Plan utilizes a cash balance formula for certain of its participants. The cash balance formula provides guaranteed rates of interest on accumulated balances of 6% for balances accumulated prior to 2004 and 4% on balances accumulated thereafter.
Annual funding contributions to the Pension Plan are made as recommended by consulting actuaries based upon the ERISA funding standards. Projected contributions are based on the latest available data and include the impact of the funding relief granted by the American Rescue Plan Act (“ARPA”) and the application of the interest rate stabilization guidance under ARPA. Plan assets consist of equity securities, fixed income funds, commingled short-term funds, private equity funds, and a guaranteed insurance contract.
The Pension Plan offers certain eligible participants the option to elect to receive lump sum benefits, which resulted in a partial plan settlement and the accelerated recognition of a portion of the accumulated other comprehensive loss during the years ended December 31, 2022 and 2021. Refer to the disclosures below for further information on the partial plan settlements.
The following tables set forth the Pension Plan’s accumulated benefit obligation, fair value of plan assets and funded status for the years ended December 31, 2023 and 2022.
ALPHA METALLURGICAL RESOURCES, INC. AND SUBSIDIARIES
Notes to Consolidated Financial Statements
(Amounts in thousands except share and per share data)
|
|
|
|
|
|
|
|
|
|
|
|
|
Year Ended December 31, |
|
2023 |
|
2022 |
| Change in benefit obligations: |
|
|
|
| Accumulated benefit obligation at beginning of period: |
$ |
468,442 |
|
|
$ |
668,055 |
|
| Interest cost |
23,973 |
|
|
15,981 |
|
| Actuarial loss (gain) |
18,239 |
|
|
(182,441) |
|
| Benefits paid |
(32,288) |
|
|
(30,378) |
|
| Settlement |
— |
|
|
(2,775) |
|
| Accumulated benefit obligation at end of period |
$ |
478,366 |
|
|
$ |
468,442 |
|
|
|
|
|
| Change in fair value of plan assets: |
|
|
|
| Fair value of plan assets at beginning of period |
$ |
357,606 |
|
|
$ |
508,125 |
|
| Actual return on plan assets |
26,129 |
|
|
(120,796) |
|
| Employer contributions |
25,011 |
|
|
3,430 |
|
| Benefits paid |
(32,288) |
|
|
(30,378) |
|
| Settlement |
— |
|
|
(2,775) |
|
| Fair value of plan assets at end of period |
$ |
376,458 |
|
|
$ |
357,606 |
|
| Funded status |
$ |
(101,908) |
|
|
$ |
(110,836) |
|
Accrued benefit cost at end of period (1) |
$ |
(101,908) |
|
|
$ |
(110,836) |
|
(1) Amounts are classified as long-term on the Consolidated Balance Sheets as there are sufficient plan assets to make expected benefit payments to plan participants in the succeeding twelve months.
Gross amounts related to benefit obligations recognized in accumulated other comprehensive loss consisted of the following as of December 31, 2023 and 2022:
|
|
|
|
|
|
|
|
|
|
|
|
|
December 31, |
|
2023 |
|
2022 |
| Net actuarial loss |
$ |
26,059 |
|
|
$ |
12,683 |
|
The following table details the components of net periodic benefit cost (credit):
|
|
|
|
|
|
|
|
|
|
|
|
|
|
|
|
|
|
|
Year Ended December 31, |
|
2023 |
|
2022 |
|
2021 |
| Interest cost |
$ |
23,973 |
|
|
$ |
15,981 |
|
|
$ |
13,566 |
|
| Expected return on plan assets |
(21,996) |
|
|
(28,733) |
|
|
(28,732) |
|
| Amortization of net actuarial loss |
730 |
|
|
2,111 |
|
|
3,217 |
|
| Settlement |
— |
|
|
244 |
|
|
412 |
|
| Net periodic benefit cost (credit) |
$ |
2,707 |
|
|
$ |
(10,397) |
|
|
$ |
(11,537) |
|
Other changes in plan assets and benefit obligation recognized in other comprehensive income (loss) are as follows:
|
|
|
|
|
|
|
|
|
|
|
|
|
|
|
|
|
|
|
Year Ended December 31, |
|
2023 |
|
2022 |
|
2021 |
Actuarial loss (gain) (1) |
$ |
14,106 |
|
|
$ |
(32,912) |
|
|
$ |
(37,004) |
|
| Amortization of net actuarial loss |
(730) |
|
|
(2,111) |
|
|
(3,217) |
|
| Settlement |
— |
|
|
(244) |
|
|
(412) |
|
| Total recognized in other comprehensive income (loss) |
$ |
13,376 |
|
|
$ |
(35,267) |
|
|
$ |
(40,633) |
|
(1) For the year ended December 31, 2023, the actuarial loss was primarily attributable to a decrease in the weighted-average discount rate actuarial assumption used in determining the benefit obligation. For the year ended December 31, 2022, the
ALPHA METALLURGICAL RESOURCES, INC. AND SUBSIDIARIES
Notes to Consolidated Financial Statements
(Amounts in thousands except share and per share data)
actuarial gain was primarily attributable to an increase in the weighted-average discount rate actuarial assumption used in determining the benefit obligation partially offset by the loss on plan assets.
The following table presents information applicable to plans with accumulated benefit obligations in excess of plan assets:
|
|
|
|
|
|
|
|
|
|
|
|
|
Year Ended December 31, |
|
2023 |
|
2022 |
| Projected benefit obligation |
$ |
478,366 |
|
|
$ |
468,442 |
|
| Accumulated benefit obligation |
$ |
478,366 |
|
|
$ |
468,442 |
|
| Fair value of plan assets |
$ |
376,458 |
|
|
$ |
357,606 |
|
The weighted-average actuarial assumption used in determining the benefit obligation as of December 31, 2023 and 2022 was as follows:
|
|
|
|
|
|
|
|
|
|
|
|
|
December 31, |
|
2023 |
|
2022 |
| Discount rate |
5.10 |
% |
|
5.42 |
% |
The weighted-average actuarial assumptions used to determine net periodic benefit cost (credit) for the years ended December 31, 2023, 2022, and 2021 were as follows:
|
|
|
|
|
|
|
|
|
|
|
|
|
|
|
|
|
|
|
Year Ended December 31, |
|
2023 |
|
2022 |
|
2021 |
| Discount rate for benefit obligation |
5.42 |
% |
|
2.92 |
% |
|
2.62 |
% |
| Discount rate for interest cost |
5.27 |
% |
|
2.44 |
% |
|
1.96 |
% |
| Expected long-term rate of return on plan assets |
6.20 |
% |
|
5.80 |
% |
|
5.80 |
% |
The discount rate assumptions were determined from a high-quality corporate bond yield-curve timing of the Company’s projected cash out flows.
The expected long-term rate of return on assets of the Pension Plan is established each year in consultation with the plan’s actuaries and outside investment advisors. This rate is determined by taking into consideration the Pension Plan’s target asset allocation, expected long-term rates of return on each major asset class by reference to long-term historic ranges, inflation assumptions, and the expected additional value from active management of the Pension Plan’s assets. For the determination of net periodic benefit cost in 2024, the Company will utilize an expected long-term rate of return on plan assets of 6.20%.
Assets of the Pension Plan are held in trusts and are invested in accordance with investment guidelines that have been established by the Company’s Benefits Committee in consultation with outside investment advisors. The target allocation for 2024 and the actual asset allocation as reported at December 31, 2023 are as follows:
|
|
|
|
|
|
|
|
|
|
|
|
|
Target Allocation Percentages 2024 |
|
Percentage of Plan Assets 2023 |
| Equity securities |
58.0 |
% |
|
54.0 |
% |
| Fixed income funds |
42.0 |
% |
|
42.0 |
% |
| Other |
— |
% |
|
4.0 |
% |
| Total |
100.0 |
% |
|
100.0 |
% |
The asset allocation targets have been set with the expectation that the Pension Plan’s assets will fund the expected liability within an appropriate level of risk. In determining the appropriate target asset allocations, the Benefits Committee considers the demographics of the Pension Plan’s participants, the funded status of the plan, the Company’s contribution philosophy, the Company’s business and financial profile, and other associated risk factors. The Pension Plan’s assets are periodically rebalanced among the major asset categories to maintain the asset allocation within a specified range of the target allocation percentage. The target allocation between equity securities and fixed income funds is determined by reference to the funded status percentage for the Pension Plan. The plan administrator uses a one-way de-risking glide path whereby the fixed income funds allocation increases as the funded status improves.
ALPHA METALLURGICAL RESOURCES, INC. AND SUBSIDIARIES
Notes to Consolidated Financial Statements
(Amounts in thousands except share and per share data)
At a 90.0% funded status level, the glide path calls for a 50/50 equity securities and fixed income funds mix. During the year ended December 31, 2021, one of the Pension Plans’ funded status levels reached 90.0% and the related plan assets were adjusted accordingly to the new allocation.
The Company contributed $25,011 to the Pension Plan during the year ended December 31, 2023. The Company expects to contribute $25,000 to the Pension Plan in 2024, which includes amounts above the estimated minimum required contributions for the 2024 plan year.
The following represents expected future pension benefit payments for the next ten years:
|
|
|
|
|
|
| 2024 |
$ |
31,491 |
|
| 2025 |
31,496 |
|
| 2026 |
31,392 |
|
| 2027 |
31,333 |
|
| 2028 |
31,180 |
|
| 2029-2033 |
152,086 |
|
|
$ |
308,978 |
|
The fair values of the Company’s Pension Plan’s assets as of December 31, 2023, by asset category are as follows:
|
|
|
|
|
|
|
|
|
|
|
|
|
|
|
|
|
|
|
|
|
|
|
|
| Asset Category |
Total |
|
Quoted Market Prices in Active Market for Identical Assets (Level 1) |
|
Significant Observable Inputs (Level 2) |
|
Significant Unobservable Inputs (Level 3) |
| Equity securities: |
|
|
|
|
|
|
|
Multi-asset fund (1) |
$ |
205,181 |
|
|
$ |
— |
|
|
$ |
205,181 |
|
|
$ |
— |
|
| Fixed income funds: |
|
|
|
|
|
|
|
Bond fund (2) |
156,235 |
|
|
— |
|
|
156,235 |
|
|
— |
|
Commingled short-term fund (3) |
1,307 |
|
|
— |
|
|
1,307 |
|
|
— |
|
| Other types of investments: |
|
|
|
|
|
|
|
| Guaranteed insurance contract |
12,230 |
|
|
— |
|
|
— |
|
|
12,230 |
|
| Total |
$ |
374,953 |
|
|
$ |
— |
|
|
$ |
362,723 |
|
|
$ |
12,230 |
|
Receivable (4) |
849 |
|
|
|
|
|
|
|
| Total assets at fair value |
375,802 |
|
|
|
|
|
|
|
Private equity funds measured at net asset value practical expedient (5) |
656 |
|
|
|
|
|
|
|
| Total plan assets |
$ |
376,458 |
|
|
|
|
|
|
|
(1) This fund contains equities (domestic and international), real estate and bonds.
(2) This fund contains bonds representing a diversity of sectors and maturities. This fund also includes mortgage-backed securities and U.S. Treasuries.
(3) This fund contains cash and highly liquid short-term investments in a collective investment fund.
(4) Receivable for investments sold at December 31, 2023, which approximates fair value.
(5) In accordance with Accounting Standards Update 2015-07, investments that are measured at fair value using the net asset value per share practical expedient have not been classified in the fair value hierarchy. The fair value amounts presented in this table are intended to permit reconciliation of the fair value hierarchy to the total value of assets of the plans.
Changes in Level 3 plan assets for the period ended December 31, 2023 were as follows:
ALPHA METALLURGICAL RESOURCES, INC. AND SUBSIDIARIES
Notes to Consolidated Financial Statements
(Amounts in thousands except share and per share data)
|
|
|
|
|
|
|
Fair Value Measurements Using Significant Unobservable Inputs (Level 3) |
|
Guaranteed Insurance Contract |
| Beginning balance, December 31, 2022 |
$ |
11,912 |
|
| Actual return on plan assets: |
|
| Relating to assets still held at the reporting date |
596 |
|
| Purchases, sales and settlements |
(278) |
|
| Ending balance, December 31, 2023 |
$ |
12,230 |
|
The fair values of the Company’s Pension Plan’s assets as of December 31, 2022, by asset category are as follows:
|
|
|
|
|
|
|
|
|
|
|
|
|
|
|
|
|
|
|
|
|
|
|
|
| Asset Category |
Total |
|
Quoted Market Prices in Active Market for Identical Assets (Level 1) |
|
Significant Observable Inputs (Level 2) |
|
Significant Unobservable Inputs (Level 3) |
| Equity securities: |
|
|
|
|
|
|
|
Multi-asset fund (1) |
$ |
198,262 |
|
|
$ |
— |
|
|
$ |
198,262 |
|
|
$ |
— |
|
| Fixed income funds: |
|
|
|
|
|
|
|
Bond fund (2) |
144,197 |
|
|
— |
|
|
144,197 |
|
|
— |
|
Commingled short-term fund (3) |
1,339 |
|
|
— |
|
|
1,339 |
|
|
— |
|
| Other types of investments: |
|
|
|
|
|
|
|
| Guaranteed insurance contract |
11,912 |
|
|
— |
|
|
— |
|
|
11,912 |
|
| Total |
$ |
355,710 |
|
|
$ |
— |
|
|
$ |
343,798 |
|
|
$ |
11,912 |
|
Receivable (4) |
1,145 |
|
|
|
|
|
|
|
| Total assets at fair value |
356,855 |
|
|
|
|
|
|
|
Private equity funds measured at net asset value practical expedient (5) |
751 |
|
|
|
|
|
|
|
| Total plan assets |
$ |
357,606 |
|
|
|
|
|
|
|
(1) This fund contains equities (domestic and international), real estate and bonds.
(2) This fund contains bonds representing a diversity of sectors and maturities. This fund also includes mortgage-backed securities and U.S. Treasuries.
(3) This fund contains cash and highly liquid short-term investments in a collective investment fund.
(4) Receivable for investments sold at December 31, 2022, which approximates fair value.
(5) In accordance with Accounting Standards Update 2015-07, investments that are measured at fair value using the net asset value per share practical expedient have not been classified in the fair value hierarchy. The fair value amounts presented in this table are intended to permit reconciliation of the fair value hierarchy to the total value of assets of the plans.
Changes in Level 3 plan assets for the period ended December 31, 2022 were as follows:
|
|
|
|
|
|
|
Fair Value Measurements Using Significant Unobservable Inputs (Level 3) |
|
Guaranteed Insurance Contract |
| Beginning balance, December 31, 2021 |
$ |
11,652 |
|
| Actual return on plan assets: |
|
| Relating to assets still held at the reporting date |
562 |
|
| Purchases, sales and settlements |
(302) |
|
| Ending balance, December 31, 2022 |
$ |
11,912 |
|
The following is a description of the valuation methodologies used for assets measured at fair value:
ALPHA METALLURGICAL RESOURCES, INC. AND SUBSIDIARIES
Notes to Consolidated Financial Statements
(Amounts in thousands except share and per share data)
Level 1 Plan Assets: Assets consist of individual security positions that are easily traded on recognized market exchanges. These securities are priced and traded daily, and therefore the fund is valued daily.
Level 2 Plan Assets: Funds consist of individual security positions that are mostly securities easily traded on recognized market exchanges. These securities are priced and traded daily, and therefore the fund is valued daily.
Level 3 Plan Assets: Assets are valued monthly or quarterly based on the Market Value provided by managers of the underlying fund investments. The Market Value provided typically reflects the fair value of each underlying fund investment, including unrealized gains and losses.
Workers’ Compensation and Pneumoconiosis (Black Lung)
The Company is required by federal and state statutes to provide benefits to employees for awards related to workers’ compensation and black lung.
The Company’s subsidiaries utilize high-deductible third-party insurance for worker’s compensation and black lung obligations with the exception of certain subsidiaries in which the Company is a qualified self-insurer for workers’ compensation and/or black lung obligations. The Company’s subsidiaries that are self-insured for black lung benefits may fund certain benefit payments through a Section 501(c) (21) tax-exempt trust fund.
Pursuant to the Merger Agreement, the Company assumed a reinsurance contract with a third party. In 2017, the Merger Companies made a lump sum payment in exchange for a reinsurance company’s agreement to administer and pay certain future workers’ compensation and state black lung obligations in the state of Kentucky. Pursuant to the Merger Agreement, the Company assumed the estimated liability for these future claims. As the liabilities are paid by the insurance company, the prepaid insurance amounts will be reduced by a corresponding amount.
The Company accrues for workers’ compensation liability by recognizing costs when it is probable that a covered liability has been incurred and the cost can be reasonably estimated. The Company’s estimates of these costs are adjusted based upon actuarial studies and include a provision for incurred but not reported losses. Actual losses may differ from these estimates, which could increase or decrease the Company’s costs. Additionally, the liability for black lung benefits is estimated by an independent actuary by prorating the accrual of actuarially projected benefits over the employee’s applicable term of service. Adjustments to the probable ultimate liability for workers’ compensation and black lung are made annually based on actuarial valuations.
For the Company’s subsidiaries that are insured with a high-deductible insurance plan for workers’ compensation and black lung claims, the insurance premium expense for the years ended December 31, 2023, 2022 and 2021 was $10,676, $9,274, and $8,630, respectively.
Workers’ Compensation
The table below presents workers’ compensation amounts recognized in the Consolidated Balance Sheets:
|
|
|
|
|
|
|
|
|
|
|
|
|
December 31, |
|
2023 |
|
2022 |
| Current liabilities |
$ |
10,482 |
|
|
$ |
11,651 |
|
| Long-term liabilities |
92,655 |
|
|
107,028 |
|
| Total liabilities |
$ |
103,137 |
|
|
$ |
118,679 |
|
Less expected insurance receivable (1) |
(39,920) |
|
|
(46,866) |
|
| Workers’ compensation obligations, net of expected insurance receivables |
$ |
63,217 |
|
|
$ |
71,813 |
|
(1) Included within Prepaid expenses and other current assets and Other non-current assets in the Consolidated Balance Sheets.
Workers’ compensation (credit) expense for high-deductible insurance plans for the years ended December 31, 2023, 2022, and 2021 was ($271), ($1,995), and $664, respectively, included within Cost of coal sales in the Consolidated Statements of Operations.
ALPHA METALLURGICAL RESOURCES, INC. AND SUBSIDIARIES
Notes to Consolidated Financial Statements
(Amounts in thousands except share and per share data)
Black Lung
The following tables set forth the accumulated black lung benefit obligations, fair value of plan assets and funded status for the years ended December 31, 2023 and 2022:
|
|
|
|
|
|
|
|
|
|
|
|
|
Year Ended December 31, |
|
2023 |
|
2022 |
| Change in benefit obligation: |
|
|
|
| Accumulated benefit obligation at beginning of period |
$ |
93,421 |
|
|
$ |
117,142 |
|
| Service cost |
2,051 |
|
|
2,642 |
|
| Interest cost |
4,660 |
|
|
2,722 |
|
| Actuarial loss (gain) |
20,019 |
|
|
(21,060) |
|
| Benefits paid |
(10,280) |
|
|
(8,025) |
|
| Accumulated benefit obligation at end of period |
$ |
109,871 |
|
|
$ |
93,421 |
|
| Change in fair value of plan assets: |
|
|
|
| Fair value of plan assets at beginning of period |
$ |
2,538 |
|
|
$ |
2,664 |
|
| Actual return on plan assets |
75 |
|
|
(126) |
|
| Benefits paid |
(10,280) |
|
|
(8,025) |
|
| Employer contributions |
10,280 |
|
|
8,025 |
|
Fair value of plan assets at end of period (1) |
2,613 |
|
|
2,538 |
|
| Funded status |
$ |
(107,258) |
|
|
$ |
(90,883) |
|
| Accrued benefit cost at end of period |
$ |
(107,258) |
|
|
$ |
(90,883) |
|
(1) Assets of the plan are held in a Section 501(c)(21) tax-exempt trust fund and consist primarily of government debt securities. All assets are classified as Level 1 and valued based on quoted market prices.
The table below presents amounts recognized in the Consolidated Balance Sheets:
|
|
|
|
|
|
|
|
|
|
|
|
|
December 31, |
|
2023 |
|
2022 |
| Current liabilities |
$ |
10,687 |
|
|
$ |
9,664 |
|
| Long-term liabilities |
96,571 |
|
|
81,219 |
|
| Total liabilities |
$ |
107,258 |
|
|
$ |
90,883 |
|
Gross amounts related to the black lung benefit obligations recognized in accumulated other comprehensive loss consisted of the following as of December 31, 2023 and 2022:
|
|
|
|
|
|
|
|
|
|
|
|
|
December 31, |
|
2023 |
|
2022 |
| Net actuarial loss (gain) |
$ |
12,630 |
|
|
$ |
(10,198) |
|
The following table details the components of the net periodic benefit cost for the black lung benefit obligations:
|
|
|
|
|
|
|
|
|
|
|
|
|
|
|
|
|
|
|
Year Ended December 31, |
|
2023 |
|
2022 |
|
2021 |
| Service cost |
$ |
2,051 |
|
|
$ |
2,642 |
|
|
$ |
2,972 |
|
| Interest cost |
4,660 |
|
|
2,722 |
|
|
2,463 |
|
| Expected return on plan assets |
(50) |
|
|
(53) |
|
|
(54) |
|
| Amortization of net actuarial (gain) loss |
(2,833) |
|
|
1,257 |
|
|
2,453 |
|
| Net periodic benefit cost |
$ |
3,828 |
|
|
$ |
6,568 |
|
|
$ |
7,834 |
|
ALPHA METALLURGICAL RESOURCES, INC. AND SUBSIDIARIES
Notes to Consolidated Financial Statements
(Amounts in thousands except share and per share data)
Other changes in the black lung plan assets and benefit obligations recognized in other comprehensive income (loss) are as follows:
|
|
|
|
|
|
|
|
|
|
|
|
|
|
|
|
|
|
|
Year Ended December 31, |
|
2023 |
|
2022 |
|
2021 |
Actuarial loss (gain) (1) |
$ |
19,995 |
|
|
$ |
(20,881) |
|
|
$ |
(9,649) |
|
| Amortization of net actuarial gain (loss) |
2,833 |
|
|
(1,257) |
|
|
(2,453) |
|
| Total recognized in other comprehensive income (loss) |
$ |
22,828 |
|
|
$ |
(22,138) |
|
|
$ |
(12,102) |
|
(1) For the year ended December 31, 2023, the actuarial loss was primarily attributable to a decrease in the weighted-average discount rate actuarial assumption used in determining the benefit obligations and an increase in new claimants. For the year ended December 31, 2022, the actuarial gain was primarily attributable to an increase in the weighted-average discount rate actuarial assumption used in determining the benefit obligations.
The weighted-average assumptions related to black lung obligations used to determine the benefit obligation as of December 31, 2023 and 2022 were as follows:
|
|
|
|
|
|
|
|
|
|
|
|
|
December 31, |
|
2023 |
|
2022 |
| Discount rate |
5.13 |
% |
|
5.42 |
% |
| Federal black lung income benefit trend rate |
2.50 |
% |
|
2.50 |
% |
| Federal black lung medical benefit trend rate |
5.00 |
% |
|
5.00 |
% |
The weighted-average assumptions related to black lung benefit obligations used to determine net periodic benefit cost were as follows:
|
|
|
|
|
|
|
|
|
|
|
|
|
|
|
|
|
|
|
Year Ended December 31, |
|
2023 |
|
2022 |
|
2021 |
| Discount rate for benefit obligation |
5.42 |
% |
|
2.96 |
% |
|
2.75 |
% |
| Discount rate for service cost |
5.58 |
% |
|
3.24 |
% |
|
3.15 |
% |
| Discount rate for interest cost |
5.23 |
% |
|
2.37 |
% |
|
1.96 |
% |
| Federal black lung income benefit trend rate |
2.50 |
% |
|
2.50 |
% |
|
2.00 |
% |
| Federal black lung medical benefit trend rate |
5.00 |
% |
|
5.00 |
% |
|
5.00 |
% |
| Expected return on plan assets |
2.00 |
% |
|
2.00 |
% |
|
2.00 |
% |
Estimated future cash payments related to black lung benefit obligations for the next 10 years ending after December 31, 2023 are as follows:
|
|
|
|
|
|
| Year ending December 31: |
|
| 2024 |
$ |
10,687 |
|
| 2025 |
10,301 |
|
| 2026 |
10,082 |
|
| 2027 |
9,937 |
|
| 2028 |
9,857 |
|
| 2029-2033 |
24,037 |
|
|
$ |
74,901 |
|
Postretirement Life Insurance Benefits
As part of the Alpha Natural Resources, Inc. bankruptcy reorganization process and the Retiree Committee Settlement Agreement, the Company assumed the unfunded liability for life insurance benefits for certain disabled and non-union retired employees.
ALPHA METALLURGICAL RESOURCES, INC. AND SUBSIDIARIES
Notes to Consolidated Financial Statements
(Amounts in thousands except share and per share data)
Provisions are made for estimated benefits and adjustments to the probable ultimate liabilities are made annually based on an actuarial study prepared by independent actuaries. As of December 31, 2023 and 2022, the postretirement life insurance benefit obligation was $8,857, including a current portion of $613, and $8,761, including a current portion of $648, respectively, which are included in the Consolidated Balance Sheets as Other non-current liabilities and Accrued expenses and other current liabilities.
Defined Contribution and Profit-Sharing Plans
The Company sponsors defined contribution plans to assist its eligible employees in providing for retirement. Generally, under the terms of these plans, employees make voluntary contributions through payroll deductions and the Company makes matching and/or discretionary contributions, as defined by each plan. The Company’s total contributions to these plans for the years ended December 31, 2023, 2022, and 2021 were $16,435, $19,385, and $10,275, respectively.
During the third quarter of 2022, the Company announced a year-end discretionary employer contribution under the Alpha Metallurgical Resources 401(k) Retirement Savings Plan (the “Plan”) equal to the 2% of the Plan participants’ annual salaries. Effective in June 2021, the Company’s matching contributions under the Plan were reinstated after being suspended due to weak market conditions during the second quarter of 2020.
Self-insured Medical Plan
The Company is self-insured for health benefit coverage for all of its active employees. Estimated liabilities for health and medical claims are recorded based on the Company’s historical experience and include a component for incurred but not paid claims. During the years ended December 31, 2023, 2022, and 2021, the Company incurred total expenses of $86,745, $68,706, and $62,351, respectively, which primarily include claims processed and an estimate for claims incurred but not paid.
(19) Stock-Based Compensation Awards
The MIP is currently authorized for the issuance of awards of up to 1,201,202 shares of common stock, and as of December 31, 2023, there were 90,970 shares of common stock available for grant under the MIP. The LTIP is currently authorized for the issuance of awards of up to 1,500,000 shares of common stock, and as of December 31, 2023, there were 819,305 shares of common stock available for grant under the LTIP. Pursuant to the Merger Agreement, the Company assumed the ANR Inc. 2017 Equity Incentive Plan (the “ANR EIP”), which had underlying ANR shares that were converted to 89,766 Contura Energy, Inc. shares. The ANR EIP is not authorized for additional issuance of awards of shares of common stock, and as of December 31, 2023, there were no shares of common stock available for grant under the ANR EIP.
As of December 31, 2023, the Company had three types of stock-based awards outstanding: time-based restricted stock units, performance-based restricted stock units, and performance-based cash awards. Upon vesting and settlement or exercise of the stock-based awards outstanding, the Company issues authorized and unissued shares of the Company’s common stock to the recipient. Stock-based compensation expense totaled $20,856, $9,841, and $7,468 for the years ended December 31, 2023, 2022, and 2021, respectively. For the years ended December 31, 2023, 2022, and 2021, approximately 95%, 92%, and 89%, respectively, of stock-based compensation expense was reported as selling, general and administrative expenses, and the remainder was recorded as cost of coal sales.
The Company is authorized to repurchase common shares from employees (upon the election by the employee) to satisfy the employees’ statutory tax withholdings upon the vesting of stock grants. Shares that are repurchased to satisfy the employees’ statutory tax withholdings are recorded in treasury stock at cost. During the year ended December 31, 2023, the Company repurchased 81,287 shares of its common stock issued pursuant to awards under the MIP and LTIP for a total purchase amount of $17,333, or $213.23 average price paid per share. During the year ended December 31, 2022, the Company repurchased 94,460 shares of its common stock issued pursuant to awards under the MIP and LTIP for a total purchase amount of $7,867, or $83.28 average price paid per share. During the year ended December 31, 2021, the Company repurchased 50,363 shares of its common stock issued pursuant to awards under the MIP and LTIP for a total purchase amount of $785, or $15.60 average price paid per share.
On November 8, 2023, the Company modified the terms of certain outstanding stock-based compensation awards previously granted to Mr. Stetson, the executive chair of the Board. Pursuant to the terms of the modification, upon the completion of his service as executive chair as of the end of the day on December 31, 2023, and his appointment by the Board as non-executive chair of the Board effective as of January 1, 2024, the pro-rata vesting of his outstanding incentive awards was to be calculated as if his separation date were instead December 31, 2024.
ALPHA METALLURGICAL RESOURCES, INC. AND SUBSIDIARIES
Notes to Consolidated Financial Statements
(Amounts in thousands except share and per share data)
The modification resulted in total incremental compensation cost of $6,717 for the year ended December 31, 2023 and impacted the time-based restricted stock units and performance-based restricted stock units granted to him under the LTIP during the years ended December 31, 2023 and 2022. Awards held by other employees were not affected by the modification. As all modified awards are fully vested, there is no remaining compensation cost to be recognized as of December 31, 2023.
2023 Awards Granted
During the year ended December 31, 2023, the Company granted certain key employees and non-employee directors 35,018 time-based restricted stock units under the LTIP with a weighted average grant date fair value of $165.43 based on the Company’s closing stock price at the trading day before the date of the grant. Awards granted to key employees on January 25, 2023 will vest ratably over a three-year period from the date of the grant in accordance with the vesting schedule, subject to the participant’s continuous service with the Company through each applicable vesting date. Per the terms of the transition agreement between Mr. Stetson and the Company, dated November 18, 2022, relating to his service as the Company’s executive chair of the Board, and then as its non-executive chair, awards granted to Mr. Stetson were to vest pro-rata as of December 31, 2023, the last day of his service as the Company’s executive chair, reflecting his service through that date. The transition agreement was later amended as discussed above. Restricted stock units were also granted to a non-employee director on February 2, 2023, which vested on May 2, 2023, and to multiple non-employee directors on May 3, 2023, which will vest on the first to occur of (i) May 2, 2024, (ii) the director’s separation of service due to the director’s death or physical or mental incapacity to perform his or her usual duties, (iii) the director’s service as a member of the Board is terminated, for any reason other than removal for cause, as of a date that is more than six months after the date of grant, and (iv) a change in control.
Additionally, during the year ended December 31, 2023, the Company granted certain key employees 49,701 performance-based restricted stock units under the LTIP, which represent the number of shares of common stock that may be issued based on the achievement of targeted performance levels related to pre-established relative total shareholder return goals and annually determined operational goals over a three year period. These awards are scheduled to cliff vest on the third anniversary of the date of the grant, subject to the participant’s continuous service with the Company through the applicable vesting date and the satisfaction of the performance criteria. Per the terms of the transition agreement between Mr. Stetson and the Company, dated November 18, 2022, relating to his service as the Company’s executive chair of the Board, and then as its non-executive chair, the awards granted to Mr. Stetson were to vest pro-rata as of December 31, 2023, the last day of his service as the Company’s executive chair, reflecting his service through that date. The transition agreement was later amended as discussed above. The performance-based restricted stock units have the potential to be earned from 0% to 200% of the targeted performance level, depending on actual results. Upon vesting and settlement of these awards, the Company will issue authorized and previously unissued shares of the Company’s common stock to the recipient. The 29,816 operational performance-based restricted stock units were valued based on the Company’s closing stock price on the trading day before the date of the grant and had a weighted average grant date fair value of $171.07. For the awards with operational performance conditions, the Company reassesses at each reporting date whether achievement of each of the performance conditions was probable and adjusts the accrual of stock-based compensation expense as needed. Of the 19,885 relative total shareholder return performance-based restricted stock units, 2,093 were valued based on the Company’s closing stock price on the trading day before the date of the grant and had a weighted average grant date fair value of $171.07, and 17,792 were valued relative to the stock price performance of a comparator group and had a weighted average grant date fair value of $267.18 based on a Monte Carlo simulation. The Monte Carlo simulation incorporated the assumptions as presented in the following table:
|
|
|
|
|
|
| Relative performance-based restricted stock units |
|
Start price (1) |
$ |
151.35 |
|
Valuation date stock price (2) |
$ |
176.44 |
|
Expected volatility (3) |
102.06 |
% |
Risk-free interest rate (4) |
3.82 |
% |
Expected dividend yield (5) |
— |
% |
(1) The start price for the Company represented the average closing stock price over the twenty trading days ending on December 31, 2022, assuming dividends distributed during this period were reinvested in additional shares of the Company’s stock on the ex-dividend date.
(2) The valuation date stock price represented the closing value on the grant date.
ALPHA METALLURGICAL RESOURCES, INC. AND SUBSIDIARIES
Notes to Consolidated Financial Statements
(Amounts in thousands except share and per share data)
(3) The expected volatility assumption was based on the historical volatility of the price of the Company’s stock.
(4) The annual risk-free interest rate equaled the yield on the semi-annual zero coupon U.S. Treasury rates converted to continuously compounded rates that had a term equal to the length of the remaining performance measurement period as of the valuation date.
(5) The expected dividend yield represented the investments return to a share of the Company’s stock that is not available to the holder of the performance-based restricted stock unit.
2022 Awards Granted
During the year ended December 31, 2022, the Company granted certain key employees and non-employee directors 95,111 time-based restricted stock units under the MIP and LTIP with a weighted average grant date fair value of $96.60 based on the Company’s closing stock price at the trading day before the date of the grant. Awards granted to key employees on January 25, 2022 will vest ratably over a three-year period from the date of the grant in accordance with the vesting schedule, subject to the participant’s continuous service with the Company through each applicable vesting date. Restricted stock units were also granted to non-employee directors on May 3, 2022, which vested on May 2, 2023. An award granted to Mr. Stetson, the Chief Executive Officer (“CEO”), on November 18, 2022, in advance of his transition to executive chair of the Board on January 1, 2023, vested over the course of 2023 in accordance with the vesting schedule, subject to the participant’s continuous service with the Company through each applicable vesting date.
Additionally, during the year ended December 31, 2022, the Company granted certain key employees 60,857 performance-based restricted stock units under the LTIP, which represent the number of shares of common stock that may be issued based on the achievement of targeted performance levels related to pre-established relative total shareholder return goals and annually determined operational goals over a three year period. These awards are scheduled to cliff vest on the third anniversary of the date of the grant, subject to the participant’s continuous service with the Company through the applicable vesting date and the satisfaction of the performance criteria. These performance-based restricted stock units have the potential to be earned from 0% to 200% of the targeted performance level, depending on actual results. Upon vesting and settlement of these awards, the Company will issue authorized and previously unissued shares of the Company’s common stock to the recipient. The 36,515 operational performance-based restricted stock units were valued based on the Company’s closing stock price on the trading day before the date of the grant and had a weighted average grant date fair value of $60.37. For the awards with operational performance conditions, the Company reassesses at each reporting date whether achievement of each of the performance conditions was probable and adjusts the accrual of stock-based compensation expense as needed. The 24,342 relative total shareholder return performance-based restricted stock units were valued relative to the stock price performance of a comparator group and had a weighted average grant date fair value of $97.33 based on a Monte Carlo simulation. The Monte Carlo simulation incorporated the assumptions as presented in the following table:
|
|
|
|
|
|
| Relative performance-based restricted stock units |
|
Start price (1) |
$ |
53.29 |
|
Valuation date stock price (2) |
$ |
61.09 |
|
Expected volatility (3) |
106.48 |
% |
Risk-free interest rate (4) |
1.26 |
% |
Expected dividend yield (5) |
— |
% |
(1) The start price for the Company represented the average closing stock price over the twenty trading days ending on December 31, 2021, assuming dividends distributed during this period were reinvested in additional shares of the Company’s stock on the ex-dividend date.
(2) The valuation date stock price represented the closing price on the grant date.
(3) The expected volatility assumption was based on the historical volatility of the price of the Company’s stock.
(4) The annual risk-free interest rate equaled the yield on the semi-annual zero coupon U.S. Treasury rates converted to continuously compounded rates that had a term equal to the length of the remaining performance measurement period as of the valuation date.
(5) The expected dividend yield represented the investments return to a share of the Company’s stock that is not available to the holder of the performance-based restricted stock unit.
Additionally, during the year ended December 31, 2022, the Company granted certain key employees performance-based cash incentive awards under the LTIP with a target award amount of $1,105. The cash to be awarded is based on the achievement of pre-established relative total shareholder return goals over a three-year period.
ALPHA METALLURGICAL RESOURCES, INC. AND SUBSIDIARIES
Notes to Consolidated Financial Statements
(Amounts in thousands except share and per share data)
These awards are scheduled to cliff vest on the third anniversary of the date of the grant, subject to the participant’s continuous service with the Company through the applicable vesting date and the satisfaction of the performance criteria. These awards have the potential to be distributed from 0% to 200% of the targeted performance level, depending on actual results. Upon vesting of these awards, the Company issues cash to the recipient. These awards are classified as a liability, and the Company reassesses at each reporting date the fair value of the award and adjusts the accruals of stock-based compensation expense as appropriate based on a Monte Carlo simulation. As of December 31, 2023 and 2022, the liability for these awards totaled $1,233 and $374, respectively. The performance-based cash incentive awards were valued relative to the stock price performance of a comparator group and had a weighted average grant date fair value as a percent of target dollar value of 61.97% based on a Monte Carlo simulation. The Monte Carlo simulation incorporates the assumptions as presented in the following table:
|
|
|
|
|
|
| Performance-based cash incentive awards |
|
Start price (1) |
$ |
53.29 |
|
Valuation date stock price (2) |
$ |
61.09 |
|
Expected volatility (3) |
106.48 |
% |
Risk-free interest rate (4) |
1.26 |
% |
Expected dividend yield (5) |
— |
% |
(1) The start price for the Company represented the average closing stock price over the twenty trading days ending on December 31, 2021, assuming dividends distributed during this period were reinvested in additional shares of the Company’s stock on the ex-dividend date.
(2) The valuation date stock price represented the closing price on the grant date.
(3) The expected volatility assumption was based on the historical volatility of the price of the Company’s stock.
(4) The annual risk-free interest rate equaled the yield on the semi-annual zero coupon U.S. Treasury rates converted to continuously compounded rates that had a term equal to the length of the remaining performance measurement period as of the valuation date.
(5) The expected dividend yield represented the investments return to a share of the Company’s stock that is not available to the holder of the performance-based restricted stock unit.
2021 Awards Granted
During the year ended December 31, 2021, the Company granted certain key employees and non-employee directors 223,496 time-based restricted stock units under the MIP and LTIP with a weighted average grant date fair value of $12.03 based on the Company’s closing stock price at the trading day before the date of the grant. Awards granted to key employees will vest ratably over a three-year period from the date of the grant in accordance with the vesting schedule, subject to the participant’s continuous service with the Company through each applicable vesting date. Restricted stock units were also granted to non-employee directors on February 10, 2021, which vested on April 30, 2021, and on May 1, 2021, which vested on April 30, 2022.
Additionally, during the year ended December 31, 2021, the Company granted certain key employees 167,587 performance-based restricted stock units under the LTIP, which represent the number of shares of common stock that may be issued based on the achievement of targeted performance levels related to pre-established relative total shareholder return goals and annually determined operational goals over a three year period. These awards are scheduled to cliff vest on the third anniversary of the date of the grant, subject to the participant’s continuous service with the Company through the applicable vesting date and the satisfaction of the performance criteria. These performance-based restricted stock units have the potential to be earned from 0% to 200% of the targeted performance level, depending on actual results. Upon vesting and settlement of these awards, the Company will issue authorized and previously unissued shares of the Company’s common stock to the recipient. The 100,552 operational performance-based restricted stock units were valued based on the Company’s closing stock price on the trading day before the date of the grant and had a weighted average grant date fair value of $12.00. For the awards with operational performance conditions, the Company reassesses at each reporting date whether achievement of each of the performance conditions was probable and adjusts the accrual of stock-based compensation expense as needed. The 67,035 relative total shareholder return performance-based restricted stock units were valued relative to the stock price performance of a comparator group and had a weighted average grant date fair value of $16.18 based on a Monte Carlo simulation.
ALPHA METALLURGICAL RESOURCES, INC. AND SUBSIDIARIES
Notes to Consolidated Financial Statements
(Amounts in thousands except share and per share data)
The Monte Carlo simulation incorporated the assumptions as presented in the following table:
|
|
|
|
|
|
| Relative performance-based restricted stock units |
|
Start price (1) |
$ |
11.81 |
|
Valuation date stock price (2) |
$ |
11.34 |
|
Expected volatility (3) |
98.54 |
% |
Risk-free interest rate (4) |
0.18 |
% |
Expected dividend yield (5) |
— |
% |
(1) The start price for the Company represented the average closing stock price over the twenty trading days ending on December 31, 2020, assuming dividends distributed during this period were reinvested in additional shares of the Company’s stock on the ex-dividend date.
(2) The valuation date stock price represented the closing price on the grant date.
(3) The expected volatility assumption was based on the historical volatility of the price of the Company’s stock.
(4) The annual risk-free interest rate equaled the yield on the semi-annual zero coupon U.S. Treasury rates converted to continuously compounded rates that had a term equal to the length of the remaining performance measurement period as of the valuation date.
(5) The expected dividend yield represented the investments return to a share of the Company’s stock that is not available to the holder of the performance-based restricted stock unit.
Additionally, during the year ended December 31, 2021, the Company granted certain key employees performance-based cash incentive awards under the LTIP with a target award amount of $927. The cash to be awarded is based on the achievement of pre-established relative total shareholder return goals over a three-year period. These awards are scheduled to cliff vest on the third anniversary of the date of the grant, subject to the participant’s continuous service with the Company through the applicable vesting date and the satisfaction of the performance criteria. These awards have the potential to be distributed from 0% to 200% of the targeted performance level, depending on actual results. Upon vesting of these awards, the Company issues cash to the recipient. These awards are classified as a liability, and the Company reassesses at each reporting date the fair value of the award and adjusts the accruals of stock-based compensation expense as appropriate based on a Monte Carlo simulation. As of December 31, 2023 and 2022, the liability for these awards totaled $1,609 and $812, respectively. The performance-based cash incentive awards were valued relative to the stock price performance of a comparator group and had a weighted average grant date fair value as a percent of target dollar value of 51.73% based on a Monte Carlo simulation. The Monte Carlo simulation incorporates the assumptions as presented in the following table:
|
|
|
|
|
|
Performance-based cash incentive awards |
|
Start price (1) |
$ |
11.81 |
|
Valuation date stock price (2) |
$ |
11.34 |
|
Expected volatility (3) |
98.54 |
% |
Risk-free interest rate (4) |
0.18 |
% |
Expected dividend yield (5) |
— |
% |
(1) The start price for the Company represented the average closing stock price over the twenty trading days ending on December 31, 2020, assuming dividends distributed during this period were reinvested in additional shares of the Company’s stock on the ex-dividend date.
(2) The valuation date stock price represented the closing price on the grant date.
(3) The expected volatility assumption was based on the historical volatility of the price of the Company’s stock.
(4) The annual risk-free interest rate equaled the yield on the semi-annual zero coupon U.S. Treasury rates converted to continuously compounded rates that had a term equal to the length of the remaining performance measurement period as of the valuation date.
(5) The expected dividend yield represented the investments return to a share of the Company’s stock that is not available to the holder of the performance-based restricted stock unit.
ALPHA METALLURGICAL RESOURCES, INC. AND SUBSIDIARIES
Notes to Consolidated Financial Statements
(Amounts in thousands except share and per share data)
Restricted Stock Units
Time-Based Restricted Stock Units
Time-based restricted stock unit activity for the year ended December 31, 2023 is summarized in the following table:
|
|
|
|
|
|
|
|
|
|
|
|
| Time-based restricted stock unit activity: |
Number of Shares |
|
Weighted-Average Grant Date Fair Value |
| Non-vested shares outstanding at December 31, 2022 |
248,369 |
|
|
$ |
41.02 |
|
| Granted |
35,018 |
|
|
$ |
165.43 |
|
Vested (1) |
(178,664) |
|
|
$ |
54.50 |
|
| Forfeited |
(837) |
|
|
$ |
149.38 |
|
| Non-vested shares outstanding at December 31, 2023 |
103,886 |
|
|
$ |
58.91 |
|
(1) Includes 6,753 shares with deferred settlement pursuant to the award agreements.
As of December 31, 2023, there was $2,011 of unrecognized compensation cost related to non-vested time-based restricted stock units which is expected to be recognized as expense over a weighted-average period of 1.45 years. The total fair value of shares vested, including awards with deferred settlements, during the years ended December 31, 2023, 2022, and 2021, was $35,204, $20,275, and $5,544, respectively.
Performance-Based Restricted Stock Units
Relative performance-based restricted stock unit activity for the year ended December 31, 2023 based on target achievement of the performance criteria is summarized in the following table:
|
|
|
|
|
|
|
|
|
|
|
|
| Relative performance-based restricted stock unit activity: |
Number of Shares |
|
Weighted-Average Grant Date Fair Value |
| Non-vested shares outstanding at December 31, 2022 |
91,377 |
|
|
$ |
37.80 |
|
| Granted |
19,885 |
|
|
$ |
257.06 |
|
| Vested |
(10,502) |
|
|
$ |
106.82 |
|
| Forfeited |
(1,045) |
|
|
$ |
167.08 |
|
| Non-vested shares outstanding at December 31, 2023 |
99,715 |
|
|
$ |
72.90 |
|
As of December 31, 2023, there was $3,809 of unrecognized compensation cost related to non-vested relative performance-based restricted stock units which is expected to be recognized as expense over a weighted-average period of 1.92 years. The total fair value of shares vested during the year ended December 31, 2023 was $3,559.
Operational performance-based restricted stock unit activity for the year ended December 31, 2023 based on target achievement of the performance criteria is summarized in the following table:
|
|
|
|
|
|
|
|
|
|
|
|
Operational performance-based restricted stock unit activity: |
Number of Shares |
|
Weighted-Average Fair Value |
| Non-vested shares outstanding at December 31, 2022 |
137,067 |
|
|
$ |
24.89 |
|
| Granted |
29,816 |
|
|
$ |
171.07 |
|
| Vested |
(15,753) |
|
|
$ |
74.61 |
|
| Forfeited |
(1,568) |
|
|
$ |
150.24 |
|
| Non-vested shares outstanding at December 31, 2023 |
149,562 |
|
|
$ |
47.48 |
|
As of December 31, 2023, there was $1,446 of unrecognized compensation cost related to non-vested operational performance-based restricted stock units, based on the probability of achievement as of December 31, 2023, which is expected to be recognized as expense over a weighted-average period of 1.70 years.The total fair value of shares vested during the year ended December 31, 2023 was $5,339.
ALPHA METALLURGICAL RESOURCES, INC. AND SUBSIDIARIES
Notes to Consolidated Financial Statements
(Amounts in thousands except share and per share data)
Stock Options
30-Day Volume-Weighted Average Price (“VWAP”) Stock Options
30-day VWAP stock option activity for the year ended December 31, 2023 is summarized in the following table:
|
|
|
|
|
|
|
|
|
|
|
|
|
|
|
|
|
|
|
|
|
|
|
|
|
Number of Shares |
|
Weighted-Average Exercise Price Per Share |
|
Weighted-Average Remaining Contractual Term (Years) |
|
Aggregate Intrinsic Value (1) |
| Outstanding at December 31, 2022 |
3,407 |
|
|
$ |
66.13 |
|
|
4.18 |
|
$ |
273 |
|
| Exercisable at December 31, 2022 |
3,407 |
|
|
$ |
66.13 |
|
|
4.18 |
|
$ |
273 |
|
| Granted |
— |
|
|
$ |
— |
|
|
|
|
|
| Exercised |
(3,407) |
|
|
$ |
66.13 |
|
|
|
|
$ |
515 |
|
| Forfeited or Expired |
— |
|
|
$ |
— |
|
|
|
|
|
| Outstanding at December 31, 2023 |
— |
|
|
$ |
— |
|
|
|
|
$ |
— |
|
| Exercisable at December 31, 2023 |
— |
|
|
$ |
— |
|
|
|
|
$ |
— |
|
(1) The aggregate intrinsic value of outstanding and exercisable options is calculated as the difference between the exercise price and the Company’s stock price at each reporting period end. The aggregate intrinsic value of exercised options is calculated as the difference between the exercise price and the Company’s stock price on the exercise date.
As of December 31, 2023, there was no unrecognized compensation cost related to the 30-day VWAP stock options.
Performance-Based Cash Incentive Awards
Performance-based cash incentive award activity for the year ended December 31, 2023 based on target achievement of the performance criteria is summarized in the following table:
|
|
|
|
|
|
|
|
|
|
|
|
| Performance-based cash incentive award activity: |
Target Dollar Value |
|
Weighted-Average Fair Value as a % of Target Dollar Value |
| Non-vested awards outstanding at December 31, 2022 |
$ |
3,958 |
|
|
166.29 |
% |
| Granted |
— |
|
|
— |
% |
| Vested |
(2,054) |
|
|
200.00 |
% |
| Forfeited |
(28) |
|
|
130.43 |
% |
| Non-vested awards outstanding at December 31, 2023 |
$ |
1,876 |
|
|
190.30 |
% |
As of December 31, 2023, there was $728 of unrecognized compensation cost related to non-vested performance-based cash incentive awards, based on the probability of achievement as of December 31, 2023, which is expected to be recognized as expense over a weighted-average period of 1.01 years.
(20) Related Party Transactions
There were no material related party transactions for the year ended December 31, 2023.
During the year ended December 31, 2021, the Company, through a privately negotiated transaction with an underlying Contingent Revenue Obligation creditor, repurchased 7.75% of the outstanding rights of the Contingent Revenue Obligation at an aggregate purchase price of $2,091. The underlying Contingent Revenue Obligation creditor was an existing shareholder (related party) as of the repurchase date. Refer to Note 14 for additional disclosures on this acquisition-related obligation. Additionally, during the year ended December 31, 2021, the Company repurchased at a discount certain outstanding principal borrowings made under the Term Loan Credit Facility from existing shareholders through privately negotiated transactions.
ALPHA METALLURGICAL RESOURCES, INC. AND SUBSIDIARIES
Notes to Consolidated Financial Statements
(Amounts in thousands except share and per share data)
Refer to Note 13 for additional disclosures on long-term debt.
(21) Commitments and Contingencies
(a) General
Estimated losses from loss contingencies are accrued by a charge to income when information available indicates that it is probable that an asset has been impaired or a liability has been incurred and the amount of the loss can be reasonably estimated.
If a loss contingency is not probable or reasonably estimable, disclosure of the loss contingency is made in the Consolidated Financial Statements when it is at least reasonably possible that a loss may be incurred and that the loss could be material.
(b) Commitments and Contingencies
Commitments
The Company leases coal mining and other equipment under long-term financing and operating leases with varying terms. Refer to Note 11 for further information on leases. In addition, the Company leases mineral interests and surface rights from landowners under various terms and royalty rates.
Coal royalty expense was $185,398, $226,366, and $113,685 for the years ended December 31, 2023, 2022, and 2021, respectively.
Minimum royalty obligations under coal leases total $14,357, $14,394, $13,160, $11,901, $11,851, and $89,025 for 2024, 2025, 2026, 2027, 2028, and after 2028, respectively.
Other Commitments
As of December 31, 2023, the Company has obligations under certain coal purchase agreements that contain minimum quantities to be purchased in 2024 totaling an estimated $236,848. The Company also has outstanding unconditional purchase obligations for 2024 and 2025 totaling $251,038 and $66,675, respectively, related to the purchase of equipment, diesel fuel, and electricity, as well as for rail freight and export terminal costs (including $48,405 in 2024 for DTA funding.)
Under the terms of its partnership related agreements with respect to its investment in DTA, the Company is required to fund its proportionate share of DTA’s ongoing operating and capital costs. In November 2023, the Company, together with DTA management announced that DTA needed additional capital investment to maximize functionality and minimize downtime due to mechanical issues. Beyond the Company’s share of routine operating costs, it expects to invest up to an incremental $25,000 per year for infrastructure and equipment upgrades at DTA over the next 6 years. The Company’s 2024 funding of DTA includes routine operating and capital costs and infrastructure and equipment upgrades.
Contingencies
Extensive regulation of the impacts of mining on the environment and of maintaining workplace safety has had, and is expected to continue to have, a significant effect on the Company’s costs of production and results of operations. Further regulations, legislation or litigation in these areas may also cause the Company’s sales or profitability to decline by increasing costs or by hindering the Company’s ability to continue mining at existing operations or to permit new operations.
During the normal course of business, contract-related matters arise between the Company and its customers. When a loss related to such matters is considered probable and can reasonably be estimated, the Company records a liability.
During the first half of 2023, the Company purchased and sold 399 tons, totaling $15,170, under the Cumberland Back-to-Back Coal Supply Agreements. For the year ended December 31, 2022, the Company purchased and sold 1,617 tons, totaling $62,171, under the Cumberland Back-to-Back Coal Supply Agreements. As of June 30, 2023, the Cumberland Back-to-Back Coal Supply Agreements had been fully performed.
ALPHA METALLURGICAL RESOURCES, INC. AND SUBSIDIARIES
Notes to Consolidated Financial Statements
(Amounts in thousands except share and per share data)
(c) Guarantees and Financial Instruments with Off-Balance Sheet Risk
In the normal course of business, the Company is a party to certain guarantees and financial instruments with off-balance sheet risk, such as bank LCs, performance or surety bonds, and other guarantees and indemnities related to the obligations of affiliated entities which are not reflected in the Company’s Consolidated Balance Sheets. However, the underlying liabilities that they secure, such as asset retirement obligations, workers’ compensation liabilities, and royalty obligations, are reflected in the Company’s Consolidated Balance Sheets.
The Company is required to provide financial assurance in order to perform the post-mining reclamation required by its mining permits, pay workers’ compensation claims under workers’ compensation laws in various states, pay federal black lung benefits, and perform certain other obligations. In order to provide the required financial assurance, the Company generally uses surety bonds for post-mining reclamation and workers’ compensation obligations. The Company can also use bank LCs to collateralize certain obligations.
As of December 31, 2023, the Company had $31 of cash collateralized LCs remaining to be replaced as part of the transition from the previous ABL Facility to the New ABL Facility and $60,896 in LCs outstanding under the New ABL Facility. During the first quarter of 2024, the remaining cash collateralized LCs from the previous ABL Facility were cancelled with no replacement required and the cash collateral was returned.
As of December 31, 2023, the Company had outstanding surety bonds with a total face amount of $177,109 to secure various obligations and commitments. To secure the Company’s reclamation-related obligations, the Company has $33,858 of collateral in the form of restricted cash and restricted investments supporting these obligations as of December 31, 2023.
The Company meets frequently with its surety providers and has discussions with certain providers regarding the extent of and the terms of their participation in the program. These discussions may cause the Company to shift surety bonds between providers or to alter the terms of their participation in our program. To the extent that surety bonds become unavailable or the Company’s surety bond providers require additional collateral, the Company would seek to secure its obligations with LCs, cash deposits or other suitable forms of collateral. The Company’s failure to maintain, or inability to acquire, surety bonds or to provide a suitable alternative would have a material adverse effect on its liquidity. These failures could result from a variety of factors including lack of availability, higher cost or unfavorable market terms of new surety bonds, and the exercise by third-party surety bond issuers of their right to refuse to renew the surety.
Amounts included in restricted cash provide collateral to secure the following obligations:
|
|
|
|
|
|
|
|
|
|
|
|
|
December 31, |
|
2023 |
|
2022 |
| Workers’ compensation and black lung obligations |
$ |
104,998 |
|
|
$ |
15,334 |
|
| Reclamation-related obligations |
685 |
|
|
3,220 |
|
| Financial payments and other performance obligations |
10,235 |
|
|
10,387 |
|
| Contingent Revenue Obligation escrow |
— |
|
|
24,547 |
|
| Total restricted cash |
$ |
115,918 |
|
|
$ |
53,488 |
|
| Less current portion |
— |
|
|
(24,547) |
|
| Restricted cash, net of current portion |
$ |
115,918 |
|
|
$ |
28,941 |
|
Amounts included in restricted investments provide collateral to secure the following obligations:
ALPHA METALLURGICAL RESOURCES, INC. AND SUBSIDIARIES
Notes to Consolidated Financial Statements
(Amounts in thousands except share and per share data)
|
|
|
|
|
|
|
|
|
|
|
|
|
December 31, |
|
2023 |
|
2022 |
| Workers’ compensation and black lung obligations |
$ |
2,514 |
|
|
$ |
72,136 |
|
| Reclamation-related obligations |
33,173 |
|
|
31,718 |
|
| Financial payments and other performance obligations |
4,910 |
|
|
1,881 |
|
Total restricted investments (1) |
$ |
40,597 |
|
|
$ |
105,735 |
|
(1) Classified as long-term trading securities as of December 31, 2023 and 2022.
Amounts included in deposits provide collateral to secure the following obligations:
|
|
|
|
|
|
|
|
|
|
|
|
|
December 31, |
|
2023 |
|
2022 |
| Workers’ compensation obligations |
$ |
4,500 |
|
|
$ |
— |
|
| Reclamation-related obligations |
— |
|
|
102 |
|
| Financial payments and other performance obligations |
32 |
|
|
391 |
|
| Other operating agreements |
850 |
|
|
85,618 |
|
| Total deposits |
$ |
5,382 |
|
|
$ |
86,111 |
|
| Less current portion |
(32) |
|
|
(84,748) |
|
Total deposits, net of current portion (1) |
$ |
5,350 |
|
|
$ |
1,363 |
|
(1) Included within Other non-current assets on the Company’s Consolidated Balance Sheets.
DCMWC Reauthorization Process
In July 2019, the U.S. Department of Labor (Division of Coal Mine Workers’ Compensation or “DCMWC”) began implementing a new authorization process for all self-insured coal mine operators. As requested by the DCMWC, the Company filed an application and supporting documentation for reauthorization to self-insure certain of its black lung obligations in October 2019. As a result of this application, the DCMWC notified the Company in a letter dated February 21, 2020 that the Company was reauthorized to self-insure certain of its black lung obligations for a period of one-year from February 21, 2020. The DCMWC reauthorization was contingent, however, upon the Company’s providing collateral of $65,700 to secure certain of its black lung obligations. This proposed collateral requirement would have been an increase from the approximate $2,600 in collateral that the Company currently provides to secure these self-insured black lung obligations. The reauthorization process provided the Company with the right to appeal the security determination in writing within 30 days of the date of the notification, which appeal period the DCMWC agreed to extend to May 22, 2020. The Company exercised this right of appeal in connection with the substantial increase in the amount of required collateral. In February 2021, the U.S. Department of Labor (“DOL”) withdrew its Federal Register notice seeking comments on its bulletin describing its new method of calculating collateral requirements. The DOL removed the bulletin from its website in May 2021. On February 10, 2022, a telephone conference was held with DCMWC and DOL decision makers wherein the Company presented facts and arguments in support of its appeal. No ruling has been made on the appeal, but during the call the Company indicated that it would be willing to allocate an additional $10,000 in collateral. If the Company’s appeal is unsuccessful, the Company may be required to provide additional LCs to receive the self-insurance reauthorization from the DCMWC or alternatively insure these black lung obligations through a third-party provider that would likely also require the Company to provide additional collateral. In January 2023, the DOL proposed for public comment new regulations which, if adopted, would substantially increase the collateral required to secure self-insured federal black lung obligations. Under the proposed 120% minimum collateral requirement, the Company estimates it could be required to provide approximately $80,000 to $100,000 of collateral to secure certain of its black lung obligations. The DOL has indicated that it expects that some form of these new regulations could go into effect in the first quarter or early second quarter of 2024. A significant increase in these collateral obligations could have a materially adverse effect on the Company’s liquidity.
(d) Legal Proceedings
Litigation has been initiated against certain of our subsidiaries in which the plaintiffs allege violations of the Fair Labor Standards Act due to alleged failure to compensate for time “donning” and “doffing” equipment and to account for the effects in the calculation of overtime rates and pay. The plaintiffs seek collective action certification. We cannot reasonably estimate a range of potential exposure at this time.
ALPHA METALLURGICAL RESOURCES, INC. AND SUBSIDIARIES
Notes to Consolidated Financial Statements
(Amounts in thousands except share and per share data)
We believe the plaintiffs’ claims are without merit, but if we were ultimately unsuccessful in defending against this litigation, it could have a material, adverse effect upon our liquidity and results of operations.
In addition, the Company is party to other legal proceedings from time to time. These proceedings, as well as governmental examinations, could involve various business units and a variety of claims including, but not limited to, contract disputes, personal injury claims, property damage claims (including those resulting from blasting, trucking and flooding), environmental and safety issues, securities-related matters and employment matters. While some legal matters may specify the damages claimed by the plaintiffs, many seek an unquantified amount of damages. Even when the amount of damages claimed against the Company or its subsidiaries is stated, (i) the claimed amount may be exaggerated or unsupported; (ii) the claim may be based on a novel legal theory or involve a large number of parties; (iii) there may be uncertainty as to the likelihood of a class being certified or the ultimate size of the class; (iv) there may be uncertainty as to the outcome of pending appeals or motions; and/or (v) there may be significant factual issues to be resolved. As a result, if such legal matters arise in the future, the Company may be unable to estimate a range of possible loss for matters that have not yet progressed sufficiently through discovery and development of important factual information and legal issues. The Company records accruals based on an estimate of the ultimate outcome of these matters, but these estimates can be difficult to determine and involve significant judgment.
(22) Concentration of Credit Risk and Major Customers
The Company markets produced, processed, and purchased coal to customers in the United States and in international markets. The following table presents additional information on our total revenues and top customers:
|
|
|
|
|
|
|
|
|
|
|
|
|
|
|
|
|
|
|
Year Ended December 31, |
| |
2023 |
|
2022 |
|
2021 |
| Total coal revenues |
$ |
3,456,630 |
|
|
$ |
4,092,987 |
|
|
$ |
2,252,624 |
|
| Total revenues |
3,471,417 |
|
|
4,101,592 |
|
|
2,258,686 |
|
| Export coal revenues |
2,539,068 |
|
|
3,303,477 |
|
|
1,706,026 |
|
| Top customer as % of total revenues |
13 |
% |
|
25 |
% |
|
13 |
% |
| Top 10 customers as % of total revenues |
74 |
% |
|
70 |
% |
|
64 |
% |
| Number of customers exceeding 10% of total revenues |
2 |
|
|
1 |
|
|
2 |
|
| Number of customers exceeding 10% of total trade accounts receivable, net |
3 |
|
|
2 |
|
|
3 |
|
| Domestic coal revenue as % of total coal revenues |
26 |
% |
|
19 |
% |
|
24 |
% |
| Export coal revenue as % of total coal revenues |
74 |
% |
|
81 |
% |
|
76 |
% |
| Countries with export coal revenue exceeding 10% of total revenues |
India |
|
India |
|
India, China, Brazil |
| Met coal as % of coal sales volume |
90 |
% |
|
87 |
% |
|
83 |
% |
| Thermal coal as % of coal sales volume |
10 |
% |
|
13 |
% |
|
17 |
% |
(23) Segment Information
The Company extracts, processes and markets met and thermal coal from deep and surface mines for sale to steel and coke producers, industrial customers, and electric utilities. The Company conducts mining operations only in the United States with mines in Central Appalachia. The Company has one reportable segment: Met, which consists of five active mines and two preparation plants in Virginia, seventeen active mines and six preparation plants in West Virginia, as well as expenses associated with certain idled/closed mines.
ALPHA METALLURGICAL RESOURCES, INC. AND SUBSIDIARIES
Notes to Consolidated Financial Statements
(Amounts in thousands except share and per share data)
In addition to the one reportable segment, the All Other category includes general corporate overhead and corporate assets and liabilities, the former CAPP - Thermal operations consisting of one preparation plant in West Virginia, and the elimination of certain intercompany activity, as well as expenses associated with certain idled/closed mines.
Reportable segment operating results are regularly reviewed by the Chief Operating Decision Maker (“CODM”), who is the Chief Executive Officer of the Company.
Segment operating results and capital expenditures for the year ended December 31, 2023 were as follows:
|
|
|
|
|
|
|
|
|
|
|
|
|
|
|
|
|
|
|
Year Ended December 31, 2023 |
|
Met |
|
All Other |
|
Consolidated |
| Total revenues |
$ |
3,417,395 |
|
|
$ |
54,022 |
|
|
$ |
3,471,417 |
|
| Depreciation, depletion, and amortization |
$ |
125,716 |
|
|
$ |
11,153 |
|
|
$ |
136,869 |
|
| Amortization of acquired intangibles, net |
$ |
8,523 |
|
|
$ |
— |
|
|
$ |
8,523 |
|
| Adjusted EBITDA |
$ |
1,087,803 |
|
|
$ |
(54,692) |
|
|
$ |
1,033,111 |
|
| Capital expenditures |
$ |
238,916 |
|
|
$ |
6,457 |
|
|
$ |
245,373 |
|
Segment operating results and capital expenditures for the year ended December 31, 2022 were as follows:
|
|
|
|
|
|
|
|
|
|
|
|
|
|
|
|
|
|
|
Year Ended December 31, 2022 |
|
Met |
|
All Other |
|
Consolidated |
| Total revenues |
$ |
4,023,688 |
|
|
$ |
77,904 |
|
|
$ |
4,101,592 |
|
| Depreciation, depletion, and amortization |
$ |
100,584 |
|
|
$ |
7,036 |
|
|
$ |
107,620 |
|
| Amortization of acquired intangibles, net |
$ |
15,699 |
|
|
$ |
3,799 |
|
|
$ |
19,498 |
|
| Adjusted EBITDA |
$ |
1,776,642 |
|
|
$ |
(36,030) |
|
|
$ |
1,740,612 |
|
| Capital expenditures |
$ |
160,679 |
|
|
$ |
3,630 |
|
|
$ |
164,309 |
|
Segment operating results and capital expenditures for the year ended December 31, 2021 were as follows:
|
|
|
|
|
|
|
|
|
|
|
|
|
|
|
|
|
|
|
Year Ended December 31, 2021 |
|
Met |
|
All Other |
|
Consolidated |
| Total revenues |
$ |
2,176,080 |
|
|
$ |
82,606 |
|
|
$ |
2,258,686 |
|
| Depreciation, depletion, and amortization |
$ |
99,963 |
|
|
$ |
10,084 |
|
|
$ |
110,047 |
|
| Amortization of acquired intangibles, net |
$ |
13,671 |
|
|
$ |
(427) |
|
|
$ |
13,244 |
|
| Adjusted EBITDA |
$ |
567,270 |
|
|
$ |
(32,789) |
|
|
$ |
534,481 |
|
| Capital expenditures |
$ |
79,185 |
|
|
$ |
4,115 |
|
|
$ |
83,300 |
|
ALPHA METALLURGICAL RESOURCES, INC. AND SUBSIDIARIES
Notes to Consolidated Financial Statements
(Amounts in thousands except share and per share data)
The following table presents a reconciliation of net income (loss) to Adjusted EBITDA for the year ended December 31, 2023:
|
|
|
|
|
|
|
|
|
|
|
|
|
|
|
|
|
|
|
Year Ended December 31, 2023 |
|
Met |
|
All Other |
|
Consolidated |
| Net income (loss) |
$ |
938,495 |
|
|
$ |
(216,539) |
|
|
$ |
721,956 |
|
| Interest expense |
731 |
|
|
6,192 |
|
|
6,923 |
|
| Interest income |
(644) |
|
|
(11,289) |
|
|
(11,933) |
|
| Income tax expense |
— |
|
|
123,503 |
|
|
123,503 |
|
| Depreciation, depletion and amortization |
125,716 |
|
|
11,153 |
|
|
136,869 |
|
| Non-cash stock compensation expense |
96 |
|
|
18,921 |
|
|
19,017 |
|
| Loss on extinguishment of debt |
— |
|
|
2,753 |
|
|
2,753 |
|
| Accretion on asset retirement obligations |
14,886 |
|
|
10,614 |
|
|
25,500 |
|
| Amortization of acquired intangibles, net |
8,523 |
|
|
— |
|
|
8,523 |
|
| Adjusted EBITDA |
$ |
1,087,803 |
|
|
$ |
(54,692) |
|
|
$ |
1,033,111 |
|
The following table presents a reconciliation of net income (loss) to Adjusted EBITDA for the year ended December 31, 2022:
|
|
|
|
|
|
|
|
|
|
|
|
|
|
|
|
|
|
|
Year Ended December 31, 2022 |
|
Met |
|
All Other |
|
Consolidated |
| Net income (loss) |
$ |
1,647,104 |
|
|
$ |
(198,559) |
|
|
$ |
1,448,545 |
|
| Interest expense |
202 |
|
|
21,600 |
|
|
21,802 |
|
| Interest income |
(541) |
|
|
(2,646) |
|
|
(3,187) |
|
| Income tax expense |
— |
|
|
106,205 |
|
|
106,205 |
|
| Depreciation, depletion and amortization |
100,584 |
|
|
7,036 |
|
|
107,620 |
|
| Non-cash stock compensation expense |
4 |
|
|
7,480 |
|
|
7,484 |
|
| Mark-to-market adjustment - acquisition-related obligations |
— |
|
|
8,880 |
|
|
8,880 |
|
| Accretion on asset retirement obligations |
13,590 |
|
|
10,175 |
|
|
23,765 |
|
| Amortization of acquired intangibles, net |
15,699 |
|
|
3,799 |
|
|
19,498 |
|
| Adjusted EBITDA |
$ |
1,776,642 |
|
|
$ |
(36,030) |
|
|
$ |
1,740,612 |
|
ALPHA METALLURGICAL RESOURCES, INC. AND SUBSIDIARIES
Notes to Consolidated Financial Statements
(Amounts in thousands except share and per share data)
The following table presents a reconciliation of net income (loss) to Adjusted EBITDA for the year ended December 31, 2021:
|
|
|
|
|
|
|
|
|
|
|
|
|
|
|
|
|
|
|
Year Ended December 31, 2021 |
|
Met |
|
All Other |
|
Consolidated |
| Net income (loss) |
$ |
439,859 |
|
|
$ |
(151,069) |
|
|
$ |
288,790 |
|
| Interest expense |
184 |
|
|
69,470 |
|
|
69,654 |
|
| Interest income |
(6) |
|
|
(330) |
|
|
(336) |
|
| Income tax expense |
— |
|
|
3,408 |
|
|
3,408 |
|
| Depreciation, depletion and amortization |
99,963 |
|
|
10,084 |
|
|
110,047 |
|
| Non-cash stock compensation expense |
28 |
|
|
5,287 |
|
|
5,315 |
|
| Mark-to-market adjustment - acquisition-related obligations |
— |
|
|
19,525 |
|
|
19,525 |
|
| Gain on settlement of acquisition-related obligations |
— |
|
|
(1,125) |
|
|
(1,125) |
|
| Accretion on asset retirement obligations |
13,571 |
|
|
12,949 |
|
|
26,520 |
|
| Asset impairment and restructuring |
— |
|
|
(561) |
|
|
(561) |
|
| Amortization of acquired intangibles, net |
13,671 |
|
|
(427) |
|
|
13,244 |
|
| Adjusted EBITDA |
$ |
567,270 |
|
|
$ |
(32,789) |
|
|
$ |
534,481 |
|
No asset information has been disclosed as the CODM does not regularly review asset information by reportable segment.
Item 9. Changes in and Disagreements with Accountants on Accounting and Financial Disclosure
None.
Item 9A. Controls and Procedures
Evaluation of Disclosure Controls and Procedures
We maintain disclosure controls and procedures as that term is defined in Rules 13a-15(e) and 15d-15(e) under the Securities Exchange Act of 1934, as amended (the “Exchange Act”) that are designed to ensure that information required to be disclosed by the Company in reports that it files or submits under the Exchange Act, is recorded, processed, summarized and reported within the time periods specified in the SEC’s rules and forms, and that such information is accumulated and communicated to our management, including our CEO and our Chief Financial Officer (“CFO”), as appropriate, to allow timely decisions regarding required disclosures. In accordance with Rule 13a-15(b) of the Exchange Act, we have evaluated, under the supervision of our CEO and our CFO, the effectiveness of disclosure controls and procedures as of December 31, 2023. Based on this evaluation, our CEO and our CFO concluded that our disclosure controls and procedures were effective as of December 31, 2023.
Management’s Report on Internal Control Over Financial Reporting
Management is responsible for maintaining and establishing adequate internal control over financial reporting. An evaluation of the effectiveness of the design and operation of our internal control over financial reporting, as defined in Rules 13a-15(f) and 15d-15(f) under the Exchange Act, as of the end of the period covered by this report was performed under the supervision and with the participation of management, including our CEO and CFO under the oversight of the Audit Committee of the Board. This evaluation is performed to determine if our internal controls over financial reporting provide reasonable assurance regarding the reliability of financial reporting and the preparation of financial statements for external purposes in accordance with generally accepted accounting principles.
Management conducted an assessment of the effectiveness of our internal control over financial reporting using the criteria set by the Committee of Sponsoring Organizations of the Treadway Commission (COSO) in Internal Control - Integrated Framework (2013). Based on this assessment, management concluded that our internal control over financial reporting was effective as of December 31, 2023.
Our CEO, CFO, and other members of management do not expect that our disclosure controls and procedures or our internal control over financial reporting will prevent all errors and all fraud. A control system, no matter how well designed and operated, can provide only reasonable, not absolute, assurance that the objectives of the control system are met. Because of its inherent limitations, internal control over financial reporting may not prevent or detect misstatements. Also, projections of any evaluation of effectiveness to future periods are subject to the risk that controls may become inadequate because of changes in conditions, or that the degree of compliance with the policies or procedures may deteriorate.
Our independent registered public accounting firm, RSM US LLP, has audited the effectiveness of our internal control over financial reporting, as stated in their attestation report included in this annual report on Form 10-K.
Changes in Internal Control Over Financial Reporting
There were no changes in our internal control over financial reporting (as defined in Rule 13a-15(f) under the Exchange Act) that occurred during the period covered by this Annual Report on Form 10-K that have materially affected, or is reasonably likely to materially affect, our internal control over financial reporting.
Item 9B. Other Information
During the quarter ended December 31, 2023, no director or officer adopted or terminated: (i) any contract, instruction or written plan for the purchase or sale of securities of the Company intended to satisfy the affirmative defense conditions of Rule 10b5-1(c); or (ii) any “non-Rule 10b5-1 trading arrangement” as defined in paragraph (c) of item 408(a) of Regulation S-K.
Item 9C. Disclosure Regarding Foreign Jurisdictions that Prevent Inspections Item 10.
Not applicable.
Part III
Directors, Executive Officers and Corporate Governance
The sections of our Proxy Statement entitled “Proposal 1 - Election of Directors,” “About our Board of Directors - Board and Its Committees,” “About our Board of Directors - Board Committees - Audit Committee,” “About our Management Team,” “Delinquent Section 16(a) Reports,” “About our Board of Directors - Code of Business Ethics” and “Stockholder Proposals for the 2025 Annual Meeting” are incorporated herein by reference.
The Company has a written Code of Business Ethics that applies to the Company’s Chief Executive Officer (Principal Executive Officer), Chief Financial Officer (Principal Financial and Accounting Officer) and others. The Code of Business Ethics is available on the Company’s website at investors.alphametresources.com/investors/corporate-governance/governance-documents. Any amendments to, or waivers from, a provision of our Code of Business Ethics that applies to our Principal Executive Officer, Principal Financial and Accounting Officer or persons performing similar functions and that relates to any element of the code of ethics enumerated in paragraph (b) of Item 406 of Regulation S-K shall be disclosed by posting on our website. Information on or accessible through our website is not incorporated by reference into this Annual Report on Form 10-K.
The Company has adopted an insider securities trading policy that prohibits directors, officers, employees, temporary employees, independent consultants and contractors of the Company from engaging in hedging transactions involving Company securities such as short selling, buying or selling publicly traded options (including puts and calls), zero-cost collar and forward sales contracts. The policy also prohibits the holding by these persons of Alpha securities in a margin account or pledging Alpha securities as collateral for a loan.
Item 11. Executive Compensation
Information required by this item is incorporated herein by reference to the sections of our proxy statement for the 2024 annual meeting of stockholders entitled “About our Board of Directors - Director Compensation,” “Board Committee Reports - Compensation Committee Report” and “Executive Compensation.” These sections include, but are not limited to, “About our Board of Directors - Director Compensation - 2023 Director Compensation,” “Executive Compensation - Compensation Discussion and Analysis,” “Board Committee Reports - Compensation Committee Report,” “Executive Compensation - Compensation Discussion and Analysis - Risk Assessment of Compensation Programs,” “Executive Compensation - 2023 Summary Compensation Table,” “Executive Compensation – 2023 Grants of Plan-Based Awards,” “Executive Compensation - Outstanding Equity Awards at 2023 Fiscal Year End,” “Executive Compensation - Option Exercises and Stock Vested in 2023,” “Executive Compensation - Nonqualified Deferred Compensation,” “Executive Compensation - Potential Payments on Termination or Change in Control,” “Pay Ratio,” and “Executive Compensation - Pay Versus Performance.”.
Item 12. Security Ownership of Certain Beneficial Owners and Management and Related Stockholder Matters
The sections of our Proxy Statement entitled “Security Ownership of Certain Beneficial Owners and Management” and “Executive Compensation – Potential Payments on Termination and Change in Control - Equity Compensation Plan Information” are incorporated herein by reference.
Item 13. Certain Relationships and Related Transactions, and Director Independence
The sections of our Proxy Statement entitled “About our Board of Directors - Independent and Non-Management Directors” and “Other Information - Review and Approval of Transactions With Related Persons” are incorporated herein by reference.
Item 14. Principal Accountant Fees and Services
The sections of our Proxy Statement entitled “Proposal 3 - Ratification of Appointment of Independent Registered Public Accounting Firm - Independent Registered Public Accounting Firm and Fees” and “Proposal 3 - Ratification of Appointment of Independent Registered Public Accounting Firm - Policy for Approval of Audit and Permitted Non-Audit Services” are incorporated herein by reference.
Additional Information
We file annual, quarterly and current reports, proxy statements and other information with the Securities and Exchange Commission (“SEC”). You may access and read our SEC filings through our website, at www.alphametresources.com, or the SEC’s website, at www.sec.gov. You may also request copies of our filings, at no cost, by telephone at (423) 573-0300 or by mail at: Alpha Metallurgical Resources, Inc., P.O. Box 848, Bristol, TN 37621, attention: Investor Relations. Our Audit Committee Charter, Compensation Committee Charter, Nominating and Corporate Governance Committee Charter, Corporate Governance Practices and Policies, and Code of Business Ethics are also available on our website and available in print to any stockholder who requests them. Information on or accessible through our website is not incorporated by reference into this Annual Report on Form 10-K.
Part IV
Item 15. Exhibit and Financial Statement Schedules
Pursuant to the rules and regulations of the Securities and Exchange Commission, the Company has filed certain agreements as exhibits to this Annual Report on Form 10-K. These agreements may contain representations and warranties by the parties. These warranties have been made solely for the benefit of the other party or parties to such agreements and (i) may have been qualified by disclosure made to such other party or parties, (ii) were made only as of the date of such agreements or such other date(s) as may be specified in such agreements and are subject to more recent developments, which may not be fully reflected in such Company’s public disclosure, (iii) may reflect the allocation of risk among the parties to such agreements and (iv) may apply materiality standards different from what may be viewed as material to investors. Accordingly, these representations and warranties may not describe the Company’s actual state of affairs at the date hereof and should not be relied upon.
(a) Documents filed as part of this Annual Report on Form 10-K:
(1) The following financial statements are filed as part of this Annual Report on Form 10-K under Item 8-Financial Statements and Supplementary Data:
•Report of Independent Registered Public Accounting Firm
•Consolidated Statements of Operations, Years ended December 31, 2023, 2022, and 2021
•Consolidated Statements of Comprehensive Income, Years ended December 31, 2023, 2022, and 2021
•Consolidated Balance Sheets, December 31, 2023 and 2022
•Consolidated Statements of Cash Flows, Years ended December 31, 2023, 2022, and 2021
•Consolidated Statements of Stockholders’ Equity, Years ended December 31, 2023, 2022, and 2021
•Notes to Consolidated Financial Statements
(2) Financial Statement Schedules. All schedules are omitted because they are not required or because the information is immaterial or provided elsewhere in the Consolidated Financial Statements and Notes thereto.
(3) Listing of Exhibits. See the Exhibit Index following the signature page to this Annual Report on Form 10-K.
Exhibit Index
|
|
|
|
|
|
| Exhibit No. |
Description of Exhibit |
| 3.1* |
|
| 3.2* |
|
| 4.1 |
|
| 10.1*† |
|
| 10.2*† |
|
| 10.3*† |
|
| 10.4*† |
|
| 10.5*† |
|
| 10.6† |
|
| 10.7*† |
|
| 10.8* |
|
| 10.9*† |
|
| 10.10*† |
|
| 10.11*† |
|
| 10.12*† |
|
| 10.13*† |
|
| 10.14*† |
|
| 10.15* |
Credit Agreement, dated as of October 27, 2023, by and among Alpha Metallurgical Resources, Inc. and certain of its Subsidiaries, as borrowers, the Guarantors party thereto, Regions Capital Markets, a division of Regions Bank, as Book Runner and Lead Arranger, ServisFirst Bank and Texas Capital Bank, as Joint Book Runners and Joint Lead Arrangers, the other Lenders from time to time party thereto, and Regions Bank, as administrative agent, collateral agent, swingline lender and LC issuer (Incorporated by reference to Exhibit 10.1 of Form 10-Q of Alpha Metallurgical Resources, Inc. filed on November 2, 2023) |
| 10.16† |
|
| 10.17† |
|
| 19 |
|
| 21.1 |
|
|
|
|
|
|
|
| 23.1 |
|
| 23.2 |
|
| 31 |
|
| 32 |
|
| 95 |
|
| 96.1 |
|
| 96.2 |
|
| 96.3 |
|
| 96.4 |
|
| 96.5 |
|
| 96.6 |
|
| 96.7 |
|
| 97† |
|
| 101 |
The following financial information from Alpha Metallurgical Resources, Inc.'s Annual Report on Form 10-K for the year ended December 31, 2023 formatted in Inline XBRL (Extensible Business Reporting Language) includes: (i) Consolidated Statements of Operations, (ii) Consolidated Statements of Comprehensive Income, (iii) Consolidated Balance Sheets, (iv) Consolidated Statements of Cash Flows, (v) Consolidated Statements of Stockholders’ Equity, and (vi) Notes to the Consolidated Financial Statements. |
| 104 |
Cover Page Interactive Data File (formatted as Inline XBRL and contained in Exhibit 101) |
______________
* Previously filed. † Management contract, compensatory plan or arrangement.
Item 16. Form 10-K Summary Pursuant to the requirements of Section 13 or 15(d) of the Securities Exchange Act of 1934, the registrant has duly caused this report to be signed on its behalf by the undersigned, thereunto duly authorized.
None.
SIGNATURES
|
|
|
|
|
|
|
|
|
| |
ALPHA METALLURGICAL RESOURCES, INC. |
| Date: February 26, 2024 |
By: |
/s/ J. Todd Munsey |
| |
Name: |
J. Todd Munsey |
| |
Title: |
Chief Financial Officer (Principal Financial Officer and Principal Accounting Officer) |
KNOW ALL PERSONS BY THESE PRESENTS, that each person whose signature appears below constitutes and appoints J. Todd Munsey his true and lawful attorney-in-fact, each with full power of substitution, for him in any and all capacities, to sign any amendments to this Annual Report on Form 10-K and to file the same, with exhibits thereto and other documents in connection therewith, with the Securities and Exchange Commission, hereby ratifying and confirming all that said attorney-in-fact or his substitute or substitutes may do or cause to be done by virtue hereof. Pursuant to the requirements of the Securities Exchange Act of 1934, this report has been signed below by the following persons on behalf of the registrant and in the capacities and on the dates indicated.
|
|
|
|
|
|
|
|
|
|
|
|
|
|
|
| Signature |
|
Date |
|
Title |
|
|
|
|
|
| /s/ Charles Andrew Eidson |
|
February 26, 2024 |
|
Chief Executive Officer (Principal Executive Officer) |
| Charles Andrew Eidson |
|
|
|
|
|
|
|
|
|
| /s/ J. Todd Munsey |
|
February 26, 2024 |
|
Chief Financial Officer
(Principal Financial Officer and Principal Accounting Officer) |
| J. Todd Munsey |
|
|
|
|
|
|
|
|
| /s/ David J. Stetson |
|
February 26, 2024 |
|
Chairman |
| David J. Stetson |
|
|
|
|
|
|
|
|
|
| /s/ Joanna Baker de Neufville |
|
February 26, 2024 |
|
Director |
| Joanna Baker de Neufville |
|
|
|
|
|
|
|
|
|
| /s/ Kenneth S. Courtis |
|
February 26, 2024 |
|
Director |
| Kenneth S. Courtis |
|
|
|
|
|
|
|
|
|
| /s/ Albert E. Ferrara, Jr. |
|
February 26, 2024 |
|
Director |
| Albert E. Ferrara, Jr. |
|
|
|
|
|
|
|
|
|
| /s/ Elizabeth A. Fessenden |
|
February 26, 2024 |
|
Director |
| Elizabeth A. Fessenden |
|
|
|
|
|
|
|
|
|
| /s/ Michael Gorzynski |
|
February 26, 2024 |
|
Director |
| Michael Gorzynski |
|
|
|
|
|
|
|
|
|
| /s/ Michael J. Quillen |
|
February 26, 2024 |
|
Lead Independent Director |
| Michael J. Quillen |
|
|
|
|
|
|
|
|
|
| /s/ Daniel D. Smith |
|
February 26, 2024 |
|
Director |
| Daniel D. Smith |
|
|
|
|
EX-4.1
2
a12312023exhibit41.htm
DESCRIPTION OF SECURITIES REGISTERED
Document
DESCRIPTION OF SECURITIES REGISTERED
PURSUANT TO SECTION 12 OF THE
SECURITIES EXCHANGE ACT OF 1934
The following is a summary of the material terms of the securities of Alpha Metallurgical Resources, Inc. registered under Section 12 of the Securities Exchange Act of 1934, as amended (the “Exchange Act”), as of February 19, 2024, unless otherwise stated. Our authorized capital stock under our second amended and restated certificate of incorporation, as amended, consists of 50,000,000 shares of common stock, par value $0.01 per share and 5,000,000 shares of preferred stock, par value $0.01 per share. “Alpha”, “our” or “the Company” refers to Alpha Metallurgical Resources, Inc.
DESCRIPTION OF ALPHA CAPITAL STOCK
The following is a description of the material terms of our second amended and restated certificate of incorporation, as amended, and fourth amended and restated bylaws, in each case as in effect and affecting the rights of our stockholders upon the completion of this offering. We refer you to our second amended and restated certificate of incorporation, and the amendment thereto, and fourth amended and restated bylaws, copies of which are filed as exhibits to our Annual Report on Form 10-K, of which this exhibit forms a part. We encourage you to read these documents, and the applicable provisions of the General Corporation Law of the State of Delaware (the “DGCL”), for additional information.
Common Stock
Common stock outstanding. As of February 19, 2024, there were 12,994,558 shares of common stock outstanding, which were held of record by 85 stockholders. All outstanding shares of common stock are fully paid and non-assessable.
Voting rights. The holders of common stock are entitled to one vote per share on all matters to be voted upon by the stockholders.
Dividend rights. Subject to preferences that may be applicable to any outstanding preferred stock, the holders of common stock are entitled to receive ratably such dividends, if any, as may be declared from time to time by the board of directors out of funds legally available therefor.
Rights upon liquidation. In the event of our liquidation, dissolution or winding up, the holders of common stock are entitled to share ratably in all assets remaining after payment of liabilities, subject to prior distribution rights of preferred stock, if any, then outstanding.
Other rights. The holders of common stock have no preemptive or conversion rights or other subscription rights. There are no redemption or sinking fund provisions applicable to the common stock.
Preferred Stock
As of February 19, 2024, there were no shares of preferred stock outstanding. Alpha’s board of directors has the authority to issue the preferred stock in one or more series and to fix the designations, powers, preferences and relative, participating, optional or other rights, if any, and the qualifications, limitations or restrictions thereof, if any, with respect to each such class or series of preferred stock and the number of shares constituting each such class or series, and to increase or decrease the number of shares of any such class or series to the extent permitted by Delaware law.
The issuance of preferred stock may have the effect of delaying, deferring or preventing a change in control of Alpha without further action by the stockholders and may adversely affect the voting and other rights of the holders of common stock. At present, Alpha has no plans to issue any of the preferred stock.
Description of Certain Provisions of Alpha's Second Amended and Restated Certificate of Incorporation, as amended, and Fourth Amended and Restated Bylaws, and Delaware Law
Removal of Directors; Vacancies
As of February 26, 2024, our board of directors is composed of seven directors, with one position currently vacant. The exact number of directors may be fixed from time to time by resolution of the board. Any director may be removed, with or without cause, at any time by the affirmative vote of shares representing a majority of the shares then entitled to vote at an election of directors. Any vacancy occurring on the board of directors and any newly created directorship shall, unless the board calls a special meeting for which the election of directors is included as business or as otherwise required by law, be filled solely by a majority of the directors remaining in office.
No Cumulative Voting
The DGCL provides that stockholders are not entitled to the right to cumulate votes in the election of directors unless Alpha’s second amended and restated certificate of incorporation, as amended, provides otherwise. Alpha’s second amended and restated certificate of incorporation, as amended, prohibits cumulative voting.
Calling of Special Meetings of Stockholders
Alpha’s second amended and restated certificate of incorporation, as amended, and Alpha’s fourth amended and restated bylaws, provide that special meetings of Alpha’s stockholders may be called only by Alpha’s board of directors, subject to the rights of the holders of any series of preferred stock.
No Stockholder Action by Written Consent
Alpha’s second amended and restated certificate of incorporation, as amended, and Alpha’s fourth amended and restated bylaws provide that any action required or permitted to be taken by Alpha’s stockholders must be effected by a duly called annual or special meeting of stockholders and may not be effected by any consent in lieu of a meeting of such stockholders, subject to the rights of the holders of any series of preferred stock.
Advance Notice Requirements for Stockholder Proposals and Director Nominations
Alpha’s fourth amended and restated bylaws provide that stockholders seeking to nominate candidates for election as directors or to bring business before an annual meeting of stockholders must provide timely notice of their proposal in writing to Alpha’s corporate secretary.
Generally, to be timely, a stockholder’s notice must be received at Alpha’s principal executive offices not less than 120 days nor more than 150 days prior to the first anniversary date of the date on which the Company first mailed its proxy materials for the previous year’s annual meeting. Alpha’s fourth amended and restated bylaws also specify requirements as to the form and content of a stockholder’s notice. These provisions may limit stockholders’ ability to bring matters before an annual meeting of stockholders or make nominations for directors at an annual meeting of stockholders.
Amendments to Alpha’s Second Amended and Restated Certificate of Incorporation, as Amended, and Fourth Amended and Restated Bylaws
Alpha’s second amended and restated certificate of incorporation, as amended, grants Alpha’s board of directors the authority to adopt, amend or repeal Alpha’s fourth amended and restated bylaws without a stockholder vote in any manner not inconsistent with the laws of the State of Delaware. Alpha’s second amended and restated certificate of incorporation, as amended, and fourth amended and restated bylaws may be amended by the affirmative vote of the holders of at least two-thirds of the shares of common stock.
Limitations on Liability and Indemnification of Officers and Directors
Alpha’s second amended and restated certificate of incorporation, as amended, provides that no director will be personally liable to Alpha or its stockholders for monetary damages for breach of fiduciary duty as a director, except as required by applicable law, as in effect from time to time. Currently, Delaware law requires that liability be imposed for the following:
|
|
|
|
|
|
| • |
any breach of the director’s duty of loyalty to Alpha or its stockholders; |
|
|
| • |
any act or omission not in good faith or which involved intentional misconduct or a knowing violation of law; |
|
|
| • |
unlawful payments of dividends or unlawful stock repurchases or redemptions under Section 174 of the Delaware General Corporation Law; and |
|
|
| • |
any transaction from which the director derived an improper personal benefit. |
As a result, neither Alpha nor its stockholders have the right, through stockholders’ derivative suits on their behalf, to recover monetary damages against a director for breach of fiduciary duty as a director, including breaches resulting from grossly negligent behavior, except in the situations described above.
Alpha’s second amended and restated certificate of incorporation, as amended, provides that, to the fullest extent permitted by law, Alpha will indemnify any officer or director of Alpha against all damages, claims and liabilities arising out of the fact that the person is or was Alpha’s director or officer, or served any other enterprise at Alpha’s request as a director, officer, employee, agent or fiduciary. Alpha will reimburse the expenses, including attorneys’ fees, incurred by a person indemnified by this provision when Alpha receives an undertaking to repay such amounts if it is ultimately determined that the person is not entitled to be indemnified by Alpha. Amending this provision will not reduce Alpha’s indemnification obligations relating to actions taken before an amendment.
Delaware Anti-Takeover Statute
Alpha is subject to Section 203 of the DGCL. Subject to specified exceptions, Section 203 prohibits a publicly held Delaware corporation from engaging in a “business combination” with an “interested stockholder” for a period of three years after the date of the transaction in which the person became an interested stockholder. “Business combinations” include mergers, asset sales and other transactions resulting in a financial benefit to the “interested stockholder.” Subject to various exceptions, an “interested stockholder” is a person who together with his or her affiliates and associates, owns, or within three years did own, 15% or more of the corporation’s outstanding voting stock.
Certain of the above-described provisions of Alpha's second amended and restated certificate of incorporation, as amended, Alpha's fourth amended and restated bylaws and the DGCL may have the effect of making it more difficult for a third party to acquire, or discouraging a third party from attempting to acquire, control of Alpha.
Exclusive Forum Provision of Alpha’s Fourth Amended and Restated Bylaws
Under Alpha’s fourth amended and restated bylaws, to the fullest extent permitted by law and unless Alpha consents in writing to the selection of an alternative forum, the Court of Chancery of the state of Delaware will be the sole and exclusive forum for (i) any derivative action or proceeding brought on behalf of Alpha, (ii) any action asserting a claim of breach of a fiduciary duty owed by any Alpha director, officer or other employee to Alpha or its stockholders, (iii) any action asserting a claim arising pursuant to any provision of the DGCL or the Alpha charter (including any certificate of designations relating to any class or series of preferred stock) or the Alpha bylaws (in each case, as they may be amended from time to time), or (iv) any action asserting a claim governed by the internal affairs doctrine. In addition, Alpha’s fourth amended and restated bylaws provide that the federal district courts of the United States of America will be the exclusive forum for resolving any complaint asserting a cause of action arising under the Securities Act of 1933, as amended.
By limiting the ability of third parties and Alpha’s stockholders to file such lawsuits in the forum of their choosing, these exclusive forum provisions could increase the costs to a plaintiff of bringing such a lawsuit and could have the effect of deterring such lawsuits, which could include potential takeover-related lawsuits.
Authorized but Unissued Capital Stock
The DGCL does not require stockholder approval for any issuance of authorized shares. However, the listing requirements of the New York Stock Exchange, which would apply so long as Alpha’s common stock is listed on the New York Stock Exchange, require stockholder approval of certain issuances equal to or exceeding 20% of the then-outstanding voting power or then-outstanding number of shares of common stock. These additional shares may be used for a variety of corporate purposes, including future public offerings, to raise additional capital or to facilitate acquisitions.
One of the effects of the existence of unissued and unreserved common stock may be to enable Alpha’s board of directors to issue shares to persons friendly to current management, which issuance could render more difficult or discourage an attempt to obtain control of Alpha by means of a merger, tender offer, proxy contest or otherwise, and thereby protect the continuity of our management and possibly deprive the stockholders of opportunities to sell their shares of common stock at prices higher than prevailing market prices.
Transfer Agent and Registrar
Computershare Trust Company, N.A. is the transfer agent and registrar for Alpha’s common stock.
EX-10.6
3
a12312023exhibit106.htm
AMR, INC. AMENDED AND RESTATED NON-EMPLOYEE DIRECTOR COMPENSATION POLICY
Document
ALPHA METALLURGICAL RESOURCES, INC.
AMENDED AND RESTATED
NON-EMPLOYEE DIRECTOR COMPENSATION POLICY
This Amended and Restated Non-Employee Director Compensation Policy (the “Policy”) of Alpha Metallurgical Resources, Inc. (the “Company”), as adopted by the Board of Directors of the Company (the “Board”) on May 3, 2023, is effective as of May 3, 2023 (the “Effective Date”). Capitalized terms used but not otherwise defined herein shall have the meanings ascribed to such terms in the Alpha Metallurgical Resources, Inc. Long-Term Incentive Plan (the “Plan”).
WHEREAS, the Board has determined that it is in the best interests of the Company to establish this Policy to set forth the compensation that will be payable to each member of the Board who is not an employee of the Company or of any subsidiary (each, an “Eligible Director”) as consideration for service on the Board.
NOW, THEREFORE, the Board hereby agrees as follows:
1.General. The cash compensation and restricted stock unit awards described in this Policy will be paid or be made, as applicable, automatically and without further action of the Board, to each Eligible Director. For the avoidance of doubt, any member of the Board who is not an Eligible Director will not be entitled to cash, equity or any other compensation in connection with service on the Board.
2.Annual Cash Compensation
a.Cash Retainer. Each Eligible Director serving as a member of the Board will receive an annual cash retainer of $100,000 for service on the Board (the “Cash Retainer”) for the period beginning on the date of the annual meeting of stockholders (“Annual Meeting”) of a given year and ending on the date of the Annual Meeting of the following year (each such period, a “Compensation Year”). An Eligible Director may elect, in accordance with procedures established by the Compensation Committee of the Board (the “Compensation Committee”), to receive one hundred percent (100%) of the Cash Retainer as a restricted stock unit award pursuant to the Plan, with the number of restricted stock units awarded equal to the amount of the Cash Retainer divided by the volume-weighted average price (VWAP) of the Company’s common stock as of market close on the 20 trading ending on the day prior to the grant date (the “20-day VWAP") (the “Elective RSUs”).
b.Other Retainers. Eligible Directors are entitled to receive additional annual cash compensation as set forth in this Section 2(b) for service as the chair of the Board, as a chair of a committee of the Board or as a non-chair committee member (collectively, the “Committee Retainers”). An Eligible Director may elect, in accordance with procedures established by the Compensation Committee, to receive one hundred percent (100%) of Committee Retainers as a restricted stock unit award pursuant to the Plan, with the number of restricted stock units awarded equal to the amount of the Committee Retainers divided by the 20-day VWAP (also “Elective RSUs”).
(i)Chair Compensation. Each Eligible Director is entitled to additional annual cash compensation for service as a chair of the Board or of a committee of the Board for service during a Compensation Year, as set forth in the following table:
|
|
|
|
|
|
| Position |
Annual Chair Compensation |
| Non-Employee Chair of the Board |
$100,000 |
| Lead Independent Director if Employee is Chair of the Board |
$50,000 |
Audit Committee Chair |
$30,000 |
Compensation Committee Chair |
$20,000 |
| Safety, Health & Environmental Committee Chair |
$15,000 |
Nominating & Corporate Governance Committee Chair |
$12,000 |
(ii)Committee Member Compensation. Each Eligible Director who serves as a member of a committee of the Board in a non-chair capacity is entitled to additional annual cash compensation for each committee on which such director serves during a Compensation Year, as set forth in the following table:
|
|
|
|
|
|
| Committee |
Annual Member Compensation |
| Audit Committee |
$10,000 |
| Compensation Committee |
$10,000 |
| Safety, Health & Environmental Committee |
$5,000 |
| Nominating & Corporate Governance Committee |
$5,000 |
3.Payment Schedule for the Cash Retainer and Meeting Fees; Proration of Cash Retainer
a.Payment Schedule. The Cash Retainer for each Eligible Director will be paid by the Company in equal quarterly installments during the first calendar month of the Compensation Year quarter to which such amount relates.
b.Acceleration / Proration of Cash Retainer. With respect to any Compensation Year in which an Eligible Director’s service as a member of the Board is terminated as of a date that is more than six (6) months after the beginning of, but prior to the completion of, that Compensation Year, for any reason other than removal for cause, such Eligible Director will be entitled to receive any portion of the Eligible Director’s total Cash Retainer for that Compensation Year, including any Committee Retainer(s) unpaid as of the effective date of termination, and this amount shall be paid to the Eligible Director not later than the last day of his or her service as a member of the Board (or, if there was not at least thirty days’ advance notice regarding such termination, within thirty days of such notice). In the event a new Eligible Director is elected or appointed to the Board following the beginning of a Compensation Year, such Eligible Director will be entitled to receive a Cash Retainer for that Compensation Year, prorated based on the date of appointment or election and payable in accordance with the schedule set forth in Section 3(a).
c.New Annual Meeting Date. Notwithstanding Sections 3(a) and 3(b), if the Board determines that the date of the next Annual Meeting shall be more than thirty (30) days from the anniversary date of the prior Annual Meeting (the “Prior Year Date”), the Compensation Year then in effect shall end as of the earlier of (i) the date of the next Annual Meeting and (ii) the date which is thirty (30) days after the anniversary of the Prior Year Date. If the next Annual Meeting is held after the anniversary of the Prior Year Date, each Eligible Director at the time of the next Annual Meeting will be entitled to receive a prorated portion of the Cash Retainer for any partial quarter of service, payable during the calendar month immediately following the next Annual Meeting.
4.Payment Schedule for Committee Retainers
a.Payment Schedule. Each Eligible Director who is entitled to a Committee Retainer for service as the chair of the Board or on a Board committee during a Compensation Year will be paid this Committee Retainer in full during the first calendar month of the Compensation Year. If an Eligible Director is appointed to a new position or committee at a time other than at the beginning of a Compensation Year, the Eligible Director shall receive an un-prorated Committee Retainer for the applicable Compensation Year as a result of the appointment, paid in the calendar month immediately following the calendar month in which the appointment occurred.
b.New Annual Meeting Date. If the Board establishes an Annual Meeting date which does not coincide with the beginning of a Compensation Year, as described in Section 3(c), each Eligible Director will be paid any applicable Committee Retainer during the first calendar month of the new, adjusted Compensation Year, as described in Section 3(c), notwithstanding the fact that the Eligible Director may have received a Committee Retainer within the twelve (12) month period immediately preceding that date..
5.Equity Compensation
a.RSU Grants. Each Eligible Director serving as a member of the Board at the beginning of a Compensation Year will receive, pursuant to the Plan, an annual grant of the number of restricted stock units equal to $125,000 divided by the 20-day VWAP (the “Annual RSUs” and, together with any Elective RSUs held by the Eligible Director, the “RSUs”). The Annual RSUs will be granted as of each Annual Meeting date to each Eligible Director serving following the Annual Meeting (“Grant Date”) of the applicable Compensation Year. The RSUs will vest in full on the first to occur of (i) the day before the one-year anniversary of the date of grant (or, in the case of a new Eligible Director who is elected or appointed to the Board following the beginning of a Compensation Year, such other date as provided in the applicable Award Agreement), (ii) the Eligible Director's service as a member of the Board is terminated as of a date that is more than six (6) months after the beginning of but prior to the completion of that Compensation Year for any reason other than removal for cause, and (iii) a Change in Control, subject in each case to the Eligible Director's continuous service with the Company through such date. Unless otherwise elected by an Eligible Director in a Non-Employee Director Restricted Stock Unit Election Form or otherwise provided in the applicable Award Agreement, the shares of the
Company’s common stock or the Fair Market Value thereof (as determined pursuant to the applicable Award Agreement) in respect of vested RSUs will be delivered (or if settled in cash, will be paid) to the Eligible Director on the earlier of (A) the last day of his or her service as a member of the Board (or, if there was not at least thirty business days’ advance notice regarding the termination, within thirty business days following the termination, and (B) immediately prior to a Change in Control. In the event a new Eligible Director is elected or appointed to the Board following the beginning of a Compensation Year, the Compensation Committee will have the authority to determine, in its sole discretion, whether the new Director is eligible to receive, in connection with election or appointment, an annual grant of RSUs (or a prorated portion thereof) or a special, one-time grant of restricted stock units pursuant to the Plan. The applicable Award Agreement for a grant of restricted stock units will provide, as determined by the Committee in its sole discretion, whether the restricted stock units may be settled in cash or in shares of the Company’s common stock.
New Annual Meeting Date. If the Board establishes an Annual Meeting date which does not coincide with the beginning of a Compensation Year, as described in Section 3(c), s, each Eligible Director at the time of the next Annual Meeting will receive a grant of Annual RSUs on the first day of the Compensation Year beginning on the Annual Meeting date, which grant will be prorated to reflect any portion of the prior Compensation Year that would have, but for the changed Annual Meeting date, overlapped with the Compensation Year that commences on the next Annual Meeting date.
EX-10.16
4
a12312023exhibit1016.htm
FORM OF RESTRICTED STOCK UNIT AWARD AGREEMENT
Document
Alpha Metallurgical Resources, Inc.
RESTRICTED STOCK UNIT AWARD AGREEMENT
This Restricted Stock Unit Award Agreement (“Agreement”) is entered into by and between Alpha Metallurgical Resources, Inc. (the “Company”) and the participant whose name appears below (the “Participant”) in order to set forth the terms and conditions of Restricted Stock Units (the “RSUs”) granted to the Participant under the 2018 Long-Term Incentive Plan (the “Plan”).
Participant’s Name:
|
|
|
|
|
|
|
|
|
|
|
|
|
|
|
|
|
|
|
|
|
|
|
|
|
|
|
|
| Award Type |
|
Date of Grant |
|
Number of RSUs |
|
Vesting Schedule |
Restricted Stock Units (the “RSUs”) |
|
January 24, 2024 |
|
[X]
[X]
[X]
|
|
January 24, 2025
January 24, 2026
January 24, 2027
|
Subject to the attached Terms and Conditions and the terms of the Plan, which are incorporated herein by reference, the Company hereby grants to the Participant the number of RSUs on the Date of Grant and with the Vesting Schedule, each as set forth above. Capitalized terms used but not otherwise defined herein or in the attached Terms and Conditions shall have the meanings ascribed to such terms in the Plan.
IN WITNESS WHEREOF, the Company has duly executed and delivered this Agreement as of the Date of Grant.
|
|
|
|
|
|
|
|
|
|
|
|
| ALPHA METALLURGICAL RESOURCES, INC. |
|
PARTICIPANT |
| By: |
/s/ Roger L. Nicholson |
|
|
|
|
Name: Roger L. Nicholson |
|
Name: |
|
Title: EVP – CAO, General Counsel and Secretary |
|
|
PLEASE RETURN ONE SIGNED COPY OF THIS AGREEMENT TO:
Alpha Metallurgical Resources, Inc. 340 Martin Luther King Jr. Blvd. Bristol, TN 37620 Attn: Matt Franklin Alpha Metallurgical Resources, Inc. 2018 LONG-TERM INCENTIVE PLAN Terms and Conditions of RSU Grant
1.GRANT OF RSUs. The RSUs have been granted to the Participant as an incentive for the Participant to continue to provide services to the Company and to align the Participant’s interests with those of the Company. Each RSU corresponds to one Common Share. Each RSU constitutes a contingent and unsecured promise by the Company to deliver one Common Share on the settlement date, as set forth in Section 3.
2.VESTING. The RSUs shall vest in accordance with the Vesting Schedule, subject to the Participant’s continuous service with the Company through each applicable vesting date. All unvested RSUs shall be immediately forfeited upon a termination of Participant’s employment or service with the Company for any reason, except as otherwise provided in the Company’s Key Employee Separation Plan (the “KESP”), if applicable to the Participant. In the event of a Change in Control, the RSUs will be treated in accordance with the terms of the Plan.
3.SETTLEMENT. Except as otherwise set forth in the Plan, the RSUs will be settled in Common Shares, and the Participant shall receive the number of Common Shares that corresponds to the number of RSUs that have become vested as of the applicable vesting date, which Common Shares shall be delivered on the date that is no later than forty-five (45) days following the applicable vesting date, as determined in the Committee’s sole discretion.
4.DIVIDEND EQUIVALENT PAYMENTS. Until the RSUs settle in Common Shares, if the Company pays a dividend on Common Shares, the Participant will be entitled to a payment in the same amount as the dividend the Participant would have received if he or she held Common Shares in respect of his or her vested and unvested RSUs held but not previously forfeited immediately prior to the record date of the dividend (a “Dividend Equivalent”). No such Dividend Equivalents will be paid to the Participant with respect to any RSU that is thereafter cancelled or forfeited prior to the applicable vesting date. The Committee will determine the form of payment in its sole discretion and may pay Dividend Equivalents in Common Shares, cash or a combination thereof. The Company will pay the Dividend Equivalents within forty-five (45) days of the vesting date of the RSUs to which such Dividend Equivalents relate.
5.NONTRANSFERABILITY. No portion of the RSUs may be sold, assigned, transferred, encumbered, hypothecated, or pledged by the Participant, other than to the Company as a result of forfeiture of the RSUs as provided herein, unless and until payment is made in respect of vested RSUs in accordance with the provisions hereof and the Participant has become the holder of record of the vested Common Shares issuable hereunder, unless otherwise provided by the Committee.
6.TAX AND WITHHOLDING. Pursuant to rules and procedures that the Company establishes, tax or other withholding obligations arising upon vesting and settlement (as applicable) of the RSUs may be satisfied, in the Committee’s sole discretion, by having the Company withhold Common Shares, tendering Common Shares or by having the Company withhold cash if the Company provides for a cash withholding option, in each case in an amount sufficient to satisfy the tax or other withholding obligations. Common Shares withheld or tendered will be valued using the Fair Market Value of the Common Shares on the date the RSUs settle. In order to comply with applicable accounting standards or the Company's policies in effect from time to time, the Company may limit the amount of Common Shares that the Participant may have withheld or that the Participant may tender. The Participant acknowledges that, if he or she is subject to taxes in more than one jurisdiction, the Company may be required to withhold or account for taxes in more than one jurisdiction.
7.RIGHTS AS STOCKHOLDER. Except as set forth herein, the Participant will not have any rights as a stockholder in the Common Shares corresponding to the RSUs prior to settlement of the RSUs.
8.SECURITIES LAW COMPLIANCE. The Company may, if it determines it is appropriate, affix any legend to the stock certificates representing Common Shares issued upon settlement of the RSUs and any stock certificates that may subsequently be issued in substitution for the original certificates. The Company may advise the transfer agent to place a stop order against such Common Shares if it determines that such an order is necessary or advisable.
9.COMPLIANCE WITH LAW. Any sale, assignment, transfer, pledge, mortgage, encumbrance or other disposition of Common Shares issued upon settlement of the RSUs (whether directly or indirectly, whether or not for value, and whether or not voluntary) must be made in compliance with any applicable constitution, rule, regulation, or policy of any of the exchanges, associations or other institutions with which the Company has membership or other privileges, and any applicable law, or applicable rule or regulation of any governmental agency, self-regulatory organization or state or federal regulatory body.
10.MISCELLANEOUS.
(a)No Right To Continued Employment or Service. This Agreement shall not confer upon the Participant any right to continue in the employ or service of the Company or any Affiliate or Subsidiary or to be entitled to any remuneration or benefits not set forth in this Agreement or the Plan nor interfere with or limit the right of the Company or any Affiliate or Subsidiary to modify the terms of or terminate the Participant’s employment or service at any time.
(b)No Advice Regarding Grant. The Company is not providing any tax, legal or financial advice, nor is the Company making any recommendations regarding the Participant’s participation in the Plan or acquisition or sale of the underlying Common Shares. The Participant is hereby advised to consult with his or her own personal tax, legal and financial advisors regarding his or her participation in the Plan before taking any action related to the Plan.
(c)Plan to Govern. This Agreement and the rights of the Participant hereunder are subject to all of the terms and conditions of the Plan as the same may be amended from time to time, as well as to such rules and regulations as the Committee may adopt for the administration of the Plan.
(d)Amendment. Subject to the restrictions set forth in the Plan, the Company may from time to time suspend, modify or amend this Agreement or the Plan. Subject to the Company’s rights pursuant to Sections 12(b) and 21 of the Plan, no amendment of the Plan or this Agreement may, without the consent of the Participant, adversely affect the rights of the Participant in a material manner with respect to the RSUs granted pursuant to this Agreement.
(e)Severability. In the event that any provision of this Agreement shall he held illegal or invalid for any reason, such illegality or invalidity shall not affect the remaining provisions of this Agreement, and this Agreement shall be construed and enforced as if the illegal or invalid provision had not been included.
(f)Entire Agreement. This Agreement and the Plan contain all of the understandings between the Company and the Participant concerning the RSUs granted hereunder and supersede all prior agreements and understandings.
(g)Successors. This Agreement shall be binding upon and inure to the benefit of any successor or successors of the Company and any person or persons who shall, upon the Participant’s death, acquire any rights hereunder in accordance with this Agreement or the Plan.
(h)Governing Law. To the extent not preempted by federal law, this Agreement shall be construed in accordance with and governed by the laws of the State of Delaware, without regard to any conflicts or choice of law, rule or principle that might otherwise refer the interpretation of the award to the substantive law of another jurisdiction.
(i)Compliance with Section 409A of the Internal Revenue Code. The Award is intended to comply with Section 409A of the Code (“Section 409A”) to the extent subject thereto, and shall be interpreted in accordance with Section 409A and treasury regulations and other interpretive guidance issued thereunder, including without limitation any such regulations or other guidance that may be issued after the Date of Grant. The Company reserves the right to modify the terms of this Agreement, including, without limitation, the payment provisions applicable to the RSUs, to the extent necessary or advisable to comply with Section 409A and reserves the right to make any changes to the RSU award so that it does not become subject to Section 409A or a “specified employee” waiting period (as described below).
For purposes of this Agreement, each amount to be paid or benefit to be provided shall be construed as a separate identified payment for purposes of Section 409A.
Notwithstanding any provision in the Plan to the contrary, no payment or distribution under this Agreement that constitutes an item of deferred compensation under Section 409A and becomes payable by reason of the Participant’s termination of employment or service with the Company shall be made to the Participant until his or her termination of employment or service constitutes a “separation from service” within the meaning of Section 409A. Notwithstanding any provision in the Plan or this Agreement to the contrary, if the Participant is a specified employee within the meaning of Section 409A, then to the extent necessary to avoid the imposition of taxes under Section 409A, the Participant shall not be entitled to any payments upon a termination of his or her employment or service until the earlier of: (i) the expiration of the six (6)-month period measured from the date of the Participant’s separation from service or (ii) the date of the Participant’s death. Upon the expiration of the applicable waiting period set forth in the preceding sentence, all payments and benefits deferred pursuant to this Section 10(i) (whether they would have otherwise been payable in a single lump sum or in installments in the absence of such deferral) shall be paid to the Participant in a lump sum as soon as practicable, but in no event later than sixty (60) calendar days, following such expired period, and any remaining payments due under this Agreement will be paid in accordance with the normal payment dates specified for them herein.
Notwithstanding any provision of the Plan or this Agreement to the contrary, in no event shall the Company or any affiliate be liable to the Participant on account of failure of the RSUs to (i) qualify for favorable U.S. or foreign tax treatment or (ii) avoid adverse tax treatment under U.S. or foreign law, including, without limitation, under Section 409A.
(j)If Participant is an executive officer of the Company, Participant acknowledges and agrees that the awards granted to the participant hereby, as well as those previously granted to Participant in connection with service as an executive officer, are subject to the Company’s Amended and Restated Executive Officer Incentive Compensation Recoupment Policy, as that policy may be amended from time to time by the Company’s board of directors.
EX-10.17
5
a12312023exhibit1017.htm
FORM OF PERFORMANCE STOCK UNIT AWARD AGREEMENT
Document
Alpha Metallurgical Resources, Inc.
PERFORMANCE STOCK UNIT AWARD AGREEMENT
This Performance Stock Unit Award Agreement (“Agreement”) is entered into by and between Alpha Metallurgical Resources, Inc. (the “Company”) and the participant whose name appears below (the “Participant”) in order to set forth the terms and conditions of a Performance Award (the “Award”) in the form of performance-based Restricted Stock Units (the “PSUs”) granted to the Participant under the 2018 Long-Term Incentive Plan (the “Plan”).
Participant’s Name:
|
|
|
|
|
|
|
|
|
|
|
|
|
|
|
|
|
|
|
|
|
|
|
|
|
|
|
| Award Type |
|
“Date of Grant” |
|
“Target PSUs” |
|
“Vesting Date” |
|
“Performance Period” |
Performance-Based Restricted Stock Units (the “PSUs”) |
|
January 24, 2024 |
|
Relative TSR Units: [X]
NFDL Units: [X]
FPS Units: [X]
YPD Units: [X]
|
|
January 24, 2027 |
|
January 1, 2024 through December 31, 2026 |
Subject to the attached Terms and Conditions and the terms of the Plan, which are incorporated herein by reference, the Company hereby grants to the Participant the Award of PSUs with a Date of Grant, amount of Relative TSR Units, NFDL Units, FPS Units and YPD Units, respectively, Vesting Date and Performance Period, as set forth above. Capitalized terms used but not otherwise defined herein, in the attached Terms and Conditions or in Appendix A shall have the meanings ascribed to such terms in the Plan.
IN WITNESS WHEREOF, the Company has duly executed and delivered this Agreement as of the Date of Grant.
|
|
|
|
|
|
|
|
|
|
|
|
| ALPHA METALLURGICAL RESOURCES, INC. |
|
PARTICIPANT |
|
|
|
| By: |
/s/ Roger L. Nicholson |
|
|
|
Name: Roger L. Nicholson |
|
Name: |
|
Title: EVP – CAO, General Counsel and Secretary |
|
|
PLEASE RETURN ONE SIGNED COPY OF THIS AGREEMENT TO:
Alpha Metallurgical Resources, Inc. 340 Martin Luther King Jr. Blvd. Bristol, TN 37620 Attn: Matt Franklin Alpha Metallurgical Resources, Inc. 2018 LONG-TERM INCENTIVE PLAN Terms and Conditions of PSU Grant
1.GRANT OF PSUs. The Award has been granted to the Participant as an incentive for the Participant to continue to provide services to the Company or its Affiliate or Subsidiary and to align the Participant’s interests with those of the Company. Each PSU earned under the Award (“Earned PSUs”) will correspond to one Common Share. The Award constitutes a contingent and unsecured promise by the Company to deliver one Common Share on the settlement date for each PSU earned, as set forth in Section 3.
2.VESTING. The Award shall vest as to a number of PSUs on the Vesting Date, subject to (i) the Participant’s continuous service with the Company or any Affiliate or Subsidiary through the Vesting Date (the “Service Condition”) and (ii) the satisfaction of the performance conditions set forth in Appendix A (the “Performance Conditions”) measured as of December 31, 2026 (the “Measurement Date”). The PSUs shall, subject to the terms of the Company’s Key Employee Separation Plan, as applicable, be immediately forfeited in their entirety without any delivery of Common Shares or other payment to the Participant upon a termination of Participant’s employment or service with the Company or any Affiliate or Subsidiary for any reason on or prior to the Vesting Date. In the event of a Change in Control, the PSUs will be treated in accordance with the terms of the Plan.
3.SETTLEMENT. Except as otherwise set forth in the Plan, any Earned PSUs will be settled in Common Shares, and the Participant shall receive the number of Common Shares that corresponds to the number of Earned PSUs that become vested as of the Vesting Date based on the satisfaction of the Performance Conditions. Common Shares shall be delivered on the date that is no later than forty-five (45) days following the Vesting Date, as determined in the Committee’s sole discretion.
4.DIVIDEND EQUIVALENT PAYMENTS. Until the PSUs settle in Common Shares, if the Company pays a dividend on Common Shares during the Performance Period, the Participant will become entitled as of the Vesting Date to a payment in the same amount as the dividend the Participant would have received if he or she held Common Shares in respect of his or her Earned PSUs immediately prior to the record date of the dividend (a “Dividend Equivalent”). No such Dividend Equivalents will be paid to the Participant with respect to any PSU that is cancelled or forfeited prior to the Vesting Date or that is otherwise not earned under the terms of the Award. The Committee will determine the form of payment in its sole discretion and may pay Dividend Equivalents in Common Shares, cash or a combination thereof. The Company will pay the Dividend Equivalents within forty-five (45) days of the Vesting Date.
5.NONTRANSFERABILITY. No portion of the Award may be sold, assigned, transferred, encumbered, hypothecated, or pledged by the Participant, other than to the Company as a result of forfeiture of the Award as provided herein, unless and until payment is made in respect of any Earned PSUs in accordance with the provisions hereof and the Participant has become the holder of record of the vested Common Shares issuable hereunder, unless otherwise provided by the Committee.
6.TAX AND WITHHOLDING. Pursuant to rules and procedures that the Company establishes, tax or other withholding obligations arising upon vesting and settlement (as applicable) of any Earned PSUs may be satisfied, in the Committee’s sole discretion, by having the Company or the Participant’s employer withhold Common Shares, tendering Common Shares or by having the Company or the Participant’s employer withhold cash if the Company provides for a cash withholding option, in each case in an amount sufficient to satisfy the tax or other withholding obligations. Common Shares withheld or tendered will be valued using the Fair Market Value of the Common Shares on the date the Award settles. In order to comply with applicable accounting standards or the Company's policies in effect from time to time, the Company may limit the amount of Common Shares that the Participant may have withheld or that the Participant may tender. The Participant acknowledges that, if he or she is subject to taxes in more than one jurisdiction, the Company or the Participant’s employer may be required to withhold or account for taxes in more than one jurisdiction.
7.RIGHTS AS STOCKHOLDER. Except as set forth herein, the Participant will not have any rights as a stockholder in the Common Shares corresponding to any PSUs prior to settlement of any Earned PSUs.
8.SECURITIES LAW COMPLIANCE. The Company may, if it determines it is appropriate, affix any legend to the stock certificates (or book entry) representing Common Shares issued upon settlement of any Earned PSUs and any stock certificates that may subsequently be issued in substitution for the original certificates. The Company may advise the transfer agent to place a stop order against such Common Shares if it determines that such an order is necessary or advisable.
9.COMPLIANCE WITH LAW AND POLICY. Any sale, assignment, transfer, pledge, mortgage, encumbrance or other disposition of Common Shares issued upon settlement of any Earned PSUs (whether directly or indirectly, whether or not for value, and whether or not voluntary) must be made in compliance with Company policy then in effect and any applicable constitution, rule, regulation, or policy of any of the exchanges, associations or other institutions with which the Company has membership or other privileges, and any applicable law, or applicable rule or regulation of any governmental agency, self-regulatory organization or state or federal regulatory body.
10.MISCELLANEOUS.
(a)No Right To Continued Employment or Service. This Agreement shall not confer upon the Participant any right to continue in the employ or service of the Company or any Affiliate or Subsidiary or to be entitled to any remuneration or benefits not set forth in this Agreement or the Plan nor interfere with or limit the right of the Company or any Affiliate or Subsidiary to modify the terms of or terminate the Participant’s employment or service at any time.
(b)No Advice Regarding Grant. The Company is not providing any tax, legal or financial advice, nor is the Company making any recommendations regarding the Participant’s participation in the Plan or acquisition or sale of the underlying Common Shares. The Participant is hereby advised to consult with his or her own personal tax, legal and financial advisors regarding his or her participation in the Plan before taking any action related to the Plan.
(c)Plan to Govern. This Agreement and the rights of the Participant hereunder are subject to all of the terms and conditions of the Plan as the same may be amended from time to time, as well as to such rules and regulations as the Committee may adopt for the administration of the Plan.
(d)Amendment. Subject to the restrictions set forth in the Plan, the Company may from time to time suspend, modify or amend this Agreement or the Plan. Subject to the Company’s rights pursuant to Sections 12(b) and 21 of the Plan, no amendment of the Plan or this Agreement may, without the consent of the Participant, adversely affect the rights of the Participant in a material manner with respect to the Award granted pursuant to this Agreement.
(e)Severability. In the event that any provision of this Agreement shall he held illegal or invalid for any reason, such illegality or invalidity shall not affect the remaining provisions of this Agreement, and this Agreement shall be construed and enforced as if the illegal or invalid provision had not been included.
(f)Entire Agreement. This Agreement and the Plan contain all of the understandings between the Company and the Participant concerning the Award granted hereunder and supersede all prior agreements and understandings.
(g)Successors. This Agreement shall be binding upon and inure to the benefit of any successor or successors of the Company and any person or persons who shall, upon the Participant’s death, acquire any rights hereunder in accordance with this Agreement or the Plan.
(h)Governing Law. To the extent not preempted by federal law, this Agreement shall be construed in accordance with and governed by the laws of the State of Delaware, without regard to any conflicts or choice of law, rule or principle that might otherwise refer the interpretation of the award to the substantive law of another jurisdiction.
(i)Compliance with Section 409A of the Internal Revenue Code. The Award is intended to comply with Section 409A of the Code (“Section 409A”) to the extent subject thereto, and shall be interpreted in accordance with Section 409A and treasury regulations and other interpretive guidance issued thereunder, including without limitation any such regulations or other guidance that may be issued after the Date of Grant. The Company reserves the right to modify the terms of this Agreement, including, without limitation, the payment provisions applicable to the Award, to the extent necessary or advisable to comply with Section 409A and reserves the right to make any changes to the Award so that it does not become subject to Section 409A or a “specified employee” waiting period (as described below).
For purposes of this Agreement, each amount to be paid or benefit to be provided shall be construed as a separate identified payment for purposes of Section 409A.
Notwithstanding any provision in the Plan to the contrary, no payment or distribution under this Agreement that constitutes an item of deferred compensation under Section 409A and becomes payable by reason of the Participant’s termination of employment or service with the Company or any Affiliate or Subsidiary shall be made to the Participant until his or her termination of employment or service constitutes a “separation from service” within the meaning of Section 409A. Notwithstanding any provision in the Plan or this Agreement to the contrary, if the Participant is a specified employee within the meaning of Section 409A, then to the extent necessary to avoid the imposition of taxes under Section 409A, the Participant shall not be entitled to any payments upon a termination of his or her employment or service until the earlier of: (i) the expiration of the six (6)-month period measured from the date of the Participant’s separation from service or (ii) the date of the Participant’s death.
Upon the expiration of the applicable waiting period set forth in the preceding sentence, all payments and benefits deferred pursuant to this Section 10(i) (whether they would have otherwise been payable in a single lump sum or in installments in the absence of such deferral) shall be paid to the Participant in a lump sum as soon as practicable, but in no event later than sixty (60) calendar days, following such expired period, and any remaining payments due under this Agreement will be paid in accordance with the normal payment dates specified for them herein.
Notwithstanding any provision of the Plan or this Agreement to the contrary, in no event shall the Company or any Affiliate or Subsidiary be liable to the Participant on account of failure of the Award to (i) qualify for favorable U.S. or foreign tax treatment or (ii) avoid adverse tax treatment under U.S. or foreign law, including, without limitation, under Section 409A.
(j)If Participant is an executive officer of the Company, Participant acknowledges and agrees that the awards granted to the participant hereby, as well as those previously granted to Participant in connection with service as an executive officer, are subject to the Company’s Amended and Restated Executive Officer Incentive Compensation Recoupment Policy, as that policy may be amended from time to time by the Company’s board of directors.
Appendix A
Performance Stock Unit Award Agreement
Performance Conditions
1.PERFORMANCE CONDITIONS. The Relative TSR Units may be earned based on and subject to the achievement of Company TSR relative to the TSR of the Comparator Group during the Performance Period (the “Relative TSR Metric”). The NFDL Units may be earned based on and subject to the achievement of the Company’s annual average rate of Non-Fatal Days Lost (“NFDL”) metric during the Performance Period (the “NFDL Metric”). The FPS Units may be earned based on and subject to the achievement of the Company’s Underground Feet Per Shift (“FPS”) metric during the Performance Period (the “FPS Metric”). The YPD Units may be earned based on and subject to the achievement of the Company’s Surface Yards Per Day (“YPD”) metric during the Performance Period (the “YPD Metric”). Subject to Section 2 of the Terms and Conditions, the Performance Conditions shall be measured as of the Measurement Date in accordance with this Appendix A.
2.RELATIVE TSR METRIC. (a) Subject to Section 2(b) of this Appendix A and satisfaction of the Service Condition, the Relative TSR Units shall vest and become Earned PSUs based on the positioning of the Company TSR within the Comparator Group TSR, in accordance with the following table.
|
|
|
|
|
|
|
|
|
| Performance Level |
Company TSR Position within the Comparator Group |
% of Relative TSR Units Earned |
| Below Threshold |
Lowest |
0% |
| Threshold |
Second Lowest |
50% |
| Target |
Third Highest |
100% |
| Maximum |
Highest |
200% |
If, as of the Measurement Date, the Company TSR is between Performance Levels, then the Relative TSR Units shall vest and become Earned PSUs using straight line linear interpolation, based on the Comparator Group TSRs of the Comparator Group members that are positioned immediately above and below the Company. For example, if the Company TSR is the second highest among the Comparator Group with a 13% TSR, and the highest performing member of the Comparator Group had a 17% TSR and the third highest performing member of the Comparator Group had a 10% TSR, then straight line linear interpolation would result in a vesting percentage of the Relative TSR Units of 143%.
(b) Notwithstanding the foregoing, if the Company TSR is below 0%, then the percentage of the Relative TSR Units that vest and become Earned PSUs shall not exceed 100%.
(c) The Company shall make the following adjustments to the calculation to be made with respect to the Relative TSR Units, as applicable:
(i)If a member of the Comparator Group is acquired by, or merges with, another company during the Performance Period, or announces such an acquisition or merger during the Performance Period, such member’s Comparator Group TSR shall be measured as of the date that is two business days prior to the announcement of such acquisition or merger; and
(ii)If a member of the Comparator Group files for bankruptcy, liquidation or reorganization during the Performance Period, such member of the Comparator Group shall be treated as having the lowest Comparator Group TSR.
3.NFDL METRIC. (a) For each fiscal year during the Performance Period, the Committee shall establish threshold, target and maximum performance goals for achievement of the NFDL Metric during the applicable fiscal year, and shall certify NFDL Metric performance at the end of the applicable fiscal year. Subject to satisfaction of the Service Condition, the total NFDL Units shall vest and become Earned PSUs based on the Average Company NFDL of the fiscal years in the Performance Period, in accordance with the following table.
|
|
|
|
|
|
|
|
|
| Performance Level |
Average Company NFDL |
% of NFDL Units Earned |
| Below Threshold |
>112% of Target |
0% |
| Threshold |
112% of Target |
50% |
| Target |
100% of Target |
100% |
| Maximum |
81.5% of Target |
200% |
If, as of the Measurement Date, the Average Company NFDL is between Performance Levels, then straight-line linear interpolation shall be used to determine the percentage of the NFDL Units that shall vest and become Earned PSUs with respect to the NFDL Metric.
(b) In the event of an acquisition, merger, disposition or other strategic event involving the Company that affects the Company’s NFDL rate potential, the Committee may make such adjustments to the calculation of the NFDL Metric as the Committee determines are appropriate in its sole discretion.
4.FPS AND YPD METRIC. (a) For each fiscal year during the Performance Period, the Committee shall establish threshold, target and maximum performance goals for achievement of the FPS and YPD Metric during the applicable fiscal year, and shall certify performance of the FPS and YPD Metric at the end of the applicable fiscal year. Subject to satisfaction of the Service Condition, the total FPS and total YPD Units shall vest and become Earned PSUs based on the Average Company FPS and YPD of the fiscal years in the Performance Period in accordance with the following table.
|
|
|
|
|
|
|
|
|
| Performance Level |
Average Company FPS |
% of FPS Units Earned |
| Below Threshold |
<92% of Target |
0% |
| Threshold |
92% of Target |
50% |
| Target |
100% of Target |
100% |
| Maximum |
108% of Target |
200% |
If, as of the Measurement Date, the Average Company FPS and YPD is between Performance Levels, then straight line linear interpolation shall be used to determine the percentage of the FPS and YPD Units that shall vest and become Earned PSUs with respect to the FPS and YPD Metric.
(b) In the event of an acquisition, merger, disposition or other strategic event involving the Company that affects the Company’s FPS and YPD potential, the Committee may make such adjustments to the calculation of the FPS and YPD Metric as the Committee determines are appropriate in its sole discretion.
5.DEFINITIONS.
(a)“Average Company FPS” means the average FPS performance for each fiscal year during the Performance Period, based on annual performance goals established by the Committee.
(b)“Average Company YPD” means the average YPD performance for each fiscal year during the Performance Period, based on annual performance goals established by the Committee.
(c)“Average Company NFDL” means the average NFDL performance for each fiscal year during the Performance Period, based on annual performance goals established by the Committee.
(d)“Company End Price” means the average of the closing prices of a Common Share for the 20 trading days ending on the Measurement Date.
(e)“Company Start Price” means the average of the closing prices of a Common Share for the 20 trading days ending on December 31, 2023.
(f)“Company TSR” means the total shareholder return of the Company over the Performance Period, as measured by (x) the Company End Price minus the Company Start Price (assuming dividends are reinvested as of the dividend payment date), divided by (y) the Company Start Price and multiplied by (z) 100.
(g)“Comparator Group” means Peabody Energy Corporation, Warrior Met Coal, Inc., Arch Resources, Inc., CONSOL Energy Inc. and Ramaco Resources, Inc.
(h)“Comparator Group End Price” means, with respect to a company that is part of the Comparator Group, the average of the closing prices of such company’s common shares on the principal exchange on which such shares are then traded for the 20 trading days ending on the Measurement Date.
(i)“Comparator Group Start Price” means, with respect to a company that is part of the Comparator Group, the average of the closing prices of such company’s common shares on the principal exchange on which such shares are then traded for the 20 trading days ending on December 31, 2023.
(j)“Comparator Group TSR” means, with respect to a company that is part of the Comparator Group, such company’s total shareholder return over the Performance Period, as measured by (x) the Comparator Group End Price minus the Comparator Group Start Price (assuming dividends are reinvested as of the dividend payment date), divided by (y) such Comparator Group Start Price and multiplied by (z) 100.
(k)“Performance Period” means the period commencing on January 1, 2024 and ending on December 31, 2026.
EX-19
6
a12312023exhibit19.htm
AMR, INC INSIDER TRADING AND INFORMATION DISCLOSURE POLICY
Document
Alpha Metallurgical Resources, Inc.
Insider Trading and Information Disclosure Policy
Adopted by the Board of Directors on February 21, 2023
Persons engaging in transactions in a company’s equity or debt securities at a time when they have material nonpublic information regarding the company, or who disclose material nonpublic information or make recommendations or express opinions on the basis of material nonpublic information to a person who engages in transactions in that company’s securities (“tipping”), may be violating securities laws and be subject to significant monetary fines and imprisonment. Alpha Metallurgical Resources, Inc. and its subsidiaries (collectively, the “Company”) and its supervisory personnel also face potential civil and criminal liability if they fail to take appropriate steps to prevent illegal insider trading. The SEC has imposed large penalties even when the disclosing person did not profit from the trading. There is no minimum amount of profit required for prosecution.
In order to take an active role in promoting compliance with such laws, and preventing insider trading violations by its officers, directors, employees, temporary employees, independent consultants and contractors of the Company (“Company Persons” and each a “Company Person”), the Company has adopted this Insider Trading and Information Disclosure Policy (this “Policy”). Once you have reviewed this Policy, please sign the attached Insider Trading Policy Compliance Statement (Attachment B) and return it to the Policy Administrator (as defined below).
Company Persons who violate this Policy will be subject to disciplinary action by the Company, which may include ineligibility for future participation in the Company’s equity incentive plans or termination of employment or other service to the Company.
I.Administration of Policy
The Chief Legal Officer has ultimate responsibility for all matters pertaining to the interpretation and enforcement of this Policy. The Chief Legal Officer and the “Policy Administrator,” who may be designated by the Chief Legal Officer, have the specific responsibilities indicated in this Policy. The initial Policy Administrator is the Senior Vice President, Deputy General Counsel and Assistant Corporate Secretary.
II.Applicability of Policy
Except as provided herein, this Policy applies to all transactions in all securities that the Company has issued or may issue from time to time, including, but not limited to, common stock, options or units related to common stock, debt securities, preferred stock, warrants and convertible debentures, as well as to derivative securities relating to the Company’s securities, including securities exchangeable into the Company’s securities, whether or not issued by the Company, such as exchange-traded options (collectively, “Company Securities”).
Its prohibitions apply to actions taken by all Company Persons.
Portions of this Policy impose additional obligations on certain Company Persons that have, or are likely to have, regular or special access to material nonpublic information in the normal course of their duties (“Insiders”). The Company has determined that the persons identified on Attachment A are Insiders for the purposes of this Policy. The Policy Administrator, in consultation with other members of management, as necessary, shall maintain the list of Insiders, including by removing or adding persons to the list as necessary. The Chief Legal Officer or Policy Administrator may also subject directors and certain employees with inside knowledge of material information to ad hoc restrictions.
The restrictions and prohibitions in this Policy on actions by Company Persons also apply to actions by the spouses, minor children and adult members of the households of Company Persons, and any entities (including, but not limited to, trusts or family partnerships) that Company Persons directly or indirectly influence or control (“related persons”). All Company Persons are responsible for ensuring that such other persons or entities do not engage in the activities restricted or prohibited under this Policy.
This Policy (and/or a summary thereof) shall be delivered to all new Company Persons upon the commencement of their relationships with the Company and is to be circulated to all Company Persons at least annually.
III.Statement of Policy
General Prohibition Against Insider Trading
No Trading or Tipping on Material Nonpublic Information. No Company Person may, while in possession of material nonpublic information about the Company:
•buy, sell or otherwise engage in any transactions, directly or indirectly, in any Company Securities, except as described in Section VI of this Policy;
•make recommendations or express opinions about trading in Company Securities on the basis of such information;
•disclose such information to any third party, including family or household members; or
•assist anyone in the above activities.
The above restrictions also apply to transacting in the securities of another company while in possession of material nonpublic information relating to such other company when that information is obtained in the course of employment with, or other services performed on behalf of, the Company or any subsidiary of the Company.
Transactions that may be necessary or justifiable for independent reasons (such as the need to raise money for an emergency expenditure) are not excepted from these restrictions. The securities laws do not recognize mitigating circumstances, and in any event, even the appearance of an improper transaction must be avoided to preserve the Company’s reputation for adhering to the highest standards of conduct. Transactions involving securities of subsidiaries or affiliates should be carefully reviewed by counsel for compliance not only with U.S. law but also for possible application of local law.
Material Nonpublic Information. It is not possible to define all categories of material information, as the ultimate determination of materiality by enforcement authorities will be based on an assessment of all of the facts and circumstances. Information that is material at one point in time may cease to be material at another point in time, and vice versa.
In general, information is considered “material” if there is a reasonable likelihood that it would be considered important to an investor in making a decision to buy, hold or sell securities. Any information that could be expected to affect a company’s stock price, whether positive or negative, and whether the change is large or small, may be considered material.
While it may be difficult under this standard to determine whether particular information is material, there are various categories of information that are particularly sensitive and, as a general rule, should be considered material. Examples of such information include:
•Financial results for fiscal quarters or years;
•Projections (or updates thereof) of future revenues, earnings or losses intended to be publicly released;
•News of a pending or proposed merger;
•News of the disposition or acquisition of significant assets or a significant subsidiary;
•Material impairments, write-offs or restructurings;
•Creation of a material direct or contingent financial obligation;
•Impending bankruptcy or financial liquidity problems;
•The gain or loss of a substantial customer or supplier;
•Stock splits;
•New equity or debt offerings;
•Significant litigation or regulatory exposure due to actual or threatened litigation, investigations or enforcement activity;
•A significant cybersecurity incident;
•Major changes in senior management;
•Material agreements not in the ordinary course of business (or termination thereof); and
•Termination or significant reduction of a business relationship with a customer that provides material revenue to the Company.
Each of the Chief Legal Officer and the Policy Administrator, in consultation as appropriate with other members of senior management of the Company, has the authority to determine whether any information constitutes material nonpublic information.
Nonpublic Information. Information is not considered public until it has been disclosed broadly to the marketplace (for example, included in a press release or, if applicable, in a filing with the Securities and Exchange Commission (the “SEC”)) and the investing public has had time to absorb the information fully. For purposes of this Policy, information will be considered to be fully absorbed by 9:30 a.m. U.S. Eastern Time on the third “trading day” after the information is released. If, for example, the Company were to make an announcement on Monday, the information in the announcement would be considered public (and trades could be made) starting at 9:30 a.m. U.S. Eastern Time on Thursday (assuming all relevant days are “trading days”; a “trading day” is a day on which the New York Stock Exchange is open for business).
Special Restrictions and Prohibitions
The following transactions present heightened legal risk and/or the appearance of improper or inappropriate conduct on the part of Company Persons, and are restricted or prohibited as follows. The restrictions and prohibitions apply even if the relevant Company Person is not in possession of material nonpublic information.
Short Sales. Short sales of a security (i.e., the sale of a security that the seller does not own) by their nature reflect an expectation that the value of the security will decline. Short sales can create perverse incentives for the seller, and signal to the market a lack of confidence in the Company’s prospects. Accordingly, no Company Person may engage in a short sale of Company Securities.
Publicly Traded Options or Other Derivatives. A put is an option to sell a security at a specific price before a set date, and a call is an option or right to buy a security at a specific price before a set date. Generally, put options are purchased when a person believes the value of a security will fall, and call options are purchased when a person believes the value of a security will rise. A transaction in options is, in effect, a bet on the short-term movement of the Company’s securities, and therefore creates the appearance of trading on the basis of material nonpublic information. Transactions in options may also focus a Company Person’s attention on short-term performance at the expense of the Company’s long-term objectives. Accordingly, no Company Person may engage in a put, call or other derivative security transaction relating to Company Securities on an exchange or in any other organized market.
Hedging Transactions. Certain forms of hedging or monetization transactions, including zero-cost collars, equity swaps, exchange funds and forward sale contracts, allow a stockholder to lock in much of the value of his or her stock holdings, often in exchange for all or part of the potential for upside appreciation in the stock. These transactions allow the stockholder to continue to own the covered securities, but without the full risks and rewards of ownership. Because participating in these transactions may cause a Company Person to no longer have the same objectives as the Company’s other stockholders, no Company Person may engage in such transactions.
Margin Accounts and Pledges. Securities held in margin accounts for collateral as a margined loan may be sold by the broker without the customer’s consent if the customer fails to meet a margin call. Similarly, securities pledged (or hypothecated) as collateral for a loan may be sold in foreclosure if the borrower defaults on the loan. A margin sale or foreclosure sale that occurs at a time when the pledgor is aware of material nonpublic information or otherwise is not permitted to trade in Company Securities would fall under the restrictions in this Policy on trading during such times. Therefore, no Company Person may hold Company Securities in a margin account or pledge Company Securities as collateral for a loan.
Public Resales – Rule 144. The Securities Act of 1933, as amended (the “Securities Act”) requires every person who offers or sells a security to register such transaction with the SEC unless an exemption from registration is available. Rule 144 under the Securities Act is the exemption typically relied upon for (i) public resales by any person of “restricted securities” (i.e., unregistered securities acquired in a private offering or sale) and (ii) public resales by directors, officers and other control persons of a company (known as “affiliates”) of any of the Company’s securities, whether restricted or unrestricted.
The exemption in Rule 144 may only be relied upon if certain conditions are met. These conditions vary based upon whether the Company has been subject to the SEC’s reporting requirements for 90 days (and is therefore a “reporting company” for purposes of the rule) and whether the person seeking to sell the securities is an affiliate or not.
The restriction imposed by this Policy apply to any public resales of Company Securities by Company Persons, including, but not limited to, any resales pursuant to Rule 144.)
Private Resales. Directors and officers also may sell securities in a private transaction without registration. Although there is no statutory provision or SEC rule expressly dealing with private sales, the general view is that such sales can safely be made by affiliates if, among other factors, the party acquiring the securities understands its is acquiring restricted securities that must be held for at least six months (if issued by a reporting company that meets the current public information requirements) or one-year (if issued by a non-reporting company) before the securities will be eligible for resale to the public under Rule 144. Private resales raise certain documentation and other issues and must be reviewed in advance by the Chief Legal Officer, in addition to being subject to the other restrictions imposed by this Policy.
Restrictions on Purchases of Company Securities. In order to prevent market manipulation, the SEC adopted Regulation M under the U.S. Exchange Act. Regulation M generally restricts the Company or any of its affiliates from buying Company stock, including as part of a share buyback program, in the open market during certain periods while a distribution, such as a public offering, is taking place. Anyone who desires to make purchases of Company stock during any period that the Company is conducting an offering or buying shares from the public should consult with the Chief Legal Officer, in addition to complying with the other requirements of this Policy.
Exceptions
The following routine transactions, within the limits described, are generally not subject to the restrictions on trading in this Policy. The Company reserves the right to prohibit any such transaction as it, in its sole discretion, deems necessary.
Stock Option Exercises. This Policy does not apply to the exercise of any employee stock options, whereby a Company Person pays out-of-pocket to exercise and hold the stock, or to the “net exercise” pursuant to which a Company Person elects to have the Company withhold shares subject to an option to pay the exercise price and/or satisfy tax-withholding requirements. This Policy does apply, however, to any sale of shares as part of a broker-assisted cashless exercise of an option or any other market sale for the purpose of generating the cash needed to pay the exercise price of an option and/or to satisfy tax withholding obligations.
Restricted Stock and Restricted Stock Unit Awards. This Policy does not apply to the vesting and settlement of restricted stock and restricted stock units, or the withholding or sale of stock back to the Company to satisfy tax withholding obligations upon the vesting of any restricted stock or restricted stock units. This Policy does apply, however, to any market sale of stock after vesting, including without limitation to satisfy tax withholding obligations.
IV.Blackout Periods
The Company has established quarterly blackout periods, and may impose additional, special blackout periods, each as described below. Except as noted below, Insiders may not conduct any transactions in Company Securities during quarterly blackout periods.
Quarterly Blackout Periods. Quarterly blackout periods begin on the fifteenth calendar day of the third month of each fiscal quarter (i.e., March 15, June 15, September 15 and December 15) and end at 9:30 a.m. U.S. Eastern Time on the third trading day following the later of (a) the release to the public of the Company’s earnings for that fiscal quarter or fiscal year, and (b) the filing with the SEC of a quarterly report on Form 10-Q or an annual report on Form 10-K for that fiscal quarter or fiscal year.
Special Blackout Periods. From time to time the Chief Legal Officer may impose special blackout periods, during which Insiders and other affected persons will be prohibited from engaging in transactions in Company Securities. In the event of a special blackout period, the Chief Legal Officer or the Policy Administrator will notify Insiders and other affected persons, who will be prohibited from engaging in any transaction involving the Company’s securities until further written notice. The imposition of a special blackout period is itself confidential information, and the fact that it has been imposed may not be disclosed to others.
Modification of a Blackout Period. The Chief Legal Officer may shorten, suspend, terminate or extend any blackout period at such time and for such duration as he or she deems appropriate given the relevant circumstances. Any persons affected by such a modification will be appropriately notified.
Exceptions. The Company recognizes that an Insider may experience exceptional circumstances that may necessitate a transaction during a blackout period. In that case, the Insider must request permission to do so from the Chief Legal Officer or the Policy Administrator. Permission to transact within a blackout period is at the discretion of the Chief Executive Officer and Chief Legal Officer. If one of these individuals wishes to trade outside the blackout period, it shall be subject to prior review and approval by the other. Further, no exceptions will be granted for, nor will any exception that is granted allow, trading by an Insider while the Insider is actually aware of material nonpublic information.
V.Additional Procedures and Requirements
Pre-Clearance
Insiders must obtain written pre-clearance from the Chief Legal Officer or the Policy Administrator before transacting in Company Securities, including for transactions occurring outside a blackout period, any exercise of director or employee stock options and any gifts of Company Securities. A form for such purposes is provided as Attachment C, but the Chief Legal Officer or the Policy Administrator may use such form as he determines to be appropriate. A request for pre-clearance should be submitted at least two days in advance of the proposed transaction. Neither the Chief Legal Officer nor the Policy Administrator is under any obligation to approve any trade. Pre-clearance of any transaction is valid for the day on which it is granted (if a trading day) and for the next five (5) trading days thereafter. If the transaction order is not placed within that period, pre-clearance must be requested and approved in writing again. Requesting persons must treat denials of pre-clearance requests as confidential.
The Chief Legal Officer may determine that no trades may occur. No reasons need be provided and the closing of the pre-clearance period itself may constitute material inside information that should not be communicated.
Exchange Act Section 16
As long as the Company is required to file periodic reports with the SEC pursuant to the Exchange Act of 1934 (the “Exchange Act”), directors and executive officers of the Company (“Section 16 Persons”) must also comply with the reporting obligations and limitations on short-swing transactions set forth in the Exchange Act.
The practical effect of these provisions is that Section 16 Persons who purchase and sell (or sell and purchase) Company stock (or derivative securities related to Company stock) within a period of less than six months must disgorge all profits to the Company, whether or not they had knowledge of any material nonpublic information.
Under these provisions, and so long as certain specific criteria are met, neither the receipt of an option under the Company’s option plans nor the exercise of that option is deemed a purchase under Section 16; however, these transactions must still be reported in accordance with the requirements of Section 16, and the sale of any such shares is a sale under Section 16. The making or receiving of gifts of Company stock must also be reported under Section 16.
Section 16 Persons should be aware that trading in Company stock under an approved Rule 10b5-1 Plan (discussed below) does not exempt such transactions from the provisions of Section 16, including the reporting requirements.
While filing Section reports (including Forms 3, 4 and 5) is a personal obligation of each Section 16 Person, the Company can facilitate this process. To ensure compliance with all reporting requirements, however, a Section 16 Person must, on the date of any trade, provide the Chief Legal Officer or the Policy Administrator with all information relating to the trade that is necessary to properly prepare a Form 4. A Section 16 Person must also execute a Form 4 (either individually or through a duly-authorized power of attorney) within a sufficient amount of time to allow the Company to electronically file the Form 4, on the Section 16 Person’s behalf, with the SEC via EDGAR before 5:30 p.m. U.S. Eastern Time on the second business day following the trade.
The Company is required to disclose in its annual proxy statement the names of insiders who failed to file Section 16(a) reports properly during the fiscal year, along with the particulars of such instances of noncompliance. Accordingly, all Section 16 Persons must notify the Company’s Chief Legal Officer, prior to any transactions or changes in their or their family members’ beneficial ownership involving Company stock, and are strongly encouraged to avail themselves of the assistance available from the Chief Legal Officer’s office in satisfying the reporting requirements.
Schedule 13D and 13G
Section 13(d) of the Exchange Act requires the filing of a statement on Schedule 13D (or on Schedule 13G, in certain limited circumstances) by any person or group which acquires beneficial ownership of more than five percent of a class of equity securities registered under the Exchange Act. The threshold for reporting is met if the stock owned, when coupled with the amount of stock subject to options exercisable within 60 days, exceeds the five percent limit.
A report on Schedule 13D is required to be filed with the SEC and submitted to the Company within ten days after the reporting threshold is reached. If a material change occurs in the facts set forth in the Schedule 13D, such as an increase or decrease of one percent or more in the percentage of stock beneficially owned, an amendment disclosing the change must be filed promptly. A decrease in beneficial ownership to less than five percent is per se material and must be reported.
A person is deemed the beneficial owner of securities for purposes of Section 13(d) if such person has or shares voting power (i.e., the power to vote or direct the voting of the securities) or dispositive power (i.e., the power to sell or direct the sale of the securities).
Broker Requirements
In order to assist in complying with this Policy and applicable securities laws (including Section 16 and Schedule 13D/G reporting requirements, to the extent applicable), each Insider should require that any broker that assists the Insider with open market transactions involving Company securities:
•Not enter any order for the Insider without (a) except for orders under pre-approved Rule 10b5-1 Plans, first verifying with the Policy Administrator that no blackout is in effect and the transaction was pre-cleared; and (b) complying with the brokerage firm’s compliance procedures (e.g., Rule 144 procedures); and
•Report promptly (and in any case by the end of the transaction date) by (a) telephone and (b) by email to the Insider and, if possible, also directly to the Policy Administrator, the details of every transaction involving Company Securities (including any transaction pursuant to Rule 10b5-1 Plan) handled by the broker for the Insider.
Prior to depositing any Company Securities into an account at, executing or authorizing any transaction involving Company Securities through, or entering into into a Rule 10b5-1 Plan with, a broker, anInsider should inform that broker that he or she is an Insider subject to the black-out period and pre-clearance requirements of this Policy and of the specific requirements detailed above. Each Insider should also inform that broker of the prohibitions on short sales, derivative transactions, hedging transactions, margining and pledging with respect of Company securities. If an Insider intends to effect trading in Company Securities through a broker or online brokerage platform where communicating Insider status and these requirements is not possible, the Insider must inform the Policy Administrator and the Policy Administrator may impose additional requirements in respect of such trading.
Individual Responsibility
All Company Persons have the individual responsibility to comply with this Policy. A Company Person may, from time to time, have to forgo a proposed transaction in Company Securities even if he or she planned to make the transaction before learning of the material nonpublic information. While the Chief Legal Officer or the Policy Administrator can and should be consulted regarding the application of this Policy, including the appropriateness of engaging in a particular transaction at a particular time, the responsibility for adhering to this Policy and avoiding unlawful transactions, and ensuring that related persons (as described above) do the same, rests with each Company Person.
Post-Termination Transactions
This Policy applies even after termination of employment or service with the Company. If a Company Person is in possession of material nonpublic information when his or her employment or service terminates, that person may not trade in Company Securities (or another company’s securities, as described in this Policy) until such information has become public or is no longer material.
VI.Transactions under Rule 10b5-1 Plans
Implementation of a trading plan under Rule 10b5-1 under the Exchange Act allows a person to place a standing order with a broker to purchase or sell stock of the Company, so long as the plan specifies the dates, prices and amounts of the planned trades or establishes a formula for those purposes (a “Rule 10b5-1 Plan”). Trades executed pursuant to a Rule 10b5-1 Plan that meets the requirements listed below may generally be executed even though the person who established the Rule 10b5-1 Plan may be in possession of material nonpublic information at the time of the trade.
A Rule 15b5-1 Plan may only be established when a person is not in possession of material nonpublic information and when a blackout period is not in effect. Anyone subject to this Policy who wishes to enter into a Rule 10b5-1 Plan must submit it to the Chief Legal Officer or the Policy Administrator for prior, written approval. Further, unless the Chief Legal Officer or Policy Administrator provides a prior, written exception, all Rule 10b5-1 Plans must be placed through the firm that may be retained by the Company from time to time to administer its equity compensation programs. Subsequent modifications (by formal amendment or otherwise) and terminations of any Rule 10b5-1 Plan must also be pre-approved by the Chief Legal Officer or the Policy Administrator. The actual transactions effected pursuant to a pre-approved Rule 10b5-1 Plan will not, however, be subject to the pre-clearance procedures for transactions in Company stock and may occur during blackout periods.
Whether or not pre-approval will be granted will depend on all the facts and circumstances at the time, but the following guidelines should be kept in mind:
•The Rule 10b5-1 Plan must be in writing and may only be adopted, modified or terminated when a blackout period is not in effect and when the individual is not in possession of material nonpublic information;
•The Rule 10b5-1 Plan must be adopted, modified or terminated in good faith and not as part of a plan or scheme to evade the anti-fraud rules under the federal securities laws, and the Company Person must act in good faith with respect to the Rule 10b5-1 Plan throughout its duration;
•The Rule 10b5-1 Plan must permit its termination by the Company at any time when the Company believes that trading pursuant to its terms may not lawfully occur.
•The Rule 10b5-1 Plan should provide for relatively simple pricing parameters (e.g., limit orders), rather than complex formulae for determining when trading under the Rule 10b5-1 Plan may occur and at what price
•The Company Person adopting the Rule 10b5-1 Plan must not have the ability to influence how, when or whether to make purchases or sales after the Rule 10b5-1 Plan is adopted;
•Any Section 16 Person must certify, before adopting, modifying or terminating a Rule 10b5-1 Plan that he or she (1) is not in possession of material nonpublic information, and (2) is adopting or modifying the Rule 10b5-1 Plan in good faith and not as part of a plan or scheme to evade the anti-fraud rules under the federal securities laws;
•No Company Person may have more than one Rule 10b5-1 Plan covering the same time period, except as follows:
oTwo Rule 10b5-1 Plans may be maintained simultaneously if one of them is a successor Rule 10b5-1 Plan under which trades are not scheduled to begin until the completion or expiration of the predecessor Rule 10b5-1 Plan. If the predecessor Plan is terminated early, trading under the successor Rule 10b5-1 Plan cannot commence until the applicable cooling-off period has run from the termination date of the predecessor Rule 10b5-1 Plan; or
oA Company Person may have multiple contracts with different brokers to execute trades that, when taken together, constitute a single Rule 10b5-1 Plan, as such a modification or termination of one contract will constitute a modification or termination of the single Rule 10b5-1 Plan oIn addition to a Rule 10b5-1 Plan, a Company Person may use sell-to-cover arrangements that authorize the sale of only enough securities necessary to satisfy tax withholding obligations arising exclusively from the vesting of a compensatory award.
•When a Rule 10b5-1 Plan is effective, no transactions may be effected by the Company Person outside of the Rule 10b5-1 Plan;
•The Company Person may not have more than one single-trade Rule 10b5-1 Plan (i.e., a trading plan designed to effect a trade in a single transaction) during any consecutive 12-month period;
•The Rule 10b5-1 Plan should, in the absence of special circumstances, be for a period of not less than one year;
•Transactions under the Rule 10b5-1 Plan may not commence until the later of (1) 90 days following the adoption or modification of the Rule 10b5-1 Plan or (2) 2 business days following the disclosure in a periodic report (on Form 10-Q or 10-K) of the Company’s financial results for the fiscal quarter in which the Rule 10b5-1 Plan was adopted or modified (but not to exceed 120 days following such adoption or modification);
•A copy of the executed version of any pre-approved Rule 10b5-1 Plan must be provided to the Chief Legal Officer or the Policy Administrator for retention in accordance with the Company’s record retention policy.
The use of Rule 10b5-1 Plans does not obviate the need to file Forms 144 or Forms 3, 4 or 5; and Section 16 Persons are required to indicate on any Form 5 or Form 5 if a transaction reported on that form was made under a Rule 10b5-1 Plan and provide the date that the Rule 10b5-1 Plan was adopted. In addition, the Company is required to publically disclose whether any Section 16 Person has adopted, modified or terminated a Rule 10b5-1 Plan during the previous fiscal quarter. The Company is required to describe the material terms of each Rule 10b5-1 Plan that is adopted, modified or terminated, including the name and title of the director or officer, the date the Rule 10b5-1 Plan was adopted, modified or terminated, the Rule 10b5-1 Plan’s duration, and the total amount of securities to be purchased or sold under the Rule 10b5-1 Plan. The Company is not, however, required to disclose any information relating to the pricing terms of any Rule 10b5-1 Plan. The Company will also consider whether public announcement of any Rule 10b5-1 Plan should be made at the time it is established.
VII.Disclosure of Company Information
In General
The Company has developed and continues to develop proprietary, confidential and nonpublic information. In the course of business operations, a Company Person may become aware of such information. Such information does not belong to individual directors, officers or other Company Persons. It is an asset of the Company. Company Persons may not disclose or otherwise use any proprietary, confidential or nonpublic information of any kind acquired as a result of association with the Company except if authorized to do so for or on behalf of the Company. This obligation applies whether that information relates to the Company or another organization (such as a customer, vendor or supplier) and continues even after the Company Person is no longer associated with the Company. Anyone that has questions as to whether information is proprietary, confidential or nonpublic should contact the Chief Legal Officer, the Policy Administrator or the head of Corporate Communications and should abstain from disclosing or otherwise using such information until informed that its disclosure or other use is permitted.
Media, Analyst and Similar Inquiries
Company Persons may not answer questions from news media reporters, securities analysts, or stockholders about the Company’s business, plans, strategy, results, policies, or practices, either directly or through another person, unless specifically authorized by the Company. Instead, refer any and all such inquiries to the head of Corporate Communications in accordance with the Company’s Code of Business Conduct and Ethics. In addition, employees are prohibited from participating in online bulletin boards, blogs, or “chat rooms” or other social media forums on matters concerning the Company or related topics, unless expressly authorized by the Company.
Quiet Periods
During any quarterly or special blackout period, as described herein (the “Quiet Period”), no Company Person may provide information regarding the Company’s business or financial outlook to anyone outside the Company, except to an auditor, attorney or consultant who has an obligation to keep the information confidential or to a third party (but not a stockholder or investor in the Company or an analyst) with whom the Company is engaged in disclosure of information pursuant to a binding confidentiality agreement. Further, notwithstanding anything herein to the contrary, neither the Company nor any Company Person shall participate in one-on-one or group meetings/calls with analysts or investors within two weeks prior to quarterly earnings releases or regularly scheduled Board of Directors meetings without prior Board approval. Except for the limitations of the prior sentence, the requirements of any Quiet Period may be modified or waived by any of the Chief Executive Officer, the Chief Financial Officer or the Chief Legal Officer if he determines that it is in the Company’s best interests to do so.
VIII.Monitoring Compliance
The Chief Legal Officer and the Policy Administrator will monitor compliance with this Policy and will periodically review this Policy with the Audit Committee of the Board of Directors. In addition to other duties under this Policy, the Chief Legal Officer and Policy Administrator will be responsible for the following:
•Pre-clearing all transactions involving Company Securities by Insiders in order to determine compliance with this Policy, insider trading laws, Section 16 of the Exchange Act and Rule 144 promulgated under the Securities Act;
•Serving as the designated recipient at the Company of copies of reports filed with the SEC by Section 16 Persons under Section 16 of the Exchange Act;
•In concert with the Human Resources Department, assisting in the preparation of Section 16 reports (Forms 3, 4 and 5) for Section 16 Persons;
•Sending quarterly and other reminders regarding the start and completion of the blackout periods and regarding special blackout periods;
•Sending reminders to all Section 16 Persons about their obligations to report under Section 16;
•In concert with the Human Resources Department, periodically circulating this Policy (and/or a summary thereof) and coordinating training about this Policy to Company Persons;
•In concert with the Human Resources Department, promptly circulating this Policy and coordinating training to all persons who become Company Persons;
•Maintaining a current version of this Policy on the Company’s intranet website; and
•Assisting the Company in implementing this Policy, including monitoring relevant changes in law, regulation or best practices and making appropriate changes to this Policy and related practices and procedures.
IX.Inquiries
Any person who has a question about this Policy or its application to any proposed transaction may obtain additional guidance from the Chief Legal Officer or the Policy Administrator. If there is any uncertainty as to the appropriateness of any such communications, please consult with the Chief Legal Officer or the Policy Administrator before speaking with anyone, especially brokers or any other persons or entities contemplating or executing securities trades.
ATTACHMENT A
— Members of the Board of Directors and their administrative assistants and household members
— Members of the Management Committee and their administrative assistants and household members
— Department Heads and their administrative assistants and household members
— Employees in the following corporate departments, except as indicated:
oAccounting, other than the Accounts Payable group I have carefully reviewed the Company’s Insider Trading and Information Disclosure Policy (the “Policy”), dated ____ __, 2023, and understand all of its provisions.
oLegal
oCoal Sales
oFinance / Treasury
oCommunications / Investor Relations
oBusiness Planning
ATTACHMENT B
Alpha Metallurgical Resources, Inc.
(the “Company”)
Insider Trading Policy Compliance Statement
I certify that, to the best of my knowledge, I have complied with this Policy and its procedures since such date (or during my term of employment or service, if it commenced after such date) and that I will continue to adhere to the Policy and these procedures in the future.
Without limiting the preceding paragraph, I understand that if, I am an Insider, the Chief Legal Officer or Policy Administrator will be required, and will have the discretion to, exercise his judgment in determining whether to (a) approve particular transactions by me in Company Securities or my establishment, modification or termination of any Rule 10b5-1 Plan or other arrangements for trading in Company Securities and (b) subject me to any blackout periods. I also recognize that, if I am an Insider, the Chief Legal Officer or Policy Administrator will be required to analyze and assess any request I may make to establish, modify or terminate any Rule 10b5-1 Plan or to engage in a particular transaction in Company Securities, based on verifiable information available to the Chief Legal Officer or Policy Administrator at the time of the request and in the context of the Company’s intent to preserve its reputation for maintaining the highest legal, business and ethical standards, as well as the Company’s obligation to comply with all laws and regulations pertaining to insider trading. I acknowledge and affirm that the Chief Legal Officer’s or Policy Administrator’s determination with regard to any particular transaction, Rule 10b5-1 Plan or blackout period will be made solely on behalf of, and for the benefit of, the Company and further acknowledge and affirm each of the Chief Legal Officer’s and the Policy Administrator’s right to make that determination in his sole discretion. I hereby agree to be bound by, and to accept without objection, any determination of the Chief Legal Officer or Policy Administrator not to permit any Rule 10b5-1 Plan or particular transaction or to subject me to any such blackout period.
I realize that failure to observe and comply with all of the provisions contained in the Policy may subject me to disciplinary action by the Company, including discharge. Any capitalized terms used but not defined herein have the meanings given to them in the Policy.
Acknowledged by:
Signature: ____________________________________ Date: __________________
Print Name: ___________________________________
Title: _________________________________________
ATTACHMENT C
Alpha Metallurgical Resources, Inc.
(the “Company”)
Form of Trading Clearance Application
|
|
|
| Name: ______________________________________________________________________ |
|
| Title: _______________________________________________________________________ |
|
| Proposed Transaction Date: _____________________________________________________ |
|
| Type of Security to be Traded: ___________________________________________________ |
|
| Type of Transaction (e.g., Purchase / Sale / Entry into, Modification or Termination of Rule |
| 10b5-1 Plan (please attach) / Gift): ________________________________________________ |
|
| Number of Shares Involved (if applicable): _________________________________________ |
Certification
I hereby certify that:
•I am acting in good faith, and will continue to act in good faith, and not as part of a plan or scheme to evade the anti-fraud rules under the federal securities laws.
•I have read and understand the Alpha Metallurgical Resources, Inc. Insider Trading and Information Disclosure Policy and have had the opportunity to ask questions about it.
•I understand that material nonpublic information is information concerning the Company that (a) is not generally known to the public; and (b) if publicly known, would be likely to affect either the market price of Company securities or a person’s decision to buy, sell or hold Company securities.
•I am not in possession of any material nonpublic information about the Company and/or its subsidiaries and, if I come into possession of material nonpublic information prior to executing the applicable transaction, I will not execute that transaction.
•I understand that if I trade while in possession of material nonpublic information, I may be subject to severe civil or criminal penalties and may be subject to discipline by the Company up to and including termination for cause.
•I understand that this clearance, if granted, will be valid for the day on which it is granted (if a trading day) and for the next five (5) trading days thereafter.
•I understand that the Chief Legal Officer, the Policy Administrator and other attorneys employed by the Company and its subsidiaries represent the Company and do not
represent me individually. I have had the opportunity to consult with my own legal, tax and other advisors.
Review and Decision
The undersigned has reviewed the foregoing application and approves / prohibits (circle one) the proposed trade(s).
EX-21.1
7
a12312023exhibit211.htm
LIST OF SUBSIDIARIES OF ALPHA METALLURGICAL RESOURCES, INC.
Document
LIST OF SUBSIDIARIES
|
|
|
|
|
|
| Name of Entity |
State of Incorporation / Organization |
| Alex Energy, LLC |
West Virginia |
| Alpha American Coal Company, LLC |
Delaware |
| Alpha American Coal Holding, LLC |
Delaware |
| Alpha Appalachia Holdings, LLC |
Delaware |
| Alpha Appalachia Services, LLC |
West Virginia |
| Alpha Coal Sales Co., LLC |
Delaware |
| Alpha European Marketing, LLC |
Delaware |
| Alpha European Sales, LLC |
Virginia |
| Alpha India, LLC |
Delaware |
| Alpha Land and Reserves, LLC |
Delaware |
| Alpha Metallurgical Coal Sales, LLC |
Delaware |
| Alpha Metallurgical Resources, Inc. |
Delaware |
| Alpha Metallurgical Resources, LLC |
Delaware |
| Alpha Metallurgical Services, LLC |
Delaware |
| Alpha Metallurgical Terminal, LLC |
Delaware |
| Alpha Natural Resources Holdings, Inc. |
Delaware |
| Alpha Natural Resources International, LLC |
Delaware |
| Alpha Natural Resources Services, LLC |
Delaware |
| Alpha Natural Resources, LLC |
Delaware |
| ANR, Inc. |
Delaware |
| Appalachia Coal Sales Company, LLC |
Virginia |
| Appalachia Holding Company, LLC |
Virginia |
| Aracoma Coal Company, LLC |
West Virginia |
| Bandmill Coal LLC |
West Virginia |
| Barbara Holdings Inc. |
Delaware |
| Barnabus Land Company |
West Virginia |
| Belfry Coal Corporation |
West Virginia |
| Black Castle Mining Company, LLC |
West Virginia |
| Black King Mine Development Co. |
West Virginia |
| Boone East Development Co., LLC |
West Virginia |
| Brooks Run South Mining, LLC |
Delaware |
| Clear Fork Coal Company |
West Virginia |
| Contura CAPP Land, LLC |
Delaware |
| Contura Freeport, LLC |
Delaware |
| Delbarton Mining Company, LLC |
West Virginia |
| Dickenson-Russell Contura, LLC |
Delaware |
| Dominion Terminal Associates LLP |
Virginia |
| Elk Run Coal Company, LLC |
West Virginia |
| Enterprise Mining Company, LLC |
Delaware |
| Foundation Royalty Company |
Delaware |
| Goals Coal Company |
West Virginia |
| Highland Mining Company |
West Virginia |
| Independence Coal Company, LLC |
West Virginia |
| Jacks Branch Coal Company |
West Virginia |
|
|
|
|
|
|
| Kanawha Energy Company, LLC |
West Virginia |
| Kepler Processing Company, LLC |
West Virginia |
| Kingston Mining, Inc. |
West Virginia |
| Knox Creek Coal Corporation |
Virginia |
| Laxare, Inc. |
West Virginia |
| Litwar Processing Company, LLC |
West Virginia |
| Logan I, LLC |
West Virginia |
| Logan III, LLC |
West Virginia |
| Lynn Branch Coal Company, Inc. |
West Virginia |
| Marfork Coal Company, LLC |
West Virginia |
| Marshall Land LLC |
West Virginia |
| Martin County Coal, LLC |
Kentucky |
| Maxxim Rebuild Co., LLC |
Delaware |
| Maxxim Shared Services, LLC |
Delaware |
| Mountain Empire Land & Conservation, LLC |
Delaware |
| Nicewonder Contracting, Inc. |
West Virginia |
| Nicholas Contura, LLC |
Delaware |
| Old ANR, LLC |
Delaware |
| Omar Mining Company, LLC |
West Virginia |
| Paramont Contura, LLC |
Delaware |
| Performance Coal Company, LLC |
West Virginia |
| Pioneer Fuel Corporation |
West Virginia |
| Power Mountain Contura, LLC |
Delaware |
| Premium Energy, LLC |
Delaware |
| Rawl Sales & Processing Co., LLC |
West Virginia |
| Republic Energy, LLC |
West Virginia |
| Resource Insurance Company, Inc. |
Tennessee |
| Riverside Energy Company, LLC |
West Virginia |
| Road Fork Development Company, LLC |
Kentucky |
| Rostraver Energy Company |
Pennsylvania |
| Rum Creek Coal Sales, Inc. |
West Virginia |
| Sidney Coal Company, LLC |
Kentucky |
| Spartan Mining Company, LLC |
West Virginia |
| Trace Creek Coal Company |
Pennsylvania |
| Wabash Mine Holding Company |
Delaware |
EX-23.1
8
a12312023exhibit231.htm
CONSENT OF RSM US LLP
Document
Consent of Independent Registered Public Accounting Firm
We consent to the incorporation by reference in the Registration Statements on Form S-8 (Nos. 333-257563 and 333-228293) of Alpha Metallurgical Resources, Inc. (formerly Contura Energy, Inc.) of our reports dated February 26, 2023 relating to the consolidated financial statements and the effectiveness of internal control over financial reporting of Alpha Metallurgical Resources, Inc., appearing in this Annual Report on Form 10-K of Alpha Metallurgical Resources, Inc. for the year ended December 31, 2023.
/s/ RSM US LLP
Atlanta, Georgia
February 26, 2023
EX-23.2
9
a12312023exhibit232.htm
CONSENT OF MARSHALL MILLER & ASSOCIATES, INC. DATED FEBRUARY 26, 2024
Document
CONSENT OF MARSHALL MILLER & ASSOCIATES, INC.
February 26, 2024
Alpha Metallurgical Resources, Inc.
340 Martin Luther King Jr. Blvd.
Bristol, Tennessee 37620
Reference: Consent of Independent Experts
We hereby consent to the reference to Marshall Miller & Associates, Inc. in the Annual Report on Form 10-K of Alpha Metallurgical Resources, Inc. for the year ended December 31, 2023.
We further wish to advise that Marshall Miller & Associates, Inc. was not employed on a contingent basis and that at the time of preparation of our reports, as well as at present, neither Marshall Miller & Associates, Inc. nor any of its employees had, or now has, a substantial interest in Alpha Metallurgical Resources, Inc. or any of its affiliates or subsidiaries.
We also consent to the filing and use of references to Marshall Miller & Associates, Inc.’s name, including our firm’s status as an expert or “qualified person,” and any quotation or summarization of the following Technical Report Summaries:
•“Alpha Metallurgical Resources, Inc. Statement of Coal Resources and Reserves for the Aracoma Complex in Accordance with United States SEC Standards as of December 31, 2023, Central Appalachian Coal Basin, West Virginia, USA, February 2024”
•“Alpha Metallurgical Resources, Inc. Statement of Coal Resources and Reserves for the Kepler Complex in Accordance with United States SEC Standards as of December 31, 2023, Central Appalachian Coal Basin, West Virginia, USA, February 2024”
•“Alpha Metallurgical Resources, Inc. Statement of Coal Resources and Reserves for the Kingston Mining Complex in Accordance with United States SEC Standards as of December 31, 2023, Central Appalachian Coal Basin, West Virginia, USA, February 2024”
•“Alpha Metallurgical Resources, Inc. Statement of Coal Resources and Reserves for the Marfork Mining Complex in Accordance with United States SEC Standards as of December 31, 2023, Central Appalachian Coal Basin, West Virginia, USA, February 2024”
•“Alpha Metallurgical Resources, Inc. Statement of Coal Resources and Reserves for the Virginia Complex in Accordance with United States SEC Standards as of December 31, 2023, Central Appalachian Coal Basin, Virginia, USA, February 2024”
•“Alpha Metallurgical Resources, Inc. Statement of Coal Resources and Reserves for the Elk Run Underground Complex in Accordance with United States SEC Standards as of December 31, 2023, Central Appalachian Coal Basin, West Virginia, USA, February 2024”
•“Alpha Metallurgical Resources, Inc. Statement of Coal Resources for the Power Mountain Underground Complex in Accordance with United States SEC Standards as of December 31, 2023, Central Appalachian Coal Basin, West Virginia, USA, February 2024”
We also consent to the incorporation by reference in Alpha Metallurgical Resource’s Registration Statements on Form S-8 (Nos 333-228293 and 333-257563) of the above items.
Respectfully submitted,
Marshall Miller & Associates, Inc
|
|
|
|
|
|
| By: |
/s/ Justin S. Douthat |
|
Name: Justin S. Douthat, PE, MBA |
|
Title: Executive Vice President (MM&A Representative) |
|
Date: February 26, 2024 |
EX-31
10
a12312023exhibit31.htm
CERTIFICATIONS PURSUANT TO RULE 13A-14(A) UNDER THE SECURITIES EXCHANGE ACT
Document
CERTIFICATIONS
CERTIFICATION OF PRINCIPAL EXECUTIVE OFFICER AND PRINCIPAL FINANCIAL OFFICER
Each of the officers below certifies that:
1.I have reviewed this Annual Report on Form 10-K (this “Report”) of Alpha Metallurgical Resources, Inc. (the “Registrant”);
2.Based on my knowledge, this Report does not contain any untrue statement of a material fact or omit to state a material fact necessary to make the statements made, in light of the circumstances under which such statements were made, not misleading with respect to the period covered by this Report;
3.Based on my knowledge, the financial statements, and other financial information included in this Report, fairly present in all material respects the financial condition, results of operations and cash flows of the Registrant as of, and for, the periods presented in this Report;
4.The registrant’s other certifying officer and I are responsible for establishing and maintaining disclosure controls and procedures (as defined in Exchange Act Rules 13a-15(e) and 15d-15(e)) and internal control over financial reporting (as defined by Exchange Act Rules 13a-15(f) and 15d-15(f)) for the registrant and have:
a.designed such disclosure controls and procedures, or caused such disclosure controls and procedures to be designed under our supervision, to ensure that material information relating to the registrant, including its consolidated subsidiaries, is made known to us by others within those entities, particularly during the period in which this quarterly report is being prepared;
b.designed such internal control over financial reporting, or caused such internal control over financial reporting to be designed under our supervision, to provide reasonable assurance regarding the reliability of financial reporting and the preparation of financial statements for external purposes in accordance with generally accepted accounting principles;
c.evaluated the effectiveness of the registrant’s disclosure controls and procedures and presented in this report our conclusions about the effectiveness of the disclosure controls and procedures, as of the end of the period covered by this report based on such evaluation; and
d.disclosed in this report any change in the registrant’s internal control over financial reporting that occurred during the registrant’s most recent fiscal quarter (the registrant’s fourth fiscal quarter in the case of an annual report) that has materially affected, or is reasonably likely to materially affect, the registrant’s internal control over financial reporting;
5.The Registrant's other certifying officer and I have disclosed to the Registrant's auditors and the audit committee of the Registrant's board of directors (or persons performing the equivalent functions):
a.All significant deficiencies and material weaknesses in the design or operation of internal control over financial reporting which are reasonably likely to adversely affect the Registrant's ability to record, process, summarize and report financial information; and
b.Any fraud, whether or not material, that involves management or other employees who have a significant role in the Registrant's internal control over financial reporting.
|
|
|
| Date: February 26, 2024 |
| |
By: /s/ Charles Andrew Eidson |
| Charles Andrew Eidson |
| Chief Executive Officer |
| (Principal Executive Officer) |
|
|
|
| Date: February 26, 2024 |
| |
By: /s/ J. Todd Munsey |
| J. Todd Munsey |
| Chief Financial Officer |
| (Principal Financial Officer and Principal Accounting Officer) |
EX-32
11
a12312023exhibit32.htm
CERTIFICATIONS PURSUANT TO 18 U.S.C. SECTION 1350
Document
CERTIFICATION PURSUANT TO 18 U.S.C. SECTION 1350, AS ADOPTED PURSUANT TO SECTION 906 OF THE SARBANES-OXLEY ACT OF 2002
In connection with the Annual Report on Form 10-K of Alpha Metallurgical Resources, Inc. (the “Registrant”) for the period ended December 31, 2023, as filed with the Securities and Exchange Commission on the date hereof (the “Report”), each of the undersigned officers of the Registrant certifies, pursuant to 18 U.S.C. Section 1350, as adopted pursuant to Section 906 of the Sarbanes-Oxley Act of 2002, that to his knowledge:
1)The Report fully complies with the requirements of Section 13(a) or 15(d) of the Securities Exchange Act of 1934; and
2)The information contained in the Report fairly presents, in all material respects, the financial condition and results of operations of the Registrant.
|
|
|
| Date: February 26, 2024 |
|
By: /s/ Charles Andrew Eidson |
| Charles Andrew Eidson |
| Chief Executive Officer |
| (Principal Executive Officer) |
|
|
|
| Date: February 26, 2024 |
| |
By: /s/ J. Todd Munsey |
| J. Todd Munsey |
| Chief Financial Officer |
| (Principal Financial Officer and Principal Accounting Officer) |
EX-95
12
a12312023exhibit95.htm
MINE SAFETY DISCLOSURE
Document
Mine Safety and Health Administration Data
Our subsidiaries’ mining operations have consistently been recognized with numerous local, state and national awards over the years for outstanding safety performance.
Our behavior-based safety process involves all employees in accident prevention and continuous improvement. Safety leadership and training programs are based upon the concepts of situational awareness and observation, changing behaviors and, most importantly, employee involvement. The core elements of our safety training include identification of critical behaviors, frequency of those behaviors, employee feedback and removal of barriers for continuous improvement.
All employees are empowered to champion the safety process. Every person is challenged to identify hazards and initiate corrective actions, ensuring that hazards are addressed in a timely manner.
All levels of the organization are expected to be proactive and commit to perpetual improvement, implementing new safety processes that promote a safe and healthy work environment.
Our subsidiaries operate multiple mining complexes in two states and are regulated by both the U.S. Mine Safety and Health Administration (“MSHA”) and state regulatory agencies. As described in more detail in the “Environmental and Other Regulatory Matters” section of our Annual Report on Form 10-K for the year ended December 31, 2023, the Federal Mine Safety and Health Act of 1977, as amended (the “Mine Act”), among other federal and state laws and regulations, imposes stringent safety and health standards on all aspects of mining operations. Regulatory inspections are mandated by these agencies with thousands of inspection shifts at our properties each year. Citations and compliance metrics at each of our mines and coal preparation facilities vary due to the size and type of the operation. We endeavor to conduct our mining and other operations in compliance with all applicable federal, state and local laws and regulations. However, violations occur from time to time. None of the violations identified or the monetary penalties assessed upon us set forth in the tables below has been material.
For purposes of reporting regulatory matters under Section 1503(a) of the Dodd-Frank Wall Street Reform and Consumer Protection Act (the “Dodd-Frank Act”), we include the following table that sets forth the total number of specific citations and orders and the total dollar value of the proposed civil penalty assessments that were issued by MSHA during the current reporting period for each of our subsidiaries that is a coal mine operator, by individual mine. During the current reporting period, none of the mines operated by our subsidiaries received written notice from MSHA of a pattern of violations under Section 104(e) of the Mine Act.
|
|
|
|
|
|
|
|
|
|
|
|
|
|
|
|
|
|
|
|
|
|
|
|
|
|
|
|
|
|
|
|
|
|
|
|
|
|
|
|
|
|
|
|
|
|
|
|
|
|
|
| Year Ended December 31, 2023 |
| MSHA Mine ID |
|
Operator |
|
Significant and Substantial Citations Issued (Section 104 of the Mine Act) *Excludes 104(d) citations/orders |
|
Failure to Abate Orders (Section 104(b) of the Mine Act) |
|
Unwarrantable Failure Citations/Orders Issued (Section 104(d) of the Mine Act) |
|
Flagrant Violations (Section 110(b)(2) of the Mine Act) |
|
Imminent Danger Orders Issued (Section 107(a) of the Mine Act) |
|
Dollar Value of Proposed Civil Penalty Assessments (in Thousands) (1) |
|
Mining Related Fatalities |
| 4405270 |
|
Paramont Contura, LLC |
|
2 |
|
— |
|
— |
|
— |
|
— |
|
$6.04 |
|
— |
| 4405311 |
|
Dickenson-Russell Contura, LLC |
|
8 |
|
— |
|
— |
|
— |
|
— |
|
$5.19 |
|
— |
| 4407163 |
|
Paramont Contura, LLC |
|
1 |
|
— |
|
— |
|
— |
|
— |
|
$0.56 |
|
— |
| 4407223 |
|
Paramont Contura, LLC |
|
12 |
|
— |
|
— |
|
— |
|
— |
|
$28.79 |
|
— |
| 4407274 |
|
Paramont Contura LLC |
|
1 |
|
— |
|
— |
|
— |
|
— |
|
$3.40 |
|
— |
| 4407308 |
|
Paramont Contura, LLC |
|
12 |
|
— |
|
— |
|
— |
|
— |
|
$28.08 |
|
— |
| 4407381 |
|
Paramont Contura, LLC |
|
1 |
|
— |
|
— |
|
— |
|
— |
|
$0.81 |
|
— |
| 4603317 |
|
Mammoth Coal Co. |
|
— |
|
— |
|
— |
|
— |
|
— |
|
$0.14 |
|
— |
| 4604343 |
|
Kingston Mining Inc. |
|
1 |
|
— |
|
— |
|
— |
|
— |
|
$1.79 |
|
— |
| 4604637 |
|
Kepler Processing Company LLC |
|
— |
|
— |
|
— |
|
— |
|
— |
|
$2.11 |
|
— |
| 4604669 |
|
Rum Creek Coal Sales |
|
— |
|
— |
|
— |
|
— |
|
— |
|
$0.28 |
|
— |
| 4605086 |
|
Bandmill Coal, LLC |
|
2 |
|
— |
|
— |
|
— |
|
— |
|
$8.17 |
|
— |
| 4606880 |
|
Power Mountain Contura LLC |
|
— |
|
— |
|
— |
|
— |
|
— |
|
$0.29 |
|
— |
| 4607491 |
|
Nicholas Contura LLC |
|
— |
|
— |
|
— |
|
— |
|
— |
|
$0.90 |
|
— |
| 4607938 |
|
Black Castle Mining Company, LLC |
|
— |
|
— |
|
— |
|
— |
|
— |
|
$0.14 |
|
— |
| 4608159 |
|
Mammoth Coal Co. |
|
— |
|
— |
|
— |
|
— |
|
— |
|
$1.16 |
|
— |
| 4608374 |
|
Marfork Coal Company, LLC |
|
— |
|
1 |
|
1 |
|
— |
|
— |
|
$3.43 |
|
— |
| 4608787 |
|
Nicholas Contura LLC |
|
15 |
|
1 |
|
1 |
|
— |
|
1 |
|
$57.11 |
|
— |
| 4608801 |
|
Aracoma Coal Company, LLC |
|
— |
|
— |
|
— |
|
— |
|
— |
|
$1.14 |
|
— |
| 4608837 |
|
Marfork Coal Company, LLC |
|
11 |
|
— |
|
— |
|
— |
|
— |
|
$19.33 |
|
— |
| 4608932 |
|
Kingston Mining, Inc. |
|
10 |
|
— |
|
— |
|
— |
|
— |
|
$51.35 |
|
— |
| 4609026 |
|
Republic Energy LLC |
|
— |
|
— |
|
— |
|
— |
|
— |
|
$0.72 |
|
— |
|
|
|
|
|
|
|
|
|
|
|
|
|
|
|
|
|
|
|
|
|
|
|
|
|
|
|
|
|
|
|
|
|
|
|
|
|
|
|
|
|
|
|
|
|
|
|
|
|
|
|
| 4609048 |
|
Marfork Coal Company, LLC |
|
2 |
|
— |
|
— |
|
— |
|
— |
|
$8.24 |
|
— |
| 4609054 |
|
Republic Energy LLC |
|
1 |
|
— |
|
— |
|
— |
|
— |
|
$6.26 |
|
— |
| 4609091 |
|
Marfork Coal Company, LLC |
|
63 |
|
1 |
|
1 |
|
— |
|
— |
|
$639.28 |
|
— |
| 4609092 |
|
Marfork Coal Company, LLC |
|
2 |
|
— |
|
— |
|
— |
|
— |
|
$2.85 |
|
— |
| 4609111 |
|
Nicholas-Contura, LLC |
|
— |
|
— |
|
— |
|
— |
|
— |
|
$0.62 |
|
— |
| 4609114 |
|
Republic Energy LLC |
|
— |
|
— |
|
— |
|
— |
|
— |
|
$0.14 |
|
— |
| 4609148 |
|
Mammoth Coal Co |
|
— |
|
— |
|
— |
|
— |
|
— |
|
$0.13 |
|
— |
| 4609212 |
|
Marfork Coal Company, LLC |
|
10 |
|
— |
|
— |
|
— |
|
— |
|
$201.64 |
|
— |
| 4609221 |
|
Mammoth Coal Co. |
|
2 |
|
— |
|
— |
|
— |
|
— |
|
$244.79 |
|
— |
| 4609361 |
|
Aracoma Coal Company, LLC |
|
5 |
|
— |
|
— |
|
— |
|
— |
|
$11.39 |
|
— |
| 4609375 |
|
Marfork Coal Company, LLC |
|
12 |
|
— |
|
— |
|
— |
|
— |
|
$32.20 |
|
— |
| 4609475 |
|
Republic Energy LLC |
|
— |
|
— |
|
— |
|
— |
|
— |
|
$4.63 |
|
— |
| 4609522 |
|
Spartan Mining Company, LLC |
|
83 |
|
— |
|
— |
|
— |
|
— |
|
$514.10 |
|
— |
| 4609550 |
|
Marfork Coal Company, LLC |
|
77 |
|
— |
|
1 |
|
— |
|
— |
|
$603.16 |
|
— |
| 4609574 |
|
Aracoma Coal Company |
|
14 |
|
— |
|
— |
|
— |
|
— |
|
$70.17 |
|
— |
| 4609575 |
|
Aracoma Coal Company, LLC |
|
62 |
|
— |
|
— |
|
— |
|
— |
|
$365.67 |
|
— |
| 4609611 |
|
Aracoma Coal Company LLC |
|
10 |
|
— |
|
— |
|
— |
|
— |
|
$20.72 |
|
— |
| 4609640 |
|
Elk Run Coal Company, LLC |
|
5 |
|
— |
|
— |
|
— |
|
— |
|
$0.49 |
|
— |
| J603 |
|
Dickenson-Russell Contura, LLC |
|
1 |
|
— |
|
— |
|
— |
|
— |
|
$— |
|
— |
| F457 |
|
Maxxim Rebuild Company, LLC |
|
5 |
|
— |
|
— |
|
— |
|
— |
|
$2.75 |
|
— |
| S463 |
|
Marfork Coal Company - Marfork Environmental |
|
1 |
|
— |
|
— |
|
— |
|
— |
|
$— |
|
— |
For purposes of reporting regulatory matters under Section 1503(a) of the Dodd-Frank Act, we include the following table that sets forth a list of legal actions pending before the Federal Mine Safety and Health Review Commission, including the Administrative Law Judges thereof, pursuant to the Mine Act, and other required information, for each of our subsidiaries that is a coal mine operator, by individual mine including legal actions and other required information.
|
|
|
|
|
|
|
|
|
|
|
|
|
|
|
|
|
|
|
|
|
|
|
|
|
|
|
|
|
|
|
|
|
|
|
|
|
|
|
|
|
|
|
|
|
|
|
|
|
|
|
|
|
|
|
|
|
|
|
|
|
|
|
| As of and For the Year Ended December 31, 2023 |
| Mine ID |
|
Operator Name |
|
MSHA Pending Legal Actions (as of last day of reporting period) (1) |
|
New MSHA Dockets commenced during reporting period |
|
MSHA dockets in which final orders were entered (not appealed) during reporting period |
|
Contests of Citations/Orders referenced in Subpart B, 29 CFR Part 2700 |
|
Contests of Proposed Penalties referenced in Subpart C, 29 CFR Part 2700 |
|
Complaints for compensation referenced in Subpart D, 29 CFR Part 2700 |
|
Complaints for discharge, discrimination, or interference referenced in Subpart E, 29 CFR Part 2700 |
|
Applications for temporary relief referenced in Subpart F 29 CFR Part 2700 |
|
Appeals of judges’ decisions or orders to FMSHRC referenced in Subpart H 29 CFR Part 2700 |
| 4608932 |
|
Kingston Mining, Inc. |
|
1 |
|
|
3 |
|
|
5 |
|
|
— |
|
|
1 |
|
|
— |
|
|
— |
|
|
— |
|
|
— |
|
| 4609091 |
|
Marfork Coal Company, LLC |
|
5 |
|
|
8 |
|
|
6 |
|
|
— |
|
|
4 |
|
|
— |
|
|
1 |
|
|
— |
|
|
— |
|
| 4609221 |
|
Mammoth Coal Co. |
|
2 |
|
|
11 |
|
|
15 |
|
|
— |
|
|
2 |
|
|
— |
|
|
— |
|
|
— |
|
|
— |
|
| 4609522 |
|
Spartan Mining Company, LLC |
|
1 |
|
|
6 |
|
|
7 |
|
|
— |
|
|
— |
|
|
— |
|
|
1 |
|
|
— |
|
|
— |
|
| 4609550 |
|
Marfork Coal Company, LLC |
|
3 |
|
|
7 |
|
|
8 |
|
|
— |
|
|
3 |
|
|
— |
|
|
— |
|
|
— |
|
|
— |
|
| 4608837 |
|
Marfork Coal Company, LLC |
|
— |
|
|
1 |
|
|
1 |
|
|
— |
|
|
— |
|
|
— |
|
|
— |
|
|
— |
|
|
— |
|
| 4609212 |
|
Marfork Coal Company, LLC |
|
1 |
|
|
6 |
|
|
5 |
|
|
— |
|
|
1 |
|
|
— |
|
|
— |
|
|
— |
|
|
— |
|
| 4608787 |
|
Nicholas Contura, LLC |
|
3 |
|
|
6 |
|
|
3 |
|
|
1 |
|
|
2 |
|
|
— |
|
|
— |
|
|
— |
|
|
— |
|
| 4405270 |
|
Paramont Contura, LLC |
|
— |
|
|
1 |
|
|
1 |
|
|
— |
|
|
— |
|
|
— |
|
|
— |
|
|
— |
|
|
— |
|
| 4609475 |
|
Republic Energy LLC |
|
— |
|
|
1 |
|
|
1 |
|
|
— |
|
|
— |
|
|
— |
|
|
— |
|
|
— |
|
|
— |
|
| 4609575 |
|
Aracoma Coal Company, LLC |
|
5 |
|
|
6 |
|
|
2 |
|
|
— |
|
|
5 |
|
|
— |
|
|
— |
|
|
— |
|
|
— |
|
| 4405311 |
|
Dickenson-Russell Contura, LLC |
|
— |
|
|
— |
|
|
1 |
|
|
— |
|
|
— |
|
|
— |
|
|
— |
|
|
— |
|
|
— |
|
| 4407308 |
|
Paramont Contura, LLC |
|
— |
|
|
— |
|
|
1 |
|
|
— |
|
|
— |
|
|
— |
|
|
— |
|
|
— |
|
|
— |
|
| 4407163 |
|
Paramont Contura, LLC |
|
— |
|
|
1 |
|
|
1 |
|
|
— |
|
|
— |
|
|
— |
|
|
— |
|
|
— |
|
|
— |
|
| 4609375 |
|
Marfork Coal Company, LLC |
|
— |
|
|
1 |
|
|
1 |
|
|
— |
|
|
— |
|
|
— |
|
|
— |
|
|
— |
|
|
— |
|
(1) The MSHA proposed assessments issued during the current reporting period do not necessarily relate to the citations or orders issued by MSHA during the current reporting period or to the pending legal actions reported herein.
EX-96.1
13
finalaracomatswithappend.htm
TECHNICAL REPORT SUMMARY - ARACOMA COMPLEX
finalaracomatswithappend

Alpha Metallurgical Resources, Inc. Statement of Coal Resources and Reserves for the Aracoma Complex in Accordance with United States SEC Standards as of December 31, 2023 Central Appalachian Coal Basin West Virginia, USA February 2024 Prepared for: Alpha Metallurgical Resources, Inc. 340 Martin Luther King Blvd. Bristol, TN 37620 Prepared by: MARSHALL MILLER & ASSOCIATES, INC. 582 Industrial Park Road Bluefield, Virginia 24605 www.mma1.com Alpha Metallurgical Resources, Inc. Statement of Coal Resources and Reserves for the Aracoma Complex in Accordance with United States SEC Standards as of December 31, 2023 Central Appalachian Coal Basin West Virginia, USA MARSHALL MILLER & ASSOCIATES, INC. 2 Statement of Use and Preparation This updated Technical Report Summary (TRS) was prepared for the sole use of Alpha Metallurgical Resources, Inc. (Alpha) and its affiliated and subsidiary companies and advisors. Copies or references to information in this report may not be used without the written permission of Alpha. The report provides a statement of coal resources and coal reserves for Alpha, as defined under the United States Securities and Exchange Commission (SEC). The statement is based on information provided by Alpha and reviewed by various professionals within Marshall Miller & Associates, Inc. (MM&A). MM&A professionals who contributed to the drafting of this report meet the definition of Qualified Persons (QPs), consistent with the requirements of the SEC. The information in this TRS related to coal resources and reserves is based on, and fairly represents, information compiled by the QPs. At the time of reporting, MM&A’s QPs have sufficient experience relevant to the style of mineralization and type of deposit under consideration and to the activity they are undertaking to qualify as a QP as defined by the SEC. Certain information set forth in this report contains “forward-looking information”, including production, productivity, operating costs, capital costs, sales prices, and other assumptions. These statements are not guarantees of future performance and undue reliance should not be placed on them. The assumptions used to develop the forward-looking and the risks that could cause the actual results to differ materially are detailed in the body of this report. Marshall Miller & Associates, Inc. (MM&A) hereby consents (i) to the use of the information contained in this report dated December 31, 2023, relating to estimates of coal resources and coal reserves controlled by Alpha, (ii) to the use of MM&A’s name, any quotations from or summarizations of this TRS in Alpha’s SEC filings, and (iii) to the filing of this TRS as an exhibit to Alpha’s SEC filings. Qualified Person: /s/ Marshall Miller & Associates, Inc. Date: February 9, 2024

Alpha Metallurgical Resources, Inc. Statement of Coal Resources and Reserves for the Aracoma Complex in Accordance with United States SEC Standards as of December 31, 2023 Central Appalachian Coal Basin West Virginia, USA MARSHALL MILLER & ASSOCIATES, INC. 3 Table of Contents 1 Executive Summary ............................................................................................................... 9 1.1 Property Description ................................................................................................ 9 1.2 Ownership .............................................................................................................. 10 1.3 Geology .................................................................................................................. 10 1.4 Exploration Status .................................................................................................. 10 1.5 Operations and Development ................................................................................. 10 1.6 Mineral Resource ................................................................................................... 11 1.7 Mineral Reserve ..................................................................................................... 11 1.8 Capital Summary .................................................................................................... 12 1.9 Operating Costs ...................................................................................................... 13 1.10 Economic Evaluation .............................................................................................. 15 1.10.1 Discounted Cash Flow Analysis ................................................................. 17 1.10.2 Sensitivity Analysis .................................................................................... 17 1.11 Permitting .............................................................................................................. 18 1.12 Conclusion and Recommendations ......................................................................... 18 2 Introduction ........................................................................................................................ 18 2.1 Registrant and Terms of Reference ......................................................................... 18 2.2 Information Sources ............................................................................................... 19 2.3 Scope of Assignment.............................................................................................. 19 2.4 Personal Inspections ............................................................................................... 20 3 Property Description ........................................................................................................... 20 3.1 Location ................................................................................................................. 20 3.2 Titles, Claims or Leases ........................................................................................... 20 3.3 Mineral Rights ........................................................................................................ 21 3.4 Encumbrances ........................................................................................................ 22 3.5 Other Risks ............................................................................................................. 22 4 Accessibility, Climate, Local Resources, Infrastructure and Physiography .......................... 22 4.1 Topography, elevation and Vegetation ................................................................... 22 4.2 Access and Transport ............................................................................................. 22 4.3 Proximity to Population Centers ............................................................................. 22 4.4 Climate and Length of Operating Season ................................................................ 23 Alpha Metallurgical Resources, Inc. Statement of Coal Resources and Reserves for the Aracoma Complex in Accordance with United States SEC Standards as of December 31, 2023 Central Appalachian Coal Basin West Virginia, USA MARSHALL MILLER & ASSOCIATES, INC. 4 4.5 Infrastructure ......................................................................................................... 23 5 History ................................................................................................................................. 23 5.1 Previous Operation ................................................................................................. 23 5.2 Previous Exploration ............................................................................................... 24 6 Geological Setting, Mineralization and Deposit .................................................................. 24 6.1 Regional, Local and Property Geology..................................................................... 24 6.2 Mineralization ........................................................................................................ 25 6.3 Deposits ................................................................................................................. 25 7 Exploration .......................................................................................................................... 26 7.1 Nature and Extent of Exploration ........................................................................... 26 7.2 Drilling Procedures ................................................................................................. 28 7.3 Hydrology ............................................................................................................... 28 7.4 Geotechnical Data .................................................................................................. 28 8 Sample Preparation Analyses and Security ......................................................................... 29 8.1 Prior to Sending to the Lab ..................................................................................... 29 8.2 Lab Procedures ....................................................................................................... 29 9 Data Verification ................................................................................................................. 30 9.1 Procedures of Qualified Person .............................................................................. 30 9.2 Limitations ............................................................................................................. 30 9.3 Opinion of Qualified Person.................................................................................... 30 10 Mineral Processing and Metallurgical Testing ..................................................................... 31 10.1 Testing Procedures ................................................................................................. 31 10.2 Relationship of Tests to the Whole ......................................................................... 31 10.3 Lab Information ...................................................................................................... 32 10.4 Relevant Results ..................................................................................................... 32 11 Mineral Resource Estimates ................................................................................................ 32 11.1 Assumptions, Parameters and Methodology .......................................................... 32 11.1.1 Geostatistical Analysis .............................................................................. 34 11.2 Resources Exclusive of Reserves ............................................................................. 37 11.2.1 Initial Economic Assessment ..................................................................... 38 11.3 Qualified Person’s Estimates .................................................................................. 39 11.4 Qualified Person’s Opinion ..................................................................................... 40 12 Mineral Reserve Estimates .................................................................................................. 40 12.1 Assumptions, Parameters and Methodology .......................................................... 40

Alpha Metallurgical Resources, Inc. Statement of Coal Resources and Reserves for the Aracoma Complex in Accordance with United States SEC Standards as of December 31, 2023 Central Appalachian Coal Basin West Virginia, USA MARSHALL MILLER & ASSOCIATES, INC. 5 12.2 Mineral Reserves .................................................................................................... 42 12.2.1 Upper Chilton Seam .................................................................................. 42 12.2.2 Upper Cedar Grove Seam .......................................................................... 42 12.2.3 Lower Cedar Grove Seam .......................................................................... 42 12.2.4 Alma Seam ................................................................................................ 42 12.2.5 No. 2 Gas Seam ......................................................................................... 43 12.3 Qualified Person’s Estimates .................................................................................. 43 12.4 Qualified Person’s Opinion ..................................................................................... 44 13 Mining Methods .................................................................................................................. 44 13.1 Geotech and Hydrology .......................................................................................... 44 13.2 Production Rates .................................................................................................... 44 13.3 Mining Related Requirements ................................................................................ 46 13.3.1 Underground ............................................................................................ 46 13.4 Required Equipment and Personnel ....................................................................... 46 13.4.1 Underground Mines .................................................................................. 46 14 Processing and Recovery Methods ...................................................................................... 49 14.1 Description or Flowsheet ........................................................................................ 49 14.2 Requirements for Energy, Water, Material and Personnel ...................................... 50 15 Infrastructure ...................................................................................................................... 50 16 Market Studies .................................................................................................................... 52 16.1 Market Description ................................................................................................. 52 16.2 Price Forecasts ....................................................................................................... 52 16.3 Contract Requirements .......................................................................................... 53 17 Environmental Studies, Permitting and Plans, Negotiations or Agreements with Local Individuals .................................................................................................................. 53 17.1 Results of Studies ................................................................................................... 53 17.2 Requirements and Plans for Waste Disposal ........................................................... 53 Note: Estimates of storage years summarized in this table were provided by Alpha and reviewed by MM&A for reasonableness. ................................................................ 54 17.3 Permit Requirements and Status ............................................................................ 54 17.4 Local Plans, Negotiations or Agreements ................................................................ 56 17.5 Mine Closure Plans ................................................................................................. 56 17.6 Qualified Person’s Opinion ..................................................................................... 56 18 Capital and Operating Costs ................................................................................................ 56 18.1 Capital Cost Estimate .............................................................................................. 56 Alpha Metallurgical Resources, Inc. Statement of Coal Resources and Reserves for the Aracoma Complex in Accordance with United States SEC Standards as of December 31, 2023 Central Appalachian Coal Basin West Virginia, USA MARSHALL MILLER & ASSOCIATES, INC. 6 18.2 Operating Cost Estimate ......................................................................................... 58 19 Economic Analysis ............................................................................................................... 59 19.1 Economic Evaluation .............................................................................................. 59 19.1.1 Introduction .............................................................................................. 59 19.1.2 Cash Flow Summary .................................................................................. 63 19.1.3 Discounted Cash Flow Analysis ................................................................. 65 19.1.4 Sensitivity Analysis .................................................................................... 65 20 Adjacent Properties ............................................................................................................. 66 20.1 Information Used ................................................................................................... 66 21 Other Relevant Data and Information ................................................................................. 66 22 Interpretation and Conclusions ........................................................................................... 67 22.1 Conclusion .............................................................................................................. 67 22.2 Risk Factors ............................................................................................................ 67 22.2.1 Governing Assumptions ............................................................................ 68 22.2.2 Limitations ................................................................................................ 68 22.2.3 Methodology ............................................................................................ 68 22.2.4 Development of the Risk Matrix................................................................ 69 22.2.5 Categorization of Risk Levels and Color Code Convention ......................... 72 22.2.6 Description of the Coal Property ............................................................... 72 22.2.7 Summary of Residual Risk Ratings ............................................................. 73 22.2.8 Risk Factors ............................................................................................... 73 23 Recommendations .............................................................................................................. 80 24 References ........................................................................................................................... 80 25 Reliance on Information Provided by Registrant ................................................................. 80 FIGURES (IN REPORT) Figure 1-1: Aracoma Property Location Map .................................................................................. 9 Figure 1-2: Projected Capital Expenditures – Consolidated Aracoma Operations .......................... 13 Figure 1-3: Aracoma Operating Costs ........................................................................................... 14 Figure 1-4: Sensitivity of NPV........................................................................................................ 17 Figure 6-1: Aracoma Stratigraphic Column ................................................................................... 25 Figure 7-1: Aracoma Cross-Section ............................................................................................... 27 Figure 11-1: Histogram of the Total Seam Thickness for the No. 2 Gas Seam Present in the Aracoma Complex....................................................................................................... 34 Figure 11-2: Scatter plot of the Total Seam Thickness for the No. 2 Gas Seam Present in the Aracoma Complex....................................................................................................... 34

Alpha Metallurgical Resources, Inc. Statement of Coal Resources and Reserves for the Aracoma Complex in Accordance with United States SEC Standards as of December 31, 2023 Central Appalachian Coal Basin West Virginia, USA MARSHALL MILLER & ASSOCIATES, INC. 7 Figure 11-3: Variogram of the Total Seam Thickness for the No. 2 Gas Seam Present in the Aracoma Complex....................................................................................................... 35 Figure 11-4: Result of DHSA for the No. 2 Gas Seam Present in the Aracoma Complex .................. 36 Figure 11-5: Results of Initial Economic Assessment ..................................................................... 39 Figure 15-1: Aracoma Surface Facilities ........................................................................................ 51 Figure 15-2: Bandmill Preparation Plant ....................................................................................... 51 Figure 18-1: Projected Capital Expenditures – Consolidated Aracoma Operations ........................ 57 Figure 18-2: Aracoma Operating Costs ......................................................................................... 59 Figure 19-1: Projection of Sales Tons ............................................................................................ 60 Figure 19-2: Consolidated Annual Revenue .................................................................................. 61 Figure 19-3: Revenue, Cash Costs, and EBITDA ............................................................................. 62 Figure 19-4: Annual EBITDA .......................................................................................................... 63 Figure 19-5: Net Cash Flow after Tax (Before Debt Service) .......................................................... 65 Figure 19-6: Sensitivity of NPV...................................................................................................... 66 TABLES (IN REPORT) Table 1-1: Coal Resources Summary as of December 31, 2023 ..................................................... 11 Table 1-2: Coal Reserves Summary (Marketable Sales Basis) as of December 31, 2023 ................ 12 Table 1-3: Life-of-Mine Tonnage, P&L before Tax, and EBITDA ..................................................... 15 Table 1-4: Project Cash Flow Summary (000) ................................................................................ 16 Table 3-1: Mineral Control – Aracoma Complex ........................................................................... 21 Table 11-1: General Reserve & Resource Criteria ......................................................................... 33 Table 11-2: DHSA Results Summary for Radius from a Central Point ............................................. 36 Table 11-3: Results of Initial Economic Assessment ($/ton) .......................................................... 38 Table 11-4: Coal Resources Summary as of December 31, 2023 ................................................... 39 Table 12-1: Coal Reserves Summary (Marketable Sales Basis) as of December 31, 2023............... 43 Table 13-1: Aracoma Complex Underground Mine Production Schedule (x 1,000 Saleable Tons) . 45 Table 16-1: Dry Quality Specifications .......................................................................................... 52 Table 16-2: Price Forecasts ........................................................................................................... 52 Table 17-1: Aracoma Refuse Disposal Summary ........................................................................... 54 Table 17-2: Aracoma Mining Permits ............................................................................................ 55 Table 18-1: Summary of Capital Expenditures Schedule by Mine (000) ......................................... 57 Table 18-2: Estimated Coal Production Taxes and Sales Costs ...................................................... 59 Table 19-1: Life-of-Mine Tonnage, P&L before Tax, and EBITDA ................................................... 62 Table 19-2: Project Cash Flow Summary (000) .............................................................................. 63 Table 22-1: Probability Level Table ............................................................................................... 70 Table 22-2: Consequence Level Table ........................................................................................... 71 Table 22-3: Risk Matrix ................................................................................................................. 72 Table 22-4: Risk Assessment Matrix.............................................................................................. 73 Table 22-5: Geological and Coal Resource Risk Assessment (Risks 1 and 2) .................................. 74 Table 22-6: Environmental (Risks 3 and 4) .................................................................................... 75 Table 22-7: Regulatory Requirements (Risk 5) .............................................................................. 75 Alpha Metallurgical Resources, Inc. Statement of Coal Resources and Reserves for the Aracoma Complex in Accordance with United States SEC Standards as of December 31, 2023 Central Appalachian Coal Basin West Virginia, USA MARSHALL MILLER & ASSOCIATES, INC. 8 Table 22-8: Market and Transportation (Risk 6) ............................................................................ 76 Table 22-9: Market and Transportation (Risk 7) ............................................................................ 76 Table 22-10: Methane Management (Risk 8) ................................................................................ 77 Table 22-11: Mine Fires (Risk 9) .................................................................................................... 77 Table 22-12: Ground Control (Risk 10) .......................................................................................... 78 Table 22-13: Availability of Supplies and Equipment (Risk 11) ...................................................... 78 Table 22-14: Labor – Work Stoppage (Risk 12).............................................................................. 79 Table 22-15: Labor – Retirement (Risk 13) .................................................................................... 79 Table 22-16: Health and Safety (Risk 14) ...................................................................................... 79 Table 25-1: Information from Registrant Relied Upon by MM&A ................................................. 80 Appendices A ............................................................................................................................. Summary Tables B ........................................................Initial Economic Assessment, Resources Exclusive of Reserves C ...............................................................................................................................................Maps

Alpha Metallurgical Resources, Inc. Statement of Coal Resources and Reserves for the Aracoma Complex in Accordance with United States SEC Standards as of December 31, 2023 Central Appalachian Coal Basin West Virginia, USA MARSHALL MILLER & ASSOCIATES, INC. 9 1 Executive Summary 1.1 Property Description Alpha Metallurgical Resources, Inc. (Alpha) authorized Marshall Miller & Associates, Inc. (MM&A) to prepare this updated Technical Report Summary (TRS) of its controlled coal reserves located at the Aracoma Complex (Aracoma) in Logan, Boone and Mingo counties, West Virginia. The report provides a statement of coal resources and coal reserves for Alpha, as defined under the United States Securities and Exchange Commission (SEC). Active surface facilities for the operations are located along Rum Creek, a tributary of the Guyandotte River adjacent to a CSX rail line. The Property which is located about 7 miles south of the town of Logan, West Virginia, the county seat of Logan County, and approximately 70 miles west southwest of Beckley (see Figure 1-1) is composed of approximately 100,000 total acres of mineral control, of which nearly all are contained within 11 separate leases. Figure 1-1: Aracoma Property Location Map Alpha Metallurgical Resources, Inc. Statement of Coal Resources and Reserves for the Aracoma Complex in Accordance with United States SEC Standards as of December 31, 2023 Central Appalachian Coal Basin West Virginia, USA MARSHALL MILLER & ASSOCIATES, INC. 10 1.2 Ownership The Aracoma property involves a complex combination of previous ownership. Predecessors of Alpha, namely Alpha Natural Resources (Alpha) and Massey Energy (Massey) previously held mining rights on the majority of the Property. 1.3 Geology Operations at the Aracoma Mine Complex currently extract coal from the Upper Chilton, Upper Cedar Grove, and No. 2 Gas seams by underground continuous mining method. These seams are all historically utilized as coking coal. Strata on the Property reside in the Pennsylvanian-aged (approximately 290 to 330 million years ago) Kanawha Formation. Due to the high value of these coking coals, all the seams have been extensively mined in the past. The rock formations between the coal seams are characterized by large proportions of sandstone interspersed with shale units. The coal seams reach the highest structural elevations along the southeastern margin of the Property, generally dipping toward the northwest. 1.4 Exploration Status The Property has been extensively explored, largely by drilling using continuous coring and rotary drilling methods but also by obtaining coal measurements at mine exposures, and by downhole geophysical methods. A significant amount of historical data was acquired or generated by previous owners of the Property. These sources comprise the primary data used in the evaluation of the coal resources and coal reserves on the Property. MM&A examined the data available for the evaluation and incorporated all pertinent information into this TRS. Where data appeared to be anomalous or not representative, that data was excluded from the digital databases and subsequent processing by MM&A. Ongoing exploration has been carried out by Alpha since acquiring the Aracoma Complex with the most recent drilling in 2023. The Alpha acquired exploration data has been consistent with past drilling activities. 1.5 Operations and Development As of December 31, 2023, underground mine operations were active at the Davy Branch Deep Mine in the Upper Chilton seam, the Cedar Grove No. 3 Deep Mine in the Upper Cedar Grove seam, and the Lynn Branch Deep Mine in the No. 2 Gas coal seam. The Cedar Grove No. 2 Deep Mine in the Upper Cedar Grove seam was idled during 2023. These mines produce a High Vol-B metallurgical coal blend. Based on the mine plans developed as part of this TRS, annual deep mine production peaks at 2.7 million tons in 2024. Underground reserves will be depleted in 2044.

Alpha Metallurgical Resources, Inc. Statement of Coal Resources and Reserves for the Aracoma Complex in Accordance with United States SEC Standards as of December 31, 2023 Central Appalachian Coal Basin West Virginia, USA MARSHALL MILLER & ASSOCIATES, INC. 11 In addition to the mines, the Aracoma Complex also includes the Bandmill Preparation Plant, which is also referred to as the Rum Creek Prep Plant. Last rebuilt in 2010, the plant site includes raw coal storage, clean coal storage, a centrifugal dryer, a railroad loadout as well as a refuse disposal area. Low density cyclones are used for intermediate separation and froth flotation & spirals are utilized for fine coal separation. The plant has a feed rate capacity of 1,200 raw tons per hour and produces a product with dry quality of 7.46% ash, 1.0% sulfur and 36.9% volatile matter. For year end 2023 the average utilization rate of the Bandmill Preparation Plant was 66.1% 1.6 Mineral Resource A coal resource estimate, summarized in Table 1-1 was prepared as of December 31, 2023, for property controlled by Alpha. Table 1-1: Coal Resources Summary as of December 31, 2023 Coal Resource (Dry Tons, In Situ, Mt) Area Seam Measured Indicated Inferred Total Inclusive of Reserve/Converted to Reserve Davy Branch Upper Chilton (41000) 12,153,000 3,912,000 0 16,066,000 Hatfield Area Upper Chilton (41000) 17,538,000 10,930,000 0 28,468,000 Cedar Grove No. 3 Upper Cedar Grove (30100) 20,521,000 4,377,000 0 24,898,000 Laurel Land Lower Cedar Grove (30000) 5,484,000 2,991,000 0 8,475,000 Lower Cedar Grove No. 3 Lower Cedar Grove (30000) 1,577,000 54,000 0 1,631,000 Beech Branch Alma (25800) 2,560,000 1,226,000 0 3,787,000 Lynn Branch No. 2 Gas (24000) 29,460,000 18,873,000 289,000 48,623,000 Boone West No. 2 Gas (24000) 6,072,000 8,662,000 701,000 15,435,000 Total Inclusive of Reserve/Converted to Reserve 95,366,000 51,026,000 990,000 147,382,000 Exclusive of Reserve/Not Converted to Reserve Boone West Chilton (47000) 7,306,000 1,990,000 0 9,296,000 Cedar Grove No. 2 Upper Cedar Grove (30100) 12,102,000 9,571,000 180,000 21,853,000 Cedar Grove No. 3 Upper Cedar Grove (30100) 3,414,000 1,355,000 4,000 4,773,000 Rum Creek No. 2 Gas (24000) 29,760,000 19,508,000 154,000 49,422,000 Boone West No. 2 Gas (24000) 29,094,000 17,283,000 86,000 46,463,000 Total Exclusive of Reserve/Not Converted to Reserve 81,676,000 49,707,000 423,000 131,806,000 Grand Total Inclusive of Reserve/Converted to Reserve 95,366,000 51,026,000 990,000 147,382,000 Exclusive of Reserve/Not Converted to Reserve 81,676,000 49,707,000 423,000 131,806,000 Grand Total 177,042,000 100,733,000 1,413,000 279,18,000 Note(1): Resource tons are inclusive of reserve tons since they include the in-situ tons from which recoverable coal reserves are derived. Note (2): Coal resources are reported on a dry basis. Surface moisture and inherent moisture are excluded. Note (3): The Property contains 131.4 Mt of dry, in-place measured and indicated coal resources exclusive of reserves as of December 31, 2023. Totals may not add due to rounding. See Appendix A for more detailed breakdown. 1.7 Mineral Reserve The Resource estimate outlined in Table 1-1 inclusive of reserves has been used as the basis for this Reserve calculation, which utilizes a reasonable Preliminary Feasibility Study, a Life-of Mine (LOM) Mine Plan and practical recovery factors. Production modeling was completed with an effective start date of October 1, 2023. Alpha Metallurgical Resources, Inc. Statement of Coal Resources and Reserves for the Aracoma Complex in Accordance with United States SEC Standards as of December 31, 2023 Central Appalachian Coal Basin West Virginia, USA MARSHALL MILLER & ASSOCIATES, INC. 12 Factors that would typically preclude conversion of a coal resource to coal reserve, include the following: inferred resource classification; absence of coal quality; poor mine recovery; lack of access; geological encumbrances associated with overlying and underlying strata; seam thinning; structural complication; and insufficient exploration have all been considered. Reserve consideration excludes those portions of the resource area, which exhibit the aforementioned geological and operational encumbrances. Proven and probable coal reserves were derived from the defined in-situ coal resource considering relevant processing, economic (including technical estimates of capital, revenue and cost), marketing, legal, environmental, socioeconomic, and regulatory factors. The proven and probable coal reserves on the Property are summarized below in Table 1-2. Table 1-2: Coal Reserves Summary (Marketable Sales Basis) as of December 31, 2023 Demonstrated Coal Reserves (Wet Tons, Washed or Direct Shipped) Quality (Dry Basis) By Reliability Category By Control Type Area/Mine Seam Proven Probable Total Owned Leased Ash% Sulfur% VM% Davy Branch Upper Chilton (41000) 3,023,000 914,000 3,937,000 0 3,937,000 7 0.9 39 Hatfield Upper Chilton (41000) 5,106,000 2,663,000 7,768,000 0 7,768,000 7 0.9 36 Cedar Grove No. 3 U. Cedar Grove (30100) 3,810,000 630,000 4,440,000 0 4,440,000 7 1.3 39 Lauren Land L. Cedar Grove (30000) 1,905,000 1,038,000 2,943,000 0 2,943,000 3 0.7 - Cedar Grove No. 3 L. Cedar Grove (30000) 539,000 17,000 556,000 54,000 503,000 4 0.6 38 Beech Branch Alma (25800) 972,000 458,000 1,429,000 0 1,429,000 4 0.9 39 Lynn Branch No. 2 Gas (24000) 9,150,000 6,028,000 15,178,000 1,423,000 13,755,000 4 0.8 37 Boone West No. 2 Gas (24000) 1,746,000 3,277,000 5,024,000 3,996,000 1,028,000 4 0.9 - Grand Total 26,252,000 15,024,000 41,276,000 5,473,000 35,803,000 5 0.9 37 Notes: Marketable reserve tons are reported on a moist basis, including a combination of surface and inherent moisture. Coal quality is based on a weighted average of laboratory data from core holes. The combination of surface and inherent moisture is modeled at 6.0-percent. Actual product moisture is dependent upon multiple geological factors, operational factors, and product contract specifications and can exceed 8-percent. As such, the modeled moisture values provide a level of conservatism for reserve reporting. *Volatile Matter analysis is not available for all reserve areas. All Aracoma reserves are priced as a High-Vol. B product. Totals may not add due to rounding. See Appendix A for more detailed breakdown. In summary, as of December 31, 2023, Alpha controls a total of 41.28 Mt (moist basis) of marketable coal reserves at Aracoma. Of that total, 64 percent are proven, and 36 percent are probable. Approximately 5.47 Mt are owned, and the remaining 35.80 Mt are leased coal reserves. The maps included in Appendix C reflect mining depletion at the time of the resource/reserve calculation taken from Alpha mine maps as of September 30, 2023. Mine depletion tonnages were supplied by Alpha through the end of 2023, and MM&A deducted this historical production from the mapped reserves in order to estimate reserves as of December 31, 2023. 1.8 Capital Summary Alpha provided MM&A with information related to the number of currently operating production units at Aracoma. MM&A’s capital schedules assume that major equipment rebuilds occur over the course of each machine’s remaining assumed operating life. Replacement equipment was scheduled based on MM&A’s experience and knowledge of mining equipment and industry standards with respect to the useful life of such equipment. As one mine is depleted, the equipment is moved to its replacement.

Alpha Metallurgical Resources, Inc. Statement of Coal Resources and Reserves for the Aracoma Complex in Accordance with United States SEC Standards as of December 31, 2023 Central Appalachian Coal Basin West Virginia, USA MARSHALL MILLER & ASSOCIATES, INC. 13 The capital expenditures tables detail costs for major equipment and infrastructure such as conveyor belt terminal groups. “Other” costs include expenditures for mine access and construction, mine extension capital and miscellaneous costs. A summary of the estimated capital for the consolidated Aracoma operations is provided in Figure 1-2 below. Figure 1-2: Projected Capital Expenditures – Consolidated Aracoma Operations 1.9 Operating Costs Alpha provided historical costs and budgeted projections of operating costs for its active mines; Davy Branch Deep Mine, Cedar Grove No. 2, and Lynn Branch No. 2 Mine for MM&A’s review. Cost data for the new Cedar Grove No. 3 Mine was not available for inclusion in this TRS. MM&A used the historical cost information as a reference and developed a personnel schedule for each mine. Hourly labor rates and salaries were based upon information contained in Alpha’s financial summaries. Fringe benefit costs were developed for vacation and holidays, federal and state unemployment insurance, retirement, workers’ compensation and pneumoconiosis, casualty and life insurance, healthcare and bonuses. A cost factor for mine supplies was developed that relates expenditures to mine advance rates for roof control costs and other mine supply costs based on the historical cost data provided by Alpha. Other factors were developed for maintenance and repair costs, rentals, mine power, outside services, coal preparation plant processing, refuse handling, coal loading, property taxes, and insurance and bonding and other direct mining costs. Alpha Metallurgical Resources, Inc. Statement of Coal Resources and Reserves for the Aracoma Complex in Accordance with United States SEC Standards as of December 31, 2023 Central Appalachian Coal Basin West Virginia, USA MARSHALL MILLER & ASSOCIATES, INC. 14 Appropriate royalty rates were assigned for production from leased coal lands and sales taxes were calculated for state severance taxes, the federal black lung excise tax, and federal and state reclamation fees. Company-wide pricing data as provided by Alpha is described in Table 16-2. Note that not all products reflected in Table 16-2 will apply to every business unit. The pricing data assumes a flat-line long term realization of $140 per short ton port pricing, with an average of $113.94 per ton netback pricing reflective of the high-volatile product currently sold at Aracoma. These estimates are based on long- term pricing published by third party sources and adjusted for quality and transportation. The netback pricing represents adjustments made to published benchmark pricing based on quality and transportation. A large majority of the coal sold by Alpha and their Aracoma business group is shipped internationally as part of blended products from other business units within Alpha or sourced from other companies. These netback adjustments reflect these additional costs carried after the products leave the Aracoma business unit. A summary of the projected operating costs for the consolidated Aracoma operations is provided in Figure 1-3. Figure 1-3: Aracoma Operating Costs

Alpha Metallurgical Resources, Inc. Statement of Coal Resources and Reserves for the Aracoma Complex in Accordance with United States SEC Standards as of December 31, 2023 Central Appalachian Coal Basin West Virginia, USA MARSHALL MILLER & ASSOCIATES, INC. 15 1.10 Economic Evaluation The pre-feasibility financial model prepared for this TRS was developed to test the economic viability of each coal resource area. The results of this financial model are not intended to represent a bankable feasibility study, required for financing of any current or future mining operations contemplated for the Alpha properties, but are intended to establish the economic viability of the estimated coal reserves. Cash flows are simulated on an annual basis based on projected production from the coal reserves. The discounted cash flow analysis presented herein is based on an effective date of January 1, 2024. On an un-levered basis, the NPV of the project cash flow after taxes represents the Enterprise Value of the project. The project cash flow, excluding debt service, is calculated by subtracting direct and indirect operating expenses and capital expenditures from revenue. Direct costs include labor, operating supplies, maintenance and repairs, facilities costs for materials handling, coal preparation, refuse disposal, coal loading, reclamation, and general and administrative costs. Indirect costs include statutory and legally agreed upon fees related to direct extraction of the mineral. The indirect costs are the Federal black lung tax, Federal and State reclamation taxes, property taxes, coal production royalties, and income taxes. The Alpha mines’ historical costs provided a useful reference for MM&A’s cost estimates. Table 1-3 shows LOM tonnage, P&L, and EBITDA for each Alpha mine at Aracoma. Table 1-3: Life-of-Mine Tonnage, P&L before Tax, and EBITDA LOM Tonnage LOM Pre-Tax P&L P&L Per Ton LOM EBITDA EBITDA Per Ton Lynn Branch N2G 15,477 $147,091 $9.50 $354,560 $22.91 Davey Branch UCH 4,128 $124,182 $30.08 $165,738 $40.15 Lauren Land LCG 2,943 $38,244 $12.99 $69,091 $23.48 Lauren Land - Hatfield UCH 7,768 $210,828 $27.14 $293,282 $37.75 UCG No. 3 5,106 $142,359 $27.88 $189,974 $37.20 Alma Beech Br 1,429 $21,681 $15.17 $37,959 $26.55 Boone West N2G 5,258 $20,473 $3.89 $95,359 $18.14 Grand Total 42,109 $704,857 $16.74 $1,205,962 $28.64 Note: (1) The financial model contains 0.23 million tons of inferred coal that has been excluded from reserves. LOM tonnage evaluated in the financial model includes 4th quarter 2023 production (599,742 clean tons), which was subtracted from coal reserves in order to make the effective date of the reserves December 31, 2023. As shown in Table 1-3, all of the mines analyzed show positive EBITDA over the LOM. Overall, the Alpha consolidated Aracoma operations show positive LOM P&L and EBITDA of $694.3 million and $1.2 billion, respectively. Alpha’s consolidated Aracoma cash flow summary in constant dollars, excluding debt service, is shown in Table 1-4 below. Alpha Metallurgical Resources, Inc. Statement of Coal Resources and Reserves for the Aracoma Complex in Accordance with United States SEC Standards as of December 31, 2023 Central Appalachian Coal Basin West Virginia, USA MARSHALL MILLER & ASSOCIATES, INC. 16 Table 1-4: Project Cash Flow Summary (000) YE 12/31 YE 12/31 YE 12/31 YE 12/31 YE 12/31 YE 12/31 Total 2023 2024 2025 2026 2027 2028 Production & Sales tons 42,109 665 2,687 2,487 2,433 2,263 2,231 Total Revenue $4,797,877 $75,733 $306,110 $283,322 $277,178 $257,812 $254,151 EBITDA $1,205,962 $24,321 $103,216 $88,643 $86,497 $70,723 $65,467 Net Income $569,590 $4,780 $63,754 $52,083 $51,609 $40,163 $32,871 Net Cash Provided by Operating Activities $1,070,695 $18,804 $71,698 $79,011 $76,202 $66,253 $60,039 Purchases of Property, Plant, and Equipment ($348,744) $0 ($25,208) ($34,048) ($20,743) ($4,984) ($37,805) Net Cash Flow $721,951 $18,804 $46,491 $44,963 $55,459 $61,270 $22,234 YE 12/31 YE 12/31 YE 12/31 YE 12/31 YE 12/31 YE 12/31 YE 12/31 2029 2030 2031 2032 2033 2034 2035 Production & Sales tons 2,271 2,270 2,317 2,295 2,085 2,126 2,082 Total Revenue $258,761 $258,695 $263,957 $261,478 $237,585 $242,275 $237,239 EBITDA $64,568 $63,924 $68,765 $66,464 $55,011 $57,332 $46,720 Net Income $31,473 $29,672 $31,700 $31,292 $22,033 $24,785 $19,250 Net Cash Provided by Operating Activities $56,883 $58,001 $61,325 $60,688 $53,366 $52,769 $46,405 Purchases of Property, Plant, and Equipment ($15,560) ($14,877) ($32,309) ($22,901) ($23,889) ($15,840) ($9,005) Net Cash Flow $41,323 $43,124 $29,017 $37,786 $29,477 $36,929 $37,401 YE 12/31 YE 12/31 YE 12/31 YE 12/31 YE 12/31 YE 12/31 YE 12/31 2036 2037 2038 2039 2040 2041 2042 Production & Sales tons 2,187 2,091 1,957 2,049 2,177 1,568 1,248 Total Revenue $249,209 $238,203 $222,971 $233,470 $248,071 $178,607 $142,141 EBITDA $57,320 $48,447 $50,158 $53,931 $64,861 $43,196 $25,485 Net Income $26,471 $17,834 $18,687 $21,080 $38,326 $21,137 $9,691 Net Cash Provided by Operating Activities $51,256 $46,987 $46,999 $51,148 $55,264 $45,612 $28,932 Purchases of Property, Plant, and Equipment ($12,518) ($17,876) ($29,907) ($11,903) ($5,351) ($8,478) ($5,543) Net Cash Flow $38,738 $29,112 $17,092 $39,245 $49,913 $37,134 $23,389 YE 12/31 YE 12/31 YE 12/31 YE 12/31 YE 12/31 YE 12/31 YE 12/31 2043 2044 2045 2046 2047 2048 2049 Production & Sales tons 551 71 0 0 0 0 0 Total Revenue $62,821 $8,092 $0 $0 $0 $0 $0 EBITDA $5,955 ($2,197) ($1,576) ($691) ($347) ($179) ($51) Net Income ($5,053) ($8,363) ($3,153) ($1,382) ($694) ($357) ($102) Net Cash Provided by Operating Activities $13,883 ($9,441) ($11,994) ($4,736) ($2,331) ($1,681) ($649) Purchases of Property, Plant, and Equipment $0 $0 $0 $0 $0 $0 $0 Net Cash Flow $13,883 ($9,441) ($11,994) ($4,736) ($2,331) ($1,681) ($649) Note: (1) The financial model contains 0.23 million tons of inferred coal that has been excluded from reserves. LOM tonnage evaluated in the financial model includes 4th quarter 2023 production (599,742 clean tons) which was subtracted from coal reserves in order to make the effective date of the reserves December 31, 2023. (2) Results shown for 2023 represent 4th quarter only. Consolidated cash flows are driven by annual sales tonnage, which peaks at 2.7 million tons in 2024. Between years 2025 and 2040, sales ranges from 2.0 million to 2.4 million tons and between years 2041-2044, sales range from 0.1 million tons to 1.6 million tons. Projected consolidated revenue peaks at $306.1 million in 2024 and totals $4.8 billion for the project’s life. Consolidated cash flow from operations is positive throughout the projected operating period, with the exception of post-production years, due to end-of-mine reclamation spending. Consolidated cash flow from operations peaks at $79.0 million in 2025 and totals $1.1 billion over the project life. Capital expenditures total $122.8 million during the first five years and $348.7 million over the project’s life.

Alpha Metallurgical Resources, Inc. Statement of Coal Resources and Reserves for the Aracoma Complex in Accordance with United States SEC Standards as of December 31, 2023 Central Appalachian Coal Basin West Virginia, USA MARSHALL MILLER & ASSOCIATES, INC. 17 1.10.1 Discounted Cash Flow Analysis Cash flow after tax, but before debt service, generated over the life of the project was discounted to NPV at a 16.57% discount rate, which represents MM&A’s estimate of the constant dollar, risk adjusted WACC for likely market participants if the subject reserves were offered for sale. On an un-levered basis, the NPV of the project cash flows represents the Enterprise Value of the project and amounts to $278.7 million. Alpha is an active producer, and the financial model shows positive net cash flow for each year of the operating life of the Aracoma reserves. The pre-feasibility financial model prepared for the TRS was developed to test the economic viability of each coal resource area. The NPV estimate was made for the purpose of confirming the economics for classification of coal reserves and not for purposes of valuing Alpha or its Aracoma assets. Mine plans were not optimized, and actual results of the operations may be different, but in all cases, the mine production plan assumes the properties are under competent management. 1.10.2 Sensitivity Analysis Sensitivity of the NPV results to changes in the key drivers is presented in the chart below. The sensitivity study shows the NPV at the 16.57% discount rate when Base Case sales prices, operating costs, capital costs, and discount rate are increased and decreased in increments of 5% within a +/- 15% range. Figure 1-4: Sensitivity of NPV Alpha Metallurgical Resources, Inc. Statement of Coal Resources and Reserves for the Aracoma Complex in Accordance with United States SEC Standards as of December 31, 2023 Central Appalachian Coal Basin West Virginia, USA MARSHALL MILLER & ASSOCIATES, INC. 18 As shown, NPV is quite sensitive to changes in sales price, operating cost estimates and the discount rate, and slightly sensitive to changes in capital cost estimates. 1.11 Permitting Alpha has obtained all mining and discharge permits to operate its active mines and processing, loadout or related support facilities. MM&A is unaware of any obvious or current Alpha permitting issues that are expected to prevent the issuance of future permits. Alpha, along with all coal producers, is subject to a level of uncertainty regarding future clean water permits due to United States Environmental Protection Agency (EPA) and United States Fish and Wildlife (USFW) involvement with state programs. 1.12 Conclusion and Recommendations Sufficient data has been obtained through various exploration and sampling programs and mining operations to support the geological interpretations of seam structure and thickness for coal horizons situated on the Aracoma Property and reviewed in the study. The data is of sufficient quantity and reliability to reasonably support the coal resource and coal reserve estimates in this TRS. The geological data and preliminary feasibility study, which consider mining plans, revenue, and operating and capital cost estimates are sufficient to support the classification of coal reserves provided herein. This geologic evaluation conducted in conjunction with the preliminary feasibility study concludes that the 41.28 Mt of marketable underground coal reserves identified on the Property are economically mineable under reasonable expectations of market prices for metallurgical coal products, estimated operation costs, and capital expenditures. 2 Introduction 2.1 Registrant and Terms of Reference This report was prepared for the sole use of Alpha Metallurgical Resources, Inc. (Alpha) and its affiliated and subsidiary companies and advisors. The report provides a statement of coal reserves for Alpha. Exploration results and Resource calculations were used as the basis for the mine planning and the preliminary feasibility study completed to determine the extent and viability of the reserve. The report provides a statement of coal resources and coal reserves for Alpha, as defined under the United States Securities and Exchange Commission (SEC). Coal resources and coal reserves are herein reported in imperial units of measurement and are rounded to millions of short tons (Mt).

Alpha Metallurgical Resources, Inc. Statement of Coal Resources and Reserves for the Aracoma Complex in Accordance with United States SEC Standards as of December 31, 2023 Central Appalachian Coal Basin West Virginia, USA MARSHALL MILLER & ASSOCIATES, INC. 19 2.2 Information Sources This updated technical report is based on information provided by Alpha and reviewed by MM&A’s professionals, including geologists, mining engineers, civil engineers, and environmental scientists. MM&A’s professionals hold professional registrations and memberships which qualify them as Qualified Persons in accordance with SEC guidelines. Sources of data and information are listed below in Table 2-1: Table 2-1: Information Provided to MM&A by Alpha Category Information Provided by Alpha Report Section Geological Geologic data including digital databases and original source data including geologist logs, driller’s logs, geophysical logs. 9.1 Coal Quality Database of coal quality information supplemented with original source laboratory sheets where available. 10.1 Mining Historical productivities and manpower projections. 13.2, 13.4 Coal Preparation Flow Sheet and other information related to coal processing. 14.1 Waste Disposal Engineering data and estimates representing remaining capacities for coarse and fine coal waste disposal. 17.2 Costs Historical and budgetary operating cost information used to derive cost drivers for reserve financial modeling 18.2 Note: While the sources of data listed in Table 2-1 are not exhaustive, they represent a significant portion of information which supports this TRS. MM&A reviewed the provided data and found it to be reasonable prior to incorporating it into the TRS. The TRS contains “forward-looking information” including forecasts of productivity and annual coal production, operating and capital cost estimates, coal sales price forecasts, the assumption that Alpha will continue to acquire necessary permits, and other assumptions. The TRS statements and conclusions are not a guarantee of future performance and undue reliance should not be placed on them. The ability of Alpha to recover the estimated coal reserves is dependent on multiple factors beyond the control of MM&A including, but not limited to geologic factors, mining conditions, regulatory approvals, and changes in regulations. In all cases, the plans assume the Property is under competent management. 2.3 Scope of Assignment Alpha engaged MM&A to conduct a coal reserve evaluation of the Alpha coal properties as of December 31, 2023. For the evaluation, the following tasks were to be completed: > Conduct site visits of the mines and mine infrastructure facilities; > Process the information supporting the estimation of coal resources and reserves into geological models; > Develop life-of-reserve mine (LOM) plans and financial models; > Hold discussions with Alpha company management; and > Prepare and issue a Technical Report Summary providing a statement of coal reserves which would include: - A description of the mines and facilities. - A description of the evaluation process. Alpha Metallurgical Resources, Inc. Statement of Coal Resources and Reserves for the Aracoma Complex in Accordance with United States SEC Standards as of December 31, 2023 Central Appalachian Coal Basin West Virginia, USA MARSHALL MILLER & ASSOCIATES, INC. 20 - An estimation of coal reserves with compliance elements as stated under the SEC S-K 1300 regulations that become effective for the first fiscal year commencing on or after January 1, 2022. 2.4 Personal Inspections MM&A is very familiar with Aracoma, having provided a variety of services in recent years and QP’s involved in this TRS have conducted multiple site visits. Most recently a site inspection of the deep mine facilities was conducted on October 5, 2022. 3 Property Description 3.1 Location The Aracoma Mine Complex is located in the Central Appalachian Basin in southern West Virginia (see Figure 1-1) approximately 7 miles south of the town of Logan, West Virginia, the county seat of Logan County and 70 miles west of Beckley, which is the county seat of Raleigh County. Surface facilities for the operation are located in the Guyandotte River drainage basin, central to the active Mines as well as those currently in development. Numerous small communities are present throughout the Property such as the previously mentioned Logan, as well as Stollings, Omar and Barnabus. The nearest major population centers are Charleston, West Virginia (65 miles north), Bristol, Virginia (140 miles south), Roanoke, Virginia (190 miles east), and Morgantown, West Virginia (220 miles north), and Lexington, Kentucky (190 miles west). The Property is located on the following United States Geological Survey (USGS) Quadrangles: Holden, Barnabus, Man, Mallory, Amherstdale, Lorado, Wharton, Clothier, and Logan. The coordinate system and datum used for the model of the Aracoma Mine complex and the subsequent maps were produced in the West Virginia State Plane South system, NAD 27. 3.2 Titles, Claims or Leases The Property is composed of approximately 100,000 total acres of mineral control, nearly all of which is leased. Alpha’s control is comprised of over 11 separate leases with varying expiration dates. Some leases expire over the next several years, but Alpha does not anticipate any challenges related to lease renewal. Table 3-1 lists the Aracoma mineral leases. MM&A has not carried out a separate title verification for the coal properties and has not verified leases, deeds, surveys, or other property control instruments pertinent to the subject resources. Alpha has represented to MM&A that it controls the mining rights to the reserves as shown on its property maps, and MM&A has accepted these as being a true and accurate depiction of the mineral rights controlled by Alpha. The TRS assumes the Property is developed under responsible and experienced management.

Alpha Metallurgical Resources, Inc. Statement of Coal Resources and Reserves for the Aracoma Complex in Accordance with United States SEC Standards as of December 31, 2023 Central Appalachian Coal Basin West Virginia, USA MARSHALL MILLER & ASSOCIATES, INC. 21 Table 3-1: Mineral Control – Aracoma Complex Reference File Number Document Type Expiration Date (1) On-going Minimum Royalty (2) On-going Production Royalty (3) Lease Type AD 1 Deed N/A No No Base AD 2 Deed N/A No No Base AD 3 Deed N/A No No Base AD 4 Deed N/A No No Base AD 5 Deed N/A No No Base AL 1 Lease 2/14/2025 Yes Yes Base AL 2 Lease 2/14/2025 Yes Yes Base AL 3 Lease 6/30/2024 Yes Yes Base AL 4 Lease 7/17/2034 Yes Yes Base AL 5 Lease 8/1/2026 Yes Yes Base AL 6 Lease 12/31/2026 Yes Yes Base AL 7 Lease 5/26/2028 Yes Yes Base AL 8 Lease 5/26/2028 Yes Yes Base AL 9 Lease 9/30/2024 Yes Yes Base AL 10 Lease 9/30/2024 Yes Yes Base AL 11 Lease 11/1/2027 Yes Yes Base (1) For leases with expiration dates, Company has option to renew or expects to renew until all mineable and merchantable coal is exhausted (2) Minimum royalty payments are generally recoupable against future production royalties. (3) Royalty rates range from 5% to 8% of gross selling price 3.3 Mineral Rights Alpha supplied property control maps to MM&A related to properties for which mineral and/or surface property are controlled by Alpha. While MM&A accepted these representations as being true and accurate, through past knowledge of the Property MM&A has no knowledge of past property boundary disputes or other concerns that could impact future mining operations or development potential. Property control in Appalachia can be intricate. Coal mining properties are typically composed of numerous property tracts which are owned and/or leased from both land holding companies and private individuals or companies. It is common to encounter severed ownership, with different entities or individuals controlling the surface and mineral rights. Mineral control in the region is typically characterized by leases or ownership of larger tracts of land, with surface control generally comprised of smaller tracts, particularly in developed areas. Control of the surface property is necessary to conduct surface mining but is not necessary to conduct underground mining aside from relatively limited areas required for seam access or ventilation infrastructure. Alpha’s executive management team has a history of mining in Central Appalachia and has conveyed to MM&A that it has been successful in acquiring surface rights where needed for past operations. Alpha Metallurgical Resources, Inc. Statement of Coal Resources and Reserves for the Aracoma Complex in Accordance with United States SEC Standards as of December 31, 2023 Central Appalachian Coal Basin West Virginia, USA MARSHALL MILLER & ASSOCIATES, INC. 22 3.4 Encumbrances No Title Encumbrances are known. By assignment, MM&A did not complete a query related to Title Encumbrances. 3.5 Other Risks There is always risk involved in property control. As is common practice, Alpha, and its predecessors, have had their land teams examine the deeds and title control to minimize this risk. Historically, property control has not posed any significant challenges related to Aracoma’s operations. 4 Accessibility, Climate, Local Resources, Infrastructure and Physiography 4.1 Topography, elevation and Vegetation The topography of the area surrounding the Aracoma mine complex is typical of the Central Appalachian Plateau’s physiographic province, being rugged and deeply dissected by V-shaped river valleys and flanked by steep-sided upland regions. Slopes in the area are mostly steep to very steep with some gently sloping with relatively narrow ridges. Surface elevations near the mine complex range from approximately 1,200 feet above sea level at streams to approximately 2,200 feet at ridge tops. The area is heavily vegetated and has a significant amount of hardwood forests. The Property is not situated near any major urban centers. 4.2 Access and Transport There is general access to the Aracoma property via a well-developed network of primary, secondary, and unimproved roads. Interstates 64 and 77 converge at Beckley, West Virginia, and are the primary roads in the area connecting to Beckley, Charleston, and Huntington, West Virginia, to the West and Lexington, Virginia, to the East. Numerous secondary and unimproved roads provide direct access to the mine property, some being federal-, state-, and town-maintained. These include State Route 119 running east-west from Danville to Logan and State Route 10 running north-south from Logan to Man. These roads typically stay open throughout the year. Within the Property, unimproved roads are utilized to access gas drainage wells and surface based deep mine infrastructure. An Alpha-owned preparation plant and rail loadout are located approximately 12 miles southeast of the town of Logan along the CSX railroad system and serve as the primary transport means of processed coal. 4.3 Proximity to Population Centers The Aracoma Mine Complex is located near the town of Logan and is primarily in Logan and Boone Counties, West Virginia, with small portions falling in Mingo County. There are no large population centers in proximity. The nearest major population centers are Charleston, West Virginia (65 miles

Alpha Metallurgical Resources, Inc. Statement of Coal Resources and Reserves for the Aracoma Complex in Accordance with United States SEC Standards as of December 31, 2023 Central Appalachian Coal Basin West Virginia, USA MARSHALL MILLER & ASSOCIATES, INC. 23 north), Bristol, Virginia (140 miles south), Roanoke, Virginia (190 miles east), and Morgantown, West Virginia (220 miles north), and Lexington, Kentucky (190 miles west). As of the 2010 census, Logan County had just over 36,700 residents. 4.4 Climate and Length of Operating Season The climate of the region is classified as humid continental with four distinct seasons: warm summers, cold winters, and moderate fall and spring seasons. Precipitation in the region is consistent throughout the year, approximately 3 to 5 inches per month, with the most rain falling in spring and the early months of summer. Average yearly precipitation is 47 inches. Summer months typically begin in late May and end in early September and range in average temperature from 50 to 83 degrees Fahrenheit. Winters typically begin in mid to late November and run until mid to late March with average temperatures ranging from 23 to 54 degrees Fahrenheit. Precipitation in the winter typically comes in the form of snowfall or as a wintery mix (sleet and snow) with severe snowfall events occurring occasionally. Seasonal variations in climate typically do not affect underground mining in West Virginia. However, weather events could potentially negatively impact efficiency of surface and preparation plant operations on a very limited basis and lasting less than a few days. 4.5 Infrastructure The Aracoma Mine Complex has sources of water, power, personnel, and supplies readily available for use. Personnel have historically been sourced from the surrounding communities in Logan, Mingo, Wyoming, and Boone Counties and have proven to be adequate in numbers to conduct mining operations. As mining is common in the surrounding areas, the workforce is generally familiar with mining practices, and many are experienced miners. Water is sourced locally from public water sources or rivers, and electricity is sourced from Appalachian Power, a subsidiary of American Electric Power (AEP). The service industry in the areas surrounding the mine complex has historically provided supplies, equipment repairs and fabrication, etc. Alpha’s Bandmill preparation plant services consumers with washed coal, which is transported via the adjacent CSX rail line at the Aracoma loadout. Haul roads, primary roads, and conveyor belt systems account for transport from the various mine sites to the preparation plant. 5 History 5.1 Previous Operation The Aracoma property involves a complex combination of previous ownership. Coal mining in the area occurred for nearly a century. Predecessors of Alpha, namely Alpha Natural Resources (Alpha) and Massey Energy (Massey) previously held mining rights on much of the Property. Alpha Metallurgical Resources, Inc. Statement of Coal Resources and Reserves for the Aracoma Complex in Accordance with United States SEC Standards as of December 31, 2023 Central Appalachian Coal Basin West Virginia, USA MARSHALL MILLER & ASSOCIATES, INC. 24 5.2 Previous Exploration Extensive exploration in the form of subsurface drill efforts has been carried out on the Property by numerous entities, most of which efforts were completed prior to the inception of Alpha. Diamond core and rotary drilling are the primary types of exploration on the Property. Data for correlation and mining conditions are derived from core descriptions and geophysical logging (e-logging). Coal-quality analyses were also employed during the core-exploration process. The development of this report included an assessment of over 5,375 coal measurements, largely comprised of exploration drill holes. Drill records indicate that independent contract drilling operators have typically been engaged to carry out drilling on the Property. Geophysical logging was typically performed by outside logging firms. MM&A, via its Geophysical Logging Systems subsidiary, has logged a significant number of the past exploration holes, including most of the recently drilled holes. Drill hole locations used in this assessment are shown on the resource and reserve maps included in Appendix C. 6 Geological Setting, Mineralization and Deposit 6.1 Regional, Local and Property Geology The Property lies in the Central Appalachian Coal basin in the Appalachian Plateau physiographic province. The coal deposits in the eastern US are the oldest and most extensively developed coal deposits in the country. The coal deposits on the Property are Carboniferous in age, being of the Pennsylvanian system. Overall, these Carboniferous coals contain two-fifths of the US’s bituminous coal deposits and extend over 900 miles from northern Alabama to Pennsylvania and are part of what is known as the Appalachian Basin. The Appalachian Basin is more than 250 miles wide and, in some portions, contains over 60 coal seams of varying economic significance. Seams and zones of economic significance typically range between 24 and 48 inches in thickness, with relatively little structural deformation. Regional structure is typically characterized by gently dipping strata to the northwest at one to four percent, averaging three percent. Strata on the Property are of the Pennsylvanian-age Kanawha Formation of the Pottsville Series. The rock formations between the coal seams are characterized by large proportions of sandstone interspersed with shale units. Seams with remaining reserve or resource potential include, in stratigraphically ascending order the: No. 2 Gas, Alma, Lower Cedar Grove, Upper Cedar Grove Chilton and Upper Chilton.

Alpha Metallurgical Resources, Inc. Statement of Coal Resources and Reserves for the Aracoma Complex in Accordance with United States SEC Standards as of December 31, 2023 Central Appalachian Coal Basin West Virginia, USA MARSHALL MILLER & ASSOCIATES, INC. 25 6.2 Mineralization The generalized stratigraphic columnar section in Figure 6-1 demonstrates the vertical relationship of the principal coal seams and rock formations on the Property. Figure 6-1: Aracoma Stratigraphic Column (not to scale) 6.3 Deposits The coal produced at the Aracoma complex is a High-Volatile-B bituminous coal. Alpha Metallurgical Resources, Inc. Statement of Coal Resources and Reserves for the Aracoma Complex in Accordance with United States SEC Standards as of December 31, 2023 Central Appalachian Coal Basin West Virginia, USA MARSHALL MILLER & ASSOCIATES, INC. 26 Due to the high value of these High volatile coking coals, all the seams have been extensively mined in the past. The coal seams reach the highest structural elevations along the southeastern margin of the Property, generally dipping toward the northwest. The upper seams of interest are situated above drainage and are accessible via outcrop, the deeper No. 2 Gas seam is below drainage where slope and shaft access are required. The rock formations between the coal seams are characterized by large portions of sandstone with shale units interspersed throughout. 7 Exploration 7.1 Nature and Extent of Exploration The Property has been extensively explored by subsurface drilling efforts carried out by numerous entities, most of which were completed prior to ownership by Alpha. Diamond core and rotary drilling are the primary types of exploration on the Property. Data for correlation and mining conditions are derived from core descriptions and geophysical logging (e- logging). Coal-quality analyses were also employed during the core-exploration process. Drill records indicate that independent contract drilling operators have typically been engaged to carry out drilling on the Property. Geophysical logging was typically performed by outside logging firms. MM&A, via its Geophysical Logging Systems subsidiary, has logged a significant number of the past exploration holes, including most of the recently drilled holes. The location of the drill holes are shown on the maps included in Appendix C. The concentration of exploration varies slightly across the Property. Drilling on the Property is typically sufficient for delineation of potential surface, highwall miner, and deep mineable coal horizons. Core logging is carried out by geologists in cases where roof and floor strata are of particular interest and in cases where greater resolution and geologic detail are needed. In many cases the drill hole data comes from simplified driller’s logs, which may lack specific details regarding geotechnical conditions and specific geology, making correlations and floor and roof conditions difficult to determine. Geophysical logging (e-logging) techniques, by contrast, document specific details useful for geologic interpretation and mining conditions. Given the variability of data-gathering methods, definitive mapping of future mining conditions may not be possible, but projections and assumptions can be made within a reasonable degree of certainty. A significant effort was put into verifying the integrity of the database. Once this was established, stratigraphic columnar sections were generated using cross-sectional analysis to establish or confirm coal seam correlations. A typical cross-section is shown in Figure 7-1.

Alpha Metallurgical Resources, Inc. Statement of Coal Resources and Reserves for the Aracoma Complex in Accordance with United States SEC Standards as of December 31, 2023 Central Appalachian Coal Basin West Virginia, USA MARSHALL MILLER & ASSOCIATES, INC. 27 Figure 7-1: Aracoma Cross-Section Due to the long history of exploration by various parties on the Property, a wide variety of survey techniques exist for documentation of data point locations. Many of the older exploration drill holes appear to have been located by survey and more recently completed drill holes are often located by high-resolution Global Positioning System (GPS) units. However, some holes appear to have been approximately located using USGS topography maps or other methods which are less accurate. Therefore, discretion had to be used regarding the accuracy for the location and ground surface elevation of some of these older drill holes. In instances where a drill hole location (or associated coal seam elevations) appeared to be inconsistent with the overall structural trend (or surface topography for surface-mineable areas), the data point was not honored for geological modeling. Others with apparently minor variances were adjusted and then used by MM&A. Surveying of the underground and surface mined areas has been performed by the mine operators and/or their consulting surveyors. By assignment, MM&A did not verify the accuracy or completeness of supplied mine maps but accepted this information as being the work of responsible engineers and surveyors, as required by both State and Federal Law. MM&A compiled comprehensive topographic map files by selecting the best available aerial mapping for each area and filling any gaps with digital USGS topographic mapping. Alpha Metallurgical Resources, Inc. Statement of Coal Resources and Reserves for the Aracoma Complex in Accordance with United States SEC Standards as of December 31, 2023 Central Appalachian Coal Basin West Virginia, USA MARSHALL MILLER & ASSOCIATES, INC. 28 7.2 Drilling Procedures Core drilling methods utilize NX-size (21/8 inch) or similar-sized core cylinders to recover core samples, which can be used to delineate geologic characteristics, and for coal quality testing and geotechnical logging. For the core holes, the geophysical logs are especially useful in verifying the core recovery of both the coal samples (for assurance that sample is representative of the full seam) and of the roof and floor rock samples (for evaluating ground control characteristics of deep mineable coal seams). In addition to the core holes, rotary drilled holes also exist on most of the Property. Data for the rotary drilled holes is mainly derived from downhole geophysical logs, which are used to interpret coal and rock thickness and depth since logging of the drill cuttings is not reliable. A wide variety of core-logging techniques exist for the Property. For many of the core holes, the primary data source is a generalized lithology description by the driller, typically supplemented by a more detailed core log completed by a geologist. These drilling logs were provided to MM&A as a geological database. MM&A geologists were not involved in the production of original core logs but did perform a basic check of information within the provided database. Where geophysical logs for such holes are available, they were used by MM&A geologists to verify the coal thickness and core recovery of seams. 7.3 Hydrology Hydrologic testing and forecasting are necessary parts of the permitting process and as such are routinely considered in the mine planning process. Aracoma has a lengthy history of operation and three currently active mines with no significant hydrologic concerns or material issues experienced in its history. Future mining is projected to occur in areas exhibiting similar hydrogeological conditions as past mining. Based upon the successful history of the operation with regards to hydrogeological features, MM&A assumes that the operation will not be hindered by such issues in the future. 7.4 Geotechnical Data Life-of-Mine (LOM) Mining plans for potential underground mines were developed by MM&A through incorporation of budget maps from Alpha. Pillar stability was tested by MM&A using the Analysis of Coal Pillar Stability (ACPS) program that was developed by the National Institute for Occupational Safety and Health (NIOSH). MM&A reviewed the results from the ACPS analysis and considered it in the development of the LOM plan. Coal and rock strengths from core testing are used to verify the empirical assumptions integral to ACPS.

Alpha Metallurgical Resources, Inc. Statement of Coal Resources and Reserves for the Aracoma Complex in Accordance with United States SEC Standards as of December 31, 2023 Central Appalachian Coal Basin West Virginia, USA MARSHALL MILLER & ASSOCIATES, INC. 29 8 Sample Preparation Analyses and Security 8.1 Prior to Sending to the Lab Most of the coal samples have been obtained from the Property by subsurface exploration using core drilling techniques. The protocol for preparing and testing the samples has varied over time and is not well documented for the older holes drilled on the Property. Typical US core drilling sampling technique is for the coal core sample, once recovered from the core barrel, to be described then wrapped in a sealed plastic sleeve and placed into a covered core box, which is the length of the sample so that the core can be delivered to a laboratory in relatively intact condition and with original moisture content. The core identification number and the depth are scribed on the sample box lid to identify the sample. This process has been the norm for both historical and ongoing exploration activities at Aracoma. This work is typically performed by the supervising driller, geologist or company personnel. Samples are most often delivered to the company by the driller after each shift or acquired by company personnel or representatives. Most of the coal core samples were obtained by previous operators on the Property. MM&A did not participate in the collection, sampling, and analysis of the majority of core samples within the exploration database. However, it is reasonable to assume, given the sophistication level of the previous operators, that these samples were generally collected and processed under industry best-practices. This assumption is based on MM&A’s familiarity with the operating companies and the companies used to perform the analysis. In addition to the steps taken to ensure the accuracy of the historical data as described above, Alpha reports the company employs a detailed chain of custody process during their current sampling programs. This chain of custody process follows the sample from the time it is drilled until the final quality results are entered into a database for preparation of geologic models. 8.2 Lab Procedures Coal quality testing has been performed over a large number of years by operating companies using different laboratories and testing regimens. Some of the samples have raw analyses and washabilities on the full seam (with coal and rock parting layers co-mingled) and are mainly useful for characterizing the coal quality for projected production from underground and highwall mining. Other samples have coal and rock analyzed separately, the results of which can be manipulated to forecast either surface or underground mining quality. Care has been taken to use only those analyses that are representative of the coal quality parameters for the appropriate mining type for each sample. Standard procedure upon receipt of core samples by the testing laboratory is to log the depth and thickness of the sample, then perform testing as specified by a representative of the operating company. Each sample is then analyzed in accordance with procedures defined under ASTM International (ASTM) standards including, but not limited to; washability (ASTM D4371); ash (ASTM Alpha Metallurgical Resources, Inc. Statement of Coal Resources and Reserves for the Aracoma Complex in Accordance with United States SEC Standards as of December 31, 2023 Central Appalachian Coal Basin West Virginia, USA MARSHALL MILLER & ASSOCIATES, INC. 30 D3174); sulfur (ASTM D4239); Btu/lb. (ASTM D5865); volatile matter (ASTM D3175); and Free Swell Index (FSI) (ASTM D720). 9 Data Verification 9.1 Procedures of Qualified Person MM&A reviewed the Alpha-supplied digital geologic database and supplemented the database with its own in-house records which have been maintained for both Alpha and previous operators of the Property. The database consists of data records, which include drill hole information for holes that lie within and adjacent to the Property along with records for numerous supplemental coal seam thickness measurements. Once the initial integrity of the database was established, stratigraphic columnar sections were generated using cross-sectional analysis to establish or confirm coal seam correlations. Geophysical logs were used wherever available to assist in confirming the seam correlation and to verify proper seam thickness measurements and recovery of coal samples. After establishing and/or verifying proper seam correlation, seam data control maps and geological cross-sections were generated and again used to verify seam correlations and data integrity. Once the database was fully vetted, seam thickness, base-of-seam elevation, roof and floor lithology, and overburden maps were independently generated for use in the mine planning process. Coal quality was analyzed and summarized by MM&A’s team of geologists and engineers. Quality was provided by Alpha in various database formats, laboratory data sheets, and also obtained directly from MM&A’s files. Care was taken to ensure that sampled data was representative of the mineable section. In instances where minimal representative data was noted, geological tonnages were estimated based upon applying assumed densities of coal and non-coal material to thicknesses expressed in geological database files. 9.2 Limitations As with any exploration program, localized anomalies, such as a thin coal area or poor mining conditions, cannot always be identified. The greater the density of the samples taken, the less the risk. Once an area is identified as being of interest for inclusion in the mine plan, additional samples are taken to help reduce the risk in those specific areas. In general, provision is made in the mine planning portion of the study to allow for localized anomalies that are typically classed more as a nuisance than a hinderance. 9.3 Opinion of Qualified Person Sufficient data has been obtained through various exploration and sampling programs and mining operations to support the geological interpretations of seam structure and thickness for coal horizons

Alpha Metallurgical Resources, Inc. Statement of Coal Resources and Reserves for the Aracoma Complex in Accordance with United States SEC Standards as of December 31, 2023 Central Appalachian Coal Basin West Virginia, USA MARSHALL MILLER & ASSOCIATES, INC. 31 situated on the Aracoma Property. The data is of sufficient quantity and reliability to reasonably support the coal resource and coal reserve estimates in this TRS. 10 Mineral Processing and Metallurgical Testing 10.1 Testing Procedures Basic chemical analyses (both raw and washed quality), petrographic data, rheological data and ash, ultimate and sulfur analysis are available but not summarized for this filing. Available coal quality data sourced from MM&A’s vaults (associated with former projects for Alpha and its predecessors) was tabulated by resource area in a Microsoft® EXCEL workbook. Such data contained laboratory sheets which MM&A utilized to confirm that sampled intervals were representative of geological models and confirm that appropriate laboratory procedures were utilized to derive raw and clean coal parameters. Additionally, Alpha provided MM&A with a database of its own in-house coal quality information which did not include backup laboratory information or sampled intervals. MM&A compared wash recovery values from Alpha’s dataset to proximal holes with wash recovery data in MM&A’s dataset and calculated estimates of wash recovery based upon the relative percentages of coal and rock from lithologic descriptions. In general, MM&A found that Alpha’s dataset was representative and appropriate for inclusion in coal quality summaries. Quality tables also provide basic statistical analyses of the coal quality datasets, including average value; maximum and minimum values; and the number of samples available to represent each quality parameter of the seam. Coal samples that were deemed by MM&A geologists to be unrepresentative were not used for statistical analysis of coal quality, as documented in the tabulations. The amount and areal extent of coal sampling for geological data is generally sufficient to represent the quality characteristics of the coal horizons and allow for proper market placement of the subject coal seams. For some of the coal deposits, there are considerable laboratory data from core samples that are representative of the full extent of the resource area; and for others there are more limited data to represent the resource area. For example, in the active operations with considerable previous mining, there may be limited quality data within some of the remaining resource areas; however, in those cases the core sampling data can be supplemented with operational data from mining and shipped quality samples representative of the resource area. 10.2 Relationship of Tests to the Whole The extensive sampling and testing procedures typically followed in the Coal Industry result in an excellent correlation between samples and Marketable product. As shipped analyses of the coal from Aracoma were reviewed to verify that the coal quality and characteristics were as expected. The Aracoma Property has a long history of saleable production, under various owners, in the High-volatile metallurgical and thermal markets, confirming exploration results. Alpha Metallurgical Resources, Inc. Statement of Coal Resources and Reserves for the Aracoma Complex in Accordance with United States SEC Standards as of December 31, 2023 Central Appalachian Coal Basin West Virginia, USA MARSHALL MILLER & ASSOCIATES, INC. 32 10.3 Lab Information Each sample is analyzed at area Laboratories that operate in accordance with procedures defined under ASTM standards including, but not limited to; washability (ASTM D4371); ash (ASTM D3174); sulfur (ASTM D4239); Btu/lb. (ASTM D5865); volatile matter (ASTM D3175); Free Swell Index (FSI) (ASTM D720). 10.4 Relevant Results No critical factors have been found that would adversely affect the recovery of the Reserve. Any quality issues that occur, either localized or generally, are accounted for in the Marketing Study done for this TRS. 11 Mineral Resource Estimates MM&A independently created a geologic model to define the coal resources at Aracoma. Coal resources were estimated as of December 31, 2023. 11.1 Assumptions, Parameters and Methodology Geological data was imported into Carlson Mining® (formerly SurvCADD®) geological modelling software in the form of Microsoft® Excel files incorporating drill hole collars, seam and thickness picks, bottom seam elevations and raw and washed coal quality. These data files were validated prior to importing into the software. Once imported, a geologic model was created, reviewed, and verified- with a key element being a gridded model of coal seam thickness. Resource tons were estimated by using the seam thickness grid based on each valid point of observation and by defining resource confidence arcs around the points of observation. Points of observation for Measured and Indicated confidence arcs were defined for all valid drill holes that intersected the seam using standards deemed acceptable by MM&A based on a detailed geologic evaluation and a statistical analysis of all drill holes within the projected reserve areas as described in Section 11.1.1. The geological evaluation incorporated an analysis of seam thickness related to depositional environments, adjacent roof and floor lithologies, and structural influences. After validating coal seam data and establishing correlations, the thickness and elevation for seams of economic interest were used to generate a geologic model. Due to the relative structural simplicity of the deposits and the reasonable continuity of the tabular coal beds, the principal geological interpretation necessary to define the geometry of the coal deposits is the proper modeling of their thickness and elevation. Both coal thickness and quality data are deemed by MM&A to be reasonably sufficient within the resource areas. Therefore, there is a reasonable level of confidence in the geologic interpretations required for coal resource determination based on the available data and the techniques applied to the data.

Alpha Metallurgical Resources, Inc. Statement of Coal Resources and Reserves for the Aracoma Complex in Accordance with United States SEC Standards as of December 31, 2023 Central Appalachian Coal Basin West Virginia, USA MARSHALL MILLER & ASSOCIATES, INC. 33 Table 11-1 below provides the geological mapping and coal tonnage estimation criteria used for the coal resource and reserve evaluation. These cut-off parameters have been developed by MM&A based on its experience with Aracoma properties and are typical of mining operations in the Central Appalachian coal basin. This experience includes technical and economic evaluations of numerous properties in the region for the purposes of determining the economic viability of the subject coal reserves. Table 11-1: General Reserve & Resource Criteria Item Parameters Technical Notes & Exceptions* • General Reserve Criteria Reserve Base Classification Reserve and Resource Coal resources as reported are exclusive and inclusive of coal reserves. Reliability Categories Reserve (Proven and Probable) Resource (Measured, Indicated & Inferred) To better reflect geological conditions of the coal deposits, distance between points of observation is determined via statistical analysis Effective Date of Resource Estimate December 31, 2023 Coal resources were estimated based upon depletion maps with effective dates of September 31, 2023, with a fourth quarter production depletion adjustment though December 31, 2023 Effective Date of Reserve Estimate December 31, 2023 Coal reserves were estimated based upon depletion maps with effective dates of September 31, 2023, with a fourth quarter production depletion adjustment though December 31, 2023. Seam Density With raw seam analysis: SG = 1.25+(Raw Ash% / 100 In the absence of laboratory data, estimated by (1) assuming specific gravity of 1.30 for coal and 2.25 for rock parting • Underground-Mineable Criteria Map Thickness Total seam thickness Minimum Seam Thickness 30 inches Minor Exceptions for localized zones of thinner coal Minimum Mining Thickness 52 inches Minimum Total Coal Thickness 27 inches and 30 inches Minor Exceptions for localized zones of thinner coal Minimum In-Seam Wash Recovery Determined as function of seam thickness Wash Recovery Applied to Coal Reserves Based on average yield for drill holes within reserve area, or in the absence of laboratory washability data, based on estimated visual recovery using specific gravities noted above and 95 percent yield on “clean” coal Out-of-Seam Dilution Thickness for Run-of-Mine Tons Applied to ROM tonnages Delta between minimum mining thickness (52 inches) and seam thickness 2 inches minimum OSD Mine Barrier 200-foot distance from abandoned mines and sealed or pillared areas Minimum Reserve Tonnage 400 thousand recoverable tons for individual area (logical mining unit) Minimum Overburden Depth 100 feet Minimum Interval to Rider Coal Considered on a case-by-case basis, depending on interval lithology, etc. Minimum Interval to Overlying or Underlying Reserves Considered on a case-by-case basis, depending on interval lithology, extent and type of extraction, etc. Minimum Interval to Overlying or Underlying Mined Areas Considered on a case-by-case basis, depending on interval lithology, extent and type of extraction, etc. Adjustments Applied to Coal Reserves 6.5 percent moisture increase; 5 percent preparation plant inefficiency Note: Exceptions for application of these criteria to reserve estimation are made as warranted and demonstrated by either actual mining experience or detailed data that allows for empirical evaluation of mining conditions. Final classification of coal reserve is made based on the pre-feasibility evaluation. Alpha Metallurgical Resources, Inc. Statement of Coal Resources and Reserves for the Aracoma Complex in Accordance with United States SEC Standards as of December 31, 2023 Central Appalachian Coal Basin West Virginia, USA MARSHALL MILLER & ASSOCIATES, INC. 34 11.1.1 Geostatistical Analysis MM&A completed a geostatistical analysis on drill holes within the reserve boundaries to determine the applicability of the common United States classification system for measured and indicated coal resources. Historically, the United States has assumed that coal within ¼-mile (1,320 feet) of a point of observation represents a measured resource whereas coal between ¼-mile (1,320 feet) and ¾-mile (3,960 feet) from a point of observation is classified as indicated. Inferred resources are commonly assumed to be located between ¾-mile (3,960 feet) and 3 miles (15,840 feet) from a point of observation. Per SEC regulations, only measured and indicated resources may be considered for reserve classification, respectively, as proven and probable reserves. MM&A performed a geostatistical analysis test of the Aracoma data set using the Drill Hole Spacing Analysis (DHSA) method. This method attempts to quantify the uncertainty of applying a measurement from a central location to increasingly larger square blocks and provides recommendations for determining the distances between drill holes for measured, indicated, and inferred resources. To perform DHSA the data set was processed to remove any erroneous data points, clustered data points, as well as directional trends. This was achieved through the use of histograms, as seen in Figure 11-1, color coded scatter plots showing the geospatial positioning of the borings, Figure 11-2, and trend analysis. Figure 11-1: Histogram of the Total Seam Thickness for the No. 2 Gas Seam Present in the Aracoma Complex Figure 11-2: Scatter plot of the Total Seam Thickness for the No. 2 Gas Seam Present in the Aracoma Complex

Alpha Metallurgical Resources, Inc. Statement of Coal Resources and Reserves for the Aracoma Complex in Accordance with United States SEC Standards as of December 31, 2023 Central Appalachian Coal Basin West Virginia, USA MARSHALL MILLER & ASSOCIATES, INC. 35 Following the completion of data processing, a variogram of the data set was created, Figure 11-3. The variogram plots average square difference against the separation distance between the data pairs. The separation distance is broken up into separate bins defined by a uniform lag distance (e.g., for a lag distance of 500 feet the bins would be 0 – 500 feet, 501 – 1,000 feet, etc.). Each pair of data points that are less than one lag distance apart are reported in the first bin. If the data pair is further apart than one lag distance but less than two lag distances apart, then the variance is reported in the second bin. The numerical average for differences reported for each bin is then plotted on the variogram. Care was taken to define the lag distance in such a way as to not overestimate any nugget effect present in the data set. Lastly, modeled equations, often spherical, gaussian, or exponential, are applied to the variogram in order to represent the data set across a continuous spectrum. Figure 11-3: Variogram of the Total Seam Thickness for the No. 2 Gas Seam Present in the Aracoma Complex The estimation variance is then calculated using information from the modeled variogram as well as charts published by Journel and Huijbregts (1978). This value estimates the variance from applying a single central measurement to increasingly larger square blocks. Care was taken to ensure any nugget effect present was added back into the data. This process was repeated for each test block size. Alpha Metallurgical Resources, Inc. Statement of Coal Resources and Reserves for the Aracoma Complex in Accordance with United States SEC Standards as of December 31, 2023 Central Appalachian Coal Basin West Virginia, USA MARSHALL MILLER & ASSOCIATES, INC. 36 The final step of the process is to calculate the global estimation variance. In this step the number square blocks that would fit inside the selected study area is determined for each block size that was investigated in the previous step. The estimation variance is then divided by the number of blocks that would fit inside the study area for each test block size. Following this determination, the data is then transformed back to represent the relative error in the 95th-percentile range. Figure 11-4 shows the results of the DHSA performed on the No. 2 Gas seam data for the Aracoma Complex. DHSA provides hole to hole spacing values, these distances need to be converted to radius from a central point in order to compare to the historical standards. A summary of the radius data is shown in Table 11-2. DHSA prescribes measured, indicated, and inferred drill hole spacings be determined at the 10-percent, 20-percent, and 50-percent levels of relative error, respectively. Figure 11-4: Result of DHSA for the No. 2 Gas Seam Present in the Aracoma Complex Table 11-2: DHSA Results Summary for Radius from a Central Point Model: Measured Radial Distance (10% Relative Error) Indicated Radial Distance (20% Relative Error) Inferred Radial Distance (50% Relative Error) (Miles) (Miles) (Miles) Gaussian: 0.47 0.88 2.11 Spherical: 0.45 0.85 2.08 Exponential: 0.47 0.88 2.11 Comparing the results of the DHSA to the historical standards, it is evident that the historical standards are more conservative than even the most conservative DHSA model with regards to determining

Alpha Metallurgical Resources, Inc. Statement of Coal Resources and Reserves for the Aracoma Complex in Accordance with United States SEC Standards as of December 31, 2023 Central Appalachian Coal Basin West Virginia, USA MARSHALL MILLER & ASSOCIATES, INC. 37 measured resources. The Spherical model recommends using a radius of 0.45 miles for measured resources compared to the historical value of 0.25 miles. With respect to indicated resources the DHSA falls in line closely with the historical standards. The Spherical model recommends using a radius of 0.85 miles, while the Gaussian and Exponential models recommend a radius of 0.88 miles. These values line up closely with the historical radius of 0.75 miles. These results have led the QPs to report the data following the historical classification standards, rather than use the results of the DHSA. 11.2 Resources Exclusive of Reserves The Aracoma property contains multiple resource blocks which were not deemed to exhibit reserve potential at the time of the study. These resources, formally identified as resources exclusive of reserves, are in the Upper Chilton, Upper Cedar Grove and No. 2 Gas seams. Reasons which may preclude elevation of resources to reserves include, but are not limited to: 1. Unfavorable geology, mine access or social/political constraint that will increase mine operating cost or capital development costs. i. Map 5, No. 2 Gas seam, shows resource classification for the Rum Creek Area. Geology indicates the roof and floor will be hard cutting and seam splitting that will limit the mine height and equipment size. ii. Map 2, Upper Cedar Grove, the seam is generally in two benches with a parting of variable thickness. The resource areas are mostly confined to where the mid-seam parting thickness is less than 4.0 feet. 2. Coal quality inconsistent with typical preferred market properties. i. Shown on Map 2, Upper Cedar Grove seam, the Cedar Grove #2 mine experienced higher than desirable Sulfur content when mining in the portions of Block A2. The remaining portions of coal block are projected to have higher than 1.6% Sulfur and were subsequently designated as resource tons rather than as reserves. ii. Shown on Map 2, Upper Cedar Grove seam, the Cedar Grove #3 northern blocks are classified as a resource due to lack of coal quality analysis and the potential high sulfur. 3. Isolation of resource blocks in which seam access costs are cost prohibitive at the time of the study. i. Map 6, Chilton Seam, Blocks BW-A1 through BW-A5 and BW-B through BW-F, have all been classified as resource, as they are isolated and separated by adverse mineral and out crops. The resources have the potential to be surface mined or underground mined or a combination of these methods. The seam is located high on the hills, so the cover is generally shallow and variable. Alpha Metallurgical Resources, Inc. Statement of Coal Resources and Reserves for the Aracoma Complex in Accordance with United States SEC Standards as of December 31, 2023 Central Appalachian Coal Basin West Virginia, USA MARSHALL MILLER & ASSOCIATES, INC. 38 4. Exclusion from LOM planning by mining operator due to remaining resource blocks which are relatively small, isolated blocks and not currently attractive from an operational perspective. i. Portions of the Boone West No. 2 Gas, Blocks BW-A, B, B1, D1, D2, and E – on Maps 5 and 7, located immediately north of the reserve block BW-C, have been designated as resource, as they are relatively small, isolated controlled blocks of coal. Additional mineral control with associated exploration drilling could define a contiguous block suitable for mine development. 11.2.1 Initial Economic Assessment MM&A completed an initial economic assessment to determine the potential economic viability of resources exclusive of reserves (not converted to reserves). MM&A applied relevant technical factors to estimate potential saleable tons without the resource blocks, should the resources be extracted via deep, continuous mining methods. MM&A developed cash cost profiles for the resource blocks, including direct cash costs (labor, supplies, roof control, maintenance and repair, power, and other); washing, trucking, materials handling, general and administrative, and environmental costs; and indirect cash costs (royalties, production taxes, property tax, insurance). Costs were developed based off relevant cost drivers (per-ft, per-raw-ton, per-clean-ton). Additionally, MM&A estimated capital costs to access resources. Capital costs associated with mine development were amortized across the resource’s potential saleable tonnages). Additional non-cash items (depreciation of equipment and depletion) and cash costs were compared to an assumed sale price of $125 per ton netback FOB loadout (approximately $154 per ton U.S. East Coast basis) for high-volatile markets. This resource assumed sales value was developed as a premium to the market-based reserve sales value to properly estimate the sales-related expenses should these resources be extracted during higher-than-average market conditions. Pricing used for the primary product was selected by the QP and deemed reasonable based on a review of historical average pricing for the Aracoma complex coal products over the past 5 years. The results of the analysis are shown below and demonstrate potential profitability on a fully loaded cost basis. Detailed summaries are shown in Appendix B. Table 11-3: Results of Initial Economic Assessment ($/ton) Mine/Resource Block Seam Direct Cash Transportation, Washing, Enviro, G&A Indirect Non-Cash Total Cost Fully Loaded P&L Boone West Chilton $49.16 $29.09 $15.42 $23.53 $117.19 $7.81 UCG Lauren Land, Block A2-A3 UCG $53.02 $24.50 $15.42 $7.73 $100.67 $24.33 UCG Lauren Land, Block B UCG $48.39 $27.08 $15.42 $7.73 $98.62 $26.38 N2G BW N2G $69.01 $25.59 $10.42 $17.80 $122.82 $2.18 N2G RC N2G $63.99 $23.15 $10.42 $12.46 $110.03 $14.97

Alpha Metallurgical Resources, Inc. Statement of Coal Resources and Reserves for the Aracoma Complex in Accordance with United States SEC Standards as of December 31, 2023 Central Appalachian Coal Basin West Virginia, USA MARSHALL MILLER & ASSOCIATES, INC. 39 Figure 11-5: Results of Initial Economic Assessment 11.3 Qualified Person’s Estimates Based on the work previously described and detailed modelling of those areas along with consideration all modifying factors, a coal resource estimate, summarized in Table 11-4, was prepared as of December 31, 2023, for property controlled by Alpha. Table 11-4: Coal Resources Summary as of December 31, 2023 Coal Resource (Dry Tons, In Situ, Mt) Area Seam Measured Indicated Inferred Total Inclusive of Reserve/Converted to Reserve Davy Branch Upper Chilton (41000) 12,153,000 3,912,000 0 16,066,000 Hatfield Area Upper Chilton (41000) 17,538,000 10,930,000 0 28,468,000 Cedar Grove No. 3 Upper Cedar Grove (30100) 20,521,000 4,377,000 0 24,898,000 Laurel Land Lower Cedar Grove (30000) 5,484,000 2,991,000 0 8,475,000 Lower Cedar Grove No. 3 Lower Cedar Grove (30000) 1,577,000 54,000 0 1,631,000 Beech Branch Alma (25800) 2,560,000 1,226,000 0 3,787,000 Lynn Branch No. 2 Gas (24000) 29,460,000 18,873,000 289,000 48,623,000 Boone West No. 2 Gas (24000) 6,072,000 8,662,000 701,000 15,435,000 Total Inclusive of Reserve/Converted to Reserve 95,366,000 51,026,000 990,000 147,382,000 Exclusive of Reserve/Not Converted to Reserve Boone West Chilton (47000) 7,306,000 1,990,000 0 9,296,000 Cedar Grove No. 2 Upper Cedar Grove (30100) 12,102,000 9,571,000 180,000 21,853,000 Cedar Grove No. 3 Upper Cedar Grove (30100) 3,414,000 1,355,000 4,000 4,773,000 Rum Creek No. 2 Gas (24000) 29,760,000 19,508,000 154,000 49,422,000 Boone West No. 2 Gas (24000) 29,094,000 17,283,000 86,000 46,463,000 Total Exclusive of Reserve/Not Converted to Reserve 81,676,000 49,707,000 423,000 131,806,000 Alpha Metallurgical Resources, Inc. Statement of Coal Resources and Reserves for the Aracoma Complex in Accordance with United States SEC Standards as of December 31, 2023 Central Appalachian Coal Basin West Virginia, USA MARSHALL MILLER & ASSOCIATES, INC. 40 Coal Resource (Dry Tons, In Situ, Mt) Area Seam Measured Indicated Inferred Total Grand Total Inclusive of Reserve/Converted to Reserve 95,366,000 51,026,000 990,000 147,382,000 Exclusive of Reserve/Not Converted to Reserve 81,676,000 49,707,000 423,000 131,806,000 Grand Total 177,042,000 100,733,000 1,413,000 279,18,000 Note(1): Resource tons are inclusive of reserve tons since they include the in-situ tons from which recoverable coal reserves are derived. Note (2): Coal resources are reported on a dry basis. Surface moisture and inherent moisture are excluded. Note (3): The Property contains 131.4 Mt of dry, in-place measured and indicated coal resources exclusive of reserves as of December 31, 2023. Totals may not add due to rounding. See Appendix A for more detailed breakdown. 11.4 Qualified Person’s Opinion While there is some stratigraphically controlled seam-thickness variability due to seam splitting, sand channels, etc., MM&A geologists and engineers modeled the deposit and resource areas to reflect realistic mining scenarios, giving special consideration to uncertainties as related to each class of mineral resources such as (1) seam thickness, (2) floor and roof conditions, (3) mining equipment, etc. This statistical study demonstrates that for each configuration of mineable seams, the classification system of measured (0 – ¼ mile), indicated (¼ to ¾ mile), and inferred (¾ to 3 miles) is reasonably adequate to predict seam thickness variation for modeling and mining purposes. Based on MM&A’s geostatistical analysis, it would be possible to extend the measured, indicated and inferred arcs slightly beyond historically accepted practices due to consistent geological settings. The QP’s have again elected not to extend arc distances, introducing a level of conservatism in measured and indicated coal classification. Based on the data review, the attendant work done to verify the data integrity and the creation of an independent Geologic Model, MM&A believes this is a fair and accurate representation of the Aracoma coal resources. 12 Mineral Reserve Estimates 12.1 Assumptions, Parameters and Methodology Coal Reserves are classified as proven or probable considering “modifying factors” including mining, metallurgical, economic, marketing, legal, environmental, social and governmental factors. > Proven Coal Reserves are the economically mineable part of a measured coal resource, adjusted for diluting materials and allowances for losses when the material is mined. It is based on appropriate assessment and studies in consideration of and adjusted for reasonably assumed modifying factors. These assessments demonstrate that extraction could be reasonably justified at the time of reporting. > Probable Coal Reserves are the economically mineable part of an indicated coal resource, and in some circumstances a measured coal resource, adjusted for diluting materials and allowances for

Alpha Metallurgical Resources, Inc. Statement of Coal Resources and Reserves for the Aracoma Complex in Accordance with United States SEC Standards as of December 31, 2023 Central Appalachian Coal Basin West Virginia, USA MARSHALL MILLER & ASSOCIATES, INC. 41 losses when the material is mined. It is based on appropriate assessment and studies in consideration of and adjusted for reasonably assumed modifying factors. These assessments demonstrate that extraction could be reasonably justified at the time of reporting. Upon completion of delineation and calculation of coal resources, MM&A generated a LOM plan for Aracoma. The footprint of each reserve area is shown on the maps in Appendix C. The Mine plan was generated based on budget mine plans provided by Alpha and supplemented with additional projections by MM&A to reflect LOM plans that honor property control limits, geologic mapping, or other factors determined during the evaluation. Carlson Mining software was used to generate the LOM plan for Aracoma. The mine plan was sequenced based on productivity schedules provided by Alpha. MM&A judged the productivity estimates and plans to be reasonable based on experience and current industry practice. Raw, ROM production data outputs from LOM plan sequencing were processed into Microsoft® EXCEL spreadsheets and summarized on an annual basis for processing into the economic model. Average seam densities were estimated to determine raw coal tons produced from the LOM plan. Average mine recovery and wash recovery factors were applied to determine coal reserve tons. Coal reserve tons in this evaluation are reported at a 6.0-percent moisture and represent the saleable product from the Property. Pricing data as provided by Alpha from third party sources is described in Table 16-2. The pricing data assumes a flat-line mine realization of $140 per short-ton port pricing, with an average of $113.94 per ton netback pricing, reflective of the high-volatile product currently sold at Aracoma. The coal resource mapping and estimation process, described in the report, was used as a basis for the coal reserve estimate. Proven and probable coal reserves were derived from the defined coal resource considering relevant processing, economic (including technical estimates of capital, revenue, and cost), marketing, legal, environmental, socio-economic, and regulatory factors and are presented on a moist, recoverable basis. As is customary in the US, the categories for proven and probable coal reserves are based on the distances from valid points of measurement as determined by the QP for the area under consideration. For this evaluation, measured resource, which may convert to a proven reserve, is based on a ¼-mile radius from a valid point of observation. Points of observation include exploration drill holes, and mine measurements which have been fully vetted and processed into a geologic model. The geologic model is based on seam depositional modeling, the interrelationship of overlying and underlying strata on seam mineability, seam thickness trends, the impact of seam structure, intra-seam characteristics, etc. Once the geologic model was Alpha Metallurgical Resources, Inc. Statement of Coal Resources and Reserves for the Aracoma Complex in Accordance with United States SEC Standards as of December 31, 2023 Central Appalachian Coal Basin West Virginia, USA MARSHALL MILLER & ASSOCIATES, INC. 42 completed, a statistical analysis, described in Section 11.1.1 was conducted and a ¼-mile radius from a valid point of observation was selected to define Measured Resources. Likewise, the distance between ¼ and ¾ of a mile radius was selected to define Indicated Resources. Indicated Resources may convert to Probable Reserves. Inferred Resources (greater than a ¾-mile radius from a valid point of observation) have been excluded from Reserve consideration. 12.2 Mineral Reserves Aracoma reserves were derived from multiple coal seams of Figure 7-1 located on the Property. All reserves are planned to be mined by underground mining methods. The above-drainage underground seams include the Upper Chilton seam at Davy Branch and Hatfield and the Upper Cedar Grove seam at Laurel Branch Mine. Below-drainage underground reserves are in the Lower Cedar Grove seam, the Alma seam at Beech Branch and the No. 2 Gas seam at Boone West, Lynn Branch and Rum Creek. Table 12-1 shows the demonstrated tonnage by Proven and Probable. 12.2.1 Upper Chilton Seam The Upper Chilton reserve is contained in two blocks, the active Davy Branch mine block and, to the west, the Hatfield block. Seam thickness is generally between 3 and 4 feet. Localized areas of hard roof and floor are excluded from the reserves. 12.2.2 Upper Cedar Grove Seam The Upper Cedar Grove (UCG) resource and reserve is also in two blocks, the idle Cedar Grove No. 2 mine block and a separate block, Cedar Grove No. 3 mine to the west. The Cedar Grove No. 3 mine began initial production during the fourth quarter 2022. The reserve is defined by areas with less than 1.70% sulfur and less than 4.0 feet total mid-seam parting thickness. There are no reserves defined in the active Cedar Grove No. 2 mine block, all reserves are in the west block (No. 3 mine). 12.2.3 Lower Cedar Grove Seam The Lower Cedar Grove (LCG) reserves are located in two separate blocks. The west block is referred to as the Lauren Land LCG and is an unmined block surrounded by abandoned mines. Access would be through a short slope. Seam thickness ranges from 2.50 to 3.50 feet. The east block is part of the Upper Cedar Grove #3 Mine. The LCG would be mined though the UCG#3 mine along the west margin of the UCG reserve. The LCG will be the more attractive coal seam once the UCG seam parting increases to greater than 4 feet. 12.2.4 Alma Seam The Alma seam reserve is located in one block south of the Guyandotte River and south of the closed Aracoma Alma No. 1 Mine. The east side of the reserve block outcrops along the river and the west

Alpha Metallurgical Resources, Inc. Statement of Coal Resources and Reserves for the Aracoma Complex in Accordance with United States SEC Standards as of December 31, 2023 Central Appalachian Coal Basin West Virginia, USA MARSHALL MILLER & ASSOCIATES, INC. 43 side is slightly below drainage where the reserve will be accessed. The seam thickness is less than 3.0 feet, and the reserve cutoff is 2.5 feet. 12.2.5 No. 2 Gas Seam The No. 2 Gas seam reserve is in three areas: the active Lynn Branch No. 2 Mine, the Rum Creek area and the Boone West area. Lynn Branch is the largest block of the No. 2 Gas reserve and is located south and west of the Guyandotte river and south and west of previous mining. Seam thickness is generally greater than 3 feet. Areas with projected low fluidity will be mined with higher fluidity coals. The Rum Creek No 2 Gas is considered strictly a resource due to seam splits to the north, and the resource area is bound by hard roof and floor rock that will limit the mining height. The Boone West reserve is north of Rum Creek. The reserve outcrops on the west side in Mill and Crooked Creeks. 12.3 Qualified Person’s Estimates The coal reserves, as shown in Table 12-1, are based on a technical evaluation of the geology and a preliminary feasibility study of the coal deposits. The extent to which the coal reserves may be affected by any known environmental, permitting, legal, title, socio-economic, marketing, political, or other relevant issues has been reviewed rigorously. Similarly, the extent to which the estimates of coal reserves may be materially affected by mining, metallurgical, infrastructure and other relevant factors has also been considered. The results of this TRS define an estimated 41.28 Mt of proven and probable marketable coal reserves. The maps included in Appendix C reflect mining depletion at the time of the resource/reserve calculation taken from Alpha mine maps as of September 30, 2023. Mine depletion tonnages were supplied by Alpha through the end of 2023, and MM&A deducted this historical production from the mapped reserves in order to estimate reserves as of December 31, 2023. Table 12-1: Coal Reserves Summary (Marketable Sales Basis) as of December 31, 2023 Demonstrated Coal Reserves (Wet Tons, Washed or Direct Shipped) Quality (Dry Basis) By Reliability Category By Control Type Area/Mine Seam Proven Probable Total Owned Leased Ash% Sulfur% VM% Davy Branch Upper Chilton (41000) 3,023,000 914,000 3,937,000 0 3,937,000 7 0.9 39 Hatfield Upper Chilton (41000) 5,106,000 2,663,000 7,768,000 0 7,768,000 7 0.9 36 Cedar Grove No. 3 U. Cedar Grove (30100) 3,810,000 630,000 4,440,000 0 4,440,000 7 1.3 39 Lauren Land L. Cedar Grove (30000) 1,905,000 1,038,000 2,943,000 0 2,943,000 3 0.7 - Cedar Grove No. 3 L. Cedar Grove (30000) 539,000 17,000 556,000 54,000 503,000 4 0.6 38 Beech Branch Alma (25800) 972,000 458,000 1,429,000 0 1,429,000 4 0.9 39 Lynn Branch No. 2 Gas (24000) 9,150,000 6,028,000 15,178,000 1,423,000 13,755,000 4 0.8 37 Boone West No. 2 Gas (24000) 1,746,000 3,277,000 5,024,000 3,996,000 1,028,000 4 0.9 - Grand Total 26,252,000 15,024,000 41,276,000 5,473,000 35,803,000 5 0.9 37 Notes: Marketable reserve tons are reported on a moist basis, including a combination of surface and inherent moisture. Coal quality is based on a weighted average of laboratory data from core holes. The combination of surface and inherent moisture is modeled at 6.0 -percent. Actual product moisture is dependent upon multiple geological factors, operational factors, and product contract specifications and can exceed 8-percent. As such, the modeled moisture values provide a level of conservatism for reserve reporting. *Volatile Matter analysis is not available for all reserve areas. All Aracoma reserves are priced as a High-Vol. B product. Totals may not add due to rounding. See Appendix A for more detailed breakdown. Alpha Metallurgical Resources, Inc. Statement of Coal Resources and Reserves for the Aracoma Complex in Accordance with United States SEC Standards as of December 31, 2023 Central Appalachian Coal Basin West Virginia, USA MARSHALL MILLER & ASSOCIATES, INC. 44 12.4 Qualified Person’s Opinion The estimate of coal reserves was determined in accordance with the SEC S-K 1300 regulations that became effective for the first fiscal year falling on or after January 1, 2021. The LOM mining plan for Aracoma was prepared to the level of preliminary feasibility. Mine projections were prepared, and timing scheduled to match production with coal seam characteristics. Production timing was carried out from current locations to depletion of the coal reserve area. Coal reserve estimates could be materially affected by the risk factors described in Section 22.2. Based on the Preliminary Feasibility Study and the attendant Economic Review, MM&A believes this is a fair and accurate calculation of the Aracoma coal reserves. 13 Mining Methods Seven underground mining areas were modeled and tested economically. Once the Resources were calculated, mine plans were created to project operating each resource area to depletion, with crews and equipment scheduled to move to subsequent mining areas as depletion occurs. Underground mine operations are projected to be exhausted in 2044. Individual mine lives range from 5 to 17 years. 13.1 Geotech and Hydrology Mining plans for potential underground mines were developed by Alpha and MM&A. Pillar stability was tested by MM&A using the Analysis of Coal Pillar Stability (ACPS) program that was developed by NIOSH. MM&A reviewed the results from the ACPS analysis and considered it in the development of the LOM plan. Hydrology has not been an issue of concern at Aracoma. Based on numerous site visits to the underground operations of the Property by the QP’s, it has been determined that this is not a significant concern. Mining of future reserves is projected to occur in areas which exhibit similar hydrogeological characteristics as those formerly mined areas. 13.2 Production Rates Operations at Aracoma by Alpha and its predecessors have been on-going for many years. The Mine plan and productivity expectations reflect historical performance and efforts have been made to adjust the plan to reflect future conditions. MM&A is confident that the mine plan is reasonably representative to provide an accurate estimation of coal reserves. Mine development and operation have not been optimized within the TRS. Carlson Mining software was used by MM&A to generate mine plans for the mineable coal seams. Mine plans were sequenced based on productivity schedules provided by Alpha, which were based on

Alpha Metallurgical Resources, Inc. Statement of Coal Resources and Reserves for the Aracoma Complex in Accordance with United States SEC Standards as of December 31, 2023 Central Appalachian Coal Basin West Virginia, USA MARSHALL MILLER & ASSOCIATES, INC. 45 historically achieved productivity levels. All production forecasting ties assumed production rates to geological models as constructed by MM&A’s team of geologists and mining engineers. The Aracoma Mining Complex currently operates three underground mines with a total of six (6) operating sections. The Cedar Grove #2 mine has been idled and production has shifted to the Cedar Grove #3 Mine. One continuous miner production section will operate in the Cedar Grove #3 Mine. The projected underground mines are set up similarly to the currently active operation. Lynn Branch No. 2 (No. 2 Gas seam) will operate three production sections and the Davy Branch Mine (Upper Chilton seam) will operate two production sections. It should be noted that Alpha plans to add a second section in the Cedar Grove #3 Mine in 2024, and a fourth “construction” unit will operate in the Lynn Branch Mine; however, MM&A has not reflected these updates as part of the current TRS. All sections are configured with dual continuous miners in a super section operation. In all cases, mines are forecasted to produce coal two shifts each day. Production is scheduled Monday through Friday each week, and every other Saturday. As shown in Table 13-1, the seven areas planned for underground mines produce coal until 2044. Clean coal production varies directly with coal thickness. Table 13-1: Aracoma Complex Underground Mine Production Schedule (x 1,000 Saleable Tons) Mine Name 2023 2024 2025 2026 2027 2028 2029 2030 Lynn Branch N2G 284 1,134 1,072 1,113 1,083 1,018 1,017 969 Davey Branch UCH 245 901 864 781 676 661 0 0 Lauren Land - Hatfield UCH 0 0 0 0 0.0 0 423 433 Lauren Land LCG 0 0 0 0 0 0 0 0 Boone West N2G 0 0 0 0 0 0 0 0 Rum Creek N2G 0 0 0 0 0 0 0 0 Alma Beech Br 0 0 0 0 0 0 303 350 UCG No. 3 135 651 550 539 504 551 528 519 Total 665 2,687 2,487 2,433 2,263 2,231 2,271 2,270 Mine Name 2031 2032 2033 2034 2035 2036 2037 2038 Lynn Branch N2G 1,035 1,014 953 921 973 1,048 957 579 Davey Branch UCH 0 0 0 0 0 0 0 0 Lauren Land - Hatfield UCH 384 415 789 757 776 788 756 693 Lauren Land LCG 0 0 0 0 0 0 0 0 Boone West N2G 0 0 201 449 334 352 377 685 Rum Creek N2G 0 0 0 0 0 0 0 0 Alma Beech Br 324 310 143 0 0 0 0 0 UCG No. 3 574 555 0 0 0 0 0 0 Total 2,317 2,295 2,085 2,126 2,082 2,187 2,091 1,957 Alpha Metallurgical Resources, Inc. Statement of Coal Resources and Reserves for the Aracoma Complex in Accordance with United States SEC Standards as of December 31, 2023 Central Appalachian Coal Basin West Virginia, USA MARSHALL MILLER & ASSOCIATES, INC. 46 Mine Name 2039 2040 2041 2042 2043 2044 2045 2046 Lynn Branch N2G 307 0 0 0 0 0 0 0 Davey Branch UCH 0 0 0 0 0 0 0 0 Lauren Land - Hatfield UCH 723 735 96 0 0 0 0 0 Lauren Land LCG 331 726 740 694 381 71 0 0 Boone West N2G 688 717 731 554 170 0 0 0 Rum Creek N2G 0 0 0 0 0 0 0 0 Alma Beech Br 0 0 0 0 0 0 0 0 UCG No. 3 0 0 0 0 0 0 0 0 Total 2,049 2,177 1,568 1,248 551 71 0 0 13.3 Mining Related Requirements 13.3.1 Underground A mine plan with sequenced mining projections was prepared for each logical mining unit. For each mine plan, the appropriate number of production units is selected for the resource area, and a productivity level assigned, expressed in feet of advance per unit-shift of production. The productivity is based on the equipment and personnel configuration, mining height and expected physical conditions. 13.4 Required Equipment and Personnel 13.4.1 Underground Mines 13.4.1.1 Lynn Branch No. 2 Mine (Map 5) As noted above, MM&A’s model shows the Lynn Branch No. 2 Mine operating three (3) continuous mining sections in the No. 2 Gas seam. This mine produces metallurgical coal from leased mineral property. The mine started its first mining unit in 2020, the second unit in March of 2021 and the third unit in July 2021. Production is scheduled for approximately 265 days each year, which represents production on Monday through Friday plus every other Saturday. On each day, production sections are scheduled to produce coal on two shifts. The sections are configured as super sections with two continuous miners used for production on each section. Productivity is planned at the rate of 280 feet of advance per shift of operation. Principal production equipment per section includes two continuous miners, two roof bolters, four shuttle cars, and one scoop. Coal is extracted from the production face with the continuous miners and hauled to the mine conveyor in shuttle cars. At the conveyor belt, the coal is discharged from the shuttle cars onto a feeder breaker for transfer onto the conveyor. The conveyors carry the coal to the outside, where it is stockpiled. Coal is then transported via highway truck haulage to the Bandmill Preparation Plant where it is processed and loaded onto CSX rail for transport to the consumer.

Alpha Metallurgical Resources, Inc. Statement of Coal Resources and Reserves for the Aracoma Complex in Accordance with United States SEC Standards as of December 31, 2023 Central Appalachian Coal Basin West Virginia, USA MARSHALL MILLER & ASSOCIATES, INC. 47 The Lynn Branch No. 2 Mine is operational at the time of this report; all necessary infrastructure and utilities are in place; all necessary permits have been obtained. Estimated expenditures for site closure and reclamation are included in the financial model for this site. The mine is scheduled to deplete its mining assignment in 2039. 13.4.1.2 Davy Branch Deep Mine (Map 1) The Davy Branch Deep Mine, which is currently operational with two (2) continuous mining sections producing coal in the Upper Chilton seam on leased mineral property. The Davy Branch Deep Mine is a two (2) section mine with each working section operated as a super section (two sets of mining equipment operating simultaneously and sharing a common dumping point on the same section, with each set being ventilated by a separate split on intake air) Each super section operates two (2) Continuous Miners, two (2) Roof Bolters, four (4) Shuttle Cars and one (1) scoop. Like the Lynn Branch No. 2 Deep mine operation, coal is extracted from the production face with the continuous miners and hauled to the mine conveyor in shuttle cars. At the conveyor belt, the coal is discharged from the shuttle cars onto a feeder breaker for transfer onto the conveyor. The conveyors carry the coal to the outside, where it is stockpiled. Coal is then transported via highway truck haulage to the Bandmill Preparation Plant where it is processed and loaded into CSX rail for transport to the consumer. The Davy Branch Deep Mine is also operational at the time of this report with all necessary infrastructure and utilities in place. All necessary permits have been obtained. Estimated expenditures for site closure and reclamation are included in the financial model for this site. The mine is scheduled to deplete its mining assignment in 2029. 13.4.1.3 Hatfield Upper Chilton (Map 1) The Hatfield Upper Chilton reserve is in conceptual stage at this point. A potential portal area was located along the outcrop near County Highway 13. The reserve can support two operating areas for two continuous miner production sections. The Hatfield Upper Chilton Mine is projected as a two (2) section mine with each working section operated as a super section (two sets of mining equipment operating simultaneously and sharing a common dumping point on the same section, with each set being ventilated by a separate split on intake air). Each super section operates two (2) Continuous Miners, two (2) Roof Bolters, four (4) Shuttle Cars and one (1) scoop. Like the Lynn Branch No. 2 Deep mine operation, coal is extracted from the production face with the continuous miners and hauled to the mine conveyor In shuttle cars. At the conveyor belt, the coal is discharged from the shuttle cars onto a feeder breaker for transfer onto the conveyor. The conveyors carry the coal to the outside, where it is stockpiled. Coal is then transported via highway truck haulage to the Bandmill Preparation Plant where it is processed and loaded into CSX rail for transport to the consumer. Alpha Metallurgical Resources, Inc. Statement of Coal Resources and Reserves for the Aracoma Complex in Accordance with United States SEC Standards as of December 31, 2023 Central Appalachian Coal Basin West Virginia, USA MARSHALL MILLER & ASSOCIATES, INC. 48 The physical location of the reserve is the furthest from the Bandmill preparation plant with a highway haul of 21.5 miles. The report includes an initial starting date in 2029 with a second production unit starting in 2032. Both production units complete their assignment during the 2041 calendar year. 13.4.1.4 Boone West (No. 2 Gas) (Map 7) This reserve area is located north of the Bandmill Preparation Plant. A contour faceup would be used to access the coal seam. The reserve block can support two continuous miner units. The Property has had limited mining activity with no undermining and limited overmining. Peach Creek Road–- County Route 12/02 comes directly to the proposed stockpile area. The County Road is a paved road, but only one lane wide traveling through populated areas. The distance to the preparation plant is 13.5 miles. The Boone West N2G Mine is projected as a two (2) section mine with each working section operated as a super section (two sets of mining equipment operating simultaneously and sharing a common dumping point on the same section, with each set being ventilated by a separate split on intake air). Each super section operates two (2) Continuous Miners, two (2) Roof Bolters, four (4) Shuttle Cars and one (1) scoop. Like the Lynn Branch No. 2 Deep mine operation, coal is extracted from the production face with the continuous miners and hauled to the mine conveyor in shuttle cars. At the conveyor belt, the coal is discharged from the shuttle cars onto a feeder breaker for transfer onto the conveyor. The conveyors carry the coal to the outside, where it is stockpiled. Coal is then transported via highway truck haulage to the Bandmill Preparation Plant where it is processed and loaded into CSX rail for transport to the consumer. The report includes an initial starting date in 2033 with a second production unit starting in 2038. The production units complete their assignment in calendar year 2042 and 2043, respectively. 13.4.1.5 Upper Cedar Grove #3 (Map 2) The Upper Cedar Grove 3 mine started operations in calendar year 2022. As noted above the mine produces metallurgical grade coal using one (1) active section with two (2) continuous miners, two (2) roof bolters, four (4) shuttle cars, one (1) belt feeder, and one (1) scoop per section. The working section is operated as a super section (two sets of mining equipment operating simultaneously and sharing a common dumping point on the same section, with each set being ventilated by a separate split on intake air). Coal is extracted from the production face with the continuous miners and hauled to the mine conveyor in shuttle cars. At the conveyor belt, the coal is discharged from the shuttle cars onto a feeder breaker for transfer onto the conveyor. The conveyors carry the coal to the outside. Coal is then transported via highway trucks for haulage to the Bandmill Preparation Plant where it is processed and loaded into CSX rail for transport to the consumer. Due to the favorable fluidity of this

Alpha Metallurgical Resources, Inc. Statement of Coal Resources and Reserves for the Aracoma Complex in Accordance with United States SEC Standards as of December 31, 2023 Central Appalachian Coal Basin West Virginia, USA MARSHALL MILLER & ASSOCIATES, INC. 49 coal, a key factor in determining the coking quality of coal, Alpha uses coal produced from this mine to blend coal from other Alpha mining operations which may show slightly less favorable coking characteristics. The mine portal area was constructed from a contour bench and is located along West Virginia Route 10, which has been upgraded as a divided 4-lane highway. Haul distance to the Bandmill Preparation Plant is 5.9 miles. 13.4.1.6 Alma Seam at Beech Branch (Map 4) This reserve area is a small block that can be accessed from an outcrop portal. The mining has been projected as a single super section production unit. Mining would begin in 2029 and the reserve would be depleted in 2033. The projected faceup from a contour bench is located along West Virginia Route 10, which has been upgraded as a divided 4-lane highway. Haul distance to the Bandmill Preparation Plant is 4.7 miles. 13.4.1.7 Lower Cedar Grove – Lauren Land (Map 3) This reserve area is a small block that would be accessed from an abandoned mine bench. The mine would face up in the Upper Split of the Lower Cedar Grove seam and then ramp down in the Lower Cedar Grove seam. This mine would support two continuous miner units beginning in the first quarter of 2039 followed by another unit in the fourth quarter of 2039. The mining boundary will be depleted with a continuous miner unit finishing in 2043 and the remaining unit finishing in 2044. Run-of-mine coal would be trucked via County Route 13 to the Bandmill Preparation Plant located 18.9 miles away. 13.4.1.8 Lower Cedar Grove #3 (Map 3) The Lower Cedar Grove (LCG) reserves are located along the western mine limit of the Upper Cedar Grove #3 Mine. The LCG will be accessed through the UCG #3 Mine and will be a continuation of the #3 Mine. The LCG will be more economical to extract where the UCG mid-seam parting increases to 4 feet. This mine would support one continuous miner units beginning in mid-2026. The LCG and UCG mining will be depleted with a continuous miner unit finishing in 2032. 14 Processing and Recovery Methods 14.1 Description or Flowsheet The Aracoma Division currently includes the Bandmill Preparation Plant in addition to the mines. The plant site includes raw coal storage, clean coal storage, a centrifugal dryer, a railroad loadout, and refuse disposal area. Feed rate capacity is 1200 raw tons per hour and produces a typical product Alpha Metallurgical Resources, Inc. Statement of Coal Resources and Reserves for the Aracoma Complex in Accordance with United States SEC Standards as of December 31, 2023 Central Appalachian Coal Basin West Virginia, USA MARSHALL MILLER & ASSOCIATES, INC. 50 containing 7.46% ash, 0.97% sulfur and 36.96% volatile matter. Primary separation equipment includes heavy media vessels, heavy media cyclones, spirals, and flotation cells, supported by the requisite screens, centrifuges, disk filters, plate presses, sumps, pumps, and distribution systems. For year-end 2023 the average utilization rate of the Bandmill Preparation Plant was 66.1% Additional plate presses have recently been installed to reduce the amount of slurry. Coarse and fine refuse are disposed of in an adjacent combined fill refuse area and impoundment. Processes and equipment are typical of those used in the coal industry and are in use in nearly all plants in the Central Appalachian Basin. 14.2 Requirements for Energy, Water, Material and Personnel Personnel have historically been sourced from the surrounding communities in Logan, Mingo, Wyoming, and Boone Counties, and have proven to be adequate in numbers to conduct processing operations at Aracoma. As mining is common in the surrounding areas, the workforce is generally familiar with mining practices, and many are experienced miners. Water is sourced locally from public water sources or rivers, and electricity is sourced from AEP. The service industry in the areas surrounding the mine complex has historically provided supplies, equipment repairs and fabrication, etc. 15 Infrastructure Alpha’s Bandmill preparation plant services customers with washed coal, which is transported via the CSX rail line at the plant’s loadout. Haul roads, primary roads, and conveyor belt systems account for transport from the various mine sites to the preparation plant. This practice will continue for future reserves. As an active operation, the necessary support infrastructure for Aracoma is in place. As new areas are developed, the infrastructure requirements will change. These changes have been considered in the LOM plans and financial model. The underground mining resource areas which are located above drainage will require an access road and mine access development along the outcrop. Typical mine facilities include a mine office, a change house, supply facilities, mine fan and a stacker conveyor if truck haulage is required. A Photo of the existing facilities is shown in Figures 15-1 and 15-2.

Alpha Metallurgical Resources, Inc. Statement of Coal Resources and Reserves for the Aracoma Complex in Accordance with United States SEC Standards as of December 31, 2023 Central Appalachian Coal Basin West Virginia, USA MARSHALL MILLER & ASSOCIATES, INC. 51 Figure 15-1: Aracoma Surface Facilities Figure 15-2: Bandmill Preparation Plant Alpha Metallurgical Resources, Inc. Statement of Coal Resources and Reserves for the Aracoma Complex in Accordance with United States SEC Standards as of December 31, 2023 Central Appalachian Coal Basin West Virginia, USA MARSHALL MILLER & ASSOCIATES, INC. 52 16 Market Studies 16.1 Market Description The quality characteristics for the subject coal resources and coal reserves have been reviewed in detail by MM&A. The drill hole data were utilized to develop average coal quality characteristics for the mining site. These average coal quality characteristics were then utilized as the basis for determining the various markets into which the saleable coal will likely be placed. Quality Specifications for the Aracoma High-Volatile B product is as shown in Table 16-1. Table 16-1: Dry Quality Specifications 2023 Ash (%) 7.46 Sulfur (%) 0.97 Volatile Matter (%) 36.96 The mine production primarily serves the high-volatile metallurgical markets with lesser by-product PCI and thermal coal. 16.2 Price Forecasts Company-wide pricing data as provided by Alpha from third-party sources is described in Table 16-2. Note that not all products reflected in Table 16-2 will apply to every business unit. The pricing data assumes a flat-line long-term realization of $140 per short ton port pricing, with an average $113.94 per ton netback pricing reflective of the high-volatile product currently sold at Aracoma. These estimates are based on long-term pricing published by third party sources and adjusted for quality and transportation. The netback pricing represents adjustments made to published benchmark pricing based on quality and transportation. A large majority of the coal sold by Alpha is shipped internationally as part of blended products from other business units within Alpha or sourced from other companies. These netback adjustments reflect these additional costs carried after the products leave the Aracoma business unit. Table 16-2: Price Forecasts Coal Quality Market Pricing Per Ton (1) (2) High-Vol. A $162 High- Vol. B $140 Mid-Vol. $163 Low-Vol. $163 Thermal $74 (1) Market pricing shown on U.S. East Coast basis. (2) Metallurgical and thermal pricing based on 10-year and 3-year average, respectively of forecasted pricing from pricing services.

Alpha Metallurgical Resources, Inc. Statement of Coal Resources and Reserves for the Aracoma Complex in Accordance with United States SEC Standards as of December 31, 2023 Central Appalachian Coal Basin West Virginia, USA MARSHALL MILLER & ASSOCIATES, INC. 53 16.3 Contract Requirements Some contracts are necessary for successful marketing of the coal. For Aracoma, since all mining, preparation and marketing is done in-house, the remaining contracts required are: > Transportation – Alpha contracts with the CSX Railroad to transport coal to market. > Sales – Sales contracts are a mix of spot and contract sales. With the volatility of the market, long- term contracts are not typically written. 17 Environmental Studies, Permitting and Plans, Negotiations or Agreements with Local Individuals 17.1 Results of Studies MM&A completed an environmental review in 2011 of the Massey properties acquired by Alpha, including those operations that were active at Aracoma at that time. The environmental review completed by MM&A included site inspections, reviews of historical records, database searches of State and Federal regulatory records and interviews to identify potential recognized environmental conditions (RECs) that may create environmental liability for the sites. While MM&A identified RECs during both studies, MM&A’s opinion was that those issues would not preclude the continued or future use of the properties as a coal mining/preparation venture. Based on this former ESA completed by MM&A, it is MM&A’s opinion that Aracoma has a generally typical coal industry record of compliance with applicable mining, water quality, and environmental laws. Estimated costs for mine closure, including water quality monitoring during site reclamation, are included in the financial models. 17.2 Requirements and Plans for Waste Disposal Disposal philosophy has been modified from previous years with the addition of filter press systems on the refuse fine material circuit. The filter press systems create a dewatered filter cake from the fine refuse disposal stream that can be combined with the coarse refuse material for disposal as a solid material that can be spread with heavy equipment such as dozers. The Tinsley Branch Refuse Impoundment remains useful as a facility that can accept slurry as an alternative if the filter press system is inoperable, or if circuit water needs to be stored such as when the plant is being idled. The Impoundment has nearly reached its capacity with the surrounding terrain elevation. However, an estimate of storage years is not provided since the facility is used as a backup facility to the actual processing methods. Alpha Metallurgical Resources, Inc. Statement of Coal Resources and Reserves for the Aracoma Complex in Accordance with United States SEC Standards as of December 31, 2023 Central Appalachian Coal Basin West Virginia, USA MARSHALL MILLER & ASSOCIATES, INC. 54 The Bandmill Hollow impoundment permit approvals remain in place but the permit has been modified to a combined fill. Capital expenditures to construct the refuse facility and its associated facilities have not been spent. Coarse refuse disposal has been ongoing upstream of the Tinsley Branch Impoundment for several years. The upstream area had been the site of surface mining activity which now provides fill areas for refuse placement. The estimated disposal volume from the Mine Timing models is approximately 20,000,000 cubic yards. Areas available for refuse disposal far exceed the projected volume. The table below outlines the existing permits that may be used for waste disposal. Table 17-1: Aracoma Refuse Disposal Summary Refuse Facility State SMCRA Permit Number MSHA ID Refuse Disposal Type Classified as a Dam Permit Status Current Planned Maximum Coarse Life (Approved + Planned) Current Planned Maximum Fines Life (Approved + Planned) Est. Coarse/ Combined Refuse Life (Yrs.) Est. Fine Slurry Refuse Life (Yrs.) Tinsley Branch Refuse Impoundment (Aracoma) O-5032-99 1211- WV04- 0527-01 Slurry Impoundment–- Downstream and Upstream Yes Active 0.5 2-5 7-8 3-5 Bandmill Hollow Impoundment (Aracoma) O-5002-10 1211- WV04- 05086-01 – Combined Refuse Fill Yes Not Started 7.5 0 7.5 0 Highland Surface permits S-5001-94 S-5030-96 1211-WV- 40528-01 – Combined Refuse Storage No Active 30+ 30+ Note: Estimates of storage years summarized in this table were provided by Alpha and reviewed by MM&A for reasonableness. 17.3 Permit Requirements and Status All mining operations are subject to federal and state laws and must obtain permits to operate mines, coal preparation and related facilities, haul roads, and other incidental surface disturbances necessary for mining to occur. Permits generally require that the permittee post a performance bond in an amount established by the regulatory program to provide assurance that any disturbance or liability created during mining operations is properly restored to an approved post-mining land use and that all regulations and requirements of the permits are fully satisfied before the bond is returned to the permittee. Significant penalties exist for any permittee who fails to meet the obligations of the permits including cessation of mining operations, which can lead to potential forfeiture of the bond. Any company, and its directors, owners and officers, which are subject to bond forfeiture can be denied future permits under the program.1 New permits or permit revisions will occasionally be necessary to facilitate the expansion or addition of new mining areas on the Property, such as amendments to existing permits and new permits for 1 Monitored under the Applicant Violator System (AVS) by the Federal Office of Surface Mining.

Alpha Metallurgical Resources, Inc. Statement of Coal Resources and Reserves for the Aracoma Complex in Accordance with United States SEC Standards as of December 31, 2023 Central Appalachian Coal Basin West Virginia, USA MARSHALL MILLER & ASSOCIATES, INC. 55 mining of reserve areas. Exploration permits are also required. Property under lease includes provisions for exploration among the terms of the lease. New or modified mining permits are subject to a public advertisement process and comment period, and the public is provided an opportunity to raise objections to any proposed mining operation. MM&A is not aware of any specific prohibition of mining on the subject property and given sufficient time and planning, Alpha should be able to secure new permits to maintain its planned mining operations within the context of current regulations. Necessary permits are in place to support current production on the Property, but future permits are required to maintain and expand production. Portions of the Property are located near local communities. Regulations prohibit mining activities within 300 feet of a residential dwelling, school, church, or similar structure unless written consent is first obtained from the owner of the structure. Where required, Alpha reports that such consents have been obtained where mining is proposed beyond the regulatory limits. Alpha has obtained all mining and discharge permits to operate its mines and processing, loadout or related facilities. MM&A is unaware of any obvious or current Alpha permitting issues that are expected to prevent the issuance of future permits. Aracoma, along with all coal producers, is subject to a level of uncertainty regarding future clean water permits due to United States Environmental Protection Agency (EPA) and United States Fish and Wildlife (USFW) involvement with state programs. The mining permits currently held by Aracoma are shown in Table 17-2. The information in the table below was taken from the West Virginia Department of Environmental Protection (WVDEP) website. Table 17-2: Aracoma Mining Permits Type Permit ID Permit Name Current Status Issued Date Expiration Date Acres NPDES No. SMCRA U500699 Alma Mine Active, Reclamation Only 09/10/1999 19/10/2024 48.02 WV1020111 SMCRA U500500 Bee Hollow Deep Mine Phase 1 Release 08/17/2000 08/17/2005 4.00 WV1020340 SMCRA U500308 Cedar Grove Active, Reclamation Only 08/21/2008 08/21/2028 18.51 WV1029771 SMCRA U503008 Cedar Grove No 2 Active, Reclamation Only 07/06/2024 07/06/2024 17.13 SMCRA U500499 Chilton No. 1/Hernshaw Mine Inactive 09/10/1999 09/10/2024 33.08 WV1020102 SMCRA U500319 Davy Branch Deep Mine Active, Moving Coal 11/13/2019 11/13/2024 18.33 WV1028553 SMCRA U500119, U505591 Lynn Branch Mine Active, Moving Coal 09/06/2019 09/06/2024 20.3/14.7 WV1011073, WV1028537 SMCRA U502190 Princess Aracoma Deep Mine Inactive, Reclaimed 07/29/1991 07/29/2026 110.04 SMCRA P071800 Bandmill Preparation Plant Active 1/18/91 1/25/2028 178.32 WV0093211 SMCRA U061600 Coalburg #3 Mine Active, Reclamation Only 08/21/1980 12/15/2027 31.11 WV0047074 SMCRA S501390 Camp Branch Surface Mine Active, Reclaimed 07/29/1991 07/29/2021 143.22 WV1010689 SMCRA U500400 Rich Creek Mine #1 Inactive 09/01/2000 09/01/2025 6.00 WV1020277 SMCRA U500421 Cedar Grove Mine No. 3 Active, Moving Coal 11/04/2021 11/04/2026 17.18 WV1031091 Note: Permit status and expiration dates are based on information obtained from regulatory agency website. Permits in reclamation status receive Renewal Waivers and may show expired dates. Alpha Metallurgical Resources, Inc. Statement of Coal Resources and Reserves for the Aracoma Complex in Accordance with United States SEC Standards as of December 31, 2023 Central Appalachian Coal Basin West Virginia, USA MARSHALL MILLER & ASSOCIATES, INC. 56 17.4 Local Plans, Negotiations or Agreements MM&A found no indication of agreements beyond the scope of Federal or State Regulations. 17.5 Mine Closure Plans Applicable regulations require that mines be properly closed, and reclamation commenced immediately upon abandonment. In general, site reclamation includes removal of structures, backfilling, regrading, and revegetation of disturbed areas. Sediment control is required during the establishment of vegetation, and bond release generally requires a minimum five-year period of site maintenance, water sampling, and sediment control following mine completion. This requirement is reduced to two years for certain operations involving re-mining. Reclamation of underground mines includes closure and sealing of mine openings such as portals and shafts in addition to the items listed above. Estimated costs for mine closure, including water quality monitoring during site reclamation, are included in the financial models. As with all mining companies, an accretion calculation is performed annually so the necessary Asset Retirement Obligations (ARO) can be shown as a Liability on the Balance Sheet. 17.6 Qualified Person’s Opinion The Aracoma complex is an operating facility; all necessary permits for current production have been obtained. MM&A knows of no reason that any permits revisions or new permits that may be required cannot be obtained. Estimated expenditures for site closure and reclamation are included in the financial model for this site. 18 Capital and Operating Costs 18.1 Capital Cost Estimate The production sequence selected for a property must consider the proximity of each reserve area to coal preparation plants, river docks and/or railroad loading points, along with suitability of production equipment to coal seam conditions. The in-place infrastructure was evaluated, and any future needs were planned to a level suitable for a Preliminary Feasibility Study and included in the Capital Forecast. Alpha provided MM&A with information related to the number of currently operating production units at Aracoma. MM&A’s capital schedules assume that major equipment rebuilds occur over the course of each machine’s remaining assumed operating life. Replacement equipment was scheduled based on MM&A’s experience and knowledge of mining equipment and industry standards with respect to the useful life of such equipment. As one mine is depleted, the equipment is moved to its replacement.

Alpha Metallurgical Resources, Inc. Statement of Coal Resources and Reserves for the Aracoma Complex in Accordance with United States SEC Standards as of December 31, 2023 Central Appalachian Coal Basin West Virginia, USA MARSHALL MILLER & ASSOCIATES, INC. 57 The capital expenditures tables detail costs for major equipment and infrastructure such as conveyor belt terminal groups. “Other” costs include expenditures for mine access and construction, mine extension capital and miscellaneous costs. A summary of the estimated capital for the consolidated Aracoma operations is provided in Figure 18-1 below. Total capital by mine is summarized in Table 18- 1. An additional $3.0 million of capital was added in 2024 for plant upgrades, resulting in a total estimated capital of $348.7 million for the Aracoma Complex. Figure 18-1: Projected Capital Expenditures – Consolidated Aracoma Operations Table 18-1: Summary of Capital Expenditures Schedule by Mine (000) Item Total 2023* 2024 2025 2026 2027 2028 2029 Lynn Branch N2G $152,280 $0 $8,038 $25,519 $14,568 $1,007 $20,921 $2,600 Davey Branch UCH $19,653 $0 $8,640 $4,209 $3,996 $2,117 $693 $0 Lauren Land - Hatfield UCH $67,331 $0 $0 $0 $0 $0 $7,143 $4,320 Lauren Land LCG $16,568 $0 $0 $0 $0 $0 $0 $0 Boone West N2G $46,238 $0 $0 $0 $0 $0 $0 $0 Rum Creek N2G $0 $0 $0 $0 $0 $0 $0 $0 Alma Beech Br $17,565 $0 $0 $0 $0 $0 $5,626 $4,320 UCG No. 3 $26,122 $0 $5,543 $4,320 $2,179 $1,860 $3,423 $4,320 Total $345,756 $0 $22,221 $34,048 $20,743 $4,984 $37,805 $15,560 Alpha Metallurgical Resources, Inc. Statement of Coal Resources and Reserves for the Aracoma Complex in Accordance with United States SEC Standards as of December 31, 2023 Central Appalachian Coal Basin West Virginia, USA MARSHALL MILLER & ASSOCIATES, INC. 58 Item 2030 2031 2032 2033 2034 2035 2036 2037 Lynn Branch N2G $4,038 $23,559 $13,460 $5,008 $4,320 $693 $6,320 $8,013 Davey Branch UCH $0 $0 $0 $0 $0 $0 $0 $0 Lauren Land - Hatfield UCH $7,275 $1,000 $8,659 $8,200 $4,320 $6,927 $1,000 $9,863 Lauren Land LCG $0 $0 $0 $0 $0 $0 $0 $0 Boone West N2G $0 $0 $0 $10,681 $7,200 $1,385 $5,198 $0 Rum Creek N2G $0 $0 $0 $0 $0 $0 $0 $0 Alma Beech Br $1,385 $5,890 $344 $0 $0 $0 $0 $0 UCG No. 3 $2,179 $1,860 $438 $0 $0 $0 $0 $0 Total $14,877 $32,309 $22,901 $23,889 $15,840 $9,005 $12,518 $17,876 Item 2038 2039 2040 2041 2042 2043 2044 2045 Lynn Branch N2G $8,357 $5,861 $0 $0 $0 $0 $0 $0 Davey Branch UCH $0 $0 $0 $0 $0 $0 $0 $0 Lauren Land - Hatfield UCH $5,983 $0 $2,640 $0 $0 $0 $0 $0 Lauren Land LCG $0 $6,042 $663 $4,320 $5,543 $0 $0 $0 Boone West N2G $15,567 $0 $2,048 $4,158 $0 $0 $0 $0 Rum Creek N2G $0 $0 $0 $0 $0 $0 $0 $0 Alma Beech Br $0 $0 $0 $0 $0 $0 $0 $0 UCG No. 3 $0 $0 $0 $0 $0 $0 $0 $0 Total $29,907 $11,903 $5,351 $8,478 $5,543 $0 $0 $0 Note: No capital was projected for 4th quarter 2023. 18.2 Operating Cost Estimate Alpha provided historical costs and budgeted projections of operating costs for its active mines (Cedar Grove #2, Lynn Branch No. 2 and Davy Branch Deep Mine) for MM&A’s review. Cost data for the new Cedar Grove #3 mine was not available at the time of this TRS. MM&A used the historical cost information as a reference and developed a personnel schedule for the mine. Hourly labor rates and salaries were based upon information contained in Alpha’s financial summaries. Fringe benefit costs were developed for vacation and holidays, federal and state unemployment insurance, retirement, workers’ compensation and pneumoconiosis, casualty and life insurance, healthcare and bonuses. A cost factor for mine supplies was developed that relates expenditures to mine advance rates for roof control costs and other mine supply costs based on the historical cost data provided by Alpha. Other factors were developed for maintenance and repair costs, rentals, mine power, outside services, coal preparation plant processing, refuse handling, coal loading, property taxes, and insurance and bonding and other direct mining costs. Appropriate royalty rates were assigned for production from leased coal lands and sales taxes were calculated for state severance taxes, the federal black lung excise tax, and federal and state reclamation fees. Statutory sales-related costs are summarized in Table 18-2.

Alpha Metallurgical Resources, Inc. Statement of Coal Resources and Reserves for the Aracoma Complex in Accordance with United States SEC Standards as of December 31, 2023 Central Appalachian Coal Basin West Virginia, USA MARSHALL MILLER & ASSOCIATES, INC. 59 Table 18-2: Estimated Coal Production Taxes and Sales Costs Description of Tax or Sales Cost Basis of Assessment Cost Federal Black Lung Excise Tax–- Underground Per Ton $1.10 Federal Reclamation Fees – Underground Per Ton $0.12 West Virginia Reclamation Tax–- Underground Per Ton $0.279 West Virginia Severance Tax Percentage of Revenue 1 to 5% Royalties–- Underground Percentage of Revenue 6.0% Notes: 1. Federal black lung excise tax is paid only on coal sold domestically. MM&A assumed 50% of sales will be into domestic market. A summary of the projected operating costs for the consolidated Aracoma operations is provided in Figure 18-2. Figure 18-2: Aracoma Operating Costs 19 Economic Analysis 19.1 Economic Evaluation 19.1.1 Introduction The pre-feasibility financial model prepared for this TRS was developed to test the economic viability of each coal resource area. The results of this financial model are not intended to represent a bankable feasibility study, required for financing of any current or future mining operations contemplated for the Alpha Metallurgical Resources, Inc. Statement of Coal Resources and Reserves for the Aracoma Complex in Accordance with United States SEC Standards as of December 31, 2023 Central Appalachian Coal Basin West Virginia, USA MARSHALL MILLER & ASSOCIATES, INC. 60 Alpha properties, but are intended to establish the economic viability of the estimated coal reserves. Cash flows are simulated on an annual basis based on projected production from the coal reserves. The discounted cash flow analysis presented herein is based on an effective date of January 1, 2024. On an un-levered basis, the NPV of the project cash flow after taxes represents the Enterprise Value of the project. The project cash flow, excluding debt service, is calculated by subtracting direct and indirect operating expenses and capital expenditures from revenue. Direct costs include labor, operating supplies, maintenance and repairs, facilities costs for materials handling, coal preparation, refuse disposal, coal loading, reclamation and general and administrative costs. Indirect costs include statutory and legally agreed upon fees related to direct extraction of the mineral. The indirect costs are the Federal black lung tax, Federal and State reclamation taxes, property taxes, coal production royalties, and income taxes. The Alpha mines’ historical costs provided a useful reference for MM&A’s cost estimates. The operations are projected on a calendar year basis. MM&A’s projection of annual sales tonnage is summarized in the chart below. While all Alpha coal resource properties deemed by MM&A to have potential for classification as coal reserves were evaluated as part of the economic model, some of those resource areas were determined to be uneconomical in the current market and were therefore excluded from coal reserves as discussed below. Figure 19-1: Projection of Sales Tons

Alpha Metallurgical Resources, Inc. Statement of Coal Resources and Reserves for the Aracoma Complex in Accordance with United States SEC Standards as of December 31, 2023 Central Appalachian Coal Basin West Virginia, USA MARSHALL MILLER & ASSOCIATES, INC. 61 Sales revenue is based on the coal price information provided to MM&A by Alpha. Only the revenue from Alpha’s captive mining operations is included in the financial model used for this TRS. The P&L projections of the individual mines of Alpha’s Aracoma operations are then consolidated into a P&L and cash flow schedule for further testing of the economics. Projected debt service is excluded from the P&L and cash flow model in order to determine Enterprise Value of the aggregated entity. The financial model expresses coal sales prices, operating costs, and capital expenditures in current day dollars without adjustment for inflation. Capital expenditures and reclamation costs are included based on engineering estimates for each mine by year. MM&A also included an estimate of administrative costs in the financial projections. Alpha will pay royalties for the various current and projected operations. The royalty rates vary by location as provided by Alpha. The royalty rates were assumed to be 6.0% of the sales revenue. The projection model also includes consolidated income tax calculations at Alpha’s Aracoma Division level, incorporating statutory depletion calculations, as well as state income taxes, and a federal tax rate of 21%. To the extent the Alpha mines generate net operating losses for tax purposes, the losses are carried over to offset future taxable income from Alpha mines. The terms “cash flows” and “project cash flows” used in this report refer to after-tax cash flows. Alpha’s projected consolidated annual revenue for the Aracoma operations is shown in the chart below: Figure 19-2: Consolidated Annual Revenue Alpha Metallurgical Resources, Inc. Statement of Coal Resources and Reserves for the Aracoma Complex in Accordance with United States SEC Standards as of December 31, 2023 Central Appalachian Coal Basin West Virginia, USA MARSHALL MILLER & ASSOCIATES, INC. 62 Projected consolidated revenue, cash costs, and EBITDA for the Aracoma operations are expressed in dollars per ton in the graph below. Figure 19-3: Revenue, Cash Costs, and EBITDA The above chart shows an assumed revenue of $114 per ton, cash costs of $76 to $94 per ton and EBITDA of $20 to $38 per ton. Positive EBITDA per ton averages $28.64 per ton over the life of the operations. Table 19-1 shows LOM tonnage, P&L, and EBITDA for each Alpha mine at Aracoma. Table 19-1: Life-of-Mine Tonnage, P&L before Tax, and EBITDA LOM Tonnage LOM Pre-Tax P&L P&L Per Ton LOM EBITDA EBITDA Per Ton Lynn Branch N2G 15,477 $147,091 $9.50 $354,560 $22.91 Davey Branch UCH 4,128 $124,182 $30.08 $165,738 $40.15 Lauren Land LCG 2,943 $38,244 $12.99 $69,091 $23.48 Lauren Land - Hatfield UCH 7,768 $210,828 $27.14 $293,282 $37.75 UCG No. 3 5,106 $142,359 $27.88 $189,974 $37.20 Alma Beech Br 1,429 $21,681 $15.17 $37,959 $26.55 Boone West N2G 5,258 $20,473 $3.89 $95,359 $18.14 Grand Total 42,109 $704,857 $16.74 $1,205,962 $28.64 Note: (1) The financial model contains 0.23 million tons of inferred coal that has been excluded from reserves. LOM tonnage evaluated in the financial model includes 4th quarter 2023 production (599,742 clean tons), which was subtracted from coal reserves in order to make the effective date of the reserves December 31, 2023.

Alpha Metallurgical Resources, Inc. Statement of Coal Resources and Reserves for the Aracoma Complex in Accordance with United States SEC Standards as of December 31, 2023 Central Appalachian Coal Basin West Virginia, USA MARSHALL MILLER & ASSOCIATES, INC. 63 As shown in Table 19-1, all of the mines analyzed show positive EBITDA over the LOM. Overall, the Alpha consolidated Aracoma operations show positive LOM P&L and EBITDA of $704.9 million and $1.2 billion, respectively. A breakdown of projected EBITDA for the consolidated Aracoma operations is shown in the chart below: Figure 19-4: Annual EBITDA 19.1.2 Cash Flow Summary Alpha’s consolidated Aracoma cash flow summary in constant dollars, excluding debt service, is shown in Table 19-2 below. Table 19-2: Project Cash Flow Summary (000) YE 12/31 YE 12/31 YE 12/31 YE 12/31 YE 12/31 YE 12/31 Total 2023 2024 2025 2026 2027 2028 Production & Sales tons 42,109 665 2,687 2,487 2,433 2,263 2,231 Total Revenue $4,797,877 $75,733 $306,110 $283,322 $277,178 $257,812 $254,151 EBITDA $1,205,962 $24,321 $103,216 $88,643 $86,497 $70,723 $65,467 Net Income $569,590 $4,780 $63,754 $52,083 $51,609 $40,163 $32,871 Net Cash Provided by Operating Activities $1,070,695 $18,804 $71,698 $79,011 $76,202 $66,253 $60,039 Purchases of Property, Plant, and Equipment ($348,744) $0 ($25,208) ($34,048) ($20,743) ($4,984) ($37,805) Net Cash Flow $721,951 $18,804 $46,491 $44,963 $55,459 $61,270 $22,234 Alpha Metallurgical Resources, Inc. Statement of Coal Resources and Reserves for the Aracoma Complex in Accordance with United States SEC Standards as of December 31, 2023 Central Appalachian Coal Basin West Virginia, USA MARSHALL MILLER & ASSOCIATES, INC. 64 YE 12/31 YE 12/31 YE 12/31 YE 12/31 YE 12/31 YE 12/31 YE 12/31 2029 2030 2031 2032 2033 2034 2035 Production & Sales tons 2,271 2,270 2,317 2,295 2,085 2,126 2,082 Total Revenue $258,761 $258,695 $263,957 $261,478 $237,585 $242,275 $237,239 EBITDA $64,568 $63,924 $68,765 $66,464 $55,011 $57,332 $46,720 Net Income $31,473 $29,672 $31,700 $31,292 $22,033 $24,785 $19,250 Net Cash Provided by Operating Activities $56,883 $58,001 $61,325 $60,688 $53,366 $52,769 $46,405 Purchases of Property, Plant, and Equipment ($15,560) ($14,877) ($32,309) ($22,901) ($23,889) ($15,840) ($9,005) Net Cash Flow $41,323 $43,124 $29,017 $37,786 $29,477 $36,929 $37,401 YE 12/31 YE 12/31 YE 12/31 YE 12/31 YE 12/31 YE 12/31 YE 12/31 2036 2037 2038 2039 2040 2041 2042 Production & Sales tons 2,187 2,091 1,957 2,049 2,177 1,568 1,248 Total Revenue $249,209 $238,203 $222,971 $233,470 $248,071 $178,607 $142,141 EBITDA $57,320 $48,447 $50,158 $53,931 $64,861 $43,196 $25,485 Net Income $26,471 $17,834 $18,687 $21,080 $38,326 $21,137 $9,691 Net Cash Provided by Operating Activities $51,256 $46,987 $46,999 $51,148 $55,264 $45,612 $28,932 Purchases of Property, Plant, and Equipment ($12,518) ($17,876) ($29,907) ($11,903) ($5,351) ($8,478) ($5,543) Net Cash Flow $38,738 $29,112 $17,092 $39,245 $49,913 $37,134 $23,389 YE 12/31 YE 12/31 YE 12/31 YE 12/31 YE 12/31 YE 12/31 YE 12/31 2043 2044 2045 2046 2047 2048 2049 Production & Sales tons 551 71 0 0 0 0 0 Total Revenue $62,821 $8,092 $0 $0 $0 $0 $0 EBITDA $5,955 ($2,197) ($1,576) ($691) ($347) ($179) ($51) Net Income ($5,053) ($8,363) ($3,153) ($1,382) ($694) ($357) ($102) Net Cash Provided by Operating Activities $13,883 ($9,441) ($11,994) ($4,736) ($2,331) ($1,681) ($649) Purchases of Property, Plant, and Equipment $0 $0 $0 $0 $0 $0 $0 Net Cash Flow $13,883 ($9,441) ($11,994) ($4,736) ($2,331) ($1,681) ($649) Note: (1) The financial model contains 0.23 million tons of inferred coal that has been excluded from reserves. LOM tonnage evaluated in the financial model includes 4th quarter 2023 production (599,742 clean tons) which was subtracted from coal reserves in order to make the effective date of the reserves December 31, 2023. (2) Results shown for 2023 represent 4th quarter only. Consolidated cash flows are driven by annual sales tonnage, which peaks at 2.7 million tons in 2024. Between years 2025 and 2040, sales ranges from 2.0 million to 2.4 million tons and between years 2041-2044, sales range from 0.1 million tons to 1.6 million tons. Projected consolidated revenue peaks at $306.1 million in 2024 and totals $4.8 billion for the project’s life. Consolidated cash flow from operations is positive throughout the projected operating period, with the exception of post-production years, due to end-of-mine reclamation spending. Consolidated cash flow from operations peaks at $79.0 million in 2025 and totals $1.1 billion over the project life. Capital expenditures total $122.8 million during the first five years and $348.7 million over the project’s life. Consolidated Aracoma net cash flow after tax, but before debt service, is shown by year in the chart below:

Alpha Metallurgical Resources, Inc. Statement of Coal Resources and Reserves for the Aracoma Complex in Accordance with United States SEC Standards as of December 31, 2023 Central Appalachian Coal Basin West Virginia, USA MARSHALL MILLER & ASSOCIATES, INC. 65 Figure 19-5: Net Cash Flow after Tax (Before Debt Service) LOM Net cash flow is positive for this project. The cash flows after year 2044 are generally related to end of mine reclamation expenditures, which are accrued over the life of the mines. 19.1.3 Discounted Cash Flow Analysis Cash flow after tax, but before debt service, generated over the life of the project was discounted to NPV at a 16.57% discount rate, which represents MM&A’s estimate of the constant dollar, risk adjusted WACC for likely market participants if the subject reserves were offered for sale. On an un-levered basis, the NPV of the project cash flows represents the Enterprise Value of the project and amounts to $278.7 million. Alpha is an active producer, and the financial model shows positive net cash flow for each year of the operating life of the Aracoma reserves. The pre-feasibility financial model prepared for the TRS was developed to test the economic viability of each coal resource area. The NPV estimate was made for the purpose of confirming the economics for classification of coal reserves and not for purposes of valuing Alpha or its Aracoma assets. Mine plans were not optimized, and actual results of the operations may be different, but in all cases, the mine production plan assumes the properties are under competent management. 19.1.4 Sensitivity Analysis Sensitivity of the NPV results to changes in the key drivers is presented in the chart below. The sensitivity study shows the NPV at the 16.57% discount rate when Base Case sales prices, operating Alpha Metallurgical Resources, Inc. Statement of Coal Resources and Reserves for the Aracoma Complex in Accordance with United States SEC Standards as of December 31, 2023 Central Appalachian Coal Basin West Virginia, USA MARSHALL MILLER & ASSOCIATES, INC. 66 costs, capital costs, and discount rate are increased and decreased in increments of 5% within a +/- 15% range. Figure 19-6: Sensitivity of NPV As shown, NPV is quite sensitive to changes in sales price and operating cost estimates, and slightly sensitive to changes in capital cost estimates. 20 Adjacent Properties 20.1 Information Used No Proprietary information associated with neighboring properties was used as part of this study. 21 Other Relevant Data and Information MM&A performed a previous evaluation of all the Property in year 2022 for reserves effective as of December 31, 2022, for Alpha based on SEC S-K 1300 regulations. MM&A utilized this former evaluation as the basis for the December 31, 2023 TRS.

Alpha Metallurgical Resources, Inc. Statement of Coal Resources and Reserves for the Aracoma Complex in Accordance with United States SEC Standards as of December 31, 2023 Central Appalachian Coal Basin West Virginia, USA MARSHALL MILLER & ASSOCIATES, INC. 67 22 Interpretation and Conclusions 22.1 Conclusion Sufficient data has been obtained through various exploration and sampling programs and mining operations to support the geological interpretations of seam structure and thickness for coal horizons situated on the Aracoma Property. The data is of sufficient quantity and reliability to reasonably support the coal resource and coal reserve estimates in this TRS. The geological data and preliminary feasibility study, which consider mining plans, revenue, and operating and capital cost estimates are sufficient to support the classification of coal reserves provided herein. This geologic evaluation conducted in conjunction with the preliminary feasibility study is sufficient to conclude that the 41.28 Mt of marketable coal reserves identified on the Property are economically mineable under reasonable expectations of market prices for metallurgical coal products, estimated operation costs, and capital expenditures. 22.2 Risk Factors Risks have been identified for operational, technical and administrative subjects addressed in the Pre- Feasibility Study. A risk matrix has been constructed to present the risk levels for all the risk factors identified and quantified in the risk assessment process. The risk matrix and risk assessment process are modelled to that presented in the Australian and New Zealand Standard on Risk Management (AS/NZS 4360). The purpose of the characterization of the project risk components is to inform the project stakeholders of key aspects of the Alpha projects that can be impacted by events whose consequences can affect the success of the venture. The significance of an impacted aspect of the operation is directly related to both the probability of occurrence and the severity of the consequences. The initial risk for a risk factor is herein defined as the risk level after the potential impact of the risk factor is addressed by competent and prudent management utilizing control measures readily available. Residual risk for a risk factor is herein defined as the risk level following application of special mitigation measures if management determines that the initial risk level is unacceptable. Initial risk and residual risk can be quantified numerically, derived by the product of values assigned to probability and consequence ranging from very low risk to very high risk. The probability and consequence parameters are subjective numerical estimates made by practiced mine engineers and managers. Both are assigned values from 1 to 5 for which the value 1 represents the lowest probability and least consequence, and the value 5 represents the highest probability and greatest consequence. The products that define the Risk Level are classified from very low to very high. Alpha Metallurgical Resources, Inc. Statement of Coal Resources and Reserves for the Aracoma Complex in Accordance with United States SEC Standards as of December 31, 2023 Central Appalachian Coal Basin West Virginia, USA MARSHALL MILLER & ASSOCIATES, INC. 68 Risk Level Table (R = P x C) Risk Level (R) Very Low (1 to 2) Low (3 to 5) Moderate (6 to 11) High (12 to 19) Very High (20 to 25) Risk aspects identified and evaluated during this assignment total 13. No residual risks are rated Very High. Three (3) residual risks are rated High. Six (6) of the risk aspects could be associated with Moderate residual risk. Four (4) of the risk aspects were attributed Low or Very Low residual risks. 22.2.1 Governing Assumptions The listing of the aspects is not presumed to be exhaustive. Instead that listing is presented based on the experiences of the contributors to the TRS. 1. The probability and consequence ratings are subjectively assigned, and it is assumed that this subjectivity reasonably reflects the condition of the active and projected mine operations. 2. The Control Measures shown in the matrices presented in this chapter are not exhaustive. They represent a condensed collection of activities that the author of the risk assessment section has observed to be effective in coal mining scenarios. 3. Mitigation Measures listed for each risk factor of the operation are not exhaustive. The measures listed, however, have been observed by the author to be effective. 4. The monetary values used in ranking the consequences are generally accepted quantities for the coal mining industry. 22.2.2 Limitations The risk assessment proposed in this report is subject to the limitations of the information currently collected, tested, and interpreted at the time of the writing of the report. 22.2.3 Methodology The numerical quantities (i.e., risk levels) attributable to either “initial” or “residual” risks are derived by the product of values assigned to probability and consequence ranging from very low risk to very high risk. R = P x C Where: R = Risk Level P = Probability of Occurrence C = Consequence of Occurrence

Alpha Metallurgical Resources, Inc. Statement of Coal Resources and Reserves for the Aracoma Complex in Accordance with United States SEC Standards as of December 31, 2023 Central Appalachian Coal Basin West Virginia, USA MARSHALL MILLER & ASSOCIATES, INC. 69 The Probability (P) and Consequence (C) parameters recited in the formula are subjective numerical estimates made by practiced mine engineers and managers. Both P and C are assigned integer values ranging from 1 to 5 for which the value 1 represents the lowest probability and least consequence, and the value 5 represents the highest probability and greatest consequence. The products (R = P x C) which define the Risk Level, are thereafter classified from very low to very high. Risk Level Table Risk Level (R) Very Low (1 to 2) Low (3 to 5) Moderate (6 to 11) High (12 to 19) Very High (20 to 25) Very high initial risks are considered to be unacceptable and require corrective action well in advance of project development. In short, measures must be applied to reduce very high initial risks to a tolerable level. As shown and discussed above, after taking into account the operational, technical, and administrative actions that have been applied or are available for action when required, the residual risk can be determined. The residual risk provides a basis for the management team to determine if the residual risk level is acceptable or tolerable. If the risk level is determined to be unacceptable, further actions should be considered to reduce the residual risk to acceptable or tolerable levels to provide justification for continuation of the proposed operation. 22.2.4 Development of the Risk Matrix Risks have been identified for the technical, operational, and administrative subjects addressed in the TRS. The risk matrix and risk assessment process are modelled to that presented in the Australian and New Zealand Standard on Risk Management (AS/NZS 4360). Alpha Metallurgical Resources, Inc. Statement of Coal Resources and Reserves for the Aracoma Complex in Accordance with United States SEC Standards as of December 31, 2023 Central Appalachian Coal Basin West Virginia, USA MARSHALL MILLER & ASSOCIATES, INC. 70 22.2.4.1 Probability Level Table Table 22-1: Probability Level Table Category Probability Level (P) 1 Remote Not likely to occur except in exceptional circumstances. <10% 2 Unlikely Not likely to occur; small in degree. 10 - 30% 3 Possible Capable of occurring. 30 - 60% 4 Likely High chance of occurring in most circumstances. 60 - 90% 5 Almost Certain Event is expected under most circumstances; impossible to avoid. >90% The lowest rated probability of occurrence is assigned the value of 1 and described as remote, with a likelihood of occurrence of less than 10 percent. Increasing values are assigned to each higher probability of occurrence, culminating with the value of 5 assigned to incidents considered to be almost certain to occur. 22.2.4.2 Consequence Level Table Table 22-2 lists the consequence levels.

Alpha Metallurgical Resources, Inc. Statement of Coal Resources and Reserves for the Aracoma Complex in Accordance with United States SEC Standards as of December 31, 2023 Central Appalachian Coal Basin West Virginia, USA MARSHALL MILLER & ASSOCIATES, INC. 71 Table 22-2: Consequence Level Table Correlation of Events in Key Elements of the Project Program to Event Severity Category Category Severity of the Event Financial Impact of the Event Unplanned Loss of Production (Impact on Commercial Operations) Events Impacting on the Environment Events Affecting the Program’s Social and Community Relations Resultant Regulatory / Sovereign Risk Events Affecting Occupational Health & Safety 1 Insignificant < USD $0.5 million ≤ 12 hours Insignificant loss of habitat; no irreversible effects on water, soil and the environment. Occasional nuisance impact on travel. Event recurrence avoided by corrective action through established procedures (Engineering, guarding, training). 2 Minor USD $0.5 million to $2.0 million ≤ 1 day No significant change to species populations; short- term reversible perturbation to ecosystem function. Persistent nuisance impact on travel. Transient adverse media coverage. First aid – lost time. Event recurrence avoided by corrective action thought established procedures. 3 Moderate USD $2.0 million to $10.0 million ≤ 1 week Appreciable change to species population; medium-term (≤10 years) detriment to ecosystem function. Measurable impact on travel and water/air quality. Significant adverse media coverage / transient public outrage. Uncertainty securing or retaining essential approval / license. Medical Treatment – permanent incapacitation Avoiding event recurrence requires modification to established corrective action procedures. Change to regulations (tax; bonds; standards). 4 Major USD $10.0 million to $50.0 million 1 to 2 weeks Change to species population threatening viability; long-term (>10 years) detriment to ecosystem function. Long-term, serious impact on travel and use of water resources; degradation of air quality; sustained and effective public opposition. Suspension / long-delay in securing essential approval / license. Fatality. Avoiding event recurrence requires modification to established corrective action procedures and staff retraining. Change to laws (tax; bonds; standards). 5 Critical >USD $50.0 million >1 month Species extinction; irreversible damage to ecosystem function. Loss of social license. Withdraw / failure to secure essential approval / license. Multiple fatalities. Avoiding event recurrence requires major overhaul of policies and procedures. Alpha Metallurgical Resources, Inc. Statement of Coal Resources and Reserves for the Aracoma Complex in Accordance with United States SEC Standards as of December 31, 2023 Central Appalachian Coal Basin West Virginia, USA MARSHALL MILLER & ASSOCIATES, INC. 72 The lowest rated consequence is assigned the value of 1 and is described as Insignificant Consequence with parameters that include non-reportable safety incidents with zero days lost accidents, no environmental damage, loss of production or systems for less than 12 hours and cost of less than USD $0.5 million. Increasing values are assigned to each higher consequence, culminating with the value of 5 assigned to critical consequences, the parameters of which include multiple-fatality accidents, major environmental damage, and loss of production or systems for longer than one month and cost of greater than USD $50.0 million. Composite Risk Matrix R = P x C and Color-Code Convention The risk level, defined as the product of probability of occurrence and consequence, ranges in value from 1 (lowest possible risk) to 25 (maximum risk level). The values are color-coded to facilitate identification of the highest risk aspects. Table 22-3: Risk Matrix P x C = R Consequence (C) Insignificant Minor Moderate Major Critical 1 2 3 4 5 P ro b ab ili ty L ev el ( P ) Remote 1 1 2 3 4 5 Unlikely 2 2 4 6 8 10 Possible 3 3 6 9 12 15 Likely 4 4 8 12 16 20 Almost Certain 5 5 10 15 20 25 22.2.5 Categorization of Risk Levels and Color Code Convention Very high risks are considered to be unacceptable and require corrective action. Risk reduction measures must be applied to reduce very high risks to a tolerable level. 22.2.6 Description of the Coal Property The Aracoma Complex (Aracoma) is located in Logan, Mingo, Boone and McDowell Counties, West Virginia and is an active operation with three underground mines. The active underground operations within the Aracoma Mine Complex (Lynn Branch #2, Davy Branch Deep Mine, and Cedar Grove #3) utilize continuous mining production sections. The Cedar Grove No. 2 Deep Mine in the Upper Cedar Grove seam was idled during 2023. This method provides continuity, preserving skilled work groups

Alpha Metallurgical Resources, Inc. Statement of Coal Resources and Reserves for the Aracoma Complex in Accordance with United States SEC Standards as of December 31, 2023 Central Appalachian Coal Basin West Virginia, USA MARSHALL MILLER & ASSOCIATES, INC. 73 and enabling effective utilization of existing production equipment. The active and projected mines are located above and below drainage and as such are accessed via a combination of drifts and box cuts. 22.2.7 Summary of Residual Risk Ratings Each risk factor is numbered, and a risk level for each is determined by multiplying the assigned probability by the assigned consequence. The risk levels are plotted on a risk matrix to provide a composite view of the Alpha risk profile. The average risk level is 6.6, which is defined as Moderate. Table 22-4: Risk Assessment Matrix C o n se q u en ce Critical >$50 MM Major $10-50MM 9 6 Moderate $2-10 MM 1, 12 2, 4, 8, 14 3 Minor $0.5-$2 MM 13 5, 7, 10 Low <$0.5 MM 11 <10% 10-30% 30-60% 60-90% >90% Remote Unlikely Possible Likely Almost Certain 22.2.8 Risk Factors A high-level approach is utilized to characterize risk factors that are generally similar across a number of the active and proposed mining operations. Risk factors that are unique to a specific operation or are particularly noteworthy are addressed individually. 22.2.8.1 Geological and Coal Resource Coal mining is accompanied by risk that, despite exploration efforts, mining areas will be encountered where geological conditions render extraction of the resource to be uneconomic, or that coal quality characteristics disqualify the product for sale into target markets. Offsetting the geological and coal resource risk are the size of the controlled property which allows flexibility in the selection of mine areas away from areas where coal quality and mineability are less favorable. In addition, many of the underground mines are designed to operate with multiple production sections each, which lessens the immediate impact when one section encounters difficulties. The large reserve areas also provide a mitigation strategy of varying the timing of Alpha Metallurgical Resources, Inc. Statement of Coal Resources and Reserves for the Aracoma Complex in Accordance with United States SEC Standards as of December 31, 2023 Central Appalachian Coal Basin West Virginia, USA MARSHALL MILLER & ASSOCIATES, INC. 74 development of mines to offset expected or encountered adverse conditions, thereby maintaining consistent production and quality. This flexibility requires additional extension or development cost but increases performance consistency. The larger reserve areas will be developed with multiple production sections and the small, replacement production reserve areas provide ready access to alternative locations if geological and coal resource characteristics require abandonment of an active production area. Table 22-5: Geological and Coal Resource Risk Assessment (Risks 1 and 2) Aspect Impact Control Measures Initial Risk Level Mitigation Measures Residual Risk Level P C R P C R Recoverable coal tons recognized to be significantly less than previously estimated. Reserve base is adequate to serve market commitments and respond to opportunities for many years. Local adverse conditions may increase frequency and cost of production unit relocations. Previous and ongoing exploration and extensive regional mining history provide a high level of confidence of coal seam correlation, continuity of the coal seams, and coal resource tons. 1 4 4 Optimize mine plan to increase resource recovery; develop mine plan to provide readily available alternate mining locations to sustain expected production level. 1 3 3 Coal quality locally proves to be lower than initially projected. If uncontrolled, production and sale of coal that is out of specification can result in rejection of deliveries, cancellation of coal sales agreements and damage to reputation. Exploration and vast experience and history in local coal seams provide confidence in coal quality; limited excursions can be managed with careful product segregation and blending. 2 5 10 Develop mine plan to provide readily available alternate mining locations to sustain expected production level; modify coal sales agreements to reflect coal quality. 2 3 6 22.2.8.2 Environmental Water quality and other permit requirements are subject to modification and such changes could have a material impact on the capability of the operator to meet modified standards or to receive new permits and modifications to existing permits. Permit protests may result in delays or denials to permit applications. Environmental standards and permit requirements have evolved significantly over the past 50 years and to-date, mining operators and regulatory bodies have been able to adapt successfully to evolving environmental requirements.

Alpha Metallurgical Resources, Inc. Statement of Coal Resources and Reserves for the Aracoma Complex in Accordance with United States SEC Standards as of December 31, 2023 Central Appalachian Coal Basin West Virginia, USA MARSHALL MILLER & ASSOCIATES, INC. 75 Table 22-6: Environmental (Risks 3 and 4) Aspect Impact Control Measures Initial Risk Level Mitigation Measures Residual Risk Level P C R P C R Environmental performance standards are modified in the future. Delays in receiving new permits and modifications to existing permits; cost of testing and treatment of water and soils Work with regulatory agencies to understand and influence final standards; implement testing, treatment and other actions to comply with new standards. 3 4 12 Modify mining and reclamation plans to improve compliance with new standards while reducing cost of compliance. 3 3 9 New permits and permit modifications are increasingly delayed or denied. Interruption of production and delayed implementation of replacement production from new mines. Comply quickly with testing, treatment and other actions required; continue excellent compliance performance within existing permits. 2 4 8 Establish and maintain close and constructive working relationships with regulatory agencies, local communities and community action groups. 2 3 6 22.2.8.3 Regulatory Requirements Federal and state health and safety regulatory agencies occasionally amend mine laws and regulations. The impact is industry wide. Mining operators and regulatory agencies have been able to adapt successfully to evolving health and safety requirements. Table 22-7: Regulatory Requirements (Risk 5) Aspect Impact Control Measures Initial Risk Level Mitigation Measures Residual Risk Level P C R P C R Federal and state mine safety and health regulatory agencies amend mine laws and regulations. Cost of training, materials, supplies and equipment; modification of mine examination and production procedures; modification of mining plans. Participate in hearings and workshops when possible to facilitate understanding and implementation; work cooperatively with agencies and employees to facilitate implementation of new laws and regulations. 4 3 12 Familiarity and experience with new laws and regulations results in reduced impact to operations and productivity and improved supplies and equipment options. 4 2 8 22.2.8.4 Market and Transportation Most of the current and future production is expected to be directed to domestic and international metallurgical markets. Historically the metallurgical markets have been cyclical and highly volatile. Alpha Metallurgical Resources, Inc. Statement of Coal Resources and Reserves for the Aracoma Complex in Accordance with United States SEC Standards as of December 31, 2023 Central Appalachian Coal Basin West Virginia, USA MARSHALL MILLER & ASSOCIATES, INC. 76 Table 22-8: Market and Transportation (Risk 6) Aspect Impact Control Measures Initial Risk Level Mitigation Measures Residual Risk Level P C R P C R Volatile coal prices drop precipitously. Loss of revenue adversely affects profitability; reduced cash flow may disrupt capital expenditures plan. Cost control measures implemented; capital spending deferred. 4 5 20 High-cost operations closed, and employees temporarily furloughed. 4 4 16 Occasional delay or interruption of rail, river and terminals service may be expected. The operator can possibly minimize the impact of delays by being a preferred customer by fulfilling shipment obligations promptly and maintaining close working relationships. Table 22-9: Market and Transportation (Risk 7) Aspect Impact Control Measures Initial Risk Level Mitigation Measures Residual Risk Level P C R P C R Rail or river transport is delayed; storage and shipping access at river and ocean terminals is not available. Fulfillment of coal sales agreements delayed; limited coal storage at mines may increase cost of rehandling; production may be temporarily idled. Provide adequate storage capacity at mines; coordinate continuously with railroad and shipping companies to respond quickly and effectively to changing circumstances. 4 3 12 Provide back-up storage facility along with personnel, equipment and rehandle plan to sustain production and fulfill sales obligations timely. 4 2 8 22.2.8.5 Mining Plan Occupational health and safety risks are inherent in mining operations. Comprehensive training and retraining programs, internal safety audits and examinations, regular mine inspections, safety meetings, along with support of trained fire brigades and mine rescue teams are among activities that greatly reduce accident risks. Employee health monitoring programs coupled with dust and noise monitoring and abatement reduce health risks to miners. As underground mines are developed and extended, observation of geological, hydrogeological and geotechnical conditions lead to modification of mine plans and procedures to enable safe work within the mine environments. Highlighted below are selected examples of safety and external factors relevant to Alpha’s operations. 22.2.8.5.1 Methane Management Coalbed methane is present in coal operations below drainage. Often the methane concentration in shallow coal seams is at such low levels that it can be readily managed with frequent testing and monitoring, vigilance mine ventilation and routine ventilation surveys. Very high methane concentrations may be present at greater depths. High methane concentrations may require

Alpha Metallurgical Resources, Inc. Statement of Coal Resources and Reserves for the Aracoma Complex in Accordance with United States SEC Standards as of December 31, 2023 Central Appalachian Coal Basin West Virginia, USA MARSHALL MILLER & ASSOCIATES, INC. 77 degasification of the coal seam to assure safe mining. Methane is not expected to be present in most of the Aracoma property. Table 22-10: Methane Management (Risk 8) Aspect Impact Control Measures Initial Risk Level Mitigation Measures Residual Risk Level P C R P C R Methane hazard is present in mines operating below drainage. Injury or loss of life; possible ignition of gas and mine explosion; potential loss of mine and equipment temporarily or permanently; additional mine fan, mine power, ventilation, monitoring and examination requirements. Low to moderate levels can be managed with frequent examinations, testing and monitoring within the mine ventilation system. Excellent rock dust maintenance minimizes explosion propagation risk should an ignition occur. 2 5 10 Very high-level methane concentrations may require coal seam degasification and gob degasification where pillar extraction methods are employed. 2 3 6 22.2.8.5.2 Mine Fires Mine fires, once common at mine operations, are rare today. Most active coal miners have not encountered a mine fire. Vastly improved mine power and equipment electrical systems, along with safe mine practices reduce mine fire risks. Crew training and fire brigade support and training improve response for containment and control if a fire occurs. Spontaneous combustion within coal mines, which is the source of most fires that occur today, is not expected to commonly occur at the Alpha property. When spontaneous combustion conditions are present, monitoring systems are employed for early detection and mine plans are designed to facilitate isolation, containment and rapid extinguishment. Table 22-11: Mine Fires (Risk 9) Aspect Impact Control Measures Initial Risk Level Mitigation Measures Residual Risk Level P C R P C R Mine fire at underground operation or plant stockpile fire. Injury or loss of life; potential loss of mine temporarily or permanently; damage to equipment and mine infrastructure. Inspection and maintenance of mine power, equipment and mine infrastructure; good housekeeping; frequent examination of conveyor belt entries; prompt removal of accumulations of combustible materials. 1 5 5 If spontaneous combustion conditions are present, enhanced monitoring and examination procedures will be implemented; mine design will incorporate features to facilitate isolation, containment and extinguishment of spontaneous combustion locations. 1 4 4 Alpha Metallurgical Resources, Inc. Statement of Coal Resources and Reserves for the Aracoma Complex in Accordance with United States SEC Standards as of December 31, 2023 Central Appalachian Coal Basin West Virginia, USA MARSHALL MILLER & ASSOCIATES, INC. 78 22.2.8.5.3 Ground Control Underground mining exposes miners to the risks of roof falls and rib rolls. Ground control-based risks can be mitigated through effective roof control plans which are supplemented with a strong understanding of future geotechnical conditions. Foremen and crews should be trained to examine the roof, rib and floor conditions and identify pending and immediate hazards. Multiple publicly available software programs can be used to assess pillar sizing and stability. Table 22-12: Ground Control (Risk 10) Aspect Impact Control Measures Initial Risk Level Mitigation Measures Residual Risk Level P C R P C R Ground control issues cause roof failures, rib rolls, floor heave, etc. Injury or loss of life; catastrophic damage to equipment; production interruption. Regular inspection for change and signs of failure. Dynamic design of roof control plan and safety measures to honor observed conditions and exploration- based information; conservative pillar design. 4 3 12 Multiple operating sections to mitigate any lost production; availability of new working areas in case abandonment of section is required; availability of alternative roof control technologies in case of abrupt changes in mining conditions. 4 2 8 22.2.8.5.4 Availability of Supplies and Equipment The industry has periodically experienced difficulty receiving timely delivery of mine supplies and equipment. Availability issues often accompanied boom periods for coal demand. Any future delivery of supplies and equipment delays are expected to be temporary with limited impact on production. Table 22-13: Availability of Supplies and Equipment (Risk 11) Aspect Impact Control Measures Initial Risk Level Mitigation Measures Residual Risk Level P C R P C R Disruption of availability for supplies and equipment. Temporary interruption of production. Force majeure provision in coal sales agreements to limit liability for delayed or lost sales. 3 2 6 Work closely with customers to assure delayed coal delivery rather than cancelled sales; monitory external conditions and increase inventory of critical supplies; accelerate delivery of equipment when possible. 3 1 3 22.2.8.5.5 Labor Work stoppage due to labor protests are considered to be unlikely and accompanied by limited impact should it occur. Strong employee relations and communications limit the exposure to outside protesters. Loss of supervisors and skilled employees to retirement is inevitable; the impact can be lessened with succession planning, training and mentorship of new employees.

Alpha Metallurgical Resources, Inc. Statement of Coal Resources and Reserves for the Aracoma Complex in Accordance with United States SEC Standards as of December 31, 2023 Central Appalachian Coal Basin West Virginia, USA MARSHALL MILLER & ASSOCIATES, INC. 79 Table 22-14: Labor – Work Stoppage (Risk 12) Aspect Impact Control Measures Initial Risk Level Mitigation Measures Residual Risk Level P C R P C R Work stoppage due to slowdowns or secondary boycott activity. Loss of production and coal sales; damaged customer and employee relations; reputation loss. Maintain excellent employee relations and communications; maintain frequent customer communications. 2 3 6 Develop plan for employee communications and legal support to minimize impact of secondary boycott activities. 1 3 3 Table 22-15: Labor – Retirement (Risk 13) Aspect Impact Control Measures Initial Risk Level Mitigation Measures Residual Risk Level P C R P C R Retirement of supervisors and skilled employees. Loss of leadership and critical skills to sustain high levels of safety, maintenance and productivity. Monitor demographics closely and maintain communications with employees who are approaching retirement age; maintain employee selection and training programs. 3 3 9 Maintain selection of candidates and implementation of in-house or third-party training for electricians and mechanics; develop employee mentoring program. 3 2 6 22.2.8.6 Comprehensive Health and Safety While largely incorporated in mine plan-based risk factors, effective health and safety programs reduce the risk of accidents, associated loss of production and fines. Currently, coal mining and processing requires a robust health and safety team, consisting of executive level health and safety roles, regional health and safety managers, and multiple operational level health and safety coordinators. Table 22-16: Health and Safety (Risk 14) Aspect Impact Control Measures Initial Risk Level Mitigation Measures Residual Risk Level P C R P C R Failure to attain operations safety standards and associated occurrence of accidents Injuries and possible loss of life; damage to morale and workforce confidence; loss of production and diminished productivity; regulatory issues, closures and fines; reputation loss Safety and loss control awareness training to help employees recognize hazardous conditions and actions; frequent job observations and feedback; periodic employee performance reviews 2 5 10 Senior management's active participation in safety process; utilization of motivational methods to reinforce company's values and commitment to safety; regular comprehensive safety audits to assure safety standards are maintained. 2 3 6 Alpha Metallurgical Resources, Inc. Statement of Coal Resources and Reserves for the Aracoma Complex in Accordance with United States SEC Standards as of December 31, 2023 Central Appalachian Coal Basin West Virginia, USA MARSHALL MILLER & ASSOCIATES, INC. 80 23 Recommendations Alpha should continue to work both internally and with outside assistance to further define their Resource Base and to Optimize the LOM Plan. 24 References Publicly available information from various State and Federal agencies was used where relevant. JOURNEL, A.G., & HUIJBREGTS, CH, J., 1978: Mining Geostatistics, The Blackburn Press Caldwell, New Jersey. 25 Reliance on Information Provided by Registrant A summary of the information provided by Alpha relied upon by MM&A for the purposes of this TRS is provided in Table 25-1. Table 25-1: Information from Registrant Relied Upon by MM&A Category Information Provided by Alpha Report Section Marketing Long-term price forecast used in financial projections 16.2 Legal Mineral control and surface control rights as shown on maps 3.2, 3.3 Environmental Permit and bonding information 17.3

APPENDIX A SUMMARY TABLES Alpha Metallurgical Resources, Inc. SEC Technical Report - Aracoma Complex Summary of Coal Resource (Short Tons) • Effective December 31, 2023 Appendix A - Table 1 Area Seam Measured Indicated Total Inferred Grand Total Owned Leased Permitted Not Permitted Ash% Sulfur% VM% Boone West Chilton (47000) 7,306,000 1,990,000 9,296,000 0 9,296,000 9,296,000 0 0 9,296,000 23 0.6 0 Cedar Grove No. 2 Upper Cedar Grove (30100) 12,102,000 9,571,000 21,673,000 180,000 21,853,000 0 21,673,000 16,546,000 5,127,000 51 2.9 0 Cedar No. 3 Mine Upper Cedar Grove (30100) 3,414,000 1,355,000 4,769,000 4,000 4,773,000 0 4,769,000 4,122,000 646,000 51 2.9 0 Rum Creek No. 2 Gas (24000) 29,760,000 19,508,000 49,268,000 154,000 49,422,000 0 49,268,000 0 49,268,000 13 0.7 32 Boone West No. 2 Gas (24000) 29,094,000 17,283,000 46,377,000 86,000 46,463,000 37,296,000 9,081,000 0 46,377,000 22 1.1 0 Total 81,676,000 49,707,000 131,383,000 423,000 131,806,000 46,592,000 84,791,000 20,668,000 110,715,000 23 1.2 32 Note(1): Resource tons are Exclusive of Reserve/Not Converted to Reserve tons (not converted to reserve). Note (2): Coal resources are reported on a dry basis. Surface moisture and inherent moisture are excluded. Totals may not add due to rounding. Quality (Dry Basis) By Control Type By Permit Status Coal Resource (Dry Tons, In Situ) By Reliability Category AMR118 Bandmill SEC Reserve Tables (2024-02-06).xlsx • Aracoma ANR Resource Report • 2/7/2024 Page 1 of 1

Alpha Metallurgical Resources, Inc. SEC Technical Report - Aracoma Complex Summary of Coal Reserves (Short Tons) • Effective December 31, 2023 Appendix A - Table 2 Area/Mine Seam Proven Probable Total Surface UG Owned Leased Permitted Not Permitted Thermal Met Ash% Sulfur% VM% Davy Branch Upper Chilton (41000) 3,023,000 914,000 3,937,000 0 3,937,000 0 3,937,000 3,906,000 31,000 0 3,937,000 7 0.9 39 Hatfield Area Upper Chilton (41000) 5,106,000 2,663,000 7,768,000 0 7,768,000 0 7,768,000 0 7,768,000 0 7,768,000 7 0.9 36 Cedar Grove No. 3 Upper Cedar Grove (30100) 3,810,000 630,000 4,440,000 0 4,440,000 0 4,440,000 4,422,000 17,000 0 4,440,000 7 1.3 39 Lauren Land Lower Cedar Grove (30000) 1,905,000 1,038,000 2,943,000 0 2,943,000 0 2,943,000 0 2,943,000 0 2,943,000 3 0.7 - Cedar Grove No. 3 Lower Cedar Grove (30000) 539,000 17,000 556,000 0 556,000 54,000 503,000 0 556,000 0 556,000 4 0.6 38 Beech Branch Alma (25800) 972,000 458,000 1,429,000 0 1,429,000 0 1,429,000 0 1,429,000 0 1,429,000 4 0.9 39 Lynn Branch No. 2 Gas (24000) 9,150,000 6,028,000 15,178,000 0 15,178,000 1,423,000 13,755,000 14,336,000 842,000 0 15,178,000 4 0.8 37 Boone West No. 2 Gas (24000) 1,746,000 3,277,000 5,024,000 0 5,024,000 3,996,000 1,028,000 0 5,024,000 0 5,024,000 4 0.9 - Grand Total 26,252,000 15,024,000 41,276,000 0 41,276,000 5,473,000 35,803,000 22,664,000 18,611,000 0 41,276,000 5 0.9 37 Notes: Marketable reserve tons are reported on a moist basis, including a combination of surface and inherent moisture. Coal quality is based on a weighted average of laboratory data from core holes The combination of surface and inherent moisture is modeled at 6.0-percent. Actual product moisture is dependent upon multiple geological factors, operational factors, and product contract specifications and can exceed 8-percent. As such, the modeled moisture values provide a level of conservatism for reserve reporting. *Volatile Matter analysis is not available for all reserve areas. All Aracoma reserves are priced as a High-Vol B product. Totals may not add due to rounding. By Market Quality (Dry Basis) Permit Status Demonstrated Coal Reserves (Wet Tons, Washed or Direct Shipped, x1,000) By Reliability Category By Mining Type By Control Type AMR118 Bandmill SEC Reserve Tables (2024-02-06).xlsx • Aracoma ANR Reserve Report • 2/7/2024 Page 1 of 1 APPENDIX B INITIAL ECONOMIC ASSESSMENT, RESOURCES EXCLUSIVE OF RESERVES

Alpha Metallurgical Resources, LLC Initial Economic Assessment, Resources Exclusive of Reserves (per Ton) Appendix B: Aracoma Complex Seam: Chilton Upper Cedar Grove Upper Cedar Grove No.2 Gas No.2 Gas Aracoma Aracoma Aracoma Aracoma Aracoma Area: Boone West Chilton UCG Lauren Land A2-A3 UCG Lauren Land B N2G Boone West N2G Rum Creek In-Place Resource Tons (not adjusted for Q4 2023 Depletion) 9,296,143 21,852,520 4,772,514 46,462,578 49,422,129 Potentially Recoverable Tons* 2,025,891 4,547,947 952,313 9,934,907 10,567,736 Mining Method Deep - CM Deep - CM Deep - CM Deep - CM Deep - CM Assumed Sales Realization at Plant** 125$ 125$ 125$ 125$ 125$ Iniital Capex Estimate to Access Resources*** 32,000,000$ -$ -$ 100,000,000$ 50,000,000$ Direct Mining Costs: Labor**** 25.03$ 19.95$ 18.28$ 31.95$ 30.17$ Supplies, Excluding Roof Control 7.78$ 7.15$ 6.55$ 10.23$ 9.66$ Roof Control 7.05$ 6.48$ 5.93$ 11.46$ 10.82$ M&R 5.61$ 11.54$ 10.46$ 10.79$ 9.36$ Power 0.80$ 1.98$ 1.78$ 1.07$ 0.93$ Other 2.89$ 5.93$ 5.38$ 3.50$ 3.04$ Total Direct Cash Costs 49.16$ 53.02$ 48.39$ 69.01$ 63.99$ Transporation, Washing, Environmental & G&A Costs: Coal Prep***** 6.41$ 13.18$ 11.96$ 7.45$ 6.46$ Materials Handling 1.50$ 1.50$ 1.50$ 1.50$ 1.50$ Raw Coal Trucking***** 15.47$ 4.12$ 7.92$ 10.94$ 9.49$ Clean Coal Trucking 1.25$ 1.25$ 1.25$ 1.25$ 1.25$ Enviro****** 0.35$ 0.35$ 0.35$ 0.35$ 0.35$ G&A 4.10$ 4.10$ 4.10$ 4.10$ 4.10$ Total Transporation, Washing, Environmental & G&A Costs: 29.09$ 24.50$ 27.08$ 25.59$ 23.15$ Indirect Cash Costs Royalty 7.50$ 7.50$ 7.50$ 7.50$ 7.50$ Black Lung Excise Tax 0.55$ 0.55$ 0.55$ 0.55$ 0.55$ SMCRA 0.12$ 0.12$ 0.12$ 0.12$ 0.12$ State Severance 6.25$ 6.25$ 6.25$ 1.25$ 1.25$ Property Tax & Insurance 1.00$ 1.00$ 1.00$ 1.00$ 1.00$ Total Indirect Cash Costs 15.42$ 15.42$ 15.42$ 10.42$ 10.42$ Non Cash Costs Amoritiztion of Development Capital 15.80$ -$ -$ 10.07$ 4.73$ Depreciation of Initial Equipment and Sustaining Capital 6.73$ 6.73$ 6.73$ 6.73$ 6.73$ Depletion 1.00$ 1.00$ 1.00$ 1.00$ 1.00$ Total Non Cash 23.53$ 7.73$ 7.73$ 17.80$ 12.46$ Total Cash Cost 93.66$ 92.94$ 90.89$ 105.02$ 97.56$ EBITDA 31.34$ 32.06$ 34.11$ 19.98$ 27.44$ Fully Loaded Cost 117.19$ 100.67$ 98.62$ 122.82$ 110.03$ Fully Loaded P&L 7.81$ 24.33$ 26.38$ 2.18$ 14.97$ Passes Resource Iniital Economic Assessment? YES YES YES YES YES *Potentially recoverable tons are calculated by applying appropriate modifying factors to in-place resource tonnages **Sales relization represents estimated long range sales price. ***No initial capital required where resources are accessible from existing mines. ****Labor rates are driven based off of super section productivities assuming 250 to 300 feet per unit shift per section. *****Processing assumed to occur at Bandmill plant. ******Environmental costs assumed to include permiting, outfall maintenance, etc. AMR118 Bandmill Initial Economic Assessment Resources Exclusive of Reserves 121823.xlsx Page 1 of 1 APPENDIX C MAPS

Davy Branch Mine Area Hatfield Area Hatfield Energy Mine 1.5 Scale In Miles 0 Data Point Location Map 1 Aracoma Area Upper Chilton Seam Alpha Metallurgical Resource, LLC Logan & Mingo Counties, West Virginia Coordinate System: West Virginia South State Plane NAD 27 Controlled Underground Reserve / Resource as of 12/31/23 Previous Underground Mining N Resource Inclusive of Reserve / Converted to Reserve Cedar Grove No. 2 Mine (Active) CG No. 2 Mine UCG No. 3 Mine 1 Scale In Miles 0 Data Point Location Map 2 Aracoma Area Upper Cedar Grove Seam Alpha Metallurgical Resource, LLC Logan County, West Virginia Coordinate System: West Virginia South State Plane NAD 27 Controlled Underground Reserve / Resource as of 12/31/23 Previous Underground Mining N Resource Exclusive of Reserve / Not Converted to Reserve Resource Inclusive of Reserve / Converted to Reserve

# 5 Mine No.18 Mine Upper Cedar Grove and Lower Cedar Grove Seams Mined Together Upper Cedar Grove and Lower Cedar Grove Seams Mined Together No. 38 Mine Lauren Land LCG Area Lower Cedar Grove No. 3 1 Scale In Miles 0 Data Point Location Map 3 Aracoma Area Lower Cedar Grove Seam Alpha Metallurgical Resource, LLC Logan County, West Virginia Coordinate System: West Virginia South State Plane NAD 27 Controlled Underground Reserve / Resource as of 12/31/23 Previous Underground Mining N Resource Inclusive of Reserve / Converted to Reserve H.T. WILSON COAL CO. Alma No. 1 Mine Alma Beech Br. Area 4000' Scale In Feet 0 Data Point Location Map 4 Aracoma Area Alma Seam Alpha Metallurgical Resource, LLC Logan County, West Virginia Coordinate System: West Virginia South State Plane NAD 27 Controlled Underground Reserve / Resource as of 12/31/23 Previous Underground Mining N Resource Inclusive of Reserve / Converted to Reserve

SEALED SEALED SEALED SEALED SEALED SEALED SEALED SEALED SEALED SEALED SEALED SEALED K1 K2 K3 K4 K5 K6 K7 K8 K9 SEALED SEALEDSEALED SEALED SEALED SEALED SEALED SEALED SEALED Dehue Mine No. 8C Mine Boone West Aracoma Rum Creek Area See Map 7 for This Area Lynn Branch Mine Area 2.5 Scale In Miles 0 Data Point Location Map 5 Aracoma Area No. 2 Gas Seam Alpha Metallurgical Resource, LLC Logan County, West Virginia Coordinate System: West Virginia South State Plane NAD 27 Controlled Underground Reserve / Resource as of 12/31/23 Previous Underground Mining N Resource Exclusive of Reserve / Not Converted to Reserve Resource Inclusive of Reserve / Converted to Reserve 4000' Scale In Feet 0 Data Point Location Map 6 Boone West Area Chilton Seam Alpha Metallurgical Resource, LLC Boone & Logan Counties, West Virginia Coordinate System: West Virginia South State Plane NAD 27 Controlled Reserve / Resource as of 12/31/23 Previous Underground Mining N Resource Exclusive of Reserve / Not Converted to Reserve

Boone West Aracoma See Map 5 for This Area Boone West Area 1.5 Scale In Miles 0 Data Point Location Map 7 Boone West Area No. 2 Gas Seam Alpha Metallurgical Resource, LLC Logan & Boone Counties, West Virginia Coordinate System: West Virginia South State Plane NAD 27 Controlled Underground Reserve / Resource as of 12/31/23 Previous Underground Mining N Resource Exclusive of Reserve / Not Converted to Reserve Resource Inclusive of Reserve / Converted to Reserve
EX-96.2
14
finalkeplertswithappendi.htm
TECHNICAL REPORT SUMMARY - KEPLER COMPLEX
finalkeplertswithappendi

Alpha Metallurgical Resources, Inc. Statement of Coal Resources and Reserves for the Kepler Complex in Accordance with United States SEC Standards as of December 31, 2023 Central Appalachian Coal Basin West Virginia, USA February 2024 Prepared for: Alpha Metallurgical Resources, Inc. 340 Martin Luther King Blvd. Bristol, TN 37620 Prepared by: MARSHALL MILLER & ASSOCIATES, INC. 582 Industrial Park Road Bluefield, Virginia 24605 www.mma1.com Alpha Metallurgical Resources, Inc. Statement of Coal Resources and Reserves for the Kepler Complex in Accordance with United States SEC Standards as of December 31, 2023 Central Appalachian Coal Basin West Virginia, USA MARSHALL MILLER & ASSOCIATES, INC. 2 Statement of Use and Preparation This updated Technical Report Summary (TRS) was prepared for the sole use of Alpha Metallurgical Resources, Inc. (Alpha) and its affiliated and subsidiary companies and advisors. Copies or references to information in this report may not be used without the written permission of Alpha. The report provides a statement of coal resources and coal reserves for Alpha, as defined under the United States Securities and Exchange Commission (SEC). The statement is based on information provided by Alpha and reviewed by various professionals within Marshall Miller and Associates (MM&A). MM&A professionals who contributed to the drafting of this report meet the definition of Qualified Persons (QPs), consistent with the requirements of the SEC. The information in this TRS related to coal resources and reserves is based on, and fairly represents, information compiled by the QPs. At the time of reporting, MM&A’s QPs have sufficient experience relevant to the style of mineralization and type of deposit under consideration and to the activity they are undertaking to qualify as a QP as defined by the SEC. Certain information set forth in this report contains “forward-looking information”, including production, productivity, operating costs, capital costs, sales prices, and other assumptions. These statements are not guarantees of future performance and undue reliance should not be placed on them. The assumptions used to develop the forward-looking and the risks that could cause the actual results to differ materially are detailed in the body of this report. Marshall Miller & Associates, Inc. (MM&A) hereby consents (i) to the use of the information contained in this report dated December 31, 2023, relating to estimates of coal resources and coal reserves controlled by Alpha, (ii) to the use of MM&A’s name, any quotations from or summarizations of this TRS in Alpha’s SEC filings, and (iii) to the filing of this TRS as an exhibit to Alpha’s SEC filings. Qualified Person: /s/ Marshall Miller & Associates, Inc. Date: February 9, 2024

Alpha Metallurgical Resources, Inc. Statement of Coal Resources and Reserves for the Kepler Complex in Accordance with United States SEC Standards as of December 31, 2023 Central Appalachian Coal Basin West Virginia, USA MARSHALL MILLER & ASSOCIATES, INC. 3 Table of Contents 1 Executive Summary ............................................................................................................... 9 1.1 Property Description ................................................................................................ 9 1.2 Ownership .............................................................................................................. 10 1.3 Geology .................................................................................................................. 11 1.4 Exploration Status .................................................................................................. 11 1.5 Operations and Development ................................................................................. 11 1.6 Mineral Resource ................................................................................................... 12 1.7 Mineral Reserve ..................................................................................................... 12 1.8 Capital Summary .................................................................................................... 13 1.9 Operating Costs ...................................................................................................... 14 1.10 Economic Evaluation .............................................................................................. 15 1.10.1 Discounted Cash Flow Analysis ................................................................. 18 1.10.2 Sensitivity Analysis .................................................................................... 18 1.11 Permitting .............................................................................................................. 19 1.12 Conclusion and Recommendations ......................................................................... 19 2 Introduction ........................................................................................................................ 19 2.1 Registrant and Terms of Reference ......................................................................... 19 2.2 Information Sources ............................................................................................... 20 2.3 Scope of Assignment.............................................................................................. 20 2.4 Personal Inspections ............................................................................................... 21 3 Property Description ........................................................................................................... 21 3.1 Location ................................................................................................................. 21 3.2 Titles, Claims or Leases ........................................................................................... 21 3.3 Mineral Rights ........................................................................................................ 22 3.4 Encumbrances ........................................................................................................ 22 3.5 Other Risks ............................................................................................................. 23 4 Accessibility, Climate, Local Resources, Infrastructure and Physiography .......................... 23 4.1 Topography, elevation and Vegetation ................................................................... 23 4.2 Access and Transport ............................................................................................. 23 4.3 Proximity to Population Centers ............................................................................. 23 4.4 Climate and Length of Operating Season ................................................................ 24 4.5 Infrastructure ......................................................................................................... 24 Alpha Metallurgical Resources, Inc. Statement of Coal Resources and Reserves for the Kepler Complex in Accordance with United States SEC Standards as of December 31, 2023 Central Appalachian Coal Basin West Virginia, USA MARSHALL MILLER & ASSOCIATES, INC. 4 5 History ................................................................................................................................. 24 5.1 Previous Operation ................................................................................................. 24 5.2 Previous Exploration ............................................................................................... 25 6 Geological Setting, Mineralization and Deposit .................................................................. 25 6.1 Regional, Local and Property Geology..................................................................... 25 6.2 Mineralization ........................................................................................................ 26 6.3 Deposits ................................................................................................................. 26 7 Exploration .......................................................................................................................... 27 7.1 Nature and Extent of Exploration ........................................................................... 27 7.2 Non-Drilling Procedures and Parameters ................................................................ 29 7.3 Drilling Procedures ................................................................................................. 29 7.4 Hydrology ............................................................................................................... 29 7.5 Geotechnical Data .................................................................................................. 30 8 Sample Preparation Analyses and Security ......................................................................... 30 8.1 Prior to Sending to the Lab ..................................................................................... 30 8.2 Lab Procedures ....................................................................................................... 30 9 Data Verification ................................................................................................................. 31 9.1 Procedures of Qualified Person .............................................................................. 31 9.2 Limitations ............................................................................................................. 32 9.3 Opinion of Qualified Person.................................................................................... 32 10 Mineral Processing and Metallurgical Testing ..................................................................... 32 10.1 Testing Procedures ................................................................................................. 32 10.2 Relationship of Tests to the Whole ......................................................................... 33 10.3 Lab Information ...................................................................................................... 33 10.4 Relevant Results ..................................................................................................... 33 11 Mineral Resource Estimates ................................................................................................ 33 11.1 Assumptions, Parameters and Methodology .......................................................... 33 11.1.1 Statistical Analysis ..................................................................................... 35 11.2 Resources Exclusive of Reserves ............................................................................. 39 11.2.1 Initial Economic Assessment ..................................................................... 40 11.3 Qualified Person’s Estimates .................................................................................. 41 11.4 Qualified Person’s Opinion ..................................................................................... 42 12 Mineral Reserve Estimates .................................................................................................. 42 12.1 Assumptions, Parameters and Methodology .......................................................... 42

Alpha Metallurgical Resources, Inc. Statement of Coal Resources and Reserves for the Kepler Complex in Accordance with United States SEC Standards as of December 31, 2023 Central Appalachian Coal Basin West Virginia, USA MARSHALL MILLER & ASSOCIATES, INC. 5 12.2 Mineral Reserves .................................................................................................... 44 12.2.1 Sewell Seam (Map 1) ................................................................................ 44 12.2.2 Pocahontas No. 3 (P3) Seam (Map 3) ........................................................ 44 12.3 Qualified Person’s Estimates .................................................................................. 44 12.4 Qualified Person’s Opinion ..................................................................................... 45 13 Mining Methods .................................................................................................................. 45 13.1 Geotech and Hydrology .......................................................................................... 46 13.2 Production Rates .................................................................................................... 46 13.3 Mining Related Requirements ................................................................................ 47 13.3.1 Underground ............................................................................................ 47 13.4 Required Equipment and Personnel ....................................................................... 48 13.4.1 Underground Mines .................................................................................. 48 14 Processing and Recovery Methods ...................................................................................... 51 14.1 Description or Flowsheet ........................................................................................ 51 14.2 Requirements for Energy, Water, Material and Personnel ...................................... 51 15 Infrastructure ...................................................................................................................... 52 16 Market Studies .................................................................................................................... 55 16.1 Market Description ................................................................................................. 55 16.2 Price Forecasts ....................................................................................................... 56 16.3 Contract Requirements .......................................................................................... 56 17 Environmental Studies, Permitting and Plans, Negotiations or Agreements with Local Individuals .................................................................................................................. 56 17.1 Results of Studies ................................................................................................... 56 17.2 Requirements and Plans for Waste Disposal ........................................................... 57 17.3 Permit Requirements and Status ............................................................................ 58 17.4 Local Plans, Negotiations or Agreements ................................................................ 61 17.5 Mine Closure Plans ................................................................................................. 61 17.6 Qualified Person’s Opinion ..................................................................................... 61 18 Capital and Operating Costs ................................................................................................ 61 18.1 Capital Cost Estimate .............................................................................................. 61 18.2 Operating Cost Estimate ......................................................................................... 63 19 Economic Analysis ............................................................................................................... 64 19.1 Economic Evaluation .............................................................................................. 64 19.1.1 Introduction .............................................................................................. 64 Alpha Metallurgical Resources, Inc. Statement of Coal Resources and Reserves for the Kepler Complex in Accordance with United States SEC Standards as of December 31, 2023 Central Appalachian Coal Basin West Virginia, USA MARSHALL MILLER & ASSOCIATES, INC. 6 19.1.2 Cash Flow Summary .................................................................................. 68 19.1.3 Discounted Cash Flow Analysis ................................................................. 70 19.1.4 Sensitivity Analysis .................................................................................... 70 20 Adjacent Properties ............................................................................................................. 71 20.1 Information Used ................................................................................................... 71 21 Other Relevant Data and Information ................................................................................. 71 22 Interpretation and Conclusions ........................................................................................... 72 22.1 Conclusion .............................................................................................................. 72 22.2 Risk Factors ............................................................................................................ 72 22.2.1 Governing Assumptions ............................................................................ 73 22.2.2 Limitations ................................................................................................ 73 22.2.3 Methodology ............................................................................................ 73 22.2.4 Development of the Risk Matrix................................................................ 74 22.2.5 Categorization of Risk Levels and Color Code Convention ......................... 77 22.2.6 Description of the Coal Property ............................................................... 77 22.2.7 Summary of Residual Risk Ratings ............................................................. 78 22.2.8 Risk Factors ............................................................................................... 78 23 Recommendations .............................................................................................................. 85 24 References ........................................................................................................................... 85 25 Reliance on Information Provided by Registrant ................................................................. 85 FIGURES (IN REPORT) Figure 1-1: Alpha’s Kepler Property Location Map ........................................................................ 10 Figure 1-2: Projected Capital Expenditures – Consolidated Kepler Operations .............................. 14 Figure 1-3: Kepler Operating Costs ............................................................................................... 15 Figure 1-4: Sensitivity of NPV........................................................................................................ 18 Figure 6-1: Kepler Stratigraphic Column ....................................................................................... 26 Figure 7-1: Kepler Cross-Section ................................................................................................... 28 Figure 11-1: Histogram of the Total Seam Thickness for the Pocahontas No. 3 Seam Present in the Kepler Complex................................................................................................. 36 Figure 11-2: Scatter plot of the Total Seam Thickness for the Pocahontas No. 3 Seam Present in the Kepler Complex................................................................................................. 36 Figure 11-3: Variogram of the Total Seam Thickness for the Pocahontas No. 3 Seam Present in the Kepler Complex .................................................................................................... 37 Figure 11-4: Result of DHSA for the Pocahontas No. 3 Seam Present in the Kepler Complex ........ 38 Figure 11-5: Results of Initial Economic Assessment ..................................................................... 41 Figure 15-1: Kepler Surface Facilities ............................................................................................ 53

Alpha Metallurgical Resources, Inc. Statement of Coal Resources and Reserves for the Kepler Complex in Accordance with United States SEC Standards as of December 31, 2023 Central Appalachian Coal Basin West Virginia, USA MARSHALL MILLER & ASSOCIATES, INC. 7 Figure 15-2: Kepler Preparation Plant ........................................................................................... 54 Figure 15-3: Feats Loadout Facility located near Holden, WV ....................................................... 55 Figure 18-1: Projected Capital Expenditures – Consolidated Kepler Operations ............................ 62 Figure 18-2: Kepler Operating Costs ............................................................................................. 64 Figure 19-1: Projection of Sales Tons ............................................................................................ 65 Figure 19-2: Consolidated Annual Revenue .................................................................................. 66 Figure 19-3: Revenue, Cash Costs, and EBITDA ............................................................................. 67 Figure 19-4: Annual EBITDA .......................................................................................................... 68 Figure 19-5: Net Cash Flow after Tax (Before Debt Service) .......................................................... 70 Figure 19-6: Sensitivity of NPV...................................................................................................... 71 TABLES (IN REPORT) Table 1-1: Coal Resources Summary as of December 31, 2023 ..................................................... 12 Table 1-2: Coal Reserves Summary (Marketable Sales Basis) as of December 31, 2023 ................ 13 Table 1-3: Life-of-Mine Tonnage, P&L before Tax, and EBITDA ..................................................... 16 Table 1-4: Project Cash Flow Summary (000) ................................................................................ 16 Table 3-1: Mineral Control – Kepler Complex ............................................................................... 22 Table 11-1: General Reserve & Resource Criteria ......................................................................... 34 Table 11-2: Statistical Breakdown................................................................................................. 36 Table 11-3: DHSA Results Summary for Radius from a Central Point ............................................. 38 Table 11-4: Results of Initial Economic Assessment ...................................................................... 40 Table 11-5: Coal Resources Summary as of December 31, 2023 ................................................... 41 Table 12-1: Coal Reserves Summary (Marketable Sales Basis) as of December 31, 2023............... 45 Table 13-1: Kepler Complex Underground Mine Production Schedule (x 1,000 Saleable Tons) ..... 47 Table 16-1: Quality Specifications ................................................................................................. 55 Table 16-2: Price Forecasts ........................................................................................................... 56 Table 17-1: Kepler Refuse Disposal Summary ............................................................................... 58 Table 17-2: Kepler Mining Permits................................................................................................ 60 Table 18-1: Summary of Capital Expenditures Schedule by Mine .................................................. 62 Table 18-2: Estimated Coal Production Taxes and Sales Costs ...................................................... 63 Table 19-1: Life-of-Mine Tonnage, P&L before Tax, and EBITDA ................................................... 67 Table 19-2: Project Cash Flow Summary (000) .............................................................................. 68 Table 22-1: Probability Level Table ............................................................................................... 75 Table 22-2: Consequence Level Table ........................................................................................... 76 Table 22-3: Risk Matrix ................................................................................................................. 77 Table 22-4: Risk Assessment Matrix.............................................................................................. 78 Table 22-5: Geological and Coal Resource Risk Assessment (Risks 1 and 2) .................................. 79 Table 22-6: Environmental (Risks 3 and 4) .................................................................................... 80 Table 22-7: Regulatory Requirements (Risk 5) .............................................................................. 80 Table 22-8: Market and Transportation (Risk 6) ............................................................................ 80 Table 22-9: Market and Transportation (Risk 7) ............................................................................ 81 Table 22-10: Methane Management (Risk 8) ................................................................................ 82 Alpha Metallurgical Resources, Inc. Statement of Coal Resources and Reserves for the Kepler Complex in Accordance with United States SEC Standards as of December 31, 2023 Central Appalachian Coal Basin West Virginia, USA MARSHALL MILLER & ASSOCIATES, INC. 8 Table 22-11: Mine Fires (Risk 9) .................................................................................................... 82 Table 22-12: Ground Control (Risk 10) .......................................................................................... 83 Table 22-13: Availability of Supplies and Equipment (Risk 11) ...................................................... 83 Table 22-14: Labor – Work Stoppage (Risk 12).............................................................................. 84 Table 22-15: Labor – Retirement (Risk 13) .................................................................................... 84 Table 22-16: Health and Safety (Risk 14) ...................................................................................... 84 Table 25-1: Information from Registrant Relied Upon by MM&A ................................................. 85 Appendices A ............................................................................................................................. Summary Tables B ............................................. Initial Economic Assessment, Kepler Resources Exclusive of Reserves C ...............................................................................................................................................Maps

Alpha Metallurgical Resources, Inc. Statement of Coal Resources and Reserves for the Kepler Complex in Accordance with United States SEC Standards as of December 31, 2023 Central Appalachian Coal Basin West Virginia, USA MARSHALL MILLER & ASSOCIATES, INC. 9 1 Executive Summary 1.1 Property Description Alpha Metallurgical Resources, Inc. (Alpha) authorized Marshall Miller & Associates, Inc. (MM&A) to prepare this updated Technical Report Summary (TRS) of its controlled coal reserves located at the Kepler Complex (Kepler) in Wyoming County, Raleigh and McDowell counties, West Virginia. The report provides a statement of coal resources and coal reserves for Alpha, as defined under the United States Securities and Exchange Commission (SEC). Coal resources and coal reserves are herein reported in imperial units of measurement. Active surface facilities for the operation are located along the Guyandotte River near the Road Fork #52 mine portals and adjacent to a Norfolk Southern rail line about 1.8 miles west of the town of Pineville, West Virginia, the county seat of Wyoming County, and approximately 25 miles west southwest of Beckley (see Figure 1-1). The Property is composed of approximately 98,000 total acres of mineral control, of which nearly all are contained within 9 separate leases. Alpha Metallurgical Resources, Inc. Statement of Coal Resources and Reserves for the Kepler Complex in Accordance with United States SEC Standards as of December 31, 2023 Central Appalachian Coal Basin West Virginia, USA MARSHALL MILLER & ASSOCIATES, INC. 10 Figure 1-1: Alpha’s Kepler Property Location Map 1.2 Ownership The Kepler property involves a complex combination of previous ownership. Predecessors of Alpha, namely Alpha Natural Resources and Massey Energy (Massey) previously held mining rights on the majority of the Property. Additionally, reserves and resources associated with the former Pinnacle Mine (commonly referred to as Mine 50) were acquired by Alpha. The Pinnacle based reserves have undergone multiple ownership changes, with recent controllers including Mission Coal, Cliffs Natural Resources, PinnOak Resources and US Steel.

Alpha Metallurgical Resources, Inc. Statement of Coal Resources and Reserves for the Kepler Complex in Accordance with United States SEC Standards as of December 31, 2023 Central Appalachian Coal Basin West Virginia, USA MARSHALL MILLER & ASSOCIATES, INC. 11 1.3 Geology Operations at the Kepler Mine Complex currently extract coal from the Pocahontas No. 3 seam by underground continuous mining methods. Strata on the Property are of the Pennsylvanian-age New River and Pocahontas Formations of the Pottsville Series. Seams with remaining reserve and resource potential include Pocahontas No. 3 and No. 6 (in the Pocahontas Formation) and the Sewell (in the New River Formation). These seams are all historically utilized as coking coal and due to the high value of these coking coals, all of the seams have been extensively mined in the past. The rock formations between the coal seams are characterized by large proportions of sandstone interspersed with shale units. The coal seams reach the highest structural elevations along the southeastern margin of the Property, generally dipping toward the northwest. The Pocahontas No. 3 seam is located below drainage throughout the Property. The Sewell seam and the Pocahontas No. 6 seam are generally above drainage, although some areas extending below drainage. 1.4 Exploration Status The Property has been extensively explored, largely by drilling using continuous coring and rotary drilling methods but also by obtaining coal measurements at mine exposures, and by downhole geophysical methods. The majority of the data was acquired or generated by previous owners of the Property. These sources comprise the primary data used in the evaluation of the coal resources and coal reserves on the Property. MM&A examined the data available for the evaluation and incorporated all pertinent information into this TRS. Where data appeared to be anomalous or not representative, that data was excluded from the digital databases and subsequent processing by MM&A. Ongoing exploration has been carried out by Alpha since acquiring the Kepler Complex. The Alpha acquired exploration data has been consistent with past drilling activities. 1.5 Operations and Development As of December 31, 2023, underground mine operations were active at the Road Fork #52 Mine in the Pocahontas No. 3 seam. The mine produces low-volatile metallurgical coal. The Wyoming 2 Mine in the Sewell seam was closed in October 2020. Based on the mine plans developed as part of this TRS, annual deep mine production peaks at 2.4 million tons in 2031. Underground reserves will be depleted in 2058. The Kepler Complex also includes the Kepler Preparation Plant in addition to the mines. The plant site includes raw coal storage, clean coal storage, a thermal dryer, a railroad loadout, and refuse disposal area. The plant has a feed rate capacity of 900 raw tons per hour with a typical dry product quality of 5.85% ash and, 0.80% sulfur and 19.39% volatile matter. Plant utilization averaged 54.43% in 2023. Alpha Metallurgical Resources, Inc. Statement of Coal Resources and Reserves for the Kepler Complex in Accordance with United States SEC Standards as of December 31, 2023 Central Appalachian Coal Basin West Virginia, USA MARSHALL MILLER & ASSOCIATES, INC. 12 1.6 Mineral Resource A coal resource estimate, summarized in Table 1-1 was prepared as of December 31, 2023, for property controlled by Alpha. Table 1-1: Coal Resources Summary as of December 31, 2023 Coal Resource (Dry Tons, In Situ) Mine/Area Seam Measured Indicated Inferred Total Inclusive of Reserves/Converted to Reserve Sewell #2 West Sewell 8,030,000 2,928,000 0 10,958,000 Sewell #1 East Sewell 1,682,000 52,000 0 1,733,000 Road Fork 52 Pocahontas 3 35,279,000 22,750,000 0 58,028,000 Proposed P3 North Pocahontas 3 9,330,000 17,842,000 0 27,172,000 Total Inclusive of Reserve 54,321,000 43,571,000 0 97,891,000 Exclusive of Reserve/Not Converted to Reserve Wyoming 2 Sewell 3,180,000 254,000 0 3,434,000 Resource Only Sewell 1,994,000 1,521,000 0 3,514,000 Resource Only Pocahontas 6 0 23,565,000 0 23,565,000 Road Fork 52 Pocahontas 3 1,835,000 517,000 0 2,352,000 Total Exclusive of Reserve 7,009,000 25,857,000 0 32,866,000 Grand Total Grand Total 7,009,000 25,857,000 0 32,866,000 Note(1): Resource tons are inclusive of reserve tons since they include the in-situ tons from which recoverable coal reserves are derived. Note (2): Coal resources are reported on a dry basis. Surface moisture and inherent moisture are excluded. Totals may not add due to rounding. See Appendix A for a detailed breakdown. 1.7 Mineral Reserve The Resource estimate outlined in Table 1-1 inclusive of reserves has been used as the basis for this Reserve calculation, which utilizes a reasonable Preliminary Feasibility Study, a Life-of Mine (LOM) Mine Plan and practical recovery factors. Production modeling was completed with an effective start date of October 1, 2023. Factors that would typically preclude conversion of a coal resource to coal reserve, which include the following: inferred resource classification; absence of coal quality; poor mine recovery; lack of access; geological encumbrances associated with overlying and underlying strata; seam thinning; structural complication; and insufficient exploration have all been considered. Reserve consideration excludes those portions of the resource area, which exhibit the aforementioned geological and operational encumbrances. Proven and probable coal reserves were derived from the defined in-situ coal resource considering relevant processing, economic (including technical estimates of capital, revenue and cost), marketing, legal, environmental, socioeconomic, and regulatory factors. The proven and probable coal reserves on the Property are summarized below in Table 1-2.

Alpha Metallurgical Resources, Inc. Statement of Coal Resources and Reserves for the Kepler Complex in Accordance with United States SEC Standards as of December 31, 2023 Central Appalachian Coal Basin West Virginia, USA MARSHALL MILLER & ASSOCIATES, INC. 13 Table 1-2: Coal Reserves Summary (Marketable Sales Basis) as of December 31, 2023 Demonstrated Coal Reserves (Wet Tons, Washed or Direct Shipped) Quality (Dry Basis) By Reliability Category By Control Type Mine Seam Proven Probable Total Owned Leased Ash% Sulfur% VM% Sewell #2 West Sewell 3,222,000 1,220,000 4,442,000 3,000 4,438,000 3 0.5 24 Sewell #1 East Sewell 581,000 3,000 584,000 0 584,000 4 0.7 23 Road Fork 52 Pocahontas 3 15,370,000 9,426,000 24,796,000 255,000 24,541,000 6 0.9 19 Proposed P3 North Pocahontas 3 3,859,000 7,510,000 11,369,000 0 11,369,000 6 0.9 20 Grand Total 23,031,000 18,159,000 41,191,000 258,000 40,932,000 5 0.8 20 Notes: Marketable reserve tons are reported on a moist basis, including a combination of surface and inherent moisture. Coal quality is based on a weighted average of laboratory data from core hole. The combination of surface and inherent moisture is modeled at 6.5-percent. Actual product moisture is dependent upon multiple geological factors, operational factors, and product contract specifications and can exceed 8-percent. As such, the modeled moisture values provide a level of conservatism for reserve reporting. *Volatile Matter analysis is not available for the Beckley seam reserve areas. The Beckley reserves are priced as a Mid-Vol. product. Totals may not add due to rounding. See Appendix A for a detailed breakdown. In summary, Alpha controls a total of 41.19 Mt (moist basis) of marketable coal reserves at Kepler as of December 31, 2023. Of that total, 56 percent are proven, and 44 percent are probable. Of the 41.19 Mt tons, 15.07 Mt are permitted coal reserves and 26.13 Mt are not permitted coal reserves. The maps included in Appendix C reflect mining depletion at the time of the resource/reserve calculation taken from Alpha mine maps as of September 30, 2023. Mine depletion tonnages were supplied by Alpha through the end of 2023, and MM&A deducted fourth quarter production from the mapped reserves in order to estimate reserves as of December 31, 2023. 1.8 Capital Summary Alpha provided MM&A with information related to the number of currently operating production units at Kepler. MM&A’s capital schedules assume that major equipment rebuilds occur over the course of each machine’s remaining assumed operating life. Replacement equipment was scheduled based on MM&A’s experience and knowledge of mining equipment and industry standards with respect to the useful life of such equipment. As one mine is depleted, the equipment is moved to its replacement. The capital expenditures tables detail costs for major equipment and infrastructure such as conveyor belt terminal groups. “Other” costs include expenditures for mine access and construction, mine extension capital and miscellaneous costs. A summary of the estimated capital for the consolidated Kepler operations is provided in Figure 1-2 below. Alpha Metallurgical Resources, Inc. Statement of Coal Resources and Reserves for the Kepler Complex in Accordance with United States SEC Standards as of December 31, 2023 Central Appalachian Coal Basin West Virginia, USA MARSHALL MILLER & ASSOCIATES, INC. 14 Figure 1-2: Projected Capital Expenditures – Consolidated Kepler Operations 1.9 Operating Costs Alpha provided historical operating costs for its active Road Fork #52 mine from 2021 through 2023 for MM&A’s review. MM&A used the historical cost information as a reference and developed a personnel schedule for the mine. Hourly labor rates and salaries were based upon information contained in Alpha’s financial summaries. Fringe benefit costs were developed for vacation and holidays, federal and state unemployment insurance, retirement, workers’ compensation and pneumoconiosis, casualty and life insurance, healthcare and bonuses. A cost factor for mine supplies was developed that relates expenditures to mine advance rates for roof control costs and other mine supply costs based on the historical cost data provided by Alpha. Other factors were developed for maintenance and repair costs, rentals, mine power, outside services, coal preparation plant processing, refuse handling, coal loading, property taxes, and insurance and bonding and other direct mining costs. Appropriate royalty rates were assigned for production from leased coal lands and sales taxes were calculated for state severance taxes, the federal black lung excise tax, and federal and state reclamation fees. Company-wide pricing data as provided by Alpha is described in Table 16-2. Note that not all products reflected in Table 16-2 will apply to every business unit. The pricing data assumes a flat-line long term realization of $163 per short ton port pricing, with an average of $136.74 per ton netback pricing reflective of the low-volatile product currently sold at Kepler. These estimates are based on long-term

Alpha Metallurgical Resources, Inc. Statement of Coal Resources and Reserves for the Kepler Complex in Accordance with United States SEC Standards as of December 31, 2023 Central Appalachian Coal Basin West Virginia, USA MARSHALL MILLER & ASSOCIATES, INC. 15 pricing published by third-party sources and adjusted for quality and transportation. The netback pricing represents adjustments made to published benchmark pricing based on quality and transportation. A large majority of the coal sold by Alpha and their Kepler business group is shipped internationally as part of blended products from other business units within Alpha or sourced from other companies. These netback adjustments reflect these additional costs carried after the products leave the Kepler business unit. A summary of the projected operating costs for the consolidated Kepler operations is provided in Figure 1-3. Figure 1-3: Kepler Operating Costs 1.10 Economic Evaluation The pre-feasibility financial model prepared for this TRS was developed to test the economic viability of each coal resource area. The results of this financial model are not intended to represent a bankable feasibility study, required for financing of any current or future mining operations contemplated for the Alpha properties, but are intended to establish the economic viability of the estimated coal reserves. Cash flows are simulated on an annual basis based on projected production from the coal reserves. The discounted cash flow analysis presented herein is based on an effective date of January 1, 2024. On an un-levered basis, the NPV of the project cash flow after taxes represents the Enterprise Value of the project. The project cash flow, excluding debt service, is calculated by subtracting direct and Alpha Metallurgical Resources, Inc. Statement of Coal Resources and Reserves for the Kepler Complex in Accordance with United States SEC Standards as of December 31, 2023 Central Appalachian Coal Basin West Virginia, USA MARSHALL MILLER & ASSOCIATES, INC. 16 indirect operating expenses and capital expenditures from revenue. Direct costs include labor, operating supplies, maintenance and repairs, facilities costs for materials handling, coal preparation, refuse disposal, coal loading, reclamation and general and administrative costs. Indirect costs include statutory and legally agreed upon fees related to direct extraction of the mineral. The indirect costs are the Federal black lung tax, Federal and State reclamation taxes, property taxes, coal production royalties, and income taxes. The Alpha mines’ historical costs provided a useful reference for MM&A’s cost estimates. Table 1-3 shows LOM tonnage, P&L, and EBITDA for each Alpha mine at Kepler. Table 1-3: Life-of-Mine Tonnage, P&L before Tax, and EBITDA Mine LOM Tonnage LOM Pre-Tax P&L P&L Per Ton LOM EBITDA EBITDA Per Ton P3 North 11,369 $193,042 $16.98 $444,423 $39.09 Road Fork 52 25,267 $957,448 $37.89 $1,310,357 $51.86 Sewell #1 584 $492 $0.84 $12,020 $20.59 Sewell #2 4,442 $139,620 $31.43 $205,199 $46.20 Consolidated Deep Mines 41,661 $1,290,603 $30.98 $1,971,999 $47.33 Note: (1) LOM tonnage evaluated in the financial model includes 4th quarter 2023 production (470,621 clean tons) which was subtracted from coal reserves in order to make the effective date of the reserves December 31, 2023. As shown in Table 1-3, all of the mines analyzed show positive EBITDA over the LOM. Overall, the Alpha consolidated Kepler operations show positive LOM P&L and EBITDA of $1.3 billion and $2.0 billion, respectively. Alpha’s consolidated Kepler cash flow summary in constant dollars, excluding debt service, is shown in Table 1-4 below. Table 1-4: Project Cash Flow Summary (000) YE 12/31 YE 12/31 YE 12/31 YE 12/31 YE 12/31 YE 12/31 Total 2023 2024 2025 2026 2027 2028 Production & Sales tons 41,661 480 2,020 2,024 1,966 2,000 1,833 Total Revenue $5,696,747 $65,625 $276,149 $276,792 $268,773 $273,450 $250,667 EBITDA $1,971,999 $27,748 $117,271 $116,970 $109,709 $112,637 $93,999 Net Income $1,013,371 $18,889 $72,511 $71,788 $67,804 $71,058 $56,276 Net Cash Provided by Operating Activities $1,694,767 $17,465 $80,201 $97,518 $92,951 $93,789 $83,260 Purchases of Property, Plant, and Equipment ($457,193) $0 ($12,611) ($18,503) ($16,973) ($5,352) ($15,020) Net Cash Flow $1,237,574 $17,465 $67,590 $79,015 $75,977 $88,437 $68,240 YE 12/31 YE 12/31 YE 12/31 YE 12/31 YE 12/31 YE 12/31 YE 12/31 2029 2030 2031 2032 2033 2034 2035 Production & Sales tons 1,774 2,175 2,422 2,412 2,321 2,191 1,919 Total Revenue $242,533 $297,477 $331,226 $329,767 $317,322 $299,582 $262,458 EBITDA $86,355 $102,549 $128,106 $124,932 $116,170 $105,672 $79,801 Net Income $49,477 $53,749 $70,552 $70,742 $62,650 $56,781 $27,841 Net Cash Provided by Operating Activities $75,507 $83,644 $103,490 $107,124 $101,210 $92,588 $76,325 Purchases of Property, Plant, and Equipment ($23,888) ($33,594) ($33,119) ($7,544) ($29,907) ($8,640) ($87,478) Net Cash Flow $51,619 $50,050 $70,371 $99,580 $71,303 $83,948 ($11,153)

Alpha Metallurgical Resources, Inc. Statement of Coal Resources and Reserves for the Kepler Complex in Accordance with United States SEC Standards as of December 31, 2023 Central Appalachian Coal Basin West Virginia, USA MARSHALL MILLER & ASSOCIATES, INC. 17 YE 12/31 YE 12/31 YE 12/31 YE 12/31 YE 12/31 YE 12/31 YE 12/31 2036 2037 2038 2039 2040 2041 2042 Production & Sales tons 1,971 1,695 1,365 945 908 617 537 Total Revenue $269,482 $231,805 $186,637 $129,236 $124,211 $84,306 $73,369 EBITDA $93,986 $60,648 $51,169 $35,345 $37,842 $27,951 $22,899 Net Income $39,712 $17,855 $13,314 $11,502 $12,511 $7,653 $13,766 Net Cash Provided by Operating Activities $81,910 $64,660 $52,342 $21,581 $31,705 $27,130 $22,465 Purchases of Property, Plant, and Equipment ($22,306) ($4,320) ($11,545) ($7,200) ($19,673) ($7,275) $0 Net Cash Flow $59,604 $60,340 $40,797 $14,381 $12,031 $19,855 $22,465 YE 12/31 YE 12/31 YE 12/31 YE 12/31 YE 12/31 YE 12/31 YE 12/31 2043 2044 2045 2046 2047 2048 2049 Production & Sales tons 540 526 552 503 470 458 459 Total Revenue $73,905 $71,869 $75,453 $68,726 $64,237 $62,570 $62,806 EBITDA $23,529 $21,729 $25,193 $18,747 $14,491 $12,781 $13,123 Net Income $14,673 $9,842 $12,331 $7,509 $5,192 $3,549 $3,831 Net Cash Provided by Operating Activities $21,113 $19,738 $21,647 $18,247 $14,231 $12,090 $12,041 Purchases of Property, Plant, and Equipment ($4,320) ($11,751) ($5,543) ($6,583) ($7,200) ($7,200) $0 Net Cash Flow $16,793 $7,987 $16,104 $11,664 $7,031 $4,890 $12,041 YE 12/31 YE 12/31 YE 12/31 YE 12/31 YE 12/31 YE 12/31 YE 12/31 2050 2051 2052 2053 2054 2055 2056 Production & Sales tons 462 465 502 528 552 573 570 Total Revenue $63,240 $63,563 $68,583 $72,152 $75,415 $78,354 $77,924 EBITDA $13,651 $13,949 $18,445 $21,939 $25,019 $27,791 $27,496 Net Income $2,937 $3,215 $7,139 $10,870 $13,783 $15,042 $13,419 Net Cash Provided by Operating Activities $12,480 $12,845 $16,034 $19,137 $21,215 $23,022 $23,356 Purchases of Property, Plant, and Equipment ($13,687) ($11,914) ($4,320) $0 $0 ($9,863) ($9,863) Net Cash Flow ($1,207) $931 $11,714 $19,137 $21,215 $13,159 $13,493 YE 12/31 YE 12/31 YE 12/31 YE 12/31 YE 12/31 YE 12/31 YE 12/31 2057 2058 2059 2060 2061 2062 2063 Production & Sales tons 570 359 0 0 0 0 0 Total Revenue $78,004 $49,080 $0 $0 $0 $0 $0 EBITDA $27,435 $15,260 ($192) ($76) ($38) ($20) ($10) Net Income $15,805 $8,476 ($385) ($152) ($77) ($39) ($20) Net Cash Provided by Operating Activities $23,769 $19,533 ($1,559) ($520) ($260) ($130) ($130) Purchases of Property, Plant, and Equipment $0 $0 $0 $0 $0 $0 $0 Net Cash Flow $23,769 $19,533 ($1,559) ($520) ($260) ($130) ($130) (1) LOM tonnage evaluated in the financial model includes 4th quarter 2023 production (470,621 clean tons) which was subtracted from coal reserves in order to make the effective date of the reserves December 31, 2023. (2) Results shown for 2023 represent 4th quarter only. Consolidated cash flows are driven by annual sales tonnage, which grows from 2.0 million tons in 2024 to a peak of 2.4 million tons in 2031. Between years 2032 and 2038, sales ranges from 1.4 million to 2.4 million tons and between years 2039-2058, sales range from 0.4 million tons to 0.9 million tons. Projected consolidated revenue grows from $276.1 million in 2024 to a peak of $331.2 million in 2031. Revenue totals $5.7 billion for the project’s life. Consolidated cash flow from operations is positive throughout the projected operating period, with the exception of post-production years, due to end-of-mine reclamation spending. Consolidated cash flow from operations peaks at $107.1 million in 2032 and totals $1.7 billion over the project life. Capital expenditures total $53.4 million during the first five years and $457.2 million over the project’s life. Alpha Metallurgical Resources, Inc. Statement of Coal Resources and Reserves for the Kepler Complex in Accordance with United States SEC Standards as of December 31, 2023 Central Appalachian Coal Basin West Virginia, USA MARSHALL MILLER & ASSOCIATES, INC. 18 1.10.1 Discounted Cash Flow Analysis Cash flow after tax, but before debt service, generated over the life of the project was discounted to NPV at a 16.57% discount rate, which represents MM&A’s estimate of the constant dollar, risk adjusted WACC for likely market participants if the subject reserves were offered for sale. On an un-levered basis, the NPV of the project cash flows represents the Enterprise Value of the project and amounts to $427.1 million. Alpha is an active producer, and the financial model shows positive net cash flow for each year of the operating life of the Kepler reserves. The pre-feasibility financial model prepared for the TRS was developed to test the economic viability of each coal resource area. The NPV estimate was made for the purpose of confirming the economics for classification of coal reserves and not for purposes of valuing Alpha or its Kepler assets. Mine plans were not optimized, and actual results of the operations may be different, but in all cases, the mine production plan assumes the properties are under competent management. 1.10.2 Sensitivity Analysis Sensitivity of the NPV results to changes in the key drivers is presented in the chart below. The sensitivity study shows the NPV at the 16.57% discount rate when Base Case sales prices, operating costs, capital costs, and discount rate are increased and decreased in increments of 5% within a +/- 15% range. Figure 1-4: Sensitivity of NPV

Alpha Metallurgical Resources, Inc. Statement of Coal Resources and Reserves for the Kepler Complex in Accordance with United States SEC Standards as of December 31, 2023 Central Appalachian Coal Basin West Virginia, USA MARSHALL MILLER & ASSOCIATES, INC. 19 As shown, NPV is quite sensitive to changes in sales price and operating cost estimates, and slightly sensitive to changes in capital cost estimates. 1.11 Permitting Alpha has obtained all mining and discharge permits to operate its active mines and processing, loadout or related support facilities. MM&A is unaware of any obvious or current Alpha permitting issues that are expected to prevent the issuance of future permits. Kepler, along with all coal producers, is subject to a level of uncertainty regarding future clean water permits due to United States Environmental Protection Agency (EPA) and United States Fish and Wildlife Service (USFW) involvement with state programs. 1.12 Conclusion and Recommendations Sufficient data has been obtained through various exploration and sampling programs and mining operations to support the geological interpretations of seam structure and thickness for coal horizons situated on the Kepler Property. The data is of sufficient quantity and reliability to reasonably support the coal resource and coal reserve estimates in this TRS. The geological data and preliminary feasibility study, which consider mining plans, revenue, and operating and capital cost estimates are sufficient to support the classification of coal reserves provided herein. This geologic evaluation conducted in conjunction with the preliminary feasibility study concludes that the 41.2 Mt of marketable underground coal reserves identified on the Property are economically mineable under reasonable expectations of market prices for metallurgical coal products, estimated operation costs, and capital expenditures. 2 Introduction 2.1 Registrant and Terms of Reference This report was prepared for the sole use of Alpha Metallurgical Resources, Inc. (Alpha) and its affiliated and subsidiary companies and advisors. The report provides a statement of coal reserves for Alpha. Exploration results and Resource calculations were used as the basis for the mine planning and the preliminary feasibility study completed to determine the extent and viability of the reserve. The report provides a statement of coal resources and coal reserves for Alpha, as defined under the United States Securities and Exchange Commission (SEC). Alpha Metallurgical Resources, Inc. Statement of Coal Resources and Reserves for the Kepler Complex in Accordance with United States SEC Standards as of December 31, 2023 Central Appalachian Coal Basin West Virginia, USA MARSHALL MILLER & ASSOCIATES, INC. 20 2.2 Information Sources The updated technical report is based on information provided by Alpha and reviewed by MM&A’s professionals, including geologists, mining engineers, civil engineers, and environmental scientists. MM&A’s professionals hold professional registrations and memberships which qualify them as Qualified Persons in accordance with SEC regulations. Sources of data and information are listed below in Table 2-1: Table 2-1: Information Provided to MM&A by Alpha Category Information Provided by Alpha Report Section Geological Geologic data including digital databases and original source data including geologist logs, driller’s logs, geophysical logs. 9.1 Coal Quality Database of coal quality information supplemented with original source laboratory sheets where available. 10.1 Mining Historical productivities and manpower projections. 13.2, 13.4 Coal Preparation Flow Sheet and other information related to coal processing. 14.1 Waste Disposal Engineering data and estimates representing remaining capacities for coarse and fine coal waste disposal. 17.2 Costs Historical and budgetary operating cost information used to derive cost drivers for reserve financial modeling 18.2 Note: While the sources of data listed in Table 2-1 are not exhaustive, they represent a significant portion of information which supports this TRS. MM&A reviewed the provided data and found it to be reasonable prior to incorporating it into the TRS. The TRS contains “forward-looking information” including forecasts of productivity and annual coal production, operating and capital cost estimates, coal sales price forecasts, the assumption that Alpha will continue to acquire necessary permits, and other assumptions. The TRS statements and conclusions are not a guarantee of future performance and undue reliance should not be placed on them. The ability of Alpha to recover the estimated coal reserves is dependent on multiple factors beyond the control of MM&A including, but not limited to geologic factors, mining conditions, regulatory approvals, and changes in regulations. In all cases, the plans assume the Property is under competent management. 2.3 Scope of Assignment Alpha engaged MM&A to conduct a coal reserve evaluation of the Alpha coal properties as of December 31, 2023. For the evaluation, the following tasks were to be completed: > Conduct site visits of the mines and mine infrastructure facilities; > Process the information supporting the estimation of coal resources and reserves into geological models; > Develop life-of-reserve mine (LOM) plans and financial models; > Hold discussions with Alpha company management; and > Prepare and issue a Technical Report Summary providing a statement of coal reserves which would include: - A description of the mines and facilities. - A description of the evaluation process.

Alpha Metallurgical Resources, Inc. Statement of Coal Resources and Reserves for the Kepler Complex in Accordance with United States SEC Standards as of December 31, 2023 Central Appalachian Coal Basin West Virginia, USA MARSHALL MILLER & ASSOCIATES, INC. 21 - An estimation of coal reserves with compliance elements as stated under the new SEC Guidelines which will become effective for the first fiscal year commencing on or after January 1, 2021. 2.4 Personal Inspections MM&A is very familiar with Kepler, having provided a variety of services in recent years and QP’s involved in this TRS have conducted multiple site visits. 3 Property Description 3.1 Location The Kepler Mine Complex is located in the Central Appalachian Basin in southern West Virginia (see Figure 1-1) approximately 2 miles west of Pineville, the county seat of Wyoming County and 25 miles west southwest of Beckley, which is the county seat of Raleigh County. Surface facilities for the operation are located along the Guyandotte River near the Road Fork #52 portal and adjacent to a Norfolk Southern rail line. Numerous small communities are present throughout the Property such as Marianna, Slab Fork, and Wyoming. The nearest major population centers are Charleston, West Virginia (53 miles north), Bristol, Virginia (75 miles south), Roanoke, Virginia (90 miles east), and Morgantown, West Virginia (166 miles north), and Lexington, KY (165 miles west) . The Property is located on the following United States Geological Survey (USGS) Quadrangles: Oceana, Matheny, McGraws, Gilbert, Baileysville, Pineville, Mullens, Rhodell, Iaeger, Davy, Welch, Keystone, Crumpler, and Matoaka. The coordinate system and datum used for the model of the Kepler Mine complex and the subsequent maps were produced in the West Virginia State Plane South system, NAD 27. 3.2 Titles, Claims or Leases The Property is composed of approximately 98,000 total acres of mineral control, nearly all of which is leased. Alpha’s control is comprised of over 9 separate leases with varying expiration dates. Some leases expire over the next several years, but Alpha does not anticipate any challenges related to lease renewal. Table 3-1 lists the Kepler mineral leases. MM&A has not carried out a separate title verification for the coal properties and has not verified leases, deeds, surveys or other property control instruments pertinent to the subject resources. Alpha has represented to MM&A that it controls the mining rights to the reserves as shown on its property maps, and MM&A has accepted these as being a true and accurate depiction of the mineral rights controlled by Alpha. The TRS assumes the Property is developed under responsible and experienced management. Alpha Metallurgical Resources, Inc. Statement of Coal Resources and Reserves for the Kepler Complex in Accordance with United States SEC Standards as of December 31, 2023 Central Appalachian Coal Basin West Virginia, USA MARSHALL MILLER & ASSOCIATES, INC. 22 Table 3-1: Mineral Control – Kepler Complex Reference File Number Document Type Expiration Date (1) On-going Minimum Royalty (2) On-going Production Royalty (3) KD 1 Deed N/A N/A N/A KD 2 Deed N/A N/A N/A KD 3 Deed N/A N/A N/A KD 4 Deed N/A N/A N/A KL 1 Lease 9/27/2024 Yes Yes KL 2 Lease Exhaustion Yes Yes KL 3 Lease 1/27/2040 Yes Yes KL 4 Lease 5/5/2024 Yes Yes KL 5 Lease 4/30/2026 Yes Yes KL 6 Lease 2/28/2028 Yes Yes KL 7 Lease 4/15/2027 Yes Yes KL 8 Lease 7/31/2050 Yes Yes KL 9 Lease 1/1/2027 Yes Yes (1) For leases with expiration dates, Company has option to renew or expects to renew until all mineable and merchantable coal is exhausted (2) Minimum royalty payments are generally recoupable against future production royalties. (3) Royalty rates range from 4% to 7% of gross selling price 3.3 Mineral Rights Alpha supplied property control maps to MM&A related to properties for which mineral and/or surface property are controlled by Alpha. While MM&A accepted these representations as being true and accurate, through past knowledge of the Property MM&A has no knowledge of past property boundary disputes or other concerns that could impact future mining operations or development potential. Property control in Appalachia can be intricate. Coal mining properties are typically composed of numerous property tracts which are owned and/or leased from both land holding companies and private individuals or companies. It is common to encounter severed ownership, with different entities or individuals controlling the surface and mineral rights. Mineral control in the region is typically characterized by leases or ownership of larger tracts of land, with surface control generally comprised of smaller tracts, particularly in developed areas. Control of the surface property is necessary to conduct surface mining but is not necessary to conduct underground mining aside from relatively limited areas required for seam access or ventilation infrastructure. Alpha’s executive management team has a history of mining in Central Appalachia and has conveyed to MM&A that it has been successful in acquiring surface rights where needed for past operations. 3.4 Encumbrances No Title Encumbrances are known. By assignment, MM&A did not complete a query related to Title Encumbrances.

Alpha Metallurgical Resources, Inc. Statement of Coal Resources and Reserves for the Kepler Complex in Accordance with United States SEC Standards as of December 31, 2023 Central Appalachian Coal Basin West Virginia, USA MARSHALL MILLER & ASSOCIATES, INC. 23 3.5 Other Risks There is always risk involved in property control. As is common practice, Alpha, and its predecessors, have had their legal teams examine the deeds and title control in order to minimize this risk. Historically, property control has not posed any significant challenges related to Kepler’s operations. 4 Accessibility, Climate, Local Resources, Infrastructure and Physiography 4.1 Topography, elevation and Vegetation The topography of the area surrounding the Kepler mine complex is typical of the Central Appalachian Plateau’s physiographic province, being rugged and deeply dissected by v-shaped river valleys and flanked by steep-sided upland regions. Slopes in the area are mostly steep to very steep with some gently sloping with relatively narrow ridges. Surface elevations near the mine complex range from approximately 1,200 feet above sea level at streams to approximately 2,200 feet at ridge tops. The area is heavily vegetated and has a significant amount of hardwood forests. The Property is not situated near any major urban centers. 4.2 Access and Transport There is general access to the Kepler property via a well-developed network of primary, secondary, and unimproved roads. Interstates 64 and 77 converge at Beckley, West Virginia, and are the primary roads in the area connecting Beckley, Charleston, and Huntington, West Virginia, to the West and Lexington, Virginia, to the East. Numerous secondary and unimproved roads provide direct access to the mine property, some being federal-, state-, and town-maintained. These include State Route 97 running east-west and State Route 16 running north-south from Pineville to Welch and east-west from Pineville to Mullens. These roads typically stay open throughout the year. Within the Property, unimproved roads are utilized to access gas drainage wells and surface based deep mine infrastructure. An Alpha- owned loadout area and a Norfolk Southern rail line are located approximately 2 miles west of the town of Pineville and serve as the primary transport means of processed coal. Kepler also has access to the CSX rail line through the Feats loadout located near Holden, West Virginia along State Route 119. 4.3 Proximity to Population Centers The Kepler Mine Complex is located near the towns of Pineville and Welch and communities of Marianna, Wyoming, New Richmond and Itmann, primarily in Wyoming County, West Virginia, with small portions falling in Raleigh and McDowell Counties. There are no large population centers within close proximity. The nearest major population centers are Charleston, West Virginia (53 miles north), Bristol, Virginia (75 miles south), Roanoke, Virginia (90 miles east), and Morgantown, West Virginia (166 Alpha Metallurgical Resources, Inc. Statement of Coal Resources and Reserves for the Kepler Complex in Accordance with United States SEC Standards as of December 31, 2023 Central Appalachian Coal Basin West Virginia, USA MARSHALL MILLER & ASSOCIATES, INC. 24 miles north), and Lexington, KY (165 miles west). As of the 2010 census, Wyoming County had 23,796 residents. 4.4 Climate and Length of Operating Season The climate of the region is classified as humid continental with four distinct seasons: warm summers, cold winters, and moderate fall and spring seasons. Precipitation in the region is consistent throughout the year, approximately 3 to 5 inches per month, with the most rain falling in spring and the early months of summer. Average yearly precipitation is 45.8 inches. Summer months typically begin in late May and end in early September and range in average temperature from 50 to 83 degrees Fahrenheit. Winters typically begin in mid to late November and run until mid to late March with average temperatures ranging from 23 to 54 degrees Fahrenheit. Precipitation in the winter typically comes in the form of snowfall or as a wintery mix (sleet and snow) with severe snowfall events occurring occasionally. Seasonal variations in climate typically do not affect underground mining in West Virginia. However, weather events could potentially negatively impact efficiency of surface and preparation plant operations on a very limited basis and lasting less than a few days. 4.5 Infrastructure The Kepler Mine Complex has sources of water, power, personnel, and supplies readily available for use. Personnel have historically been sourced from the surrounding communities in Wyoming, Raleigh, McDowell Counties, and have proven to be adequate in numbers to conduct mining operations. As mining is common in the surrounding areas, the workforce is generally familiar with mining practices, and many are experienced miners. Water is sourced locally from public water sources or rivers, and electricity is sourced from Appalachian Power, a subsidiary of American Electric Power (AEP). The service industry in the areas surrounding the mine complex has historically provided supplies, equipment repairs and fabrication, etc. Alpha’s Kepler preparation plant services consumers with washed coal, which is transported via the adjacent Norfolk Southern rail line at the Kepler loadout or through the Feats loadout on the CSX rail line near Holden, WV. Haul roads, primary roads, and conveyor belt systems account for transport from the various active and planned mine sites to the preparation plant. 5 History 5.1 Previous Operation The Kepler property involves a complex combination of previous ownership. Coal mining in the area occurred for nearly a century. Predecessors of Alpha, namely Alpha Natural Resources (Alpha) and Massey Energy (Massey) previously held mining rights on the majority of the Property. The Alpha based portions of the Kepler property were acquired from the AMCI Group (AMCI) at Alpha’s inception

Alpha Metallurgical Resources, Inc. Statement of Coal Resources and Reserves for the Kepler Complex in Accordance with United States SEC Standards as of December 31, 2023 Central Appalachian Coal Basin West Virginia, USA MARSHALL MILLER & ASSOCIATES, INC. 25 in the mid-2000’s. The Massey based assets were combined with the AMCI and Alpha assets during Alpha’s acquisition of Massey in 2011. Additionally, reserves and resources associated with the former Pinnacle Mine (commonly referred to as Mine 50) were recently acquired by Alpha as a result of the Mission Coal bankruptcy. Mission Coal is the most recent operator of Mine 50 which utilized longwall mining methods in the Pocahontas No. 3 seam to produce low volatile coking coal. The Pinnacle based reserves have undergone multiple ownership changes, with recent controllers including, Cliffs Natural Resources, PinnOak Resources and US Steel. 5.2 Previous Exploration Extensive exploration in the form of subsurface drill efforts has been carried out on the Property by numerous entities, most of which efforts were completed prior to the inception of Alpha. Diamond core and rotary drilling are the primary types of exploration on the Property. Data for correlation and mining conditions are derived from core descriptions and geophysical logging (e-logging). Coal-quality analyses were also employed during the core-exploration process. The development of this report included an assessment of over 2,200 coal measurements, largely comprised of exploration drill holes. Drill records indicate that independent contract drilling operators have typically been engaged to carry out drilling on the Property. Geophysical logging was typically performed by outside logging firms. MM&A, via its Geophysical Logging Systems subsidiary, has logged a significant number of the past exploration holes, including most of the recently drilled holes. Drill hole locations used in this assessment are shown on the resource and reserve maps included in Appendix C. 6 Geological Setting, Mineralization and Deposit 6.1 Regional, Local and Property Geology The Property lies in the Central Appalachian Coal basin in the Appalachian Plateau physiographic province. The coal deposits in the eastern US are the oldest and most extensively developed coal deposits in the country. The coal deposits on the Property are Carboniferous in age, being of the Pennsylvanian system. Overall, these Carboniferous coals contain two-fifths of the US’s bituminous coal deposits and extend over 900 miles from northern Alabama to Pennsylvania and are part of what is known as the Appalachian Basin. The Appalachian Basin is more than 250 miles wide and, in some portions, contains over 60 coal seams of varying economic significance. Seams and zones of economic significance typically range between 24 and 48 inches in thickness, with relatively little structural deformation. Regional structure is typically characterized by gently dipping strata to the northwest at 1.0 to 4.0 percent, averaging 3.0 percent. Alpha Metallurgical Resources, Inc. Statement of Coal Resources and Reserves for the Kepler Complex in Accordance with United States SEC Standards as of December 31, 2023 Central Appalachian Coal Basin West Virginia, USA MARSHALL MILLER & ASSOCIATES, INC. 26 Strata on the Property are of the Pennsylvanian-age New River and Pocahontas Formations of the Pottsville Series. The rock formations between the coal seams are characterized by large proportions of sandstone interspersed with shale units. Seams mined or with remaining reserve or resource potential include, in stratigraphically ascending order the: Pocahontas No. 3 and No. 6 (in the Pocahontas Formation) and the Sewell (in the New River Formation). 6.2 Mineralization The generalized stratigraphic columnar section in Figure 6-1 demonstrates the vertical relationship of the principal coal seams and rock formations on the Property. Figure 6-1: Kepler Stratigraphic Column (not to scale) 6.3 Deposits The coal produced at the Kepler complex is mainly a low-volatile, typically under 21 percent volatile matter bituminous coal. Some coal exhibits localized higher volatile zones of approximately 23 percent. Due to the high value of these low-volatile coking coals, all of the seams have been extensively mined in the past. The coal seams reach the highest structural elevations along the southeastern margin of the Property, generally dipping toward the northwest. The seams of interest are all situated both above and below drainage. The Pocahontas No. 3 reserves are located below drainage. The Sewell reserves,

Alpha Metallurgical Resources, Inc. Statement of Coal Resources and Reserves for the Kepler Complex in Accordance with United States SEC Standards as of December 31, 2023 Central Appalachian Coal Basin West Virginia, USA MARSHALL MILLER & ASSOCIATES, INC. 27 located on the western portion of the Property, are located below drainage. The rock formations between the coal seams are characterized by large portions of sandstone with shale units interspersed throughout. 7 Exploration 7.1 Nature and Extent of Exploration The Property has been extensively explored by subsurface drilling efforts carried out by numerous entities, most of which were completed prior to ownership by Alpha. Diamond core and rotary drilling are the primary types of exploration on the Property. Diamond core drilling produces rock core samples from the hole. Data for coal bed correlations and strata mining conditions are derived from core descriptions and geophysical logging (e-logging). Geophysical logs are produced from a probe that surveys the drill hole void. Rock stratum types are interpreted from log signatures produced from the probe which commonly include a hole caliper, rock density and gamma readings. Coal-quality analyses were also employed during the core-exploration process. This study included analyzing over 2,200 measurements of coal thickness, largely composed of exploration drilling holes. Drill records indicate that independent contract drilling operators have typically been engaged to carry out drilling on the Property. Geophysical logging was typically performed by outside logging firms. MM&A, via its Geophysical Logging Systems subsidiary, has logged a significant number of the past exploration holes, and currently logs most of the recently drilled holes. The location of the drill holes is shown on the maps included in Appendix C. The concentration of exploration varies slightly across the Property. Drilling on the Property is typically sufficient for delineation of potential surface, highwall miner, and deep mineable benches. Core logging is carried out by professional geologists in cases where roof and floor strata are of particular interest and in cases where greater resolution and geologic detail are needed. However, most drill hole data come from simplified driller’s logs, which often lack specific details regarding geotechnical conditions and specific geology, making correlations and floor and roof conditions difficult to determine. Geophysical logging (e-logging) techniques, by contrast, document specific details useful for geologic interpretation and mining conditions. Given the variability of data-gathering methods, definitive mapping of future mining conditions may not be possible, but projections and assumptions can be made within a reasonable degree of certainty. A significant effort was put into verifying the integrity of the database. Once this was established, stratigraphic columnar sections were generated using cross-sectional analysis to establish or confirm coal seam correlations. Alpha Metallurgical Resources, Inc. Statement of Coal Resources and Reserves for the Kepler Complex in Accordance with United States SEC Standards as of December 31, 2023 Central Appalachian Coal Basin West Virginia, USA MARSHALL MILLER & ASSOCIATES, INC. 28 A typical cross-section is shown in Figure 7-1. Figure 7-1: Kepler Cross-Section Due to the long history of exploration by various parties on the Property, a wide variety of survey techniques exist for documentation of data point locations. Many of the older exploration drill holes appear to have been located by survey and more recently completed drill holes are often located by high-resolution Global Positioning System (GPS) units. However, some holes appear to have been approximately located using USGS topography maps or other methods which are less accurate. Therefore, discretion had to be used regarding the accuracy for the location and ground surface elevation of some of these older drill holes. In instances where a drill hole location (or associated coal seam elevations) appeared to be inconsistent with the overall structural trend (or surface topography for surface-mineable areas), the data point was not honored for geological modeling. Others with apparently minor variances were adjusted or then used by MM&A.

Alpha Metallurgical Resources, Inc. Statement of Coal Resources and Reserves for the Kepler Complex in Accordance with United States SEC Standards as of December 31, 2023 Central Appalachian Coal Basin West Virginia, USA MARSHALL MILLER & ASSOCIATES, INC. 29 Surveying of the underground and surface mined areas has been performed by the mine operators and/or their consulting surveyors. By assignment, MM&A did not verify the accuracy or completeness of supplied mine maps but accepted this information as being the work of responsible engineers and surveyors, as required by both State and Federal Law. MM&A compiled comprehensive topographic map files by selecting the best available aerial mapping for each area and filling any gaps with digital USGS topographic mapping. 7.2 Non-Drilling Procedures and Parameters Some analyses, specifically ultimate ash and sulfur types are not as prevalent as others in the testing done on samples recovered by drilling. To supplement the information database, samples have been provided from train shipments from the Kepler plant. 7.3 Drilling Procedures Core drilling methods utilize NX-size (21/8 inch) or similar-sized core cylinders to recover core samples, which can be used to delineate geologic characteristics, and for coal quality testing and geotechnical logging. For the core holes, the geophysical logs are especially useful in verifying the core recovery of both the coal samples (for assurance that sample is representative of the full seam) and of the roof and floor rock samples (for evaluating ground control characteristics of deep mineable coal seams). In addition to the core holes, rotary drilled holes also exist on most of the Property. Data for the rotary drilled holes is mainly derived from downhole geophysical logs, which are used to interpret coal and rock thickness and depth since logging of the drill cuttings is not reliable. A wide variety of core-logging techniques exist for the Property. For many of the core holes, the primary data source is a generalized lithology description by the driller, typically supplemented by a more detailed core log completed by a geologist. These drilling logs were provided to MM&A as a geological database. MM&A geologists were not involved in the production of original core logs but did perform a basic check of information within the provided database. Where geophysical logs for such holes are available, they were used by MM&A geologists to verify the coal thickness and core recovery of seams. 7.4 Hydrology Hydrologic testing and forecasting are necessary parts of the permitting process and as such are routinely considered in the mine planning process. Kepler has a lengthy history of operation and one currently active mine and multiple previously active mines with no significant hydrologic concerns or material issues experienced in its history. Future mining is projected to occur in areas exhibiting similar hydrogeological conditions as past mining. Based upon the successful history of the operation with regards to hydrogeological features, MM&A assumes that the operation will not be hindered by such issues in the future. Alpha Metallurgical Resources, Inc. Statement of Coal Resources and Reserves for the Kepler Complex in Accordance with United States SEC Standards as of December 31, 2023 Central Appalachian Coal Basin West Virginia, USA MARSHALL MILLER & ASSOCIATES, INC. 30 7.5 Geotechnical Data Life-of-Mine (LOM) Mining plans for potential underground mines were developed by MM&A through incorporation of budget maps from Alpha. Pillar stability was tested by MM&A using the Analysis of Coal Pillar Stability (ACPS) program that was developed by the National Institute for Occupational Safety and Health (NIOSH). MM&A reviewed the results from the ACPS analysis and considered it in the development of the LOM plan. Coal and rock strengths from core testing are used to verify the empirical assumptions integral to ACPS. 8 Sample Preparation Analyses and Security 8.1 Prior to Sending to the Lab Most of the coal samples have been obtained from the Property by subsurface exploration using core drilling techniques. The protocol for preparing and testing the samples has varied over time and is not well documented for the older holes drilled on the Property. Typical US core drilling sampling technique is for the coal core sample, once recovered from the core barrel, to be described then wrapped in a sealed plastic sleeve and placed into a covered core box, which is the length of the sample so that the core can be delivered to a laboratory in relatively intact condition and with original moisture content. The core identification number and the depth are scribed on the sample box lid to identify the sample. This process has been the norm for both historical and ongoing exploration activities at Kepler. This work is typically performed by the supervising driller, geologist or company personnel. Samples are most often delivered to the company by the driller after each shift or acquired by company personnel or representatives. Most of the coal core samples were obtained by previous operators on the Property. MM&A did not participate in the collection, sampling and analysis of the majority of core samples within the exploration database. However, it is reasonable to assume, given the sophistication level of the previous operators, that these samples were generally collected and processed under industry best-practices. This assumption is based on MM&A’s familiarity with the operating companies and the companies used to perform the analysis. In addition to the steps taken to ensure the accuracy of the historical data as described above, Alpha reports the company employs a detailed chain of custody process during their current sampling programs. This chain of custody process follows the sample from the time it is drilled until the final quality results are entered into a database for preparation of geologic models. 8.2 Lab Procedures Coal quality testing has been performed over many years by operating companies using different laboratories and testing regimens. Some of the samples have raw analyses and washabilities on the

Alpha Metallurgical Resources, Inc. Statement of Coal Resources and Reserves for the Kepler Complex in Accordance with United States SEC Standards as of December 31, 2023 Central Appalachian Coal Basin West Virginia, USA MARSHALL MILLER & ASSOCIATES, INC. 31 full seam (with coal and rock parting layers co-mingled) and are mainly useful for characterizing the coal quality for projected production from underground and highwall mining. Other samples have coal and rock analyzed separately, the results of which can be manipulated to forecast either surface or underground mining quality. Care has been taken to use only those analyses that are representative of the coal quality parameters for the appropriate mining type for each sample. Standard procedure upon receipt of core samples by the testing laboratory is to log the depth and thickness of the sample, then perform testing as specified by a representative of the operating company. Each sample is then analyzed in accordance with procedures defined under ASTM International (ASTM) standards including, but not limited to; washability (ASTM D4371); ash (ASTM D3174); sulfur (ASTM D4239); Btu/lb. (ASTM D5865); volatile matter (ASTM D3175); and Free Swell Index (FSI) (ASTM D720). 9 Data Verification 9.1 Procedures of Qualified Person MM&A reviewed the Alpha-supplied digital geologic database and supplemented the database with its own in-house records which have been maintained for both Alpha and previous operators of the Property. The database consists of data records, which include drill hole information for holes that lie within and adjacent to the Property and records for numerous supplemental coal seam thickness measurements. Once the initial integrity of the database was established, stratigraphic columnar sections were generated using cross-sectional analysis to establish or confirm coal seam correlations. Geophysical logs were used wherever available to assist in confirming the seam correlation and to verify proper seam thickness measurements and recovery of coal samples. After establishing and/or verifying proper seam correlation, seam data control maps and geological cross-sections were generated and again used to verify seam correlations and data integrity. Once the database was fully vetted, seam thickness, base-of-seam elevation, roof and floor lithology, and overburden maps were independently generated for use in the mine planning process. Coal quality was analyzed and summarized by MM&A’s team of geologists and engineers. Quality was provided by Alpha in various database formats, laboratory data sheets, and also obtained directly from MM&A’s files. Care was taken to ensure that sampled data was representative of the mineable section. In instances where minimal representative data was noted, geological tonnages were estimated based upon applying assumed densities of coal and non-coal material to thicknesses expressed in geological database files. Alpha Metallurgical Resources, Inc. Statement of Coal Resources and Reserves for the Kepler Complex in Accordance with United States SEC Standards as of December 31, 2023 Central Appalachian Coal Basin West Virginia, USA MARSHALL MILLER & ASSOCIATES, INC. 32 9.2 Limitations As with any exploration program, localized anomalies cannot always be discovered. The greater the density of the samples taken, the less the risk. Once an area is identified as being of interest for inclusion in the mine plan, additional samples are taken to help reduce the risk in those specific areas. In general, provision is made in the mine planning portion of the study to allow for localized anomalies that are typically classed more as a nuisance than a hinderance. 9.3 Opinion of Qualified Person Sufficient data has been obtained through various exploration and sampling programs and mining operations to support the geological interpretations of seam structure and thickness for coal horizons situated on the Kepler Property. The data is of sufficient quantity and reliability to reasonably support the coal resource and coal reserve estimates in this TRS. 10 Mineral Processing and Metallurgical Testing 10.1 Testing Procedures Basic chemical analyses (both raw and washed quality), petrographic data, rheological data and ash, ultimate and sulfur analysis are available but not summarized for this filing. Available coal quality data sourced from MM&A’s vaults (associated with former projects for Alpha and its predecessors) was tabulated by resource area in a Microsoft® EXCEL workbook. Such data contained laboratory sheets which MM&A utilized to confirm that sampled intervals were representative of geological models and confirm that appropriate laboratory procedures were utilized to derive raw and clean coal parameters. Additionally, Alpha provided MM&A with a database of its own in-house coal quality information which did not include backup laboratory information or sampled intervals. MM&A compared wash recovery values from Alpha’s dataset to proximal holes with wash recovery data in MM&A’s dataset and calculated estimates of wash recovery based upon the relative percentages of coal and rock from lithologic descriptions. In general, MM&A found that Alpha’s dataset was representative and appropriate for inclusion in coal quality summaries. Quality tables also provide basic statistical analyses of the coal quality datasets, including average value; maximum and minimum values; and the number of samples available to represent each quality parameter of the seam. Coal samples that were deemed by MM&A geologists to be unrepresentative were not used for statistical analysis of coal quality, as documented in the tabulations. Specific to the surface mine reserve areas, exploration quality was supplemented with historical pit sampling. Tabulations were completed based upon annual arithmetic averages on in-pit samples for washed quality. The general consistency in quality suggests confidence in the mines’ ability to continue to produce a comparable metallurgical product.

Alpha Metallurgical Resources, Inc. Statement of Coal Resources and Reserves for the Kepler Complex in Accordance with United States SEC Standards as of December 31, 2023 Central Appalachian Coal Basin West Virginia, USA MARSHALL MILLER & ASSOCIATES, INC. 33 The amount and areal extent of coal sampling for geological data is generally sufficient to represent the quality characteristics of the coal horizons and allow for proper market placement of the subject coal seams. For some of the coal deposits, there are considerable laboratory data from core samples that are representative of the full extent of the resource area; and for others there are more limited data to represent the resource area. For example, in the active operations with considerable previous mining, there may be limited quality data within some of the remaining resource areas; however, in those cases the core sampling data can be supplemented with operational data from mining and shipped quality samples representative of the resource area. 10.2 Relationship of Tests to the Whole The extensive sampling and testing procedures typically followed in the Coal Industry result in an excellent correlation between samples and Marketable product. As shipped analyses of the coal from Kepler were reviewed to verify that the coal quality and characteristics were as expected. The Kepler Property has a long history of saleable production, under various owners, in the low and mid-volatile metallurgical markets, confirming exploration results. 10.3 Lab Information Each sample is analyzed at area Laboratories that operate in accordance with procedures defined under ASTM standards including, but not limited to; washability (ASTM D4371); ash (ASTM D3174); sulfur (ASTM D4239); Btu/lb. (ASTM D5865); volatile matter (ASTM D3175); and Free Swell Index (FSI) (ASTM D720). 10.4 Relevant Results No critical factors have been found that would adversely affect the recovery of the Reserve. Any quality issues that occur, either localized or generally, are accounted for in the Marketing Study done for this TRS. 11 Mineral Resource Estimates MM&A independently created a geologic model to define the coal resources at Kepler. Coal resources were estimated as of December 31, 2023. 11.1 Assumptions, Parameters and Methodology Geological data was imported into Carlson Mining® (formerly SurvCADD®) geological modelling software in the form of Microsoft® Excel files incorporating drill hole collars, seam and thickness picks, bottom seam elevations and raw and washed coal quality. These data files were validated prior to importing into the software. Once imported, a geologic model was created, reviewed, and verified- with a key Alpha Metallurgical Resources, Inc. Statement of Coal Resources and Reserves for the Kepler Complex in Accordance with United States SEC Standards as of December 31, 2023 Central Appalachian Coal Basin West Virginia, USA MARSHALL MILLER & ASSOCIATES, INC. 34 element being a gridded model of coal seam thickness. Resource tons were estimated by using the seam thickness grid based on each valid point of observation and by defining resource confidence arcs around the points of observation. Points of observation for Measured and Indicated confidence arcs were defined for all valid drill holes that intersected the seam using standards deemed acceptable by MM&A based on a detailed geologic evaluation and a statistical analysis of all drill holes within the projected reserve areas as described in Section 11.1.1. The geological evaluation incorporated an analysis of seam thickness related to depositional environments, adjacent roof and floor lithologies, and structural influences. After validating coal seam data and establishing correlations, the thickness and elevation for seams of economic interest were used to generate a geologic model. Due to the relative structural simplicity of the deposits and the reasonable continuity of the tabular coal beds, the principal geological interpretation necessary to define the geometry of the coal deposits is the proper modeling of their thickness and elevation. Both coal thickness and quality data are deemed by MM&A to be reasonably sufficient within the resource areas. Therefore, there is a reasonable level of confidence in the geologic interpretations required for coal resource determination based on the available data and the techniques applied to the data. Table 11-1 below provides the geological mapping and coal tonnage estimation criteria used for the coal resource and reserve evaluation. These cut-off parameters have been developed by MM&A based on its experience with Kepler properties and are typical of mining operations in the Central Appalachian coal basin. This experience includes technical and economic evaluations of numerous properties in the region for the purposes of determining the economic viability of the subject coal reserves. Table 11-1: General Reserve & Resource Criteria Item Parameters Technical Notes & Exceptions* • General Reserve Criteria Reserve Base Classification Reserve and Resource Coal resources as reported are inclusive or exclusive of coal reserves. Reliability Categories Reserve (Proven and Probable) Resource (Measured, Indicated & Inferred) To better reflect geological conditions of the coal deposits, distance between points of observation is determined via statistical analysis Effective Date of Resource Estimate December 31, 2023 Coal resources were estimated based upon depletion maps with effective dates of September 31, 2023 with a production depletion adjustment though 12/31/21. Effective Date of Reserve Estimate December 31, 2023 Coal reserves were estimated based upon depletion maps with effective dates of September 31, 2023 with a production depletion adjustment though 12/31/21. Seam Density With raw seam analysis: SG = 1.25+(Raw Ash% / 100 In the absence of laboratory data, estimated by (1) assuming specific gravity of 1.30 for coal and 2.25 for rock parting • Underground-Mineable Criteria Map Thickness Total seam thickness Minimum Seam Thickness 30 inches Minor Exceptions for localized zones of thinner coal Minimum Mining Thickness 54 inches Minimum Total Coal Thickness 27 inches Minor Exceptions for localized zones of thinner coal

Alpha Metallurgical Resources, Inc. Statement of Coal Resources and Reserves for the Kepler Complex in Accordance with United States SEC Standards as of December 31, 2023 Central Appalachian Coal Basin West Virginia, USA MARSHALL MILLER & ASSOCIATES, INC. 35 Item Parameters Technical Notes & Exceptions* Minimum In-Seam Wash Recovery Determined as function of seam thickness Wash Recovery Applied to Coal Reserves Based on average yield for drill holes within reserve area, or in the absence of laboratory washability data, based on estimated visual recovery using specific gravities noted above and 95 percent yield on "clean" coal Out-of-Seam Dilution Thickness for Run-of-Mine Tons Applied to ROM tonnages 2 inches Mine Barrier 200-foot distance from abandoned mines and sealed or pillared areas Minimum Reserve Tonnage 400 thousand recoverable tons for individual area (logical mining unit) Minimum Overburden Depth 100 feet Minimum Interval to Rider Coal Considered on a case-by-case basis, depending on interval lithology, etc. Minimum Interval to Overlying or Underlying Reserves Considered on a case-by-case basis, depending on interval lithology, extent and type of extraction, etc. Minimum Interval to Overlying or Underlying Mined Areas Considered on a case-by-case basis, depending on interval lithology, extent and type of extraction, etc. Adjustments Applied to Coal Reserves 6.5 percent moisture increase; 5 percent preparation plant inefficiency Note: Exceptions for application of these criteria to reserve estimation are made as warranted and demonstrated by either actual mining experience or detailed data that allows for empirical evaluation of mining conditions. Final classification of coal reserve is made based on the pre-feasibility evaluation. 11.1.1 Statistical Analysis MM&A completed two statistical analyses on drill holes within the reserve boundaries. The first analysis was performed in order to determine the applicability of the common United States classification system for measured and indicated coal resources. Historically, the United States has assumed that coal within ¼-mile (1,320 feet) of a point of observation represents a measured resource whereas coal between ¼-mile (1,320 feet and ¾-mile (3,960 feet) from a point of observation is classified as indicated. Inferred resources are commonly assumed to be located between ¾-mile (3,960 feet) and 3 miles (15,840 feet) from a point of observation. Per SEC regulations, only measured and indicated resources may be considered for reserve classification, respectively as proven and probable reserves. A general acceptable thickness variation for measured resources is approximately 20 percent. Thickness variations for indicated resources are assumed to average less than 30 percent, which is also comparable with historical standards. MM&A extracted drill hole information from within projected reserve areas of the Kepler complex, which included coordinates (northing and easting) and seam thickness. Drill holes included diamond core and rotary holes. Since the Pocahontas No. 3 seam represents the vast majority of the reserve tonnage for the Kepler complex, data for this seam in each mineable area was extracted and processed. Once the data was extracted, matrices were formed to calculate the distance and percent change in seam thicknesses between each combination of drill holes in the reserve area. Distances were then sorted from smallest to largest and the variation in thicknesses was analyzed as a function of distance Alpha Metallurgical Resources, Inc. Statement of Coal Resources and Reserves for the Kepler Complex in Accordance with United States SEC Standards as of December 31, 2023 Central Appalachian Coal Basin West Virginia, USA MARSHALL MILLER & ASSOCIATES, INC. 36 between drill holes. Ultimately, the average variation in thicknesses between drill holes at ¼-, ¾- and 3-mile intervals were calculated to determine the applicability of common US resource classification systems. The results for the Pocahontas No. 3 seam in each mining area were then compiled to form a summary. The total number of drill holes used in this study is 216, generating a total 18,016 data points. Table 11-2 is a breakdown of the statistics used in the study. Table 11-2: Statistical Breakdown Classification: Measured Indicated Inferred Distance Between Drill holes (miles): 0 – ¼ ¼ - ¾ ¾ - 3 Number of Data Points: 134 1,356 16,526 Average Thickness Variation: 14% 14% 21% MM&A also performed a geostatistical analysis of the same data set using the Drill Hole Spacing Analysis (DHSA) method. This method attempts to quantify the uncertainty of applying a measurement from a central location to increasingly larger square blocks and provides recommendations for determining the distances between drill holes for measured, indicated, and inferred resources. To perform DHSA the data set was processed to remove any erroneous data points, clustered data points, as well as directional trends. This was achieved through the use of histograms, as seen in Figure 11-1, color coded scatter plots showing the geospatial positioning of the borings, Figure 11-2, and trend analysis. Figure 11-1: Histogram of the Total Seam Thickness for the Pocahontas No. 3 Seam Present in the Kepler Complex Figure 11-2: Scatter plot of the Total Seam Thickness for the Pocahontas No. 3 Seam Present in the Kepler Complex

Alpha Metallurgical Resources, Inc. Statement of Coal Resources and Reserves for the Kepler Complex in Accordance with United States SEC Standards as of December 31, 2023 Central Appalachian Coal Basin West Virginia, USA MARSHALL MILLER & ASSOCIATES, INC. 37 Following the completion of data processing, a variogram of the data set was created, Figure 11-3. The variogram plots average square difference against the separation distance between the data pairs. The separation distance is broken up into separate bins defined by a uniform lag distance (e.g., for a lag distance of 500 feet the bins would be 0 – 500 feet, 501 – 1,000 feet, etc.). Each pair of data points that are less than one lag distance apart are reported in the first bin. If the data pair is further apart than one lag distance but less than two lag distances apart, then the variance is reported in the second bin. The numerical average for differences reported for each bin is then plotted on the variogram. Care was taken to define the lag distance in such a way as to not overestimate any nugget effect present in the data set. Lastly, modeled equations, often spherical, gaussian, or exponential, are applied to the variogram in order to represent the data set across a continuous spectrum. Figure 11-3: Variogram of the Total Seam Thickness for the Pocahontas No. 3 Seam Present in the Kepler Complex The estimation variance is then calculated using information from the modeled variogram as well as charts published by Journel and Huijbregts (1978). This value estimates the variance from applying a single central measurement to increasingly larger square blocks. Care was taken to ensure any nugget effect present was added back into the data. This process was repeated for each test block size. Alpha Metallurgical Resources, Inc. Statement of Coal Resources and Reserves for the Kepler Complex in Accordance with United States SEC Standards as of December 31, 2023 Central Appalachian Coal Basin West Virginia, USA MARSHALL MILLER & ASSOCIATES, INC. 38 The final step of the process is to calculate the global estimation variance. In this step the number square blocks that would fit inside the selected study area is determined for each block size that was investigated in the previous step. The estimation variance is then divided by the number of blocks that would fit inside the study area for each test block size. Following this determination, the data is then transformed back to represent the relative error in the 95th-percentile range. Figure 11-4 shows the results of the DHSA performed on the Pocahontas No. 3 data for the Kepler Complex. DHSA provides hole to hole spacing values, these distances need to be converted to radius from a central point in order to compare to the historical standards. A summary of the radius data is shown in Table 11-3. DHSA prescribes measured, indicated, and inferred drill hole spacings be determined at the 10-percent, 20-percent, and 50-percent levels of relative error, respectively. Figure 11-4: Result of DHSA for the Pocahontas No. 3 Seam Present in the Kepler Complex Table 11-3: DHSA Results Summary for Radius from a Central Point Model: Measured Radial Distance (10% Relative Error) Indicated Radial Distance (20% Relative Error) Inferred Radial Distance (50% Relative Error) (Miles) (Miles) (Miles) Gaussian: 0.33 0.65 1.63 Spherical: 0.38 0.73 1.78 Exponential: 0.39 0.74 1.79

Alpha Metallurgical Resources, Inc. Statement of Coal Resources and Reserves for the Kepler Complex in Accordance with United States SEC Standards as of December 31, 2023 Central Appalachian Coal Basin West Virginia, USA MARSHALL MILLER & ASSOCIATES, INC. 39 Comparing the results of the DHSA to the historical standards, it is evident that the historical standards are more conservative than even the most conservative DHSA model with regards to determining measured resources. The Gaussian model recommends using a radius of 0.33 miles for measured resources compared to the historical value of 0.25 miles. With respect to indicated resources the DHSA falls in line closely with the historical standards. The Gaussian model recommends using a radius 0.65 miles, while the spherical and exponential models recommend radiuses of 0.73 and 0.74 miles, respectively. These values line up closely with the historical radius of 0.75 miles. These results have led the QPs to report the data following the historical classification standards, rather than use the results of the DHSA. As shown earlier, the thickness variation between holes is less than the historically accepted standards. Based on this analysis, it would be possible to extend the measured, indicated and inferred arcs slightly beyond historically accepted practices due to consistent geological settings. The QP’s have again elected not to extend arc distances, introducing a level of conservatism in measured and indicated coal classification. 11.2 Resources Exclusive of Reserves The Kepler property contains multiple resource blocks which were not deemed to exhibit reserve potential at the time of the study. These resources, formally identified as resources exclusive of reserves, are located in the Sewell, Pocahontas No. 3, and Pocahontas No. 6 coal seams. Reasons which may preclude elevation of resources to reserves include, but are not limited to: 1. Limited availability of quality information to document coal seam market characteristics. All Pocahontas No. 6 resources are hindered by limited quality information. It is of important note that abandoned works in the Pocahontas No. 6 seam and operations by proximal producers in the same seam demonstrate that the Pocahontas No. 6 seam has metallurgical properties. 2. Exclusion from LOM planning by mining operator due to remaining resource blocks which are relatively small, isolated blocks and not currently attractive from an operational perspective. Two resource blocks in the closed Sewell Wyoming #2 mine are not considered a reserve due to relatively small size and access through a closed mine with unknown conditions. 3. Questionable mining conditions due to historical mine maps of proximal operations appearing to cease suddenly adjacent to resource areas, requiring further evaluation to determine mineability at the PFS level. Resources associated with the Sewell Wyomac (Block I) tonnages are located proximal to abandoned works which abruptly stopped. MM&A suspects that the abandoned works encountered seam splitting or geotechnical problems which could also negatively impact remaining resources. The Pocahontas No. 3 seam at Road Fork 52 is considered a resource between 350 feet and 1,000 feet from the end of the Pinnacle mine coal bed methane horizontal drill holes. The resource classification is based on questionable gelling of these holes and possible interconnection with the flooded Pinnacle mine. Alpha Metallurgical Resources, Inc. Statement of Coal Resources and Reserves for the Kepler Complex in Accordance with United States SEC Standards as of December 31, 2023 Central Appalachian Coal Basin West Virginia, USA MARSHALL MILLER & ASSOCIATES, INC. 40 11.2.1 Initial Economic Assessment MM&A completed an initial economic assessment to determine the potential economic viability of resources exclusive of reserves (not converted to reserves). MM&A applied relevant technical factors to estimate potential saleable tons without the resource blocks, should the resources be extracted via deep, continuous mining methods. MM&A developed cash cost profiles for the resource blocks, including direct cash costs (labor, supplies, roof control, maintenance and repair, power, and other); washing, trucking, materials handling, general and administrative, and environmental costs; and indirect cash costs (royalties, production taxes, property tax, insurance). Costs were developed based off relevant cost drivers (per-ft, per-raw-ton, per-clean-ton). Additionally, MM&A estimated capital costs to access resources. Capital costs associated with mine developed were amortized across the resource’s potential saleable tonnages). Additional non-cash items (depreciation of equipment and depletion) and cash costs were compared to an assumed sale price of $140 per ton netback FOB loadout (approximately $167 per ton U.S. East Coast basis) for low-volatile markets. This resource assumed sales value was developed as a premium to the market-based reserve sales value to properly estimate the sales-related expenses should these resources be extracted during higher-than-average market conditions. Pricing used for the primary product was selected by the QP and deemed reasonable based on a review of historical average pricing for the Kepler complex coal products over the past 5 years. The results of the analysis are shown below and demonstrate potential profitability on a fully loaded cost basis. Detailed summaries are shown in Appendix B. Table 11-4: Results of Initial Economic Assessment Seam Resource Block Direct Cash Transportation, Washing, Enviro, G&A Indirect Non-Cash Total Cost Fully Loaded P&L Sewell B, C, D $75.08 $26.10 $13.02 $8.52 $122.71 $17.29 Sewell F $68.34 $27.19 $14.42 $13.82 $123.77 $16.23 P6 A $63.49 $26.41 $14.42 $9.75 $114.07 $25.93 P6 B, D $67.99 $26.48 $13.02 $8.51 $116.00 $24.00 P6 F, G $76.81 $35.22 $13.02 $13.12 $138.16 $1.84 P3 E,F,G $59.58 $22.84 $14.42 $10.13 $106.96 $33.04

Alpha Metallurgical Resources, Inc. Statement of Coal Resources and Reserves for the Kepler Complex in Accordance with United States SEC Standards as of December 31, 2023 Central Appalachian Coal Basin West Virginia, USA MARSHALL MILLER & ASSOCIATES, INC. 41 Figure 11-5: Results of Initial Economic Assessment 11.3 Qualified Person’s Estimates Based on the work described and detailed modelling of the areas considering all the parameters defined, a coal resource estimate, summarized in Table 11-5, was prepared as of December 31, 2023, for property controlled by Alpha. Table 11-5: Coal Resources Summary as of December 31, 2023 Coal Resource (Dry Tons, In Situ) Mine/Area Seam Measured Indicated Inferred Total Inclusive of Reserves/Converted to Reserve Sewell #2 West Sewell 8,030,000 2,928,000 0 10,958,000 Sewell #1 East Sewell 1,682,000 52,000 0 1,733,000 Road Fork 52 Pocahontas 3 35,279,000 22,750,000 0 58,028,000 Proposed P3 North Pocahontas 3 9,330,000 17,842,000 0 27,172,000 Total Inclusive of Reserve 54,321,000 43,571,000 0 97,891,000 Exclusive of Reserve/Not Converted to Reserve Wyoming 2 Sewell 3,180,000 254,000 0 3,434,000 Resource Only Sewell 1,994,000 1,521,000 0 3,514,000 Resource Only Pocahontas 6 0 23,565,000 0 23,565,000 Road Fork 52 Pocahontas 3 1,835,000 517,000 0 2,352,000 Total Exclusive of Reserve 7,009,000 25,857,000 0 32,866,000 Grand Total Grand Total 7,009,000 25,857,000 0 32,866,000 Note(1): Resource tons are inclusive of reserve tons since they include the in-situ tons from which recoverable coal reserves are derived. Note (2): Coal resources are reported on a dry basis. Surface moisture and inherent moisture are excluded. Totals may not add due to rounding. See Appendix A for a detailed breakdown. Alpha Metallurgical Resources, Inc. Statement of Coal Resources and Reserves for the Kepler Complex in Accordance with United States SEC Standards as of December 31, 2023 Central Appalachian Coal Basin West Virginia, USA MARSHALL MILLER & ASSOCIATES, INC. 42 11.4 Qualified Person’s Opinion While there is some stratigraphically controlled seam-thickness variability due to seam splitting, sand channels, etc., MM&A geologists and engineers modeled the deposit and resource areas to reflect realistic mining scenarios, giving special consideration to uncertainties as related to each class of mineral resources such as (1) seam thickness, (2) floor and roof conditions, (3) mining equipment, etc. This statistical study demonstrates that for each configuration of mineable seams, the classification system of measured (0 – ¼ mile), indicated (¼ to ¾ mile), and inferred (¾ to 3 miles) is reasonably adequate to predict seam thickness variation for modeling and mining purposes. Based on MM&A’s geostatistical analysis, it would be possible to extend the measured, indicated and inferred arcs slightly beyond historically accepted practices due to consistent geological settings. The QP’s have again elected not to extend arc distances, introducing a level of conservatism in measured and indicated coal classification. Based on the data review, the attendant work done to verify the data integrity and the creation of an independent Geologic Model, MM&A believes this is a fair and accurate representation of the Kepler coal resources. 12 Mineral Reserve Estimates 12.1 Assumptions, Parameters and Methodology Coal Reserves are classified as proven or probable considering “modifying factors” including mining, metallurgical, economic, marketing, legal, environmental, social and governmental factors. > Proven Coal Reserves are the economically mineable part of a measured coal resource, adjusted for diluting materials and allowances for losses when the material is mined. It is based on appropriate assessment and studies in consideration of and adjusted for reasonably assumed modifying factors. These assessments demonstrate that extraction could be reasonably justified at the time of reporting. > Probable Coal Reserves are the economically mineable part of an indicated coal resource, and in some circumstances a measured coal resource, adjusted for diluting materials and allowances for losses when the material is mined. It is based on appropriate assessment and studies in consideration of and adjusted for reasonably assumed modifying factors. These assessments demonstrate that extraction could be reasonably justified at the time of reporting. Upon completion of delineation and calculation of coal resources, MM&A generated a LOM plan for Kepler. The footprint of each reserve area is shown on the maps in Appendix C. The mine plan was generated based on 5-year budget mine plans, where provided by Alpha, and supplemented with

Alpha Metallurgical Resources, Inc. Statement of Coal Resources and Reserves for the Kepler Complex in Accordance with United States SEC Standards as of December 31, 2023 Central Appalachian Coal Basin West Virginia, USA MARSHALL MILLER & ASSOCIATES, INC. 43 additional projections by MM&A to reflect LOM plans that honor property control limits, geologic mapping, or other factors determined during the evaluation. Carlson Mining software was used to generate the LOM plan for Kepler. The mine plan was sequenced based on productivity schedules provided by Alpha. MM&A judged the productivity estimates and plans to be reasonable based on experience and current industry practice. Raw, ROM production data outputs from LOM plan sequencing were processed into Microsoft® EXCEL spreadsheets and summarized on an annual basis for processing into the economic model. Average seam densities were estimated to determine raw coal tons produced from the LOM plan. Average mine recovery and wash recovery factors were applied to determine coal reserve tons. Coal reserve tons in this evaluation are reported at a 6.50-percent moisture and represent the saleable product from the Property. Pricing data as provided by Alpha from third-party sources is described in Table 16-2. The pricing data assumes a flat-line mine realization of $163 per short ton port pricing, with an average of $136.74 per ton netback pricing, reflective of the low/mid-volatile product currently sold at Kepler. This estimate was provided by Alpha. The coal resource mapping and estimation process, described in the report, was used as a basis for the coal reserve estimate. Proven and probable coal reserves were derived from the defined coal resource considering relevant processing, economic (including technical estimates of capital, revenue, and cost), marketing, legal, environmental, socio-economic, and regulatory factors and are presented on a moist, recoverable basis. As is customary in the US, the categories for proven and probable coal reserves are based on the distances from valid points of measurement as determined by the QP for the area under consideration. For this evaluation, measured resource, which may convert to a proven reserve, is based on a ¼-mile radius from a valid point of observation. Points of observation include exploration drill holes, and mine measurements which have been fully vetted and processed into a geologic model. The geologic model is based on seam depositional modeling, the interrelationship of overlying and underlying strata on seam mineability, seam thickness trends, the impact of seam structure, intra-seam characteristics, etc. Once the geologic model was completed, a statistical analysis, described in Section 11.1.1 was conducted and a ¼-mile radius from a valid point of observation was selected to define Measured Resources. Likewise, the distance between ¼ and ¾ of a mile radius was selected to define Indicated Resources. Indicated Resources may convert to Probable Reserves. Alpha Metallurgical Resources, Inc. Statement of Coal Resources and Reserves for the Kepler Complex in Accordance with United States SEC Standards as of December 31, 2023 Central Appalachian Coal Basin West Virginia, USA MARSHALL MILLER & ASSOCIATES, INC. 44 Inferred Resources (greater than a ¾-mile radius from a valid point of observation) have been excluded from Reserve consideration. 12.2 Mineral Reserves Kepler Property reserves were derived from multiple coal seams of Figure 7-1 located on the Property. Reserves are all categorized as underground mineable. Underground reserves were derived from two coal seams: the Sewell seam and the Pocahontas No. 3 (P3) seam. 12.2.1 Sewell Seam (Map 1) Sewell seam reserves are included in two proposed mines, the Sewell #1 Mine, and the Sewell #2 Mine. The Sewell #1 proposed mine is located south of the Guyandotte River and immediately south and adjacent to the Kepler preparation plant. The reserve block is located adjacent to the refuse impoundment and previously closed mines. Seam thickness is typically 2.5 feet and less than 2.5 feet coal thickness. The Sewell #2 proposed mine is also located south of the Guyandotte River and west of the proposed Sewell #1 Mine. The reserve is located along the west side of the closed Marianna #3 Sewell Mine. Seam thickness is typically 2.5 to 3.0 feet and greater than 2.5 feet coal thickness. 12.2.2 Pocahontas No. 3 (P3) Seam (Map 3) The P3 reserve includes the active Road Fork 52 reserve block located south of the Guyandotte River, and a contiguous P3 block north of the river that will require separate access. The reserves have been previously mined by the Pinnacle mine and Alpha’s closed Road Fork 51 Mine. The P3 is below drainage and is a gassy coal seam. The seam has been degassed though an array of surface, in-seam horizontal de-gas drill holes. Alpha management has a long history of mining the P3 and managing the gas with ventilation. The seam thickness in the Road Fork 52 block is generally 3.5 to 5.0 feet and 2.5 to 3.5 feet in the northern block. The southern reserve boundary is 1000 feet from the end of the Pinnacle mine coalbed methane (CBM) horizontal drill holes. The barrier with the CBM hole is based on questionable gelling of these holes and possible interconnection with the flooded Pinnacle mine. 12.3 Qualified Person’s Estimates The coal reserves, as shown in Table 12-1, are based on a technical evaluation of the geology and a preliminary feasibility study of the coal deposits. The extent to which the coal reserves may be affected by any known environmental, permitting, legal, title, socioeconomic, marketing, political, or other relevant issues has been reviewed rigorously. Similarly, the extent to which the estimates of coal

Alpha Metallurgical Resources, Inc. Statement of Coal Resources and Reserves for the Kepler Complex in Accordance with United States SEC Standards as of December 31, 2023 Central Appalachian Coal Basin West Virginia, USA MARSHALL MILLER & ASSOCIATES, INC. 45 reserves may be materially affected by mining, metallurgical, infrastructure and other relevant factors has also been considered. The results of this TRS define an estimated 41.19 Mt of proven and probable marketable coal reserves. The maps included in Appendix C reflect mining depletion at the time of the resource/reserve calculation taken from Alpha mine maps at various points during calendar year 2023. Mine depletion tonnages were supplied by Alpha through the end of 2023, and MM&A deducted this historical production from the mapped reserves in order to estimate reserves as of December 31, 2023. Table 12-1: Coal Reserves Summary (Marketable Sales Basis) as of December 31, 2023 Demonstrated Coal Reserves (Wet Tons, Washed or Direct Shipped) Quality (Dry Basis) By Reliability Category By Control Type Mine Seam Proven Probable Total Owned Leased Ash% Sulfur% VM% Sewell #2 West Sewell 3,222,000 1,220,000 4,442,000 3,000 4,438,000 3 0.5 24 Sewell #1 East Sewell 581,000 3,000 584,000 0 584,000 4 0.7 23 Road Fork 52 Pocahontas 3 15,370,000 9,426,000 24,796,000 255,000 24,541,000 6 0.9 19 Proposed P3 North Pocahontas 3 3,859,000 7,510,000 11,369,000 0 11,369,000 6 0.9 20 Grand Total 23,031,000 18,159,000 41,191,000 258,000 40,932,000 5 0.8 20 Notes: Marketable reserve tons are reported on a moist basis, including a combination of surface and inherent moisture. Coal quality is based on a weighted average of laboratory data from core hole. The combination of surface and inherent moisture is modeled at 6.5-percent. Actual product moisture is dependent upon multiple geological factors, operational factors, and product contract specifications and can exceed 8-percent. As such, the modeled moisture values provide a level of conservatism for reserve reporting. *Volatile Matter analysis is not available for the Beckley seam reserve areas. The Beckley reserves are priced as a Mid-Vol. product. Totals may not add due to rounding. See Appendix A for a detailed breakdown. 12.4 Qualified Person’s Opinion The estimate of coal reserves was determined in accordance with the SEC S-K 1300 regulations that became effective for the first fiscal year falling on or after January 1, 2021. The LOM mining plan for Kepler was prepared to the level of preliminary feasibility. Mine projections were prepared, and timing scheduled to match production with coal seam characteristics. Production timing was carried out from current locations to depletion of the coal reserve area. Coal reserve estimates could be materially affected by the risk factors described in Section 22.2. Based on the Preliminary Feasibility Study and the attendant Economic Review, MM&A believes this is a fair and accurate calculation of the Kepler coal reserves. 13 Mining Methods Four underground mining areas were modeled and tested economically. Once the Resources were calculated, mine plans were created to project operating each resource area to depletion, with crews and equipment scheduled to move to subsequent mining areas as depletion occurs. Underground mine operations are projected to be exhausted in 2058. Individual mines lives range from 4 years to 24 years. Alpha Metallurgical Resources, Inc. Statement of Coal Resources and Reserves for the Kepler Complex in Accordance with United States SEC Standards as of December 31, 2023 Central Appalachian Coal Basin West Virginia, USA MARSHALL MILLER & ASSOCIATES, INC. 46 13.1 Geotech and Hydrology Mining plans for potential underground mines were developed by Alpha and MM&A. Pillar stability was tested by MM&A using the Analysis of Coal Pillar Stability (ACPS) program that was developed by the National Institute for Occupational Safety and Health (NIOSH). MM&A reviewed the results from the ACPS analysis and considered it in the development of the LOM plan. Hydrology has not been an issue of concern at Kepler. Based on numerous site visits to both the surface and underground portions of the Property by the QP’s, it has been determined that this is not a significant concern. Mining of future reserves is projected to occur in areas which exhibit similar hydrogeological characteristics as those formerly mined areas. At the Road Fork 52 Mine in the Pocahontas No. 3 Seam, the projections approach the boundary of the abandoned Pinnacle Mine. This mine is up dip of the projections and has been filling with water. Management has recognized the potential of water migration from the abandoned workings. Possible conduits from coalbed methane wells have been identified and substantial barriers are being left to protect the projected workings from impacts from the abandoned mine. 13.2 Production Rates Operations at Kepler by Alpha and its predecessors have been on-going for many years. The mine plan and productivity expectations reflect historical performance and efforts have been made to adjust the plan to reflect future conditions. MM&A is confident that the mine plan is reasonably representative to provide an accurate estimation of coal reserves. Mine development and operation have not been optimized within the TRS. Carlson Mining software was used by MM&A to generate mine plans for the mineable coal seams. Mine plans were sequenced based on productivity schedules provided by Alpha, which were based on historically achieved productivity levels. All production forecasting ties assumed production rates to geological models as constructed by MM&A’s team of geologists and mining engineers. The Kepler Mining Complex currently operates one underground mine with a total of five (5) operating sections. All five continuous mining units operate at the Road Fork 52 Mine in the Pocahontas No. 3 seam. Each proposed Kepler mine is scheduled to operate one or two production sections with the Road Fork 52 Mine operating five production sections. All sections are configured with dual continuous miners on each production section. The smaller single unit mines will operate in a walking super section configuration where only one continuous miner is operational at a given time. The Sewell West and P3 North Mines will operate as super section operations where both continuous miners are operational on a production section at a given time. In all cases, mines are forecasted to produce coal two shifts each day. Production is scheduled Monday through Friday each week, and every other Saturday.

Alpha Metallurgical Resources, Inc. Statement of Coal Resources and Reserves for the Kepler Complex in Accordance with United States SEC Standards as of December 31, 2023 Central Appalachian Coal Basin West Virginia, USA MARSHALL MILLER & ASSOCIATES, INC. 47 As shown in Table 13-1, the four areas planned for underground mines produce coal until 2058. Clean coal production varies directly with coal thickness. Table 13-1: Kepler Complex Underground Mine Production Schedule (x 1,000 Saleable Tons) Mine Name 2023 2024 2025 2026 2027 2028 2029 2030 P3 North 0 0 0 0 0 0 0 0 Road Fork 52 480 2,020 2,024 1,966 2,000 1,833 1,774 1,804 Sewell #1 0 0 0 0 0 0 0 162 Sewell #2 0 0 0 0 0 0 0 209 Total 480 2,020 2,024 1,966 2,000 1,833 1,774 2,175 Mine Name 2031 2032 2033 2034 2035 2036 2037 2038 P3 North 0 0 0 0 39 268 472 472 Road Fork 52 1,977 2,002 1,875 1,707 1,407 1,222 770 406 Sewell #1 185 186 50 0 0 0 0 0 Sewell #2 260 224 395 484 474 481 453 487 Total 2,422 2,412 2,321 2,191 1,919 1,971 1,695 1,365 Mine Name 2039 2040 2041 2042 2043 2044 2045 2046 P3 North 482 507 505 537 540 526 552 503 Road Fork 52 0 0 0 0 0 0 0 0 Sewell #1 0 0 0 0 0 0 0 0 Sewell #2 463 401 111 0 0 0 0 0 Total 945 908 617 537 540 526 552 503 Mine Name 2047 2048 2049 2050 2051 2052 2053 2054 P3 North 470 458 459 462 465 502 528 552 Road Fork 52 0 0 0 0 0 0 0 0 Sewell #1 0 0 0 0 0 0 0 0 Sewell #2 0 0 0 0 0 0 0 0 Total 470 458 459 462 465 502 528 552 Mine Name 2055 2056 2057 2058 2059 2060 2061 2062 P3 North 573 570 570 359 0 0 0 0 Road Fork 52 0 0 0 0 0 0 0 0 P2 0 0 0 0 0 0 0 0 Sewell #1 0 0 0 0 0 0 0 0 Sewell #2 0 0 0 0 0 0 0 0 Total 573 570 570 359 0 0 0 0 13.3 Mining Related Requirements 13.3.1 Underground A mine plan with sequenced mining projections was prepared for each logical mining unit. For each mine plan, the appropriate number of production units is selected for the resource area, and a productivity level assigned, expressed in feet of advance per unit-shift of production. The productivity is based on the equipment and personnel configuration, mining height and expected physical conditions. Alpha Metallurgical Resources, Inc. Statement of Coal Resources and Reserves for the Kepler Complex in Accordance with United States SEC Standards as of December 31, 2023 Central Appalachian Coal Basin West Virginia, USA MARSHALL MILLER & ASSOCIATES, INC. 48 13.4 Required Equipment and Personnel 13.4.1 Underground Mines 13.4.1.1 Road Fork 52 Road Fork 52 started production with a single mining unit in early 2020. Two additional mining units were added during calendar year 2020 from the Road Fork 51 operation. The fourth mining unit was added during the calendar year 2022 and the fifth mining unit was added during the calendar year 2023. Access to the Pocahontas No. 3 seam is gained by a decline slope that reaches to the west of the historic workings. This mine produces metallurgical coal from leased and owned mineral property. Production is scheduled for approximately 250 days each year, which represents production on Monday through Friday. On each day, two production sections are scheduled to produce coal on two shifts. Productivity is planned at the rate of 250 feet of advance per shift of operation for the production section. A total of 270 employees are assigned to the mine. Principal production equipment includes two continuous miners, two roof bolters, four shuttle cars and one scoop for the super sections. Coal is extracted from the production face with the continuous miners and hauled to the mine conveyor in shuttle cars. At the conveyor belt, the coal is discharged from the shuttle cars onto a feeder breaker for transfer onto the conveyor. The conveyors carry the coal to the outside, where it is transported directly to the preparation plant and load-out via conveyor belt. The mine is existing with sufficient infrastructure and surface facilities to service the operation. The mine is located in the Appalachian Basin, which has an extensive history (>100 years) of coal mining. The workforce is existing and is considered to be stable. There are no plans to recruit new workers to staff this operation. Estimated mine access and utility capital expenditures are included in the financial model for the mine. Mining permits are in place and capital construction is in place. Estimated expenditures for mine closure and site reclamation are included in the financial model for each mine or plant site. Expected annual production averages approximately 1,900,000 marketable tons at steady state levels. The mine is scheduled to deplete in 2038. 13.4.1.2 Sewell #1 The Sewell #1 mine assignment is found in the Sewell Seam near the Kepler Processing Facility refuse impoundment. The site would use an existing drift mine faceup to access the reserve. Rehabilitation of the existing workings near the portal area and the establishment of mine seals will allow the mining activity to bypass the old works and start operations along the old workings. Production would be scheduled to begin in 2030. This mine will produce metallurgical coal from leased mineral property.

Alpha Metallurgical Resources, Inc. Statement of Coal Resources and Reserves for the Kepler Complex in Accordance with United States SEC Standards as of December 31, 2023 Central Appalachian Coal Basin West Virginia, USA MARSHALL MILLER & ASSOCIATES, INC. 49 Production is scheduled for approximately 250 days each year, which represents production on Monday through Friday. This will be a single operating section producing during two scheduled production shifts per day. The section is configured with two continuous miners operated on a walk-between schedule. Productivity is planned at the rate of 220 feet of advance per shift of operation. A total of 36 employees are assigned to the mine. Principal production equipment includes two continuous miners, two roof bolters, three shuttle cars, and one scoop. Coal is extracted from the production face with the continuous miners and hauled to the mine conveyor in shuttle cars. At the conveyor belt, the coal is discharged from the shuttle cars onto a feeder breaker for transfer onto the conveyor. The conveyors carry coal to the outside, where it is stacked on the ground to await truck transport to the preparation plant and load-out. The workforce is existing and is considered to be stable. There are no plans to recruit new workers to staff this operation. Estimated mine access and utility capital expenditures are included in the financial model for the mine. Estimated expenditures for mine closure and site reclamation are included in the financial model for each mine or plant site. Expected annual production averages approximately 185,000 marketable tons at steady state levels. The mine is scheduled to deplete in 2033. 13.4.1.3 Sewell #2 The proposed Sewell #2 Mine is scheduled to begin production in 2030. Access to the Sewell Seam will be by drift entry along the outcrop. The mine will produce metallurgical coal from leased property. Production is scheduled for approximately 250 days each year, which represents production on Monday through Friday. On each day, one production section is scheduled to produce coal on two shifts. Production sections are configured as super sections with two continuous miners available for production on each section. Mining will begin with one section and a second unit will be brought on- line after the Sewell #1 mine is completed. Productivity is planned at the rate of 220 feet of advance per shift of operation. A total of 109 employees will be assigned to the mine. Principal production equipment includes two continuous miners, two roof bolters, three shuttle cars, and one scoop. Coal is extracted from the production face with the continuous miners and hauled to the mine conveyor in shuttle cars. At the conveyor belt, the coal is discharged from the shuttle cars onto a feeder breaker for transfer onto the conveyor. The conveyors carry the coal to the outside, where it is stacked on the ground. A transportation advantage for the mine will be a vertical shaft to the Pocahontas No. 3 Seam main conveyor belt. The vertical shaft would be configured as a vertical Alpha Metallurgical Resources, Inc. Statement of Coal Resources and Reserves for the Kepler Complex in Accordance with United States SEC Standards as of December 31, 2023 Central Appalachian Coal Basin West Virginia, USA MARSHALL MILLER & ASSOCIATES, INC. 50 coal transportation facility where coal from the Sewell Seam can be staged on the Road Fork 52 main belt for haulage to the Kepler Processing Facility without requiring truck haulage. Due to the projected starting date for the Mine Sewell #2 Mine, no detailed design of infrastructure or surface facilities has been completed to date. The proposed mine is located in the Appalachian Basin, which has an extensive history (>100 years) of coal mining. The workforce is existing and is considered to be stable. There are no plans to recruit new workers to staff this operation. Estimated mine access and utility capital expenditures are included in the financial model for the mine. Due to the projected start-up date of the Sewell #2 Mine, no permit work has been completed to date. The proposed mine is located in an area with a long history of coal mining, with numerous permitted operations in close proximity. Coal mining permits are routinely obtained. Estimated expenditures for mine closure and site reclamation are included in the financial model for each mine or plant site. Expected annual production averages approximately 480,000 marketable tons at steady state levels. The mine is scheduled to deplete in 2041. 13.4.1.4 P3 North The proposed P3 North Mine is scheduled to begin production in 2035. Mining Units from the Road Fork 52 Mine will be used to staff the P3 North mine assignment. Access to the Pocahontas No. 3 seam will be by slope entry to access the coal seam located 300 vertical feet below the surface. This mine will produce metallurgical coal from leased mineral property. Production is scheduled for approximately 250 days each year, which represents production on Monday through Friday. On each day, two production sections are scheduled to produce coal on two shifts. Each section is configured as super sections with two continuous miners available for production on each section. Productivity is planned at the rate of 220 feet of advance per shift of operation. A total of 109 employees are assigned to the mine. Principal production equipment includes two continuous miners, two roof bolters, three shuttle cars, and one scoop. Coal is extracted from the production face with the continuous miner and hauled to the mine conveyor in shuttle cars. At the conveyor belt, the coal is discharged from the shuttle cars onto a feeder breaker for transfer onto the conveyor. The conveyors carry coal to the outside, where it is stacked on the ground to await truck transport to the preparation plant and load-out. Due to the projected starting date for the P3 North Mine, no detailed design of infrastructure or surface facilities has been completed to date. The proposed mine is located in the Appalachian Basin, which has an extensive history (>100 years) of coal mining. The workforce is existing and is considered to be stable. There are no plans to recruit new workers to staff this operation. Estimated mine access and utility capital expenditures are included in the financial model for the mine.

Alpha Metallurgical Resources, Inc. Statement of Coal Resources and Reserves for the Kepler Complex in Accordance with United States SEC Standards as of December 31, 2023 Central Appalachian Coal Basin West Virginia, USA MARSHALL MILLER & ASSOCIATES, INC. 51 Due to the projected start-up date of the P3 North Mine, no permit work has been completed to date. The proposed mine is located in an area with a long history of coal mining, with numerous permitted operations in close proximity. Coal mining permits are routinely obtained. Estimated expenditures for mine closure and site reclamation are included in the financial model for each mine or plant site. Expected annual production averages approximately 500,000 marketable tons at steady state levels. The mine is scheduled to deplete in 2058. 14 Processing and Recovery Methods 14.1 Description or Flowsheet The Kepler Division currently includes the Kepler Preparation Plant in addition to the mines. The preparation plant was constructed in 1967 and first processed coal in 1969. The plant site includes raw coal storage, clean coal storage, a railroad loadout, and refuse disposal area. The plant has a feed rate capacity of 900 raw tons per hour. Primary separation equipment includes heavy media vessels, heavy media cyclones, spirals, and flotation cells, supported by the requisite screens, centrifuges, disk filters, sumps, pumps, and distribution systems. The plant produces a product with a typical dry ash content of 5.85%; typical dry sulfur content of 0.80% and a typical dry volatile matter content of 19.39%. Coarse and fine refuse are disposed in an adjacent coarse and slurry refuse areas. During the 2023 reporting year, the Kepler Plant had an average utilization of 54.43%. The washed coal product is shipped to customers through the Kepler loadout located on the Norfolk Southern rail line and at the Feats loadout located on the CSX rail line near Holden, West Virginia. The Feats loadout was constructed in 1975 and has a capacity of 3500 tons per hour. Processes and equipment are typical of those used in the coal industry and are in use in nearly all plants in the Central Appalachian Basin. 14.2 Requirements for Energy, Water, Material and Personnel Personnel have historically been sourced from the surrounding communities in Wyoming, Raleigh, and McDowell Counties, and have proven to be adequate in numbers to conduct mining operations at Kepler. As mining is common in the surrounding areas, the workforce is generally familiar with mining practices, and many are experienced miners. Water is sourced locally from public water sources or rivers, and electricity is sourced from AEP. The service industry in the areas surrounding the mine complex has historically provided supplies, equipment repairs and fabrication, etc. Alpha Metallurgical Resources, Inc. Statement of Coal Resources and Reserves for the Kepler Complex in Accordance with United States SEC Standards as of December 31, 2023 Central Appalachian Coal Basin West Virginia, USA MARSHALL MILLER & ASSOCIATES, INC. 52 15 Infrastructure Alpha’s Kepler preparation plant services customers with washed coal, which is transported via the Norfolk Southern rail line at the plant’s loadout or on the CSX rail line via the Feats loadout near Holden, West Virginia. Haul roads, primary roads, and conveyor belt systems account for transport from the various mine sites to the preparation plant. This practice will continue for future reserves. As an active operation, the necessary support infrastructure for Kepler is in place. As new areas are developed, the infrastructure requirements will change. These changes have been considered in the LOM plans and financial model. The underground mining resource areas which are located above drainage will require an access road and mine access development along the outcrop. The Road Fork 52 facility is a long-term below- drainage mine and will require ventilation shafts, access portals and dewatering facilities during the life of the assignment. The P3 North mine assignment is found below drainage and will require an access slope, ventilation shafts and dewatering facilities during its lifespan. Typical mine facilities include a mine office, a change house, supply facilities, mine fan and a stacker conveyor if truck haulage is required. One major advantage for the operations is that the majority of the raw coal is transported directly to the preparation plant by conveyors which eliminates truck haulage. A photo of the existing facilities is shown in Figure 15-1.

Alpha Metallurgical Resources, Inc. Statement of Coal Resources and Reserves for the Kepler Complex in Accordance with United States SEC Standards as of December 31, 2023 Central Appalachian Coal Basin West Virginia, USA MARSHALL MILLER & ASSOCIATES, INC. 53 Figure 15-1: Kepler Surface Facilities Alpha Metallurgical Resources, Inc. Statement of Coal Resources and Reserves for the Kepler Complex in Accordance with United States SEC Standards as of December 31, 2023 Central Appalachian Coal Basin West Virginia, USA MARSHALL MILLER & ASSOCIATES, INC. 54 Figure 15-2: Kepler Preparation Plant

Alpha Metallurgical Resources, Inc. Statement of Coal Resources and Reserves for the Kepler Complex in Accordance with United States SEC Standards as of December 31, 2023 Central Appalachian Coal Basin West Virginia, USA MARSHALL MILLER & ASSOCIATES, INC. 55 Figure 15-3: Feats Loadout Facility located near Holden, WV 16 Market Studies 16.1 Market Description The quality characteristics for the subject coal resources and coal reserves have been reviewed in detail by MM&A. The drill hole data were utilized to develop average coal quality characteristics for the mining site. These average coal quality characteristics were then utilized as the basis for determining the various markets into which the saleable coal will likely be placed. Quality Specifications for the Kepler products are as shown in Table 16-1. Table 16-1: Quality Specifications Low Volatile Ash (%) 5.85 Sulfur (%) 0.80 Volatile Matter (%) 19.39 Note: All Specs are dry basis except Moisture and Thermal The mine production serves both the low and mid-volatiles metallurgical markets. Alpha Metallurgical Resources, Inc. Statement of Coal Resources and Reserves for the Kepler Complex in Accordance with United States SEC Standards as of December 31, 2023 Central Appalachian Coal Basin West Virginia, USA MARSHALL MILLER & ASSOCIATES, INC. 56 16.2 Price Forecasts Company-wide pricing data as provided by Alpha from third-party sources is described in Table 16-2. Note that not all products reflected in Table 16-2 will apply to every business unit. The pricing data assumes a flat-line long term realization of $163 per short ton port pricing, with an average of $136.74 per ton netback pricing reflective of the low-volatile product currently sold at Kepler. These estimates are based on long-term pricing published by third party sources and adjusted for quality and transportation. The netback pricing represents adjustments made to published benchmark pricing based on quality and transportation. A large majority of the coal sold by Alpha and their Kepler business group is shipped internationally as part of blended products from other business units within Alpha or sourced from other companies. These netback adjustments reflect these additional costs carried after the products leave the Kepler business unit. Table 16-2: Price Forecasts Coal Quality Market Pricing Per Ton (1) (2) High-Vol. A $162 High- Vol. B $140 Mid-Vol. $163 Low-Vol. $163 Thermal $74 (1) - Market pricing shown on U.S. East Coast basis. (2) - Metallurgical and thermal pricing based on 10-year and 3-year average, respectively of forecasted pricing from pricing services. 16.3 Contract Requirements Some contracts are necessary for successful marketing of the coal. For Kepler, since all mining, preparation and marketing is done in-house, the remaining contracts required are: > Transportation – Alpha contracts with the Norfolk Southern Railroad to transport coal to market. > Sales – Sales contracts are a mix of spot and contract sales. With the volatility of the market, long- term contracts are not typically written. 17 Environmental Studies, Permitting and Plans, Negotiations or Agreements with Local Individuals 17.1 Results of Studies MM&A completed an environmental review in 2011 for the Massey properties acquired by Alpha, including those operations that were active at Kepler at that time. In addition, MM&A performed a Limited Phase I Environmental Site Assessment (ESA) on the Pinnacle property in September 2005 on behalf of PinnOak Resources, LLC. Alpha reports not having conducted such a study since the 2005 and

Alpha Metallurgical Resources, Inc. Statement of Coal Resources and Reserves for the Kepler Complex in Accordance with United States SEC Standards as of December 31, 2023 Central Appalachian Coal Basin West Virginia, USA MARSHALL MILLER & ASSOCIATES, INC. 57 2011 MM&A studies. The environmental review and ESA completed by MM&A included site inspections, reviews of historical records, database searches of State and Federal regulatory records and interviews to identify potential recognized environmental conditions (RECs) that may create environmental liability for the sites. While MM&A identified RECs during both studies, MM&A’s opinion was that those issues would not preclude the continued or future use of the properties as a coal mining/preparation venture. Based on this former ESA completed by MM&A, it is MM&A’s opinion that Kepler has a generally typical coal industry record of compliance with applicable mining, water quality, and environmental laws. Estimated costs for mine closure, including water quality monitoring during site reclamation, are included in the financial models. 17.2 Requirements and Plans for Waste Disposal Volumetric calculations were performed on currently approved refuse disposal areas at the Kepler Complex to determine the available storage capacity for refuse produced during the period addressed by the financial model. Based on the rates included within the financial model, MM&A has been able to determine that adequate coal mine refuse storage volume has been permitted for the Kepler Complex. The December 31, 2022 timing model estimated 33,790,000 tons of refuse will be generated throughout the life of the project. At full production levels from 2024 to 2041, an average of 1,273,000 tons of refuse will be generated on an annual basis. Three refuse areas are permitted and available for use at the Kepler Complex. Volumes were generated from Google Earth interactive imagery dated October 2020. Surface elevations for the permit areas were obtained from imagery on the West Virginia Department of Environmental Protection permitting website. Simple volumetric calculations were used to develop storage volume in terms of cubic yards as well as refuse tons. The original impoundment is permitted to the 1900-ft elevation. The 2023 work elevation at the original impoundment is estimated at 1816 feet. The remaining volume in the impoundment is estimated to be 6,409,754 cubic yards or approximately 5.4 years if both coarse and fine refuse are stored. The Big Branch Coarse Coal Refuse Storage area has reached its permit limits and the footprint has been maximized to a higher elevation than the interface between the refuse and original ground. While additional storage is available, the use of the resulting flat ground for supporting the refuse disposal operations, no additional storage was calculated by MM&A. Alpha Metallurgical Resources, Inc. Statement of Coal Resources and Reserves for the Kepler Complex in Accordance with United States SEC Standards as of December 31, 2023 Central Appalachian Coal Basin West Virginia, USA MARSHALL MILLER & ASSOCIATES, INC. 58 The Big Branch Fine Coal Refuse Storage area is permitted but has not been started. The storage capacity of this facility is 39,372,000 cubic yards or approximately 35.4 years. In summary, there is permitted refuse disposal storage available for 41 years of activity at the full production levels approximated for years 2024 to 2038 in this timing model. Table 17-1: Kepler Refuse Disposal Summary Refuse Facility State SMCRA Permit Number MSHA ID Refuse Disposal Type Classified as a Dam Permit Status Current Planned Maximum Coarse Life (Approved + Planned) Current Planned Maximum Fines Life (Approved + Planned) Est. Coarse/ Combined Refuse Life (Approved/ Permitted) Est. Fine Refuse Life (Approved/ Permitted Wallace Cabin Branch Impoundment (Kepler) E004500 1211-WV4- 0704-01 Slurry Impoundment - Downstream and Upstream Yes Active 34.0 34.0 5.4 5.4 Big Branch Fine Coal Refuse: O400603 1211-WV4- 0704-03 Slurry Impoundment - Downstream Yes Not Started 35.4 35.4 35.4 35.4 Big Branch Coarse Coal Refuse Phase 1 – Left Fork O402496 1211-WV4- 0704-02 Coarse Refuse No Active 2.3 0.0 2.3 0.0 Note: Permit status and expiration dates are based on information obtained from regulatory agency website. 17.3 Permit Requirements and Status All mining operations are subject to federal and state laws and must obtain permits to operate mines, coal preparation and related facilities, haul roads, and other incidental surface disturbances necessary for mining to occur. Permits generally require that the permittee post a performance bond in an amount established by the regulatory program to provide assurance that any disturbance or liability created during mining operations is properly restored to an approved post-mining land use and that all regulations and requirements of the permits are fully satisfied before the bond is returned to the permittee. Significant penalties exist for any permittee who fails to meet the obligations of the permits including cessation of mining operations, which can lead to potential forfeiture of the bond. Any company, and its directors, owners and officers, which are subject to bond forfeiture can be denied future permits under the program.1 New permits or permit revisions will occasionally be necessary to facilitate the expansion or addition of new mining areas on the Property, such as amendments to existing permits and new permits for mining of reserve areas. Exploration permits also are required. Property under lease includes provisions for exploration among the terms of the lease. New or modified mining permits are subject to a public advertisement process and comment period, and the public is provided an opportunity to raise objections to any proposed mining operation. MM&A is not aware of any specific prohibition of 1 Monitored under the Applicant Violator System (AVS) by the Federal Office of Surface Mining.

Alpha Metallurgical Resources, Inc. Statement of Coal Resources and Reserves for the Kepler Complex in Accordance with United States SEC Standards as of December 31, 2023 Central Appalachian Coal Basin West Virginia, USA MARSHALL MILLER & ASSOCIATES, INC. 59 mining on the subject property and given sufficient time and planning, Alpha should be able to secure new permits to maintain its planned mining operations within the context of current regulations. Necessary permits are in place to support current production on the Property, but future permits are required to maintain and expand production. Portions of the Property are located near local communities. Regulations prohibit mining activities within 300 feet of a residential dwelling, school, church, or similar structure unless written consent is first obtained from the owner of the structure. Where required, Alpha reports that such consents have been obtained where mining is proposed beyond the regulatory limits. Alpha has obtained all mining and discharge permits to operate its mines and processing, loadout or related facilities. MM&A is unaware of any obvious or current Alpha permitting issues that are expected to prevent the issuance of future permits. Kepler, along with all coal producers, is subject to a level of uncertainty regarding future clean water permits due to United States Environmental Protection Agency (EPA) and United States Fish and Wildlife Service (USFW) involvement with state programs. The Mining permits currently held by Kepler are shown in Table 17-2. Alpha Metallurgical Resources, Inc. Statement of Coal Resources and Reserves for the Kepler Complex in Accordance with United States SEC Standards as of December 31, 2023 Central Appalachian Coal Basin West Virginia, USA MARSHALL MILLER & ASSOCIATES, INC. 60 Table 17-2: Kepler Mining Permits Permittee Type Permit ID Permit Name Current Status Issued Date Expiration Date Acres NPDES No. Brooks Run South Mining, LLC Coal Underground U301512 Marianna Slope Mine Active, Moving Coal 7/24/2015 7/24/2025 45.38 WV1026844 Brooks Run South Mining, LLC Coal Underground U400498 Still Run Mine No. 7 Inactive, Reclamation Only 8/20/1998 8/20/2023 10.39 WV1018621 Brooks Run South Mining, LLC Coal Underground U401289 Alpine No. 3 Inactive, Reclamation Only 8/8/1989 8/8/2024 11.51 WV1008706 Road Fork Development Company, LLC Other O000684 Preparation Plant Inactive 2/3/1984 2/3/2024 102.15 WV1006592 Road Fork Development Company, LLC Other O004782 Refuse Area No. 2 Active, Reclamation Only 8/24/1982 8/24/2027 50.45 WV1006584 Road Fork Development Company, LLC Coal Underground U400105 Guyandotte Slope Mine Active, Reclamation Only 8/23/2005 8/25/2025 57.41 WV1021273 Road Fork Development Company, LLC Coal Underground U400208 Kepler Sewell Mine No. 1 Active, No Coal Removed 8/18/2009 8/18/2024 10.40 WV1021567 Kepler Processing Company, LLC Coal Underground E004500 Wallace Cabin Branch Coal Refuse Disposal Facility Active 1/17/1981 7/23/2027 214.17 WV1009877 Kepler Processing Company, LLC Other - Refuse Disposal O400603 Big Branch Fine Coal Refuse Di Not Started 5/26/2004 5/26/2024 138.00 WV1018973 Kepler Processing Company, LLC Other - Refuse Disposal O402496 Big Br Coarse Coal Refuse Active 6/2/1997 6/2/2027 59.39 WV1018493 Riverside Energy Company, LLC Coal Underground U007584 No. 9 Deep Mine Active, No Coal Removed 9/7/1984 9/7/2024 220.21 WV0066770 Riverside Energy Company, LLC Coal Underground U047100 Westigan Mine No. 6 Seam Active Reclamation only 10/23/1979 12/17/2009 4.02 WV1005596 Riverside Energy Company, LLC Coal Underground U400295 Still Run No. 1 Mine Active Reclamation only 3/17/1995 3/17/2010 5.16 WV1016181 Riverside Energy Company, LLC Coal Underground U400297 Joe Branch Mine No. 1 Active Reclamation only 7/17/1997 7/17/2027 9.42 WV1018523 Riverside Energy Company, LLC Coal Underground U400806 Tralee Mine No. 1 Active Reclamation only 2/27/2007 2/27/2027 10.97 WV1021401 Riverside Energy Company, LLC Coal Underground U401198 Rock Branch Mine No. 1 Active R No Coal Removed 11/19/1998 11/19/2023 12.79 WV1018671 Riverside Energy Company, LLC Coal Underground U401207 Horse Creek Mine No. 1 Active No Coal Removed 12/19/2008 12/19/2023 7.64 WV1021532 Riverside Energy Company, LLC Coal Underground U401908 Lower War Eagle Mine Active, No Coal Removed 10/19/2010 10/19/2025 17.83 WV1023888 Riverside Energy Company, LLC Coal Underground U402387 Cherokee Mine Reclaimed , Water Treatment 12/28/1988 12/28/2018 33.47 WV1018876 Riverside Energy Company, LLC Coal Underground U402595 Jims Branch Mine No. 2 Active Reclamation only 3/18/1996 3/18/2026 9.81 WV1016385 Note: Permit status and expiration dates are based on information obtained from regulatory agency website. Permits in reclamation status receive Renewal Waivers and may show expired dates.

Alpha Metallurgical Resources, Inc. Statement of Coal Resources and Reserves for the Kepler Complex in Accordance with United States SEC Standards as of December 31, 2023 Central Appalachian Coal Basin West Virginia, USA MARSHALL MILLER & ASSOCIATES, INC. 61 17.4 Local Plans, Negotiations or Agreements MM&A found no indication of agreements beyond the scope of Federal or State Regulations. 17.5 Mine Closure Plans Applicable regulations require that mines be properly closed, and reclamation commenced immediately upon abandonment. In general, site reclamation includes removal of structures, backfilling, regrading, and revegetation of disturbed areas. For surface mines, the majority of the expense for backfilling and regrading is completed as part of ongoing mining operations, with only reclamation of final pits and HWM benches required at end-of-mine life. Sediment control is required during the establishment of vegetation, and bond release generally requires a minimum five-year period of site maintenance, water sampling, and sediment control following mine completion. This requirement is reduced to two years for certain operations involving re-mining. Reclamation of underground mines includes closure and sealing of mine openings such as portals and shafts in addition to the items listed above. Estimated costs for mine closure, including water quality monitoring during site reclamation, are included in the financial models. As with all mining companies, an accretion calculation is performed annually so the necessary Asset Retirement Obligations (ARO) can be shown as a Liability on the Balance Sheet. 17.6 Qualified Person’s Opinion The Kepler complex is an operating facility; all necessary permits for current production have been obtained. MM&A knows of no reason that any permits revisions or new permits that may be required cannot be obtained. Estimated expenditures for site closure and reclamation are included in the financial model for this site. 18 Capital and Operating Costs 18.1 Capital Cost Estimate The production sequence selected for a property must consider the proximity of each reserve area to coal preparation plants, river docks and/or railroad loading points, along with suitability of production equipment to coal seam conditions. The in-place infrastructure was evaluated, and any future needs were planned to a level suitable for a Preliminary Feasibility Study and included in the Capital Forecast. Alpha provided MM&A with information related to the number of currently operating production units at Kepler. MM&A’s capital schedules assume that major equipment rebuilds occur over the course of Alpha Metallurgical Resources, Inc. Statement of Coal Resources and Reserves for the Kepler Complex in Accordance with United States SEC Standards as of December 31, 2023 Central Appalachian Coal Basin West Virginia, USA MARSHALL MILLER & ASSOCIATES, INC. 62 each machine’s remaining assumed operating life. Replacement equipment was scheduled based on MM&A’s experience and knowledge of mining equipment and industry standards with respect to the useful life of such equipment. As one mine is depleted, the equipment is moved to its replacement. The capital expenditures tables detail costs for major equipment and infrastructure such as conveyor belt terminal groups. “Other” costs include expenditures for mine access and construction, mine extension capital and miscellaneous costs. A summary of the estimated capital for the consolidated Kepler operations is provided in Figure 18-1 below. Total capital by mine is summarized in Table 18-1. Figure 18-1: Projected Capital Expenditures – Consolidated Kepler Operations Table 18-1: Summary of Capital Expenditures Schedule by Mine Item Total 2023 2024 2025 2026 2027 2028 2029 P3 North $207,979 $0 $0 $0 $0 $0 $0 $0 Road Fork 52 $181,869 $0 $12,611 $18,503 $16,973 $5,352 $15,020 $13,304 Sewell #1 $12,597 $0 $0 $0 $0 $0 $0 $2,456 Sewell #2 $54,748 $0 $0 $0 $0 $0 $0 $8,128 Total $457,193 $0 $12,611 $18,503 $16,973 $5,352 $15,020 $23,888 Item 2030 2031 2032 2033 2034 2035 2036 2037 P3 North $0 $0 $0 $0 $0 $71,618 $11,222 $0 Road Fork 52 $7,275 $33,119 $7,544 $29,907 $0 $7,544 $10,396 $4,320 Sewell #1 $10,141 $0 $0 $0 $0 $0 $0 $0 Sewell #2 $16,178 $0 $0 $0 $8,640 $8,316 $688 $0 Total $33,594 $33,119 $7,544 $29,907 $8,640 $87,478 $22,306 $4,320

Alpha Metallurgical Resources, Inc. Statement of Coal Resources and Reserves for the Kepler Complex in Accordance with United States SEC Standards as of December 31, 2023 Central Appalachian Coal Basin West Virginia, USA MARSHALL MILLER & ASSOCIATES, INC. 63 Item 2038 2039 2040 2041 2042 2043 2044 2045 P3 North $2,905 $7,200 $15,515 $7,275 $0 $4,320 $11,751 $5,543 Road Fork 52 $0 $0 $0 $0 $0 $0 $0 $0 Sewell #1 $0 $0 $0 $0 $0 $0 $0 $0 Sewell #2 $8,640 $0 $4,158 $0 $0 $0 $0 $0 Total $11,545 $7,200 $19,673 $7,275 $0 $4,320 $11,751 $5,543 Item 2046 2047 2048 2049 2050 2051 2052 2053 P3 North $6,583 $7,200 $7,200 $0 $13,687 $11,914 $4,320 $0 Road Fork 52 $0 $0 $0 $0 $0 $0 $0 $0 Sewell #1 $0 $0 $0 $0 $0 $0 $0 $0 Sewell #2 $0 $0 $0 $0 $0 $0 $0 $0 Total $6,583 $7,200 $7,200 $0 $13,687 $11,914 $4,320 $0 Item 2054 2055 2056 2057 2058 2059 2060 2061 P3 North $0 $9,863 $9,863 $0 $0 $0 $0 $0 Road Fork 52 $0 $0 $0 $0 $0 $0 $0 $0 Sewell #1 $0 $0 $0 $0 $0 $0 $0 $0 Sewell #2 $0 $0 $0 $0 $0 $0 $0 $0 Total $0 $9,863 $9,863 $0 $0 $0 $0 $0 Note: No capital was projected for 4th quarter 2023. 18.2 Operating Cost Estimate Alpha provided historical operating costs for its active Road Fork #52 Mine from 2021 through 2023 for MM&A’s review. MM&A used the historical cost information as a reference and developed a personnel schedule for the mine. Hourly labor rates and salaries were based upon information contained in Alpha’s financial summaries. Fringe benefit costs were developed for vacation and holidays, federal and state unemployment insurance, retirement, workers’ compensation and pneumoconiosis, casualty and life insurance, healthcare and bonuses. A cost factor for mine supplies was developed that relates expenditures to mine advance rates for roof control costs and other mine supply costs based on the historical cost data provided by Alpha. Other factors were developed for maintenance and repair costs, rentals, mine power, outside services, coal preparation plant processing, refuse handling, coal loading, property taxes, insurance and bonding and other direct mining costs. Appropriate royalty rates were assigned for production from leased coal lands and sales taxes were calculated for state severance taxes, the federal black lung excise tax, and federal and state reclamation fees. Statutory sales-related costs are summarized in Table 18-2. Table 18-2: Estimated Coal Production Taxes and Sales Costs Description of Tax or Sales Cost Basis of Assessment Cost Federal Black Lung Excise Tax - Underground Per Ton $1.10 Federal Reclamation Fees – Underground Per Ton $0.12 West Virginia Reclamation Tax - Underground Per Ton $0.279 West Virginia Severance Tax Percentage of Revenue 1 to 5% Royalties - Underground Percentage of Revenue 5.0% Notes: 1. Federal black lung excise tax is paid only on coal sold domestically. Alpha Metallurgical Resources, Inc. Statement of Coal Resources and Reserves for the Kepler Complex in Accordance with United States SEC Standards as of December 31, 2023 Central Appalachian Coal Basin West Virginia, USA MARSHALL MILLER & ASSOCIATES, INC. 64 A summary of the projected operating costs for the consolidated Kepler operations is provided in Figure 18-2. Figure 18-2: Kepler Operating Costs 19 Economic Analysis 19.1 Economic Evaluation 19.1.1 Introduction The pre-feasibility financial model prepared for this TRS was developed to test the economic viability of each coal resource area. The results of this financial model are not intended to represent a bankable feasibility study, required for financing of any current or future mining operations contemplated for the Alpha properties, but are intended to establish the economic viability of the estimated coal reserves. Cash flows are simulated on an annual basis based on projected production from the coal reserves. The discounted cash flow analysis presented herein is based on an effective date of January 1, 2024. On an un-levered basis, the NPV of the project cash flow after taxes represents the Enterprise Value of the project. The project cash flow, excluding debt service, is calculated by subtracting direct and indirect operating expenses and capital expenditures from revenue. Direct costs include labor, operating supplies, maintenance and repairs, facilities cost for materials handling, coal preparation,

Alpha Metallurgical Resources, Inc. Statement of Coal Resources and Reserves for the Kepler Complex in Accordance with United States SEC Standards as of December 31, 2023 Central Appalachian Coal Basin West Virginia, USA MARSHALL MILLER & ASSOCIATES, INC. 65 refuse disposal, coal loading, reclamation and general and administrative costs. Indirect costs include statutory and legally agreed upon fees related to direct extraction of the mineral. The indirect costs are the Federal black lung tax, Federal and State reclamation taxes, property taxes, coal production royalties, and income taxes. The Alpha mines’ historical costs provided a useful reference for MM&A’s cost estimates. The operations are projected on a calendar year basis. MM&A’s projection of annual sales tonnage is summarized in the chart below. While all Alpha coal resource properties deemed by MM&A to have potential for classification as coal reserves were evaluated as part of the economic model, some of those resource areas were determined to be uneconomical in the current market and were therefore excluded from coal reserves as discussed below. Figure 19-1: Projection of Sales Tons Sales revenue is based on the coal price information provided to MM&A by Alpha. Only the revenue from Alpha’s captive mining operations is included in the financial model used for this TRS. The P&L projections of the individual mines of Alpha’s Kepler operations are then consolidated into a P&L and cash flow schedule for further testing of the economics. Projected debt service is excluded from the P&L and cash flow model in order to determine Enterprise Value of the aggregated entity. Alpha Metallurgical Resources, Inc. Statement of Coal Resources and Reserves for the Kepler Complex in Accordance with United States SEC Standards as of December 31, 2023 Central Appalachian Coal Basin West Virginia, USA MARSHALL MILLER & ASSOCIATES, INC. 66 The financial model expresses coal sales prices, operating costs, and capital expenditures in current day dollars without adjustment for inflation. Capital expenditures and reclamation costs are included based on engineering estimates for each mine by year. MM&A also included an estimate of administrative costs in the financial projections. Alpha will pay royalties for the various current and projected operations. The royalty rates vary by location as provided by Alpha. The royalty rates are 5.0% of the sales revenue. The projection model also includes consolidated income tax calculations at Alpha’s Kepler Division level, incorporating statutory depletion calculations, as well as state income taxes, and a federal tax rate of 21%. To the extent the Alpha mines generate net operating losses for tax purposes, the losses are carried over to offset future taxable income from Alpha mines. The terms “cash flows” and “project cash flows” used in this report refer to after-tax cash flows. Alpha’s projected consolidated annual revenue for the Kepler operations is shown in the chart below: Figure 19-2: Consolidated Annual Revenue Projected consolidated revenue, cash costs, and EBITDA for the Kepler operations are expressed in dollars per ton in the graph below.

Alpha Metallurgical Resources, Inc. Statement of Coal Resources and Reserves for the Kepler Complex in Accordance with United States SEC Standards as of December 31, 2023 Central Appalachian Coal Basin West Virginia, USA MARSHALL MILLER & ASSOCIATES, INC. 67 Figure 19-3: Revenue, Cash Costs, and EBITDA The above chart shows an assumed revenue of $137 per ton, cash costs of $79 to $109 per ton and EBITDA of $28 to $58 per ton. Positive EBITDA per ton averages $47.33 per ton over the life of the operations. Table 19-1 shows LOM tonnage, P&L, and EBITDA for each Alpha mine at Kepler. Table 19-1: Life-of-Mine Tonnage, P&L before Tax, and EBITDA Mine LOM Tonnage LOM Pre-Tax P&L P&L Per Ton LOM EBITDA EBITDA Per Ton P3 North 11,369 $193,042 $16.98 $444,423 $39.09 Road Fork #52 25,267 $957,448 $37.89 $1,310,357 $51.86 Sewell #1 584 $492 $0.84 $12,020 $20.59 Sewell #2 4,442 $139,620 $31.43 $205,199 $46.20 Consolidated Deep Mines 41,661 $1,290,603 $30.98 $1,971,999 $47.33 Note: (1) LOM tonnage evaluated in the financial model includes 4th quarter 2023 production (470,621 clean tons) which was subtracted from coal reserves in order to make the effective date of the reserves December 31, 2023. As shown in Table 19-1, all of the mines analyzed show positive EBITDA over the LOM. Overall, the Alpha consolidated Kepler operations show positive LOM P&L and EBITDA of $1.3 billion and $2.0 billion, respectively. Alpha Metallurgical Resources, Inc. Statement of Coal Resources and Reserves for the Kepler Complex in Accordance with United States SEC Standards as of December 31, 2023 Central Appalachian Coal Basin West Virginia, USA MARSHALL MILLER & ASSOCIATES, INC. 68 A breakdown of projected EBITDA for the consolidated Kepler operations is shown in the chart below: Figure 19-4: Annual EBITDA 19.1.2 Cash Flow Summary Alpha’s consolidated Kepler cash flow summary in constant dollars, excluding debt service, is shown in Table 19-2 below. Table 19-2: Project Cash Flow Summary (000) YE 12/31 YE 12/31 YE 12/31 YE 12/31 YE 12/31 YE 12/31 Total 2023 2024 2025 2026 2027 2028 Production & Sales tons 41,661 480 2,020 2,024 1,966 2,000 1,833 Total Revenue $5,696,747 $65,625 $276,149 $276,792 $268,773 $273,450 $250,667 EBITDA $1,971,999 $27,748 $117,271 $116,970 $109,709 $112,637 $93,999 Net Income $1,013,371 $18,889 $72,511 $71,788 $67,804 $71,058 $56,276 Net Cash Provided by Operating Activities $1,694,767 $17,465 $80,201 $97,518 $92,951 $93,789 $83,260 Purchases of Property, Plant, and Equipment ($457,193) $0 ($12,611) ($18,503) ($16,973) ($5,352) ($15,020) Net Cash Flow $1,237,574 $17,465 $67,590 $79,015 $75,977 $88,437 $68,240 YE 12/31 YE 12/31 YE 12/31 YE 12/31 YE 12/31 YE 12/31 YE 12/31 2029 2030 2031 2032 2033 2034 2035 Production & Sales tons 1,774 2,175 2,422 2,412 2,321 2,191 1,919 Total Revenue $242,533 $297,477 $331,226 $329,767 $317,322 $299,582 $262,458 EBITDA $86,355 $102,549 $128,106 $124,932 $116,170 $105,672 $79,801 Net Income $49,477 $53,749 $70,552 $70,742 $62,650 $56,781 $27,841 Net Cash Provided by Operating Activities $75,507 $83,644 $103,490 $107,124 $101,210 $92,588 $76,325 Purchases of Property, Plant, and Equipment ($23,888) ($33,594) ($33,119) ($7,544) ($29,907) ($8,640) ($87,478) Net Cash Flow $51,619 $50,050 $70,371 $99,580 $71,303 $83,948 ($11,153)

Alpha Metallurgical Resources, Inc. Statement of Coal Resources and Reserves for the Kepler Complex in Accordance with United States SEC Standards as of December 31, 2023 Central Appalachian Coal Basin West Virginia, USA MARSHALL MILLER & ASSOCIATES, INC. 69 YE 12/31 YE 12/31 YE 12/31 YE 12/31 YE 12/31 YE 12/31 YE 12/31 2036 2037 2038 2039 2040 2041 2042 Production & Sales tons 1,971 1,695 1,365 945 908 617 537 Total Revenue $269,482 $231,805 $186,637 $129,236 $124,211 $84,306 $73,369 EBITDA $93,986 $60,648 $51,169 $35,345 $37,842 $27,951 $22,899 Net Income $39,712 $17,855 $13,314 $11,502 $12,511 $7,653 $13,766 Net Cash Provided by Operating Activities $81,910 $64,660 $52,342 $21,581 $31,705 $27,130 $22,465 Purchases of Property, Plant, and Equipment ($22,306) ($4,320) ($11,545) ($7,200) ($19,673) ($7,275) $0 Net Cash Flow $59,604 $60,340 $40,797 $14,381 $12,031 $19,855 $22,465 YE 12/31 YE 12/31 YE 12/31 YE 12/31 YE 12/31 YE 12/31 YE 12/31 2043 2044 2045 2046 2047 2048 2049 Production & Sales tons 540 526 552 503 470 458 459 Total Revenue $73,905 $71,869 $75,453 $68,726 $64,237 $62,570 $62,806 EBITDA $23,529 $21,729 $25,193 $18,747 $14,491 $12,781 $13,123 Net Income $14,673 $9,842 $12,331 $7,509 $5,192 $3,549 $3,831 Net Cash Provided by Operating Activities $21,113 $19,738 $21,647 $18,247 $14,231 $12,090 $12,041 Purchases of Property, Plant, and Equipment ($4,320) ($11,751) ($5,543) ($6,583) ($7,200) ($7,200) $0 Net Cash Flow $16,793 $7,987 $16,104 $11,664 $7,031 $4,890 $12,041 YE 12/31 YE 12/31 YE 12/31 YE 12/31 YE 12/31 YE 12/31 YE 12/31 2050 2051 2052 2053 2054 2055 2056 Production & Sales tons 462 465 502 528 552 573 570 Total Revenue $63,240 $63,563 $68,583 $72,152 $75,415 $78,354 $77,924 EBITDA $13,651 $13,949 $18,445 $21,939 $25,019 $27,791 $27,496 Net Income $2,937 $3,215 $7,139 $10,870 $13,783 $15,042 $13,419 Net Cash Provided by Operating Activities $12,480 $12,845 $16,034 $19,137 $21,215 $23,022 $23,356 Purchases of Property, Plant, and Equipment ($13,687) ($11,914) ($4,320) $0 $0 ($9,863) ($9,863) Net Cash Flow ($1,207) $931 $11,714 $19,137 $21,215 $13,159 $13,493 YE 12/31 YE 12/31 YE 12/31 YE 12/31 YE 12/31 YE 12/31 YE 12/31 2057 2058 2059 2060 2061 2062 2063 Production & Sales tons 570 359 0 0 0 0 0 Total Revenue $78,004 $49,080 $0 $0 $0 $0 $0 EBITDA $27,435 $15,260 ($192) ($76) ($38) ($20) ($10) Net Income $15,805 $8,476 ($385) ($152) ($77) ($39) ($20) Net Cash Provided by Operating Activities $23,769 $19,533 ($1,559) ($520) ($260) ($130) ($130) Purchases of Property, Plant, and Equipment $0 $0 $0 $0 $0 $0 $0 Net Cash Flow $23,769 $19,533 ($1,559) ($520) ($260) ($130) ($130) (1) LOM tonnage evaluated in the financial model includes 4th quarter 2023 production (470,621 clean tons) which was subtracted from coal reserves in order to make the effective date of the reserves December 31, 2023. (2) Results shown for 2023 represent 4th quarter only. Consolidated cash flows are driven by annual sales tonnage, which grows from 2.0 million tons in 2024 to a peak of 2.4 million tons in 2031. Between years 2032 and 2038, sales ranges from 1.4 million to 2.4 million tons and between years 2039-2058, sales range from 0.4 million tons to 0.9 million tons. Projected consolidated revenue grows from $276.1 million in 2024 to a peak of $331.2 million in 2031. Revenue totals $5.7 billion for the project’s life. Consolidated cash flow from operations is positive throughout the projected operating period, with the exception of post-production years, due to end-of-mine reclamation spending. Consolidated cash flow from operations peaks at $107.1 million in 2032 and totals $1.7 billion over the project life. Capital expenditures total $53.4 million during the first five years and $457.2 million over the project’s life. Consolidated Kepler net cash flow after tax, but before debt service, is shown by year in the chart below: Alpha Metallurgical Resources, Inc. Statement of Coal Resources and Reserves for the Kepler Complex in Accordance with United States SEC Standards as of December 31, 2023 Central Appalachian Coal Basin West Virginia, USA MARSHALL MILLER & ASSOCIATES, INC. 70 Figure 19-5: Net Cash Flow after Tax (Before Debt Service) LOM net cash flow is positive for this project. The cash flows after year 2058 are generally related to end of mine reclamation expenditures, which are accrued over the life of the mines. 19.1.3 Discounted Cash Flow Analysis Cash flow after tax, but before debt service, generated over the life of the project was discounted to NPV at a 16.57% discount rate, which represents MM&A’s estimate of the constant dollar, risk adjusted WACC for likely market participants if the subject reserves were offered for sale. On an un-levered basis, the NPV of the project cash flows represents the Enterprise Value of the project and amounts to $427.1 million. Alpha is an active producer, and the financial model shows positive net cash flow for each year of the operating life of the Kepler reserves. The pre-feasibility financial model prepared for the TRS was developed to test the economic viability of each coal resource area. The NPV estimate was made for the purpose of confirming the economics for classification of coal reserves and not for purposes of valuing Alpha or its Kepler assets. Mine plans were not optimized, and actual results of the operations may be different, but in all cases, the mine production plan assumes the properties are under competent management. 19.1.4 Sensitivity Analysis Sensitivity of the NPV results to changes in the key drivers is presented in the chart below. The sensitivity study shows the NPV at the 16.57% discount rate when Base Case sales prices, operating

Alpha Metallurgical Resources, Inc. Statement of Coal Resources and Reserves for the Kepler Complex in Accordance with United States SEC Standards as of December 31, 2023 Central Appalachian Coal Basin West Virginia, USA MARSHALL MILLER & ASSOCIATES, INC. 71 costs, capital costs, and discount rate are increased and decreased in increments of 5% within a +/- 15% range. Figure 19-6: Sensitivity of NPV As shown, NPV is quite sensitive to changes in sales price and operating cost estimates, and slightly sensitive to changes in capital cost estimates. 20 Adjacent Properties 20.1 Information Used No Proprietary information associated with neighboring properties was used as part of this study. 21 Other Relevant Data and Information MM&A performed a previous evaluation of all the Property in year 2022 for reserves effective as of December 31, 2022, for Alpha based on SEC S-K 1300 regulations. MM&A utilized this former evaluation as the basis for the December 31, 2023 TRS. Alpha Metallurgical Resources, Inc. Statement of Coal Resources and Reserves for the Kepler Complex in Accordance with United States SEC Standards as of December 31, 2023 Central Appalachian Coal Basin West Virginia, USA MARSHALL MILLER & ASSOCIATES, INC. 72 22 Interpretation and Conclusions 22.1 Conclusion Sufficient data has been obtained through various exploration and sampling programs and mining operations to support the geological interpretations of seam structure and thickness for coal horizons situated on the Kepler Property. The data is of sufficient quantity and reliability to reasonably support the coal resource and coal reserve estimates in this TRS. The geological data and preliminary feasibility study, which consider mining plans, revenue, and operating and capital cost estimates are sufficient to support the classification of coal reserves provided herein. This geologic evaluation conducted in conjunction with the preliminary feasibility study is sufficient to conclude that the 41.2 Mt of marketable coal reserves identified on the Property are economically mineable under reasonable expectations of market prices for metallurgical coal products, estimated operation costs, and capital expenditures. 22.2 Risk Factors Risks have been identified for operational, technical and administrative subjects addressed in the Pre- Feasibility Study. A risk matrix has been constructed to present the risk levels for all the risk factors identified and quantified in the risk assessment process. The risk matrix and risk assessment process are modelled to that presented in the Australian and New Zealand Standard on Risk Management (AS/NZS 4360). The purpose of the characterization of the project risk components is to inform the project stakeholders of key aspects of the Alpha projects that can be impacted by events whose consequences can affect the success of the venture. The significance of an impacted aspect of the operation is directly related to both the probability of occurrence and the severity of the consequences. The initial risk for a risk factor is herein defined as the risk level after the potential impact of the risk factor is addressed by competent and prudent management utilizing control measures readily available. Residual risk for a risk factor is herein defined as the risk level following application of special mitigation measures if management determines that the initial risk level is unacceptable. Initial risk and residual risk can be quantified numerically, derived by the product of values assigned to probability and consequence ranging from very low risk to very high risk. The probability and consequence parameters are subjective numerical estimates made by practiced mine engineers and managers. Both are assigned values from 1 to 5 for which the value 1 represents the lowest probability and least consequence, and the value 5 represents the highest probability and

Alpha Metallurgical Resources, Inc. Statement of Coal Resources and Reserves for the Kepler Complex in Accordance with United States SEC Standards as of December 31, 2023 Central Appalachian Coal Basin West Virginia, USA MARSHALL MILLER & ASSOCIATES, INC. 73 greatest consequence. The products, which define the Risk Level, are classified from very low to very high. Risk Level Table (R = P x C) Risk Level (R) Very Low (1 to 2) Low (3 to 5) Moderate (6 to 11) High (12 to 19) Very High (20 to 25) Risk aspects identified and evaluated during this assignment total 13. No residual risks are rated Very High. Three (3) residual risks are rated High. Six (6) of the risk aspects could be associated with Moderate residual risk. Four (4) of the risk aspects were attributed Low or Very Low residual risks. 22.2.1 Governing Assumptions The listing of the aspects is not presumed to be exhaustive. Instead that listing is presented based on the experiences of the contributors to the TRS. 1. The probability and consequence ratings are subjectively assigned, and it is assumed that this subjectivity reasonably reflects the condition of the active and projected mine operations. 2. The Control Measures shown in the matrices presented in this chapter are not exhaustive. They represent a condensed collection of activities that the author of the risk assessment section has observed to be effective in coal mining scenarios. 3. Mitigation Measures listed for each risk factor of the operation are not exhaustive. The measures listed, however, have been observed by the author to be effective. 4. The monetary values used in ranking the consequences are generally accepted quantities for the coal mining industry. 22.2.2 Limitations The risk assessment proposed in this report is subject to the limitations of the information currently collected, tested, and interpreted at the time of the writing of the report. 22.2.3 Methodology The numerical quantities (i.e., risk levels) attributable to either “initial” or “residual” risks are derived by the product of values assigned to probability and consequence ranging from very low risk to very high risk. Alpha Metallurgical Resources, Inc. Statement of Coal Resources and Reserves for the Kepler Complex in Accordance with United States SEC Standards as of December 31, 2023 Central Appalachian Coal Basin West Virginia, USA MARSHALL MILLER & ASSOCIATES, INC. 74 R = P x C Where: R = Risk Level P = Probability of Occurrence C = Consequence of Occurrence The Probability (P) and Consequence (C) parameters recited in the formula are subjective numerical estimates made by practiced mine engineers and managers. Both P and C are assigned integer values ranging from 1 to 5 for which the value 1 represents the lowest probability and least consequence, and the value 5 represents the highest probability and greatest consequence. The products (R = P x C) which define the Risk Level, are thereafter classified from very low to very high. Risk Level Table Risk Level (R) Very Low (1 to 2) Low (3 to 5) Moderate (6 to 11) High (12 to 19) Very High (20 to 25) Very high initial risks are considered to be unacceptable and require corrective action well in advance of project development. In short, measures must be applied to reduce very high initial risks to a tolerable level. As shown and discussed above, after taking into account the operational, technical, and administrative actions that have been applied or are available for action when required, the residual risk can be determined. The residual risk provides a basis for the management team to determine if the residual risk level is acceptable or tolerable. If the risk level is determined to be unacceptable, further actions should be considered to reduce the residual risk to acceptable or tolerable levels to provide justification for continuation of the proposed operation. 22.2.4 Development of the Risk Matrix Risks have been identified for the technical, operational, and administrative subjects addressed in the TRS. The risk matrix and risk assessment process are modelled to that presented in the Australian and New Zealand Standard on Risk Management (AS/NZS 4360).

Alpha Metallurgical Resources, Inc. Statement of Coal Resources and Reserves for the Kepler Complex in Accordance with United States SEC Standards as of December 31, 2023 Central Appalachian Coal Basin West Virginia, USA MARSHALL MILLER & ASSOCIATES, INC. 75 22.2.4.2 Probability Level Table Table 22-1: Probability Level Table Category Probability Level (P) 1 Remote Not likely to occur except in exceptional circumstances. <10% 2 Unlikely Not likely to occur; small in degree. 10 - 30% 3 Possible Capable of occurring. 30 - 60% 4 Likely High chance of occurring in most circumstances. 60 - 90% 5 Almost Certain Event is expected under most circumstances; impossible to avoid. >90% The lowest rated probability of occurrence is assigned the value of 1 and described as remote, with a likelihood of occurrence of less than 10 percent. Increasing values are assigned to each higher probability of occurrence, culminating with the value of 5 assigned to incidents considered to be almost certain to occur. 22.2.4.3 Consequence Level Table Table 22-2 lists the consequence levels. Alpha Metallurgical Resources, Inc. Statement of Coal Resources and Reserves for the Kepler Complex in Accordance with United States SEC Standards as of December 31, 2023 Central Appalachian Coal Basin West Virginia, USA MARSHALL MILLER & ASSOCIATES, INC. 76 Table 22-2: Consequence Level Table Correlation of Events in Key Elements of the Project Program to Event Severity Category Category Severity of the Event Financial Impact of the Event Unplanned Loss of Production (Impact on Commercial Operations) Events Impacting on the Environment Events Affecting the Program’s Social and Community Relations Resultant Regulatory / Sovereign Risk Events Affecting Occupational Health & Safety 1 Insignificant < USD $0.5 million ≤ 12 hours Insignificant loss of habitat; no irreversible effects on water, soil and the environment. Occasional nuisance impact on travel. Event recurrence avoided by corrective action through established procedures (Engineering, guarding, training). 2 Minor USD $0.5 million to $2.0 million ≤ 1 day No significant change to species populations; short- term reversible perturbation to ecosystem function. Persistent nuisance impact on travel. Transient adverse media coverage. First aid – lost time. Event recurrence avoided by corrective action thought established procedures. 3 Moderate USD $2.0 million to $10.0 million ≤ 1 week Appreciable change to species population; medium-term (≤10 years) detriment to ecosystem function. Measurable impact on travel and water/air quality. Significant adverse media coverage / transient public outrage. Uncertainty securing or retaining essential approval / license. Medical Treatment – permanent incapacitation Avoiding event recurrence requires modification to established corrective action procedures. Change to regulations (tax; bonds; standards). 4 Major USD $10.0 million to $50.0 million 1 to 2 weeks Change to species population threatening viability; long-term (>10 years) detriment to ecosystem function. Long-term, serious impact on travel and use of water resources; degradation of air quality; sustained and effective public opposition. Suspension / long-delay in securing essential approval / license. Fatality. Avoiding event recurrence requires modification to established corrective action procedures and staff retraining. Change to laws (tax; bonds; standards). 5 Critical >USD $50.0 million >1 month Species extinction; irreversible damage to ecosystem function. Loss of social license. Withdraw / failure to secure essential approval / license. Multiple fatalities. Avoiding event recurrence requires major overhaul of policies and procedures.

Alpha Metallurgical Resources, Inc. Statement of Coal Resources and Reserves for the Kepler Complex in Accordance with United States SEC Standards as of December 31, 2023 Central Appalachian Coal Basin West Virginia, USA MARSHALL MILLER & ASSOCIATES, INC. 77 The lowest rated consequence is assigned the value of 1 and is described as Insignificant Consequence parameters include non-reportable safety incidents with zero days lost accidents, no environmental damage, loss of production or systems for less than 12 hours and cost of less than USD $0.5 million. Increasing values are assigned to each higher consequence, culminating with the value of 5 assigned to critical consequences, the parameters of which include multiple-fatality accidents, major environmental damage, and loss of production or systems for longer than one month and cost of greater than USD $50.0 million. Composite Risk Matrix R = P x C and Color-Code Convention The risk level, defined as the product of probability of occurrence and consequence, ranges in value from 1 (lowest possible risk) to 25 (maximum risk level). The values are color-coded to facilitate identification of the highest risk aspects. Table 22-3: Risk Matrix P x C = R Consequence (C) Insignificant Minor Moderate Major Critical 1 2 3 4 5 P ro b ab ili ty L ev el ( P ) Remote 1 1 2 3 4 5 Unlikely 2 2 4 6 8 10 Possible 3 3 6 9 12 15 Likely 4 4 8 12 16 20 Almost Certain 5 5 10 15 20 25 22.2.5 Categorization of Risk Levels and Color Code Convention Very high risks are considered to be unacceptable and require corrective action. Risk reduction measures must be applied to reduce very high risks to a tolerable level. 22.2.6 Description of the Coal Property The Kepler Mine Complex (Kepler) is located in located in Wyoming, Raleigh and McDowell Counties, West Virginia and is an active operation with one underground mine. The active underground operation within the Kepler Mine Complex (Road Fork #52) utilizes continuous mining production sections. This method provides continuity, preserving skilled work groups and enabling effective Alpha Metallurgical Resources, Inc. Statement of Coal Resources and Reserves for the Kepler Complex in Accordance with United States SEC Standards as of December 31, 2023 Central Appalachian Coal Basin West Virginia, USA MARSHALL MILLER & ASSOCIATES, INC. 78 utilization of existing production equipment. The active and projected mines are located above and below drainage and as such are accessed via a combination of drifts, box cuts, shafts and slopes. 22.2.7 Summary of Residual Risk Ratings Each risk factor is numbered, and a risk level for each is determined by multiplying the assigned probability by the assigned consequence. The risk levels are plotted on a risk matrix to provide a composite view of the Alpha risk profile. The average risk level is 6.6, which is defined as Moderate. Table 22-4: Risk Assessment Matrix C o n se q u en ce Critical >$50 MM Major $10-50MM 9 6 Moderate $2-10 MM 1, 12 2, 4, 8, 14 3 Minor $0.5-$2 MM 13 5, 7, 10 Low <$0.5 MM 11 <10% 10-30% 30-60% 60-90% >90% Remote Unlikely Possible Likely Almost Certain 22.2.8 Risk Factors A high-level approach is utilized to characterize risk factors that are generally similar across a number of the active and proposed mining operations. Risk factors that are unique to a specific operation or are particularly noteworthy are addressed individually. 22.2.8.1 Geological and Coal Resource Coal mining is accompanied by risk that, despite exploration efforts, mining areas will be encountered where geological conditions render extraction of the resource to be uneconomic, or that coal quality characteristics disqualify the product for sale into target markets. Offsetting the geological and coal resource risk are the size of the controlled property which allows flexibility in the selection of mine areas away from areas where coal quality and mineability are less favorable. In addition, many of the underground mines are designed to operate with multiple production sections each, which lessens the immediate impact when one section encounters difficulties. The large reserve areas also provide a mitigation strategy of varying the timing of

Alpha Metallurgical Resources, Inc. Statement of Coal Resources and Reserves for the Kepler Complex in Accordance with United States SEC Standards as of December 31, 2023 Central Appalachian Coal Basin West Virginia, USA MARSHALL MILLER & ASSOCIATES, INC. 79 development of mines to offset expected or encountered adverse conditions, thereby maintaining consistent production and quality. This flexibility requires additional extension or development cost but increases performance consistency. The larger reserve areas will be developed with multiple production sections and the small, replacement production reserve areas provide ready access to alternative locations if geological and coal resource characteristics require abandonment of an active production area. Table 22-5: Geological and Coal Resource Risk Assessment (Risks 1 and 2) Aspect Impact Control Measures Initial Risk Level Mitigation Measures Residual Risk Level P C R P C R Recoverable coal tons recognized to be significantly less than previously estimated. Reserve base is adequate to serve market commitments and respond to opportunities for many years. Local adverse conditions may increase frequency and cost of production unit relocations. Previous and ongoing exploration and extensive regional mining history provide a high level of confidence of coal seam correlation, continuity of the coal seams, and coal resource tons. 1 4 4 Optimize mine plan to increase resource recovery; develop mine plan to provide readily available alternate mining locations to sustain expected production level. 1 3 3 Coal quality locally proves to be lower than initially projected. If uncontrolled, production and sale of coal that is out of specification can result in rejection of deliveries, cancellation of coal sales agreements and damage to reputation. Exploration and vast experience and history in local coal seams provide confidence in coal quality; limited excursions can be managed with careful product segregation and blending. 2 5 10 Develop mine plan to provide readily available alternate mining locations to sustain expected production level; modify coal sales agreements to reflect coal quality. 2 3 6 22.2.8.2 Environmental Water quality and other permit requirements are subject to modification and such changes could have a material impact on the capability of the operator to meet modified standards or to receive new permits and modifications to existing permits. Permit protests may result in delays or denials to permit applications. Environmental standards and permit requirements have evolved significantly over the past 50 years and to-date, mining operators and regulatory bodies have been able to adapt successfully to evolving environmental requirements. Alpha Metallurgical Resources, Inc. Statement of Coal Resources and Reserves for the Kepler Complex in Accordance with United States SEC Standards as of December 31, 2023 Central Appalachian Coal Basin West Virginia, USA MARSHALL MILLER & ASSOCIATES, INC. 80 Table 22-6: Environmental (Risks 3 and 4) Aspect Impact Control Measures Initial Risk Level Mitigation Measures Residual Risk Level P C R P C R Environmental performance standards are modified in the future. Delays in receiving new permits and modifications to existing permits; cost of testing and treatment of water and soils Work with regulatory agencies to understand and influence final standards; implement testing, treatment and other actions to comply with new standards. 3 4 12 Modify mining and reclamation plans to improve compliance with new standards while reducing cost of compliance. 3 3 9 New permits and permit modifications are increasingly delayed or denied. Interruption of production and delayed implementation of replacement production from new mines. Comply quickly with testing, treatment and other actions required; continue excellent compliance performance within existing permits. 2 4 8 Establish and maintain close and constructive working relationships with regulatory agencies, local communities and community action groups. 2 3 6 22.2.8.3 Regulatory Requirements Federal and state health and safety regulatory agencies occasionally amend mine laws and regulations. The impact is industry wide. Mining operators and regulatory agencies have been able to adapt successfully to evolving health and safety requirements. Table 22-7: Regulatory Requirements (Risk 5) Aspect Impact Control Measures Initial Risk Level Mitigation Measures Residual Risk Level P C R P C R Federal and state mine safety and health regulatory agencies amend mine laws and regulations. Cost of training, materials, supplies and equipment; modification of mine examination and production procedures; modification of mining plans. Participate in hearings and workshops when possible to facilitate understanding and implementation; work cooperatively with agencies and employees to facilitate implementation of new laws and regulations. 4 3 12 Familiarity and experience with new laws and regulations results in reduced impact to operations and productivity and improved supplies and equipment options. 4 2 8 22.2.8.4 Market and Transportation Most of the current and future production is expected to be directed to domestic and international metallurgical markets. Historically the metallurgical markets have been cyclical and highly volatile. Table 22-8: Market and Transportation (Risk 6) Aspect Impact Control Measures Initial Risk Level Mitigation Measures Residual Risk Level P C R P C R Volatile coal prices drop precipitously. Loss of revenue adversely affects profitability; reduced cash flow may disrupt capital expenditures plan. Cost control measures implemented; capital spending deferred. 4 5 20 High-cost operations closed, and employees temporarily furloughed. 4 4 16

Alpha Metallurgical Resources, Inc. Statement of Coal Resources and Reserves for the Kepler Complex in Accordance with United States SEC Standards as of December 31, 2023 Central Appalachian Coal Basin West Virginia, USA MARSHALL MILLER & ASSOCIATES, INC. 81 Occasional delay or interruption of rail, river and terminals service may be expected. The operator can possibly minimize the impact of delays by being a preferred customer by fulfilling shipment obligations promptly and maintaining close working relationships. Table 22-9: Market and Transportation (Risk 7) Aspect Impact Control Measures Initial Risk Level Mitigation Measures Residual Risk Level P C R P C R Rail or river transport is delayed; storage and shipping access at river and ocean terminals is not available. Fulfillment of coal sales agreements delayed; limited coal storage at mines may increase cost of rehandling; production may be temporarily idled. Provide adequate storage capacity at mines; coordinate continuously with railroad and shipping companies to respond quickly and effectively to changing circumstances. 4 3 12 Provide back-up storage facility along with personnel, equipment and rehandle plan to sustain production and fulfill sales obligations timely. 4 2 8 22.2.8.5 Mining Plan Occupational health and safety risks are inherent in mining operations. Comprehensive training and retraining programs, internal safety audits and examinations, regular mine inspections, safety meetings, along with support of trained fire brigades and mine rescue teams are among activities that greatly reduce accident risks. Employee health monitoring programs coupled with dust and noise monitoring and abatement reduce health risks to miners. As underground mines are developed and extended, observation of geological, hydrogeological and geotechnical conditions lead to modification of mine plans and procedures to enable safe work within the mine environments. Highlighted below are selected examples of safety and external factors relevant to Alpha’s operations. 22.2.8.5.1 Methane Management Coalbed methane is present in coal operations below drainage. Often the methane concentration in shallow coal seams is at such low levels that it can be readily managed with frequent testing and monitoring, vigilance mine ventilation and routine ventilation surveys. Very high methane concentrations may be present at greater depths. High methane concentrations may require degasification of the coal seam to assure safe mining. Methane is not expected to be present in above- drainage mines of the Kepler property. Alpha Metallurgical Resources, Inc. Statement of Coal Resources and Reserves for the Kepler Complex in Accordance with United States SEC Standards as of December 31, 2023 Central Appalachian Coal Basin West Virginia, USA MARSHALL MILLER & ASSOCIATES, INC. 82 Table 22-10: Methane Management (Risk 8) Aspect Impact Control Measures Initial Risk Level Mitigation Measures Residual Risk Level P C R P C R Methane hazard is present in mines operating below drainage. Injury or loss of life; possible ignition of gas and mine explosion; potential loss of mine and equipment temporarily or permanently; additional mine fan, mine power, ventilation, monitoring and examination requirements. Low to moderate levels can be managed with frequent examinations, testing and monitoring within the mine ventilation system. Excellent rock dust maintenance minimizes explosion propagation risk should an ignition occur. 2 5 10 Very high-level methane concentrations may require coal seam degasification and gob degasification where pillar extraction methods are employed. 2 3 6 22.2.8.5.2 Mine Fires Mine fires, once common at mine operations, are rare today. Most active coal miners have not encountered a mine fire. Vastly improved mine power and equipment electrical systems, along with safe mine practices reduce mine fire risks. Crew training and fire brigade support and training improve response for containment and control if a fire occurs. Spontaneous combustion within coal mines, which is the source of most fires that occur today, is not expected to commonly occur at the Alpha property. When spontaneous combustion conditions are present, monitoring systems are employed for early detection and mine plans are designed to facilitate isolation, containment and rapid extinguishment. Table 22-11: Mine Fires (Risk 9) Aspect Impact Control Measures Initial Risk Level Mitigation Measures Residual Risk Level P C R P C R Mine fire at underground operation or plant stockpile fire. Injury or loss of life; potential loss of mine temporarily or permanently; damage to equipment and mine infrastructure. Inspection and maintenance of mine power, equipment and mine infrastructure; good housekeeping; frequent examination of conveyor belt entries; prompt removal of accumulations of combustible materials. 1 5 5 If spontaneous combustion conditions are present, enhanced monitoring and examination procedures will be implemented; mine design will incorporate features to facilitate isolation, containment and extinguishment of spontaneous combustion locations. 1 4 4 22.2.8.5.3 Ground Control Underground mining exposes miners to the risks of roof falls and rib rolls. Ground control-based risks can be mitigated through effective roof control plans which are supplemented with a strong understanding of future geotechnical conditions. Foremen and crews should be trained to examine the roof, rib and floor conditions and identify pending and immediate hazards. Multiple publicly available software programs can be used to assess pillar sizing and stability.

Alpha Metallurgical Resources, Inc. Statement of Coal Resources and Reserves for the Kepler Complex in Accordance with United States SEC Standards as of December 31, 2023 Central Appalachian Coal Basin West Virginia, USA MARSHALL MILLER & ASSOCIATES, INC. 83 Table 22-12: Ground Control (Risk 10) Aspect Impact Control Measures Initial Risk Level Mitigation Measures Residual Risk Level P C R P C R Ground control issues cause roof failures, rib rolls, floor heave, etc. Injury or loss of life; catastrophic damage to equipment; production interruption. Regular inspection for change and signs of failure. Dynamic design of roof control plan and safety measures to honor observed conditions and exploration- based information; conservative pillar design. 4 3 12 Multiple operating sections to mitigate any lost production; availability of new working areas in case abandonment of section is required; availability of alternative roof control technologies in case of abrupt changes in mining conditions. 4 2 8 22.2.8.5.4 Availability of Supplies and Equipment The industry has periodically experienced difficulty receiving timely delivery of mine supplies and equipment. Availability issues often accompanied boom periods for coal demand. Any future delivery of supplies and equipment delays are expected to be temporary with limited impact on production. Table 22-13: Availability of Supplies and Equipment (Risk 11) Aspect Impact Control Measures Initial Risk Level Mitigation Measures Residual Risk Level P C R P C R Disruption of availability for supplies and equipment. Temporary interruption of production. Force majeure provision in coal sales agreements to limit liability for delayed or lost sales. 3 2 6 Work closely with customers to assure delayed coal delivery rather than cancelled sales; monitory external conditions and increase inventory of critical supplies; accelerate delivery of equipment when possible. 3 1 3 22.2.8.5.5 Labor Work stoppage due to labor protests are considered to be unlikely and accompanied by limited impact should it occur. Strong employee relations and communications limit the exposure to outside protesters. Loss of supervisors and skilled employees to retirement is inevitable; the impact can be lessened with succession planning, training and mentorship of new employees. Alpha Metallurgical Resources, Inc. Statement of Coal Resources and Reserves for the Kepler Complex in Accordance with United States SEC Standards as of December 31, 2023 Central Appalachian Coal Basin West Virginia, USA MARSHALL MILLER & ASSOCIATES, INC. 84 Table 22-14: Labor – Work Stoppage (Risk 12) Aspect Impact Control Measures Initial Risk Level Mitigation Measures Residual Risk Level P C R P C R Work stoppage due to slowdowns or secondary boycott activity. Loss of production and coal sales; damaged customer and employee relations; reputation loss. Maintain excellent employee relations and communications; maintain frequent customer communications. 2 3 6 Develop plan for employee communications and legal support to minimize impact of secondary boycott activities. 1 3 3 Table 22-15: Labor – Retirement (Risk 13) Aspect Impact Control Measures Initial Risk Level Mitigation Measures Residual Risk Level P C R P C R Retirement of supervisors and skilled employees. Loss of leadership and critical skills to sustain high levels of safety, maintenance and productivity. Monitor demographics closely and maintain communications with employees who are approaching retirement age; maintain employee selection and training programs. 3 3 9 Maintain selection of candidates and implementation of in-house or third-party training for electricians and mechanics; develop employee mentoring program. 3 2 6 22.2.8.6 Comprehensive Health and Safety While largely incorporated in mine plan-based risk factors, effective health and safety programs reduce the risk of accidents, associated loss of production and fines. Currently, coal mining and processing requires a robust health and safety team, consisting of executive level health and safety roles, regional health and safety managers, and multiple operational level health and safety coordinators. Table 22-16: Health and Safety (Risk 14) Aspect Impact Control Measures Initial Risk Level Mitigation Measures Residual Risk Level P C R P C R Failure to attain operations safety standards and associated occurrence of accidents Injuries and possible loss of life; damage to morale and workforce confidence; loss of production and diminished productivity; regulatory issues, closures and fines; reputation loss Safety and loss control awareness training to help employees recognize hazardous conditions and actions; frequent job observations and feedback; periodic employee performance reviews 2 5 10 Senior management's active participation in safety process; utilization of motivational methods to reinforce company's values and commitment to safety; regular comprehensive safety audits to assure safety standards are maintained. 2 3 6

Alpha Metallurgical Resources, Inc. Statement of Coal Resources and Reserves for the Kepler Complex in Accordance with United States SEC Standards as of December 31, 2023 Central Appalachian Coal Basin West Virginia, USA MARSHALL MILLER & ASSOCIATES, INC. 85 23 Recommendations Alpha is continuing to work both internally and with outside assistance to further define their Resource Base and to Optimize the LOM Plan. 24 References Publicly available information from various State and Federal agencies was used where relevant. JOURNEL, A.G., & HUIJBREGTS, CH, J., 1978: Mining Geostatistics, The Blackburn Press Caldwell, New Jersey. 25 Reliance on Information Provided by Registrant A summary of the information provided by Alpha relied upon by MM&A for the purposes of this TRS is provided in Table 25-1. Table 25-1: Information from Registrant Relied Upon by MM&A Category Information Provided by Alpha Report Section Marketing Long-term price forecast used in financial projections 16.2 Legal Mineral control and surface control rights as shown on maps 3.2, 3.3 Environmental Permit and bonding information 17.3 APPENDIX A SUMMARY TABLES

Alpha Metallurgical Resources 2023 SEC Filing - Kepler Properties Summary of Coal Resource (Short Tons) • Effective December 31, 2023 Appendix A Table 1 Mine/Area Seam Measured Indicated Total Inferred Grand Total Owned Leased Permitted Not Permitted Ash% Sulfur% VM% Sewell #2 West Sewell 0 0 0 0 0 0 0 0 0 - - - Sewell #1 East Sewell 0 0 0 0 0 0 0 0 0 - - - Proposed P3 North Pocahontas 3 0 0 0 0 0 0 0 0 0 - - - Wyoming 2 Sewell 3,180,000 254,000 3,434,000 0 3,434,000 0 3,434,000 2,505,000 929,000 5 0.5 23 Resource Only Sewell 1,994,000 1,521,000 3,514,000 0 3,514,000 115,000 3,399,000 0 3,514,000 4 0.9 24 Resource Only Pocahontas 6 0 23,565,000 23,565,000 0 23,565,000 481,000 23,085,000 0 23,565,000 - - - Road Fork 52 Pocahontas 3 1,835,000 517,000 2,352,000 0 2,352,000 0 2,352,000 1,396,000 957,000 10 1.1 20 Total 7,009,000 25,857,000 32,866,000 0 32,866,000 596,000 32,270,000 3,901,000 28,965,000 6 0.8 22 Note(1): Resource tons are exclusive of reserve tons (not converted to reserve). Note (2): Coal resources are reported on a dry basis. Surface moisture and inherent moisture are excluded. All resources exclusive of reserves are considered on a met market. Totals may not add due to rounding. Quality (Dry Basis) Coal Resource (Dry Tons, In Situ) By Reliability Category By Control Type By Permit Status Alpha Metallurgical Resources 2023 SEC Filing - Kepler Properties Summary of Coal Reserves (Short Tons) • Effective December 31, 2023 Appendix A Table 2 By Reliability Category By Mining Type By Control Type By Permit Status By Market Mine Seam Proven Probable Total Surface UG Owned Leased Permitted Not Permitted Thermal Met Ash% Sulfur% VM% Sewell #2 Sewell 3,222,000 1,220,000 4,442,000 0 4,442,000 3,000 4,438,000 0 4,442,000 0 4,442,000 3 0.5 24 Sewell #1 Sewell 581,000 3,000 584,000 0 584,000 0 584,000 549,000 34,000 0 584,000 4 0.7 23 Road Fork 52 (Pocahontas 3) Pocahontas 3 15,370,000 9,426,000 24,796,000 0 24,796,000 255,000 24,541,000 14,515,000 10,281,000 0 24,796,000 6 0.9 19 Proposed P3 North Pocahontas 3 3,859,000 7,510,000 11,369,000 0 11,369,000 0 11,369,000 0 11,369,000 0 11,369,000 6 0.9 20 Grand Total 23,031,000 18,159,000 41,191,000 0 41,191,000 258,000 40,932,000 15,065,000 26,126,000 0 41,190,000 5 0.8 20 Notes: Marketable reserve tons are reported on a moist basis, including a combination of surface and inherent moisture. Coal quality is based on a weighted average of laboratory data from core hole. The combination of surface and inherent moisture is modeled at 6.5-percent. Actual product moisture is dependent upon multiple geological factors, operational factors, and product contract specifications and can exceed 8-percent. As such, the modeled moisture values provide a level of conservatism for reserve reporting. *Volatile Matter analysis is not available for the Beckley seam reserve areas. The Beckley reserves are priced as a Mid-Vol. product. Totals may not add due to rounding. Quality (Dry Basis) Demonstrated Coal Reserves (Wet Tons, Washed or Direct Shipped)

APPENDIX B INITIAL ECONOMIC ASSESSMENT, KEPLER RESOURCES EXCLUSIVE OF RESERVES Sewell Wyoming 2 Sewell P6 P6 P6 P3 Blocks A,B,D Block F Block A Blocks B,C,D Blocks F,G BlockS E,F,G In-Place Resource Tons (not adjusted for Q4 2023 Depletion) 5,695,960 1,252,740 6,298,030 15,070,060 2,197,160 2,352,030 Potentially Recoverable Tons* 2,930,000 570,000 2,870,000 7,430,000 1,080,000 960,000 Mining Method Deep - CM Deep - CM Deep - CM Deep - CM Deep - CM Deep - CM Assumed Sales Realization at Plant** 140$ 140$ 140$ 140$ 140$ 140$ Iniital Capex Estimate to Access Resources*** 2,300,000$ 3,480,000$ 5,800,000$ 5,800,000$ 5,800,000$ 2,300,000$ Direct Mining Costs: Labor**** 39.74$ 36.98$ 33.72$ 36.08$ 40.18$ 26.30$ Supplies, Excluding Roof Control 12.73$ 11.85$ 10.81$ 11.56$ 12.87$ 7.02$ Roof Control 6.87$ 6.40$ 5.83$ 6.24$ 6.95$ 8.96$ M&R 12.20$ 10.18$ 10.19$ 10.95$ 13.04$ 13.43$ Power 1.50$ 1.25$ 1.25$ 1.34$ 1.60$ 1.65$ Other 2.03$ 1.69$ 1.70$ 1.82$ 2.17$ 2.23$ Total Direct Cash Costs 75.08$ 68.34$ 63.49$ 67.99$ 76.81$ 59.58$ Transporation, Washing, Environmental & G&A Costs: Coal Prep***** 13.00$ 10.84$ 10.85$ 11.66$ 13.89$ 14.28$ Materials Handling 2.29$ 1.91$ 1.91$ 2.05$ 2.45$ 2.51$ Raw Coal Trucking***** 4.76$ 8.39$ 7.59$ 6.71$ 12.83$ -$ Clean Coal Trucking 1.25$ 1.25$ 1.25$ 1.25$ 1.25$ 1.25$ Enviro****** 1.00$ 1.00$ 1.00$ 1.00$ 1.00$ 1.00$ G&A 3.80$ 3.80$ 3.80$ 3.80$ 3.80$ 3.80$ Total Transporation, Washing, Environmental & G&A Costs: 26.10$ 27.19$ 26.41$ 26.48$ 35.22$ 22.84$ Indirect Cash Costs Royalty 9.80$ 9.80$ 9.80$ 9.80$ 9.80$ 9.80$ Black Lung Excise Tax 0.55$ 0.55$ 0.55$ 0.55$ 0.55$ 0.55$ SMCRA 0.12$ 0.12$ 0.12$ 0.12$ 0.12$ 0.12$ State Severance 1.40$ 2.80$ 2.80$ 1.40$ 1.40$ 2.80$ Property Tax & Insurance 1.15$ 1.15$ 1.15$ 1.15$ 1.15$ 1.15$ Total Indirect Cash Costs 13.02$ 14.42$ 14.42$ 13.02$ 13.02$ 14.42$ Non Cash Costs Amoritiztion of Development Capital 0.78$ 6.09$ 2.02$ 0.78$ 5.39$ 2.39$ Depreciation of Initial Equipment and Sustaining Capital 6.73$ 6.73$ 6.73$ 6.73$ 6.73$ 6.73$ Depletion 1.00$ 1.00$ 1.00$ 1.00$ 1.00$ 1.00$ Total Non Cash 8.52$ 13.82$ 9.75$ 8.51$ 13.12$ 10.13$ Total Cash Cost 114.19$ 109.95$ 104.32$ 107.49$ 125.05$ 96.84$ EBITDA 25.81$ 30.05$ 35.68$ 32.51$ 14.95$ 43.16$ Fully Loaded Cost 122.71$ 123.77$ 114.07$ 116.00$ 138.16$ 106.96$ Fully Loaded P&L 17.29$ 16.23$ 25.93$ 24.00$ 1.84$ 33.04$ Passes Resource Iniital Economic Assessment? YES YES YES YES YES YES *Potentially recoverable tons are calculated by applying appropriate modifying factors to in-place resource tonnages **Sales relization represents approximate 2-year historicals for Kepler product ***Capex estimate inclusive of site development and seam access, including water, power, etc. ****Labor rates are driven based off of super section productivities assuming 250 to 300 feet per unit shift per section. *****Processing assumed to occur at Kepler plant, requiring haulage to plant. ******Environmental costs assumed to include permiting, outfall maintenance, etc. Initial Economic Assessment, Kepler Resources Exclusive of Reserves Appendix B AMR118 Kepler Initial Economic Assessment Resources Exclusive of Reserves 123123_sp122123.xlsx • Appendix • 1/16/2024 Page 1 of 1

APPENDIX C MAPS 11-1-18 R N STE WE GRADE AND R O A D R A IL OLD FO LK NOR UNNEL T Park Trailer Marianna Mine No.3 Wyoming Mine Strip OLD PORTALS 11-9-18 12-1-18 T panel U panel Sealed Area Sealed Area Sealed Area Sealed Area Wyoming No.2 Mine ER N ST WE O LD AN D NO RF O LK Sewell # 2 Sewell # 1 2 Scale In Miles 0 Data Point Location Map 1 Kepler Area Sewell Seam Alpha Metallurgical Resource, LLC Wyoming County, West Virginia Coordinate System: West Virginia South State Plane NAD 27 Controlled Underground Reserve / Resource as of 12/31/23 Previous Underground Mining N Resource Exclusive of Reserve / Not Converted to Reserve Resource Inclusive of Reserve / Converted to Reserve

Tralee No. 1 Mine Extractors No. 1 Mine G&A No. 2 Mine Joe Branch No. 1 Mine Wyoming No. 1 Mine Joe Branch No.2 Mine Still Run No. 3 Mine 1 Scale In Miles 0 Data Point Location Map 2 Kepler Area Pocahontas No. 6 Seam Alpha Metallurgical Resource, LLC Wyoming County, West Virginia Coordinate System: West Virginia South State Plane NAD 27 Controlled Underground Reserve / Resource as of 12/31/23 Previous Underground Mining N Resource Exclusive of Reserve / Not Converted to Reserve 20 R R R RR R R R R R R R R RR R 5 Right Off 3 South Mains DH dh dh dh dh well bor e locate d OLD LONGWALL SECTION "F AU LT " 5 10 40 R R 9 10 11 13 14 15 16 17 18 SEAL 2 SEAL 1 SEAL 3 SE AL 4 SE AL 5 SE AL 6 SE AL 7 SE AL 8 D D D D D D D D D R R R R R DD R R R R R R R R R R D R R WT 12 R R R R R R R R R R R R R R R R R RR R R RRRRRR R R R R R R R R R R R R R R R R R R R R R R R R 19 Seals 19-29 22 23 24 25 27 28 29 35 36 373839 40 41 42 43 44 45 Seals 30-34 Seals 35-39 Seals 40-49 R R R R D D R RR R R 20 21 26 34 33 32 31 30 49 WT 48 47 46 DD R WT R D D RR R well bor e locate d 1 5 10 15 20 25 30 R N STE WE GRADE AND R O A D R A IL OLD FO LK NOR UNNEL T Alpha Land and Reserves LLC (Lessee) Heartwood Forestland Fund III, L.P. (Lessor) Pinnacle Mine (Road Fork 51) Guyandotte Energy Mine P3 North Road Fork 52 Road Fork 52 Mine 1.5 Scale In Miles 0 Data Point Location Map 3 Kepler Area Pocahontas No. 3 Seam Alpha Metallurgical Resource, LLC Wyoming & McDowell Counties, West Virginia Coordinate System: West Virginia South State Plane NAD 27 Controlled Underground Reserve / Resource as of 12/31/23 Previous Underground Mining N Resource Exclusive of Reserve / Not Converted to Reserve Resource Inclusive of Reserve / Converted to Reserve
EX-96.3
15
finalkingstontrswithappe.htm
TECHNICAL REPORT SUMMARY - KINGSTON MINING COMPLEX
finalkingstontrswithappe

Alpha Metallurgical Resources, Inc. Statement of Coal Resources and Reserves for the Kingston Mining Complex in Accordance with United States SEC Standards as of December 31, 2023 Central Appalachian Coal Basin West Virginia, USA February 2024 Prepared for: Alpha Metallurgical Resources, Inc. 340 Martin Luther King Jr. Blvd. Bristol, TN 37620 Prepared by: MARSHALL MILLER & ASSOCIATES, INC. 582 Industrial Park Road Bluefield, Virginia 24605 www.mma1.com Alpha Metallurgical Resources, Inc. Statement of Coal Resources and Reserves for the Kingston Mining Complex in Accordance with United States SEC Standards as of December 31, 2023 Central Appalachian Coal Basin West Virginia, USA MARSHALL MILLER & ASSOCIATES, INC. 2 Statement of Use and Preparation This updated Technical Report Summary (TRS) was prepared for the sole use of Alpha Metallurgical Resources, Inc. (Alpha) and its affiliated and subsidiary companies and advisors. Copies or references to information in this report may not be used without the written permission of Alpha. The report provides a statement of coal resources and coal reserves for Alpha, as defined under the United States Securities and Exchange Commission (SEC). The statement is based on information provided by Alpha and reviewed by various professionals within Marshall Miller & Associates, Inc. (MM&A). MM&A professionals who contributed to the drafting of this report meet the definition of Qualified Persons (QPs), consistent with the requirements of the SEC. The information in this TRS related to coal resources and reserves is based on, and fairly represents, information compiled by the QPs. At the time of reporting, MM&A’s QPs have sufficient experience relevant to the style of mineralization and type of deposit under consideration and to the activity they are undertaking to qualify as a QP as defined by the SEC. Each QP consents to the inclusion in this report of the matters based on their information in the form and context in which it appears. Certain information set forth in this report contains “forward-looking information,” including production, productivity, operating costs, capital costs, sales prices, and other assumptions. These statements are not guarantees of future performance and undue reliance should not be placed on them. The assumptions used to develop the forward-looking and the risks that could cause the actual results to differ materially are detailed in the body of this report. Marshall Miller & Associates, Inc. (MM&A) hereby consents (i) to the use of the information contained in this report dated December 31, 2023, relating to estimates of coal resources and coal reserves controlled by Alpha, (ii) to the use of MM&A’s name, any quotations from or summarizations of this TRS in Alpha’s SEC filings, and (iii) to the filing of this TRS as an exhibit to Alpha’s SEC filings. Qualified Person: /s/ Marshall Miller & Associates, Inc. Date: February 9, 2024

Alpha Metallurgical Resources, Inc. Statement of Coal Resources and Reserves for the Kingston Mining Complex in Accordance with United States SEC Standards as of December 31, 2023 Central Appalachian Coal Basin West Virginia, USA MARSHALL MILLER & ASSOCIATES, INC. 3 Table of Contents 1 Executive Summary .................................................................................................................... 9 1.1 Property Description ..................................................................................................... 9 1.2 Ownership ................................................................................................................... 10 1.3 Geology ....................................................................................................................... 10 1.4 Exploration Status ....................................................................................................... 11 1.5 Operations and Development ..................................................................................... 11 1.6 Mineral Resource ........................................................................................................ 12 1.7 Mineral Reserve .......................................................................................................... 12 1.8 Capital Summary ......................................................................................................... 13 1.9 Operating Costs ........................................................................................................... 14 1.10 Economic Evaluation ................................................................................................... 16 1.10.1 Discounted Cash Flow Analysis ...................................................................... 18 1.10.2 Sensitivity Analysis ......................................................................................... 18 1.11 Permitting ................................................................................................................... 19 1.12 Conclusion and Recommendations .............................................................................. 19 2 Introduction ............................................................................................................................. 20 2.1 Registrant and Terms of Reference ............................................................................. 20 2.2 Information Sources .................................................................................................... 20 2.3 Scope of Assignment .................................................................................................. 21 2.4 Personal Inspections ................................................................................................... 21 3 Property Description ................................................................................................................ 22 3.1 Location ...................................................................................................................... 22 3.2 Titles, Claims or Leases ................................................................................................ 22 3.3 Mineral Rights ............................................................................................................. 24 3.4 Encumbrances ............................................................................................................. 24 3.5 Other Risks .................................................................................................................. 25 4 Accessibility, Climate, Local Resources, Infrastructure and Physiography ............................... 25 4.1 Topography, Elevation, and Vegetation ....................................................................... 25 4.2 Access and Transport .................................................................................................. 25 4.3 Proximity to Population Centers .................................................................................. 26 4.4 Climate and Length of Operating Season ..................................................................... 26 4.5 Infrastructure .............................................................................................................. 26 Alpha Metallurgical Resources, Inc. Statement of Coal Resources and Reserves for the Kingston Mining Complex in Accordance with United States SEC Standards as of December 31, 2023 Central Appalachian Coal Basin West Virginia, USA MARSHALL MILLER & ASSOCIATES, INC. 4 5 History ...................................................................................................................................... 27 5.1 Previous Operation ..................................................................................................... 27 5.2 Previous Exploration ................................................................................................... 27 6 Geological Setting, Mineralization and Deposit ....................................................................... 27 6.1 Regional, Local and Property Geology ......................................................................... 27 6.2 Mineralization ............................................................................................................. 28 6.3 Deposits ...................................................................................................................... 29 7 Exploration ............................................................................................................................... 30 7.1 Nature and Extent of Exploration ................................................................................ 30 7.2 Drilling Procedures ...................................................................................................... 32 7.3 Hydrology .................................................................................................................... 32 7.4 Geotechnical Data ....................................................................................................... 33 8 Sample Preparation Analyses and Security .............................................................................. 33 8.1 Prior to Sending to the Lab .......................................................................................... 33 8.2 Lab Procedures............................................................................................................ 34 9 Data Verification ...................................................................................................................... 34 9.1 Procedures of Qualified Person ................................................................................... 34 9.2 Limitations .................................................................................................................. 35 9.3 Opinion of Qualified Person ........................................................................................ 35 10 Mineral Processing and Metallurgical Testing .......................................................................... 35 10.1 Testing Procedures ...................................................................................................... 35 10.2 Relationship of Tests to the Whole .............................................................................. 36 10.3 Lab Information ........................................................................................................... 36 10.4 Relevant Results .......................................................................................................... 36 11 Mineral Resource Estimates ..................................................................................................... 37 11.1 Assumptions, Parameters and Methodology ............................................................... 37 11.1.1 Geostatistical Analysis ................................................................................... 39 11.2 Resources Exclusive of Reserves .................................................................................. 43 11.2.1 Initial Economic Assessment .......................................................................... 43 11.3 Qualified Person’s Estimates ....................................................................................... 44 11.4 Qualified Person’s Opinion .......................................................................................... 45 12 Mineral Reserve Estimates ....................................................................................................... 45 12.1 Assumptions, Parameters and Methodology ............................................................... 45 12.2 Mineral Reserves ......................................................................................................... 47 12.2.1 Surface Reserves ............................................................................................ 47

Alpha Metallurgical Resources, Inc. Statement of Coal Resources and Reserves for the Kingston Mining Complex in Accordance with United States SEC Standards as of December 31, 2023 Central Appalachian Coal Basin West Virginia, USA MARSHALL MILLER & ASSOCIATES, INC. 5 12.2.2 Underground Reserves .................................................................................. 48 12.3 Qualified Person’s Estimates ....................................................................................... 49 12.4 Qualified Person’s Opinion .......................................................................................... 50 13 Mining Methods ....................................................................................................................... 51 13.1 Geotech and Hydrology ............................................................................................... 51 13.2 Production Rates ......................................................................................................... 51 13.3 Mining Related Requirements ..................................................................................... 52 13.3.1 Underground ................................................................................................. 52 13.4 Required Equipment and Personnel ............................................................................ 53 13.4.1 Underground Mines ....................................................................................... 53 13.4.2 Surface Mines ................................................................................................ 55 14 Processing and Recovery Methods ........................................................................................... 56 14.1 Description or Flowsheet............................................................................................. 56 14.2 Requirements for Energy, Water, Material and Personnel ........................................... 59 15 Infrastructure ........................................................................................................................... 59 16 Market Studies ......................................................................................................................... 66 16.1 Market Description ..................................................................................................... 66 16.2 Price Forecasts ............................................................................................................ 67 16.3 Contract Requirements ............................................................................................... 67 17 Environmental Studies, Permitting and Plans, Negotiations or Agreements with Local Individuals ....................................................................................................................... 68 17.1 Results of Studies ........................................................................................................ 68 17.2 Requirements and Plans for Waste Disposal ................................................................ 68 17.3 Permit Requirements and Status ................................................................................. 69 17.4 Local Plans, Negotiations or Agreements ..................................................................... 72 17.5 Mine Closure Plans ...................................................................................................... 72 17.6 Qualified Person’s Opinion .......................................................................................... 72 18 Capital and Operating Costs ..................................................................................................... 72 18.1 Capital Cost Estimate................................................................................................... 72 18.2 Operating Cost Estimate .............................................................................................. 74 19 Economic Analysis .................................................................................................................... 75 19.1 Economic Evaluation ................................................................................................... 75 19.1.1 Introduction................................................................................................... 75 19.1.2 Cash Flow Summary ....................................................................................... 80 19.1.3 Discounted Cash Flow Analysis ...................................................................... 82 Alpha Metallurgical Resources, Inc. Statement of Coal Resources and Reserves for the Kingston Mining Complex in Accordance with United States SEC Standards as of December 31, 2023 Central Appalachian Coal Basin West Virginia, USA MARSHALL MILLER & ASSOCIATES, INC. 6 19.1.4 Sensitivity Analysis ......................................................................................... 82 20 Adjacent Properties.................................................................................................................. 83 20.1 Information Used ........................................................................................................ 83 21 Other Relevant Data and Information ...................................................................................... 83 22 Interpretation and Conclusions ................................................................................................ 84 22.1 Conclusion................................................................................................................... 84 22.2 Risk Factors ................................................................................................................. 84 22.2.1 Governing Assumptions ................................................................................. 85 22.2.2 Limitations ..................................................................................................... 85 22.2.3 Methodology ................................................................................................. 85 22.2.4 Development of the Risk Matrix .................................................................... 86 22.2.5 Categorization of Risk Levels and Color Code Convention .............................. 89 22.2.6 Description of the Coal Property .................................................................... 89 22.2.7 Summary of Residual Risk Ratings .................................................................. 90 22.2.8 Risk Factors .................................................................................................... 90 23 Recommendations ................................................................................................................... 97 24 References................................................................................................................................ 97 25 Reliance on Information Provided by Registrant ..................................................................... 98 FIGURES (IN REPORT) Figure 1-1: Alpha’s Kingston Mining Complex Property Location Map ............................................... 10 Figure 1-2: Projected Capital Expenditures – Consolidated Kingston Mining Complex ....................... 14 Figure 1-3: Kingston Mining Complex Operating Costs ...................................................................... 16 Figure 1-4: Sensitivity of NPV ............................................................................................................ 19 Figure 6-1: Kingston Stratigraphic Column......................................................................................... 29 Figure 7-1: Kingston Cross-Section .................................................................................................... 31 Figure 11-1: Histogram of the Total Seam Thickness for the Middle Cedar Grove Seam Present in the Kingston Mining Complex .......................................................................................... 40 Figure 11-2: Scatter plot of the Total Seam Thickness for the Middle Cedar Grove Seam Present in the Kingston Mining Complex .......................................................................................... 40 Figure 11-3: Variogram of the Total Seam Thickness for the Middle Cedar Grove Seam Present in the Kingston Mining Complex .......................................................................................... 41 Figure 11-4: Result of DHSA for the Middle Cedar Grove Seam Present in the Kingston Mining Complex .......................................................................................................................... 42 Figure 11-5: Results of Initial Economic Assessment .......................................................................... 44 Figure 13-1: Kingston Mine Permit Areas Aerial View ........................................................................ 55 Figure 14-1: Kingston Preparation Plant and Refuse Area ................................................................. 58 Figure 14-2: Kingston Preparation Plant and Refuse Area (Zoomed-In View) .................................... 58

Alpha Metallurgical Resources, Inc. Statement of Coal Resources and Reserves for the Kingston Mining Complex in Accordance with United States SEC Standards as of December 31, 2023 Central Appalachian Coal Basin West Virginia, USA MARSHALL MILLER & ASSOCIATES, INC. 7 Figure 15-1: Kingston Overview ......................................................................................................... 60 Figure 15-2: Kingston Plant Area October 2022 ................................................................................. 61 Figure 15-3: Kingston Refuse Area October 2022 .............................................................................. 62 Figure 15-4: Kingston - Pax Loadout Surface Facilities ....................................................................... 63 Figure 15-5: Mammoth Facilities Overview ....................................................................................... 64 Figure 15-6: Mammoth Preparation Plant Layout 2022 ..................................................................... 65 Figure 15-7: Dunn Hollow Impoundment Refuse Disposal Area ......................................................... 66 Figure 18-1: Projected Capital Expenditures – Consolidated Kingston Operations ............................. 73 Figure 18-2: Kingston Mining Complex Operating Costs .................................................................... 75 Figure 19-1: Projection of Sales Tons ................................................................................................. 76 Figure 19-2: Consolidated Annual Revenue ....................................................................................... 78 Figure 19-3: Revenue, Cash Costs, and EBITDA .................................................................................. 78 Figure 19-4: Annual EBITDA ............................................................................................................... 80 Figure 19-5: Net Cash Flow after Tax (Before Debt Service) ............................................................... 82 Figure 19-6: Sensitivity of NPV .......................................................................................................... 83 TABLES (IN REPORT) Table 1-1: Coal Resources Summary as of December 31, 2023 .......................................................... 12 Table 1-2: Coal Reserves Summary (Marketable Sales Basis) as of December 31, 2023 ..................... 13 Table 1-3: Life-of-Mine Tonnage, P&L before Tax, and EBITDA .......................................................... 17 Table 1-4: Project Cash Flow Summary (000) ..................................................................................... 17 Table 3-1: Mineral Control – Mid-West Virginia (Kingston) Complex ................................................. 23 Table 11-1: General Reserve & Resource Criteria .............................................................................. 38 Table 11-2: DHSA Results Summary for Radius from a Central Point ................................................. 42 Table 11-3: Results of Initial Economic Assessment ........................................................................... 44 Table 11-4: Coal Resources Summary as of December 31, 2023 ........................................................ 45 Table 12-1: Kingston Coal Reserves Summary (Marketable Sales Basis) as of December 31, 2023 ..... 48 Table 12-2: Coal Reserves Summary (Marketable Sales Basis) as of December 31, 2023 ................... 50 Table 13-1: Kingston Mining Complex Underground Mine Production Schedule (x 1,000 Saleable Tons) ............................................................................................................................... 52 Table 13-2: Kingston Mining Complex Surface Mine Production Schedule (x 1,000 Saleable Tons) .... 52 Table 13-3: Kingston Mining Complex Highwall Mine Production Schedule (x 1,000 Saleable Tons) .. 52 Table 16-1: Dry Quality Specifications ............................................................................................... 67 Table 16-2: Price Forecasts ................................................................................................................ 67 Table 17-1: Kingston Refuse Disposal Summary ................................................................................ 69 Table 17-2: Kingston Mining Permits ................................................................................................. 71 Table 18-1: Summary of Capital Expenditures Schedule by Mine....................................................... 74 Table 18-2: Estimated Coal Production Taxes and Sales Costs ........................................................... 75 Table 19-1: Life-of-Mine Tonnage, P&L before Tax, and EBITDA ........................................................ 79 Table 19-2: Project Cash Flow Summary (000) ................................................................................... 80 Table 22-1: Probability Level Table .................................................................................................... 87 Table 22-2: Consequence Level Table ................................................................................................ 88 Table 22-3: Risk Matrix ...................................................................................................................... 89 Alpha Metallurgical Resources, Inc. Statement of Coal Resources and Reserves for the Kingston Mining Complex in Accordance with United States SEC Standards as of December 31, 2023 Central Appalachian Coal Basin West Virginia, USA MARSHALL MILLER & ASSOCIATES, INC. 8 Table 22-4: Risk Assessment Matrix .................................................................................................. 90 Table 22-5: Geological and Coal Resource Risk Assessment (Risks 1 and 2) ....................................... 91 Table 22-6: Environmental (Risks 3 and 4) ......................................................................................... 92 Table 22-7: Regulatory Requirements (Risk 5) ................................................................................... 92 Table 22-8: Market and Transportation (Risk 6)................................................................................. 93 Table 22-9: Market and Transportation (Risk 7)................................................................................. 93 Table 22-10: Methane Management (Risk 8) ..................................................................................... 94 Table 22-11: Mine Fires (Risk 9)......................................................................................................... 94 Table 22-12: Ground Control (Risk 10) ............................................................................................... 95 Table 22-13: Availability of Supplies and Equipment (Risk 11) ........................................................... 95 Table 22-14: Labor – Work Stoppage (Risk 12) .................................................................................. 96 Table 22-15: Labor – Retirement (Risk 13) ......................................................................................... 96 Table 22-16: Health and Safety (Risk 14) ........................................................................................... 97 Table 22-17: Refuse Disposal (Risk 15) .............................................................................................. 97 Table 25-1: Information from Registrant Relied Upon by MM&A ...................................................... 98 Appendices A .................................................................................................................................. Summary Tables B ............................................................................. Financial Details – Resources Exclusive of Reserves C ................................................................................................................................................... Maps

Alpha Metallurgical Resources, Inc. Statement of Coal Resources and Reserves for the Kingston Mining Complex in Accordance with United States SEC Standards as of December 31, 2023 Central Appalachian Coal Basin West Virginia, USA MARSHALL MILLER & ASSOCIATES, INC. 9 1 Executive Summary 1.1 Property Description Alpha Metallurgical Resources, Inc. (Alpha) authorized Marshall Miller & Associates, Inc. (MM&A) to prepare this updated Technical Report Summary (TRS) of its controlled coal reserves located at the Kingston Mining Complex (Kingston or the Property) in Raleigh and Fayette counties, West Virginia. The report provides a statement of coal resources and coal reserves for Alpha, as defined under the United States Securities and Exchange Commission (SEC). Coal resources and coal reserves are herein reported in imperial units of measurement. The Kingston Mining Complex is comprised of the Kingston surface and underground operations. Active Kingston surface facilities and preparation plant for met operations are located near the community of Mossy, along Paint Creek in Fayette County, West Virginia. Kingston is located approximately 25 miles north of Beckley, West Virginia; The Pax loadout is in the community of Pax, located along Interstate Highway 64/77 and has access to the CSX railroad line. The Pax Loadout is 20 miles north of Beckley, West Virginia (see Figure 1-1). Kingston properties are included within Alpha’s Mid-West Virginia mineral holdings that are composed of approximately 244,275 total acres located in Raleigh, Boone, Fayette and Kanawha Counties, West Virginia. There are approximately 55 separate leases for the Mid-West Virginia mineral holdings group which Kingston resource area is a part of. Alpha Metallurgical Resources, Inc. Statement of Coal Resources and Reserves for the Kingston Mining Complex in Accordance with United States SEC Standards as of December 31, 2023 Central Appalachian Coal Basin West Virginia, USA MARSHALL MILLER & ASSOCIATES, INC. 10 Figure 1-1: Alpha’s Kingston Mining Complex Property Location Map 1.2 Ownership The Kingston Property involves a complex combination of previous ownership. Predecessors of Alpha, namely Alpha Natural Resources (Alpha), and Massey Energy (Massey) previously held mining rights on most of the Property. 1.3 Geology Coal seams with reserves of currently active operations at the Kingston Mining Complex include the Upper, Middle and Lower Clarion; Stockton, Upper Coalburg, Coalburg, Lower Coalburg, Upper Winifrede Rider, Upper Winifrede, Winifrede, Lower Winifrede, Upper Chilton A, Middle Chilton A , Chilton A Upper Split, Chilton A Lower Split, Chilton A, Chilton Rider, Upper Chilton, Lower Chilton, Chilton, Upper Hernshaw, Lower Hernshaw, Upper Cedar Grove Upper Split, Upper Cedar Grove Lower Split, Middle Cedar Grove, Lower Cedar Grove Upper Split, Lower Cedar Grove, Peerless Upper Split, Peerless Lower Split, Peerless C, Upper No. 2 Gas, Lower No. 2 Gas, Powellton, Lower Powellton, Powellton Lower Split, Powellton Lower Split Upper, Upper Eagle Rider 2, Powellton Lower Split Lower, Upper Eagle Rider, Upper Eagle, Eagle A, Eagle Upper Split, Eagle Lower Split, Eagle, Little Eagle, Little

Alpha Metallurgical Resources, Inc. Statement of Coal Resources and Reserves for the Kingston Mining Complex in Accordance with United States SEC Standards as of December 31, 2023 Central Appalachian Coal Basin West Virginia, USA MARSHALL MILLER & ASSOCIATES, INC. 11 Eagle Lower Split, War Eagle, Glen Alum Tunnel Upper Split, Glen Alum Tunnel Douglas and Sewell seams. Coal seams below the Coalburg seam are all historically utilized as coking coal. Strata on the Property, among the active sites, are mostly of the Pennsylvanian-aged (approximately 290 to 330 million years ago) Kanawha Formation. The lower most Sewell coal seam is part of the New River Formation of the Pottsville Series. The rock formations between the coal seams are characterized by proportions of sandstone and shale units. In general, the coal seams reach the highest structural elevations along the southeastern margin of the Property, dipping toward the northwest. The area is stable with no major faulting and gentle dips. 1.4 Exploration Status The Property has been extensively explored, by drilling using continuous coring and rotary drilling methods but also by obtaining coal measurements at mine exposures, and by downhole geophysical methods. Most of the data was acquired or generated by previous owners of the Property. These sources comprise the primary data used in the evaluation of the coal resources and coal reserves on the Property. MM&A examined the data available for the evaluation and incorporated all pertinent information into this TRS. Where data were anomalous or not representative, that data was excluded from the digital databases and subsequent processing by MM&A. Ongoing exploration has been carried out by Alpha since acquiring the Kingston Mining Complex. The Alpha acquired exploration data has been consistent with past drilling activities. 1.5 Operations and Development As of December 31, 2023, the Kingston Mining Complex is comprised of one surface operation, Kingston. The surface mine is composed of four primary permit areas. The surface mines production is approximately 70% metallurgical coal product consisting of High-Vol A product and 30% steam coal as a by-product from stripping. These surface mines are traditional contour strip mines that include supplemental highwall mining activity in major seams. Kingston underground mine operations that are currently active include the Kingston 2 Mine. Kingston 2 produces Mid-Vol product from the Douglas coal seam. Undeveloped Sewell seam reserves will produce a Low-Vol product. Based on the mine plans developed as part of this TRS, annual deep mine production peaks at 1.4 million tons in 2031. Underground reserves will be depleted in 2036. Annual surface production peaks at 2.4 million tons in 2028 and highwall mine production peaks at 0.7 million tons in 2034. Surface and highwall reserves are both depleted in 2034. In addition to the mines, the Kingston Mining Complex includes the Kingston Preparation Plant and the Pax loadout facilities. Alpha Metallurgical Resources, Inc. Statement of Coal Resources and Reserves for the Kingston Mining Complex in Accordance with United States SEC Standards as of December 31, 2023 Central Appalachian Coal Basin West Virginia, USA MARSHALL MILLER & ASSOCIATES, INC. 12 The Kingston Preparation Plant has a design feed rate capacity of 700 raw tons per hour. Primary separation equipment includes heavy media vessels, heavy media cyclones, spirals, and flotation cells, supported by the requisite screens, centrifuges, sumps, pumps, and distribution systems. Coarse and fine refuse are disposed in an adjacent combined fill refuse area and impoundment. Plant utilization averaged 72.6% in 2023. Coal production is capable of being transported to the Mammoth Preparation plant for processing and shipping on the Kanawha River. The Mammoth plant had an average utilization of 18.3% in 2024. Short line railroad connections to the CSX and Norfolk Southern railroads are available at the Pax loadout as well as on-site barge loading on the Kanawha River at Marmet, West Virginia are also available. 1.6 Mineral Resource A coal resource estimate, summarized in Table 1-1 was prepared as of December 31, 2023, for property controlled by Alpha. Table 1-1: Coal Resources Summary as of December 31, 2023 Coal Resource (Dry Tons, In Situ) Area or Seam Measured Indicated Inferred Total Inclusive of Reserve/Converted to Reserve Kingston Surface 19,996,000 6,599,000 1,118,000 27,713,000 Kingston HWM 17,219,000 1,553,000 0 18,772,000 Sewell (UG) 31,740,000 10,907,000 1,602,000 44,250,000 Douglas (UG) 4,426,000 1,318,000 0 5,743,000 Total 73,381,000 20,377,000 2,720,000 96,478,000 Exclusive of Reserve/Not Converted to Reserve Kingston Surface 0 0 0 0 Kingston HWM 0 0 0 0 Sewell (UG) 13,266,000 10,206,000 0 23,472,000 Douglas (UG) 2,439,000 751,000 0 3,189,000 Total 15,705,000 10,957,000 0 26,662,000 Grand Total Total 89,086,000 31,334,000 2,720,000 123,140,000 Note (1): Resource tons are inclusive of reserve tons since they are the in-situ tons from which recoverable coal reserves are derived. Note (2): Coal resources are reported on a dry basis. Surface moisture and inherent moisture are excluded. Note (3): The Property contains26.66 million tons (Mt) of dry, in-place measured and indicated coal resources exclusive of reserves as of December 31, 2023. Totals may not add due to rounding. See Appendix A for detailed breakdown. 1.7 Mineral Reserve The Resource estimate outlined in Table 1-1 inclusive of reserves has been used as the basis for this Reserve calculation, which utilizes a reasonable Preliminary Feasibility Study, a Life-of Mine (LOM) Mine Plan and practical recovery factors. Production modeling was completed with an effective start date of October 1, 2023 for the underground mines and July 1, 2023 for the surface mines. Factors that would typically preclude conversion of a coal resource to coal reserve, include the following: inferred resource classification; absence of coal quality; poor mine recovery; lack of access to the deposit; geological encumbrances associated with overlying and underlying strata; thin seam

Alpha Metallurgical Resources, Inc. Statement of Coal Resources and Reserves for the Kingston Mining Complex in Accordance with United States SEC Standards as of December 31, 2023 Central Appalachian Coal Basin West Virginia, USA MARSHALL MILLER & ASSOCIATES, INC. 13 trends; complex structures; and insufficient exploration data. The listed factors have all been considered. Reserve consideration excludes those portions of the resource area, which exhibit the aforementioned geologic and/ or operational encumbrances. Proven and probable coal reserves were derived from the defined in-situ coal resource considering relevant processing, economic (including technical estimates of capital, revenue, and cost), marketing, legal, environmental, socioeconomic, and regulatory factors. The proven and probable coal reserves on the Property are summarized below in Table 1-2. Table 1-2: Coal Reserves Summary (Marketable Sales Basis) as of December 31, 2023 Demonstrated Coal Reserves Quality (Dry Basis) (Wet Tons, Washed or Direct Shipped) By Reliability Category By Permit Status By Control Type Area/Seam Proven Probable Total Permitted Not Permitted Owned Leased Ash% Sulfur% VM% Kingston Surface 15,737,000 5,167,000 20,904,000 15,364,000 5,540,000 0 20,904,000 10 1.0 32 Kingston HWM 5,887,000 512,000 6,399,000 5,757,000 642,000 0 6,399,000 11 1.1 32 Sewell (UG) 0 9,722,000 9,722,000 0 9,722,000 523,000 9,199,000 5 0.8 22 Douglas (UG) 1,427,000 205,000 1,632,000 903,000 729,000 109,000 1,523,000 6 1.0 23 Grand Total 23,051,000 15,606,000 38,656,000 22,024,000 16,633,000 632,000 38,025,000 - - - Notes: Marketable reserve tons are reported on a moist basis, including a combination of surface and inherent moisture. Coal quality is based on a weighted average of laboratory data from core holes. The combination of surface and inherent moisture is modeled at 6.0-percent. Douglas seam volatile matter analysis not available. Douglas seam priced as a Mid-Vol. product, consistent with Kingston 2 production. Actual product moisture is dependent upon multiple geological factors, operational factors, and product contract specifications and can exceed 8-percent. As such, the modeled moisture values provide a level of conservatism for reserve reporting. Totals may not add due to rounding. See Appendix A for detailed breakdown. In summary, Alpha controls a total of 38.66 Mt (moist basis) of marketable coal reserves at Kingston as of December 31, 2023. Of that total, 60 percent are proven, and 40 percent are probable. Of the 38.66 Mt, 0.63 Mt are owned, and 38.02 Mt are leased coal reserves. Of the total, 20.90 Mt are surface mineable, 6.40 Mt are highwall mineable, and 11.35 Mt are underground mineable. The maps included in Appendix C reflect mining depletion at the time of the resource/reserve calculation taken from Alpha mine maps as of September 30, 2023 for the underground mines and as of June 30, 2023 for the surface mines. Mine depletion tonnages were supplied by Alpha through the end of 2023, and MM&A deducted this historical production from the mapped reserves in order to estimate reserves as of December 31, 2023. 1.8 Capital Summary Alpha provided MM&A with information related to the number of currently operating production units at the Kingston Mining Complex. MM&A’s capital schedules assume that major equipment rebuilds occur over the course of each machine’s remaining assumed operating life. Replacement equipment was scheduled based on MM&A’s experience and knowledge of mining equipment and industry standards with respect to the useful life of such equipment. As one mine is depleted, the equipment is moved to its replacement mine. Alpha Metallurgical Resources, Inc. Statement of Coal Resources and Reserves for the Kingston Mining Complex in Accordance with United States SEC Standards as of December 31, 2023 Central Appalachian Coal Basin West Virginia, USA MARSHALL MILLER & ASSOCIATES, INC. 14 The capital expenditures tables detail costs for major equipment and infrastructure such as conveyor belt terminal groups. “Other” costs include expenditures for mine access and construction, mine extension capital and miscellaneous costs. A summary of the estimated capital for the consolidated Kingston operations is provided in Figure 1-2 below. Figure 1-2: Projected Capital Expenditures – Consolidated Kingston Mining Complex 1.9 Operating Costs Alpha provided historical costs and budgeted projections of operating costs for its active mines including: > Underground mine operations at Kingston 2 and Kingston 10. > Surface mine operations at Kingston. > Highwall miner operations at Kingston HWM. MM&A used the historical and/or budget cost information as a reference and developed a personnel schedule for each mine. Hourly labor rates and salaries were based upon information contained in Alpha’s financial summaries. Fringe benefit costs were developed for vacation and holidays, federal and state unemployment insurance, retirement, workers’ compensation and pneumoconiosis, casualty and life insurance, healthcare, and bonuses. A cost factor for mine supplies was developed that relates expenditures to mine advance rates for roof control costs and other mine supply costs based on the historical cost data provided by Alpha. Other factors were developed for maintenance and repair costs,

Alpha Metallurgical Resources, Inc. Statement of Coal Resources and Reserves for the Kingston Mining Complex in Accordance with United States SEC Standards as of December 31, 2023 Central Appalachian Coal Basin West Virginia, USA MARSHALL MILLER & ASSOCIATES, INC. 15 rentals, mine power, outside services, coal preparation plant processing, refuse handling, coal loading, property taxes, insurance and bonding and other direct mining costs. Appropriate royalty rates were assigned for production from leased coal lands and sales taxes were calculated for state severance taxes, the federal black lung excise tax, and federal and state reclamation fees. Pricing data as provided by Alpha is described in Table 16-2. The pricing data assumes a flat-line long term realization average of $163 per short ton port loading, with an average of $126.29 netback pricing reflective of the mid-volatile product, and $162 per short ton port loading, with an average of $134.74 netback pricing reflective of the high-volatile product currently sold at Kingston. A portion of the surface mine production is also thermal product which assumes a flat-line long term realization of $74 per short ton with an average of $65.52 per ton netback pricing. The LOM blended average netback pricing for the Kingston reserves is $121.00 per ton. These estimates are based on long-term pricing published by third party sources and adjusted for quality and transportation. A large majority of the coal sold by Alpha and their Kingston business group is shipped internationally as part of blended products from other business units within Alpha or sourced from other companies. These netback adjustments reflect these additional costs carried after the products leave the Kingston Mining Complex. A summary of the projected operating costs for the consolidated Kingston operations is provided in Figure 1-3. Alpha Metallurgical Resources, Inc. Statement of Coal Resources and Reserves for the Kingston Mining Complex in Accordance with United States SEC Standards as of December 31, 2023 Central Appalachian Coal Basin West Virginia, USA MARSHALL MILLER & ASSOCIATES, INC. 16 Figure 1-3: Kingston Mining Complex Operating Costs 1.10 Economic Evaluation The pre-feasibility financial model prepared for this TRS was developed to test the economic viability of each coal resource area. The results of this financial model are not intended to represent a bankable feasibility study, required for financing of any current or future mining operations contemplated for the Alpha properties, but are intended to establish the economic viability of the estimated coal reserves. Cash flows are simulated on an annual basis based on projected production from the coal reserves. The discounted cash flow analysis presented herein is based on an effective date of January 1, 2024. On an un-levered basis, the NPV of the project cash flow after taxes represents the Enterprise Value of the project. The project cash flow, excluding debt service, is calculated by subtracting direct and indirect operating expenses and capital expenditures from revenue. Direct costs include labor, operating supplies, maintenance and repairs, facilities cost for materials handling, coal preparation, refuse disposal, coal loading, reclamation, and general and administrative costs. Indirect costs include statutory and legally agreed upon fees related to direct extraction of the mineral. The indirect costs are the Federal black lung tax, Federal and State reclamation taxes, property taxes, coal production royalties, and income taxes. The Alpha mines’ historical costs provided a useful reference for MM&A’s cost estimates. Table 1-3 shows LOM tonnage, P&L, and EBITDA for each Alpha mine at Kingston.

Alpha Metallurgical Resources, Inc. Statement of Coal Resources and Reserves for the Kingston Mining Complex in Accordance with United States SEC Standards as of December 31, 2023 Central Appalachian Coal Basin West Virginia, USA MARSHALL MILLER & ASSOCIATES, INC. 17 Table 1-3: Life-of-Mine Tonnage, P&L before Tax, and EBITDA LOM Tonnage LOM Pre-Tax P&L P&L Per Ton LOM EBITDA EBITDA Per Ton Underground Mines Kingston Mine #10 (Douglas) 826 $4,820 $5.83 $15,243 $18.44 Sewell 9,722 $231,343 $23.80 $484,302 $49.81 Kingston #2 (Douglas) 806 $21,163 $26.27 $24,663 $30.61 Consolidated Deep Mines 11,354 $257,325 $22.66 $524,208 $46.17 Surface Mines Kingston 21,193 $296,502 $13.99 $500,200 $23.60 Consolidated Surface Mines 21,193 $296,502 $13.99 $500,200 $23.60 HWM Operations Kingston HWM 6,479 $474,147 $73.18 $487,972 $75.32 Consolidated HWMs 6,479 $474,147 $73.18 $487,972 $75.32 Grand Total 39,026 $1,027,974 $26.34 $1,512,381 $38.75 Note: 1) LOM tonnage evaluated in the financial model includes October 2023 through December 2023 production for underground mines and July 2023 through December 2023 production for surface and highwall mines production (369,714 clean tons) which was subtracted from coal reserves to make the effective date of the reserves December 31, 2023. As shown in Table 1-3, all the mines analyzed show positive EBITDA over the LOM. Overall, the Alpha consolidated Kingston operations show positive LOM P&L and EBITDA of $1.0 billion and $1.5 billion, respectively. Alpha’s consolidated Kingston cash flow summary in constant dollars, excluding debt service, is shown in Table 1-4 below. Table 1-4: Project Cash Flow Summary (000) YE 12/31 YE 12/31 YE 12/31 YE 12/31 YE 12/31 YE 12/31 Total 2023 2024 2025 2026 2027 2028 Production & Sales tons 39,026 582 2,455 3,273 3,147 3,330 3,902 Total Revenue $4,722,359 $70,436 $291,394 $391,372 $380,133 $396,866 $467,507 EBITDA $1,512,381 $15,715 $70,399 $125,225 $109,058 $118,673 $154,318 Net Income $830,602 $11,143 $41,608 $57,421 $51,545 $58,134 $80,517 Net Cash Provided by Operating Activities $1,315,008 $10,850 $50,112 $98,851 $102,565 $107,427 $129,069 Purchases of Property, Plant, and Equipment ($482,553) $0 ($168,878) ($95,604) ($15,019) ($21,831) ($35,678) Net Cash Flow $832,456 $10,850 ($118,766) $3,247 $87,545 $85,596 $93,391 YE 12/31 YE 12/31 YE 12/31 YE 12/31 YE 12/31 YE 12/31 YE 12/31 2029 2030 2031 2032 2033 2034 2035 Production & Sales tons 3,903 3,737 4,113 3,710 3,738 2,188 824 Total Revenue $474,006 $453,123 $500,576 $449,710 $453,148 $274,266 $104,108 EBITDA $163,309 $147,957 $180,670 $144,116 $145,657 $100,104 $35,960 Net Income $87,368 $73,278 $116,285 $93,108 $89,928 $55,869 $24,815 Net Cash Provided by Operating Activities $141,164 $135,176 $152,526 $133,069 $125,470 $99,141 $43,307 Purchases of Property, Plant, and Equipment ($25,610) ($23,910) ($46,911) ($16,760) ($30,663) ($1,369) ($319) Net Cash Flow $115,554 $111,266 $105,615 $116,309 $94,807 $97,772 $42,988 Alpha Metallurgical Resources, Inc. Statement of Coal Resources and Reserves for the Kingston Mining Complex in Accordance with United States SEC Standards as of December 31, 2023 Central Appalachian Coal Basin West Virginia, USA MARSHALL MILLER & ASSOCIATES, INC. 18 YE 12/31 YE 12/31 YE 12/31 YE 12/31 YE 12/31 YE 12/31 YE 12/31 2036 2037 2038 2039 2040 2041 2042 Production & Sales tons 124 0 0 0 0 0 0 Total Revenue $15,715 $0 $0 $0 $0 $0 $0 EBITDA $4,223 ($1,717) ($679) ($343) ($175) ($91) ($0) Net Income ($4,069) ($3,624) ($1,456) ($736) ($349) ($182) ($0) Net Cash Provided by Operating Activities $11,725 ($15,020) ($5,188) ($2,915) ($1,160) ($1,160) $0 Purchases of Property, Plant, and Equipment $0 $0 $0 $0 $0 $0 $0 Net Cash Flow $11,725 ($15,020) ($5,188) ($2,915) ($1,160) ($1,160) $0 Note: 1) LOM tonnage evaluated in the financial model includes October 2023 through December 2023 production for underground mines and July 2023 through December 2023 production for surface and highwall mines production (369,714 clean tons) which was subtracted from coal reserves to make the effective date of the reserves December 31, 2023. 2) Results shown for 2023 represent 4th quarter only. Consolidated cash flows are driven by annual sales tonnage, which grows from 2.5 million tons in 2024 to a peak of 4.1 million tons in 2031. Between years 2032 and 2036, sales ranges from 0.1 million to 3.7 million tons. Projected consolidated revenue grows from $291.4 million in 2024 to a peak of $500.6 million in 2031. Revenue totals $4.7 billion for the project’s life. Consolidated cash flow from operations is positive throughout the projected operating period, apart from post-production years, due to end-of-mine reclamation spending. Consolidated cash flow from operations peaks at $152.5 million in 2031 and totals $1.3 billion over the project life. Capital expenditures total $337.0 million during the first five years and $482.6 million over the project’s life. 1.10.1 Discounted Cash Flow Analysis Cash flow after tax, but before debt service, generated over the life of the project was discounted to NPV at a 16.57% discount rate, which represents MM&A’s estimate of the constant dollar, risk adjusted WACC for market participants if the subject reserves were offered for sale. On an un-levered basis, the NPV of the project cash flows represents the Enterprise Value of the project and amounts to $263.8 million. Alpha is an active producer, and the financial model shows positive net cash flow for each year of the operating life of the Kingston reserves. The pre-feasibility financial model prepared for the TRS was developed to test the economic viability of each coal resource area. The NPV estimate was made for the purpose of confirming the economics for classification of coal reserves and not for purposes of valuing Alpha or its Kingston assets. Mine plans were not optimized, and actual results of the operations may be different, but in all cases, the mine production plan assumes the properties are under competent management. 1.10.2 Sensitivity Analysis Sensitivity of the NPV results to changes in the key drivers is presented in the chart below. The sensitivity study shows the NPV at the 16.57% discount rate when Base Case sales prices, operating costs, capital costs and discount rate are increased and decreased in increments of 5% within a +/- 15% range.

Alpha Metallurgical Resources, Inc. Statement of Coal Resources and Reserves for the Kingston Mining Complex in Accordance with United States SEC Standards as of December 31, 2023 Central Appalachian Coal Basin West Virginia, USA MARSHALL MILLER & ASSOCIATES, INC. 19 Figure 1-4: Sensitivity of NPV As shown, NPV is quite sensitive to changes in sales price and operating cost estimates, and slightly sensitive to changes in capital cost estimates. 1.11 Permitting Alpha has obtained all mining and discharge permits to operate its active mines and processing, loadout, or related support facilities. MM&A is unaware of any obvious or current Alpha permitting issues that are expected to prevent the issuance of future permits. Alpha, along with all coal producers, is subject to a level of uncertainty regarding future clean water permits due to United States Environmental Protection Agency (EPA) and United States Fish and Wildlife (USFW) involvement with state programs. 1.12 Conclusion and Recommendations Sufficient data has been obtained through various exploration and sampling programs and mining operations to support the geological interpretations of seam structure and thickness for coal horizons situated on the Kingston Property. The data is of sufficient quantity and reliability to support the coal resource and coal reserve estimates in this TRS. Alpha Metallurgical Resources, Inc. Statement of Coal Resources and Reserves for the Kingston Mining Complex in Accordance with United States SEC Standards as of December 31, 2023 Central Appalachian Coal Basin West Virginia, USA MARSHALL MILLER & ASSOCIATES, INC. 20 The geological data and preliminary feasibility study, which consider mining plans, revenue, and operating and capital cost estimates are sufficient to support the classification of coal reserves provided herein. This geologic evaluation conducted in conjunction with the preliminary feasibility study concludes that the 38.66 Mt of marketable underground and surface coal reserves identified on the Property are economically mineable under reasonable expectations of market prices for metallurgical coal products, estimated operation costs, and capital expenditures. 2 Introduction 2.1 Registrant and Terms of Reference This report was prepared for the sole use of Alpha Metallurgical Resources, Inc. (Alpha) and its affiliated and subsidiary companies and advisors. The report provides a statement of coal reserves for Alpha located at the Kingston Mining Complex (Kingston) in Raleigh and Fayette Counties, West Virginia. Exploration results and Resource calculations were used as the basis for the mine planning and the preliminary feasibility study completed to determine the extent and viability of the reserve. The report provides a statement of coal resources and coal reserves for Alpha, as defined under the United States Securities and Exchange Commission (SEC). Coal resources and coal reserves are herein reported in imperial units of measurement. 2.2 Information Sources The updated technical report is based on information provided by Alpha and reviewed by MM&A’s professionals, including geologists, mining engineers, civil engineers, and environmental scientists. MM&A’s professionals hold professional registrations and memberships which qualify them as Qualified Persons in accordance with SEC guidelines. Sources of data and information are listed below in Table 2-1.

Alpha Metallurgical Resources, Inc. Statement of Coal Resources and Reserves for the Kingston Mining Complex in Accordance with United States SEC Standards as of December 31, 2023 Central Appalachian Coal Basin West Virginia, USA MARSHALL MILLER & ASSOCIATES, INC. 21 Table 2-1: Information Provided to MM&A by Alpha Category Information Provided by Alpha Report Section Geological Geologic data including digital databases and original source data including geologist logs, driller’s logs, geophysical logs. 9.1 Coal Quality Database of coal quality information supplemented with original source laboratory sheets where available. 10.1 Mining Historical productivities and manpower projections. 13.2, 13.4 Coal Preparation Flow Sheet and other information related to coal processing. 14.1 Waste Disposal Engineering data and estimates representing remaining capacities for coarse and fine coal waste disposal. 17.2 Costs Historical and budgetary operating cost information used to derive cost drivers for reserve financial modeling 18.2 Note: While the sources of data listed in Table 2-1 are not exhaustive, they represent a significant portion of information which supports this TRS. MM&A reviewed the provided data and found it to be reasonable prior to incorporating it into the TRS. The TRS contains “forward-looking information” including forecasts of productivity and annual coal production, operating and capital cost estimates, coal sales price forecasts, the assumption that Alpha will continue to acquire necessary permits, and other assumptions. The TRS statements and conclusions are not a guarantee of future performance and undue reliance should not be placed on them. The ability of Alpha to recover the estimated coal reserves is dependent on multiple factors beyond the control of MM&A including, but not limited to geologic factors, mining conditions, regulatory approvals, and changes in regulations. In all cases, the plans assume the Property is under competent management. 2.3 Scope of Assignment Alpha engaged MM&A to conduct a coal reserve evaluation of the Alpha coal properties as of December 31, 2023. For the evaluation, the following tasks were to be completed: > Conduct site visits of the mines and mine infrastructure facilities. > Process the information supporting the estimation of coal resources and reserves into geological models. > Develop life-of-reserve mine (LOM) plans and financial models. > Hold discussions with Alpha company management; and > Prepare and issue a Technical Report Summary providing a statement of coal reserves which would include: - A description of the mines and facilities. - A description of the evaluation process. - An estimation of coal reserves with compliance elements as stated under the SEC S-K1300 regulations that became effective for the first fiscal year commencing on or after January 1, 2022. 2.4 Personal Inspections MM&A is familiar with the Kingston properties, having provided a variety of services in recent years and QP’s involved in this TRS have conducted multiple site visits most recently September 2023. Alpha Metallurgical Resources, Inc. Statement of Coal Resources and Reserves for the Kingston Mining Complex in Accordance with United States SEC Standards as of December 31, 2023 Central Appalachian Coal Basin West Virginia, USA MARSHALL MILLER & ASSOCIATES, INC. 22 3 Property Description 3.1 Location The Kingston Mining Complex is in the Central Appalachian Basin in West Virginia (see Figure 1-1) north of Beckley, West Virginia, and south of Charleston, West Virginia. The Business Unit includes Kingston with two issued and one pending surface permits and one deep mine located in Raleigh and Fayette Counties. Kingston surface facilities are near the community of Mossy, along Paint Creek in Fayette County. The Pax loadout is in the community of Pax, located along Interstate Highway 64/77. These facilities are all 20 to 27 miles north of Beckley, WV, the county seat of Raleigh County. Numerous small communities are present throughout the Property. The nearest major population centers are Charleston, West Virginia (45 miles north), Bristol, Virginia (160 miles south), Roanoke, Virginia (140 miles east), and Morgantown, West Virginia (170 miles north), and Lexington, KY (220 miles west). The Property is located on the following United States Geological Survey (USGS) Quadrangles: Dorothy, Pax, Arnett, and Eccles. The coordinate system and datum used for the model of the Kingston Mining Complex, and the subsequent maps were produced in the West Virginia State Plane South system, NAD 27. 3.2 Titles, Claims or Leases Kingston properties are included within Alpha’s Mid-West Virginia mineral holdings that are composed of approximately 244,275 acres located in Raleigh, Boone, Fayette and Kanawha Counties, West Virginia. There are approximately 55 separate leases for the Mid-West Virginia mineral holdings group which Kingston resource area is a part of. Some leases expire over the next several years, but Alpha does not anticipate any challenges related to lease renewal. Table 3-1 lists the Alpha’s Mid-West Virginia (Kingston) mineral leases MM&A has not carried out a separate title verification for the coal properties and has not verified leases, deeds, surveys, or other property control instruments pertinent to the subject resources. Alpha has represented to MM&A that it controls the mining rights to the reserves as shown on its property maps, and MM&A has accepted these as being a true and accurate depiction of the mineral rights controlled by Alpha. The TRS assumes the Property is developed under responsible and experienced management.

Alpha Metallurgical Resources, Inc. Statement of Coal Resources and Reserves for the Kingston Mining Complex in Accordance with United States SEC Standards as of December 31, 2023 Central Appalachian Coal Basin West Virginia, USA MARSHALL MILLER & ASSOCIATES, INC. 23 Table 3-1: Mineral Control – Mid-West Virginia (Kingston) Complex Reference File No. Document Type Expiration Date (1) On-going Minimum Royalty (2) On-going Production Royalty (3) MD 1 Deed N/A N/A N/A MD 2 Deed N/A N/A N/A MD 3 Deed N/A N/A N/A MD 4 Deed N/A N/A N/A MD 5 Deed N/A N/A N/A MD 6 Deed N/A N/A N/A MD 7 Deed N/A N/A N/A MD 8 Deed N/A N/A N/A ML 01 Lease 1/1/2027 Yes Yes ML 01b Lease 6/15/2029 Yes Yes ML 02 Lease 1/1/2027 Yes Yes ML 03 Lease 12/31/2033 Yes Yes ML 04 Lease 12/31/2025 Yes Yes ML 04b Lease 2/18/2029 Yes Yes ML 05 Lease 7/31/2028 Yes Yes ML 06 Lease 5/9/2024 Yes Yes ML 07 Lease 12/31/2024 Yes Yes ML 09 Lease 12/31/2026 Yes Yes ML 10 Lease Exhaustion Yes Yes ML 11 Lease 1/18/2025 Yes Yes ML 12a Lease Exhaustion Yes Yes ML 13 Lease 1/3/2025 Yes Yes ML 14 Lease 1/26/2025 Yes Yes ML 14c Lease 11/29/2025 No Yes ML 15 Lease 8/31/2024 Yes Yes ML 16 Lease 5/26/2027 Yes Yes ML 17 Lease 12/31/2026 Yes Yes ML 18 Lease 8/31/2028 Yes Yes ML 19 Lease 8/31/2028 Yes Yes ML 20 Lease 12/31/2028 Yes Yes ML 21 Lease 4/30/2024 Yes Yes ML 22a Lease 8/31/2028 No Yes ML 22b Lease 8/31/2028 Yes Yes ML 23 Lease 5/31/2026 Yes Yes ML 24 Lease 5/31/2026 Yes Yes ML 25 Lease 12/6/2024 Yes Yes ML 26 Lease 10/28/2024 Yes Yes ML 27a Lease 10/25/2030 Yes Yes ML 27b Lease 3/10/2025 Yes Yes ML 28 Lease 12/6/2024 Yes Yes ML 29 Lease 12/31/2024 Yes Yes ML 30 Lease 6/14/2025 Yes Yes ML 31 Lease 12/31/2023 Yes Yes ML 32 Lease 2/11/2024 Yes Yes ML 33 Lease 12/31/2026 Yes Yes ML 34 Lease 12/31/2024 Yes Yes ML 35 Lease 3/9/2025 Yes Yes ML 36 Lease 12/31/2024 Yes Yes ML 37 Lease Exhaustion Yes Yes Alpha Metallurgical Resources, Inc. Statement of Coal Resources and Reserves for the Kingston Mining Complex in Accordance with United States SEC Standards as of December 31, 2023 Central Appalachian Coal Basin West Virginia, USA MARSHALL MILLER & ASSOCIATES, INC. 24 Reference File No. Document Type Expiration Date (1) On-going Minimum Royalty (2) On-going Production Royalty (3) ML 38 Lease 12/31/2025 Yes Yes ML 39 Lease Exhaustion Yes Yes ML 40 Lease 6/30/2025 Yes Yes ML 42 Lease 5/26/2027 Yes Yes ML 43 Lease 2/1/2024 Yes Yes ML 44 Lease 11/29/2025 Yes Yes ML 45 Lease 5/4/2024 Yes Yes ML 46 Lease 9/23/2026 Yes Yes ML 47 Lease 2/28/2024 Yes Yes ML 48 Lease 2/10/2024 Yes Yes ML 49 Lease 6/8/2027 Yes Yes (1) For leases with expiration dates, Company has option to renew or expects to renew until all mineable and merchantable coal is exhausted (2) Minimum royalty payments are generally recoupable against future production royalties. (3) Royalty rates range from 3% to 10% of gross selling price 3.3 Mineral Rights Alpha supplied property control maps to MM&A related to properties for which mineral and/or surface property are controlled by Alpha. While MM&A accepted these representations as being true and accurate, MM&A has no knowledge of past property boundary disputes or other concerns, through past knowledge of the Property, that would signal concern over future mining operations or development potential. Property control in Appalachia can be intricate. Coal mining properties are typically composed of numerous property tracts which are owned and/or leased from both land holding companies and private individuals or companies. It is common to encounter severed ownership, with different entities or individuals controlling the surface and mineral rights. Mineral control in the region is typically characterized by leases or ownership of larger tracts of land, with surface control comprised of smaller tracts, particularly in developed areas. Control of the surface property is necessary to conduct surface mining but is not necessary to conduct underground mining aside from limited areas required for seam access or ventilation infrastructure. Alpha’s executive management team has a history of mining in Central Appalachia and has conveyed to MM&A that it has been successful in acquiring surface rights where needed for past operations. 3.4 Encumbrances No Title Encumbrances are known. By assignment, MM&A did not complete a query related to Title Encumbrances.

Alpha Metallurgical Resources, Inc. Statement of Coal Resources and Reserves for the Kingston Mining Complex in Accordance with United States SEC Standards as of December 31, 2023 Central Appalachian Coal Basin West Virginia, USA MARSHALL MILLER & ASSOCIATES, INC. 25 3.5 Other Risks There is always risk involved in property control. As is common practice, Alpha, and its predecessors, have had their legal teams examine the deeds and title control to minimize this risk. Historically, property control has not posed any significant challenges related to Kingston’s operations. 4 Accessibility, Climate, Local Resources, Infrastructure and Physiography 4.1 Topography, Elevation, and Vegetation Much of the topography of the area encompassed by the Kingston Mining Complex is typical of the Central Appalachian Plateau’s physiographic province, being rugged deeply dissected by V-shaped river valleys, flanked by steep-sided upland regions. Terrain slopes in the area are mostly steep to very steep with some gently sloping with narrow ridges. Surface elevations near the mine operations range from approximately 1,200 feet above sea level at streams to approximately 3,000 feet at ridge tops. The area is heavily vegetated and has a significant amount of hardwood forests. The Property is not situated near any major urban centers. 4.2 Access and Transport There is general access to the Kingston Property via a well-developed network of primary, secondary, and unimproved roads from U.S. interstates highways. Interstate 81 to the south and 77 to the east are the primary roads coming into the business unit region. Interstate 81 connects with Bristol, Virginia to the southwest and Roanoke, Virginia to the east. Interstate 77 connects with Charleston, West Virginia to the north and via interstate 64 with Lexington, Kentucky, to the northwest. Numerous secondary and unimproved roads provide direct access to the mine property, some being federal, state, and town maintained. Interstate 64/77 is located near the eastern side of the Property and is the primary throughfare in the area connecting the Property to Beckley, Charleston, and Huntington, West Virginia, to the West and Lexington, Virginia, to the East. Numerous secondary and unimproved roads provide direct access to the mine property, some being federal-, state-, and town- maintained. These include West Virginia State Route 1 which runs through the Property holdings and provides direct access to surface office facilities and preparation plant from points north and south. These roads typically stay open throughout the year. Within the Property, unimproved roads are utilized to access surface based deep mine infrastructure. The primary transport means of processed coal is CSX Railroad which services the Marfork preparation plant and the Pax Loadout. Additionally, coal is transported by over-the-road-truck to the Kanawha River for barge transportation at the Marmet dock and for processing at the Mammoth preparation plant with access to barge and the Kanawha River Railroad short line that connects to the Norfolk Southern and CSX Transportation railroads. Alpha Metallurgical Resources, Inc. Statement of Coal Resources and Reserves for the Kingston Mining Complex in Accordance with United States SEC Standards as of December 31, 2023 Central Appalachian Coal Basin West Virginia, USA MARSHALL MILLER & ASSOCIATES, INC. 26 4.3 Proximity to Population Centers The Kingston Mining Complex is located approximately 15 miles northwest of the City of Beckley and is situated in Raleigh and Fayette Counties, West Virginia, with small portions falling in Kanawha County. There are no large population centers near mine operations. The nearest major population centers are Charleston, West Virginia (45 miles north), Bristol, Virginia (160 miles south), Roanoke, Virginia (140 miles east), and Morgantown, West Virginia (170 miles north), and Lexington, Kentucky (220 miles west). As of the 2020 census, Raleigh County had just over 73,300 residents and Fayette County had 40,488 residents. 4.4 Climate and Length of Operating Season The climate of the region is classified as humid continental with four distinct seasons: warm summers, cold winters, and moderate fall and spring seasons. Precipitation in the region is consistent throughout the year, 3 to 5 inches per month, with the most rain falling in spring and the early months of summer. Average yearly precipitation is 40 inches. Summer months typically begin in late May and end in early September and range in average temperature from 46 to 78 degrees Fahrenheit. Winters typically begin in mid to late November and run until mid to late March with average temperatures ranging from 19 to 52 degrees Fahrenheit. Precipitation in the winter typically comes in the form of snowfall or as a wintery mix (sleet and snow) with severe snowfall events occurring occasionally. Seasonal variations in climate typically do not affect underground mining in West Virginia. However, weather events could potentially negatively impact efficiency of surface and preparation plant operations on a limited basis and last less than a few days. 4.5 Infrastructure The Kingston Mining Complex has sources of water, power, personnel, and supplies readily available for use. Personnel have historically been sourced from the surrounding communities in Raleigh, Fayette, and surrounding Counties, and have proven to be adequate in number to conduct mining operations. As mining is common in the surrounding areas, the workforce is familiar with mining practices, and many are experienced miners. Water is sourced locally from public water sources or rivers, and electricity is sourced from Appalachian Power, a subsidiary of American Electric Power (AEP). The service industry in the areas surrounding the mine operations has historically provided supplies, equipment repairs and fabrication, etc. The Kingston Preparation Plant processes Kingston coal and is capable of shipping through the Pax Loadout or by barge on the Kanawha River. Pax Loadout services consumers with raw and washed coal via the CSX railroad. Haul roads, primary roads, and conveyor belt systems account for transport from the various mine sites to both surface plant facilities.

Alpha Metallurgical Resources, Inc. Statement of Coal Resources and Reserves for the Kingston Mining Complex in Accordance with United States SEC Standards as of December 31, 2023 Central Appalachian Coal Basin West Virginia, USA MARSHALL MILLER & ASSOCIATES, INC. 27 5 History 5.1 Previous Operation The Kingston Property involves a complex combination of previous ownership. Coal mining in the area occurred for a century. Predecessors of Alpha, namely Alpha Natural Resources (Alpha) and Massey Energy (Massey) previously held mining rights on much of the Property. 5.2 Previous Exploration Extensive exploration in the form of subsurface drill efforts has been carried out on the Property by numerous entities, most of which efforts were completed prior to the inception of Alpha. Diamond core and rotary drilling are the primary types of exploration on the Property. Data for correlation and mining conditions are derived from core descriptions and geophysical logs (e-logging). Coal sampling and quality analyses were also employed during the core-exploration process. The development of this report included an assessment of over 400 locations of coal measurements, comprised of exploration drill holes which often include several coal intercepts. In mine data measurements are included also. Drill records indicate that independent contract drilling operators have typically been engaged to carry out drilling on the Property. Geophysical logging was typically performed by outside logging firms. MM&A, via its Geophysical Logging Systems subsidiary, has logged a substantial number of the past exploration holes, and currently logs most of the recent drilled holes. Drill hole locations used in this assessment are shown on the resource and reserve maps included in Appendix C. 6 Geological Setting, Mineralization and Deposit 6.1 Regional, Local and Property Geology The Property lies in the Central Appalachian Coal basin in the Appalachian Plateau physiographic province. The coal deposits in the eastern U.S. are the oldest and most extensively developed coal deposits in the country. The coal deposits on the Property are Carboniferous in age, being of the Pennsylvanian system. Overall, these Carboniferous coals contain two-fifths of the US’s bituminous coal deposits and extend over 900 miles from northern Alabama to Pennsylvania and are part of what is known as the Appalachian Basin. The Appalachian Basin is more than 250 miles wide and, in some portions, contains over 60 coal seams of varying economic significance. Alpha Metallurgical Resources, Inc. Statement of Coal Resources and Reserves for the Kingston Mining Complex in Accordance with United States SEC Standards as of December 31, 2023 Central Appalachian Coal Basin West Virginia, USA MARSHALL MILLER & ASSOCIATES, INC. 28 Strata on the Property are mostly of the Pennsylvanian-age Kanawha Formation and the older, lower Sewell seam is part of the New River Formation of the Pottsville Series. The rock formations between the coal seams are characterized by large proportions of sandstone interspersed with shale units. Coal seams with remaining reserve or resource potential evaluated within this TRS include, in descending stratigraphic order the: Upper, Middle and Lower Clarion; Stockton, Upper Coalburg, Coalburg, Lower Coalburg, Upper Winifrede Rider, Upper Winifrede, Winifrede, Lower Winifrede, Upper Chilton A, Middle Chilton A , Chilton A Upper Split, Chilton A Lower Split, Chilton A, Chilton Rider, Upper Chilton, Lower Chilton, Chilton, Upper Hernshaw, Lower Hernshaw, Upper Cedar Grove Upper Split, Upper Cedar Grove Lower Split, Middle Cedar Grove, Lower Cedar Grove Upper Split, Lower Cedar Grove, Peerless Upper Split, Peerless Lower Split, Peerless C, Upper No. 2 Gas, Lower No. 2 Gas, Powellton, Lower Powellton, Powellton Lower Split, Powellton Lower Split Upper, Upper Eagle Rider 2, Powellton Lower Split Lower, Upper Eagle Rider, Upper Eagle, Eagle A, Eagle Upper Split, Eagle Lower Split, Eagle, Little Eagle, Little Eagle Lower Split, War Eagle, Glen Alum Tunnel Upper Split, Glen Alum Tunnel Douglas and Sewell seams. 6.2 Mineralization The generalized stratigraphic columnar section in Figure 6-1 demonstrates the vertical relationship of the principal coal seams and rock formations on the Kingston Property.

Alpha Metallurgical Resources, Inc. Statement of Coal Resources and Reserves for the Kingston Mining Complex in Accordance with United States SEC Standards as of December 31, 2023 Central Appalachian Coal Basin West Virginia, USA MARSHALL MILLER & ASSOCIATES, INC. 29 Figure 6-1: Kingston Stratigraphic Column 6.3 Deposits The Kingston Mining Complex currently produces predominantly a High-Volatile-A product and Mid- Volatile product (with by-product thermal coal). Due to the long history of mining in the region, high value of these coking coals, all the seams have been extensively mined in the past. The coal seams reach the highest structural elevations along the southeastern margin of the Property, dipping toward the northwest. The surface mine seams, and the Douglas seam are all situated above drainage or near and are therefore accessible via outcrop. The Sewell seam is below drainage and has not been developed. The rock formations between the coal seams are characterized by sandstone and shale units interspersed throughout. Alpha Metallurgical Resources, Inc. Statement of Coal Resources and Reserves for the Kingston Mining Complex in Accordance with United States SEC Standards as of December 31, 2023 Central Appalachian Coal Basin West Virginia, USA MARSHALL MILLER & ASSOCIATES, INC. 30 7 Exploration 7.1 Nature and Extent of Exploration The Property has been extensively explored by subsurface drilling efforts carried out by numerous entities, most of which were completed prior to ownership by Alpha. Diamond core and rotary drilling are the primary types of exploration on the Property. Diamond core drilling produces rock core samples from the hole. Data for coal bed correlations and strata mining conditions are derived from core descriptions and geophysical logging (e-logging). Geophysical logs are produced from a probe that surveys the drill hole void. Rock stratum types are interpreted from log signatures produced from the probe which commonly include a hole caliper, rock density and gamma readings. Coal-quality analyses were also employed during the core-exploration process. Drill records indicate that independent contract drilling operators have typically been engaged to carry out drilling on the Property. Geophysical logging was typically performed by outside logging firms. MM&A, via its Geophysical Logging Systems subsidiary, has logged a substantial number of the past exploration holes, including most of the recently drilled holes. The Location of the drill holes are shown on the maps included in Appendix C. The concentration of exploration varies slightly across the Property. Drilling on the Property is typically sufficient for delineation of potential surface and highwall miner benches, and deep mineable seams. Core logging is carried out by professional geologists in cases where roof and floor strata are of particular interest and in cases where greater resolution and geologic detail are needed. However, most drill hole data come from simplified driller’s logs, which lack details regarding geotechnical conditions and specific geology, making correlations and floor and roof conditions difficult to determine. Geophysical logging (e-logging) techniques, by contrast, document specific details useful for geologic interpretation and mining conditions. Given the variability of data-gathering methods employed, definitive mapping of future mining conditions may not be possible, but projections and assumptions can be made within a reasonable degree of certainty. A significant effort was put into verifying the integrity of the database. Once this was established, stratigraphic columnar sections were generated using cross-sectional analysis to establish or confirm coal seam correlations. Forty-two individual coal seams or splits were identified, correlated, and modelled for resource/reserve potential in the Kingston Mining Complex. A typical cross-section is shown in Figure 7-1.

Alpha Metallurgical Resources, Inc. Statement of Coal Resources and Reserves for the Kingston Mining Complex in Accordance with United States SEC Standards as of December 31, 2023 Central Appalachian Coal Basin West Virginia, USA MARSHALL MILLER & ASSOCIATES, INC. 31 Figure 7-1: Kingston Cross-Section Due to the long history of exploration by various parties on the Property, a wide variety of survey techniques exist for documentation of data point locations. Many of the older exploration drill holes appear to have been located by survey and more recently completed drill holes are often located by high-resolution Global Positioning System (GPS) units. However, some holes appear to have been located using USGS topography maps or other methods which are less accurate. Therefore, discretion had to be used regarding the accuracy for the location and ground surface elevation of some of these older drill holes. In instances where a drill hole location (or associated coal seam elevations) was inconsistent with the overall structural trend (or surface topography for surface-mineable areas), the Alpha Metallurgical Resources, Inc. Statement of Coal Resources and Reserves for the Kingston Mining Complex in Accordance with United States SEC Standards as of December 31, 2023 Central Appalachian Coal Basin West Virginia, USA MARSHALL MILLER & ASSOCIATES, INC. 32 data point was not honored for geological modeling. Others with minor variances were adjusted or then used by MM&A. Surveying of the underground and surface mined areas has been performed by the mine operators and/or their consulting surveyors. By assignment, MM&A did not verify the accuracy or completeness of the supplied mine maps but accepted this information as being the work of responsible engineers and surveyors, as required by both State and Federal Law. MM&A compiled comprehensive topographic map files by selecting the best available aerial mapping for each area. In the case of active surface mines, digital flown topography was utilized to reference original seam outcrop positions. 7.2 Drilling Procedures Core drilling methods utilize NX-size (21/8 inch) or similar-sized core cylinders to recover core samples, which can be used to delineate geologic characteristics, and for coal quality testing and geotechnical logging. For the cored holes, the geophysical logs are especially useful in verifying the percent of core recovery of both the coal samples (for assurance that sample is representative of the full seam) and of the roof and floor rock samples (for evaluating ground control characteristics of deep mineable coal seams). In addition to the core holes, rotary drilled holes also exist on the Property. Data for the rotary drilled holes is derived from downhole geophysical logs, which are used to interpret coal and rock thickness and depth since logging of the drill cuttings is not reliable in this application. A wide variety of core-logging techniques exist for the Property. For many of the core holes, the primary data source is a generalized lithology description by the driller, typically supplemented by a more detailed core log completed by a geologist. These drill logs were provided to MM&A collectively as a geological database. MM&A geologists were not involved in the production of original core logs but did perform a basic check of drill records and information within the provided database. Where geophysical logs for such holes are available, they were used by MM&A geologists to verify the coal thickness and core recovery of relevant seams. 7.3 Hydrology Hydrologic testing and forecasting are necessary parts of the permitting process and as such are routinely considered in the mine planning process. MM&A is not aware of any significant hydrologic impacts being experienced at any currently active deep mines or active surface mines. Future mining is projected to occur in areas exhibiting similar hydrogeological conditions as past mining. Based upon the successful history of the operation with regards to hydrogeological features, MM&A assumes that the operation will not be hindered by such issues in the future.

Alpha Metallurgical Resources, Inc. Statement of Coal Resources and Reserves for the Kingston Mining Complex in Accordance with United States SEC Standards as of December 31, 2023 Central Appalachian Coal Basin West Virginia, USA MARSHALL MILLER & ASSOCIATES, INC. 33 7.4 Geotechnical Data Life-of-Mine (LOM) Mining plans for potential underground mines were developed by MM&A through incorporation of budget maps from Alpha. Pillar stability was tested by MM&A using the Analysis of Coal Pillar Stability (ACPS) program that was developed by the National Institute for Occupational Safety and Health (NIOSH). MM&A reviewed the results from the ACPS analysis and considered it in the development of the LOM plan. Coal and rock strengths from core testing are used to verify the empirical assumptions integral to ACPS. 8 Sample Preparation Analyses and Security 8.1 Prior to Sending to the Lab Most of the coal samples related to exploration drilling activities have been obtained from the Property by subsurface exploration using core drilling techniques. The protocol for preparing and testing the samples has varied over time and is not well documented for the older holes drilled on the Property. Typical US coal sampling technique from core drilling is for the coal core sample, once recovered from the core barrel, to be measured and described into a log, then wrapped in a sealed plastic sleeve and placed into a covered wooden core box, which is the length of the sample so that the core can be delivered to a laboratory in relatively intact condition and with original moisture content. The core identification number and the depth are scribed on the sample box lid to identify the sample. This process has been the norm for both historical and ongoing exploration activities at Kingston. The supervising driller, geologist, or company personnel typically perform this work. Samples are most often delivered to the company by the driller after each shift or acquired by company personnel or representatives. Most of the coal core samples were obtained by previous operators on the Property. MM&A did not participate in the collection, sampling, and analysis of most core samples within the exploration database. However, it is reasonable to assume, given the professional level of the previous operators, that these samples were collected and processed under industry best-practices. This assumption is based on MM&A’s familiarity with the operating companies and the companies used to perform the analysis. Additionally, specific to Alpha’s Kingston surface operations, a significant dataset was made available related to in-pit quality measurements used during the mining process as a predictive measure prior to mining. This robust dataset is based upon bulk or grab samples obtained by employees of Alpha prior to the extraction of coal in surface mined pits or in stockpiles. The information contained in the dataset does not include a surveyed location point, as the information is only relied upon in the short term for assistance in coal blending procedures. Alpha Metallurgical Resources, Inc. Statement of Coal Resources and Reserves for the Kingston Mining Complex in Accordance with United States SEC Standards as of December 31, 2023 Central Appalachian Coal Basin West Virginia, USA MARSHALL MILLER & ASSOCIATES, INC. 34 In addition to the steps taken to ensure the accuracy of the historical data as described above, Alpha reports the company employs a detailed chain of custody process during their current sampling programs. This chain of custody process follows the sample from the time it is drilled until the final quality results are entered into a database for preparation of geologic models. 8.2 Lab Procedures Coal quality testing related to exploration drilling has been performed over many years by operating companies using different laboratories and testing regimens. Some of the samples have raw analyses and washability analysis on the full seam (with coal and rock parting layers co-mingled) and are useful for characterizing the coal quality for projected production from underground and highwall mining. Other samples have coal and rock analyzed separately, the results of which can be manipulated to forecast either surface or underground mining quality. Care has been taken to use only those analyses that are representative of the coal quality parameters for the appropriate mining type for each sample. Standard procedure upon receipt of core samples by the testing laboratory is to log the depth and thickness of the sample, then perform testing as specified by a representative of the operating company. Each sample is then analyzed in accordance with procedures defined under ASTM International (ASTM) standards including, but not limited to; washability (ASTM D4371); ash (ASTM D3174); sulfur (ASTM D4239); Btu/lb. (ASTM D5865); volatile matter (ASTM D3175); and Free Swell Index (FSI) (ASTM D720). Specific to the pit-quality sampling and associated datasets, laboratory analysis includes both short proximate analysis and at times, detailed metallurgical characteristics. The dataset contains a combination of raw and washed samples. 9 Data Verification 9.1 Procedures of Qualified Person MM&A reviewed the Alpha-supplied digital geologic database which consists of data records including drill hole information for holes that lie within and adjacent to the Property along with records for numerous supplemental coal seam thickness measurements, in mine measurements from underground mine maps. Once the initial integrity of the database was established, stratigraphic columnar sections were generated to use cross-sectional analysis to establish or confirm coal seam correlations. The stratigraphic column correlation method provides a view of seam depths, lithologic strata, and thickness intervals to over and underlying seams. Geophysical logs were used wherever available to assist in confirming the seam correlation and to verify proper seam depths, thickness measurements and recovery of coal samples.

Alpha Metallurgical Resources, Inc. Statement of Coal Resources and Reserves for the Kingston Mining Complex in Accordance with United States SEC Standards as of December 31, 2023 Central Appalachian Coal Basin West Virginia, USA MARSHALL MILLER & ASSOCIATES, INC. 35 After establishing and/or verifying proper seam correlation for all seams, the database was used in the geologic model process. Seam thickness, base-of-seam elevation, roof and floor lithology data control, and overburden maps were independently generated for use in the mine planning process. Maps with seam control data plus geological cross-sections were generated to represent the seam correlations and data integrity. Forty-two individual coal seams or splits were identified, correlated, and modelled for resource/reserve potential in the Kingston Mining Complex. Coal quality data was analyzed and summarized by MM&A’s team of geologists and engineers. Quality was provided by Alpha in various database formats, laboratory data sheets, and obtained directly from MM&A’s files. Care was taken to ensure that sampled data was representative of the mineable section. In instances where minimal representative data was noted, geological tonnages were estimated based upon applying assumed densities of coal and non-coal material to thicknesses expressed in geological database files. 9.2 Limitations As with any exploration program, localized anomalies, such as a thin coal area or poor mining conditions, cannot always be discovered. The greater the density of the samples taken, the less the risk. Once an area is identified for inclusion in the mine plan, additional samples are taken to help reduce the risk in specific areas. In general, provision is made in the mine planning portion of the study to allow for localized anomalies that are typically classed more as a nuisance than a hinderance. 9.3 Opinion of Qualified Person Sufficient data has been obtained through various exploration and sampling programs and mining operations to support the geological interpretations of seam structure and thickness for coal horizons situated on the Kingston Property. The Property data is of sufficient quantity and reliability to support the coal resource and coal reserve estimates in this TRS. 10 Mineral Processing and Metallurgical Testing 10.1 Testing Procedures Basic chemical analyses (both raw and washed quality), petrographic data, rheological data and ash, ultimate and sulfur analysis are available but not summarized for this filing. Available coal quality data sourced from MM&A’s vaults (associated with former projects for Alpha and its predecessors) was tabulated by resource area in a Microsoft® EXCEL workbook. Such data contained laboratory sheets which MM&A utilized to confirm that sampled intervals were representative of geological models and confirm that appropriate laboratory procedures were utilized to derive raw and clean coal parameters. Additionally, Alpha provided MM&A with a database of its own in-house coal quality information which did not include backup laboratory information or sampled intervals. MM&A compared wash recovery values from Alpha’s dataset to proximal holes with wash recovery data in MM&A’s dataset and calculated estimates of wash recovery based upon the relative percentages of Alpha Metallurgical Resources, Inc. Statement of Coal Resources and Reserves for the Kingston Mining Complex in Accordance with United States SEC Standards as of December 31, 2023 Central Appalachian Coal Basin West Virginia, USA MARSHALL MILLER & ASSOCIATES, INC. 36 coal and rock from lithologic descriptions. In general, MM&A found that Alpha’s dataset was representative and appropriate for inclusion in coal quality summaries. Quality tables also provide basic statistical analyses of the coal quality datasets, including average value; maximum and minimum values; and the number of samples available to represent each quality parameter of the seam. Coal samples that were deemed by MM&A geologists to be unrepresentative were not used for statistical analysis of coal quality, as documented in the tabulations. The amount and areal extent of coal sampling for geological data is sufficient to represent the quality characteristics of the coal horizons and allow for proper market placement of the subject coal seams. For some of the coal deposits, there are considerable laboratory data from core samples that are representative of the full extent of the resource area; and for others there are more limited data to represent the resource area. For example, in the active operations with considerable previous mining, there may be limited quality data within some of the remaining resource areas; however, in those cases the core sampling data can be supplemented with operational data from mining and shipped quality samples representative of the resource area. 10.2 Relationship of Tests to the Whole The extensive sampling and testing procedures typically followed in the Coal Industry result in an excellent correlation between samples and Marketable product. Pit analyses of the coal from Kingston were reviewed to verify that the coal quality and characteristics were as expected. The Kingston Property has a long history of saleable production, under various owners, in the Mid-Volatile and High- volatile metallurgical and thermal markets, confirming exploration results. In select instances, those areas which did not contain exploration information inclusive of coal quality analysis but were located relatively adjacent to active producing areas and/or areas which contained coal quality information were downgraded to a “probable” classification. Based upon the extensive production history locally and regionally, the report authors deemed this process acceptable. 10.3 Lab Information Each sample is analyzed at area Laboratories that operate in accordance with procedures defined under ASTM standards including, but not limited to; washability (ASTM D4371); ash (ASTM D3174); sulfur (ASTM D4239); Btu/lb. (ASTM D5865); volatile matter (ASTM D3175); and Free Swell Index (FSI) (ASTM D720). 10.4 Relevant Results No critical factors have been found that would adversely affect the recovery of the Reserve. Any quality issues that occur, either localized or regional, are accounted for in the Marketing Study done for this TRS.

Alpha Metallurgical Resources, Inc. Statement of Coal Resources and Reserves for the Kingston Mining Complex in Accordance with United States SEC Standards as of December 31, 2023 Central Appalachian Coal Basin West Virginia, USA MARSHALL MILLER & ASSOCIATES, INC. 37 11 Mineral Resource Estimates MM&A independently created geologic models to define the coal resources at Kingston. Coal resources were estimated as of December 31, 2023. 11.1 Assumptions, Parameters and Methodology Geological data was imported into Carlson Mining® (formerly SurvCADD®) geological modelling software in the form of Microsoft® Excel files incorporating drill hole collars, seam and thickness picks, bottom seam elevations and raw and washed coal quality. These data files were validated prior to importing into the software. Once imported, a geologic model was created, reviewed, and verified- with a key element being a gridded model of coal seam thickness. Resource tons were estimated by using the seam thickness grid based on each valid point of observation and by defining resource confidence arcs around the points of observation. Points of observation for Measured and Indicated confidence arcs were defined for all valid drill holes that intersected the seam using standards deemed acceptable by MM&A based on a detailed geologic evaluation and a statistical analysis of drill holes within the projected reserve areas as described in Section 11.1.1. The geological evaluation incorporated an analysis of seam thickness related to depositional environments, adjacent roof, and floor lithologies, and structural influences. After validating coal seam data and establishing correlations, the seam thickness, coal thickness and elevation for seams of economic interest were used to generate a geologic model. Local geologic and physical conditions were incorporated into the model where mineability and or mining costs could be affected by the conditions. Both coal thickness and quality data are deemed by MM&A to be sufficient within the resource areas. Therefore, there is a reasonable level of confidence in the geologic interpretations required for coal resource determination based on the available data and the techniques applied to the data. Table 11-1 below provides the geological mapping and coal tonnage estimation criteria used for the coal resource and reserve evaluation. These cut-off parameters have been developed by MM&A based on its experience with the Alpha Property and are typical of mining operations in the Central Appalachian coal basin. This experience includes technical and economic evaluations of numerous properties in the region for the purposes of determining the economic viability of the subject coal reserves. Alpha Metallurgical Resources, Inc. Statement of Coal Resources and Reserves for the Kingston Mining Complex in Accordance with United States SEC Standards as of December 31, 2023 Central Appalachian Coal Basin West Virginia, USA MARSHALL MILLER & ASSOCIATES, INC. 38 Table 11-1: General Reserve & Resource Criteria Item Parameters Technical Notes & Exceptions* • General Reserve Criteria Reserve Classification Reserve and Resource Coal resources as reported are inclusive of coal reserves. Reliability Categories Reserve (Proven and Probable) Resource (Measured, Indicated & Inferred) To better reflect geological conditions of the coal deposits, distance between points of observation is determined via statistical analysis. For surface-mineable reserves, the QPs responsible for the delineation of coal reserves have opted to classify tons in areas lacking exploration drillhole quality as 100- percent probable as opposed to basing proven and probable classifications upon relative distance from drillholes. Resource classification as stated in the tables is directly derived from drillhole spacing. The QPs have relied upon consistency in historical pit sampling as a justification for reserve delineation in such areas. Proven and Measured Classification 0.25 Mile, (1320’) Projection form Measurement Point Based on 11.1.1 Analysis Probable and Indicated Classification 0.25 to 0.75 Mile, (1320’ to 3960’) Projection form Measurement Point Based on 11.1.1 Analysis; Required for Reserve Classification Inferred Classification 0.75 to 3.0 Mile, (3960’ to 15,840) Projection form Measurement Point Based on 11.1.1 Analysis Effective Date of Resource Estimate December 31, 2023 Coal resources were estimated based upon depletion maps as of September 30, 2023 for underground mines and as of June 30, 2023 for surface mines, along with third and fourth quarter 2023 production depletion adjustment. Effective Date of Reserve Estimate December 31, 2023 Coal reserves were estimated based upon depletion maps as of September 30, 2023 for underground mines and as of June 30, 2023 for surface mines, along with third and fourth quarter 2023 production depletion adjustment. Seam Density With Analysis: SG = 1.25 + Raw Ash/100 In the absence of laboratory data, estimated by (1) assuming specific gravity of 1.30 for coal and 2.25 for rock parting • Underground-Mineable Criteria Map Thickness Total seam thickness Minimum Seam Thickness 25 inches (Douglas) 30 inches (Sewell) Minor Exceptions for localized zones of thinner coal. Minimum Mining Thickness 54 inches Minimum Total Coal Thickness 25 inches (Douglas) 30 inches (Sewell) Minor Exceptions for localized zones of thinner coal. Minimum In-Seam Wash Recovery Determined as function of seam thickness Wash Recovery Applied to Coal Reserves Based on average yield for drill holes within reserve area, or in the absence of laboratory washability data, based on estimated visual recovery using specific gravities noted above and 95 percent yield on "clean" coal Out-of-Seam Dilution Thickness for Run-of-Mine Tons Applied to ROM tonnages Delta between minimum mining thickness (54 inches) and seam thickness Mine Barrier 200-foot distance from abandoned mines and 50-foot from sealed or pillared areas of active Alpha mines Minimum Reserve Tonnage 400 thousand recoverable tons for individual area (logical mining unit) Minimum Overburden Depth 100 feet Minimum Interval to Rider Coal Considered on a case-by-case basis, depending on interval lithology, etc. Minimum Interval to Overlying or Underlying Reserves Considered on a case-by-case basis, depending on interval lithology, extent, and type of extraction, etc.

Alpha Metallurgical Resources, Inc. Statement of Coal Resources and Reserves for the Kingston Mining Complex in Accordance with United States SEC Standards as of December 31, 2023 Central Appalachian Coal Basin West Virginia, USA MARSHALL MILLER & ASSOCIATES, INC. 39 Item Parameters Technical Notes & Exceptions* Minimum Interval to Overlying or Underlying Mined Areas Considered on a case-by-case basis, depending on interval lithology, extent, and type of extraction, etc. Adjustments Applied to Coal Reserves 6.0 percent moisture increase; 5 percent preparation plant inefficiency • Surface-mineable Criteria Mining Type Surface mining Highwall mining (HWM) Coal Density Used laboratory apparent specific gravity data where available. Otherwise use raw ash formula: Sp. Gr. = (% Raw Ash/100) + 1.25 EXCEPTION: Used 1800 tons per acre foot for seams with no quality data on surface reserve calculation Used estimated specific gravity based on 1.30 specific gravity for coal and 2.25 specific gravity for rock where no lab data was available. This is also referred to as EVR or Estimated Visual Recovery method. Surface Property Control Controlled Surface-mineable coal resource estimated where mineral and surface rights are controlled. No resource estimated if mineral rights are not controlled. Uncontrolled Surface-mineable coal resource estimated where surface is uncontrolled if mineral rights are controlled. Basis for Coal Tonnage Thickness of recoverable coal less removable partings Minimum thickness of removable parting for surface- mineable seam is 0.25-foot generally. Minimum Total seam thickness for Single Cut Contour 2.0 feet (*) Minimum Thickness of Principal Seam in Multi-Seam Areas 1.0 foot (*) Minimum Thickness of Secondary Seam 0.5 foot Secondary seam is within 2.5 feet of principal seam Mine Strip Ratio 18:1 BCY /ton ratio for metallurgical coal & 15:1 BCY/ton for thermal coal surface mine strip ratios are targets and can vary some by cut or job. Minimum Total seam thickness for High Wall Miner 2.0 feet (*) Seam thickness can vary within a panel. Areas Considered for Surface- mineable Coal Resource Permitted and potential permit areas provided by Alpha Note: Exceptions for application of these criteria to reserve estimation are made as warranted and demonstrated by either actual mining experience or detailed data that allows for empirical evaluation of mining conditions. Final classification of coal reserve is made based on the pre-feasibility evaluation. 11.1.1 Geostatistical Analysis MM&A completed a geostatistical analysis on drill holes within the reserve boundaries to determine the applicability of the common United States classification system for measured and indicated coal resources. Historically, the United States has assumed that coal within ¼-mile (1,320 feet) of a point of observation represents a measured resource whereas coal between ¼-mile (1,320 feet) and ¾-mile (3,960 feet) from a point of observation is classified as indicated. Inferred resources are commonly assumed to be located between ¾-mile (3,960 feet) and 3 miles (15,840 feet) from a point of observation. Per SEC regulations, only measured and indicated resources may be considered for reserve classification, respectively as proven and probable reserves. MM&A performed a geostatistical analysis test of the Kingston, Middle Cedar Grove seam data set using the Drill Hole Spacing Analysis (DHSA) method. This method attempts to quantify the uncertainty of applying a measurement from a central location to increasingly larger square blocks and provides recommendations for determining the distances between drill holes for measured, indicated, and inferred resources. Alpha Metallurgical Resources, Inc. Statement of Coal Resources and Reserves for the Kingston Mining Complex in Accordance with United States SEC Standards as of December 31, 2023 Central Appalachian Coal Basin West Virginia, USA MARSHALL MILLER & ASSOCIATES, INC. 40 To perform DHSA the data set was processed to remove any erroneous data points, clustered data points, as well as directional trends. This was achieved using histograms, as seen in Figure 11-1, color coded scatter plots showing the geospatial positioning of the borings, Figure 11-2, and trend analysis. Figure 11-1: Histogram of the Total Seam Thickness for the Middle Cedar Grove Seam Present in the Kingston Mining Complex Figure 11-2: Scatter plot of the Total Seam Thickness for the Middle Cedar Grove Seam Present in the Kingston Mining Complex Following the completion of data processing, a variogram of the data set was created, Figure 11-3. The variogram plots average square difference against the separation distance between the data pairs. The separation distance is broken up into separate bins defined by a uniform lag distance (e.g., for a lag distance of 500 feet the bins would be 0 – 500 feet, 501 – 1,000 feet, etc.). Each pair of data points that are less than one lag distance apart are reported in the first bin. If the data pair is further apart than one lag distance but less than two lag distances apart, then the variance is reported in the second bin. The numerical average for differences reported for each bin is then plotted on the variogram. Care was taken to define the lag distance in such a way as to not overestimate any nugget effect present in the data set. Lastly, modeled equations, often spherical, gaussian, or exponential, are applied to the variogram to represent the data set across a continuous spectrum.

Alpha Metallurgical Resources, Inc. Statement of Coal Resources and Reserves for the Kingston Mining Complex in Accordance with United States SEC Standards as of December 31, 2023 Central Appalachian Coal Basin West Virginia, USA MARSHALL MILLER & ASSOCIATES, INC. 41 Figure 11-3: Variogram of the Total Seam Thickness for the Middle Cedar Grove Seam Present in the Kingston Mining Complex The estimation variance is then calculated using information from the modeled variogram as well as charts published by Journal and Huijbregts (1978). This value estimates the variance from applying a single central measurement to increasingly larger square blocks. Care was taken to ensure any nugget effect present was added back into the data. This process was repeated for each test block size. The last step of the process is to calculate the global estimation variance. In this step the number square blocks that would fit inside the selected study area is determined for each block size that was investigated in the previous step. The estimation variance is then divided by the number of blocks that would fit inside the study area for each test block size. Following this determination, the data is then transformed back to represent the relative error in the 95th-percentile range. Figure 11-4 shows the results of the DHSA performed on the Middle Cedar Grove seam data for the Kingston Mining Complex. DHSA provides hole to hole spacing values, these distances need to be converted to radius from a midway point in order to compare to the historical standards. A summary of the radius data is shown in Table 11-3. DHSA prescribes measured, indicated, and inferred drill hole Alpha Metallurgical Resources, Inc. Statement of Coal Resources and Reserves for the Kingston Mining Complex in Accordance with United States SEC Standards as of December 31, 2023 Central Appalachian Coal Basin West Virginia, USA MARSHALL MILLER & ASSOCIATES, INC. 42 spacings be determined at the 10-percent, 20-percent, and 50-percent levels of relative error, respectively. Figure 11-4: Result of DHSA for the Middle Cedar Grove Seam Present in the Kingston Mining Complex Table 11-2: DHSA Results Summary for Radius from a Central Point Model: Measured Radial Distance (10% Relative Error) Indicated Radial Distance (20% Relative Error) Inferred Radial Distance (50% Relative Error) (Miles) (Miles) (Miles) Gaussian: 0.39 0.77 1.91 Spherical: 0.39 0.77 1.91 Exponential: 0.40 0.78 1.92 Comparing the results of the DHSA to the historical standards, it is evident that the historical standards are more conservative than even the most conservative DHSA model with regards to determining measured resources. The Gaussian and Spherical models recommend using a radius of 0.39 miles for measured resources compared to the historical value of 0.25 miles. With respect to indicated resources the DHSA-recommended drill hole spacing is slightly greater than the historical standards. The Exponential model recommends using a radius 0.78 miles, while the Gaussian and Spherical models recommend a radius of 0.77 compared against the historical radius of 0.75 miles. These results have led the QPs to report the data following the historical classification standards as outlined in USGS Circular 891, rather than use the results of the DHSA. 0 5 10 15 20 25 30 35 40 2000 3000 4000 5000 6000 7000 8000 9000 10000 R el a ve E rr o r 9 5 % P er ce n le R a n ge Dri l l Hole Spacing ( ) Gauss ian Exponen al Spherica l

Alpha Metallurgical Resources, Inc. Statement of Coal Resources and Reserves for the Kingston Mining Complex in Accordance with United States SEC Standards as of December 31, 2023 Central Appalachian Coal Basin West Virginia, USA MARSHALL MILLER & ASSOCIATES, INC. 43 11.2 Resources Exclusive of Reserves The Kingston Property contains resource blocks of surface seams which were not deemed to exhibit reserve potential at the time of the study. These resources exclusive of reserves are listed below. Reasons which may preclude elevation of resources to reserves include, but are not limited to: 1. Limited availability of quality information to document coal seam market characteristics. > Sewell resources area north and northwest of the reserves lack metallurgical coal quality. 2. Limited drill hole density and/or coal seam definition. > The Sewell resources area north of the reserves is separated from the reserve by an area of limited drilling. Access to the resource block requires additional definition. It is bounded on the east side by existing closed Sewell mines. > Drill hole spacing is wide spaced in the Sewell resource area. Due to the lack of seam definition, the resource is classified as indicated. Mineability constraints due to over/under mining, underground conditions, and physical locations that would have negative influence on the mineability of the coal. > The Sewell resources area is bound on the east side by existing close Sewell mines. Based on the mine maps, entries were driven toward and into the resource block and then stopped. It is likely coal thickness and/or other geologic conditions were encountered that limited the advance into the resource area. 3. Undefined resource access, low seam thickness. > Douglas resources located south of the Kingston 2 Mine area are separated from the current mining area by coal seam thickness below the economic cut-off value. > Full extraction (pillar) mining of a southern panel isolated a resource from above cutoff coal thickness. 11.2.1 Initial Economic Assessment MM&A completed an initial economic assessment to determine the potential economic viability of resources exclusive of reserves. MM&A applied relevant technical factors to estimate potential saleable tons without the resource blocks, should the resources be extracted via deep, continuous mining methods. MM&A developed cash cost profiles for the resource blocks, including direct cash costs (labor, supplies, roof control, maintenance and repair, power, and other); washing, trucking, materials handling, general and administrative, and environmental costs; and indirect cash costs (royalties, production taxes, property tax, insurance). Costs were developed based off relevant cost drivers (per-ft, per-raw-ton, per-clean-ton). Additionally, MM&A estimated capital costs to access resources. Capital costs associated with mine developed were amortized across the resource’s potential saleable tonnages). Additional non-cash items (depreciation of equipment and depletion) Alpha Metallurgical Resources, Inc. Statement of Coal Resources and Reserves for the Kingston Mining Complex in Accordance with United States SEC Standards as of December 31, 2023 Central Appalachian Coal Basin West Virginia, USA MARSHALL MILLER & ASSOCIATES, INC. 44 and cash costs were compared to an assumed sale price of $140 per ton netback FOB loadout (approximately $181 per ton U.S. East Coast basis) for Mid Vol markets. This resource assumed sales value was developed as a premium to the market-based reserve sales value to properly estimate the sales-related expenses should these resources be extracted during higher-than-average market conditions. Pricing used for the primary product was selected by the QP and deemed reasonable based on a review of historical average pricing for the Kingston Mining Complex coal products over the past 5 years. The results of the analysis are shown below and demonstrate potential profitability on a fully loaded cost basis. Detailed summaries are shown in Appendix B. Table 11-3: Results of Initial Economic Assessment Mine Resource Block Direct Cash Transportation, Washing, Enviro, G&A Indirect Non Cash Total Cost Fully Loaded P&L Sewell North UG Sewell North UG $89.99 $23.88 $12.22 $7.73 $133.83 $6.17 Douglas Blocks D, F Douglas Blocks D, F $68.79 $28.65 $10.82 $7.73 $115.99 $24.01 Figure 11-5: Results of Initial Economic Assessment 11.3 Qualified Person’s Estimates Based on the work previously described and detailed modelling of those areas along with consideration of modifying factors, a coal resource estimate, summarized in Table 11-5, was prepared as of December 31, 2023, for Kingston Property controlled by Alpha.

Alpha Metallurgical Resources, Inc. Statement of Coal Resources and Reserves for the Kingston Mining Complex in Accordance with United States SEC Standards as of December 31, 2023 Central Appalachian Coal Basin West Virginia, USA MARSHALL MILLER & ASSOCIATES, INC. 45 Table 11-4: Coal Resources Summary as of December 31, 2023 Coal Resource (Dry Tons, In Situ) Area or Seam Measured Indicated Inferred Total Inclusive of Reserve/Converted to Reserve Kingston Surface 19,996,000 6,599,000 1,118,000 27,713,000 Kingston HWM 17,219,000 1,553,000 0 18,772,000 Sewell (UG) 31,740,000 10,907,000 1,602,000 44,250,000 Douglas (UG) 4,426,000 1,318,000 0 5,743,000 Total 73,381,000 20,377,000 2,720,000 96,478,000 Exclusive of Reserve/Not Converted to Reserve Kingston Surface 0 0 0 0 Kingston HWM 0 0 0 0 Sewell (UG) 13,266,000 10,206,000 0 23,472,000 Douglas (UG) 2,439,000 751,000 0 3,189,000 Total 15,705,000 10,957,000 0 26,662,000 Grand Total Total 89,086,000 31,334,000 2,720,000 123,140,000 Note (1): Resource tons are inclusive of reserve tons since they are the in-situ tons from which recoverable coal reserves are derived. Note (2): Coal resources are reported on a dry basis. Surface moisture and inherent moisture are excluded. Note (3): The Property contains26.66 million tons (Mt) of dry, in-place measured and indicated coal resources exclusive of reserves as of December 31, 2023. Totals may not add due to rounding. See Appendix A for detailed breakdown. 11.4 Qualified Person’s Opinion While there is some stratigraphically controlled seam-thickness variability due to seam splitting, sand channels, etc., MM&A geologists and engineers modeled the deposit and resource areas to reflect realistic mining scenarios, giving special consideration to uncertainties as related to each class of mineral resources such as (1) seam thickness, (2) floor and roof conditions, (3) mining equipment, etc. This statistical study demonstrates that for each configuration of mineable seams, the classification system of measured (0 – ¼ mile), indicated (¼ to ¾ mile), and inferred (¾ to 3 miles) is reasonably adequate to predict seam thickness variation for modeling and mining purposes. Based on MM&A’s geostatistical analysis, it would be possible to extend the measured arcs slightly beyond historically accepted practices due to consistent geological settings. The QP’s have again elected not to extend arc distances, introducing a level of conservatism in the measured coal classification. Based on the data review, the attendant work done to verify the data integrity and the creation of an independent Geologic Model, MM&A believes this is a fair and accurate representation of the Kingston coal resources. 12 Mineral Reserve Estimates 12.1 Assumptions, Parameters and Methodology Coal Reserves are classified as proven or probable considering “modifying factors” including mining, metallurgical, economic, marketing, legal, environmental, social, and governmental factors. Alpha Metallurgical Resources, Inc. Statement of Coal Resources and Reserves for the Kingston Mining Complex in Accordance with United States SEC Standards as of December 31, 2023 Central Appalachian Coal Basin West Virginia, USA MARSHALL MILLER & ASSOCIATES, INC. 46 > Proven Coal Reserves are the economically mineable part of a measured coal resource, adjusted for diluting materials and allowances for losses when the material is mined. It is based on appropriate assessment and studies in consideration of and adjusted for assumed modifying factors. These assessments demonstrate that extraction could be justified at the time of reporting. > Probable Coal Reserves are the economically mineable part of an indicated coal resource, and in some circumstances a measured coal resource, adjusted for diluting materials and allowances for losses when the material is mined. It is based on appropriate assessment and studies in consideration of and adjusted for assumed modifying factors. These assessments demonstrate that extraction could be justified at the time of reporting. Upon completion of delineation and calculation of coal resources, MM&A generated a LOM plan for Kingston. The footprint of each reserve area is shown on the maps in Appendix C. The Mine plan was generated based on 5-year budget mine plans provided by Alpha and supplemented with additional projections by MM&A to reflect LOM plans that honor property control limits, geologic mapping, or other factors determined during the evaluation. Carlson Mining software was used to generate the LOM plan for Kingston. The mine plan was sequenced based on productivity schedules provided by Alpha. MM&A judged the productivity estimates and plans to be reasonable based on experience and current industry practice. Raw, ROM production data outputs from LOM plan sequencing were processed into Microsoft® EXCEL spreadsheets and summarized on an annual basis for processing into the economic model. Average seam densities were estimated to determine raw coal tons produced from the LOM plan. Average mine recovery and wash recovery factors were applied to determine coal reserve tons. Coal reserve tons in this evaluation are reported on a moist, saleable product basis with 4.5% moisture for surface mined reserves and 6.0% for deep mine reserves. Pricing data as provided by Alpha is described in Table 16-2. The pricing data assumes a flat-line long term realization average of $163 per short ton port loading, with an average of $126.29 netback pricing reflective of the mid-volatile product, and $162 per short ton port loading, with an average of $134.74 netback pricing reflective of the high-volatile product currently sold at Kingston. A portion of the surface mine production is also thermal product which assumes a flat-line long term realization of $74 per short ton with an average of $65.52 per ton netback pricing. The LOM blended average netback pricing for the Kingston reserves is $121.00 per ton. These estimates are based on long-term pricing published by third party sources and adjusted for quality and transportation. A large majority of the coal sold by Alpha and their Kingston Mining Complex is shipped internationally as part of blended products from other business groups within Alpha or sourced from other companies. These netback adjustments reflect these additional costs carried after the products leave the Kingston Mining Complex.

Alpha Metallurgical Resources, Inc. Statement of Coal Resources and Reserves for the Kingston Mining Complex in Accordance with United States SEC Standards as of December 31, 2023 Central Appalachian Coal Basin West Virginia, USA MARSHALL MILLER & ASSOCIATES, INC. 47 The coal resource mapping and estimation process, described in the report, was used as a basis for the coal reserve estimate. Proven and probable coal reserves were derived from the defined coal resource considering relevant processing, economic (including technical estimates of capital, revenue, and cost), marketing, legal, environmental, socio-economic, and regulatory factors and are presented on a moist, recoverable basis. As is customary in the US, the categories for proven and probable coal reserves are based on the distances from valid points of measurement as determined by the QP for the area under consideration. For this evaluation, measured resource, which may convert to a proven reserve, is based on a ¼-mile radius from a valid point of observation. Points of observation include exploration drill holes, and mine measurements which have been fully vetted and processed into a geologic model. The geologic model is based on seam depositional modeling, the interrelationship of overlying and underlying strata on seam mineability, seam thickness trends, the impact of seam structure, intra-seam characteristics, etc. Once the geologic model was completed, a statistical analysis, described in Section 11.1.1 was conducted and a ¼-mile radius from a valid point of observation was selected to define Measured Resources. Likewise, the distance between ¼ and ¾ of a mile radius was selected to define Indicated Resources. Indicated Resources may convert to Probable Reserves. Inferred Resources (greater than a ¾-mile radius from a valid point of observation) have been excluded from Reserve consideration. 12.2 Mineral Reserves Kingston Mining Complex reserves were derived from multiple coal seams in Figure 7-1 located on the Property. Reserves are estimated for both surface and underground mining. Surface reserves were derived from multiple seams and underground reserves were derived from two seams. The underground accessed seams include the Douglas seam at the active Kingston 2 mine; the Sewell seam located below drainage east of the surface mines. Demonstrated reserve tons are listed in the discussion below. Table 12-3 shows the demonstrated tonnage by Proven and Probable status. 12.2.1 Surface Reserves The Kingston operations include active surface mines with contour and highwall miner reserve. Estimated LOM average mine ratios bank cubic yards per ton (BCY/Ton) do not exceed 20 to 1 for the reserve estimates. Cross sections through drill holes with lithologic records and seam correlation tie lines have been prepared for each surface reserve and are available upon request. Alpha Metallurgical Resources, Inc. Statement of Coal Resources and Reserves for the Kingston Mining Complex in Accordance with United States SEC Standards as of December 31, 2023 Central Appalachian Coal Basin West Virginia, USA MARSHALL MILLER & ASSOCIATES, INC. 48 12.2.1.1 Kingston The demonstrated reserve at Kingston surface is comprised of 20.90 million surface mine tons and 6.40 million highwall miner tons from 30 different coal seams for permitted and non-permitted reserve. Kingston mine operations include three fully permitted areas and one partially permitted area. The mine permit areas are adjacent to one another with mine permits. Two Kingston permits were active in 2023. Table 12-1 shows the demonstrated tonnage by Proven and Probable status. Table 12-1: Kingston Coal Reserves Summary (Marketable Sales Basis) as of December 31, 2023 Demonstrated Coal Reserves (Wet Tons, Washed or Direct Shipped) By Reliability Category Area Proven Probable Total Surface Kingston 1,615,000 355,000 1,970,000 Paint Mountain 6,436,000 1,408,000 7,844,000 White Oak 3,770,000 1,780,000 5,550,000 Fulton East 3,916,000 1,624,000 5,540,000 Kingston Surface 15,737,000 5,167,000 20,904,000 Highwall Kingston 1,444,000 31,000 1,475,000 Paint Mountain 1,808,000 35,000 1,843,000 White Oak 2,040,000 318,000 2,358,000 Fulton East 594,000 128,000 722,000 Kingston HWM 5,887,000 512,000 6,399,000 Total Kingston Surface 3,059,000 386,000 3,445,000 Paint Mountain 8,244,000 1,443,000 9,688,000 White Oak 5,810,000 2,098,000 7,908,000 Fulton East 4,510,000 1,752,000 6,262,000 Kingston Total 21,623,000 5,679,000 27,302,000 The Fulton East permit area lacks valley fill permits necessary for the mine plan. These areas include the Kingston permit with demonstrated reserves of 3.45 Mt from to be extracted from the Powellton through the Stockton seams; Paint Mountain Permit S-3005-20 with demonstrated reserves of 9.69 Mt to be extracted from the Eagle Lower Split through the Stockton seams; and the White Oak permit with demonstrated reserves of 7.91 Mt to be extracted from the Powellton through the Stockton seams. Fulton East permit area contains demonstrated reserves of 6.26 Mt to be extracted from the Chilton Rider to the Upper Eagle seams. Reserve tonnage may increase with permit expansion to include contouring in the lower Glen Allum Tunnel and Douglas seams. These contours will be associated with future hollow fills and/or near them. 12.2.2 Underground Reserves There are three underground reserve areas on the Kingston Property. The Kingston 2 and 10 mines and associated reserves that extract mid-volatile coal from the Douglas seam. The Sewell seam reserve is below drainage and located east of the surface mines.

Alpha Metallurgical Resources, Inc. Statement of Coal Resources and Reserves for the Kingston Mining Complex in Accordance with United States SEC Standards as of December 31, 2023 Central Appalachian Coal Basin West Virginia, USA MARSHALL MILLER & ASSOCIATES, INC. 49 12.2.2.1 Kingston 2 - Douglas Seam Douglas reserves include 0.81 Mt clean recoverable tons remaining in the active Kingston 2 Mine. The Douglas seam is commonly a coal bench with localized area of thin shale partings. Seam thickness average approximately 2.5 feet in the Kingston 2 Mine reserve. Roof and floor rock is generally shale that makes the mine horizon a cuttable unit. The run-of-mine (ROM) coal is belted to the Kingston Preparation Plant prior to shipping to the customer. 12.2.2.2 Kingston 10 – Douglas Seam Douglas reserves include 0.83 Mt clean recoverable tons in the future Kingston 10 Mine, which will require a new face-up and portals. Seam thickness average 2.6 feet in the Kingston 10 Mine reserve. The Douglas seam appears to begin to split on the west side of the reserve area. The split thickness may define the reserve limit. 12.2.2.3 Sewell Seam The Sewell seam reserve is located near the community of Pax in Fayette County, West Virginia. The Sewell seam demonstrated reserves are 9.72 Mt clean recoverable tons. The reserve is classified as a Probable reserve due to the lack of metallurgical quality and dynamic depositional environments forming multiple seam benches. . The seam is below drainage and the overburden ranges from 200 feet in the lowest valley bottoms to over 900 feet under the highest ridge tops. The Paint Creek Lineament is a north-south trending zone following the western reserve boundary with most tons found east of the lineament. The Sewell seam is known to be gassy and influenced by horizontal stress that would be managed by ventilation and mine design. The seam consists of multiple coal benches (1 to 4 benches) and seam thickness ranges from 3 feet to 11 feet. The benches are depositional with limited lateral continuity where the coal thins at the margin of the deposition basin. The raised depositional areas trend north-south through the center part of the reserve and contain the most coal benches and thickest seam. Roof and floor rock is mostly shale that makes the mine horizon a cuttable unit. 12.3 Qualified Person’s Estimates The coal reserves, as shown in Table 12-1, are based on a technical evaluation of the geology and a preliminary feasibility study of the coal deposits. The extent to which the coal reserves may be affected by any known environmental, permitting, legal, title, socio-economic, marketing, political, or other relevant issues has been reviewed rigorously. Similarly, the extent to which the estimates of coal reserves may be materially affected by mining, quality, infrastructure and other relevant factors has also been considered. Alpha Metallurgical Resources, Inc. Statement of Coal Resources and Reserves for the Kingston Mining Complex in Accordance with United States SEC Standards as of December 31, 2023 Central Appalachian Coal Basin West Virginia, USA MARSHALL MILLER & ASSOCIATES, INC. 50 The results of this TRS define an estimated 32.86 Mt of proven and probable marketable coal reserves. Table 12-2: Coal Reserves Summary (Marketable Sales Basis) as of December 31, 2023 Demonstrated Coal Reserves Quality (Dry Basis) (Wet Tons, Washed or Direct Shipped) By Reliability Category By Permit Status By Control Type Area/Seam Proven Probable Total Permitted Not Permitted Owned Leased Ash% Sulfur% VM% Kingston Surface 15,737,000 5,167,000 20,904,000 15,364,000 5,540,000 0 20,904,000 10 1.0 32 Kingston HWM 5,887,000 512,000 6,399,000 5,757,000 642,000 0 6,399,000 11 1.1 32 Sewell (UG) 0 9,722,000 9,722,000 0 9,722,000 523,000 9,199,000 5 0.8 22 Douglas (UG) 1,427,000 205,000 1,632,000 903,000 729,000 109,000 1,523,000 6 1.0 23 Grand Total 23,051,000 15,606,000 38,656,000 22,024,000 16,633,000 632,000 38,025,000 - - - Notes: Marketable reserve tons are reported on a moist basis, including a combination of surface and inherent moisture. Coal quality is based on a weighted average of laboratory data from core holes. The combination of surface and inherent moisture is modeled at 6.0-percent. Douglas seam volatile matter analysis not available. Douglas seam priced as a Mid-Vol. product, consistent with Kingston 2 production. Actual product moisture is dependent upon multiple geological factors, operational factors, and product contract specifications and can exceed 8-percent. As such, the modeled moisture values provide a level of conservatism for reserve reporting. Totals may not add due to rounding. See Appendix A for detailed breakdown. In summary, Alpha controls a total of 38.66 Mt (moist basis) of marketable coal reserves at Kingston as of December 31, 2023. Of that total, 60 percent are proven, and 40 percent are probable. Of the 38.66 Mt, 0.63 Mt are owned, and 38.02 Mt are leased coal reserves. Of the total, 20.90 Mt are surface mineable, 6.40 Mt are highwall mineable, and 11.35 Mt are underground mineable. Marketable coal reserves are 6.72 Mt are thermal and 31.94 Mt are metallurgical. The maps included in Appendix C reflect mining depletion at the time of the resource/reserve calculation taken from Alpha mine maps as of September 30, 2023 for the underground mines and as of June 30, 2023 for the surface mines. Mine depletion tonnages were supplied by Alpha through the end of 2023, and MM&A deducted this historical production from the mapped reserves in order to estimate reserves as of December 31, 2023. 12.4 Qualified Person’s Opinion The estimate of coal reserves was determined in accordance with the SEC S-K 1300 regulations that became effective for the first fiscal year falling on or after January 1, 2021. The LOM mining plan for Kingston was prepared to the level of preliminary feasibility. Mine projections were prepared, and timing scheduled to match production with coal seam characteristics. Production timing was carried out from current locations to depletion of the coal reserve area. Coal reserve estimates could be materially affected by the risk factors described in Section 22.2. Based on the Preliminary Feasibility Study and the attendant Economic Review, MM&A believes this is a fair and accurate calculation of the Kingston coal reserves.

Alpha Metallurgical Resources, Inc. Statement of Coal Resources and Reserves for the Kingston Mining Complex in Accordance with United States SEC Standards as of December 31, 2023 Central Appalachian Coal Basin West Virginia, USA MARSHALL MILLER & ASSOCIATES, INC. 51 13 Mining Methods Three underground mining areas along with the Kingston surface and highwall miner areas were modeled and tested economically. Once the Resources were calculated, mine plans were created to project operating each resource area to depletion, with crews and equipment scheduled to move to subsequent mining areas as depletion occurs. Underground mine operations are projected to be exhausted in 2036, while surface and highwall mining operations are projected to be completed in 2034. 13.1 Geotech and Hydrology Mining plans for potential underground mines were developed by Alpha and MM&A. Pillar stability was tested by MM&A using the Analysis of Coal Pillar Stability (ACPS) program that was developed by the National Institute for Occupational Safety and Health (NIOSH). MM&A reviewed the results from the ACPS analysis and considered it in the development of the LOM plan. Hydrology has not been an issue of concern at Alpha’s Kingston operations. Based on numerous site visits to the underground operations of the Property by the QP’s, it has been determined that this is not a significant concern. Mining of future reserves is projected to occur in areas which exhibit similar hydrogeological characteristics as those formerly mined areas. 13.2 Production Rates Operations at the Kingston Property by Alpha and its predecessors are in various stages of maturity. The mine plan and productivity expectations reflect historical performance and efforts have been made to adjust the plan to reflect future conditions. MM&A is confident that the mine plan is representative of providing an accurate estimation of coal reserves. Mine development and operation have not been optimized within the TRS. Carlson Mining software was used by MM&A to generate mine plans for the mineable coal seams. Mine plans were sequenced based on productivity schedules provided by Alpha, which were based on historically achieved productivity levels. All production forecasting ties assumed production rates to geological models as constructed by MM&A’s team of geologists and mining engineers. As shown in Table 13-1, the areas planned for underground mines produce coal until 2036. Clean coal production varies directly with coal thickness and anticipated mining conditions. Alpha Metallurgical Resources, Inc. Statement of Coal Resources and Reserves for the Kingston Mining Complex in Accordance with United States SEC Standards as of December 31, 2023 Central Appalachian Coal Basin West Virginia, USA MARSHALL MILLER & ASSOCIATES, INC. 52 Table 13-1: Kingston Mining Complex Underground Mine Production Schedule (x 1,000 Saleable Tons) Mine Name 2023 2024 2025 2026 2027 2028 2029 2030 Kingston Mine #10 (Douglas) 0 0 216 274 264 73 0 0 Sewell 0 0 288 595 629.1 825 1,188 1,022 Kingston #2 (Douglas) 125 553 127 0 0 0 0 0 Total 125 553 631 869 893 898 1,188 1,022 Mine Name 2031 2032 2033 2034 2035 2036 2037 2038 Kingston Mine #10 (Douglas) 0 0 0 0 0 0 0 0 Sewell 1,398 995 1,022 810 824 124 0 0 Kingston #2 (Douglas) 0 0 0 0 0 0 0 0 Total 1,398 995 1,022 810 824 124 0 0 As shown in Tables 13-2 and 13-3, the areas planned for surface and highwall mines produce coal until 2034. Clean coal production varies directly with surface mining ratios along with availability of open highwall for the highwall miner units. Table 13-2: Kingston Mining Complex Surface Mine Production Schedule (x 1,000 Saleable Tons) Mine Name 2023 2024 2025 2026 2027 2028 2029 2030 Kingston 332 1,671 2,132 1,761 2,132 2,443 2,013 2,013 Mine Name 2031 2032 2033 2034 2035 2036 2037 2038 Kingston 2,013 2,013 2,013 657 0 0 0 0 Table 13-3: Kingston Mining Complex Highwall Mine Production Schedule (x 1,000 Saleable Tons) Mine Name 2023 2024 2025 2026 2027 2028 2029 2030 Kingston HWM 125 231 510 517 305 562 702 702 Mine Name 2031 2032 2033 2034 2035 2036 2037 2038 Kingston HWM 702 702 702 720 0 0 0 0 13.3 Mining Related Requirements 13.3.1 Underground A mine plan with sequenced mining projections was prepared for each logical mining unit. For each mine plan, the appropriate number of production units is selected for the resource area, and a productivity level assigned, expressed in feet of advance per unit-shift of production. The productivity is based on the equipment and personnel configuration, mining height and expected physical conditions.

Alpha Metallurgical Resources, Inc. Statement of Coal Resources and Reserves for the Kingston Mining Complex in Accordance with United States SEC Standards as of December 31, 2023 Central Appalachian Coal Basin West Virginia, USA MARSHALL MILLER & ASSOCIATES, INC. 53 13.4 Required Equipment and Personnel 13.4.1 Underground Mines 13.4.1.1 Kingston 2 Mine – Douglas Seam (Maps UG-1) Kingston 2 is an active mine and has been in production for over 20 years. Two operating sections are found within the mine plan. Each production unit is supplied with two (2) continuous miners, two (2) roof bolters, four (4) shuttle cars, two (2) scoops and one (1) section feeder breaker. Four distinct portal areas access the reserve boundary from coal seam contour benches. > The main portal and surface facilities are located on the east side of the valley, immediately upstream of the Kingston Preparation Plant. This facility includes the mine office, warehousing and change house facilities. > Portals are located on the west side of the valley, immediately across from the main portals. > A set of portals northeast of the preparation plant deliver run of mine coal into a stockpile that feeds the Kingston Preparation Plant. > A new set of portals at Shotgun Hollow above the community of Pax have been developed. These portals provide a shorter travel distance to the working areas than the original portal locations. The basis mining concept has the continuous miner cutting coal and rock from the mine face. The continuous miner loads the run of mine material into shuttle cars which transports the material to the section feeder breaker. The feeder breaker loads the run of mine product onto the section conveyor belt and consecutive conveyor belts for haulage to the surface stockpile. Once the continuous miner has reached its maximum distance in a working face, it is trammed to another available working face to begin mining. The roof bolter machine is moved into the recently completed working face to support the roof and ribs with steel bolts and plates. The run of mine coal stockpile is located adjacent to the Kingston Preparation Plant where a reclaim conveyor transports the run of mine product for processing. The mine is nearing its end of life with both units ending their assignments in 2025. Remaining reserves are found at the edges of the mineral body. 13.4.1.2 Kingston 10 Mine – Douglas Seam (Map UG-1) A small boundary area accessible from outcrop near White Oak Branch of Clear Creek has been included within the report. The Kingston 10 Mine would use one continuous miner unit from the Kingston 2 Mine as the unit becomes available. The run of mine coal would be placed into a stockpile and trucked to a processing facility before shipping to a customer. Alpha Metallurgical Resources, Inc. Statement of Coal Resources and Reserves for the Kingston Mining Complex in Accordance with United States SEC Standards as of December 31, 2023 Central Appalachian Coal Basin West Virginia, USA MARSHALL MILLER & ASSOCIATES, INC. 54 The operation is projected to start in the first quarter of 2025 and complete its assignment in the first quarter of 2028. 13.4.1.3 Sewell Seam Mine Sewell Mine (Map UG-2) The Sewell Seam reserve boundary will be reached by constructing a slope and two ventilation shafts for access. The slope has a grade of 15 percent and will be constructed at a width capable of supporting the mine conveyor as well as an adjacent haulage road. Projected plans include the construction of a raw coal stockpile near the slope portal which would ship the raw product to a proposed railcar loading facility. From there the coal would be transported to Alpha’s Mammoth Preparation Plant near Montgomery, West Virginia. The Mammoth Preparation Plant is serviced by the Kanawha River Railroad (KNWA), a short line railroad owned by WATCO. Capital construction costs include the mine construction, the railcar loading facility and a railcar unloading facility at the Mammoth Preparation Plant. The rail haul from the Pax Loadout to the Mammoth Preparation Plant would operate entirely on KNWA rail for a one-way distance of 33 miles. The proposed mine has been timed with three operating continuous miner production units. Each production unit is equipped with two (2) continuous miners, two (2) roof bolting machines, four (4) shuttle cars, two (2) mine scoops and one (1) section feeder breaker. The normal production cycle involves the continuous miner cutting coal and rock from the mine face. The continuous miner loads the run-of-mine material into shuttle cars which transports the material to the section feeder breaker. The feeder breaker loads the run of mine product onto the section conveyor belt and consecutive conveyor belts for haulage to the surface stockpile. Operating life-of-mine for the Sewell seam is projected at 11 years.

Alpha Metallurgical Resources, Inc. Statement of Coal Resources and Reserves for the Kingston Mining Complex in Accordance with United States SEC Standards as of December 31, 2023 Central Appalachian Coal Basin West Virginia, USA MARSHALL MILLER & ASSOCIATES, INC. 55 13.4.2 Surface Mines 13.4.2.1 Kingston (Map K2-K11) Figure 13-1: Kingston Mine Permit Areas Aerial View The Kingston reserve area consists of mountain-top, contour and highwall mining of 30+ seams: from the Stockton to the Eagle - a difference of over 1,000 vertical feet. Deep mining has taken place in the Lower Cedar Grove, Upper and Lower No. 2 Gas, Powellton and Powellton lower split, Upper Eagle, and Eagle upper and lower splits. Previous contour and augering mining have also been documented. The present mine plan consists of four permits: Kingston, Paint Mountain, White Oak and Fulton East. The Fulton East valley fill 401 and U.S. Army Corps of Engineers (ACOE) 404 permits are pending. MM&A did not attempt to confirm burden storage capacity as presented in Kingston’s permits. The Kingston operation is in an early-development phase. Only working areas have been established, with late 3rd Quarter 2023 disturbance being limited to the Kingston permit. Additional working areas will be established on the south-eastern portion of the property, within the Paint Mountain permit, in Alpha Metallurgical Resources, Inc. Statement of Coal Resources and Reserves for the Kingston Mining Complex in Accordance with United States SEC Standards as of December 31, 2023 Central Appalachian Coal Basin West Virginia, USA MARSHALL MILLER & ASSOCIATES, INC. 56 late 2023. Production activity on the south-eastern portion of the property will be slowly transitioning from the Bishop area that is expected to be fully depleted by 2028. Mining activity is expected to utilize hydraulic shovels / front-end loaders mining while extracting the lower contour coal seams. Dozers will help supplement production by pushing burden to areas of lower benches that have completed highwall mining activity. Strip ratio constraints will limit areas of full area mining, with most of the surface mining being contours created for highwall mining activity. Contour widths for seams that have lower strip ratios will generally be wider than others. Surface mining will be initiated in lower seams and progress to upper seams so that reclamation of the lower seams can be achieved by spoil from upper seam mining, providing lower highwall mining activity has been completed. Ideally the reclamation of the contour benches can be achieved by dozer pushing, but it is expected that the majority of reclamation volume will be achieved by higher cost truck haulage. Valley fills of substantial storage volume are primarily limited to the Kingston and Paint Mountain permits. Smaller fills are permitted on the White Oak permit with most excess spoil capacity provided by the backfilling within the three permits. Additional storage volume can be obtained from backfilling on the adjacent, largely reclaimed permit to the east. Regulatory approval of the Fulton East valley fills will be necessary before full scale production can commence on this permit. Kingston will be operating two large hydraulic excavators, one small hydraulic excavator, three 993 front-end loaders and four D11 track bulldozers. Combined production capacity will be in excess of 27 million BCY per year within 2 years and in excess of 33 million BCY per year once production activity ceases at Bishop. Two highwall miners will provide additional production tonnage as highwalls are exposed. Production activity on the Paint Mountain permit might be hampered if the WV turnpike tower that is located at the top of the permit ridge is not moved or restrictions are placed on blasting in the vicinity of the tower. Negotiations are expected to take place. The mine will employ up to 243 operators in the surface mining and highwall mining phases of the operation. At the above production level exhaustion of the reserves is expected to be in year 2034. 14 Processing and Recovery Methods 14.1 Description or Flowsheet The Alpha Kingston Operations includes the Kingston Preparation Plant. Washed coal product is transported from the preparation plant by truck haulage to the Pax loadout with access to the CSX Railroad. The Pax loadout was constructed in 2006 and can load railroad cars at a rate of 3,500 tons

Alpha Metallurgical Resources, Inc. Statement of Coal Resources and Reserves for the Kingston Mining Complex in Accordance with United States SEC Standards as of December 31, 2023 Central Appalachian Coal Basin West Virginia, USA MARSHALL MILLER & ASSOCIATES, INC. 57 per hour. Coal can also be transported by truck to Alpha’s Marmet dock barge loading facilities. The docks are located on the Kanawha River near Marmet, West Virginia, and provide barge transportation to the customer. Barges can be loaded at the rate of 1,600 tons per hour and the facility was built in 1986. Coal can also be trucked to the Kingston Mammoth Preparation Plant for processing. The Mammoth Plant provides rail loading on the Kanawha River Railroad short line that connects to the Norfolk Southern and CSX Transportation railroad systems as well as on-site barge loading on the Kanawha River. The Kingston plant site includes raw coal storage, clean coal storage, and refuse disposal areas. The Kingston preparation plant was constructed in 1974 and has a raw feed rate capacity of 700 raw tons per hour. The plant received its latest upgrade in 20011. Primary separation equipment includes Peters heavy media vessels, Krebs heavy media cyclones, MultiTech spirals, and Denver froth cells, supported by the requisite screens, centrifuges, sumps, pumps, and distribution systems. Coarse and fine refuse are disposed in an adjacent slurry cell impoundment. During the 2023 reporting year, the Kingston plant produced a product with a typical ash content of 8.41%, and a typical sulfur content 0.67% at a utilization rate of 72.6% Product transportation from the preparation plant is by highway truck to either the Pax Railroad Loadout or to barge loading facilities along the Kanawha River near Marmet, West Virginia. An aerial image of the Kingston Preparation Plant and refuse area is shown in Figure 14-1. 1 Coal Age Magazine, October 2022, pg 19, US Prep Plant Census 2022 Alpha Metallurgical Resources, Inc. Statement of Coal Resources and Reserves for the Kingston Mining Complex in Accordance with United States SEC Standards as of December 31, 2023 Central Appalachian Coal Basin West Virginia, USA MARSHALL MILLER & ASSOCIATES, INC. 58 Figure 14-1: Kingston Preparation Plant and Refuse Area Figure 14-2: Kingston Preparation Plant and Refuse Area (Zoomed-In View)

Alpha Metallurgical Resources, Inc. Statement of Coal Resources and Reserves for the Kingston Mining Complex in Accordance with United States SEC Standards as of December 31, 2023 Central Appalachian Coal Basin West Virginia, USA MARSHALL MILLER & ASSOCIATES, INC. 59 Processes and equipment are typical of those used in the coal industry and are in use in all plants in the Central Appalachian Basin. Current operations can ship product to the existing Mammoth Preparation Plant located near Montgomery, Fayette County, West Virginia. Future plans include shipping the proposed Sewell Seam mine run of mine product to the Mammoth Preparation Plant on the Kanawha River Railroad system. By utilizing the existing infrastructure with the nearby railroad facilities, the existing preparation plant, the existing refuse facilities and the existing shipping facilities, the Sewell Seam mine will enter the market with a premium metallurgical product strategically situated to access various markets by two Class 1 railroads and the intracoastal waterway barge system. The Mammoth preparation plant was originally constructed in 1950 and remains active. The last upgrade occurred in 2008. The plant feed rate is 1,200 raw tons per hour. Separation equipment utilizes a heavy media vessel, low density cyclones, spirals and column flotation, supported by various screens, centrifuges, sumps, pumps and distribution systems. During the 2023 reporting year, the Mammoth plant had a utilization rate of 18.28%. Coarse and fine refuse are disposed of at the nearby Lick Branch Impoundment. Rail service is provided by the Kanawha River Railroad short line that connects to either the CSX or Norfolk Southern Class 1 railroads. Barge loading facilities are available on site as the plant is strategically located on the headwaters of the Kanawha River intracoastal waterway system. 14.2 Requirements for Energy, Water, Material and Personnel Personnel have historically been sourced from the surrounding communities in Fayette, Raleigh, Kanawha, and Boone Counties, and have proven to be adequate in numbers to conduct mining operations. As mining is common in the surrounding areas, the workforce is familiar with mining practices, and many are experienced miners. Water is sourced locally from public water sources or rivers, and electricity is sourced from Appalachian Electric Power (AEP). The service industry in the areas surrounding the mine operations has historically provided supplies, equipment repairs and fabrication, etc. 15 Infrastructure The Kingston Preparation Plant services the area with washed coal, which is transported via highway trucks to the Pax Loadout located on WATCO’s Kanawha River Railroad short line railroad or to barge loading facilities along the Kanawha River near Marmet, West Virginia. Haul roads, primary roads, and Alpha Metallurgical Resources, Inc. Statement of Coal Resources and Reserves for the Kingston Mining Complex in Accordance with United States SEC Standards as of December 31, 2023 Central Appalachian Coal Basin West Virginia, USA MARSHALL MILLER & ASSOCIATES, INC. 60 conveyor belt systems account for transport from the various mine sites to the preparation plant. This practice will continue for future reserves. As an active operation, the necessary support infrastructure for Kingston is in place. As new areas are developed, the infrastructure requirements will change. These changes have been considered in the LOM plans and financial model. The underground mining resource areas which are located below drainage will require surface facilities, mine access slope development to the coal seam and ventilation facilities. Typical surface facilities include a mine office, a change house, supply facilities, mine fan and a stacker conveyor for run-of-mine coal storage. Photographs of the existing Kingston facilities are shown in Figures 15-1, 15-2, 15-3 and 15-4. Figure 15-1: Kingston Overview

Alpha Metallurgical Resources, Inc. Statement of Coal Resources and Reserves for the Kingston Mining Complex in Accordance with United States SEC Standards as of December 31, 2023 Central Appalachian Coal Basin West Virginia, USA MARSHALL MILLER & ASSOCIATES, INC. 61 Figure 15-2: Kingston Plant Area October 2022 Alpha Metallurgical Resources, Inc. Statement of Coal Resources and Reserves for the Kingston Mining Complex in Accordance with United States SEC Standards as of December 31, 2023 Central Appalachian Coal Basin West Virginia, USA MARSHALL MILLER & ASSOCIATES, INC. 62 Figure 15-3: Kingston Refuse Area October 2022

Alpha Metallurgical Resources, Inc. Statement of Coal Resources and Reserves for the Kingston Mining Complex in Accordance with United States SEC Standards as of December 31, 2023 Central Appalachian Coal Basin West Virginia, USA MARSHALL MILLER & ASSOCIATES, INC. 63 Figure 15-4: Kingston - Pax Loadout Surface Facilities Current operations can ship product to the existing Mammoth Preparation Plant located near Montgomery, Fayette County, West Virginia. Future plans include shipping the proposed Sewell Seam mine run of mine product to the Mammoth Preparation Plant on the existing Kanawha River Railroad system. By utilizing the existing infrastructure with the nearby railroad facilities, the existing preparation plant, the existing refuse facilities and the existing shipping facilities, the Sewell Seam mine will enter the market with a premium metallurgical product strategically situated to access various markets by two Class 1 railroads and the intracoastal waterway barge system. The Sewell Seam Mine slope location will be remote from the Kingston Preparation Plant but adjacent to the existing Kanawha River Railroad short line. A dedicated railroad car loader will be constructed on the railroad right of way. Using the existing railroad as compared to highway trucks to and from the Kingston Plant will provide a cost-effective method to participating in the metallurgical market with this coal. Photographs of the existing Mammoth facilities are shown in Figures 15-5, 15-6, and 15-7. Alpha Metallurgical Resources, Inc. Statement of Coal Resources and Reserves for the Kingston Mining Complex in Accordance with United States SEC Standards as of December 31, 2023 Central Appalachian Coal Basin West Virginia, USA MARSHALL MILLER & ASSOCIATES, INC. 64 Figure 15-5: Mammoth Facilities Overview

Alpha Metallurgical Resources, Inc. Statement of Coal Resources and Reserves for the Kingston Mining Complex in Accordance with United States SEC Standards as of December 31, 2023 Central Appalachian Coal Basin West Virginia, USA MARSHALL MILLER & ASSOCIATES, INC. 65 Figure 15-6: Mammoth Preparation Plant Layout 2022 Alpha Metallurgical Resources, Inc. Statement of Coal Resources and Reserves for the Kingston Mining Complex in Accordance with United States SEC Standards as of December 31, 2023 Central Appalachian Coal Basin West Virginia, USA MARSHALL MILLER & ASSOCIATES, INC. 66 Figure 15-7: Dunn Hollow Impoundment Refuse Disposal Area 16 Market Studies 16.1 Market Description The quality characteristics for the subject coal resources and coal reserves have been reviewed in detail by MM&A. The drill hole data were used to develop average coal quality characteristics for the mining site. These average coal quality characteristics were then utilized as the basis for determining the various markets into which the saleable coal will be placed. Quality Specifications for the Kingston products as produced in 2023 are as shown in Table 16-1.

Alpha Metallurgical Resources, Inc. Statement of Coal Resources and Reserves for the Kingston Mining Complex in Accordance with United States SEC Standards as of December 31, 2023 Central Appalachian Coal Basin West Virginia, USA MARSHALL MILLER & ASSOCIATES, INC. 67 Table 16-1: Dry Quality Specifications Kingston Preparation Plant Pax Load Out Ash (%) 8.41 7.85 Sulfur (%) 0.67 0.93 Volatile Matter (%) 23.86 29.21 Note: All Specs are dry basis The mine production serves both the mid-volatile and the high-volatile metallurgical markets. 16.2 Price Forecasts Pricing data as provided by Alpha from third-party sources is described in Table 16-2. The pricing data assumes a flat-line long term realization average of $163 per short ton port loading, with an average of $126.29 netback pricing reflective of the mid-volatile product, and $162 per short ton port loading, with an average of $134.74 netback pricing reflective of the high-volatile product currently sold at Kingston. A portion of the surface mine production is also thermal product which assumes a flat-line long term realization of $74 per short ton with an average of $65.52 per ton netback pricing. The LOM blended average netback pricing for the Kingston reserves is $121.00 per ton. These estimates are based on long-term pricing published by third party sources and adjusted for quality and transportation. A large majority of the coal sold by Alpha and their Kingston Mining Complex is shipped internationally as part of blended products from other business groups within Alpha or sourced from other companies. These netback adjustments reflect these additional costs carried after the products leave the Kingston Mining Complex. Table 16-2: Price Forecasts Coal Quality Market Pricing Per Ton (1) (2) High-Vol. A $162 High- Vol. B $140 Mid-Vol. $163 Low-Vol. $163 Thermal $74 (1) - Market pricing shown on U.S. East Coast basis. (2) - Metallurgical and thermal pricing based on 10-year and 3-year average, respectively of forecasted pricing from pricing services. 16.3 Contract Requirements Some contracts are necessary for successful marketing of the coal. For Kingston, since all mining, preparation and marketing is done in-house, the remaining contracts required are: Alpha Metallurgical Resources, Inc. Statement of Coal Resources and Reserves for the Kingston Mining Complex in Accordance with United States SEC Standards as of December 31, 2023 Central Appalachian Coal Basin West Virginia, USA MARSHALL MILLER & ASSOCIATES, INC. 68 > Transportation – Alpha contracts with the Norfolk Southern Railroad and CSX Transportation to transport coal to market. Barge transportation on the Kanawha River is contracted through various parties. > Sales – Sales contracts are a mix of spot and contract sales. With the volatility of the market, long- term contracts are not typically written. 17 Environmental Studies, Permitting and Plans, Negotiations or Agreements with Local Individuals 17.1 Results of Studies MM&A completed an environmental review in 2011 for the Massey properties acquired by Alpha, including those operations that were active at Kingston at that time. The environmental review completed by MM&A included site inspections, reviews of historical records, database searches of State and Federal regulatory records and interviews to identify potential recognized environmental conditions (RECs) that may create environmental liability for the sites. While MM&A identified RECs during both studies, MM&A’s opinion was that those issues would not preclude the continued or future use of the properties as a coal mining/preparation venture. Based on this former ESA completed by MM&A, it is MM&A’s opinion that Kingston has a typical coal industry record of compliance with applicable mining, water quality, and environmental laws. Estimated costs for mine closure, including water quality monitoring during site reclamation, are included in the financial models. 17.2 Requirements and Plans for Waste Disposal The financial model estimates tonnage reporting to the Kingston Preparation Plant through calendar year 2036. The current refuse facility uses slurry cell construction above the existing refuse area. Current activities adjoin the active surface mining area. Substantial areas are available for refuse disposal as needed and could overflow in to surface mine areas if needed. Coal processing will be provided for the Kingston underground mines that complete their assignments in 2028. Afterwards, processing will be limited to highwall miner production, auger production and selected surface mine seams at a reduced production rate until 2034. The Mammoth Preparation Plant will see run of mine coal from the Sewell Seam Mine starting in 2025 and extending into calendar year 2036. Adequate capacity remains in the existing impoundment structure to store the refuse material that will be generated. Table 17-1 is configured to provide general information as to the status of the refuse areas.

Alpha Metallurgical Resources, Inc. Statement of Coal Resources and Reserves for the Kingston Mining Complex in Accordance with United States SEC Standards as of December 31, 2023 Central Appalachian Coal Basin West Virginia, USA MARSHALL MILLER & ASSOCIATES, INC. 69 Table 17-1: Kingston Refuse Disposal Summary Refuse Facility State SMCRA Permit Number MSHA ID Refuse Disposal Type Classified as a Dam Permit Status Current Planned Maximum Coarse Life (Approved + Planned) Current Planned Maximum Fines Life (Approved + Planned) Est. Coarse/ Combined Refuse Life (Yrs.) Est. Fine Refuse Life (Yrs.) Kingston Coal Refuse Disposal Facility Kingston O-3019-93 1211-WV- 40107-04 Slurry Cell Impoundment - Downstream and Upstream Yes Active 11+ 11+ 11+ 11+ Mammoth Refuse Impoundment S-127-82 Slurry Impoundment - Downstream and Upstream Yes Active 11+ 11+ 11+ 11+ 17.3 Permit Requirements and Status All mining operations are subject to federal and state laws and must obtain permits to operate mines, coal preparation and related facilities, haul roads, and other incidental surface disturbances necessary for mining to occur. Permits require that the permittee post a performance bond in an amount established by the regulatory program to provide assurance that any disturbance or liability created during mining operations is restored to an approved post-mining land use and that all regulations and requirements of the permits are fully satisfied before the bond is returned to the permittee. Significant penalties exist for any permittee who fails to meet the obligations of the permits including cessation of mining operations, which can lead to potential forfeiture of the bond. Any company, and its directors, owners, and officers, which are subject to bond forfeiture can be denied future permits under the program.2 New permits or permit revisions will occasionally be necessary to facilitate the expansion or addition of new mining areas on the Property, such as amendments to existing permits and new permits for mining of reserve areas. Exploration permits are also required. Property under lease includes provisions for exploration among the terms of the lease. New or modified mining permits are subject to a public advertisement process and comment period, and the public is provided an opportunity to raise objections to any proposed mining operation. MM&A is not aware of any specific prohibition of mining on the subject property and given sufficient time and planning, Alpha should be able to secure new permits to maintain its planned mining operations within the context of current regulations. Necessary permits are in place to support current production on the Property, but future permits are required to maintain and expand production. Portions of the Property are located near local communities. Regulations prohibit mining activities within 300 feet of a residential dwelling, school, church, or similar structure unless written consent is first obtained from the owner of the structure. 2 Monitored under the Applicant Violator System (AVS) by the Federal Office of Surface Mining. Alpha Metallurgical Resources, Inc. Statement of Coal Resources and Reserves for the Kingston Mining Complex in Accordance with United States SEC Standards as of December 31, 2023 Central Appalachian Coal Basin West Virginia, USA MARSHALL MILLER & ASSOCIATES, INC. 70 Where required, Alpha reports that such consents have been obtained where mining is proposed beyond the regulatory limits. Alpha has obtained all mining and discharge permits to operate its mines and processing, loadout, or related facilities. MM&A is unaware of any obvious or current Alpha permitting issues that are expected to prevent the issuance of future permits. The Kingston Mining Complex, along with all coal producers, is subject to a level of uncertainty regarding future clean water permits due to United States Environmental Protection Agency (EPA) and United States Fish and Wildlife (USFW) involvement with state programs. The Mining permits currently held by Alpha on the Kingston Property are shown in Table 17-2.

Alpha Metallurgical Resources, Inc. Statement of Coal Resources and Reserves for the Kingston Mining Complex in Accordance with United States SEC Standards as of December 31, 2023 Central Appalachian Coal Basin West Virginia, USA MARSHALL MILLER & ASSOCIATES, INC. 71 Table 17-2: Kingston Mining Permits Mine Name Seam Permit Expires Status Acres Disturbed Acres Reclaimed Acres Bonded Republic Energy, LLC Skitter Creek No. 1 Mine - S302794 9/22/2025 Active, Reclaimed 55.9 497.68 616.58 Kingston Mine Chilton A, No. 2 Gas - Lwr, Coalburg - Ltl, Winifrede - Lwr, Chilton, Chilton RDR, Hernshaw, Coalburg, No. 2 Gas, Chilton - Ltl, Stockton, Winifrede - U, Peerless, Powellton, Clarion, Cedar Grove S300215 11/5/2024 Active, Moving Coal - - 738.78 White Oak Surface Mine Chilton A, No. 2 Gas - Lwr, Coalburg - Ltl, Winifrede - Lwr, Chilton, Chilton RDR, Hernshaw, Coalburg, No. 2 Gas, Chilton - Ltl, Stockton, Winifrede - U, Peerless, Powellton, Clarion, Cedar Grove S300821 11/30/2027 Not Started - - 847.4 Paint Mountain Surface Mine Chilton A, Chilton, Chilton RDR, Coalburg, No. 2 Gas, Stockton, Winifrede - U, Winifrede, Eagle, Eagle A, Eagle - Ltl, Peerless, Powellton, Cedar Grove S300520 10/19/2026 Active, Moving Coal - - 1,237.14 Fulton East Surface Mine Peerless, Campbell Crk – Lwr, 2 Gas, Powellton, Williamson, Cedar Grove, Hernshaw, Powellton A S300721 08/07/28 Not Started - - 852.4 Pax Loadout O302103 11/15/24 Active, No Coal Removed 15.05 5.1 21.81 Kingston Mining, Inc Kingston Preparation Plant - O301198 09/28/2025 Active 54.34 5.6 78.29 Refuge Disposal Area - O301993 03/14/2024 Active 93.14 60.19 218.94 Crown Hill River Loading Facility - O302190 07/15/2026 Active 19.62 0.76 22.08 Kingston No. 2 Mine 2 Gas U300601 11/05/2026 Active 11.67 0 14.95 Glen Alum No. 1 Glen Alum Tunnel U300496 12/18/2026 Inactive 12.06 9.34 29.00 Glen Alum No. 3 Glen Alum Tunnel U300597 03/27/2025 Inactive 8.70 3.07 12.40 Kingston No. 5 Glen Alum Tunnel U300512 07/07/2025 Inactive 1.54 1.54 13.42 Kingston Sewell Mine Sewell U300422 03/20/28 Not Started - - 22.77 Kingston No. 7 Mine Little Eagle U302612 01/02/2028 Inactive 16.96 5.70 37.86 Note: Permit status and expiration dates are based on information obtained from regulatory agency website. Permits in reclamation status receive Renewal Waivers and may show expired dates. Alpha Metallurgical Resources, Inc. Statement of Coal Resources and Reserves for the Kingston Mining Complex in Accordance with United States SEC Standards as of December 31, 2023 Central Appalachian Coal Basin West Virginia, USA MARSHALL MILLER & ASSOCIATES, INC. 72 17.4 Local Plans, Negotiations or Agreements MM&A found no indication of agreements beyond the scope of Federal or State Regulations. 17.5 Mine Closure Plans Applicable regulations require that mines be properly closed, and reclamation commenced immediately upon abandonment. In general, site reclamation includes removal of structures, backfilling, regrading, and revegetation of disturbed areas. For surface mines, much of the expense for backfilling and regrading is completed as part of ongoing mining operations, with only reclamation of final pits and HWM benches required at end-of-mine life. Sediment control is required during the establishment of vegetation, and bond release requires a minimum five-year period of site maintenance, water sampling, and sediment control following mine completion. This requirement is reduced to two years for certain operations involving re-mining. Reclamation of underground mines includes closure and sealing of mine openings such as portals and shafts in addition to the items listed above. Estimated costs for mine closure, including water quality monitoring during site reclamation, are included in the financial models. As with all mining companies, an accretion calculation is performed annually so the necessary Asset Retirement Obligations (ARO) can be shown as a Liability on the Balance Sheet. 17.6 Qualified Person’s Opinion The Kingston Mining Complex is an operating facility; all necessary permits for current production have been obtained. MM&A knows of no reason that any permit revisions or new permits that may be required cannot be obtained. Estimated expenditures for site closure and reclamation are included in the financial model for this site. 18 Capital and Operating Costs 18.1 Capital Cost Estimate The production sequence selected for a property must consider the proximity of each reserve area to coal preparation plants, river docks and/or railroad loading points, along with suitability of production equipment to coal seam conditions. The in-place infrastructure was evaluated, and any future needs were planned to a level suitable for a Preliminary Feasibility Study and included in the Capital Forecast. Alpha provided MM&A with information related to the number of currently operating production units at Kingston. MM&A’s capital schedules assume that major equipment rebuilds occur over the course

Alpha Metallurgical Resources, Inc. Statement of Coal Resources and Reserves for the Kingston Mining Complex in Accordance with United States SEC Standards as of December 31, 2023 Central Appalachian Coal Basin West Virginia, USA MARSHALL MILLER & ASSOCIATES, INC. 73 of each machine’s remaining assumed operating life. Replacement equipment was scheduled based on MM&A’s experience and knowledge of mining equipment and industry standards with respect to the useful life of such equipment. As one mine is depleted, the equipment is moved to its replacement. The capital expenditures tables detail costs for major equipment and infrastructure such as conveyor belt terminal groups. “Other” costs include expenditures for mine access and construction, mine extension capital and miscellaneous costs. A summary of the estimated capital for the consolidated Kingston operations is provided in Figure 18-1 below. Total capital by mine is summarized in Table 18-1. Figure 18-1: Projected Capital Expenditures – Consolidated Kingston Operations Alpha Metallurgical Resources, Inc. Statement of Coal Resources and Reserves for the Kingston Mining Complex in Accordance with United States SEC Standards as of December 31, 2023 Central Appalachian Coal Basin West Virginia, USA MARSHALL MILLER & ASSOCIATES, INC. 74 Table 18-1: Summary of Capital Expenditures Schedule by Mine Item Total 2023 2024 2025 2026 2027 2028 2029 Kingston #2 (Douglas) $0 $0 $0 $0 $0 $0 $0 $0 Sewell $252,360 $0 $106,836 $66,583 $0 $8,311 $22,268 $8,640 Kingston Mine #10 (Douglas) $16,101 $0 $0 $16,101 $0 $0 $0 $0 Workman Surface $0 $0 $0 $0 $0 $0 $0 $0 Kingston Surface $199,622 $0 $61,542 $12,340 $13,679 $12,880 $9,400 $12,340 Workman HWM $0 $0 $0 $0 $0 $0 $0 $0 Kingston HWM $14,470 $0 $500 $580 $1,340 $640 $4,010 $4,630 Total $482,553 $0 $168,878 $95,604 $15,019 $21,831 $35,678 $25,610 Item 2030 2031 2032 2033 2034 2035 2036 2037 Kingston #2 (Douglas) $0 $0 $0 $0 $0 $0 $0 $0 Sewell $9,701 $10,880 $4,320 $14,183 $319 $319 $0 $0 Kingston Mine #10 (Douglas) $0 $0 $0 $0 $0 $0 $0 $0 Workman Surface $0 $0 $0 $0 $0 $0 $0 $0 Kingston Surface $13,679 $34,661 $11,800 $16,300 $1,000 $0 $0 $0 Workman HWM $0 $0 $0 $0 $0 $0 $0 $0 Kingston HWM $530 $1,370 $640 $180 $50 $0 $0 $0 Total $23,910 $46,911 $16,760 $30,663 $1,369 $319 $0 $0 Note: No capital was projected for 4th quarter 2023. 18.2 Operating Cost Estimate Alpha provided historical costs and budgeted projections of operating costs for its active underground mines (Kingston #2) for MM&A’s review, along with its active surface and highwall mines (Kingston). MM&A used the historical and/or budget cost information as a reference and developed a personnel schedule for the mine. Hourly labor rates and salaries were based upon information contained in Alpha’s financial summaries. Fringe benefit costs were developed for vacation and holidays, federal and state unemployment insurance, retirement, workers’ compensation and pneumoconiosis, casualty and life insurance, healthcare, and bonuses. A cost factor for mine supplies was developed that relates expenditures to mine advance rates for roof control costs and other mine supply costs based on the historical cost data provided by Alpha. Other factors were developed for maintenance and repair costs, rentals, mine power, outside services, drilling & blasting, coal preparation plant processing, refuse handling, coal loading, property taxes, and insurance and bonding and other direct mining costs. Appropriate royalty rates were assigned for production from leased coal lands and sales taxes were calculated for state severance taxes, the federal black lung excise tax, and federal and state reclamation fees. Statutory sales-related costs are summarized in Table 18-2.

Alpha Metallurgical Resources, Inc. Statement of Coal Resources and Reserves for the Kingston Mining Complex in Accordance with United States SEC Standards as of December 31, 2023 Central Appalachian Coal Basin West Virginia, USA MARSHALL MILLER & ASSOCIATES, INC. 75 Table 18-2: Estimated Coal Production Taxes and Sales Costs Description of Tax or Sales Cost Basis of Assessment Cost Federal Black Lung Excise Tax – Underground Per Ton $1.10 Federal Black Lung Excise Tax – Surface/Highwall Per Ton $0.55 Federal Reclamation Fees – Underground Per Ton $0.12 Federal Reclamation Fees – Surface/Highwall Per Ton $0.28 West Virginia Reclamation Tax - Underground Per Ton $0.279 West Virginia Severance Tax Percentage of Revenue 1 to 5% Royalties – Underground, Surface and Highwall Percentage of Revenue 5.0% Notes: 1. Federal black lung excise tax is paid only on coal sold domestically. A summary of the projected operating costs for the consolidated Kingston operations is provided in Figure 18-2. Figure 18-2: Kingston Mining Complex Operating Costs 19 Economic Analysis 19.1 Economic Evaluation 19.1.1 Introduction The pre-feasibility financial model prepared for this TRS was developed to test the economic viability of each coal resource area. The results of this financial model are not intended to represent a bankable Alpha Metallurgical Resources, Inc. Statement of Coal Resources and Reserves for the Kingston Mining Complex in Accordance with United States SEC Standards as of December 31, 2023 Central Appalachian Coal Basin West Virginia, USA MARSHALL MILLER & ASSOCIATES, INC. 76 feasibility study, required for financing of any current or future mining operations contemplated for the Alpha properties, but are intended to establish the economic viability of the estimated coal reserves. Cash flows are simulated on an annual basis based on projected production from the coal reserves. The discounted cash flow analysis presented herein is based on an effective date of January 1, 2024. On an un-levered basis, the NPV of the project cash flow after taxes represents the Enterprise Value of the project. The project cash flow, excluding debt service, is calculated by subtracting direct and indirect operating expenses and capital expenditures from revenue. Direct costs include labor, operating supplies, maintenance and repairs, facilities cost for materials handling, coal preparation, refuse disposal, coal loading, reclamation, and general and administrative costs. Indirect costs include statutory and legally agreed upon fees related to direct extraction of the mineral. The indirect costs are the Federal black lung tax, Federal and State reclamation taxes, property taxes, coal production royalties, and income taxes. The Alpha mines’ historical costs provided a useful reference for MM&A’s cost estimates. The operations are projected on a calendar year basis. MM&A’s projection of annual sales tonnage is summarized in the chart below. While all Alpha coal resource properties deemed by MM&A to have potential for classification as coal reserves were evaluated as part of the economic model, some of those resource areas were determined to be uneconomical in the current market and were therefore excluded from coal reserves as discussed below. Figure 19-1: Projection of Sales Tons

Alpha Metallurgical Resources, Inc. Statement of Coal Resources and Reserves for the Kingston Mining Complex in Accordance with United States SEC Standards as of December 31, 2023 Central Appalachian Coal Basin West Virginia, USA MARSHALL MILLER & ASSOCIATES, INC. 77 Sales revenue is based on the coal price information provided to MM&A by Alpha. Only the revenue from Alpha’s captive mining operations is included in the financial model used for this TRS. The P&L projections of the individual mines of Alpha’s Kingston operations are then consolidated into a P&L and cash flow schedule for further testing of the economics. Projected debt service is excluded from the P&L and cash flow model to determine Enterprise Value of the aggregated entity. The financial model expresses coal sales prices, operating costs, and capital expenditures in current day dollars without adjustment for inflation. Capital expenditures and reclamation costs are included based on engineering estimates for each mine by year. MM&A also included an estimate of administrative costs in the financial projections. Alpha will pay royalties for the various current and projected operations. The royalty rates vary by location as provided by Alpha. The royalty rates were assumed to be 5.0% of the sales revenue. The projection model also includes consolidated income tax calculations at Alpha’s Kingston Division level, incorporating statutory depletion calculations, as well as state income taxes, and a federal tax rate of 21%. To the extent the Alpha mines generate net operating losses for tax purposes, the losses are carried over to offset future taxable income from Alpha mines. The terms “cash flows” and “project cash flows” used in this report refer to after-tax cash flows. Alpha’s projected consolidated annual revenue for the Kingston operations is shown in the chart below. Alpha Metallurgical Resources, Inc. Statement of Coal Resources and Reserves for the Kingston Mining Complex in Accordance with United States SEC Standards as of December 31, 2023 Central Appalachian Coal Basin West Virginia, USA MARSHALL MILLER & ASSOCIATES, INC. 78 Figure 19-2: Consolidated Annual Revenue Projected consolidated revenue, cash costs, and EBITDA for the Kingston operations are expressed in dollars per ton in the graph below. Figure 19-3: Revenue, Cash Costs, and EBITDA

Alpha Metallurgical Resources, Inc. Statement of Coal Resources and Reserves for the Kingston Mining Complex in Accordance with United States SEC Standards as of December 31, 2023 Central Appalachian Coal Basin West Virginia, USA MARSHALL MILLER & ASSOCIATES, INC. 79 The above chart shows an average LOM revenue of $121 per ton, cash costs of $78 to $94 per ton and EBITDA of $27 to $46 per ton. Positive EBITDA per ton averages $38.75 per ton over the life of the operations. Table 19-1 shows LOM tonnage, P&L, and EBITDA for each Alpha mine at Kingston. Table 19-1: Life-of-Mine Tonnage, P&L before Tax, and EBITDA LOM Tonnage LOM Pre Tax P&L P&L Per Ton LOM EBITDA EBITDA Per Ton Underground Mines Kingston Mine #10 (Douglas) 826 $4,820 $5.83 $15,243 $18.44 Sewell 9,722 $231,343 $23.80 $484,302 $49.81 Kingston #2 (Douglas) 806 $21,163 $26.27 $24,663 $30.61 Consolidated Deep Mines 11,354 $257,325 $22.66 $524,208 $46.17 Surface Mines Kingston 21,193 $296,502 $13.99 $500,200 $23.60 Consolidated Surface Mines 21,193 $296,502 $13.99 $500,200 $23.60 HWM Operations Kingston HWM 6,479 $474,147 $73.18 $487,972 $75.32 Consolidated HWMs 6,479 $474,147 $73.18 $487,972 $75.32 Grand Total 39,026 $1,027,974 $26.34 $1,512,381 $38.75 Note: 1) LOM tonnage evaluated in the financial model includes October 2023 through December 2023 production for underground mines and July 2023 through December 2023 production for surface and highwall mines production (369,714 clean tons) which was subtracted from coal reserves to make the effective date of the reserves December 31, 2023. As shown in Table 19-1, all the mines analyzed show positive EBITDA over the LOM. Overall, the Alpha consolidated Kingston operations show positive LOM P&L and EBITDA of $1.0 billion and $1.5 billion, respectively. A breakdown of projected EBITDA for the consolidated Kingston operations is shown in the chart below: Alpha Metallurgical Resources, Inc. Statement of Coal Resources and Reserves for the Kingston Mining Complex in Accordance with United States SEC Standards as of December 31, 2023 Central Appalachian Coal Basin West Virginia, USA MARSHALL MILLER & ASSOCIATES, INC. 80 Figure 19-4: Annual EBITDA 19.1.2 Cash Flow Summary Alpha’s consolidated Kingston cash flow summary in constant dollars, excluding debt service, is shown in Table 19-2 below. Table 19-2: Project Cash Flow Summary (000) YE 12/31 YE 12/31 YE 12/31 YE 12/31 YE 12/31 YE 12/31 Total 2023 2024 2025 2026 2027 2028 Production & Sales tons 39,026 582 2,455 3,273 3,147 3,330 3,902 Total Revenue $4,722,359 $70,436 $291,394 $391,372 $380,133 $396,866 $467,507 EBITDA $1,512,381 $15,715 $70,399 $125,225 $109,058 $118,673 $154,318 Net Income $830,602 $11,143 $41,608 $57,421 $51,545 $58,134 $80,517 Net Cash Provided by Operating Activities $1,315,008 $10,850 $50,112 $98,851 $102,565 $107,427 $129,069 Purchases of Property, Plant, and Equipment ($482,553) $0 ($168,878) ($95,604) ($15,019) ($21,831) ($35,678) Net Cash Flow $832,456 $10,850 ($118,766) $3,247 $87,545 $85,596 $93,391 YE 12/31 YE 12/31 YE 12/31 YE 12/31 YE 12/31 YE 12/31 YE 12/31 2029 2030 2031 2032 2033 2034 2035 Production & Sales tons 3,903 3,737 4,113 3,710 3,738 2,188 824 Total Revenue $474,006 $453,123 $500,576 $449,710 $453,148 $274,266 $104,108 EBITDA $163,309 $147,957 $180,670 $144,116 $145,657 $100,104 $35,960 Net Income $87,368 $73,278 $116,285 $93,108 $89,928 $55,869 $24,815 Net Cash Provided by Operating Activities $141,164 $135,176 $152,526 $133,069 $125,470 $99,141 $43,307 Purchases of Property, Plant, and Equipment ($25,610) ($23,910) ($46,911) ($16,760) ($30,663) ($1,369) ($319) Net Cash Flow $115,554 $111,266 $105,615 $116,309 $94,807 $97,772 $42,988

Alpha Metallurgical Resources, Inc. Statement of Coal Resources and Reserves for the Kingston Mining Complex in Accordance with United States SEC Standards as of December 31, 2023 Central Appalachian Coal Basin West Virginia, USA MARSHALL MILLER & ASSOCIATES, INC. 81 YE 12/31 YE 12/31 YE 12/31 YE 12/31 YE 12/31 YE 12/31 YE 12/31 2036 2037 2038 2039 2040 2041 2042 Production & Sales tons 124 0 0 0 0 0 0 Total Revenue $15,715 $0 $0 $0 $0 $0 $0 EBITDA $4,223 ($1,717) ($679) ($343) ($175) ($91) ($0) Net Income ($4,069) ($3,624) ($1,456) ($736) ($349) ($182) ($0) Net Cash Provided by Operating Activities $11,725 ($15,020) ($5,188) ($2,915) ($1,160) ($1,160) $0 Purchases of Property, Plant, and Equipment $0 $0 $0 $0 $0 $0 $0 Net Cash Flow $11,725 ($15,020) ($5,188) ($2,915) ($1,160) ($1,160) $0 Note: 1) LOM tonnage evaluated in the financial model includes October 2023 through December 2023 production for underground mines and July 2023 through December 2023 production for surface and highwall mines production (369,714 clean tons) which was subtracted from coal reserves to make the effective date of the reserves December 31, 2023. 2) Results shown for 2023 represent 4th quarter only. Consolidated cash flows are driven by annual sales tonnage, which grows from 2.5 million tons in 2024 to a peak of 4.1 million tons in 2031. Between years 2032 and 2036, sales ranges from 0.1 million to 3.7 million tons. Projected consolidated revenue grows from $291.4 million in 2024 to a peak of $500.6 million in 2031. Revenue totals $4.7 billion for the project’s life. Consolidated cash flow from operations is positive throughout the projected operating period, apart from post-production years, due to end-of-mine reclamation spending. Consolidated cash flow from operations peaks at $152.5 million in 2031 and totals $1.3 billion over the project life. Capital expenditures total $337.0 million during the first five years and $482.6 million over the project’s life. Consolidated Kingston net cash flow after tax, but before debt service, is shown by year in the chart below: Alpha Metallurgical Resources, Inc. Statement of Coal Resources and Reserves for the Kingston Mining Complex in Accordance with United States SEC Standards as of December 31, 2023 Central Appalachian Coal Basin West Virginia, USA MARSHALL MILLER & ASSOCIATES, INC. 82 Figure 19-5: Net Cash Flow after Tax (Before Debt Service) LOM Net cash flow is positive for this project. The cash flows after year 2036 are related to end of mine reclamation expenditures, which are accrued over the life of the mines. 19.1.3 Discounted Cash Flow Analysis Cash flow after tax, but before debt service, generated over the life of the project was discounted to NPV at a 16.57% discount rate, which represents MM&A’s estimate of the constant dollar, risk adjusted WACC for market participants if the subject reserves were offered for sale. On an un-levered basis, the NPV of the project cash flows represents the Enterprise Value of the project and amounts to $263.8 million. Alpha is an active producer, and the financial model shows positive net cash flow for each year of the operating life of the Kingston reserves. The pre-feasibility financial model prepared for the TRS was developed to test the economic viability of each coal resource area. The NPV estimate was made for the purpose of confirming the economics for classification of coal reserves and not for purposes of valuing Alpha or its Kingston assets. Mine plans were not optimized, and actual results of the operations may be different, but in all cases, the mine production plan assumes the properties are under competent management. 19.1.4 Sensitivity Analysis Sensitivity of the NPV results to changes in the key drivers is presented in the chart below. The sensitivity study shows the NPV at the 16.57% discount rate when Base Case sales prices, operating

Alpha Metallurgical Resources, Inc. Statement of Coal Resources and Reserves for the Kingston Mining Complex in Accordance with United States SEC Standards as of December 31, 2023 Central Appalachian Coal Basin West Virginia, USA MARSHALL MILLER & ASSOCIATES, INC. 83 costs, capital costs and discount rate are increased and decreased in increments of 5% within a +/- 15% range. Figure 19-6: Sensitivity of NPV As shown, NPV is quite sensitive to changes in sales price and operating cost estimates, and slightly sensitive to changes in capital cost estimates. 20 Adjacent Properties 20.1 Information Used No Proprietary information associated with neighboring properties was used as part of this study. 21 Other Relevant Data and Information MM&A performed a previous evaluation of all the Property in year 2022 for reserves effective as of December 31, 2022, for Alpha based on the (SEC) S-K 1300 regulations. Kingston was previously included in and referred to as Mid-West Virginia Surface. MM&A utilized this former evaluation as the basis of an updated study for the TRS dated December 31, 2023. Alpha Metallurgical Resources, Inc. Statement of Coal Resources and Reserves for the Kingston Mining Complex in Accordance with United States SEC Standards as of December 31, 2023 Central Appalachian Coal Basin West Virginia, USA MARSHALL MILLER & ASSOCIATES, INC. 84 22 Interpretation and Conclusions 22.1 Conclusion Sufficient data has been obtained through various exploration and sampling programs and mining operations to support the geological interpretations of seam structure and thickness for coal horizons situated on the Kingston Property. The data is of sufficient quantity and reliability to support the coal resource and coal reserve estimates in this TRS. The geological data and preliminary feasibility study, which consider mining plans, revenue, and operating and capital cost estimates are sufficient to support the classification of coal reserves provided herein. This geologic evaluation conducted in conjunction with the preliminary feasibility study is sufficient to conclude that the 38.66 Mt of marketable coal reserves identified on the Property are economically mineable under reasonable expectations of market prices for metallurgical coal products, estimated operation costs, and capital expenditures. 22.2 Risk Factors Risks have been identified for operational, technical, and administrative subjects addressed in the Pre- Feasibility Study. A risk matrix has been constructed to present the risk levels for all the risk factors identified and quantified in the risk assessment process. The risk matrix and risk assessment process are modelled to that presented in the Australian and New Zealand Standard on Risk Management (AS/NZS 4360). The purpose of the characterization of the project risk components is to inform the project stakeholders of key aspects of the Alpha projects that can be impacted by events whose consequences can affect the success of the venture. The significance of an impacted aspect of the operation is related to both the probability of occurrence and the severity of the consequences. The initial risk for a risk factor is herein defined as the risk level after the potential impact of the risk factor is addressed by competent and prudent management utilizing control measures readily available. Residual risk for a risk factor is herein defined as the risk level following application of special mitigation measures if management determines that the initial risk level is unacceptable. Initial risk and residual risk can be quantified numerically, derived by the product of values assigned to probability and consequence ranging from very low risk to very high risk. The probability and consequence parameters are subjective numerical estimates made by practiced mine engineers and managers. Both are assigned values from 1 to 5 for which the value 1 represents the lowest probability and least consequence, and the value 5 represents the highest probability and

Alpha Metallurgical Resources, Inc. Statement of Coal Resources and Reserves for the Kingston Mining Complex in Accordance with United States SEC Standards as of December 31, 2023 Central Appalachian Coal Basin West Virginia, USA MARSHALL MILLER & ASSOCIATES, INC. 85 greatest consequence. The products which define the Risk Level are classified from very low to very high. Risk Level Table (R = P x C) Risk Level (R) Very Low (1 to 2) Low (3 to 5) Moderate (6 to 11) High (12 to 19) Very High (20 to 25) Risk aspects identified and evaluated during this assignment total 15. No residual risks are rated Very High. Three (3) residual risks are rated High. Six (6) of the risk aspects could be associated with Moderate residual risk. Four (4) of the risk aspects were attributed Low or Very Low residual risks. 22.2.1 Governing Assumptions The listing of the aspects is not presumed to be exhaustive. Instead that listing is presented based on the experiences of the contributors to the TRS. 1. The probability and consequence ratings are subjectively assigned, and it is assumed that this subjectivity reflects the condition of the active and projected mine operations. 2. The Control Measures shown in the matrices presented in this chapter are not exhaustive. They represent a condensed collection of activities that the author of the risk assessment section has observed to be effective in coal mining scenarios. 3. Mitigation Measures listed for each risk factor of the operation are not exhaustive. The measures listed, however, have been observed by the author to be effective. 4. The monetary values used in ranking the consequences are accepted quantities for the coal mining industry. 22.2.2 Limitations The risk assessment proposed in this report is subject to the limitations of the information currently collected, tested, and interpreted at the time of the writing of the report. 22.2.3 Methodology The numerical quantities (i.e., risk levels) attributable to either “initial” or “residual” risks are derived by the product of values assigned to probability and consequence ranging from very low risk to very high risk. Alpha Metallurgical Resources, Inc. Statement of Coal Resources and Reserves for the Kingston Mining Complex in Accordance with United States SEC Standards as of December 31, 2023 Central Appalachian Coal Basin West Virginia, USA MARSHALL MILLER & ASSOCIATES, INC. 86 R = P x C Where: R = Risk Level P = Probability of Occurrence C = Consequence of Occurrence The Probability (P) and Consequence (C) parameters recited in the formula are subjective numerical estimates made by practiced mine engineers and managers. Both P and C are assigned integer values ranging from 1 to 5 for which the value 1 represents the lowest probability and least consequence, and the value 5 represents the highest probability and greatest consequence. The products (R = P x C) which define the Risk Level, are thereafter classified from very low to very high. Risk Level Table Risk Level (R) Very Low (1 to 2) Low (3 to 5) Moderate (6 to 11) High (12 to 19) Very High (20 to 25) Very high initial risks are unacceptable and require corrective action well in advance of project development. In short, measures must be applied to reduce very high initial risks to a tolerable level. As shown and discussed above, after considering the operational, technical, and administrative actions that have been applied or are available for action when required, the residual risk can be determined. The residual risk provides a basis for the management team to determine if the residual risk level is acceptable or tolerable. If the risk level is determined to be unacceptable, further actions should be considered to reduce the residual risk to acceptable or tolerable levels to provide justification for continuation of the proposed operation. 22.2.4 Development of the Risk Matrix Risks have been identified for the technical, operational, and administrative subjects addressed in the TRS. The risk matrix and risk assessment process are modelled to that presented in the Australian and New Zealand Standard on Risk Management (AS/NZS 4360).

Alpha Metallurgical Resources, Inc. Statement of Coal Resources and Reserves for the Kingston Mining Complex in Accordance with United States SEC Standards as of December 31, 2023 Central Appalachian Coal Basin West Virginia, USA MARSHALL MILLER & ASSOCIATES, INC. 87 22.2.4.1 Probability Level Table Table 22-1: Probability Level Table Category Probability Level (P) 1 Remote Not likely to occur except in exceptional circumstances. <10% 2 Unlikely Not likely to occur; small in degree. 10 - 30% 3 Possible Capable of occurring. 30 - 60% 4 Likely High chance of occurring in most circumstances. 60 - 90% 5 Almost Certain Event is expected under most circumstances; impossible to avoid. >90% The lowest rated probability of occurrence is assigned the value of 1 and described as remote, with a likelihood of occurrence of less than 10 percent. Increasing values are assigned to each higher probability of occurrence, culminating with the value of 5 assigned to incidents considered to be almost certain to occur. 22.2.4.2 Consequence Level Table Table 22-2 lists the consequence levels. Alpha Metallurgical Resources, Inc. Statement of Coal Resources and Reserves for the Kingston Mining Complex in Accordance with United States SEC Standards as of December 31, 2023 Central Appalachian Coal Basin West Virginia, USA MARSHALL MILLER & ASSOCIATES, INC. 88 Table 22-2: Consequence Level Table Correlation of Events in Key Elements of the Project Program to Event Severity Category Category Severity of the Event Financial Impact of the Event Unplanned Loss of Production (Impact on Commercial Operations) Events Impacting on the Environment Events Affecting the Program's Social and Community Relations Resultant Regulatory / Sovereign Risk Events Affecting Occupational Health & Safety 1 Insignificant < USD $0.5 million ≤ 12 hours Insignificant loss of habitat; no irreversible effects on water, soil, and the environment. Occasional nuisance impact on travel. Event recurrence avoided by corrective action through established procedures (Engineering, guarding, training). 2 Minor USD $0.5 million to $2.0 million ≤ 1 day No notable change to species populations; short- term reversible perturbation to ecosystem function. Persistent nuisance impact on travel. Transient adverse media coverage. First aid – lost time. Event recurrence avoided by corrective action thought established procedures. 3 Moderate USD $2.0 million to $10.0 million ≤ 1 week Appreciable change to species population; medium-term (≤10 years) detriment to ecosystem function. Measurable impact on travel and water/air quality. Significant adverse media coverage / transient public outrage. Uncertainty securing or retaining essential approval / license. Medical Treatment – permanent incapacitation Avoiding event recurrence requires modification to established corrective action procedures. Change to regulations (tax; bonds; standards). 4 Major USD $10.0 million to $50.0 million 1 to 2 weeks Change to species population threatening viability; long-term (>10 years) detriment to ecosystem function. Long-term, serious impact on travel and use of water resources; degradation of air quality; sustained and effective public opposition. Suspension / long-delay in securing essential approval / license. Fatality. Avoiding event recurrence requires modification to established corrective action procedures and staff retraining. Change to laws (tax; bonds; standards). 5 Critical >USD $50.0 million >1 month Species extinction; irreversible damage to ecosystem function. Loss of social license. Withdraw / failure to secure essential approval / license. Multiple fatalities. Avoiding event recurrence requires major overhaul of policies and procedures.

Alpha Metallurgical Resources, Inc. Statement of Coal Resources and Reserves for the Kingston Mining Complex in Accordance with United States SEC Standards as of December 31, 2023 Central Appalachian Coal Basin West Virginia, USA MARSHALL MILLER & ASSOCIATES, INC. 89 The lowest rated consequence is assigned the value of 1 and is described as Insignificant Consequence parameters include non-reportable safety incidents with zero days lost accidents, no environmental damage, loss of production or systems for less than 12 hours and cost of less than USD $0.5 million. Increasing values are assigned to each higher consequence, culminating with the value of 5 assigned to critical consequences, the parameters of which include multiple-fatality accidents, major environmental damage, and loss of production or systems for longer than one month and cost of greater than USD $50.0 million. Composite Risk Matrix R = P x C and Color-Code Convention The risk level, defined as the product of probability of occurrence and consequence, ranges in value from 1 (lowest risk) to 25 (maximum risk level). The values are color-coded to facilitate identification of the highest risk aspects. Table 22-3: Risk Matrix P x C = R Consequence (C) Insignificant Minor Moderate Major Critical 1 2 3 4 5 P ro b ab ili ty L ev el ( P ) Remote 1 1 2 3 4 5 Unlikely 2 2 4 6 8 10 Possible 3 3 6 9 12 15 Likely 4 4 8 12 16 20 Almost Certain 5 5 10 15 20 25 22.2.5 Categorization of Risk Levels and Color Code Convention Very high risks are unacceptable and require corrective action. Risk reduction measures must be applied to reduce very high risks to a tolerable level. 22.2.6 Description of the Coal Property The Kingston Mining Complex is in Raleigh, and Fayette Counties, West Virginia – is an active operation with one underground mine and one surface mine. The active underground operation within the Kingston Mining Complex (Kingston 2 Mine) utilizes two continuous mining production sections. This method provides continuity, preserving skilled work groups and enabling effective utilization of existing Alpha Metallurgical Resources, Inc. Statement of Coal Resources and Reserves for the Kingston Mining Complex in Accordance with United States SEC Standards as of December 31, 2023 Central Appalachian Coal Basin West Virginia, USA MARSHALL MILLER & ASSOCIATES, INC. 90 production equipment. The active Kingston surface mining operations employ contour, area and highwall mining methods. 22.2.7 Summary of Residual Risk Ratings Each risk factor is numbered, and a risk level for each is determined by multiplying the assigned probability by the assigned consequence. The risk levels are plotted on a risk matrix to provide a composite view of the Kingston risk profile. The average risk level is 7.6, which is defined as Moderate. Table 22-4: Risk Assessment Matrix C o n se q u en ce Critical >$50 MM Major $10-50MM 9 6,15 Moderate $2-10 MM 1, 12 8, 14 2, 3, 4 Minor $0.5-$2 MM 13 5, 7, 10 Low <$0.5 MM 11 <10% 10-30% 30-60% 60-90% >90% Remote Unlikely Possible Likely Almost Certain 22.2.8 Risk Factors A high-level approach is utilized to characterize risk factors that are similar across a number of the active and proposed mining operations. Risk factors that are unique to a specific operation or are particularly noteworthy are addressed individually. 22.2.8.1 Geological and Coal Resource Coal mining is accompanied by risk that, despite exploration efforts, mining areas will be encountered where geological conditions render extraction of the resource to be uneconomic, or that coal quality characteristics disqualify the product for sale into target markets. Offsetting the geological and coal resource risk are the size of the controlled property which allows flexibility in the selection of mine areas away from areas where coal quality and mineability are less favorable. In addition, many of the underground mines are designed to operate with multiple production sections each, which lessens the immediate impact when one section encounters difficulties. The large reserve areas also provide a mitigation strategy of varying the timing of

Alpha Metallurgical Resources, Inc. Statement of Coal Resources and Reserves for the Kingston Mining Complex in Accordance with United States SEC Standards as of December 31, 2023 Central Appalachian Coal Basin West Virginia, USA MARSHALL MILLER & ASSOCIATES, INC. 91 development of mines to offset expected or encountered adverse conditions, thereby maintaining consistent production and quality. This flexibility requires additional extension or development cost but increases performance consistency. The larger reserve areas will be developed with multiple production sections and the small, replacement production reserve areas provide ready access to alternative locations if geological and coal resource characteristics require abandonment of an active production area. Table 22-5: Geological and Coal Resource Risk Assessment (Risks 1 and 2) Aspect Impact Control Measures Initial Risk Level Mitigation Measures Residual Risk Level P C R P C R Recoverable coal tons recognized to be significantly less than previously estimated. Reserve base is adequate to serve market commitments and respond to opportunities for many years. Local adverse conditions may increase frequency and cost of production unit relocations. Previous and ongoing exploration and extensive regional mining history provide a high level of confidence of coal seam correlation, continuity of the coal seams, and coal resource tons. 1 4 4 Optimize mine plan to increase resource recovery; develop mine plan to provide readily available alternate mining locations to sustain expected production level. 1 3 3 Coal quality locally proves to be lower than initially projected. If uncontrolled, production and sale of coal that is out of specification can result in rejection of deliveries, cancellation of coal sales agreements and damage to reputation. Clean coal quality related to surface mines is justified by historical trends as opposed to exploration data. Exploration and vast experience and history in local coal seams provide confidence in coal quality; limited excursions can be managed with careful product segregation and blending. 3 5 15 Develop mine plan to provide readily available alternate mining locations to sustain expected production level; modify coal sales agreements to reflect coal quality. 3 3 9 22.2.8.2 Environmental Water quality and other permit requirements are subject to modification and such changes could have a material impact on the capability of the operator to meet modified standards or to receive new permits and modifications to existing permits. Permit protests may result in delays or denials to permit applications. Environmental standards and permit requirements have evolved significantly over the past 50 years and to-date, mining operators and regulatory bodies have been able to adapt successfully to evolving environmental requirements. Alpha Metallurgical Resources, Inc. Statement of Coal Resources and Reserves for the Kingston Mining Complex in Accordance with United States SEC Standards as of December 31, 2023 Central Appalachian Coal Basin West Virginia, USA MARSHALL MILLER & ASSOCIATES, INC. 92 Table 22-6: Environmental (Risks 3 and 4) Aspect Impact Control Measures Initial Risk Level Mitigation Measures Residual Risk Level P C R P C R Environmental performance standards are modified in the future. Delays in receiving new permits and modifications to existing permits; cost of testing and treatment of water and soils Work with regulatory agencies to understand and influence final standards; implement testing, treatment, and other actions to comply with new standards. 3 4 12 Modify mining and reclamation plans to improve compliance with new standards while reducing cost of compliance. 3 3 9 New permits and permit modifications are increasingly delayed or denied. Interruption of production and delayed implementation of replacement production from new mines. Comply quickly with testing, treatment and other actions required; continue excellent compliance performance within existing permits. 3 4 12 Establish and maintain close and constructive working relationships with regulatory agencies, local communities, and community action groups. 3 3 9 22.2.8.3 Regulatory Requirements Federal and state health and safety regulatory agencies occasionally amend mine laws and regulations. The impact is industry wide. Mining operators and regulatory agencies have been able to adapt successfully to evolving health and safety requirements. Table 22-7: Regulatory Requirements (Risk 5) Aspect Impact Control Measures Initial Risk Level Mitigation Measures Residual Risk Level P C R P C R Federal and state mine safety and health regulatory agencies amend mine laws and regulations. Cost of training, materials, supplies and equipment; modification of mine examination and production procedures; modification of mining plans. Participate in hearings and workshops, when possible, to facilitate understanding and implementation; work cooperatively with agencies and employees to facilitate implementation of new laws and regulations. 4 3 12 Familiarity and experience with new laws and regulations results in reduced impact to operations and productivity and improved supplies and equipment options. 4 2 8 22.2.8.4 Market and Transportation Most of the current and future production is expected to be directed to domestic and international metallurgical markets. Historically the metallurgical markets have been cyclical and highly volatile.

Alpha Metallurgical Resources, Inc. Statement of Coal Resources and Reserves for the Kingston Mining Complex in Accordance with United States SEC Standards as of December 31, 2023 Central Appalachian Coal Basin West Virginia, USA MARSHALL MILLER & ASSOCIATES, INC. 93 Table 22-8: Market and Transportation (Risk 6) Aspect Impact Control Measures Initial Risk Level Mitigation Measures Residual Risk Level P C R P C R Volatile coal prices drop precipitously. Loss of revenue adversely affects profitability; reduced cash flow may disrupt capital expenditures plan. Cost control measures implemented; capital spending deferred. 4 5 20 High-cost operations closed, and employees temporarily furloughed. 4 4 16 Occasional delay or interruption of rail, river and terminals service may be expected. The operator can minimize the impact of delays by being a preferred customer by fulfilling shipment obligations promptly and maintaining close working relationships. Table 22-9: Market and Transportation (Risk 7) Aspect Impact Control Measures Initial Risk Level Mitigation Measures Residual Risk Level P C R P C R Rail or river transport is delayed; storage and shipping access at river and ocean terminals is not available. Fulfillment of coal sales agreements delayed; limited coal storage at mines may increase cost of rehandling; production may be temporarily idled. Provide adequate storage capacity at mines; coordinate continuously with railroad and shipping companies to respond quickly and effectively to changing circumstances. 4 3 12 Provide back-up storage facility along with personnel, equipment and rehandle plan to sustain production and fulfill sales obligations timely. 4 2 8 22.2.8.5 Mining Plan Occupational health and safety risks are inherent in mining operations. Comprehensive training and retraining programs, internal safety audits and examinations, regular mine inspections, safety meetings, along with support of trained fire brigades and mine rescue teams are among activities that reduce accident risks. Employee health monitoring programs coupled with dust and noise monitoring and abatement reduce health risks to miners. As underground mines are developed and extended, observation of geological, hydrogeological, and geotechnical conditions lead to modification of mine plans and procedures to enable safe work within the mine environments. Highlighted below are selected examples of safety and external factors relevant to Alpha’s operations. 22.2.8.5.1 Methane Management Coalbed methane is potentially present in coal operations; however, the methane concentration in shallow coal seams is at such low levels that it can be readily managed with frequent testing and Alpha Metallurgical Resources, Inc. Statement of Coal Resources and Reserves for the Kingston Mining Complex in Accordance with United States SEC Standards as of December 31, 2023 Central Appalachian Coal Basin West Virginia, USA MARSHALL MILLER & ASSOCIATES, INC. 94 monitoring, vigilance mine ventilation , and routine ventilation surveys. Methane is not expected to be present in most of the Kingston property. Table 22-10: Methane Management (Risk 8) Aspect Impact Control Measures Initial Risk Level Mitigation Measures Residual Risk Level P C R P C R Methane hazard is present in mines operating below drainage. Injury or loss of life; possible ignition of gas and mine explosion; potential loss of mine and equipment temporarily or permanently; additional mine fan, mine power, ventilation, monitoring and examination requirements. Low to moderate levels can be managed with frequent examinations, testing and monitoring within the mine ventilation system. Excellent rock dust maintenance minimizes explosion propagation risk should an ignition occur. 2 5 10 Very high-level methane concentrations may require coal seam degasification and gob degasification where pillar extraction methods are employed. 2 3 6 22.2.8.5.2 Mine Fires Mine fires, once common at mine operations, are rare today. Most active coal miners have not encountered a mine fire. Vastly improved mine power and equipment electrical systems, along with safe mine practices reduce mine fire risks. Crew training and fire brigade support and training improve response for containment and control if a fire occurs. Spontaneous combustion within coal mines, which is the source of most fires that occur today, is not expected to commonly occur at the Alpha property. When spontaneous combustion conditions are present, monitoring systems are employed for early detection and mine plans are designed to facilitate isolation, containment, and rapid extinguishment. Table 22-11: Mine Fires (Risk 9) Aspect Impact Control Measures Initial Risk Level Mitigation Measures Residual Risk Level P C R P C R Mine fire at underground operation or plant stockpile fire. Injury or loss of life; potential loss of mine temporarily or permanently; damage to equipment and mine infrastructure. Inspection and maintenance of mine power, equipment and mine infrastructure; good housekeeping; frequent examination of conveyor belt entries; prompt removal of accumulations of combustible materials. 1 5 5 If spontaneous combustion conditions are present, enhanced monitoring and examination procedures will be implemented; mine design will incorporate features to facilitate isolation, containment, and extinguishment of spontaneous combustion locations. 1 4 4

Alpha Metallurgical Resources, Inc. Statement of Coal Resources and Reserves for the Kingston Mining Complex in Accordance with United States SEC Standards as of December 31, 2023 Central Appalachian Coal Basin West Virginia, USA MARSHALL MILLER & ASSOCIATES, INC. 95 22.2.8.5.3 Ground Control Underground mining exposes miners to the risks of roof falls and rib rolls. Ground control-based risks can be mitigated through effective roof control plans which are supplemented with a strong understanding of future geotechnical conditions. Foremen and crews should be trained to examine the roof, rib and floor conditions and identify pending and immediate hazards. Multiple publicly available software programs can be used to assess pillar sizing and stability. Table 22-12: Ground Control (Risk 10) Aspect Impact Control Measures Initial Risk Level Mitigation Measures Residual Risk Level P C R P C R Ground control issues cause roof failures, rib rolls, floor heave, etc. Injury or loss of life; catastrophic damage to equipment; production interruption. Regular inspection for change and signs of failure. Dynamic design of roof control plan and safety measures to honor observed conditions and exploration- based information; conservative pillar design. 4 3 12 Multiple operating sections to mitigate any lost production; availability of new working areas in case abandonment of section is required; availability of alternative roof control technologies in case of abrupt changes in mining conditions. 4 2 8 22.2.8.5.4 Availability of Supplies and Equipment The industry has periodically had trouble receiving timely delivery of mine supplies and equipment. Availability issues often accompanied increased periods for coal demand. Any future delivery of supplies and equipment delays are expected to be temporary with limited impact on production. Table 22-13: Availability of Supplies and Equipment (Risk 11) Aspect Impact Control Measures Initial Risk Level Mitigation Measures Residual Risk Level P C R P C R Disruption of availability for supplies and equipment. Temporary interruption of production. Force majeure provision in coal sales agreements to limit liability for delayed or lost sales. 3 2 6 Work closely with customers to assure delayed coal delivery rather than cancelled sales; monitory external conditions and increase inventory of critical supplies; accelerate delivery of equipment when possible. 3 1 3 Alpha Metallurgical Resources, Inc. Statement of Coal Resources and Reserves for the Kingston Mining Complex in Accordance with United States SEC Standards as of December 31, 2023 Central Appalachian Coal Basin West Virginia, USA MARSHALL MILLER & ASSOCIATES, INC. 96 22.2.8.5.5 Labor Work stoppage due to labor protests are unlikely and accompanied by limited impact should it occur. Strong employee relations and communications limit the exposure to outside protesters. Loss of supervisors and skilled employees to retirement is inevitable; the impact can be lessened with succession planning, training and mentorship of new employees. Table 22-14: Labor – Work Stoppage (Risk 12) Aspect Impact Control Measures Initial Risk Level Mitigation Measures Residual Risk Level P C R P C R Work stoppage due to slowdowns or secondary boycott activity. Loss of production and coal sales; damaged customer and employee relations; reputation loss. Maintain excellent employee relations and communications; maintain frequent customer communications. 2 3 6 Develop plan for employee communications and legal support to minimize impact of secondary boycott activities. 1 3 3 Table 22-15: Labor – Retirement (Risk 13) Aspect Impact Control Measures Initial Risk Level Mitigation Measures Residual Risk Level P C R P C R Retirement of supervisors and skilled employees. Loss of leadership and critical skills to sustain high levels of safety, maintenance, and productivity. Monitor demographics closely and maintain communications with employees who are approaching retirement age; maintain employee selection and training programs. 3 3 9 Maintain selection of candidates and implementation of in-house or third-party training for electricians and mechanics; develop employee mentoring program. 3 2 6 22.2.8.6 Comprehensive Health and Safety While incorporated in mine plan-based risk factors, effective health and safety programs reduce the risk of accidents, associated loss of production and fines. Currently, coal mining and processing requires a robust health and safety team, consisting of executive level health and safety roles, regional health and safety managers, and multiple operational level health and safety coordinators.

Alpha Metallurgical Resources, Inc. Statement of Coal Resources and Reserves for the Kingston Mining Complex in Accordance with United States SEC Standards as of December 31, 2023 Central Appalachian Coal Basin West Virginia, USA MARSHALL MILLER & ASSOCIATES, INC. 97 Table 22-16: Health and Safety (Risk 14) Aspect Impact Control Measures Initial Risk Level Mitigation Measures Residual Risk Level P C R P C R Failure to attain operations safety standards and associated occurrence of accidents. Injuries and possible loss of life; damage to morale and workforce confidence; loss of production and diminished productivity; regulatory issues, closures, and fines; reputation loss. Safety and loss control awareness training to help employees recognize hazardous conditions and actions; frequent job observations and feedback; periodic employee performance reviews. 2 5 10 Senior management's active participation in safety process; utilization of motivational methods to reinforce company's values and commitment to safety; regular comprehensive safety audits to assure safety standards are maintained. 2 3 6 22.2.8.7 Refuse Disposal Having sufficient refuse disposal capacity is critical to strategic long-term mine development. Production delays can be caused by the lengthy process associated with identifying, designing, and permitting future waste disposal areas. Alpha’s Kingston Mining Complex is actively pursuing additional refuse storage areas to acquire and/or permit to support the LOM reserves for the Property. Table 22-17: Refuse Disposal (Risk 15) Aspect Impact Control Measures Initial Risk Level Mitigation Measures Residual Risk Level P C R P C R Failure to acquire and/or permit refuse storage areas to support reserves Interruption of coal preparation plant operations and increased pressure on mine/plant raw coal storage capacities. Plant design modifications to reduce refuse volumes produced; strategic property acquisition and design of future refuse storage areas. 4 5 20 Addition of plate frame filters in plant; identify, design, and permit additional refuse facilities. 4 4 16 23 Recommendations Alpha is continuing to work both internally and with outside assistance to further define their Resource Base and to Optimize the LOM Plan. 24 References Publicly available information from various State and Federal agencies was used where relevant. Alpha Metallurgical Resources, Inc. Statement of Coal Resources and Reserves for the Kingston Mining Complex in Accordance with United States SEC Standards as of December 31, 2023 Central Appalachian Coal Basin West Virginia, USA MARSHALL MILLER & ASSOCIATES, INC. 98 JOURNEL, A.G., & HUIJBREGTS, CH, J., 1978: Mining Geostatistics, The Blackburn Press Caldwell, New Jersey. 25 Reliance on Information Provided by Registrant A summary of the information provided by Alpha relied upon by MM&A for the purposes of this TRS is provided in Table 25-1. Table 25-1: Information from Registrant Relied Upon by MM&A Category Information Provided by Alpha Report Section Marketing Long-term price forecast used in financial projections 16.2 Legal Mineral control and surface control rights as shown on maps 3.2, 3.3 Environmental Permit and bonding information 17.3

APPENDIX A SUMMARY TABLES Alpha Metallurgical Resources 2023 SEC Update - Kingston Complex Summary of Coal Resource (Short Tons) • Effective December 31, 2023 Appendix A Table 1 Mine/Area Seam Measured Indicated Total Inferred Grand Total Owned Leased Permitted Not Permitted Thermal Met Ash% Sulfur% VM% Kingston Surface 0 0 0 0 0 0 0 0 0 0 0 - - - Kingston HWM 0 0 0 0 0 0 0 0 0 0 0 - - - Sewell Mine Sewell 0 0 0 0 0 0 0 0 0 0 0 - - - Sewell Mine Area Sewell 13,266,000 10,206,000 23,472,000 0 23,472,000 13,864,000 9,609,000 0 23,472,000 0 23,472,000 34 - - Kingston 2 Douglas 2,439,000 751,000 3,189,000 0 3,189,000 0 3,189,000 0 3,189,000 0 3,189,000 12 0.7 22 Kingston 10 Douglas 0 0 0 0 0 0 0 0 0 0 0 - - - Total 15,705,000 10,957,000 26,662,000 0 26,662,000 13,864,000 12,798,000 0 26,662,000 0 26,662,000 - - - Note(1): Resource tons are exclusive of reserve tons (not converted to reserve). Note (2): Coal resources are reported on a dry basis. Surface moisture and inherent moisture are excluded. Note (3): The Property contains 26.66 million tons (Mt) of dry, in-place measured and indicated coal resources exclusive of reserves as of December 31, 2023. Totals may not add due to rounding. Sewell is classified as a indicated due to the lack of drilling and lack of quality. By Reliability Category Quality (Dry Basis) By Market Type Coal Resource (Dry Tons, In Situ) By Control Type By Permit Status

Alpha Metallurgical Resources 2023 SEC Update - Kingston Complex Summary of Coal Reserve (Short Tons) • Effective December 31, 2023 Appendix A Table 2 Mine Seam Proven Probable Total Surface UG Owned Leased Permitted Not Permitted Thermal Met Ash% Sulfur% VM% Kingston Surface 15,737,000 5,167,000 20,904,000 20,904,000 0 0 20,904,000 15,364,000 5,540,000 6,719,000 14,185,000 10 1.0 32 Kingston HWM 5,887,000 512,000 6,399,000 6,399,000 0 0 6,399,000 5,757,000 642,000 0 6,399,000 11 1.1 32 Sewell Mine Sewell 0 9,722,000 9,722,000 0 9,722,000 523,000 9,199,000 0 9,722,000 0 9,722,000 5 0.8 22 Kingston 2 Douglas 689,000 117,000 806,000 0 806,000 109,000 697,000 496,000 309,000 0 806,000 6 0.8 23 Kingston 10 Douglas 739,000 88,000 826,000 0 826,000 0 826,000 407,000 419,000 0 826,000 6 1.1 - Grand Total 23,051,000 15,606,000 38,656,000 27,302,000 11,354,000 632,000 38,025,000 22,024,000 16,633,000 6,719,000 31,937,000 - - - Notes: Marketable reserve tons are reported on a moist basis, including a combination of surface and inherent moisture. Coal quality is based on a weighted average of laboratory data from core holes. The combination of surface and inherent moisture is modeled at 6.0-percent. Douglas seam volatile matter analysis not available. Douglas seam priced as a Mid-Vol. product, consistent with Kingston 2 production. Actual product moisture is dependent upon multiple geological factors, operational factors, and product contract specifications and can exceed 8-percent. As such, the modeled moisture values provide a level of conservatism for reserve reporting. Totals may not add due to rounding. Quality (Dry Basis) By Reliability Category By Control TypeBy Mining Type Demonstrated Coal Reserves (Wet Tons, Washed or Direct Shipped) By Permit Status By Market AMR118 Kingston Tables (2024-02-06).xlsx • MWVS ANR Reserve Report • 2/8/2024 Page 1 of 1 APPENDIX B KINGSTON SURFACE RESOURCES EXCLUSIVE OF RESERVES (PER TON)

Alpha Metallurgical Resources, Inc. Initial Economic Assessment Kingston Complex Resources Exclusive of Reserves (per Ton) Appendix B: Kingston Complex Sewell North UG Douglas Blocks H Douglas Blocks D, F In-Place Resource Tons (not adjusted for Q4 2023 Depletion) 23,472,492 3,048,078 382,283 Potentially Recoverable Tons* 6,497,890 697,125 122,543 Mining Method Deep - CM Deep - CM Deep - CM Assumed Sales Realization at Plant** 140$ 140$ 140$ Inital Capex Estimate to Access Resources*** -$ 2,000,000$ -$ Direct Mining Costs: Labor**** 44.51$ 29.41$ 38.24$ Supplies, Excluding Roof Control 12.22$ 4.99$ 6.50$ Roof Control 10.18$ 4.91$ 6.39$ M&R 15.75$ 7.79$ 9.49$ Power 2.71$ 2.68$ 3.27$ Other 4.62$ 4.03$ 4.91$ Total Direct Cash Costs**** 89.99$ 53.81$ 68.79$ Transporation, Washing, Environmental & G&A Costs: Materials Handling 12.49$ 12.35$ 15.05$ Coal Prep***** 1.50$ 1.50$ 1.50$ Raw Coal Trucking***** 3.39$ -$ -$ Clean Coal Trucking 1.00$ 6.60$ 6.60$ Enviro****** 1.00$ 1.00$ 1.00$ G&A 4.50$ 4.50$ 4.50$ Total Transporation, Washing, Environmental & G&A Costs: 23.88$ 25.95$ 28.65$ Indirect Cash Costs Royalty 7.00$ 7.00$ 7.00$ Black Lung Excise Tax 0.55$ 0.55$ 0.55$ SMCRA 0.12$ 0.12$ 0.12$ State Severance 2.80$ 1.40$ 1.40$ Property Tax & Insurance 1.75$ 1.75$ 1.75$ Total Indirect Cash Costs 12.22$ 10.82$ 10.82$ Non Cash Costs Amoritiztion of Development Capital -$ 2.87$ -$ Depreciation of Initial Equipment and Sustaining Capital 6.73$ 6.91$ 6.73$ Depletion 1.00$ 1.00$ 1.00$ Total Non Cash 7.73$ 10.78$ 7.73$ Total Cash Cost 126.09$ 90.58$ 108.26$ EBITDA 13.91$ 49.42$ 31.74$ Fully Loaded Cost 133.83$ 101.36$ 115.99$ Fully Loaded P&L 6.17$ 38.64$ 24.01$ Passes Resource Iniital Economic Assessment? YES YES YES *Potentially recoverable tons are calculated by applying appropriate modifying factors to in-place resource tonnages **Sales relization represents estimated long range sales price. ***Initial development has already occurred. ****Labor rates are driven based off of super section productivities assuming 250 to 300 feet per unit shift per section. *****Processing assumed to occur at Mammoth Plant for Sewell tons. ******Environmental costs assumed to include permiting, outfall maintenance, etc. AMR118 Kingston Initial Economic Assessment Resources Exclusive of Reserves 123123_sp122123.xlsx Page 1 of 1 APPENDIX C MAPS

Final map located in Kingston Resoures office Final map located in Kingston Resoures office M.A.E. Mine SE No.6 M.A.E.SE No.7Mine Kingston No. 10 Area Kingston No. 2 Area 5000' Scale In Feet 0 Data Point Location Map UG-1 Kingston Area Douglas Seam Alpha Metallurgical Resource, LLC Raleigh & Fayette Counties, West Virginia Coordinate System: West Virginia South State Plane NAD 27 Controlled Underground Reserve / Resource as of 12/31/23 Previous Underground Mining N Resource Inclusive of Reserve / Converted to Reserve Resource Exclusive of Reserve / Not Converted to Reserve 1.5 Scale In Miles 0 Data Point Location Map UG-2 Kingston Area Sewell Seam Alpha Metallurgical Resource, LLC Raleigh & Fayette Counties, West Virginia Coordinate System: West Virginia South State Plane NAD 27 Controlled Underground Reserve / Resource as of 12/31/23 Previous Underground Mining N Resource Inclusive of Reserve / Converted to Reserve Resource Exclusive of Reserve / Not Converted to Reserve

Kingston Plant Coalburg and Stockton N Alpha Metallurgical Resources, LLC Map K-2 Kingston Fayette and Raleigh Counties, Virginia Coordinate System: West Virginia South State Plane NAD 27 3000 Scale In Feet 0 Data Point Location Contour / Area Reserve Controlled Surface Resource Inclusive of Reserve / Converted to Reserve as of 12/31/23 Kingston Plant Upper Winifrede Through Lower Coalburg N Alpha Metallurgical Resources, LLC Map K-3 Kingston Fayette and Raleigh Counties, Virginia Coordinate System: West Virginia South State Plane NAD 27 3000 Scale In Feet 0 Data Point Location Contour / Area Reserve Controlled Surface Resource Inclusive of Reserve / Converted to Reserve as of 12/31/23

Kingston Plant Chilton Rider Through Lower Winifrede N Alpha Metallurgical Resources, LLC Map K-4 Kingston Fayette and Raleigh Counties, Virginia Coordinate System: West Virginia South State Plane NAD 27 3000 Scale In Feet 0 Data Point Location Contour / Area Reserve HWM Reserve Chilton Rider - Chilton A, Chilton A Lower Split, Chilton A Upper Split and Upper Chilton A Highwall Miner Not Shown Controlled Surface Resource Inclusive of Reserve / Converted to Reserve as of 12/31/23 Previous Surface Mining Kingston Plant Lower Hernshaw Through Chilton N Alpha Metallurgical Resources, LLC Map K-5 Kingston Fayette and Raleigh Counties, Virginia Coordinate System: West Virginia South State Plane NAD 27 3000 Scale In Feet 0 Data Point Location Contour / Area Reserve HWM Reserve - Upper Hernshaw Highwall Miner Not Shown Controlled Surface Resource Inclusive of Reserve / Converted to Reserve as of 12/31/23 Previous Surface Mining

Kingston Plant Middle Cedar Grove and Upper Cedar Grove Upper and Lower Splits N Alpha Metallurgical Resources, LLC Map K-6 Kingston Fayette and Raleigh Counties, Virginia Coordinate System: West Virginia South State Plane NAD 27 3000 Scale In Feet 0 Data Point Location Contour / Area Reserve Previous Surface and Underground Mining HWM Reserve - Upper Cedar Grove Upper and Lower Splits Highwall Miner Not Shown Controlled Surface Resource Inclusive of Reserve / Converted to Reserve as of 12/31/23 Kingston Plant Peerless Lower and Upper Splits N Alpha Metallurgical Resources, LLC Map K-7 Kingston Fayette and Raleigh Counties, Virginia Coordinate System: West Virginia South State Plane NAD 27 3000 Scale In Feet 0 Data Point Location Contour / Area Reserve HWM Reserve Previous Surface and Underground Mining Controlled Surface Resource Inclusive of Reserve / Converted to Reserve as of 12/31/23

Kingston Plant Lower and Upper 2 Gas N Alpha Metallurgical Resources, LLC Map K-8 Kingston Fayette and Raleigh Counties, Virginia Coordinate System: West Virginia South State Plane NAD 27 3000 Scale In Feet 0 Data Point Location Contour / Area Reserve HWM Reserve Previous Surface / Underground Mining Controlled Surface Resource Inclusive of Reserve / Converted to Reserve as of 12/31/23 Kingston Plant C 38 C 40 N Alpha Metallurgical Resources, LLC Map K-9 Kingston Powellton Fayette and Raleigh Counties, Virginia Coordinate System: West Virginia South State Plane NAD 27 3000 Scale In Feet 0 Data Point Location Contour / Area Reserve HWM Reserve Previous Surface / Underground Mining Controlled Surface Resource Inclusive of Reserve / Converted to Reserve as of 12/31/23

Kingston Plant Upper Eagle Through Powellton Lower Split N Alpha Metallurgical Resources, LLC Map K-10 Kingston Fayette and Raleigh Counties, Virginia Coordinate System: West Virginia South State Plane NAD 27 3000 Scale In Feet 0 Data Point Location Contour / Area Reserve Previous Surface / Underground Mining Controlled Surface Resource Inclusive of Reserve / Converted to Reserve as of 12/31/23
EX-96.4
16
finalmarforkreportwithap.htm
TECHNICAL REPORT SUMMARY - MARFORK MINING COMPLEX
finalmarforkreportwithap

Alpha Metallurgical Resources, Inc. Statement of Coal Resources and Reserves for the Marfork Mining Complex in Accordance with United States SEC Standards as of December 31, 2023 Central Appalachian Coal Basin West Virginia, USA February 2024 Prepared for: Alpha Metallurgical Resources, Inc. 340 Martin Luther King Jr. Blvd. Bristol, TN 37620 Prepared by: MARSHALL MILLER & ASSOCIATES, INC. 582 Industrial Park Road Bluefield, Virginia 24605 www.mma1.com Alpha Metallurgical Resources, Inc. Statement of Coal Resources and Reserves for the Marfork Mining Complex in Accordance with United States SEC Standards as of December 31, 2023 Central Appalachian Coal Basin West Virginia, USA MARSHALL MILLER & ASSOCIATES, INC. 2 Statement of Use and Preparation This updated Technical Report Summary (TRS) was prepared for the sole use of Alpha Metallurgical Resources, Inc. (Alpha) and its affiliated and subsidiary companies and advisors. Copies or references to information in this report may not be used without the written permission of Alpha. The report provides a statement of coal resources and coal reserves for Alpha, as defined under the United States Securities and Exchange Commission (SEC). The statement is based on information provided by Alpha and reviewed by various professionals within Marshall Miller & Associates, Inc. (MM&A). MM&A professionals who contributed to the drafting of this report meet the definition of Qualified Persons (QPs), consistent with the requirements of the SEC. The information in this TRS related to coal resources and reserves is based on, and fairly represents, information compiled by the QPs. At the time of reporting, MM&A’s QPs have sufficient experience relevant to the style of mineralization and type of deposit under consideration and to the activity they are undertaking to qualify as a QP as defined by the SEC. Certain information set forth in this report contains “forward-looking information”, including production, productivity, operating costs, capital costs, sales prices, and other assumptions. These statements are not guarantees of future performance and undue reliance should not be placed on them. The assumptions used to develop the forward-looking information and the risks that could cause the actual results to differ materially are detailed in the body of this report. Marshall Miller & Associates, Inc. (MM&A) hereby consents (i) to the use of the information contained in this report dated December 31, 2023, relating to estimates of coal resources and coal reserves controlled by Alpha, (ii) to the use of MM&A’s name, any quotations from or summarizations of this TRS in Alpha’s SEC filings, and (iii) to the filing of this TRS as an exhibit to Alpha’s SEC filings. Qualified Person: /s/ Marshall Miller & Associates, Inc. Date: February 9, 2024

Alpha Metallurgical Resources, Inc. Statement of Coal Resources and Reserves for the Marfork Mining Complex in Accordance with United States SEC Standards as of December 31, 2023 Central Appalachian Coal Basin West Virginia, USA MARSHAL MILLER & ASSOCIATES, INC. 3 Table of Contents 1 Executive Summary .................................................................................................................... 9 1.1 Property Description ..................................................................................................... 9 1.2 Ownership ................................................................................................................... 10 1.3 Geology ....................................................................................................................... 10 1.4 Exploration Status ....................................................................................................... 11 1.5 Operations and Development ..................................................................................... 11 1.6 Mineral Resource ........................................................................................................ 12 1.7 Mineral Reserve .......................................................................................................... 13 1.8 Capital Summary ......................................................................................................... 14 1.9 Operating Costs ........................................................................................................... 15 1.10 Economic Evaluation ................................................................................................... 16 1.10.1 Discounted Cash Flow Analysis ...................................................................... 20 1.10.2 Sensitivity Analysis ......................................................................................... 20 1.11 Permitting ................................................................................................................... 21 1.12 Conclusion and Recommendations .............................................................................. 21 2 Introduction ............................................................................................................................. 21 2.1 Registrant and Terms of Reference ............................................................................. 21 2.2 Information Sources .................................................................................................... 22 2.3 Scope of Assignment ................................................................................................... 22 2.4 Personal Inspections ................................................................................................... 23 3 Property Description ................................................................................................................ 23 3.1 Location ...................................................................................................................... 23 3.2 Titles, Claims or Leases ................................................................................................ 24 3.3 Mineral Rights ............................................................................................................. 25 3.4 Encumbrances ............................................................................................................. 26 3.5 Other Risks .................................................................................................................. 26 4 Accessibility, Climate, Local Resources, Infrastructure and Physiography ............................... 26 4.1 Topography, Elevation, and Vegetation ....................................................................... 26 4.2 Access and Transport .................................................................................................. 26 4.3 Proximity to Population Centers .................................................................................. 27 4.4 Climate and Length of Operating Season ..................................................................... 27 4.5 Infrastructure .............................................................................................................. 27 5 History ...................................................................................................................................... 28 Alpha Metallurgical Resources, Inc. Statement of Coal Resources and Reserves for the Marfork Mining Complex in Accordance with United States SEC Standards as of December 31, 2023 Central Appalachian Coal Basin West Virginia, USA MARSHAL MILLER & ASSOCIATES, INC. 4 5.1 Previous Operation ..................................................................................................... 28 5.2 Previous Exploration ................................................................................................... 28 6 Geological Setting, Mineralization and Deposit ....................................................................... 28 6.1 Regional, Local and Property Geology ......................................................................... 28 6.2 Mineralization ............................................................................................................. 29 6.3 Deposits ...................................................................................................................... 31 7 Exploration ............................................................................................................................... 32 7.1 Nature and Extent of Exploration ................................................................................ 32 7.2 Drilling Procedures ...................................................................................................... 35 7.3 Hydrology .................................................................................................................... 35 7.4 Geotechnical Data ....................................................................................................... 36 8 Sample Preparation Analyses and Security .............................................................................. 36 8.1 Prior to Sending to the Lab .......................................................................................... 36 8.2 Lab Procedures............................................................................................................ 37 9 Data Verification ...................................................................................................................... 37 9.1 Procedures of Qualified Person ................................................................................... 37 9.2 Limitations .................................................................................................................. 38 9.3 Opinion of Qualified Person ........................................................................................ 38 10 Mineral Processing and Metallurgical Testing .......................................................................... 38 10.1 Testing Procedures ...................................................................................................... 38 10.2 Relationship of Tests to the Whole .............................................................................. 39 10.3 Lab Information ........................................................................................................... 39 10.4 Relevant Results .......................................................................................................... 39 11 Mineral Resource Estimates ..................................................................................................... 40 11.1 Assumptions, Parameters and Methodology ............................................................... 40 11.1.1 Geostatistical Analysis ................................................................................... 42 11.2 Resources Exclusive of Reserves .................................................................................. 46 11.2.1 Initial Economic Assessment .......................................................................... 47 11.3 Qualified Person’s Estimates ....................................................................................... 49 11.4 Qualified Person’s Opinion .......................................................................................... 50 12 Mineral Reserve Estimates ....................................................................................................... 51 12.1 Assumptions, Parameters and Methodology ............................................................... 51 12.2 Mineral Reserves ......................................................................................................... 52 12.2.1 Surface Reserves ............................................................................................ 53 12.2.2 Underground Reserves .................................................................................. 54

Alpha Metallurgical Resources, Inc. Statement of Coal Resources and Reserves for the Marfork Mining Complex in Accordance with United States SEC Standards as of December 31, 2023 Central Appalachian Coal Basin West Virginia, USA MARSHAL MILLER & ASSOCIATES, INC. 5 12.2.3 Laurel Hernshaw (Map 2)............................................................................... 54 12.2.4 Coon/Ellis Upper Cedar Grove (UCG) (Map 3) ................................................ 54 12.2.5 Titan Middle Cedar Grove (MCG) (Map 4) ...................................................... 54 12.2.6 Low Gap Middle Cedar Grove (MCG) (Map 4) ................................................ 55 12.2.7 Black King Lower Cedar Grove (LCG) (Map 5) ................................................. 55 12.2.8 Berwind Area Lower Cedar Grove Seam (LCG) (Map 5) .................................. 55 12.2.9 Bee Tree Powellton Seam (Map 6) ................................................................. 55 12.2.10 Marfork/Workman Area Upper Eagle (Map 7A) ............................................. 55 12.2.11 Panther Eagle Seam (Map 9) .......................................................................... 55 12.2.12 Horse Creek Eagle Seam (Map 9) ................................................................... 56 12.2.13 Black Eagle Mine - Eagle Seam (Map 9) .......................................................... 56 12.2.14 Dow Fork Eagle Seam (Map 9) ....................................................................... 56 12.2.15 Marfork/Workman Glen Alum Tunnel Seam (Map 10) ................................... 56 12.2.16 Workman Beckley Seam (Map 11) ................................................................. 56 12.3 Qualified Person’s Estimates ....................................................................................... 57 12.4 Qualified Person’s Opinion .......................................................................................... 58 13 Mining Methods ....................................................................................................................... 58 13.1 Geotech and Hydrology ............................................................................................... 58 13.2 Production Rates ......................................................................................................... 58 13.3 Mining Related Requirements ..................................................................................... 62 13.3.1 Underground ................................................................................................. 62 13.4 Required Equipment and Personnel ............................................................................ 63 13.4.1 Surface Mines ................................................................................................ 63 13.4.2 Underground Mines ....................................................................................... 66 14 Processing and Recovery Methods ........................................................................................... 73 14.1 Description or Flowsheet............................................................................................. 73 14.2 Requirements for Energy, Water, Material and Personnel ........................................... 73 15 Infrastructure ........................................................................................................................... 74 15.1 Marfork Preparation Plant ........................................................................................... 74 15.2 Workman’s Creek Coal Handling Facility ...................................................................... 76 15.3 Underground Conveyor Coal Transport System ........................................................... 77 15.5 Proposed Coal Handling Facility on Browns Branch of West Fork ................................ 78 15.6 Black Eagle Mine and Browns Branch Coal Handling to Marfork Preparation Plant...... 79 16 Market Studies ......................................................................................................................... 79 16.1 Market Description ..................................................................................................... 79 16.2 Price Forecasts ............................................................................................................ 80 16.3 Contract Requirements ............................................................................................... 80 Alpha Metallurgical Resources, Inc. Statement of Coal Resources and Reserves for the Marfork Mining Complex in Accordance with United States SEC Standards as of December 31, 2023 Central Appalachian Coal Basin West Virginia, USA MARSHAL MILLER & ASSOCIATES, INC. 6 17 Environmental Studies, Permitting and Plans, Negotiations or Agreements with Local Individuals ....................................................................................................................... 81 17.1 Results of Studies ........................................................................................................ 81 17.2 Requirements and Plans for Waste Disposal ................................................................ 81 17.3 Permit Requirements and Status ................................................................................. 82 17.4 Local Plans, Negotiations or Agreements ..................................................................... 85 17.5 Mine Closure Plans ...................................................................................................... 85 17.6 Qualified Person’s Opinion .......................................................................................... 85 18 Capital and Operating Costs ..................................................................................................... 85 18.1 Capital Cost Estimate................................................................................................... 85 18.2 Operating Cost Estimate .............................................................................................. 89 19 Economic Analysis .................................................................................................................... 90 19.1 Economic Evaluation ................................................................................................... 90 19.1.1 Introduction................................................................................................... 90 19.1.2 Cash Flow Summary ....................................................................................... 95 19.1.3 Discounted Cash Flow Analysis ...................................................................... 97 19.1.4 Sensitivity Analysis ......................................................................................... 98 20 Adjacent Properties.................................................................................................................. 98 20.1 Information Used ........................................................................................................ 98 21 Other Relevant Data and Information ...................................................................................... 99 22 Interpretation and Conclusions ................................................................................................ 99 22.1 Conclusion................................................................................................................... 99 22.2 Risk Factors ................................................................................................................. 99 22.2.1 Governing Assumptions ............................................................................... 100 22.2.2 Limitations ................................................................................................... 101 22.2.3 Methodology ............................................................................................... 101 22.2.4 Development of the Risk Matrix .................................................................. 102 22.2.5 Categorization of Risk Levels and Color Code Convention ............................ 104 22.2.6 Description of the Coal Property .................................................................. 104 22.2.7 Summary of Residual Risk Ratings ................................................................ 105 22.2.8 Risk Factors .................................................................................................. 105 23 Recommendations ................................................................................................................. 112 24 References.............................................................................................................................. 112 25 Reliance on Information Provided by Registrant ................................................................... 112

Alpha Metallurgical Resources, Inc. Statement of Coal Resources and Reserves for the Marfork Mining Complex in Accordance with United States SEC Standards as of December 31, 2023 Central Appalachian Coal Basin West Virginia, USA MARSHAL MILLER & ASSOCIATES, INC. 7 FIGURES (IN REPORT) Figure 1-1: Alpha’s Marfork Property Location Map .......................................................................... 10 Figure 1-2: Projected Capital Expenditures – Consolidated Marfork Mining Complex ........................ 15 Figure 1-3: Marfork Mining Complex Operating Costs ....................................................................... 16 Figure 1-4: Sensitivity of NPV ............................................................................................................ 20 Figure 6-1: Workman Creek Stratigraphic Column ............................................................................. 30 Figure 6-2: Marfork Stratigraphic Column ......................................................................................... 31 Figure 7-1: Workman Creek Cross-Section......................................................................................... 33 Figure 7-2: Marfork Underground Mine Cross-Section ...................................................................... 34 Figure 11-1: Histogram of the Total Seam Thickness for the Eagle Seam Present in the Marfork Mining Complex .............................................................................................................. 43 Figure 11-2: Scatter plot of the Total Seam Thickness for the Eagle Seam Present in the Marfork Mining Complex .............................................................................................................. 43 Figure 11-3: Variogram of the Total Seam Thickness for the Eagle Seam Present in the Marfork Mining Complex .............................................................................................................. 44 Figure 11-4: Result of DHSA for the Eagle Seam Present in the Marfork Mining Complex ................... 45 Figure 11-5: Results of Initial Economic Assessment .......................................................................... 49 Figure 13-1: Workman Creek Surface Mine and Permit Areas Aerial View ......................................... 63 Figure 15-1: Workman Creek Surface Facilities .................................................................................. 75 Figure 15-2: Marfork Facilities ........................................................................................................... 75 Figure 15-3: Workman’s Creek Coal Handling Facility ........................................................................ 76 Figure 15-4: Underground Conveyor Coal Transport System ............................................................. 78 Figure 18-1: Projected Capital Expenditures – Consolidated Marfork Operations .............................. 86 Figure 18-2: Marfork Operating Costs ............................................................................................... 90 Figure 19-1: Projection of Sales Tons ................................................................................................. 91 Figure 19-2: Consolidated Annual Revenue ....................................................................................... 92 Figure 19-3: Revenue, Cash Costs, and EBITDA .................................................................................. 93 Figure 19-4: Annual EBITDA ............................................................................................................... 95 Figure 19-5: Net Cash Flow after Tax (Before Debt Service) ............................................................... 97 Figure 19-6: Sensitivity of NPV .......................................................................................................... 98 TABLES (IN REPORT) Table 1-1: Coal Resources Summary as of December 31, 2023 .......................................................... 12 Table 1-2: Coal Reserves Summary (Marketable Sales Basis) as of December 31, 2023 ..................... 14 Table 1-3: Life-of-Mine Tonnage, P&L before Tax, and EBITDA .......................................................... 17 Table 1-4: Project Cash Flow Summary (000) ..................................................................................... 18 Table 2-1: Information Provided to MM&A by Alpha ......................................................................... 22 Table 3-1: Mineral Control – Mid-West Virginia (Marfork) Complex .................................................. 24 Table 11-1: General Reserve & Resource Criteria .............................................................................. 41 Table 11-2: DHSA Results Summary for Radius from a Central Point ................................................. 45 Table 11-3: Results of Initial Economic Assessment ($/ton) ............................................................... 48 Alpha Metallurgical Resources, Inc. Statement of Coal Resources and Reserves for the Marfork Mining Complex in Accordance with United States SEC Standards as of December 31, 2023 Central Appalachian Coal Basin West Virginia, USA MARSHAL MILLER & ASSOCIATES, INC. 8 Table 11-4: Coal Resources Summary as of December 31, 2023 ........................................................ 49 Table 12-1: Workman Creek Coal Reserves Summary (Marketable Sales Basis) as of December 31, 2023 ................................................................................................................................ 53 Table 12-2: Coal Reserves Summary (Marketable Sales Basis) as of December 31, 2023 ................... 57 Table 13-1: Marfork Mining Complex Underground Mine Production Schedule (x 1,000 Saleable Tons) ............................................................................................................................... 59 Table 13-2: Marfork Mining Complex Surface Mine Production Schedule (x 1,000 Saleable Tons) ..... 61 Table 13-3: Marfork Mining Complex Highwall Mine Production Schedule (x 1,000 Saleable Tons) ... 62 Table 15-1: Browns Branch Coal Handling Facility ............................................................................. 78 Table 15-2: Black Eagle Coal Handling Facility.................................................................................... 79 Table 16-1: Quality Specifications...................................................................................................... 79 Table 16-2: Price Forecasts ................................................................................................................ 80 Table 17-1: Marfork Refuse Disposal Summary ................................................................................. 81 Table 17-2: Marfork Mining Permits .................................................................................................. 84 Table 18-1: Summary of Capital Expenditures Schedule by Mine....................................................... 87 Table 18-2: Estimated Coal Production Taxes and Sales Costs ........................................................... 89 Table 19-1: Life-of-Mine Tonnage, P&L before Tax, and EBITDA ........................................................ 94 Table 19-2: Project Cash Flow Summary (000) ................................................................................... 95 Table 22-1: Probability Level Table .................................................................................................. 102 Table 22-2: Consequence Level Table .............................................................................................. 103 Table 22-3: Risk Matrix .................................................................................................................... 104 Table 22-4: Risk Assessment Matrix ................................................................................................ 105 Table 22-5: Geological and Coal Resource Risk Assessment (Risks 1 and 2) ..................................... 106 Table 22-6: Environmental (Risks 3 and 4) ....................................................................................... 107 Table 22-7: Regulatory Requirements (Risk 5) ................................................................................. 107 Table 22-8: Market and Transportation (Risk 6)............................................................................... 108 Table 22-9: Market and Transportation (Risk 7)............................................................................... 108 Table 22-10: Methane Management (Risk 8) ................................................................................... 109 Table 22-11: Mine Fires (Risk 9)....................................................................................................... 109 Table 22-12: Ground Control (Risk 10) ............................................................................................. 110 Table 22-13: Availability of Supplies and Equipment (Risk 11) ......................................................... 110 Table 22-14: Labor – Work Stoppage (Risk 12) ................................................................................ 111 Table 22-15: Labor – Retirement (Risk 13) ....................................................................................... 111 Table 22-16: Health and Safety (Risk 14) ......................................................................................... 111 Table 25-1: Information from Registrant Relied Upon by MM&A .................................................... 112 Appendices A .............................................................................................................................. Summary Tables B ......................................... Initial Economic Assessment Resources Exclusive of Reserves (per Ton) C ............................................................................................................................................... Maps

Alpha Metallurgical Resources, Inc. Statement of Coal Resources and Reserves for the Marfork Mining Complex in Accordance with United States SEC Standards as of December 31, 2023 Central Appalachian Coal Basin West Virginia, USA MARSHAL MILLER & ASSOCIATES, INC. 9 1 Executive Summary 1.1 Property Description Alpha Metallurgical Resources, Inc. (Alpha) authorized Marshall Miller & Associates, Inc. (MM&A) to prepare this updated Technical Report Summary (TRS) of its controlled coal reserves located at the Marfork Mining Complex (Marfork or the Property) in Raleigh, Boone, Fayette and Kanawha Counties, West Virginia. Coal resources and coal reserves are herein reported in imperial units of measurement. The Marfork Mining Complex is comprised of the Marfork underground operations and the Workman Creek surface mines. Active surface facilities for the Marfork operations are located along Little Marsh Fork, a tributary of the Big Coal River adjacent to a CSX rail line. Active surface facilities for Workman Creek are located in Raleigh County, West Virginia, located along Workman Creek, a tributary to Clear Fork along State Route 1. Both surface facilities are about 30 miles northwest of Beckley, West Virginia, the county seat of Raleigh County (see Figure 1-1). Marfork properties are included within Alpha’s Mid-West Virginia mineral holdings that are composed of approximately 244,275 total acres. There are approximately 55 separate leases for the Mid-West Virginia mineral holdings group, which includes Marfork resource area. Alpha Metallurgical Resources, Inc. Statement of Coal Resources and Reserves for the Marfork Mining Complex in Accordance with United States SEC Standards as of December 31, 2023 Central Appalachian Coal Basin West Virginia, USA MARSHAL MILLER & ASSOCIATES, INC. 10 Figure 1-1: Alpha’s Marfork Property Location Map 1.2 Ownership The Marfork Property involves a complex combination of previous ownership. Predecessors of Alpha, namely Alpha Natural Resources (Alpha) and Massey Energy (Massey) previously held mining rights on most of the Property. 1.3 Geology Operations at the Marfork Mining Complex currently extract coal from the Eagle and Glen Alum Tunnel coal seams by the underground continuous mining method. Run-of-mine coal is subsequently transported to the Marfork Preparation Plant for processing. Currently identified underground coal resources and reserves are in the Chilton, Hernshaw, Upper Cedar Grove, Middle Cedar Grove, Lower Cedar Grove, Peerless, Powellton, Eagle, Glen Alum Tunnel, Beckley, and Fire Creek seams. Workman

Alpha Metallurgical Resources, Inc. Statement of Coal Resources and Reserves for the Marfork Mining Complex in Accordance with United States SEC Standards as of December 31, 2023 Central Appalachian Coal Basin West Virginia, USA MARSHAL MILLER & ASSOCIATES, INC. 11 Creek surface mines recover coal from the Upper, Middle and Lower Clarion; Stockton, Upper Coalburg, Coalburg, Lower Coalburg, Upper Winifrede Rider, Upper Winifrede, Winifrede, Lower Winifrede, Upper Chilton A, Middle Chilton A , Chilton A Upper Split, Chilton A Lower Split, Chilton A, Chilton Rider, Upper Chilton, Lower Chilton, Chilton, Upper Hernshaw, Lower Hernshaw, Upper Cedar Grove Upper Split, Upper Cedar Grove Lower Split, Middle Cedar Grove, Lower Cedar Grove Upper Split, Lower Cedar Grove, Peerless Upper Split, Peerless Lower Split, Peerless C, Upper No. 2 Gas, Lower No. 2 Gas, Powellton, Lower Powellton, Powellton Lower Split, Powellton Lower Split Upper, Upper Eagle Rider 2, Powellton Lower Split Lower, Upper Eagle Rider, Upper Eagle, Eagle A, Eagle Upper Split, Eagle Lower Split, Eagle, and Little Eagle. These coal seams are historically utilized as coking coal. Strata on the Property reside in the Pennsylvanian-aged (approximately 290 to 330 million years ago) Kanawha and New River Formations. Due to the high value of these coking coals, all the seams have been extensively mined in the past. The rock formations between the coal seams are characterized by large proportions of sandstone interspersed with shale units. The coal seams reach the highest structural elevations along the southeastern margin of the Property, generally dipping toward the northwest. 1.4 Exploration Status The Property has been extensively explored, largely by drilling using continuous coring and rotary drilling methods but also by obtaining coal measurements at mine exposures, and by downhole geophysical methods. A significant amount of historical data was acquired or generated by previous owners of the Property. These sources comprise the primary data used in the evaluation of the coal resources and coal reserves on the Property. MM&A examined the data available for the evaluation and incorporated all pertinent information into this TRS. Where data appeared to be anomalous or not representative, that data was excluded from the digital databases and subsequent processing by MM&A. Ongoing exploration has been carried out by Alpha since acquiring the Marfork Mining Complex. The Alpha acquired exploration data has been consistent with past drilling activities. 1.5 Operations and Development As of December 31, 2023, the Marfork Mining Complex is comprised of surface and underground operations. Active surface mine operations at Workman Creek, including the Long Ridge, Center Contour, Turkeyfoot, Eagle #2 and Middle Ridge permits. Underground mine operations were active at the Black Eagle Mine, Panther Eagle, and Horse Creek mines; all located in the Eagle coal seam and the Glen Alum mine operating in the Glen Alum Tunnel seam. The idle Slabcamp mine in the Stockton coal seam is a part of Mammoth Complex and is not a part of this study. The Dow Fork mine is currently in the conceptual stage and is planned to operate in the Eagle seam. The active Eagle seam mines and the Dow Fork mine produce, or will produce, a High-Volatile metallurgical coal blend. The Glen Alum mine produces a Mid-Volatile product. Alpha Metallurgical Resources, Inc. Statement of Coal Resources and Reserves for the Marfork Mining Complex in Accordance with United States SEC Standards as of December 31, 2023 Central Appalachian Coal Basin West Virginia, USA MARSHAL MILLER & ASSOCIATES, INC. 12 Based on the mine plans developed as part of this TRS, annual deep mine production peaks at 2.71 million tons in 2052. Underground reserves will be depleted in 2065. Surface mine production peaks at 2.82 million tons in 2025 and surface reserves will be depleted in 2032. Highwall mine production peaks at 0.61 million tons in 2029 and those reserves are scheduled to be depleted in 2032. In addition to the mines, the Marfork Mining Complex also includes the Marfork Preparation Plant. The plant site includes raw coal storage, clean coal storage, a centrifugal dryer, a railroad loadout as well as two refuse disposal areas. Low-density cyclones are used for intermediate separation and froth flotation and spirals are utilized for fine coal separation. The plant has a feed rate capacity of 2,400 raw tons per hour and produces 7.25% ash at less than 1.07% sulfur. For year-end 2023, the average utilization rate of the Marfork Preparation Plant was 70.0%. Coal Production is also conveyed from Workman Creek, through underground mine works to the Marfork Preparation Plant for processing, and shipment on the CSX railway. 1.6 Mineral Resource A coal resource estimate, summarized in Table 1-1 was prepared as of December 31, 2023, for property controlled by Alpha. Table 1-1: Coal Resources Summary as of December 31, 2023 Coal Resource (Dry Tons, In Situ) Area/Mine Seam Measured Indicated Inferred Total Inclusive of Reserve (Converted to Reserve) Workman Creek Surface Multi 18,115,000 391,000 9,000 18,515,000 Workman Creek HWM Multi 12,734,000 190,000 0 12,924,000 Laurel Area Hernshaw 19,513,000 5,902,000 0 25,415,000 Coon Cedar Grove Upper Cedar Grove 4,264,000 182,000 0 4,446,000 Ellis Cedar Grove Upper Cedar Grove 4,869,000 31,000 0 4,899,000 Titan MCG Middle Cedar Grove 10,849,000 4,649,000 0 15,498,000 Low Gap MCG Middle Cedar Grove 1,920,000 14,000 0 1,935,000 Black King I Lower Cedar Grove 20,019,000 3,428,000 0 23,447,000 Berwind Lower Cedar Grove 6,315,000 251,000 0 6,566,000 Beetree Powellton 1,005,000 333,000 0 1,338,000 Workman Upper Eagle 3,712,000 114,000 0 3,826,000 Black Eagle Eagle 24,876,000 12,506,000 2,000 37,384,000 Dow Fork Eagle 33,789,000 15,524,000 0 49,312,000 Panther Eagle Eagle 6,746,000 1,474,000 0 8,220,000 Horse Creek Eagle 1,303,000 326,000 0 1,630,000 Glen Alum Tunnel Glen Alum Tunnel 9,675,000 3,929,000 217,000 13,821,000 Workman Beckley 50,253,000 43,362,000 0 93,615,000 Subtotal Subtotal 229,957,000 92,606,000 228,000 322,790,000

Alpha Metallurgical Resources, Inc. Statement of Coal Resources and Reserves for the Marfork Mining Complex in Accordance with United States SEC Standards as of December 31, 2023 Central Appalachian Coal Basin West Virginia, USA MARSHAL MILLER & ASSOCIATES, INC. 13 Coal Resource (Dry Tons, In Situ) Area/Mine Seam Measured Indicated Inferred Total Exclusive of Reserve Workman Creek Surface Multi 3,981,000 848,000 5,000 4,834,000 Workman Creek HWM Multi 0 0 0 0 Elk Run - Seng Creek Chilton 14,555,000 11,353,000 0 25,907,000 Black King Upper Cedar Grove 25,826,000 2,064,000 0 27,891,000 Titan Middle Cedar Grove 393,000 8,000 0 401,000 Black King LCG Lower Cedar Grove 4,589,000 644,000 0 5,234,000 Powellon 10-B Powellton 3,533,000 211,000 0 3,744,000 Slip Ridge Powellton Powellton 656,000 17,000 0 673,000 Laurel Branch Upper Eagle 6,880,000 1,863,000 0 8,743,000 Marfork Eagle A 14,547,000 5,555,000 8,000 20,109,000 Dow Fork Eagle 0 0 1,320,000 1,320,000 Panther Eagle Eagle 2,762,000 495,000 0 3,257,000 Sycamore Eagle 7,278,000 896,000 0 8,173,000 Glen Alum Tunnel Glen Alum Tunnel 1,936,000 1,747,000 223,000 3,906,000 Workman Beckley 2,934,000 5,605,000 57,000 8,596,000 Mountain Laurel Beckley 14,800,000 14,565,000 55,000 29,420,000 Mountain Laurel Fire Creek 4,389,000 1,506,000 0 5,895,000 Subtotal Subtotal 109,059,000 47,377,000 1,667,000 158,103,000 Grand Total Inclusive of Reserve 229,957,000 92,606,000 228,000 322,790,000 Exclusive of Reserve 109,059,000 47,377,000 1,667,000 158,103,000 Grand Total 339,016,000 139,983,000 1,895,000 480,894,000 Note (1): Resource tons are inclusive of reserve tons since they include the in-situ tons from which recoverable coal reserves are derived. Note (2): Coal resources are reported on a dry basis. Surface moisture and inherent moisture are excluded. Note (3): The Property contains 156.4 million tons (Mt) of dry, in-place measured and indicated coal resources exclusive of reserves (not converted to reserve) as of December 31, 2023. Totals may not add due to rounding. See Appendix A for detailed breakdown. 1.7 Mineral Reserve The Resource estimate outlined in Table 1-1 inclusive of reserves has been used as the basis for this Reserve calculation, which utilizes a reasonable Preliminary Feasibility Study, a Life-of Mine (LOM) Mine Plan and practical recovery factors. Production modeling was completed with an effective start date of October 1, 2023 for the underground mines, and July 1, 2023 for the surface mines. Factors that would typically preclude conversion of a coal resource to coal reserve, include the following: inferred resource classification; absence of coal quality; poor mine recovery; lack of access; geological encumbrances associated with overlying and underlying strata; seam thinning; structural complication; and insufficient exploration have all been considered. Reserve consideration excludes those portions of the resource area that exhibit geological and operational encumbrances. Proven and probable coal reserves were derived from the defined in-situ coal resource considering relevant processing, economic (including technical estimates of capital, revenue, and cost), marketing, legal, environmental, socioeconomic, and regulatory factors. The proven and probable coal reserves on the Property are summarized below in Table 1-2. Alpha Metallurgical Resources, Inc. Statement of Coal Resources and Reserves for the Marfork Mining Complex in Accordance with United States SEC Standards as of December 31, 2023 Central Appalachian Coal Basin West Virginia, USA MARSHAL MILLER & ASSOCIATES, INC. 14 Table 1-2: Coal Reserves Summary (Marketable Sales Basis) as of December 31, 2023 Demonstrated Coal Reserves (Wet Tons, Washed or Direct Shipped) Quality (Dry Basis) By Reliability Category By Permit Status By Control Type Seam Proven Probable Total Permitted Not Permitted Owned Leased Ash % Sulfur % VM % Workman Creek Surface 0 15,495,000 15,495,000 15,495,000 0 67,000 15,427,000 10 0.9 - Workman Creek HWM 4,249,000 64,000 4,313,000 3,544,000 769,000 0 4,313,000 6 0.9 - Hernshaw 3,562,000 1,021,000 4,583,000 0 4,583,000 0 4,583,000 5 0.8 36 Upper Cedar Grove 1,666,000 25,000 1,691,000 1,691,000 0 0 1,691,000 6 1.0 35 Middle Cedar Grove 632,000 5,238,000 5,870,000 3,932,000 1,938,000 0 5,870,000 6 1.1 37 Lower Cedar Grove 10,634,000 1,437,000 12,071,000 4,509,000 7,562,000 0 12,071,000 5 0.8 36 Powellton 336,000 116,000 452,000 275,000 177,000 0 452,000 2 0.8 - Upper Eagle 1,016,000 6,000 1,021,000 0 1,021,000 0 1,021,000 6 0.8 30 Eagle 16,052,000 7,418,000 23,470,000 16,997,000 6,474,000 368,000 23,102,000 5 0.8 33 Glen Alum Tunnel 1,847,000 708,000 2,555,000 1,285,000 1,269,000 219,000 2,335,000 5 0.9 26 Beckley 13,339,000 12,793,000 26,132,000 2,924,000 23,207,000 1,558,000 24,573,000 5 0.9 20 Grand Total 53,333,000 44,320,000 97,652,000 50,651,000 47,001,000 2,214,000 95,438,000 6 0.9 30 Notes: Marketable reserve tons are reported on a moist basis, including a combination of surface and inherent moisture. Coal quality is based on a weighted average of laboratory analysis from core holes. The combination of surface and inherent moisture is modeled at 6.0-percent. Actual product moisture is dependent upon multiple geological factors, operational factors, and product contract specifications and can exceed 8-percent. As such, the modeled moisture values provide a level of conservatism for reserve reporting. Raw quality and some volatile matter analysis not available for Workman Creek. Workman Creek surface reserves were priced at 70% High-Vol. A and 30% thermal product. Workman Creek Surface is modeled as 55% direct-ship and 45% washed to mimic what Alpha is doing, however without any raw quality data for the surface seams a quality composite could not be prepared. See Appendix A for detailed breakdown. Totals may not add due to rounding. In summary, Alpha controls a total of 97.65 million tons (Mt) (moist basis) of marketable coal reserves at Marfork. Of that total, 55 percent are proven, and 45 percent are probable. Due to the lack of raw coal quality information, all Workman Creek surface reserves have been classified as Probable, even though it is an active operation with sales into the thermal and metallurgical markets. Approximately 2.21 Mt are owned, and the remaining 95.44 Mt are leased coal reserves. Of the total, 50.65 Mt are permitted, and the remaining 47.00 Mt are not permitted. The maps included in Appendix C reflect mining depletion at the time of the resource/reserve calculation taken from Alpha mine maps as of September 30, 2023 for underground mines and as of June 30, 2023 for surface mines. Mine depletion tonnages were supplied by Alpha through the end of 2023, and MM&A deducted this historical production from the mapped reserves to estimate reserves as of December 31, 2023. 1.8 Capital Summary Alpha provided MM&A with information related to the number of currently operating production units at the Marfork Mining Complex. MM&A’s capital schedules assume that major equipment rebuilds occur over the course of each machine’s remaining assumed operating life. Replacement equipment was scheduled based on MM&A’s experience and knowledge of mining equipment and industry standards with respect to the useful life of such equipment. As one mine is depleted, the equipment is moved to its replacement.

Alpha Metallurgical Resources, Inc. Statement of Coal Resources and Reserves for the Marfork Mining Complex in Accordance with United States SEC Standards as of December 31, 2023 Central Appalachian Coal Basin West Virginia, USA MARSHAL MILLER & ASSOCIATES, INC. 15 The capital expenditures tables detail costs for major equipment and infrastructure such as conveyor belt terminal groups. “Other” costs include expenditures for mine access and construction, mine extension capital and miscellaneous costs. A summary of the estimated capital for the consolidated Marfork operations is provided in Figure 1-2 below. Figure 1-2: Projected Capital Expenditures – Consolidated Marfork Mining Complex 1.9 Operating Costs Alpha provided historical operating costs for its active mines including: Underground mine operations at Black Eagle, Panther Eagle, Horse Creek Eagle, and Glen Alum. Surface and highwall mine operations at Workman Creek North and Workman Creek South. MM&A used the historical cost information as a reference and developed a personnel schedule for each mine. Hourly labor rates and salaries were based upon information contained in Alpha’s financial summaries. Fringe benefit costs were developed for vacation and holidays, federal and state unemployment insurance, retirement, workers’ compensation and pneumoconiosis, casualty and life insurance, healthcare, and bonuses. A cost factor for mine supplies was developed that relates expenditures to mine advance rates for roof control costs and other mine supply costs based on the historical cost data provided by Alpha. Other factors were developed for maintenance and repair costs, Alpha Metallurgical Resources, Inc. Statement of Coal Resources and Reserves for the Marfork Mining Complex in Accordance with United States SEC Standards as of December 31, 2023 Central Appalachian Coal Basin West Virginia, USA MARSHAL MILLER & ASSOCIATES, INC. 16 rentals, mine power, outside services, coal preparation plant processing, refuse handling, coal loading, property taxes and insurance and bonding and other direct mining costs. Appropriate royalty rates were assigned for production from leased coal lands and sales taxes were calculated for state severance taxes, the federal black lung excise tax, and federal and state reclamation fees. A summary of the projected operating costs for the consolidated Marfork operations is provided in Figure 1-3. Figure 1-3: Marfork Mining Complex Operating Costs 1.10 Economic Evaluation The pre-feasibility financial model prepared for this TRS was developed to test the economic viability of each coal resource area. The results of this financial model are not intended to represent a bankable feasibility study, required for financing of any current or future mining operations contemplated for the Alpha properties, but are intended to establish the economic viability of the estimated coal reserves. Cash flows are simulated on an annual basis based on projected production from the coal reserves. The discounted cash flow analysis presented herein is based on an effective date of January 1, 2024.

Alpha Metallurgical Resources, Inc. Statement of Coal Resources and Reserves for the Marfork Mining Complex in Accordance with United States SEC Standards as of December 31, 2023 Central Appalachian Coal Basin West Virginia, USA MARSHAL MILLER & ASSOCIATES, INC. 17 On an un-levered basis, the NPV of the project cash flow after taxes represents the Enterprise Value of the project. The project cash flow, excluding debt service, is calculated by subtracting direct and indirect operating expenses and capital expenditures from revenue. Direct costs include labor, operating supplies, maintenance and repairs, facilities costs for materials handling, coal preparation, refuse disposal, coal loading, reclamation, and general and administrative costs. Indirect costs include statutory and legally agreed upon fees related to direct extraction of the mineral. The indirect costs are the Federal black lung tax, Federal and State reclamation taxes, property taxes, coal production royalties, and income taxes. The Alpha mines’ historical costs provided a useful reference for MM&A’s cost estimates. Company-wide pricing data as provided by Alpha is described in Table 16-2. Note that not all products reflected in Table 16-2 will apply to every business unit. The pricing data assumes a flat-line long-term realization of $162 per short ton port pricing, with an average $132.51 per ton netback pricing reflective of the high-volatile product currently sold at Marfork, and $163 per short ton port loading with an average of $127.26 per short ton netback pricing reflective of the low-volatile product. A portion of the surface mine production is also thermal product which assumes a flat-line long term realization of $74 per short ton with an average of $65.52 per ton netback pricing. The LOM blended average netback pricing for the Marfork reserves is $127.67 per ton. These estimates are based on long-term pricing published by third party sources and adjusted for quality and transportation. The netback pricing represents adjustments made to published benchmark pricing based on quality and transportation. A large majority of the coal sold by Alpha and their Marfork Mining Complex is shipped internationally as part of blended products from other business units within Alpha or sourced from other companies. The netback adjustments reflect these additional costs carried after the products leave the Marfork Mining Complex. Table 1-3 shows the MM&A projected LOM tonnage, P&L, and EBITDA for each Alpha mine at Marfork. Table 1-3: Life-of-Mine Tonnage, P&L before Tax, and EBITDA LOM Tonnage LOM Pre-Tax P&L P&L Per Ton LOM EBITDA EBITDA Per Ton Laurel Hernshaw 4,583 $51,548 $11.25 $108,897 $23.76 Black King LCG Brown's Br 9,917 $167,143 $16.85 $343,720 $34.66 Workman Upper Eagle 1,021 $18,474 $18.09 $32,825 $32.14 Berwind LCG 2,154 $24,190 $11.23 $48,915 $22.71 Low Gap MCG 632 $6,918 $10.94 $13,655 $21.60 Titan MCG 5,238 $96,616 $18.45 $155,040 $29.60 Coon UCG 783 $12,400 $15.84 $22,259 $28.43 Ellis UCG 908 $16,382 $18.04 $21,624 $23.82 Bee Tree Powellton 452 $4,334 $9.59 $9,154 $20.26 Black Eagle 10,649 ($59,679) $(5.60) $123,520 $11.60 Dow Fork Eagle 10,000 $98,365 $9.84 $218,250 $21.83 Horse Creek Eagle 364 ($52) $(0.14) $6,962 $19.11 Panther Eagle 2,812 $56,949 $20.25 $103,178 $36.69 Workman's Creek Beckley 26,132 $496,371 $18.99 $1,033,507 $39.55 Glen Alum Tunnel 2,674 $8,537 $3.19 $60,823 $22.75 Consolidated Deep Mines 78,319 $998,495 $12.75 $2,302,327 $29.40 Alpha Metallurgical Resources, Inc. Statement of Coal Resources and Reserves for the Marfork Mining Complex in Accordance with United States SEC Standards as of December 31, 2023 Central Appalachian Coal Basin West Virginia, USA MARSHAL MILLER & ASSOCIATES, INC. 18 LOM Tonnage LOM Pre-Tax P&L P&L Per Ton LOM EBITDA EBITDA Per Ton Surface Mines Workman 16,304 $103,580 $6.35 $248,577 $15.25 Consolidated Surface Mines 16,304 $103,580 $6.35 $248,577 $15.25 Highwall Miner Operations Workman HWM 4,461 $311,502 $69.83 $331,774 $74.38 Consolidated HWMs 4,461 $311,502 $69.83 $331,774 $74.38 Grand Total 99,084 $1,413,577 $14.27 $2,882,678 $29.09 Note: ** LOM tonnage evaluated in the financial model includes September 2023 through December 2023 for underground mines and July 2023 through December 2023 production for surface mines production (1,410,126 clean tons) which was subtracted from coal reserves to make the effective date of the reserves December 31, 2023. As shown in Table 1-3, all the mines analyzed show positive EBITDA over the LOM. Overall, the Alpha consolidated Marfork operations show positive LOM P&L and EBITDA of $1.4 billion and $2.9 billion, respectively. Alpha’s consolidated Marfork cash flow summary in constant dollars, excluding debt service, is shown in Table 1-4 below. Table 1-4: Project Cash Flow Summary (000) YE 12/31 YE 12/31 YE 12/31 YE 12/31 YE 12/31 YE 12/31 Total 2023 2024 2025 2026 2027 2028 Production & Sales tons 99,084 1,837 4,703 5,014 4,339 3,676 4,623 Total Revenue $12,650,363 $219,084 $576,504 $605,617 $525,681 $449,955 $558,645 EBITDA $2,882,678 $63,699 $154,517 $184,802 $131,787 $86,716 $143,825 Net Income $1,166,814 $47,552 $89,398 $111,667 $75,883 $37,134 $80,635 Net Cash Provided by Operating Activities $2,635,916 $39,436 $116,868 $154,338 $128,089 $87,588 $115,877 Purchases of Property, Plant, and Equipment ($1,278,392) $0 ($39,640) ($51,401) ($33,447) ($31,728) ($43,170) Net Cash Flow $1,357,523 $39,436 $77,228 $102,937 $94,642 $55,860 $72,707 YE 12/31 YE 12/31 YE 12/31 YE 12/31 YE 12/31 YE 12/31 YE 12/31 2029 2030 2031 2032 2033 2034 2035 Production & Sales tons 3,263 3,407 3,448 2,651 1,707 1,710 1,641 Total Revenue $410,212 $430,838 $436,697 $342,519 $226,196 $226,567 $217,491 EBITDA $36,099 $46,270 $50,257 $51,332 $28,689 $30,094 $20,363 Net Income ($12,204) ($9,699) $1,419 $5,477 $2,661 $4,073 ($4,381) Net Cash Provided by Operating Activities $56,298 $45,206 $48,856 $53,237 $32,861 $30,167 $21,977 Purchases of Property, Plant, and Equipment ($55,957) ($55,870) ($32,860) ($30,176) ($22,288) ($10,435) ($147,752) Net Cash Flow $341 ($10,664) $15,995 $23,061 $10,573 $19,732 ($125,775) YE 12/31 YE 12/31 YE 12/31 YE 12/31 YE 12/31 YE 12/31 YE 12/31 2036 2037 2038 2039 2040 2041 2042 Production & Sales tons 1,694 1,787 1,825 1,852 2,169 2,208 2,149 Total Revenue $222,795 $235,259 $240,297 $243,388 $281,875 $285,662 $277,445 EBITDA $18,459 $27,117 $31,693 $36,479 $57,560 $62,756 $57,289 Net Income ($26,754) ($15,846) ($9,311) ($2,448) $10,756 $16,596 $31,977 Net Cash Provided by Operating Activities $19,529 $25,143 $31,321 $36,300 $53,379 $59,415 $57,760 Purchases of Property, Plant, and Equipment ($43,309) ($13,279) ($2,110) ($8,059) ($66,072) ($34,881) $0 Net Cash Flow ($23,779) $11,864 $29,211 $28,240 ($12,693) $24,534 $57,760

Alpha Metallurgical Resources, Inc. Statement of Coal Resources and Reserves for the Marfork Mining Complex in Accordance with United States SEC Standards as of December 31, 2023 Central Appalachian Coal Basin West Virginia, USA MARSHAL MILLER & ASSOCIATES, INC. 19 YE 12/31 YE 12/31 YE 12/31 YE 12/31 YE 12/31 YE 12/31 YE 12/31 2043 2044 2045 2046 2047 2048 2049 Production & Sales tons 2,316 2,368 2,602 2,553 2,350 2,147 2,421 Total Revenue $298,002 $304,579 $334,351 $327,843 $301,945 $276,280 $311,187 EBITDA $76,054 $80,785 $103,810 $99,229 $81,204 $67,954 $98,698 Net Income $54,764 $53,250 $61,119 $49,594 $38,837 $29,925 $43,150 Net Cash Provided by Operating Activities $70,770 $78,010 $92,492 $88,565 $79,577 $66,232 $83,054 Purchases of Property, Plant, and Equipment ($440) ($43,807) ($66,146) ($31,565) ($29,465) ($30,162) ($71,912) Net Cash Flow $70,330 $34,203 $26,347 $57,000 $50,112 $36,070 $11,142 YE 12/31 YE 12/31 YE 12/31 YE 12/31 YE 12/31 YE 12/31 YE 12/31 2050 2051 2052 2053 2054 2055 2056 Production & Sales tons 2,679 2,674 2,706 2,695 2,187 2,191 1,969 Total Revenue $344,043 $343,219 $347,355 $346,970 $288,833 $290,385 $260,911 EBITDA $122,378 $121,616 $122,747 $122,033 $65,274 $67,591 $51,975 Net Income $54,502 $55,739 $64,468 $57,122 $12,740 $40,617 $23,181 Net Cash Provided by Operating Activities $104,041 $110,950 $111,581 $109,528 $73,715 $59,758 $55,283 Purchases of Property, Plant, and Equipment ($53,796) ($36,027) ($9,399) ($54,001) ($17,578) ($31,356) ($19,477) Net Cash Flow $50,245 $74,924 $102,182 $55,527 $56,137 $28,402 $35,806 YE 12/31 YE 12/31 YE 12/31 YE 12/31 YE 12/31 YE 12/31 YE 12/31 2057 2058 2059 2060 2061 2062 2063 Production & Sales tons 1,801 1,743 1,540 1,549 1,174 718 581 Total Revenue $238,708 $230,919 $204,029 $205,270 $155,559 $95,173 $76,978 EBITDA $49,894 $55,261 $50,318 $52,815 $35,487 $21,956 $20,089 Net Income $22,752 $26,852 $23,308 $26,989 $11,050 $4,783 $8,179 Net Cash Provided by Operating Activities $50,293 $53,839 $45,481 $48,668 $38,355 $26,651 $21,920 Purchases of Property, Plant, and Equipment ($18,720) ($344) ($12,979) ($14,258) ($14,183) ($344) $0 Net Cash Flow $31,573 $53,495 $32,502 $34,410 $24,172 $26,307 $21,920 YE 12/31 YE 12/31 YE 12/31 YE 12/31 YE 12/31 YE 12/31 YE 12/31 2064 2065 2066 2067 2068 2069 2070 Production & Sales tons 380 36 0 0 0 0 0 Total Revenue $50,363 $4,733 $0 $0 $0 $0 $0 EBITDA $8,200 ($4,321) ($4,673) ($1,849) ($930) ($474) ($247) Net Income ($1,467) ($12,880) ($9,345) ($3,698) ($1,860) ($948) ($493) Net Cash Provided by Operating Activities $14,022 $2,633 ($37,894) ($12,658) ($6,296) ($3,148) ($3,148) Purchases of Property, Plant, and Equipment $0 $0 $0 $0 $0 $0 $0 Net Cash Flow $14,022 $2,633 ($37,894) ($12,658) ($6,296) ($3,148) ($3,148) Notes: (1) LOM tonnage evaluated in the financial model includes September 2023 through December 2023 for underground mines and July 2023 through December 2023 production for surface mines production (1,410,126 clean tons) which was subtracted from coal reserves to make the effective date of the reserves December 31, 2023. (2) Results shown for 2023 represent 4th quarter only. Consolidated cash flows are driven by annual sales tonnage, which range from 3.3 million tons to 5.0 million tons between 2024 and 2031. Between years 2032 and 2061, sales ranges from 1.2 million to 2.7 million tons and between years 2062-2065, sales range from 0.04 million tons to 0.7 million tons. Projected consolidated revenue peaks at $605.6 million in 2025 and totals $12.7 billion for the project’s life. Consolidated cash flow from operations is positive throughout the projected operating period, apart from post-production years, due to end-of-mine reclamation spending. Consolidated cash flow from operations peaks at $154.3 million in 2025 and totals $2.6 billion over the project life. Capital expenditures total $199.4 million during the first five years and $1.3 billion over the project’s life. Alpha Metallurgical Resources, Inc. Statement of Coal Resources and Reserves for the Marfork Mining Complex in Accordance with United States SEC Standards as of December 31, 2023 Central Appalachian Coal Basin West Virginia, USA MARSHAL MILLER & ASSOCIATES, INC. 20 1.10.1 Discounted Cash Flow Analysis Cash flow after tax, but before debt service, generated over the life of the project was discounted to NPV at a 16.57% discount rate, which represents MM&A’s estimate of the constant dollar, risk adjusted WACC for likely market participants if the subject reserves were offered for sale. On an un-levered basis, the NPV of the project cash flows represents the Enterprise Value of the project and amounts to $342.8 million. Alpha is an active producer, and the financial model shows positive net cash flow for each year of the operating life of the Marfork reserves. The pre-feasibility financial model prepared for the TRS was developed to test the economic viability of each coal resource area. The NPV estimate was made for the purpose of confirming the economics for classification of coal reserves and not for purposes of valuing Alpha or its Marfork assets. Mine plans were not optimized, and actual results of the operations may be different, but in all cases, the mine production plan assumes the properties are under competent management. 1.10.2 Sensitivity Analysis Sensitivity of the NPV results to changes in the key drivers is presented in the chart below. The sensitivity study shows the NPV at the 16.57% discount rate when Base Case sales prices, operating costs, capital costs and discount rate are increased and decreased in increments of 5% within a +/- 15% range. Figure 1-4: Sensitivity of NPV

Alpha Metallurgical Resources, Inc. Statement of Coal Resources and Reserves for the Marfork Mining Complex in Accordance with United States SEC Standards as of December 31, 2023 Central Appalachian Coal Basin West Virginia, USA MARSHAL MILLER & ASSOCIATES, INC. 21 As shown, NPV is quite sensitive to changes in sales price, operating cost estimates and the discount rate, and slightly sensitive to changes in capital cost estimates. 1.11 Permitting Alpha has obtained all mining and discharge permits to operate its active mines, preparation plant processing, loadout, and related support facilities. MM&A is unaware of any obvious or current Alpha permitting issues that are expected to prevent the issuance of future permits. Alpha, along with all coal producers, is subject to a level of uncertainty regarding future clean water permits due to United States Environmental Protection Agency (EPA) and United States Fish and Wildlife (USFW) involvement with state programs. 1.12 Conclusion and Recommendations Sufficient data has been obtained through various exploration and sampling programs and mining operations to support the geological interpretations of seam structure and thickness for coal horizons situated on the Marfork Property and reviewed in the study. The data is of sufficient quantity and reliability to reasonably support the coal resource and coal reserve estimates in this TRS. The geological data and preliminary feasibility study, which consider mining plans, revenue, and operating and capital cost estimates are sufficient to support the classification of coal reserves provided herein. This geologic evaluation conducted in conjunction with the preliminary feasibility study concludes that the 97.65 Mt of marketable underground coal reserves identified on the Property are economically mineable under reasonable expectations of market prices for metallurgical coal products, estimated operation costs, and capital expenditures. 2 Introduction 2.1 Registrant and Terms of Reference This updated report was prepared for the sole use of Alpha Metallurgical Resources, Inc. (Alpha) and its affiliated and subsidiary companies and advisors. The report provides a statement of coal reserves for Alpha. Exploration results and resource calculations were used as the basis for the mine planning and the preliminary feasibility study completed to determine the extent and viability of the reserve. The report provides a statement of coal resources and coal reserves for Alpha, as defined under the United States Securities and Exchange Commission (SEC). Alpha Metallurgical Resources, Inc. Statement of Coal Resources and Reserves for the Marfork Mining Complex in Accordance with United States SEC Standards as of December 31, 2023 Central Appalachian Coal Basin West Virginia, USA MARSHAL MILLER & ASSOCIATES, INC. 22 Coal resources and coal reserves are herein reported in imperial units of measurement. 2.2 Information Sources The technical report is based on information provided by Alpha and reviewed by MM&A’s professionals, including geologists, mining engineers, civil engineers, and environmental scientists. MM&A’s professionals hold professional registrations and memberships which qualify them as Qualified Persons in accordance with SEC guidelines. Sources of data and information are listed below in Table 2-1: Table 2-1: Information Provided to MM&A by Alpha Category Information Provided by Alpha Report Section Geological Geologic data including digital databases and original source data including geologist logs, driller’s logs, geophysical logs. 9.1 Coal Quality Database of coal quality information supplemented with original source laboratory sheets where available. 10.1 Mining Historical productivities and manpower projections. 13.2, 13.4 Coal Preparation Flow Sheet and other information related to coal processing. 14.1 Waste Disposal Engineering data and estimates representing remaining capacities for coarse and fine coal waste disposal. 17.2 Costs Historical and budgetary operating cost information used to derive cost drivers for reserve financial modeling 18.2 Note: While the sources of data listed in Table 2-1 are not exhaustive, they represent a significant portion of information which supports this TRS. MM&A reviewed the provided data and found it to be reasonable prior to incorporating it into the TRS. The TRS contains “forward-looking information” including forecasts of productivity and annual coal production, operating and capital cost estimates, coal sales price forecasts, the assumption that Alpha will continue to acquire necessary permits, and other assumptions. The TRS statements and conclusions are not a guarantee of future performance and undue reliance should not be placed on them. The ability of Alpha to recover the estimated coal reserves is dependent on multiple factors beyond the control of MM&A including, but not limited to geologic factors, mining conditions, regulatory approvals, and changes in regulations. In all cases, the plans assume the Property is under competent management. 2.3 Scope of Assignment Alpha engaged MM&A to conduct a coal reserve evaluation of the Alpha coal properties as of December 31, 2023. For the evaluation, the following tasks were to be completed: > Conduct site visits of the mines and mine infrastructure facilities. > Process the information supporting the estimation of coal resources and reserves into geological models. > Develop life-of-reserve mine (LOM) plans and financial models. > Hold discussions with Alpha company management; and > Prepare and issue a Technical Report Summary providing a statement of coal reserves which would include:

Alpha Metallurgical Resources, Inc. Statement of Coal Resources and Reserves for the Marfork Mining Complex in Accordance with United States SEC Standards as of December 31, 2023 Central Appalachian Coal Basin West Virginia, USA MARSHAL MILLER & ASSOCIATES, INC. 23 - A description of the mines and facilities. - A description of the evaluation process. - An estimation of coal reserves with compliance elements as stated under the SEC S-K 1300 regulations that became effective for the first fiscal year commencing on or after January 1, 2021. 2.4 Personal Inspections MM&A is very familiar with Marfork ’s West Virginia Properties, having provided a variety of services in recent years. Qualitied Persons involved in this TRS have conducted multiple site visits, most recently September 2023. 3 Property Description 3.1 Location The Marfork Mining Complex is in the Central Appalachian Basin of southern West Virginia (see Figure 1-1) with coal properties mostly in Raleigh and Boone counties. The underground mine properties are generally centered around the Marfork preparation plant and facilities located approximately 3 miles south of the town of Whitesville, West Virginia, and 30 miles northwest of Beckley, West Virginia, the county seat of Raleigh County. Surface facilities for the operation are in the Big Coal River drainage basin, central to the active mines as well as those currently in development. Surface facilities for the Workman Creek operation are located on Workman Creek, a tributary to Clear Fork along State Route 1. The Workman properties are east of and adjoining to the Marfork underground properties. Numerous small communities are present throughout the Property such as the previously mentioned town of Whitesville, as well as Sylvester, Montcoal and Clear Creek communities. The nearest major population centers are Charleston, West Virginia (40 miles north), Bristol, Virginia (170 miles south), Roanoke, Virginia (160 miles east), Morgantown, West Virginia (200 miles north), and Lexington, Kentucky (220 miles west). The Property is located on the following United States Geological Survey (USGS) Quadrangles: Williams Mnt., Sylvester, Eskdale, Wharton, Whitesville, Dorothy, Pax, Pilot Knob, Arnett, Eccles, and Beckley. The coordinate system and datum used for the model of the Marfork Mining Complex, and the subsequent maps were produced in the West Virginia State Plane South system, NAD 27. Alpha Metallurgical Resources, Inc. Statement of Coal Resources and Reserves for the Marfork Mining Complex in Accordance with United States SEC Standards as of December 31, 2023 Central Appalachian Coal Basin West Virginia, USA MARSHAL MILLER & ASSOCIATES, INC. 24 3.2 Titles, Claims or Leases Marfork properties are included within Alpha’s Mid-West Virginia mineral holdings that are composed of approximately 244,275 acres located in Raleigh, Boone, Fayette and Kanawha Counties, West Virginia. There are approximately 52 separate leases for the Mid-West Virginia mineral holdings group which Kingston resource area is a part of. Some leases expire over the next several years, but Alpha does not anticipate any challenges related to lease renewal. Table 3-1 lists Alpha’s Mid-West Virginia mineral leases. MM&A has not carried out a separate title verification for the coal properties and has not verified leases, deeds, surveys, or other property control instruments pertinent to the subject resources. Alpha has represented to MM&A that it controls the mining rights to the reserves as shown on its property maps, and MM&A has accepted these as being a true and accurate depiction of the mineral rights controlled by Alpha. The TRS assumes the Property is developed under responsible and experienced management. Table 3-1: Mineral Control – Mid-West Virginia (Marfork) Complex Reference File No. Document Type Expiration Date (1) On-going Minimum Royalty (2) On-going Production Royalty (3) MD 1 Deed N/A N/A N/A MD 2 Deed N/A N/A N/A MD 3 Deed N/A N/A N/A MD 4 Deed N/A N/A N/A MD 5 Deed N/A N/A N/A MD 6 Deed N/A N/A N/A MD 7 Deed N/A N/A N/A MD 8 Deed N/A N/A N/A ML 01 Lease 1/1/2027 Yes Yes ML 01b Lease 6/15/2029 Yes Yes ML 02 Lease 1/1/2027 Yes Yes ML 03 Lease 12/31/2033 Yes Yes ML 04 Lease 12/31/2025 Yes Yes ML 04b Lease 2/18/2029 Yes Yes ML 05 Lease 7/31/2028 Yes Yes ML 06 Lease 5/9/2024 Yes Yes ML 07 Lease 12/31/2024 Yes Yes ML 09 Lease 12/31/2026 Yes Yes ML 10 Lease Exhaustion Yes Yes ML 11 Lease 1/18/2025 Yes Yes ML 12a Lease Exhaustion Yes Yes ML 13 Lease 1/3/2025 Yes Yes ML 14 Lease 1/26/2025 Yes Yes ML 14c Lease 11/29/2025 No Yes ML 15 Lease 8/31/2024 Yes Yes ML 16 Lease 5/26/2027 Yes Yes ML 17 Lease 12/31/2026 Yes Yes ML 18 Lease 8/31/2028 Yes Yes ML 19 Lease 8/31/2028 Yes Yes ML 20 Lease 12/31/2028 Yes Yes ML 21 Lease 4/30/2024 Yes Yes ML 22a Lease 8/31/2028 No Yes ML 22b Lease 8/31/2028 Yes Yes ML 23 Lease 5/31/2026 Yes Yes ML 24 Lease 5/31/2026 Yes Yes ML 25 Lease 12/6/2024 Yes Yes

Alpha Metallurgical Resources, Inc. Statement of Coal Resources and Reserves for the Marfork Mining Complex in Accordance with United States SEC Standards as of December 31, 2023 Central Appalachian Coal Basin West Virginia, USA MARSHAL MILLER & ASSOCIATES, INC. 25 Reference File No. Document Type Expiration Date (1) On-going Minimum Royalty (2) On-going Production Royalty (3) ML 26 Lease 10/28/2024 Yes Yes ML 27a Lease 10/25/2030 Yes Yes ML 27b Lease 3/10/2025 Yes Yes ML 28 Lease 12/6/2024 Yes Yes ML 29 Lease 12/31/2024 Yes Yes ML 30 Lease 6/14/2025 Yes Yes ML 31 Lease 12/31/2023 Yes Yes ML 32 Lease 2/11/2024 Yes Yes ML 33 Lease 12/31/2026 Yes Yes ML 34 Lease 12/31/2024 Yes Yes ML 35 Lease 3/9/2025 Yes Yes ML 36 Lease 12/31/2024 Yes Yes ML 37 Lease Exhaustion Yes Yes ML 38 Lease 12/31/2025 Yes Yes ML 39 Lease Exhaustion Yes Yes ML 40 Lease 6/30/2025 Yes Yes ML 42 Lease 5/26/2027 Yes Yes ML 43 Lease 2/1/2024 Yes Yes ML 44 Lease 11/29/2025 Yes Yes ML 45 Lease 5/4/2024 Yes Yes ML 46 Lease 9/23/2026 Yes Yes ML 47 Lease 2/28/2024 Yes Yes ML 48 Lease 2/10/2024 Yes Yes ML 49 Lease 6/8/2027 Yes Yes (1) For leases with expiration dates, Company has option to renew or expects to renew until all mineable and merchantable coal is exhausted (2) Minimum royalty payments are generally recoupable against future production royalties. (3) Royalty rates range from 3% to 10% of gross selling price 3.3 Mineral Rights Alpha supplied property control maps to MM&A related to properties for which mineral and/or surface property are controlled by Alpha. While MM&A accepted these representations as being true and accurate, through experience with the Property, MM&A has no knowledge of past property boundary disputes or other concerns that could impact future mining operations or development potential. Property control in Appalachia can be intricate. Coal mining properties are typically composed of numerous property tracts which are owned and/or leased from both land holding companies and private individuals or companies. It is common to encounter severed ownership, with different entities or individuals controlling the surface and mineral rights. Mineral control in the region is typically characterized by leases or ownership of larger tracts of land, with surface control generally comprised of smaller tracts, particularly in developed areas. Control of the surface property is necessary to conduct surface mining but is not necessary to conduct underground mining aside from relatively limited areas required for seam access or ventilation infrastructure. Alpha’s executive management team has a history of mining in Central Appalachia and has conveyed to MM&A that it has been successful in acquiring surface rights where needed for past operations. Alpha Metallurgical Resources, Inc. Statement of Coal Resources and Reserves for the Marfork Mining Complex in Accordance with United States SEC Standards as of December 31, 2023 Central Appalachian Coal Basin West Virginia, USA MARSHAL MILLER & ASSOCIATES, INC. 26 3.4 Encumbrances No Title Encumbrances are known. By assignment, MM&A did not complete a query related to Title Encumbrances. 3.5 Other Risks There is always risk involved in property control. As is common practice, Alpha, and its predecessors, have had their land teams examine the deeds and title control to minimize this risk. Historically, property control has not posed any significant challenges related to Marfork’s operations. 4 Accessibility, Climate, Local Resources, Infrastructure and Physiography 4.1 Topography, Elevation, and Vegetation The topography of the area surrounding the Marfork Mining Complex is typical of the Central Appalachian Plateau’s physiographic province, being rugged and deeply dissected by V-shaped river valleys and flanked by steep-sided upland regions. Slopes in the area are mostly steep to very steep with some gently sloping with relatively narrow ridges. Surface elevations near the mine complex range from approximately 1,000 feet above sea level at streams to approximately 2,600 feet at ridge tops. The area is heavily vegetated and has a significant amount of hardwood forests. The Property is not situated near any major urban centers. 4.2 Access and Transport There is general access to the Marfork Property via a well-developed network of primary, secondary, and unimproved roads. Interstate 64/77 is located near the eastern side of the Property and is the primary throughfare in the area connecting the Property to Beckley, Charleston, and Huntington, West Virginia, to the West and Lexington, Virginia, to the East. Numerous secondary and unimproved roads provide direct access to the mine property, some being federal-, state-, and town-maintained. These include West Virginia State Route 1 and 3 that runs through the Property holdings and provides direct access to surface office facilities and preparation plant from points north and south. These primary roads typically stay open throughout the year. Within the Property, unimproved roads are utilized to access gas drainage wells and surface based deep mine infrastructure. The Alpha-owned office facilities, preparation plant and rail loadout are located approximately 3 miles south of the town of Whitesville along the CSX railroad system and serve as the primary transport means of processed coal.

Alpha Metallurgical Resources, Inc. Statement of Coal Resources and Reserves for the Marfork Mining Complex in Accordance with United States SEC Standards as of December 31, 2023 Central Appalachian Coal Basin West Virginia, USA MARSHAL MILLER & ASSOCIATES, INC. 27 4.3 Proximity to Population Centers The Marfork Mining Complex is located near the town of Beckley and is primarily in Raleigh and Boone Counties, West Virginia. There are no large population centers in proximity. The nearest major population centers are Charleston, West Virginia (40 miles north), Bristol, Virginia (170 miles south), Roanoke, Virginia (190 miles southeast), and Morgantown, West Virginia (200 miles northeast), and Lexington, Kentucky (220 miles west). As of the 2020 census, Raleigh County had just over 74,600 residents. 4.4 Climate and Length of Operating Season The climate of the region is classified as humid continental with four distinct seasons: warm summers, cold winters, and moderate fall and spring seasons. Precipitation in the region is consistent throughout the year, approximately 3 to 5 inches per month, with the most rain falling in spring and the early months of summer. Average yearly precipitation is 40 inches. Summer months typically begin in late May and end in early September and range in average temperature from 46 to 78 degrees Fahrenheit. Winters typically begin in mid to late November and run until mid to late March with average temperatures ranging from 19 to 52 degrees Fahrenheit. Precipitation in the winter typically comes in the form of snowfall or as a wintery mix (sleet and snow) with severe snowfall events occurring occasionally. Seasonal variations in climate typically do not affect underground mining in West Virginia. However, weather events could potentially negatively impact efficiency of surface and preparation plant operations on a very limited basis and lasting less than a few days. 4.5 Infrastructure The Marfork Mining Complex has sources of water, power, personnel, and supplies readily available for use. Personnel have historically been sourced from the surrounding communities in Raleigh, Kanawha, Fayette, and Boone Counties, and have proven to be adequate in numbers to conduct mining operations. As mining is common in the surrounding areas, the workforce is generally familiar with mining practices, and many are experienced miners. Water is sourced locally from public water sources or rivers, and electricity is sourced from Appalachian Power, a subsidiary of American Electric Power (AEP). The service industry in the areas surrounding the mine complex has historically provided supplies, equipment repairs and fabrication, etc. Alpha’s Marfork preparation plant services consumers with washed coal, which is transported via the adjacent CSX rail line at the Marfork loadout. Haul roads, primary roads, and conveyor belt systems account for transport from the various mine sites to the preparation plant. Alpha Metallurgical Resources, Inc. Statement of Coal Resources and Reserves for the Marfork Mining Complex in Accordance with United States SEC Standards as of December 31, 2023 Central Appalachian Coal Basin West Virginia, USA MARSHAL MILLER & ASSOCIATES, INC. 28 5 History 5.1 Previous Operation The Marfork Property involves a complex combination of previous ownership. Coal mining in the area occurred for nearly a century. Predecessors of Alpha, namely Alpha Natural Resources (Alpha) and Massey Energy (Massey) previously held mining rights on much of the Property. The current facilities were constructed in 1994 by Marfork Coal Company, a subsidiary of A. T. Massey Coal Company. The preparation plant, refuse disposal areas, utility infrastructure and rail transportation have been maintained and upgraded to provide a modern coal processing facility for the Property. 5.2 Previous Exploration Extensive exploration in the form of subsurface drill efforts has been carried out on the Property by numerous entities, most of which efforts were completed prior to the inception of Alpha. Diamond core and rotary drilling are the primary types of exploration on the Property. Data for correlation and mining conditions are derived from core descriptions and geophysical logging (e-logging). Coal-quality analyses were also employed during the core-exploration process. The development of this report included an assessment of over 1,000 exploration drill holes, largely comprised of coal measurements. Drill records indicate that independent contract drilling operators have typically been engaged to carry out drilling on the Property. Geophysical logging was typically performed by outside logging firms. MM&A, via its Geophysical Logging Systems subsidiary, has logged a significant number of the past exploration holes, and currently logs most of the recently drilled holes. Drill hole locations used in this assessment are shown on the resource and reserve maps included in Appendix C. 6 Geological Setting, Mineralization and Deposit 6.1 Regional, Local and Property Geology The Property lies in the Central Appalachian Coal basin in the Appalachian Plateau physiographic province. The coal deposits in the eastern US are the oldest and most extensively developed coal deposits in the country. The coal deposits on the Property are Carboniferous in age, being of the Pennsylvanian system. Overall, these Carboniferous coals contain two-fifths of the US’s bituminous coal deposits and extend over 900 miles from northern Alabama to Pennsylvania and are part of what is known as the

Alpha Metallurgical Resources, Inc. Statement of Coal Resources and Reserves for the Marfork Mining Complex in Accordance with United States SEC Standards as of December 31, 2023 Central Appalachian Coal Basin West Virginia, USA MARSHAL MILLER & ASSOCIATES, INC. 29 Appalachian Basin. The Appalachian Basin is more than 250 miles wide and, in some portions, contains over 60 coal seams of varying economic significance. Coal seams and zones of economic significance typically range between 24 and 48 inches in thickness, with relatively little structural deformation. Regional structure is typically characterized by gently dipping strata to the northwest at one to four percent, averaging three percent. Strata on the Property are mostly of the Pennsylvanian-age Kanawha Formation and the older, lower Beckley and Fire Creek seams are part of the New River Formation of the Pottsville Series. The rock formations between the coal seams are characterized by large proportions of sandstone interspersed with shale units. Coal seams with remaining reserve or resource potential evaluated within this TRS include, in descending stratigraphic order the: Upper, Middle and Lower Clarion; Stockton, Upper Coalburg, Coalburg, Lower Coalburg, Upper Winifrede Rider, Upper Winifrede, Winifrede, Lower Winifrede, Upper Chilton A, Middle Chilton A , Chilton A Upper Split, Chilton A Lower Split, Chilton A, Chilton Rider, Upper Chilton, Lower Chilton, Chilton, Upper Hernshaw, Lower Hernshaw, Upper Cedar Grove Upper Split, Upper Cedar Grove Lower Split, Middle Cedar Grove, Lower Cedar Grove Upper Split, Lower Cedar Grove, Peerless Upper Split, Peerless Lower Split, Peerless C, Upper No. 2 Gas, Lower No. 2 Gas, Powellton, Lower Powellton, Powellton Lower Split, Powellton Lower Split Upper, Upper Eagle Rider 2, Powellton Lower Split Lower, Upper Eagle Rider, Upper Eagle, Eagle A, Eagle, Little Eagle, Glen Alum Tunnel, Beckley and Fire Creek seams. 6.2 Mineralization The generalized stratigraphic columnar section in Figure 6-1 and Figure 6-2 demonstrates the vertical relationship of the principal coal seams and rock formations on the Workman Creek and Marfork Property. Alpha Metallurgical Resources, Inc. Statement of Coal Resources and Reserves for the Marfork Mining Complex in Accordance with United States SEC Standards as of December 31, 2023 Central Appalachian Coal Basin West Virginia, USA MARSHAL MILLER & ASSOCIATES, INC. 30 Figure 6-1: Workman Creek Stratigraphic Column (Not to scale)

Alpha Metallurgical Resources, Inc. Statement of Coal Resources and Reserves for the Marfork Mining Complex in Accordance with United States SEC Standards as of December 31, 2023 Central Appalachian Coal Basin West Virginia, USA MARSHAL MILLER & ASSOCIATES, INC. 31 Figure 6-2: Marfork Stratigraphic Column (Not to scale) 6.3 Deposits The coal produced at the Marfork Mining Complex is mainly a High-volatile metallurgical bituminous coal. The higher rank Glen Alum and Beckley coals will produce a Mid-Volatile and a Low-Volatile product. Due to the high value of these High and Mid Volatile coking coals, all the seams have been extensively mined in the past. Generally, the coal rank increases with depth whereas the highest seams stratigraphically and physically on the hills exhibit the greatest volatile matter content and deepest seams exhibit the lowest volatile matter content. The highest structural elevations are along the southeastern margin of the Property with the strata generally dipping toward northwest. The Marfork underground coal seams of interest above drainage include the Chilton through the Glen Alum Tunnel and are accessible via an outcrop faceup. Below-drainage seams of interest include the Beckley and the Fire Creek and would require slope development access. The surface mines included the Upper Chilton through the Little Eagle coal seams. The rock formations between the coal seams are characterized by large portions of sandstone with shale units interspersed throughout. Alpha Metallurgical Resources, Inc. Statement of Coal Resources and Reserves for the Marfork Mining Complex in Accordance with United States SEC Standards as of December 31, 2023 Central Appalachian Coal Basin West Virginia, USA MARSHAL MILLER & ASSOCIATES, INC. 32 7 Exploration 7.1 Nature and Extent of Exploration The Property has been extensively explored by subsurface drilling efforts carried out by numerous entities, most of which were completed prior to ownership by Alpha. Diamond core and rotary drilling are the primary types of exploration on the Property. Data for correlation and mining conditions are derived from core descriptions and geophysical logging (e- logging). Coal-quality analyses were also employed during the core-exploration process. Drill records indicate that independent contract drilling operators have typically been engaged to carry out drilling on the Property. Geophysical logging was typically performed by outside logging firms. MM&A, via its Geophysical Logging Systems subsidiary, has logged a portion of the past exploration holes, including most of the recently drilled holes. Drill hole locations are shown on the maps included in Appendix C. The concentration of exploration varies slightly across the Property. Drilling on the Property is typically sufficient for delineation of deep mineable coal horizons. Core logging is carried out by geologists in cases where roof and floor strata are of particular interest and in cases where greater resolution and geologic detail are needed. In many cases the drill hole data comes from simplified driller’s logs, which may lack specific details regarding geotechnical conditions and specific geology, making correlations and floor and roof conditions difficult to determine. Geophysical logging (e-logging) techniques, by contrast, document specific details useful for geologic interpretation and mining conditions. Given the variability of data-gathering methods, definitive mapping of future mining conditions may not be possible, but projections and assumptions can be made within a reasonable degree of certainty. A significant effort was put into verifying the integrity of the database. Once this was established, stratigraphic columnar sections were generated using cross-sectional analysis to establish or confirm coal seam correlations. A typical cross-section for Workman Creek and Marfork is shown in Figure 7-1 and Figure 7-2.

Alpha Metallurgical Resources, Inc. Statement of Coal Resources and Reserves for the Marfork Mining Complex in Accordance with United States SEC Standards as of December 31, 2023 Central Appalachian Coal Basin West Virginia, USA MARSHAL MILLER & ASSOCIATES, INC. 33 Figure 7-1: Workman Creek Cross-Section Alpha Metallurgical Resources, Inc. Statement of Coal Resources and Reserves for the Marfork Mining Complex in Accordance with United States SEC Standards as of December 31, 2023 Central Appalachian Coal Basin West Virginia, USA MARSHAL MILLER & ASSOCIATES, INC. 34 Figure 7-2: Marfork Underground Mine Cross-Section Due to the long history of exploration by various parties on the Property, a wide variety of survey techniques exist for documentation of data point locations. Many of the older exploration drill holes appear to have been located by survey and more recently completed drill holes are often located by high-resolution Global Positioning System (GPS) units. However, some holes appear to have been

Alpha Metallurgical Resources, Inc. Statement of Coal Resources and Reserves for the Marfork Mining Complex in Accordance with United States SEC Standards as of December 31, 2023 Central Appalachian Coal Basin West Virginia, USA MARSHAL MILLER & ASSOCIATES, INC. 35 approximately located using USGS topography maps or other methods which are less accurate. Therefore, discretion had to be used regarding the accuracy for the location and ground surface elevation of some of these older drill holes. In instances where a drill hole location (or associated coal seam elevations) appeared to be inconsistent with the overall structural trend (or surface topography for surface-mineable areas), the data point was not honored for geological modeling. Others with apparently minor variances were adjusted and then used by MM&A. Surveying of the underground and surface mined areas has been performed by the mine operators and/or their consulting surveyors. By assignment, MM&A did not verify the accuracy or completeness of mine maps supplied by Alpha but accepted this information as being the work of responsible engineers and surveyors, as required by both State and Federal Law. MM&A compiled comprehensive topographic map files by selecting the best available aerial mapping for each area and filling any gaps with digital USGS topographic mapping. 7.2 Drilling Procedures Core drilling methods utilize NX-size (21/8 inch) or similar-sized core cylinders to recover core samples, which can be used to delineate geologic characteristics, and for coal quality testing and geotechnical logging. For the core holes, the geophysical logs are especially useful in verifying the core recovery of both the coal samples (for assurance that sample is representative of the full seam) and of the roof and floor rock samples (for evaluating ground control characteristics of deep mineable coal seams). In addition to the core holes, rotary drilled holes also exist on the Property. Data for the rotary drilled holes is mainly derived from downhole geophysical logs, which are used to interpret coal and rock thickness and depth since logging of the drill cuttings is not reliable. A wide variety of core-logging techniques exist for the Property. For many of the core holes, the primary data source is a generalized lithology description by the driller, more recent holes are generally supplemented by a more detailed core log completed by a geologist. These drilling logs were provided to MM&A as a geological database. MM&A geologists were not involved in the production of original core logs but did perform a basic check of information within the provided database. An audit of the Alpha database was conducted by comparing seam depths, coal, and parting thicknesses in the electronic database against the source drill logs and the results were acceptable. Where geophysical logs for such holes are available, they were used by MM&A geologists to verify the coal thickness and core recovery of seams. 7.3 Hydrology Hydrologic testing and forecasting are necessary parts of the permitting process and as such are routinely considered in the mine planning process. Alpha Metallurgical Resources, Inc. Statement of Coal Resources and Reserves for the Marfork Mining Complex in Accordance with United States SEC Standards as of December 31, 2023 Central Appalachian Coal Basin West Virginia, USA MARSHAL MILLER & ASSOCIATES, INC. 36 Marfork has a lengthy history of operation and four currently active mines with no significant hydrologic concerns or material issues experienced in its history. Future mining is projected to occur in areas exhibiting similar hydrogeological conditions as past mining. Based upon the successful history of the operation with regards to hydrogeological features, MM&A assumes that the operation will not be hindered by such issues in the future. 7.4 Geotechnical Data Life-of-Mine (LOM) Mining plans for potential underground mines were developed by MM&A through incorporation of budget maps from Alpha. Pillar stability was tested by MM&A using the Analysis of Coal Pillar Stability (ACPS) program that was developed by the National Institute for Occupational Safety and Health (NIOSH). MM&A reviewed the results from the ACPS analysis and considered it in the development of the LOM plan. Coal and rock strengths from core testing are used to verify the empirical assumptions integral to ACPS. 8 Sample Preparation Analyses and Security 8.1 Prior to Sending to the Lab Most of the coal samples have been obtained from the Property by subsurface exploration using core drilling techniques. The protocol for preparing and testing the samples has varied over time and is not well documented for the older holes drilled on the Property. Typical US core drilling sampling technique is for the coal core sample, once recovered from the core barrel, to be described then wrapped in a sealed plastic sleeve and placed into a covered core box, which is the length of the sample so that the core can be delivered to a laboratory in relatively intact condition and with original moisture content. The core identification number and the depth are scribed on the sample box lid to identify the sample. This process has been the norm for both historical and ongoing exploration activities at Marfork. This work is typically performed by the supervising driller, geologist, or company personnel. Samples are most often delivered to the company by the driller after each shift or acquired by company personnel or representatives. Most of the coal core samples were obtained by previous operators on the Property. MM&A did not participate in the collection, sampling, and analysis of most core samples within the exploration database. However, it is reasonable to assume, given the sophistication level of the previous operators, that these samples were generally collected and processed under industry best- practices. This assumption is based on MM&A’s familiarity with the operating companies and the companies used to perform the analysis. In addition to the steps taken to ensure the accuracy of the historical data as described above, Alpha reports that the company employs a detailed chain of custody process during their current sampling

Alpha Metallurgical Resources, Inc. Statement of Coal Resources and Reserves for the Marfork Mining Complex in Accordance with United States SEC Standards as of December 31, 2023 Central Appalachian Coal Basin West Virginia, USA MARSHAL MILLER & ASSOCIATES, INC. 37 programs. This chain of custody process follows the sample from the time it is drilled until the final quality results are entered into a database for preparation of geologic models. 8.2 Lab Procedures Coal quality testing has been performed over many years by operating companies using different laboratories and testing regimens. Some of the samples have raw analyses and washabilities on the full seam (with coal and rock parting layers co-mingled) and are mainly useful for characterizing the coal quality for projected production from underground and highwall mining. Other samples have coal and rock analyzed separately, the results of which can be manipulated to forecast either surface or underground mining quality. Care has been taken to use only those analyses that are representative of the coal quality parameters for the appropriate mining type for each sample. Standard procedure upon receipt of core samples by the testing laboratory is to log the depth and thickness of the sample, then perform testing as specified by a representative of the operating company. Each sample is then analyzed in accordance with procedures defined under ASTM International (ASTM) standards including, but not limited to; washability (ASTM D4371); ash (ASTM D3174); sulfur (ASTM D4239); Btu/lb. (ASTM D5865); volatile matter (ASTM D3175); and Free Swell Index (FSI) (ASTM D720). 9 Data Verification 9.1 Procedures of Qualified Person MM&A reviewed the Alpha-supplied digital geologic database and supplemented the database with its own in-house records which have been maintained for both Alpha and previous operators of the Property. The database consists of data records, which include drill hole information for holes that lie within and adjacent to the Property and records for numerous supplemental coal seam thickness measurements. Once the initial integrity of the database was established, stratigraphic columnar sections were generated using cross-sectional analysis to establish or confirm coal seam correlations. Geophysical logs were used wherever available to assist in confirming the seam correlation and to verify proper seam thickness measurements and recovery of coal samples. Additionally, an audit of the Alpha digital database was conducted by comparing seam depths, coal, and parting thicknesses in the database against the source drill logs and the results were acceptable. After establishing and/or verifying proper seam correlation, seam data control maps and geological cross-sections were generated and again used to verify seam correlations and data integrity. Once the database was fully vetted, seam thickness, base-of-seam elevation, roof and floor lithology, and overburden maps were independently generated for use in the mine planning process. Alpha Metallurgical Resources, Inc. Statement of Coal Resources and Reserves for the Marfork Mining Complex in Accordance with United States SEC Standards as of December 31, 2023 Central Appalachian Coal Basin West Virginia, USA MARSHAL MILLER & ASSOCIATES, INC. 38 Coal quality was analyzed and summarized by MM&A’s team of geologists and engineers. Quality was provided by Alpha in various database formats, laboratory data sheets, and obtained directly from MM&A’s files. Care was taken to ensure that sampled data was representative of the mineable section. In instances where minimal representative data was noted, geological tonnages were estimated based upon applying assumed densities of coal and non-coal material to thicknesses expressed in geological database files. 9.2 Limitations As with any exploration program, localized anomalies cannot always be discovered. The greater the density of the samples taken, the less the risk. Once an area is identified as being of interest for inclusion in the mine plan, additional samples are taken to help reduce the risk in those specific areas. In general, provision is made in the mine planning portion of the study to allow for localized anomalies that are typically classed more as a nuisance than a hinderance. 9.3 Opinion of Qualified Person Sufficient data has been obtained through various exploration and sampling programs and mining operations to support the geological interpretations of seam structure and thickness for coal horizons situated on the Marfork Property. The data is of sufficient quantity and reliability to reasonably support the coal resource and coal reserve estimates in this TRS. 10 Mineral Processing and Metallurgical Testing 10.1 Testing Procedures Basic chemical analyses (both raw and washed quality), petrographic data, rheological data and ash, ultimate and sulfur analysis are available but not summarized for this filing. Available coal quality data sourced from MM&A’s vaults (associated with former projects for Alpha and its predecessors) and provided by Alpha was tabulated by resource area in a Microsoft® EXCEL workbook. Such data contained laboratory sheets which MM&A utilized to confirm that sampled intervals were representative of geological models and confirm that appropriate laboratory procedures were utilized to derive raw and clean coal parameters. Additionally, Alpha provided MM&A with a database of its own in-house coal quality information which did not include backup laboratory information or sampled intervals. MM&A compared wash recovery values from Alpha’s dataset to proximal holes with wash recovery data in MM&A’s dataset and calculated estimates of wash recovery based upon the relative percentages of coal and rock from lithologic descriptions. In general, MM&A found that Alpha’s dataset was representative and appropriate for inclusion in coal quality summaries. Quality tables also provide basic statistical analyses of the coal quality datasets, including

Alpha Metallurgical Resources, Inc. Statement of Coal Resources and Reserves for the Marfork Mining Complex in Accordance with United States SEC Standards as of December 31, 2023 Central Appalachian Coal Basin West Virginia, USA MARSHAL MILLER & ASSOCIATES, INC. 39 average value; maximum and minimum values; and the number of samples available to represent each quality parameter of the seam. Coal samples that were deemed by MM&A geologists to be unrepresentative were not used for statistical analysis of coal quality, as documented in the tabulations. The amount and areal extent of coal sampling for geological data is generally sufficient to represent the quality characteristics of the coal horizons and allow for proper market placement of the subject coal seams. For some of the coal deposits, there are considerable laboratory data from core samples that are representative of the full extent of the resource area; and for others there are more limited data to represent the resource area. For example, in the active operations with considerable previous mining, there may be limited quality data within some of the remaining resource areas; however, in those cases the core sampling data can be supplemented with operational data from mining and shipped quality samples representative of the resource area. 10.2 Relationship of Tests to the Whole The extensive sampling and testing procedures typically followed in the Coal Industry result in an excellent correlation between samples and Marketable product. As shipped analyses of the coal from Marfork were reviewed to verify that the coal quality and characteristics were as expected. The Marfork Property has a long history of saleable production, in the High-volatile metallurgical and thermal markets, confirming exploration results. In select instances, those areas which did not contain exploration information inclusive of coal quality analysis but were located relatively adjacent to active producing areas and/or areas which contained coal quality information were downgraded to a “probable” classification. Based upon the extensive production history locally and regionally, the report authors deemed this process acceptable. 10.3 Lab Information Each sample is analyzed at area Laboratories that operate in accordance with procedures defined under ASTM standards including, but not limited to; washability (ASTM D4371); ash (ASTM D3174); sulfur (ASTM D4239); Btu/lb. (ASTM D5865); volatile matter (ASTM D3175); Free Swell Index (FSI) (ASTM D720). 10.4 Relevant Results No critical factors have been found that would adversely affect the recovery of the Reserve. Any quality issues that occur, either localized or generally, are accounted for in the Marketing Study done for this TRS. Alpha Metallurgical Resources, Inc. Statement of Coal Resources and Reserves for the Marfork Mining Complex in Accordance with United States SEC Standards as of December 31, 2023 Central Appalachian Coal Basin West Virginia, USA MARSHAL MILLER & ASSOCIATES, INC. 40 11 Mineral Resource Estimates MM&A created independent geologic models to define the coal resources at Marfork. Coal resources were estimated as of December 31, 2023. 11.1 Assumptions, Parameters and Methodology Geological data was imported into Carlson Mining® (formerly SurvCADD®) geological modelling software in the form of Microsoft® Excel files incorporating drill hole collars, seam and thickness picks, bottom seam elevations and raw and washed coal quality. These data files were validated prior to importing into the software. Once imported, a geologic model was created, reviewed, and verified with a key element being a gridded model of coal seam thickness. Resource tons were estimated by using the seam thickness grid based on each valid point of observation and by defining resource confidence arcs around the points of observation. Points of observation for Measured and Indicated confidence arcs were defined for all valid drill holes that intersected the seam using standards deemed acceptable by MM&A based on a detailed geologic evaluation and a statistical analysis of all drill holes within the projected reserve areas as described in Section 11.1.1. The geological evaluation incorporated an analysis of seam thickness related to depositional environments, adjacent roof, and floor lithologies, and structural influences. After validating coal seam data and establishing correlations, the seam thickness, coal thickness and elevation for seams of economic interest were used to generate a geologic model. Local geologic and physical conditions were incorporated into the model where mineability and or mining costs could be affected by the conditions. Both coal thickness and quality data are deemed by MM&A to be reasonably sufficient within the resource areas. Therefore, there is a reasonable level of confidence in the geologic interpretations required for coal resource determination based on the available data and the techniques applied to the data. Table 11-1 below provides the geological mapping and coal tonnage estimation criteria used for the coal resource and reserve evaluation. These cut-off parameters have been developed by MM&A based on its experience with the Alpha Property and are typical of mining operations in the Central Appalachian coal basin. This experience includes technical and economic evaluations of numerous properties in the region for the purposes of determining the economic viability of the subject coal reserves.

Alpha Metallurgical Resources, Inc. Statement of Coal Resources and Reserves for the Marfork Mining Complex in Accordance with United States SEC Standards as of December 31, 2023 Central Appalachian Coal Basin West Virginia, USA MARSHAL MILLER & ASSOCIATES, INC. 41 Table 11-1: General Reserve & Resource Criteria Item Parameters Technical Notes & Exceptions* • General Reserve Criteria Reserve Classification Reserve and Resource Coal resources as reported are inclusive and exclusive of coal reserves. Reliability Categories Reserve (Proven and Probable) Resource (Measured, Indicated & Inferred) To better reflect geological conditions of the coal deposits, distance between points of observation is determined via statistical analysis Proven and Measured Classification 0.25 Mile, (1320’) Projection form Measurement Point Based on 11.1.1 Analysis Probable and Indicated Classification 0.25 to 0.75 Mile, (1320’ to 3960’) Projection form Measurement Point Based on 11.1.1 Analysis; Required for Reserve or Resource Classification Inferred Classification 0.75 to 3.0 Mile, (3960’ to 15,840) Projection form Measurement Point Based on 11.1.1 Analysis Effective Date of Resource Estimate December 31, 2023 Coal resources were estimated based upon depletion maps as of September 30, 2023 for underground mines and as of June 30, 2023 for surface mines, along with third and fourth quarter 2023 production depletion adjustment. Effective Date of Reserve Estimate December 31, 2023 Coal reserves were estimated based upon depletion maps as of September 30, 2023 for underground mines and as of June 30, 2023 for surface mines, along with third and fourth quarter 2023 production depletion adjustment. Seam Density - with Raw Seam Analysis 1.25 + (Raw Ash% / 100) Seam Density - without Raw Seam Analysis Estimated by (1) assuming specific gravity of 1.30 for coal and 2.25 for rock parting • Underground-Mineable Criteria Map Thickness Total seam thickness Minimum Seam Thickness 25 inches Glen Alum Seam; 30 inches all Other Seams Minor Exceptions for localized zones of thinner coal Minimum Mining Thickness 54 inches Minimum Total Coal Thickness 25 inches Glen Alum Seam; 30 inches all Other Seams Minor Exceptions for localized zones of thinner coal Minimum In-Seam Wash Recovery Determined as function of seam thickness Wash Recovery Applied to Coal Reserves Based on average yield for drill holes within reserve area, or in the absence of laboratory washability data, based on estimated visual recovery using specific gravities noted above and 95 percent yield on "clean" coal Out-of-Seam Dilution Thickness for Run-of-Mine Tons Applied to ROM tonnages Delta between minimum mining thickness (54 inches) and seam thickness 2 inches minimum OSD Mine Barrier 200-foot distance from abandoned mines and 50’ sealed or pillared areas of active Alpha mines Minimum Reserve Tonnage 400 thousand recoverable tons for individual area (logical mining unit) Minimum Overburden Depth 100 feet Minimum Interval to Rider Coal Considered on a case-by-case basis, depending on interval lithology, etc. Minimum Interval to Overlying or Underlying Reserves Considered on a case-by-case basis, depending on interval lithology, extent, and type of extraction, etc. Minimum Interval to Overlying or Underlying Mined Areas Considered on a case-by-case basis, depending on interval lithology, extent, and type of extraction, etc. Adjustments Applied to Coal Reserves 6.0 percent moisture increase; 5 percent preparation plant inefficiency • Surface-mineable Criteria Mining Type Surface mining Highwall mining (HWM) Coal Density Used laboratory apparent specific gravity data where available. Otherwise use raw ash formula: Sp. Gr. = (% Raw Ash/100) + 1.25 Alpha Metallurgical Resources, Inc. Statement of Coal Resources and Reserves for the Marfork Mining Complex in Accordance with United States SEC Standards as of December 31, 2023 Central Appalachian Coal Basin West Virginia, USA MARSHAL MILLER & ASSOCIATES, INC. 42 Item Parameters Technical Notes & Exceptions* Used estimated specific gravity based on 1.30 specific gravity for coal and 2.25 specific gravity for rock where no lab data was available. This is also referred to as EVR or Estimated Visual Recovery method. EXCEPTION: Used 1800 tons per acre foot for seams with no quality data on surface reserve calculation Surface Property Control Controlled Surface-mineable coal resource estimated where mineral and surface rights are controlled. No resource estimated if mineral rights are not controlled. Uncontrolled Surface-mineable coal resource estimated where surface is uncontrolled if mineral rights are controlled. Basis for Coal Tonnage Thickness of recoverable coal less removable partings Minimum thickness of removable parting for surface- mineable seam is 0.25-foot generally. Minimum Total seam thickness for Single Cut Contour 2.0 feet (*) Minimum Thickness of Principal Seam in Multi-Seam Areas 1.0 foot (*) Minimum Thickness of Secondary Seam 0.5 foot Secondary seam is within 2.5 feet of principal seam Mine Strip Ratio 18:1 BCY /ton ratio for metallurgical coal & 15:1 BCY/ton for thermal coal surface mine strip ratios are targets and can vary some by cut or job. Minimum Total seam thickness for High Wall Miner 2.0 feet (*) Seam thickness can vary within a panel. Areas Considered for Surface- mineable Coal Resource Permitted and potential permit areas provided by Alpha Note: Exceptions for application of these criteria to reserve estimation are made as warranted and demonstrated by either actual mining experience or detailed data that allows for empirical evaluation of mining conditions. Final classification of coal reserve is made based on the pre-feasibility evaluation. 11.1.1 Geostatistical Analysis MM&A completed a geostatistical analysis on drill holes within the reserve boundaries to determine the applicability of the common United States classification system for measured and indicated coal resources. Historically, the United States has assumed that coal within ¼-mile (1,320 feet) of a point of observation represents a measured resource whereas coal between ¼-mile (1,320 feet) and ¾-mile (3,960 feet) from a point of observation is classified as indicated. Inferred resources are commonly assumed to be located between ¾-mile (3,960 feet) and 3 miles (15,840 feet) from a point of observation. Per SEC regulations, only measured and indicated resources may be considered for reserve classification, respectively as proven and probable reserves. MM&A performed a geostatistical analysis test of the Marfork Eagle data set using the Drill Hole Spacing Analysis (DHSA) method. This method attempts to quantify the uncertainty of applying a measurement from a central location to increasingly larger square blocks and provides recommendations for determining the distances between drill holes for measured, indicated, and inferred resources. To perform DHSA the data set was processed to remove any erroneous data points, clustered data points, as well as directional trends. This was achieved using histograms, as seen in Figure 11-1, color coded scatter plots showing the geospatial positioning of the borings, Figure 11-2, and trend analysis.

Alpha Metallurgical Resources, Inc. Statement of Coal Resources and Reserves for the Marfork Mining Complex in Accordance with United States SEC Standards as of December 31, 2023 Central Appalachian Coal Basin West Virginia, USA MARSHAL MILLER & ASSOCIATES, INC. 43 Figure 11-1: Histogram of the Total Seam Thickness for the Eagle Seam Present in the Marfork Mining Complex Figure 11-2: Scatter plot of the Total Seam Thickness for the Eagle Seam Present in the Marfork Mining Complex Following the completion of data processing, a variogram of the data set was created, Figure 11-3. The variogram plots average square difference against the separation distance between the data pairs. The separation distance is broken up into separate bins defined by a uniform lag distance (e.g., for a lag distance of 500 feet the bins would be 0 – 500 feet, 501 – 1,000 feet, etc.). Each pair of data points that are less than one lag distance apart are reported in the first bin. If the data pair is further apart than one lag distance but less than two lag distances apart, then the variance is reported in the second bin. The numerical average for differences reported for each bin is then plotted on the variogram. Care was taken to define the lag distance in such a way as to not overestimate any nugget effect present in the data set. Lastly, modeled equations, often spherical, gaussian, or exponential, are applied to the variogram to represent the data set across a continuous spectrum. Alpha Metallurgical Resources, Inc. Statement of Coal Resources and Reserves for the Marfork Mining Complex in Accordance with United States SEC Standards as of December 31, 2023 Central Appalachian Coal Basin West Virginia, USA MARSHAL MILLER & ASSOCIATES, INC. 44 Figure 11-3: Variogram of the Total Seam Thickness for the Eagle Seam Present in the Marfork Mining Complex The estimation variance is then calculated using information from the modeled variogram as well as charts published by Journal and Huijbregts (1978). This value estimates the variance from applying a single central measurement to increasingly larger square blocks. Care was taken to ensure any nugget effect present was added back into the data. This process was repeated for each test block size. The final step of the process is to calculate the global estimation variance. In this step the number square blocks that would fit inside the selected study area is determined for each block size that was investigated in the previous step. The estimation variance is then divided by the number of blocks that would fit inside the study area for each test block size. Following this determination, the data is then transformed back to represent the relative error in the 95th-percentile range. Figure 11-4 shows the results of the DHSA performed on the Eagle seam data for the Marfork Mining Complex. DHSA provides hole to hole spacing values, these distances need to be converted to radius from a central point to compare to the historical standards. A summary of the radius data is shown in

Alpha Metallurgical Resources, Inc. Statement of Coal Resources and Reserves for the Marfork Mining Complex in Accordance with United States SEC Standards as of December 31, 2023 Central Appalachian Coal Basin West Virginia, USA MARSHAL MILLER & ASSOCIATES, INC. 45 Table 11-2. DHSA prescribes measured, indicated, and inferred drill hole spacings be determined at the 10-percent, 20-percent, and 50-percent levels of relative error, respectively. Figure 11-4: Result of DHSA for the Eagle Seam Present in the Marfork Mining Complex Table 11-2: DHSA Results Summary for Radius from a Central Point Model: Measured Radial Distance (10% Relative Error) Indicated Radial Distance (20% Relative Error) Inferred Radial Distance (50% Relative Error) (Miles) (Miles) (Miles) Gaussian: 0.46 0.87 2.10 Spherical: 0.45 0.82 1.96 Exponential: 0.43 0.77 1.79 Comparing the results of the DHSA to the historical standards, it is evident that the historical standards are more conservative than even the most conservative DHSA model with regards to determining measured resources. The Spherical model recommends using a radius of 0.45 miles for measured resources compared to the historical value of 0.25 miles. With respect to indicated resources the DHSA falls in line closely with the historical standards. The Spherical model recommends using a radius 0.82 miles, while the Gaussian model recommends a radius of 0.87 miles and Exponential model recommends a radius of 0.77 miles. These values line up closely with the historical radius of 0.75 miles. These results have led the QP’s to report the data following the historical classification standards, as outlined in United States Geological Survey Circular 891 rather than use the results of the DHSA. Alpha Metallurgical Resources, Inc. Statement of Coal Resources and Reserves for the Marfork Mining Complex in Accordance with United States SEC Standards as of December 31, 2023 Central Appalachian Coal Basin West Virginia, USA MARSHAL MILLER & ASSOCIATES, INC. 46 11.2 Resources Exclusive of Reserves The Marfork Property contains multiple resource blocks which were not deemed to exhibit reserve potential at the time of the study. These resources, formally identified as resources exclusive of reserves, are in the: Chilton, Upper, Middle and Lower Cedar Groves, Powellton, Eagle, Glen Alum Tunnel, Beckley, and Fire Creek seams. Reasons which may preclude elevation of resources to reserves include, but are not limited to: 1. Limited availability of quality information to document coal seam market characteristics. a. Chilton Seam – Map 1: limited metallurgical analysis. b. Lower Winifrede – Map W-2: The Lower Winifrede and above coal seams in the Workman Eagle #2 Permit lack coal quality information and are deemed a resource. 2. Coal quality inconsistent with typical preferred market properties. a. Chilton Seam – Map 1: historically not a coking coal, sulfur >1%. 3. Isolation of resource blocks in which seam access costs are cost prohibitive at the time of the study. a. Titan Middle Cedar Grove – Map 4: eastern resource block isolated from reserve by below cutoff coal thickness. b. Black King Lower Cedar Grove – Map 5: isolated block bound on three sides by abandoned mine workings. c. Black King Area Upper Cedar Grove – Map 3: physical locations for access not identified and engineering and evaluation not completed to be included in the LOM planning. d. Marfork Area Eagle A – Map 8: physical locations for access not identified and engineering and evaluation not completed to be included in the LOM planning. e. Laurel Creek Area Upper Eagle – Map 7B: physical locations for access not identified and engineering and evaluation not completed to be included in the LOM planning. f. Glen Alum Tunnel – Map 10: resource block located north of a sandstone washout. g. Slip Ridge Area Powellton Seam – Map 6: two separated resource blocks that would need to development through below cutoff coal thickness. 4. Unfavorable economics at the PFS level, yet economics could become attractive in the future under different market conditions. a. 10-B Area Powellton Seam – Map 6: uncertain access through a sealed existing mine or a faceup where the surface is not controlled.

Alpha Metallurgical Resources, Inc. Statement of Coal Resources and Reserves for the Marfork Mining Complex in Accordance with United States SEC Standards as of December 31, 2023 Central Appalachian Coal Basin West Virginia, USA MARSHAL MILLER & ASSOCIATES, INC. 47 b. Mountain Laurel Beckley – Map 11: below-drainage slope access and raw haul to coal processing. c. Mountain Laurel Fire Creek – Map 12: below-drainage slope access and raw haul to coal processing. 5. Exclusion from LOM planning by mining operator due to remaining resource blocks which are relatively small, isolated blocks and not currently attractive from an operational perspective. a. 10-B Area Powellton Seam - Map 6: uncertain access through a sealed existing mine or a faceup where the surface is not controlled. b. Sycamore Eagle– Map 9: isolated block. c. Roland Beckley - Map 11: isolated block where additional mineral control is needed for access. 6. Mineability constraints due to over/under mining, underground conditions, and physical locations. a. Dow Fork Eagle – Map 9: inferred resource adjacent to inclusive LOM plan. b. Sycamore Eagle – Map 9: mine plan is not defined as whether deep mine or surface mine. Jurisdictional water determinations have not been completed for a surface assessment. c. Panther Eagle – Map 9: single area in north of the portal area with sandstone roof and hard floor that create difficult cutting for the continuous miners. d. Mountain Laurel Beckley – Map 11: two below-drainage coal blocks located on the north side of Beckley, West Virginia. Overburden depth is 360 feet to 920 feet. These blocks are questionable due to permitting and potential liability of a mine under an urban area with shopping malls, residential areas, Interstate and State highways. e. Mountain Laurel Fire Creek – Map 12: single coal block located approximately 70 feet to 110 feet below the Mountain Laurel Beckley. Would require an in-mine slope from the Beckley seam for access. 11.2.1 Initial Economic Assessment MM&A completed an initial economic assessment to determine the potential economic viability of resources exclusive of reserves. MM&A applied relevant technical factors to estimate potential saleable tons without the resource blocks, should the resources be extracted via deep, continuous mining methods. MM&A developed cash cost profiles for the resource blocks, including direct cash costs (labor, supplies, roof control, maintenance and repair, power, and other); washing, trucking, materials handling, general and administrative, and environmental costs; and indirect cash costs (royalties, production taxes, property tax, insurance). Costs were developed based off relevant cost drivers (per-ft, per-raw-ton, per-clean-ton). Additionally, MM&A estimated capital costs to access Alpha Metallurgical Resources, Inc. Statement of Coal Resources and Reserves for the Marfork Mining Complex in Accordance with United States SEC Standards as of December 31, 2023 Central Appalachian Coal Basin West Virginia, USA MARSHAL MILLER & ASSOCIATES, INC. 48 resources. Capital costs associated with mine development were amortized across the resource’s potential saleable tonnages). Additional non-cash items (depreciation of equipment and depletion) and cash costs were compared to an assumed sale price of $140 per ton netback FOB loadout (approximately $171 per ton U.S. East Coast basis) for metallurgical and thermal markets. This resource assumed sales value was developed as a premium to the market-based reserve sales value to properly estimate the sales-related expenses should these resources be extracted during higher-than-average market conditions. The pricing used for the primary product was selected by the QP and was deemed reasonable based on a review of historical average pricing for the Marfork Mining Complex coal products over the past 5 years. The results of the analysis are shown below and demonstrate potential profitability on a fully loaded cost basis. Detailed summaries are shown in Appendix B. Table 11-3: Results of Initial Economic Assessment ($/ton) Mine Resource Block Direct Cash Transportation, Washing, Enviro, G&A Indirect Non-Cash Total Cost Fully Loaded P&L Seng Creek Chilton $50.36 $31.19 $17.47 $12.50 $111.52 $28.48 Glen Alum GAT $69.66 $24.11 $12.57 $16.76 $123.09 $16.91 Titan Block D MCG $63.74 $29.66 $11.87 $19.86 $125.13 $14.87 Black King Block A1 LCG $66.32 $24.15 $11.87 $7.73 $110.08 $29.92 Black King Block D LCG $59.09 $23.08 $13.27 $14.73 $110.17 $29.83 Black King UCG UCG $75.74 $24.93 $11.87 $15.89 $128.43 $11.57 Dow Fork Eagle EG $66.58 $39.16 $17.47 $7.73 $130.94 $9.06 Sycamore Eagle EG $55.50 $23.07 $17.47 $18.18 $114.23 $25.77 Panther Eagle EG $65.20 $23.03 $11.87 $7.73 $107.83 $32.17 Beckley Mt. Laurel BEC $69.16 $28.95 $4.87 $34.14 $137.13 $2.87 Beckley Workman BEC $55.77 $20.50 $17.47 $15.40 $109.14 $30.86 Firecreek Mt. Laurel FC $74.99 $31.23 $3.47 $25.39 $135.09 $4.91 Marfork Eagle A Blocks B&C EGA $70.48 $33.71 $13.27 $9.65 $127.10 $12.90 Powellton Block 10-B POW $66.40 $25.09 $13.27 $16.02 $120.78 $19.22 Marfork Eagle A Block A EGA $63.38 $24.94 $11.87 $11.60 $111.79 $28.21 Laurel Br UEG $73.43 $33.10 $11.87 $10.79 $129.19 $10.81 Slip Ridge Powellton POW $71.45 $33.95 $11.87 $20.98 $138.25 $1.75 Glen Alum Block B1 GAT $54.08 $29.19 $11.87 $9.73 $104.87 $35.13 Workman Creek (WIN & Above) Various $55.07 $14.17 $20.45 $5.72 $95.41 $44.59

Alpha Metallurgical Resources, Inc. Statement of Coal Resources and Reserves for the Marfork Mining Complex in Accordance with United States SEC Standards as of December 31, 2023 Central Appalachian Coal Basin West Virginia, USA MARSHAL MILLER & ASSOCIATES, INC. 49 Figure 11-5: Results of Initial Economic Assessment 11.3 Qualified Person’s Estimates Based on the work previously described and detailed modelling of those areas, considering all the modifying actors, a coal resource estimate, summarized in Table 11-4, was prepared as of December 31, 2023, for Marfork Property controlled by Alpha. Table 11-4: Coal Resources Summary as of December 31, 2023 Coal Resource (Dry Tons, In Situ) Area/Mine Seam Measured Indicated Inferred Total Inclusive of Reserve (Converted to Reserve) Workman Creek Surface Multi 18,115,000 391,000 9,000 18,515,000 Workman Creek HWM Multi 12,734,000 190,000 0 12,924,000 Laurel Area Hernshaw 19,513,000 5,902,000 0 25,415,000 Coon Cedar Grove Upper Cedar Grove 4,264,000 182,000 0 4,446,000 Ellis Cedar Grove Upper Cedar Grove 4,869,000 31,000 0 4,899,000 Titan MCG Middle Cedar Grove 10,849,000 4,649,000 0 15,498,000 Low Gap MCG Middle Cedar Grove 1,920,000 14,000 0 1,935,000 Black King I Lower Cedar Grove 20,019,000 3,428,000 0 23,447,000 Berwind Lower Cedar Grove 6,315,000 251,000 0 6,566,000 Beetree Powellton 1,005,000 333,000 0 1,338,000 Workman Upper Eagle 3,712,000 114,000 0 3,826,000 Black Eagle Eagle 24,876,000 12,506,000 2,000 37,384,000 Dow Fork Eagle 33,789,000 15,524,000 0 49,312,000 Panther Eagle Eagle 6,746,000 1,474,000 0 8,220,000 Horse Creek Eagle 1,303,000 326,000 0 1,630,000 Glen Alum Tunnel Glen Alum Tunnel 9,675,000 3,929,000 217,000 13,821,000 Workman Beckley 50,253,000 43,362,000 0 93,615,000 Subtotal Subtotal 229,957,000 92,606,000 228,000 322,790,000 Alpha Metallurgical Resources, Inc. Statement of Coal Resources and Reserves for the Marfork Mining Complex in Accordance with United States SEC Standards as of December 31, 2023 Central Appalachian Coal Basin West Virginia, USA MARSHAL MILLER & ASSOCIATES, INC. 50 Coal Resource (Dry Tons, In Situ) Area/Mine Seam Measured Indicated Inferred Total Inclusive of Reserve (Converted to Reserve) Exclusive of Reserve Workman Creek Surface Multi 3,981,000 848,000 5,000 4,834,000 Workman Creek HWM Multi 0 0 0 0 Elk Run - Seng Creek Chilton 14,555,000 11,353,000 0 25,907,000 Black King Upper Cedar Grove 25,826,000 2,064,000 0 27,891,000 Titan Middle Cedar Grove 393,000 8,000 0 401,000 Black King LCG Lower Cedar Grove 4,589,000 644,000 0 5,234,000 Powellon 10-B Powellton 3,533,000 211,000 0 3,744,000 Slip Ridge Powellton Powellton 656,000 17,000 0 673,000 Laurel Branch Upper Eagle 6,880,000 1,863,000 0 8,743,000 Marfork Eagle A 14,547,000 5,555,000 8,000 20,109,000 Dow Fork Eagle 0 0 1,320,000 1,320,000 Panther Eagle Eagle 2,762,000 495,000 0 3,257,000 Sycamore Eagle 7,278,000 896,000 0 8,173,000 Glen Alum Tunnel Glen Alum Tunnel 1,936,000 1,747,000 223,000 3,906,000 Workman Beckley 2,934,000 5,605,000 57,000 8,596,000 Mountain Laurel Beckley 14,800,000 14,565,000 55,000 29,420,000 Mountain Laurel Fire Creek 4,389,000 1,506,000 0 5,895,000 Subtotal Subtotal 109,059,000 47,377,000 1,667,000 158,103,000 Grand Total Inclusive of Reserve 229,957,000 92,606,000 228,000 322,790,000 Exclusive of Reserve 109,059,000 47,377,000 1,667,000 158,103,000 Grand Total 339,016,000 139,983,000 1,895,000 480,894,000 Note (1): Resource tons are inclusive of reserve tons since they include the in-situ tons from which recoverable coal reserves are derived. Note (2): Coal resources are reported on a dry basis. Surface moisture and inherent moisture are excluded. Note (3): The Property contains 156.4 million tons (Mt) of dry, in-place measured and indicated coal resources exclusive of reserves (not converted to reserve) as of December 31, 2023. Totals may not add due to rounding. See Appendix A for detailed breakdown. 11.4 Qualified Person’s Opinion While there is some stratigraphically controlled seam-thickness variability due to seam splitting, sand channels, etc., MM&A geologists and engineers modeled the deposit and resource areas to reflect realistic mining scenarios, giving special consideration to uncertainties as related to each class of mineral resources such as (1) seam thickness, (2) floor and roof conditions, (3) mining equipment, etc. This statistical study demonstrates that for each configuration of mineable seams, the classification system of measured (0 – ¼ mile), indicated (¼ to ¾ mile), and inferred (¾ to 3 miles) is reasonably adequate to predict seam thickness variation for modeling and mining purposes. Based on MM&A’s geostatistical analysis, it would be possible to extend the measured, and indicated arcs slightly beyond historically accepted practices due to consistent geological settings. The QP’s have again elected not to extend arc distances, introducing a level of conservatism in measured and indicated coal classification. Based on the data review, the attendant work done to verify the data integrity and the creation of an independent Geologic Model, MM&A believes this is a fair and accurate representation of the Marfork coal resources.

Alpha Metallurgical Resources, Inc. Statement of Coal Resources and Reserves for the Marfork Mining Complex in Accordance with United States SEC Standards as of December 31, 2023 Central Appalachian Coal Basin West Virginia, USA MARSHAL MILLER & ASSOCIATES, INC. 51 12 Mineral Reserve Estimates 12.1 Assumptions, Parameters and Methodology Coal Reserves are classified as proven or probable considering “modifying factors” including mining, metallurgical, economic, marketing, legal, environmental, social, and governmental factors. > Proven Coal Reserves are the economically mineable part of a measured coal resource, adjusted for diluting materials and allowances for losses when the material is mined. It is based on appropriate assessment and studies in consideration of and adjusted for reasonably assumed modifying factors. These assessments demonstrate that extraction could be reasonably justified at the time of reporting. > Probable Coal Reserves are the economically mineable part of an indicated coal resource, and in some circumstances a measured coal resource, adjusted for diluting materials and allowances for losses when the material is mined. It is based on appropriate assessment and studies in consideration of and adjusted for reasonably assumed modifying factors. These assessments demonstrate that extraction could be reasonably justified at the time of reporting. Upon completion of delineation and calculation of coal resources, MM&A generated a LOM plan for Marfork. The footprint of each reserve area is shown on the maps in Appendix C. The Mine plan was generated based on 5-year budget mine plans provided by Alpha and supplemented with additional projections by MM&A to reflect LOM plans that honor property control limits, geologic mapping, or other factors determined during the evaluation. Carlson Mining software was used to generate the LOM plan for Marfork. The mine plan was sequenced based on productivity schedules provided by Alpha. MM&A judged the productivity estimates and plans to be reasonable based on experience and current industry practice. Raw, ROM production data outputs from LOM plan sequencing were processed into Microsoft® EXCEL spreadsheets and summarized on an annual basis for processing into the economic model. Average seam densities were estimated to determine raw coal tons produced from the LOM plan. Average mine recovery and wash recovery factors were applied to determine coal reserve tons. Coal reserve tons in this evaluation are reported at a 6.0-percent moisture and represent the saleable product from the Property. Pricing data as provided by Alpha is described in Table 16-2. The pricing data assumes a flat-line long- term realization of $162 per short ton port pricing, with an average $132.51 per ton netback pricing reflective of the high-volatile product currently sold at Marfork, and $163 per short ton port loading with an average of $127.26 per short ton netback pricing reflective of the low-volatile product. A Alpha Metallurgical Resources, Inc. Statement of Coal Resources and Reserves for the Marfork Mining Complex in Accordance with United States SEC Standards as of December 31, 2023 Central Appalachian Coal Basin West Virginia, USA MARSHAL MILLER & ASSOCIATES, INC. 52 portion of the surface mine production is also thermal product which assumes a flat-line long term realization of $74 per short ton with an average of $65.52 per ton netback pricing. The LOM blended average netback pricing for the Marfork reserves is $127.67 per ton. These estimates are based on long-term pricing published by third party sources and adjusted for quality and transportation. The coal resource mapping and estimation process, described in the report, was used as a basis for the coal reserve estimate. Proven and probable coal reserves were derived from the defined coal resource considering relevant processing, economic (including technical estimates of capital, revenue, and cost), marketing, legal, environmental, socio-economic, and regulatory factors and are presented on a moist, recoverable basis. As is customary in the US, the categories for proven and probable coal reserves are based on the distances from valid points of measurement as determined by the QP for the area under consideration. For this evaluation, measured resource, which may convert to a proven reserve, is based on a ¼-mile radius from a valid point of observation. Points of observation include exploration drill holes, and mine measurements which have been fully vetted and processed into a geologic model. The geologic model is based on seam depositional modeling, the interrelationship of overlying and underlying strata on seam mineability, seam thickness trends, the impact of seam structure, intra-seam characteristics, etc. Once the geologic model was completed, a statistical analysis, described in Section 11.1.1 was conducted and a ¼-mile radius from a valid point of observation was selected to define Measured Resources. Likewise, the distance between ¼ and ¾ of a mile radius was selected to define Indicated Resources. Indicated Resources may convert to Probable Reserves. Inferred Resources (greater than a ¾-mile radius from a valid point of observation) have been excluded from Reserve consideration. 12.2 Mineral Reserves The Marfork Mine Complex reserves are derived from multiple coal seams as shown on Figure 7-1 and Figure 7-2. Reserves are estimated for both surface and underground mining. Surface reserves were derived from multiple seams and underground reserves were derived from nine seams. The underground accessed seams include above drainage seams from the Hernshaw down to the Glen Alum Tunnel; the Beckley seam located below drainage east of the surface mines. Demonstrated reserve tons are listed in the discussion below. Tables 12-1 and 12-2 show the demonstrated tonnage by Proven and Probable status.

Alpha Metallurgical Resources, Inc. Statement of Coal Resources and Reserves for the Marfork Mining Complex in Accordance with United States SEC Standards as of December 31, 2023 Central Appalachian Coal Basin West Virginia, USA MARSHAL MILLER & ASSOCIATES, INC. 53 12.2.1 Surface Reserves The Workman Creek surface operations are active mines with contour and highwall miner reserves. Estimated LOM average mine ratios bank cubic yards per ton (BCY/Ton) do not exceed 20 to 1 for the reserve estimates. Cross sections through drill holes with lithologic records and seam correlation tie lines have been prepared for each surface reserve and are available upon request. 12.2.1.1 Workman Creek Surface Demonstrated reserve at Workman Creek is comprised of 15.49 million surface mine tons and 4.3 million highwall miner tons from 25 different coal seams. An additional 8 seams are considered resource due to a lack of quality data. Workman Creek reserves consists of six permit areas that are adjacent to each other and are centered around the Workman Creek office and surface facility area. Table 12-1 shows the demonstrated tonnage by Proven and Probable status. Table 12-1: Workman Creek Coal Reserves Summary (Marketable Sales Basis) as of December 31, 2023 Demonstrated Coal Reserves (Wet Tons, Washed or Direct Shipped) Categories Proven Probable Total Surface Center Contour 0 3,278,200 3,278,200 Eagle No. 2 0 2,922,400 2,922,400 Long Ridge #1 0 984,500 984,500 Middle Ridge 0 798,900 798,900 Turkeyfoot 0 7,510,500 7,510,500 Grand Total 0 15,494,500 15,494,500 Highwall Miner Center Contour 1,067,200 25,700 1,092,900 Eagle No. 2 680,000 0 680,000 Long Ridge #1 580,300 0 580,300 Middle Ridge 98,400 0 98,400 Turkeyfoot 1,823,200 37,900 1,861,200 Grand Total 4,249,200 63,600 4,312,800 Total Center Contour 1,067,200 3,303,800 4,371,000 Eagle No. 2 680,000 2,922,400 3,602,400 Long Ridge #1 580,300 984,500 1,564,900 Middle Ridge 98,400 798,900 897,300 Turkeyfoot 1,823,200 7,548,500 9,371,700 Grand Total 4,249,200 15,558,100 19,807,300 Workman Creek’s six permits include: Long Ridge with demonstrated reserves of 1.56 Mt to be extracted from the Upper Chilton through the Little Eagle seams; Turkey Foot with demonstrated reserves of 9.37 Mt to be extracted from the Upper Chilton through the Little Eagle seams; Center Contour with demonstrated reserves of 4.37 Mt to be extracted from the Upper Chilton A through the Little Eagle seams; Eagle No. 2 with demonstrated reserves of 3.60 Mt to be extracted from the Upper Clarion through the Middle Cedar Grove seams; and Middle Ridge with demonstrated reserves of 0.90 Mt to be extracted from the Upper Clarion A through the Middle Cedar Grove seams. All the permits Alpha Metallurgical Resources, Inc. Statement of Coal Resources and Reserves for the Marfork Mining Complex in Accordance with United States SEC Standards as of December 31, 2023 Central Appalachian Coal Basin West Virginia, USA MARSHAL MILLER & ASSOCIATES, INC. 54 are active to varying degrees except for the Eagle 2 permit. The reserves within Eagle 2 permit may increase if the permit’s proposed hollow fills within Sycamore branch receive the necessary US Army Corps of Engineers’ (USACE) 404 permit. Lower elevation seams within the permit require the hollow fills for excess spoil storage. The reserves of the Eagle 2 permit are presently limited to upper seams that can be backfilled and can obtain excess spoil storage room from adjacent permits. 12.2.2 Underground Reserves Demonstrated reserve tons are listed in the discussion below. 12.2.3 Laurel Hernshaw (Map 2) Laurel Hernshaw demonstrated reserves are 4.58 Mt clean recoverable tons. The Hernshaw seam is generally characterized by two benches of coal with an approximate 0.5-foot to 1.0-foot shale parting. The parting thickness increases and the seam splits in the southern portion of the reserve, forming the southern reserve boundary. The average Hernshaw seam thickness of the reserve is 4.7 feet. The roof and floor rock are typically shale. A localized sandstone channel is present in the immediate roof and in the floor in the northeast portion of the reserve. This area is not included as a reserve due to mine cuttability. 12.2.4 Coon/Ellis Upper Cedar Grove (UCG) (Map 3) Coon UCG demonstrated reserves are 0.78 Mt clean recoverable tons, and Ellis area demonstrated Reserves are 0.91 Mt clean recoverable tons. Coon reserves are the remaining, unmined portion of the Coon Cedar Grove deep mine and the Ellis reserve is located on the ridge south of Coon. The UCG is generally two benches separated by an approximate 1-foot to 3-foot parting. The parting thickness increases and the seam splits in the northeast portion of the reserve, forming the eastern Coon reserve boundary. The average seam thickness of the reserve is 5.4 to 6.1 feet. Roof rock is generally sandstone, and the floor is shale. The southern limit of reserves is marked by a sandstone channel that has cut into the seam, eroding most of the coal. The northern limit to the Ellis reserve is defined by less than 30-foot of interburden to the mined out Middle Cedar Grove seam. 12.2.5 Titan Middle Cedar Grove (MCG) (Map 4) Titan MCG Demonstrated reserves are 5.24 Mt clean recoverable tons. Republic surface mine has developed a faceup area for the Titan mine. The roof and floor rock are generally cuttable shale. The seam is generally 1 to 2 coal benches separated by thin partings. A third, lower bench is present in the western part of the reserve creating a thicker seam and coal. The average seam thickness of the reserve is 3.20 feet. Sulfur averages greater than 1% west of the reserve area, although MM&A has no coal quality analysis within the reserve. With no washed coal quality analysis within the reserve boundary, the reserve is classified as a Probable Reserve.

Alpha Metallurgical Resources, Inc. Statement of Coal Resources and Reserves for the Marfork Mining Complex in Accordance with United States SEC Standards as of December 31, 2023 Central Appalachian Coal Basin West Virginia, USA MARSHAL MILLER & ASSOCIATES, INC. 55 12.2.6 Low Gap Middle Cedar Grove (MCG) (Map 4) Low Gap MCG demonstrated reserves are 0.63 Mt clean recoverable tons. The reserve is located on the hilltop immediately north of the Marfork Office. The reserve is an extension of the Marsh Fork Mine, west of Low Gap that is below the crop line. The roof and floor rock are generally cuttable shale. Sandstone is present in the roof in the southeast area of the reserves and has reduced the coal/seam thickness. The seam is generally comprised of two coal benches separated by thin parting. A third, lower bench, is present in the central part of the reserve creating a thicker seam and coal. The average seam thickness of the reserve is 3.46 feet. 12.2.7 Black King Lower Cedar Grove (LCG) (Map 5) Black King LCG Demonstrated reserves are 9.92 Mt clean recoverable tons. The reserve is located adjacent to and north and west of the closed Black King 1 Mine. Roof rock is mostly sandstone, and the floor is cuttable shale. The northeast reserve limit is defined by a sandstone washout of the coal seam. The seam is generally one clean bench of coal. The average seam thickness of the reserve is 2.81 feet. 12.2.8 Berwind Area Lower Cedar Grove Seam (LCG) (Map 5) Berwind LCG Demonstrated reserves are 2.15 Mt clean recoverable tons. The reserve is located west of Hazy Creek. Roof rock is thick sandstone, and the floor is cuttable shale. The seam is generally one clean bench of coal. The average seam thickness of the reserve is 2.8 feet. 12.2.9 Bee Tree Powellton Seam (Map 6) Beetree area Powellton reserve is located north of the Brushy Fork Impoundment and south of Little Marsh Fork and would be accessed by one portal. The eastern reserve block would be developed through below-cutoff coal thickness from the portal reserve block. Bee Tree Powellton seam demonstrated reserves are 0.45 Mt clean recoverable tons. The seam is comprised of one coal bench generally void of any partings. Roof rock is shale and sandstone on the east portion of the reserve and the floor rock is shale and fireclay. The average seam thickness of the reserve is 2.9 feet. 12.2.10 Marfork/Workman Area Upper Eagle (Map 7A) The Workman Upper Eagle reserve is located between the Marfork Deep operations and Workman surface operation. The reserve will be accessed from the surface mine bench and extract coal between the surface and highwall miner areas to the coal thickness cutoff. Demonstrated reserves are 1.02 Mt clean recoverable tons. The average seam thickness of the reserve is 3.52 feet. 12.2.11 Panther Eagle Seam (Map 9) Panther Eagle reserve is actively being mined. Demonstrated reserves are 2.68 Mt clean recoverable tons. The seam generally has two coal benches separated by a thin 0.15-foot to 0.30-foot parting. Roof rock is dominated by sandstone and may have washed out the upper coal bench where the seam thins Alpha Metallurgical Resources, Inc. Statement of Coal Resources and Reserves for the Marfork Mining Complex in Accordance with United States SEC Standards as of December 31, 2023 Central Appalachian Coal Basin West Virginia, USA MARSHAL MILLER & ASSOCIATES, INC. 56 below cutoff. The floor rock is mostly shale making the seam cuttable. The average seam thickness of the reserve is 3.13 feet. 12.2.12 Horse Creek Eagle Seam (Map 9) Horse Creek Eagle is the remaining reserve blocks to be mined from the active Horse Creek mine. Reserves were calculated for the blocks and the reserve is separated from Panther Eagle by a low coal area. The seam contains two coal benches separated by an approximately 0.3-foot parting. The roof rock is shale and sandstone, and the floor rock is generally shale. The average seam thickness of the reserve is 2.95 feet. 12.2.13 Black Eagle Mine - Eagle Seam (Map 9) Black Eagle reserve is actively being mined. Demonstrated reserves are 10.43 Mt clean recoverable tons. The seam contains two distinct coal benches with a parting up to 0.5 feet thick. The roof is mostly sandstone with localized thin shale between the seam and sandstone main roof. The floor is generally shale. The average seam thickness of the reserve is 3.25 feet. 12.2.14 Dow Fork Eagle Seam (Map 9) Dow Fork Eagle Demonstrated reserves are 10.0 Mt clean recoverable tons. The seam, consistent with other Eagle reserves, is two distinct coal benches separated by a parting. Parting is less than 1.0 foot in the west and northeast portions of the reserve. The parting thickness increases in the center portion of the reserve and eventually splits the seam creating the reserve southern limit. The roof rock is dominated by sandstone in the west and east with shale roof common in the center portion on the reserve. The floor rock is shale. The average seam thickness of the reserve is 4.1 feet. 12.2.15 Marfork/Workman Glen Alum Tunnel Seam (Map 10) Glen Alum Tunnel mine is active and the mine entrance is developed in the Workman Creek area. The seam is composed of multiple coal benches and partings. The parting above the lower coal bench increases to over 15 feet in the center portion of the Property, splitting the reserve into two blocks. The reserve is bound by a sandstone channel that has eroded the coal seam to the north and outcrop to the south. Roof and floor rock is predominantly shale with isolated areas of sandstone. The average seam thickness of the reserve is 4.7 feet. 12.2.16 Workman Beckley Seam (Map 11) Workman Beckley seam reserve is below drainage and located east of the Workman Creek facilities and west of Interstate Highway I77. Demonstrated reserves are 26.13 Mt clean recoverable tons. Overburden thickness ranges from 600 feet to over 2,000 feet along the ridges. The roof is typically sandstone with areas of shale roof. The west and east reserve limits are bound by north-south trending sandstone seam washout zones. The closed and abandoned Bonny mine encountered small scale, localized seam washouts within the reserve. Additional unidentified seam washouts are likely within

Alpha Metallurgical Resources, Inc. Statement of Coal Resources and Reserves for the Marfork Mining Complex in Accordance with United States SEC Standards as of December 31, 2023 Central Appalachian Coal Basin West Virginia, USA MARSHAL MILLER & ASSOCIATES, INC. 57 the reserve. The floor rock is generally shale. Previous mining in the Bonny and Beckley mines indicate in situ horizontal stress and methane gas will be present. The average seam thickness of the reserve is 4.3 feet. 12.3 Qualified Person’s Estimates The coal reserves, as shown in Table 12-2, are based on a technical evaluation of the geology and a preliminary feasibility study of the coal deposits. The extent to which the coal reserves may be affected by any known environmental, permitting, legal, title, socio-economic, marketing, political, or other relevant issues has been reviewed rigorously. Similarly, the extent to which the estimates of coal reserves may be materially affected by mining, metallurgical, infrastructure and other relevant factors has also been considered. The results of this TRS define an estimated 97.65 Mt of proven and probable marketable coal reserves. The maps included in Appendix C reflect mining depletion at the time of the resource/reserve calculation taken from Alpha mine maps as of September 30, 2023 for underground mines and as of June 30, 2023 for surface mines. Mine depletion tonnages were supplied by Alpha through the end of 2023, and MM&A deducted this historical production from the mapped reserves to estimate reserves as of December 31, 2023. Table 12-2: Coal Reserves Summary (Marketable Sales Basis) as of December 31, 2023 Demonstrated Coal Reserves (Wet Tons, Washed or Direct Shipped) Quality (Dry Basis) By Reliability Category By Permit Status By Control Type Seam Proven Probable Total Permitted Not Permitted Owned Leased Ash % Sulfur % VM % Workman Creek Surface 0 15,495,000 15,495,000 15,495,000 0 67,000 15,427,000 10 0.9 - Workman Creek HWM 4,249,000 64,000 4,313,000 3,544,000 769,000 0 4,313,000 6 0.9 - Hernshaw 3,562,000 1,021,000 4,583,000 0 4,583,000 0 4,583,000 5 0.8 36 Upper Cedar Grove 1,666,000 25,000 1,691,000 1,691,000 0 0 1,691,000 6 1.0 35 Middle Cedar Grove 632,000 5,238,000 5,870,000 3,932,000 1,938,000 0 5,870,000 6 1.1 37 Lower Cedar Grove 10,634,000 1,437,000 12,071,000 4,509,000 7,562,000 0 12,071,000 5 0.8 36 Powellton 336,000 116,000 452,000 275,000 177,000 0 452,000 2 0.8 - Upper Eagle 1,016,000 6,000 1,021,000 0 1,021,000 0 1,021,000 6 0.8 30 Eagle 16,052,000 7,418,000 23,470,000 16,997,000 6,474,000 368,000 23,102,000 5 0.8 33 Glen Alum Tunnel 1,847,000 708,000 2,555,000 1,285,000 1,269,000 219,000 2,335,000 5 0.9 26 Beckley 13,339,000 12,793,000 26,132,000 2,924,000 23,207,000 1,558,000 24,573,000 5 0.9 20 Grand Total 53,333,000 44,320,000 97,652,000 50,651,000 47,001,000 2,214,000 95,438,000 6 0.9 30 Notes: Marketable reserve tons are reported on a moist basis, including a combination of surface and inherent moisture. Coal quality is based on a weighted average of laboratory analysis from core holes. The combination of surface and inherent moisture is modeled at 6.0-percent. Actual product moisture is dependent upon multiple geological factors, operational factors, and product contract specifications and can exceed 8-percent. As such, the modeled moisture values provide a level of conservatism for reserve reporting. Raw quality and some volatile matter analysis not available for Workman Creek. Workman Creek surface reserves were priced at 70% High-Vol. A and 30% thermal product. Workman Creek Surface is modeled as 55% direct-ship and 45% washed to mimic what Alpha is doing, however without any raw quality data for the surface seams a quality composite could not be prepared. See Appendix A for detailed breakdown. Totals may not add due to rounding. Alpha Metallurgical Resources, Inc. Statement of Coal Resources and Reserves for the Marfork Mining Complex in Accordance with United States SEC Standards as of December 31, 2023 Central Appalachian Coal Basin West Virginia, USA MARSHAL MILLER & ASSOCIATES, INC. 58 12.4 Qualified Person’s Opinion The estimate of coal reserves was determined in accordance with the SEC S-K1300 regulations that became effective for the first fiscal year falling on or after January 1, 2021. The LOM mining plan for Marfork was prepared to the level of preliminary feasibility. Mine projections were prepared, and timing scheduled to match production with coal seam characteristics. Production timing was carried out from current locations to depletion of the coal reserve area. Coal reserve estimates could be materially affected by the risk factors described in Section 22.2. Based on the Preliminary Feasibility Study and the attendant Economic Review, MM&A believes this is a fair and accurate calculation of the Marfork coal reserves. 13 Mining Methods Twenty underground mining areas were modeled and tested economically. Once the Resources were calculated, mine plans were created to project operating each resource area to depletion, with crews and equipment scheduled to move to subsequent mining areas as depletion occurs. Underground mine operations are projected to be exhausted in 2065, while surface and highwall miner operations are projected to be exhausted in 2032. 13.1 Geotech and Hydrology Mining plans for potential underground mines were developed by Alpha and MM&A. Pillar stability was tested by MM&A using the Analysis of Coal Pillar Stability (ACPS) program that was developed by NIOSH. MM&A reviewed the results from the ACPS analysis and considered it in the development of the LOM plan. Hydrology has not been an issue of concern at Marfork. Based on numerous site visits to the underground operations of the Property by the QP’s, it has been determined that this is not a significant concern. Mining of future reserves is projected to occur in areas which exhibit similar hydrogeological characteristics as those formerly mined areas. 13.2 Production Rates Operations at the Marfork Property by Alpha and its predecessors have been on-going for many years. The Mine plan and productivity expectations reflect historical performance and efforts have been made to adjust the plan to reflect future conditions. MM&A is confident that the mine plan is reasonably representative to provide an accurate estimation of coal reserves. Mine development and operation have not been optimized within the TRS.

Alpha Metallurgical Resources, Inc. Statement of Coal Resources and Reserves for the Marfork Mining Complex in Accordance with United States SEC Standards as of December 31, 2023 Central Appalachian Coal Basin West Virginia, USA MARSHAL MILLER & ASSOCIATES, INC. 59 Carlson Mining software was used by MM&A to generate mine plans for the mineable coal seams. Mine plans were sequenced based on productivity schedules provided by Alpha, which were based on historically achieved productivity levels. All production forecasting ties assumed production rates to geological models as constructed by MM&A’s team of geologists and mining engineers. The Marfork Mining Complex currently operates four underground mines with a total of eight (8) operating sections. The Glen Alum mine is in the Workman Creek surface area and is currently active with two operating sections. The projected underground mines are set up similarly to the currently active operations. Black Eagle is operating three production sections, Panther Eagle is operating two production sections, Horse Creek Eagle is operating one production section, and the Glen Alum Mine is operating two production sections. All sections are configured with dual continuous miners in a super section operation. In all cases, mines are forecasted to produce coal two shifts each day. Production is scheduled Monday through Friday each week, and every other Saturday. As shown in Table 13-1, the twenty areas planned for underground mines produce coal until 2065. Clean coal production varies directly with coal thickness. Table 13-1: Marfork Mining Complex Underground Mine Production Schedule (x 1,000 Saleable Tons) Mine Name 2023 2024 2025 2026 2027 2028 2029 2030 Laurel Hernshaw 0 0 0 0 46 307 328 332 Black King LCG Brown's Br 0 0 0 0 0 0 0 0 Workman Upper Eagle 0 0 0 0 0 0 0 249 Berwind LCG 0 0 0 0 0 0 0 0 Low Gap MCG 0 0 0 0 0 0 0 0 Titan MCG 0 0 0 0 0 0 0 0 Coon UCG 0 0 0 0 0 0 0 0 Ellis UCG 0 0 0 0 0 0 0 0 Bee Tree Powellton 0 0 0 0 0 0 0 0 Black Eagle 222 893 766 617 608 615 627 635 Dow Fork Eagle 0 0 0 0 0 0 62 449 Horse Creek Eagle 71 283 11 0 0 0 0 0 Panther Eagle 129 544 507 562 525 247 248 50 Workman's Creek Beckley 0 0 0 0 0 0 0 0 Glen Alum Tunnel 97 491 401 365 393 452 391 84 Total 519 2,211 1,685 1,544 1,572 1,622 1,656 1,799 Alpha Metallurgical Resources, Inc. Statement of Coal Resources and Reserves for the Marfork Mining Complex in Accordance with United States SEC Standards as of December 31, 2023 Central Appalachian Coal Basin West Virginia, USA MARSHAL MILLER & ASSOCIATES, INC. 60 Mine Name 2031 2032 2033 2034 2035 2036 2037 2038 Laurel Hernshaw 327 310 270 290 292 276 314 327 Black King LCG Brown's Br 0 0 0 0 0 0 0 0 Workman Upper Eagle 273 219 246 35 0 0 0 0 Berwind LCG 0 0 0 0 0 0 0 0 Low Gap MCG 0 0 0 0 0 0 0 0 Titan MCG 0 0 0 0 0 0 0 0 Coon UCG 0 0 0 0 0 0 0 0 Ellis UCG 0 0 0 0 0 0 0 0 Bee Tree Powellton 0 0 0 217 232 3 0 0 Black Eagle 640 651 630 616 616 590 608 606 Dow Fork Eagle 601 568 561 552 501 515 565 605 Horse Creek Eagle 0 0 0 0 0 0 0 0 Panther Eagle 0 0 0 0 0 0 0 0 Workman's Creek Beckley 0 0 0 0 0 311 300 286 Glen Alum Tunnel 0 0 0 0 0 0 0 0 Total 1,840 1,748 1,707 1,710 1,641 1,694 1,787 1,825 Mine Name 2039 2040 2041 2042 2043 2044 2045 2046 Laurel Hernshaw 313 328 329 195 0 0 0 0 Black King LCG Brown's Br 0 0 0 0 0 0 0 0 Workman Upper Eagle 0 0 0 0 0 0 0 0 Berwind LCG 0 0 0 0 0 0 0 0 Low Gap MCG 0 0 0 0 0 0 0 0 Titan MCG 0 0 0 0 0 0 0 0 Coon UCG 0 0 0 0 0 0 0 0 Ellis UCG 0 0 0 0 0 0 0 0 Bee Tree Powellton 0 0 0 0 0 0 0 0 Black Eagle 559 150 0 0 0 0 0 0 Dow Fork Eagle 604 630 553 570 619 616 612 564 Horse Creek Eagle 0 0 0 0 0 0 0 0 Panther Eagle 0 0 0 0 0 0 0 0 Workman's Creek Beckley 376 1,062 1,326 1,383 1,697 1,752 1,990 1,989 Glen Alum Tunnel 0 0 0 0 0 0 0 0 Total 1,852 2,169 2,208 2,149 2,316 2,368 2,602 2,553 Mine Name 2047 2048 2049 2050 2051 2052 2053 2054 Laurel Hernshaw 0 0 0 0 0 0 0 0 Black King LCG Brown's Br 291 590 580 592 568 573 574 589 Workman Upper Eagle 0 0 0 0 0 0 0 0 Berwind LCG 0 0 0 0 0 0 3 309 Low Gap MCG 0 0 0 0 0 0 0 156 Titan MCG 0 0 0 0 0 0 177 588 Coon UCG 0 0 0 0 0 0 0 0 Ellis UCG 0 0 0 0 0 0 0 359 Bee Tree Powellton 0 0 0 0 0 0 0 0 Black Eagle 0 0 0 0 0 0 0 0 Dow Fork Eagle 252 0 0 0 0 0 0 0 Horse Creek Eagle 0 0 0 0 0 0 0 0 Panther Eagle 0 0 0 0 0 0 0 0 Workman's Creek Beckley 1,808 1,557 1,842 2,087 2,106 2,133 1,942 185 Glen Alum Tunnel 0 0 0 0 0 0 0 0 Total 2,350 2,147 2,421 2,679 2,674 2,706 2,695 2,187

Alpha Metallurgical Resources, Inc. Statement of Coal Resources and Reserves for the Marfork Mining Complex in Accordance with United States SEC Standards as of December 31, 2023 Central Appalachian Coal Basin West Virginia, USA MARSHAL MILLER & ASSOCIATES, INC. 61 Mine Name 2055 2056 2057 2058 2059 2060 2061 2062 Laurel Hernshaw 0 0 0 0 0 0 0 0 Black King LCG Brown's Br 576 560 553 552 570 590 579 584 Workman Upper Eagle 0 0 0 0 0 0 0 0 Berwind LCG 311 297 311 292 264 348 18 0 Low Gap MCG 291 185 0 0 0 0 0 0 Titan MCG 639 560 550 696 706 611 577 134 Coon UCG 0 193 387 203 0 0 0 0 Ellis UCG 375 174 0 0 0 0 0 0 Bee Tree Powellton 0 0 0 0 0 0 0 0 Black Eagle 0 0 0 0 0 0 0 0 Dow Fork Eagle 0 0 0 0 0 0 0 0 Horse Creek Eagle 0 0 0 0 0 0 0 0 Panther Eagle 0 0 0 0 0 0 0 0 Workman's Creek Beckley 0 0 0 0 0 0 0 0 Glen Alum Tunnel 0 0 0 0 0 0 0 0 Total 2,191 1,969 1,801 1,743 1,540 1,549 1,174 718 Mine Name 2063 2064 2065 2066 2067 2068 2069 2070 Laurel Hernshaw 0 0 0 0 0 0 0 0 Black King LCG Brown's Br 581 380 36 0 0 0 0 0 Workman Upper Eagle 0 0 0 0 0 0 0 0 Berwind LCG 0 0 0 0 0 0 0 0 Low Gap MCG 0 0 0 0 0 0 0 0 Titan MCG 0 0 0 0 0 0 0 0 Coon UCG 0 0 0 0 0 0 0 0 Ellis UCG 0 0 0 0 0 0 0 0 Bee Tree Powellton 0 0 0 0 0 0 0 0 Black Eagle 0 0 0 0 0 0 0 0 Dow Fork Eagle 0 0 0 0 0 0 0 0 Horse Creek Eagle 0 0 0 0 0 0 0 0 Panther Eagle 0 0 0 0 0 0 0 0 Workman's Creek Beckley 0 0 0 0 0 0 0 0 Glen Alum Tunnel 0 0 0 0 0 0 0 0 Total 581 380 36 0 0 0 0 0 * LOM tonnage evaluated in the financial model includes October 2023 through December 2023 production for underground mines and July 2023 through December 2023 production for surface mines (1,410,126 clean tons of which 452,276 are UG) which was subtracted from coal reserves to make the effective date of the reserves December 31, 2023. As shown in Tables 13-2 and 13-3, the areas planned for surface and highwall mines produce coal until 2032. Clean coal production varies directly with surface mining ratios along with availability of open highwall for the highwall miner units. Table 13-2: Marfork Mining Complex Surface Mine Production Schedule (x 1,000 Saleable Tons) Mine Name 2023 2024 2025 2026 2027 2028 2029 2030 Workman 1,184 2,197 2,816 2,358 1,743 2,565 1,003 1,003 Mine Name 2031 2032 2033 2034 2035 2036 2037 2038 Workman 1,003 433 0 0 0 0 0 0 * LOM tonnage evaluated in the financial model includes October 2023 through December 2023 production for underground mines and July 2023 through December 2023 production for surface mines (1,410,126 clean tons of which 809,844 are surface) which was subtracted from coal reserves to make the effective date of the reserves December 31, 2023. Alpha Metallurgical Resources, Inc. Statement of Coal Resources and Reserves for the Marfork Mining Complex in Accordance with United States SEC Standards as of December 31, 2023 Central Appalachian Coal Basin West Virginia, USA MARSHAL MILLER & ASSOCIATES, INC. 62 Table 13-3: Marfork Mining Complex Highwall Mine Production Schedule (x 1,000 Saleable Tons) Mine Name 2023 2024 2025 2026 2027 2028 2029 2030 Workman HWM 134 296 512 437 361 436 605 605 Mine Name 2031 2032 2033 2034 2035 2036 2037 2038 Workman HWM 605 470 0 0 0 0 0 0 * LOM tonnage evaluated in the financial model includes October 2023 through December 2023 production for underground mines and July 2023 through December 2023 production for surface mines (1,410,126 clean tons of which 148,005 are highwall) which was subtracted from coal reserves to make the effective date of the reserves December 31, 2023. 13.3 Mining Related Requirements 13.3.1 Underground A mine plan with sequenced mining projections was prepared for each logical mining unit. For each mine plan, the appropriate number of production units is selected for the resource area, and a productivity level assigned, expressed in feet of advance per unit-shift of production. The productivity is based on the equipment and personnel configuration, mining height and expected physical conditions. The mine plans and production forecasts generated by MM&A and described in this section were developed for the purpose of coal reserve analysis and may not be consistent with current or future Alpha mine plans and production timing forecasts.

Alpha Metallurgical Resources, Inc. Statement of Coal Resources and Reserves for the Marfork Mining Complex in Accordance with United States SEC Standards as of December 31, 2023 Central Appalachian Coal Basin West Virginia, USA MARSHAL MILLER & ASSOCIATES, INC. 63 13.4 Required Equipment and Personnel 13.4.1 Surface Mines 13.4.1.1 Workman Creek Surface (Map W-2 through W-14) Figure 13-1: Workman Creek Surface Mine and Permit Areas Aerial View The Workman Surface reserve area consists of mountain-top, contour and highwall mining of 25 seams: from the Upper Clarian to the Little Eagle -- a difference of over 1,000 vertical feet. Deep mining has taken place in the Lower Hernshaw, Middle Cedar Grove, Lower Cedar Grove, Lower 2 Gas, Powellton, Upper Eagle, Eagle Rider/Eagle A, Eagle, and Little Eagle. Previous contour and auger mining have also Alpha Metallurgical Resources, Inc. Statement of Coal Resources and Reserves for the Marfork Mining Complex in Accordance with United States SEC Standards as of December 31, 2023 Central Appalachian Coal Basin West Virginia, USA MARSHAL MILLER & ASSOCIATES, INC. 64 been documented. The present mine plan consists of six permits: Middle Fork, Collins Fork, Turkey Foot, Center Contour, Long Ridge, and Eagle #2. Mining activity consists of hydraulic shovels/ front-end loaders with rock trucks contour mining the lower seams; generating highwalls that are subsequently reclaimed by track bulldozers pushing material off upper seams. Prior to their reclamation, highwall miners selectively burrow long holes in the thicker seams exposed in the highwall. Where vertical elevation differences exceed 500 feet, burden will have to be initially trucked off the mountain ridge(s). Continued development of the Workman surface reserve is contingent on obtaining excess spoil room. Partial relief has been provided by the approved plan to cap the previous Collins Fork impoundment with mine spoil. Initial efforts to cap the impoundment have been successful. As of 2023, United States Army Corp of Engineers (USACE) has approved all proposed hollow fills, with the exception of those associated with the Eagle #2 permit. Expansion of mining to the west will require approval of the Eagle #2 hollow fills in the Sycamore Creek drainage. MM&A did not attempt to confirm burden storage capacity as presented in Workman’s permits. The Workman permits require backfilling to eliminate highwall exposure created by excavation. Ideally, highwall backfilling would be performed by dozers pushing burden from upper seams, but would also generally involve supplemental placement by trucked mine spoil. Depending on the extent of excavation and available hollow fill space, trucked mine spoil might represent a large reclamation volume that extends high in elevation. Careful operational planning will be required to ensure burden placement does not interfere with the full extraction of lower seam reserves and does not result in longer haul distances on grade. Reducing the volume of generated mine spoil can help when excess spoil room is very limited due to delays in hollow fill approvals, when there is a desire to reduce the mine stripping ratio, when there is desire to reduce costly backfilling, and when there is a desire to decrease delays in employing cheaper highwall mining activity. Methods include: > converting area mining to contour cuts with supplemental highwall mining to remove coal not exposed during excavation. > Eliminating second or third cuts along a contour and introducing supplemental highwall mining earlier than originally planned. It must be recognized that highwall mining does not achieve the coal recovery of full excavation and it might not achieve penetration depths that are desired. Workman’s mine plan reflects some of these changes when compared to their proposed excavation that appears in their permits. Development of the Eagle South reserves will likely not provide additional hollow fills and will likely complicate mine plans and associated spoil placement.

Alpha Metallurgical Resources, Inc. Statement of Coal Resources and Reserves for the Marfork Mining Complex in Accordance with United States SEC Standards as of December 31, 2023 Central Appalachian Coal Basin West Virginia, USA MARSHAL MILLER & ASSOCIATES, INC. 65 The active Workman Creek Coal Handling Facility (CHF) presently used to convey coals through the mountain in the No. 2 Gas seam to the Marfork preparation plant does not allow for the full contour cuts as depicted in the Center Contour permit and will likely reduce burden storage capacity along the eastern ridge line as depicted in the permit. Contour mining of the lower seams is very efficient with two or three cuts typically required until excavation limits are reached. Burden is trucked to hollow fills and/or back fill areas previously mined. Seams generally exposed during contour activity include the Upper Eagle, Eagle Rider, Eagle, and Little Eagle. Track bulldozers expose the seams above the contour highwall. These seams generally include the upper and lower Powellton, upper and lower No. 2 Gas and Peerless seams. Dozers provide a very cheap, fast, and safe means of reclaiming the lower contour highwalls. Excavation and haulage of upper seam burden is actively taking place in the Middle Ridge, Collins Fork, and Eagle #2 permits. It will also have to take place in the Center Contour, Turkey Foot, and Long Ridge permits. To shorten haul distances, a “cut-thru” is proposed in the Long Ridge permit. The cut-thru will provide shorter haul distances to the Workman Creek coal handling facility and allow better distribution of mine spoil so that potential expansion westward can be achieved. Development of the Workman reserves is complicated by existing electrical transmission lines and gas lines that cross the property. Partial relocation of these lines has already taken place, and more are anticipated. Workman operates four large hydraulic excavators, three Caterpillar Inc. (Cat®) 993 loaders and nine D11 track bulldozers with a production capacity in excess of 40 million bcy per year. Two highwall miners provide additional production tonnage when the final highwalls are exposed. Production from the highwall miners is expected to be sporadic due to highwall exposure of the surface mine and presence of deep-mine works. Delays in hollow fill approval will likely encourage highwall mining of reserves that would otherwise be surface mined. The mine is expected to employ up to approximately 286 operators in the surface mining phase and highwall mining phases of the operation. MM&A attempted to adhere generally to Workman’s five-year mine plan. Differences in production can be attributed to a topographic surface that doesn’t reflect the latest pre-stripping activities. Additional differences can be attributed to MM&A not recognizing the mining of the upper seams (Upper Clarion to the Lower Winifrede) as reserves due to insufficient coal quality data for those seams. Associated burden volumes were still recognized in the production forecast. Alpha Metallurgical Resources, Inc. Statement of Coal Resources and Reserves for the Marfork Mining Complex in Accordance with United States SEC Standards as of December 31, 2023 Central Appalachian Coal Basin West Virginia, USA MARSHAL MILLER & ASSOCIATES, INC. 66 At the above production level exhaustion of the reserves is expected to be in year 2032 based on the present understanding of distribution of surface and highwall mining activity An additional highwall miner is projected to be introduced in 2029 to complete highwall mining within months of the surface mining activity. 13.4.2 Underground Mines 13.4.2.1 Panther Eagle Mine (Map 9) The Panther Eagle Mine is a unique operation that has one super section production unit and one mobile bridge conveyor production section in operation. The mine is operating in the Eagle Seam. The location is near the Marfork Preparation Plant with its run-of-mine (ROM) product transported by conveyor belt to the plant’s Raw Coal Stockpiles. The mine produces metallurgical grade coal from leased mineral property. The mine started production in 2017. One production unit utilizes a mobile bridge unit in lieu of shuttle cars while the other is a traditional super section. Production is scheduled for approximately 242 days each year, which represents production on Monday through Friday. On each day, production sections are scheduled to produce coal on two shifts. The sections are configured as super sections with two continuous miners used for production on each section. Productivity is planned at the rate of 240 feet of advance per shift. Principal production equipment for the super section includes two continuous miners, two roof bolters, four shuttle cars, and one scoop. Coal is extracted from the production face with the continuous miners and hauled to the mine conveyor in shuttle cars. At the conveyor belt, the coal is discharged from the shuttle cars onto a feeder breaker for transfer onto the conveyor. The conveyors carry the coal to the outside, where it is transported to the Raw Coal Stockpiles at the preparation plant. Principal production equipment for the mobile bridge conveyor unit includes two continuous miners, two roof bolters, mobile bridge conveyor unit and one scoop. Coal is extracted from the production face with the continuous miner and transported to the section conveyor belt by the bridge unit. The mine conveyors carry the coal to the surface and then to the Raw Coal Stockpile at the preparation plant. Coal is then transported by means of surface conveyors to the Raw Coal Stockpile at the Marfork Preparation Plant where it is processed and loaded onto CSX rail for transport to the consumer. The Panther Eagle mine is operational at the time of this report; all necessary infrastructure and utilities are in place; all necessary permits have been obtained. Estimated expenditures for site closure and reclamation are included in the financial model for this site.

Alpha Metallurgical Resources, Inc. Statement of Coal Resources and Reserves for the Marfork Mining Complex in Accordance with United States SEC Standards as of December 31, 2023 Central Appalachian Coal Basin West Virginia, USA MARSHAL MILLER & ASSOCIATES, INC. 67 The Mine is scheduled to deplete its mining assignment in 2030. 13.4.2.2 Black Eagle Mine (Map 9) The Black Eagle Mine, which is currently operational with three (3) continuous mining sections producing coal in the Eagle seam on leased mineral property. The Black Eagle Mine started production in 2019. The Black Eagle Mine is a three (3) section mine with each working section operated as a super section (two sets of mining equipment operating simultaneously and sharing a common dumping point on the same section, with each set being ventilated by a separate split on intake air) Each super section operates two (2) Continuous Miners, two (2) Roof Bolters, four (4) Shuttle Cars and one (1) scoop. Coal is extracted from the production face with the continuous miners and hauled to the mine conveyor in shuttle cars. At the conveyor belt, the coal is discharged from the shuttle cars onto a feeder breaker for transfer onto the conveyor. The conveyors transport the run of mine coal to the portal area, where product is stockpiled. Coal is then transported via highway truck haulage to the Marfork Preparation Plant where it is processed and loaded into CSX rail for transport to the consumer. The mine stockpile is reclaimed to a bin directly across from the entrance to the Marfork Complex. Off- road trucks are loaded at the bin then transport coal to the plant. Mine workings have developed up to the location of a vertical ventilation shaft (with another shaft projected in the future) for providing ventilation to support three continuous miner sections through its assignment. Google Earth imagery indicates construction activity at the surface location of the air shafts in October 2022. The Black Eagle mine is operational at the time of this report with all necessary infrastructure and utilities in place. All necessary permits have been obtained. Estimated expenditures for site closure and reclamation are included in the financial model for this site. The mine is scheduled to deplete its mining assignment in 2040. 13.4.2.3 Horse Creek Eagle (Map 9) The Horse Creek Eagle Mine is an active mine that currently operates one continuous miner production unit operating as a super section (two sets of mining equipment operating simultaneously and sharing a common dumping point on the seam section, with each set being ventilated by a separate split of intake air). The super section operates two (2) Continuous Miners, two (2) Roof Bolters, four (4) Shuttle Cars and one (1) scoop. Coal is extracted from the production face with the continuous miners and hauled to the mine conveyor in shuttle cars. At the conveyor belt, the coal is discharged from the shuttle cars Alpha Metallurgical Resources, Inc. Statement of Coal Resources and Reserves for the Marfork Mining Complex in Accordance with United States SEC Standards as of December 31, 2023 Central Appalachian Coal Basin West Virginia, USA MARSHAL MILLER & ASSOCIATES, INC. 68 onto a feeder breaker for transfer onto the mine conveyor. The mine conveyor system transports the run of mine coal to the portal area, where product is stockpiled. Coal is then batched through the underground coal conveyor system from the Horse Creek Material Handling Facility to the raw coal stockpiles at the Marfork Preparation Plant. The raw coal is processed and loaded into CSX rail for transport to the consumer. Operating life for this mine is forecast to last until November 2025. 13.4.2.4 Glen Alum Tunnel Mine at Workman’s Creek (Map 10) The Glen Alum Tunnel Mine started production in 2022. The faceup area was developed with surface mining equipment from the Alpha’s adjacent Workman Creek Surface Mine Operations. The mine is located adjacent to the Workman’s Creek Coal Handling Facility. Off-highway trucks are used to transport the run of mine product 0.6 miles to stockpile areas at the Coal Handling Facility. The coal is then transported by underground conveyors to the Marfork Preparation Plant for processing. The mine produces metallurgical grade coal using two (2) active sections with two (2) continuous miners, two (2) roof bolters, three (3) shuttle cars, one (1) belt feeder, and one (1) scoop per section. Coal is extracted from the production face with the continuous miners and hauled to the mine conveyor in shuttle cars. At the conveyor belt, the coal is discharged from the shuttle cars onto a feeder breaker for transfer onto the conveyor. The conveyors carry the coal to the outside, where it is placed in a stockpile before being loaded on off-highway trucks to transport it to the Workman’s Creek Coal Handling Facility. The Workman’s Creek Coal Handling Facility uses an underground conveyor system that travels through three underground mines in three different seams to reach the Marfork Preparation Plant approximately 8 miles to the west. The mine is scheduled to deplete its mining assignment in 2030. 13.4.2.5 Dow Fork Eagle (Map 9) The Dow Fork Eagle Mine is in the Clear Fork watershed north of the Marfork Preparation Plant. The mineral boundary has two existing environmental permits for portals. The portal site is located on Dow Fork of Long Branch of the Clear Fork of the Coal River. The site is an existing contour surface mine area that is part of the Republic Mining Complex. The reserve can support two operating areas for two continuous miner production sections. The product would be transported by highway trucks. The one-way haul distance to the proposed Clear Fork Coal Handling Facility is 6.96 miles. Coal would be placed into a stockpile prior to being transported on an underground and surface conveyor system to the Marfork Preparation Plant. The one-way haul distance directly to the Marfork Preparation Plant is 15.14 miles.

Alpha Metallurgical Resources, Inc. Statement of Coal Resources and Reserves for the Marfork Mining Complex in Accordance with United States SEC Standards as of December 31, 2023 Central Appalachian Coal Basin West Virginia, USA MARSHAL MILLER & ASSOCIATES, INC. 69 The report includes an initial starting date in 2029 with a second production unit starting in 2030. Mining will be completed during the calendar year 2047. 13.4.2.6 Bee Tree Powellton (Map 6) The Bee Tree Powellton area is located along the Powellton Seam outcrop upstream of the Marfork Preparation Plant. The mining area is relatively small and would be mined using the bridge conveyor mining unit from the Panther Eagle Mine. Principal production equipment for the bridge unit includes one continuous miner, two roof bolters, mechanical bridge unit and one scoop. Coal is extracted from the production face with the continuous miner and transported to the section conveyor belt by the bridge unit. The mine conveyors carry the coal to the surface and then to the Raw Coal Stockpile at the preparation plant. A haul road would be constructed from the valley floor up to the Powellton Seam contour bench level. The faceup would be along a newly exposed highwall to eliminate the potential hazard of weathered rock walls. The run of mine product would be transported by off highway trucks for 2.8 miles to the Raw Coal Stockpiles at the Marfork Preparation Plant. Operating life for the mine is forecast as 22 months for one production unit beginning in February 2034. 13.4.2.7 Laurel Hernshaw (Map 2) The Laurel Hernshaw Mine is in Laurel Branch of Clear Fork. Previous mining in the area included the Laurel Eagle and Laurel Alma Mines in the 1990’s and the basic infrastructure including haul roads and stockpile areas remaining. The Laurel Hernshaw Mine will be a single super section continuous miner operation. A new mine bench will be constructed above the former portal location for the Laurel Alma Mine. Mine product would be deposited into the Laurel Alma stockpile area. The product would be transported by highway trucks. The one-way haul distance to the proposed Clear Fork Coal Handling Facility is 2.13 miles. Coal would be placed into a stockpile prior to being transported on an underground and surface conveyor system to the Marfork Preparation Plant. The one-way haul distance directly to the Marfork Preparation Plant is 10.31 miles. Operating life for this mine is forecast as 14 years – 8 months with one production unit. 13.4.2.8 Titan Cedar Grove (Map 4) The Titan Cedar Grove Mine is in the Clear Fork watershed north of the Marfork Preparation Plant. The portal site is located on Long Branch of the Clear Fork of the Coal River. The site will be created with a Alpha Metallurgical Resources, Inc. Statement of Coal Resources and Reserves for the Marfork Mining Complex in Accordance with United States SEC Standards as of December 31, 2023 Central Appalachian Coal Basin West Virginia, USA MARSHAL MILLER & ASSOCIATES, INC. 70 new bench and fill area. The reserve can support two operating areas for two continuous miner production super sections. The product would be transported by highway trucks. The one-way haul distance to the proposed Clear Fork Coal Handling Facility is 5.26 miles. Coal would be placed into a stockpile prior to being transported on an underground and surface conveyor system to the Marfork Preparation Plant. The one-way haul distance directly to the Marfork Preparation Plant is 13.44 miles. Operating life for this mine is forecast as 8 years – 9 months. 13.4.2.9 Black King Lower Cedar Grove at Browns Branch (Map 5) The Lower Cedar Grove Seam would be accessed by excavating a contour portal area and a stockpile area. Surface support facilities such as a mine office, change house, warehousing, parking, electrical power, water, sewage, and parking would be provided on site. The mine will produce metallurgical grade coal using two (2) active sections with two (2) continuous miners, two (2) roof bolters, three (3) shuttle cars, one (1) belt feeder, and one (1) scoop per section. Coal is extracted from the production face with the continuous miners and hauled to the mine conveyor in shuttle cars. At the conveyor belt, the coal is discharged from the shuttle cars onto a feeder breaker for transfer onto the conveyor. The conveyors carry the coal to the outside, where it is placed in a stockpile before being loaded to a proposed gloryhole construction to the Black Eagle Mine where the run-of-mine product would be transported to the Marfork Preparation Plant. Mine life is forecast as 17 years – 11 months for two operating sections. 13.4.2.10 Beckley Seam at Workman’s Creek (Map 11) The Beckley Seam is a metallurgical coal that has been regionally mined for over a century. Remaining reserve locations of this size are rare. In as much, there is a considerable effort to be made to reach this reserve body. Historic mines in the area include the Bonny Mine, New Beckley Mine, and Maple Meadow Mine. The coal appears in pod type deposits in that mineable height is in a small region that correlates with its deposition. The coal seam is at 600 feet depth below the valley floor. Access to the seam will be by slope and shaft methods. Construction time will be considerable before coal can be produced from the development. The mine is projected with five (5) continuous miner units operating as super sections. Coal would be transported to the surface through a slope constructed with a conveyor galley on the top and a haulage galley in the bottom of the excavation. From the surface, the coal can be transported to the Workman’s

Alpha Metallurgical Resources, Inc. Statement of Coal Resources and Reserves for the Marfork Mining Complex in Accordance with United States SEC Standards as of December 31, 2023 Central Appalachian Coal Basin West Virginia, USA MARSHAL MILLER & ASSOCIATES, INC. 71 Creek Coal Handling Facility by proposed surface conveyors with final delivery to the Marfork Preparation Plant for processing and loading onto the CSX rail system. The mine life is 18 years – 4 Months. 13.4.2.11 Coon Upper Cedar Grove (Map 3) The Coon Cedar Grove mine is maintained in a non-production active status. The coal conveyor haulage system from Workman’s Creek requires that the mine be maintained to meet the requirements of the federal and state regulations. The mine is ventilated and inspected on a regular basis. Additionally, a small workforce is available for maintaining the conveyor system and any maintenance work that develops. A small reserve block remains for the Coon Cedar Grove Mine. Mining would use the existing infrastructure for access and support. The run-of-mine coal would use the coal conveyor system to transport the product to the Marfork Preparation Plant for processing and loading onto the CSX rail system. Operating life for this mine is forecast as 2 years – 0 months for one production section. 13.4.2.12 Low Gap Middle Cedar Grove (Map 4) The Low Gap area hosts the coarse refuse disposal area. Access to the site is provided by a well- developed system of roads that have supported the coarse refuse disposal area, a Cedar Grove Seam Mine to the east and two Powellton Seam mines. Access to the site will require the construction of a new access road to reach the outcrop on the western side of the valley. A contour mine bench would be created to access the seam and coal transport off the bench to the Powellton Seam level below would be accomplished with conveyors. The mine would be a single super section mine operating along a relatively narrow ridgetop. Coal would be transported 1.2 miles by truck down the existing haul road to the Marfork Preparation Plant where the product would be processed and shipped by rail on the CSX rail system. Operating life for this mine is forecast as 2 years – 3 months for one production section. 13.4.2.13 Ellis Upper Cedar Grove (Map 3) The Ellis Cedar Grove Mine has received its environmental permits. The mine is projected in the Upper Cedar Grove Seam in Ellis Creek off Marsh Fork, approximately 3.3 miles south of the Marfork Preparation Plant. The portal area will be located adjacent to the existing portal facility that was constructed as part of the Slip Ridge Cedar Grove Mine in the Middle Cedar Grove Seam. In as much, infrastructure such as haul roads, drainage control and utilities have been available at the site. Alpha Metallurgical Resources, Inc. Statement of Coal Resources and Reserves for the Marfork Mining Complex in Accordance with United States SEC Standards as of December 31, 2023 Central Appalachian Coal Basin West Virginia, USA MARSHAL MILLER & ASSOCIATES, INC. 72 The mine would feature a single super section with two (2) continuous miners, two (2) roof bolters, three (3) shuttle cars, one (1) belt feeder, and one (1) scoop per section. Coal is extracted from the production face with the continuous miners and hauled to the mine conveyor in shuttle cars. At the conveyor belt, the coal is discharged from the shuttle cars onto a feeder breaker for transfer onto the conveyor. The conveyors carry the coal to the outside, where it is placed in a stockpile before being loaded onto trucks to be hauled for 9.4 miles to the Marfork Preparation Plant. Operating life for this mine is forecast as 2 years – 6 months for one production section. 13.4.2.14 Berwind Lower Cedar Grove (Map 5) The Berwind Cedar Grove area is an isolated block in the Lower Cedar Grove Seam. The portal location has been set along a tributary of Hazy Creek of Marsh Fork and is located approximately 5.6 miles southwest of the Marfork Preparation Plant. No environmental permits have been acquired for this reserve at this time. The portal area will utilize existing infrastructure as well as new construction to build a contour bench for the portal area. The excess material would be placed below the contour bench to create a stockpile area for the mine product. The mine will develop through an area of low coal to reach the body of the reserve. The mine would feature a single super section with two (2) continuous miners, two (2) roof bolters, three (3) shuttle cars, one (1) belt feeder, and one (1) scoop per section. Coal is extracted from the production face with the continuous miners and hauled to the mine conveyor in shuttle cars. At the conveyor belt, the coal is discharged from the shuttle cars onto a feeder breaker for transfer onto the conveyor. The conveyors carry the coal to the outside, where it is placed in a stockpile before being loaded onto trucks to be hauled for 11.0 miles to the Marfork Preparation Plant. Operating life for this mine is forecast as 7 years – 1 month for one production section. 13.4.2.15 Workman Upper Eagle (Map 7A) The Workman Branch Upper Eagle Mine is located near the site of the Workman’s Creek Material Handling Facility. The mine will feature a single continuous miner unit utilizing a continuous haulage bridge conveyor system. The faceup will be created by the surface mine operations at Workman Creek. The mine product will be transported back to the Marfork Preparation Plant by means of the existing underground conveyor system. Principal production equipment for the bridge unit includes one continuous miner, two roof bolters, mobile bridge unit and one scoop. Coal is extracted from the production face with the continuous

Alpha Metallurgical Resources, Inc. Statement of Coal Resources and Reserves for the Marfork Mining Complex in Accordance with United States SEC Standards as of December 31, 2023 Central Appalachian Coal Basin West Virginia, USA MARSHAL MILLER & ASSOCIATES, INC. 73 miner and transported to the section conveyor belt by the bridge unit. The mine conveyors carry the coal to the surface and then to the Raw Coal Stockpile and then batched through the underground conveyor system to the preparation plant. Operating life for this mine is forecast as 3 years – 11 months for one production section ending in calendar year 2034. 14 Processing and Recovery Methods 14.1 Description or Flowsheet The Marfork Division currently includes the Marfork Preparation Plant in addition to the supporting mines. The plant was originally constructed in 1994 and received its latest upgrade in 2019.1 The plant produces a typical product with an ash content of 7.25% and typical sulfur content of 1.07% at a utilization rate of 70.0% in 2023. The infrastructure includes four (4) distinct raw coal stockpiles and seven (7) distinct clean coal stockpiles. The plant itself includes separation equipment including a heavy media vessel, cyclones, froth flotation, spirals, centrifugal dryers, screens, pumps, and sumps. The plant design feed rate is 2,400 tons per hour. Coarse and fine refuse are disposed at the Brushy Branch Impoundment and coarse refuse disposal is supplemented at the Low Gap Refuse Disposal Facility. Plant feed can be blended from the different stockpiles and plant products can be blended during the loading process. The flood railroad loadout is serviced by the CSX rail system. The empty train is cut once to create two strings for loading a 150-car unit train. Coal is recovered from the clean coal stockpiles by a reclaim belt located in a tunnel beneath the stockpiles. Processes and equipment are typical of those used in the coal industry and are in use in nearly all plants in the Central Appalachian Basin. 14.2 Requirements for Energy, Water, Material and Personnel Personnel have historically been sourced from the surrounding communities in Raleigh, Kanawha, Fayette, and Boone Counties, and have proven to be adequate in numbers to conduct processing operations at Marfork. As mining is common in the surrounding areas, the workforce is generally familiar with mining practices, and many are experienced miners. 1 Coal Age Magazine, October 2021, Prep Plant Census Alpha Metallurgical Resources, Inc. Statement of Coal Resources and Reserves for the Marfork Mining Complex in Accordance with United States SEC Standards as of December 31, 2023 Central Appalachian Coal Basin West Virginia, USA MARSHAL MILLER & ASSOCIATES, INC. 74 Water is sourced locally from public water sources or rivers, and electricity is sourced from American Electric Power. The service industry in the areas surrounding the mine complex has historically provided supplies, equipment repairs and fabrication, etc. 15 Infrastructure Alpha’s Marfork preparation plant services the area with washed coal, which is transported via the CSX rail line at the plant’s loadout. Haul roads, primary roads, and conveyor belt systems account for transport from the various mine sites to the preparation plant. This practice will continue for future reserves. 15.1 Marfork Preparation Plant The preparation plant and associated refuse disposal areas have been established and maintained to provide a modern coal processing facility. Product flexibility is available with the in-bound product transportation systems that maximize the ability of the facility to reach regional reserves. Unique to the Marfork infrastructure is an existing transportation system that utilizes conveyor belts in underground mines as well as surface conveyors to transport raw coal to the facility for processing. This allows the plant ability to bring feed from considerable distance without incurring the cost of trucking over highways. Additionally, the rock content of the mine product does not impact the transportation cost as much as a trucking cost due to the efficiency of the conveyors. Product flexibility includes surface and underground mine production that is processed or shipped directly to the CSX rail system. The various areas and different seams provide a method to offer a wide variety of coal products for the customer. The coal handling ability in both the raw coal and clean coal areas allows for separating different types of coals for servicing different customer’s needs. The existing blending capabilities and the variety of coal seams reporting to the facility allows for a custom coal to be provided. Aerial photographs of existing facilities are shown in Figure 15-1 and Figure 15-2.

Alpha Metallurgical Resources, Inc. Statement of Coal Resources and Reserves for the Marfork Mining Complex in Accordance with United States SEC Standards as of December 31, 2023 Central Appalachian Coal Basin West Virginia, USA MARSHAL MILLER & ASSOCIATES, INC. 75 Figure 15-1: Workman Creek Surface Facilities Figure 15-2: Marfork Facilities Alpha Metallurgical Resources, Inc. Statement of Coal Resources and Reserves for the Marfork Mining Complex in Accordance with United States SEC Standards as of December 31, 2023 Central Appalachian Coal Basin West Virginia, USA MARSHAL MILLER & ASSOCIATES, INC. 76 15.2 Workman’s Creek Coal Handling Facility The existing transport system reaches from the preparation plant approximately 8 miles to the east to the Workman Creek Coal Handling Facility. The facility provides transport for coal product from the existing surface mine operations surrounding the site generally located within the Rowland Land holdings. Coal is transported to the Marfork Preparation Plant for processing and shipping metallurgical and steam products. The Coal Handling Facility includes a stockpile area at the Upper Powellton level. The stockpile area feeds coal onto a conveyor system that enters the non-producing Allen Powellton Mine. The conveyor system travels through underground mines and surface areas to transport the product to the Marfork Preparation Plant for processing and shipment on the CSX rail system. The conveyor system covers 10.7 miles in total. An aerial view of the Workman’s Creek Coal Handling Facility is shown in Figure 15-2. Figure 15-3: Workman’s Creek Coal Handling Facility

Alpha Metallurgical Resources, Inc. Statement of Coal Resources and Reserves for the Marfork Mining Complex in Accordance with United States SEC Standards as of December 31, 2023 Central Appalachian Coal Basin West Virginia, USA MARSHAL MILLER & ASSOCIATES, INC. 77 15.3 Underground Conveyor Coal Transport System Starting at the Workman’s Creek Coal Handling Facility, the coal transportation system consists of a conveyor belt system that travels through three non-producing coal mines to reach the Marfork Preparation Plant. The transportation system provides an economical alternative to trucking coal over large distances to reach existing preparation and shipping facilities. The Allen Powellton Mine is used to transport from the Workman’s Creek Coal Handling Facility to the mine’s original portal area in Horse Creek. The mine’s original stockpile area and overland conveyor to the portal in the Slip Ridge Cedar Grove Mine is utilized for the transportation system. The overall underground conveyor distance is 18,825 feet. The Horse Creek Coal Handling Facility provided coal transportation for the Horse Creek Eagle Mine and the Allen Powellton Mine. The Allen Powellton Mine recently ceased production in 2021 and the Horse Creek Eagle Mine is projected to close in 2025. With the mine closings, the coal transport system will be dedicated to the operations at Workman’s Creek. From the Horse Creek Coal Handling Facility, the coal is transported through the Slip Ridge Cedar Grove Mine located in the overlying Middle Cedar Grove Seam. The Slip Ridge Cedar Grove Mine has been idled since 2020. The underground conveyors transport the coal to the Brushy Creek Portal on the face of the impoundment. The overall underground conveyor distance is 17,363 feet. The conveyor system daylights and crosses the impoundment face to the Coon Cedar Grove Brushy Creek Portal on the other side of the valley, 1,570 feet. The Coon Cedar Grove Mine has been in non-producing status since 2021. This mine is in the Upper Cedar Grove Seam which is the seam above the Middle Cedar Grove seam. The underground conveyors transport the coal from the Impoundment Portal for 9,063 feet to the main portal area in Coon Branch which is located above the raw coal stockpiles. A series of surface conveyors transport the coal from the portal area 4,374 feet to the raw coal stockpiles. At the raw coal stockpiles, the coal can be placed in different stockpiles to provide product separation for blending purposes. The conveyor system covers 10.7 miles in total. Figure 15-3 is an aerial view of the conveyor system along the mine benches located in Coon Branch above the Marfork Preparation Plant. Alpha Metallurgical Resources, Inc. Statement of Coal Resources and Reserves for the Marfork Mining Complex in Accordance with United States SEC Standards as of December 31, 2023 Central Appalachian Coal Basin West Virginia, USA MARSHAL MILLER & ASSOCIATES, INC. 78 Figure 15-4: Underground Conveyor Coal Transport System As new areas are developed, the infrastructure requirements will change. These changes have been considered in the LOM plans and financial model. 15.5 Proposed Coal Handling Facility on Browns Branch of West Fork Browns Branch is located between the towns of Van and Bandytown in Boone County, West Virginia. The site is approximately 8 miles west of the Marfork Preparation Plant. The Black King LCG Mine would portal near the mouth of the valley and the coal would be transported to the Marfork Preparation Plant by utilizing the Black Eagle Mine’s conveyor transportation system. Table 15-1: Browns Branch Coal Handling Facility Raw Tons Clean Tons Black King LCG 21,683,000 9,917,000

Alpha Metallurgical Resources, Inc. Statement of Coal Resources and Reserves for the Marfork Mining Complex in Accordance with United States SEC Standards as of December 31, 2023 Central Appalachian Coal Basin West Virginia, USA MARSHAL MILLER & ASSOCIATES, INC. 79 A vertical gloryhole would be used to drop the run-of-mine product to the Eagle Seam Level. A vertical shaft is constructed, and a feeder system is placed at the bottom of the shaft. The vertical shaft performs similar to a coal storage silo and allows the coal to be brought to the lower level in a controlled manner. Coal would be stockpiled at the mine sites as needed to separate the quality. Coal would be batched through the system to maintain separation for quality control. Estimated CAPEX costs for the facility are included within the financial model. 15.6 Black Eagle Mine and Browns Branch Coal Handling to Marfork Preparation Plant A stockpile reclaim system to a bin across from the Marfork Complex entrace is in place and operating. The active Black Eagle Mine will operate until 2040 and will produce approximately 21,500,000 ROM tons during its life span. The Browns Branch Coal Handling Facility will service approximately 21,700,000 raw tons during its lifetime from the Black King LCG Mine. Table 15-2: Black Eagle Coal Handling Facility Raw Tons Clean Tons Black Eagle 21,497,000 10,649,000 Black King LCG 21,683,000 9,917,000 Total 43,180,000 20,566,000 16 Market Studies 16.1 Market Description The quality characteristics for the subject coal resources and coal reserves have been reviewed in detail by MM&A. The drill hole data were utilized to develop average coal quality characteristics for the mining site. These average coal quality characteristics were then utilized as the basis for determining the various markets into which the saleable coal will likely be placed. A typical quality specification for the Marfork products are as shown in Table 16-1. Table 16-1: Quality Specifications HVA MV Ash (%) 6.33 6.84 Sulfur (%) 0.96 1.22 Volatile Matter (%) 30.02 28.5 Alpha Metallurgical Resources, Inc. Statement of Coal Resources and Reserves for the Marfork Mining Complex in Accordance with United States SEC Standards as of December 31, 2023 Central Appalachian Coal Basin West Virginia, USA MARSHAL MILLER & ASSOCIATES, INC. 80 The mine production serves the high-volatile and mid-volatile metallurgical markets. 16.2 Price Forecasts Company-wide pricing data as provided by Alpha from third party sources is described in Table 16-2. Note that not all products reflected in Table 16-2 will apply to every business unit. The pricing data assumes a flat-line long-term realization of $162 per short ton port pricing, with an average $132.51 per ton netback pricing reflective of the high-volatile product currently sold at Marfork, and $163 per short ton port loading with an average of $127.26 per short ton netback pricing reflective of the low- volatile product. A portion of the surface mine production is also thermal product which assumes a flat-line long term realization of $74 per short ton with an average of $65.52 per ton netback pricing. The LOM blended average netback pricing for the Marfork reserves is $127.67 per ton. These estimates are based on long-term pricing published by third party sources and adjusted for quality and transportation. The netback pricing represents adjustments made to published benchmark pricing based on quality and transportation. A large majority of the coal sold by Alpha and their Marfork Complex is shipped internationally as part of blended products from other business units within Alpha or sourced from other companies. These netback adjustments reflect these additional costs carried after the products leave the Marfork Mine Complex. Table 16-2: Price Forecasts Coal Quality Market Pricing Per Ton (1) (2) High-Vol. A $162 High- Vol. B $140 Mid-Vol. $163 Low-Vol. $163 Thermal $74 (1) Market pricing shown on U.S. East Coast basis. (2) Metallurgical and thermal pricing based on 10-year and 3- year average, respectively of forecasted pricing from pricing services. 16.3 Contract Requirements Some contracts are necessary for successful marketing of the coal. For Marfork, since all mining, preparation and marketing is done in-house, the remaining contracts required are: > Transportation – Alpha contracts with the CSX Railroad to transport coal to market. > Sales – Sales contracts are a mix of spot and contract sales. With the volatility of the market, long- term contracts are not typically written.

Alpha Metallurgical Resources, Inc. Statement of Coal Resources and Reserves for the Marfork Mining Complex in Accordance with United States SEC Standards as of December 31, 2023 Central Appalachian Coal Basin West Virginia, USA MARSHAL MILLER & ASSOCIATES, INC. 81 17 Environmental Studies, Permitting and Plans, Negotiations or Agreements with Local Individuals 17.1 Results of Studies MM&A completed an environmental review in 2011 of the Massey properties acquired by Alpha, including those operations that were active at Marfork at that time. The environmental review completed by MM&A included site inspections, reviews of historical records, database searches of State and Federal regulatory records and interviews to identify potential recognized environmental conditions (RECs) that may create environmental liability for the sites. While MM&A identified RECs during both studies, MM&A’s opinion was that those issues would not preclude the continued or future use of the properties as a coal mining/preparation venture. Based on this former ESA completed by MM&A, it is MM&A’s opinion that Marfork has a generally typical coal industry record of compliance with applicable mining, water quality, and environmental laws. Estimated costs for mine closure, including water quality monitoring during site reclamation, are included in the financial models. 17.2 Requirements and Plans for Waste Disposal Based on a recent engineering review, done by Alpha, approximately 77 years of fine refuse disposal capacity and 65 years of coarse refuse disposal capacity at current rates have been identified, a significant portion of which is permitted and active. Securing approvals for additional coarse and fines capacity will be critical to execute the business plan as outlined in this TRS. The table below outlines the current estimated capacities and permits of Marfork’s coarse refuse disposal area and slurry impoundment. Table 17-1: Marfork Refuse Disposal Summary Refuse Facility State SMCRA Permit Number MSHA ID Refuse Disposal Type Classified as a Dam Permit Status Current Planned Maximum Coarse Life (Approved + Planned) Current Planned Maximum Fines Life (Approved + Planned) Est. Coarse/ Combined Refuse Life (Approved/ Permitted) Est. Fine Refuse Life (Approved/ Permitted) Brushy Fork Refuse Impoundment O-3010-95 1211- WV40234- 02 Slurry Impoundment - Downstream and Upstream Yes Active 46.1 76.5 19.6 Low Gap Refuse Disposal Area O-3005-94 1211- WV40234- 01 Coarse Refuse Fill No Active 18.5 0.0 18.5 0.0 Alpha Metallurgical Resources, Inc. Statement of Coal Resources and Reserves for the Marfork Mining Complex in Accordance with United States SEC Standards as of December 31, 2023 Central Appalachian Coal Basin West Virginia, USA MARSHAL MILLER & ASSOCIATES, INC. 82 The estimated facility life was based on a 10-year average of 466 acre-feet of slurry storage consumed per year and coarse placement of 4,000,000 refuse tons per year. Total facility capacity provided 66.7 years of coarse refuse storage and 77.5 years of fine storage capacity. Reclamation permit outlines indicate that both storage facilities have been permitted to the top of the ridgelines to maximize the storage capacity. The current MSHA approved impoundment design (Crest Elevation 2,200 feet) provides 21 years of slurry disposal. 17.3 Permit Requirements and Status All mining operations are subject to federal and state laws and must obtain permits to operate mines, coal preparation and related facilities, haul roads, and other incidental surface disturbances necessary for mining to occur. Permits generally require that the permittee post a performance bond in an amount established by the regulatory program to provide assurance that any disturbance or liability created during mining operations is properly restored to an approved post-mining land use and that all regulations and requirements of the permits are fully satisfied before the bond is returned to the permittee. Significant penalties exist for any permittee who fails to meet the obligations of the permits including cessation of mining operations, which can lead to potential forfeiture of the bond. Any company, and its directors, owners, and officers, which are subject to bond forfeiture can be denied future permits under the program.2 New permits or permit revisions will occasionally be necessary to facilitate the expansion or addition of new mining areas on the Property, such as amendments to existing permits and new permits for mining of reserve areas. Exploration permits are also required. Property under lease includes provisions for exploration among the terms of the lease. New or modified mining permits are subject to a public advertisement process and comment period, and the public is provided an opportunity to raise objections to any proposed mining operation. MM&A is not aware of any specific prohibition of mining on the subject property and given sufficient time and planning, Alpha should be able to secure new permits to maintain its planned mining operations within the context of current regulations. Necessary permits are in place to support current production on the Property, but future permits are required to maintain and expand production. Portions of the Property are located near local communities. Regulations prohibit mining activities within 300 feet of a residential dwelling, school, church, or similar structure unless written consent is first obtained from the owner of the structure. Where required, Alpha reports that such consents have been obtained where mining is proposed beyond the regulatory limits. 2 Monitored under the Applicant Violator System (AVS) by the Federal Office of Surface Mining.

Alpha Metallurgical Resources, Inc. Statement of Coal Resources and Reserves for the Marfork Mining Complex in Accordance with United States SEC Standards as of December 31, 2023 Central Appalachian Coal Basin West Virginia, USA MARSHAL MILLER & ASSOCIATES, INC. 83 Alpha has obtained all mining and discharge permits to operate its mines and processing, loadout, or related facilities. MM&A is unaware of any obvious or current Alpha permitting issues that are expected to prevent the issuance of future permits. The Marfork Mining Complex, along with all coal producers, is subject to a level of uncertainty regarding future clean water permits due to United States Environmental Protection Agency (EPA) and the United States Fish and Wildlife Agency (USFW) involvement with state programs. The Mining permits currently held by Alpha on the Marfork Property are shown in Table 17-2. Alpha Metallurgical Resources, Inc. Statement of Coal Resources and Reserves for the Marfork Mining Complex in Accordance with United States SEC Standards as of December 31, 2023 Central Appalachian Coal Basin West Virginia, USA 84MARSHALL MILLER & ASSOCIATES, INC. 84 Table 17-2: Marfork Mining Permits Mine Name Seam Permit Status Expires Acres Disturbed Acres Reclaimed Acres Bonded Marfork Coal Company, LLC RtFk Low Gap BR. Coal. Ref. Dis Refuse Disposal - Other O-3005-94 Active, no coal removed 6/12/2028 116.95 25.16 249.76 Brushy Fork Slurry Impoundment - O-3010-95 Active, no coal removed 11/28/2025 645 88 660.75 Marfork Processing - O-3024-93 Active, no coal removed 3/16/2024 100.34 0 100.45 Bee Tree Surface Mine Chilton, Hernshaw, Coalburg, 2 Gas, Stockton, Winifrede, Eagle, Peerless, Powellton, Cedar Grove S-3010-04 PV-Phase 1 Release 7/11/2026 244.36 141.27 1080.2 Hazy Creek Highwall Mine No. 1 2 Gas, Powellton S-3017-09 Not Started 10/17/2027 0 0 109.59 Horse Creek Eagle Deep Mine Eagle U-3001-04 Active, moving coal 12/23/2024 136.76 2.97 139.73 Black Eagle Deep Mine Eagle U-3001-18 Active, moving coal 8/8/2028 112.86 Horse Creek No. 2 Gas Deep Mine 2 Gas U-3002-04 Active, moving coal 12/23/2024 79.21 3.4 85.21 Bee Tree Powellton re-permit Powellton U-3003-18 Not Started 1/30/2024 0 0 3.75 Panther Eagle Deep Mine Eagle U-3003-98 Active, moving coal 3/2/2024 8.09 0 32.66 Brushy Eagle #1 Mine - U-3006-93 Active, moving coal 10/21/2028 85.65 2.32 102.56 Coon - Cedar Grove Deep Mine Cedar Grove U-3009-00 Active, No Coal Removed 12/21/2025 16.41 7.16 23.57 Glen Alum Tunnel Mine Glen Alum Tunnel U-3012-09 Active, moving coal 7/11/2027 17.68 0 36.1 Ellis Upper Cedar Grove Mine Cedar Grove U-3013-19 Not Started 9/8/2025 0 0 5.48 Lower Cedar Grove Mine #1 - U-3013-94 Active, reclamation only 6/7/2026 35.85 0 35.85 Slip Ridge Powellton 2 Gas, Powellton U-3013-99 Active, no coal removed 5/3/2025 17.36 0 20.46 Beckley Seam Deep Mine Beckley U-3017-08 Active, no coal removed 12/4/2024 30.16 0 31.19 Slip Ridge Cedar Grove Cedar Grove U-3021-00 Active, no coal removed 4/29/2027 150.38 0 147.81 Coon Hollow No. 3 - U-5003-93 Active, no coal removed 6/14/2028 139.01 14.54 162.18 Republic Energy, LLC Middle Ridge Surface Mine Chilton A, Winifrede - Lwr, Chilton, Chilton RDR, Hernshaw, Coalburg, No. 2 Gas, Stockton, Winifrede - U, Winifrede, Eagle, Eagle A, Eagle - Ltl, Peerless, Powellton, Cedar Grove S301712 Active, Moving Coal 3/24/2024 272.5 145.8 799.05 Collins Fk Remediation Project No. 2 Gas - Lwr, Chilton, Chilton RDR, Hernshaw, No. 2 Gas, Eagle, Eagle A, Eagle - Ltl, Peerless, Powellton, Cedar Grove, Cedar S300208 Active, Reclamation only 10/14/2026 159.88 125.95 262.88 Eagle No. 2 Surface Mine Chilton A, No. 2 Gas - Lwr, Winifrede - Lwr, Chilton, Chilton RDR, Coalburg, No. 2 Gas, Stockton RDR, Winifrede- U, Winifrede, Eagle, Eagle A, Eagle - Ltl, Peerless, Powellton, Cedar Grove S302805 Active, Moving Coal 6/6/2028 61.73 0 2039.9 Turkeyfoot Surface Mine Glen alum Tunnel, Hernshaw, Douglas, No. 2 Gas, Eagle, Eagle A, Eagle - Ltl, Peerless, Powellton, Cedar Grove S301419 Active, no Coal Removed 4/16/2026 - - 1085.7 Center Contour Surface Mine Chilton A, Chilton, Chilton RDR, Hernshaw, No. 2 Gas, Eagle, Eagle A, Eagle - Ltl, Peerless, Powellton, Cedar Grove, Powellton - Lwr S300316 Active, Moving Coal 11/13/2024 - - 561.43 Long Ridge #1 Surface Mine Chilton A, Winifrede - Lwr, Chilton, Hernshaw, Coalburg, No. 2 Gas, Winifrede, Eagle, Eagle A, Eagle -Ltl, Peerless, Powellton, Cedar Grove, Powellton - Lwr S300115 Active, Moving Coal 12/21/2026 330.24 115.58 864.05 Note: Permit status and expiration dates are based on information obtained from regulatory agency website. Permits in reclamation status receive Renewal Waivers and may show expired dates.

Alpha Metallurgical Resources, Inc. Statement of Coal Resources and Reserves for the Marfork Mining Complex in Accordance with United States SEC Standards as of December 31, 2023 Central Appalachian Coal Basin West Virginia, USA MARSHALL MILLER & ASSOCIATES, INC. 85 17.4 Local Plans, Negotiations or Agreements MM&A found no indication of agreements beyond the scope of Federal or State Regulations. 17.5 Mine Closure Plans Applicable regulations require that mines be properly closed, and reclamation commenced immediately upon abandonment. In general, site reclamation includes removal of structures, backfilling, regrading, and revegetation of disturbed areas. For surface mines, much of the expense for backfilling and regrading is completed as part of ongoing mining operations, with only reclamation of final pits and HWM benches required at end-of-mine life. Sediment control is required during the establishment of vegetation, and bond release generally requires a minimum five-year period of site maintenance, water sampling, and sediment control following mine completion. This requirement is reduced to two years for certain operations involving re-mining. Reclamation of underground mines includes closure and sealing of mine openings such as portals and shafts in addition to the items listed above. Estimated costs for mine closure, including water quality monitoring during site reclamation, are included in the financial models. As with all mining companies, an accretion calculation is performed annually so the necessary Asset Retirement Obligations (ARO) can be shown as a Liability on the Balance Sheet. 17.6 Qualified Person’s Opinion The Marfork Mining Complex is an operating facility; all necessary permits for current production have been obtained. MM&A knows of no reason that any permits revisions or new permits that may be required cannot be obtained. Estimated expenditures for site closure and reclamation are included in the financial model for this site. 18 Capital and Operating Costs 18.1 Capital Cost Estimate The production sequence selected for a property must consider the proximity of each reserve area to coal preparation plants, river docks and/or railroad loading points, along with suitability of production equipment to coal seam conditions. The in-place infrastructure was evaluated, and any future needs were planned to a level suitable for a Preliminary Feasibility Study and included in the Capital Forecast. Alpha Metallurgical Resources, Inc. Statement of Coal Resources and Reserves for the Marfork Mining Complex in Accordance with United States SEC Standards as of December 31, 2023 Central Appalachian Coal Basin West Virginia, USA MARSHALL MILLER & ASSOCIATES, INC. 86 Alpha provided MM&A with information related to the number of currently operating production units at Marfork. MM&A’s capital schedules assume that major equipment rebuilds occur over the course of each machine’s remaining assumed operating life. Replacement equipment was scheduled based on MM&A’s experience and knowledge of mining equipment and industry standards with respect to the useful life of such equipment. As one mine is depleted, the equipment is moved to its replacement. The capital expenditures tables detail costs for major equipment and infrastructure such as conveyor belt terminal groups. “Other” costs include expenditures for mine access and construction, mine extension capital and miscellaneous costs. A summary of the estimated capital for the consolidated Marfork operations is provided in Figure 18-1 below. Total capital by mine is summarized in Table 18- 1. Figure 18-1: Projected Capital Expenditures – Consolidated Marfork Operations

Alpha Metallurgical Resources, Inc. Statement of Coal Resources and Reserves for the Marfork Mining Complex in Accordance with United States SEC Standards as of December 31, 2023 Central Appalachian Coal Basin West Virginia, USA MARSHALL MILLER & ASSOCIATES, INC. 87 Table 18-1: Summary of Capital Expenditures Schedule by Mine Item Total 2023 2024 2025 2026 2027 2028 2029 Laurel Hernshaw $48,516 $0 $0 $0 $0 $6,216 $4,320 $0 Black King LCG Brown's Br $97,528 $0 $0 $0 $0 $0 $0 $0 Workman Upper Eagle $16,586 $0 $0 $0 $0 $0 $0 $0 Berwind LCG $21,434 $0 $0 $0 $0 $0 $0 $0 Low Gap MCG $12,740 $0 $0 $0 $0 $0 $0 $0 Titan MCG $66,729 $0 $0 $0 $0 $0 $0 $0 Coon UCG $250 $0 $0 $0 $0 $0 $0 $0 Ellis UCG $6,222 $0 $0 $0 $0 $0 $0 $0 Slip Ridge Powellton $0 $0 $0 $0 $0 $0 $0 $0 Bee Tree Powellton $4,892 $0 $0 $0 $0 $0 $0 $0 Black Eagle $123,590 $0 $4,320 $14,183 $11,430 $688 $4,320 $9,837 Dow Fork Eagle $100,903 $0 $0 $0 $0 $0 $0 $19,130 Panther Eagle $22,001 $0 $4,320 $4,702 $663 $344 $4,320 $0 Workman's Creek Beckley $554,791 $0 $0 $0 $0 $0 $0 $0 Glen Alum Tunnel $28,710 $0 $8,640 $11,086 $344 $0 $8,640 $0 Workman $159,280 $0 $22,310 $20,310 $19,890 $20,070 $20,970 $22,310 Workman HWM $14,220 $0 $50 $1,120 $1,120 $4,410 $600 $4,680 Total $1,278,392 $0 $39,640 $51,401 $33,447 $31,728 $43,170 $55,957 Item 2030 2031 2032 2033 2034 2035 2036 2037 Laurel Hernshaw $7,275 $0 $7,544 $0 $0 $6,583 $4,320 $0 Black King LCG Brown's Br $0 $0 $0 $0 $0 $0 $0 $0 Workman Upper Eagle $9,042 $0 $7,544 $0 $0 $0 $0 $0 Berwind LCG $0 $0 $0 $0 $0 $0 $0 $0 Low Gap MCG $0 $0 $0 $0 $0 $0 $0 $0 Titan MCG $0 $0 $0 $0 $0 $0 $0 $0 Coon UCG $0 $0 $0 $0 $0 $0 $0 $0 Ellis UCG $0 $0 $0 $0 $0 $0 $0 $0 Slip Ridge Powellton $0 $0 $0 $0 $0 $0 $0 $0 Bee Tree Powellton $0 $0 $0 $0 $4,892 $0 $0 $0 Black Eagle $7,275 $14,550 $7,544 $15,088 $0 $6,902 $18,124 $8,640 Dow Fork Eagle $7,275 $0 $7,544 $7,200 $5,543 $6,927 $4,320 $4,639 Panther Eagle $7,653 $0 $0 $0 $0 $0 $0 $0 Workman's Creek Beckley $0 $0 $0 $0 $0 $127,339 $16,545 $0 Glen Alum Tunnel $0 $0 $0 $0 $0 $0 $0 $0 Workman $16,230 $17,190 $0 $0 $0 $0 $0 $0 Workman HWM $1,120 $1,120 $0 $0 $0 $0 $0 $0 Total $55,870 $32,860 $30,176 $22,288 $10,435 $147,752 $43,309 $13,279 Item 2038 2039 2040 2041 2042 2043 2044 2045 Laurel Hernshaw $663 $0 $11,595 $0 $0 $0 $0 $0 Black King LCG Brown's Br $0 $0 $0 $0 $0 $0 $0 $0 Workman Upper Eagle $0 $0 $0 $0 $0 $0 $0 $0 Berwind LCG $0 $0 $0 $0 $0 $0 $0 $0 Low Gap MCG $0 $0 $0 $0 $0 $0 $0 $0 Titan MCG $0 $0 $0 $0 $0 $0 $0 $0 Coon UCG $0 $0 $0 $0 $0 $0 $0 $0 Ellis UCG $0 $0 $0 $0 $0 $0 $0 $0 Slip Ridge Powellton $0 $0 $0 $0 $0 $0 $0 $0 Bee Tree Powellton $0 $0 $0 $0 $0 $0 $0 $0 Black Eagle $344 $344 $0 $0 $0 $0 $0 $0 Dow Fork Eagle $663 $7,275 $11,595 $4,664 $0 $0 $14,127 $0 Panther Eagle $0 $0 $0 $0 $0 $0 $0 $0 Workman's Creek Beckley $440 $440 $42,882 $30,217 $0 $440 $29,680 $66,146 Glen Alum Tunnel $0 $0 $0 $0 $0 $0 $0 $0 Workman $0 $0 $0 $0 $0 $0 $0 $0 Workman HWM $0 $0 $0 $0 $0 $0 $0 $0 Total $2,110 $8,059 $66,072 $34,881 $0 $440 $43,807 $66,146 Alpha Metallurgical Resources, Inc. Statement of Coal Resources and Reserves for the Marfork Mining Complex in Accordance with United States SEC Standards as of December 31, 2023 Central Appalachian Coal Basin West Virginia, USA MARSHALL MILLER & ASSOCIATES, INC. 88 Item 2046 2047 2048 2049 2050 2051 2052 2053 Laurel Hernshaw $0 $0 $0 $0 $0 $0 $0 $0 Black King LCG Brown's Br $0 $16,904 $0 $11,595 $8,659 $4,320 $319 $4,983 Workman Upper Eagle $0 $0 $0 $0 $0 $0 $0 $0 Berwind LCG $0 $0 $0 $0 $0 $0 $0 $8,346 Low Gap MCG $0 $0 $0 $0 $0 $0 $0 $0 Titan MCG $6,668 $0 $0 $0 $0 $0 $0 $18,188 Coon UCG $0 $0 $0 $0 $0 $0 $0 $0 Ellis UCG $0 $0 $0 $0 $0 $0 $0 $0 Slip Ridge Powellton $0 $0 $0 $0 $0 $0 $0 $0 Bee Tree Powellton $0 $0 $0 $0 $0 $0 $0 $0 Black Eagle $0 $0 $0 $0 $0 $0 $0 $0 Dow Fork Eagle $0 $0 $0 $0 $0 $0 $0 $0 Panther Eagle $0 $0 $0 $0 $0 $0 $0 $0 Workman's Creek Beckley $24,897 $12,561 $30,162 $60,317 $45,137 $31,707 $9,080 $22,483 Glen Alum Tunnel $0 $0 $0 $0 $0 $0 $0 $0 Workman $0 $0 $0 $0 $0 $0 $0 $0 Workman HWM $0 $0 $0 $0 $0 $0 $0 $0 Total $31,565 $29,465 $30,162 $71,912 $53,796 $36,027 $9,399 $54,001 Item 2054 2055 2056 2057 2058 2059 2060 2061 Laurel Hernshaw $0 $0 $0 $0 $0 $0 $0 $0 Black King LCG Brown's Br $5,543 $12,743 $344 $7,200 $0 $12,979 $7,275 $4,320 Workman Upper Eagle $0 $0 $0 $0 $0 $0 $0 $0 Berwind LCG $0 $1,823 $10,920 $0 $344 $0 $0 $0 Low Gap MCG $5,813 $6,927 $0 $0 $0 $0 $0 $0 Titan MCG $0 $5,543 $7,963 $11,520 $0 $0 $6,983 $9,863 Coon UCG $0 $0 $250 $0 $0 $0 $0 $0 Ellis UCG $6,222 $0 $0 $0 $0 $0 $0 $0 Slip Ridge Powellton $0 $0 $0 $0 $0 $0 $0 $0 Bee Tree Powellton $0 $0 $0 $0 $0 $0 $0 $0 Black Eagle $0 $0 $0 $0 $0 $0 $0 $0 Dow Fork Eagle $0 $0 $0 $0 $0 $0 $0 $0 Panther Eagle $0 $0 $0 $0 $0 $0 $0 $0 Workman's Creek Beckley $0 $4,320 $0 $0 $0 $0 $0 $0 Glen Alum Tunnel $0 $0 $0 $0 $0 $0 $0 $0 Workman $0 $0 $0 $0 $0 $0 $0 $0 Workman HWM $0 $0 $0 $0 $0 $0 $0 $0 Total $17,578 $31,356 $19,477 $18,720 $344 $12,979 $14,258 $14,183 Item 2062 2063 2064 2065 2066 2067 2068 2069 Laurel Hernshaw $0 $0 $0 $0 $0 $0 $0 $0 Black King LCG Brown's Br $344 $0 $0 $0 $0 $0 $0 $0 Workman Upper Eagle $0 $0 $0 $0 $0 $0 $0 $0 Berwind LCG $0 $0 $0 $0 $0 $0 $0 $0 Low Gap MCG $0 $0 $0 $0 $0 $0 $0 $0 Titan MCG $0 $0 $0 $0 $0 $0 $0 $0 Coon UCG $0 $0 $0 $0 $0 $0 $0 $0 Ellis UCG $0 $0 $0 $0 $0 $0 $0 $0 Slip Ridge Powellton $0 $0 $0 $0 $0 $0 $0 $0 Bee Tree Powellton $0 $0 $0 $0 $0 $0 $0 $0 Black Eagle $0 $0 $0 $0 $0 $0 $0 $0 Dow Fork Eagle $0 $0 $0 $0 $0 $0 $0 $0 Panther Eagle $0 $0 $0 $0 $0 $0 $0 $0 Workman's Creek Beckley $0 $0 $0 $0 $0 $0 $0 $0 Glen Alum Tunnel $0 $0 $0 $0 $0 $0 $0 $0 Workman $0 $0 $0 $0 $0 $0 $0 $0 Workman HWM $0 $0 $0 $0 $0 $0 $0 $0 Total $344 $0 $0 $0 $0 $0 $0 $0 Note: No capital was projected for 4th quarter 2023.

Alpha Metallurgical Resources, Inc. Statement of Coal Resources and Reserves for the Marfork Mining Complex in Accordance with United States SEC Standards as of December 31, 2023 Central Appalachian Coal Basin West Virginia, USA MARSHALL MILLER & ASSOCIATES, INC. 89 18.2 Operating Cost Estimate Alpha provided historical costs and budgeted projections of operating costs for its active surface and highwall mines (Workman Creek), underground mines (Black Eagle, Panther Eagle, and Horse Creek Eagle, and the Glen Alum Tunnel) for MM&A’s review. MM&A used the historical cost information as a reference and developed a personnel schedule for the mine. Hourly labor rates and salaries were based upon information contained in Alpha’s financial summaries. Fringe benefit costs were developed for vacation and holidays, federal and state unemployment insurance, retirement, workers’ compensation and pneumoconiosis, casualty and life insurance, healthcare, and bonuses. A cost factor for mine supplies was developed that relates expenditures to mine advance rates for roof control costs and other mine supply costs based on the historical cost data provided by Alpha. Other factors were developed for maintenance and repair costs, rentals, mine power, outside services, coal preparation plant processing, refuse handling, coal loading, property taxes and insurance and bonding and other direct mining costs. Appropriate royalty rates were assigned for production from leased coal lands and sales taxes were calculated for state severance taxes, the federal black lung excise tax, and federal and state reclamation fees. Statutory sales-related costs are summarized in Table 18-2. Table 18-2: Estimated Coal Production Taxes and Sales Costs Description of Tax or Sales Cost Basis of Assessment Cost Federal Black Lung Excise Tax - Underground Per Ton $1.10 Federal Black Lung Excise Tax – Surface/Highwall Per Ton $0.55 Federal Reclamation Fees – Underground Per Ton $0.12 Federal Reclamation Fees – Surface/Highwall Per Ton $0.28 West Virginia Reclamation Tax - Underground Per Ton $0.279 West Virginia Severance Tax Percentage of Revenue 1 to 5% Royalties - Surface Percentage of Revenue 8.5% Royalties - Underground Percentage of Revenue 6.0% Notes: 1. Federal black lung excise tax is paid only on coal sold domestically. MM&A assumed 50% of sales will be into domestic market. A summary of the projected operating costs for the consolidated Marfork operations is provided in Figure 18-2. Alpha Metallurgical Resources, Inc. Statement of Coal Resources and Reserves for the Marfork Mining Complex in Accordance with United States SEC Standards as of December 31, 2023 Central Appalachian Coal Basin West Virginia, USA MARSHALL MILLER & ASSOCIATES, INC. 90 Figure 18-2: Marfork Operating Costs 19 Economic Analysis 19.1 Economic Evaluation 19.1.1 Introduction The pre-feasibility financial model prepared for this TRS was developed to test the economic viability of each coal resource area. The results of this financial model are not intended to represent a bankable feasibility study, required for financing of any current or future mining operations contemplated for the Alpha properties, but are intended to establish the economic viability of the estimated coal reserves. Cash flows are simulated on an annual basis based on projected production from the coal reserves. The discounted cash flow analysis presented herein is based on an effective date of January 1, 2024. On an un-levered basis, the NPV of the project cash flow after taxes represents the Enterprise Value of the project. The project cash flow, excluding debt service, is calculated by subtracting direct and indirect operating expenses and capital expenditures from revenue. Direct costs include labor, operating supplies, maintenance and repairs, facilities costs for materials handling, coal preparation, refuse disposal, coal loading, reclamation, and general and administrative costs. Indirect costs include statutory and legally agreed upon fees related to direct extraction of the mineral. The indirect costs

Alpha Metallurgical Resources, Inc. Statement of Coal Resources and Reserves for the Marfork Mining Complex in Accordance with United States SEC Standards as of December 31, 2023 Central Appalachian Coal Basin West Virginia, USA MARSHALL MILLER & ASSOCIATES, INC. 91 are the Federal black lung tax, Federal and State reclamation taxes, property taxes, coal production royalties, and income taxes. The Alpha mines’ historical costs provided a useful reference for MM&A’s cost estimates. The operations are projected on a calendar year basis. MM&A’s projection of annual sales tonnage is summarized in the chart below. While all Alpha coal resources, properties deemed by MM&A to have potential for classification as coal reserves were evaluated as part of the economic model, some of those resource areas were determined to be uneconomical in the current market and were therefore excluded from coal reserves as discussed below. Figure 19-1: Projection of Sales Tons Sales revenue is based on the coal price information provided to MM&A by Alpha. Only the revenue from Alpha’s captive mining operations is included in the financial model used for this TRS. The P&L projections of the individual mines of Alpha’s Marfork operations are then consolidated into a P&L and cash flow schedule for further testing of the economics. Projected debt service is excluded from the P&L and cash flow model to determine Enterprise Value of the aggregated entity. The financial model expresses coal sales prices, operating costs, and capital expenditures in current day dollars without adjustment for inflation. Capital expenditures and reclamation costs are included based Alpha Metallurgical Resources, Inc. Statement of Coal Resources and Reserves for the Marfork Mining Complex in Accordance with United States SEC Standards as of December 31, 2023 Central Appalachian Coal Basin West Virginia, USA MARSHALL MILLER & ASSOCIATES, INC. 92 on engineering estimates for each mine by year. MM&A also included an estimate of administrative costs in the financial projections. Alpha will pay royalties for the various current and projected operations. The royalty rates vary by location as provided by Alpha. The royalty rates were assumed to be 6.0 to 8.5% of the sales revenue. The projection model also includes consolidated income tax calculations at Alpha’s Marfork Division level, incorporating statutory depletion calculations, as well as state income taxes, and a federal tax rate of 21%. To the extent the Alpha mines generate net operating losses for tax purposes, the losses are carried over to offset future taxable income from Alpha mines. The terms “cash flows” and “project cash flows” used in this report refer to after-tax cash flows. Alpha’s projected consolidated annual revenue for the Marfork operations is shown in the chart below: Figure 19-2: Consolidated Annual Revenue Projected consolidated revenue, cash costs, and EBITDA for the Marfork operations are expressed in dollars per ton in the graph below.

Alpha Metallurgical Resources, Inc. Statement of Coal Resources and Reserves for the Marfork Mining Complex in Accordance with United States SEC Standards as of December 31, 2023 Central Appalachian Coal Basin West Virginia, USA MARSHALL MILLER & ASSOCIATES, INC. 93 Figure 19-3: Revenue, Cash Costs, and EBITDA The above chart shows an average LOM revenue of $128 per ton, cash costs of $83 to $121 per ton and EBITDA of $11 to $46 per ton at steady state. Positive EBITDA per ton averages $29.09 per ton over the life of the operations. Table 19-1 shows LOM tonnage, P&L, and EBITDA for each Alpha mine at Marfork. Alpha Metallurgical Resources, Inc. Statement of Coal Resources and Reserves for the Marfork Mining Complex in Accordance with United States SEC Standards as of December 31, 2023 Central Appalachian Coal Basin West Virginia, USA MARSHALL MILLER & ASSOCIATES, INC. 94 Table 19-1: Life-of-Mine Tonnage, P&L before Tax, and EBITDA LOM Tonnage LOM Pre-Tax P&L P&L Per Ton LOM EBITDA EBITDA Per Ton Laurel Hernshaw 4,583 $51,548 $11.25 $108,897 $23.76 Black King LCG Brown's Br 9,917 $167,143 $16.85 $343,720 $34.66 Workman Upper Eagle 1,021 $18,474 $18.09 $32,825 $32.14 Berwind LCG 2,154 $24,190 $11.23 $48,915 $22.71 Low Gap MCG 632 $6,918 $10.94 $13,655 $21.60 Titan MCG 5,238 $96,616 $18.45 $155,040 $29.60 Coon UCG 783 $12,400 $15.84 $22,259 $28.43 Ellis UCG 908 $16,382 $18.04 $21,624 $23.82 Bee Tree Powellton 452 $4,334 $9.59 $9,154 $20.26 Black Eagle 10,649 ($59,679) $(5.60) $123,520 $11.60 Dow Fork Eagle 10,000 $98,365 $9.84 $218,250 $21.83 Horse Creek Eagle 364 ($52) $(0.14) $6,962 $19.11 Panther Eagle 2,812 $56,949 $20.25 $103,178 $36.69 Workman's Creek Beckley 26,132 $496,371 $18.99 $1,033,507 $39.55 Glen Alum Tunnel 2,674 $8,537 $3.19 $60,823 $22.75 Consolidated Deep Mines 78,319 $998,495 $12.75 $2,302,327 $29.40 Surface Mines Workman 16,304 $103,580 $6.35 $248,577 $15.25 Consolidated Surface Mines 16,304 $103,580 $6.35 $248,577 $15.25 Highwall Miner Operations Workman HWM 4,461 $311,502 $69.83 $331,774 $74.38 Consolidated HWMs 4,461 $311,502 $69.83 $331,774 $74.38 Grand Total 99,084 $1,413,577 $14.27 $2,882,678 $29.09 Note: ** LOM tonnage evaluated in the financial model includes September 2023 through December 2023 for underground mines and July 2023 through December 2023 production for surface mines production (1,410,126 clean tons) which was subtracted from coal reserves to make the effective date of the reserves December 31, 2023. As shown in Table 19-1, all the mines analyzed show positive EBITDA over the LOM. Overall, the Alpha consolidated Marfork operations show positive LOM P&L and EBITDA of $1.4 billion and $2.9 billion, respectively. A breakdown of projected EBITDA for the consolidated Marfork operations is shown in the chart below:

Alpha Metallurgical Resources, Inc. Statement of Coal Resources and Reserves for the Marfork Mining Complex in Accordance with United States SEC Standards as of December 31, 2023 Central Appalachian Coal Basin West Virginia, USA MARSHALL MILLER & ASSOCIATES, INC. 95 Figure 19-4: Annual EBITDA 19.1.2 Cash Flow Summary Alpha’s consolidated Marfork cash flow summary in constant dollars, excluding debt service, is shown in Table 19-2 below. Table 19-2: Project Cash Flow Summary (000) YE 12/31 YE 12/31 YE 12/31 YE 12/31 YE 12/31 YE 12/31 Total 2023 2024 2025 2026 2027 2028 Production & Sales tons 99,084 1,837 4,703 5,014 4,339 3,676 4,623 Total Revenue $12,650,363 $219,084 $576,504 $605,617 $525,681 $449,955 $558,645 EBITDA $2,882,678 $63,699 $154,517 $184,802 $131,787 $86,716 $143,825 Net Income $1,166,814 $47,552 $89,398 $111,667 $75,883 $37,134 $80,635 Net Cash Provided by Operating Activities $2,635,916 $39,436 $116,868 $154,338 $128,089 $87,588 $115,877 Purchases of Property, Plant, and Equipment ($1,278,392) $0 ($39,640) ($51,401) ($33,447) ($31,728) ($43,170) Net Cash Flow $1,357,523 $39,436 $77,228 $102,937 $94,642 $55,860 $72,707 YE 12/31 YE 12/31 YE 12/31 YE 12/31 YE 12/31 YE 12/31 YE 12/31 2029 2030 2031 2032 2033 2034 2035 Production & Sales tons 3,263 3,407 3,448 2,651 1,707 1,710 1,641 Total Revenue $410,212 $430,838 $436,697 $342,519 $226,196 $226,567 $217,491 EBITDA $36,099 $46,270 $50,257 $51,332 $28,689 $30,094 $20,363 Net Income ($12,204) ($9,699) $1,419 $5,477 $2,661 $4,073 ($4,381) Net Cash Provided by Operating Activities $56,298 $45,206 $48,856 $53,237 $32,861 $30,167 $21,977 Purchases of Property, Plant, and Equipment ($55,957) ($55,870) ($32,860) ($30,176) ($22,288) ($10,435) ($147,752) Net Cash Flow $341 ($10,664) $15,995 $23,061 $10,573 $19,732 ($125,775) Alpha Metallurgical Resources, Inc. Statement of Coal Resources and Reserves for the Marfork Mining Complex in Accordance with United States SEC Standards as of December 31, 2023 Central Appalachian Coal Basin West Virginia, USA MARSHALL MILLER & ASSOCIATES, INC. 96 YE 12/31 YE 12/31 YE 12/31 YE 12/31 YE 12/31 YE 12/31 YE 12/31 2036 2037 2038 2039 2040 2041 2042 Production & Sales tons 1,694 1,787 1,825 1,852 2,169 2,208 2,149 Total Revenue $222,795 $235,259 $240,297 $243,388 $281,875 $285,662 $277,445 EBITDA $18,459 $27,117 $31,693 $36,479 $57,560 $62,756 $57,289 Net Income ($26,754) ($15,846) ($9,311) ($2,448) $10,756 $16,596 $31,977 Net Cash Provided by Operating Activities $19,529 $25,143 $31,321 $36,300 $53,379 $59,415 $57,760 Purchases of Property, Plant, and Equipment ($43,309) ($13,279) ($2,110) ($8,059) ($66,072) ($34,881) $0 Net Cash Flow ($23,779) $11,864 $29,211 $28,240 ($12,693) $24,534 $57,760 YE 12/31 YE 12/31 YE 12/31 YE 12/31 YE 12/31 YE 12/31 YE 12/31 2043 2044 2045 2046 2047 2048 2049 Production & Sales tons 2,316 2,368 2,602 2,553 2,350 2,147 2,421 Total Revenue $298,002 $304,579 $334,351 $327,843 $301,945 $276,280 $311,187 EBITDA $76,054 $80,785 $103,810 $99,229 $81,204 $67,954 $98,698 Net Income $54,764 $53,250 $61,119 $49,594 $38,837 $29,925 $43,150 Net Cash Provided by Operating Activities $70,770 $78,010 $92,492 $88,565 $79,577 $66,232 $83,054 Purchases of Property, Plant, and Equipment ($440) ($43,807) ($66,146) ($31,565) ($29,465) ($30,162) ($71,912) Net Cash Flow $70,330 $34,203 $26,347 $57,000 $50,112 $36,070 $11,142 YE 12/31 YE 12/31 YE 12/31 YE 12/31 YE 12/31 YE 12/31 YE 12/31 2050 2051 2052 2053 2054 2055 2056 Production & Sales tons 2,679 2,674 2,706 2,695 2,187 2,191 1,969 Total Revenue $344,043 $343,219 $347,355 $346,970 $288,833 $290,385 $260,911 EBITDA $122,378 $121,616 $122,747 $122,033 $65,274 $67,591 $51,975 Net Income $54,502 $55,739 $64,468 $57,122 $12,740 $40,617 $23,181 Net Cash Provided by Operating Activities $104,041 $110,950 $111,581 $109,528 $73,715 $59,758 $55,283 Purchases of Property, Plant, and Equipment ($53,796) ($36,027) ($9,399) ($54,001) ($17,578) ($31,356) ($19,477) Net Cash Flow $50,245 $74,924 $102,182 $55,527 $56,137 $28,402 $35,806 YE 12/31 YE 12/31 YE 12/31 YE 12/31 YE 12/31 YE 12/31 YE 12/31 2057 2058 2059 2060 2061 2062 2063 Production & Sales tons 1,801 1,743 1,540 1,549 1,174 718 581 Total Revenue $238,708 $230,919 $204,029 $205,270 $155,559 $95,173 $76,978 EBITDA $49,894 $55,261 $50,318 $52,815 $35,487 $21,956 $20,089 Net Income $22,752 $26,852 $23,308 $26,989 $11,050 $4,783 $8,179 Net Cash Provided by Operating Activities $50,293 $53,839 $45,481 $48,668 $38,355 $26,651 $21,920 Purchases of Property, Plant, and Equipment ($18,720) ($344) ($12,979) ($14,258) ($14,183) ($344) $0 Net Cash Flow $31,573 $53,495 $32,502 $34,410 $24,172 $26,307 $21,920 YE 12/31 YE 12/31 YE 12/31 YE 12/31 YE 12/31 YE 12/31 YE 12/31 2064 2065 2066 2067 2068 2069 2070 Production & Sales tons 380 36 0 0 0 0 0 Total Revenue $50,363 $4,733 $0 $0 $0 $0 $0 EBITDA $8,200 ($4,321) ($4,673) ($1,849) ($930) ($474) ($247) Net Income ($1,467) ($12,880) ($9,345) ($3,698) ($1,860) ($948) ($493) Net Cash Provided by Operating Activities $14,022 $2,633 ($37,894) ($12,658) ($6,296) ($3,148) ($3,148) Purchases of Property, Plant, and Equipment $0 $0 $0 $0 $0 $0 $0 Net Cash Flow $14,022 $2,633 ($37,894) ($12,658) ($6,296) ($3,148) ($3,148) Notes: (1) LOM tonnage evaluated in the financial model includes September 2023 through December 2023 for underground mines and July 2023 through December 2023 production for surface mines production (1,410,126 clean tons) which was subtracted from coal reserves to make the effective date of the reserves December 31, 2023. (2) Results shown for 2023 represent 4th quarter only. Consolidated cash flows are driven by annual sales tonnage, which range from 3.3 million tons to 5.0 million tons between 2024 and 2031. Between years 2032 and 2061, sales ranges from 1.2 million to 2.7 million tons and between years 2062-2065, sales range from 0.04 million tons to 0.7 million tons. Projected consolidated revenue peaks at $605.6 million in 2025 and totals $12.7 billion for the project’s life.

Alpha Metallurgical Resources, Inc. Statement of Coal Resources and Reserves for the Marfork Mining Complex in Accordance with United States SEC Standards as of December 31, 2023 Central Appalachian Coal Basin West Virginia, USA MARSHALL MILLER & ASSOCIATES, INC. 97 Consolidated cash flow from operations is positive throughout the projected operating period, apart from post-production years, due to end-of-mine reclamation spending. Consolidated cash flow from operations peaks at $154.3 million in 2025 and totals $2.6 billion over the project life. Capital expenditures total $199.4 million during the first five years and $1.3 billion over the project’s life. Consolidated Marfork net cash flow after tax, but before debt service, is shown by year in the chart below: Figure 19-5: Net Cash Flow after Tax (Before Debt Service) LOM Net cash flow is positive for this project. The cash flows after year 2064 are generally related to end of mine reclamation expenditures, which are accrued over the life of the mines. 19.1.3 Discounted Cash Flow Analysis Cash flow after tax, but before debt service, generated over the life of the project was discounted to NPV at a 16.57% discount rate, which represents MM&A’s estimate of the constant dollar, risk adjusted WACC for likely market participants if the subject reserves were offered for sale. On an un-levered basis, the NPV of the project cash flows represents the Enterprise Value of the project and amounts to $342.8 million. Alpha is an active producer, and the financial model shows positive net cash flow for each year of the operating life of the Marfork reserves. The pre-feasibility financial model prepared for the TRS was developed to test the economic viability of each coal resource area. The NPV estimate was Alpha Metallurgical Resources, Inc. Statement of Coal Resources and Reserves for the Marfork Mining Complex in Accordance with United States SEC Standards as of December 31, 2023 Central Appalachian Coal Basin West Virginia, USA MARSHALL MILLER & ASSOCIATES, INC. 98 made for the purpose of confirming the economics for classification of coal reserves and not for purposes of valuing Alpha or its Marfork assets. Mine plans were not optimized, and actual results of the operations may be different, but in all cases, the mine production plan assumes the properties are under competent management. 19.1.4 Sensitivity Analysis Sensitivity of the NPV results to changes in the key drivers is presented in the chart below. The sensitivity study shows the NPV at the 16.57% discount rate when Base Case sales prices, operating costs, capital costs and discount rate are increased and decreased in increments of 5% within a +/- 15% range. Figure 19-6: Sensitivity of NPV As shown, NPV is quite sensitive to changes in sales price and operating cost estimates, and slightly sensitive to changes in capital cost estimates. 20 Adjacent Properties 20.1 Information Used No Proprietary information associated with neighboring properties was used as part of this study.

Alpha Metallurgical Resources, Inc. Statement of Coal Resources and Reserves for the Marfork Mining Complex in Accordance with United States SEC Standards as of December 31, 2023 Central Appalachian Coal Basin West Virginia, USA MARSHALL MILLER & ASSOCIATES, INC. 99 21 Other Relevant Data and Information MM&A performed a previous evaluation of all the Property in year 2022 for reserves effective as of December 31, 2022, for Alpha based on the (SEC) S-K 1300 regulations. Prior to the 2022 assessment, Marfork was referred to as Mid-West Virginia Underground and Workman was previously included in and referred to as Mid-West Virginia Surface. MM&A utilized this former evaluation as the basis of an updated study for the December 31, 2023 TRS. 22 Interpretation and Conclusions 22.1 Conclusion Sufficient data has been obtained through various exploration and sampling programs and mining operations to support the geological interpretations of seam structure and thickness for coal horizons situated on the Marfork Property. The data is of sufficient quantity and reliability to reasonably support the coal resource and coal reserve estimates in this TRS. The geological data and preliminary feasibility study, which consider mining plans, revenue, and operating and capital cost estimates are sufficient to support the classification of coal reserves provided herein. This geologic evaluation conducted in conjunction with the preliminary feasibility study is sufficient to conclude that the 97.65 Mt of marketable coal reserves identified on the Property are economically mineable under reasonable expectations of market prices for metallurgical coal products, estimated operation costs, and capital expenditures. 22.2 Risk Factors Risks have been identified for operational, technical, and administrative subjects addressed in the Pre- Feasibility Study. A risk matrix has been constructed to present the risk levels for all the risk factors identified and quantified in the risk assessment process. The risk matrix and risk assessment process are modelled to that presented in the Australian and New Zealand Standard on Risk Management (AS/NZS 4360). The purpose of the characterization of the project risk components is to inform the project stakeholders of key aspects of the Alpha projects that can be impacted by events whose consequences can affect the success of the venture. The significance of an impacted aspect of the operation is directly related to both the probability of occurrence and the severity of the consequences. The initial risk for a risk factor is herein defined as the risk level after the potential impact of the risk factor is addressed by competent Alpha Metallurgical Resources, Inc. Statement of Coal Resources and Reserves for the Marfork Mining Complex in Accordance with United States SEC Standards as of December 31, 2023 Central Appalachian Coal Basin West Virginia, USA MARSHALL MILLER & ASSOCIATES, INC. 100 and prudent management utilizing control measures readily available. Residual risk for a risk factor is herein defined as the risk level following application of special mitigation measures if management determines that the initial risk level is unacceptable. Initial risk and residual risk can be quantified numerically, derived by the product of values assigned to probability and consequence ranging from very low risk to very high risk. The probability and consequence parameters are subjective numerical estimates made by practiced mine engineers and managers. Both are assigned values from 1 to 5 for which the value 1 represents the lowest probability and least consequence, and the value 5 represents the highest probability and greatest consequence. The products, which define the Risk Level, are classified from very low to very high. Risk Level Table (R = P x C) Risk Level (R) Very Low (1 to 2) Low (3 to 5) Moderate (6 to 11) High (12 to 19) Very High (20 to 25) Risk aspects identified and evaluated during this assignment total 13. No residual risks are rated Very High. Three (3) residual risks are rated High. Six (6) of the risk aspects could be associated with Moderate residual risk. Four (4) of the risk aspects were attributed Low or Very Low residual risks. 22.2.1 Governing Assumptions The listing of the aspects is not presumed to be exhaustive. Instead that listing is presented based on the experiences of the contributors to the TRS. 1. The probability and consequence ratings are subjectively assigned, and it is assumed that this subjectivity reasonably reflects the condition of the active and projected mine operations. 2. The Control Measures shown in the matrices presented in this chapter are not exhaustive. They represent a condensed collection of activities that the author of the risk assessment section has observed to be effective in coal mining scenarios. 3. Mitigation Measures listed for each risk factor of the operation are not exhaustive. The measures listed, however, have been observed by the author to be effective. 4. The monetary values used in ranking the consequences are generally accepted quantities for the coal mining industry.

Alpha Metallurgical Resources, Inc. Statement of Coal Resources and Reserves for the Marfork Mining Complex in Accordance with United States SEC Standards as of December 31, 2023 Central Appalachian Coal Basin West Virginia, USA MARSHALL MILLER & ASSOCIATES, INC. 101 22.2.2 Limitations The risk assessment proposed in this report is subject to the limitations of the information currently collected, tested, and interpreted at the time of the writing of the report. 22.2.3 Methodology The numerical quantities (i.e., risk levels) attributable to either “initial” or “residual” risks are derived by the product of values assigned to probability and consequence ranging from very low risk to very high risk. R = P x C Where: R = Risk Level P = Probability of Occurrence C = Consequence of Occurrence The Probability (P) and Consequence (C) parameters recited in the formula are subjective numerical estimates made by practiced mine engineers and managers. Both P and C are assigned integer values ranging from 1 to 5 for which the value 1 represents the lowest probability and least consequence, and the value 5 represents the highest probability and greatest consequence. The products (R = P x C) which define the Risk Level, are thereafter classified from very low to very high. Risk Level Table Risk Level (R) Very Low (1 to 2) Low (3 to 5) Moderate (6 to 11) High (12 to 19) Very High (20 to 25) Very high initial risks are unacceptable and require corrective action well in advance of project development. In short, measures must be applied to reduce very high initial risks to a tolerable level. As shown and discussed above, after considering the operational, technical, and administrative actions that have been applied or are available for action when required, the residual risk can be determined. The residual risk provides a basis for the management team to determine if the residual risk level is acceptable or tolerable. If the risk level is determined to be unacceptable, further actions should be considered to reduce the residual risk to acceptable or tolerable levels to provide justification for continuation of the proposed operation. Alpha Metallurgical Resources, Inc. Statement of Coal Resources and Reserves for the Marfork Mining Complex in Accordance with United States SEC Standards as of December 31, 2023 Central Appalachian Coal Basin West Virginia, USA MARSHALL MILLER & ASSOCIATES, INC. 102 22.2.4 Development of the Risk Matrix Risks have been identified for the technical, operational, and administrative subjects addressed in the TRS. The risk matrix and risk assessment process are modelled to that presented in the Australian and New Zealand Standard on Risk Management (AS/NZS 4360). 22.2.4.1 Probability Level Table Table 22-1: Probability Level Table Category Probability Level (P) 1 Remote Not likely to occur except in exceptional circumstances. <10% 2 Unlikely Not likely to occur; small in degree. 10 - 30% 3 Possible Capable of occurring. 30 - 60% 4 Likely High chance of occurring in most circumstances. 60 - 90% 5 Almost Certain Event is expected under most circumstances; impossible to avoid. >90% The lowest rated probability of occurrence is assigned the value of 1 and described as remote, with a likelihood of occurrence of less than 10 percent. Increasing values are assigned to each higher probability of occurrence, culminating with the value of 5 assigned to incidents considered to be almost certain to occur. 22.2.4.2 Consequence Level Table Table 22-2 lists the consequence levels.

Alpha Metallurgical Resources, Inc. Statement of Coal Resources and Reserves for the Marfork Mining Complex in Accordance with United States SEC Standards as of December 31, 2023 Central Appalachian Coal Basin West Virginia, USA MARSHALL MILLER & ASSOCIATES, INC. 103 Table 22-2: Consequence Level Table Correlation of Events in Key Elements of the Project Program to Event Severity Category Category Severity of the Event Financial Impact of the Event Unplanned Loss of Production (Impact on Commercial Operations) Events Impacting on the Environment Events Affecting the Program’s Social and Community Relations Resultant Regulatory / Sovereign Risk Events Affecting Occupational Health & Safety 1 Insignificant < USD $0.5 million ≤ 12 hours Insignificant loss of habitat; no irreversible effects on water, soil, and the environment. Occasional nuisance impact on travel. Event recurrence avoided by corrective action through established procedures (Engineering, guarding, training). 2 Minor USD $0.5 million to $2.0 million ≤ 1 day No significant change to species populations; short- term reversible perturbation to ecosystem function. Persistent nuisance impact on travel. Transient adverse media coverage. First aid – lost time. Event recurrence avoided by corrective action thought established procedures. 3 Moderate USD $2.0 million to $10.0 million ≤ 1 week Appreciable change to species population; medium-term (≤10 years) detriment to ecosystem function. Measurable impact on travel and water/air quality. Significant adverse media coverage / transient public outrage. Uncertainty securing or retaining essential approval / license. Medical Treatment – permanent incapacitation Avoiding event recurrence requires modification to established corrective action procedures. Change to regulations (tax; bonds; standards). 4 Major USD $10.0 million to $50.0 million 1 to 2 weeks Change to species population threatening viability; long-term (>10 years) detriment to ecosystem function. Long-term, serious impact on travel and use of water resources; degradation of air quality; sustained and effective public opposition. Suspension / long-delay in securing essential approval / license. Fatality. Avoiding event recurrence requires modification to established corrective action procedures and staff retraining. Change to laws (tax; bonds; standards). 5 Critical >USD $50.0 million >1 month Species extinction; irreversible damage to ecosystem function. Loss of social license. Withdraw / failure to secure essential approval / license. Multiple fatalities. Avoiding event recurrence requires major overhaul of policies and procedures. Alpha Metallurgical Resources, Inc. Statement of Coal Resources and Reserves for the Marfork Mining Complex in Accordance with United States SEC Standards as of December 31, 2023 Central Appalachian Coal Basin West Virginia, USA MARSHALL MILLER & ASSOCIATES, INC. 104 The lowest rated consequence is assigned the value of 1 and is described as Insignificant Consequence with parameters that include non-reportable safety incidents with zero days lost accidents, no environmental damage, loss of production or systems for less than 12 hours and cost of less than USD $0.5 million. Increasing values are assigned to each higher consequence, culminating with the value of 5 assigned to critical consequences, the parameters of which include multiple-fatality accidents, major environmental damage, and loss of production or systems for longer than one month and cost of greater than USD $50.0 million. Composite Risk Matrix R = P x C and Color-Code Convention The risk level, defined as the product of probability of occurrence and consequence, ranges in value from 1 (lowest possible risk) to 25 (maximum risk level). The values are color-coded to facilitate identification of the highest risk aspects. Table 22-3: Risk Matrix P x C = R Consequence (C) Insignificant Minor Moderate Major Critical 1 2 3 4 5 P ro b ab ili ty L ev el ( P ) Remote 1 1 2 3 4 5 Unlikely 2 2 4 6 8 10 Possible 3 3 6 9 12 15 Likely 4 4 8 12 16 20 Almost Certain 5 5 10 15 20 25 22.2.5 Categorization of Risk Levels and Color Code Convention Very high risks are unacceptable and require corrective action. Risk reduction measures must be applied to reduce very high risks to a tolerable level. 22.2.6 Description of the Coal Property The Marfork complex is in Raleigh, Kanawha, Fayette and Boone Counties, West Virginia and is an active operation with four underground mines. The active surface mine operations (Workman Creek) employ contour, area, and highwall mining methods. The active underground operations (Black Eagle Mine, Panther Eagle, Horse Creek Eagle and Glen Alum Tunnel) utilize continuous mining production sections. This method provides continuity, preserving skilled work groups and enabling effective utilization of

Alpha Metallurgical Resources, Inc. Statement of Coal Resources and Reserves for the Marfork Mining Complex in Accordance with United States SEC Standards as of December 31, 2023 Central Appalachian Coal Basin West Virginia, USA MARSHALL MILLER & ASSOCIATES, INC. 105 existing production equipment. The active and projected mines are located above and below drainage and as such are accessed via a combination of drifts, box cuts, shafts, and slopes. 22.2.7 Summary of Residual Risk Ratings Each risk factor is numbered, and a risk level for each is determined by multiplying the assigned probability by the assigned consequence. The risk levels are plotted on a risk matrix to provide a composite view of the Alpha risk profile. The average risk level is 6.8, which is defined as Moderate. Table 22-4: Risk Assessment Matrix C o n se q u en ce Critical >$50 MM Major $10-50MM 9 6 Moderate $2-10 MM 1, 12 2, 8, 14 3, 4 Minor $0.5-$2 MM 13 5, 7, 10 Low <$0.5 MM 11 <10% 10-30% 30-60% 60-90% >90% Remote Unlikely Possible Likely Almost Certain 22.2.8 Risk Factors A high-level approach is utilized to characterize risk factors that are generally similar across several active and proposed mining operations. Risk factors that are unique to a specific operation or are particularly noteworthy are addressed individually. 22.2.8.1 Geological and Coal Resource Coal mining is accompanied by risk that, despite exploration efforts, mining areas will be encountered where geological conditions render extraction of the resource to be uneconomic, or that coal quality characteristics disqualify the product for sale into target markets. Offsetting the geological and coal resource risk are the size of the controlled property which allows flexibility in the selection of mine areas away from areas where coal quality and mineability are less favorable. In addition, many of the underground mines are designed to operate with multiple production sections each, which lessens the immediate impact when one section encounters difficulties. The large reserve areas also provide a mitigation strategy of varying the timing of Alpha Metallurgical Resources, Inc. Statement of Coal Resources and Reserves for the Marfork Mining Complex in Accordance with United States SEC Standards as of December 31, 2023 Central Appalachian Coal Basin West Virginia, USA MARSHALL MILLER & ASSOCIATES, INC. 106 development of mines to offset expected or encountered adverse conditions, thereby maintaining consistent production and quality. This flexibility requires additional extension or development cost but increases performance consistency. The larger reserve areas will be developed with multiple production sections and the small, replacement production reserve areas provide ready access to alternative locations if geological and coal resource characteristics require abandonment of an active production area. Table 22-5: Geological and Coal Resource Risk Assessment (Risks 1 and 2) Aspect Impact Control Measures Initial Risk Level Mitigation Measures Residual Risk Level P C R P C R Recoverable coal tons recognized to be significantly less than previously estimated. Reserve base is adequate to serve market commitments and respond to opportunities for many years. Local adverse conditions may increase frequency and cost of production unit relocations. Previous and ongoing exploration and extensive regional mining history provide a high level of confidence of coal seam correlation, continuity of the coal seams, and coal resource tons. 1 4 4 Optimize mine plan to increase resource recovery; develop mine plan to provide readily available alternate mining locations to sustain expected production level. 1 3 3 Coal quality locally proves to be lower than initially projected. If uncontrolled, production and sale of coal that is out of specification can result in rejection of deliveries, cancellation of coal sales agreements and damage to reputation. Exploration and vast experience and history in local coal seams provide confidence in coal quality; limited excursions can be managed with careful product segregation and blending. 2 5 10 Develop mine plan to provide readily available alternate mining locations to sustain expected production level; modify coal sales agreements to reflect coal quality. 2 3 6 22.2.8.2 Environmental Water quality and other permit requirements are subject to modification and such changes could have a material impact on the capability of the operator to meet modified standards or to receive new permits and modifications to existing permits. Permit protests may result in delays or denials to permit applications. Environmental standards and permit requirements have evolved significantly over the past 50 years and to-date, mining operators and regulatory bodies have been able to adapt successfully to evolving environmental requirements.

Alpha Metallurgical Resources, Inc. Statement of Coal Resources and Reserves for the Marfork Mining Complex in Accordance with United States SEC Standards as of December 31, 2023 Central Appalachian Coal Basin West Virginia, USA MARSHALL MILLER & ASSOCIATES, INC. 107 Table 22-6: Environmental (Risks 3 and 4) Aspect Impact Control Measures Initial Risk Level Mitigation Measures Residual Risk Level P C R P C R Environmental performance standards are modified in the future. Delays in receiving new permits and modifications to existing permits; cost of testing and treatment of water and soils Work with regulatory agencies to understand and influence final standards; implement testing, treatment, and other actions to comply with new standards. 3 4 12 Modify mining and reclamation plans to improve compliance with new standards while reducing cost of compliance. 3 3 9 New permits and permit modifications are increasingly delayed or denied. Interruption of production and delayed implementation of replacement production from new mines. Comply quickly with testing, treatment and other actions required; continue excellent compliance performance within existing permits. 3 4 12 Establish and maintain close and constructive working relationships with regulatory agencies, local communities, and community action groups. 3 3 9 22.2.8.3 Regulatory Requirements Federal and state health and safety regulatory agencies occasionally amend mine laws and regulations. The impact is industry wide. Mining operators and regulatory agencies have been able to adapt successfully to evolving health and safety requirements. Table 22-7: Regulatory Requirements (Risk 5) Aspect Impact Control Measures Initial Risk Level Mitigation Measures Residual Risk Level P C R P C R Federal and state mine safety and health regulatory agencies amend mine laws and regulations. Cost of training, materials, supplies and equipment; modification of mine examination and production procedures; modification of mining plans. Participate in hearings and workshops, when possible, to facilitate understanding and implementation; work cooperatively with agencies and employees to facilitate implementation of new laws and regulations. 4 3 12 Familiarity and experience with new laws and regulations results in reduced impact to operations and productivity and improved supplies and equipment options. 4 2 8 22.2.8.4 Market and Transportation Most of the current and future production is expected to be directed to domestic and international metallurgical markets. Historically, the metallurgical markets have been cyclical and highly volatile. Alpha Metallurgical Resources, Inc. Statement of Coal Resources and Reserves for the Marfork Mining Complex in Accordance with United States SEC Standards as of December 31, 2023 Central Appalachian Coal Basin West Virginia, USA MARSHALL MILLER & ASSOCIATES, INC. 108 Table 22-8: Market and Transportation (Risk 6) Aspect Impact Control Measures Initial Risk Level Mitigation Measures Residual Risk Level P C R P C R Volatile coal prices drop precipitously. Loss of revenue adversely affects profitability; reduced cash flow may disrupt capital expenditures plan. Cost control measures implemented; capital spending deferred. 4 5 20 High-cost operations closed, and employees temporarily furloughed. 4 4 16 Occasional delay or interruption of rail, river and terminals service may be expected. The operator can possibly minimize the impact of delays by being a preferred customer by fulfilling shipment obligations promptly and maintaining close working relationships. Table 22-9: Market and Transportation (Risk 7) Aspect Impact Control Measures Initial Risk Level Mitigation Measures Residual Risk Level P C R P C R Rail or river transport is delayed; storage and shipping access at river and ocean terminals is not available. Fulfillment of coal sales agreements delayed; limited coal storage at mines may increase cost of rehandling; production may be temporarily idled. Provide adequate storage capacity at mines; coordinate continuously with railroad and shipping companies to respond quickly and effectively to changing circumstances. 4 3 12 Provide back-up storage facility along with personnel, equipment and rehandle plan to sustain production and fulfill sales obligations timely. 4 2 8 22.2.8.5 Mining Plan Occupational health and safety risks are inherent in mining operations. Comprehensive training and retraining programs, internal safety audits and examinations, regular mine inspections, safety meetings, along with support of trained fire brigades and mine rescue teams are among activities that greatly reduce accident risks. Employee health monitoring programs coupled with dust and noise monitoring and abatement reduce health risks to miners. As underground mines are developed and extended, observation of geological, hydrogeological, and geotechnical conditions leads to modification of mine plans and procedures to enable safe work within the mine environments. Highlighted below are selected examples of safety and external factors relevant to Alpha’s operations. 22.2.8.5.1 Methane Management Coalbed methane is present in coal operations below drainage. Often the methane concentration in shallow coal seams is at such low levels that it can be readily managed with vigilance, and routine mine ventilation surveys. Very high methane concentrations may be present at greater depths. High

Alpha Metallurgical Resources, Inc. Statement of Coal Resources and Reserves for the Marfork Mining Complex in Accordance with United States SEC Standards as of December 31, 2023 Central Appalachian Coal Basin West Virginia, USA MARSHALL MILLER & ASSOCIATES, INC. 109 methane concentrations may require degasification of the coal seam to assure safe mining. Methane is not expected to be present in most of the Marfork property. Table 22-10: Methane Management (Risk 8) Aspect Impact Control Measures Initial Risk Level Mitigation Measures Residual Risk Level P C R P C R Methane hazard is present in mines operating below drainage. Injury or loss of life; possible ignition of gas and mine explosion; potential loss of mine and equipment temporarily or permanently; additional mine fan, mine power, ventilation, monitoring and examination requirements. Low to moderate levels can be managed with frequent examinations, testing and monitoring within the mine ventilation system. Excellent rock dust maintenance minimizes explosion propagation risk should an ignition occur. 2 5 10 Very high-level methane concentrations may require coal seam degasification and gob degasification where pillar extraction methods are employed. 2 3 6 22.2.8.5.2 Mine Fires Mine fires, once common at mine operations, are rare today. Most active coal miners have not encountered a mine fire. Vastly improved mine power and equipment electrical systems, along with safe mine practices reduce mine fire risks. Crew training and fire brigade support and training improve response for containment and control if a fire occurs. Spontaneous combustion within coal mines, which is the source of most fires that occur today, is not expected to commonly occur at the Alpha property. When spontaneous combustion conditions are present, monitoring systems are employed for early detection and mine plans are designed to facilitate isolation, containment, and rapid extinguishment. Table 22-11: Mine Fires (Risk 9) Aspect Impact Control Measures Initial Risk Level Mitigation Measures Residual Risk Level P C R P C R Mine fire at underground operation or plant stockpile fire. Injury or loss of life; potential loss of mine temporarily or permanently; damage to equipment and mine infrastructure. Inspection and maintenance of mine power, equipment and mine infrastructure; good housekeeping; frequent examination of conveyor belt entries; prompt removal of accumulations of combustible materials. 1 5 5 If spontaneous combustion conditions are present, enhanced monitoring and examination procedures will be implemented; mine design will incorporate features to facilitate isolation, containment, and extinguishment of spontaneous combustion locations. 1 4 4 Alpha Metallurgical Resources, Inc. Statement of Coal Resources and Reserves for the Marfork Mining Complex in Accordance with United States SEC Standards as of December 31, 2023 Central Appalachian Coal Basin West Virginia, USA MARSHALL MILLER & ASSOCIATES, INC. 110 22.2.8.5.3 Ground Control Underground mining exposes miners to the risks of roof falls and rib rolls. Ground control-based risks can be mitigated through effective roof control plans which are supplemented with a strong understanding of future geotechnical conditions. Foremen and crews should be trained to examine the roof, rib and floor conditions and identify pending and immediate hazards. Multiple publicly available software programs can be used to assess pillar sizing and stability. Table 22-12: Ground Control (Risk 10) Aspect Impact Control Measures Initial Risk Level Mitigation Measures Residual Risk Level P C R P C R Ground control issues cause roof failures, rib rolls, floor heave, etc. Injury or loss of life; catastrophic damage to equipment; production interruption. Regular inspection for change and signs of failure. Dynamic design of roof control plan and safety measures to honor observed conditions and exploration- based information; conservative pillar design. 4 3 12 Multiple operating sections to mitigate any lost production; availability of new working areas in case abandonment of section is required; availability of alternative roof control technologies in case of abrupt changes in mining conditions. 4 2 8 22.2.8.5.4 Availability of Supplies and Equipment The industry has periodically had trouble receiving timely delivery of mine supplies and equipment. Availability issues often accompanied boom periods for coal demand. Any future delivery of supplies and equipment delays are expected to be temporary with limited impact on production. Table 22-13: Availability of Supplies and Equipment (Risk 11) Aspect Impact Control Measures Initial Risk Level Mitigation Measures Residual Risk Level P C R P C R Disruption of availability for supplies and equipment. Temporary interruption of production. Force majeure provision in coal sales agreements to limit liability for delayed or lost sales. 3 2 6 Work closely with customers to assure delayed coal delivery rather than cancelled sales; monitory external conditions and increase inventory of critical supplies; accelerate delivery of equipment when possible. 3 1 3 22.2.8.5.5 Labor Work stoppage due to labor protests are unlikely and accompanied by limited impact should it occur. Strong employee relations and communications limit the exposure to outside protesters. Loss of

Alpha Metallurgical Resources, Inc. Statement of Coal Resources and Reserves for the Marfork Mining Complex in Accordance with United States SEC Standards as of December 31, 2023 Central Appalachian Coal Basin West Virginia, USA MARSHALL MILLER & ASSOCIATES, INC. 111 supervisors and skilled employees to retirement is inevitable; the impact can be lessened with succession planning, training and mentorship of new employees. Table 22-14: Labor – Work Stoppage (Risk 12) Aspect Impact Control Measures Initial Risk Level Mitigation Measures Residual Risk Level P C R P C R Work stoppage due to slowdowns or secondary boycott activity. Loss of production and coal sales; damaged customer and employee relations; reputation loss. Maintain excellent employee relations and communications; maintain frequent customer communications. 2 3 6 Develop plan for employee communications and legal support to minimize impact of secondary boycott activities. 1 3 3 Table 22-15: Labor – Retirement (Risk 13) Aspect Impact Control Measures Initial Risk Level Mitigation Measures Residual Risk Level P C R P C R Retirement of supervisors and skilled employees. Loss of leadership and critical skills to sustain high levels of safety, maintenance, and productivity. Monitor demographics closely and maintain communications with employees who are approaching retirement age; maintain employee selection and training programs. 3 3 9 Maintain selection of candidates and implementation of in-house or third-party training for electricians and mechanics; develop employee mentoring program. 3 2 6 22.2.8.6 Comprehensive Health and Safety While largely incorporated in mine plan-based risk factors, effective health and safety programs reduce the risk of accidents, associated loss of production and fines. Currently, coal mining and processing requires a robust health and safety team, consisting of executive level health and safety roles, regional health and safety managers, and multiple operational level health and safety coordinators. Table 22-16: Health and Safety (Risk 14) Aspect Impact Control Measures Initial Risk Level Mitigation Measures Residual Risk Level P C R P C R Failure to attain operations safety standards and associated occurrence of accidents Injuries and possible loss of life; damage to morale and workforce confidence; loss of production and diminished productivity; regulatory issues, closures, and fines; reputation loss Safety and loss control awareness training to help employees recognize hazardous conditions and actions; frequent job observations and feedback; periodic employee performance reviews 2 5 10 Senior management's active participation in safety process; utilization of motivational methods to reinforce company's values and commitment to safety; regular comprehensive safety audits to assure safety standards are maintained. 2 3 6 Alpha Metallurgical Resources, Inc. Statement of Coal Resources and Reserves for the Marfork Mining Complex in Accordance with United States SEC Standards as of December 31, 2023 Central Appalachian Coal Basin West Virginia, USA MARSHALL MILLER & ASSOCIATES, INC. 112 23 Recommendations Alpha should continue to work both internally and with outside assistance to further define their Resource Base and to Optimize the LOM Plan. 24 References Publicly available information from various State and Federal agencies was used where relevant. JOURNEL, A.G., & HUIJBREGTS, CH, J., 1978: Mining Geostatistics, The Blackburn Press Caldwell, New Jersey. 25 Reliance on Information Provided by Registrant A summary of the information provided by Alpha relied upon by MM&A for the purposes of this TRS is provided in Table 25-1. Table 25-1: Information from Registrant Relied Upon by MM&A Category Information Provided by Alpha Report Section Marketing Long-term price forecast used in financial projections 16.2 Legal Mineral control and surface control rights as shown on maps 3.2, 3.3 Environmental Permit and bonding information 17.3

APPENDIX A SUMMARY TABLES Alpha Metallurgical Resources 2023 SEC Update - Marfork Summary of Coal Resource (Short Tons) • Effective December 31, 2023 Appendix A Table 1 Mine/Area Seam Measured Indicated Total Inferred Grand Total Owned Leased Permitted Not Permitted Ash% Sulfur% VM% Workman Creek Surface Multi 3,981,000 848,000 4,829,000 5,000 4,834,000 0 4,829,000 4,829,000 0 - - - Workman Creek HWM Multi 0 0 0 0 0 0 0 0 0 - - - Seng Creek Chilton 14,555,000 11,353,000 25,907,000 0 25,907,000 25,907,000 0 0 25,907,000 - - - Black King Upper Cedar Grove 25,826,000 2,064,000 27,891,000 0 27,891,000 0 27,891,000 0 27,891,000 - - - Titan Middle Cedar Grove 393,000 8,000 401,000 0 401,000 0 401,000 401,000 0 - - - Black King LCG Lower Cedar Grove 4,589,000 644,000 5,234,000 0 5,234,000 0 5,234,000 0 5,234,000 7 0.8 - Powellon 10-B Powellton 3,533,000 211,000 3,744,000 0 3,744,000 0 3,744,000 0 3,744,000 - - - Slip Ridge Powellton Powellton 656,000 17,000 673,000 0 673,000 0 673,000 237,000 435,000 5 0.9 - Laurel Branch Upper Eagle 6,880,000 1,863,000 8,743,000 0 8,743,000 0 8,743,000 0 8,743,000 8 0.8 - Marfork (Eagle A) Eagle A 14,547,000 5,555,000 20,101,000 8,000 20,109,000 0 20,101,000 0 20,101,000 8 1.8 - Dow Fork Eagle 0 0 0 1,320,000 1,320,000 0 0 0 0 36 0.7 - Panther Eagle Eagle 2,762,000 495,000 3,257,000 0 3,257,000 0 3,257,000 3,257,000 0 13 1.5 - Sycamore Eagle 7,278,000 896,000 8,173,000 0 8,173,000 0 8,173,000 0 8,173,000 - - - Glen Alum Tunnel Glen Alum Tunnel 1,936,000 1,747,000 3,684,000 223,000 3,906,000 0 3,684,000 3,684,000 0 45 0.9 4 Workman Beckley 2,934,000 5,605,000 8,539,000 57,000 8,596,000 0 8,539,000 0 8,539,000 20 1.3 - Mountain Laurel Beckley 14,800,000 14,565,000 29,365,000 55,000 29,420,000 29,365,000 0 0 29,365,000 - - - Mountain Laurel Fire Creek 4,389,000 1,506,000 5,895,000 0 5,895,000 5,895,000 0 0 5,895,000 4 0.7 20 Total 109,059,000 47,377,000 156,436,000 1,667,000 158,103,000 61,168,000 95,268,000 12,408,000 144,028,000 22 1.0 17 Note(1): Resource tons are exclusive of reserve tons (not converted to reserve). Note (2): Coal resources are reported on a dry basis. Surface moisture and inherent moisture are excluded. Note (3): The Property contains 156.4 million tons (Mt) of dry, in-place measured and indicated coal resources exclusive of reserves as of December 31, 2023. All resources exclusive of reserves are considered a met market. Totals may not add due to rounding. Quality (Dry Basis) By Permit StatusBy Reliability Category Coal Resource (Dry Tons, In Situ) By Control Type AMR118 Marfork Tables (2024-01-24).xlsx • MWVU ANR Resource Report • 1/26/2024 Page 1 of 1

Alpha Metallurgical Resources 2023 SEC Update - Marfork Summary of Coal Reserves (Short Tons) • Effective December 31, 2023 Appendix A Table 2 By Permit Status By Market Mine/Area Mine Proven Probable Total Surface UG Owned Leased Permitted Not Permitted Thermal Met Ash% Sulfur% VM% Workman Creek Surface Multi 0 15,495,000 15,495,000 15,495,000 0 67,000 15,427,000 15,495,000 0 4,648,000 10,846,000 10 0.9 - Workman Creek HWM Multi 4,249,000 64,000 4,313,000 4,313,000 0 0 4,313,000 3,544,000 769,000 0 4,313,000 6 0.9 - Laurel Area Hernshaw 3,562,000 1,021,000 4,583,000 0 4,583,000 0 4,583,000 0 4,583,000 0 4,583,000 5 0.8 36 Coon Cedar Grove Upper Cedar Grove 765,000 18,000 783,000 0 783,000 0 783,000 783,000 0 0 783,000 7 1.1 35 Ellis Cedar Grove Upper Cedar Grove 901,000 7,000 908,000 0 908,000 0 908,000 908,000 0 0 908,000 5 0.9 - Titan Middle Cedar Grove 0 5,238,000 5,238,000 0 5,238,000 0 5,238,000 3,932,000 1,306,000 0 5,238,000 6 1.1 37 Low Gap Middle Cedar Grove 632,000 0 632,000 0 632,000 0 632,000 0 632,000 0 632,000 6 0.8 - Black King LCG Lower Cedar Grove 8,535,000 1,383,000 9,917,000 0 9,917,000 0 9,917,000 4,509,000 5,409,000 0 9,917,000 5 0.7 36 Berwind Lower Cedar Grove 2,100,000 54,000 2,154,000 0 2,154,000 0 2,154,000 0 2,154,000 0 2,154,000 5 0.9 - Beetree Powellton 336,000 116,000 452,000 0 452,000 0 452,000 275,000 177,000 0 452,000 2 0.8 - Workman Upper Eagle 1,016,000 6,000 1,021,000 0 1,021,000 0 1,021,000 0 1,021,000 0 1,021,000 6 0.8 30 Black Eagle Eagle 6,588,000 3,838,000 10,426,000 0 10,426,000 98,000 10,328,000 6,926,000 3,500,000 0 10,426,000 5 0.8 35 Dow Fork Eagle 6,935,000 3,064,000 10,000,000 0 10,000,000 270,000 9,729,000 7,026,000 2,973,000 0 10,000,000 5 0.7 32 Panther Eagle Eagle 2,232,000 448,000 2,680,000 0 2,680,000 0 2,680,000 2,680,000 0 0 2,680,000 4 1.1 34 Horse Creek Eagle 297,000 68,000 364,000 0 364,000 0 364,000 364,000 0 0 364,000 4 1.1 34 Glen Alum Tunnel Glen Alum Tunnel 1,847,000 708,000 2,555,000 0 2,555,000 219,000 2,335,000 1,285,000 1,269,000 0 2,555,000 5 0.9 26 Workman Beckley 13,339,000 12,793,000 26,132,000 0 26,132,000 1,558,000 24,573,000 2,924,000 23,207,000 0 26,132,000 5 0.9 20 Grand Total Grand Total 53,333,000 44,320,000 97,652,000 19,807,000 77,845,000 2,214,000 95,438,000 50,651,000 47,001,000 4,648,000 93,004,000 6 0.9 30 Notes: Marketable reserve tons are reported on a moist basis, including a combination of surface and inherent moisture. Coal quality is based on a weighted average of laboratory analysis from core holes. The combination of surface and inherent moisture is modeled at 6.0-percent. Actual product moisture is dependent upon multiple geological factors, operational factors, and product contract specifications and can exceed 8-percent. As such, the modeled moisture values provide a level of conservatism for reserve reporting. Totals may not add due to rounding. Demonstrated Coal Reserves By Mining TypeBy Reliability Category Quality (Dry Basis)(Wet Tons, Washed or Direct Shipped) By Control Type AMR118 Marfork Tables (2024-02-06).xlsx • MWVU ANR Reserve Report • 2/6/2024 Page 1 of 1 APPENDIX B INITIAL ECONOMIC ASSESSMENT RESOURCES EXCLUSIVE OF RESERVES (PER TON)

Alpha Metallurgical Resources, Inc. Initial Economic Assessment, Resources Exclusive of Reserves (per Ton) Appendix B: Marfork Complex Seam: CH GAT MCG LCG LCG UCG EG EG EG BEC BEC FC POW POW EGA EGA POW GAT Win & Abv. Marfork Marfork Marfork Marfork Marfork Marfork Marfork Marfork Marfork Marfork Marfork Marfork Marfork Marfork Marfork Marfork Marfork Marfork Marfork Area: Elk Run Seng Creek Chilton Glen Alum Tunnel Block E Titan Middle Cedar Grove Block D Black King I Block A1 Black King I Block C Black King UCG Dow Fork Eagle Sycamore Eagle Panther Eagle Beckley Mt. Laurel Beckley Workman Firecreek Mt. Laurel Laurel Br Upper Eagle Powellton Block 10-B Marfork Eagle A Block A Marfork Eagle A Blocks B&C Slip Ridge Powellton Glen Alum Block B1 Workman Creek (WIN & Above) In-Place Resource Tons (not adjusted for Q4 2023 Depletion) 25,907,000 3,683,572 401,000 2,065,000 3,169,000 27,891,000 1,319,948 8,105,000 3,256,899 29,420,000 8,596,000 5,895,000 8,743,000 3,744,000 5,831,213 14,278,000 672,892 222,668 6,561,580 Potentially Recoverable Tons* 6,087,692 997,432 164,970 834,852 1,286,197 8,949,706 255,618 2,775,028 1,197,538 6,928,697 2,216,225 1,642,161 2,945,628 1,085,980 2,330,284 4,703,623 285,693 54,108 5,306,033 Mining Method Deep - CM Deep - CM Deep - CM Deep - CM Deep - CM Deep - CM Deep - CM Deep - CM Deep - CM Deep - CM Deep - CM Deep - CM Deep - CM Deep - CM Deep - CM Deep - CM Deep - CM Deep - CM Surface Assumed Sales Realization at Plant** 140$ 140$ 140$ 140$ 140$ 140$ 140$ 140$ 140$ 140$ 140$ 140$ 140$ 140$ 140$ 140$ 140$ 140$ 140$ Initial Capex Estimate to Access Resources*** 29,000,000$ 9,000,000$ 2,000,000$ -$ 9,000,000$ 73,000,000$ -$ 29,000,000$ -$ 183,000,000$ 17,000,000$ 29,000,000$ 9,000,000$ 9,000,000$ 9,000,000$ 9,000,000$ 3,500,000$ -$ 812,000$ Direct Mining Costs: Labor**** 19.44$ 35.04$ 30.65$ 32.37$ 27.34$ 38.03$ 28.53$ 25.05$ 26.15$ 35.07$ 27.67$ 37.70$ 35.48$ 30.58$ 29.14$ 32.17$ 32.43$ 24.77$ Supplies, Excluding Roof Control 5.95$ 10.25$ 9.38$ 8.89$ 8.37$ 10.44$ 8.73$ 7.67$ 9.34$ 9.63$ 7.60$ 10.35$ 9.74$ 9.36$ 8.92$ 9.85$ 9.93$ 6.81$ Roof Control 4.96$ 11.60$ 7.82$ 7.40$ 6.97$ 8.70$ 7.28$ 6.39$ 7.78$ 8.02$ 6.54$ 8.62$ 8.12$ 7.80$ 7.43$ 8.20$ 8.27$ 5.68$ M&R 13.66$ 8.14$ 10.84$ 12.05$ 11.19$ 12.67$ 15.03$ 11.19$ 14.96$ 11.21$ 9.52$ 12.50$ 13.71$ 12.74$ 12.21$ 13.82$ 14.20$ 11.48$ Power 2.35$ 0.66$ 1.87$ 2.08$ 1.93$ 2.18$ 2.59$ 1.93$ 2.58$ 1.93$ 1.64$ 2.16$ 2.36$ 2.20$ 2.11$ 2.38$ 2.45$ 1.98$ Other 4.00$ 3.97$ 3.18$ 3.53$ 3.28$ 3.71$ 4.41$ 3.28$ 4.39$ 3.29$ 2.79$ 3.66$ 4.02$ 3.73$ 3.58$ 4.05$ 4.16$ 3.36$ Total Direct Cash Costs 50.36$ 69.66$ 63.74$ 66.32$ 59.09$ 75.74$ 66.58$ 55.50$ 65.20$ 69.16$ 55.77$ 74.99$ 73.43$ 66.40$ 63.38$ 70.48$ 71.45$ 54.08$ 55.07$ Transporation, Washing, Environmental & G&A Costs: Coal Prep***** 12.72$ 12.76$ 10.09$ 11.22$ 10.42$ 11.80$ 14.00$ 10.41$ 13.93$ 10.44$ 8.87$ 11.64$ 12.77$ 11.86$ 11.37$ 12.87$ 13.22$ 10.69$ 4.30$ Materials Handling 1.50$ 1.50$ 1.50$ 1.50$ 1.50$ 1.50$ 1.50$ 1.50$ 1.50$ 1.50$ 1.50$ 1.50$ 1.50$ 1.50$ 1.50$ 1.50$ 1.50$ 1.50$ 1.50$ Raw Coal Trucking***** 9.37$ 2.99$ 10.47$ 3.83$ 3.56$ 4.03$ 16.07$ 3.56$ -$ 9.41$ 2.53$ 10.49$ 11.23$ 4.13$ 4.47$ 11.74$ 11.63$ 9.40$ 2.92$ Clean Coal Trucking 1.25$ 1.25$ 1.25$ 1.25$ 1.25$ 1.25$ 1.25$ 1.25$ 1.25$ 1.25$ 1.25$ 1.25$ 1.25$ 1.25$ 1.25$ 1.25$ 1.25$ 1.25$ 0.50$ Enviro****** 0.35$ 0.35$ 0.35$ 0.35$ 0.35$ 0.35$ 0.35$ 0.35$ 0.35$ 0.35$ 0.35$ 0.35$ 0.35$ 0.35$ 0.35$ 0.35$ 0.35$ 0.35$ 0.35$ G&A 6.00$ 5.26$ 6.00$ 6.00$ 6.00$ 6.00$ 6.00$ 6.00$ 6.00$ 6.00$ 6.00$ 6.00$ 6.00$ 6.00$ 6.00$ 6.00$ 6.00$ 6.00$ 4.60$ Total Transporation, Washing, Environmental & G&A Costs: 31.19$ 24.11$ 29.66$ 24.15$ 23.08$ 24.93$ 39.16$ 23.07$ 23.03$ 28.95$ 20.50$ 31.23$ 33.10$ 25.09$ 24.94$ 33.71$ 33.95$ 29.19$ 14.17$ Indirect Cash Costs Royalty 8.40$ 8.40$ 8.40$ 8.40$ 8.40$ 8.40$ 8.40$ 8.40$ 8.40$ -$ 8.40$ -$ 8.40$ 8.40$ 8.40$ 8.40$ 8.40$ 8.40$ 11.90$ Black Lung Excise Tax 0.55$ 0.55$ 0.55$ 0.55$ 0.55$ 0.55$ 0.55$ 0.55$ 0.55$ 0.55$ 0.55$ 0.55$ 0.55$ 0.55$ 0.55$ 0.55$ 0.55$ 0.55$ 0.25$ SMCRA 0.12$ 0.12$ 0.12$ 0.12$ 0.12$ 0.12$ 0.12$ 0.12$ 0.12$ 0.12$ 0.12$ 0.12$ 0.12$ 0.12$ 0.12$ 0.12$ 0.12$ 0.12$ 0.28$ State Severance 7.00$ 2.80$ 1.40$ 1.40$ 2.80$ 1.40$ 7.00$ 7.00$ 1.40$ 2.80$ 7.00$ 1.40$ 1.40$ 2.80$ 1.40$ 2.80$ 1.40$ 1.40$ 7.02$ Property Tax & Insurance 1.40$ 0.70$ 1.40$ 1.40$ 1.40$ 1.40$ 1.40$ 1.40$ 1.40$ 1.40$ 1.40$ 1.40$ 1.40$ 1.40$ 1.40$ 1.40$ 1.40$ 1.40$ 1.00$ Total Indirect Cash Costs 17.47$ 12.57$ 11.87$ 11.87$ 13.27$ 11.87$ 17.47$ 17.47$ 11.87$ 4.87$ 17.47$ 3.47$ 11.87$ 13.27$ 11.87$ 13.27$ 11.87$ 11.87$ 20.45$ Non Cash Costs Amoritiztion of Development Capital 4.76$ 9.02$ 12.12$ -$ 7.00$ 8.16$ -$ 10.45$ -$ 26.41$ 7.67$ 17.66$ 3.06$ 8.29$ 3.86$ 1.91$ 12.25$ -$ 0.12$ Depreciation of Initial Equipment and Sustaining Capital 6.73$ 6.73$ 6.73$ 6.73$ 6.73$ 6.73$ 6.73$ 6.73$ 6.73$ 6.73$ 6.73$ 6.73$ 6.73$ 6.73$ 6.73$ 6.73$ 6.73$ 6.73$ 4.60$ Depletion 1.00$ 1.00$ 1.00$ 1.00$ 1.00$ 1.00$ 1.00$ 1.00$ 1.00$ 1.00$ 1.00$ 1.00$ 1.00$ 1.00$ 1.00$ 1.00$ 2.00$ 3.00$ 1.00$ Total Non Cash 12.50$ 16.76$ 19.86$ 7.73$ 14.73$ 15.89$ 7.73$ 18.18$ 7.73$ 34.14$ 15.40$ 25.39$ 10.79$ 16.02$ 11.60$ 9.65$ 20.98$ 9.73$ 5.72$ Total Cash Cost 99.02$ 106.34$ 105.27$ 102.34$ 95.44$ 112.54$ 123.21$ 96.04$ 100.10$ 102.98$ 93.73$ 109.70$ 118.40$ 104.76$ 100.19$ 117.46$ 117.27$ 95.14$ 89.69$ EBITDA 40.98$ 33.66$ 34.73$ 37.66$ 44.56$ 27.46$ 16.79$ 43.96$ 39.90$ 37.02$ 46.27$ 30.30$ 21.60$ 35.24$ 39.81$ 22.54$ 22.73$ 44.86$ 50.31$ Fully Loaded Cost 111.52$ 123.09$ 125.13$ 110.08$ 110.17$ 128.43$ 130.94$ 114.23$ 107.83$ 137.13$ 109.14$ 135.09$ 129.19$ 120.78$ 111.79$ 127.10$ 138.25$ 104.87$ 95.41$ Fully Loaded P&L 28.48$ 16.91$ 14.87$ 29.92$ 29.83$ 11.57$ 9.06$ 25.77$ 32.17$ 2.87$ 30.86$ 4.91$ 10.81$ 19.22$ 28.21$ 12.90$ 1.75$ 35.13$ 44.59$ Passes Resource Iniital Economic Assessment? YES YES YES YES YES YES YES YES YES YES YES YES YES YES YES YES YES YES YES *Potentially recoverable tons are calculated by applying appropriate modifying factors to in-place resource tonnages **Sales realization represents estimated long range sales price. ***No initial capital required where resources are accessible from existing mines. ****Labor rates are driven based off of super section productivities assuming 250 to 300 feet per unit shift per section for underground mineable resources, and $2.50 per cubic yard for surface mineable resources. *****Processing assumed to occur at Marfork plant with the exception of Mt. Laurel resouces, which are assumed to be toll washed at another regional plant. ******Environmental costs assumed to include permiting, outfall maintenance, etc. AMR118 Marfork Initial Economic Assessment Resources Exclusive of Reserves 122123.xlsx Page 1 of 1 APPENDIX C MAPS

Seng Creek Area 3000' Scale In Feet 0 Data Point Location Map 1 Marfork Area Chilton Seam Alpha Metallurgical Resource, LLC Boone & Raleigh Counties, West Virginia Coordinate System: West Virginia South State Plane NAD 27 Controlled Underground Reserve / Resource as of 12/31/23 N Resource Exclusive of Reserve / Not Converted to Reserve Bethlehem Mines No. 113 Bethlehem Mines No. 114 & 115 Laurel Area 4000' Scale In Feet 0 Data Point Location Map 2 Marfork Area Hernshaw Seam Alpha Metallurgical Resource, LLC Boone, Raleigh & Kanawha Counties, West Virginia Coordinate System: West Virginia South State Plane NAD 27 Controlled Underground Reserve / Resource as of 12/31/23 Previous Underground Mining N Resource Inclusive of Reserve / Converted to Reserve

R 1" OF COAL CUT UP 80' Coon Area Ellis Area Black King Area Black King Area 1.5 Scale In Miles 0 Data Point Location Map 3 Marfork Area Upper Cedar Grove Seam Alpha Metallurgical Resource, LLC Boone & Raleigh Counties, West Virginia Coordinate System: West Virginia South State Plane NAD 27 Controlled Underground Reserve / Resource as of 12/31/23 Previous Underground Mining N Resource Exclusive of Reserve / Not Converted to Reserve Resource Inclusive of Reserve / Converted to Reserve TSH-14 BADTOP BADTOP XX XX X X X X X X X X X X X XX X X X XX XX X X X X X X XX XX XX X X X X XX X X X X X X BE LT N o. 2 BELT No.3 X X X X X X X X FALL X XX XX XX X X XX X BAD TOP AREA FALL X XX X X X X X X X X X X X X X XX X X X X X X X X X X 308° 47' 39" AZI. 308° 47' 39" AZI. $ $ $ $ $ $$ $ $ SEALED AREA SEALED AREA SEALED AREA SEALED AREA SEALED AREA SEALED AREA 50 ft. Barrier 128° 52' 05" AZI. $ $ $$ $ $ 21 8° 5 0' 3 0" A ZI . BOTH SPLITS RAMPED UP TOP SPLIT ONLY 308° 48' 28.35" AZI. 308° 48' 28" AZI. 21 8° 4 8' 28 " A ZI . BM M AI NS AZI.308°48'28" Ra m pe d up To p s pli t o nly Bo th S pli ts XX X X X X X X X X X X X X X X X X X X X X X X X X X X X X X X X X X X XX X X X X X XX X X X Laurel Alma Mine Titan Area Low Gap Area 6000' Scale In Feet 0 Data Point Location Map 4 Marfork Area Middle Cedar Grove Seam Alpha Metallurgical Resource, LLC Kanawha & Fayette Counties, West Virginia Coordinate System: West Virginia South State Plane NAD 27 Controlled Underground Reserve / Resource as of 12/31/23 Previous Underground Mining N Resource Exclusive of Reserve / Not Converted to Reserve Resource Inclusive of Reserve / Converted to Reserve

PILLARS MINED 7 MAD DOG MAINS D O O BE R M AI N S FALL FALL FALL HOOVE /FALL LAYERED SHALE Sealed Area of Kessler No. 4 BIG R FAULT FAULT FAULT FAULT Sealed Area of Kessler No. 4 Sealed Area of Kessler No. 4 (Not measured by Elk Run Coal Company) (Not measured by Elk Run Coal Company) (Not measured by Elk Run Coal Company) Berwind Area Black King I Area Black King I Mine 2 Scale In Miles 0 Data Point Location Map 5 Marfork Area Lower Cedar Grove Seam Alpha Metallurgical Resource, LLC Boone & Raleigh Counties, West Virginia Coordinate System: West Virginia South State Plane NAD 27 Controlled Underground Reserve / Resource as of 12/31/23 Previous Underground Mining N Resource Exclusive of Reserve / Not Converted to Reserve Resource Inclusive of Reserve / Converted to Reserve + + + + + + + + ROWLAND NO. 11 MINE Workman Area 10-B Area Beetree Area Slip Ridge Area 1 Scale In Miles 0 Data Point Location Map 6 Marfork Area Powellton Seam Alpha Metallurgical Resource, LLC Boone & Raleigh Counties, West Virginia Coordinate System: West Virginia South State Plane NAD 27 Controlled Underground Reserve / Resource as of 12/31/23 Previous Underground Mining N Resource Exclusive of Reserve / Not Converted to Reserve Resource Inclusive of Reserve / Converted to Reserve

2000 Scale In Feet 0 Data Point Location Map 7A Marfork Area Upper Eagle Seam Alpha Metallurgical Resource, LLC Raleigh & Fayette Counties, West Virginia Coordinate System: West Virginia South State Plane NAD 27 Controlled Underground Reserve / Resource as of 12/31/23 Previous Surface / Underground Mining N Resource Inclusive of Reserve / Converted to Reserve 2000 Scale In Feet 0 Data Point Location Map 7B Marfork - Laurel Creek Area Upper Eagle Seam Alpha Metallurgical Resource, LLC Raleigh & Fayette Counties, West Virginia Coordinate System: West Virginia South State Plane NAD 27 Controlled Underground Reserve / Resource as of 12/31/23 Previous Surface / Underground Mining Resource Exclusive of Reserve / Not Converted to Reserve

6000 Scale In Feet 0 Data Point Location Map 8 Marfork Area Eagle A Seam Alpha Metallurgical Resource, LLC Raleigh & Fayette Counties, West Virginia Coordinate System: West Virginia South State Plane NAD 27 Controlled Underground Reserve / Resource as of 12/31/23 Previous Surface / Underground Mining Resource Exclusive of Reserve / Not Converted to Reserve

4000' Scale In Feet 0 Data Point Location Map 10 Marfork Area Glen Alum Tunnel Seam Alpha Metallurgical Resource, LLC Raleigh County, West Virginia Coordinate System: West Virginia South State Plane NAD 27 Controlled Underground Reserve / Resource as of 12/31/23 Previous Underground Mining N Resource Exclusive of Reserve / Not Converted to Reserve Resource Inclusive of Reserve / Converted to Reserve Beckley Lick Run Bonny Mine Stanaford No. 1 Mine Skelton Mine Mountain Laurel Area Workman Area Beckley Mine 2 Scale In Miles 0 Data Point Location Map 11 Marfork Area Beckley Seam Alpha Metallurgical Resource, LLC Raleigh & Fayette Counties, West Virginia Coordinate System: West Virginia South State Plane NAD 27 Controlled Underground Reserve / Resource as of 12/31/23 Previous Underground Mining N Resource Exclusive of Reserve / Not Converted to Reserve Resource Inclusive of Reserve / Converted to Reserve

Mountain Laurel Area 3000' Scale In Feet 0 Data Point Location Map 12 Marfork Area Fire Creek Seam Alpha Metallurgical Resource, LLC Boone, Raleigh, Kanawha & Fayette Counties, West Virginia Coordinate System: West Virginia South State Plane NAD 27 Controlled Underground Reserve / Resource as of 12/31/23 Previous Underground Mining N Resource Exclusive of Reserve / Not Converted to Reserve Lower Winifrede and Above N Alpha Metallurgical Resources, LLC Map W-2 Marfork - Workman Raleigh County, Virginia Coordinate System: West Virginia South State Plane NAD 27 4000 Scale In Feet 0 Data Point Location Previous Surface Mining Resource Exclusive of Reserve Controlled Surface Resource Not Converted to Reserve as of 12/31/23

Upper Cilton A N Alpha Metallurgical Resources, LLC Map W-3 Marfork - Workman Raleigh County, Virginia Coordinate System: West Virginia South State Plane NAD 27 4000 Scale In Feet 0 Data Point Location Contour / Area Reserve Controlled Surface Resource Inclusive of Reserve / Converted to Reserve as of 12/31/23 Previous Surface / Underground Mining Upper Chilton Through Middle Chilton A N Alpha Metallurgical Resources, LLC Map W-4 Marfork - Workman Raleigh County, Virginia Coordinate System: West Virginia South State Plane NAD 27 4000 Scale In Feet 0 Data Point Location Contour / Area Reserve HWM Reserve - Chilton Rider Highwall Miner Not Shown Previous Surface / Underground Mining Controlled Surface Resource Inclusive of Reserve / Converted to Reserve as of 12/31/23

Middle Cedar Grove Through Lower Chilton N Alpha Metallurgical Resources, LLC Map W-5 Marfork - Workman Raleigh County, Virginia Coordinate System: West Virginia South State Plane NAD 27 5000 Scale In Feet 0 Data Point Location Contour / Area Reserve HWM Reserve - Lower Hernshaw Highwall Miner Not Shown Previous Surface / Underground Mining Controlled Surface Resource Inclusive of Reserve / Converted to Reserve as of 12/31/23 Peerless Upper Split and Lower Cedar Grove N Alpha Metallurgical Resources, LLC Map W-6 Marfork - Workman Raleigh County, Virginia Coordinate System: West Virginia South State Plane NAD 27 4000 Scale In Feet 0 Data Point Location Contour / Area Reserve Previous Surface / Underground Mining Controlled Surface Resource Inclusive of Reserve / Converted to Reserve as of 12/31/23

214' Lower 2 Gas through Peerless C N Alpha Metallurgical Resources, LLC Map W-7 Marfork - Workman Raleigh County, Virginia Coordinate System: West Virginia South State Plane NAD 27 4000 Scale In Feet 0 Data Point Location Contour / Area Reserve HWM Reserve Previous Surface / Underground Mining Controlled Surface Resource Inclusive of Reserve / Converted to Reserve as of 12/31/23 N Alpha Metallurgical Resources, LLC Map W-8 Marfork - Workman Powellton Raleigh County, Virginia Coordinate System: West Virginia South State Plane NAD 27 4000 Scale In Feet 0 Data Point Location Contour / Area Reserve HWM Reserve Previous Surface / Underground Mining Controlled Surface Resource Inclusive of Reserve / Converted to Reserve as of 12/31/24

Upper Eagle Rider 2 and Lower Powellton N Alpha Metallurgical Resources, LLC Map W-9 Marfork - Workman Raleigh County, Virginia Coordinate System: West Virginia South State Plane NAD 27 4000 Scale In Feet 0 Data Point Location Contour / Area Reserve Previous Surface Mining Controlled Surface Resource Inclusive of Reserve / Converted to Reserve as of 12/31/23 Upper Eagle and Upper Eagle Rider N Alpha Metallurgical Resources, LLC Map W-10 Marfork - Workman Raleigh County, Virginia Coordinate System: West Virginia South State Plane NAD 27 4000 Scale In Feet 0 Data Point Location Contour / Area Reserve HWM Reserve Previous Surface / Underground Mining Controlled Surface Resource Inclusive of Reserve / Converted to Reserve as of 12/31/23

Eagle Rider Eagle A N Alpha Metallurgical Resources, LLC Map W-11 Marfork - Workman Raleigh County, Virginia Coordinate System: West Virginia South State Plane NAD 27 4000 Scale In Feet 0 Data Point Location Contour / Area Reserve HWM Reserve Previous Surface / Underground Mining Controlled Surface Resource Inclusive of Reserve / Converted to Reserve as of 12/31/23 SEALED SEALED AREA SEALED AREA SEALED AREA SEALED AREA SEALED AREA SEALED AREA SEALED AREA SEALED AREA SEALED AREA SEALED AREA SEALED AREA SEALED AREA SEALED AREA SEALED AREA SEALED AREA SEALED AREA SEALED AREA SEALED AREA SEALED AREA SEALED AREA SEALED AREA SEALED AREA SEALED AREA SEALED AREA SEALED AREA SEALED AREA SEALED AREA SEALED AREA SEALED AREA SEALED AREA SEALED AREA SEALED AREA SEALED AREA SEALED AREA SEALED AREA SEALED AREA SEALED AREA SEALED AREA SEALED AREA SEALED AREA SEALED AREA SEALED AREA SEALED AREA SEALED AREA SEALED AREA SEALED AREA C=48" Eagle N Alpha Metallurgical Resources, LLC Map W-12 Marfork - Workman Raleigh County, Virginia Coordinate System: West Virginia South State Plane NAD 27 4000 Scale In Feet 0 Data Point Location Contour / Area Reserve HWM Reserve Previous Surface / Underground Mining Controlled Surface Resource Inclusive of Reserve / Converted to Reserve as of 12/31/23

Little Eagle N Alpha Metallurgical Resources, LLC Map W-13 Marfork - Workman Raleigh County, Virginia Coordinate System: West Virginia South State Plane NAD 27 4000 Scale In Feet 0 Data Point Location Contour / Area Reserve HWM Reserve Previous Surface / Underground Mining Controlled Surface Resource Inclusive of Reserve / Converted to Reserve as of 12/31/23
EX-96.5
17
finalvirginiapropertiest.htm
TECHNICAL REPORT SUMMARY - VIRGINIA COMPLEX
finalvirginiapropertiest

Alpha Metallurgical Resources, Inc. Statement of Coal Resources and Reserves for the Virginia Complex in Accordance with United States SEC Standards as of December 31, 2023 Central Appalachian Coal Basin Virginia, USA February 2024 Prepared for: Alpha Metallurgical Resources, Inc. 340 Martin Luther King Jr. Blvd. Bristol, TN 37620 Prepared by: MARSHALL MILLER & ASSOCIATES, INC. 582 Industrial Park Road Bluefield, Virginia 24605 www.mma1.com Alpha Metallurgical Resources, Inc. Statement of Coal Resources and Reserves for the Virginia Complex in Accordance with United States SEC Standards as of December 31, 2023 Central Appalachian Coal Basin Virginia, USA MARSHALL MILLER & ASSOCIATES, INC. 1 Statement of Use and Preparation This updated Technical Report Summary (TRS) was prepared for the sole use of Alpha Metallurgical Resources, Inc. (Alpha) and its affiliated and subsidiary companies and advisors. Copies or references to information in this report may not be used without the written permission of Alpha. The report provides a statement of coal resources and coal reserves for Alpha, as defined under the United States Securities and Exchange Commission (SEC). The statement is based on information provided by Alpha and reviewed by various professionals within Marshall Miller & Associates, Inc. (MM&A). MM&A professionals who contributed to the drafting of this report meet the definition of Qualified Persons (QPs), consistent with the requirements of the SEC. The information in this TRS related to coal resources and reserves is based on, and fairly represents, information compiled by the QPs. At the time of reporting, MM&A’s QPs have sufficient experience relevant to the style of mineralization and type of deposit under consideration and to the activity they are undertaking to qualify as a QP as defined by the SEC. Certain information set forth in this report contains “forward-looking information”, including production, productivity, operating costs, capital costs, sales prices, and other assumptions. These statements are not guarantees of future performance and undue reliance should not be placed on them. The assumptions used to develop the forward-looking and the risks that could cause the actual results to differ materially are detailed in the body of this report. Marshall Miller & Associates, Inc. (MM&A) hereby consents (i) to the use of the information contained in this report dated December 31, 2023, relating to estimates of coal resources and coal reserves controlled by Alpha, (ii) to the use of MM&A’s name, any quotations from or summarizations of this TRS in Alpha’s SEC filings, and (iii) to the filing of this TRS as an exhibit to Alpha’s SEC filings. Qualified Person: /s/ Marshall Miller & Associates, Inc. Date: February 9, 2024

Alpha Metallurgical Resources, Inc. Statement of Coal Resources and Reserves for the Virginia Complex in Accordance with United States SEC Standards as of December 31, 2023 Central Appalachian Coal Basin Virginia, USA MARSHALL MILLER & ASSOCIATES, INC. 2 Table of Contents 1 Executive Summary .................................................................................................................... 8 1.1 Property Description ..................................................................................................... 8 1.2 Ownership ..................................................................................................................... 9 1.3 Geology ......................................................................................................................... 9 1.4 Exploration Status ....................................................................................................... 10 1.5 Operations and Development ..................................................................................... 10 1.6 Mineral Resource ........................................................................................................ 11 1.7 Mineral Reserve .......................................................................................................... 12 1.8 Capital Summary ......................................................................................................... 13 1.9 Operating Costs ........................................................................................................... 14 1.10 Economic Evaluation ................................................................................................... 15 1.10.1 Discounted Cash Flow Analysis ...................................................................... 18 1.10.2 Sensitivity Analysis ......................................................................................... 18 1.11 Permitting ................................................................................................................... 19 1.12 Conclusion and Recommendations .............................................................................. 19 2 Introduction ............................................................................................................................. 20 2.1 Registrant and Terms of Reference ............................................................................. 20 2.2 Information Sources .................................................................................................... 20 2.3 Scope of Assignment ................................................................................................... 21 2.4 Personal Inspections ................................................................................................... 21 3 Property Description ................................................................................................................ 22 3.1 Location ...................................................................................................................... 22 3.2 Titles, Claims or Leases ................................................................................................ 22 3.3 Mineral Rights ............................................................................................................. 23 3.4 Encumbrances ............................................................................................................. 24 3.5 Other Risks .................................................................................................................. 24 4 Accessibility, Climate, Local Resources, Infrastructure and Physiography ............................... 24 4.1 Topography, elevation, and Vegetation ....................................................................... 24 4.2 Access and Transport .................................................................................................. 24 4.3 Proximity to Population Centers .................................................................................. 25 4.4 Climate and Length of Operating Season ..................................................................... 25 4.5 Infrastructure .............................................................................................................. 25 Alpha Metallurgical Resources, Inc. Statement of Coal Resources and Reserves for the Virginia Complex in Accordance with United States SEC Standards as of December 31, 2023 Central Appalachian Coal Basin Virginia, USA MARSHALL MILLER & ASSOCIATES, INC. 3 5 History ...................................................................................................................................... 26 5.1 Previous Operation ..................................................................................................... 26 5.2 Previous Exploration ................................................................................................... 26 6 Geological Setting, Mineralization and Deposit ....................................................................... 26 6.1 Regional, Local and Property Geology ......................................................................... 26 6.2 Mineralization ............................................................................................................. 27 6.3 Deposits ...................................................................................................................... 28 7 Exploration ............................................................................................................................... 29 7.1 Nature and Extent of Exploration ................................................................................ 29 7.2 Drilling Procedures ...................................................................................................... 31 7.3 Mine Data ................................................................................................................... 32 7.4 Hydrology .................................................................................................................... 32 7.5 Geotechnical Data ....................................................................................................... 32 8 Sample Preparation Analyses and Security .............................................................................. 32 8.1 Prior to Sending to the Lab .......................................................................................... 32 8.2 Lab Procedures............................................................................................................ 33 9 Data Verification ...................................................................................................................... 34 9.1 Procedures of Qualified Person ................................................................................... 34 9.2 Limitations .................................................................................................................. 34 9.3 Opinion of Qualified Person ........................................................................................ 35 10 Mineral Processing and Metallurgical Testing .......................................................................... 35 10.1 Testing Procedures ...................................................................................................... 35 10.2 Relationship of Tests to the Whole .............................................................................. 36 10.3 Lab Information ........................................................................................................... 36 10.4 Relevant Results .......................................................................................................... 36 11 Mineral Resource Estimates ..................................................................................................... 36 11.1 Assumptions, Parameters and Methodology ............................................................... 36 11.1.1 Geostatistical Analysis ................................................................................... 38 11.2 Resources Exclusive of Reserves .................................................................................. 41 11.2.1 Initial Economic Assessment .......................................................................... 42 11.3 Qualified Person’s Estimates ....................................................................................... 44 11.4 Qualified Person’s Opinion .......................................................................................... 44 12 Mineral Reserve Estimates ....................................................................................................... 45 12.1 Assumptions, Parameters and Methodology ............................................................... 45 12.2 Mineral Reserves ......................................................................................................... 46

Alpha Metallurgical Resources, Inc. Statement of Coal Resources and Reserves for the Virginia Complex in Accordance with United States SEC Standards as of December 31, 2023 Central Appalachian Coal Basin Virginia, USA MARSHALL MILLER & ASSOCIATES, INC. 4 12.2.1 Surface Reserves............................................................................................ 47 12.2.2 Underground Reserves .................................................................................. 48 12.3 Qualified Person’s Estimates ....................................................................................... 50 12.4 Qualified Person’s Opinion .......................................................................................... 51 13 Mining Methods ....................................................................................................................... 52 13.1 Geotech and Hydrology ............................................................................................... 52 13.2 Production Rates ......................................................................................................... 52 13.3 Mining Related Requirements ..................................................................................... 54 13.3.1 Underground ................................................................................................. 54 13.4 Required Equipment and Personnel ............................................................................ 54 13.4.1 Underground Mines....................................................................................... 54 13.4.2 Surface Mines ................................................................................................ 58 14 Processing and Recovery Methods ........................................................................................... 62 14.1 Description or Flowsheet............................................................................................. 62 14.2 Requirements for Energy, Water, Material and Personnel ........................................... 64 15 Infrastructure ........................................................................................................................... 65 16 Market Studies ......................................................................................................................... 68 16.1 Market Description ..................................................................................................... 68 16.2 Price Forecasts ............................................................................................................ 68 16.3 Contract Requirements ............................................................................................... 69 17 Environmental Studies, Permitting and Plans, Negotiations or Agreements with Local Individuals ....................................................................................................................... 69 17.1 Results of Studies ........................................................................................................ 69 17.2 Requirements and Plans for Waste Disposal ................................................................ 69 17.3 Permit Requirements and Status ................................................................................. 70 17.4 Local Plans, Negotiations or Agreements ..................................................................... 74 17.5 Mine Closure Plans ...................................................................................................... 74 17.6 Qualified Person’s Opinion .......................................................................................... 74 18 Capital and Operating Costs ..................................................................................................... 74 18.1 Capital Cost Estimate................................................................................................... 74 18.2 Operating Cost Estimate .............................................................................................. 77 19 Economic Analysis .................................................................................................................... 78 19.1 Economic Evaluation ................................................................................................... 78 19.1.1 Introduction .................................................................................................. 78 19.1.2 Cash Flow Summary....................................................................................... 83 Alpha Metallurgical Resources, Inc. Statement of Coal Resources and Reserves for the Virginia Complex in Accordance with United States SEC Standards as of December 31, 2023 Central Appalachian Coal Basin Virginia, USA MARSHALL MILLER & ASSOCIATES, INC. 5 19.1.3 Discounted Cash Flow Analysis ...................................................................... 85 19.1.4 Sensitivity Analysis ......................................................................................... 85 20 Adjacent Properties.................................................................................................................. 86 20.1 Information Used ........................................................................................................ 86 21 Other Relevant Data and Information ...................................................................................... 86 22 Interpretation and Conclusions ................................................................................................ 87 22.1 Conclusion................................................................................................................... 87 22.2 Risk Factors ................................................................................................................. 87 22.2.1 Governing Assumptions ................................................................................. 88 22.2.2 Limitations ..................................................................................................... 88 22.2.3 Methodology ................................................................................................. 88 22.2.4 Development of the Risk Matrix .................................................................... 89 22.2.5 Categorization of Risk Levels and Color Code Convention .............................. 92 22.2.6 Description of the Coal Property .................................................................... 92 22.2.7 Summary of Residual Risk Ratings .................................................................. 93 22.2.8 Risk Factors.................................................................................................... 93 23 Recommendations ................................................................................................................. 100 24 References.............................................................................................................................. 100 25 Reliance on Information Provided by Registrant ................................................................... 101 FIGURES (IN REPORT) Figure 1-1: Alpha’s Virginia Property Location Map ............................................................................. 9 Figure 1-2: Projected Capital Expenditures – Consolidated Virginia Operations ................................. 13 Figure 1-3: Virginia Operating Costs .................................................................................................. 15 Figure 1-4: Sensitivity of NPV ............................................................................................................ 19 Figure 6-1: Virginia Stratigraphic Column .......................................................................................... 28 Figure 7-1: Virginia Cross-Section ...................................................................................................... 30 Figure 11-1: Histogram of the Total Seam Thickness for the Jawbone Seam Present in the Virginia Complex .......................................................................................................................... 39 Figure 11-2: Scatter plot of the Total Seam Thickness for the Jawbone Seam Present in the Virginia Complex .......................................................................................................................... 39 Figure 11-3: Variogram of the Total Seam Thickness for the Jawbone Seam Present in the Virginia Complex .......................................................................................................................... 40 Figure 11-4: Result of DHSA for the Jawbone Seam Present in the Virginia Complex .......................... 41 Figure 11-5: Results of Initial Economic Assessment .......................................................................... 43 Figure 13-1: Long Branch Surface Mine Aerial View........................................................................... 58 Figure 13-2: 88-Strip/Three Forks Surface Mine Aerial View .............................................................. 60 Figure 14-1: McClure River Preparation Plant and Refuse Area ......................................................... 63

Alpha Metallurgical Resources, Inc. Statement of Coal Resources and Reserves for the Virginia Complex in Accordance with United States SEC Standards as of December 31, 2023 Central Appalachian Coal Basin Virginia, USA MARSHALL MILLER & ASSOCIATES, INC. 6 Figure 14-2: Tom’s Creek Preparation Plant and Slurry Impoundment .............................................. 64 Figure 15-1: McClure River Preparation Plant & Surface Facilities ..................................................... 66 Figure 15-2: Tom’s Creek Preparation Plant & Surface Facilities ........................................................ 67 Figure 18-1: Projected Capital Expenditures – Consolidated Virginia Operations ............................... 75 Figure 18-2: Virginia Operating Costs ................................................................................................ 78 Figure 19-1: Projection of Sales Tons ................................................................................................. 79 Figure 19-2: Consolidated Annual Revenue ....................................................................................... 80 Figure 19-3: Revenue, Cash Costs, and EBITDA .................................................................................. 81 Figure 19-4: Annual EBITDA ............................................................................................................... 82 Figure 19-5: Net Cash Flow after Tax (Before Debt Service) ............................................................... 85 Figure 19-6: Sensitivity of NPV .......................................................................................................... 86 TABLES (IN REPORT) Table 1-1: Coal Resources Summary as of December 31, 2023 .......................................................... 11 Table 1-2: Coal Reserves Summary (Marketable Sales Basis) as of December 31, 2023 ..................... 12 Table 1-3: Life-of-Mine Tonnage, P&L before Tax, and EBITDA .......................................................... 16 Table 1-4: Project Cash Flow Summary (000) ..................................................................................... 17 Table 2-1: Information Provided to MM&A by Alpha ......................................................................... 21 Table 3-1: Mineral Control – Virginia Complex .................................................................................. 23 Table 11-1: General Reserve & Resource Criteria .............................................................................. 37 Table 11-2: DHSA Results Summary for Radius from a Central Point ................................................. 41 Table 11-3: Results of Initial Economic Assessment ........................................................................... 43 Table 11-4: Coal Resources Summary as of December 31, 2023 ........................................................ 44 Table 12-1: Coal Reserves Summary (Marketable Sales Basis) as of December 31, 2023 ................... 51 Table 13-1: Virginia Complex Underground Mine Production Schedule (x 1,000 Saleable Tons) ........ 53 Table 13-2: Virginia Complex Surface Mine Production Schedule (x 1,000 Saleable Tons) ................. 54 Table 13-3: Virginia Complex Highwall Mine Production Schedule (x 1,000 Saleable Tons) ................ 54 Table 16-1: 2023 Produced Quality ................................................................................................... 68 Table 16-2: Price Forecasts ................................................................................................................ 68 Table 17-1: Virginia Refuse Disposal Summary .................................................................................. 70 Table 17-2: Virginia Mining Permits ................................................................................................... 72 Table 18-1: Summary of Capital Expenditures Schedule by Mine....................................................... 76 Table 18-2: Estimated Coal Production Taxes and Sales Costs ........................................................... 77 Table 19-1: Life-of-Mine Tonnage, P&L before Tax, and EBITDA ........................................................ 81 Table 19-2: Project Cash Flow Summary (000) ................................................................................... 83 Table 22-1: Probability Level Table .................................................................................................... 90 Table 22-2: Consequence Level Table ................................................................................................ 91 Table 22-3: Risk Matrix ...................................................................................................................... 92 Table 22-4: Risk Assessment Matrix .................................................................................................. 93 Table 22-5: Geological and Coal Resource Risk Assessment (Risks 1 and 2) ....................................... 94 Table 22-6: Environmental (Risks 3 and 4) ......................................................................................... 95 Table 22-7: Regulatory Requirements (Risk 5) ................................................................................... 95 Table 22-8: Market and Transportation (Risk 6)................................................................................. 95 Alpha Metallurgical Resources, Inc. Statement of Coal Resources and Reserves for the Virginia Complex in Accordance with United States SEC Standards as of December 31, 2023 Central Appalachian Coal Basin Virginia, USA MARSHALL MILLER & ASSOCIATES, INC. 7 Table 22-9: Market and Transportation (Risk 7)................................................................................. 96 Table 22-10: Methane Management (Risk 8) ..................................................................................... 97 Table 22-11: Mine Fires (Risk 9)......................................................................................................... 97 Table 22-12: Ground Control (Risk 10) ............................................................................................... 98 Table 22-13: Availability of Supplies and Equipment (Risk 11) ........................................................... 98 Table 22-14: Labor – Work Stoppage (Risk 12) .................................................................................. 99 Table 22-15: Labor – Retirement (Risk 13) ......................................................................................... 99 Table 22-16: Health and Safety (Risk 14) ........................................................................................... 99 Table 22-17: Refuse Disposal (Risk 15) ............................................................................................ 100 Table 25-1: Information from Registrant Relied Upon by MM&A .................................................... 101 Appendices A .................................................................................................................................. Summary Tables B ............................................. Initial Economic Assessment, Resources Exclusive of Reserves (per Ton) C ................................................................................................................................................... Maps

Alpha Metallurgical Resources, Inc. Statement of Coal Resources and Reserves for the Virginia Complex in Accordance with United States SEC Standards as of December 31, 2023 Central Appalachian Coal Basin Virginia, USA MARSHALL MILLER & ASSOCIATES, INC. 8 1 Executive Summary 1.1 Property Description Alpha Metallurgical Resources, Inc. (Alpha) authorized Marshall Miller & Associates, Inc. (MM&A) to prepare this updated Technical Report Summary (TRS) of its controlled coal reserves located at the Virginia Complex (Virginia or the Property) in Buchanan, Dickenson, Russell and Wise counties, Virginia. The report provides a statement of coal resources and coal reserves for Alpha, as defined under the United States Securities and Exchange Commission (SEC). Active surface facilities for the operations include the McClure River Preparation plant (McClure) in Dickenson County Virginia, located along the McClure River and adjacent to a CSX rail line. The McClure Plant is about 9 miles southeast of the town of Clintwood, Virginia, the county seat of Dickenson County, and approximately 30 miles northwest of Lebanon VA; the Tom’s Creek Preparation plant in Wise County Virginia is located by Toms Creek, a tributary of the Guest River. The plant is adjacent to a Norfolk Southern (NS) rail line, and is about 10 to 15 miles, route dependent, east of the town of Wise Virginia, and approximately 46 miles northwest of Lebanon Virginia (see Figure 1-1). The Property is composed of approximately 321,600 total acres of mineral control, of which nearly all are contained within 19 separate leases and 5 owned tracts. Alpha Metallurgical Resources, Inc. Statement of Coal Resources and Reserves for the Virginia Complex in Accordance with United States SEC Standards as of December 31, 2023 Central Appalachian Coal Basin Virginia, USA MARSHALL MILLER & ASSOCIATES, INC. 9 Figure 1-1: Alpha’s Virginia Property Location Map 1.2 Ownership The Virginia property involves a complex combination of previous ownership. Predecessors of Alpha, namely Alpha Natural Resources (Alpha), Dickenson Russell Coal Company, Dickenson-Russell Contura LLC, Paramont Coal Company Virginia LLC (Paramont), Paramont Contura LLC, and Clinchfield Coal Company all previously held mining rights on most of the Property. 1.3 Geology Coal seams of currently active operations at the Virginia Mine Complex include the Jawbone, Jawbone Rider, Upper Banner, Lower Banner, Big Fork, Kennedy, Aily, Raven splits and Tiller. These seams are all historically utilized as coking coal. Due to the high value of these coking coals, these mineable seams have been extensively mined in the past. Strata on the Property, among the active sites, are of the Pennsylvanian-aged (approximately 290 to 330 million years ago) Wise Formation. Some of the in-active sites include coals in the overlying Norton Formation. The rock formations between the coal seams are characterized by proportions of sandstone and shale units. In general, the coal seams reach the highest structural elevations along the southeastern margin of the Property, and dip toward the northwest. Several faults with vertical

Alpha Metallurgical Resources, Inc. Statement of Coal Resources and Reserves for the Virginia Complex in Accordance with United States SEC Standards as of December 31, 2023 Central Appalachian Coal Basin Virginia, USA MARSHALL MILLER & ASSOCIATES, INC. 10 displacement (north-south Glamorgan Fault, Paw Paw Fault) on the Prater Quadrangle of the Property trend northwest – southeast impact the underground deposit of the Jawbone Rider seam and the 88 Strip surface mine. Furthermore, the Russell Fork fault impacts the Jawbone Rider seam with horizontal offset. Several faults, with minor vertical displacement, run through the Jawbone reserve but appear to have limited impact on mining. 1.4 Exploration Status The Property has been extensively explored, largely by drilling with continuous coring, and rotary drilling methods often supported by downhole geophysical methods. In addition to exploration means, coal measures obtained from mine exposures have supplemented the database. Most of the data was acquired or generated by previous owners of the Property. These sources comprise the primary data used in the evaluation of the coal resources and coal reserves on the Property. MM&A examined the data available for the evaluation and incorporated all pertinent information into this TRS. Where data were anomalous or not representative, that data was not honored from within the digital databases and for subsequent processing by MM&A. Ongoing exploration has been carried out by Alpha since acquiring the Virginia Complex. The Alpha acquired exploration data has been consistent with past drilling activities. 1.5 Operations and Development As of December 31, 2023, underground mine operations were active at Deep Mine 41 (Jawbone Seam), Deep Mine 44 (Rush Branch – Lower Banner Seam), and the Bear Ridge (Upper Banner Seam) deep mine. Deep Mine 41 produces Mid-Vol coal. High Vol-A coal is the product from Deep Mine 44 and by the Bear Ridge deep mine. Deep Mine 46, also referred to as the Ball Ridge Mine, is in the planning/pre- development stage. Active surface mine operations, with associated Highwall-Miners, include The Long Branch surface mine and 88 Strip. Both mines produce High Vol-A quality coal. Based on the mine plans developed as part of this TRS, annual deep mine production peaks at 2.5 million tons in 2026. Underground reserves will be depleted in 2058. Annual surface mine production peaks at 0.9 million tons in 2025 and highwall mine production peaks at 0.5 million in 2028. Surface and highwall reserves are both depleted in 2032. In addition to the mines, the Virginia Complex includes the McClure River and Toms Creek Preparation Plants. The McClure River Preparation Plant site, with a feed rate capacity of 1,100 raw tons per hour, uses a Heavy Media Vessel for primary separation, Low Density Cyclone for Intermediate Separation and Froth Flotation and Spirals in the Fine Coal Circuit. The plant utilizes both centrifugal and thermal dryers. The McClure River plant produces a product with a dry ash ranging from 8.1% to 27.9% (Middlings) and less Alpha Metallurgical Resources, Inc. Statement of Coal Resources and Reserves for the Virginia Complex in Accordance with United States SEC Standards as of December 31, 2023 Central Appalachian Coal Basin Virginia, USA MARSHALL MILLER & ASSOCIATES, INC. 11 than 0.8% sulfur. Volatile matter averages 24.2%. For year-end 2023, the average utilization rate of the McClure River Preparation Plant was 52.6%. Product is shipped via the CSX Transportation railroad system from the plant. The Tom’s Creek Preparation Plant, also with a feed rate of 1,100 tons/hour, produces a product with an 8.1% to 19.8% (middlings) ash, and 0.83% to 0.96% sulfur ranges. Volatile matter averages 30.0%. The plant uses centrifugal dryers; a Heavy Media Vessel for primary separation; Low Density and Heavy Media Cyclones for Intermediate Separation; Froth Flotation, Spirals and Columns for the Fine Coal Circuit. For year-end 2023, the average utilization rate of the Tom’s Creek Preparation Plant was 43.1%. Product is shipped via the Norfolk Southern railway system from the plant. 1.6 Mineral Resource A coal resource estimate, summarized in Table 1-1 was prepared as of December 31, 2023, for property controlled by Alpha. Table 1-1: Coal Resources Summary as of December 31, 2023 Coal Resource (Dry Tons, In Situ, Mt) Area Seam Measured Indicated Inferred Total Inclusive of Reserve (Converted to Reserve) 88Strip/3Frks Upper Banner-Tiller 11,661,700 1,626,900 0 13,288,600 Long Branch Upper Banner 2 - Lower Banner 2,377,200 528,300 0 2,905,600 Bear Ridge Upper Banner (4650) 521,500 43,200 0 564,700 Ball Ridge (Deep Mine 46) Lower Banner (4900) 4,835,900 383,400 0 5,219,300 Long Branch (Deep Mine 45) Lower Banner (4900) 3,221,600 350,000 0 2,368,900 Rush Branch (Deep Mine 44) Lower Banner (4900) 2,240,900 600 0 2,241,400 Deep Mine 43 Jawbone Rider (5950) 37,893,900 21,339,100 250,700 59,483,700 Black Dog Jawbone (6000) 16,105,700 246,400 0 16,352,100 Deep Mine 41 Jawbone (6000) 55,989,800 15,454,600 0 71,444,400 Deep Mine 42 Jawbone (6000) 41,959,700 7,425,900 0 49,385,600 Total Inclusive of Reserve (Converted to Reserve) 176,807,800 47,398,400 250,700 223,254,200 Exclusive of Reserve (Not Converted to Reserve) Holly Creek Upper Banner (4650) 5,594,200 2,155,800 0 7,750,000 Bear Ridge Upper Banner (4650) 180,900 118,100 0 299,000 Ball Ridge (Deep Mine 46) Lower Banner (4900) 1,003,100 32,000 0 1,035,100 Deep Mine 43 Jawbone Rider (5950) 10,653,400 8,216,300 409,100 19,278,800 Black Dog Jawbone (6000) 6,367,400 1,859,700 0 8,227,200 Deep Mine 41 Jawbone (6000) 4,704,400 705,000 0 5,409,400 Deep Mine 42 Jawbone (6000) 2,023,900 15,000 0 2,038,900 Total Exclusive of Reserve (Not Converted to Reserve) 30,527,300 13,101,900 409,100 44,038,300 Grand Total Inclusive of Reserve (Converted to Reserve) 176,807,800 47,398,400 250,700 223,254,200 Exclusive of Reserve (Not Converted to Reserve) 30,527,300 13,101,900 409,100 44,038,300 Grand Total 207,335,100 60,500,300 659,900 267,292,500 Note(1): Resource tons are inclusive of reserve tons since they are the in-situ tons from which recoverable coal reserves are derived. Note (2): Coal resources are reported on a dry basis. Surface moisture and inherent moisture are excluded. Totals may not add due to rounding. See Appendix A for detailed breakdown.

Alpha Metallurgical Resources, Inc. Statement of Coal Resources and Reserves for the Virginia Complex in Accordance with United States SEC Standards as of December 31, 2023 Central Appalachian Coal Basin Virginia, USA MARSHALL MILLER & ASSOCIATES, INC. 12 1.7 Mineral Reserve The Resource estimate outlined in Table 1-1 inclusive of reserves has been used as the basis for this Reserve calculation, which utilizes a reasonable Preliminary Feasibility Study, a Life-of Mine (LOM) Mine Plan and practical recovery factors. Production modeling was completed with an effective start date of October 1, 2023 for the underground mines, and July 1, 2023 for the surface mines. Factors that would typically preclude conversion of a coal resource to coal reserve, include the following: inferred resource classification; absence of coal quality; poor mine recovery; lack of access to the deposit; geological encumbrances associated with overlying and underlying strata; thin seam trends; complex structures; and insufficient exploration data. The listed factors have all been considered. Reserve consideration excludes those portions of the resource area, which exhibit the aforementioned geologic and/ or operational encumbrances. Proven and probable coal reserves were derived from the defined in-situ coal resource considering relevant processing, economic (including technical estimates of capital, revenue and cost), marketing, legal, environmental, socioeconomic, and regulatory factors. The proven and probable coal reserves on the Property are summarized below in Table 1-2. Table 1-2: Coal Reserves Summary (Marketable Sales Basis) as of December 31, 2023 Demonstrated Coal Reserves Quality (Dry Basis) (Wet Tons, Washed or Direct Shipped) By Reliability Category By Permit Status Seam/Area Proven Probable Total Permitted Not Permitted Ash% Sulfur% VM% Surface Mineable 88 Strip/Three Forks 133,000 3,973,700 4,106,700 2,083,000 2,023,700 6 0.9 29 88 Strip/Three Forks 414,600 2,318,800 2,733,400 391,200 2,342,200 6 0.9 29 Long Branch 103,900 84,000 187,800 125,300 62,600 5 0.8 32 Long Branch 597,400 101,200 698,600 393,700 304,900 5 0.8 31 Total Surface Mineable 1,248,800 6,477,700 7,726,500 2,993,300 4,733,300 6 0.8 31 Underground Upper Banner (4650) Bear Ridge 71,800 11,700 83,500 83,500 0 5 0.7 33 Total Upper Banner (4650) 71,800 11,700 83,500 83,500 0 5 0.7 - Lower Banner (4900) Ball Ridge (Deep Mine 46) 1,189,600 92,400 1,282,000 1,282,000 0 6 0.7 29 Long Branch (Deep Mine 45) 713,200 15,500 728,700 728,700 0 6 0.7 30 Rush Branch (Deep Mine 44) 310,600 0 310,600 150,700 159,900 5 0.7 29 Total Lower Banner (4900) 2,213,400 107,900 2,321,300 2,161,400 159,900 6 0.7 29 Jawbone Rider (5950) Deep Mine 43 13,939,400 7,961,200 21,900,600 0 21,900,600 3 0.8 24 Total Jawbone Rider (5950) 13,939,400 7,961,200 21,900,600 0 21,900,600 3 0.8 24 Jawbone (6000) Black Dog 3,970,400 65,000 4,035,400 4,035,400 0 8 0.6 28 Deep Mine 41 15,367,700 4,356,200 19,724,000 16,851,500 2,872,500 9 0.8 26 Deep Mine 42 10,941,400 2,013,900 12,955,400 12,522,800 432,600 7 0.7 26 Total Jawbone (6000) 30,279,600 6,435,100 36,714,700 33,409,600 3,305,100 8 0.7 26 Total UG Mineable 46,504,100 14,516,000 61,020,100 35,654,500 25,365,600 6 0.8 25 Grand Total Grand Total 47,752,900 20,993,800 68,746,600 38,647,700 30,098,900 6 0.8 25 Notes: Marketable reserve tons are reported on a moist basis, including a combination of surface and inherent moisture. Coal quality is based on a weighted average of laboratory data from core holes. The combination of surface and inherent moisture is modeled at 6.0-percent. Actual product moisture is dependent upon multiple geological factors, operational factors, and product contract specifications and can exceed 8-percent. As such, the modeled moisture values provide a level of conservatism for reserve reporting. Totals may not add due to rounding. See Appendix A for detailed breakdown. Alpha Metallurgical Resources, Inc. Statement of Coal Resources and Reserves for the Virginia Complex in Accordance with United States SEC Standards as of December 31, 2023 Central Appalachian Coal Basin Virginia, USA MARSHALL MILLER & ASSOCIATES, INC. 13 In summary, Alpha controls a total of 68.75 Mt (moist basis) of marketable coal reserves at Virginia, as of December 31, 2023. Of that total, 69 percent are proven, and 31 percent are probable. All 68.75 Mt are leased coal reserves. The maps included in Appendix C reflect mining depletion at the time resource/reserve calculation based on Alpha mine maps as of September 30, 2023 for underground mines and as of June 30, 2023 for surface mines. Mine depletion tonnages were supplied by Alpha through the end of 2023, and MM&A deducted this historical production from the mapped reserves in order to estimate reserves as of December 31, 2023. 1.8 Capital Summary Alpha provided MM&A with information related to the number of currently operating production units at the Virginia complex. MM&A’s capital schedules assume that major equipment rebuilds occur over the course of each machine’s remaining assumed operating life. Replacement equipment was scheduled based on MM&A’s experience and knowledge of mining equipment and industry standards with respect to the useful life of such equipment. As one mine is depleted, the equipment is moved to its replacement mine. The capital expenditures tables detail costs for major equipment and infrastructure such as conveyor belt terminal groups. “Other” costs include expenditures for mine access and construction, mine extension capital and miscellaneous costs. A summary of the estimated capital for the consolidated Virginia operations is provided in Figure 1-2 below. Figure 1-2: Projected Capital Expenditures – Consolidated Virginia Operations

Alpha Metallurgical Resources, Inc. Statement of Coal Resources and Reserves for the Virginia Complex in Accordance with United States SEC Standards as of December 31, 2023 Central Appalachian Coal Basin Virginia, USA MARSHALL MILLER & ASSOCIATES, INC. 14 1.9 Operating Costs Alpha provided historical costs and budgeted projections of operating costs for its active mines; for Deep Mines 41& 44, and Long Branch surface mine and 88 Strip for MM&A’s review. MM&A used the historical cost information as a reference and developed a personnel schedule for each mine. Hourly labor rates and salaries were based upon information contained in Alpha’s financial summaries. Fringe benefit costs were developed for vacation and holidays, federal and state unemployment insurance, retirement, workers’ compensation and pneumoconiosis, casualty and life insurance, healthcare and bonuses. A cost factor for mine supplies was developed that relates expenditures to mine advance rates for roof control costs and other mine supply costs based on the historical cost data provided by Alpha. Other factors were developed for maintenance and repair costs, rentals, mine power, outside services, coal preparation (prep) plant processing, refuse handling, coal loading, property taxes, and insurance and bonding and other direct mining costs. Appropriate royalty rates were assigned for production from leased coal lands and sales taxes were calculated for state severance taxes, the federal black lung excise tax, and federal and state reclamation fees. Company-wide pricing data as provided by Alpha is described in Table 16-2. Note that not all products reflected in Table 16-2 will apply to every business unit. The pricing data assumes a flat-line long term realization of $162 to $163 per short ton port pricing, with an average $125.03 per ton netback pricing reflective of the high- and mid -volatile product currently sold at Virginia. These estimates are based on long-term pricing published by third-party sources and adjusted for quality and transportation. The netback pricing represents adjustments made to published benchmark pricing based on quality and transportation. A large majority of the coal sold by Alpha and their Virginia business group is shipped internationally as part of blended products from other business units within Alpha or sourced from other companies. These netback adjustments reflect these additional costs carried after the products leave the Virginia business unit. A summary of the projected operating costs for the consolidated Virginia operations is provided in Figure 1-3. Alpha Metallurgical Resources, Inc. Statement of Coal Resources and Reserves for the Virginia Complex in Accordance with United States SEC Standards as of December 31, 2023 Central Appalachian Coal Basin Virginia, USA MARSHALL MILLER & ASSOCIATES, INC. 15 Figure 1-3: Virginia Operating Costs 1.10 Economic Evaluation The pre-feasibility financial model prepared for this TRS was developed to test the economic viability of each coal resource area. The results of this financial model are not intended to represent a bankable feasibility study, required for financing of any current or future mining operations contemplated for the Alpha properties, but are intended to establish the economic viability of the estimated coal reserves. Cash flows are simulated on an annual basis based on projected production from the coal reserves. The discounted cash flow analysis presented herein is based on an effective date of January 1, 2024. On an un-levered basis, the NPV of the project cash flow after taxes represents the Enterprise Value of the project. The project cash flow, excluding debt service, is calculated by subtracting direct and indirect operating expenses and capital expenditures from revenue. Direct costs include labor, operating supplies, maintenance and repairs, facilities cost for materials handling, coal preparation, refuse disposal, coal loading, reclamation, and general and administrative costs. Indirect costs include statutory and legally agreed upon fees related to direct extraction of the mineral. The indirect costs are the Federal black lung tax, Federal and State reclamation taxes, property taxes, coal production royalties, and income taxes. The Alpha mines’ historical costs provided a useful reference for MM&A’s cost estimates. Table 1-3 shows LOM tonnage, P&L, and EBITDA for each Alpha mine at Virginia.

Alpha Metallurgical Resources, Inc. Statement of Coal Resources and Reserves for the Virginia Complex in Accordance with United States SEC Standards as of December 31, 2023 Central Appalachian Coal Basin Virginia, USA MARSHALL MILLER & ASSOCIATES, INC. 16 Table 1-3: Life-of-Mine Tonnage, P&L before Tax, and EBITDA LOM Tonnage LOM Pre-Tax P&L P&L Per Ton LOM EBITDA EBITDA Per Ton Underground Mines DM 41-42-Black Dog (Jawbone) 37,355 $844,960 $22.62 $1,356,847 $36.32 Long Branch Deep (L. Banner) 729 $34,422 $47.24 $39,024 $53.55 DM44 (Lower Banner) 465 $1,250 $2.69 $6,007 $12.93 DM43 (Jawbone Rider) 21,901 $210,289 $9.60 $558,027 $25.48 Ball Ridge DM46 (L. Banner) 1,282 $33,105 $25.82 $43,388 $33.84 Bear Ridge (Upper Banner) 105 $974 $9.31 $1,329 $12.71 Consolidated Deep Mines 61,835 $1,125,000 $18.19 $2,004,621 $32.42 Surface Mines Long Branch 228 ($8,921) ($39.20) ($1,319) ($5.80) 88 Strip 4,287 $47,474 $11.07 $120,152 $28.03 Consolidated Surface Mines 4,515 $38,553 $8.54 $118,832 $26.32 HWM Operations Long Branch HWM 738 $19,898 $26.97 $38,250 $51.84 88 Strip HWM 2,783 $150,671 $54.13 $165,703 $59.53 Consolidated HWMs 3,521 $170,569 $48.44 $203,953 $57.92 Grand Total 69,871 $1,334,121 $19.09 $2,327,407 $33.31 Note: (1) LOM tonnage evaluated in the financial model includes October 2023 through December 2023 production for underground mines and July 2023 through December 2023 production for surface mines production (1.12 million total clean tons) which was subtracted from coal reserves in order to make the effective date of the reserves December 31, 2023. As shown in Table 1-3, all of the mines analyzed show positive EBITDA over the LOM. Overall, the Alpha consolidated Virginia operations show positive LOM P&L and EBITDA of $1.3 billion and $2.3 billion, respectively. Alpha’s consolidated Virginia cash flow summary in constant dollars, excluding debt service, is shown in Table 1-4 below. Alpha Metallurgical Resources, Inc. Statement of Coal Resources and Reserves for the Virginia Complex in Accordance with United States SEC Standards as of December 31, 2023 Central Appalachian Coal Basin Virginia, USA MARSHALL MILLER & ASSOCIATES, INC. 17 Table 1-4: Project Cash Flow Summary (000) YE 12/31 YE 12/31 YE 12/31 YE 12/31 YE 12/31 YE 12/31 Total 2023 2024 2025 2026 2027 2028 Production & Sales tons 69,871 1,049 2,991 3,639 3,473 3,494 3,173 Total Revenue $8,736,279 $132,872 $375,442 $457,763 $436,893 $440,937 $401,144 EBITDA $2,327,407 $47,516 $98,172 $150,138 $129,938 $139,281 $125,826 Net Income $1,090,302 $35,806 $59,513 $96,252 $81,452 $85,112 $70,780 Net Cash Provided by Operating Activities $2,083,587 $29,989 $75,981 $117,142 $113,894 $117,169 $110,011 Purchases of Property, Plant, and Equipment ($892,646) $0 ($37,333) ($33,306) ($47,613) ($51,149) ($62,343) Net Cash Flow $1,190,941 $29,989 $38,648 $83,836 $66,281 $66,019 $47,668 YE 12/31 YE 12/31 YE 12/31 YE 12/31 YE 12/31 YE 12/31 YE 12/31 2029 2030 2031 2032 2033 2034 2035 Production & Sales tons 2,857 2,766 2,748 2,376 2,162 2,065 2,096 Total Revenue $360,367 $349,158 $346,869 $298,348 $268,886 $256,742 $260,589 EBITDA $94,611 $97,030 $94,086 $72,063 $66,163 $61,052 $62,116 Net Income $41,501 $40,348 $39,913 $20,028 $13,960 $15,118 $18,622 Net Cash Provided by Operating Activities $91,472 $89,227 $88,257 $73,008 $63,660 $60,152 $59,760 Purchases of Property, Plant, and Equipment ($48,685) ($30,985) ($22,070) ($37,542) ($58,580) ($15,065) ($43,200) Net Cash Flow $42,787 $58,242 $66,187 $35,466 $5,080 $45,087 $16,559 YE 12/31 YE 12/31 YE 12/31 YE 12/31 YE 12/31 YE 12/31 YE 12/31 2036 2037 2038 2039 2040 2041 2042 Production & Sales tons 2,183 2,170 2,106 2,356 2,273 2,243 2,224 Total Revenue $271,511 $269,793 $261,909 $292,967 $282,684 $278,872 $276,558 EBITDA $70,963 $69,221 $65,351 $87,795 $82,979 $78,517 $75,844 Net Income $32,262 $28,979 $22,134 $43,305 $45,002 $38,106 $37,913 Net Cash Provided by Operating Activities $56,442 $61,336 $59,762 $75,101 $76,023 $71,819 $69,380 Purchases of Property, Plant, and Equipment ($15,490) ($39,518) ($47,166) ($26,142) ($18,729) ($29,768) ($29,043) Net Cash Flow $40,952 $21,818 $12,596 $48,959 $57,294 $42,051 $40,338 YE 12/31 YE 12/31 YE 12/31 YE 12/31 YE 12/31 YE 12/31 YE 12/31 2043 2044 2045 2046 2047 2048 2049 Production & Sales tons 2,263 2,232 1,862 1,702 1,786 1,811 1,579 Total Revenue $281,377 $277,527 $231,517 $211,631 $222,124 $225,263 $196,380 EBITDA $80,014 $74,350 $43,761 $34,631 $43,741 $45,877 $50,040 Net Income $37,677 $36,406 $14,532 $8,615 $14,275 $14,689 $21,001 Net Cash Provided by Operating Activities $71,561 $68,995 $47,641 $35,439 $39,373 $42,494 $46,688 Purchases of Property, Plant, and Equipment ($40,050) ($18,023) ($18,093) ($8,163) ($29,333) ($39,202) ($11,520) Net Cash Flow $31,511 $50,972 $29,549 $27,276 $10,040 $3,291 $35,168 YE 12/31 YE 12/31 YE 12/31 YE 12/31 YE 12/31 YE 12/31 YE 12/31 2050 2051 2052 2053 2054 2055 2056 Production & Sales tons 1,215 956 994 754 486 476 493 Total Revenue $151,084 $118,939 $123,633 $93,734 $60,404 $59,147 $61,368 EBITDA $38,443 $26,510 $30,406 $24,364 $13,552 $12,650 $14,219 Net Income $16,845 $13,824 $16,422 $8,771 $1,413 $5,216 $6,553 Net Cash Provided by Operating Activities $39,650 $25,647 $27,000 $24,347 $16,507 $13,256 $13,524 Purchases of Property, Plant, and Equipment $0 ($4,320) ($8,844) ($16,706) ($344) $0 ($4,320) Net Cash Flow $39,650 $21,327 $18,156 $7,641 $16,163 $13,256 $9,204

Alpha Metallurgical Resources, Inc. Statement of Coal Resources and Reserves for the Virginia Complex in Accordance with United States SEC Standards as of December 31, 2023 Central Appalachian Coal Basin Virginia, USA MARSHALL MILLER & ASSOCIATES, INC. 18 YE 12/31 YE 12/31 YE 12/31 YE 12/31 YE 12/31 YE 12/31 YE 12/31 2057 2058 2059 2060 2061 2062 2063 Production & Sales tons 538 281 0 0 0 0 0 Total Revenue $66,859 $34,987 $0 $0 $0 $0 $0 EBITDA $19,327 $9,279 ($1,382) ($547) ($276) ($141) ($73) Net Income $10,140 $2,654 ($2,764) ($1,094) ($552) ($281) ($146) Net Cash Provided by Operating Activities $16,695 $13,865 ($11,208) ($3,736) ($1,868) ($934) ($934) Purchases of Property, Plant, and Equipment $0 $0 $0 $0 $0 $0 $0 Net Cash Flow $16,695 $13,865 ($11,208) ($3,736) ($1,868) ($934) ($934) Notes : (1) LOM tonnage evaluated in the financial model includes October 2023 through December 2023 production for underground mines and July 2023 through December 2023 production for surface mines (1.12 million total clean tons) which was subtracted from coal reserves in order to make the effective date of the reserves December 31, 2023. (2) Results shown for 2023 represent 4th quarter only. Consolidated cash flows are driven by annual sales tonnage, which grows from 3.0 million tons in 2024 to a peak of 3.6 million tons in 2025. Between years 2026 and 2044, sales ranges from 2.1 million to 3.5 million tons and between years 2045-2058, sales range from 0.3 million tons to 1.9 million tons. Projected consolidated revenue grows from $375.4 million in 2024 to a peak of $457.8 million in 2025. Revenue totals $8.7 billion for the project’s life. Consolidated cash flow from operations is positive throughout the projected operating period, with the exception of post-production years, due to end-of-mine reclamation spending. Consolidated cash flow from operations peaks at $117.2 million in 2027 and totals $2.1 billion over the project life. Capital expenditures total $231.7 million during the first five years and $892.6 million over the project’s life. 1.10.1 Discounted Cash Flow Analysis Cash flow after tax, but before debt service, generated over the life of the project was discounted to NPV at a 16.57% discount rate, which represents MM&A’s estimate of the constant dollar, risk adjusted WACC for likely market participants if the subject reserves were offered for sale. On an un-levered basis, the NPV of the project cash flows represents the Enterprise Value of the project and amounts to $356.9 million. Alpha is an active producer, and the financial model shows positive net cash flow for each year of the operating life of the Virginia reserves. The pre-feasibility financial model prepared for the TRS was developed to test the economic viability of each coal resource area. The NPV estimate was made for the purpose of confirming the economics for classification of coal reserves and not for purposes of valuing Alpha or its Virginia assets. Mine plans were not optimized, and actual results of the operations may be different, but in all cases, the mine production plan assumes the properties are under competent management. 1.10.2 Sensitivity Analysis Sensitivity of the NPV results to changes in the key drivers is presented in the chart below. The sensitivity study shows the NPV at the 16.57% discount rate when Base Case sales prices, operating costs, capital costs and discount rate are increased and decreased in increments of 5% within a +/- 15% range. Alpha Metallurgical Resources, Inc. Statement of Coal Resources and Reserves for the Virginia Complex in Accordance with United States SEC Standards as of December 31, 2023 Central Appalachian Coal Basin Virginia, USA MARSHALL MILLER & ASSOCIATES, INC. 19 Figure 1-4: Sensitivity of NPV As shown, NPV is quite sensitive to changes in sales price and operating cost estimates, and slightly sensitive to changes in capital cost estimates. 1.11 Permitting Alpha has obtained all mining and discharge permits to operate its active mines and processing, loadout, or related support facilities. MM&A is unaware of any obvious or current Alpha permitting issues that are expected to prevent the issuance of future permits. Alpha, along with all coal producers, is subject to a level of uncertainty regarding future clean water permits due to United States Environmental Protection Agency (EPA) and the United States Fish and Wildlife (USFW) involvement with state programs. 1.12 Conclusion and Recommendations Sufficient data has been obtained through various exploration and sampling programs and mining operations to support the geological interpretations of seam structure and thickness for coal horizons situated on the Virginia Property. The data is of sufficient quantity and reliability to reasonably support the coal resource and coal reserve estimates in this TRS. The geological data and preliminary feasibility study, which consider mining plans, revenue, and operating and capital cost estimates are sufficient to support the classification of coal reserves provided herein.

Alpha Metallurgical Resources, Inc. Statement of Coal Resources and Reserves for the Virginia Complex in Accordance with United States SEC Standards as of December 31, 2023 Central Appalachian Coal Basin Virginia, USA MARSHALL MILLER & ASSOCIATES, INC. 20 This geologic evaluation conducted in conjunction with the preliminary feasibility study concludes that the 68.75 Mt of marketable coal reserves identified on the Property are economically mineable under reasonable expectations of market prices for metallurgical coal products, estimated operation costs, and capital expenditures. 2 Introduction 2.1 Registrant and Terms of Reference This updated report was prepared for the sole use of Alpha Metallurgical Resources, Inc. (Alpha) and its affiliated and subsidiary companies and advisors. The report provides a statement of coal reserves for Alpha located at the Virginia Complex (Virginia or the Property) in Buchanan, Dickenson, Russell and Wise Counties, Virginia. Exploration results and Resource calculations were used as the basis for the mine planning and the preliminary feasibility study completed to determine the extent and viability of the reserve. The report provides a statement of coal resources and coal reserves for Alpha, as defined under the United States Securities and Exchange Commission (SEC). Coal resources and coal reserves are herein reported in imperial units of measurement and are rounded to millions of short tons (Mt). 2.2 Information Sources The technical report is based on information provided by Alpha and reviewed by MM&A’s professionals, including geologists, mining engineers, civil engineers, and environmental scientists. MM&A’s professionals hold professional registrations and memberships which qualify them as Qualified Persons in accordance with SEC guidelines. Sources of data and information are listed below in Table 2-1: Alpha Metallurgical Resources, Inc. Statement of Coal Resources and Reserves for the Virginia Complex in Accordance with United States SEC Standards as of December 31, 2023 Central Appalachian Coal Basin Virginia, USA MARSHALL MILLER & ASSOCIATES, INC. 21 Table 2-1: Information Provided to MM&A by Alpha Category Information Provided by Alpha Report Section Geological Geologic data including digital databases and original source data including geologist logs, driller’s logs, geophysical logs. 9.1 Coal Quality Database of coal quality information supplemented with original source laboratory sheets where available. 10.1 Mining Historical productivities and manpower projections. 13.2, 13.4 Coal Preparation Flow Sheet and other information related to coal processing. 14.1 Waste Disposal Engineering data and estimates representing remaining capacities for coarse and fine coal waste disposal. 17.2 Costs Historical and budgetary operating cost information used to derive cost drivers for reserve financial modeling 18.2 Note: While the sources of data listed in Table 2-1 are not exhaustive, they represent a significant portion of information which supports this TRS. MM&A reviewed the provided data and found it to be reasonable prior to incorporating it into the TRS. The TRS contains “forward-looking information” including forecasts of productivity and annual coal production, operating and capital cost estimates, coal sales price forecasts, the assumption that Alpha will continue to acquire necessary permits, and other assumptions. The TRS statements and conclusions are not a guarantee of future performance and undue reliance should not be placed on them. The ability of Alpha to recover the estimated coal reserves is dependent on multiple factors beyond the control of MM&A including, but not limited to geologic factors, mining conditions, regulatory approvals, and changes in regulations. In all cases, the plans assume the Property is under competent management. 2.3 Scope of Assignment Alpha engaged MM&A to conduct a coal reserve evaluation of the Alpha coal properties as of December 31, 2023. For the evaluation, the following tasks were to be completed: > Conduct site visits of the mines and mine infrastructure facilities. > Process the information supporting the estimation of coal resources and reserves into geological models. > Develop life-of-reserve mine (LOM) plans and financial models. > Hold discussions with Alpha company management; and > Prepare and issue a Technical Report Summary providing a statement of coal reserves which would include: - A description of the mines and facilities. - A description of the evaluation process. - An estimation of coal reserves with compliance elements as stated under the SEC S-K 1300 regulations that become effective for the first fiscal year commencing on or after January 1, 2022. 2.4 Personal Inspections MM&A is very familiar with the Virginia properties, having provided a variety of services in recent years and QP’s involved in this TRS have conducted multiple site visits. Most recently a site inspection of the surface mine mines was conducted on September 13, 2023.

Alpha Metallurgical Resources, Inc. Statement of Coal Resources and Reserves for the Virginia Complex in Accordance with United States SEC Standards as of December 31, 2023 Central Appalachian Coal Basin Virginia, USA MARSHALL MILLER & ASSOCIATES, INC. 22 3 Property Description 3.1 Location The Virginia Mine Complex is in the Central Appalachian Basin in southwest Virginia (see Figure 1-1) north of Lebanon, Virginia, and U.S. Highway 19 and south of Pikeville, Kentucky. The complex covers part of four counties: Buchanan, Dickenson, Russell and Wise. Surface facilities for the operation are located near the community of McClure, along the McClure River in Dickenson County and near Tom’s Creek, a tributary of the Guest River in Wise County. The McClure plant is near the active Jawbone seam Deep Mine No. 41. The Toms Creek Plant is near the town of Coeburn, Virginia and accessed by State Rt. 652. Numerous small communities are present throughout the Property. The nearest major population centers are Bristol, Virginia (65 miles south) and Roanoke, Virginia (195 miles east), and Charleston, West Virginia (165 miles north), and Lexington, Kentucky (180 miles northwest). The Property is located on the following United States Geological Survey (USGS) Quadrangles: Elkhorn, Harman, Jenkins East, Clintwood, Haysi, Prater, Vansant, Big A Mtn, Duty, Nora, Caney Ridge, Pound, Flat Gap, Wise, Coeburn, St. Paul and Carbo. The coordinate system and datum used for the model of the Virginia Mine complex and the subsequent maps were produced in the Virginia State Plane South system, NAD 83. 3.2 Titles, Claims or Leases The Property is composed of over 321,600 total acres of mineral control, nearly all of which is leased. Alpha’s control is comprised of over 19 separate leases with varying expiration dates. Some leases expire over the next several years, but Alpha does not anticipate any challenges related to lease renewal. Table 3-1 list the Virginia property mineral control. MM&A has not carried out a separate title verification for the coal properties and has not verified leases, deeds, surveys or other property control instruments pertinent to the subject resources. Alpha has represented to MM&A that it controls the mining rights to the reserves as shown on its property maps, and MM&A has accepted these as being a true and accurate depiction of the mineral rights controlled by Alpha. The TRS assumes the Property is developed under responsible and experienced management. Alpha Metallurgical Resources, Inc. Statement of Coal Resources and Reserves for the Virginia Complex in Accordance with United States SEC Standards as of December 31, 2023 Central Appalachian Coal Basin Virginia, USA MARSHALL MILLER & ASSOCIATES, INC. 23 Table 3-1: Mineral Control – Virginia Complex Reference File No. Document Type Expiration Date (1) On-going Minimum Royalty (2) On-going Production Royalty (3) VD 1 Deed N/A N/A N/A VD 2 Deed N/A N/A N/A VD 3 Deed N/A N/A N/A VD 4 Deed N/A N/A N/A VD-5 Deed N/A N/A N/A VL 1 Lease 9/30/2024 No Yes VL 2 Lease 3/31/2028 Yes Yes VL 4 Lease Exhaustion No Yes VL 5 Lease 4/7/2028 Yes Yes VL 6 Lease 6/23/2028 Yes Yes VL 7 Lease 3/27/2027 Yes Yes VL 8 Lease 7/22/2024 No Yes VL 9 Lease 6/26/2024 No Yes VL 10 Lease 7/23/2024 No Yes VL 11 Lease 1/7/2024 No Yes VL 12 Lease Exhaustion No Yes VL 13 Lease 6/30/2024 No Yes VL 14 Lease 6/21/2027 No Yes VL 17 Lease 3/26/2028 No Yes VL 18 Lease 12/31/2024 No Yes VL 19 Lease 5/22/2027 No Yes VL 20 Lease 9/6/2024 No Yes VL 21 Lease 3/31/2025 Yes N/A VL 22 Lease 8/30/2024 Yes Yes (1) For leases with expiration dates, Company has option to renew or expects to renew until all mineable and merchantable coal is exhausted (2) Minimum royalty payments are generally recoupable against future production royalties. (3) Royalty rates range from 3% to 9% of gross selling price 3.3 Mineral Rights Alpha supplied property control maps to MM&A related to properties for which mineral and/or surface property are controlled by Alpha. While MM&A accepted these representations as being true and accurate, through past knowledge of the Property MM&A has no knowledge of past property boundary disputes or other concerns that could impact future mining operations or development potential. Property control in Appalachia can be intricate. Coal mining properties are typically composed of numerous property tracts which are owned and/or leased from both land holding companies and private individuals or companies. It is common to encounter severed ownership, with different entities or individuals controlling the surface and mineral rights. Mineral control in the region is typically characterized by leases or ownership of larger tracts of land, with surface control generally comprised of smaller tracts, particularly in developed areas. Control of the surface property is necessary to conduct surface mining but is not necessary to conduct underground mining aside from relatively limited areas required for seam access or ventilation

Alpha Metallurgical Resources, Inc. Statement of Coal Resources and Reserves for the Virginia Complex in Accordance with United States SEC Standards as of December 31, 2023 Central Appalachian Coal Basin Virginia, USA MARSHALL MILLER & ASSOCIATES, INC. 24 infrastructure. Alpha’s executive management team has a history of mining in Central Appalachia and has conveyed to MM&A that it has been successful in acquiring surface rights where needed for past operations. 3.4 Encumbrances No Title Encumbrances are known. By assignment, MM&A did not complete a query related to Title Encumbrances. 3.5 Other Risks There is always risk involved in property control. As is common practice, Alpha, and its predecessors, have had their legal teams examine the deeds and title control to minimize this risk. Historically, property control has not posed any significant challenges related to Virginia’s operations. 4 Accessibility, Climate, Local Resources, Infrastructure and Physiography 4.1 Topography, elevation, and Vegetation Topography of the area encompassed by the Virginia mine complex is typical of the Central Appalachian Plateau’s physiographic province, being rugged with a dendritic drainage pattern that form narrow river valleys, flanked by steep-sided upland regions. Terrain slopes in the area are mostly steep to very steep with some gently sloping with relatively narrow ridges. North of the Property exists Pine Mountain, a result of compressional forces and movement along the Pine Mountain thrust fault. The flanks of Pine Mountain create a trellis drainage pattern flowing southward, along the northern border of Dickenson County. Surface elevations near the mine complex range from approximately 1,300 feet above sea level at streams to approximately 2,400 feet at ridge tops. The area is heavily vegetated and has a significant amount of hardwood forests. The Property is not situated near any major urban centers. 4.2 Access and Transport There is general access to the Virginia property via a well-developed network of primary, secondary, and unimproved roads from U.S. interstates highways. Interstate 81 to the south and Interstate 77 to the east are the primary roads coming into the complex region. Interstate 81 connects with Bristol, Virginia to the southwest and Roanoke, Virginia to the east. Interstate 77 connects with Charleston, West Virginia to the north and via Interstate 64 with Lexington, Kentucky, to the northwest. US Route 19 connects Interstate 81 with Lebanon, Virginia from the south, while US Route 460 connects Interstate 77 with US Route 19 from the east. Numerous secondary and unimproved roads provide direct access to the mine property, some being federal, state, and town-maintained. These include US Route 58, via State Route 71 connecting Lebanon Alpha Metallurgical Resources, Inc. Statement of Coal Resources and Reserves for the Virginia Complex in Accordance with United States SEC Standards as of December 31, 2023 Central Appalachian Coal Basin Virginia, USA MARSHALL MILLER & ASSOCIATES, INC. 25 to Toms Creek Virginia, and US Route 23 to State Routes 83 and 63 running north-south from Pikeville, Kentucky to McClure, Virginia. These roads typically stay open throughout the year. Within the Property, unimproved roads are utilized to access gas drainage wells and surface based deep mine infrastructure. The primary transport means of processed coal is CSX Railroad which services the McClure River Loadout located just east of McClure Virginia, and NS Railroad servicing the Tom’s Creek Loadout located 2.25 miles north of Coeburn, Virginia. 4.3 Proximity to Population Centers The Virginia Mine Complex is in southwest Virginia, north of Lebanon, Virginia and south of Pikeville, Kentucky. Several small towns reside in the complex footprint which covers much of Dickenson County and smaller portions of Buchanan, Russell, and Wise Counties. There are no large population centers within close proximity. The nearest major population centers are Bristol, Virginia (65 miles south) and Roanoke, Virginia (195 miles east), and Charleston, West Virginia (165 miles north), and Lexington, Kentucky (180 miles northwest). As of the 2020 Annual County and Resident Population Estimate (www.census.gov), Dickenson County had 14,124 residents. 4.4 Climate and Length of Operating Season The climate of the region is classified as humid continental with four distinct seasons: warm summers, cold winters, and moderate fall and spring seasons. Precipitation in the region comes throughout the year, and annually includes approximately 46 inches of rain and 29 inches of snow. Most rain comes in spring and the early months of summer. Warmer months typically begin in late May and end in early September and range in average temperature from 48 to 82 degrees Fahrenheit. Colder months typically begin in mid to late November and run until mid to late March with average temperatures ranging from 21 to 54 degrees Fahrenheit. Precipitation in the winter typically comes in the form of snowfall or as a wintery mix (sleet and snow) with severe snowfall events occurring occasionally. Seasonal variations in climate typically do not affect underground mining in Virginia. However, weather events could potentially negatively impact efficiency of surface mine and preparation plant operations on a very limited basis and lasting less than a few days. 4.5 Infrastructure The Virginia Mine Complex has sources of water, power, personnel, and supplies readily available for use. Personnel have historically been sourced from the surrounding communities in Dickenson, and surrounding Counties, and have proven to be adequate in numbers to conduct mining operations. As mining is common in the surrounding areas, the workforce is generally familiar with mining practices, and many are experienced miners. Water is sourced locally from public water sources or rivers, and electricity is sourced from Appalachian Power, a subsidiary of American Electric Power (AEP). The

Alpha Metallurgical Resources, Inc. Statement of Coal Resources and Reserves for the Virginia Complex in Accordance with United States SEC Standards as of December 31, 2023 Central Appalachian Coal Basin Virginia, USA MARSHALL MILLER & ASSOCIATES, INC. 26 service industry in the areas surrounding the mine complex has historically provided supplies, equipment repairs and fabrication, etc. Alpha’s Tom’s Creek Prep Plant services consumers with washed coal, which is transported via the adjacent Norfolk Southern rail line at the loadout. The McClure River Prep Plant services consumers with washed coal via CSX rail line accessible from the plant loadout. Haul roads, primary roads, and conveyor belt systems account for transport from the various mine sites to both preparation plant facilities. 5 History 5.1 Previous Operation The Virginia property involves a complex combination of previous ownership. Coal mining in the area occurred for nearly a century. Predecessors of Alpha, namely Alpha Natural Resources (Alpha), Dickenson Russell Coal Company, Dickenson-Russell Contura LLC, Paramont Coal Company Virginia LLC (Paramont), Paramont Contura LLC, and Clinchfield Coal Company all previously held mining rights on most of the Property. 5.2 Previous Exploration Extensive exploration in the form of subsurface drill efforts has been carried out on the Property by numerous entities, most of which efforts were completed prior to the inception of Alpha. Diamond core and rotary drilling are the primary types of exploration on the Property. Data for correlation and mining conditions are derived from core descriptions and geophysical logs (e-logging). Coal sampling and quality analyses were also employed during the core-exploration process. The development of this report included an assessment of over 6,600 locations of coal measurements, largely comprised of exploration drill holes which often include several to many coal intercepts. In-mine data measurements are included also. Drill records indicate that independent contract drilling operators have typically been engaged to carry out drilling on the Property. Geophysical logging was typically performed by outside logging firms. MM&A, via its Geophysical Logging Systems subsidiary, has logged a significant number of the past exploration holes, and currently logs most of the recent drilled holes Drill hole locations used in this assessment are shown on the resource and reserve maps included in Appendix C. 6 Geological Setting, Mineralization and Deposit 6.1 Regional, Local and Property Geology The Property lies in the Central Appalachian Coal basin in the Appalachian Plateau physiographic province. Alpha Metallurgical Resources, Inc. Statement of Coal Resources and Reserves for the Virginia Complex in Accordance with United States SEC Standards as of December 31, 2023 Central Appalachian Coal Basin Virginia, USA MARSHALL MILLER & ASSOCIATES, INC. 27 The coal deposits in the eastern U.S. are the oldest and most extensively developed coal deposits in the country. The coal deposits on the Property are Carboniferous in age, being of the Pennsylvanian system. Overall, these Carboniferous coals contain two-fifths of the US’s bituminous coal deposits and extend over 900 miles from northern Alabama to Pennsylvania and are part of what is known as the Appalachian Basin. The Appalachian Basin is more than 250 miles wide and, in some portions, contains over 60 coal seams of varying economic significance. Coal seams and zones of economic significance typically range between 24 and 48 inches in thickness. Southwest-Northeast trending regional faults border the Property on the Northwest and southeast sides. They include the Pine Mountain trust fault to the northwest and the St. Paul and Buffalo Mountain faults to the southeast. Additional faults in the Property have north-south or northwest- southeast trends. A few faults impact the coal deposit and resource extents such as the proximity of Russel Fork fault with the Jawbone Rider seam. Structural slopes of the Property are typically characterized by a shallow dip to the northwest. Strata on the Property are of the Pennsylvanian-age Wise and Norton Formations. The base of the Wise formation is the Dorchester coal bed. The Gladeville Sandstone exists between the formations. The rock formations between the coal seams are characterized by sandstone and shale units. Seams with remaining reserve or resource potential include, in stratigraphically ascending order the: Tiller, Jawbone, Jawbone Rider, Raven, Aily, Kennedy, Lower Banner, Upper Banner, in the Norton Formation and Clintwood, Eagle, Lower Bolling, Upper Bolling, Pinhook, Lower Standiford, Upper Standiford, Taggart Marker and Taggart in the Wise Formation. 6.2 Mineralization The generalized stratigraphic columnar section in Figure 6-1 demonstrates the vertical relationship of the principal coal seams and rock formations on the Property.

Alpha Metallurgical Resources, Inc. Statement of Coal Resources and Reserves for the Virginia Complex in Accordance with United States SEC Standards as of December 31, 2023 Central Appalachian Coal Basin Virginia, USA MARSHALL MILLER & ASSOCIATES, INC. 28 Figure 6-1: Virginia Stratigraphic Column (not to scale) 6.3 Deposits The Virginia complex currently produces both High-Volatile-A bituminous coal, and a Mid-Volatile bituminous coal as primary products. Due to the long history of mining in the region and the high value of these coking coals, all the seams have been extensively mined in the past. The coal seams reach the highest structural elevations along the southeastern margin of the Property, generally dipping toward the northwest. The seams of interest are generally situated above drainage or near and are therefore accessible via outcrop or through short slopes. The rock formations between the coal seams are characterized mainly by sandstone and shale units interspersed throughout. Alpha Metallurgical Resources, Inc. Statement of Coal Resources and Reserves for the Virginia Complex in Accordance with United States SEC Standards as of December 31, 2023 Central Appalachian Coal Basin Virginia, USA MARSHALL MILLER & ASSOCIATES, INC. 29 7 Exploration 7.1 Nature and Extent of Exploration The Property has been extensively explored by subsurface drilling efforts carried out by numerous entities, most of which were completed prior to ownership by Alpha. Diamond core and rotary drilling are the primary types of exploration on the Property. Diamond core drilling produces rock core samples from the hole. Data for coal bed correlations and strata mining conditions are derived from core descriptions and geophysical logging (e-logging). Geophysical logs are produced from a probe that surveys the drill hole void. Rock stratum types are interpreted from log signatures produced from the probe which commonly include a hole caliper, rock density and gamma readings. Coal-quality analyses were also employed during the core-exploration process. Drill records indicate that independent contract drilling operators have typically been engaged to carry out drilling on the Property. Geophysical logging was typically performed by outside logging firms. MM&A, via its Geophysical Logging Systems subsidiary, has logged a significant number of the past exploration holes, including most of the recently drilled holes. The Location of the drill holes are shown on the maps included in Appendix C. The concentration of exploration varies slightly across the Property. Drilling on the Property is typically sufficient for delineation of potential surface and highwall miner benches, and deep mineable seams. Core logging is carried out by professional geologists in cases where roof and floor strata are of particular interest and in cases where greater resolution and geologic detail are needed. However, most drill hole data come from simplified driller’s logs, which lack details regarding geotechnical conditions and specific geology, making correlations and floor and roof conditions difficult to determine. Geophysical logging (e-logging) techniques, by contrast, document specific details useful for geologic interpretation and mining conditions. Given the variability of data-gathering methods employed, definitive mapping of future mining conditions may not be possible, but projections and assumptions can be made within a reasonable degree of certainty. A significant effort was put into verifying the integrity of the database. Once this was established, stratigraphic columnar sections were generated using cross-sectional analysis to establish or confirm coal seam correlations. A typical cross-section is shown in Figure 7-1.

Alpha Metallurgical Resources, Inc. Statement of Coal Resources and Reserves for the Virginia Complex in Accordance with United States SEC Standards as of December 31, 2023 Central Appalachian Coal Basin Virginia, USA MARSHALL MILLER & ASSOCIATES, INC. 30 Figure 7-1: Virginia Cross-Section Due to the long history of exploration by various parties on the Property, a wide variety of survey techniques exist for documentation of data point locations. Many of the older exploration drill holes appear to have been located by survey and more recently completed drill holes are often located by high-resolution Global Positioning System (GPS) units. However, some holes appear to have been approximately located using USGS topography maps or other methods which are less accurate. Alpha Metallurgical Resources, Inc. Statement of Coal Resources and Reserves for the Virginia Complex in Accordance with United States SEC Standards as of December 31, 2023 Central Appalachian Coal Basin Virginia, USA MARSHALL MILLER & ASSOCIATES, INC. 31 Therefore, discretion had to be used regarding the accuracy for the location and ground surface elevation of some of these older drill holes. In instances where a drill hole location (or associated coal seam elevations) appeared to be inconsistent with the overall structural trend (or surface topography for surface-mineable areas), the data point was not honored for geological modeling. Others with apparently minor variances were adjusted or then used by MM&A. In 2023, Alpha provided MM&A with data from more than 20 additional holes, mainly gas well holes. Thirteen of the 2023 holes are located in the in the vicinity the Russel Fork River, in or proximate to the Deep Mine 43 area; three holes are located on two ridge tops adjacent to the Wilder surface mine area; six holes are located slightly east of the Three Forks mine area, on ridges east and west of Indian Creek. Three additional holes are located west of the projected Jawbone Rider mine. New holes located in or proximate to defined coal resource areas were verified and used herein. Surveying of the underground and surface mined areas has been performed by the mine operators and/or their consulting surveyors. By assignment, MM&A did not verify the accuracy or completeness of the supplied mine maps but accepted this information as being the work of responsible engineers and surveyors, as required by both State and Federal Law. MM&A compiled comprehensive topographic map files by selecting the best available aerial mapping for each area. In the case of active surface mines, digital U.S.G.S. historical topography was utilized to reference original seam outcrop positions. 7.2 Drilling Procedures Core drilling methods utilize NX-size (21/8 inch) or similar-sized core cylinders to recover core samples, which can be used to delineate geologic characteristics, and for coal quality testing and geotechnical logging. For the cored holes, the geophysical logs are especially useful in verifying the percent of core recovery of both the coal samples (for assurance that sample is representative of the full seam) and of the roof and floor rock samples (for evaluating ground control characteristics of deep mineable coal seams). In addition to the core holes, rotary drilled holes also exist on the Property. Data for the rotary drilled holes is mainly derived from downhole geophysical logs, which are used to interpret coal and rock thickness and depth since logging of the drill cuttings is not reliable in this application. A wide variety of core-logging techniques exist for the Property. For many of the core holes, the primary data source is a generalized lithology description by the driller, typically supplemented by a more detailed core log completed by a geologist. These drill logs were provided to MM&A collectively as a geological database. MM&A geologists were not involved in the production of original core logs but did perform a basic check of drill records and information within the provided database. Where geophysical logs for such holes are available, they were used by MM&A geologists to verify the coal thickness and core recovery of relevant seams.

Alpha Metallurgical Resources, Inc. Statement of Coal Resources and Reserves for the Virginia Complex in Accordance with United States SEC Standards as of December 31, 2023 Central Appalachian Coal Basin Virginia, USA MARSHALL MILLER & ASSOCIATES, INC. 32 7.3 Mine Data Mine data from active underground and surface mines was used to supplement the exploration drillhole records, by seam. In- seam mine data was provided from Alpha through coal section measurement records within maps of active mines. The mine data was processed for seam thickness and coal thickness, by seam and then appended to the Carlson model database for seam model updates. Seam thickness data excluded roof and or floor strata records above and below the measured seam. In 2023, supplemental mine data was utilized for DM 44 (Rush Branch) active underground mine and surface mines 88-Strip and Long Branch. 7.4 Hydrology Hydrologic testing and forecasting are necessary parts of the permitting process and as such are routinely considered in the mine planning process. MM&A is not aware of any significant hydrologic impacts being experienced at any three currently active deep mines or two active surface mines. Future mining is projected to occur in areas exhibiting similar hydrogeological conditions as past mining. Based upon the successful history of the operation with regards to hydrogeological features, MM&A assumes that the operation will not be hindered by such issues in the future. 7.5 Geotechnical Data Life-of-Mine (LOM) Mining plans for potential underground mines were developed by MM&A through incorporation of budget maps from Alpha. Pillar stability was tested by MM&A using the Analysis of Coal Pillar Stability (ACPS) program that was developed by the National Institute for Occupational Safety and Health (NIOSH). MM&A reviewed the results from the ACPS analysis and considered it in the development of the LOM plan. Coal and rock strengths from core testing are used to verify the empirical assumptions integral to ACPS. 8 Sample Preparation Analyses and Security 8.1 Prior to Sending to the Lab Most of the coal samples related to exploration drilling activities have been obtained from the Property by subsurface exploration using core drilling techniques. The protocol for preparing and testing the samples has varied over time and is not well documented for the older holes drilled on the Property. Typical US coal sampling technique from core drilling is for the coal core sample, once recovered from the core barrel, to be measured and described into a log, then wrapped in a sealed plastic sleeve and placed into a covered wooden core box, which is the length of the sample so that the core can be delivered to a laboratory in relatively intact condition and with original moisture content. The core Alpha Metallurgical Resources, Inc. Statement of Coal Resources and Reserves for the Virginia Complex in Accordance with United States SEC Standards as of December 31, 2023 Central Appalachian Coal Basin Virginia, USA MARSHALL MILLER & ASSOCIATES, INC. 33 identification number and the depth are scribed on the sample box lid to identify the sample. This process has been the norm for both historical and ongoing exploration activities at Virginia. This work is typically performed by the supervising driller, geologist, or company personnel. Samples are most often delivered to the company by the driller after each shift or acquired by company personnel or representatives. Most of the coal core samples were obtained by previous operators on the Property. MM&A did not participate in the collection, sampling, and analysis of the majority of core samples within the exploration database. However, it is reasonable to assume, given the professional level of the previous operators, that these samples were generally collected and processed under industry best-practices. This assumption is based on MM&A’s familiarity with the operating companies and the companies used to perform the analysis. Additionally, specific to Alpha’s Virginia surface operations, a significant dataset was made available related to in-pit quality measurements used during the mining process as a predictive measure prior to mining. This robust dataset is generally based upon bulk or grab samples obtained by employees of Alpha prior to the extraction of coal in surface mined pits. MM&A’s review of the datasets suggests a general continuity of sampling procedures. Care was taken by MM&A to determine sampling locations which are commonly tied to both coal seam names and generalized mine locations. The information contained in the dataset does not include a surveyed location point, as the information is generally only relied upon in the short term for assistance in coal blending procedures. 8.2 Lab Procedures Coal quality testing related to exploration drilling has been performed over many years by operating companies using different laboratories and testing regimens. Some of the samples have raw analyses and washability analysis on the full seam (with coal and rock parting layers co-mingled) and are mainly useful for characterizing the coal quality for projected production from underground and highwall mining. Other samples have coal and rock analyzed separately, the results of which can be manipulated to forecast either surface or underground mining quality. Care has been taken to use only those analyses that are representative of the coal quality parameters for the appropriate mining type for each sample. Standard procedure upon receipt of core samples by the testing laboratory is to log the depth and thickness of the sample, then perform testing as specified by a representative of the operating company. Each sample is then analyzed in accordance with procedures defined under ASTM International (ASTM) standards including, but not limited to; washability (ASTM D4371); ash (ASTM D3174); sulfur (ASTM D4239); Btu/lb. (ASTM D5865); volatile matter (ASTM D3175); and Free Swell Index (FSI) (ASTM D720). Specific to the aforementioned pit-quality sampling and associated datasets, laboratory analysis includes both short proximate analysis and at times, detailed metallurgical characteristics. The dataset contains a combination of raw and washed samples.

Alpha Metallurgical Resources, Inc. Statement of Coal Resources and Reserves for the Virginia Complex in Accordance with United States SEC Standards as of December 31, 2023 Central Appalachian Coal Basin Virginia, USA MARSHALL MILLER & ASSOCIATES, INC. 34 In addition to the steps taken to ensure the accuracy of the historical data as described above, Alpha reports that the company employes a detailed chain of custody process during their current sampling programs. This chain of custody process follows the sample from the time it is drilled until the final quality results are entered into a database for preparation of geologic models. 9 Data Verification 9.1 Procedures of Qualified Person MM&A reviewed the Alpha-supplied digital geologic database which consists of data records including drill hole information for holes that lie within and adjacent to the Property along with records for numerous supplemental coal seam thickness measurements; mainly in mine measurements from underground mine maps. Once the initial integrity of the database was established, stratigraphic columnar sections were generated to use in cross-sectional analysis to establish or confirm coal seam correlations. The stratigraphic column correlation method provides a view of seam depths, lithologic strata and thickness intervals to over and underlying seams. Geophysical logs were used wherever available to assist in confirming the seam correlation and to verify proper seam depths, thickness measurements and recovery of coal samples. After establishing and/or verifying proper seam correlation for all seams the database was used in the geologic model process. Seam thickness, base-of-seam elevation, roof and floor lithology, and overburden maps were independently generated for use in the mine planning process. Maps with seam control data plus geological cross-sections were generated to represent the seam correlations and data integrity. Coal quality was analyzed and summarized by MM&A’s team of geologists and engineers. Quality was provided by Alpha in various database formats, laboratory data sheets, and also obtained directly from MM&A’s files. Care was taken to ensure that sampled data was representative of the mineable section. In instances where minimal representative data was noted, geological tonnages were estimated based upon applying assumed densities of coal and non-coal material to thicknesses expressed in geological database files. 9.2 Limitations As with any exploration program, localized anomalies, such as a thin coal area or poor mining conditions, cannot always be identified. The greater the density of the samples taken, the less the risk. Once an area is identified for inclusion in the mine plan, additional samples are taken to help reduce the risk in specific areas. In general, provision is made in the mine planning portion of the study to allow for localized anomalies that are typically classed more as a nuisance than a hinderance. Alpha Metallurgical Resources, Inc. Statement of Coal Resources and Reserves for the Virginia Complex in Accordance with United States SEC Standards as of December 31, 2023 Central Appalachian Coal Basin Virginia, USA MARSHALL MILLER & ASSOCIATES, INC. 35 9.3 Opinion of Qualified Person Sufficient data has been obtained through various exploration and sampling programs and mining operations to support the geological interpretations of seam structure and thickness for coal horizons situated on the Virginia Property. The Property data is of sufficient quantity and reliability to reasonably support the coal resource and coal reserve estimates in this TRS. 10 Mineral Processing and Metallurgical Testing 10.1 Testing Procedures Basic chemical analyses (both raw and washed quality), petrographic data, rheological data and ash, ultimate and sulfur analysis are available but not summarized for this filing. Available coal quality data sourced from MM&A’s vaults (associated with former projects for Alpha and its predecessors) was tabulated by resource area in a Microsoft® EXCEL workbook. Such data contained laboratory sheets which MM&A utilized to confirm that sampled intervals were representative of geological models and confirm that appropriate laboratory procedures were utilized to derive raw and clean coal parameters. Additionally, Alpha provided MM&A with a database of its own in-house coal quality information which did not include backup laboratory information or sampled intervals. MM&A compared wash recovery values from Alpha’s dataset to proximal holes with wash recovery data in MM&A’s dataset and calculated estimates of wash recovery based upon the relative percentages of coal and rock from lithologic descriptions. In general, MM&A found that Alpha’s dataset was representative and appropriate for inclusion in coal quality summaries. Quality tables also provide basic statistical analyses of the coal quality datasets, including average value; maximum and minimum values; and the number of samples available to represent each quality parameter of the seam. Coal samples that were deemed by MM&A geologists to be unrepresentative were not used for statistical analysis of coal quality, as documented in the tabulations. Specific to the surface mine reserve areas, exploration quality was supplemented with historical pit sampling. Tabulations were completed based upon annual arithmetic averages on in-pit samples for washed quality. The general consistency in quality suggests confidence in the mines’ ability to continue to produce a comparable metallurgical product. The amount and areal extent of coal sampling for geological data is generally sufficient to represent the quality characteristics of the coal horizons and allow for proper market placement of the subject coal seams. For some of the coal deposits, there are considerable laboratory data from core samples that are representative of the full extent of the resource area; and for others there are more limited data to represent the resource area. For example, in the active operations with considerable previous mining, there may be limited quality data within some of the remaining resource areas; however, in those cases the core sampling data can be supplemented with operational data from mining and shipped quality samples representative of the resource area.

Alpha Metallurgical Resources, Inc. Statement of Coal Resources and Reserves for the Virginia Complex in Accordance with United States SEC Standards as of December 31, 2023 Central Appalachian Coal Basin Virginia, USA MARSHALL MILLER & ASSOCIATES, INC. 36 10.2 Relationship of Tests to the Whole The extensive sampling and testing procedures typically followed in the Coal Industry result in an excellent correlation between samples and Marketable product. Pit analyses of the coal from Virginia were reviewed to verify that the coal quality and characteristics were as expected. The Virginia Property has a long history of saleable production, under various owners, in the Mid-Volatile and High-volatile metallurgical and thermal markets, confirming exploration results. 10.3 Lab Information Each sample is analyzed at area Laboratories that operate in accordance with procedures defined under ASTM standards including, but not limited to; washability (ASTM D4371); ash (ASTM D3174); sulfur (ASTM D4239); Btu/lb. (ASTM D5865); volatile matter (ASTM D3175); and Free Swell Index (FSI) (ASTM D720). 10.4 Relevant Results No critical factors have been found that would adversely affect the recovery of the Reserve. Any quality issues that occur, either localized or generally, are accounted for in the Marketing Study done for this TRS. 11 Mineral Resource Estimates MM&A independently created geologic models to define the coal resources at Virginia. Coal resources were estimated as of December 31, 2023. 11.1 Assumptions, Parameters and Methodology Geological data was imported into Carlson Mining® (formerly SurvCADD®) software for geological modelling and resource estimates. The imported data, formatted in Microsoft® Excel files, incorporates drill hole collars elevations, seam and thickness picks, bottom seam elevations and raw and washed coal quality. These data files were validated prior to importing into the software. Once imported, a geologic model was created, reviewed, and verified- with a key element being a gridded model of coal seam thickness. Resource tons were estimated by using the seam thickness grid based on each valid point of observation and by defining resource confidence arcs around the points of observation. Points of observation for Measured and Indicated confidence arcs were defined for all valid drill holes that intersected the seam using standards deemed acceptable by MM&A based on a detailed geologic evaluation and a statistical analysis of all drill holes within the projected reserve areas as described in Section 11.1.1. The geological evaluation incorporated an analysis of seam thickness related to depositional environments, adjacent roof and floor lithologies, and structural influences. After establishing correlations, validated coal seam data, including seam thickness and elevation for seams of economic interest were used to generate a geologic model. Due to the relative structural Alpha Metallurgical Resources, Inc. Statement of Coal Resources and Reserves for the Virginia Complex in Accordance with United States SEC Standards as of December 31, 2023 Central Appalachian Coal Basin Virginia, USA MARSHALL MILLER & ASSOCIATES, INC. 37 simplicity of the deposits and the reasonable continuity of the tabular coal beds, the principal geological interpretation necessary to define the lateral extents of the coal deposits is the proper modeling of seam thickness and elevation. Both coal thickness and quality data are deemed by MM&A to be reasonably sufficient within the resource areas. Therefore, there is a reasonable level of confidence in the geologic interpretations required for coal resource determination based on the available data and the techniques applied to the data. Table 11-1 below provides the geological mapping and coal tonnage estimation criteria used for the coal resource and reserve evaluation. These cut-off parameters have been developed by MM&A based on its experience with the Alpha Property and are typical of mining operations in the Central Appalachian coal basin. This experience includes technical and economic evaluations of numerous properties in the region for the purposes of determining the economic viability of the subject coal reserves. Table 11-1: General Reserve & Resource Criteria Item Parameters Technical Notes & Exceptions* • General Reserve Criteria Reserve Classification Reserve and Resource Coal resources as reported are inclusive of coal reserves. Reliability Categories Reserve (Proven and Probable) Resource (Measured, Indicated & Inferred) To better reflect geological conditions of the coal deposits, distance between points of observation is determined via statistical analysis. For surface-mineable reserves, the QPs responsible for the delineation of coal reserves have opted to classify tons in areas lacking exploration drill hole quality as 100- percent probable as opposed to basing proven and probable classifications upon relative distance from drill holes. Resource classification as stated in the tables is directly derived from drill hole spacing. The QPs have relied upon consistency in historical pit sampling as a justification for reserve delineation in such areas. Effective Date of Resource Estimate December 31, 2023 Coal resources were estimated based upon depletion maps as of September 30, 2023 for underground mines and as of June 30, 2023 for surface mines, along with third and fourth quarter 2023 production depletion adjustment. Effective Date of Reserve Estimate December 31, 2023 Coal reserves were estimated based upon depletion maps as of September 30, 2023 for underground mines and as of June 30, 2023 for surface mines, along with third and fourth quarter 2023 production depletion adjustment. Seam Density With raw seam analysis: SG = 1.25+(Raw Ash% / 100 In the absence of laboratory data, estimated by (1) assuming specific gravity of 1.30 for coal and 2.25 for rock parting • Underground-Mineable Criteria Map Thickness Total seam thickness Minimum Seam Thickness 30 inches Jawbone Seam / 27 inches other seams Minor Exceptions for localized zones of thinner coal Minimum Mining Thickness 54 inches Minimum Total Coal Thickness 30 inches Jawbone Seam / 27 inches other seams Minor Exceptions for localized zones of thinner coal Minimum In-Seam Wash Recovery Determined as function of seam thickness Wash Recovery Applied to Coal Reserves Based on average yield for drill holes within reserve area, or in the absence of laboratory washability data, based on estimated visual recovery using specific gravities noted above and 95 percent yield on “clean” coal

Alpha Metallurgical Resources, Inc. Statement of Coal Resources and Reserves for the Virginia Complex in Accordance with United States SEC Standards as of December 31, 2023 Central Appalachian Coal Basin Virginia, USA MARSHALL MILLER & ASSOCIATES, INC. 38 Item Parameters Technical Notes & Exceptions* Out-of-Seam Dilution Thickness for Run-of-Mine Tons Applied to ROM tonnages 2 inches Mine Barrier 200-foot distance from abandoned mines and sealed or pillared areas Minimum Reserve Tonnage 400 thousand recoverable tons for individual area (logical mining unit) Minimum Overburden Depth 100 feet Minimum Interval to Rider Coal Considered on a case-by-case basis, depending on interval lithology, etc. Minimum Interval to Overlying or Underlying Reserves Considered on a case-by-case basis, depending on interval lithology, extent, and type of extraction, etc. Minimum Interval to Overlying or Underlying Mined Areas Considered on a case-by-case basis, depending on interval lithology, extent and type of extraction, etc. Adjustments Applied to Coal Reserves 6.0 percent moisture increase; 95 percent preparation plant inefficiency • Surface-mineable Criteria Mining Type Surface mining Highwall mining (HWM) Coal Density Used laboratory apparent specific gravity data where available. Otherwise use raw ash formula: Sp. Gr. = (% Raw Ash/100) + 1.25 Used estimated specific gravity based on 1.30 specific gravity for coal and 2.25 specific gravity for rock where no lab data was available. This is also referred to as EVR or Estimated Visual Recovery method. EXCEPTION: Used 1800 tons per acre foot for seams with no quality data on surface reserve calculation Surface Property Control Controlled Surface-mineable coal resource estimated where mineral and surface rights are controlled. No resource estimated if mineral rights are not controlled. Uncontrolled Surface-mineable coal resource estimated where surface is uncontrolled if mineral rights are controlled. Basis for Coal Tonnage Thickness of recoverable coal less removable partings Minimum thickness of removable parting for surface- mineable seam is 0.25-foot generally. Minimum Total seam thickness for Single Cut Contour 2.0 feet (*) Minimum Thickness of Principal Seam in Multi-Seam Areas 1.0 foot (*) Minimum Thickness of Secondary Seam 0.5 foot Secondary seam is within 2.5 feet of principal seam Mine Strip Ratio 18:1 BCY /ton ratio for metallurgical coal & 15:1 BCY/ton for thermal coal surface mine strip ratios are targets and can vary some by cut or job. Minimum Total seam thickness for High Wall Miner 2.0 feet (*) Seam thickness can vary within a panel. Areas Considered for Surface- mineable Coal Resource Permitted and potential permit areas provided by Alpha Note: Exceptions for application of these criteria to reserve estimation are made as warranted and demonstrated by either actual mining experience or detailed data that allows for empirical evaluation of mining conditions. Final classification of coal reserve is made based on the pre-feasibility evaluation. 11.1.1 Geostatistical Analysis MM&A completed a geostatistical analysis on drill holes within the reserve boundaries to determine the applicability of the common United States classification system for measured and indicated coal resources. Historically, the United States has assumed that coal within ¼-mile (1,320 feet) of a point of observation represents a measured resource whereas coal between ¼-mile (1,320 feet and ¾-mile (3,960 feet) from a point of observation is classified as indicated. Inferred resources are commonly assumed to be located between ¾-mile (3,960 feet) and 3 miles (15,840 feet) from a point of observation. Per SEC regulations, only measured and indicated resources may be considered for reserve classification, respectively as proven and probable reserves. Alpha Metallurgical Resources, Inc. Statement of Coal Resources and Reserves for the Virginia Complex in Accordance with United States SEC Standards as of December 31, 2023 Central Appalachian Coal Basin Virginia, USA MARSHALL MILLER & ASSOCIATES, INC. 39 MM&A performed a geostatistical analysis test of the Virginia data set using the Drill Hole Spacing Analysis (DHSA) method. This method attempts to quantify the uncertainty of applying a measurement from a central location to increasingly larger square blocks and provides recommendations for determining the distances between drill holes for measured, indicated, and inferred resources. To perform DHSA the data set was processed to remove any erroneous data points, clustered data points, as well as directional trends. This was achieved through the use of histograms, as seen in Figure 11-1, color coded scatter plots showing the geospatial positioning of the borings, Figure 11-2, and trend analysis. Figure 11-1: Histogram of the Total Seam Thickness for the Jawbone Seam Present in the Virginia Complex Figure 11-2: Scatter plot of the Total Seam Thickness for the Jawbone Seam Present in the Virginia Complex Following the completion of data processing, a variogram of the data set was created, Figure 11-3. The variogram plots average square difference against the separation distance between the data pairs. The separation distance is broken up into separate bins defined by a uniform lag distance (e.g., for a lag distance of 500 feet the bins would be 0 – 500 feet, 501 – 1,000 feet, etc.). Each pair of data points that are less than one lag distance apart are reported in the first bin. If the data pair is further apart than one lag distance but less than two lag distances apart, then the variance is reported in the second bin. The numerical average for differences reported for each bin is then plotted on the variogram. Care was taken to define the lag distance in such a way as to not overestimate any nugget effect present in the data set. Lastly, modeled equations, often spherical, gaussian, or exponential, are applied to the variogram in order to represent the data set across a continuous spectrum.

Alpha Metallurgical Resources, Inc. Statement of Coal Resources and Reserves for the Virginia Complex in Accordance with United States SEC Standards as of December 31, 2023 Central Appalachian Coal Basin Virginia, USA MARSHALL MILLER & ASSOCIATES, INC. 40 Figure 11-3: Variogram of the Total Seam Thickness for the Jawbone Seam Present in the Virginia Complex The estimation variance is then calculated using information from the modeled variogram as well as charts published by Journel and Huijbregts (1978). This value estimates the variance from applying a single central measurement to increasingly larger square blocks. Care was taken to ensure any nugget effect present was added back into the data. This process was repeated for each test block size. The final step of the process is to calculate the global estimation variance. In this step the number square blocks that would fit inside the selected study area is determined for each block size that was investigated in the previous step. The estimation variance is then divided by the number of blocks that would fit inside the study area for each test block size. Following this determination, the data is then transformed back to represent the relative error in the 95th-percentile range. Figure 11-4 shows the results of the DHSA performed on the Jawbone seam data for the Virginia Complex. DHSA provides hole to hole spacing values, these distances need to be converted to radius from a central point in order to compare to the historical standards. A summary of the radius data is shown in Table 11-3. DHSA prescribes measured, indicated, and inferred drill hole spacings be determined at the 10-percent, 20-percent, and 50-percent levels of relative error, respectively. Alpha Metallurgical Resources, Inc. Statement of Coal Resources and Reserves for the Virginia Complex in Accordance with United States SEC Standards as of December 31, 2023 Central Appalachian Coal Basin Virginia, USA MARSHALL MILLER & ASSOCIATES, INC. 41 Figure 11-4: Result of DHSA for the Jawbone Seam Present in the Virginia Complex Table 11-2: DHSA Results Summary for Radius from a Central Point Model: Measured Radial Distance (10% Relative Error) Indicated Radial Distance (20% Relative Error) Inferred Radial Distance (50% Relative Error) (Miles) (Miles) (Miles) Gaussian: 0.62 1.05 2.34 Spherical: 0.61 1.08 2.50 Exponential: 0.58 1.03 2.39 Comparing the results of the DHSA to the historical standards, it is evident that the historical standards are more conservative than even the most conservative DHSA model with regards to determining measured resources. The Exponential model recommends using a radius of 0.58 miles for measured resources compared to the historical value of 0.25 miles. With respect to indicated resources the DHSA- recommended drillhole spacing exceeds the historical standards. The Exponential model recommends using a radius of 1.03 miles, while the Gaussian and Spherical models recommend a radius of 1.05 and 1.08 miles, respectively. These results have led the QPs to report the data following the historical classification standards, rather than use the results of the DHSA. 11.2 Resources Exclusive of Reserves The Virginia Properties contain resource blocks of underground seams which were not deemed to exhibit reserve potential at the time of the study. These resources, identified as resources exclusive of

Alpha Metallurgical Resources, Inc. Statement of Coal Resources and Reserves for the Virginia Complex in Accordance with United States SEC Standards as of December 31, 2023 Central Appalachian Coal Basin Virginia, USA MARSHALL MILLER & ASSOCIATES, INC. 42 reserves, exist in the Upper Banner, Lower Banner, Jawbone Rider and Jawbone seams. Reasons which may preclude elevation of resources to reserves include, but are not limited to: 1. Limited availability of quality information to document coal seam market characteristics. 2. Block does not meet reserve criteria at this time. i. Upper Banner seam, Holly Creek Block HC-B1 is less than 2.5 feet total coal thickness, Map UB-2. ii. Jawbone Rider Deep Mine 43 Block D2 is a high reject area, Map JBR-7. 3. Isolation of resource blocks in which seam access costs are cost prohibitive at the time of the study. i. Lower Banner seam, Ball Ridge Block BR-C (Map LB-4); Jawbone Rider seam, Deep Mine 43 Block C1A (Map JBR-7); Jawbone seam, Black Dog Block BD-E (Map JB-9) and Deep Mine 41, Block 41-G (Map JB-8) and Deep Mine 42, Block 42-E (Map JB-9) have all been classified as resource as they are isolated from the reserve Blocks. 4. Unfavorable economics at the preliminary feasibility study level, yet economics could become attractive in the future under different market conditions. 5. Exclusion from LOM planning by mining operator due to remaining resource blocks which are relatively small, isolated blocks and not currently attractive from an operational perspective. i. Jawbone Rider seam Deep Mine 43, Block D1 (Map JBR-7) and Jawbone seam, Black Dog Block BD-D (Map JB-9). ii. Holly Creek was previously reported as a reserve although for this reporting period of December 31, 2023, the Property has been reclassified as a resource exclusive of a reserve (not converted to a mine plan). The reclassification is based on projected difficult mining conditions (hard cutting) were encountered at the adjoining mine. iii. Jawbone seam, Deep Mine 41. A portion of Block 41-E is now isolated and assigned resource (Map JB-7). 11.2.1 Initial Economic Assessment MM&A completed an initial economic assessment to determine the potential economic viability of resources exclusive of reserves (not converted to reserves). MM&A applied relevant technical factors to estimate potential saleable tons without the resource blocks, should the resources be extracted via deep, continuous mining methods. MM&A developed cash cost profiles for the resource blocks, including direct cash costs (labor, supplies, roof control, maintenance and repair, power, and other); washing, trucking, materials handling, general and administrative, and environmental costs; and indirect cash costs (royalties, production taxes, property tax, insurance). Costs were developed based off relevant cost drivers (per-ft, per-raw-ton, per-clean-ton). Additionally, MM&A estimated capital costs to access resources. Capital costs associated with mine developed were amortized across the Alpha Metallurgical Resources, Inc. Statement of Coal Resources and Reserves for the Virginia Complex in Accordance with United States SEC Standards as of December 31, 2023 Central Appalachian Coal Basin Virginia, USA MARSHALL MILLER & ASSOCIATES, INC. 43 resource’s potential saleable tonnages). Additional non-cash items (depreciation of equipment and depletion) and cash costs were compared to an assumed sale price of $135 per ton netback FOB loadout (approximately $177 per ton U.S. East Coast basis) for mid-volatile markets. This resource assumed sales value was developed as a premium to the market-based reserve sales value to properly estimate the sales-related expenses should these resources be extracted during higher-than-average market conditions. Pricing used for the primary product was selected by the QP and deemed reasonable based on a review of historical average pricing for the Virginia complex coal products over the past 5 years. The results Of the analysis are shown below and demonstrate potential profitability on a fully loaded cost basis. Detailed summaries are shown in Appendix B. Table 11-3: Results of Initial Economic Assessment Mine/Resource Block Seam Direct Cash Transportation, Washing, Enviro, G&A Indirect Non-Cash Total Cost Fully Loaded P&L Ball Ridge Block BR-C Lower Banner $55.19 $27.35 $11.32 $10.64 $104.50 $30.50 Jawbone Rider Blocks C1A,D1,D2 Jawbone Rider $57.71 $36.05 $11.32 $10.95 $116.03 $18.97 Jawbone Blocks BD-D1&2,BD- E,41-E4&G,42-E/F1/F2/F3 Jawbone $71.34 $29.67 $11.32 $14.30 $126.63 $8.37 Holly Creek Upper Banner $47.50 $31.10 $11.32 $16.28 $106.20 $28.80 Bear Ridge Upper Banner $70.75 $33.66 $12.52 $7.73 $124.67 $10.33 Figure 11-5: Results of Initial Economic Assessment

Alpha Metallurgical Resources, Inc. Statement of Coal Resources and Reserves for the Virginia Complex in Accordance with United States SEC Standards as of December 31, 2023 Central Appalachian Coal Basin Virginia, USA MARSHALL MILLER & ASSOCIATES, INC. 44 11.3 Qualified Person’s Estimates Based on the work previously described and detailed modelling of those areas along with consideration of all modifying factors, a coal resource estimate, summarized in Table 11-4, was prepared as of December 31, 2023, for property controlled by Alpha. Table 11-4: Coal Resources Summary as of December 31, 2023 Coal Resource (Dry Tons, In Situ, Mt) Area Seam Measured Indicated Inferred Total Inclusive of Reserve (Converted to Reserve) 88Strip/3Frks Upper Banner-Tiller 11,661,700 1,626,900 0 13,288,600 Long Branch Upper Banner 2 - Lower Banner 2,377,200 528,300 0 2,905,600 Bear Ridge Upper Banner (4650) 521,500 43,200 0 564,700 Ball Ridge (Deep Mine 46) Lower Banner (4900) 4,835,900 383,400 0 5,219,300 Long Branch (Deep Mine 45) Lower Banner (4900) 3,221,600 350,000 0 2,368,900 Rush Branch (Deep Mine 44) Lower Banner (4900) 2,240,900 600 0 2,241,400 Deep Mine 43 Jawbone Rider (5950) 37,893,900 21,339,100 250,700 59,483,700 Black Dog Jawbone (6000) 16,105,700 246,400 0 16,352,100 Deep Mine 41 Jawbone (6000) 55,989,800 15,454,600 0 71,444,400 Deep Mine 42 Jawbone (6000) 41,959,700 7,425,900 0 49,385,600 Total Inclusive of Reserve (Converted to Reserve) 176,807,800 47,398,400 250,700 223,254,200 Exclusive of Reserve (Not Converted to Reserve) Holly Creek Upper Banner (4650) 5,594,200 2,155,800 0 7,750,000 Bear Ridge Upper Banner (4650) 180,900 118,100 0 299,000 Ball Ridge (Deep Mine 46) Lower Banner (4900) 1,003,100 32,000 0 1,035,100 Deep Mine 43 Jawbone Rider (5950) 10,653,400 8,216,300 409,100 19,278,800 Black Dog Jawbone (6000) 6,367,400 1,859,700 0 8,227,200 Deep Mine 41 Jawbone (6000) 4,704,400 705,000 0 5,409,400 Deep Mine 42 Jawbone (6000) 2,023,900 15,000 0 2,038,900 Total Exclusive of Reserve (Not Converted to Reserve) 30,527,300 13,101,900 409,100 44,038,300 Grand Total Inclusive of Reserve (Converted to Reserve) 176,807,800 47,398,400 250,700 223,254,200 Exclusive of Reserve (Not Converted to Reserve) 30,527,300 13,101,900 409,100 44,038,300 Grand Total 207,335,100 60,500,300 659,900 267,292,500 Note(1): Resource tons are inclusive of reserve tons since they are the in-situ tons from which recoverable coal reserves are derived. Note (2): Coal resources are reported on a dry basis. Surface moisture and inherent moisture are excluded. Totals may not add due to rounding. See Appendix A for detailed breakdown. 11.4 Qualified Person’s Opinion While there is some stratigraphically controlled seam-thickness variability due to seam splitting, sand channels, etc., MM&A geologists and engineers modeled the deposit and resource areas to reflect realistic mining scenarios, giving special consideration to uncertainties as related to each class of mineral resources such as (1) seam thickness, (2) floor and roof conditions, (3) mining equipment, etc. This statistical study demonstrates that for each configuration of mineable seams, the classification system of measured (0 – ¼ mile), indicated (¼ to ¾ mile), and inferred (¾ to 3 miles) is reasonably adequate to predict seam thickness variation for modeling and mining purposes. Based on MM&A’s geostatistical analysis, it would be possible to extend the measured, indicated and inferred arcs slightly beyond historically accepted practices due to consistent geological settings. The QP’s have again Alpha Metallurgical Resources, Inc. Statement of Coal Resources and Reserves for the Virginia Complex in Accordance with United States SEC Standards as of December 31, 2023 Central Appalachian Coal Basin Virginia, USA MARSHALL MILLER & ASSOCIATES, INC. 45 elected not to extend arc distances, introducing a level of conservatism in measured and indicated coal classification. Based on the data review, the attendant work done to verify the data integrity and the creation of an independent Geologic Model, MM&A believes this is a fair and accurate representation of the Virginia coal resources. 12 Mineral Reserve Estimates 12.1 Assumptions, Parameters and Methodology Coal Reserves are classified as proven or probable considering “modifying factors” including mining, metallurgical, economic, marketing, legal, environmental, social and governmental factors. > Proven Coal Reserves are the economically mineable part of a measured coal resource, adjusted for diluting materials and allowances for losses when the material is mined. It is based on appropriate assessment and studies in consideration of and adjusted for reasonably assumed modifying factors. These assessments demonstrate that extraction could be reasonably justified at the time of reporting. > Probable Coal Reserves are the economically mineable part of an indicated coal resource, and in some circumstances a measured coal resource, adjusted for diluting materials and allowances for losses when the material is mined. It is based on appropriate assessment and studies in consideration of and adjusted for reasonably assumed modifying factors. These assessments demonstrate that extraction could be reasonably justified at the time of reporting. Upon completion of delineation and calculation of coal resources, MM&A generated a LOM plan for Virginia. The footprint of each reserve area is shown on the maps in Appendix C. The Mine plan was generated based on 5-year budget mine plans provided by Alpha and supplemented with additional projections by MM&A to reflect LOM plans that honor property control limits, geologic mapping, or other factors determined during the evaluation. Carlson Mining software was used to generate the LOM plan for Virginia. The mine plan was sequenced based on productivity schedules provided by Alpha. MM&A judged the productivity estimates and plans to be reasonable based on experience and current industry practice. Raw, ROM production data outputs from LOM plan sequencing were processed into Microsoft® EXCEL spreadsheets and summarized on an annual basis for processing into the economic model. Average seam densities were estimated to determine raw coal tons produced from the LOM plan. Average mine recovery and wash recovery factors were applied to determine coal reserve tons. Coal reserve tons in this evaluation are reported at a 6.0-percent moisture for underground and 4.5% for surface reserves and represent the saleable product from the Property.

Alpha Metallurgical Resources, Inc. Statement of Coal Resources and Reserves for the Virginia Complex in Accordance with United States SEC Standards as of December 31, 2023 Central Appalachian Coal Basin Virginia, USA MARSHALL MILLER & ASSOCIATES, INC. 46 Pricing data as provided by Alpha from third party sources is described in Table 16-2. The pricing data assumes a flat-line long term realization of $162 to $163 per short ton port pricing, with an average $125.03 per ton netback pricing reflective of the high- and mid -volatile product currently sold at Virginia. The coal resource mapping and estimation process, described in the report, was used as a basis for the coal reserve estimate. Proven and probable coal reserves were derived from the defined coal resource considering relevant processing, economic (including technical estimates of capital, revenue, and cost), marketing, legal, environmental, socio-economic, and regulatory factors and are presented on a moist, recoverable basis. As is customary in the US, the categories for proven and probable coal reserves are based on the distances from valid points of measurement as determined by the QP for the area under consideration. For this evaluation, measured resource, which may convert to a proven reserve, is based on a ¼-mile radius from a valid point of observation. Points of observation include exploration drill holes, and mine measurements which have been fully vetted and processed into a geologic model. The geologic model is based on seam depositional modeling, the interrelationship of overlying and underlying strata on seam mineability, seam thickness trends, the impact of seam structure, intra-seam characteristics, etc. Once the geologic model was completed, a statistical analysis, described in Section 11.1.1 was conducted and a ¼-mile radius from a valid point of observation was selected to define Measured Resources. Likewise, the distance between ¼ and ¾ of a mile radius was selected to define Indicated Resources. Indicated Resources may convert to Probable Reserves. Inferred Resources (greater than a ¾-mile radius from a valid point of observation) have been excluded from Reserve consideration. 12.2 Mineral Reserves Virginia Properties reserves were derived from multiple coal seams of Figure 7-1 located on the Property. Reserves are estimated for both surface and underground mining. Surface reserves were derived for two sites Long Branch, and 88-Strip/Three Forks. Each account for coal reserves from multiple seams. Underground reserves were derived from four seams. The underground accessed seams include the Upper Banner seam at Bear Ridge; the Lower Banner seam at Ball Ridge, Long Branch, and Rush Branch Mine 44; the Jawbone Rider seam in Deep Mine 43; and the Jawbone seam in Deep Mine 41, Mine 42 and Black Dog. Demonstrated reserve tons are listed in the discussion below. Table 12-1 shows the demonstrated tonnage by Proven and Probable status. Alpha Metallurgical Resources, Inc. Statement of Coal Resources and Reserves for the Virginia Complex in Accordance with United States SEC Standards as of December 31, 2023 Central Appalachian Coal Basin Virginia, USA MARSHALL MILLER & ASSOCIATES, INC. 47 12.2.1 Surface Reserves The two surface mines of the Virginia Properties are both active mines with contour and highwall miner reserves. Estimated LOM average mine ratios (BCY/Ton) do not exceed 29 to 1 for the reserve estimates. Cross sections through drill holes with lithologic records and seam correlation tie lines have been prepared for each surface reserve and are available upon request. 12.2.1.1 Long Branch Surface The Demonstrated reserve at Long Branch is comprised of 0.19 million surface mine tons and 0.70 million highwall miner tons from three seams. The active Long Branch mine includes permitted reserves to be extracted from the Upper Banner 2, Upper Banner and Lower Banner seams. In 2023, seam data of coal section records was extracted per seam from mine maps and utilized to update the geologic model. Locally, previous surface mining exists in each of the three seams while previous deep mines exist in the Upper and Lower Banner. Planned mining methods are by contour strip and highwall miner mainly in new reserve blocks with little reserve in areas previously mined of the three seams. 12.2.1.2 88-Strip & Three Forks Surface Demonstrated reserve at 88 Strip and Three Forks is comprised of 4.11 million surface mine tons and 2.73 million highwall miner tons from multiple seams for permitted and non-permitted reserve. The two mines are proximate to one another with adjacent mine permits. The 88 Strip surface mine has a history of previous mining. Even though portions of the mine have been reclaimed, select previously mined areas are included in the reserve along with remaining reserve blocks. Reserves from 88 Strip are derived from seven seams that includes the Aily, Raven 2, Raven Upper split, Raven Lower split, Jawbone Rider, Jawbone, and Tiller. The Upper and Lower Raven splits merge into the Raven seam on the south end of the mine area (Map 88-8). Also, the Jawbone and Tiller seams are joined and known as the Thick Tiller west of the fault running through the Property (Map 88- 11). These two seams were joined during deposition, contemporaneously with fault block movement. Elsewhere, the Jawbone and Tiller seams are separated by a sandstone unit named the Counsel sandstone. Most seams at 88 Strip are sufficiently thick to include highwall miner reserves. In 2023, seam data of coal section records was extracted per seam from mine maps and utilized to update the geologic model. Some coals included in the surface-mineable reserves lack seam-specific coal quality data. The QPs responsible for the delineation of such surface-mineable coal reserves have opted to classify tons in areas lacking exploration drillhole quality as 100-percent probable as opposed to basing proven and probable classifications upon relative distance from drillholes. Resource classification as stated in the tables is directly derived from drillhole spacing. The QPs at MM&A have relied upon consistency in historical pit sampling as a justification for reserve delineation in such areas.

Alpha Metallurgical Resources, Inc. Statement of Coal Resources and Reserves for the Virginia Complex in Accordance with United States SEC Standards as of December 31, 2023 Central Appalachian Coal Basin Virginia, USA MARSHALL MILLER & ASSOCIATES, INC. 48 Three Forks reserves are derived from the seams of 88 Strip plus the Upper Banner, Lower Banner, Big Fork and Kennedy seams which lie above the Aily seam. 12.2.2 Underground Reserves Underground reserves of the Property are derived from several smaller above drainage deposits in the Upper and Lower Banner seams along with larger seam deposits of the deeper Jawbone Rider and Jawbone seams. Three of the underground mines are currently active, the Rush Branch Mine 44 in the Lower Banner seam, Bear Ridge mine in the Upper Banner seam and Deep Mine 41 in the Jawbone seam. Seam sections through drill holes with roof and floor lithologic records and correlated seam ties have been prepared for each underground reserve and are available upon request. 12.2.2.1 Deep Mine 37 – Holly Creek Upper Banner Holly Creek was previously reported as a reserve although for this reporting period of December 31, 2023, the Property remains a resource exclusive of a reserve (not converted to a mine plan). The classification is based on projected difficult mining conditions (hard cutting) that were encountered at this mine. 12.2.2.2 Bear Ridge Upper Banner Bear Ridge is an active mine with 0.08 million tons of permitted, demonstrated reserve remaining. In 2022 the Bear Ridge mine permit was revised to add additional acres. The average seam thickness of the Upper Banner seam at Bear Ridge ranges between 2.5 and over 3 feet thick. Previous mining of the Upper Banner seam exists in the closed underground mines that adjoin the reserve and in the Long Branch surface mine. The Bear Ridge mine extent is limited by creek drainages to the south, low coal trends to the west and east, and existing underground mines to the north. The mine is currently active. 12.2.2.3 Deep Mine 46 – Ball Ridge Lower Banner The Ball Ridge reserve includes 1.28 million tons of demonstrated reserves from two pods of Lower Banner coal, Ball Ridge West (Block BR-A1/A2) and Ball Ridge East (Block BR-B1/B2). The reserve pods are bounded to the north by stream drainages and low overburden cover but elsewhere by low coal trends. The seam pods are separated in the middle by a low cover zone above the head of Cabin Creek. Seam thickness of the reserve ranges between 2.5 and over 4.0 feet thick. The mine has not been faced up. 12.2.2.4 Deep Mine 45 – Long Branch Lower Banner The Long Branch reserve in the Lower Banner seam includes 0.73 million demonstrated tons and is proximate to the Long Branch Surface mine. The reserve is permitted and has an approximate average seam thickness of 2.68 feet thick. Previous underground mining of the Lower Banner seam occurred in the Roaring Fork No. 2 Mine that is located immediately adjacent to the south of the Long Branch reserve block. The mine has not been faced up. Alpha Metallurgical Resources, Inc. Statement of Coal Resources and Reserves for the Virginia Complex in Accordance with United States SEC Standards as of December 31, 2023 Central Appalachian Coal Basin Virginia, USA MARSHALL MILLER & ASSOCIATES, INC. 49 12.2.2.5 Deep Mine 44 – Rush Branch Lower Banner Rush Branch (Deep Mine 44) is currently an active mine. The Rush Branch reserve includes 0.31 million demonstrated permitted and non-permitted tons. In 2023, seam data of coal section records was extracted from DM 44 mine map and utilized to update the geologic model. In 2022 the Rush Branch mine permit was revised to add additional acres, west of Rockhouse Branch. The revised permit included a portion of resource block RB-C. In 2023, the RB-C block which includes permitted and non-permitted tons, has been reclassified to reserve. Also in 2023, mine block RB-A, north of Rockhouse Branch has been reclassified to reserve. Previous mining of the Lower Banner seam exists in several underground mines located south and north of the mine. Some thin coal zones divide the reserve blocks which range in seam thickness between 2.5 and over 4.0 feet. The lateral extent of the reserve is bound by multiple stream drainages. The mine is active with two production sections operating. 12.2.2.6 Deep Mine 43 – Jawbone Rider The Jawbone Rider seam reserve of the proposed Deep Mine 43 includes an estimated 21.90 million demonstrated tons, or 35-percent of the Virginia properties total underground reserve. This below drainage reserve is not permitted and has no previous mining locally. Coal thickness of the Jawbone Rider reserve ranges from about 2.33 feet to over 5.0 feet, yet most of this demonstrated reserve has an average thickness between 2.5 and 3.5 feet. There are several mapped low coal pods excluded from the reserve where drill data records indicate the total coal is less than 2.25 feet thick. The mine has not been faced up. In 2023, approximately 16 new gas wells received from Alpha were assessed to further define the deposition of the Jawbone Rider seam. Most of the holes are located in or near the southern portion of the reserve boundary. In general, the new seam data from the drill holes aligned with the seam thickness trends of the seam. The Jawbone Rider reserve is bordered by two faults, the Jess Fault to the Northeast and the Russell Fork fault to the southwest and divided by the Little Paw Paw Fault in the reserve area. Two faults have a greater impact on the reserve. The Russell Fork Fault limits the lateral extent of the reserve in the southwest direction, while displacement of the Little Paw Paw Fault divides the reserve into separate west (ID) and east (ID) blocks. The west block is also divided along the overlying Russell Fork River. Several adverse mineral tracts limit the reserve extent. The potential addition of select adverse blocks could expand the Jawbone Rider resource or reserve in the future. Additional exploration is recommended to delineate coal thickness trends in several locations in the reserve block, and in the proposed permit limits with further resource potential. 12.2.2.7 Deep Mine 41, Deep Mine 42, Black Dog – Jawbone The Jawbone seam reserve is laterally continuous and incorporates three adjacent reserve areas: Deep Mine 41, Mine 42, and the Black Dog mine. Mine 42 block is currently accessed from Deep Mine 41 and

Alpha Metallurgical Resources, Inc. Statement of Coal Resources and Reserves for the Virginia Complex in Accordance with United States SEC Standards as of December 31, 2023 Central Appalachian Coal Basin Virginia, USA MARSHALL MILLER & ASSOCIATES, INC. 50 is not a separate mine. This below-drainage reserve includes 36.71 million demonstrated tons, or 60- percent of the Virginia Properties total underground reserve. Approximately 91 percent of the Jawbone reserve is permitted by the three mine permits. The mineable seam thickness fluctuates across the reserve. Seam heights range from 2.5 feet to over 7.0 feet thick, with an approximate average seam thickness of 4.5 feet. Several faults run through the reserve but appear to have limited impact with mining. Previous mining exists within the permitted boundaries and also east of the Black Dog mine. Deep Mine 41 is the largest mine in the Jawbone reserve with 19.72 million demonstrated tons. It also has a significant amount of previous mining. Mine 42 block includes 12.96 million demonstrated reserve tons. The Black Dog reserve includes 4.04 million demonstrated tons. It too has a significant amount of previous mining inside the permit boundary. Proximity to the overlying Jawbone Rider coal and the underlying Jawbone Leader coal have been identified on Maps JB-8 and JB-9. Locations where the Rider coal is less than 10 feet above and where the Leader coal is less than 5 feet below the Jawbone seam have been mapped for the report users benefit. Where the Rider coal is less than 10 feet above, less stable roof and floor mining conditions could exist in the reserve. In 2023, per recognition of areas where the Leader seam is proximate to the Jawbone seam, MM&A further evaluated the Jawbone to Jawbone Leader seam interval to identify areas where the leader coal is within 2-foot of the Jawbone seam. From the evaluation, several Jawbone-Jawbone Leader areas were identified by these criteria, including a large area in block 42-A. Observations of seam data indicate that, in general, when the Jawbone seam thickness is greater than approximately 4.5 feet, the Jawbone Leader coal is close to or attached to the bottom of the Jawbone seam. The Jawbone-Jawbone Leader joined seam areas commonly have a seam height range of approximately 4.5 feet to over 8.0 feet. The mine is currently operating seven (7) continuous miner sections. 12.3 Qualified Person’s Estimates The coal reserves, as shown in Table 12-1, are based on a technical evaluation of the geology and a preliminary feasibility study of the coal deposits. The extent to which the coal reserves may be affected by any known environmental, permitting, legal, title, socio-economic, marketing, political, or other relevant issues has been reviewed rigorously. Similarly, the extent to which the estimates of coal reserves may be materially affected by mining, quality, infrastructure and other relevant factors has also been considered. The results of this TRS define an estimated 68.75 Mt of proven and probable marketable coal reserves. The maps included in Appendix C reflect mining depletion at the time of the resource/reserve calculation based on Alpha mine maps as of September 30, 2023 for underground mines and as of June 30, 2023 for surface mines. Mine depletion tonnages were supplied by Alpha through the end of 2023, Alpha Metallurgical Resources, Inc. Statement of Coal Resources and Reserves for the Virginia Complex in Accordance with United States SEC Standards as of December 31, 2023 Central Appalachian Coal Basin Virginia, USA MARSHALL MILLER & ASSOCIATES, INC. 51 and MM&A deducted this historical production from the mapped reserves in order to estimate reserves as of December 31, 2023. Table 12-1: Coal Reserves Summary (Marketable Sales Basis) as of December 31, 2023 Demonstrated Coal Reserves Quality (Dry Basis) (Wet Tons, Washed or Direct Shipped) By Reliability Category By Permit Status Seam/Area Proven Probable Total Permitted Not Permitted Ash% Sulfur% VM% Surface Mineable 88 Strip/Three Forks 133,000 3,973,700 4,106,700 2,083,000 2,023,700 6 0.9 29 88 Strip/Three Forks 414,600 2,318,800 2,733,400 391,200 2,342,200 6 0.9 29 Long Branch 103,900 84,000 187,800 125,300 62,600 5 0.8 32 Long Branch 597,400 101,200 698,600 393,700 304,900 5 0.8 31 Total Surface Mineable 1,248,800 6,477,700 7,726,500 2,993,300 4,733,300 6 0.8 31 Underground Upper Banner (4650) Bear Ridge 71,800 11,700 83,500 83,500 0 5 0.7 33 Total Upper Banner (4650) 71,800 11,700 83,500 83,500 0 5 0.7 - Lower Banner (4900) Ball Ridge (Deep Mine 46) 1,189,600 92,400 1,282,000 1,282,000 0 6 0.7 29 Long Branch (Deep Mine 45) 713,200 15,500 728,700 728,700 0 6 0.7 30 Rush Branch (Deep Mine 44) 310,600 0 310,600 150,700 159,900 5 0.7 29 Total Lower Banner (4900) 2,213,400 107,900 2,321,300 2,161,400 159,900 6 0.7 29 Jawbone Rider (5950) Deep Mine 43 13,939,400 7,961,200 21,900,600 0 21,900,600 3 0.8 24 Total Jawbone Rider (5950) 13,939,400 7,961,200 21,900,600 0 21,900,600 3 0.8 24 Jawbone (6000) Black Dog 3,970,400 65,000 4,035,400 4,035,400 0 8 0.6 28 Deep Mine 41 15,367,700 4,356,200 19,724,000 16,851,500 2,872,500 9 0.8 26 Deep Mine 42 10,941,400 2,013,900 12,955,400 12,522,800 432,600 7 0.7 26 Total Jawbone (6000) 30,279,600 6,435,100 36,714,700 33,409,600 3,305,100 8 0.7 26 Total UG Mineable 46,504,100 14,516,000 61,020,100 35,654,500 25,365,600 6 0.8 25 Grand Total Grand Total 47,752,900 20,993,800 68,746,600 38,647,700 30,098,900 6 0.8 25 Notes: Marketable reserve tons are reported on a moist basis, including a combination of surface and inherent moisture. Coal quality is based on a weighted average of laboratory data from core holes. The combination of surface and inherent moisture is modeled at 6.0-percent. Actual product moisture is dependent upon multiple geological factors, operational factors, and product contract specifications and can exceed 8-percent. As such, the modeled moisture values provide a level of conservatism for reserve reporting. Totals may not add due to rounding. See Appendix A for detailed breakdown. 12.4 Qualified Person’s Opinion The estimate of coal reserves was determined in accordance with the SEC S-K 1300 regulations that became effective for the first fiscal year falling on or after January 1, 2021. The LOM mining plan for Virginia was prepared to the level of preliminary feasibility. Mine projections were prepared, and timing scheduled to match production with coal seam characteristics. Production timing was carried out from current locations to depletion of the coal reserve area. Coal reserve estimates could be materially affected by the risk factors described in Section 22.2. Based on the Preliminary Feasibility Study and the attendant Economic Review, MM&A believes this is a fair and accurate calculation of the Virginia coal reserves.

Alpha Metallurgical Resources, Inc. Statement of Coal Resources and Reserves for the Virginia Complex in Accordance with United States SEC Standards as of December 31, 2023 Central Appalachian Coal Basin Virginia, USA MARSHALL MILLER & ASSOCIATES, INC. 52 13 Mining Methods Six underground mining areas along with two surface and highwall miner areas were modeled and tested economically. Once the Resources were calculated, mine plans were created to project operating each resource area to depletion, with crews and equipment scheduled to move to subsequent mining areas as depletion occurs. Underground mine operations are projected to be exhausted in 2058, while surface and highwall mining operations are both projected to be completed in 2032. 13.1 Geotech and Hydrology Mining plans for potential underground mines were developed by Alpha and MM&A. Pillar stability was tested by MM&A using the Analysis of Coal Pillar Stability (ACPS) program that was developed by the National Institute for Occupational Safety and Health (NIOSH). MM&A reviewed the results from the ACPS analysis and considered it in the development of the LOM plan. Hydrology has not been an issue of concern at Alpha’s Virginia operations. Based on numerous site visits to the underground operations of the Property by the QP’s, it has been determined that this is not a significant concern. Mining of future reserves is projected to occur in areas which exhibit similar hydrogeological characteristics as those formerly mined areas. 13.2 Production Rates Operations at the Virginia operations by Alpha and its predecessors have been on-going for many years. The mine plan and productivity expectations reflect historical performance and efforts have been made to adjust the plan to reflect future conditions. MM&A is confident that the mine plan is reasonably representative to provide an accurate estimation of coal reserves. Mine development and operation have not been optimized within the TRS. Carlson Mining software was used by MM&A to generate mine plans for the mineable coal seams. Mine plans were sequenced based on productivity schedules provided by Alpha, which were based on historically achieved productivity levels. All production forecasting ties assumed production rates to geological models as constructed by MM&A’s team of geologists and mining engineers. The primary mine feeding the McClure Preparation Plant consists of Deep Mine 41 (DM41). In addition, Deep Mine 44 (DM44) and Bear Ridge Contract Mine, 88 Strip and Long Branch surface and highwall miner operations feed both the McClure and Tom’s Creek plants. There is a total of ten (10) operating continuous miner sections within these underground mines. As shown in Table 13-1, the areas planned for underground mines produce coal until 2058. Clean coal production varies directly with coal thickness and anticipated mining conditions. Alpha Metallurgical Resources, Inc. Statement of Coal Resources and Reserves for the Virginia Complex in Accordance with United States SEC Standards as of December 31, 2023 Central Appalachian Coal Basin Virginia, USA MARSHALL MILLER & ASSOCIATES, INC. 53 Table 13-1: Virginia Complex Underground Mine Production Schedule (x 1,000 Saleable Tons) Mine Name 2023 2024 2025 2026 2027 2028 2029 2030 DM 41-42-Black Dog (Jawbone) 456 1,747 1,752 1,728 1,660 1,677 1,582 1,476 Long Branch Deep (L. Banner) 0 0 197 292 240 0 0 0 DM44 (Lower Banner) 109 290 65 0 0.0 0 0 0 DM43 (Jawbone Rider) 0 0 0 10 208 366 602 618 Ball Ridge DM46 (L. Banner) 0 116 428 478 260 0 0 0 Bear Ridge (Upper Banner) 18 80 6 0 0 0 0 0 Total 584 2,233 2,449 2,509 2,368 2,042 2,184 2,094 Mine Name 2031 2032 2033 2034 2035 2036 2037 2038 DM 41-42-Black Dog (Jawbone) 1,455 1,383 1,484 1,438 1,474 1,522 1,521 1,434 Long Branch Deep (L. Banner) 0 0 0 0 0 0 0 0 DM44 (Lower Banner) 0 0 0 0 0 0 0 0 DM43 (Jawbone Rider) 621 610 678 626 621 661 648 672 Ball Ridge DM46 (L. Banner) 0 0 0 0 0 0 0 0 Bear Ridge (Upper Banner) 0 0 0 0 0 0 0 0 Total 2,076 1,992 2,162 2,065 2,096 2,183 2,170 2,106 Mine Name 2039 2040 2041 2042 2043 2044 2045 2046 DM 41-42-Black Dog (Jawbone) 1,609 1,567 1,528 1,495 1,543 1,483 1,129 825 Long Branch Deep (L. Banner) 0 0 0 0 0 0 0 0 DM44 (Lower Banner) 0 0 0 0 0 0 0 0 DM43 (Jawbone Rider) 747 706 715 729 719 749 733 877 Toms Creek (Lower Banner) 0 0 0 0 0 0 0 0 Ball Ridge DM46 (L. Banner) 0 0 0 0 0 0 0 0 Bear Ridge (Upper Banner) 0 0 0 0 0 0 0 0 Total 2,356 2,273 2,243 2,224 2,263 2,232 1,862 1,702 Mine Name 2047 2048 2049 2050 2051 2052 2053 2054 DM 41-42-Black Dog (Jawbone) 843 838 558 147 0 0 0 0 Long Branch Deep (L. Banner) 0 0 0 0 0 0 0 0 DM44 (Lower Banner) 0 0 0 0 0 0 0 0 DM43 (Jawbone Rider) 943 974 1,021 1,067 956 994 754 486 Ball Ridge DM46 (L. Banner) 0 0 0 0 0 0 0 0 Bear Ridge (Upper Banner) 0 0 0 0 0 0 0 0 Total 1,786 1,811 1,579 1,215 956 994 754 486 Mine Name 2055 2056 2057 2058 2059 2060 2061 2062 DM 41-42-Black Dog (Jawbone) 0 0 0 0 0 0 0 0 Long Branch Deep (L. Banner) 0 0 0 0 0 0 0 0 DM44 (Lower Banner) 0 0 0 0 0 0 0 0 DM43 (Jawbone Rider) 476 493 538 281 0 0 0 0 Ball Ridge DM46 (L. Banner) 0 0 0 0 0 0 0 0 Bear Ridge (Upper Banner) 0 0 0 0 0 0 0 0 Total 476 493 538 281 0 0 0 0 As shown in Tables 13-2 and 13-3, the areas planned for surface and highwall mines produce coal until 2032. Clean coal production varies directly with surface mining ratios along with availability of open highwall for the highwall miner units.

Alpha Metallurgical Resources, Inc. Statement of Coal Resources and Reserves for the Virginia Complex in Accordance with United States SEC Standards as of December 31, 2023 Central Appalachian Coal Basin Virginia, USA MARSHALL MILLER & ASSOCIATES, INC. 54 Table 13-2: Virginia Complex Surface Mine Production Schedule (x 1,000 Saleable Tons) Mine Name 2023 2024 2025 2026 2027 2028 2029 2030 Long Branch 37 51 62 51 25 0 0 0 88 Strip 268 512 872 599 639 653 207 207 Total 306 563 934 650 664 653 207 207 Mine Name 2031 2032 2033 2034 2035 2036 2037 2038 Long Branch 0 0 0 0 0 0 0 0 88 Strip 207 124 0 0 0 0 0 0 Total 207 124 0 0 0 0 0 0 Table 13-3: Virginia Complex Highwall Mine Production Schedule (x 1,000 Saleable Tons) Mine Name 2023 2024 2025 2026 2027 2028 2029 2030 Long Branch HWM 107 106 114 127 169 114 0 0 88 Strip HWM 52 89 141 187 294 364 465 465 Total 159 195 256 315 463 478 465 465 Mine Name 2031 2032 2033 2034 2035 2036 2037 2038 Long Branch HWM 0 0 0 0 0 0 0 0 88 Strip HWM 465 260 0 0 0 0 0 0 Total 465 260 0 0 0 0 0 0 13.3 Mining Related Requirements 13.3.1 Underground A mine plan with sequenced mining projections was prepared for each logical mining unit. For each mine plan, the appropriate number of production units is selected for the resource area, and a productivity level assigned, expressed in feet of advance per unit-shift of production. The productivity is based on the equipment and personnel configuration, mining height and expected physical conditions. 13.4 Required Equipment and Personnel 13.4.1 Underground Mines 13.4.1.1 Deep Mine 41 (Maps JB-8, JB-9) Deep Mine 41 is a well-developed underground mine that supports seven (7) production units. The mine operates in the Jawbone Seam. The mine has been in production since 2010. Full steady state production was reached in 2016 at 1,500,000 clean tons per year and averaging 1,675,000 clean tons per year over the period from 2016 to 2020. The coal seam is accessed by a side-by-side decline slope. Personnel, supplies and equipment traverse the haul roadside of the slope to access the workings and the belt travels up the opposite side. The slope facility is located near the center of the coal property. Work areas have been developed to the east and west of the slope bottom area. A split shaft is located at slope bottom. The shaft provides intake air, and the mine fan is mounted on the return side of the shaft in an exhausting arrangement. Alpha Metallurgical Resources, Inc. Statement of Coal Resources and Reserves for the Virginia Complex in Accordance with United States SEC Standards as of December 31, 2023 Central Appalachian Coal Basin Virginia, USA MARSHALL MILLER & ASSOCIATES, INC. 55 The depth of cover ranges from 400 feet to 1,200 feet. Production is scheduled for approximately 248 days each year, which represents production on Monday through Friday. On each day, production sections are scheduled to produce coal on two shifts. The sections are configured as super sections with two continuous miners operated independently on each section. Productivity is planned at the rate of 174 feet of advance per shift of operation. Principal production equipment per section includes one continuous miner, one roof bolter, two shuttle cars, and one scoop. Coal is extracted from the production face with the continuous miner and hauled to the mine conveyor in shuttle cars. At the conveyor belt, the coal is discharged from the shuttle cars onto a feeder breaker for transfer onto the conveyor. The conveyors carry the coal to the outside, where it is stockpiled. Coal is then transported via overland conveyor belt haulage to the McClure Preparation Plant where it is processed and loaded onto CSX rail for transport to the consumer. The production units do perform secondary recovery where available with mobile roof support (MRS) units. The mine plan design includes leaving support pillars in selected areas to prevent subsidence damage to surface structures and features. Deep Mine 41 is operational at the time of this report; all necessary infrastructure and utilities are in place; all necessary permits have been obtained. Estimated capital expenditures for future ventilation facilities are included within the financial model. The estimated expenditures for site closure and reclamation have been calculated and are included within the financial model as well. As work areas are completed, the mine will see a reduction in production units starting with two units in 2045, one unit in 2047, two units in 2049, and the final two units in 2050. 13.4.1.2 Deep Mine 44 Rush Branch (Map LB-5) Deep Mine 44 is located approximately 3.5 miles south of the McClure Preparation Plant. It is currently operational with two (2) continuous mining sections producing coal in the Lower Banner seam on leased mineral property. Deep Mine 44 is a two (2) production section mine with each working section equipped with two (2) Continuous Miners, two (2) Roof Bolters, four (4) Shuttle Cars and two (2) scoops. The production units do perform secondary recovery where available with MRS units. The mine plan design includes leaving support pillars in selected areas to prevent subsidence damage to surface structures and features. Similar to the Deep Mine 41 operation, coal is extracted from the production face with the continuous miners and hauled to the mine conveyor in shuttle cars. At the conveyor belt, the coal is discharged from the shuttle cars onto a feeder breaker for transfer onto the conveyor. The conveyors carry the coal to the outside, where it is stockpiled. Coal is then transported via highway truck haulage to the Toms Creek and McClure Preparation Plants where it is processed and loaded onto the Norfolk Southern and CSX rail system, respectively, for transport to the consumer.

Alpha Metallurgical Resources, Inc. Statement of Coal Resources and Reserves for the Virginia Complex in Accordance with United States SEC Standards as of December 31, 2023 Central Appalachian Coal Basin Virginia, USA MARSHALL MILLER & ASSOCIATES, INC. 56 Deep Mine 44 is also operational at the time of this report with all necessary infrastructure and utilities in place. All necessary permits have been obtained. Estimated expenditures for site closure and reclamation are included in the financial model for this site. The Mine is scheduled to deplete its mining assignment in 2025. 13.4.1.3 Bear Ridge Contract Mine (Map UB-1) Active at the time of this report, Capital Coal Corporation is operating the Bear Ridge Contract Mine (formerly operated by Four-O Mining). The facility is located on Rush Branch of Roaring Fork of the McClure River approximately 8.7 miles southeast of the McClure Preparation Plant. The mine produces from the Upper Banner Seam. Estimated depletion occurs just after the beginning of calendar year 2025. The mine produces metallurgical grade coal using one (1) active section with one (1) continuous miner, one (1) roof bolter, two (2) shuttle cars, one (1) belt feeder, and one (1) scoop per section. Coal is extracted from the production face with the continuous miners and hauled to the mine conveyor in shuttle cars. At the conveyor belt, the coal is discharged from the shuttle cars onto a feeder breaker for transfer onto the conveyor. The conveyors carry the coal to the outside, where it is stockpiled prior to being trucked to the Toms Creek and McClure Preparation Plants by highway trucks. The mine site is compact and does not have equipment to scalp rock prior to trucking to the preparation plant. All necessary permits have been obtained. Estimated expenditures for site closure and reclamation are included in the financial model for this site. 13.4.1.4 Deep Mine 43 (Map JBR-7) Deep Mine 43 targets the Upper Jawbone Seam. Access would be gained by a haulage slope and ventilation shafts as the coal boundary is completely below drainage. The access is proposed at a location along Frying Pan Creek of Russell Fork, approximately 9.4 miles east of the McClure Preparation Plant. The coal boundary is bisected by a northwest to southeast trending fault system. The projected plan is to drive through the fault to access the eastern portion of the coal boundary. At the crossing, a ventilation/elevator shaft has been proposed for developing the eastern boundary. Deep Mine 43 will begin mining as a three (3) section mine and later in its assignment, a fourth production section will be added. Each working section will be operated as a super section with two sets of mining equipment operated simultaneously and sharing a common dumping point on the same section, with each set being ventilated by a separate split on intake air. Each super section operates two (2) Continuous Miners, two (2) Roof Bolters, four (4) Shuttle Cars and two (2) scoops. The production units do perform secondary recovery where available with MRS units. The mine plan design includes leaving support pillars in selected area to prevent subsidence damage to surface structures and features. Coal will be extracted from the working face by the continuous miner and loaded onto Alpha Metallurgical Resources, Inc. Statement of Coal Resources and Reserves for the Virginia Complex in Accordance with United States SEC Standards as of December 31, 2023 Central Appalachian Coal Basin Virginia, USA MARSHALL MILLER & ASSOCIATES, INC. 57 shuttle cars to be transported to the belt feeder on the section conveyor belt. Once on the conveyor belt, the product will be transported to the surface to a stockpile. Highway trucks would transport the product on public highways to the McClure Preparation Plant for a one-way distance of 19.9 miles. The mine product is expected to average 40 percent recovery due to in-seam rock as well as out of seam dilution occurring from excavating roof or floor rock to have adequate height to operate the underground machinery. Due to the size of this reserve, the option to acquire additional property to construct a small preparation plant also remains but further study of this arrangement would be necessary. This model proposes to reduce the amount of rock being hauled to the preparation plant by screening the run of mine material to reduce the rock content. The installation of a screen system and a coarse refuse disposal site on controlled surface property would reduce the weight of the hauled material by approximately twelve percent (12%), which would be realized in a cost reduction in the truck haulage costs on a clean ton basis. A similar system was used at Deep Mine 37. The timing model projects mining to commence in 2026 and be completed in 2058. 13.4.1.5 Deep Mine 45 Long Branch (Map LB-6) This reserve area is located approximately 8.4 miles southeast of the McClure Preparation Plant and approximately 1.0 miles north of the Bear Ridge Contract Mine. The coal boundary is found in the Lower Banner Seam. An existing surface mine contour bench will be used to access the seam. Coal would be trucked to the Tom Creek and McClure Preparation Plants with highway trucks across a developed coal haul road to the county road system. This mine includes a starting date of February 2025 with a completion date of November 2027. Deep Mine 45 will be developed as a one (1) section mine with the working section operated as a super section with two sets of mining equipment operating simultaneously and sharing a common dumping point on the same section, with each set being ventilated by a separate split on intake air. Each super section operates two (2) Continuous Miners, two (2) Roof Bolters, four (4) Shuttle Cars and two (2) scoops. The production units do perform secondary recovery where available with MRS units. The mine plan design includes leaving support pillars in selected areas to prevent subsidence damage to surface structures and features. Coal will be excavated from the working face by the continuous miner and loaded onto shuttle cars to be transported to the belt feeder on the section conveyor belt. Once on the conveyor belt, the product will be transported to the surface to a stockpile. Highway trucks would transport the product on public highways for a one-way distance of 13.5 miles. Electrical power can be sourced from the Bear Ridge Contract Mine utility tap approximately 0.5 miles from the proposed site. 13.4.1.6 Deep Mine 46 Ball Ridge (Map LB-4) This reserve area is located approximately 4.9 miles southeast of the McClure Preparation Plant. The coal seam is the Lower Banner Seam.

Alpha Metallurgical Resources, Inc. Statement of Coal Resources and Reserves for the Virginia Complex in Accordance with United States SEC Standards as of December 31, 2023 Central Appalachian Coal Basin Virginia, USA MARSHALL MILLER & ASSOCIATES, INC. 58 Deep Mine 46 will be developed as a two (2) section mine with each working section operated as a super section (two sets of mining equipment operating simultaneously and sharing a common dumping point on the same section, with each set being ventilated by a separate split on intake air). Each super section operates two (2) Continuous Miners, two (2) Roof Bolters, four (4) Shuttle Cars and two (2) scoops. The production units do perform secondary recovery where available with MRS units. The mine plan design includes leaving support pillars in selected areas to prevent subsidence damage to surface structures and features. Coal will be excavated from the working face by the continuous miner and loaded onto shuttle cars to be transported to the belt feeder on the section conveyor belt. Once on the conveyor belt, the product will be transported to the surface to a stockpile. Highway trucks would transport the product on public highways for a one-way distance of 8.1 miles to the McClure Preparation Plant. The site will be constructed along the Lower Banner Seam outcrop. The surface facilities would be positioned along existing roads as a contour cut along the coal seam with a stockpile area located below the mine bench. A new power substation would be required. A local utility power line is near the site. The power tap can be utilized in the future for the expansion of the southeast portion of Deep Mine 41. Mining is projected to commence in 2024 and be completed in 2027. 13.4.2 Surface Mines 13.4.2.1 Long Branch (Map LBR-1 through LBR-3) Figure 13-1: Long Branch Surface Mine Aerial View Alpha Metallurgical Resources, Inc. Statement of Coal Resources and Reserves for the Virginia Complex in Accordance with United States SEC Standards as of December 31, 2023 Central Appalachian Coal Basin Virginia, USA MARSHALL MILLER & ASSOCIATES, INC. 59 The Long Branch reserve area consists of contour and highwall mining of three seams: the Upper Banner 2, Upper Banner, and the Lower Banner seams. Deep mining has taken place in the Upper and Lower Banner seams. Pre-law surface contouring and augering depletion exists on three seams with no evidence of highwall reclamation. The Upper Banner and Lower Banner benches north of Lick Creek are expected to contain large amounts of mined spoil that will require remining to fully expose the seams for highwall mining. Proposed contouring is limited to areas that have highwall mining potential. Due to steep terrain, restricted spoil placement areas, and existing gas well locations, second-cut contouring is limited to areas where existing contour width is insufficient to accommodate a highwall miner. If practical, second-cut contouring will be attempted in areas of previous augering to provide solid coal for highwall mining. Unfortunately, a portion of the augering will likely remain requiring the additional steps of grouting the auger holes and/or widening highwall mining web widths effectively reducing overall highwall miner recovery. The Long Branch reserve does not offer a great deal of flexibility in development due to the large concentration of gas wells and lines that require close coordination with the gas company for their shut- in/plugging and line movement. Additionally, there is no permitted off-bench areas for final or temporary spoil placement. The lack of hollow fill space requires placing mined spoil on contour benches recently highwall mined. Remaining excess mine spoil is placed on mined contour benches that can accommodate additional spoil or is used to reclaim “pre-law” walls within the permit. Contour cuts are deliberately held to the minimal widths necessary to support highwall mining where planned to avoid generating excess swelled spoil. Alpha presently dedicates one Caterpillar Inc. (CAT) 993 loader/785 truck spread for excavation. Track dozers are available on the job but are not expected to contribute to production and will be used primarily for reclamation. Continual highwall mining activity will be unlikely due to periods of insufficient highwall exposure. As a result, the operation benefits from multi-skilled operators capable of operating different machinery. Long Branch surface mining operations are scheduled to conclude in 2027 while highwall mining operations will continue until 2028.

Alpha Metallurgical Resources, Inc. Statement of Coal Resources and Reserves for the Virginia Complex in Accordance with United States SEC Standards as of December 31, 2023 Central Appalachian Coal Basin Virginia, USA MARSHALL MILLER & ASSOCIATES, INC. 60 13.4.2.2 88 Strip/Three Forks (Map 88-1 through 88-11) Figure 13-2: 88-Strip/Three Forks Surface Mine Aerial View The 88 Strip / Three Forks mine complex is an area that has been mined for more than 50 years. Initially deep and surface mining targeted the Raven, Jawbone, and Tiller seams. In the western portion of the mining complex the Jawbone and Tiller effectively come close together to allow them to be deep mined as one seam known locally as the “Thick Tiller”. Surface mining activity wanned in the 1990s and most of the disturbed areas were reclaimed. Surface mining resumed approximately 10 years later with the recognition that the Jawbone-Tiller seams had more contour, auger and highwall mining potential. Alpha Metallurgical Resources, Inc. Statement of Coal Resources and Reserves for the Virginia Complex in Accordance with United States SEC Standards as of December 31, 2023 Central Appalachian Coal Basin Virginia, USA MARSHALL MILLER & ASSOCIATES, INC. 61 Alpha continues to develop the Jawbone-Tiller seams, concentrating on surface mining previously deep mined areas where pillars were not removed. This effort often involves remining reclaimed spoil placed on upper Raven benches. Strip ratios for the “Thick Tiller” pits can exceed 30:1, but engineered pit/panel alignment, allocation of dozers pushing upper seam spoil into void space of the previously excavated panel and limiting loader/truck contribution to the lower seams significantly reduces the cost per yard. Blast casting of the upper burden also offers limited quick and cheap burden removal. Placement of spoil in adjacent panels requires rehandle of the spoil along the spoil-side high wall to assure safe removal of the targeted Jawbone-Tiller pillars. Although Alpha contends that they have successfully re-mined Thick Tiller in areas of small regular pillar sizes, MM&A limited reserve boundaries to areas where digital records indicate that larger pillars still remain to be excavated. Digital records have not always been found to be accurate, therefore MM&A believes it is appropriate to periodically drill to confirm pillars remain and have not been “pillared”. Alpha has supplemented mining with contour and highwall mining of additional seams: Jawbone Rider, Raven, and Ailey seams. In 2023 contour and highwall mining activity extended to higher elevation seams of the Kennedy, Kennedy Rider, Big Fork, Lower Banner, and Upper Banner in the Three Forks mining area. As of the 3rd quarter of 2023, mining excavation is being constrained by permit delays associated with the additional Three Forks permit due to the “Big Sandy crayfish” issue. It is also impacting revisions to existing permit to add additional property to simplify spoil removal from lower seams on the eastern side of Three Forks permit. Until this permit is obtained, mining of the lower seams will require hauling mine spoil vertically to a “cut-thru” connecting areas with adequate spoil storage room. Additional permitting is required before mining can take place on reserves east of Indian Creek and south of Rabbit Ridge. MM&A believes the 88 Strip mine will slowly transition out of large Thick Tiller coal production due to exhaustion of the larger mineable pillar boundaries. Production will continue east in the previously stated seams and new seams that are primarily in the 3 Forks area of future expansion. The additional seams in the Three Forks area include the Upper Banner, Lower Banner, Big Fork, Kennedy Rider, and Kennedy, all of which are above the Aily seam in the stratigraphic column. Most of the seams show no evidence of previous mining activity. Proposed contouring is limited to areas that have highwall mining potential. Additional areas that bridge contouring were added in selected areas. 88 Strip presently utilizes 3 – CAT 993 loader/785 truck spreads and 3 – D11 track dozers for overburden production. Historically, greater than 16 million cubic yards (CY) were mined on a yearly basis due to heavy contribution of dozers, but due to increased emphasis on new seam contouring yearly overburden volumes are expected to be between 14 and 15 million CY by year 2027. Creation of highwalls will primarily involve truck haulage and not dozer pushing. Track dozer production is expected to be limited to Thick Tiller pits.

Alpha Metallurgical Resources, Inc. Statement of Coal Resources and Reserves for the Virginia Complex in Accordance with United States SEC Standards as of December 31, 2023 Central Appalachian Coal Basin Virginia, USA MARSHALL MILLER & ASSOCIATES, INC. 62 With a few exceptions contouring and highwall mining will be initiated in lower seams in areas of multi- seam planned activity to aid in reclamation. Highwall mining will target coals greater than 18 inches and average 650 feet penetration depth. Unless additional reserve areas are recognized only one loader/truck spread will be required to create highwall otherwise the surface activity will outrun the trailing highwall mining activity. Additionally, two more highwall miners are projected to be required in order to exhaust reserves within the same year contour activity ceases in year 2032. 14 Processing and Recovery Methods 14.1 Description or Flowsheet The Alpha Virginia Operations currently includes the McClure River Preparation Plant and Tom’s Creek Preparation Plant in addition to the mines. The plant sites include raw coal storage, clean coal storage, a railroad loadout, and refuse disposal area. Both plants have a feed rate capacity of 1,100 raw tons per hour each. The McClure River Plant was built by Roberts and Shaefer in 1979 and received an upgrade in 2019. The plant produces a product with a typical ash content of 8.13% and typical sulfur content of 0.71%. Plant equipment includes a heavy media vessel for primary separation, low density cyclone for intermediate separation, froth flotation and spirals in the fine coal circuit. Centrifugal dryers are utilized, and a thermal dryer can be seen in the aerial imagery obtained from Google Earth. During the 2023 reporting year the McClure Plant had an average utilization of 52.59%. Coarse and fine refuse are disposed of at an adjacent combined refuse area utilizing currently installed vacuum disk filters that could be augmented with new plate-and-frame filter presses when installation is completed. Historically slurry was injected into the adjacent McClure No. 1 Mine with an opportunity to resume this process in a limited capacity moving forward. Due to the topography of the region and limited competition for land resources a new slurry impoundment has started the design phase. The site would be constructed on adjacent property following the acquisition and permitting process for additional long-term refuse capacity. An aerial image of the McClure River Plant and refuse area is shown in Figure 14-1. Alpha Metallurgical Resources, Inc. Statement of Coal Resources and Reserves for the Virginia Complex in Accordance with United States SEC Standards as of December 31, 2023 Central Appalachian Coal Basin Virginia, USA MARSHALL MILLER & ASSOCIATES, INC. 63 Figure 14-1: McClure River Preparation Plant and Refuse Area The Tom’s Creek Plant was built by The Daniels Company in 1980 and received an upgrade by Sedgman Pty Ltd in 2004. The plant produces a product with a typical ash content of 8.11% with typical sulfur content of 0.83% at a utilization rate of 43.06% in 2023. Plant equipment includes a heavy media vessel for primary separation, low density and heavy media cyclones for intermediate separation, froth flotation, spirals and columns for the fine coal circuit. The plant utilizes centrifugal dryers. Coarse refuse is belted to the top of the adjacent impoundment and also includes a slurry pond. An aerial image of the Tom’s Creek Plant and slurry impoundment is shown in Figure 14-2.

Alpha Metallurgical Resources, Inc. Statement of Coal Resources and Reserves for the Virginia Complex in Accordance with United States SEC Standards as of December 31, 2023 Central Appalachian Coal Basin Virginia, USA MARSHALL MILLER & ASSOCIATES, INC. 64 Figure 14-2: Tom’s Creek Preparation Plant and Slurry Impoundment Processes and equipment are typical of those used in the coal industry and are in use in nearly all plants in the Central Appalachian Basin. 14.2 Requirements for Energy, Water, Material and Personnel Personnel have historically been sourced from the surrounding communities in Dickenson, Wise and Russell Counties, and have proven to be adequate in numbers to conduct mining operations. As mining is common in the surrounding areas, the workforce is generally familiar with mining practices, and many are experienced miners. Alpha Metallurgical Resources, Inc. Statement of Coal Resources and Reserves for the Virginia Complex in Accordance with United States SEC Standards as of December 31, 2023 Central Appalachian Coal Basin Virginia, USA MARSHALL MILLER & ASSOCIATES, INC. 65 Water is sourced locally from public water sources or rivers, and electricity is sourced from Appalachian Electric Power (AEP). The service industry in the areas surrounding the mine complex has historically provided supplies, equipment repairs and fabrication, etc. 15 Infrastructure Alpha’s Virginia preparation plants service customers with washed coal, which is transported via the CSX Transportation and Norfolk Southern rail lines at the plant’s loadouts. Haul roads, primary roads, and conveyor belt systems account for transport from the various mine sites to the preparation plant. This practice will continue for future reserves. As an active operation, the necessary support infrastructure for Virginia is in place. As new areas are developed, the infrastructure requirements will change. These changes have been considered in the LOM plans and financial model. The underground mining resource areas which are located above drainage will require an access road and mine access development along the outcrop. Typical mine facilities include a mine office, a change house, supply facilities, mine fan and a stacker conveyor if truck haulage is required. One major advantage for the operations is that the majority of the raw coal originates from Deep Mine 41 and is transported directly to the preparation plant by conveyors which eliminates truck haulage. Photographs of the existing facilities are shown in Figures 15-1 and 15-2.

Alpha Metallurgical Resources, Inc. Statement of Coal Resources and Reserves for the Virginia Complex in Accordance with United States SEC Standards as of December 31, 2023 Central Appalachian Coal Basin Virginia, USA MARSHALL MILLER & ASSOCIATES, INC. 66 Figure 15-1: McClure River Preparation Plant & Surface Facilities Alpha Metallurgical Resources, Inc. Statement of Coal Resources and Reserves for the Virginia Complex in Accordance with United States SEC Standards as of December 31, 2023 Central Appalachian Coal Basin Virginia, USA MARSHALL MILLER & ASSOCIATES, INC. 67 Figure 15-2: Tom’s Creek Preparation Plant & Surface Facilities

Alpha Metallurgical Resources, Inc. Statement of Coal Resources and Reserves for the Virginia Complex in Accordance with United States SEC Standards as of December 31, 2023 Central Appalachian Coal Basin Virginia, USA MARSHALL MILLER & ASSOCIATES, INC. 68 16 Market Studies 16.1 Market Description The quality characteristics for the subject coal resources and coal reserves have been reviewed in detail by MM&A. The drill hole data were utilized to develop average coal quality characteristics for the mining site. These average coal quality characteristics were then utilized as the basis for determining the various markets into which the saleable coal will likely be placed. A typical quality specification for the Virginia products as produced in 2023 is shown in Table 16-1. Table 16-1: 2023 Produced Quality MV HVA Ash (%) 8.13 8.11 Sulfur (%) 0.71 .83 Volatile Matter (%) 24.16 30.39 The mine production serves both the mid- and high-volatile metallurgical market. 16.2 Price Forecasts Company-wide pricing data as provided by Alpha from third party sources is described in Table 16-2. Note that not all products reflected in Table 16-2 will apply to every business unit. The pricing data assumes a flat-line long term realization of $162 to $163 per short ton port pricing, with a LOM average of $125.03 per ton netback pricing reflective of the high- and mid-volatile product currently sold at Virginia. These estimates are based on long-term pricing published by third party sources and adjusted for quality and transportation. The netback pricing represents adjustments made to published benchmark pricing based on quality and transportation. A large majority of the coal sold by Alpha and their Virginia business group is shipped internationally as part of blended products from other business units within Alpha or sourced from other companies. These netback adjustments reflect these additional costs carried after the products leave the Virginia business unit. Table 16-2: Price Forecasts Coal quality Market Pricing Per Ton (1) (2) High-Vol. A $162 High- Vol. B $140 Mid-Vol. $163 Low-Vol. $163 Thermal $74 (1) Market pricing shown on U.S. East Coast basis. (2) Metallurgical and thermal pricing based on 10-year and 3-year average, respectively of forecasted pricing from pricing services. Alpha Metallurgical Resources, Inc. Statement of Coal Resources and Reserves for the Virginia Complex in Accordance with United States SEC Standards as of December 31, 2023 Central Appalachian Coal Basin Virginia, USA MARSHALL MILLER & ASSOCIATES, INC. 69 16.3 Contract Requirements Some contracts are necessary for successful marketing of the coal. For Virginia, since all mining, preparation and marketing is done in-house, the remaining contracts required are: > Transportation – Alpha contracts with the Norfolk Southern Railroad and CSX to transport coal to market. > Sales – Sales contracts are a mix of spot and contract sales. With the volatility of the market, long- term contracts are not typically written. 17 Environmental Studies, Permitting and Plans, Negotiations or Agreements with Local Individuals 17.1 Results of Studies MM&A completed an environmental review in 2011 for the Massey properties acquired by Alpha, including those operations that were active at Virginia at that time. The environmental review completed by MM&A included site inspections, reviews of historical records, database searches of State and Federal regulatory records and interviews to identify potential recognized environmental conditions (RECs) that may create environmental liability for the sites. While MM&A identified RECs during both studies, MM&A’s opinion was that those issues would not preclude the continued or future use of the properties as a coal mining/preparation venture. Based on this former ESA completed by MM&A, it is MM&A’s opinion that Virginia has a generally typical coal industry record of compliance with applicable mining, water quality, and environmental laws. Estimated costs for mine closure, including water quality monitoring during site reclamation, are included in the financial models. 17.2 Requirements and Plans for Waste Disposal At the McClure Preparation Plant, coarse and fine refuse are presently placed in an adjacent combined refuse area utilizing existing vacuum disk filters that could be augmented with plate-and-frame filter presses when installation is completed. Initially, combined refuse was placed in the existing fills. The McClure plant has been injecting slurry into the adjacent McClure No. 1 Mine for approximately the past 15 years. There is an opportunity to resume injection in a limited capacity moving forward, and the permitting of two new injection sites is underway. Due to the topography of the region and limited land resources, a new coarse refuse/slurry impoundment has started the design phase. The site would be constructed on adjacent property following the acquisition and permitting process for additional long-term refuse capacity.

Alpha Metallurgical Resources, Inc. Statement of Coal Resources and Reserves for the Virginia Complex in Accordance with United States SEC Standards as of December 31, 2023 Central Appalachian Coal Basin Virginia, USA MARSHALL MILLER & ASSOCIATES, INC. 70 Based on a study completed by Schnabel Engineering, Inc. (Schnabel) in February 2021 using January 2021 updated mapping, McClure River Refuse area has disposal capacity for combined refuse through February 2029 at present production rates. The proposed new coarse disposal/impoundment site has a projected capacity of approximately 20 years. The refuse disposal site at the Toms Branch Preparation Plant includes an impoundment with coarse refuse fill areas. As with most operations in the region, continuing to secure additional coarse and fines capacity will be critical to execute the business plan as outlined in this TRS, a process Alpha has historically shown success in navigating. The table below outlines the current estimated capacities and permits of Virginia’s fine and coarse impoundments. Table 17-1: Virginia Refuse Disposal Summary Refuse Facility State SMCRA Permit Number MSHA ID Refuse Disposal Type Classified as a Dam Permit Status Current Planned Maximum Coarse Life (Approved + Planned) Current Planned Maximum Fines Life (Approved + Planned) Est. Coarse/ Combined Refuse Life (Yrs.) Est. Fine Refuse Life (Yrs.) McClure River Refuse Area (Virginia) 1402177 1211-VA5- 0124-01 Coarse Refuse No Active 11 3 8 3 Sallies Branch Slurry Impoundment (Virginia) 1302182 1211-VA5- 0133-01A Slurry Impoundment – Downstream and Upstream Yes Active 20.8 20.8 20.8 20.8 17.3 Permit Requirements and Status All mining operations are subject to federal and state laws and must obtain permits to operate mines, coal preparation plants and related facilities, haul roads, and other incidental surface disturbances necessary for mining to occur. Permits generally require that the permittee post a performance bond in an amount established by the regulatory program to provide assurance that any disturbance or liability created during mining operations is properly restored to an approved post-mining land use and that all regulations and requirements of the permits are fully satisfied before the bond is returned to the permittee. Significant penalties exist for any permittee who fails to meet the obligations of the permits including cessation of mining operations, which can lead to potential forfeiture of the bond. Any company, and its directors, owners and officers, which are subject to bond forfeiture can be denied future permits under the program.1 New permits or permit revisions will occasionally be necessary to facilitate the expansion or addition of new mining areas on the Property, such as amendments to existing permits and new permits for mining of reserve areas. Exploration permits are also required. Property under lease includes provisions for exploration among the terms of the lease. New or modified mining permits are subject to a public 1 Monitored under the Applicant Violator System (AVS) by the Federal Office of Surface Mining. Alpha Metallurgical Resources, Inc. Statement of Coal Resources and Reserves for the Virginia Complex in Accordance with United States SEC Standards as of December 31, 2023 Central Appalachian Coal Basin Virginia, USA MARSHALL MILLER & ASSOCIATES, INC. 71 advertisement process and comment period, and the public is provided an opportunity to raise objections to any proposed mining operation. MM&A is not aware of any specific prohibition of mining on the subject property and given sufficient time and planning, Alpha should be able to secure new permits to maintain its planned mining operations within the context of current regulations. Necessary permits are in place to support current production on the Property, but future permits are required to maintain and expand production. Portions of the Property are located near local communities. Regulations prohibit mining activities within 300 feet of a residential dwelling, school, church, or similar structure unless written consent is first obtained from the owner of the structure. Where required, Alpha reports that such consents have been obtained where mining is proposed beyond the regulatory limits. Alpha has obtained all mining and discharge permits to operate its mines and processing, loadout or related facilities. MM&A is unaware of any obvious or current Alpha permitting issues that are expected to prevent the issuance of future permits. Virginia, along with all coal producers, is subject to a level of uncertainty regarding future clean water permits due to United States Environmental Protection Agency (EPA) and the United States Fish and Wildlife Agency (USFW) involvement with state programs. The mining permits currently held by Alpha Virginia are shown in Table 17-2.

Alpha Metallurgical Resources, Inc. Statement of Coal Resources and Reserves for the Virginia Complex in Accordance with United States SEC Standards as of December 31, 2023 Central Appalachian Coal Basin Virginia, USA MARSHALL MILLER & ASSOCIATES, INC. 72 Table 17-2: Virginia Mining Permits Permit Operation Name Company Current Status Issue Bond Method MSHA ID Current Permit Expiration Date NPDES Acreage 1102158 88 Strip Paramont Contura, LLC Active 10/26/2016 Pool 44-07163; 44-07300 2,502.15 2/10/2026 VA0082158, VAG400983 1102161 Black Bear Surface Mine Paramont Contura, LLC Completion Report; Inactive 11/17/2016 Pool 44-07100; 44-06886 208.52 7/9/2027 VA0082161 1102167 Kiwanis Surface Mine Paramont Contura, LLC Active, Not Started 11/22/2016 Pool Pending 328.57 7/29/2023 (in review) VA0082167 1102180 Three Forks Surface Mine Paramont Contura, LLC Active 12/19/2016 Pool 44-07163 1,705.03 5/29/2024 VA0082180 1102181 Cabin Ridge Paramont Contura, LLC Completion Report; Active Reclamation Only 12/19/2016 Pool 44-07322 417.06 12/17/2023 (in review) VA0082181 1102186 Long Branch Auger Mine Paramont Contura, LLC Active 12/20/2016 Pool 44-07381 1,505.23 5/9/2023 (in review) VA0082186 1102188 Hawks Nest Surface Paramont Contura, LLC Completion Report; Active Reclamation Only 12/20/2016 Pool 44-06949 31.67 3/23/2024 VA0082188 1102197 Bold Camp Surface Mine Paramont Contura, LLC Active 2/7/2017 Pool 44-07274 367.7 4/26/2021 (in review) VA0082197 1102233 Butcherknife Surface Paramont Contura, LLC Completion Report, Active Reclamation Only 6/14/2017 Pool 44-07257 139.72 1/26/2022 (in review) VA0082233 1102243 Doe Branch Strip Paramont Contura, LLC Active, Not Started 10/11/2017 Pool Pending 1,085.64 9/14/2020 (in review) VA0082243 1202159 Deep Mine #37 Paramont Contura, LLC Active, Not Producing 11/2/2016 Cost 44-07231 65.48 7/23/2023 (in review) VA0082159 1202160 Deep Mine #44 Paramont Contura, LLC Active 11/3/2016 Cost 44-07308 27.26 3/18/2023 (in review) VA0082160, VA0092878 1202171 Deep Mine #41 Paramont Contura, LLC Active 12/13/2016 Cost 44-07223 35.23 5/2/2023 (in review) VA0082171, VA0092576 1202173 Powers Branch Deep Mine Paramont Contura, LLC Completion Report; Inactive 12/14/2016 Cost Pending 48.62 1/19/2025 VA0082173 1202174 Deep Mine #25 Paramont Contura, LLC Completion Letter; Active Reclaimed 12/14/2016 Cost 44-07129 44.6 11/30/2024 VA0082174 1202187 Deep Mine #26 Paramont Contura, LLC Completion Report; Inactive 12/20/2016 Cost 44-06929 35.97 12/3/2023 (in review) VA0082187 1202189 Toms Creek North Deep Mine Paramont Contura, LLC Completion Report; Active Reclamation Only 1/3/2017 Cost 44-07367 7 10/14/2021 (in review) VA0082189 1202191 Bear Ridge Deep Mine Paramont Contura, LLC Active 1/18/2017 Cost 44-07217 7.98 12/19/2027 (CSMO/NPDES Renewal application was approved 12/15/2023) VA0082191 1202193 Stonecoal/ Dorton Aily Mine Paramont Contura, LLC Completion Report; Active Reclamation Only 1/19/2017 Cost 44-07193 8.18 9/6/2021 (in review) VA0082193 Alpha Metallurgical Resources, Inc. Statement of Coal Resources and Reserves for the Virginia Complex in Accordance with United States SEC Standards as of December 31, 2023 Central Appalachian Coal Basin Virginia, USA MARSHALL MILLER & ASSOCIATES, INC. 73 Permit Operation Name Company Current Status Issue Bond Method MSHA ID Current Permit Expiration Date NPDES Acreage 1202196 Spruce Pine Mine Paramont Contura, LLC Completion Report; Inactive 1/31/2017 Cost 44-07159 49.22 10/27/2020 (in review) VA0082196 1202198 Deep Mine 42 Paramont Contura, LLC Active 2/7/2017 Cost 44-07223 27.23 6/29/2021 (in review) VA0082198 1202247 Toms Creek South Paramont Contura, LLC Completion Report, Active Reclamation Only 10/23/2017 Cost 44-07388 20.47 10/23/2022 (in review) VA0082247 1202282 Long Branch Lower Banner Deep Mine Paramont Contura, LLC Active, Not Started Cost Pending 24.75 11/28/2023 (in review) VA0082282 1302182 Toms Creek Prep Plant Paramont Contura, LLC Active 12/19/2016 Pool 44-05270 501.67 12/20/2023 (in review) VA0082182, VAG400197 1302195 Moss #2 Prep Plant Dickenson-Russell Contura, LLC Active; Temporary Cessation 1/26/2017 Cost 44-06007 125.99 12/29/2023 (in review, Renewal Application Data Dump Provided 1/3/24) VA0082195 1402177 McClure Prep Plant Dickenson-Russell Contura, LLC Active 12/15/2016 Cost 44-04251; 44-05311 505.55 12/21/2023 (in review) VA0067032, VA0082177 1602175 Hughes Branch Mine Paramont Contura, LLC Completion Report, Inactive 12/14/2016 Pool 44-06268; 44-06891; 44-07109 16.25 11/25/2022 (in review) VA0082175 Note: Permit status and expiration dates are based on information obtained from regulatory agency website and/or Alpha. Permits with expired dates are listed as “in review” due to approval backlogs at the state level.

Alpha Metallurgical Resources, Inc. Statement of Coal Resources and Reserves for the Virginia Complex in Accordance with United States SEC Standards as of December 31, 2023 Central Appalachian Coal Basin Virginia, USA MARSHALL MILLER & ASSOCIATES, INC. 74 17.4 Local Plans, Negotiations or Agreements MM&A found no indication of agreements beyond the scope of Federal or State Regulations. 17.5 Mine Closure Plans Applicable regulations require that mines be properly closed, and reclamation commenced immediately upon abandonment. In general, site reclamation includes removal of structures, backfilling, regrading, and revegetation of disturbed areas. For surface mines, the majority of the expense for backfilling and regrading is completed as part of ongoing mining operations, with only reclamation of final pits and HWM benches required at end-of-mine life. Sediment control is required during the establishment of vegetation, and bond release generally requires a minimum five-year period of site maintenance, water sampling, and sediment control following mine completion. This requirement is reduced to two years for certain operations involving re-mining. Reclamation of underground mines includes closure and sealing of mine openings such as portals and shafts in addition to the items listed above. Estimated costs for mine closure, including water quality monitoring during site reclamation, are included in the financial models. As with all mining companies, an accretion calculation is performed annually so the necessary Asset Retirement Obligations (ARO) can be shown as a Liability on the Balance Sheet. 17.6 Qualified Person’s Opinion The Virginia complex is an operating facility; all necessary permits for current production have been obtained. MM&A knows of no reason that any permits revisions or new permits that may be required cannot be obtained. Based on the Schnabel study discussed in Section 17.2, McClure has disposal capacity for combined refuse through February 2029 at present production rates. The proposed new coarse disposal/impoundment site has a projected capacity of approximately 20 years. Estimated expenditures for site closure and reclamation are included in the financial model for this site. 18 Capital and Operating Costs 18.1 Capital Cost Estimate The production sequence selected for a property must consider the proximity of each reserve area to coal preparation plants, river docks and/or railroad loading points, along with suitability of production equipment to coal seam conditions. The in-place infrastructure was evaluated, and any future needs were planned to a level suitable for a Preliminary Feasibility Study and included in the Capital Forecast. Alpha Metallurgical Resources, Inc. Statement of Coal Resources and Reserves for the Virginia Complex in Accordance with United States SEC Standards as of December 31, 2023 Central Appalachian Coal Basin Virginia, USA MARSHALL MILLER & ASSOCIATES, INC. 75 Alpha provided MM&A with information related to the number of currently operating production units at Virginia. MM&A’s capital schedules assume that major equipment rebuilds occur over the course of each machine’s remaining assumed operating life. Replacement equipment was scheduled based on MM&A’s experience and knowledge of mining equipment and industry standards with respect to the useful life of such equipment. As one mine is depleted, the equipment is moved to its replacement. The capital expenditures tables detail costs for major equipment and infrastructure such as conveyor belt terminal groups. “Other” costs include expenditures for mine access and construction, mine extension capital and miscellaneous costs. A summary of the estimated capital for the consolidated Virginia operations is provided in Figure 18-1 below. Total capital by mine is summarized in Table 18-1. An additional $10.3 million of capital was included in 2024 for coal preparation plant and loadout upgrades. Figure 18-1: Projected Capital Expenditures – Consolidated Virginia Operations

Alpha Metallurgical Resources, Inc. Statement of Coal Resources and Reserves for the Virginia Complex in Accordance with United States SEC Standards as of December 31, 2023 Central Appalachian Coal Basin Virginia, USA MARSHALL MILLER & ASSOCIATES, INC. 76 Table 18-1: Summary of Capital Expenditures Schedule by Mine Item Total 2023 2024 2025 2026 2027 2028 2029 DM 41-42-Black Dog (Jawbone) $462,320 $0 $10,141 $17,616 $9,463 $37,299 $19,760 $27,855 Long Branch Deep (L. Banner) $2,560 $0 $0 $2,560 $0 $0 $0 $0 DM44 (Lower Banner) $0 $0 $0 $0 $0 $0 $0 $0 DM43 (Jawbone Rider) $324,913 $0 $0 $0 $28,960 $1,300 $32,603 $8,590 Ball Ridge DM46 (L. Banner) $4,338 $0 $4,338 $0 $0 $0 $0 $0 Bear Ridge (Upper Banner) $0 $0 $0 $0 $0 $0 $0 $0 Long Branch HWM $4,560 $0 $1,800 $2,760 $0 $0 $0 $0 88 Strip $68,900 $0 $7,860 $8,820 $9,190 $8,170 $8,430 $7,860 Long Branch HWM $1,370 $0 $1,370 $0 $0 $0 $0 $0 88 Strip HWM $13,410 $0 $1,550 $1,550 $0 $4,380 $1,550 $4,380 Total $882,371 $0 $27,059 $33,306 $47,613 $51,149 $62,343 $48,685 Item 2030 2031 2032 2033 2034 2035 2036 2037 DM 41-42-Black Dog (Jawbone) $20,995 $6,860 $27,566 $25,533 $14,721 $38,192 $11,170 $33,898 Long Branch Deep (L. Banner) $0 $0 $0 $0 $0 $0 $0 $0 DM44 (Lower Banner) $0 $0 $0 $0 $0 $0 $0 $0 DM43 (Jawbone Rider) $0 $7,200 $9,406 $33,047 $344 $5,008 $4,320 $5,620 Ball Ridge DM46 (L. Banner) $0 $0 $0 $0 $0 $0 $0 $0 Bear Ridge (Upper Banner) $0 $0 $0 $0 $0 $0 $0 $0 Long Branch HWM $0 $0 $0 $0 $0 $0 $0 $0 88 Strip $9,990 $8,010 $570 $0 $0 $0 $0 $0 Long Branch HWM $0 $0 $0 $0 $0 $0 $0 $0 88 Strip HWM $0 $0 $0 $0 $0 $0 $0 $0 Total $30,985 $22,070 $37,542 $58,580 $15,065 $43,200 $15,490 $39,518 Item 2038 2039 2040 2041 2042 2043 2044 2045 DM 41-42-Black Dog (Jawbone) $24,013 $11,185 $11,185 $21,880 $27,743 $12,403 $13,703 $9,453 Long Branch Deep (L. Banner) $0 $0 $0 $0 $0 $0 $0 $0 DM44 (Lower Banner) $0 $0 $0 $0 $0 $0 $0 $0 DM43 (Jawbone Rider) $23,152 $14,957 $7,544 $7,888 $1,300 $27,647 $4,320 $8,640 Ball Ridge DM46 (L. Banner) $0 $0 $0 $0 $0 $0 $0 $0 Bear Ridge (Upper Banner) $0 $0 $0 $0 $0 $0 $0 $0 Long Branch HWM $0 $0 $0 $0 $0 $0 $0 $0 88 Strip $0 $0 $0 $0 $0 $0 $0 $0 Long Branch HWM $0 $0 $0 $0 $0 $0 $0 $0 88 Strip HWM $0 $0 $0 $0 $0 $0 $0 $0 Total $47,166 $26,142 $18,729 $29,768 $29,043 $40,050 $18,023 $18,093 Item 2046 2047 2048 2049 2050 2051 2052 2053 DM 41-42-Black Dog (Jawbone) $7,819 $17,956 $3,910 $0 $0 $0 $0 $0 Long Branch Deep (L. Banner) $0 $0 $0 $0 $0 $0 $0 $0 DM44 (Lower Banner) $0 $0 $0 $0 $0 $0 $0 $0 DM43 (Jawbone Rider) $344 $11,377 $35,292 $11,520 $0 $4,320 $8,844 $16,706 Ball Ridge DM46 (L. Banner) $0 $0 $0 $0 $0 $0 $0 $0 Bear Ridge (Upper Banner) $0 $0 $0 $0 $0 $0 $0 $0 Long Branch HWM $0 $0 $0 $0 $0 $0 $0 $0 88 Strip $0 $0 $0 $0 $0 $0 $0 $0 Long Branch HWM $0 $0 $0 $0 $0 $0 $0 $0 88 Strip HWM $0 $0 $0 $0 $0 $0 $0 $0 Total $8,163 $29,333 $39,202 $11,520 $0 $4,320 $8,844 $16,706 Alpha Metallurgical Resources, Inc. Statement of Coal Resources and Reserves for the Virginia Complex in Accordance with United States SEC Standards as of December 31, 2023 Central Appalachian Coal Basin Virginia, USA MARSHALL MILLER & ASSOCIATES, INC. 77 Item 2054 2055 2056 2057 2058 2059 2060 2061 DM 41-42-Black Dog (Jawbone) $0 $0 $0 $0 $0 $0 $0 $0 Long Branch Deep (L. Banner) $0 $0 $0 $0 $0 $0 $0 $0 DM44 (Lower Banner) $0 $0 $0 $0 $0 $0 $0 $0 DM43 (Jawbone Rider) $344 $0 $4,320 $0 $0 $0 $0 $0 Ball Ridge DM46 (L. Banner) $0 $0 $0 $0 $0 $0 $0 $0 Bear Ridge (Upper Banner) $0 $0 $0 $0 $0 $0 $0 $0 Long Branch HWM $0 $0 $0 $0 $0 $0 $0 $0 88 Strip $0 $0 $0 $0 $0 $0 $0 $0 Long Branch HWM $0 $0 $0 $0 $0 $0 $0 $0 88 Strip HWM $0 $0 $0 $0 $0 $0 $0 $0 Total $344 $0 $4,320 $0 $0 $0 $0 $0 Note: No capital was projected for 4th quarter 2023. 18.2 Operating Cost Estimate Alpha provided historical costs and budgeted projections of operating costs for its active underground mines (Deep Mine 41 & Deep Mine 44) for MM&A’s review, along with its active surface and highwall mines (88 Strip and Long Branch). MM&A used the historical cost information as a reference and developed a personnel schedule for the mine. Hourly labor rates and salaries were based upon information contained in Alpha’s financial summaries. Fringe benefit costs were developed for vacation and holidays, federal and state unemployment insurance, retirement, workers’ compensation and pneumoconiosis, casualty and life insurance, healthcare and bonuses. A cost factor for mine supplies was developed that relates expenditures to mine advance rates for roof control costs and other mine supply costs based on the historical cost data provided by Alpha. Other factors were developed for maintenance and repair costs, rentals, mine power, outside services, drilling & blasting, coal preparation plant processing, refuse handling, coal loading, property taxes, and insurance and bonding and other direct mining costs. Appropriate royalty rates were assigned for production from leased coal lands and sales taxes were calculated for state severance taxes, the federal black lung excise tax, and federal and state reclamation fees. Statutory sales-related costs are summarized in Table 18-2. Table 18-2: Estimated Coal Production Taxes and Sales Costs Description of Tax or Sales Cost Basis of Assessment Cost Federal Black Lung Excise Tax – Underground Per Ton $1.10 Federal Black Lung Excise Tax – Surface/Highwall Per Ton $0.55 Federal Reclamation Fees – Underground Per Ton $0.12 Federal Reclamation Fees – Surface/Highwall Per Ton $0.28 Virginia Reclamation Tax – Underground Per Ton $0.03 Virginia Reclamation Tax – Surface/Highwall Per Ton $0.04 Virginia Reclamation Tax – Coal Preparation/Loadout Per Ton $0.15 Virginia Severance Tax Percentage of Revenue 2% Royalties – Underground, Surface and Highwall Percentage of Revenue 5.0% Notes: 1. Federal black lung excise tax is paid only on coal sold domestically.

Alpha Metallurgical Resources, Inc. Statement of Coal Resources and Reserves for the Virginia Complex in Accordance with United States SEC Standards as of December 31, 2023 Central Appalachian Coal Basin Virginia, USA MARSHALL MILLER & ASSOCIATES, INC. 78 A summary of the projected operating costs for the consolidated Virginia operations is provided in Figure 18-2. Figure 18-2: Virginia Operating Costs 19 Economic Analysis 19.1 Economic Evaluation 19.1.1 Introduction The pre-feasibility financial model prepared for this TRS was developed to test the economic viability of each coal resource area. The results of this financial model are not intended to represent a bankable feasibility study, required for financing of any current or future mining operations contemplated for the Alpha properties, but are intended to establish the economic viability of the estimated coal reserves. Cash flows are simulated on an annual basis based on projected production from the coal reserves. The discounted cash flow analysis presented herein is based on an effective date of January 1, 2024. On an un-levered basis, the NPV of the project cash flow after taxes represents the Enterprise Value of the project. The project cash flow, excluding debt service, is calculated by subtracting direct and indirect operating expenses and capital expenditures from revenue. Direct costs include labor, operating supplies, maintenance and repairs, facilities costs for materials handling, coal preparation, Alpha Metallurgical Resources, Inc. Statement of Coal Resources and Reserves for the Virginia Complex in Accordance with United States SEC Standards as of December 31, 2023 Central Appalachian Coal Basin Virginia, USA MARSHALL MILLER & ASSOCIATES, INC. 79 refuse disposal, coal loading, reclamation and general and administrative costs. Indirect costs include statutory and legally agreed upon fees related to direct extraction of the mineral. The indirect costs are the Federal black lung tax, Federal and State reclamation taxes, property taxes, coal production royalties, and income taxes. The Alpha mines’ historical costs provided a useful reference for MM&A’s cost estimates. The operations are projected on a calendar year basis. MM&A’s projection of annual sales tonnage is summarized in the chart below. While all Alpha coal resource properties deemed by MM&A to have potential for classification as coal reserves were evaluated as part of the economic model, some of those resource areas were determined to be uneconomical in the current market and were therefore excluded from coal reserves as discussed below. Figure 19-1: Projection of Sales Tons Sales revenue is based on the metallurgical coal price information provided to MM&A by Alpha. Only the revenue from Alpha’s captive mining operations is included in the financial model used for this TRS. The P&L projections of the individual mines of Alpha’s Virginia operations are then consolidated into a P&L and cash flow schedule for further testing of the economics. Projected debt service is excluded from the P&L and cash flow model in order to determine Enterprise Value of the aggregated entity.

Alpha Metallurgical Resources, Inc. Statement of Coal Resources and Reserves for the Virginia Complex in Accordance with United States SEC Standards as of December 31, 2023 Central Appalachian Coal Basin Virginia, USA MARSHALL MILLER & ASSOCIATES, INC. 80 The financial model expresses coal sales prices, operating costs, and capital expenditures in current day dollars without adjustment for inflation. Capital expenditures and reclamation costs are included based on engineering estimates for each mine by year. MM&A also included an estimate of administrative costs in the financial projections. Alpha will pay royalties for the various current and projected operations. The royalty rates vary by location as provided by Alpha. The royalty rates were assumed to be 5.0% of the sales revenue. The projection model also includes consolidated income tax calculations at Alpha’s Virginia Division level, incorporating statutory depletion calculations, as well as state income taxes, and a federal tax rate of 21%. To the extent the Alpha mines generate net operating losses for tax purposes, the losses are carried over to offset future taxable income from Alpha mines. The terms “cash flows” and “project cash flows” used in this report refer to after-tax cash flows. Alpha’s projected consolidated annual revenue for the Virginia operations is shown in the chart below: Figure 19-2: Consolidated Annual Revenue Projected consolidated revenue, cash costs, and EBITDA for the Virginia operations are expressed in dollars per ton in the graph below. Alpha Metallurgical Resources, Inc. Statement of Coal Resources and Reserves for the Virginia Complex in Accordance with United States SEC Standards as of December 31, 2023 Central Appalachian Coal Basin Virginia, USA MARSHALL MILLER & ASSOCIATES, INC. 81 Figure 19-3: Revenue, Cash Costs, and EBITDA The above chart shows an assumed average revenue of $125 per ton, cash costs of $81 to $104 per ton and EBITDA of $20 to $45 per ton. Positive EBITDA per ton averages $33.31 per ton over the life of the operations. Table 19-1 shows LOM tonnage, P&L, and EBITDA for each Alpha mine at Virginia. Table 19-1: Life-of-Mine Tonnage, P&L before Tax, and EBITDA LOM Tonnage LOM Pre-Tax P&L P&L Per Ton LOM EBITDA EBITDA Per Ton Underground Mines DM 41-42-Black Dog (Jawbone) 37,355 $844,960 $22.62 $1,356,847 $36.32 Long Branch Deep (L. Banner) 729 $34,422 $47.24 $39,024 $53.55 DM44 (Lower Banner) 465 $1,250 $2.69 $6,007 $12.93 DM43 (Jawbone Rider) 21,901 $210,289 $9.60 $558,027 $25.48 Ball Ridge DM46 (L. Banner) 1,282 $33,105 $25.82 $43,388 $33.84 Bear Ridge (Upper Banner) 105 $974 $9.31 $1,329 $12.71 Consolidated Deep Mines 61,835 $1,125,000 $18.19 $2,004,621 $32.42

Alpha Metallurgical Resources, Inc. Statement of Coal Resources and Reserves for the Virginia Complex in Accordance with United States SEC Standards as of December 31, 2023 Central Appalachian Coal Basin Virginia, USA MARSHALL MILLER & ASSOCIATES, INC. 82 LOM Tonnage LOM Pre-Tax P&L P&L Per Ton LOM EBITDA EBITDA Per Ton Surface Mines Long Branch 228 ($8,921) ($39.20) ($1,319) ($5.80) 88 Strip 4,287 $47,474 $11.07 $120,152 $28.03 Consolidated Surface Mines 4,515 $38,553 $8.54 $118,832 $26.32 HWM Operations Long Branch HWM 738 $19,898 $26.97 $38,250 $51.84 88 Strip HWM 2,783 $150,671 $54.13 $165,703 $59.53 Consolidated HWMs 3,521 $170,569 $48.44 $203,953 $57.92 Grand Total 69,871 $1,334,121 $19.09 $2,327,407 $33.31 Note: (1) LOM tonnage evaluated in the financial model includes October 2023 through December 2023 production for underground mines and July 2023 through December 2023 production for surface mines production (1.12 million total clean tons) which was subtracted from coal reserves in order to make the effective date of the reserves December 31, 2023. As shown in Table 19-1, all of the mines analyzed show positive EBITDA over the LOM. Overall, the Alpha consolidated Virginia operations show positive LOM P&L and EBITDA of $1.3 billion and $2.3 billion, respectively. The breakdown of projected EBITDA for the consolidated Virginia operations is shown in the chart below: Figure 19-4: Annual EBITDA Alpha Metallurgical Resources, Inc. Statement of Coal Resources and Reserves for the Virginia Complex in Accordance with United States SEC Standards as of December 31, 2023 Central Appalachian Coal Basin Virginia, USA MARSHALL MILLER & ASSOCIATES, INC. 83 19.1.2 Cash Flow Summary Alpha’s consolidated Virginia cash flow summary in constant dollars, excluding debt service, is shown in Table 19-2 below. Table 19-2: Project Cash Flow Summary (000) YE 12/31 YE 12/31 YE 12/31 YE 12/31 YE 12/31 YE 12/31 Total 2023 2024 2025 2026 2027 2028 Production & Sales tons 69,871 1,049 2,991 3,639 3,473 3,494 3,173 Total Revenue $8,736,279 $132,872 $375,442 $457,763 $436,893 $440,937 $401,144 EBITDA $2,327,407 $47,516 $98,172 $150,138 $129,938 $139,281 $125,826 Net Income $1,090,302 $35,806 $59,513 $96,252 $81,452 $85,112 $70,780 Net Cash Provided by Operating Activities $2,083,587 $29,989 $75,981 $117,142 $113,894 $117,169 $110,011 Purchases of Property, Plant, and Equipment ($892,646) $0 ($37,333) ($33,306) ($47,613) ($51,149) ($62,343) Net Cash Flow $1,190,941 $29,989 $38,648 $83,836 $66,281 $66,019 $47,668 YE 12/31 YE 12/31 YE 12/31 YE 12/31 YE 12/31 YE 12/31 YE 12/31 2029 2030 2031 2032 2033 2034 2035 Production & Sales tons 2,857 2,766 2,748 2,376 2,162 2,065 2,096 Total Revenue $360,367 $349,158 $346,869 $298,348 $268,886 $256,742 $260,589 EBITDA $94,611 $97,030 $94,086 $72,063 $66,163 $61,052 $62,116 Net Income $41,501 $40,348 $39,913 $20,028 $13,960 $15,118 $18,622 Net Cash Provided by Operating Activities $91,472 $89,227 $88,257 $73,008 $63,660 $60,152 $59,760 Purchases of Property, Plant, and Equipment ($48,685) ($30,985) ($22,070) ($37,542) ($58,580) ($15,065) ($43,200) Net Cash Flow $42,787 $58,242 $66,187 $35,466 $5,080 $45,087 $16,559 YE 12/31 YE 12/31 YE 12/31 YE 12/31 YE 12/31 YE 12/31 YE 12/31 2036 2037 2038 2039 2040 2041 2042 Production & Sales tons 2,183 2,170 2,106 2,356 2,273 2,243 2,224 Total Revenue $271,511 $269,793 $261,909 $292,967 $282,684 $278,872 $276,558 EBITDA $70,963 $69,221 $65,351 $87,795 $82,979 $78,517 $75,844 Net Income $32,262 $28,979 $22,134 $43,305 $45,002 $38,106 $37,913 Net Cash Provided by Operating Activities $56,442 $61,336 $59,762 $75,101 $76,023 $71,819 $69,380 Purchases of Property, Plant, and Equipment ($15,490) ($39,518) ($47,166) ($26,142) ($18,729) ($29,768) ($29,043) Net Cash Flow $40,952 $21,818 $12,596 $48,959 $57,294 $42,051 $40,338 YE 12/31 YE 12/31 YE 12/31 YE 12/31 YE 12/31 YE 12/31 YE 12/31 2043 2044 2045 2046 2047 2048 2049 Production & Sales tons 2,263 2,232 1,862 1,702 1,786 1,811 1,579 Total Revenue $281,377 $277,527 $231,517 $211,631 $222,124 $225,263 $196,380 EBITDA $80,014 $74,350 $43,761 $34,631 $43,741 $45,877 $50,040 Net Income $37,677 $36,406 $14,532 $8,615 $14,275 $14,689 $21,001 Net Cash Provided by Operating Activities $71,561 $68,995 $47,641 $35,439 $39,373 $42,494 $46,688 Purchases of Property, Plant, and Equipment ($40,050) ($18,023) ($18,093) ($8,163) ($29,333) ($39,202) ($11,520) Net Cash Flow $31,511 $50,972 $29,549 $27,276 $10,040 $3,291 $35,168 YE 12/31 YE 12/31 YE 12/31 YE 12/31 YE 12/31 YE 12/31 YE 12/31 2050 2051 2052 2053 2054 2055 2056 Production & Sales tons 1,215 956 994 754 486 476 493 Total Revenue $151,084 $118,939 $123,633 $93,734 $60,404 $59,147 $61,368 EBITDA $38,443 $26,510 $30,406 $24,364 $13,552 $12,650 $14,219 Net Income $16,845 $13,824 $16,422 $8,771 $1,413 $5,216 $6,553 Net Cash Provided by Operating Activities $39,650 $25,647 $27,000 $24,347 $16,507 $13,256 $13,524 Purchases of Property, Plant, and Equipment $0 ($4,320) ($8,844) ($16,706) ($344) $0 ($4,320) Net Cash Flow $39,650 $21,327 $18,156 $7,641 $16,163 $13,256 $9,204

Alpha Metallurgical Resources, Inc. Statement of Coal Resources and Reserves for the Virginia Complex in Accordance with United States SEC Standards as of December 31, 2023 Central Appalachian Coal Basin Virginia, USA MARSHALL MILLER & ASSOCIATES, INC. 84 YE 12/31 YE 12/31 YE 12/31 YE 12/31 YE 12/31 YE 12/31 YE 12/31 2057 2058 2059 2060 2061 2062 2063 Production & Sales tons 538 281 0 0 0 0 0 Total Revenue $66,859 $34,987 $0 $0 $0 $0 $0 EBITDA $19,327 $9,279 ($1,382) ($547) ($276) ($141) ($73) Net Income $10,140 $2,654 ($2,764) ($1,094) ($552) ($281) ($146) Net Cash Provided by Operating Activities $16,695 $13,865 ($11,208) ($3,736) ($1,868) ($934) ($934) Purchases of Property, Plant, and Equipment $0 $0 $0 $0 $0 $0 $0 Net Cash Flow $16,695 $13,865 ($11,208) ($3,736) ($1,868) ($934) ($934) Notes: (1) LOM tonnage evaluated in the financial model includes October 2023 through December 2023 production for underground mines and July 2023 through December 2023 production for surface mines (1.12 million total clean tons) which was subtracted from coal reserves in order to make the effective date of the reserves December 31, 2023. (2) Results shown for 2023 represent 4th quarter only. Consolidated cash flows are driven by annual sales tonnage, which grows from 3.0 million tons in 2024 to a peak of 3.6 million tons in 2025. Between years 2026 and 2044, sales ranges from 2.1 million to 3.5 million tons and between years 2045-2058, sales range from 0.3 million tons to 1.9 million tons. Projected consolidated revenue grows from $375.4 million in 2024 to a peak of $457.8 million in 2025. Revenue totals $8.7 billion for the project’s life. Consolidated cash flow from operations is positive throughout the projected operating period, with the exception of post-production years, due to end-of-mine reclamation spending. Consolidated cash flow from operations peaks at $117.2 million in 2027 and totals $2.1 billion over the project life. Capital expenditures total $231.7 million during the first five years and $892.6 million over the project’s life. Consolidated Virginia net cash flow after tax, but before debt service, is shown by year in the chart below: Alpha Metallurgical Resources, Inc. Statement of Coal Resources and Reserves for the Virginia Complex in Accordance with United States SEC Standards as of December 31, 2023 Central Appalachian Coal Basin Virginia, USA MARSHALL MILLER & ASSOCIATES, INC. 85 Figure 19-5: Net Cash Flow after Tax (Before Debt Service) LOM Net cash flow is positive for this project. The cash flows after year 2058 are generally related to end of mine reclamation expenditures, which are accrued over the life of the mines. 19.1.3 Discounted Cash Flow Analysis Cash flow after tax, but before debt service, generated over the life of the project was discounted to NPV at a 16.57% discount rate, which represents MM&A’s estimate of the constant dollar, risk adjusted WACC for likely market participants if the subject reserves were offered for sale. On an un-levered basis, the NPV of the project cash flows represents the Enterprise Value of the project and amounts to $356.9 million. Alpha is an active producer, and the financial model shows positive net cash flow for each year of the operating life of the Virginia reserves. The pre-feasibility financial model prepared for the TRS was developed to test the economic viability of each coal resource area. The NPV estimate was made for the purpose of confirming the economics for classification of coal reserves and not for purposes of valuing Alpha or its Virginia assets. Mine plans were not optimized, and actual results of the operations may be different, but in all cases, the mine production plan assumes the properties are under competent management. 19.1.4 Sensitivity Analysis Sensitivity of the NPV results to changes in the key drivers is presented in the chart below. The sensitivity study shows the NPV at the 16.57% discount rate when Base Case sales prices, operating

Alpha Metallurgical Resources, Inc. Statement of Coal Resources and Reserves for the Virginia Complex in Accordance with United States SEC Standards as of December 31, 2023 Central Appalachian Coal Basin Virginia, USA MARSHALL MILLER & ASSOCIATES, INC. 86 costs, capital costs and discount rate are increased and decreased in increments of 5% within a +/- 15% range. Figure 19-6: Sensitivity of NPV As shown, NPV is quite sensitive to changes in sales price and operating cost estimates, and slightly sensitive to changes in capital cost estimates. 20 Adjacent Properties 20.1 Information Used No Proprietary information associated with neighboring properties was used as part of this study. 21 Other Relevant Data and Information MM&A performed a previous evaluation of all the Property in year 2021 for reserves effective as of December 31, 2021, for Alpha based on SEC S-K 1300 regulations. MM&A utilized this former evaluation as the basis for the December 31, 2023 TRS. Alpha Metallurgical Resources, Inc. Statement of Coal Resources and Reserves for the Virginia Complex in Accordance with United States SEC Standards as of December 31, 2023 Central Appalachian Coal Basin Virginia, USA MARSHALL MILLER & ASSOCIATES, INC. 87 22 Interpretation and Conclusions 22.1 Conclusion Sufficient data has been obtained through various exploration and sampling programs and mining operations to support the geological interpretations of seam structure and thickness for coal horizons situated on the Virginia Property. The data is of sufficient quantity and reliability to reasonably support the coal resource and coal reserve estimates in this TRS. The geological data and preliminary feasibility study, which consider mining plans, revenue, and operating and capital cost estimates are sufficient to support the classification of coal reserves provided herein. This geologic evaluation conducted in conjunction with the preliminary feasibility study is sufficient to conclude that the 68.75 Mt of marketable coal reserves identified on the Property are economically mineable under reasonable expectations of market prices for metallurgical coal products, estimated operation costs, and capital expenditures. 22.2 Risk Factors Risks have been identified for operational, technical and administrative subjects addressed in the Pre- Feasibility Study. A risk matrix has been constructed to present the risk levels for all the risk factors identified and quantified in the risk assessment process. The risk matrix and risk assessment process are modelled to that presented in the Australian and New Zealand Standard on Risk Management (AS/NZS 4360). The purpose of the characterization of the project risk components is to inform the project stakeholders of key aspects of the Alpha projects that can be impacted by events whose consequences can affect the success of the venture. The significance of an impacted aspect of the operation is directly related to both the probability of occurrence and the severity of the consequences. The initial risk for a risk factor is herein defined as the risk level after the potential impact of the risk factor is addressed by competent and prudent management utilizing control measures readily available. Residual risk for a risk factor is herein defined as the risk level following application of special mitigation measures if management determines that the initial risk level is unacceptable. Initial risk and residual risk can be quantified numerically, derived by the product of values assigned to probability and consequence ranging from very low risk to very high risk. The probability and consequence parameters are subjective numerical estimates made by practiced mine engineers and managers. Both are assigned values from 1 to 5 for which the value 1 represents the lowest probability and least consequence, and the value 5 represents the highest probability and

Alpha Metallurgical Resources, Inc. Statement of Coal Resources and Reserves for the Virginia Complex in Accordance with United States SEC Standards as of December 31, 2023 Central Appalachian Coal Basin Virginia, USA MARSHALL MILLER & ASSOCIATES, INC. 88 greatest consequence. The products which define the Risk Level, are classified from very low to very high. Risk Level Table (R = P x C) Risk Level (R) Very Low (1 to 2) Low (3 to 5) Moderate (6 to 11) High (12 to 19) Very High (20 to 25) Risk aspects identified and evaluated during this assignment total 15. No residual risks are rated Very High. Three (3) residual risks are rated High. Six (6) of the risk aspects could be associated with Moderate residual risk. Four (4) of the risk aspects were attributed Low or Very Low residual risks. 22.2.1 Governing Assumptions The listing of the aspects is not presumed to be exhaustive. Instead that listing is presented based on the experiences of the contributors to the TRS. 1. The probability and consequence ratings are subjectively assigned, and it is assumed that this subjectivity reasonably reflects the condition of the active and projected mine operations. 2. The Control Measures shown in the matrices presented in this chapter are not exhaustive. They represent a condensed collection of activities that the author of the risk assessment section has observed to be effective in coal mining scenarios. 3. Mitigation Measures listed for each risk factor of the operation are not exhaustive. The measures listed, however, have been observed by the author to be effective. 4. The monetary values used in ranking the consequences are generally-accepted quantities for the coal mining industry. 22.2.2 Limitations The risk assessment proposed in this report is subject to the limitations of the information currently collected, tested, and interpreted at the time of the writing of the report. 22.2.3 Methodology The numerical quantities (i.e., risk levels) attributable to either “initial” or “residual” risks are derived by the product of values assigned to probability and consequence ranging from very low risk to very high risk. Alpha Metallurgical Resources, Inc. Statement of Coal Resources and Reserves for the Virginia Complex in Accordance with United States SEC Standards as of December 31, 2023 Central Appalachian Coal Basin Virginia, USA MARSHALL MILLER & ASSOCIATES, INC. 89 R = P x C Where: R = Risk Level P = Probability of Occurrence C = Consequence of Occurrence The Probability (P) and Consequence (C) parameters recited in the formula are subjective numerical estimates made by practiced mine engineers and managers. Both P and C are assigned integer values ranging from 1 to 5 for which the value 1 represents the lowest probability and least consequence, and the value 5 represents the highest probability and greatest consequence. The products (R = P x C) which define the Risk Level, are thereafter classified from very low to very high. Risk Level Table Risk Level (R) Very Low (1 to 2) Low (3 to 5) Moderate (6 to 11) High (12 to 19) Very High (20 to 25) Very high initial risks are considered to be unacceptable and require corrective action well in advance of project development. In short, measures must be applied to reduce very high initial risks to a tolerable level. As shown and discussed above, after taking into account the operational, technical, and administrative actions that have been applied or are available for action when required, the residual risk can be determined. The residual risk provides a basis for the management team to determine if the residual risk level is acceptable or tolerable. If the risk level is determined to be unacceptable, further actions should be considered to reduce the residual risk to acceptable or tolerable levels to provide justification for continuation of the proposed operation. 22.2.4 Development of the Risk Matrix Risks have been identified for the technical, operational, and administrative subjects addressed in the TRS. The risk matrix and risk assessment process are modelled to that presented in the Australian and New Zealand Standard on Risk Management (AS/NZS 4360).

Alpha Metallurgical Resources, Inc. Statement of Coal Resources and Reserves for the Virginia Complex in Accordance with United States SEC Standards as of December 31, 2023 Central Appalachian Coal Basin Virginia, USA MARSHALL MILLER & ASSOCIATES, INC. 90 22.2.4.1 Probability Level Table Table 22-1: Probability Level Table Category Probability Level (P) 1 Remote Not likely to occur except in exceptional circumstances. <10% 2 Unlikely Not likely to occur; small in degree. 10 - 30% 3 Possible Capable of occurring. 30 - 60% 4 Likely High chance of occurring in most circumstances. 60 - 90% 5 Almost Certain Event is expected under most circumstances; impossible to avoid. >90% The lowest rated probability of occurrence is assigned the value of 1 and described as remote, with a likelihood of occurrence of less than 10 percent. Increasing values are assigned to each higher probability of occurrence, culminating with the value of 5 assigned to incidents considered to be almost certain to occur. 22.2.4.2 Consequence Level Table Table 22-2 lists the consequence levels. Alpha Metallurgical Resources, Inc. Statement of Coal Resources and Reserves for the Virginia Complex in Accordance with United States SEC Standards as of December 31, 2023 Central Appalachian Coal Basin Virginia, USA MARSHALL MILLER & ASSOCIATES, INC. 91 Table 22-2: Consequence Level Table Correlation of Events in Key Elements of the Project Program to Event Severity Category Category Severity of the Event Financial Impact of the Event Unplanned Loss of Production (Impact on Commercial Operations) Events Impacting on the Environment Events Affecting the Program's Social and Community Relations Resultant Regulatory / Sovereign Risk Events Affecting Occupational Health & Safety 1 Insignificant < USD $0.5 million ≤ 12 hours Insignificant loss of habitat; no irreversible effects on water, soil and the environment. Occasional nuisance impact on travel. Event recurrence avoided by corrective action through established procedures (Engineering, guarding, training). 2 Minor USD $0.5 million to $2.0 million ≤ 1 day No significant change to species populations; short- term reversible perturbation to ecosystem function. Persistent nuisance impact on travel. Transient adverse media coverage. First aid – lost time. Event recurrence avoided by corrective action thought established procedures. 3 Moderate USD $2.0 million to $10.0 million ≤ 1 week Appreciable change to species population; medium-term (≤10 years) detriment to ecosystem function. Measurable impact on travel and water/air quality. Significant adverse media coverage / transient public outrage. Uncertainty securing or retaining essential approval / license. Medical Treatment – permanent incapacitation Avoiding event recurrence requires modification to established corrective action procedures. Change to regulations (tax; bonds; standards). 4 Major USD $10.0 million to $50.0 million 1 to 2 weeks Change to species population threatening viability; long-term (>10 years) detriment to ecosystem function. Long-term, serious impact on travel and use of water resources; degradation of air quality; sustained and effective public opposition. Suspension / long-delay in securing essential approval / license. Fatality. Avoiding event recurrence requires modification to established corrective action procedures and staff retraining. Change to laws (tax; bonds; standards). 5 Critical >USD $50.0 million >1 month Species extinction; irreversible damage to ecosystem function. Loss of social license. Withdraw / failure to secure essential approval / license. Multiple fatalities. Avoiding event recurrence requires major overhaul of policies and procedures.

Alpha Metallurgical Resources, Inc. Statement of Coal Resources and Reserves for the Virginia Complex in Accordance with United States SEC Standards as of December 31, 2023 Central Appalachian Coal Basin Virginia, USA MARSHALL MILLER & ASSOCIATES, INC. 92 The lowest rated consequence is assigned the value of 1 and is described as Insignificant Consequence parameters include non-reportable safety incidents with zero days lost accidents, no environmental damage, loss of production or systems for less than 12 hours and cost of less than USD $0.5 million. Increasing values are assigned to each higher consequence, culminating with the value of 5 assigned to critical consequences, the parameters of which include multiple-fatality accidents, major environmental damage, and loss of production or systems for longer than one month and cost of greater than USD $50.0 million. Composite Risk Matrix R = P x C and Color-Code Convention The risk level, defined as the product of probability of occurrence and consequence, ranges in value from 1 (lowest possible risk) to 25 (maximum risk level). The values are color-coded to facilitate identification of the highest risk aspects. Table 22-3: Risk Matrix P x C = R Consequence (C) Insignificant Minor Moderate Major Critical 1 2 3 4 5 P ro b ab ili ty L ev el ( P ) Remote 1 1 2 3 4 5 Unlikely 2 2 4 6 8 10 Possible 3 3 6 9 12 15 Likely 4 4 8 12 16 20 Almost Certain 5 5 10 15 20 25 22.2.5 Categorization of Risk Levels and Color Code Convention Very high risks are considered to be unacceptable and require corrective action. Risk reduction measures must be applied to reduce very high risks to a tolerable level. 22.2.6 Description of the Coal Property The Virginia Mine Complex (Virginia) is located in located in Dickenson, Buchanan, Russell, and Wise Counties, Virginia – is an active operation with three underground mines and two Surface mines. The active underground operations within the Virginia Mine Complex (Deep Mine 41, Deep Mine 44, and Bear Ridge) utilize continuous mining production sections. The method provides continuity, preserving skilled work groups and enabling effective utilization of production equipment. The other active and Alpha Metallurgical Resources, Inc. Statement of Coal Resources and Reserves for the Virginia Complex in Accordance with United States SEC Standards as of December 31, 2023 Central Appalachian Coal Basin Virginia, USA MARSHALL MILLER & ASSOCIATES, INC. 93 projected mines are located above drainage and as such are accessed via drifts. The two active surface mining operations include the Long Branch and 88 Strip. Deep Mine 41 is located below drainage and is accessed by a slope and shaft. Deep Mine 43 will be accessed by a slope and shaft as well. 22.2.7 Summary of Residual Risk Ratings Each risk factor is numbered, and a risk level for each is determined by multiplying the assigned probability by the assigned consequence. The risk levels are plotted on a risk matrix to provide a composite view of the Alpha risk profile. The average risk level is 7.6, which is defined as Moderate. Table 22-4: Risk Assessment Matrix C o n se q u en ce Critical >$50 MM Major $10-50MM 9 6,15 Moderate $2-10 MM 1, 12 8, 14 2, 3, 4 Minor $0.5-$2 MM 13 5, 7, 10 Low <$0.5 MM 11 <10% 10-30% 30-60% 60-90% >90% Remote Unlikely Possible Likely Almost Certain 22.2.8 Risk Factors A high-level approach is utilized to characterize risk factors that are generally similar across a number of the active and proposed mining operations. Risk factors that are unique to a specific operation or are particularly noteworthy are addressed individually. 22.2.8.1 Geological and Coal Resource Coal mining is accompanied by risk that, despite exploration efforts, mining areas will be encountered where geological conditions render extraction of the resource to be uneconomic, or that coal quality characteristics disqualify the product for sale into target markets. Offsetting the geological and coal resource risk are the size of the controlled property which allows flexibility in the selection of mine areas away from areas where coal quality and mineability are less favorable. In addition, many of the underground mines are designed to operate with multiple production sections each, which lessens the immediate impact when one section encounters difficulties. The large reserve areas also provide a mitigation strategy of varying the timing of

Alpha Metallurgical Resources, Inc. Statement of Coal Resources and Reserves for the Virginia Complex in Accordance with United States SEC Standards as of December 31, 2023 Central Appalachian Coal Basin Virginia, USA MARSHALL MILLER & ASSOCIATES, INC. 94 development of mines to offset expected or encountered adverse conditions, thereby maintaining consistent production and quality. This flexibility requires additional extension or development cost but increases performance consistency. The larger reserve areas will be developed with multiple production sections and the small, replacement production reserve areas provide ready access to alternative locations if geological and coal resource characteristics require abandonment of an active production area. Table 22-5: Geological and Coal Resource Risk Assessment (Risks 1 and 2) Aspect Impact Control Measures Initial Risk Level Mitigation Measures Residual Risk Level P C R P C R Recoverable coal tons recognized to be significantly less than previously estimated. Reserve base is adequate to serve market commitments and respond to opportunities for many years. Local adverse conditions may increase frequency and cost of production unit relocations. Previous and ongoing exploration and extensive regional mining history provide a high level of confidence of coal seam correlation, continuity of the coal seams, and coal resource tons. 1 4 4 Optimize mine plan to increase resource recovery; develop mine plan to provide readily available alternate mining locations to sustain expected production level. 1 3 3 Coal quality locally proves to be lower than initially projected. If uncontrolled, production and sale of coal that is out of specification can result in rejection of deliveries, cancellation of coal sales agreements and damage to reputation. Clean coal quality related to surface mines is largely justified by historical trends as opposed to exploration data. Exploration and vast experience and history in local coal seams provide confidence in coal quality; limited excursions can be managed with careful product segregation and blending. 3 5 15 Develop mine plan to provide readily available alternate mining locations to sustain expected production level; modify coal sales agreements to reflect coal quality. 3 3 9 22.2.8.2 Environmental Water quality and other permit requirements are subject to modification and such changes could have a material impact on the capability of the operator to meet modified standards or to receive new permits and modifications to existing permits. Permit protests may result in delays or denials to permit applications. Environmental standards and permit requirements have evolved significantly over the past 50 years and to-date, mining operators and regulatory bodies have been able to adapt successfully to evolving environmental requirements. Alpha Metallurgical Resources, Inc. Statement of Coal Resources and Reserves for the Virginia Complex in Accordance with United States SEC Standards as of December 31, 2023 Central Appalachian Coal Basin Virginia, USA MARSHALL MILLER & ASSOCIATES, INC. 95 Table 22-6: Environmental (Risks 3 and 4) Aspect Impact Control Measures Initial Risk Level Mitigation Measures Residual Risk Level P C R P C R Environmental performance standards are modified in the future. Delays in receiving new permits and modifications to existing permits; cost of testing and treatment of water and soils Work with regulatory agencies to understand and influence final standards; implement testing, treatment and other actions to comply with new standards. 3 4 12 Modify mining and reclamation plans to improve compliance with new standards while reducing cost of compliance. 3 3 9 New permits and permit modifications are increasingly delayed or denied. Interruption of production and delayed implementation of replacement production from new mines. Comply quickly with testing, treatment and other actions required; continue excellent compliance performance within existing permits. 3 4 12 Establish and maintain close and constructive working relationships with regulatory agencies, local communities and community action groups. 3 3 9 22.2.8.3 Regulatory Requirements Federal and state health and safety regulatory agencies occasionally amend mine laws and regulations. The impact is industry wide. Mining operators and regulatory agencies have been able to adapt successfully to evolving health and safety requirements. Table 22-7: Regulatory Requirements (Risk 5) Aspect Impact Control Measures Initial Risk Level Mitigation Measures Residual Risk Level P C R P C R Federal and state mine safety and health regulatory agencies amend mine laws and regulations. Cost of training, materials, supplies and equipment; modification of mine examination and production procedures; modification of mining plans. Participate in hearings and workshops when possible to facilitate understanding and implementation; work cooperatively with agencies and employees to facilitate implementation of new laws and regulations. 4 3 12 Familiarity and experience with new laws and regulations results in reduced impact to operations and productivity and improved supplies and equipment options. 4 2 8 22.2.8.4 Market and Transportation Most of the current and future production is expected to be directed to domestic and international metallurgical markets. Historically the metallurgical markets have been cyclical and highly volatile. Table 22-8: Market and Transportation (Risk 6) Aspect Impact Control Measures Initial Risk Level Mitigation Measures Residual Risk Level P C R P C R Volatile coal prices drop precipitously. Loss of revenue adversely affects profitability; reduced cash flow may disrupt capital expenditures plan. Cost control measures implemented; capital spending deferred. 4 5 20 High-cost operations closed, and employees temporarily furloughed. 4 4 16

Alpha Metallurgical Resources, Inc. Statement of Coal Resources and Reserves for the Virginia Complex in Accordance with United States SEC Standards as of December 31, 2023 Central Appalachian Coal Basin Virginia, USA MARSHALL MILLER & ASSOCIATES, INC. 96 Occasional delay or interruption of rail, river and terminals service may be expected. The operator can possibly minimize the impact of delays by being a preferred customer by fulfilling shipment obligations promptly and maintaining close working relationships. Table 22-9: Market and Transportation (Risk 7) Aspect Impact Control Measures Initial Risk Level Mitigation Measures Residual Risk Level P C R P C R Rail or river transport is delayed; storage and shipping access at river and ocean terminals is not available. Fulfillment of coal sales agreements delayed; limited coal storage at mines may increase cost of rehandling; production may be temporarily idled. Provide adequate storage capacity at mines; coordinate continuously with railroad and shipping companies to respond quickly and effectively to changing circumstances. 4 3 12 Provide back-up storage facility along with personnel, equipment and rehandle plan to sustain production and fulfill sales obligations timely. 4 2 8 22.2.8.5 Mining Plan Occupational health and safety risks are inherent in mining operations. Comprehensive training and retraining programs, internal safety audits and examinations, regular mine inspections, safety meetings, along with support of trained fire brigades and mine rescue teams are among activities that greatly reduce accident risks. Employee health monitoring programs coupled with dust and noise monitoring and abatement reduce health risks to miners. As underground mines are developed and extended, observation of geological, hydrogeological and geotechnical conditions leads to modification of mine plans and procedures to enable safe work within the mine environments. Highlighted below are selected examples of safety and external factors relevant to Alpha’s operations. 22.2.8.5.1 Methane Management Coalbed methane is potentially present in coal operations; however, the methane concentration in shallow coal seams is at such low levels that it can be readily managed with frequent testing and monitoring, vigilance, and routine mine ventilation. Methane is not expected to be present in most of the Virginia property. Alpha Metallurgical Resources, Inc. Statement of Coal Resources and Reserves for the Virginia Complex in Accordance with United States SEC Standards as of December 31, 2023 Central Appalachian Coal Basin Virginia, USA MARSHALL MILLER & ASSOCIATES, INC. 97 Table 22-10: Methane Management (Risk 8) Aspect Impact Control Measures Initial Risk Level Mitigation Measures Residual Risk Level P C R P C R Methane hazard is present in mines operating below drainage. Injury or loss of life; possible ignition of gas and mine explosion; potential loss of mine and equipment temporarily or permanently; additional mine fan, mine power, ventilation, monitoring and examination requirements. Low to moderate levels can be managed with frequent examinations, testing and monitoring within the mine ventilation system. Excellent rock dust maintenance minimizes explosion propagation risk should an ignition occur. 2 5 10 Very high-level methane concentrations may require coal seam degasification and gob degasification where pillar extraction methods are employed. 2 3 6 22.2.8.5.2 Mine Fires Mine fires, once common at mine operations, are rare today. Most active coal miners have not encountered a mine fire. Vastly improved mine power and equipment electrical systems, along with safe mine practices reduce mine fire risks. Crew training and fire brigade support and training improve response for containment and control if a fire occurs. Spontaneous combustion within coal mines, which is the source of most fires that occur today, is not expected to commonly occur at the Alpha property. When spontaneous combustion conditions are present, monitoring systems are employed for early detection and mine plans are designed to facilitate isolation, containment and rapid extinguishment. Table 22-11: Mine Fires (Risk 9) Aspect Impact Control Measures Initial Risk Level Mitigation Measures Residual Risk Level P C R P C R Mine fire at underground operation or plant stockpile fire. Injury or loss of life; potential loss of mine temporarily or permanently; damage to equipment and mine infrastructure. Inspection and maintenance of mine power, equipment and mine infrastructure; good housekeeping; frequent examination of conveyor belt entries; prompt removal of accumulations of combustible materials. 1 5 5 If spontaneous combustion conditions are present, enhanced monitoring and examination procedures will be implemented; mine design will incorporate features to facilitate isolation, containment and extinguishment of spontaneous combustion locations. 1 4 4 22.2.8.5.3 Ground Control Underground mining exposes miners to the risks of roof falls and rib rolls. Ground control-based risks can be mitigated through effective roof control plans which are supplemented with a strong understanding of future geotechnical conditions. Foremen and crews should be trained to examine the

Alpha Metallurgical Resources, Inc. Statement of Coal Resources and Reserves for the Virginia Complex in Accordance with United States SEC Standards as of December 31, 2023 Central Appalachian Coal Basin Virginia, USA MARSHALL MILLER & ASSOCIATES, INC. 98 roof, rib and floor conditions and identify pending and immediate hazards. Multiple publicly available software programs can be used to assess pillar sizing and stability. Table 22-12: Ground Control (Risk 10) Aspect Impact Control Measures Initial Risk Level Mitigation Measures Residual Risk Level P C R P C R Ground control issues cause roof failures, rib rolls, floor heave, etc. Injury or loss of life; catastrophic damage to equipment; production interruption. Regular inspection for change and signs of failure. Dynamic design of roof control plan and safety measures to honor observed conditions and exploration- based information; conservative pillar design. 4 3 12 Multiple operating sections to mitigate any lost production; availability of new working areas in case abandonment of section is required; availability of alternative roof control technologies in case of abrupt changes in mining conditions. 4 2 8 22.2.8.5.4 Availability of Supplies and Equipment The industry has periodically experienced difficulty receiving timely delivery of mine supplies and equipment. Availability issues often accompanied increased periods for coal demand. Any future delivery of supplies and equipment delays are expected to be temporary with limited impact on production. Table 22-13: Availability of Supplies and Equipment (Risk 11) Aspect Impact Control Measures Initial Risk Level Mitigation Measures Residual Risk Level P C R P C R Disruption of availability for supplies and equipment. Temporary interruption of production. Force majeure provision in coal sales agreements to limit liability for delayed or lost sales. 3 2 6 Work closely with customers to assure delayed coal delivery rather than cancelled sales; monitory external conditions and increase inventory of critical supplies; accelerate delivery of equipment when possible. 3 1 3 22.2.8.5.5 Labor Work stoppage due to labor protests are considered to be unlikely and accompanied by limited impact should it occur. Strong employee relations and communications limit the exposure to outside protesters. Loss of supervisors and skilled employees to retirement is inevitable; the impact can be lessened with succession planning, training and mentorship of new employees. Alpha Metallurgical Resources, Inc. Statement of Coal Resources and Reserves for the Virginia Complex in Accordance with United States SEC Standards as of December 31, 2023 Central Appalachian Coal Basin Virginia, USA MARSHALL MILLER & ASSOCIATES, INC. 99 Table 22-14: Labor – Work Stoppage (Risk 12) Aspect Impact Control Measures Initial Risk Level Mitigation Measures Residual Risk Level P C R P C R Work stoppage due to slowdowns or secondary boycott activity. Loss of production and coal sales; damaged customer and employee relations; reputation loss. Maintain excellent employee relations and communications; maintain frequent customer communications. 2 3 6 Develop plan for employee communications and legal support to minimize impact of secondary boycott activities. 1 3 3 Table 22-15: Labor – Retirement (Risk 13) Aspect Impact Control Measures Initial Risk Level Mitigation Measures Residual Risk Level P C R P C R Retirement of supervisors and skilled employees. Loss of leadership and critical skills to sustain high levels of safety, maintenance and productivity. Monitor demographics closely and maintain communications with employees who are approaching retirement age; maintain employee selection and training programs. 3 3 9 Maintain selection of candidates and implementation of in-house or third-party training for electricians and mechanics; develop employee mentoring program. 3 2 6 22.2.8.6 Comprehensive Health and Safety While largely incorporated in mine plan-based risk factors, effective health and safety programs reduce the risk of accidents, associated loss of production and fines. Currently, coal mining and processing requires a robust health and safety team, consisting of executive level health and safety roles, regional health and safety managers, and multiple operational level health and safety coordinators. Table 22-16: Health and Safety (Risk 14) Aspect Impact Control Measures Initial Risk Level Mitigation Measures Residual Risk Level P C R P C R Failure to attain operations safety standards and associated occurrence of accidents. Injuries and possible loss of life; damage to morale and workforce confidence; loss of production and diminished productivity; regulatory issues, closures and fines; reputation loss. Safety and loss control awareness training to help employees recognize hazardous conditions and actions; frequent job observations and feedback; periodic employee performance reviews. 2 5 10 Senior management's active participation in safety process; utilization of motivational methods to reinforce company's values and commitment to safety; regular comprehensive safety audits to assure safety standards are maintained. 2 3 6

Alpha Metallurgical Resources, Inc. Statement of Coal Resources and Reserves for the Virginia Complex in Accordance with United States SEC Standards as of December 31, 2023 Central Appalachian Coal Basin Virginia, USA MARSHALL MILLER & ASSOCIATES, INC. 100 22.2.8.7 Refuse Disposal Having sufficient refuse disposal capacity is critical to strategic long-term mine development. Production delays can be caused by the lengthy process associated with identifying, designing and permitting future waste disposal areas. Alpha’s Virginia complex is actively pursuing additional refuse storage areas to acquire and/or permit in order to support the LOM reserves for the Property. Table 22-17: Refuse Disposal (Risk 15) Aspect Impact Control Measures Initial Risk Level Mitigation Measures Residual Risk Level P C R P C R Failure to acquire and/or permit refuse storage areas to support reserves Interruption of coal preparation plant operations and increased pressure on mine/plant raw coal storage capacities. Plant design modifications to reduce refuse volumes produced; strategic property acquisition and design of future refuse storage areas. 4 5 20 Addition of plate frame filters in plant; identify, design and permit additional refuse facilities. 4 4 16 23 Recommendations Alpha is continuing to work both internally and with outside assistance to further define their Resource Base and to Optimize the LOM Plan. 24 References Publicly available information from various State and Federal agencies was used where relevant. JOURNEL, A.G., & HUIJBREGTS, CH, J., 1978: Mining Geostatitics, The Blackburn Press Caldwell, New Jersey. Alpha Metallurgical Resources, Inc. Statement of Coal Resources and Reserves for the Virginia Complex in Accordance with United States SEC Standards as of December 31, 2023 Central Appalachian Coal Basin Virginia, USA MARSHALL MILLER & ASSOCIATES, INC. 101 25 Reliance on Information Provided by Registrant A summary of the information provided by Alpha relied upon by MM&A for the purposes of this TRS is provided in Table 25-1. Table 25-1: Information from Registrant Relied Upon by MM&A Category Information Provided by Alpha Report Section Marketing Long-term price forecast used in financial projections 16.2 Legal Mineral control and surface control rights as shown on maps 3.2, 3.3 Environmental Permit and bonding information 17.3

APPENDIX A SUMMARY TABLES Alpha Metallurgical Resources, LLC SEC Technical Report - Virginia Complex Summary of Coal Resource (Short Tons) • Effective December 31, 2023 Appendix A - Table 1 Mine/Area Seam Measured Indicated Total Inferred Grand Total Owned Leased Permitted Not Permitted Ash% Sulfur% VM% Holly Creek Upper Banner (4650) 5,594,000 2,156,000 7,750,000 0 7,750,000 0 7,750,000 7,172,000 578,000 23 0.8 28 Bear Ridge Upper Banner (4650) 181,000 118,000 299,000 0 299,000 0 299,000 67,000 232,000 - - - Ball Ridge (Deep Mine 46) Lower Banner (4900) 1,003,000 32,000 1,035,000 0 1,035,000 0 1,035,000 1,035,000 0 25 1.2 23 Deep Mine 43 Jawbone Rider (5950) 10,653,000 8,216,000 18,870,000 409,000 19,279,000 0 18,870,000 0 18,870,000 11 1.0 - Black Dog Jawbone (6000) 6,367,000 1,860,000 8,227,000 0 8,227,000 0 8,227,000 8,132,000 95,000 29 0.5 - Deep Mine 41 Jawbone (6000) 4,704,000 705,000 5,409,000 0 5,409,000 0 5,409,000 1,794,000 3,615,000 25 0.8 27 Deep Mine 42 Jawbone (6000) 2,024,000 15,000 2,039,000 0 2,039,000 0 2,039,000 860,000 1,179,000 42 0.4 16 Grand Total 30,527,000 13,102,000 43,629,000 409,000 44,038,000 0 43,629,000 19,060,000 24,570,000 20 0.8 26 Note(1): Resource tons are exclusive of reserve tons (not converted to reserve). Note (2): Coal resources are reported on a dry basis. Surface moisture and inherent moisture are excluded. All resources exclusive of reserves are considered a met market Totals may not add due to rounding. Quality (Dry Basis) By Reliability Category Coal Resource (Dry Tons, In Situ) By Control Type By Permit Status AMR118 VA SEC Reserve Tables (2024-02-06).xlsx • VA ANR Resource Report • 2/8/2024 Page 1 of 1

Alpha Metallurgical Resources, LLC SEC Technical Report - Virginia Complex Summary of Coal Reserve (Short Tons) • Effective December 31, 2023 Appendix A - Table 2 Demonstrated Coal Reserves (Wet Tons, Washed or Direct Shipped) By Reliability Category By Mining Type By Control Type By Permit Status By Market Mine/Area Seam Proven Probable Total Surface UG Owned Leased Permitted Not Permitted Thermal Met Ash% Sulfur% VM% 88 Strip/Three Forks (SM) Upper Banner-Tiller 133,000 3,974,000 4,107,000 4,107,000 0 0 4,107,000 2,083,000 2,024,000 821,000 3,285,000 6 0.9 29 88 Strip/Three Forks (HWM) Upper Banner-Tiller 415,000 2,319,000 2,733,000 2,733,000 0 0 2,733,000 391,000 2,342,000 547,000 2,187,000 6 0.9 29 Long Branch (SM) Upper Banner 2 - Lower Banner 104,000 84,000 188,000 188,000 0 0 188,000 125,000 63,000 38,000 150,000 5 0.8 32 Long Branch (HWM) Upper Banner 2 - Lower Banner 597,000 101,000 699,000 699,000 0 0 699,000 394,000 305,000 140,000 559,000 5 0.8 31 Bear Ridge Upper Banner (4650) 72,000 12,000 84,000 0 84,000 0 84,000 84,000 0 0 84,000 5 0.7 33 Ball Ridge (Deep Mine 46) Lower Banner (4900) 1,190,000 92,000 1,282,000 0 1,282,000 0 1,282,000 1,282,000 0 0 1,282,000 6 0.7 29 Long Branch (Deep Mine 45) Lower Banner (4900) 713,000 16,000 729,000 0 729,000 0 729,000 729,000 0 0 729,000 6 0.7 30 Rush Branch (Deep Mine 44) Lower Banner (4900) 311,000 0 311,000 0 311,000 0 311,000 151,000 160,000 0 311,000 5 0.7 29 Deep Mine 43 Jawbone Rider (5950) 13,939,000 7,961,000 21,901,000 0 21,901,000 0 21,901,000 0 21,901,000 0 21,901,000 3 0.8 24 Black Dog Jawbone (6000) 3,970,000 65,000 4,035,000 0 4,035,000 0 4,035,000 4,035,000 0 0 4,035,000 8 0.6 28 Deep Mine 41 Jawbone (6000) 15,368,000 4,356,000 19,724,000 0 19,724,000 0 19,724,000 16,851,000 2,873,000 0 19,724,000 9 0.8 26 Deep Mine 42 Jawbone (6000) 10,941,000 2,014,000 12,955,000 0 12,955,000 0 12,955,000 12,523,000 433,000 0 12,955,000 7 0.7 26 Grand Total 47,753,000 20,994,000 68,747,000 7,727,000 61,020,000 0 68,747,000 38,648,000 30,099,000 1,545,000 67,201,000 6 0.8 25 Notes: Marketable reserve tons are reported on a moist basis, including a combination of surface and inherent moisture. Coal quality is based on a weighted average of laboratory data from core holes. The combination of surface and inherent moisture is modeled at 6.0-percent. Actual product moisture is dependent upon multiple geological factors, operational factors, and product contract specifications and can exceed 8-percent. As such, the modeled moisture values provide a level of conservatism for reserve reporting. Totals may not add due to rounding. Quality (Dry Basis) AMR118 VA SEC Reserve Tables (2024-02-06).xlsx • VA ANR Reserve Report • 2/7/2024 Page 1 of 1 APPENDIX B INITIAL ECONOMIC ASSESSMENT, RESOURCES EXCLUSIVE OF RESERVES (PER TON)

Alpha Metallurgical Resources, LLC Initial Economic Assessment, Resources Exclusive of Reserves (per Ton) Appendix B: Virginia Complex Seam: Lower Banner Jawbone Rider Jawbone Upper Banner Upper Banner Area: Ball Ridge Block BR-C Jawbone Rider Blocks C1A,D1,D2 Jawbone Blocks BD-D1&2,BD- E,41-E4&G,42- E/F1/F2/F3 Holly Creek Bear Ridge Block C In-Place Resource Tons (not adjusted for Q4 2023 Depletion) 1,035,080 19,278,897 13,636,557 7,749,980 299,000 Potentially Recoverable Tons* 344,475 3,735,902 3,500,821 2,923,435 104,006 Mining Method Deep - CM Deep - CM Deep - CM Deep - CM Deep - CM Assumed Sales Realization at Plant** 135$ 135$ 135$ 135$ 135$ Initial Capex Estimate to Access Resources*** 1,000,000$ 12,000,000$ 23,000,000$ 25,000,000$ -$ Direct Mining Costs: Labor**** 29.76$ 31.19$ 28.61$ 25.17$ 38.66$ Supplies, Excluding Roof Control 6.77$ 7.09$ 7.92$ 5.72$ 8.79$ Roof Control 10.93$ 11.46$ 14.04$ 9.25$ 14.20$ M&R 4.55$ 4.69$ 15.36$ 4.32$ 5.36$ Power 1.36$ 1.41$ 3.61$ 1.30$ 1.61$ Other 1.82$ 1.87$ 1.80$ 1.73$ 2.14$ Total Direct Cash Costs 55.19$ 57.71$ 71.34$ 47.50$ 70.75$ Transporation, Washing, Environmental & G&A Costs: Coal Prep***** 9.10$ 9.37$ 20.92$ 8.65$ 10.72$ Materials Handling 1.50$ 1.50$ 1.50$ 1.50$ 1.50$ Raw Coal Trucking***** 10.01$ 18.43$ -$ 14.20$ 14.69$ Clean Coal Trucking 1.25$ 1.25$ 1.25$ 1.25$ 1.25$ Enviro****** 0.50$ 0.50$ 0.50$ 0.50$ 0.50$ G&A 5.00$ 5.00$ 5.50$ 5.00$ 5.00$ Total Transporation, Washing, Environmental & G&A Costs: 27.35$ 36.05$ 29.67$ 31.10$ 33.66$ Indirect Cash Costs Royalty 6.75$ 6.75$ 6.75$ 6.75$ 6.75$ Black Lung Excise Tax 0.55$ 0.55$ 0.55$ 0.55$ 0.55$ SMCRA 0.12$ 0.12$ 0.12$ 0.12$ 0.12$ State Severance 2.70$ 2.70$ 2.70$ 2.70$ 2.70$ Property Tax & Insurance 1.20$ 1.20$ 1.20$ 1.20$ 2.40$ Total Indirect Cash Costs 11.32$ 11.32$ 11.32$ 11.32$ 12.52$ Non Cash Costs Amoritiztion of Development Capital 2.90$ 3.21$ 6.57$ 8.55$ -$ Depreciation of Initial Equipment and Sustaining Capital 6.73$ 6.73$ 6.73$ 6.73$ 6.73$ Depletion 1.00$ 1.00$ 1.00$ 1.00$ 1.00$ Total Non Cash 10.64$ 10.95$ 14.30$ 16.28$ 7.73$ Total Cash Cost 93.87$ 105.08$ 112.33$ 89.92$ 116.93$ EBITDA 41.13$ 29.92$ 22.67$ 45.08$ 18.07$ Fully Loaded Cost 104.50$ 116.03$ 126.63$ 106.20$ 124.67$ Fully Loaded P&L 30.50$ 18.97$ 8.37$ 28.80$ 10.33$ Passes Resource Iniital Economic Assessment? YES YES YES YES YES *Potentially recoverable tons are calculated by applying appropriate modifying factors to in-place resource tonnages **Sales realization represents estimated long range sales price. ***No initial capital required where resources are accessible from existing mines. ****Labor rates are driven based off of super section productivities assuming 250 to 350 feet per unit shift per section. *****Processing assumed to occur at McClures plant except for Toms Creek, which is processed at Toms Creek plant. ******Environmental costs assumed to include permiting, outfall maintenance, etc. AMR118 Virginia Initial Economic Assessment Resources Exclusive of Reserves sp122623.xlsx Page 1 of 1 APPENDIX C MAPS

C-32 C-32 C-32 C-23 S-1 C-5 C-23 S-1 C-5 C-32 C-32 C-32 C-32 C-30 C-30 NO COAL NO COAL NO COAL C-32 C-32 C-32 C-32 C-32 C-32 C-32 C-32 06 -0 2- 23 - #2 42 6 FU LL D EP TH 4 51 ' 06 -0 2- 23 - #2 42 7 FU LL D EP TH 4 63 ' 06 -0 3- 23 - #2 42 8 FU LL D EP TH 4 73 ' 06 -0 5- 23 - #2 42 9 FU LL D EP TH 4 74 ' 06 -0 5- 23 - #2 43 0 FU LL D EP TH 4 79 ' 06 -0 6- 23 - #2 43 1 FU LL D EP TH 4 87 ' 06 -0 7- 23 - #2 43 2 FU LL D EP TH 4 89 ' 06 -0 8- 23 - #2 43 3 FU LL D EP TH 4 92 ' 06 -0 9- 23 - #2 43 4 FU LL D EP TH 5 08 ' 06 -1 4- 23 - #2 43 5 FU LL D EP TH 5 26 ' FU LL D EP TH 5 29 ' 06 -1 5- 23 - #2 43 6 06 -1 5- 23 - #2 43 7 FU LL D EP TH 5 17 ' 06 -1 6- 23 - #2 43 8 FU LL D EP TH 5 10 ' 06 -1 6- 23 - #2 43 9 FU LL D EP TH 5 04 ' 06 -1 7- 23 - #2 44 0 FU LL D EP TH 5 01 ' 06 -1 9- 23 - #2 44 1 FU LL D EP TH 5 03 ' 06 -1 9- 23 - #2 44 2 FU LL D EP TH 4 96 ' 06 -1 9- 23 - #2 44 3 FU LL D EP TH 4 92 ' S-2 C-38 S-2 C-38 S-2 C-37 S-2 C-37 S-2 C-37 S-2 C-37 S-2 C-38 S-2 C-35 S-2 C-37 8- 17 -2 1 8- 17 -2 1 9- 1- 21 9- 16 -2 1 9- 16 -2 1 10 -1 -2 1 10 -1 -2 1 10 -1 -2 1 10 -1 -2 1 10 -1 -2 1 10 -6 -2 1 10 -6 -2 1 10 -6 -2 1 10 -6 -2 1 10 -6 -2 1 10 -6 -2 1 10 -6 -2 1 10 -1 8- 21 10 -1 8- 21 10 -1 8- 21 10 -1 8- 21 10 -1 8- 21 10 -1 8- 21 10 -1 8- 21 11 -1 -2 1 11 -1 -2 1 11 -1 -2 1 11 -1 -2 1 11 -1 -2 1 11 -1 -2 1 11 -1 -2 1 11 -1 0- 21 11 -1 0- 21 11 -1 0- 21 11 -1 0- 21 11 -1 0- 21 11 -1 0- 21 11 -1 0- 21 XX X X X X X X XFA LL 1 1- 18 -2 1 X XX X X X X X X X X X X X X X X X X X X X X 12 -1 -2 1 12 -1 -2 1 12 -1 -2 1 12 -1 -2 1 12 -1 -2 1 12 -1 -2 1 12 -1 -2 1 12 -1 4- 21 12 -1 4- 21 12 -1 4- 21 12 -1 4- 21 12 -1 4- 21 12 -1 4- 21 12 -1 4- 21 12 -3 1- 21 12 -3 1- 21 12 -3 1- 21 12 -3 1- 21 12 -3 1- 21 12 -3 1- 21 1- 27 -2 2 1- 27 -2 2 1- 27 -2 2 1- 27 -2 21- 27 -2 2 1- 27 -2 2 1- 27 -2 2 2- 1- 22 2- 1- 22 2- 1- 22 2- 1- 22 2- 8- 22 2- 8- 22 2- 8- 22 2- 8- 22 2- 8- 22 2- 8- 22 2- 8- 22 3- 1- 22 3- 1- 22 3- 1- 22 3- 1- 22 3- 1- 22 3- 1- 22 3- 1- 22 3- 9- 22 3- 9- 22 4-1-22 4-1-22 4-1-22 4-1-22 4-1-22 4-1-22 4-1-22 4-1-22 4-1-22 4- 23 -2 2 4- 23 -2 2 4- 23 -2 2 4- 23 -2 2 4- 23 -2 2 5-1-22 5-1-22 5-1-22 5-1-22 5-1-22 5-1-22 5-9-225-9-22 5-9-22 5-9-22 X XX X X X X X X X X X XX X XX XX X X XX X X X XX X X X XX X FA LL 5 -1 9- 22 5-24-22 6-1-22 6-1-22 6-1-22 6-1-22 6-1-22 6-1-22 6-14-22 6-14-22 6-14-22 6-14-22 6-14-22 6-14-22 6-14-22 6-28-22 6-28-22 6-28-22 7-1-22 7-1-22 7-1-22 7-1-22 7-1-22 7-13-22 7-20-22 7-20-22 7-20-22 7-20-22 8- 3- 22 8- 3- 22 8- 3- 22 8- 3- 22 8- 3- 22 8- 16 -2 2 8- 16 -2 2 8- 16 -2 2 8- 16 -2 2 8- 16 -2 2 9- 8- 22 9- 8- 22 9- 8- 22 9- 8- 22 9-8-22 9-8-22 9-8-22 9- 1- 22 9- 1- 22 9- 1- 22 9-1-22 09-03-19 - #525 (FULL DEPTH 1000') 09-04-19 - #526 (FULL DEPTH 1000') 09-05-19 - #527 (PRESSURED OUT 720') 09-06-19 - #528 (PRESSURED OUT 910') 09-06-19 - #529 (PRESSURED OUT 930') 09-10-19 - #530 (PRESSURED OUT 980') 09-11-19 - #531 (CROSSED HOLES 480') 09-12-19 - #532 (CROSSED HOLES 860') 09-12-19 - #533 (PRESSURED OUT 910') 09-13-19 - #534 (PRESSURED OUT 940') 09-14-19 - #535A (PRESSURED OUT 970') 09-17-19 - #535 (FULL DEPTH 1000') 09-17-19 - #536 (CROSSED HOLES 420') 09-18-19 - #537 09-19-19 - #538 (PRESSURED OUT 910') 09-19-19 - #539 (CROSSED HOLES 610') 09-20-19 - #540 (PRESSURED OUT 940') 09-20-19 - #541 (PRESSURED OUT 840') 09-24-19 - #542 (PRESSURED OUT 880') 09-25-19 - #543 (PRESSURED OUT 870') 09-26-19 - #544 (FULL DEPTH 1000') 09-27-19 - #545 (PRESSURED OUT 920') 09-27-19 - #546 (FULL DEPTH 1000') 09-28-19 - #547 (FULL DEPTH 1000') 10-02-19 - #549 (FULL DEPTH 1000') 10-03-19 - #550 (FULL DEPTH 1000') 10-04-19 - #551 (FULL DEPTH 1000') 10-08-19 - #552 (FULL DEPTH 1000') 10-08-19 - #553 CROSSED HOLES 500' 10-09-19 - #554 PRESSURED OUT 900' 10-10-19 - #555 PRESSURED OUT 940' 10-11-19 - #556 PRESSURED OUT 960' 10-11-19 - #557 CROSSED HOLES 440' 10-12-19 - #558 PRESSURED OUT 920' 10-12-19 - #559 PRESSURED OUT 850' 10-15-19 - #560 10-16-19 - #561 PRESSURED OUT 850' PRESSURED OUT 850' 10-17-19 - #562 PRESSURED OUT 840' 10-17-19 - #563 PRESSURED OUT 740' 10-18-19 - #564 PRESSURED OUT 850' 10-18-19 - #565 PRESSURED OUT 850' 10-21-19 - #566 PRESSURED OUT 850' 10-22-19 - #567 CROSSED HOLES 260' 10-22-19 - #568 PRESSURED OUT 850' 10-23-19 - #569 PRESSURED OUT 850' 10-24-19 - #570 PRESSURED OUT 850' 10-25-19 - #571 PRESSURED OUT 850' 10-25-19 - #572 PRESSURED OUT 840' 10-26-19 - #573 PRESSURED OUT 850' 10-28-19 - #574 PRESSURED OUT 955' 10-28-19 - #575 PRESSURED OUT 800' 10-29-19 - #576 PRESSURED OUT 640' 10-30-19 - #577 PRESSURED OUT 860' 10-30-19 - #578 10-30-19 - #579 FULL DEPTH 257' FULL DEPTH 265' 10-30-19 - #580 FULL DEPTH 271' 10-31-19 - #581 FULL DEPTH 278' 10-31-19 - #582 FULL DEPTH 281' 10-31-19 - #583 FULL DEPTH 285' 10-31-19 - #584 FULL DEPTH 288' 10-31-19 - #585 FULL DEPTH 296' 01-02-20 - #639 CROSSED HOLES 680' 01-03-20 - #640 PRESSURED OUT 980' 01-04-20 - #641 PRESSURED OUT 810' 01-04-20 - #642 PRESSURED OUT 680' 01-06-20 - #643 PRESSURED OUT 850' 01-07-20 - #644 PRESSURED OUT 860' 01-07-20 - #645 WALL FALLING 145' BADD WALL - SKIP - #646 BADD WALL - SKIP - #647 01-07-20 - #648 PRESSURED OUT 910' 01-08-20 - #649 01-09-20 - #650 PRESSURED OUT 915' PRESSURED OUT 940' 01-10-20 - #651 PRESSURED OUT 900' 01-10-20 - #652 FULL DEPTH 897' 01-14-20 - #653 FULL DEPTH 820' 01-15-20 - #654 FULL DEPTH 744' 01-15-20 - #655 FULL DEPTH 667' 01-16-20 - #656 FULL DEPTH 589' 01-16-20 - #657 FULL DEPTH 513' PRESSURED OUT 900' CROSSED HOLE 855' PRESSURED OUT 740' 12-05-19 - #618 PRESSURED OUT 990' 12-06-19 - #619 PRESSURED OUT 750' 12-07-19 - #620 FULL DEPTH 1000' 12-09-19 - #621 PRESSURED OUT 995' 12-09-19 - #622 PRESSURED OUT 980' 12-03-19 - #615 12-04-19 - #616 12-05-19 - #617 12-10-19 - #623 PRESSURED OUT 880' 12-11-19 - #624 PRESSURED OUT 990' 12-12-19 - #625 CROSSED HOLES 400' 12-12-19 - #626 PRESSURED OUT 990' 12-13-19 - #627 PRESSURED OUT 800' 12-26-19 - #635 PRESSURED OUT 960' 12-27-19 - #636 PRESSURED OUT 880' 12-31-19 - #637 PRESSURED OUT 950' 12-31-19 - #638 PRESSURED OUT 970' 12-20-19 - #632 PRESSURED OUT 965' 12-21-19 - #633 PRESSURED OUT 890' 12-21-19 - #634 PRESSURED OUT 940' 12-17-19 - #628 PRESSURED OUT 990' 12-18-19 - #629 PRESSURED OUT 960' 12-18-19 - #630 PRESSURED OUT 945' 12-19-19 - #631 PRESSURED OUT 905' 11-01-19 - #586 PRESSURED OUT 965' 11-05-19 - #587 PRESSURED OUT 960' 11-06-19 - #588 PRESSURED OUT 920' 11-06-19 - #589 PRESSURED OUT 900' 11-07-19 - #590 PRESSURED OUT 950' 11-08-19 - #591 PRESSURED OUT 930' 11-09-19 - #592 CROSSED HOLES 640' 11-09-19 - #593 PRESSURED OUT 950' 11-11-19 - #596 PRESSURED OUT 925' 11-12-19 - #597 CROSSED HOLES 400' 11-12-19 - #598 FULL DEPTH 1000' 11-13-19 - #599 PRESSURED OUT 780' 11-14-19 - #600 FULL DEPTH 779' 11-15-19 - #601 FULL DEPTH 768' 11-15-19 - #602 FULL DEPTH 765' 11-19-19 - #603 PRESSURED OUT 450' 11-19-19 - #604 PRESSURED OUT 660' 11-20-19 - #605 PRESSURED OUT 720' 11-20-19 - #606 FULL DEPTH 753' 11-21-19 - #607 11-22-19 - #608 PRESSURED OUT 590' PRESSURED OUT 900' 11-23-19 - #610 PRESSURED OUT 880' 11-25-19 - #611 PRESSURED OUT 920' 11-25-19 - #612 PRESSURED OUT 940' 11-22-19 - #609 11-26-19 - #613 PRESSURED OUT 850' 11-27-19 - #614 PRESSURED OUT 900' 03-12-20 - #742 PRESSURED OUT 550' 03-12-20 - #743 PRESSURED OUT 580' 03-13-20 - #744 PRESSURED OUT 740' 03-13-20 - #745 PRESSURED OUT 335' 03 -1 4- 20 - #7 47 PR ES SU RED O UT 59 5' 03 -1 4- 20 - #7 48 PI NCHED O FF 58 0' 03 -1 6- 20 - #7 49 03 -1 6- 20 - #7 50 PI NCHED O FF 46 0' PI NCHED O FF 47 0' 03 -1 7- 20 - #7 51 PI NCHED O FF 46 0' 03 -1 7- 20 - #7 77 PI NC HE D OFF 3 60 ' 03 -1 7- 20 - #7 76 FE LL IN / P ULL ED H AR D 17 5' 03 -1 8- 20 - #7 75 PI NCHED O FF 42 0' 03 -1 8- 20 - #7 74 BA D R OLL P IN CHED O FF 22 0' 03 -1 8- 20 - #7 71 BA D R OLL P IN CHED O FF 19 0' 03 -1 8- 20 - #7 70 PI NCHED O FF 24 0' 03 -1 8- 20 - #7 69 PI NCHED O FF 23 5' 03 -1 9- 20 - #7 68 ROLL P IN CHED O FF 25 0' 03 -1 9- 20 - #7 67 ROLL P IN CHED O FF 25 5' 03 -1 9- 20 - #7 66 ROLL P IN CHED O FF 19 0' 03 -1 9- 20 - #7 65 ROLL P IN CHED O FF 24 5' 03 -1 9- 20 - #7 64 ROLL P IN CHED O FF 24 5' 03 -2 0- 20 - #7 63 PI NCHED O FF 26 5' 03 -2 0- 20 - #7 62 PI NCHED O FF 31 5' PI NCHED O FF 31 0' 03 -2 0- 20 - #7 61 09-12-18 - #082 (HIT DIRT AUGER GOBBED OFF 350') 09-13-18 - #083 09-13-18 - #084 (PRESSURED OUT 330') (PRESSURED OUT 350') 09-13-18 - #085 (HIT DIRT 330') 09-13-18 - #086 (HIT DIRT 325') 09-14-18 - #087 (PRESSURED OUT 320') 09-14-18 - #088 (HIT DIRT 330') 09-14-18 - #089 (HIT DIRT 330') 09-17-18 - #090 (HIT DIRT 330') 09-17-18 - #091 (HIT DIRT 330') 09-17-18 - #092 (HIT DIRT 335') 09-18-18 - #093 (HIT DIRT 345') 09-18-18 - #094 (HIT DIRT 350') 09-18-18 - #095 (HIT DIRT 345') 09-18-18 - #096 (HIT DIRT 340') 09-19-18 - #097 (HIT DIRT 365') 09-19-18 - #098 (HIT DIRT 395') 09-19-18 - #099 (HIT DIRT 390') 09-20-18 - #100 09-20-18 - #101 (HIT DIRT 395') (HIT DIRT 385') 09-20-18 - #102 (HIT DIRT 385') 09-21-18 - #103 (FULL DEPTH 395') 09-21-18 - #104 (BROKE DOWN 380') 09-21-18 - #105 (FULL DEPTH 398') 09-25-18 - #106 (FULL DEPTH 398') 09-25-18 - #107 (FULL DEPTH 406') 09-26-18 - #108 (FULL DEPTH 413') 09-26-18 - #109 (FULL DEPTH 420') 09-26-18 - #110 (FULL DEPTH 433') 09-27-18 - #111 (FULL DEPTH 454') 09-27-18 - #112 (PRESSURED OUT 480') 09-27-18 - #113 (FULL DEPTH 550') 09-28-18 - #114 (FULL DEPTH 553') 09-28-18 - #115 (HOLE FLOODED 390') 09-28-18 - #116 (FULL DEPTH 566') 02-15-19 - #231 (FULL DEPTH 532') 02-16-19 - #232 (FULL DEPTH 538') 02-16-19 - #233 (FULL DEPTH 543') 02-18-19 - #234 (HIT DIRT 535') 02-18-19 - #235 (HIT DIRT 535') 02-19-19 - #236 (HIT DIRT 525') 02-19-19 - #237 (CROSSED HOLES 480') 02-20-19 - #238 (HIT DIRT 515') 02-20-19 - #239 (HIT DIRT 500') 02-21-19 - #240 (HIT DIRT 495') 02-21-19 - #241 (HIT DIRT 495') 02-21-19 - #242 (HIT DIRT 490') 02-22-19 - #243 (HIT DIRT 485') 02-22-19 - #244 (HIT DIRT 490') 02-23-19 - #245 (PRESSURED OUT 485') 02-23-19 - #246 (PRESSURED OUT 500') 02-23-19 - #247 (PRESSURED OUT 345') 02-25-19 - #288 (PRESSURED OUT 781') 02-26-19 - #287 (FULL DEPTH 827') 02-26-19 - #286 (FULL DEPTH 824') 02-27-19 - #285 (FULL DEPTH 825') 02-28-19 - #284 (PRESSURED OUT 810') 02-28-19 - #283 (CROSSED HOLES 615') 02-28-19 - #282 (PRESSURED OUT 780') 02-28-19 - #281 (CROSSED HOLES 580') 03-01-19 - #280 (FULL DEPTH 695') 03-04-19 - #279 (FULL DEPTH 659') 03-04-19 - #278 (PRESSURED OUT 615') 03-05-19 - #277 (HIT DIRT 615') 03-05-19 - #276 (HIT DIRT 615') 03-06-19 - #275 (HIT DIRT 600') 03-06-19 - #274 (HIT DIRT 605') 03-07-19 - #273 (HIT DIRT 610') 03-07-19 - #272 (HIT DIRT 600') 03-08-19 - #271 (HIT DIRT 595') 03-08-19 - #248 (HIT DIRT 485') 03-12-19 - #249 (HIT DIRT 480') 03-12-19 - #250 (HIT DIRT 540') 10-02-18 - #117 (FULL DEPTH 571') 10-03-18 - #118 (FULL DEPTH 577') 10-03-18 - #119 (FULL DEPTH 583') 03-13-19 - #251 (HIT DIRT 540') 03-13-19 - #252 (HIT DIRT 540') 03-14-19 - #253 (HIT DIRT 595') 03-14-19 - #254 (HIT DIRT 620') 03-15-19 - #255 (HIT DIRT 620') 03-15-19 - #256 (FULL DEPTH 647') 03-16-19 - #257 (FULL DEPTH 647') 03-16-19 - #258 (FULL DEPTH 662') 03-18-19 - #259 (FULL DEPTH 668') 03-19-19 - #260 (FULL DEPTH 670') 03-19-19 - #261 (FULL DEPTH 667') 03-20-19 - #262 (FULL DEPTH 655') 03-20-19 - #263 (FULL DEPTH 645') 03-21-19 - #264 (HIT DIRT 635') 03-21-19 - #265 (HIT DIRT 635') 03-22-19 - #266 (HIT DIRT 630') 03-26-19 - #267 (HIT DIRT 620') 03-26-19 - #268 (HIT DIRT 610') 05-31-19 - #413 (FULL DEPTH 751') 05-31-19 - #414 (FULL DEPTH 761') 06-04-19 - #415 (FULL DEPTH 799') 06-05-19 - #416 (FULL DEPTH 819') 06-06-19 - #417 (FULL DEPTH 849') 06-06-19 - #418 (FULL DEPTH 867') 06-07-19 - #419 (PRESSURED OUT 770') 06-08-19 - #420 (PRESSURED OUT 745') 06-08-19 - #421 (PRESSURED OUT 860') 06-10-19 - #422 (CROSSED HOLES 510') 06-10-19 - #423 (FULL DEPTH 945') 06-11-19 - #424 (FULL DEPTH 964') 06-12-19 - #425 (FULL DEPTH 977') 06-13-19 - #426 (PRESSURED OUT 905') 06-14-19 - #427 (PRESSURED OUT 915') 06-14-19 - #428 (PRESSURED OUT 995') 07-30-19 - #429 (FULL DEPTH 413') 07-31-19 - #430 (FULL DEPTH 410') 07-31-19 - #431 (FULL DEPTH 410') 07-31-19 - #432 (FULL DEPTH 408') 08-01-19 - #433 08-01-19 - #434 (FULL DEPTH 407') (FULL DEPTH 405') 08-01-19 - #495 (FULL DEPTH 401') 08-02-19 - #496 (FULL DEPTH 410') 08-03-19 - #497 (PRESSURED OUT 980') 08-03-19 - #498 (PRESSURED OUT 995') 08-05-19 - #499 (CROSSED HOLES 550') 08-06-19 - #500 (FULL DEPTH 1000') 08-07-19 - #501 (FULL DEPTH 1000') 08-08-19 - #502 (PRESSURED OUT 740') 08-08-19 - #503 (FULL DEPTH 1000') 08-09-19 - #504 (CROSSED HOLES 720') 08-09-19 - #505 (FULL DEPTH 1000') 08-13-19 - #506 (FULL DEPTH 1000') 08-13-19 - #507 (CROSSED HOLES 720') 08-15-19 - #508 08-16-19 - #509 (FULL DEPTH 1000') (FULL DEPTH 1000') 08-16-19 - #510 (GROUND CABLE 960') 08-17-19 - #511 (FULL DEPTH 1000') 08-19-19 - #512 (PRESSURED OUT 980') 08-20-19 - #513 (PRESSURED OUT 915') 08-21-19 - #514 (PRESSURED OUT 990') 08-21-19 - #515 (PRESSURED OUT 970') 08-23-19 - #517 (PRESSURED OUT 930') 08-23-19 - #518 (PRESSURED OUT 970') 08-27-19 - #519 (PRESSURED OUT 880') 08-28-19 - #520 (PRESSURED OUT 785') 08-29-19 - #521 (PRESSURED OUT 780') 08-29-19 - #522 (PRESSURED OUT 590') 08-22-19 - #516 (CROSSED HOLES 591') 08-30-19 - #523 (PRESSURED OUT 950') 08-30-19 - #524 (PRESSURED OUT 980') Mine No.9 (CMZ Mine) Bear Ridge (Capital No.11) 11-09-22 - #2246 FULL DEPTH 403' 11-10-22 - #2247 FULL DEPTH 407' 11-10-22 - #2248 FULL DEPTH 424' 11-10-22 - #2249 FULL DEPTH 461' 11-11-22 - #2250 FULL DEPTH 493' 11-11-22 - #2251 FULL DEPTH 510' 11-15-22 - #2252 FULL DEPTH 530' 11-15-22 - #2253 FULL DEPTH 538' 11-16-22 - #2254 FULL DEPTH 533' 11-16-22 - #2255 FULL DEPTH 540' 11-16-22 - #2256 FULL DEPTH 530' 11-17-22 - #2257 FULL DEPTH 437' 11-17-22 - #2258 FULL DEPTH 385' 11-17-22 - #2259 FULL DEPTH 368' 11-18-22 - #2260 FULL DEPTH 357' 11-18-22 - #2261 FULL DEPTH 345' 11-18-22 - #2262 FULL DEPTH 342' 11-19-22 - #2263 FULL DEPTH 343' 11-19-22 - #2264 FULL DEPTH 345' 11-19-22 - #2265 FULL DEPTH 297' 11-19-22 - #2266 FULL DEPTH 297' 11-21-22 - #2267 FULL DEPTH 229' 11-21-22 - #2268 FULL DEPTH 201' 11-21-22 - #2269 FULL DEPTH 181' 11-21-22 - #2270 FULL DEPTH 151' S-2 C-35 S-2 C-35 S-2 C-35 S-2 C-35 S-2 C-35 S-2 C-35 S-2 C-35 S-2 C-35 S-2 C-35 S-2 C-35 S-2 C-35 S-2 C-35 S-2 C-35 S-2 C-35 S-2 C-35 05 -0 6- 23 - #2 39 3 FE LL IN 61 0' 05 -0 6- 23 - #2 39 4 ROLL ED O UT 70 5' 05 -0 8- 23 - #2 39 5 PR ES SU RED O UT 76 0' 05 -0 9- 23 - #2 39 6 PR ES SU RED O UT 74 0' 05 -0 9- 23 - #2 39 7 PR ES SU RED O UT 61 0' 05 -1 0- 23 - #2 39 8 PR ES SU RED O UT 73 0' 05 -1 1- 23 - #2 39 9 PR ES SU RED O UT 77 0' 05 -1 1- 23 - #2 40 0 PR ES SU RED O UT 73 0' 05 -1 2- 23 - #2 40 1 ROLL ED O UT 70 0' 05 -1 2- 23 - #2 40 2 PR ES SU RED O UT 69 0' 05 -1 6- 23 - #2 40 3 PR ES SU RED O UT 72 0' 05 -1 6- 23 - #2 40 4 RO LL ED O UT 7 00 ' 05 -1 7- 23 - #2 40 5 PR ES SU RED O UT 74 0' 05 -1 8- 23 - #2 41 3 FU LL D EP TH 79 8' 05 -1 8- 23 - #2 41 4 PR ES SU RED O UT 74 5' 05 -1 9- 23 - #2 41 5 FU LL D EP TH 78 0' 05 -2 0- 23 - #2 41 6 FU LL D EP TH 76 2' 05 -2 0- 23 - #2 41 7 FU LL D EP TH 74 2' 05 -2 2- 23 - #2 41 8 FU LL D EP TH 72 3' 05 -2 2- 23 - #2 41 9 FU LL D EP TH 70 5' 05 -2 3- 23 - #2 42 0 FU LL D EP TH 68 9' 05 -2 4- 23 - #2 42 1 FU LL D EP TH 67 6' 05 -2 4- 23 - #2 42 2 PR ES SU RED O UT 58 0' ROLL ED O UT 52 5' 05 -2 5- 23 - #2 42 3 05 -2 5- 23 - #2 42 4 PR ES SU RED O UT 50 5' 05 -2 5- 23 - #2 42 5 FU LL D EP TH 46 1' 05 -2 6- 23 - #2 40 7 ROLL ED O UT 70 0' 05 -2 6- 23 - #2 40 8 ROLL ED O UT 70 0' 05 -3 0- 23 - #2 40 6 PR ES SU RED O UT 81 0' 05 -3 1- 23 - #2 40 9 PR ES SU RED O UT 85 0' 05 -3 1- 23 - #2 41 0 ROLL ED O UT 78 0' S-2 C-36 S-2 C-36 S-2 C-37 S-2 C-36 S-2 C-36 S-2 C-37 S-2 C-37 S-2 C-38 S-2 C-38 S-2 C-38 S-2 C-38 S-2 C-38 S-2 C-38 S-2 C-36 S-2 C-38 C-32 C-32 C-32 C-32 C-1 S-1 C-2 S-3 C-32 C-1 S-2 C-3 S-3 C-32C-1 S-1 C-2 S-3 C-37 C-3 S-3 C-31 C-32 C-32 C-32 C-32 C-32 7- 17 -2 3 7- 17 -2 3 7- 17 -2 3 7- 17 -2 3 7- 17 -2 3 7- 17 -2 3 8- 1- 238- 1- 23 8- 1- 23 8- 1- 23 8- 1- 23 8- 1- 23 8- 14 -2 3 8- 14 -2 3 8- 14 -2 3 8- 14 -2 3 8- 14 -2 3 8- 14 -2 3 9- 1- 23 9- 1- 23 9- 1- 23 9- 1- 23 9- 1- 23 9- 1- 23 9- 7- 23 9- 7- 23 9- 7- 23 9- 7- 23 9- 7- 23 9- 7- 23 9- 16 -2 3 9- 16 -2 3 9- 16 -2 3 9- 16 -2 3 9- 16 -2 3 9- 16 -2 3 9- 25 -2 3 9- 25 -2 3 9- 25 -2 3 9- 1- 23 9- 25 -2 3 9- 25 -2 3 9- 25 -2 3 9- 25 -2 3 9- 1- 239- 1- 23 10 -1 -2 3 9- 25 -2 3 10 -1 -2 3 9- 1- 23 10 -1 0- 23 10 -1 0- 23 10 -1 0- 23 10 -1 0- 23 10 -1 0- 23 10 -1 0- 23 10 -1 0- 23 10 -2 3- 23 10 -2 3- 23 10 -2 3- 23 10 -2 3- 23 10 -2 3- 23 10 -2 3- 23 10 -2 3- 23 10 -2 7- 23 10 -2 7- 23 10 -2 7- 23 10 -2 7- 23 10 -2 7- 23 10 -2 7- 23 10 -2 7- 23 Final measured on 10-31-23 11 -2311 -23 11 -2 3 11 -23 11 -23 11-23 11 -2 3 11 -23 11 -23 11 -23 11 -23 10 -23 10 -23 10 -23 10 -23 11-23 11 -23 11 -23 11 -23 11 -23 11-23 11 -23 11-2311 -2 3 11-23 11 -23 11 -23 11 -23 11-23 11 -23 11 -23 11 -23 11 -23 11 -23 11 -23 11 -2 3 11 -23 11 -2 3 11 -23 11 -2311 -23 11 -23 11 -23 11 -23 11 -23 11 -23 12-23 12 -2 3 12 -23 12 -23 12 -23 12 -23 12 -2 3 12 -2 3 12-23 12 -2 3 12 -2312 -2312 -2 3 12 -23 12 -2 3 12 -2 3 12 -23 12 -2 3 12 -23 12 -2 3 12 -2 3 12 -2312 -23 12-23 12 -2312 -2 3 12 -2312 -23 12-23 N Alpha Metallurgical Resources, LLC Map UB-1 Virginia Properties Bear Ridge - Upper Banner (4650) Dickenson County, Virginia Coordinate System: Virginia South State Plane NAD 83 2000 Scale In Feet 0 Data Point Location Previous Underground Mining Controlled Underground Reserve / Resource as of 12/31/23 Resource Inclusive of Reserve / Converted to Reserve Resource Exclusive of Reserve / Not Converted to Reserve 200 200 20 0 200 SS T- 17 C- 24 SH -2 4 C -2 2 SH B- 0 SS T- 5 C- 4 SH -2 C -1 5 SH -2 C -4 SH -1 9 C -2 1 SH B- 3 SS T- 31 C -4 SH -2 C- 20 SH -1 8 C- 22 SH B- 9 SS T- 1 C -4 SS -1 C -5 .5 SS -1 C -9 .5 SH -1 C -3 .5 SH -2 3 C -2 5. 5 SH B- 13 SS T- 2 C -3 SH -1 C -5 SH -1 C -1 3. 5 SH -2 0 C- 25 .5 SH B- 12 SS T- 0 C -4 SS -1 C -5 .5 SS -1 C -1 1 SH -1 C -4 SH -2 6 C -2 5 SH B- 12 SS T- 0 C- 25 SH -2 5 C -2 6 SH B- 1 SS T- 0 C -2 5 SH -1 8 C- 24 SH B- 1 SS T- 0 C -2 6 SH -2 3 C- 23 SH B- 1 SH T- 0 C -4 SH -1 C- 4 SH -1 C -1 4 SH -2 4 C -3 0 SH B- 0 SS T- 0 C- 4 SH -1 C -4 SH -1 C -1 4 SH -2 5 C- 26 SH B- 0 SS T- 0 C- 4 SH -1 C -4 SH -1 C -1 3 SH -2 4 C -2 7 SH B- 0 SS T- 1 C -4 SH -2 C -2 1. 5 SH -3 2 C- 28 SH B- 0 SS T- 0 C -2 6 SH -1 9 C -2 3. 5 SH B- 7 SS T- 0 C- 21 SH -1 C- 5 SH -2 3. 5 C -2 4. 5 SH B- 4 SS T- 0 C -2 7 SH -2 0 C- 24 SH B- 2 SS T- 2 C -2 5 SH -2 2 C- 20 SH B- 10 SS T- 0 C- 20 SH -2 6 C -3 0 SH B- 6 SS T- 0 C- 3 SH -2 C -3 .5 SH -1 C -1 3 SH -1 2 C- 25 SH B- 14 SH T- 1 C -2 SH -1 C -4 SH -1 C -1 3 SH -1 9 C -2 3 SH B- 11 SH T- 4 C- 5 SH -1 C- 13 SH -2 C -4 SH -1 9 C -2 1 SH B- 0 SS T- 0 C- 3. 5 SH -2 C -4 SH -1 C- 13 .5 SH -1 1 C- 24 .5 SH B- 13 SS T- 1 C- 16 .5 SH -2 C- 5 SH -1 4. 5 C- 25 SH B- 9 SS T- 0 C -7 SH -1 C- 13 .5 SH -2 C- 4 SH -3 2 C- 20 .5 SH B- 6 SS T- 2 C -2 6 SH -1 8 C- 22 SH B- 3 SS T- 0 C -1 8 SH -5 6 C -2 4 SH B- 0 SS T- 2 C -2 6 SH -1 4 C- 26 SH B- 17 SS T- 3 C -2 5 SH -1 8 C- 24 SH B- 5 SS T- 4 C- 5 M UD -5 C -1 2 SH -2 C -3 SH B- 37 SS T- 0 C -2 6 SH -2 0 C -2 6 SH B- 8 SH T- 3 C- 3 SH -4 C -2 0 SH -6 0 C -2 1 SH B- 0 SH T- 0 C -3 SH -9 C- 6 SH -1 2 C -1 1 SH B- 32 SS T- 4 C- 5 M UD -2 C -1 7 SH -1 7 C- 21 SH B- 7 SS T- 2 C- 5 SH -4 C- 12 M UD -2 C -4 SH -1 5 C -2 2 SH B- 9 SS T- 0 C -9 SS -8 1 C -2 4 SH B- 0 SS T- 0 C- 21 SS -1 3 C -2 4 SH B- 9 SS T- 3 C -7 SS -4 C -2 2 SS -4 2 C -2 4 SH B- 0 SS T- 0 C -5 SS -5 C -1 7 SS -9 1 C -2 4 SH B- 6 SS T- 0 C- 4 SH -2 C- 18 SS -1 7 C- 24 SS B- 6 SS T- 42 C -2 2 SS B- 15 SS T- 51 C -2 1 SS B- 14 SS T- 0 C -5 .5 SH -.5 C- 18 .5 SS -2 8 C -2 2 SS B- 7. 5 SS T- 61 C- 22 .5 SS B- 11 .5 SH T- 0 C- 7 SH -5 C -7 SH -2 C- 3 SH -2 6 C -2 2 SH B- 7 SS T- 4 C- 6 SH -3 C -1 5 SS -4 7 C -2 2 SS B- 3 SS T- 5 C -1 2 SS -6 7 C -2 0 SS B- 8 SS T- 0 C- 5 SS -1 1 C -8 SS -4 7 C -2 4 SS B- 3 SS T- 16 C -1 5 SS -6 3 C -2 1 SS B- 2 SS T- 0 C -5 SS -6 C -1 6 SS -4 3 C -2 1 SS B- 0 SS T- 0 C -9 SS -5 8 C -2 0 SS B- 0 SS T- 9 C- 14 SS -7 2 C -1 9 SS B- 0 SS T- 0 C -6 SH -5 C- 2 SH -2 C -1 2 SS -5 4 C- 19 SS B- 6 SS T- 8 C- 15 SS -5 2 C -1 5 SS B- 6 SS T- 0 C -1 6 SS -5 4 C- 18 SS B- 2 SS T- 6 C -1 8 SH -7 SS -4 8 C- 18 SS B- 3 SS T- 68 C -2 4 SS B- 0 SS T- 18 C -1 5 SS -7 2 C -2 4 SS B- 0 SS T- 0 C -1 8 SS -6 1 C -2 4 SS B- 0 SS T- 0 C -1 6 SS -6 8 C -2 4 SS B- 0 SS T- 20 C -1 4 SS -7 0 C -2 5 SS B- 0 SS T- 0 C -1 9 SS -6 4 C -2 3 SS B- 0 SS T- 0 C -7 SS -2 0 C -8 SS -4 4 C -2 1 SS B- 0 SS T- 23 C -1 5 SS -2 7 C -1 9 SS B- 0 SS T- 0 C -1 5 SS -5 8 C -2 5 SS B- 0 SS T- 0 C -1 1 SS -6 0 C -2 5 SS B- 0 SS T- 84 C -2 4 SS B- 0 SS T- 0 C -3 SS -1 2 C -2 SH -1 C -1 2 SS -3 8 C -2 4 SS B- 0 SS T- 16 C -8 SS -2 7 C -3 0 SH B- 0 SS T- 15 C -1 5 SS -2 4 C -3 3 SH B- 0 SS T- 0 C -3 SS -2 1 C -1 6 SS -3 6 C -1 9 SH B- 0 SS T- 25 C -1 6 SS -1 7 C -1 8 SS B- 4 SS T- 0 C -1 SS -1 9 C -1 9 SS -1 8 C -1 8 SS B- 3 SS T- 0 C -1 3 SS -3 2 C -3 1 SS B- 2 SS T- 5 C -1 8 SS -3 0 SH -8 C -1 8 SS T- 16 C -2 0 SS -5 2 C -2 0 SS B- 2 SH B- 2 SS T- 8 C -1 5 SS -1 8 C -2 0 SS B- 0 SS T- 60 SS T- 4 C -4 SH -2 7 C -2 0 SS B- 24 SS T- 8 C -2 1 SH -2 2 C -2 4 SS B- 0 SH B- 0 SS T- 3 C -3 SS -1 7 C -1 8 SS B- 39 SS T- 14 C -6 SS -2 9 C -1 9 SS B- 0 SS T- 4 C -1 6 SS -4 4 C -2 2 SS B- 0 SS T- 16 C -1 7 SS -3 8 C -2 6 SH B- 0 SS T- 2 C -3 SS -4 C -2 SS -3 C -6 SS -4 1 C -2 4 SS B- 2 SS T- 10 C -3 SS -3 C -1 6 SS -3 6 C -2 3 SS B- 2 SS T- 10 C -1 4 SS -3 7 C -2 4 SS B- 0 SS T- 8 C -1 6 SS -3 8 C -2 6 SS B- 0 SS T- 9 C -2 SS -4 C -1 5 SS -3 8 C -2 4 SS B- 0 SS T- 1 C -2 SS -5 C -1 3 SS -3 0 C -2 4 SS B- 2 SS T- 11 C -1 6 SS -2 7 C -2 4 SS B- 0 SS T- 4 C -3 SS -1 6 C -2 4 SS -2 4 SS B- 0 SS T- 2 C -2 SS -1 0 C -1 4 SS -3 8 C -1 9 SS B- 2 SS T- 2 C -4 SS -5 C -1 6 SS -1 6 C -2 4 SS B- 4 SS T- 0 C -4 SS -3 C -1 6 SS -3 1 C -2 0 SS B- 2 SS T- 0 C -2 6 SS -4 0 C -2 1 SS B- 2 SS T- 3 C -4 SS -5 C -1 7 SS -2 0 C -2 0 SS B- 0 SS T- 0 C -4 SS -3 C -1 5 SS -3 0 C -2 2 SS B- 2 SS T- 12 C -1 5 SS -4 0 C -1 2 SS B- 2 SS T- 17 C -3 SS -6 C -1 2 SS -6 C -1 2 SS B- 0 SS T- 0 C -3 SS -1 1 C -1 5 SS -3 8 C -2 6 SS B- 2 SS T- 0 C -5 SS -6 C -1 2 SS -2 0 C -2 5 SS B- 2 SS T- 12 C -4 SS -3 C -4 SS -2 C -1 3 SS -2 9 C -2 1 SS B- 2 SS T- 0 C -2 SS -4 C -3 SS -1 C -1 1 SS -2 3 C -2 4 SS B- 0 SS T- 0 C -2 SS -1 0 C -3 SS -1 C -1 3 SS -1 8 C -2 4 SS B- 0 SS T- 2 C -1 SS -3 C -1 7 SS -5 7 C -1 5 SS B- 0 SS T- 0 C -3 SS -1 1 C -1 8 SS -2 4 C -2 2 SS B- 0 SS T- 0 C -4 SS -5 C -1 6 SS -1 7 C -2 2 SS B- 0 SS T- 5 C -4 SS -2 C -1 5 SS -5 0 C -1 2 SS B- 0 SS H T- 0 C -2 SS -8 C -1 5 SS -2 0 C -2 2 SS B- 2 SS H T- 0 C -5 SS -5 C -1 6 SS -1 7 C -2 2 SS B- 7 SS T- 5 C -1 5 SS -4 8 C- 23 SS B- 0 SS H T- 0 C-3 SS -1 0 C- 13 SH -4 SS -1 7 C -2 2 SS B- 2 C- 18 SS B- 2 SS -2 2 C- 27 .5 SS B- 0 SS -4 4 C -2 6 SS B- 0 SS H T- 1 C- 2 SS -1 2 C- 15 SS -3 7 SS HT -2 2 C -3 .5 SS H- 7 C- 15 .5 SS T- 2 C- 3. 5 SS -4 C- 15 .5 SS H T- 2 C- 16 SS -4 4 C -2 3 SS HB -0 SS HT -0 C- 4 SS H- 14 C- 12 SS -3 9 C -2 3 SS B- 2 SS HT -0 C- 4 SS H- 6 C -1 7 SS -3 4 C- 24 SS HB -0 SS HT -3 C- 3 SH -1 C- 11 SS H- 41 C -2 2 SS HB -0 SS HT -2 C -2 SH -7 C- 17 SS H- 37 C -2 8 SS HB -0 SS H T- 0 C -3 SH -7 C- 16 SS H- 33 C -3 3 SS HB -0 SS T- 6 C- 17 SH -3 6 C -2 0 SH B- 0 SS T- 0 C-3 SH -2 0 C -1 5 SH -3 1 C- 18 SH B- 0 SS T- 0 C- 2 SS -1 1 C- 15 SH -3 0 C -1 9 SH B- 0 SS T- 0 C -1 4 SS -2 9 C- 20 SS B- 4 SS T- 16 C- 17 SS -3 3 C -2 0 SS B- 0 SS T- 17 C -1 3 SH -2 6 C- 26 SH B- 4 SS T- 0 C- 3 SS -3 5 C- 12 SS -2 0 C- 20 SS B- 0 SS T- 16 C -1 4 SS -2 6 C- 24 SS T- 6 C- 14 SH -2 6 C -2 6 SH B- 0 SS B- 0 SS T- 30 C- 10 SS -2 6 C- 13 SS B- 0 SS T- 24 C- 15 SS -1 9 C -2 1 SS B- 0 SS T- 0 C- 2 SS -1 2 C -1 4 SH -2 3 C- 23 SH B- 0 SS T- 0 C -4 SS -3 0 C -1 2 SS -1 0 C -1 9 SS B- 0 SS T- 0 C -3 SS -2 4 C -1 2 SS -2 3 C -2 3 SS B- 0 SS T- 0 C- 3 SS -1 1 C- 7 SH -2 4 C -1 6 SH B- 5 SS T- 0 C- 1 SS -3 9 C -3 2 SS B- 0 SS T- 0 C- 2 SS -1 8 C- 13 SH -7 C- 23 SS B- 0 SH T- 0 C -3 SH -1 7 C-7 SH -1 6 C -2 5 SH B- 0 SS T- 0 C- 2 SS -2 C- 4 SS -3 0 C- 12 SH -2 C -2 4 SS B- 4 SS T- 14 C- 15 SS -1 6 C- 25 SS B- 0 UBN UB N UBN UBN UBN UBN UBN UBN UBN Alpha Metallurgical Resources, LLC Map UB-2 Virginia Properties Holly Creek - Upper Banner (4650) Dickenson County, Virginia Coordinate System: Virginia South State Plane NAD 83 3000 Scale In Feet 0 Data Point Location Controlled Underground Reserve / Resource as of 12/31/23 Previous Underground Mining Resource Exclusive of Reserve / Not Converted to Reserve

N Alpha Metallurgical Resources, LLC Map LB-3 Virginia Properties Ball Ridge - Lower Banner (4900) Dickenson County, Virginia Coordinate System: Virginia South State Plane NAD 83 2000 Scale In Feet 0 Data Point Location Previous Underground Mining Controlled Underground Reserve / Resource as of 12/31/24 Resource Inclusive of Reserve / Converted to Reserve Resource Exclusive of Reserve / Not Converted to Reserve N Alpha Metallurgical Resources, LLC Map LB-4 Virginia Properties DM44 Rush Branch - Lower Banner (4900) Dickenson County, Virginia Coordinate System: Virginia South State Plane NAD 83 3000 Scale In Feet 0 Data Point Location Previous Surface and Underground Mining Controlled Underground Reserve / Resource as of 12/31/24 Resource Inclusive of Reserve / Converted to Reserve Resource Exclusive of Reserve / Not Converted to Reserve

03-02-23 - #2348 (FULL DEPTH 822') 03-02-23 - #2347 (FELL IN 145') 03-02-23 - #2346 (FELL IN 65') 03-03-23 - #2344 03-07-23 - #2355 (FEEL IN 820') (SIT DOWN 745') 03-09-23 - #2354 (FELL IN 780') 03-10-23 - #2356 03-13-23 - #2353 (PRESSURED OUT 655') 03-14-23 - #2352 (FULL DEPTH 815') 03-15-23 - #2343 (PRESSURED OUT 750') 03-17-23 - #2342 (PRESSURED OUT 750') 03-21-23 - #2341 (PRESSURED OUT 630') 03-21-23 - #2340 (PRESSURED OUT 710') 03-22-23 - #2339 (PRESSURED OUT 670') 03-22-23 - #2338 (PRESSURED OUT 650') 03-23-23 - #2337 (PRESSURED OUT 750') (FULL DEPTH 815') Jan 23 L. Banner 01-26-23 - # 2320 (FELL IN 630') 01-27-23 - # 2321 (PRESSURED OUT 640') 01 -28 -23 - # 23 33 (P RE SS UR ED O UT 50 0') (P RE SS UR ED O UT 37 0') 01 -30 -23 - # 23 32 (P RE SS UR ED O UT 53 0') (FE LL IN 50 0') (R UN O UT 40 0') 02 -01 -23 - # 23 31 (FU LL D EP TH 60 3') (FU LL DE PT H 6 03 ') (R UN O UT 50 ') 02 -02 -23 - # 23 30 (C RO SS ED HO LE S 3 30 ') (C RO SS ED HO LE S 4 30 ') 02-03-23 - # 2329 (PRESSURED OUT 500') (RUN OUT 410') 02-10-23 - # 2328 (PRESSURED OUT 460') (RUN OUT 350') 02-11-23 - # 2327 (PRESSURED OUT 740') 02-13-23 - # 2326 (PRESSURED OUT 685') (RUN OUT 50') 02-14-23 - # 2325 (PRESSURED OUT 670') 02-15-23 - # 2324 (PRESSURED OUT 590') (RUN OUT 440') 02-27-23 - #2350 (PRESSURED OUT 640') 02-28-23 - #2349 (FULL DEPTH 814') 02-25-23 - #2351 (PRESSURED OUT 750') Jun 23 L. Banner N Alpha Metallurgical Resources, LLC Map LB-5 Virginia Properties Long Branch DM45 Mine - Lower Banner (4900) Dickenson County, Virginia Coordinate System: Virginia South State Plane NAD 83 2000 Scale In Feet 0 Data Point Location Controlled Underground Reserve / Resource as of 12/31/23 Previous Surface, Highwall Miner and Underground Mining Resource Inclusive of Reserve / Converted to Reserve N Alpha Metallurgical Resources, LLC Map JBR-6 Virginia Properties DM43 Jawbone Rider (5950) Dickenson and Buchanan Counties, Virginia Coordinate System: Virginia South State Plane NAD 83 8000 Scale In Feet 0 Data Point Location Controlled Underground Reserve / Resource as of 12/31/23 Resource Inclusive of Reserve / Converted to Reserve Resource Exclusive of Reserve / Not Converted to Reserve

STOPPED 11 -1 3- 23 STOPPED 12-8-23 STOPPED 12-8-23 STOPPED 11-29-23 11-29-23 12-6-23 12-11-23 12-15-23 12-29-23 12 -2 7- 23 11-11-23 11-27-23 12-1-23 12-6-23 12-11-23 12-18-23 12-29-23 STOPPED 11-11-23 STO PPED 1-25-23 1-27-23 1-25-23 2-6-23 2-13-23 STOPPED 8-9-238-10-23 8-11-23 8-14-23 STOPPED 12 -1 0- 22 12-19-22 12-12-22 STOPPED 7- 29 -2 3 7-31-23 8-11-23 8-22-23 8 DEGREE SLOPE ENTRY INTO JAWBONE SEAM 11-27-18 11-29-18 3-13-17 EVENING 3-22-17 4-6-17 EVENING 1-16-17 2-22-17 11 -1 8- 16 4-18-17 11-8-16 10-1-16 1- 8- 17 2-3-17 1-20-17 5-22-17 6- 29 -1 7 7- 5- 17 7-29-17 8-15-17 9-5-17 9-13-17 9-18-17 9-25-17 9-23-17 10-1-17 10-13-17 11-18-17 12 -7 -1 7 12-29-17 1-5-18 1- 30 -1 7 3-26-18 3-29-18 3-5-18 4-20-18 5- 12 -1 8 5-17-18 5-31-18 6- 12 -1 8 6-13-18 6-29-18 5-31-18 5-31-18 7-6-18 7-9-18 7-30-18 8-4-18 8-13-18 8-24-18 8-31-18 9-8-18 10-15-18 9-17-18 10-19-18 11-1-18 11-1-18 10-29-18 11-14-18 11-24-18 11-24-18 11-29-18 11 -1 3- 18 12-13-18 12 -1 3- 18 12-28-18 12-19-18 1-12-19 3-29-19 eve 4-12-19 4-16-19 4-22-19 4-30-19 4- 26 -1 9 5-14-19 5-28-19 5-30-19 6-6-19 6-27-19 7- 16 -1 9 9-12-19 9-25-19 9-30-19 10-3-19 10 -4 -1 9 10 -2 4- 19 10-31-19 12 -1 2- 19 12 -1 8- 19 12-19-19 evening 12-31-19 12-30-19 12-30-19 1-10-20 1- 10 -2 0 1-10-20 1-13-20 1-20-20 1-20-20 1- 20 -2 0 1- 20 -2 0 1-21-20 1-27-20 1-27-20 2-4-20 1-24-20 1-30-20 3- 11 -2 0 3-30-20 4- 3- 20 5-18-20 6-4-20 5-21-20 5-28-20 5-28-20 6- 4- 20 6- 9- 20 6-9-20 6-18-20 6- 29 -2 0 7- 8- 20 8-26-20 8- 16 -2 0 8- 27 -2 0 8-29-20 9-10-20 9- 10 -2 0 9- 16 -2 0 9-16-20 9-29-20 9- 29 -2 0 10 -1 -2 0 McClure No.1 Inactive SLOP 9- 29 -2 1 9-29-21 9- 3- 21 STOPPED 10-9-20 STOPPED 2-16-21 2-18-21 STOPPED 3- 3- 21 3-1-21 3-8-21 3- 4- 21 3- 23 -2 1 STOPPED 3-29-21 3-15-21 4-16-21 4-20-21 4-20-21 4- 26 -2 1 STOPPED 4-21-21 4-29-21 4-29-21 5-10-21 5- 14 -2 1 5-21-21 STOPPED 6-17-21 STO PPED 6-29-21 7-1-21 7-19-21 7-31-21 7- 16 -2 1 STOPPED 8- 23 -2 1 STOPPED 9 -3 -2 1 9-15-21 NO W ALL CUTS STOPPED 9-14-21 9- 20 -2 1 9-20-21 9- 27 -2 1 9-27-21 10 -1 1- 21 10 -1 1- 21 STO PPED 10-12-21 10-13-21 10 -2 5- 21 10 -1 4- 21 10-29-21 STOPPED 7- 15 -2 1 STOPPED 12-22-21 3-18-22 3-24-22 4-1-22 4-7-22 4-12-22 4-25-22 9-12-22 9-14-22 9-17-22 9-26-22 5- 26 -2 2 5- 30 -2 2 6- 13 -2 2 6- 27 -2 2 8-30-22 8-29-22 9-3-22 10-7-20 3-17-22 4-8-22 5-25-22 8-1-22 8-8-22 3-28-22 8-13-22 8-18-22 8-28-22 9-12-22 9-14-22 9-9-22 9-14-22 9-17-22 9-23-22 1-31-22 1-15-22 6-8-22 6-13-22 6-17-22 1- 15 -2 2 12-27-21 1-1-22 1- 31 -2 2 2-7-22 REVISED 2-8-22 STOPPED 4-1-22 STOPPED 4-1-22 STOPPED 9-10-22 STOPPED 1- 29 -1 6 STOPPED 3-17-22 STOPPED 4 -7 -2 2 STOPPED 4-22-22 STOPPED 7 -15-22 STOPPED 9-9-22 Mine No.4 N Alpha Metallurgical Resources, LLC Map JB-7 Virginia Properties DM41 Mine Area - Jawbone (6000) Dickenson County, Virginia Coordinate System: Virginia South State Plane NAD 83 7000 Scale In Feet 0 Data Point Location Previous Underground Mining Controlled Underground Reserve / Resource as of 12/31/23 Resource Inclusive of Reserve / Converted to Reserve Resource Exclusive of Reserve / Not Converted to Reserve STOPPED 12-8 -2 3 STOPPED 11 -2 9- 23 11-29-23 12-6-23 12 -1 1- 23 12-15-23 12-29-23 12-27-23 11-11-23 11-27-23 12-1-23 12-6-23 12-11-23 12-18-23 12-29-23 STO PPED 11-11-23 STO PPED 1-25-23 1-27-23 1-25-23 2-6-23 2-13-23 STO PPED 8-9-238-10-23 8-11-23 8-14-23 STOPPED 12 -1 0- 22 12-19-22 12-12-22 STOPPED 7-2 9-2 3 7-31-23 8-11-23 8-22-23 8 DEGREE SLOPE ENTRY INTO JAWBONE SEAM 11-27-18 11-29-18 3-13-17 EVENING 3-22-17 4-6-17 EVENING 1- 16 -1 7 2-22-17 11-18-16 4-18-17 11 -8 -1 6 10 -1 -1 6 1-8-17 2- 3- 17 1-20-17 5- 22 -1 7 6-29-17 7- 5- 17 7- 29 -1 7 8-15-17 9-5-17 9-13-17 9-18-17 9-25-17 9-23-17 10-1-17 10-13-17 11-18-17 12 -7 -1 7 12 -2 9- 17 1-5-18 1-30-17 3-26-18 3-29-18 3-5-18 4-20-18 5-12-18 5-17-18 5-31-18 6- 12 -1 8 6-13-18 6-29-18 5-31-18 5-31-18 7-6-18 7-9-18 7-30-18 8-4-18 8-13-18 8-24-18 8-31-18 9-8-18 10-15-18 9- 17 -1 8 10-19-18 11-1-18 11-1-18 10-29-18 11-14-18 11-24-18 11-24-18 11 -2 9- 18 11-13-18 12-13-18 12-13-18 12-28-18 12 -1 9- 18 1-12-19 3-29-19 eve 4-12-19 4-16-19 4-22-19 4-30-19 4- 26 -1 9 5-14-19 5-28-19 5-30-19 6-6-19 6- 27 -1 9 7-16-19 9-12-19 9-25-19 9-30-19 10-3-19 10 -4 -1 9 10-24-19 10-31-19 12 -1 2- 19 12-18-19 12-19-19 ev en in g 12-31-19 12-30-19 12-30-19 1-10-20 1-10-20 1-10-20 1-13-20 1-20-20 1-20-20 1- 20 -2 0 1-20-20 1-21-20 1- 27 -2 0 1-27-20 2-4-20 1-24-20 1-30-20 3-11-20 3- 30 -2 0 4- 3- 20 5-18-20 6-4-20 5-21-20 5-28-20 5-28-20 6-4-20 6- 9- 20 6-9-20 6-18-20 6-29-20 7- 8- 20 8- 26 -2 0 8- 16 -2 0 8-27-20 8-29-20 9-10-20 9- 10 -2 0 9-16-20 9-16-20 9-29-20 9- 29 -2 0 10-1-20 SLOP 9-29-21 9-29-21 9- 3- 21 STO PPED 10-9-20 STO PPED 2-16-21 2-18-21 STOPPED 3-3 -2 1 3-1-21 3-8-21 3- 4- 21 3- 23 -2 1 STO PPED 3-29-21 3-15-21 4-16-21 4-20-21 4-20-21 4- 26 -2 1 STOPPED 4- 21 -2 1 4- 29 -2 1 4-29-21 5-10-21 5-14-21 5-21-21 STOPPED 6-1 7-2 1 STO PPED 6-29-21 7-1-21 7-19-21 7-31-21 7-16-21 STOPPED 8-2 3-2 1 STOPPED 9-3 -2 1 9-15-21 NO W ALL CUTS STO PPED 9-14-21 9- 20 -2 1 9- 20 -2 1 9-27-21 9- 27 -2 1 10-11-21 10 -1 1- 21 STO PPED 10-12-21 10-13-21 10-25-21 10-14-21 10-29-21 STOPPED 7-1 5-2 1 STOPPED 12 -2 2- 21 Black Dog Mine Mine No.42 3-18-22 3-24-22 4-1-22 4-7-22 4-12-22 4-25-22 9-12-22 9-14-22 9-17-22 9-26-22 5- 26 -2 2 5- 30 -2 2 6- 13 -2 2 6- 27 -2 2 8-30-22 8-29-22 9-3-22 -20 10-7-20 3-17-22 4-8-22 5-25-22 8-1-22 8-8-22 3-28-22 8-13-22 8-18-22 8-28-22 9-12-22 9-14-22 9-9-22 9-14-22 9-17-22 9-23-22 1-31-22 1-15-22 6-8-22 6-13-22 6-17-22 -2 2- 21 1-15-22 12-27-21 1- 1- 22 1- 31 -2 2 2-7-22 REVISED 2-8-22 STOPPED 4-1-22 STOPPED 4-1 -2 2 STO PPED 9-10-22 STOPPED 1-29-16 STOPPED 3-17-22 STOPPED 4- 7- 22 STOPPED 4-22-22 STOPPED 7 -1 5-2 2 STO PPED 9-9-22 Mine No.41 N Alpha Metallurgical Resources, LLC Map JB-8 Virginia Properties DM42 Mine Area - Jawbone (6000) Dickenson County, Virginia Coordinate System: Virginia South State Plane NAD 83 5000 Scale In Feet 0 Data Point Location Previous Underground Mining Controlled Underground Reserve / Resource as of 12/31/23 Resource Inclusive of Reserve / Converted to Reserve Resource Exclusive of Reserve / Not Converted to Reserve

P M U MOSS NO. 3 MINE Black Dog Mine N Alpha Metallurgical Resources, LLC Map JB-9 Virginia Properties Black Dog Mine - Jawbone (6000) Dickenson County, Virginia Coordinate System: Virginia South State Plane NAD 83 4000 Scale In Feet 0 Data Point Location Controlled Underground Reserve / Resource as of 12/31/23 Resource Inclusive of Reserve / Converted to Reserve Resource Exclusive of Reserve / Not Converted to Reserve Previous Underground Mining N Alpha Metallurgical Resources, LLC Map 88-1 Virginia Properties Buchanan, Dickenson and Russell Counties, Virginia Coordinate System: Virginia South State Plane NAD 83 3000 Scale In Feet 0 Data Point Location Controlled Surface Resource Inclusive of Reserve / Converted to Reserve as of 12/31/23 Contour / Area Reserve 88 Strip - Upper Banner (4650) HWM Reserve

N Alpha Metallurgical Resources, LLC Map 88-2 Virginia Properties 88 Strip - Lower Banner (4900) Buchanan, Dickenson and Russell Counties, Virginia Coordinate System: Virginia South State Plane NAD 83 3000 Scale In Feet 0 Data Point Location Contour / Area Reserve Controlled Surface Resource Inclusive of Reserve / Converted to Reserve as of 12/31/23 Previous Surface Mining N Alpha Metallurgical Resources, LLC Map 88-3 Virginia Properties 88 Strip - Big Fork (5050) Buchanan, Dickenson and Russell Counties, Virginia Coordinate System: Virginia South State Plane NAD 83 3000 Scale In Feet 0 Data Point Location Contour / Area Reserve HWM Reserve Controlled Surface Resource Inclusive of Reserve / Converted to Reserve as of 12/31/23 Previous Surface Mining

N Alpha Metallurgical Resources, LLC Map 88-4 Virginia Properties 88 Strip - Kennedy Rider (5250) Buchanan, Dickenson and Russell Counties, Virginia Coordinate System: Virginia South State Plane NAD 83 3000 Scale In Feet 0 Data Point Location Contour / Area Reserve HWM Reserve Controlled Surface Resource Inclusive of Reserve / Converted to Reserve as of 12/31/23 Previous Surface Mining N Alpha Metallurgical Resources, LLC Map 88-5 Virginia Properties 88 Strip - Kennedy (5300) Buchanan, Dickenson and Russell Counties, Virginia Coordinate System: Virginia South State Plane NAD 83 3000 Scale In Feet 0 Data Point Location Contour / Area Reserve HWM Reserve Controlled Surface Resource Inclusive of Reserve / Converted to Reserve as of 12/31/23 Previous Surface and Highwall Miner Mining

N Alpha Metallurgical Resources, LLC Map 88-6 Virginia Properties 88 Strip - Aily (5400) Buchanan, Dickenson and Russell Counties, Virginia Coordinate System: Virginia South State Plane NAD 83 3000 Scale In Feet 0 Data Point Location Contour / Area Reserve HWM Reserve Previous Surface and Highwall Miner Mining Controlled Surface Resource Inclusive of Reserve / Converted to Reserve as of 12/31/23 N Alpha Metallurgical Resources, LLC Map 88-7 Virginia Properties Buchanan, Dickenson and Russell Counties, Virginia Coordinate System: Virginia South State Plane NAD 83 3000 Scale In Feet 0 Data Point Location Contour / Area Reserve HWM Reserve Previous Surface Mining 88 Strip - Raven 2 (5550)Controlled Surface Resource Inclusive of Reserve / Converted to Reserve as of 12/31/23

88 Strip - Raven 1 Upper Split (5650), Raven 1 Lower Split (5750) and Raven 1 Upper and Lower Splits Combined (5700) N Alpha Metallurgical Resources, LLC Map 88-8Virginia Properties Buchanan, Dickenson and Russell Counties, Virginia Coordinate System: Virginia South State Plane NAD 83 3000 Scale In Feet 0 Data Point Location Contour / Area Reserve HWM Reserve Previous Surface, Highwall Miner and Underground Mining Controlled Surface Resource Inclusive of Reserve / Converted to Reserve as of 12/31/23 N Alpha Metallurgical Resources, LLC Map 88-9 Virginia Properties 88 Strip - Jawbone Rider (5950) Buchanan, Dickenson and Russell Counties, Virginia Coordinate System: Virginia South State Plane NAD 83 3000 Scale In Feet 0 Data Point Location Contour / Area Reserve HWM Reserve Previous Surface and Highwall Miner Mining Controlled Surface Resource Inclusive of Reserve / Converted to Reserve as of 12/31/22

C-112" I-57" X C-3" S-3" C-9" S-11" C-15" S-20" C-30" S-9" C-99" I-25" C-57" S-3.75" C-32.50" S-14.50"C-27" X C-34.75" S-2.50"C-4" S-1.75" C-10.50" X C-32" S-13" C-5" S-2" C-7" S-4" SH-TOP C-7" S-14" C-19" SH-BOT RASH -5" C-29" S-32" C-3" S-1" C-7" S-6" SH-TOP C-5" S-6" C-3" SH-BOT S-26" C-21" S-8" C-31" 1-15-1951 C-29" X BAD H/W COAL IN PLACE AUGER MINED AUGER MINED AUGER MINED AUGER MINED AU G ER M IN ED AU GER M IN ED AU GER M IN ED AUGER M IN ED AUGER MINED AUGER MINED AUGER MINED AUGER MINED AUGER MINED AU GE R M IN ED AUGER MINED AUGER MINED AUGER MINED AUGER MINED AUGER MINED AUGER MINED AUGER MINED AUGER MINED 17 80 17 7517 70 17 6517 6017 55 17 50174517 40 17 35 17 25 17 20 1715 1710 17 05 17 00 169516 9016 85 16 80 16 7516 7016 6516 60 16 5516 50 1632.17 STRIPPED OUT 17 30 C. C. C. S TR IP # 3 3-24-1980 C. C. C. S TR IP # 3 3-13-1959 HW 1-16-80 C-5'0" I-3'0" X AUGER MINED AUGERMINED BO T. HO LE 1952.9 I-8" 1964 1950. Both JB and TL N Alpha Metallurgical Resources, LLC Map 88-10 Virginia Properties 88 Strip - Jawbone (6000) Buchanan, Dickenson and Russell Counties, Virginia Coordinate System: Virginia South State Plane NAD 83 3000 Scale In Feet 0 Data Point Location Contour / Area Reserve HWM Reserve Previous Surface, Highwall Miner and Underground Mining Controlled Surface Resource Inclusive of Reserve / Converted to Reserve as of 12/31/23 1950. C-99" I-25" 1-15-1951 C-29" BAD H/W COAL IN PLACE AUGER MINED AUGER MINED AUGER MINED AUGER MINED 1710 HW 1-16-80 PILLARED AREA PILLARED AREA PILLARED AREA WISCO COALCORP 1964 AUGER 1990 AUGER 1964 1965 MINER STARTED 5-27-75 SS TOP C-46" I-32" SL BOT-3" 2-29-80 SL TOP C-66" I-29" SL BOT 2-19-80 SL-TOP SL-29" C-58" SL-3" SL-BOT STOPPED 4-27-73 SS TOP SL-4" C-4" SL-18" C-8'7" SL BOT C-6' I-3'-9" Both JB and TL Tiller only N Alpha Metallurgical Resources, LLC Buchanan, Dickenson and Russell Counties, Virginia Coordinate System: Virginia South State Plane NAD 83 3000 Scale In Feet 0 Data Point Location Contour / Area Reserve Previous Surface, Highwall Miner and Underground Mining Map 88-11 Virginia Properties - 88 Strip Tiller (6200) and Thick Tiller Seams (6250)Controlled Surface Resource Inclusive of Reserve / Converted to Reserve as of 12/31/23

09-12-18 - #082 (HIT DIRT AUGER GOBBED OFF 350') 09-13-18 - #083 09-13-18 - #084 (PRESSURED OUT 330') (PRESSURED OUT 350') 09-13-18 - #085 (HIT DIRT 330') 09-13-18 - #086 (HIT DIRT 325') 09-14-18 - #087 (PRESSURED OUT 320') 09-14-18 - #088 (HIT DIRT 330') 09-14-18 - #089 (HIT DIRT 330') 09-17-18 - #090 (HIT DIRT 330') 09-17-18 - #091 (HIT DIRT 330') 09-17-18 - #092 (HIT DIRT 335') 09-18-18 - #093 (HIT DIRT 345') 09-18-18 - #094 (HIT DIRT 350') 09-18-18 - #095 (HIT DIRT 345') 09-18-18 - #096 (HIT DIRT 340') 09-19-18 - #097 (HIT DIRT 365') 09-19-18 - #098 (HIT DIRT 395') 09-19-18 - #099 (HIT DIRT 390') 09-20-18 - #100 09-20-18 - #101 (HIT DIRT 395')(HIT DIRT 385') 09-20-18 - #102 (HIT DIRT 385') 09-21-18 - #103 (FULL DEPTH 395') 09-21-18 - #104 (BROKE DOWN 380') 09-21-18 - #105 (FULL DEPTH 398') 09-25-18 - #106 (FULL DEPTH 398') 09-25-18 - #107 (FULL DEPTH 406') 09-26-18 - #108 (FULL DEPTH 413') 09-26-18 - #109 (FULL DEPTH 420') 09-26-18 - #110 (FULL DEPTH 433') 09-27-18 - #111 (FULL DEPTH 454') 09-27-18 - #112 (PRESSURED OUT 480') 09-27-18 - #113 (FULL DEPTH 550') 09-28-18 - #114 (FULL DEPTH 553') 09-28-18 - #115 (HOLE FLOODED 390') 09-28-18 - #116 (FULL DEPTH 566') 02-15-19 - #231 (FULL DEPTH 532') 02-16-19 - #232 (FULL DEPTH 538') 02-16-19 - #233 (FULL DEPTH 543') 02-18-19 - #234 (HIT DIRT 535') 02-18-19 - #235 (HIT DIRT 535') 02-19-19 - #236 (HIT DIRT 525') 02-19-19 - #237 (CROSSED HOLES 480') 02-20-19 - #238 (HIT DIRT 515') 02-20-19 - #239 (HIT DIRT 500') 02-21-19 - #240 (HIT DIRT 495') 02-21-19 - #241 (HIT DIRT 495') 02-21-19 - #242 (HIT DIRT 490') 02-22-19 - #243 (HIT DIRT 485') 02-22-19 - #244 (HIT DIRT 490') 02-23-19 - #245 (PRESSURED OUT 485') 02-23-19 - #246 (PRESSURED OUT 500') 02-23-19 - #247 (PRESSURED OUT 345') 02-25-19 - #288 (PRESSURED OUT 781') 02-26-19 - #287 (FULL DEPTH 827') 02-26-19 - #286 (FULL DEPTH 824') 02-27-19 - #285 (FULL DEPTH 825') 02-28-19 - #284 (PRESSURED OUT 810') 02-28-19 - #283 (CROSSED HOLES 615') 02-28-19 - #282 (PRESSURED OUT 780') 02-28-19 - #281 (CROSSED HOLES 580') 03-01-19 - #280 (FULL DEPTH 695') 03-04-19 - #279 (FULL DEPTH 659') 03-04-19 - #278 (PRESSURED OUT 615') 03-05-19 - #277 (HIT DIRT 615') 03-05-19 - #276 (HIT DIRT 615') 03-06-19 - #275 (HIT DIRT 600') 03-06-19 - #274 (HIT DIRT 605') 03-07-19 - #273 (HIT DIRT 610') 03-07-19 - #272 (HIT DIRT 600') 03-08-19 - #271 (HIT DIRT 595') 03-08-19 - #248 (HIT DIRT 485') 03-12-19 - #249 (HIT DIRT 480') 03-12-19 - #250 (HIT DIRT 540') 10-02-18 - #117 (FULL DEPTH 571') 10-03-18 - #118 (FULL DEPTH 577') 10-03-18 - #119 (FULL DEPTH 583') 03-13-19 - #251 (HIT DIRT 540') 03-13-19 - #252 (HIT DIRT 540') 03-14-19 - #253 (HIT DIRT 595') 03-14-19 - #254 (HIT DIRT 620') 03-15-19 - #255 (HIT DIRT 620') 03-15-19 - #256 (FULL DEPTH 647') 03-16-19 - #257 (FULL DEPTH 647') 03-16-19 - #258 (FULL DEPTH 662') 03-18-19 - #259 (FULL DEPTH 668') 03-19-19 - #260 (FULL DEPTH 670') 03-19-19 - #261 (FULL DEPTH 667') 03-20-19 - #262 (FULL DEPTH 655') 03-20-19 - #263 (FULL DEPTH 645') 03-21-19 - #264 (HIT DIRT 635') 03-21-19 - #265 (HIT DIRT 635') 03-22-19 - #266 (HIT DIRT 630') 03-26-19 - #267 (HIT DIRT 620') 03-26-19 - #268 (HIT DIRT 610') 05-31-19 - #413 (FULL DEPTH 751') 05-31-19 - #414 (FULL DEPTH 761') 06-04-19 - #415 (FULL DEPTH 799') 06-05-19 - #416 (FULL DEPTH 819') 06-06-19 - #417 (FULL DEPTH 849') 06-06-19 - #418 (FULL DEPTH 867') 06-07-19 - #419 (PRESSURED OUT 770') 06-08-19 - #420 (PRESSURED OUT 745') 06-08-19 - #421 (PRESSURED OUT 860') 06-10-19 - #422 (CROSSED HOLES 510') 06-10-19 - #423 (FULL DEPTH 945') 06-11-19 - #424 (FULL DEPTH 964') 06-12-19 - #425 (FULL DEPTH 977') 06-13-19 - #426 (PRESSURED OUT 905') 06-14-19 - #427 (PRESSURED OUT 915') 06-14-19 - #428 (PRESSURED OUT 995') 07-30-19 - #429 (FULL DEPTH 413') 07-31-19 - #430 (FULL DEPTH 410') 07-31-19 - #431 (FULL DEPTH 410') 07-31-19 - #432 (FULL DEPTH 408') 08-01-19 - #433 08-01-19 - #434 (FULL DEPTH 407') (FULL DEPTH 405') 08-01-19 - #495 (FULL DEPTH 401') 08-02-19 - #496 (FULL DEPTH 410') 08-03-19 - #497 (PRESSURED OUT 980') 08-03-19 - #498 (PRESSURED OUT 995') 08-05-19 - #499 (CROSSED HOLES 550') 08-06-19 - #500 (FULL DEPTH 1000') 08-07-19 - #501 (FULL DEPTH 1000') 08-08-19 - #502 (PRESSURED OUT 740') 08-08-19 - #503 (FULL DEPTH 1000') 08-09-19 - #504 (CROSSED HOLES 720') 08-09-19 - #505 (FULL DEPTH 1000') 08-13-19 - #506 (FULL DEPTH 1000') 08-13-19 - #507 (CROSSED HOLES 720') 08-15-19 - #508 08-16-19 - #509 (FULL DEPTH 1000') (FULL DEPTH 1000') 08-16-19 - #510 (GROUND CABLE 960') 08-17-19 - #511 (FULL DEPTH 1000') 08-19-19 - #512 (PRESSURED OUT 980') 08-20-19 - #513 (PRESSURED OUT 915') 08-21-19 - #514 (PRESSURED OUT 990') 08-21-19 - #515 (PRESSURED OUT 970') 08-23-19 - #517 (PRESSURED OUT 930') 08-23-19 - #518 (PRESSURED OUT 970') 08-27-19 - #519 (PRESSURED OUT 880') 08-28-19 - #520 (PRESSURED OUT 785') 08-29-19 - #521 (PRESSURED OUT 780') 08-29-19 - #522 (PRESSURED OUT 590') 08-22-19 - #516 (CROSSED HOLES 591') 09-03-19 - #525 (FULL DEPTH 1000') 09-04-19 - #526 (FULL DEPTH 1000') 09-05-19 - #527 (PRESSURED OUT 720') 09-06-19 - #528 (PRESSURED OUT 910') 09-06-19 - #529 (PRESSURED OUT 930') 08-30-19 - #523 (PRESSURED OUT 950') 08-30-19 - #524 (PRESSURED OUT 980') 09-10-19 - #530 (PRESSURED OUT 980') 09-11-19 - #531 (CROSSED HOLES 480') 09-12-19 - #532 (CROSSED HOLES 860') 09-12-19 - #533 (PRESSURED OUT 910') 09-13-19 - #534 (PRESSURED OUT 940') 09-14-19 - #535A (PRESSURED OUT 970') 09-17-19 - #535 (FULL DEPTH 1000') 09-17-19 - #536 (CROSSED HOLES 420') 09-18-19 - #537 09-19-19 - #538 (PRESSURED OUT 910') 09-19-19 - #539 (CROSSED HOLES 610') 09-20-19 - #540 (PRESSURED OUT 940') 09-20-19 - #541 (PRESSURED OUT 840') 09-24-19 - #542 (PRESSURED OUT 880') 09-25-19 - #543 (PRESSURED OUT 870') 09-26-19 - #544 (FULL DEPTH 1000') 09-27-19 - #545 (PRESSURED OUT 920') 09-27-19 - #546 (FULL DEPTH 1000') 09-28-19 - #547 (FULL DEPTH 1000') 10-02-19 - #549 (FULL DEPTH 1000') 10-03-19 - #550 (FULL DEPTH 1000') 10-04-19 - #551 (FULL DEPTH 1000') 10-08-19 - #552 (FULL DEPTH 1000') 10-08-19 - #553 CROSSED HOLES 500' 10-09-19 - #554 PRESSURED OUT 900' 10-10-19 - #555 PRESSURED OUT 940' 10-11-19 - #556 PRESSURED OUT 960' 10-11-19 - #557 CROSSED HOLES 440' 10-12-19 - #558 PRESSURED OUT 920' 10-12-19 - #559 PRESSURED OUT 850' 10-15-19 - #560 10-16-19 - #561 PRESSURED OUT 850' PRESSURED OUT 850' 10-17-19 - #562 PRESSURED OUT 840' 10-17-19 - #563 PRESSURED OUT 740' 10-18-19 - #564 PRESSURED OUT 850' 10-18-19 - #565 PRESSURED OUT 850' 10-21-19 - #566 PRESSURED OUT 850' 10-22-19 - #567 CROSSED HOLES 260' 10-22-19 - #568 PRESSURED OUT 850' 10-23-19 - #569 PRESSURED OUT 850' 10-24-19 - #570 PRESSURED OUT 850' 10-25-19 - #571 PRESSURED OUT 850' 10-25-19 - #572 PRESSURED OUT 840' 10-26-19 - #573 PRESSURED OUT 850' 10-28-19 - #574 PRESSURED OUT 955' 10-28-19 - #575 PRESSURED OUT 800' 10-29-19 - #576 PRESSURED OUT 640' 10-30-19 - #577 PRESSURED OUT 860' 10-30-19 - #578 10-30-19 - #579 FULL DEPTH 257' FULL DEPTH 265' 10-30-19 - #580 FULL DEPTH 271' 10-31-19 - #581 FULL DEPTH 278' 10-31-19 - #582 FULL DEPTH 281' 10-31-19 - #583 FULL DEPTH 285' 10-31-19 - #584 FULL DEPTH 288' 10-31-19 - #585 FULL DEPTH 296' 11-01-19 - #586 PRESSURED OUT 965' 11-05-19 - #587 PRESSURED OUT 960' 11-06-19 - #588 PRESSURED OUT 920' 11-06-19 - #589 PRESSURED OUT 900' 11-07-19 - #590 PRESSURED OUT 950' 11-08-19 - #591 PRESSURED OUT 930' 11-09-19 - #592 CROSSED HOLES 640' 11-09-19 - #593 PRESSURED OUT 950' 11-11-19 - #596 PRESSURED OUT 925' 11-12-19 - #597 CROSSED HOLES 400' 11-12-19 - #598 FULL DEPTH 1000' 11-13-19 - #599 PRESSURED OUT 780' 11-14-19 - #600 FULL DEPTH 779' 11-15-19 - #601 FULL DEPTH 768' 11-15-19 - #602 FULL DEPTH 765' 11-19-19 - #603 PRESSURED OUT 450' 11-19-19 - #604 PRESSURED OUT 660' 11-20-19 - #605 PRESSURED OUT 720' 11-20-19 - #606 FULL DEPTH 753' 11-21-19 - #607 11-22-19 - #608 PRESSURED OUT 590' PRESSURED OUT 900' 11-23-19 - #610 PRESSURED OUT 880' 11-25-19 - #611 PRESSURED OUT 920' 11-25-19 - #612 PRESSURED OUT 940' 11-22-19 - #609 11-26-19 - #613 PRESSURED OUT 850' 11-27-19 - #614 PRESSURED OUT 900' PRESSURED OUT 900' CROSSED HOLE 855' PRESSURED OUT 740' 12-05-19 - #618 PRESSURED OUT 990' 12-06-19 - #619 PRESSURED OUT 750' 12-07-19 - #620 FULL DEPTH 1000' 12-09-19 - #621 PRESSURED OUT 995' 12-09-19 - #622 PRESSURED OUT 980' 12-03-19 - #615 12-04-19 - #616 12-05-19 - #617 12-10-19 - #623 PRESSURED OUT 880' 12-11-19 - #624 PRESSURED OUT 990' 12-12-19 - #625 CROSSED HOLES 400' 12-12-19 - #626 PRESSURED OUT 990' 12-13-19 - #627 PRESSURED OUT 800' 12-26-19 - #635 PRESSURED OUT 960' 12-27-19 - #636 PRESSURED OUT 880' 12-31-19 - #637 PRESSURED OUT 950' 12-31-19 - #638 PRESSURED OUT 970' 12-20-19 - #632 PRESSURED OUT 965' 12-21-19 - #633 PRESSURED OUT 890' 12-21-19 - #634 PRESSURED OUT 940' 12-17-19 - #628 PRESSURED OUT 990' 12-18-19 - #629 PRESSURED OUT 960' 12-18-19 - #630 PRESSURED OUT 945' 12-19-19 - #631 PRESSURED OUT 905' 01-02-20 - #639 CROSSED HOLES 680' 01-03-20 - #640 PRESSURED OUT 980' 01-04-20 - #641 PRESSURED OUT 810' 01-04-20 - #642 PRESSURED OUT 680' 01-06-20 - #643 PRESSURED OUT 850' 01-07-20 - #644 PRESSURED OUT 860' 01-07-20 - #645 WALL FALLING 145' BADD WALL - SKIP - #646 BADD WALL - SKIP - #647 01-07-20 - #648 PRESSURED OUT 910' 01-08-20 - #649 01-09-20 - #650 PRESSURED OUT 915' PRESSURED OUT 940' 01-10-20 - #651 PRESSURED OUT 900' 01-10-20 - #652 FULL DEPTH 897' 01-14-20 - #653 FULL DEPTH 820' 01-15-20 - #654 FULL DEPTH 744' 01-15-20 - #655 FULL DEPTH 667' 01-16-20 - #656 FULL DEPTH 589' 01-16-20 - #657 FULL DEPTH 513' 03-12-20 - #742 PRESSURED OUT 550' 03-12-20 - #743 PRESSURED OUT 580' 03-13-20 - #744 PRESSURED OUT 740' 03-13-20 - #745 PRESSURED OUT 335' 03 -1 4- 20 - #7 47 PR ES SU RED O UT 59 5' 03 -1 4- 20 - #7 48 PI NCHED O FF 58 0' 03 -1 6- 20 - #7 49 03 -1 6- 20 - #7 50 PI NCHED O FF 46 0' PI NCHED O FF 47 0' 03 -1 7- 20 - #7 51 PI NCHED O FF 46 0' 03 -1 7- 20 - #7 77 PI NCHED O FF 36 0' 03 -1 7- 20 - #7 76 FE LL IN / P ULL ED H AR D 17 5' 03 -1 8- 20 - #7 75 PI NCHED O FF 42 0' 03 -1 8- 20 - #7 74 BA D R OLL P IN CHED O FF 22 0' 03 -1 8- 20 - #7 71 BA D R OLL P IN CHED O FF 19 0' 03 -1 8- 20 - #7 70 PI NCHED O FF 24 0' 03 -1 8- 20 - #7 69 PI NCHED O FF 23 5' 03 -1 9- 20 - #7 68 ROLL P IN CHED O FF 25 0' 03 -1 9- 20 - #7 67 ROLL P IN CHED O FF 25 5' 03 -1 9- 20 - #7 66 ROLL P IN CHED O FF 19 0' 03 -1 9- 20 - #7 65 ROLL P IN CHED O FF 24 5' 03 -1 9- 20 - #7 64 ROLL P IN CHED O FF 24 5' 03 -2 0- 20 - #7 63 PI NCHED O FF 26 5' 03 -2 0- 20 - #7 62 PI NCHED O FF 31 5' PI NCHED O FF 31 0' 03 -2 0- 20 - #7 61 07 -0 1- 21 - #1 58 9B (P R ES SU R ED O U T 88 5' ) N Alpha Metallurgical Resources, LLC Map LBR-1 Virginia Properties Long Branch - Upper Banner (4650) Dickenson County, Virginia Coordinate System: Virginia South State Plane NAD 83 2000 Scale In Feet 0 Data Point Location Contour / Area Reserve HWM Reserve Previous Surface, Highwall Miner and Underground Mining Controlled Surface Resource Inclusive of Reserve / Converted to Reserve as of 12/31/23 N Alpha Metallurgical Resources, LLC Map LBR-2 Virginia Properties Long Branch -Upper Banner 2 (4500) Dickenson County, Virginia Coordinate System: Virginia South State Plane NAD 83 2000 Scale In Feet 0 Data Point Location Contour / Area Reserve HWM Reserve Previous Surface and Highwall Miner Mining Controlled Surface Resource Inclusive of Reserve / Converted to Reserve as of 12/31/23

3309 35 N Alpha Metallurgical Resources, LLC Map LBR-3 Virginia Properties Long Branch - Lower Banner (4900) Dickenson County, Virginia Coordinate System: Virginia South State Plane NAD 83 2000 Scale In Feet 0 Data Point Location HWM Reserve Previous Surface, Highwall Miner and Underground Mining Controlled Surface Resource Inclusive of Reserve / Converted to Reserve as of 12/31/23 Contour / Area Reserve
EX-96.6
18
finalelkruntrswithappend.htm
TECHNICAL REPORT SUMMARY - ELK RUN COMPLEX
finalelkruntrswithappend

Alpha Metallurgical Resources, Inc. Statement of Coal Resources and Reserves for the Elk Run Underground Complex in Accordance with United States SEC Standards as of December 31, 2023 Central Appalachian Coal Basin West Virginia, USA February 2024 Prepared for: Alpha Metallurgical Resources, Inc. 340 Martin Luther King Jr. Blvd. Bristol, TN 37620 Prepared by: MARSHALL MILLER & ASSOCIATES, INC. 582 Industrial Park Road Bluefield, Virginia 24605 www.mma1.com Alpha Metallurgical Resources, Inc. Statement of Coal Resources and Reserves for the Elk Run Underground Complex in Accordance with United States SEC Standards as of December 31, 2023 Central Appalachian Coal Basin West Virginia, USA MARSHALL MILLER & ASSOCIATES, INC. 1 Statement of Use and Preparation This Technical Report Summary (TRS) was prepared for the sole use of Alpha Metallurgical Resources, Inc. (Alpha) and its affiliated and subsidiary companies and advisors. Copies or references to information in this report may not be used without the written permission of Alpha. The report provides a statement of coal resources and coal reserves for Alpha, as defined under the United States Securities and Exchange Commission (SEC). The statement is based on information provided by Alpha and reviewed by various professionals within Marshall Miller & Associates, Inc. (MM&A). MM&A professionals who contributed to the drafting of this report meet the definition of Qualified Persons (QPs), consistent with the requirements of the SEC. The information in this TRS related to coal resources and reserves is based on, and fairly represents, information compiled by the QPs. At the time of reporting, MM&A’s QPs have sufficient experience relevant to the style of mineralization and type of deposit under consideration and to the activity they are undertaking to qualify as a QP as defined by the SEC. Certain information set forth in this report contains “forward-looking information”, including production, productivity, operating costs, capital costs, sales prices, and other assumptions. These statements are not guarantees of future performance and undue reliance should not be placed on them. The assumptions used to develop the forward-looking information and the risks that could cause the actual results to differ materially are detailed in the body of this report. Marshall Miller & Associates, Inc. (MM&A) hereby consents (i) to the use of the information contained in this report dated December 31, 2023, relating to estimates of coal resources and coal reserves controlled by Alpha, (ii) to the use of MM&A’s name, any quotations from or summarizations of this TRS in Alpha’s SEC filings, and (iii) to the filing of this TRS as an exhibit to Alpha’s SEC filings. Qualified Person: /s/ Marshall Miller & Associates, Inc. Date: February 9, 2024

Alpha Metallurgical Resources, Inc. Statement of Coal Resources and Reserves for the Elk Run Underground Complex in Accordance with United States SEC Standards as of December 31, 2023 Central Appalachian Coal Basin West Virginia, USA MARSHALL MILLER & ASSOCIATES, INC. 2 Table of Contents 1 Executive Summary ............................................................................................................... 8 1.1 Property Description ................................................................................................ 8 1.2 Ownership ................................................................................................................ 9 1.3 Geology .................................................................................................................... 9 1.4 Exploration Status .................................................................................................. 10 1.5 Operations and Development ................................................................................. 10 1.6 Mineral Resource ................................................................................................... 10 1.7 Mineral Reserve ..................................................................................................... 11 1.8 Capital Summary .................................................................................................... 12 1.9 Operating Costs ...................................................................................................... 13 1.10 Economic Evaluation .............................................................................................. 14 1.10.1 Discounted Cash Flow Analysis ................................................................. 16 1.10.2 Sensitivity Analysis .................................................................................... 17 1.11 Permitting .............................................................................................................. 17 1.12 Conclusion and Recommendations ......................................................................... 18 2 Introduction ........................................................................................................................ 18 2.1 Registrant and Terms of Reference ......................................................................... 18 2.2 Information Sources ............................................................................................... 18 2.3 Scope of Assignment .............................................................................................. 19 2.4 Personal Inspections ............................................................................................... 20 3 Property Description ........................................................................................................... 20 3.1 Location ................................................................................................................. 20 3.2 Titles, Claims or Leases ........................................................................................... 20 3.3 Mineral Rights ........................................................................................................ 22 3.4 Encumbrances ........................................................................................................ 22 3.5 Other Risks ............................................................................................................. 23 4 Accessibility, Climate, Local Resources, Infrastructure and Physiography .......................... 23 4.1 Topography, Elevation and Vegetation ................................................................... 23 4.2 Access and Transport ............................................................................................. 23 4.3 Proximity to Population Centers ............................................................................. 23 4.4 Climate and Length of Operating Season ................................................................ 24 Alpha Metallurgical Resources, Inc. Statement of Coal Resources and Reserves for the Elk Run Underground Complex in Accordance with United States SEC Standards as of December 31, 2023 Central Appalachian Coal Basin West Virginia, USA MARSHALL MILLER & ASSOCIATES, INC. 3 4.5 Infrastructure ......................................................................................................... 24 5 History ................................................................................................................................. 24 5.1 Previous Operation ................................................................................................. 24 5.2 Previous Exploration ............................................................................................... 25 6 Geological Setting, Mineralization and Deposit .................................................................. 25 6.1 Regional, Local and Property Geology..................................................................... 25 6.2 Mineralization ........................................................................................................ 26 6.3 Deposits ................................................................................................................. 26 7 Exploration .......................................................................................................................... 27 7.1 Nature and Extent of Exploration ........................................................................... 27 7.2 Drilling Procedures ................................................................................................. 29 7.3 Hydrology ............................................................................................................... 29 7.4 Geotechnical Data .................................................................................................. 30 8 Sample Preparation Analyses and Security ......................................................................... 30 8.1 Prior to Sending to the Lab ..................................................................................... 30 8.2 Lab Procedures ....................................................................................................... 31 9 Data Verification ................................................................................................................. 31 9.1 Procedures of Qualified Person .............................................................................. 31 9.2 Limitations ............................................................................................................. 32 9.3 Opinion of Qualified Person.................................................................................... 32 10 Mineral Processing and Metallurgical Testing ..................................................................... 32 10.1 Testing Procedures ................................................................................................. 32 10.2 Relationship of Tests to the Whole ......................................................................... 33 10.3 Lab Information ...................................................................................................... 33 10.4 Relevant Results ..................................................................................................... 33 11 Mineral Resource Estimates ................................................................................................ 33 11.1 Assumptions, Parameters and Methodology .......................................................... 34 11.1.1 Geostatistical Analysis .............................................................................. 35 11.2 Resources Exclusive of Reserves ............................................................................. 38 11.2.1 Initial Economic Assessment ..................................................................... 39 11.3 Qualified Person’s Estimates .................................................................................. 40 11.4 Qualified Person’s Opinion ..................................................................................... 41 12 Mineral Reserve Estimates .................................................................................................. 41 12.1 Assumptions, Parameters and Methodology .......................................................... 41

Alpha Metallurgical Resources, Inc. Statement of Coal Resources and Reserves for the Elk Run Underground Complex in Accordance with United States SEC Standards as of December 31, 2023 Central Appalachian Coal Basin West Virginia, USA MARSHALL MILLER & ASSOCIATES, INC. 4 12.2 Underground Coal Reserves ................................................................................... 43 12.2.1 Checkmate Powellton Seam (Map 3) ........................................................ 43 12.3 Qualified Person’s Estimates .................................................................................. 43 12.4 Qualified Person’s Opinion ..................................................................................... 44 13 Mining Methods .................................................................................................................. 44 13.1 Geotech and Hydrology .......................................................................................... 45 13.2 Production Rates .................................................................................................... 45 13.3 Mining Related Requirements ................................................................................ 46 13.3.1 Underground ............................................................................................ 46 13.4 Required Equipment and Personnel ....................................................................... 46 13.4.1 Underground Mines .................................................................................. 46 14 Processing and Recovery Methods ...................................................................................... 47 14.1 Description or Flowsheet ........................................................................................ 47 14.2 Requirements for Energy, Water, Material and Personnel ...................................... 50 15 Infrastructure ...................................................................................................................... 51 15.1 Chess Processing Preparation Plant ........................................................................ 51 16 Market Studies .................................................................................................................... 54 16.1 Market Description ................................................................................................. 54 16.2 Price Forecasts ....................................................................................................... 55 16.3 Contract Requirements .......................................................................................... 55 17 Environmental Studies, Permitting and Plans, Negotiations or Agreements with Local Individuals .................................................................................................................. 56 17.1 Results of Studies ................................................................................................... 56 17.2 Requirements and Plans for Waste Disposal ........................................................... 56 17.3 Permit Requirements and Status ............................................................................ 56 17.4 Local Plans, Negotiations or Agreements ................................................................ 58 17.5 Mine Closure Plans ................................................................................................. 58 17.6 Qualified Person’s Opinion ..................................................................................... 59 18 Capital and Operating Costs ................................................................................................ 59 18.1 Capital Cost Estimate .............................................................................................. 59 18.2 Operating Cost Estimate ......................................................................................... 60 19 Economic Analysis ............................................................................................................... 62 19.1 Economic Evaluation .............................................................................................. 62 19.1.1 Introduction .............................................................................................. 62 Alpha Metallurgical Resources, Inc. Statement of Coal Resources and Reserves for the Elk Run Underground Complex in Accordance with United States SEC Standards as of December 31, 2023 Central Appalachian Coal Basin West Virginia, USA MARSHALL MILLER & ASSOCIATES, INC. 5 19.1.2 Cash Flow Summary .................................................................................. 66 19.1.3 Discounted Cash Flow Analysis ................................................................. 68 19.1.4 Sensitivity Analysis .................................................................................... 68 20 Adjacent Properties ............................................................................................................. 69 20.1 Information Used ................................................................................................... 69 21 Other Relevant Data and Information ................................................................................. 70 22 Interpretation and Conclusions ........................................................................................... 70 22.1 Conclusion .............................................................................................................. 70 22.2 Risk Factors ............................................................................................................ 70 22.2.1 Governing Assumptions ............................................................................ 71 22.2.2 Limitations ................................................................................................ 71 22.2.3 Methodology ............................................................................................ 72 22.2.4 Development of the Risk Matrix................................................................ 72 22.2.5 Categorization of Risk Levels and Color Code Convention ......................... 75 22.2.6 Description of the Coal Property ............................................................... 75 22.2.7 Summary of Residual Risk Ratings ............................................................. 76 22.2.8 Risk Factors ............................................................................................... 76 23 Recommendations .............................................................................................................. 83 24 References ........................................................................................................................... 83 25 Reliance on Information Provided by Registrant ................................................................. 83 FIGURES (IN REPORT) Figure 1-1: Alpha’s Elk Run Property Location Map ........................................................................ 9 Figure 1-2: Projected Capital Expenditures – Consolidated Operations......................................... 13 Figure 1-3: Elk Run Operating Costs .............................................................................................. 14 Figure 1-4: Sensitivity of NPV........................................................................................................ 17 Figure 6-1: Elk Run Stratigraphic Column ...................................................................................... 26 Figure 7-1: Elk Run Cross-Section.................................................................................................. 28 Figure 11-1: Histogram of the Total Seam Thickness for the Powellton Seam Present in the Elk Run Complex .............................................................................................................. 36 Figure 11-2: Scatter plot of the Total Seam Thickness for the Powellton Seam Present in the Elk Run Complex .............................................................................................................. 36 Figure 11-3: Variogram of the Total Seam Thickness for the Powellton Seam Present in the Elk Run Complex ..................................................................................................................... 37 Figure 11-4: Result of DHSA for the Powellton Seam Present in the Elk Run Complex................... 38 Figure 11-5: Results of Initial Economic Assessment ..................................................................... 40

Alpha Metallurgical Resources, Inc. Statement of Coal Resources and Reserves for the Elk Run Underground Complex in Accordance with United States SEC Standards as of December 31, 2023 Central Appalachian Coal Basin West Virginia, USA MARSHALL MILLER & ASSOCIATES, INC. 6 Figure 13-1: Checkmate Powellton Portal Location and Preparation Plant.................................... 47 Figure 14-1: Chess Process Preparation Plant Existing Equipment ................................................ 49 Figure 14-2: Railcar Loading Facility on the December 2022 Site Visit ........................................... 50 Figure 15-1: Chess Processing Facilities ........................................................................................ 52 Figure 15-2: Chess Processing Raw Coal Facilities ......................................................................... 53 Figure 15-3: Chess Processing Refuse Impoundment .................................................................... 54 Figure 18-1: Projected Capital Expenditures – Consolidated Elk Run Operations .......................... 60 Figure 18-2: Elk Run Operating Costs ............................................................................................ 62 Figure 19-1: Projection of Sales Tons ............................................................................................ 63 Figure 19-2: Consolidated Annual Revenue .................................................................................. 64 Figure 19-3: Revenue, Cash Costs, and EBITDA ............................................................................. 65 Figure 19-4: Annual EBITDA .......................................................................................................... 66 Figure 19-5: Net Cash Flow after Tax (Before Debt Service) .......................................................... 68 Figure 19-6: Sensitivity of NPV...................................................................................................... 69 TABLES (IN REPORT) Table 1-1: Coal Resources Summary as of December 31, 2023 ..................................................... 11 Table 1-2: Coal Reserves Summary (Marketable Sales Basis) as of December 31, 2023 ................ 12 Table 1-3: Life-of-Mine Tonnage, P&L before Tax, and EBITDA ..................................................... 15 Table 1-4: Project Cash Flow Summary (000) ................................................................................ 15 Table 2-1: Data Sources ................................................................................................................ 19 Table 3-1: Mineral Control – Mid-West Virginia (Elk Run) Complex .............................................. 21 Table 11-1: General Reserve & Resource Criteria ......................................................................... 34 Table 11-2: DHSA Results Summary for Radius from a Central Point ............................................. 38 Table 11-3: Results of Initial Economic Assessment ($/ton) .......................................................... 40 Table 11-4: Coal Resources Summary as of December 31, 2023 ................................................... 41 Table 12-1: Coal Reserves Summary (Marketable Sales Basis) as of December 31, 2023............... 44 Table 13-1: Elk Run Complex Underground Mine Production Schedule (x 1,000 Saleable Tons).... 46 Table 16-1: Quality Specifications ................................................................................................. 55 Table 16-2: Price Forecasts ........................................................................................................... 55 Table 17-1: Elk Run Mining Permits .............................................................................................. 58 Table 18-1: Summary of Capital Expenditures Schedule by Mine .................................................. 60 Table 18-2: Estimated Coal Production Taxes and Sales Costs ...................................................... 61 Table 19-1: Life-of-Mine Tonnage, P&L before Tax, and EBITDA ................................................... 65 Table 19-2: Project Cash Flow Summary (000) .............................................................................. 66 Table 22-1: Probability Level Table ............................................................................................... 73 Table 22-2: Consequence Level Table ........................................................................................... 74 Table 22-3: Risk Matrix ................................................................................................................. 75 Table 22-4: Risk Assessment Matrix.............................................................................................. 76 Table 22-5: Geological and Coal Resource Risk Assessment (Risks 1 and 2) .................................. 77 Table 22-6: Environmental (Risks 3 and 4) .................................................................................... 78 Alpha Metallurgical Resources, Inc. Statement of Coal Resources and Reserves for the Elk Run Underground Complex in Accordance with United States SEC Standards as of December 31, 2023 Central Appalachian Coal Basin West Virginia, USA MARSHALL MILLER & ASSOCIATES, INC. 7 Table 22-7: Regulatory Requirements (Risk 5) .............................................................................. 78 Table 22-8: Market and Transportation (Risk 6) ............................................................................ 79 Table 22-9: Market and Transportation (Risk 7) ............................................................................ 79 Table 22-10: Methane Management (Risk 8) ................................................................................ 80 Table 22-11: Mine Fires (Risk 9) .................................................................................................... 80 Table 22-12: Ground Control (Risk 10) .......................................................................................... 81 Table 22-13: Availability of Supplies and Equipment (Risk 11) ...................................................... 81 Table 22-14: Labor – Work Stoppage (Risk 12).............................................................................. 82 Table 22-15: Labor – Retirement (Risk 13) .................................................................................... 82 Table 22-16: Health and Safety (Risk 14) ...................................................................................... 82 Table 25-1: Information from Registrant Relied Upon by MM&A ................................................. 83 Appendices A ............................................................................................................................. Summary Tables B ......................................... Initial Economic Assessment Resources Exclusive of Reserves (per Ton) C ...............................................................................................................................................Maps

Alpha Metallurgical Resources, Inc. Statement of Coal Resources and Reserves for the Elk Run Underground Complex in Accordance with United States SEC Standards as of December 31, 2023 Central Appalachian Coal Basin West Virginia, USA MARSHALL MILLER & ASSOCIATES, INC. 8 1 Executive Summary 1.1 Property Description Alpha Metallurgical Resources, Inc. (Alpha) authorized Marshall Miller & Associates, Inc. (MM&A) to prepare this Technical Report Summary (TRS) of its controlled coal reserves located at the Elk Run Underground Complex (Elk Run or the Property) in Boone County, West Virginia. The report provides a statement of coal resources and coal reserves for Alpha, as defined under the United States Securities and Exchange Commission (SEC). Coal resources and coal reserves are herein reported in imperial units of measurement. Surface facilities for the operations are located along the Big Coal River adjacent to a CSX rail line. The property is located about 3.4 miles northwest of the town of Whitesville, West Virginia, and approximately 24 miles northwest of Beckley, the county seat of Raleigh County (see Figure 1-1). Elk Run properties are included within Alpha’s Mid-West Virginia mineral holdings composed of approximately 244,275 total acres in Raleigh, Boone, Fayette and Kanawha Counties, West Virginia (see Figure 1-1). There are approximately 52 separate leases for the Mid-West Virginia mineral holdings group which includes the Elk Run complex. Alpha Metallurgical Resources, Inc. Statement of Coal Resources and Reserves for the Elk Run Underground Complex in Accordance with United States SEC Standards as of December 31, 2023 Central Appalachian Coal Basin West Virginia, USA MARSHALL MILLER & ASSOCIATES, INC. 9 Figure 1-1: Alpha’s Elk Run Property Location Map 1.2 Ownership The Elk Run property involves a complex combination of previous ownership. Predecessors of Alpha, namely Alpha Natural Resources (Alpha) and Massey Energy (Massey) previously held mining rights on the majority of the Property. 1.3 Geology The Elk Run Mining Complex was idled in 2015; however, the first production cuts in the Checkmate Powellton mine were made in October 2023. Mining operations began in 1982 at the site. Currently identified coal resources and reserves are located in the Upper Cedar Grove, Peerless and Powellton seams. These coal seams are historically utilized as coking coal. Strata on the Property reside in the Pennsylvanian-aged (approximately 290 to 330 million years ago) Kanawha and New River Formations. Due to the high value of these coking coals, all the seams have been extensively mined in the past. The rock formations between the coal seams are characterized by large proportions of sandstone

Alpha Metallurgical Resources, Inc. Statement of Coal Resources and Reserves for the Elk Run Underground Complex in Accordance with United States SEC Standards as of December 31, 2023 Central Appalachian Coal Basin West Virginia, USA MARSHALL MILLER & ASSOCIATES, INC. 10 interspersed with shale units. The coal seams reach the highest structural elevations along the southeastern margin of the Property, generally dipping toward the northwest. 1.4 Exploration Status The Property has been extensively explored, largely by drilling using continuous coring and rotary drilling methods but also by obtaining coal measurements at mine exposures, and by downhole geophysical methods. A significant amount of historical data was acquired or generated by previous owners of the Property. These sources comprise the primary data used in the evaluation of the coal resources and coal reserves on the Property. MM&A examined the data available for the evaluation and incorporated all pertinent information into this TRS. Where data appeared to be anomalous or not representative, that data was excluded from the digital databases and subsequent processing by MM&A. 1.5 Operations and Development As of December 31, 2023, the facility is being developed. Mining is anticipated to occur in the Upper Cedar Grove, Peerless and Powellton seams. The first production cuts in the Checkmate Powellton mine were made in October 2023. The Upper Cedar Grove and Powellton seams will produce a high- volatile metallurgical product. The Peerless seam with its higher sulfur content will participate in both metallurgical and steam markets. Based on the mine plans developed as part of this TRS, annual deep mine production peaks at 1.5 million clean tons in 2036 and will be depleted in 2045. In addition to the Checkmate Powellton Mine, the Elk Run Complex also includes the Chess Processing Preparation Plant. The plant site includes raw coal storage, clean coal storage, a centrifugal dryer, a railroad loadout as well as refuse disposal areas. The equipment includes heavy media vessels for primary separation, low density cyclones are used for intermediate separation and froth flotation and spirals are utilized for fine coal separation. The plant has a feed rate capacity of 2,200 raw tons per hour. Elk Run processing plant is currently undergoing renovations and will come online near the end of 2023 or early January 2024. 1.6 Mineral Resource A coal resource estimate, summarized in Table 1-1 was prepared as of December 31, 2023, for the Elk Run property controlled by Alpha. Alpha Metallurgical Resources, Inc. Statement of Coal Resources and Reserves for the Elk Run Underground Complex in Accordance with United States SEC Standards as of December 31, 2023 Central Appalachian Coal Basin West Virginia, USA MARSHALL MILLER & ASSOCIATES, INC. 11 Table 1-1: Coal Resources Summary as of December 31, 2023 Coal Resource (Dry Tons, In Situ) Quality (Dry Basis) Area/Mine Seam Measured Indicated Inferred Total Ash% Sulfur% VM% Inclusive of Reserve/Converted to Reserve Checkmate Powellton 80,243,000 56,531,000 0 136,774,000 27 1.0 - Subtotal Subtotal 80,243,000 56,531,000 0 136,774,000 27 1.0 Exclusive of Reserve/Not Converted to Reserve Prenter Upper Cedar Grove 20,600,000 16,264,000 63,000 36,928,000 18 1.8 - Elk Run (Castle II) Peerless 12,607,000 4,207,000 0 16,815,000 25 2.4 - Checkmate Powellton 12,316,000 1,888,000 16,000 14,220,000 27 1.0 - Subtotal Subtotal 45,523,000 22,360,000 79,000 67,962,000 25 1.8 Grand Total Inclusive of Reserve/Converted to Reserve 80,243,000 56,531,000 0 136,774,000 27 1.0 Exclusive of Reserve/Not Converted to Reserve 45,523,000 22,360,000 79,000 67,962,000 25 1.8 Grand Total 125,766,000 78,891,000 79,000 204,736,000 26 1.2 Note(1): Resource tons are inclusive of reserve tons since they include the in-situ tons from which recoverable coal reserves are derived. Note (2): Coal resources are reported on a dry basis. Surface moisture and inherent moisture are excluded. Note (3): The Property contains 67.88 million tons (Mt) of dry, in-place measured and indicated coal resources exclusive of reserves as of December 31, 2023. Totals may not add due to rounding. See Appendix A for detailed breakdown. 1.7 Mineral Reserve The Resource estimate outlined in Table 1-1 inclusive of reserves has been used as the basis for this Reserve calculation, which utilizes a reasonable Preliminary Feasibility Study, a Life-of Mine (LOM) Mine Plan and practical recovery factors. Production modeling was completed with an effective start date of October 23, 2023, as this was the date that the first continuous miner production cuts were made at Checkmate Powellton. Factors that would typically preclude conversion of a coal resource to coal reserve, include the following: inferred resource classification; absence of coal quality; poor mine recovery; lack of access; geological encumbrances associated with overlying and underlying strata; seam thinning; structural complication; and insufficient exploration have all been considered. Reserve consideration excludes those portions of the resource area, which exhibit geological and operational encumbrances. Proven and probable coal reserves were derived from the defined in-situ coal resource considering relevant processing, economic (including technical estimates of capital, revenue and cost), marketing, legal, environmental, socioeconomic, and regulatory factors. The proven and probable coal reserves on the Property are summarized below in Table 1-2.

Alpha Metallurgical Resources, Inc. Statement of Coal Resources and Reserves for the Elk Run Underground Complex in Accordance with United States SEC Standards as of December 31, 2023 Central Appalachian Coal Basin West Virginia, USA MARSHALL MILLER & ASSOCIATES, INC. 12 Table 1-2: Coal Reserves Summary (Marketable Sales Basis) as of December 31, 2023 Demonstrated Coal Reserves Quality (Dry Basis) (Wet Tons, Washed or Direct Shipped) By Reliability Category By Control Type Area Seam Proven Probable Total Owned Leased Ash% Sulfur% VM% Checkmate Powellton 17,341,000 11,093,000 28,434,000 139,000 28,295,000 6 1.0 34 Grand Total 17,341,000 11,093,000 28,434,000 139,000 28,295,000 6 1.0 34- Notes: Marketable reserve tons are reported on a moist basis, including a combination of surface and inherent moisture. Coal quality is based on a weighted average of laboratory analysis from core holes. The combination of surface and inherent moisture is modeled at 6.0-percent. Actual product moisture is dependent upon multiple geological factors, operational factors, and product contract specifications and can exceed 8-percent. As such, the modeled moisture values provide a level of conservatism for reserve reporting. *Some reserves lack coal quality. Totals may not add due to rounding. See Appendix A for detailed breakdown. In summary, as of December 31, 2023, Alpha controls a total of 28.43 million tons (Mt) (moist basis) of marketable coal reserves at Elk Run. Of that total, 61 percent are proven, and 39 percent are probable. Approximately 0.14 Mt are owned, and the remaining 28.29 Mt are leased coal reserves. Of the total, 4.72 Mt are permitted, and the remaining 23.71 Mt are not permitted. The maps included in Appendix C reflect mining depletion at the time of the resource/reserve calculation based on Alpha mine maps as of September 30, 2023. There has been no production mining with processing at Elk Run since 2015 prior to the first production cuts in the Checkmate Powellton mine, which were made in October 2023. Mine depletion tonnages were supplied by Alpha through the end of 2023, and MM&A deducted this historical production from the mapped reserves in order to estimate reserves as of December 31, 2023. 1.8 Capital Summary Alpha provided MM&A with information related to the number of currently operating production units adjacent to Elk Run. MM&A’s capital schedules assume that major equipment rebuilds occur over the course of each machine’s remaining assumed operating life. Replacement equipment was scheduled based on MM&A’s experience and knowledge of mining equipment and industry standards with respect to the useful life of such equipment. As one mine is depleted, the equipment is moved to its replacement. The capital expenditures tables detail costs for major equipment and infrastructure such as conveyor belt terminal groups. “Other” costs include expenditures for mine access and construction, mine extension capital and miscellaneous costs. A summary of the estimated capital for the consolidated Elk Run operations is provided in Figure 1-2 below. Alpha Metallurgical Resources, Inc. Statement of Coal Resources and Reserves for the Elk Run Underground Complex in Accordance with United States SEC Standards as of December 31, 2023 Central Appalachian Coal Basin West Virginia, USA MARSHALL MILLER & ASSOCIATES, INC. 13 Figure 1-2: Projected Capital Expenditures – Consolidated Operations 1.9 Operating Costs Alpha provided historical costs and budgeted projections of operating costs for its active mines in West Virginia for MM&A’s review. MM&A used the historical and/or budget cost information as a reference and developed a personnel schedule for each mine. Hourly labor rates and salaries were based upon information contained in Alpha’s financial summaries. Fringe benefit costs were developed for vacation and holidays, federal and state unemployment insurance, retirement, workers’ compensation and pneumoconiosis, casualty and life insurance, healthcare and bonuses. A cost factor for mine supplies was developed that relates expenditures to mine advance rates for roof control costs and other mine supply costs based on the historical cost data provided by Alpha. Other factors were developed for maintenance and repair costs, rentals, mine power, outside services, coal preparation plant processing, refuse handling, coal loading, property taxes, and insurance and bonding and other direct mining costs. Appropriate royalty rates were assigned for production from leased coal lands and sales taxes were calculated for state severance taxes, the federal black lung excise tax, and federal and state reclamation fees. A summary of the projected operating costs for the consolidated Elk Run operations is provided in Figure 1-3.

Alpha Metallurgical Resources, Inc. Statement of Coal Resources and Reserves for the Elk Run Underground Complex in Accordance with United States SEC Standards as of December 31, 2023 Central Appalachian Coal Basin West Virginia, USA MARSHALL MILLER & ASSOCIATES, INC. 14 Figure 1-3: Elk Run Operating Costs 1.10 Economic Evaluation The pre-feasibility financial model prepared for this TRS was developed to test the economic viability of each coal resource area. The results of this financial model are not intended to represent a bankable feasibility study, required for financing of any current or future mining operations contemplated for the Alpha properties, but are intended to establish the economic viability of the estimated coal reserves. Cash flows are simulated on an annual basis based on projected production from the coal reserves. The discounted cash flow analysis presented herein is based on an effective date of January 1, 2024. On an un-levered basis, the NPV of the project cash flow after taxes represents the Enterprise Value of the project. The project cash flow, excluding debt service, is calculated by subtracting direct and indirect operating expenses and capital expenditures from revenue. Direct costs include labor, operating supplies, maintenance and repairs, facilities costs for materials handling, coal preparation, refuse disposal, coal loading, reclamation, and general and administrative costs. Indirect costs include statutory and legally agreed upon fees related to direct extraction of the mineral. The indirect costs are the Federal black lung tax, Federal and State reclamation taxes, property taxes, coal production royalties, and income taxes. The Alpha mines’ historical costs provided a useful reference for MM&A’s cost estimates. Alpha Metallurgical Resources, Inc. Statement of Coal Resources and Reserves for the Elk Run Underground Complex in Accordance with United States SEC Standards as of December 31, 2023 Central Appalachian Coal Basin West Virginia, USA MARSHALL MILLER & ASSOCIATES, INC. 15 Company-wide pricing data as provided by Alpha is described in Table 16-2. Note that not all products reflected in Table 16-2 will apply to every business unit. The pricing data assumes a flat-line long-term realization of $140 per short ton port pricing, with an average of $113.94 per ton netback pricing reflective of the high-volatile product anticipated to be sold at Elk Run. These estimates are based on long-term pricing published by third party sources and adjusted for quality and transportation. The netback pricing represents adjustments made to published benchmark pricing based on quality and transportation. A large majority of the coal sold by Alpha and their future Elk Run business group is shipped internationally as part of blended products from other business units within Alpha or sourced from other companies. These netback adjustments reflect these additional costs carried after the products leave the Elk Run business unit. Table 1-3 shows the MM&A projected LOM tonnage, P&L, and EBITDA for each Alpha mine at Elk Run. Table 1-3: Life-of-Mine Tonnage, P&L before Tax, and EBITDA LOM Tonnage LOM Pre-Tax P&L P&L Per Ton LOM EBITDA EBITDA Per Ton Castle Peerless* - $0 $- $0 $- Checkmate Powellton 28,457 $40,698 $1.43 $462,803 $16.26 Consolidated Deep Mines 28,457 $40,698 $1.43 $462,803 $16.26 Note: * This resource area failed to achieve positive results in the economic evaluation. Therefore, the coal tons and negative economic results have been excluded from the estimate of coal reserves in this TRS and economic summary above. ** LOM tonnage evaluated in the financial model includes 4th quarter 2023 production (22,902 clean tons), which was subtracted from coal reserves in order to make the effective date of the reserves December 31, 2023. As shown in Table 1-3, the Alpha consolidated Elk Run operations show positive LOM P&L and EBITDA of $40.7 million and $462.8 million, respectively. Alpha’s consolidated Elk Run cash flow summary in constant dollars, excluding debt service, is shown in Table 1-4 below. Table 1-4: Project Cash Flow Summary (000) YE 12/31 YE 12/31 YE 12/31 YE 12/31 YE 12/31 YE 12/31 Total 2023 2024 2025 2026 2027 2028 Production & Sales tons 28,457 86 1,131 1,253 1,307 1,401 1,369 Total Revenue $3,242,361 $9,835 $128,881 $142,766 $148,947 $159,607 $155,944 EBITDA $462,803 ($74) $12,689 $21,247 $22,502 $22,885 $25,016 Net Income $9,991 ($1,397) ($6,283) ($2,466) ($476) $324 ($682) Net Cash Provided by Operating Activities $432,096 $646 $9,582 $20,227 $22,789 $23,900 $25,249 Purchases of Property, Plant, and Equipment ($252,397) $0 ($17,338) ($27,969) ($5,100) ($4,320) ($16,259) Net Cash Flow $179,699 $646 ($7,756) ($7,742) $17,689 $19,580 $8,990 YE 12/31 YE 12/31 YE 12/31 YE 12/31 YE 12/31 YE 12/31 YE 12/31 2029 2030 2031 2032 2033 2034 2035 Production & Sales tons 1,426 1,331 1,429 1,423 1,334 1,190 1,264 Total Revenue $162,449 $151,631 $162,827 $162,157 $152,049 $135,567 $143,998 EBITDA $32,463 $23,271 $33,122 $32,616 $23,808 $9,357 $15,046 Net Income $12,173 $3,762 $13,620 $14,642 $5,227 ($7,866) ($1,713) Net Cash Provided by Operating Activities $29,384 $24,690 $30,159 $31,361 $25,044 $13,886 $16,036 Purchases of Property, Plant, and Equipment ($16,277) ($5,887) ($7,200) ($15,030) ($16,284) ($11,706) ($10,207) Net Cash Flow $13,107 $18,803 $22,959 $16,331 $8,760 $2,179 $5,828

Alpha Metallurgical Resources, Inc. Statement of Coal Resources and Reserves for the Elk Run Underground Complex in Accordance with United States SEC Standards as of December 31, 2023 Central Appalachian Coal Basin West Virginia, USA MARSHALL MILLER & ASSOCIATES, INC. 16 YE 12/31 YE 12/31 YE 12/31 YE 12/31 YE 12/31 YE 12/31 YE 12/31 2036 2037 2038 2039 2040 2041 2042 Production & Sales tons 1,528 1,472 1,502 1,251 1,389 1,238 1,236 Total Revenue $174,124 $167,714 $171,141 $142,551 $158,220 $141,088 $140,820 EBITDA $33,043 $31,027 $32,973 $12,608 $24,272 $11,625 $12,005 Net Income $11,664 $9,510 $8,842 ($8,018) $1,493 ($8,683) ($7,241) Net Cash Provided by Operating Activities $28,442 $30,456 $31,626 $19,104 $23,352 $17,153 $15,452 Purchases of Property, Plant, and Equipment ($19,505) ($7,200) ($22,678) ($18,166) ($14,846) ($8,040) ($1,080) Net Cash Flow $8,937 $23,256 $8,948 $938 $8,505 $9,113 $14,372 YE 12/31 YE 12/31 YE 12/31 YE 12/31 YE 12/31 YE 12/31 YE 12/31 2043 2044 2045 2046 2047 2048 2049 Production & Sales tons 1,414 1,170 312 0 0 0 0 Total Revenue $161,150 $133,317 $35,578 $0 $0 $0 $0 EBITDA $25,191 $13,181 $589 ($4,376) ($1,732) ($874) ($445) Net Income $5,433 ($5,036) ($11,524) ($8,753) ($3,464) ($1,747) ($890) Net Cash Provided by Operating Activities $24,942 $18,290 $9,471 ($35,487) ($11,829) ($5,914) ($2,957) Purchases of Property, Plant, and Equipment ($7,304) $0 $0 $0 $0 $0 $0 Net Cash Flow $17,638 $18,290 $9,471 ($35,487) ($11,829) ($5,914) ($2,957) YE 12/31 YE 12/31 YE 12/31 YE 12/31 YE 12/31 YE 12/31 YE 12/31 2050 2051 2052 2053 2054 2055 2056 Production & Sales tons 0 0 0 0 0 0 0 Total Revenue $0 $0 $0 $0 $0 $0 $0 EBITDA ($232) ($0) ($0) ($0) ($0) ($0) ($0) Net Income ($463) ($0) ($0) ($0) ($0) ($0) ($0) Net Cash Provided by Operating Activities ($2,957) $0 $0 $0 $0 $0 $0 Purchases of Property, Plant, and Equipment $0 $0 $0 $0 $0 $0 $0 Net Cash Flow ($2,957) $0 $0 $0 $0 $0 $0 Notes: (1) The Castle II (Peerless) resource area failed to achieve positive results in the economic evaluation. Therefore, the coal tons and negative economic results for this area have been excluded from the estimate of coal reserves in this TRS and economic summary above. LOM tonnage evaluated in the financial model includes 4th quarter 2023 production (22,902 clean tons), which was subtracted from coal reserves in order to make the effective date of the reserves December 31, 2023. (2) Results shown for 2023 represent 4th quarter only. Consolidated cash flows are driven by annual sales tonnage, which grows from 1.1 million tons in 2024 to a peak of nearly 1.5 million tons in 2036. Between years 2037 and 2043, sales range from 1.2 million to 1.5 million tons and between years 2044-2045, sales range from 0.3 million tons to 1.2 million tons. Projected consolidated revenue grows from $128.9 million in 2024 to a peak of $174.1 million in 2036. Revenue totals $3.2 billion for the project’s life. Consolidated cash flow from operations is positive throughout the projected operating period, with the exception of post-production years, due to end-of-mine reclamation spending. Consolidated cash flow from operations peaks at $31.6 million in 2038 and totals $432.1 million over the project life. Capital expenditures total $71.0 million during the first five years and $252.4 million over the project’s life. 1.10.1 Discounted Cash Flow Analysis Cash flow after tax, but before debt service, generated over the life of the project was discounted to NPV at a 16.57% discount rate, which represents MM&A’s estimate of the constant dollar, risk adjusted WACC for likely market participants if the subject reserves were offered for sale. On an un-levered basis, the NPV of the project cash flows represents the Enterprise Value of the project and amounts to $50.9 million. Alpha is an active producer, and the financial model shows positive net cash flow for Alpha Metallurgical Resources, Inc. Statement of Coal Resources and Reserves for the Elk Run Underground Complex in Accordance with United States SEC Standards as of December 31, 2023 Central Appalachian Coal Basin West Virginia, USA MARSHALL MILLER & ASSOCIATES, INC. 17 each year of the operating life of the Elk Run reserves. The pre-feasibility financial model prepared for the TRS was developed to test the economic viability of each coal resource area. The NPV estimate was made for the purpose of confirming the economics for classification of coal reserves and not for purposes of valuing Alpha or its Elk Run assets. Mine plans were not optimized, and actual results of the operations may be different, but in all cases, the mine production plan assumes the properties are under competent management. 1.10.2 Sensitivity Analysis Sensitivity of the NPV results to changes in the key drivers is presented in the chart below. The sensitivity study shows the NPV at the 16.57% discount rate when Base Case sales prices, operating costs, capital costs and discount rate are increased and decreased in increments of 5% within a +/- 15% range. Figure 1-4: Sensitivity of NPV As shown, NPV is quite sensitive to changes in sales price, operating cost estimates and the discount rate, and slightly sensitive to changes in capital cost estimates. 1.11 Permitting Alpha has obtained the initial mining and discharge permits to begin development/production mining and to operate the processing plant, loadout and related support facilities. MM&A is unaware of any

Alpha Metallurgical Resources, Inc. Statement of Coal Resources and Reserves for the Elk Run Underground Complex in Accordance with United States SEC Standards as of December 31, 2023 Central Appalachian Coal Basin West Virginia, USA MARSHALL MILLER & ASSOCIATES, INC. 18 obvious or current Alpha permitting issues that are expected to prevent the issuance of future permits. Alpha, along with all coal producers, is subject to a level of uncertainty regarding future permits due to federal government oversight into state programs by agencies such as the United States Environmental Protection Agency (EPA) and the United States Fish and Wildlife Service (USFW). 1.12 Conclusion and Recommendations Sufficient data has been obtained through various exploration and sampling programs and mining operations to support the geological interpretations of seam structure and thickness for coal horizons situated on the Elk Run Property and reviewed in the study. The data is of sufficient quantity and reliability to reasonably support the coal resource and coal reserve estimates in this TRS. The geological data and preliminary feasibility study, which consider mining plans, revenue, and operating and capital cost estimates are sufficient to support the classification of coal reserves provided herein. This geologic evaluation conducted in conjunction with the preliminary feasibility study concludes that the 28.43 Mt of marketable underground coal reserves identified on the Property are economically mineable under reasonable expectations of market prices for metallurgical coal products, estimated operation costs, and capital expenditures. 2 Introduction 2.1 Registrant and Terms of Reference This report was prepared for the sole use of Alpha Metallurgical Resources, Inc. (Alpha) and its affiliated and subsidiary companies and advisors. The report provides a statement of coal resources and coal reserves for Alpha, as defined under the United States Securities and Exchange Commission (SEC). Exploration results and Resource calculations were used as the basis for the mine planning and the preliminary feasibility study completed to determine the extent and viability of the reserve. Coal resources and coal reserves are herein reported in imperial units of measurement. 2.2 Information Sources The TRS is based on information provided by Alpha and reviewed by MM&A’s professionals, including geologists, mining engineers, civil engineers, and environmental scientists. MM&A’s professionals hold professional registrations and memberships which qualify them as Qualified Persons in accordance with SEC guidelines. Alpha Metallurgical Resources, Inc. Statement of Coal Resources and Reserves for the Elk Run Underground Complex in Accordance with United States SEC Standards as of December 31, 2023 Central Appalachian Coal Basin West Virginia, USA MARSHALL MILLER & ASSOCIATES, INC. 19 Sources of data and information are listed below in Table 2-1. Table 2-1: Data Sources Category Information Provided by Alpha Report Section Geological Geologic data including digital databases and original source data including geologist logs, driller’s logs, geophysical logs. 9.1 Coal Quality Database of coal quality information supplemented with original source laboratory sheets where available. 10.1 Mining Historical productivities and manpower projections. 13.2, 13.4 Coal Preparation Flow Sheet and other information related to coal processing. 14.1 Waste Disposal Engineering data and estimates representing remaining capacities for coarse and fine coal waste disposal. 17.2 Costs Historical and budgetary operating cost information used to derive cost drivers for reserve financial modeling 18.2 Note: While the sources of data listed in Table 2-1 are not exhaustive, they represent a significant portion of information which supports this TRS. MM&A reviewed the provided data and found it to be reasonable prior to incorporating it into the TRS. The TRS contains “forward-looking information” including forecasts of productivity and annual coal production, operating and capital cost estimates, coal sales price forecasts, the assumption that Alpha will continue to acquire necessary permits, and other assumptions. The TRS statements and conclusions are not a guarantee of future performance and undue reliance should not be placed on them. The ability of Alpha to recover the estimated coal reserves is dependent on multiple factors beyond the control of MM&A including, but not limited to geologic factors, mining conditions, regulatory approvals and changes in regulations. In all cases, the plans assume the Property is under competent management. 2.3 Scope of Assignment Alpha engaged MM&A to conduct a coal reserve evaluation of the Alpha coal properties as of December 31, 2023. For the evaluation, the following tasks were to be completed: > Conduct site visits of the mines and mine infrastructure facilities. > Process the information supporting the estimation of coal resources and reserves into geological models. > Develop life-of-reserve mine (LOM) plans and financial models. > Hold discussions with Alpha company management. > Prepare and issue a Technical Report Summary (TRS) providing a statement of coal reserves which would include: - A description of the mines and facilities. - A description of the evaluation process. - An estimation of coal reserves with compliance elements as stated under the SEC S-K 1300 regulations.

Alpha Metallurgical Resources, Inc. Statement of Coal Resources and Reserves for the Elk Run Underground Complex in Accordance with United States SEC Standards as of December 31, 2023 Central Appalachian Coal Basin West Virginia, USA MARSHALL MILLER & ASSOCIATES, INC. 20 2.4 Personal Inspections MM&A is very familiar with Elk Run’s West Virginia Properties, having provided a variety of services in recent years. Qualitied Persons involved in this TRS have conducted multiple site visits, most recently in December 2022. 3 Property Description 3.1 Location The Elk Run Mine Complex is located in the Central Appalachian Basin of southern West Virginia (see Figure 1-1) with surface facilities located in Boone County. The Mine properties are generally centered around the Chess Processing preparation plant and facilities located approximately 3.4 miles northwest of the town of Whitesville, West Virginia, and 24 miles northwest of Beckley, West Virginia, the county seat of Raleigh County. Surface facilities for the operation are located in the Big Coal River drainage basin, central to the active mine as well as those currently in development. The communities adjacent to the facility include Sylvester and Whitesville. The nearest major population centers are Charleston, West Virginia (40 miles north), Bristol, Virginia (170 miles south), Roanoke, Virginia (160 miles east), Morgantown, West Virginia (200 miles north), and Lexington, Kentucky (220 miles west). The property is located on the following United States Geological Survey (USGS) Quadrangles: Williams Mnt., Sylvester, Eskdale, Wharton, Whitesville, and Powellton. The coordinate system and datum used for the model of the Elk Run Mine complex and the subsequent maps were produced in the West Virginia State Plane South system, NAD 27. 3.2 Titles, Claims or Leases Elk Run properties are included within Alpha’s Mid-West Virginia mineral holdings composed of approximately 244,275 total acres. There are approximately 52 separate leases for the Mid-West Virginia mineral holdings group, which includes the Elk Run complex. Some leases expire over the next several years, but Alpha does not anticipate any challenges related to lease renewal. Table 3-1 lists Alpha’s Mid-West Virginia mineral leases. MM&A has not carried out a separate title verification for the coal properties and has not verified leases, deeds, surveys, or other property control instruments pertinent to the subject resources. Alpha has represented to MM&A that it controls the mining rights to the reserves as shown on its property maps, and MM&A has accepted these as being a true and accurate depiction of the mineral rights controlled by Alpha. The TRS assumes the Property is developed under responsible and experienced management. Alpha Metallurgical Resources, Inc. Statement of Coal Resources and Reserves for the Elk Run Underground Complex in Accordance with United States SEC Standards as of December 31, 2023 Central Appalachian Coal Basin West Virginia, USA MARSHALL MILLER & ASSOCIATES, INC. 21 Table 3-1: Mineral Control – Mid-West Virginia (Elk Run) Complex Reference File No. Document Type Expiration Date (1) On-going Minimum Royalty (2) On-going Production Royalty (3) MD 1 Deed N/A N/A N/A MD 2 Deed N/A N/A N/A MD 3 Deed N/A N/A N/A MD 4 Deed N/A N/A N/A MD 5 Deed N/A N/A N/A MD 6 Deed N/A N/A N/A MD 7 Deed N/A N/A N/A MD 8 Deed N/A N/A N/A ML 01 Lease 1/1/2027 Yes Yes ML 01b Lease 6/15/2029 Yes Yes ML 02 Lease 1/1/2027 Yes Yes ML 03 Lease 12/31/2033 Yes Yes ML 04 Lease 12/31/2025 Yes Yes ML 04b Lease 2/18/2029 Yes Yes ML 05 Lease 7/31/2028 Yes Yes ML 06 Lease 5/9/2024 Yes Yes ML 07 Lease 12/31/2024 Yes Yes ML 09 Lease 12/31/2026 Yes Yes ML 10 Lease Exhaustion Yes Yes ML 11 Lease 1/18/2025 Yes Yes ML 12a Lease Exhaustion Yes Yes ML 13 Lease 1/3/2025 Yes Yes ML 14 Lease 1/26/2025 Yes Yes ML 14c Lease 11/29/2025 No Yes ML 15 Lease 8/31/2024 Yes Yes ML 16 Lease 5/26/2027 Yes Yes ML 17 Lease 12/31/2026 Yes Yes ML 18 Lease 8/31/2028 Yes Yes ML 19 Lease 8/31/2028 Yes Yes ML 20 Lease 12/31/2028 Yes Yes ML 21 Lease 4/30/2024 Yes Yes ML 22a Lease 8/31/2028 No Yes ML 22b Lease 8/31/2028 Yes Yes ML 23 Lease 5/31/2026 Yes Yes ML 24 Lease 5/31/2026 Yes Yes ML 25 Lease 12/6/2024 Yes Yes ML 26 Lease 10/28/2024 Yes Yes ML 27a Lease 10/25/2030 Yes Yes ML 27b Lease 3/10/2025 Yes Yes ML 28 Lease 12/6/2024 Yes Yes ML 29 Lease 12/31/2024 Yes Yes ML 30 Lease 6/14/2025 Yes Yes ML 31 Lease 12/31/2023 Yes Yes ML 32 Lease 2/11/2024 Yes Yes ML 33 Lease 12/31/2026 Yes Yes ML 34 Lease 12/31/2024 Yes Yes

Alpha Metallurgical Resources, Inc. Statement of Coal Resources and Reserves for the Elk Run Underground Complex in Accordance with United States SEC Standards as of December 31, 2023 Central Appalachian Coal Basin West Virginia, USA MARSHALL MILLER & ASSOCIATES, INC. 22 Reference File No. Document Type Expiration Date (1) On-going Minimum Royalty (2) On-going Production Royalty (3) ML 35 Lease 3/9/2025 Yes Yes ML 36 Lease 12/31/2024 Yes Yes ML 37 Lease Exhaustion Yes Yes ML 38 Lease 12/31/2025 Yes Yes ML 39 Lease Exhaustion Yes Yes ML 40 Lease 6/30/2025 Yes Yes ML 42 Lease 5/26/2027 Yes Yes ML 43 Lease 2/1/2024 Yes Yes ML 44 Lease 11/29/2025 Yes Yes ML 45 Lease 5/4/2024 Yes Yes ML 46 Lease 9/23/2026 Yes Yes ML 47 Lease 2/28/2024 Yes Yes ML 48 Lease 2/10/2024 Yes Yes ML 49 Lease 6/8/2027 Yes Yes (1) For leases with expiration dates, Company has option to renew or expects to renew until all mineable and merchantable coal is exhausted (2) Minimum royalty payments are generally recoupable against future production royalties. (3) Royalty rates range from 3% to 10% of gross selling price 3.3 Mineral Rights Alpha supplied property control maps to MM&A related to properties for which mineral and/or surface property are controlled by Alpha. While MM&A accepted these representations as being true and accurate, through experience with the Property, MM&A has no knowledge of past property boundary disputes or other concerns that could impact future mining operations or development potential. Property control in Appalachia can be intricate. Coal mining properties are typically composed of numerous property tracts which are owned and/or leased from both land holding companies and private individuals or companies. It is common to encounter severed ownership, with different entities or individuals controlling the surface and mineral rights. Mineral control in the region is typically characterized by leases or ownership of larger tracts of land, with surface control generally comprised of smaller tracts, particularly in developed areas. Control of the surface property is necessary to conduct surface mining but is not necessary to conduct underground mining aside from relatively limited areas required for seam access or ventilation infrastructure. Alpha’s executive management team has a history of mining in Central Appalachia and has conveyed to MM&A that it has been successful in acquiring surface rights where needed for past operations. 3.4 Encumbrances No Title Encumbrances are known. By assignment, MM&A did not complete a query related to Title Encumbrances. Alpha Metallurgical Resources, Inc. Statement of Coal Resources and Reserves for the Elk Run Underground Complex in Accordance with United States SEC Standards as of December 31, 2023 Central Appalachian Coal Basin West Virginia, USA MARSHALL MILLER & ASSOCIATES, INC. 23 3.5 Other Risks There is always risk involved in property control. As is common practice, Alpha, and its predecessors, have had their land teams examine the deeds and title control to minimize this risk. Historically, property control has not posed any significant challenges related to Elk Run operations. 4 Accessibility, Climate, Local Resources, Infrastructure and Physiography 4.1 Topography, Elevation and Vegetation Topography of the area surrounding the Elk Run mine complex is typical of the Central Appalachian Plateau’s physiographic province, being rugged and deeply dissected by V-shaped river valleys and flanked by steep-sided upland regions. Slopes in the area are mostly steep to very steep with some gently sloping with relatively narrow ridges. Surface elevations near the mine complex range from approximately 1,000 feet above sea level at streams to approximately 2,600 feet at ridge tops. The area is heavily vegetated and has a significant amount of hardwood forests. The Property is not situated near any major urban centers. 4.2 Access and Transport There is general access to the Elk Run property via a well-developed network of primary, secondary, and unimproved roads. Interstate 64/77 is located east of the Property and is the primary throughfare in the area connecting the Property to Beckley, Charleston, and Huntington, West Virginia. Lexington, Kentucky lies to the West and Virginia is located to the East. Numerous secondary and unimproved roads provide direct access to the mine property, some being federal-, state-, and town-maintained. These include West Virginia State Route 3 that runs north-south through the Property holdings and provides direct access to surface office facilities and preparation plant from points north and south. These primary roads typically stay open throughout the year. Within the Property, unimproved roads are utilized to access gas drainage wells and surface based deep mine infrastructure. The Alpha-owned office facilities, preparation plant and rail loadout are located approximately 3.4 miles northwest of the town of Whitesville along the CSX railroad system and serve as the primary transport means of processed coal. 4.3 Proximity to Population Centers The Elk Run Mine Complex is located near the town of Beckley and is primarily in Boone County, West Virginia. There are no large population centers in proximity. The nearest major population centers are Charleston, West Virginia (40 miles north), Bristol, Virginia (170 miles south), Roanoke, Virginia ( 190 miles southeast), and Morgantown, West Virginia (200 miles northeast), and Lexington, Kentucky (220 miles west). As of the 2020 census, Boone County had just over 21,800 residents.

Alpha Metallurgical Resources, Inc. Statement of Coal Resources and Reserves for the Elk Run Underground Complex in Accordance with United States SEC Standards as of December 31, 2023 Central Appalachian Coal Basin West Virginia, USA MARSHALL MILLER & ASSOCIATES, INC. 24 4.4 Climate and Length of Operating Season The climate of the region is classified as humid continental with four distinct seasons: warm summers, cold winters, and moderate fall and spring seasons. Precipitation in the region is consistent throughout the year, approximately 3 to 5 inches per month, with the most rain falling in spring and the early months of summer. Average yearly precipitation is 40 inches. Summer months typically begin in late May and end in early September and range in average temperature from 46 to 78 degrees Fahrenheit. Winters typically begin in mid to late November and run until mid to late March with average temperatures ranging from 19 to 52 degrees Fahrenheit. Precipitation in the winter typically comes in the form of snowfall or as a wintery mix (sleet and snow) with severe snowfall events occurring occasionally. Seasonal variations in climate typically do not affect underground mining in West Virginia. However, weather events could potentially negatively impact efficiency of surface and preparation plant operations on a very limited basis and lasting less than a few days. 4.5 Infrastructure The Elk Run Mine Complex has sources of water, power, personnel, and supplies readily available for use. Personnel have historically been sourced from the surrounding communities in Raleigh, Kanawha, Fayette, and Boone Counties, and have proven to be adequate in numbers to conduct mining operations. As mining is common in the surrounding areas, the workforce is generally familiar with mining practices, and many are experienced miners. Water is sourced locally from public water sources or rivers, and electricity is sourced from Appalachian Power, a subsidiary of American Electric Power (AEP). The service industry in the areas surrounding the mine complex has historically provided supplies, equipment repairs and fabrication, etc. Alpha’s Chess Processing preparation plant services consumers with washed coal, which is transported via the adjacent CSX rail line at the Elk Run loadout. Haul roads, primary roads, and conveyor belt systems account for transport from the various mine sites to the preparation plant. 5 History 5.1 Previous Operation The Elk Run property involves a complex combination of previous ownership. Coal mining in the area occurred for nearly a century. Predecessors of Alpha, namely Alpha Natural Resources and Massey Energy (Massey) previously held mining rights on much of the Property. The current facilities were constructed in 1982 by Elk Run Coal Company, a subsidiary of A. T. Massey Coal Company to participate in the thermal coal market. Capacity grew in the 1990’s and the facility began participating in the metallurgical coal market with new mines operating on adjacent properties. The facility was idled in 2015; however, the first production cuts in the Checkmate Powellton mine were made in October 2023. Infrastructure has been maintained with a continuing presence of workers Alpha Metallurgical Resources, Inc. Statement of Coal Resources and Reserves for the Elk Run Underground Complex in Accordance with United States SEC Standards as of December 31, 2023 Central Appalachian Coal Basin West Virginia, USA MARSHALL MILLER & ASSOCIATES, INC. 25 utilizing the buildings for equipment repair and support of the nearby Alpha operations. The preparation plant, refuse disposal areas, utility infrastructure and rail transportation have been maintained and are undergoing renovations to provide a modern coal processing facility for the Property. 5.2 Previous Exploration Extensive exploration in the form of subsurface drill efforts has been carried out on the Property by numerous entities, most of which efforts were completed prior to the inception of Alpha. Diamond core and rotary drilling are the primary types of exploration on the Property. Data for correlation and mining conditions are derived from core descriptions and geophysical logging (e-logging). Coal-quality analyses were also employed during the core-exploration process. The development of this report included an assessment of over 600 exploration drill holes, largely comprised of coal measurements. Drill records indicate that independent contract drilling operators have typically been engaged to carry out drilling on the Property. Geophysical logging was typically performed by outside logging firms. MM&A, via its Geophysical Logging Systems subsidiary, has logged a significant number of the past exploration holes, including most of the recently drilled holes. Drill hole locations used in this assessment are shown on the resource/reserve maps included in Appendix C. 6 Geological Setting, Mineralization and Deposit 6.1 Regional, Local and Property Geology The Property lies in the Central Appalachian Coal basin in the Appalachian Plateau physiographic province. The coal deposits in the eastern US are the oldest and most extensively developed coal deposits in the country. The coal deposits on the Property are Carboniferous in age, being of the Pennsylvanian system. Overall, these Carboniferous coals contain two-fifths of the US’s bituminous coal deposits and extend over 900 miles from northern Alabama to Pennsylvania and are part of what is known as the Appalachian Basin. The Appalachian Basin is more than 250 miles wide and, in some portions, contains over 60 coal seams of varying economic significance. Coal seams and zones of economic significance typically range between 24 and 48 inches in thickness, with relatively little structural deformation. Regional structure is typically characterized by gently dipping strata to the northwest at one to four percent, averaging three percent. Strata on the Property are mostly of the Pennsylvanian-age Kanawha Formation. The rock formations between the coal seams are characterized by large proportions of sandstone interspersed with shale units.

Alpha Metallurgical Resources, Inc. Statement of Coal Resources and Reserves for the Elk Run Underground Complex in Accordance with United States SEC Standards as of December 31, 2023 Central Appalachian Coal Basin West Virginia, USA MARSHALL MILLER & ASSOCIATES, INC. 26 Coal seams with remaining reserve or resource potential evaluated within this TRS include, in descending stratigraphic order the: Upper Cedar Grove, Peerless and Powellton seams. 6.2 Mineralization The generalized stratigraphic columnar section in Figure 6-1 demonstrates the vertical relationship of the principal coal seams and rock formations on the Property. Figure 6-1: Elk Run Stratigraphic Column (not to scale) 6.3 Deposits The coal produced at the Elk Run complex is mainly a High-volatile metallurgical bituminous coal. Due to the high value of these High Volatile coking coals, all the seams have been extensively mined in the past. Generally, the coal rank increases with depth whereas the highest seams stratigraphically and physically on the hills exhibit the greatest volatile matter content and deepest seams exhibit the lowest volatile matter content. The highest structural elevations are along the southeastern margin of the Property with the strata generally dipping toward northwest. The seams of interest are above drainage include the Upper Cedar Grove through the Powellton and are accessible via an outcrop faceup. The Alpha Metallurgical Resources, Inc. Statement of Coal Resources and Reserves for the Elk Run Underground Complex in Accordance with United States SEC Standards as of December 31, 2023 Central Appalachian Coal Basin West Virginia, USA MARSHALL MILLER & ASSOCIATES, INC. 27 rock formations between the coal seams are characterized by large portions of sandstone with shale units interspersed throughout. 7 Exploration 7.1 Nature and Extent of Exploration The Property has been extensively explored by subsurface drilling efforts carried out by numerous entities, most of which were completed prior to ownership by Alpha. Diamond core and rotary drilling are the primary types of exploration on the Property. Data for correlation and mining conditions are derived from core descriptions and geophysical logging (e- logging). Coal-quality analyses were also employed during the core-exploration process. Drill records indicate that independent contract drilling operators have typically been engaged to carry out drilling on the Property. Geophysical logging was typically performed by outside logging firms. MM&A, via its Geophysical Logging Systems subsidiary, has logged a portion of the past exploration holes, including most of the recently drilled holes. The location of the drilling is shown on the maps included in Appendix C. The concentration of exploration varies slightly across the Property. Drilling on the Property is typically sufficient for delineation of deep mineable coal horizons. Core logging is carried out by geologists in cases where roof and floor strata are of particular interest and in cases where greater resolution and geologic detail are needed. In many cases the drill hole data comes from simplified driller’s logs, which may lack specific details regarding geotechnical conditions and specific geology, making correlations and floor and roof conditions difficult to determine. Geophysical logging (e-logging) techniques, by contrast, document specific details useful for geologic interpretation and mining conditions. Given the variability of data-gathering methods, definitive mapping of future mining conditions may not be possible, but projections and assumptions can be made within a reasonable degree of certainty. A significant effort was put into verifying the integrity of the database. Once this was established, stratigraphic columnar sections were generated using cross-sectional analysis to establish or confirm coal seam correlations. A typical cross-section is shown in Figure 7-1.

Alpha Metallurgical Resources, Inc. Statement of Coal Resources and Reserves for the Elk Run Underground Complex in Accordance with United States SEC Standards as of December 31, 2023 Central Appalachian Coal Basin West Virginia, USA MARSHALL MILLER & ASSOCIATES, INC. 28 Figure 7-1: Elk Run Cross-Section Due to the long history of exploration by various parties on the Property, a wide variety of survey techniques exist for documentation of data point locations. Many of the older exploration drill holes appear to have been located by traditional land survey methods and more recently completed drill holes are often located by high-resolution Global Positioning System (GPS) units. However, some holes appear to have been approximately located using USGS topography maps or other methods which are Alpha Metallurgical Resources, Inc. Statement of Coal Resources and Reserves for the Elk Run Underground Complex in Accordance with United States SEC Standards as of December 31, 2023 Central Appalachian Coal Basin West Virginia, USA MARSHALL MILLER & ASSOCIATES, INC. 29 less accurate. Therefore, discretion had to be used regarding the accuracy for the location and ground surface elevation of some of these older drill holes. In instances where a drill hole location (or associated coal seam elevations) appeared to be inconsistent with the overall structural trend (or surface topography for surface-mineable areas), the data point was not honored for geological modeling. Others with apparently minor variances were adjusted and then used by MM&A. Surveying of the underground and surface mined areas has been performed by the mine operators and/or their consulting surveyors. By assignment, MM&A did not verify the accuracy or completeness of mine maps supplied by Alpha but accepted this information as being the work of responsible engineers and surveyors, as required by both State and Federal Law. MM&A compiled comprehensive topographic map files by selecting the best available aerial mapping for each area and filling any gaps with digital USGS topographic mapping. 7.2 Drilling Procedures Core drilling methods utilize NX-size (21/8 inch) or similar-sized core cylinders to recover core samples, which can be used to delineate geologic characteristics, and for coal quality testing and geotechnical logging. For the core holes, the geophysical logs are especially useful in verifying the core recovery of both the coal samples (for assurance that sample is representative of the full seam) and of the roof and floor rock samples (for evaluating ground control characteristics of deep mineable coal seams). In addition to the core holes, rotary drilled holes also exist on the Property. Data for the rotary drilled holes is mainly derived from downhole geophysical logs, which are used to interpret coal and rock thickness and depth since logging of the drill cuttings is not reliable. A wide variety of core-logging techniques exist for the Property. For many of the core holes, the primary data source is a generalized lithology description by the driller, more recent holes are generally supplemented by a more detailed core log completed by a geologist. These drilling logs were provided to MM&A as a geological database. MM&A geologists were not involved in the production of original core logs but did perform a basic check of information within the provided database. An audit of the Alpha database was conducted in 2021 by comparing seam depths, coal, and parting thicknesses in the electronic database against the source drill logs and the results were acceptable. Where geophysical logs for such holes are available, they were used by MM&A geologists to verify the coal thickness and core recovery of seams. 7.3 Hydrology Hydrologic testing and forecasting are necessary parts of the permitting process and as such are routinely considered in the mine planning process. Elk Run has a lengthy history of operation with no significant hydrologic concerns or material issues experienced in its history. Future mining is projected to occur in areas exhibiting similar

Alpha Metallurgical Resources, Inc. Statement of Coal Resources and Reserves for the Elk Run Underground Complex in Accordance with United States SEC Standards as of December 31, 2023 Central Appalachian Coal Basin West Virginia, USA MARSHALL MILLER & ASSOCIATES, INC. 30 hydrogeological conditions as past mining. Based upon the successful history of the operation with regards to hydrogeological features, MM&A assumes that the operation will not be hindered by such issues in the future. 7.4 Geotechnical Data Life-of-Mine (LOM) Mining plans for potential underground mines were developed by MM&A through incorporation of budget maps from Alpha. Pillar stability was tested by MM&A using the Analysis of Coal Pillar Stability (ACPS) program that was developed by the National Institute for Occupational Safety and Health (NIOSH). MM&A reviewed the results from the ACPS analysis and considered it in the development of the LOM plan. Coal and rock strengths from core testing are used to verify the empirical assumptions integral to ACPS. 8 Sample Preparation Analyses and Security 8.1 Prior to Sending to the Lab Most of the coal samples have been obtained from the Property by subsurface exploration using core drilling techniques. The protocol for preparing and testing the samples has varied over time and is not well documented for the older holes drilled on the Property. Typical US core drilling sampling technique is for the coal core sample, once recovered from the core barrel, to be described then wrapped in a sealed plastic sleeve and placed into a covered core box, which is the length of the sample so that the core can be delivered to a laboratory in relatively intact condition and with original moisture content. The core identification number and the depth are scribed on the sample box lid to identify the sample. This process has been the norm for both historical and ongoing exploration activities at Elk Run. This work is typically performed by the supervising driller, geologist or company personnel. Samples are most often delivered to the company by the driller after each shift or acquired by company personnel or representatives. Most of the coal core samples were obtained by previous operators on the Property. MM&A did not participate in the collection, sampling and analysis of the majority of core samples within the exploration database. However, it is reasonable to assume, given the sophistication level of the previous operators, that these samples were generally collected and processed under industry best-practices. This assumption is based on MM&A’s familiarity with the operating companies and the companies used to perform the analysis. In addition to the steps taken to ensure the accuracy of the historical data as described above, Alpha reports that the company employs a detailed chain of custody process during their current sampling programs. This chain of custody process follows the sample from the time it is drilled until the final quality results are entered into a database for preparation of geologic models. Alpha Metallurgical Resources, Inc. Statement of Coal Resources and Reserves for the Elk Run Underground Complex in Accordance with United States SEC Standards as of December 31, 2023 Central Appalachian Coal Basin West Virginia, USA MARSHALL MILLER & ASSOCIATES, INC. 31 8.2 Lab Procedures Coal quality testing has been performed over a large number of years by operating companies using different laboratories and testing regimens. Some of the samples have raw analyses and washabilities on the full seam (with coal and rock parting layers co-mingled) and are mainly useful for characterizing the coal quality for projected production from underground and highwall mining. Other samples have coal and rock analyzed separately, the results of which can be manipulated to forecast either surface or underground mining quality. Care has been taken to use only those analyses that are representative of the coal quality parameters for the appropriate mining type for each sample. Standard procedure upon receipt of core samples by the testing laboratory is to log the depth and thickness of the sample, then perform testing as specified by a representative of the operating company. Each sample is then analyzed in accordance with procedures defined under ASTM International (ASTM) standards including, but not limited to; washability (ASTM D4371); ash (ASTM D3174); sulfur (ASTM D4239); Btu/lb. (ASTM D5865); volatile matter (ASTM D3175); and Free Swell Index (FSI) (ASTM D720). 9 Data Verification 9.1 Procedures of Qualified Person MM&A reviewed the Alpha-supplied digital geologic database and supplemented the database with its own in-house records which have been maintained for both Alpha and previous operators of the Property. The database consists of data records, which include drill hole information for holes that lie within and adjacent to the Property and records for numerous supplemental coal seam thickness measurements. Once the initial integrity of the database was established, stratigraphic columnar sections were generated using cross-sectional analysis to establish or confirm coal seam correlations. Geophysical logs were used wherever available to assist in confirming the seam correlation and to verify proper seam thickness measurements and recovery of coal samples. Additionally, an audit of the Alpha digital database was conducted in 2021 by comparing seam depths, coal, and parting thicknesses in the database against the source drill logs and the results were acceptable. After establishing and/or verifying proper seam correlation, seam data control maps and geological cross-sections were generated and again used to verify seam correlations and data integrity. Once the database was fully vetted, seam thickness, base-of-seam elevation, roof and floor lithology, and overburden maps were independently generated for use in the mine planning process. Coal quality was analyzed and summarized by MM&A’s team of geologists and engineers. Quality was provided by Alpha in various database formats, laboratory data sheets, and also obtained directly from

Alpha Metallurgical Resources, Inc. Statement of Coal Resources and Reserves for the Elk Run Underground Complex in Accordance with United States SEC Standards as of December 31, 2023 Central Appalachian Coal Basin West Virginia, USA MARSHALL MILLER & ASSOCIATES, INC. 32 MM&A’s files. Care was taken to ensure that sampled data was representative of the mineable section. In instances where minimal representative data was noted, geological tonnages were estimated based upon applying assumed densities of coal and non-coal material to thicknesses expressed in geological database files. 9.2 Limitations As with any exploration program, localized anomalies cannot always be discovered. The greater the density of the samples taken, the less the risk. Once an area is identified as being of interest for inclusion in the mine plan, additional samples are taken to help reduce the risk in those specific areas. In general, provision is made in the mine planning portion of the study to allow for localized anomalies that are typically classed more as a nuisance than a hinderance. 9.3 Opinion of Qualified Person Sufficient data has been obtained through various exploration and sampling programs and mining operations to support the geological interpretations of seam structure and thickness for coal horizons situated on the Elk Run Property. The data is of sufficient quantity and reliability to reasonably support the coal resource and coal reserve estimates in this TRS. 10 Mineral Processing and Metallurgical Testing 10.1 Testing Procedures Basic chemical analyses (both raw and washed quality), petrographic data, rheological data and ash, ultimate and sulfur analysis are available but not summarized for this filing. Available coal quality data sourced from MM&A’s vaults (associated with former projects for Alpha and its predecessors) was tabulated by resource area in a Microsoft® EXCEL workbook. Such data contained laboratory sheets which MM&A utilized to confirm that sampled intervals were representative of geological models and confirm that appropriate laboratory procedures were utilized to derive raw and clean coal parameters. Additionally, Alpha provided MM&A with a database of its own in-house coal quality information, which some did not include backup laboratory information or sampled intervals. MM&A compared wash recovery values from Alpha’s dataset to proximal holes with wash recovery data in MM&A’s dataset and calculated estimates of wash recovery based upon the relative percentages of coal and rock from lithologic descriptions. In general, MM&A found that Alpha’s dataset was representative and appropriate for inclusion in coal quality summaries. Quality tables also provide basic statistical analyses of the coal quality datasets, including average value; maximum and minimum values; and the number of samples available to represent each quality parameter of the seam. Coal samples that were deemed by MM&A geologists to be unrepresentative were not used for statistical analysis of coal quality, as documented in the tabulations. Alpha Metallurgical Resources, Inc. Statement of Coal Resources and Reserves for the Elk Run Underground Complex in Accordance with United States SEC Standards as of December 31, 2023 Central Appalachian Coal Basin West Virginia, USA MARSHALL MILLER & ASSOCIATES, INC. 33 The amount and areal extent of coal sampling for geological data is generally sufficient to represent the quality characteristics of the coal horizons and allow for proper market placement of the subject coal seams. For some of the coal deposits, there are considerable laboratory data from core samples that are representative of the full extent of the resource area; and for others there are more limited data to represent the resource area. For example, in the active operations with considerable previous mining, there may be limited quality data within some of the remaining resource areas; however, in those cases the core sampling data can be supplemented with operational data from mining and shipped quality samples representative of the resource area. 10.2 Relationship of Tests to the Whole The extensive sampling and testing procedures typically followed in the Coal Industry result in an excellent correlation between samples and Marketable product. The Elk Run Property has a long history of saleable production, in the High-volatile metallurgical and thermal markets, confirming exploration results. In select instances, those areas which did not contain exploration information inclusive of coal quality analysis but were located relatively adjacent to active producing areas and/or areas which contained coal quality information were downgraded to a “probable” classification. Based upon the extensive production history locally and regionally, the report authors deemed this process acceptable. 10.3 Lab Information Each sample is analyzed at area Laboratories that operate in accordance with procedures defined under ASTM standards including, but not limited to; washability (ASTM D4371); ash (ASTM D3174); sulfur (ASTM D4239); Btu/lb. (ASTM D5865); volatile matter (ASTM D3175); Free Swell Index (FSI) (ASTM D720). 10.4 Relevant Results No critical factors have been found that would adversely affect the recovery of the Reserve. Any quality issues that occur, either localized or generally, are accounted for in the Marketing Study done for this TRS. 11 Mineral Resource Estimates MM&A created independent geologic models to define the coal resources at Elk Run. Coal resources were estimated as of December 31, 2023.

Alpha Metallurgical Resources, Inc. Statement of Coal Resources and Reserves for the Elk Run Underground Complex in Accordance with United States SEC Standards as of December 31, 2023 Central Appalachian Coal Basin West Virginia, USA MARSHALL MILLER & ASSOCIATES, INC. 34 11.1 Assumptions, Parameters and Methodology Geological data was imported into Carlson Mining® (formerly SurvCADD®) geological modelling software in the form of Microsoft® Excel files incorporating drill hole collars, seam and thickness picks, bottom seam elevations and raw and washed coal quality. These data files were validated prior to importing into the software. Once imported, a geologic model was created, reviewed, and verified- with a key element being a gridded model of coal seam thickness. Resource tons were estimated by using the seam thickness grid based on each valid point of observation and by defining resource confidence arcs around the points of observation. Points of observation for Measured and Indicated confidence arcs were defined for all valid drill holes that intersected the seam using standards deemed acceptable by MM&A based on a detailed geologic evaluation and a statistical analysis of all drill holes within the projected reserve areas as described in Section 11.1.1. The geological evaluation incorporated an analysis of seam thickness related to depositional environments, adjacent roof and floor lithologies, and structural influences. After validating coal seam data and establishing correlations, the seam thickness, coal thickness and elevation for seams of economic interest were used to generate a geologic model. Local geologic and physical conditions were incorporated into the model where mineability and or mining costs could be affected by the conditions. Both coal thickness and quality data are deemed by MM&A to be reasonably sufficient within the resource areas. Therefore, there is a reasonable level of confidence in the geologic interpretations required for coal resource determination based on the available data and the techniques applied to the data. Table 11-1 below provides the geological mapping and coal tonnage estimation criteria used for the coal resource and reserve evaluation. These cut-off parameters have been developed by MM&A based on its experience with Alpha’s Elk Run Property and are typical of mining operations in the Central Appalachian coal basin. This experience includes technical and economic evaluations of numerous properties in the region for the purposes of determining the economic viability of the subject coal reserves. Table 11-1: General Reserve & Resource Criteria Item Parameters Technical Notes & Exceptions* • General Reserve Criteria Reserve Classification Reserve and Resource Coal resources as reported are inclusive of coal reserves. Reliability Categories Reserve (Proven and Probable) Resource (Measured, Indicated & Inferred) To better reflect geological conditions of the coal deposits, distance between points of observation is determined via statistical analysis Proven and Measured Classification 0.25 Mile, (1320’) Projection form Measurement Point Based on 11.1.1 Analysis Probable and Indicated Classification 0.25 to 0.75 Mile, (1320’ to 3960’) Projection form Measurement Point Based on 11.1.1 Analysis; Required for Reserve or Resource Classification Inferred Classification 0.75 to 3.0 Mile, (3960’ to 15,840) Projection form Measurement Point Based on 11.1.1 Analysis Effective Date of Resource Estimate December 31, 2023 Coal resources were estimated based upon depletion maps as of September 30, 2023, and a fourth quarter 2023 production depletion adjustment. Alpha Metallurgical Resources, Inc. Statement of Coal Resources and Reserves for the Elk Run Underground Complex in Accordance with United States SEC Standards as of December 31, 2023 Central Appalachian Coal Basin West Virginia, USA MARSHALL MILLER & ASSOCIATES, INC. 35 Item Parameters Technical Notes & Exceptions* Effective Date of Reserve Estimate December 31, 2023 Coal reserves were estimated based upon depletion maps as of September 30, 2023, and a fourth quarter 2023production depletion adjustment Seam Density - with Raw Seam Analysis 1.25 + (Raw Ash% / 100) • Underground-Mineable Criteria Map Thickness Total seam thickness Minimum Seam Thickness 30 inches Minor Exceptions for localized zones of thinner coal Minimum Mining Thickness 54 inches Minimum Total Coal Thickness 30 inches Minor Exceptions for localized zones of thinner coal Minimum In-Seam Wash Recovery Determined as function of seam thickness Wash Recovery Applied to Coal Reserves Based on average yield for drill holes within reserve area, or in the absence of laboratory washability data, based on estimated visual recovery using specific gravities noted above and 95 percent yield on "clean" coal Out-of-Seam Dilution Thickness for Run-of-Mine Tons Applied to ROM tonnages Delta between minimum mining thickness (54 inches) and seam thickness 2 inches minimum OSD Mine Barrier 200-foot distance from abandoned mines and 50’ sealed or pillared areas of active Alpha mines Minimum Reserve Tonnage 400 thousand recoverable tons for individual area (logical mining unit) Minimum Overburden Depth 100 feet Minimum Interval to Rider Coal Considered on a case-by-case basis, depending on interval lithology, etc. Minimum Interval to Overlying or Underlying Reserves Considered on a case-by-case basis, depending on interval lithology, extent and type of extraction, etc. Minimum Interval to Overlying or Underlying Mined Areas Considered on a case-by-case basis, depending on interval lithology, extent and type of extraction, etc. Adjustments Applied to Coal Reserves 6.0 percent moisture increase; 5 percent preparation plant inefficiency Note: Exceptions for application of these criteria to reserve estimation are made as warranted and demonstrated by either actual mining experience or detailed data that allows for empirical evaluation of mining conditions. Final classification of coal reserve is made based on the pre-feasibility evaluation. 11.1.1 Geostatistical Analysis MM&A completed a geostatistical analysis on drill holes within the reserve boundaries to determine the applicability of the common United States classification system for measured and indicated coal resources. Historically, the United States has assumed that coal within ¼-mile (1,320 feet) of a point of observation represents a measured resource whereas coal between ¼-mile (1,320 feet) and ¾-mile (3,960 feet) from a point of observation is classified as indicated. Inferred resources are commonly assumed to be located between ¾-mile (3,960 feet) and 3 miles (15,840 feet) from a point of observation. Per SEC regulations, only measured and indicated resources may be considered for reserve classification, respectively as proven and probable reserves. MM&A performed a geostatistical analysis test of the Elk Run, Checkmate Powellton data set using the Drill Hole Spacing Analysis (DHSA) method. This method attempts to quantify the uncertainty of applying a measurement from a central location to increasingly larger square blocks and provides recommendations for determining the distances between drill holes for measured, indicated, and inferred resources.

Alpha Metallurgical Resources, Inc. Statement of Coal Resources and Reserves for the Elk Run Underground Complex in Accordance with United States SEC Standards as of December 31, 2023 Central Appalachian Coal Basin West Virginia, USA MARSHALL MILLER & ASSOCIATES, INC. 36 To perform DHSA the data set was processed to remove any erroneous data points, clustered data points, as well as directional trends. This was achieved through the use of histograms, as seen in Figure 11-1, color coded scatter plots showing the geospatial positioning of the borings, Figure 11-2, and trend analysis. Figure 11-1: Histogram of the Total Seam Thickness for the Powellton Seam Present in the Elk Run Complex Figure 11-2: Scatter plot of the Total Seam Thickness for the Powellton Seam Present in the Elk Run Complex Following the completion of data processing, a variogram of the data set was created, Figure 11-3. The variogram plots average square difference against the separation distance between the data pairs. The separation distance is broken up into separate bins defined by a uniform lag distance (e.g., for a lag distance of 500 feet the bins would be 0 – 500 feet, 501 – 1,000 feet, etc.). Each pair of data points that are less than one lag distance apart are reported in the first bin. If the data pair is further apart than one lag distance but less than two lag distances apart, then the variance is reported in the second bin. The numerical average for differences reported for each bin is then plotted on the variogram. Care was taken to define the lag distance in such a way as to not overestimate any nugget effect present in the data set. Lastly, modeled equations, often spherical, gaussian, or exponential, are applied to the variogram in order to represent the data set across a continuous spectrum. Alpha Metallurgical Resources, Inc. Statement of Coal Resources and Reserves for the Elk Run Underground Complex in Accordance with United States SEC Standards as of December 31, 2023 Central Appalachian Coal Basin West Virginia, USA MARSHALL MILLER & ASSOCIATES, INC. 37 Figure 11-3: Variogram of the Total Seam Thickness for the Powellton Seam Present in the Elk Run Complex The estimation variance is then calculated using information from the modeled variogram as well as charts published by Journel and Huijbregts (1978). This value estimates the variance from applying a single central measurement to increasingly larger square blocks. Care was taken to ensure any nugget effect present was added back into the data. This process was repeated for each test block size. The final step of the process is to calculate the global estimation variance. In this step the number square blocks that would fit inside the selected study area is determined for each block size that was investigated in the previous step. The estimation variance is then divided by the number of blocks that would fit inside the study area for each test block size. Following this determination, the data is then transformed back to represent the relative error in the 95th-percentile range. Figure 11-4 shows the results of the DHSA performed on the Powellton seam data for the Elk Run Complex. DHSA provides hole to hole spacing values, these distances need to be converted to radius from a central point to compare to the historical standards. A summary of the radius data is shown in Table 11-2. DHSA prescribes measured, indicated, and inferred drill hole spacings be determined at the 10-percent, 20-percent, and 50-percent levels of relative error, respectively.

Alpha Metallurgical Resources, Inc. Statement of Coal Resources and Reserves for the Elk Run Underground Complex in Accordance with United States SEC Standards as of December 31, 2023 Central Appalachian Coal Basin West Virginia, USA MARSHALL MILLER & ASSOCIATES, INC. 38 Figure 11-4: Result of DHSA for the Powellton Seam Present in the Elk Run Complex Table 11-2: DHSA Results Summary for Radius from a Central Point Model: Measured Radial Distance (10% Relative Error) Indicated Radial Distance (20% Relative Error) Inferred Radial Distance (50% Relative Error) (Miles) (Miles) (Miles) Gaussian: 0.43 0.71 1.68 Spherical: 0.40 0.71 1.71 Exponential: 0.39 0.72 1.70 Comparing the results of the DHSA to the historical standards, it is evident that the historical standards are more conservative than even the most conservative DHSA model with regards to determining measured resources. The Exponential model recommends using a radius of 0.39 miles for measured resources compared to the historical value of 0.25 miles. With respect to indicated resources the DHSA falls in line closely with the historical standards. The Gaussian and Spherical models recommend using a radius of 0.71 miles, while the Exponential model recommends a radius of 0.72 miles. These values line up closely with the historical radius of 0.75 miles. These results have led the QP’s to report the data following the historical classification standards, as outlined in United States Geological Survey Circular 891 rather than use the results of the DHSA. 11.2 Resources Exclusive of Reserves The Elk Run property contains multiple resource blocks which were not deemed to exhibit reserve potential at the time of the study. These resources, formally identified as resources exclusive of 0 5 10 15 20 25 30 35 40 2000 3000 4000 5000 6000 7000 8000 9000 R el a ve E rr o r 9 5 % P er ce n le R a n ge Dril l Hole Spacing ( ) Gauss ian Exponen al Spherica l Alpha Metallurgical Resources, Inc. Statement of Coal Resources and Reserves for the Elk Run Underground Complex in Accordance with United States SEC Standards as of December 31, 2023 Central Appalachian Coal Basin West Virginia, USA MARSHALL MILLER & ASSOCIATES, INC. 39 reserves, are in the: Upper Cedar Groves, Peerless and Powellton seams. Reasons which may preclude elevation of resources to reserves include, but are not limited to: 1. Limited availability of quality information to document coal seam market characteristics. 2. Coal quality inconsistent with typical preferred market properties. 3. Isolation of resource blocks in which seam access costs are cost prohibitive at the time of the study. - Checkmate Powellton – Map 3: resource along White Castle abandoned mine works due to limited access and poor geometry for a new mine. 4. Unfavorable economics at the PFS level, yet economics could become attractive in the future under different market conditions. - Castle II Peerless - Map 2: raw coal haul distance and difficult up-dip access. 5. Exclusion from LOM planning by mining operator due to remaining resource blocks which are relatively small, isolated blocks and not currently attractive from an operational perspective. 6. Mineability constraints due to over/under mining, underground conditions and physical locations. - Prenter Upper Cedar Grove – Map 1: physical locations for access not identified and engineering and evaluation not completed to be included in the LOM planning. 11.2.1 Initial Economic Assessment MM&A completed an initial economic assessment to determine the potential economic viability of resources exclusive of reserves (not converted to reserves). MM&A applied relevant technical factors to estimate potential saleable tons without the resource blocks, should the resources be extracted via deep, continuous mining methods. MM&A developed cash cost profiles for the resource blocks, including direct cash costs (labor, supplies, roof control, maintenance and repair, power, and other); washing, trucking, materials handling, general and administrative, and environmental costs; and indirect cash costs (royalties, production taxes, property tax, insurance). Costs were developed based off relevant cost drivers (per-ft, per-raw-ton, per-clean-ton). Additionally, MM&A estimated capital costs to access resources. Capital costs associated with mine development were amortized across the resource’s potential saleable tonnages). Additional non-cash items (depreciation of equipment and depletion) and cash costs were compared to an assumed sale price of $130 per ton netback FOB loadout (approximately $150 per ton U.S. East Coast basis) for high-volatile markets. This resource assumed sales value was developed as a premium to the market-based reserve sales value to properly estimate the sales-related expenses should these resources be extracted during higher-than-average market conditions. The pricing used for the primary product was selected by the QP and deemed reasonable based on a review of historical average pricing for the Elk Run complex coal products over the past 5 years. The results of the analysis are shown below and demonstrate potential profitability on a fully loaded cost basis. Detailed summaries are shown in Appendix B.

Alpha Metallurgical Resources, Inc. Statement of Coal Resources and Reserves for the Elk Run Underground Complex in Accordance with United States SEC Standards as of December 31, 2023 Central Appalachian Coal Basin West Virginia, USA MARSHALL MILLER & ASSOCIATES, INC. 40 Table 11-3: Results of Initial Economic Assessment ($/ton) Mine Resource Block Direct Cash Transportation, Washing, Enviro, G&A Indirect Non-Cash Total Cost Fully Loaded P&L Checkmate L,M,O POW $60.96 $19.75 $17.47 $7.73 $105.92 $24.08 Prenter H UCG $58.86 $26.14 $13.57 $12.78 $111.35 $18.65 Prenter I UCG $62.98 $31.43 $13.57 $12.16 $120.15 $9.85 Prenter J UCG $56.93 $21.91 $13.57 $14.28 $106.69 $23.31 Prenter K&L UCG $56.76 $33.60 $17.47 $9.33 $117.15 $12.85 Castle Peerless PEER $62.92 $18.08 $13.57 $25.14 $119.71 $10.29 Figure 11-5: Results of Initial Economic Assessment 11.3 Qualified Person’s Estimates Based on the work previously described and detailed modelling of those areas, considering all the modifying actors, a coal resource estimate, summarized in Table 11-4, was prepared as of December 31, 2023, for property controlled by Alpha’s Elk Run operating unit. Alpha Metallurgical Resources, Inc. Statement of Coal Resources and Reserves for the Elk Run Underground Complex in Accordance with United States SEC Standards as of December 31, 2023 Central Appalachian Coal Basin West Virginia, USA MARSHALL MILLER & ASSOCIATES, INC. 41 Table 11-4: Coal Resources Summary as of December 31, 2023 Coal Resource (Dry Tons, In Situ) Quality (Dry Basis) Area/Mine Seam Measured Indicated Inferred Total Ash% Sulfur% VM% Inclusive of Reserve/Converted to Reserve Checkmate Powellton 80,243,000 56,531,000 0 136,774,000 27 1.0 - Subtotal Subtotal 80,243,000 56,531,000 0 136,774,000 27 1.0 Exclusive of Reserve/Not Converted to Reserve Prenter Upper Cedar Grove 20,600,000 16,264,000 63,000 36,928,000 18 1.8 - Elk Run (Castle II) Peerless 12,607,000 4,207,000 0 16,815,000 25 2.4 - Checkmate Powellton 12,316,000 1,888,000 16,000 14,220,000 27 1.0 - Subtotal Subtotal 45,523,000 22,360,000 79,000 67,962,000 25 1.8 Grand Total Inclusive of Reserve/Converted to Reserve 80,243,000 56,531,000 0 136,774,000 27 1.0 Exclusive of Reserve/Not Converted to Reserve 45,523,000 22,360,000 79,000 67,962,000 25 1.8 Grand Total 125,766,000 78,891,000 79,000 204,736,000 26 1.2 Note(1): Resource tons are inclusive of reserve tons since they include the in-situ tons from which recoverable coal reserves are derived. Note (2): Coal resources are reported on a dry basis. Surface moisture and inherent moisture are excluded. Note (3): The Property contains 67.88 million tons (Mt) of dry, in-place measured and indicated coal resources exclusive of reserves as of December 31, 2023. Totals may not add due to rounding. See Appendix A for detailed breakdown. 11.4 Qualified Person’s Opinion While there is some stratigraphically controlled seam-thickness variability due to seam splitting, sand channels, etc., MM&A geologists and engineers modeled the deposit and resource areas to reflect realistic mining scenarios, giving special consideration to uncertainties as related to each class of mineral resources such as (1) seam thickness, (2) floor and roof conditions, (3) mining equipment, etc. This statistical study demonstrates that for each configuration of mineable seams, the classification system of measured (0 – ¼ mile), indicated (¼ to ¾ mile), and inferred (¾ to 3 miles) is reasonably adequate to predict seam thickness variation for modeling and mining purposes. Based on MM&A’s geostatistical analysis, it would be possible to extend the measured arcs slightly beyond historically accepted practices due to consistent geological settings. The QP’s have again elected not to extend arc distances, introducing a level of conservatism in the coal resource classification. Based on the data review, the attendant work done to verify the data integrity and the creation of an independent Geologic Model, MM&A believes this is a fair and accurate representation of the Elk Run coal resources. 12 Mineral Reserve Estimates 12.1 Assumptions, Parameters and Methodology Coal Reserves are classified as proven or probable considering “modifying factors” including mining, metallurgical, economic, marketing, legal, environmental, social and governmental factors. > Proven Coal Reserves are the economically mineable part of a measured coal resource, adjusted for diluting materials and allowances for losses when the material is mined. It is based on

Alpha Metallurgical Resources, Inc. Statement of Coal Resources and Reserves for the Elk Run Underground Complex in Accordance with United States SEC Standards as of December 31, 2023 Central Appalachian Coal Basin West Virginia, USA MARSHALL MILLER & ASSOCIATES, INC. 42 appropriate assessment and studies in consideration of and adjusted for reasonably assumed modifying factors. These assessments demonstrate that extraction could be reasonably justified at the time of reporting. > Probable Coal Reserves are the economically mineable part of an indicated coal resource, and in some circumstances a measured coal resource, adjusted for diluting materials and allowances for losses when the material is mined. It is based on appropriate assessment and studies in consideration of and adjusted for reasonably assumed modifying factors. These assessments demonstrate that extraction could be reasonably justified at the time of reporting. Upon completion of delineation and calculation of coal resources, MM&A generated a LOM plan for Elk Run. The footprint of each reserve area is shown on the maps in Appendix C. The mine plan was generated based on 5-year budget mine plans provided by Alpha and supplemented with additional projections by MM&A to reflect LOM plans that honor property control limits, geologic mapping, or other factors determined during the evaluation. Carlson Mining software was used to generate the LOM plan for Elk Run. The mine plan was sequenced based on productivity schedules provided by Alpha. MM&A judged the productivity estimates and plans to be reasonable based on experience and current industry practice. Raw, ROM production data outputs from LOM plan sequencing were processed into Microsoft® EXCEL spreadsheets and summarized on an annual basis for processing into the economic model. Average seam densities were estimated to determine raw coal tons produced from the LOM plan. Average mine recovery and wash recovery factors were applied to determine coal reserve tons. Coal reserve tons in this evaluation are reported at a 6.0-percent moisture and represent the saleable product from the Property. Pricing data as provided by Alpha from third-party sources is described in Table 16-2. The pricing data assumes a flat-line long-term realization of $140 per short ton port pricing, with an average $113.94 per ton netback pricing reflective of the product currently sold at Elk Run. These estimates are based on long-term pricing published by third-party sources and adjusted for quality and transportation. The coal resource mapping and estimation process, described in the report, was used as a basis for the coal reserve estimate. Proven and probable coal reserves were derived from the defined coal resource considering relevant processing, economic (including technical estimates of capital, revenue, and cost), marketing, legal, environmental, socio-economic, and regulatory factors and are presented on a moist, recoverable basis. As is customary in the US, the categories for proven and probable coal reserves are based on the distances from valid points of measurement as determined by the QP for the area under consideration. Alpha Metallurgical Resources, Inc. Statement of Coal Resources and Reserves for the Elk Run Underground Complex in Accordance with United States SEC Standards as of December 31, 2023 Central Appalachian Coal Basin West Virginia, USA MARSHALL MILLER & ASSOCIATES, INC. 43 For this evaluation, measured resource, which may convert to a proven reserve, is based on a ¼-mile radius from a valid point of observation. Points of observation include exploration drill holes, and mine measurements which have been fully vetted and processed into a geologic model. The geologic model is based on seam depositional modeling, the interrelationship of overlying and underlying strata on seam mineability, seam thickness trends, the impact of seam structure, intra-seam characteristics, etc. Once the geologic model was completed, a statistical analysis, described in Section 11.1.1 was conducted and a ¼-mile radius from a valid point of observation was selected to define Measured Resources. Likewise, the distance between ¼ and ¾ of a mile radius was selected to define Indicated Resources. Indicated Resources may convert to Probable Reserves. Inferred Resources (greater than a ¾-mile radius from a valid point of observation) have been excluded from Reserve consideration. 12.2 Underground Coal Reserves The Elk Run Property reserves are derived from multiple coal seams as shown on Figure 7-1. Demonstrated reserve tons are listed in the discussion below. Table 12-1 shows the demonstrated tonnage by Proven and Probable status. 12.2.1 Checkmate Powellton Seam (Map 3) Checkmate Powellton seam demonstrated reserves are 25.91 Mt clean recoverable tons. The Browns Branch area includes the area from Browns Branch east to the Elk Run impoundment, from the White Knight Mine to north of the Revolution Mine. The Powellton seam is comprised of multiple coal benches with shale partings. Locally, the parting to the top bench thickens and the top bench is not considered part of the minable seam. The roof rock is shale and sandstone, and the floor rock is shale. No hard cutting areas were identified. The average seam thickness of the reserve is 3.78 feet. An isolated High Seam area where the No. 2 Gas seam has merged with the Powellton seam is located near the Elk Run Impoundment. The mine face-up and initial mining is located in this coal block. The High Seam demonstrated reserves are 2.52 Mt clean recoverable tons. The average seam thickness of the reserve is 9.32 feet. The projected inseam yield is 31%. 12.3 Qualified Person’s Estimates The coal reserves, as shown in Table 12-1, are based on a technical evaluation of the geology and a preliminary feasibility study of the coal deposits. The extent to which the coal reserves may be affected by any known environmental, permitting, legal, title, socio-economic, marketing, political, or other relevant issues has been reviewed rigorously. Similarly, the extent to which the estimates of coal

Alpha Metallurgical Resources, Inc. Statement of Coal Resources and Reserves for the Elk Run Underground Complex in Accordance with United States SEC Standards as of December 31, 2023 Central Appalachian Coal Basin West Virginia, USA MARSHALL MILLER & ASSOCIATES, INC. 44 reserves may be materially affected by mining, quality, infrastructure and other relevant factors has also been considered. The results of this TRS define an estimated 28.43 Mt of proven and probable marketable coal reserves. The maps included in Appendix C reflect mining depletion at the time of the resource/reserve calculation taken from Alpha mine maps as of September 30, 2023. Elk Run was idled in 2015; however, the first production cuts in the Checkmate Powellton mine were made in October 2023. Mine depletion tonnages were supplied by Alpha through the end of 2023, and MM&A deducted this historical production from the mapped reserves in order to estimate reserves as of December 31, 2023. Table 12-1: Coal Reserves Summary (Marketable Sales Basis) as of December 31, 2023 Demonstrated Coal Reserves Quality (Dry Basis) (Wet Tons, Washed or Direct Shipped) By Reliability Category By Control Type Area Seam Proven Probable Total Owned Leased Ash% Sulfur% VM% Checkmate Powellton 17,341,000 11,093,000 28,434,000 139,000 28,295,000 6 1.0 34 Grand Total 17,341,000 11,093,000 28,434,000 139,000 28,295,000 6 1.0 34- Notes: Marketable reserve tons are reported on a moist basis, including a combination of surface and inherent moisture. Coal quality is based on a weighted average of laboratory analysis from core holes. The combination of surface and inherent moisture is modeled at 6.0-percent. Actual product moisture is dependent upon multiple geological factors, operational factors, and product contract specifications and can exceed 8-percent. As such, the modeled moisture values provide a level of conservatism for reserve reporting. *Some reserves lack coal quality. Totals may not add due to rounding. See Appendix A for detailed breakdown. 12.4 Qualified Person’s Opinion The estimate of coal reserves was determined in accordance with the SEC Guidelines, SK 1300 that came into effect for the first fiscal year falling on or after January 1, 2021. The LOM mining plan for Elk Run was prepared to the level of preliminary feasibility. Mine projections were prepared, and timing scheduled to match production with coal seam characteristics. Production timing was carried out from current locations to depletion of the coal reserve area. Coal reserve estimates could be materially affected by the risk factors described in Section 22.2. Based on the Preliminary Feasibility Study and the attendant Economic Review, MM&A believes this is a fair and accurate calculation of the Elk Run coal reserves. 13 Mining Methods The Checkmate Powellton underground mine area was modeled and tested economically. Once the Resources were calculated, mine plans were created to project operating the resource area to depletion, with crews and equipment scheduled to move to subsequent mining areas as depletion occurs. Underground mine operations are projected to be exhausted in 2045 when the Checkmate Powellton reserves are anticipated to be fully depleted. Alpha Metallurgical Resources, Inc. Statement of Coal Resources and Reserves for the Elk Run Underground Complex in Accordance with United States SEC Standards as of December 31, 2023 Central Appalachian Coal Basin West Virginia, USA MARSHALL MILLER & ASSOCIATES, INC. 45 13.1 Geotech and Hydrology Mining plans for potential underground mines were developed by Alpha and MM&A. Pillar stability was tested by MM&A using the Analysis of Coal Pillar Stability (ACPS) program that was developed by NIOSH. MM&A reviewed the results from the ACPS analysis and considered it in the development of the LOM plan. Hydrology has not been an issue of concern at the Elk Run area. Based on numerous site visits to the underground operations of the Property by the QP’s, it has been determined that this is not a significant concern. Mining of future reserves is projected to occur in areas which exhibit similar hydrogeological characteristics as those formerly mined areas. 13.2 Production Rates Operations at Elk Run by Alpha and its predecessors have been on-going for many years. The Mine plan and productivity expectations reflect historical performance and efforts have been made to adjust the plan to reflect future conditions. MM&A is confident that the mine plan is reasonably representative to provide an accurate estimation of coal reserves. Mine development and operation have not been optimized within the TRS. Carlson Mining software was used by MM&A to generate mine plans for the mineable coal seams. Mine plans were sequenced based on productivity schedules provided by Alpha, which were based on historically achieved productivity levels. All production forecasting ties assumed production rates to geological models as constructed by MM&A’s team of geologists and mining engineers. The Elk Run Mining Complex was idled in 2015; however, the first production cuts in the Checkmate Powellton mine were made in October 2023. The Checkmate Powellton mine will be configured as super sections with dual air splits on each section and two continuous miners operating independently but dumping to the same conveyor belt. Production is forecasted to produce coal two shifts each day. Production is scheduled Monday through Friday each week, and every other Saturday. As shown in Table 13-1, the one area planned for underground mining produces coal until 2045. The Castle Peerless mine failed to achieve positive economic results and was therefore excluded from the production schedule and economic summary presented in Section 19. Clean coal production varies directly with coal thickness.

Alpha Metallurgical Resources, Inc. Statement of Coal Resources and Reserves for the Elk Run Underground Complex in Accordance with United States SEC Standards as of December 31, 2023 Central Appalachian Coal Basin West Virginia, USA MARSHALL MILLER & ASSOCIATES, INC. 46 Table 13-1: Elk Run Complex Underground Mine Production Schedule (x 1,000 Saleable Tons) Mine Name 2023 2024 2025 2026 2027 2028 2029 2030 Castle Peerless 0 0 0 0 0 0 0 0 Checkmate Powellton 86 1,131 1,253 1,307 1,401 1,369 1,426 1,331 Total 86 1,131 1,253 1,307 1,401 1,369 1,426 1,331 Mine Name 2031 2032 2033 2034 2035 2036 2037 2038 Castle Peerless 0 0 0 0 0 0 0 0 Checkmate Powellton 1,429 1,423 1,334 1,190 1,264 1,528 1,472 1,502 Total 1,429 1,423 1,334 1,190 1,264 1,528 1,472 1,502 Mine Name 2039 2040 2041 2042 2043 2044 2045 2046 Castle Peerless 0 0 0 0 0 0 0 0 Checkmate Powellton 1,251 1,389 1,238 1,236 1,414 1,170 312 0 Total 1,251 1,389 1,238 1,236 1,414 1,170 312 0 *LOM tonnage evaluated in the financial model excludes the Castle Peerless underground mine, which failed to achieve positive economic results. 13.3 Mining Related Requirements 13.3.1 Underground A mine plan with sequenced mining projections was prepared for each logical mining area within the Powellton resources. For the mine plan, the appropriate number of production units is selected for the resource area, and a productivity level assigned, expressed in feet of advance per unit-shift of production. The productivity is based on the equipment and personnel configuration, mining height and expected physical conditions. 13.4 Required Equipment and Personnel 13.4.1 Underground Mines 13.4.1.1 Checkmate Powellton (Map 3) The Powellton seam is accessed by a mine bench along the outcrop. The location of the faceup is at the site of the former Elk Run office building. Infrastructure is available nearby with adequate power, water, communication systems and product transportation. A punchout along the outcrop above the Raw Coal Stockpile at the Chess Processing Plant will be used to belt the run of mine product directly to the plant. The coal boundary will be recovered using four (4) continuous miner units. Each continuous miner unit will be configured as super sections with dual air splits and two continuous miners operating independently but sharing a common loading point on the conveyor belt system. The average seam thickness at the portal area is 9.32 feet while the remaining assignment averages 3.78 feet. The same complement of underground mining equipment will be utilized in both areas with the Komatsu Joy 12CM12 having the capability to reach the higher seam height while also being able to operate at 4.5 feet high in the lower seam areas by cutting out of seam dilution material for clearance. Alpha Metallurgical Resources, Inc. Statement of Coal Resources and Reserves for the Elk Run Underground Complex in Accordance with United States SEC Standards as of December 31, 2023 Central Appalachian Coal Basin West Virginia, USA MARSHALL MILLER & ASSOCIATES, INC. 47 A startup date of October 23, 2023 was used for this TRS, as this was the date that the first continuous miner production cuts were made at Checkmate Powellton. Operating life for this mine is forecast as 23 years for four production units. Future infrastructure costs for ventilation shafts, a new portal location, electrical power distribution and dewatering facilities have been included in the ongoing capital expenditures for this operation. Figure 13-1: Checkmate Powellton Portal Location and Preparation Plant 14 Processing and Recovery Methods 14.1 Description or Flowsheet The Elk Run Division currently includes the Chess Processing Preparation Plant in addition to the supporting coal reserves. The plant was originally constructed in 1980 and received its latest upgrade in 1998.1 The facility was idled in early 2016 but has been secured from equipment removal and vandalism. Activity remains on the Property with an active equipment rebuild facility and the 1 Coal Age Magazine, October 2015, Prep Plant Census

Alpha Metallurgical Resources, Inc. Statement of Coal Resources and Reserves for the Elk Run Underground Complex in Accordance with United States SEC Standards as of December 31, 2023 Central Appalachian Coal Basin West Virginia, USA MARSHALL MILLER & ASSOCIATES, INC. 48 processing plant is currently undergoing renovations and will come online near the end of the year or early January 2024. The infrastructure includes four (4) distinct raw coal stockpiles and four (4) distinct clean coal stockpiles. The variety of stockpiles allows for different coal qualities to be segregated to create various blends to meet specific market orders for the metallurgical and thermal markets. Various coals can be blended from the raw stockpiles during processing to produce a clean product meeting final specification. Train loading from the clean coal stockpiles allows an opportunity for additional blending to occur before the product leaves the facility on the CSX Transportation System. The plant design feed rate is 2,200 short tons per hour. The plant itself includes separation equipment including a heavy media vessel, heavy media cyclones, froth flotation, spirals, centrifugal dryers, screens, pumps and sumps. Rehabilitation work will be necessary to bring the plant to operational status. From the site inspection, the major components such as the heavy media vessel, cyclones, screens, spirals and conveyor belts remain in place. MM&A included capital required to refurbish the Elk Run plant based on budgetary estimates from Alpha. A crew of construction workers was observed on site during the site inspection on December 16, 2022. Example of existing equipment within the Chess Processing Preparation Plant during the December 16, 2022 site visit. Alpha Metallurgical Resources, Inc. Statement of Coal Resources and Reserves for the Elk Run Underground Complex in Accordance with United States SEC Standards as of December 31, 2023 Central Appalachian Coal Basin West Virginia, USA MARSHALL MILLER & ASSOCIATES, INC. 49 Figure 14-1: Chess Process Preparation Plant Existing Equipment Coarse and fine refuse are disposed at the Elk Run Impoundment and coarse refuse disposal site. The fine refuse slurry disposal is pumped to the impoundment structure which provides adequate fines storage capacity for the life of the projected reserves. The coarse refuse is transported by conveyor belts to disposal sites along the front face of the impoundment as well as areas above the impoundment pool. The flood railroad loadout is serviced by the CSX rail system. The loading tracks run from the CSX railyard past the Loadout. The facility can load a 150-car unit train in four hours. Coal is recovered by reclaim belts from either of the two (2) tunnels, each servicing two clean coal stockpile areas.

Alpha Metallurgical Resources, Inc. Statement of Coal Resources and Reserves for the Elk Run Underground Complex in Accordance with United States SEC Standards as of December 31, 2023 Central Appalachian Coal Basin West Virginia, USA MARSHALL MILLER & ASSOCIATES, INC. 50 Figure 14-2: Railcar Loading Facility on the December 2022 Site Visit Processes and equipment are typical of those used in the coal industry and are in use in nearly all plants in the Central Appalachian Basin. 14.2 Requirements for Energy, Water, Material and Personnel Personnel have historically been sourced from the surrounding communities in Raleigh, Kanawha, Fayette, and Boone Counties, and have proven to be adequate in numbers to conduct processing Alpha Metallurgical Resources, Inc. Statement of Coal Resources and Reserves for the Elk Run Underground Complex in Accordance with United States SEC Standards as of December 31, 2023 Central Appalachian Coal Basin West Virginia, USA MARSHALL MILLER & ASSOCIATES, INC. 51 operations at Elk Run. As mining is common in the surrounding areas, the workforce is generally familiar with mining practices, and many are experienced miners. Water is sourced locally from public water sources or rivers, and electricity is sourced from American Electric Power. The service industry in the areas surrounding the mine complex has historically provided supplies, equipment repairs and fabrication, etc. 15 Infrastructure Alpha’s Chess Processing preparation plant services the area with washed coal, which is transported via the CSX rail line at the plant’s loadout. Haul roads, primary roads, and conveyor belt systems account for transport from the various mine sites to the preparation plant. This practice will continue for future reserves. 15.1 Chess Processing Preparation Plant The preparation plant and associated refuse disposal areas have been established and maintained to provide a modern coal processing facility. The coal handling ability in both the raw coal and clean coal areas allows for separating different types of coals for servicing different customer’s needs. The existing blending capabilities and the variety of coal seams reporting to the facility allows for a custom coal to be provided. An aerial photo of the facility follows in Figure 15-1.

Alpha Metallurgical Resources, Inc. Statement of Coal Resources and Reserves for the Elk Run Underground Complex in Accordance with United States SEC Standards as of December 31, 2023 Central Appalachian Coal Basin West Virginia, USA MARSHALL MILLER & ASSOCIATES, INC. 52 Figure 15-1: Chess Processing Facilities Alpha Metallurgical Resources, Inc. Statement of Coal Resources and Reserves for the Elk Run Underground Complex in Accordance with United States SEC Standards as of December 31, 2023 Central Appalachian Coal Basin West Virginia, USA MARSHALL MILLER & ASSOCIATES, INC. 53 Figure 15-2: Chess Processing Raw Coal Facilities

Alpha Metallurgical Resources, Inc. Statement of Coal Resources and Reserves for the Elk Run Underground Complex in Accordance with United States SEC Standards as of December 31, 2023 Central Appalachian Coal Basin West Virginia, USA MARSHALL MILLER & ASSOCIATES, INC. 54 Figure 15-3: Chess Processing Refuse Impoundment As new areas are developed, the infrastructure requirements will change. These changes have been considered in the LOM plans and financial model. 16 Market Studies 16.1 Market Description The quality characteristics for the subject coal resources and coal reserves have been reviewed in detail by MM&A. The drill hole data were utilized to develop average coal quality characteristics for the mining site. These average coal quality characteristics were then utilized as the basis for determining the various markets into which the saleable coal will likely be placed. The mine production serves the high-volatile metallurgical markets. A typical quality specification for the Elk Run products is as shown in Table 16-1. Alpha Metallurgical Resources, Inc. Statement of Coal Resources and Reserves for the Elk Run Underground Complex in Accordance with United States SEC Standards as of December 31, 2023 Central Appalachian Coal Basin West Virginia, USA MARSHALL MILLER & ASSOCIATES, INC. 55 Table 16-1: Quality Specifications HV Ash (%) 5.94 Sulfur (%) 1.01 Volatile Matter (%) 34 16.2 Price Forecasts Company-wide pricing data as provided by Alpha from third-party sources is described in Table 16-2. Note that not all products reflected in Table 16-2 will apply to every business unit. The pricing data assumes a flat-line long-term realization of $140 per short ton port pricing, with an average of $113.94 per ton netback pricing reflective of the high-volatile product proposed to be sold at Elk Run. These estimates are based on long-term pricing published by third-party sources and adjusted for quality and transportation. The netback pricing represents adjustments made to published benchmark pricing based on quality and transportation. A large majority of the coal sold by Alpha and their future Elk Run business group is shipped internationally as part of blended products from other business units within Alpha or sourced from other companies. These netback adjustments reflect these additional costs carried after the products leave the Elk Run business unit. Table 16-2: Price Forecasts Coal Quality Market Pricing Per Ton (1) (2) High-Vol. A $162 High- Vol. B $140 Mid-Vol. $163 Low-Vol. $163 Thermal $74 (1) Market pricing shown on U.S. East Coast basis. (2) Metallurgical and thermal pricing based on 10-year and 3- year average, respectively of forecasted pricing from pricing services. 16.3 Contract Requirements Some contracts are necessary for successful marketing of the coal. For Elk Run, since all mining, preparation and marketing is done in-house, the remaining contracts required are: > Transportation – Alpha contracts with the CSX Railroad to transport coal to market > Sales – Sales contracts are a mix of spot and contract sales. With the volatility of the market, long- term contracts are not typically written.

Alpha Metallurgical Resources, Inc. Statement of Coal Resources and Reserves for the Elk Run Underground Complex in Accordance with United States SEC Standards as of December 31, 2023 Central Appalachian Coal Basin West Virginia, USA MARSHALL MILLER & ASSOCIATES, INC. 56 17 Environmental Studies, Permitting and Plans, Negotiations or Agreements with Local Individuals 17.1 Results of Studies MM&A completed an environmental review in 2011 of the Massey properties acquired by Alpha, including those operations that were active at Elk Run at that time. The environmental review completed by MM&A included site inspections, reviews of historical records, database searches of State and Federal regulatory records and interviews to identify potential recognized environmental conditions (RECs) that may create environmental liability for the sites. While MM&A identified RECs during both studies, MM&A’s opinion was that those issues would not preclude the continued or future use of the properties as a coal mining/preparation venture. Based on this former ESA completed by MM&A, it is MM&A’s opinion that Elk Run has a generally typical coal industry record of compliance with applicable mining, water quality, and environmental laws. Estimated costs for mine closure, including water quality monitoring during site reclamation, are included in the financial models. 17.2 Requirements and Plans for Waste Disposal The existing refuse impoundment has a fines storage volume of approximately 12,378-acre feet at this time. A calculation was performed by MM&A’s staff based on the mine model production totals to determine the volume of refuse to be generated during the life of the project. The findings indicate: > There is approximately 12,378 Acre-Feet of fines storage available in the current impoundment pool. This represents approximately 24,263,000 tons of fines storage at 90 tons per cubic feet density. > The mine models indicate 39.1 million tons of combined refuse production during the life of the project. At a 3-coarse ton to 1-fine ton refuse distribution, 9.8 million tons of fines will be generated. > The existing impoundment pool will provide adequate storage for the refuse fines during the life of the project. > Coarse refuse storage is available within the permit perimeter to store the coarse refuse production during the life of the project. 17.3 Permit Requirements and Status All mining operations are subject to federal and state laws and must obtain permits to operate mines, coal preparation and related facilities, haul roads, and other incidental surface disturbances necessary for mining to occur. Permits generally require that the permittee post a performance bond in an Alpha Metallurgical Resources, Inc. Statement of Coal Resources and Reserves for the Elk Run Underground Complex in Accordance with United States SEC Standards as of December 31, 2023 Central Appalachian Coal Basin West Virginia, USA MARSHALL MILLER & ASSOCIATES, INC. 57 amount established by the regulatory program to provide assurance that any disturbance or liability created during mining operations is properly restored to an approved post-mining land use and that all regulations and requirements of the permits are fully satisfied before the bond is returned to the permittee. Significant penalties exist for any permittee who fails to meet the obligations of the permits including cessation of mining operations, which can lead to potential forfeiture of the bond. Any company, and its directors, owners and officers, which are subject to bond forfeiture can be denied future permits under the program.2 New permits or permit revisions will occasionally be necessary to facilitate the expansion or addition of new mining areas on the Property, such as amendments to existing permits and new permits for mining of reserve areas. Exploration permits also are required. Property under lease includes provisions for exploration among the terms of the lease. New or modified mining permits are subject to a public advertisement process and comment period, and the public is provided an opportunity to raise objections to any proposed mining operation. MM&A is not aware of any specific prohibition of mining on the subject property and given sufficient time and planning, Alpha should be able to secure new permits to maintain its planned mining operations within the context of current regulations. Necessary permits are in place to support current production on the Property, but future permits are required to maintain and expand production. Portions of the Property are located near local communities. Regulations prohibit mining activities within 300 feet of a residential dwelling, school, church, or similar structure unless written consent is first obtained from the owner of the structure. Where required, Alpha reports that such consents have been obtained where mining is proposed beyond the regulatory limits. Alpha has obtained all mining and discharge permits to operate its mines and processing, loadout or related facilities. MM&A is unaware of any obvious or current Alpha permitting issues that are expected to prevent the issuance of future permits. Elk Run, along with all coal producers, is subject to a level of uncertainty regarding future clean water permits due to United States Environmental Protection Agency (EPA) and United States Fish and Wildlife (USFW) involvement with state programs. The mining permits currently held by Elk Run are shown in Table 17-1. 2 Monitored under the Applicant Violator System (AVS) by the Federal Office of Surface Mining.

Alpha Metallurgical Resources, Inc. Statement of Coal Resources and Reserves for the Elk Run Underground Complex in Accordance with United States SEC Standards as of December 31, 2023 Central Appalachian Coal Basin West Virginia, USA MARSHALL MILLER & ASSOCIATES, INC. 58 Table 17-1: Elk Run Mining Permits Mine Name Type Permit Status Expires Acres Disturbed Acres Reclaimed Acres Bonded Elk Run Coal Underground - Peerless D-0021-82 Inactive 05/24/27 58.52 17.19 81.72 Blue Pennant/Twilight Haul Road Haul road Only O-5014-96 Active, Moving Coal 11/04/26 84.83 15.17 100.0 Chess Processing Coal Refuse Refuse Disposal O-5042-93 Inactive 03/07/25 362.2 81.76 563.99 Elk Run Loadout Only O-5078-91 Inactive 05/19/27 30.52 13.12 43.64 CC Haul Road No. 1 Other – Haul Road O-5002-15 Not Started 04/13/26 0 0 65 CC Prep Plant Utility Area Other – Haul Road O-5003-15 Not Started 06/06/26 0 0 66 Cabin Creek Preparation Plant Other O-5004-15 Not Started 07/25/26 0 0 52 Elk Run Preparation Plant P-0470-00 Inactive 03/830/27 80.68 32.81 114.75 Elk Run Coal Underground - Coalburg U-0663-00 Inactive 05/24/27 14.92 14 28.92 Roundbottom Deep Mine Coal Underground – Powellton U-5003-05 Inactive 03/03/26 34.42 0 39.73 Black Knight II Coal Underground – Kanawha BF MZ U-5011-98 Active – Reclamation Only 09/28/23 96 0 96 Black Knight II Coal Underground – No. 2 Gas U-5014-98 Inactive 12/01/23 45.38 0 42.94 Hunter Peerless Deep Mine Coal Underground - Peerless U-5022-07 Active – Reclamation Only 08/08/28 37.59 0 37.59 Black King I Coal Underground – Cedar Grove U-5024-00 Inactive 06/19/27 47.21 0 47.21 Elk Run Coal Underground - Peerless U-6007-89 Inactive 07/28/24 1.38 0 4.19 Elk Run Coal Company, LLC Coal Underground - Powellton U-5002-23 Active 06/05/28 - 0 12.48 Titan Mine Coal Underground - Alma U-3002-13 Not Started 10/27/27 0 0 70 White Bishop Deep Mine Coal Underground U-3002-94 Inactive 7/30/27 54.74 0 72.14 Laurel Eagle Mine Coal Underground U-3008-94 Inactive 02/07/25 6.65 10.73 17.66 Laurel Powellton Mine Coal Underground U-3009-96 Not Started 03/06/27 0 0 5 Laurel Branch Alma Mine Coal Underground U-3018-94 Inactive 01/10/25 17.01 5.79 22.8 Mine No. 17 Coal Underground – Eagle-Ltl U-5007-15 Not Started 10/17/26 0 0 28 Mine No. 18 Coal Underground – Cedar Grove U-5008-15 Not Started 10/20/26 0 0 6 Mine No. 18 Coal Underground – Eagle A U-5009-15 Not Started 10/25/26 0 0 3 Note: Permit status and expiration dates are based on information obtained from regulatory agency website. Permits in reclamation status receive Renewal Waivers and may show expired dates. 17.4 Local Plans, Negotiations or Agreements MM&A found no indication of agreements beyond the scope of Federal or State Regulations. 17.5 Mine Closure Plans Applicable regulations require that mines be properly closed, and reclamation commenced immediately upon abandonment. In general, site reclamation includes removal of structures, backfilling, regrading, and revegetation of disturbed areas. For surface mines, the majority of the expense for backfilling and regrading is completed as part of ongoing mining operations, with only reclamation of final pits and HWM benches required at end-of-mine life. Sediment control is required during the establishment of vegetation, and bond release generally requires a minimum five-year period of site maintenance, water sampling, and sediment control following mine completion. This requirement is reduced to two years for certain operations involving re-mining. Reclamation of underground mines includes closure and sealing of mine openings such as portals and shafts in addition to the items listed above. Alpha Metallurgical Resources, Inc. Statement of Coal Resources and Reserves for the Elk Run Underground Complex in Accordance with United States SEC Standards as of December 31, 2023 Central Appalachian Coal Basin West Virginia, USA MARSHALL MILLER & ASSOCIATES, INC. 59 Estimated costs for mine closure, including water quality monitoring during site reclamation, are included in the financial models. As with all mining companies, an accretion calculation is performed annually so the necessary Asset Retirement Obligations (ARO) can be shown as a Liability on the Balance Sheet. 17.6 Qualified Person’s Opinion The Elk Run Mining Complex was idled in 2015; however, the first production cuts in the Checkmate Powellton mine were made in October 2023. Permits necessary to resume production are issued or are expected to be issued to meet the LOM plan. MM&A knows of no reason that any permit revisions or new permits that may be required cannot be obtained. Estimated expenditures for site closure and reclamation are included in the financial model for this site. 18 Capital and Operating Costs 18.1 Capital Cost Estimate The production sequence selected for a property must consider the proximity of each reserve area to coal preparation plants, river docks and/or railroad loading points, along with suitability of production equipment to coal seam conditions. The in-place infrastructure was evaluated, and any future needs were planned to a level suitable for a Preliminary Feasibility Study and included in the Capital Forecast. Alpha provided MM&A with information related to the number of currently operating production units at Elk Run. MM&A’s capital schedules assume that major equipment rebuilds occur over the course of each machine’s remaining assumed operating life. Replacement equipment was scheduled based on MM&A’s experience and knowledge of mining equipment and industry standards with respect to the useful life of such equipment. As one mine is depleted, the equipment is moved to its replacement. The capital expenditures tables detail costs for major equipment and infrastructure such as conveyor belt terminal groups. “Other” costs include expenditures for mine access and construction, mine extension capital and miscellaneous costs. A summary of the estimated capital for the consolidated Elk Run operations is provided in Figure 18-1 below. Total capital by mine is summarized in Table 18-1.

Alpha Metallurgical Resources, Inc. Statement of Coal Resources and Reserves for the Elk Run Underground Complex in Accordance with United States SEC Standards as of December 31, 2023 Central Appalachian Coal Basin West Virginia, USA MARSHALL MILLER & ASSOCIATES, INC. 60 Figure 18-1: Projected Capital Expenditures – Consolidated Elk Run Operations Table 18-1: Summary of Capital Expenditures Schedule by Mine Item Total 2023 2024 2025 2026 2027 2028 2029 Castle Peerless $0 $0 $0 $0 $0 $0 $0 $0 Checkmate Powellton $252,397 $0 $17,338 $27,969 $5,100 $4,320 $16,259 $16,277 Total $252,397 $0 $17,338 $27,969 $5,100 $4,320 $16,259 $16,277 Item 2030 2031 2032 2033 2034 2035 2036 2037 Castle Peerless $0 $0 $0 $0 $0 $0 $0 $0 Checkmate Powellton $5,887 $7,200 $15,030 $16,284 $11,706 $10,207 $19,505 $7,200 Total $5,887 $7,200 $15,030 $16,284 $11,706 $10,207 $19,505 $7,200 Item 2038 2039 2040 2041 2042 2043 2044 2045 Castle Peerless $0 $0 $0 $0 $0 $0 $0 $0 Checkmate Powellton $22,678 $18,166 $14,846 $8,040 $1,080 $7,304 $0 $0 Total $22,678 $18,166 $14,846 $8,040 $1,080 $7,304 $0 $0 Note: No capital was projected for 4th quarter 2023. 18.2 Operating Cost Estimate Alpha provided historical costs and budgeted projections of operating costs for its active mines in West Virginia for MM&A’s review. MM&A used the historical and/or budget cost information as a reference and developed a personnel schedule for the mine. Hourly labor rates and salaries were based upon information contained in Alpha’s financial summaries. Fringe benefit costs were developed for vacation and holidays, federal and state unemployment insurance, retirement, workers’ compensation and Alpha Metallurgical Resources, Inc. Statement of Coal Resources and Reserves for the Elk Run Underground Complex in Accordance with United States SEC Standards as of December 31, 2023 Central Appalachian Coal Basin West Virginia, USA MARSHALL MILLER & ASSOCIATES, INC. 61 pneumoconiosis, casualty and life insurance, healthcare and bonuses. A cost factor for mine supplies was developed that relates expenditures to mine advance rates for roof control costs and other mine supply costs based on the historical cost data provided by Alpha. Other factors were developed for maintenance and repair costs, rentals, mine power, outside services, coal preparation plant processing, refuse handling, coal loading, property taxes, and insurance and bonding and other direct mining costs. Appropriate royalty rates were assigned for production from leased coal lands and sales taxes were calculated for state severance taxes, the federal black lung excise tax, and federal and state reclamation fees. Statutory sales-related costs are summarized in Table 18-2. Table 18-2: Estimated Coal Production Taxes and Sales Costs Description of Tax or Sales Cost Basis of Assessment Cost Federal Black Lung Excise Tax - Underground Per Ton $1.10 Federal Reclamation Fees – Underground Per Ton $0.12 West Virginia Reclamation Tax - Underground Per Ton $0.279 West Virginia Severance Tax Percentage of Revenue 1 to 5% Royalties - Underground Percentage of Revenue 6.0% Notes: 1. Federal black lung excise tax is paid only on coal sold domestically. MM&A assumed 50% of sales will be into domestic market. A summary of the projected operating costs for the consolidated Elk Run operations is provided in Figure 18-2.

Alpha Metallurgical Resources, Inc. Statement of Coal Resources and Reserves for the Elk Run Underground Complex in Accordance with United States SEC Standards as of December 31, 2023 Central Appalachian Coal Basin West Virginia, USA MARSHALL MILLER & ASSOCIATES, INC. 62 Figure 18-2: Elk Run Operating Costs 19 Economic Analysis 19.1 Economic Evaluation 19.1.1 Introduction The pre-feasibility financial model prepared for this TRS was developed to test the economic viability of each coal resource area. The results of this financial model are not intended to represent a bankable feasibility study, required for financing of any current or future mining operations contemplated for the Alpha properties, but are intended to establish the economic viability of the estimated coal reserves. Cash flows are simulated on an annual basis based on projected production from the coal reserves. The discounted cash flow analysis presented herein is based on an effective date of January 1, 2024. On an un-levered basis, the NPV of the project cash flow after taxes represents the Enterprise Value of the project. The project cash flow, excluding debt service, is calculated by subtracting direct and indirect operating expenses and capital expenditures from revenue. Direct costs include labor, operating supplies, maintenance and repairs, facilities costs for materials handling, coal preparation, refuse disposal, coal loading, reclamation and general and administrative costs. Indirect costs include statutory and legally agreed upon fees related to direct extraction of the mineral. The indirect costs Alpha Metallurgical Resources, Inc. Statement of Coal Resources and Reserves for the Elk Run Underground Complex in Accordance with United States SEC Standards as of December 31, 2023 Central Appalachian Coal Basin West Virginia, USA MARSHALL MILLER & ASSOCIATES, INC. 63 are the Federal black lung tax, Federal and State reclamation taxes, property taxes, coal production royalties, and income taxes. The Alpha mines’ historical costs provided a useful reference for MM&A’s cost estimates. The operations are projected on a calendar year basis. MM&A’s projection of annual sales tonnage is summarized in the chart below. While all Alpha coal resource properties deemed by MM&A to have potential for classification as coal reserves were evaluated as part of the economic model, some of those resource areas were determined to be uneconomical in the current market and were therefore excluded from coal reserves as discussed below. Figure 19-1: Projection of Sales Tons Sales revenue is based on the coal price information provided to MM&A by Alpha. Only the revenue from Alpha’s captive mining operations is included in the financial model used for this TRS. The P&L projections of the individual mines of Alpha’s Elk Run operations are then consolidated into a P&L and cash flow schedule for further testing of the economics. Projected debt service is excluded from the P&L and cash flow model in order to determine Enterprise Value of the aggregated entity. The financial model expresses coal sales prices, operating costs, and capital expenditures in current day dollars without adjustment for inflation. Capital expenditures and reclamation costs are included based

Alpha Metallurgical Resources, Inc. Statement of Coal Resources and Reserves for the Elk Run Underground Complex in Accordance with United States SEC Standards as of December 31, 2023 Central Appalachian Coal Basin West Virginia, USA MARSHALL MILLER & ASSOCIATES, INC. 64 on engineering estimates for each mine by year. MM&A also included an estimate of administrative costs in the financial projections. Alpha will pay royalties for the various current and projected operations. The royalty rates vary by location as provided by Alpha. The royalty rates were assumed to be 6.0% of the sales revenue. The projection model also includes consolidated income tax calculations at Alpha’s Elk Run Division level, incorporating statutory depletion calculations, as well as state income taxes, and a federal tax rate of 21%. To the extent the Alpha mines generate net operating losses for tax purposes, the losses are carried over to offset future taxable income from Alpha mines. The terms “cash flows” and “project cash flows” used in this report refer to after-tax cash flows. Alpha’s projected consolidated annual revenue for the Elk Run operations is shown in the chart below: Figure 19-2: Consolidated Annual Revenue Projected consolidated revenue, cash costs, and EBITDA for the Elk Run operations are expressed in dollars per ton in the graph below. Alpha Metallurgical Resources, Inc. Statement of Coal Resources and Reserves for the Elk Run Underground Complex in Accordance with United States SEC Standards as of December 31, 2023 Central Appalachian Coal Basin West Virginia, USA MARSHALL MILLER & ASSOCIATES, INC. 65 Figure 19-3: Revenue, Cash Costs, and EBITDA The above chart shows an average LOM revenue of $114 per ton, cash costs of $91 to $106 per ton and EBITDA of $8 to $23 per ton at steady state. Positive EBITDA per ton averages $16.26 per ton over the life of the operations. Table 19-1 shows LOM tonnage, P&L, and EBITDA for each Alpha mine at Elk Run. Table 19-1: Life-of-Mine Tonnage, P&L before Tax, and EBITDA LOM Tonnage LOM Pre-Tax P&L P&L Per Ton LOM EBITDA EBITDA Per Ton Castle Peerless* - $0 $- $0 $- Checkmate Powellton 28,457 $40,698 $1.43 $462,803 $16.26 Consolidated Deep Mines 28,457 $40,698 $1.43 $462,803 $16.26 Note: * This resource area failed to achieve positive results in the economic evaluation. Therefore, the coal tons and negative economic results have been excluded from the estimate of coal reserves in this TRS and economic summary above. ** LOM tonnage evaluated in the financial model includes 4th quarter 2023 production (22,902 clean tons), which was subtracted from coal reserves in order to make the effective date of the reserves December 31, 2023. As shown in Table 19-1, the Alpha consolidated Elk Run operations show positive LOM P&L and EBITDA of $40.7 million and $462.8 million, respectively. A breakdown of projected EBITDA for the consolidated Elk Run operations is shown in the chart below:

Alpha Metallurgical Resources, Inc. Statement of Coal Resources and Reserves for the Elk Run Underground Complex in Accordance with United States SEC Standards as of December 31, 2023 Central Appalachian Coal Basin West Virginia, USA MARSHALL MILLER & ASSOCIATES, INC. 66 Figure 19-4: Annual EBITDA 19.1.2 Cash Flow Summary Alpha’s consolidated Elk Run cash flow summary in constant dollars, excluding debt service, is shown in Table 19-2 below. Table 19-2: Project Cash Flow Summary (000) YE 12/31 YE 12/31 YE 12/31 YE 12/31 YE 12/31 YE 12/31 Total 2023 2024 2025 2026 2027 2028 Production & Sales tons 28,457 86 1,131 1,253 1,307 1,401 1,369 Total Revenue $3,242,361 $9,835 $128,881 $142,766 $148,947 $159,607 $155,944 EBITDA $462,803 ($74) $12,689 $21,247 $22,502 $22,885 $25,016 Net Income $9,991 ($1,397) ($6,283) ($2,466) ($476) $324 ($682) Net Cash Provided by Operating Activities $432,096 $646 $9,582 $20,227 $22,789 $23,900 $25,249 Purchases of Property, Plant, and Equipment ($252,397) $0 ($17,338) ($27,969) ($5,100) ($4,320) ($16,259) Net Cash Flow $179,699 $646 ($7,756) ($7,742) $17,689 $19,580 $8,990 YE 12/31 YE 12/31 YE 12/31 YE 12/31 YE 12/31 YE 12/31 YE 12/31 2029 2030 2031 2032 2033 2034 2035 Production & Sales tons 1,426 1,331 1,429 1,423 1,334 1,190 1,264 Total Revenue $162,449 $151,631 $162,827 $162,157 $152,049 $135,567 $143,998 EBITDA $32,463 $23,271 $33,122 $32,616 $23,808 $9,357 $15,046 Net Income $12,173 $3,762 $13,620 $14,642 $5,227 ($7,866) ($1,713) Net Cash Provided by Operating Activities $29,384 $24,690 $30,159 $31,361 $25,044 $13,886 $16,036 Purchases of Property, Plant, and Equipment ($16,277) ($5,887) ($7,200) ($15,030) ($16,284) ($11,706) ($10,207) Net Cash Flow $13,107 $18,803 $22,959 $16,331 $8,760 $2,179 $5,828 Alpha Metallurgical Resources, Inc. Statement of Coal Resources and Reserves for the Elk Run Underground Complex in Accordance with United States SEC Standards as of December 31, 2023 Central Appalachian Coal Basin West Virginia, USA MARSHALL MILLER & ASSOCIATES, INC. 67 YE 12/31 YE 12/31 YE 12/31 YE 12/31 YE 12/31 YE 12/31 YE 12/31 2036 2037 2038 2039 2040 2041 2042 Production & Sales tons 1,528 1,472 1,502 1,251 1,389 1,238 1,236 Total Revenue $174,124 $167,714 $171,141 $142,551 $158,220 $141,088 $140,820 EBITDA $33,043 $31,027 $32,973 $12,608 $24,272 $11,625 $12,005 Net Income $11,664 $9,510 $8,842 ($8,018) $1,493 ($8,683) ($7,241) Net Cash Provided by Operating Activities $28,442 $30,456 $31,626 $19,104 $23,352 $17,153 $15,452 Purchases of Property, Plant, and Equipment ($19,505) ($7,200) ($22,678) ($18,166) ($14,846) ($8,040) ($1,080) Net Cash Flow $8,937 $23,256 $8,948 $938 $8,505 $9,113 $14,372 YE 12/31 YE 12/31 YE 12/31 YE 12/31 YE 12/31 YE 12/31 YE 12/31 2043 2044 2045 2046 2047 2048 2049 Production & Sales tons 1,414 1,170 312 0 0 0 0 Total Revenue $161,150 $133,317 $35,578 $0 $0 $0 $0 EBITDA $25,191 $13,181 $589 ($4,376) ($1,732) ($874) ($445) Net Income $5,433 ($5,036) ($11,524) ($8,753) ($3,464) ($1,747) ($890) Net Cash Provided by Operating Activities $24,942 $18,290 $9,471 ($35,487) ($11,829) ($5,914) ($2,957) Purchases of Property, Plant, and Equipment ($7,304) $0 $0 $0 $0 $0 $0 Net Cash Flow $17,638 $18,290 $9,471 ($35,487) ($11,829) ($5,914) ($2,957) YE 12/31 YE 12/31 YE 12/31 YE 12/31 YE 12/31 YE 12/31 YE 12/31 2050 2051 2052 2053 2054 2055 2056 Production & Sales tons 0 0 0 0 0 0 0 Total Revenue $0 $0 $0 $0 $0 $0 $0 EBITDA ($232) ($0) ($0) ($0) ($0) ($0) ($0) Net Income ($463) ($0) ($0) ($0) ($0) ($0) ($0) Net Cash Provided by Operating Activities ($2,957) $0 $0 $0 $0 $0 $0 Purchases of Property, Plant, and Equipment $0 $0 $0 $0 $0 $0 $0 Net Cash Flow ($2,957) $0 $0 $0 $0 $0 $0 Notes: (1) The Castle II (Peerless) resource area failed to achieve positive results in the economic evaluation. Therefore, the coal tons and negative economic results for this area have been excluded from the estimate of coal reserves in this TRS and economic summary above. LOM tonnage evaluated in the financial model includes 4th quarter 2023 production (22,902 clean tons), which was subtracted from coal reserves in order to make the effective date of the reserves December 31, 2023. (2) Results shown for 2023 represent 4th quarter only. Consolidated cash flows are driven by annual sales tonnage, which grows from 1.1 million tons in 2024 to a peak of nearly 1.5 million tons in 2036. Between years 2037 and 2043, sales range from 1.2 million to 1.5 million tons and between years 2044-2045, sales range from 0.3 million tons to 1.2 million tons. Projected consolidated revenue grows from $128.9 million in 2024 to a peak of $174.1 million in 2036. Revenue totals $3.2 billion for the project’s life. Consolidated cash flow from operations is positive throughout the projected operating period, with the exception of post-production years, due to end-of-mine reclamation spending. Consolidated cash flow from operations peaks at $31.6 million in 2038 and totals $432.1 million over the project life. Capital expenditures total $71.0 million during the first five years and $252.4 million over the project’s life. Consolidated Elk Run net cash flow after tax, but before debt service, is shown by year in the chart below:

Alpha Metallurgical Resources, Inc. Statement of Coal Resources and Reserves for the Elk Run Underground Complex in Accordance with United States SEC Standards as of December 31, 2023 Central Appalachian Coal Basin West Virginia, USA MARSHALL MILLER & ASSOCIATES, INC. 68 Figure 19-5: Net Cash Flow after Tax (Before Debt Service) LOM Net cash flow is positive for this project. The cash flows after year 2045 are generally related to end of mine reclamation expenditures, which are accrued over the life of the mines. 19.1.3 Discounted Cash Flow Analysis Cash flow after tax, but before debt service, generated over the life of the project was discounted to NPV at a 16.57% discount rate, which represents MM&A’s estimate of the constant dollar, risk adjusted WACC for likely market participants if the subject reserves were offered for sale. On an un-levered basis, the NPV of the project cash flows represents the Enterprise Value of the project and amounts to $50.9 million. Alpha is an active producer, and the financial model shows positive net cash flow for each year of the operating life of the Elk Run reserves. The pre-feasibility financial model prepared for the TRS was developed to test the economic viability of each coal resource area. The NPV estimate was made for the purpose of confirming the economics for classification of coal reserves and not for purposes of valuing Alpha or its Elk Run assets. Mine plans were not optimized, and actual results of the operations may be different, but in all cases, the mine production plan assumes the properties are under competent management. 19.1.4 Sensitivity Analysis Sensitivity of the NPV results to changes in the key drivers is presented in the chart below. The sensitivity study shows the NPV at the 16.57% discount rate when Base Case sales prices, operating Alpha Metallurgical Resources, Inc. Statement of Coal Resources and Reserves for the Elk Run Underground Complex in Accordance with United States SEC Standards as of December 31, 2023 Central Appalachian Coal Basin West Virginia, USA MARSHALL MILLER & ASSOCIATES, INC. 69 costs, capital costs and discount rate are increased and decreased in increments of 5% within a +/- 15% range. Figure 19-6: Sensitivity of NPV As shown, NPV is quite sensitive to changes in sales price and operating cost estimates, and slightly sensitive to changes in capital cost estimates. 20 Adjacent Properties 20.1 Information Used No Proprietary information associated with third-party neighboring properties was used as part of this study. Alpha’s Marfork properties and operations join Elk Run’s properties southern boundary. Drill hole databases and geologic models encompass both properties and there is no physical separation line between the properties. In multiple cases, certain reserve production could be sent to either of the operations preparation plants.

Alpha Metallurgical Resources, Inc. Statement of Coal Resources and Reserves for the Elk Run Underground Complex in Accordance with United States SEC Standards as of December 31, 2023 Central Appalachian Coal Basin West Virginia, USA MARSHALL MILLER & ASSOCIATES, INC. 70 21 Other Relevant Data and Information MM&A performed a previous evaluation of the Property in year 2022 for reserves effective as of December 31, 2022, for Alpha based on SEC S-K 1300 standards. Elk Run was previously included in Alpha’s MWVUG (currently referred to as Marfork) TRS dated December 31, 2021 and MM&A utilized this evaluation as well as the 2022 evaluation as the basis for the December 31, 2023 TRS. 22 Interpretation and Conclusions 22.1 Conclusion Sufficient data has been obtained through various exploration and sampling programs and mining operations to support the geological interpretations of seam structure and thickness for coal horizons situated on the Elk Run Property. The data is of sufficient quantity and reliability to reasonably support the coal resource and coal reserve estimates in this TRS. The geological data and preliminary feasibility study, which consider mining plans, revenue, and operating and capital cost estimates are sufficient to support the classification of coal reserves provided herein. This geologic evaluation conducted in conjunction with the preliminary feasibility study is sufficient to conclude that the 28.43 Mt of marketable coal reserves identified on the Property are economically mineable under reasonable expectations of market prices for metallurgical coal products, estimated operation costs, and capital expenditures. 22.2 Risk Factors Risks have been identified for operational, technical and administrative subjects addressed in the Pre- Feasibility Study. A risk matrix has been constructed to present the risk levels for all the risk factors identified and quantified in the risk assessment process. The risk matrix and risk assessment process are modelled to that presented in the Australian and New Zealand Standard on Risk Management (AS/NZS 4360). The purpose of the characterization of the project risk components is to inform the project stakeholders of key aspects of the Alpha projects that can be impacted by events whose consequences can affect the success of the venture. The significance of an impacted aspect of the operation is directly related to both the probability of occurrence and the severity of the consequences. The initial risk for a risk factor is herein defined as the risk level after the potential impact of the risk factor is addressed by competent and prudent management utilizing control measures readily available. Residual risk for a risk factor is herein defined as the risk level following application of special mitigation measures if Alpha Metallurgical Resources, Inc. Statement of Coal Resources and Reserves for the Elk Run Underground Complex in Accordance with United States SEC Standards as of December 31, 2023 Central Appalachian Coal Basin West Virginia, USA MARSHALL MILLER & ASSOCIATES, INC. 71 management determines that the initial risk level is unacceptable. Initial risk and residual risk can be quantified numerically, derived by the product of values assigned to probability and consequence ranging from very low risk to very high risk. The probability and consequence parameters are subjective numerical estimates made by practiced mine engineers and managers. Both are assigned values from 1 to 5 for which the value 1 represents the lowest probability and least consequence, and the value 5 represents the highest probability and greatest consequence. The products which define the Risk Level are classified from very low to very high. Risk Level Table (R = P x C) Risk Level (R) Very Low (1 to 2) Low (3 to 5) Moderate (6 to 11) High (12 to 19) Very High (20 to 25) Risk aspects identified and evaluated during this assignment total 13. No residual risks are rated Very High. Three (3) residual risks are rated High. Six (6) of the risk aspects could be associated with Moderate residual risk. Four (4) of the risk aspects were attributed Low or Very Low residual risks. 22.2.1 Governing Assumptions The listing of the aspects is not presumed to be exhaustive. Instead that listing is presented based on the experiences of the contributors to the TRS. 1. The probability and consequence ratings are subjectively assigned, and it is assumed that this subjectivity reasonably reflects the condition of the active and projected mine operations. 2. The Control Measures shown in the matrices presented in this chapter are not exhaustive. They represent a condensed collection of activities that the author of the risk assessment section has observed to be effective in coal mining scenarios. 3. Mitigation Measures listed for each risk factor of the operation are not exhaustive. The measures listed, however, have been observed by the author to be effective. 4. The monetary values used in ranking the consequences are generally-accepted quantities for the coal mining industry. 22.2.2 Limitations The risk assessment proposed in this report is subject to the limitations of the information currently collected, tested, and interpreted at the time of the writing of the report.

Alpha Metallurgical Resources, Inc. Statement of Coal Resources and Reserves for the Elk Run Underground Complex in Accordance with United States SEC Standards as of December 31, 2023 Central Appalachian Coal Basin West Virginia, USA MARSHALL MILLER & ASSOCIATES, INC. 72 22.2.3 Methodology The numerical quantities (i.e., risk levels) attributable to either “initial” or “residual” risks are derived by the product of values assigned to probability and consequence ranging from very low risk to very high risk. R = P x C Where: R = Risk Level P = Probability of Occurrence C = Consequence of Occurrence The Probability (P) and Consequence (C) parameters recited in the formula are subjective numerical estimates made by practiced mine engineers and managers. Both P and C are assigned integer values ranging from 1 to 5 for which the value 1 represents the lowest probability and least consequence, and the value 5 represents the highest probability and greatest consequence. The products (R = P x C) which define the Risk Level, are thereafter classified from very low to very high. Risk Level Table Risk Level (R) Very Low (1 to 2) Low (3 to 5) Moderate (6 to 11) High (12 to 19) Very High (20 to 25) Very high initial risks are considered to be unacceptable and require corrective action well in advance of project development. In short, measures must be applied to reduce very high initial risks to a tolerable level. As shown and discussed above, after taking into account the operational, technical, and administrative actions that have been applied or are available for action when required, the residual risk can be determined. The residual risk provides a basis for the management team to determine if the residual risk level is acceptable or tolerable. If the risk level is determined to be unacceptable, further actions should be considered to reduce the residual risk to acceptable or tolerable levels to provide justification for continuation of the proposed operation. 22.2.4 Development of the Risk Matrix Risks have been identified for the technical, operational, and administrative subjects addressed in the TRS. The risk matrix and risk assessment process are modelled to that presented in the Australian and New Zealand Standard on Risk Management (AS/NZS 4360). Alpha Metallurgical Resources, Inc. Statement of Coal Resources and Reserves for the Elk Run Underground Complex in Accordance with United States SEC Standards as of December 31, 2023 Central Appalachian Coal Basin West Virginia, USA MARSHALL MILLER & ASSOCIATES, INC. 73 22.2.4.1 Probability Level Table Table 22-1: Probability Level Table Category Probability Level (P) 1 Remote Not likely to occur except in exceptional circumstances. <10% 2 Unlikely Not likely to occur; small in degree. 10 - 30% 3 Possible Capable of occurring. 30 - 60% 4 Likely High chance of occurring in most circumstances. 60 - 90% 5 Almost Certain Event is expected under most circumstances; impossible to avoid. >90% The lowest rated probability of occurrence is assigned the value of 1 and described as remote, with a likelihood of occurrence of less than 10 percent. Increasing values are assigned to each higher probability of occurrence, culminating with the value of 5 assigned to incidents considered to be almost certain to occur. 22.2.4.2 Consequence Level Table Table 22-2 lists the consequence levels.

Alpha Metallurgical Resources, Inc. Statement of Coal Resources and Reserves for the Elk Run Underground Complex in Accordance with United States SEC Standards as of December 31, 2023 Central Appalachian Coal Basin West Virginia, USA MARSHALL MILLER & ASSOCIATES, INC. 74 Table 22-2: Consequence Level Table Correlation of Events in Key Elements of the Project Program to Event Severity Category Category Severity of the Event Financial Impact of the Event Unplanned Loss of Production (Impact on Commercial Operations) Events Impacting on the Environment Events Affecting the Program’s Social and Community Relations Resultant Regulatory / Sovereign Risk Events Affecting Occupational Health & Safety 1 Insignificant < USD $0.5 million ≤ 12 hours Insignificant loss of habitat; no irreversible effects on water, soil and the environment. Occasional nuisance impact on travel. Event recurrence avoided by corrective action through established procedures (Engineering, guarding, training). 2 Minor USD $0.5 million to $2.0 million ≤ 1 day No significant change to species populations; short- term reversible perturbation to ecosystem function. Persistent nuisance impact on travel. Transient adverse media coverage. First aid – lost time. Event recurrence avoided by corrective action thought established procedures. 3 Moderate USD $2.0 million to $10.0 million ≤ 1 week Appreciable change to species population; medium-term (≤10 years) detriment to ecosystem function. Measurable impact on travel and water/air quality. Significant adverse media coverage / transient public outrage. Uncertainty securing or retaining essential approval / license. Medical Treatment – permanent incapacitation Avoiding event recurrence requires modification to established corrective action procedures. Change to regulations (tax; bonds; standards). 4 Major USD $10.0 million to $50.0 million 1 to 2 weeks Change to species population threatening viability; long-term (>10 years) detriment to ecosystem function. Long-term, serious impact on travel and use of water resources; degradation of air quality; sustained and effective public opposition. Suspension / long-delay in securing essential approval / license. Fatality. Avoiding event recurrence requires modification to established corrective action procedures and staff retraining. Change to laws (tax; bonds; standards). 5 Critical >USD $50.0 million >1 month Species extinction; irreversible damage to ecosystem function. Loss of social license. Withdraw / failure to secure essential approval / license. Multiple fatalities. Avoiding event recurrence requires major overhaul of policies and procedures. Alpha Metallurgical Resources, Inc. Statement of Coal Resources and Reserves for the Elk Run Underground Complex in Accordance with United States SEC Standards as of December 31, 2023 Central Appalachian Coal Basin West Virginia, USA MARSHALL MILLER & ASSOCIATES, INC. 75 The lowest rated consequence is assigned the value of 1 and is described as Insignificant Consequence with parameters that include non-reportable safety incidents with zero days lost accidents, no environmental damage, loss of production or systems for less than 12 hours and cost of less than USD $0.5 million. Increasing values are assigned to each higher consequence, culminating with the value of 5 assigned to critical consequences, the parameters of which include multiple-fatality accidents, major environmental damage, and loss of production or systems for longer than one month and cost of greater than USD $50.0 million. Composite Risk Matrix R = P x C and Color-Code Convention The risk level, defined as the product of probability of occurrence and consequence, ranges in value from 1 (lowest possible risk) to 25 (maximum risk level). The values are color-coded to facilitate identification of the highest risk aspects. Table 22-3: Risk Matrix P x C = R Consequence (C) Insignificant Minor Moderate Major Critical 1 2 3 4 5 P ro b ab ili ty L ev el ( P ) Remote 1 1 2 3 4 5 Unlikely 2 2 4 6 8 10 Possible 3 3 6 9 12 15 Likely 4 4 8 12 16 20 Almost Certain 5 5 10 15 20 25 22.2.5 Categorization of Risk Levels and Color Code Convention Very high risks are considered to be unacceptable and require corrective action. Risk reduction measures must be applied to reduce very high risks to a tolerable level. 22.2.6 Description of the Coal Property The Elk Run complex is located in Boone County, West Virginia. The complex was idled in 2015; however, the first production cuts in the Checkmate Powellton mine were made in October 2023. The underground reserve operations are scheduled to utilize continuous mining production sections. This method provides continuity, preserving skilled work groups and enabling effective utilization of existing

Alpha Metallurgical Resources, Inc. Statement of Coal Resources and Reserves for the Elk Run Underground Complex in Accordance with United States SEC Standards as of December 31, 2023 Central Appalachian Coal Basin West Virginia, USA MARSHALL MILLER & ASSOCIATES, INC. 76 production equipment. The projected mines are located mostly above drainage and as such are accessed via portals with drifts. 22.2.7 Summary of Residual Risk Ratings Each risk factor is numbered, and a risk level for each is determined by multiplying the assigned probability by the assigned consequence. The risk levels are plotted on a risk matrix to provide a composite view of the Alpha risk profile. The average risk level is 6.6, which is defined as Moderate. Table 22-4: Risk Assessment Matrix C o n se q u en ce Critical >$50 MM Major $10-50MM 9 6 Moderate $2-10 MM 1, 12 2, 4, 8, 14 3 Minor $0.5-$2 MM 13 5, 7, 10 Low <$0.5 MM 11 <10% 10-30% 30-60% 60-90% >90% Remote Unlikely Possible Likely Almost Certain 22.2.8 Risk Factors A high-level approach is utilized to characterize risk factors that are generally similar across a number of the active and proposed mining operations. Risk factors that are unique to a specific operation or are particularly noteworthy are addressed individually. 22.2.8.1 Geological and Coal Resource Coal mining is accompanied by risk that, despite exploration efforts, mining areas will be encountered where geological conditions render extraction of the resource to be uneconomic, or that coal quality characteristics disqualify the product for sale into target markets. Offsetting the geological and coal resource risk are the size of the controlled property which allows flexibility in the selection of mine areas away from areas where coal quality and mineability are less favorable. In addition, many of the underground mines are designed to operate with multiple production sections each, which lessens the immediate impact when one section encounters difficulties. The large reserve areas also provide a mitigation strategy of varying the timing of Alpha Metallurgical Resources, Inc. Statement of Coal Resources and Reserves for the Elk Run Underground Complex in Accordance with United States SEC Standards as of December 31, 2023 Central Appalachian Coal Basin West Virginia, USA MARSHALL MILLER & ASSOCIATES, INC. 77 development of mines to offset expected or encountered adverse conditions, thereby maintaining consistent production and quality. This flexibility requires additional extension or development cost but increases performance consistency. The larger reserve areas will be developed with multiple production sections that can provide alternative locations if geological and coal resource characteristics require abandonment of an active production area. Table 22-5: Geological and Coal Resource Risk Assessment (Risks 1 and 2) Aspect Impact Control Measures Initial Risk Level Mitigation Measures Residual Risk Level P C R P C R Recoverable coal tons recognized to be significantly less than previously estimated. Reserve base is adequate to serve market commitments and respond to opportunities for many years. Local adverse conditions may increase frequency and cost of production unit relocations. Previous and ongoing exploration and extensive regional mining history provide a high level of confidence of coal seam correlation, continuity of the coal seams, and coal resource tons. 1 4 4 Optimize mine plan to increase resource recovery; develop mine plan to provide readily available alternate mining locations to sustain expected production level. 1 3 3 Coal quality locally proves to be lower than initially projected. If uncontrolled, production and sale of coal that is out of specification can result in rejection of deliveries, cancellation of coal sales agreements and damage to reputation. Exploration and vast experience and history in local coal seams provide confidence in coal quality; limited excursions can be managed with careful product segregation and blending. 2 5 10 Develop mine plan to provide readily available alternate mining locations to sustain expected production level; modify coal sales agreements to reflect coal quality. 2 3 6 22.2.8.2 Environmental Water quality and other permit requirements are subject to modification and such changes could have a material impact on the capability of the operator to meet modified standards or to receive new permits and modifications to existing permits. Permit protests may result in delays or denials to permit applications. Environmental standards and permit requirements have evolved significantly over the past 50 years and to-date, mining operators and regulatory bodies have been able to adapt successfully to evolving environmental requirements.

Alpha Metallurgical Resources, Inc. Statement of Coal Resources and Reserves for the Elk Run Underground Complex in Accordance with United States SEC Standards as of December 31, 2023 Central Appalachian Coal Basin West Virginia, USA MARSHALL MILLER & ASSOCIATES, INC. 78 Table 22-6: Environmental (Risks 3 and 4) Aspect Impact Control Measures Initial Risk Level Mitigation Measures Residual Risk Level P C R P C R Environmental performance standards are modified in the future. Delays in receiving new permits and modifications to existing permits; cost of testing and treatment of water and soils Work with regulatory agencies to understand and influence final standards; implement testing, treatment and other actions to comply with new standards. 3 4 12 Modify mining and reclamation plans to improve compliance with new standards while reducing cost of compliance. 3 3 9 New permits and permit modifications are increasingly delayed or denied. Interruption of production and delayed implementation of replacement production from new mines. Comply quickly with testing, treatment and other actions required; continue excellent compliance performance within existing permits. 2 4 8 Establish and maintain close and constructive working relationships with regulatory agencies, local communities and community action groups. 2 3 6 22.2.8.3 Regulatory Requirements Federal and state health and safety regulatory agencies occasionally amend mine laws and regulations. The impact is industry wide. Mining operators and regulatory agencies have been able to adapt successfully to evolving health and safety requirements. Table 22-7: Regulatory Requirements (Risk 5) Aspect Impact Control Measures Initial Risk Level Mitigation Measures Residual Risk Level P C R P C R Federal and state mine safety and health regulatory agencies amend mine laws and regulations. Cost of training, materials, supplies and equipment; modification of mine examination and production procedures; modification of mining plans. Participate in hearings and workshops when possible to facilitate understanding and implementation; work cooperatively with agencies and employees to facilitate implementation of new laws and regulations. 4 3 12 Familiarity and experience with new laws and regulations results in reduced impact to operations and productivity and improved supplies and equipment options. 4 2 8 22.2.8.4 Market and Transportation Most of the current and future production is expected to be directed to domestic and international metallurgical markets. Historically, the metallurgical markets have been cyclical and highly volatile. Alpha Metallurgical Resources, Inc. Statement of Coal Resources and Reserves for the Elk Run Underground Complex in Accordance with United States SEC Standards as of December 31, 2023 Central Appalachian Coal Basin West Virginia, USA MARSHALL MILLER & ASSOCIATES, INC. 79 Table 22-8: Market and Transportation (Risk 6) Aspect Impact Control Measures Initial Risk Level Mitigation Measures Residual Risk Level P C R P C R Volatile coal prices drop precipitously. Loss of revenue adversely affects profitability; reduced cash flow may disrupt capital expenditures plan. Cost control measures implemented; capital spending deferred. 4 5 20 High-cost operations closed, and employees temporarily furloughed. 4 4 16 Occasional delay or interruption of rail, river and terminals service may be expected. The operator can possibly minimize the impact of delays by being a preferred customer by fulfilling shipment obligations promptly and maintaining close working relationships. Table 22-9: Market and Transportation (Risk 7) Aspect Impact Control Measures Initial Risk Level Mitigation Measures Residual Risk Level P C R P C R Rail or river transport is delayed; storage and shipping access at river and ocean terminals is not available. Fulfillment of coal sales agreements delayed; limited coal storage at mines may increase cost of rehandling; production may be temporarily idled. Provide adequate storage capacity at mines; coordinate continuously with railroad and shipping companies to respond quickly and effectively to changing circumstances. 4 3 12 Provide back-up storage facility along with personnel, equipment and rehandle plan to sustain production and fulfill sales obligations timely. 4 2 8 22.2.8.5 Mining Plan Occupational health and safety risks are inherent in mining operations. Comprehensive training and retraining programs, internal safety audits and examinations, regular mine inspections, safety meetings, along with support of trained fire brigades and mine rescue teams are among activities that greatly reduce accident risks. Employee health monitoring programs coupled with dust and noise monitoring and abatement reduce health risks to miners. As underground mines are developed and extended, observation of geological, hydrogeological and geotechnical conditions leads to modification of mine plans and procedures to enable safe work within the mine environments. Highlighted below are selected examples of safety and external factors relevant to Alpha’s operations. 22.2.8.5.1 Methane Management Coalbed methane is present in coal operations below drainage. Often the methane concentration in shallow coal seams is at such low levels that it can be readily managed with vigilance and routine mine ventilation surveys. Very high methane concentrations may be present at greater depths. High

Alpha Metallurgical Resources, Inc. Statement of Coal Resources and Reserves for the Elk Run Underground Complex in Accordance with United States SEC Standards as of December 31, 2023 Central Appalachian Coal Basin West Virginia, USA MARSHALL MILLER & ASSOCIATES, INC. 80 methane concentrations may require degasification of the coal seam to assure safe mining. High methane concentrations are not expected to be present in the Elk Run mines. Table 22-10: Methane Management (Risk 8) Aspect Impact Control Measures Initial Risk Level Mitigation Measures Residual Risk Level P C R P C R Methane hazard is present in mines operating below drainage. Injury or loss of life; possible ignition of gas and mine explosion; potential loss of mine and equipment temporarily or permanently; additional mine fan, mine power, ventilation, monitoring and examination requirements. Low to moderate levels can be managed with frequent examinations, testing and monitoring within the mine ventilation system. Excellent rock dust maintenance minimizes explosion propagation risk should an ignition occur. 2 5 10 Very high-level methane concentrations may require coal seam degasification and gob degasification where pillar extraction methods are employed. 2 3 6 22.2.8.5.2 Mine Fires Mine fires, once common at mine operations, are rare today. Most active coal miners have not encountered a mine fire. Vastly improved mine power and equipment electrical systems, along with safe mine practices reduce mine fire risks. Crew training and fire brigade support and training improve response for containment and control if a fire occurs. Spontaneous combustion within coal mines, which is the source of most fires that occur today, is not expected to commonly occur at the Alpha property. When spontaneous combustion conditions are present, monitoring systems are employed for early detection and mine plans are designed to facilitate isolation, containment and rapid extinguishment. Table 22-11: Mine Fires (Risk 9) Aspect Impact Control Measures Initial Risk Level Mitigation Measures Residual Risk Level P C R P C R Mine fire at underground operation or plant stockpile fire. Injury or loss of life; potential loss of mine temporarily or permanently; damage to equipment and mine infrastructure. Inspection and maintenance of mine power, equipment and mine infrastructure; good housekeeping; frequent examination of conveyor belt entries; prompt removal of accumulations of combustible materials. 1 5 5 If spontaneous combustion conditions are present, enhanced monitoring and examination procedures will be implemented; mine design will incorporate features to facilitate isolation, containment and extinguishment of spontaneous combustion locations. 1 4 4 Alpha Metallurgical Resources, Inc. Statement of Coal Resources and Reserves for the Elk Run Underground Complex in Accordance with United States SEC Standards as of December 31, 2023 Central Appalachian Coal Basin West Virginia, USA MARSHALL MILLER & ASSOCIATES, INC. 81 22.2.8.5.3 Ground Control Underground mining exposes miners to the risks of roof falls and rib rolls. Ground control-based risks can be mitigated through effective roof control plans which are supplemented with a strong understanding of future geotechnical conditions. Foremen and crews should be trained to examine the roof, rib and floor conditions and identify pending and immediate hazards. Multiple publicly available software programs can be used to assess pillar sizing and stability. Table 22-12: Ground Control (Risk 10) Aspect Impact Control Measures Initial Risk Level Mitigation Measures Residual Risk Level P C R P C R Ground control issues cause roof failures, rib rolls, floor heave, etc. Injury or loss of life; catastrophic damage to equipment; production interruption. Regular inspection for change and signs of failure. Dynamic design of roof control plan and safety measures to honor observed conditions and exploration- based information; conservative pillar design. 4 3 12 Multiple operating sections to mitigate any lost production; availability of new working areas in case abandonment of section is required; availability of alternative roof control technologies in case of abrupt changes in mining conditions. 4 2 8 22.2.8.5.4 Availability of Supplies and Equipment The industry has periodically experienced difficulty receiving timely delivery of mine supplies and equipment. Availability issues often accompanied boom periods for coal demand. Any future delivery of supplies and equipment delays are expected to be temporary with limited impact on production. Table 22-13: Availability of Supplies and Equipment (Risk 11) Aspect Impact Control Measures Initial Risk Level Mitigation Measures Residual Risk Level P C R P C R Disruption of availability for supplies and equipment. Temporary interruption of production. Force majeure provision in coal sales agreements to limit liability for delayed or lost sales. 3 2 6 Work closely with customers to assure delayed coal delivery rather than cancelled sales; monitory external conditions and increase inventory of critical supplies; accelerate delivery of equipment when possible. 3 1 3 22.2.8.5.5 Labor Work stoppages due to labor protests are considered to be unlikely and accompanied by limited impact should it occur. Strong employee relations and communications limit the exposure to outside

Alpha Metallurgical Resources, Inc. Statement of Coal Resources and Reserves for the Elk Run Underground Complex in Accordance with United States SEC Standards as of December 31, 2023 Central Appalachian Coal Basin West Virginia, USA MARSHALL MILLER & ASSOCIATES, INC. 82 protesters. Loss of supervisors and skilled employees to retirement is inevitable; the impact can be lessened with succession planning, training, and mentorship of new employees. Table 22-14: Labor – Work Stoppage (Risk 12) Aspect Impact Control Measures Initial Risk Level Mitigation Measures Residual Risk Level P C R P C R Work stoppage due to slowdowns or secondary boycott activity. Loss of production and coal sales; damaged customer and employee relations; reputation loss. Maintain excellent employee relations and communications; maintain frequent customer communications. 2 3 6 Develop plan for employee communications and legal support to minimize impact of secondary boycott activities. 1 3 3 Table 22-15: Labor – Retirement (Risk 13) Aspect Impact Control Measures Initial Risk Level Mitigation Measures Residual Risk Level P C R P C R Retirement of supervisors and skilled employees. Loss of leadership and critical skills to sustain high levels of safety, maintenance and productivity. Monitor demographics closely and maintain communications with employees who are approaching retirement age; maintain employee selection and training programs. 3 3 9 Maintain selection of candidates and implementation of in-house or third-party training for electricians and mechanics; develop employee mentoring program. 3 2 6 22.2.8.6 Comprehensive Health and Safety While largely incorporated in mine plan-based risk factors, effective health and safety programs reduce the risk of accidents, associated loss of production and fines. Currently, coal mining and processing requires a robust health and safety team, consisting of executive level health and safety roles, regional health and safety managers, and multiple operational level health and safety coordinators. Table 22-16: Health and Safety (Risk 14) Aspect Impact Control Measures Initial Risk Level Mitigation Measures Residual Risk Level P C R P C R Failure to attain operations safety standards and associated occurrence of accidents Injuries and possible loss of life; damage to morale and workforce confidence; loss of production and diminished productivity; regulatory issues, closures and fines; reputation loss Safety and loss control awareness training to help employees recognize hazardous conditions and actions; frequent job observations and feedback; periodic employee performance reviews 2 5 10 Senior management's active participation in safety process; utilization of motivational methods to reinforce company's values and commitment to safety; regular comprehensive safety audits to assure safety standards are maintained. 2 3 6 Alpha Metallurgical Resources, Inc. Statement of Coal Resources and Reserves for the Elk Run Underground Complex in Accordance with United States SEC Standards as of December 31, 2023 Central Appalachian Coal Basin West Virginia, USA MARSHALL MILLER & ASSOCIATES, INC. 83 23 Recommendations Alpha should continue to work both internally and with outside assistance to further define their Resource Base and to Optimize the LOM Plan. 24 References Publicly available information from various State and Federal agencies was used where relevant. JOURNEL, A.G., & HUIJBREGTS, CH, J., 1978: Mining Geostatistics, The Blackburn Press Caldwell, New Jersey. 25 Reliance on Information Provided by Registrant A summary of the information relied upon by MM&A for the purposes of this TRS is provided in Table 25-1. Table 25-1: Information from Registrant Relied Upon by MM&A Category Information Provided by Alpha Report Section Marketing Long-term price forecast used in financial projections 16.2 Legal Mineral control and surface control rights as shown on maps 3.2, 3.3 Environmental Permit and bonding information 17.3

APPENDIX A SUMMARY TABLES Alpha Metallurgical Resources 2023 SEC Update - Elk Run Summary of Coal Resource (Short Tons) • Effective December 31, 2023 Appendix A Table 1 Mine/Area Seam Measured Indicated Total Inferred Grand Total Owned Leased Permitted Not Permitted Ash% Sulfur% VM% Prenter Upper Cedar Grove 20,600,000 16,264,000 36,864,000 63,000 36,928,000 0 36,864,000 0 36,864,000 18 1.8 - Elk Run (Castle II) Peerless 12,607,000 4,207,000 16,815,000 0 16,815,000 0 16,815,000 8,503,000 8,312,000 25 2.4 - Checkmate Powellton 12,316,000 1,888,000 14,204,000 16,000 14,220,000 0 14,204,000 178,000 14,026,000 27 1.0 - Total 45,523,000 22,360,000 67,883,000 79,000 67,962,000 0 67,883,000 8,681,000 59,202,000 25 1.8 Note(1): Resource tons are Exclusive of Reserve/Not Converted to Reserve tons. Note (2): Coal resources are reported on a dry basis. Surface moisture and inherent moisture are excluded. Note (3): The Property contains 67.88 million tons (Mt) of dry, in-place measured and indicated coal resources Exclusive of Reserve/Not Converted to Reserves as of December 31, 2023. All resources exclusive of reserves are considered a met market. Totals may not add due to rounding. Quality (Dry Basis) By Permit StatusBy Reliability Category Coal Resource (Dry Tons, In Situ) By Control Type AMR118 Elk Run Tables (2024-01-15).xlsx • ELK ANR Resource Report • 1/15/2024 Page 1 of 1

Alpha Metallurgical Resources 2023 SEC Update - Elk Run Summary of Coal Reserves (Short Tons) • Effective December 31, 2023 Appendix A Table 2 By Permit Status By Market Mine/Area Mine Proven Probable Total Surface UG Owned Leased Permitted Not Permitted Thermal Met Ash% Sulfur% VM% Prenter Upper Cedar Grove 0 0 0 0 0 0 0 0 0 0 0 - - - Elk Run (Castle II) Peerless 0 0 0 0 0 0 0 0 0 0 0 - - - Checkmate Powellton 17,341,000 11,093,000 28,434,000 0 28,434,000 139,000 28,295,000 4,724,000 23,710,000 0 28,434,000 6 1.0 34 Grand Total Grand Total 17,341,000 11,093,000 28,434,000 0 28,434,000 139,000 28,295,000 4,724,000 23,710,000 0 28,434,000 6 1.0 34 Notes: Marketable reserve tons are reported on a moist basis, including a combination of surface and inherent moisture. Coal quality is based on a weighted average of laboratory analysis from core holes. The combination of surface and inherent moisture is modeled at 6.0-percent. Actual product moisture is dependent upon multiple geological factors, operational factors, and product contract specifications and can exceed 8-percent. As such, the modeled moisture values provide a level of conservatism for reserve reporting. Totals may not add due to rounding. Demonstrated Coal Reserves By Mining TypeBy Reliability Category Quality (Dry Basis)(Wet Tons, Washed or Direct Shipped) By Control Type AMR118 Elk Run Tables (2024-01-15).xlsx • ELK ANR Reserve Report • 2/1/2024 Page 1 of 1 APPENDIX B INITIAL ECONOMIC ASSESSMENT RESOURCES EXCLUSIVE OF RESERVES (PER TON)

Alpha Metallurgical Resources, Inc. Initial Economic Assessment, Resources Exclusive of Reserves (per Ton) Appendix B: Elk Run Complex Seam: POW UCG UCG UCG UCG PEER Elk Run Elk Run Elk Run Elk Run Elk Run Elk Run Area: Checkmate Blocks L,M,O Prenter Block H Prenter Block I Prenter Block J Prenter Blocks K&L Castle Peerless In-Place Resource Tons (not adjusted for Q4 2023 Depletion) 14,220,164 4,893,701 6,603,427 3,733,210 21,697,263 16,814,606 Potentially Recoverable Tons* 3,191,538 1,783,479 2,031,406 1,374,111 5,648,828 5,306,362 Mining Method Deep - CM Deep - CM Deep - CM Deep - CM Deep - CM Deep - CM Assumed Sales Realization at Plant** 130$ 130$ 130$ 130$ 130$ 130$ Iniital Capex Estimate to Access Resources*** -$ 9,000,000$ 9,000,000$ 9,000,000$ 9,000,000$ 92,380,000$ Direct Mining Costs: Labor**** 28.48$ 28.65$ 30.42$ 27.83$ 26.72$ 31.72$ Supplies, Excluding Roof Control 7.99$ 8.04$ 8.53$ 7.81$ 7.50$ 8.90$ Roof Control 5.40$ 5.44$ 5.77$ 5.28$ 5.07$ 6.02$ M&R 13.17$ 11.54$ 12.59$ 11.05$ 12.05$ 11.22$ Power 2.63$ 2.31$ 2.52$ 2.21$ 2.41$ 2.24$ Other 3.29$ 2.88$ 3.15$ 2.76$ 3.01$ 2.81$ Total Direct Cash Costs 60.96$ 58.86$ 62.98$ 56.93$ 56.76$ 62.92$ Transporation, Washing, Environmental & G&A Costs: Coal Prep***** 11.30$ 9.90$ 10.81$ 9.48$ 10.34$ 9.63$ Materials Handling 1.50$ 1.50$ 1.50$ 1.50$ 1.50$ 1.50$ Raw Coal Trucking***** -$ 7.79$ 12.17$ 3.98$ 14.81$ -$ Clean Coal Trucking 1.25$ 1.25$ 1.25$ 1.25$ 1.25$ 1.25$ Enviro****** 0.35$ 0.35$ 0.35$ 0.35$ 0.35$ 0.35$ G&A 5.35$ 5.35$ 5.35$ 5.35$ 5.35$ 5.35$ Total Transporation, Washing, Environmental & G&A Costs: 19.75$ 26.14$ 31.43$ 21.91$ 33.60$ 18.08$ Indirect Cash Costs Royalty 7.80$ 7.80$ 7.80$ 7.80$ 7.80$ 7.80$ Black Lung Excise Tax 0.55$ 0.55$ 0.55$ 0.55$ 0.55$ 0.55$ SMCRA 0.12$ 0.12$ 0.12$ 0.12$ 0.12$ 0.12$ State Severance 6.50$ 2.60$ 2.60$ 2.60$ 6.50$ 2.60$ Property Tax & Insurance 2.50$ 2.50$ 2.50$ 2.50$ 2.50$ 2.50$ Total Indirect Cash Costs 17.47$ 13.57$ 13.57$ 13.57$ 17.47$ 13.57$ Non Cash Costs Amoritiztion of Development Capital -$ 5.05$ 4.43$ 6.55$ 1.59$ 17.41$ Depreciation of Initial Equipment and Sustaining Capital 6.73$ 6.73$ 6.73$ 6.73$ 6.73$ 6.73$ Depletion 1.00$ 1.00$ 1.00$ 1.00$ 1.00$ 1.00$ Total Non Cash 7.73$ 12.78$ 12.16$ 14.28$ 9.33$ 25.14$ Total Cash Cost 98.19$ 98.57$ 107.99$ 92.41$ 107.83$ 94.57$ EBITDA 31.81$ 31.43$ 22.01$ 37.59$ 22.17$ 35.43$ Fully Loaded Cost 105.92$ 111.35$ 120.15$ 106.69$ 117.15$ 119.71$ Fully Loaded P&L 24.08$ 18.65$ 9.85$ 23.31$ 12.85$ 10.29$ Passes Resource Iniital Economic Assessment? YES YES YES YES YES YES *Potentially recoverable tons are calculated by applying appropriate modifying factors to in-place resource tonnages **Sales relization represents estimated long range sales price. ***No initial capital required where resources are accessible from existing mines. ****Labor rates are driven based off of super section productivities assuming 250 to 300 feet per unit shift per section. *****Processing assumed to occur at Elk Run plant. ******Environmental costs assumed to include permiting, outfall maintenance, etc. AMR118 Elk Run Initial Economic Assessment Resources Exclusive of Reserves 123123_122123.xlsx Page 1 of 1 APPENDIX C MAPS

9/14/67 Prenter Area Black King Area 7000 Scale In Feet 0 Data Point Location Map 1 Elk Run Area Upper Cedar Grove Seam Alpha Metallurgical Resource, LLC Boone & Raleigh Counties, West Virginia Coordinate System: West Virginia South State Plane NAD 27 Controlled Underground Reserve / Resource as of 12/31/23 Previous Underground Mining N Resource Exclusive of Reserve / Not Converted to Reserve Resource Inclusive of Reserve / Converted to Reserve Caymus Mine Castle East Portal Mine Castle Peerless Mine Castle Peerless Area 5000' Scale In Feet 0 Data Point Location Map 2 Elk Run Peerless Seam Alpha Metallurgical Resource, LLC Boone, Raleigh, Kanawha & Fayette Counties, West Virginia Coordinate System: West Virginia South State Plane NAD 27 Controlled Underground Reserve / Resource as of 12/31/23 Previous Underground Mining N Resource Exclusive of Reserve / Not Converted to Reserve

CC + + + + + + + + + + + + + + + + + + + + + + + + AREA SEALED 10-04-2014 Life-line 6-10-80 7-22-80 10-22-80 12-16-80 6-7-81 LONGWALL FACE 9/16/81 5-1-78 4-5-78 Slip Ridge Area Checkmate Powellton Area 2 Scale In Miles 0 Data Point Location Map 3 Elk Run Area Powellton Seam Alpha Metallurgical Resource, LLC Boone & Raleigh Counties, West Virginia Coordinate System: West Virginia South State Plane NAD 27 Controlled Underground Reserve / Resource as of 12/31/23 Previous Underground Mining N Resource Exclusive of Reserve / Not Converted to Reserve Resource Inclusive of Reserve / Converted to Reserve
EX-96.7
19
finalpowermountaintrswit.htm
TECHNICAL REPORT SUMMARY - POWER MOUNTAIN UNDERGROUND COMPLEX
finalpowermountaintrswit

Alpha Metallurgical Resources, Inc. Statement of Coal Resources for the Power Mountain Underground Complex in Accordance with United States SEC Standards as of December 31, 2023 Central Appalachian Coal Basin West Virginia, USA February 2024 Prepared for: Alpha Metallurgical Resources, Inc. 340 Martin Luther King Jr. Blvd. Bristol, TN 37620 Prepared by: MARSHALL MILLER & ASSOCIATES, INC. 582 Industrial Park Road Bluefield, Virginia 24605 www.mma1.com Alpha Metallurgical Resources, Inc. Statement of Coal Resources for the Power Mountain Underground Complex in Accordance with United States SEC Standards as of December 31, 2023 Central Appalachian Coal Basin West Virginia, USA MARSHALL MILLER & ASSOCIATES, INC. 2 Statement of Use and Preparation This Technical Report Summary (TRS) was prepared for the sole use of Alpha Metallurgical Resources, Inc. (Alpha) and its affiliated and subsidiary companies and advisors. Copies or references to information in this report may not be used without the written permission of Alpha. The report provides a statement of coal resources for Alpha, as defined under the United States Securities and Exchange Commission (SEC). The statement is based on information provided by Alpha and reviewed by various professionals within Marshall Miller & Associates, Inc. (MM&A). MM&A professionals who contributed to the drafting of this report meet the definition of Qualified Persons (QPs), consistent with the requirements of the SEC. The information in this TRS related to coal resources is based on, and fairly represents, information compiled by the QPs. At the time of reporting, MM&A’s QPs have sufficient experience relevant to the style of mineralization and type of deposit under consideration and to the activity they are undertaking to qualify as a QP as defined by the SEC. Each QP consents to the inclusion in this report of the matters based on their information in the form and context in which it appears. Certain information set forth in this report contains “forward-looking information”, including production, productivity, operating costs, capital costs, sales prices, and other assumptions. These statements are not guarantees of future performance and undue reliance should not be placed on them. The assumptions used to develop the forward-looking information and the risks that could cause the actual results to differ materially are detailed in the body of this report. Marshall Miller & Associates, Inc. (MM&A) hereby consents (i) to the use of the information contained in this report dated December 31, 2023, relating to estimates of coal resources controlled by Alpha, (ii) to the use of MM&A’s name, any quotations from or summarizations of this TRS in Alpha’s SEC filings, and (iii) to the filing of this TRS as an exhibit to Alpha’s SEC filings. Qualified Person: /s/ Mashall Miller & Associates, Inc. Date: February 9, 2024

Alpha Metallurgical Resources, Inc. Statement of Coal Resources for the Power Mountain Underground Complex in Accordance with United States SEC Standards as of December 31, 2023 Central Appalachian Coal Basin West Virginia, USA MARSHALL MILLER & ASSOCIATES, INC. 3 Table of Contents 1 Executive Summary ............................................................................................................... 7 1.1 Property Description ................................................................................................ 7 1.2 Ownership ................................................................................................................ 8 1.3 Geology .................................................................................................................... 8 1.4 Exploration ............................................................................................................... 8 1.5 Operations and Development ................................................................................... 8 1.6 Mineral Resource ..................................................................................................... 8 1.7 Permitting ................................................................................................................ 9 1.8 Conclusion and Recommendations ........................................................................... 9 2 Introduction ........................................................................................................................ 10 2.1 Registrant and Terms of Reference ......................................................................... 10 2.2 Information Sources ............................................................................................... 10 2.3 Scope of Assignment .............................................................................................. 10 2.4 Personal Inspections ............................................................................................... 11 2.5 Updates to Previous TRS ......................................................................................... 11 3 Property Description ........................................................................................................... 11 3.1 Location ................................................................................................................. 11 3.2 Titles, Claims or Leases ........................................................................................... 12 3.3 Mineral Rights ........................................................................................................ 13 3.4 Encumbrances ........................................................................................................ 13 3.5 Other Risks ............................................................................................................. 14 4 Accessibility, Climate, Local Resources, Infrastructure and Physiography .......................... 14 4.1 Topography, Elevation, and Vegetation .................................................................. 14 4.2 Access and Transport ............................................................................................. 14 4.3 Proximity to Population Centers ............................................................................. 14 4.4 Climate and Length of Operating Season ................................................................ 15 4.5 Infrastructure ......................................................................................................... 15 5 History ................................................................................................................................. 15 5.1 Previous Operation ................................................................................................. 15 5.2 Previous Exploration ............................................................................................... 16 6 Geology ............................................................................................................................... 16 6.1 Regional, Local and Property Geology..................................................................... 16 6.2 Mineralization ........................................................................................................ 17 Alpha Metallurgical Resources, Inc. Statement of Coal Resources for the Power Mountain Underground Complex in Accordance with United States SEC Standards as of December 31, 2023 Central Appalachian Coal Basin West Virginia, USA MARSHALL MILLER & ASSOCIATES, INC. 4 6.3 Deposits ................................................................................................................. 18 6.3.1 Seam Description ...................................................................................... 18 7 Exploration .......................................................................................................................... 19 7.1 Nature and Extent of Exploration ........................................................................... 19 7.2 Drilling Procedures ................................................................................................. 21 7.3 Hydrology ............................................................................................................... 21 7.4 Geotechnical Data .................................................................................................. 21 8 Sample Preparation Analyses and Security ......................................................................... 22 8.1 Prior to Sending to the Lab ..................................................................................... 22 8.2 Lab Procedures ....................................................................................................... 22 9 Data Verification ................................................................................................................. 23 9.1 Procedures of Qualified Person .............................................................................. 23 9.2 Limitations ............................................................................................................. 24 9.3 Opinion of the Qualified Person ............................................................................. 24 10 Mineral Processing .............................................................................................................. 24 10.1 Testing Procedures ................................................................................................. 24 10.2 Relationship of Tests to the Whole ......................................................................... 25 10.3 Lab Information ..................................................................................................... 25 10.4 Relevant Results .................................................................................................... 25 11 Mineral Resource Estimates ................................................................................................ 26 11.1 Assumptions, Parameters and Methodology .......................................................... 26 11.1.1 Geostatistical Analysis for Classification .................................................... 27 11.2 Resources Exclusive of Reserves ............................................................................. 30 11.2.1 Powellton Coal Seam ................................................................................ 31 11.2.2 Eagle Coal Seam ........................................................................................ 32 11.3 Qualified Person’s Estimates .................................................................................. 33 11.4 Qualified Person’s Opinion ..................................................................................... 34 12 Mineral Reserve Estimates .................................................................................................. 34 13 Mining Methods .................................................................................................................. 34 14 Processing and Recovery Methods ...................................................................................... 34 15 Infrastructure ...................................................................................................................... 35 16 Market Studies .................................................................................................................... 35 16.1 Market Description ................................................................................................. 35 16.2 Price Forecasts ....................................................................................................... 36

Alpha Metallurgical Resources, Inc. Statement of Coal Resources for the Power Mountain Underground Complex in Accordance with United States SEC Standards as of December 31, 2023 Central Appalachian Coal Basin West Virginia, USA MARSHALL MILLER & ASSOCIATES, INC. 5 17 Environmental Studies, Permitting and Plans ..................................................................... 36 17.1 Environmental Permit Requirements and Status .................................................... 36 18 Capital and Operating Costs ................................................................................................ 38 19 Economic Analysis ............................................................................................................... 38 20 Adjacent Properties ............................................................................................................. 38 21 Other Relevant Data and Information ................................................................................. 38 22 Interpretation and Conclusions ........................................................................................... 38 23 Recommendations .............................................................................................................. 39 24 References ........................................................................................................................... 39 25 Reliance on Information Provided by Registrant ................................................................. 39 FIGURES (IN REPORT) Figure 1-1: Property Location Map ................................................................................................. 7 Figure 3-1: Property Location Map ............................................................................................... 12 Figure 6-1: Extent of Appalachian Basin (modified after USGS 1625-C) ......................................... 17 Figure 6-2: Power Mountain Generalized Stratigraphic Column ................................................... 18 Figure 7-1: Power Mountain Cross-Section ................................................................................... 20 Figure 11-1: Histogram of the Total Seam Thickness for the Powellton Seam Present in the Property ..................................................................................................................... 28 Figure 11-2: Scatter Plot of the Total Seam Thickness for the Powellton Seam Present in the Property ..................................................................................................................... 28 Figure 11-3: Variogram of the Total Seam Thickness for the Powellton Seam ............................... 29 Figure 11-4: Result of DHSA for the Powellton Seam Present in the Property ............................... 30 Figure 11-5: Power Mountain Coal Reserves ................................................................................ 31 Figure 11-6: Results of Initial Economic Assessment ..................................................................... 33 Figure 15-1: Power Mountain Facilities ........................................................................................ 35 TABLES (IN REPORT) Table 1-1: Coal Resources Summary as of December 31, 2023 ....................................................... 9 Table 2-1: Information from Registrant Incorporated into Study .................................................. 10 Table 3-1: Mineral Control – Power Mountain Complex ............................................................... 13 Table 10-1: Average Washed Coal Quality at 1.50 Float by Resource Area ............................ 25 Table 10-2: Average Raw Coal Quality (Dry Basis) by Resource Area ..................................... 25 Table 11-1: General Resource Evaluation Criteria ......................................................................... 27 Table 11-2: DHSA Results Summary for Radius from a Central Point ............................................. 30 Table 11-3: Results of Initial Economic Assessment ($/ton) .......................................................... 33 Table 11-4: Coal Resources Summary as of December 31, 2023 ................................................... 34 Alpha Metallurgical Resources, Inc. Statement of Coal Resources for the Power Mountain Underground Complex in Accordance with United States SEC Standards as of December 31, 2023 Central Appalachian Coal Basin West Virginia, USA MARSHALL MILLER & ASSOCIATES, INC. 6 Table 16-1: Dry Quality Specifications .......................................................................................... 36 Table 16-2: Price Forecast ............................................................................................................ 36 Table 17-1: Mining Permits with the Subject Property .................................................................. 37 Table 25-1: Information from Registrant Relied Upon by MM&A ................................................. 39 Appendices A ............................................................................................................................... Summary Table B ........................................................ Initial Economic Assessment Resources Exclusive of Reserves C ............................................................................................................................... Resource Maps

Alpha Metallurgical Resources, Inc. Statement of Coal Resources for the Power Mountain Underground Complex in Accordance with United States SEC Standards as of December 31, 2023 Central Appalachian Coal Basin West Virginia, USA MARSHALL MILLER & ASSOCIATES, INC. 7 1 Executive Summary 1.1 Property Description Alpha Metallurgical Resources, Inc. (Alpha) authorized Marshall Miller & Associates, Inc. (MM&A) to prepare this Technical Report Summary (TRS) of its controlled coal resources located at the Power Mountain Underground Complex (PM or the Property) in Nicholas County, West Virginia. The report provides a statement of coal resources for Alpha, as defined under the United States Securities and Exchange Commission (SEC). Coal resources are herein reported in imperial units of measurement. The Power Mountain Surface facilities are approximately 20 miles west of the town of Summerville, West Virginia, the county seat of Nicholas County (see Figure 1-1) and is composed of approximately 51,400 total acres of mineral control, of which nearly all are contained within 5 separate leases. Figure 1-1: Property Location Map Alpha Metallurgical Resources, Inc. Statement of Coal Resources for the Power Mountain Underground Complex in Accordance with United States SEC Standards as of December 31, 2023 Central Appalachian Coal Basin West Virginia, USA MARSHALL MILLER & ASSOCIATES, INC. 8 1.2 Ownership The Power Mountain property involves a complex combination of previous ownership. Predecessors of Alpha, namely Alpha Natural Resources and Massey Energy (Massey) previously held mining rights on the majority of the Property. 1.3 Geology The coal seams of interest within the Property are the Powellton and Eagle. These coal seams are historically utilized as coking coal. Strata on the Property reside in the Pennsylvanian-aged (approximately 290 to 330 million years ago) Kanawha Formations. Due to the high value of these coking coals, the seams have been extensively mined in the past. The rock formations between the coal seams are characterized by large proportions of sandstone interspersed with shale units. The coal seams reach the highest structural elevations along the southeast resource margins. 1.4 Exploration The Property has been extensively explored, largely by drilling using continuous coring and rotary drilling methods but also by obtaining coal measurements at mine exposures, and by downhole geophysical methods. A significant amount of historical data was acquired or generated by previous owners of the Property. These sources comprise the primary data used in the evaluation of the coal resources on the Property. MM&A examined the data available for the evaluation and incorporated all pertinent information into this TRS. Where data appeared to be anomalous or not representative, that data was excluded from the digital databases and subsequent processing by MM&A. Ongoing exploration has been carried out by Alpha as recently as 2021. The Alpha-acquired exploration data has been consistent with past drilling activities. 1.5 Operations and Development As of December 31, 2023, underground mine operations were active at the Jerry Fork Eagle Mine, Rolling Thunder Mine and Power Mountain preparation plant. All Eagle seam resources will be accessed through the Jerry Fork Mine. The Rolling Thunder Mine, located in the Powellton seam, has recently been developed and is now in production. The majority of production from Rolling Thunder Powellton is projected to be transported to the Power Mountain facilities for processing and market access. During the initial startup of operations, raw coal will be trucked to the nearby Mammoth preparation plant for processing and market access. The Power Mountain plant, originally constructed in 1985, has a capacity of 1,200 tons per hour (tph) and utilization of 25.65% in 2023. The resources are assumed to produce a product of High Volatile metallurgical coking coal. 1.6 Mineral Resource Mineral resource estimates represent in-situ coal for the Property controlled by Alpha. The resources are summarized in Table 1-1 below.

Alpha Metallurgical Resources, Inc. Statement of Coal Resources for the Power Mountain Underground Complex in Accordance with United States SEC Standards as of December 31, 2023 Central Appalachian Coal Basin West Virginia, USA MARSHALL MILLER & ASSOCIATES, INC. 9 Resources totaling 55.48 million in-place tons have been estimated for the two coal seams evaluated on the Power Mountain property. Of this total, 30.94 million tons are in the measured category, 23.74 million tons are in the indicated category, and 0.80 million tons are in the inferred category. Table 1-1: Coal Resources Summary as of December 31, 2023 Coal Resource (Dry Tons, In Situ) By Reliability Category By Control Type By Permit Status Mine/Area Seam Measured Indicated Total Inferred Grand Total Owned Leased Permitted Not Permitted Rolling Thunder Powellton 26,437,000 22,308,000 48,745,000 800,000 49,545,000 10,757,000 37,988,000 16,508,000 32,237,000 Jerry Fork Mine Eagle 4,507,000 1,431,000 5,938,000 0 5,938,000 5,938,000 0 5,938,000 0 Total 30,944,000 23,739,000 54,683,000 800,000 55,483,000 16,695,000 37,988,000 22,446,000 32,237,000 Note: All Power Mountain resources are reported exclusive of reserves (have not been converted to reserve). 1.7 Permitting The Power Mountain property has existing permits associated with existing mining operations and surface facilities. Required permits for the Rolling Thunder Powellton mine have been issued and is classified as active, moving coal. MM&A is unaware of any obvious or current Alpha permitting issues that are expected to prevent the issuance of future permits. Alpha, along with all coal producers, is subject to a level of uncertainty regarding future clean water permits due to United States Environmental Protection Agency (EPA) involvement with state programs. 1.8 Conclusion and Recommendations Sufficient data has been obtained through various exploration and sampling programs and mining operations to support the geological interpretations of seam structure and thickness for coal horizons situated on the Power Mountain Property and reviewed in the study. The data is of sufficient quantity and reliability to reasonably support the coal resource estimates in this TRS. In summary: > Potentially underground mineable resources totalling 55.48 million in-place tons have been estimated for the licenses of the Property. Of this total, 30.94 million tons are in the measured category, 23.74 million tons are in the indicated category, and 0.80 million tons are in the inferred category. > The total measured and indicated categories contain 54.68 million resource tons representing approximately 99 percent of the coal resource. Alpha Metallurgical Resources, Inc. Statement of Coal Resources for the Power Mountain Underground Complex in Accordance with United States SEC Standards as of December 31, 2023 Central Appalachian Coal Basin West Virginia, USA MARSHALL MILLER & ASSOCIATES, INC. 10 2 Introduction 2.1 Registrant and Terms of Reference Alpha authorized MM&A to prepare this Technical Report Summary (TRS) of coal resources controlled by Alpha in the Eagle and Powellton seams located in Nicholas County, West Virginia (the Property). This report was prepared for the sole use of Alpha and its affiliated and subsidiary companies and advisors. The report provides a statement of coal resources for Alpha, as defined under the United States Securities and Exchange Commission (SEC) standards. Coal resources are herein reported in U.S. units of measurement. 2.2 Information Sources The technical report is based on information provided by Alpha and reviewed by MM&A’s professionals, including geologists, mining engineers and environmental scientists. MM&A’s professionals hold professional registrations and memberships which qualify them as Qualified Persons in accordance with SEC guidelines. Sources of data and information are listed below in Table 2-1. Table 2-1: Information from Registrant Incorporated into Study Category Information Provided by Alpha Report Section Geological Geologic data including digital databases and original source data including geologist logs, driller’s logs, geophysical logs, drill hole location surveys. 9.1 Coal Quality Database of coal quality information supplemented with original source laboratory sheets where available. 10.1 Costs Historical and budgetary operating cost information used in the initial economic analysis of resources exclusive of reserves. 11.2.1 Note: While the sources of data listed in Table 2-1 are not exhaustive, they represent a significant portion of information which supports this TRS. MM&A reviewed the provided data and found it to be reasonable prior to incorporating it into the TRS. The TRS contains the assumption that Alpha will continue to acquire necessary permits, and other assumptions. The TRS statements and conclusions are not a guarantee of future performance and undue reliance should not be placed on them. The ability of Alpha to recover the estimated coal resources in the future is dependent on multiple factors beyond the control of MM&A including, but not limited to economics, geologic factors, mining conditions, regulatory approvals and changes in regulations. In all cases, the plans assume the Property is under competent management. 2.3 Scope of Assignment Alpha engaged MM&A to conduct a coal resource evaluation of the Powellton and Eagle coal seams at the Power Mountain property in Nicholas County, West Virginia and as of December 31, 2023. For the evaluation, the following tasks were to be completed: > Process the information supporting the estimation of coal resources into geological models;

Alpha Metallurgical Resources, Inc. Statement of Coal Resources for the Power Mountain Underground Complex in Accordance with United States SEC Standards as of December 31, 2023 Central Appalachian Coal Basin West Virginia, USA MARSHALL MILLER & ASSOCIATES, INC. 11 > Hold discussions with Alpha company management; and > Prepare and issue a Technical Report Summary providing a statement of coal resources which would include: - A description of the facilities. - A description of the evaluation process. - An estimation of coal resources with compliance elements as stated under the SEC S-K 1300 regulations. 2.4 Personal Inspections MM&A is very familiar with the Power Mountain West Virginia Properties, having provided a variety of services in recent years. Qualitied Persons involved in this TRS have conducted a site visit to the new Rolling Thunder Powellton mine during September 2023 and also visited Jerry Fork and Power Mountain surface facilities. 2.5 Updates to Previous TRS MM&A previously prepared an S-K 1300 TRS filings pertaining to the Property for the period ending December 31, 2022. Additionally, multiple reserve analyses have been completed on the Property by MM&A and other industry experts. 3 Property Description 3.1 Location The Power Mountain Complex is located in the Central Appalachian Basin of southern West Virginia (see Figure 3-1) with coal properties in Nicholas County. The Jerry Fork Eagle Mine is located within the Power Mountain facilities area that includes the preparation plant and rail surface facilities. The Rolling Thunder Powellton seam property is located approximately 10 miles west of the preparation plant and surface facilities. The Power Mountain surface facilities are approximately 20 miles west of the town of Summerville, West Virginia, the county seat of Nicholas County. Additionally, the Property is approximately 50 miles north of Beckley, West Virginia, and 53 miles east of Charleston, West Virginia, the state capital of West Virginia. Surface facilities for the operation are located in the Twentymile Creek and Gauley River drainage basins. Numerous small communities are present near the Property such as Drennen, Lockwood, and Belva, West Virginia. The nearest major population center is Charleston, West Virginia, the capital of West Virginia that is approximately 53 miles west of the surface facilities. Other major population centers are Beckley, West Virginia (50 miles south), Roanoke, Virginia (155 miles southeast), Morgantown, West Virginia (135 miles north), and Lexington, Kentucky (230 miles west). Alpha Metallurgical Resources, Inc. Statement of Coal Resources for the Power Mountain Underground Complex in Accordance with United States SEC Standards as of December 31, 2023 Central Appalachian Coal Basin West Virginia, USA MARSHALL MILLER & ASSOCIATES, INC. 12 The coal resources are located on the following United States Geological Survey (USGS) Quadrangles: Bentree, Lockwood, Gilboa, and Swandale. The coordinate system and datum used for the model of the Power Mountain coal resources and mine complex and the subsequent maps were produced in the West Virginia State Plane South system, NAD 27. Figure 3-1: Property Location Map 3.2 Titles, Claims or Leases MM&A has not carried out a separate title verification for the coal property and has not verified leases, deeds, surveys, or other property control instruments pertinent to the subject resources. Alpha’s property is comprised of approximately 51,400 total acres of mineral control owned in fee and approximately 5 separate leases with varying expiration dates. Table 3-1 lists the Power Mountain property mineral control. Alpha has represented to MM&A that Alpha controls the mining rights to the resources as shown on the property maps, and MM&A has accepted these as being a true and accurate depiction of the mineral rights controlled by Alpha.

Alpha Metallurgical Resources, Inc. Statement of Coal Resources for the Power Mountain Underground Complex in Accordance with United States SEC Standards as of December 31, 2023 Central Appalachian Coal Basin West Virginia, USA MARSHALL MILLER & ASSOCIATES, INC. 13 Table 3-1: Mineral Control – Power Mountain Complex Reference File Number Document Type Expiration Date (1) On-going Minimum Royalty (2) On-going Production Royalty (3) PD 1 Deed N/A N/A N/A PD 2 Deed N/A N/A N/A PD 3 Deed N/A N/A N/A PD 4 Deed N/A N/A N/A PD 5 Deed N/A N/A N/A PL 1 Lease 3/31/2024 Yes Yes PL 4 Lease 12/31/2026 Yes Yes PL 5 Lease 5/11/2027 Yes Yes PL 6 Lease 5/11/2027 Yes Yes PL 7 Lease 12/31/2023 Yes Yes (1) For leases with expiration dates, Company has option to renew or expects to renew until all mineable and merchantable coal is exhausted (2) Minimum royalty payments are generally recoupable against future production royalties. (3) Royalty rates range from 5.5% to 9% of gross selling price 3.3 Mineral Rights Alpha supplied property control maps to MM&A related to properties for which mineral and/or surface property are controlled by Alpha. While MM&A accepted these representations as being true and accurate, through experience with the Property, MM&A has no knowledge of past property boundary disputes or other concerns that could impact future mining operations or development potential. Property control in Appalachia can be intricate. Coal mining properties are typically composed of numerous property tracts which are owned and/or leased from both land holding companies and private individuals or companies. It is common to encounter severed ownership, with different entities or individuals controlling the surface and mineral rights. Mineral control in the region is typically characterized by leases or ownership of larger tracts of land, with surface control generally comprised of smaller tracts, particularly in developed areas. Control of the surface property is necessary to conduct surface mining but is not necessary to conduct underground mining aside from relatively limited areas required for seam access or ventilation infrastructure. Alpha’s executive management team has a history of mining in Central Appalachia and has conveyed to MM&A that it has been successful in acquiring surface rights where needed for past operations. By assignment, MM&A has not completed a title review of the Power Mountain properties. 3.4 Encumbrances No Title Encumbrances are known. By assignment, MM&A did not complete a query related to Title Encumbrances or Environmental Encumbrances. Alpha Metallurgical Resources, Inc. Statement of Coal Resources for the Power Mountain Underground Complex in Accordance with United States SEC Standards as of December 31, 2023 Central Appalachian Coal Basin West Virginia, USA MARSHALL MILLER & ASSOCIATES, INC. 14 3.5 Other Risks There is always risk involved in property control. As is common practice, Alpha, and its predecessors, have had their land teams examine the deeds and title control to minimize this risk. Historically, property control has not posed any significant challenges related to Power Mountain operations. 4 Accessibility, Climate, Local Resources, Infrastructure and Physiography 4.1 Topography, Elevation, and Vegetation The Property is located within the Appalachian Plateau physiographic province along the Gauley River. The terrain is typical of the Central Appalachian Plateau’s physiographic province, being rugged and deeply dissected by V-shaped river valleys and flanked by steep-sided upland regions. Slopes in the area are mostly steep to very steep with some gently sloping with relatively narrow ridges. Surface elevations near the mine complex range from approximately 900 feet above sea level at streams to approximately 2,000 feet at ridge tops. The area is heavily vegetated and has a significant amount of hardwood forests. The Property is not situated near any major urban centers. 4.2 Access and Transport Primary access to the Power Mountain properties is provided through West Virginia Route 39 (WV-39) that parallels the Gauley River. WV-39 connects with West Virginia Route 19 (WV-19) in Summersville, WV and State Route-60 at Gauley Bridge that provides access to Charleston, West Virginia and points north and south. Numerous secondary and unimproved roads provide direct access to the mine property. These roads typically stay open throughout the year. Within the Property, unimproved roads are utilized to access gas drainage wells and surface based deep mine infrastructure. Rail transport is provided to the Power Mountain loadout by Norfork Southern (NS) Railroad. 4.3 Proximity to Population Centers The Power Mountain properties are located near the town of Summersville, West Virginia in Nicholas County. There are no large population centers in close proximity to the Property. The nearest major population centers are Charleston, West Virginia (53 miles west), Roanoke, Virginia (155 miles southeast), and Morgantown, West Virginia (135 miles north), and Lexington, Kentucky (230 miles west). As of the 2020 census, Nicholas County had just over 24,600 residents.

Alpha Metallurgical Resources, Inc. Statement of Coal Resources for the Power Mountain Underground Complex in Accordance with United States SEC Standards as of December 31, 2023 Central Appalachian Coal Basin West Virginia, USA MARSHALL MILLER & ASSOCIATES, INC. 15 4.4 Climate and Length of Operating Season The climate of the region is classified as humid continental with four distinct seasons: warm summers, cold winters, and moderate fall and spring seasons. Precipitation in the region is consistent throughout the year, approximately 3 to 5 inches per month, with the most rain falling in spring and the early months of summer. Average yearly precipitation is 51.1 inches. Summer months typically begin in late May and end in early September and range in average temperature from 46 to 78 degrees Fahrenheit. Winters typically begin in mid to late November and run until mid to late March with average temperatures ranging from 19 to 52 degrees Fahrenheit. Precipitation in the winter typically comes in the form of snowfall or as a wintery mix (sleet and snow) with severe snowfall events occurring occasionally. Seasonal variations in climate typically do not affect underground mining in West Virginia. 4.5 Infrastructure The Power Mountain properties have sources of water, power, personnel, and supplies readily available for use. Personnel have historically been hired from the surrounding communities in Nicholas, Raleigh, Kanawha, Fayette, and Boone Counties, and have proven to be adequate in numbers to conduct mining operations. As mining is common in the surrounding areas, the workforce is generally familiar with mining practices, and many are experienced miners. Water is sourced locally from ground water collected in abandoned underground mines and the refuge impoundment, and electricity is sourced from Appalachian Power, a subsidiary of American Electric Power (AEP). The service industry in the areas surrounding the mine complex has historically provided supplies, equipment repairs and fabrication, etc. Alpha’s Power Mountain preparation plant services consumers with washed coal, which is transported via the adjacent NS rail line at the Power Mountain loadout. Haul roads, primary roads, and conveyor belt systems account for transport from the various mine sites to the preparation plant. 5 History 5.1 Previous Operation The Power Mountain properties involve a complex combination of previous ownership. Coal mining in the area has occurred for nearly a century. Predecessors of Alpha, namely Alpha Natural Resources (ANR) and Massey Energy (Massey) previously held mining rights on much of the Property. The current Power Mountain preparation plant surface facilities were constructed in 1985 by A.T. Massey Coal Company. The preparation plant was upgraded in 2010 and the refuse disposal areas, utility infrastructure and rail transportation have been maintained to provide a modern coal processing facility for the Property. Alpha Metallurgical Resources, Inc. Statement of Coal Resources for the Power Mountain Underground Complex in Accordance with United States SEC Standards as of December 31, 2023 Central Appalachian Coal Basin West Virginia, USA MARSHALL MILLER & ASSOCIATES, INC. 16 The Eagle seam resources are associated with the Jerry Fork Eagle underground mine. The mine was constructed in 1999 and has since been in continuous operation. The Rolling Thunder Powellton seam resources were developed in 2023, additionally there is historic underground mining on the Property. 5.2 Previous Exploration Extensive exploration in the form of subsurface drill efforts has been carried out on the Property by numerous entities, most of which efforts were completed prior to the inception of Alpha. The most recent exploration drilling has been conducted by Alpha in 2021. Diamond core and rotary drilling are the primary types of exploration on the Property. Data for correlation and mining conditions are derived from core descriptions and geophysical logging (e-logging). Coal quality analyses were also employed during the core exploration process. The development of this report included an assessment of over 250 exploration drill holes, largely comprised of coal measurements. Drill records indicate that independent contract drilling operators have typically been engaged to carry out drilling on the Property. Geophysical logging was typically performed by outside logging firms. MM&A, via its Geophysical Logging Systems (GLS) subsidiary, has logged a significant number of the past exploration holes, including most of the recently drilled holes. 6 Geology 6.1 Regional, Local and Property Geology The Property lies in the Central Appalachian Coal basin in the Appalachian Plateau physiographic province. The coal deposits in the eastern US are the oldest and most extensively developed coal deposits in the country. The coal deposits on the Property are Carboniferous in age, being of the Pennsylvanian system. Overall, these Carboniferous coals contain two-fifths of the US’s bituminous coal deposits and extend over 900 miles from northern Alabama to Pennsylvania and are part of what is known as the Appalachian Basin. The Appalachian Basin is more than 250 miles wide and, in some portions, contains over 60 coal seams of varying economic significance. Coal seams and zones of economic significance typically range between 24 and 48 inches in thickness, with relatively little structural deformation. Regional structure is typically characterized by gently dipping strata to the northwest at one to four percent, averaging three percent. Strata on the Property are mostly of the Pennsylvanian-age Kanawha Formation and the older, lower Beckley and Fire Creek seams are part of the New River Formation of the Pottsville Series. The rock formations between the coal seams are characterized by large proportions of sandstone interspersed with shale units.

Alpha Metallurgical Resources, Inc. Statement of Coal Resources for the Power Mountain Underground Complex in Accordance with United States SEC Standards as of December 31, 2023 Central Appalachian Coal Basin West Virginia, USA MARSHALL MILLER & ASSOCIATES, INC. 17 Coal seams with remaining resource potential evaluated within this TRS include, in descending stratigraphic order, the Powellton and the Eagle seams. Figure 6-1 illustrates the extent of the Appalachian Basin (in gray) and coal-bearing regions (divided by green lines). Figure 6-1: Extent of Appalachian Basin (modified after USGS 1625-C) 6.2 Mineralization The generalized stratigraphic columnar section in Figure 6-2 demonstrates the vertical relationship of the principal coal seams and rock formations on the Property. Alpha Metallurgical Resources, Inc. Statement of Coal Resources for the Power Mountain Underground Complex in Accordance with United States SEC Standards as of December 31, 2023 Central Appalachian Coal Basin West Virginia, USA MARSHALL MILLER & ASSOCIATES, INC. 18 Figure 6-2: Power Mountain Generalized Stratigraphic Column 6.3 Deposits 6.3.1 Seam Description The coal produced at the Power Mountain complex is High-volatile B bituminous coal based on the ASTM classification of coals. This ranking is for coal with greater than 31% volatile matter and a moist, mineral matter free btu of 13,000 to 14,000. These coals have historically been sold on metallurgical market. Due to the high value of these High Volatile coking coals, all the seams have been extensively mined in the past. Generally, the coal rank increases with depth whereas the highest seams stratigraphically and physically on the hills exhibit the greatest volatile matter content and deepest seams exhibit the lowest volatile matter content.

Alpha Metallurgical Resources, Inc. Statement of Coal Resources for the Power Mountain Underground Complex in Accordance with United States SEC Standards as of December 31, 2023 Central Appalachian Coal Basin West Virginia, USA MARSHALL MILLER & ASSOCIATES, INC. 19 The highest structural elevations are along the southeastern margin of the resource deposits with the strata generally dipping northwest at approximately 2%. The Eagle seam at Jerry Fork Mine would be considered below drainage. The Eagle seam was accessed through a box cut at the Jerry Fork mine. The southeastern extent of the Rolling Thunder Powellton seam resource outcrops along Twentymile Creek and dips northwest below drainage. Coal seams that outcrop and are above-drainage generally contain significantly less inherent methane gas than deep below drainage deposits. 7 Exploration 7.1 Nature and Extent of Exploration The Power Mountain property has been extensively explored by subsurface drilling efforts carried out by numerous entities, most of which were completed prior to ownership by Alpha. Diamond core and rotary drilling are the primary types of exploration on the Property. Data for correlation and mining conditions are derived from core descriptions and geophysical logging (e- logging). Coal quality analyses were also employed during the core exploration process. Drill records indicate that independent contract drilling operators have typically been engaged to carry out drilling on the Property. Geophysical logging was typically performed by outside logging firms. MM&A, via its Geophysical Logging Systems subsidiary, has logged a portion of the past exploration holes, including most of the recently drilled holes. The location of the drilling is shown on the maps included in Appendix C. The concentration of exploration varies slightly across the Property. Drilling on the Property is sufficient for delineation of deep mineable coal horizons. Core logging is carried out by geologists in cases where roof and floor strata are of particular interest and in cases where greater resolution and geologic detail are needed. In many cases the drill hole data comes from simplified driller’s logs, which may lack specific details regarding geotechnical conditions and specific geology, making correlations and floor and roof conditions difficult to determine. Geophysical logging (e-logging) techniques, by contrast, document specific details useful for geologic interpretation and mining conditions. Given the variability of data-gathering methods, definitive mapping of future mining conditions may not be possible, but projections and assumptions can be made within a reasonable degree of certainty. A significant effort was put into verifying the integrity of the database. Once this was established, stratigraphic columnar sections were generated using cross-sectional analysis to establish or confirm coal seam correlations. A typical cross-section is shown in Figure 7-1. Alpha Metallurgical Resources, Inc. Statement of Coal Resources for the Power Mountain Underground Complex in Accordance with United States SEC Standards as of December 31, 2023 Central Appalachian Coal Basin West Virginia, USA MARSHALL MILLER & ASSOCIATES, INC. 20 Figure 7-1: Power Mountain Cross-Section Due to the long history of exploration by various parties on the Property, a wide variety of survey techniques exist for documentation of data point locations. Many of the older exploration drill holes appear to have been located by survey and more recently completed drill holes are often located by high-resolution Global Positioning System (GPS) units. However, some holes appear to have been approximately located using USGS topography maps or other methods which are less accurate. Therefore, discretion had to be used regarding the accuracy for the location and ground surface elevation of some of these older drill holes. In instances where a drill hole location (or associated coal seam elevations) appeared to be inconsistent with the overall structural trend (or surface topography for surface-mineable areas), the data point was not honored for geological modeling. Others with apparently minor variances were adjusted and then used by MM&A.

Alpha Metallurgical Resources, Inc. Statement of Coal Resources for the Power Mountain Underground Complex in Accordance with United States SEC Standards as of December 31, 2023 Central Appalachian Coal Basin West Virginia, USA MARSHALL MILLER & ASSOCIATES, INC. 21 Surveying of the underground and surface mined areas has been performed by the mine operators and/or their consulting surveyors. By assignment, MM&A did not verify the accuracy or completeness of mine maps supplied by Alpha but accepted this information as being the work of responsible engineers and surveyors, as required by both State and Federal Law. 7.2 Drilling Procedures Core drilling methods utilize NX-size (21/8 inch) or similar-sized core cylinders to recover core samples, which can be used to delineate geologic characteristics, and for coal quality testing and geotechnical logging. For the core holes, the geophysical logs are especially useful in verifying the core recovery of both the coal samples (for assurance that sample is representative of the full seam) and of the roof and floor rock samples (for evaluating ground control characteristics of deep mineable coal seams). In addition to the core holes, rotary drilled holes also exist on the Property. Data for the rotary drilled holes is mainly derived from downhole geophysical logs, which are used to interpret coal and rock thickness and depth since logging of the drill cuttings is not reliable. A wide variety of core-logging techniques exist for the Property. For many of the core holes, the primary data source is a generalized lithology description by the driller, more recent holes are generally supplemented by a more detailed core log completed by a geologist. These drilling logs were provided to MM&A as a geological database. MM&A geologists were not involved in the production of original core logs but did perform a basic check of information within the provided database. 7.3 Hydrology Hydrologic testing and forecasting are necessary parts of the permitting process and as such are routinely considered in the mine planning process. Power Mountain has a lengthy history of operation in the Eagle coal seam at Jerry Fork and no significant hydrologic concerns or material issues have been experienced in its history. Future mining is projected to occur in areas exhibiting similar hydrogeological conditions as past mining. Based upon the successful history of the operation with regards to hydrogeological features, MM&A assumes that the operation will not be hindered by such issues in the future. 7.4 Geotechnical Data The effects of weathering and stress-relief fracturing are more pronounced at shallow overburden depths, and due to the potential adverse mining conditions that can be encountered within those low- cover areas, coal resources have not been determined for any area that lies within less than 100 feet of overburden thickness. Other potential adverse conditions can be brought on by lithologic transition zones within the near roof strata of the mine. The Powellton seam roof has areas of sandstone roof that transitions to shale roof rock. The Eagle seam is dominated by a relatively consistent shale roof lithology. None of the potential features discussed above should preclude mine development if proper engineering controls are put in place. Alpha Metallurgical Resources, Inc. Statement of Coal Resources for the Power Mountain Underground Complex in Accordance with United States SEC Standards as of December 31, 2023 Central Appalachian Coal Basin West Virginia, USA MARSHALL MILLER & ASSOCIATES, INC. 22 MM&A’s site-specific knowledge of geotechnical information is limited to its employees’ experience at the operation and common knowledge of typical geotechnical based mining issues which are anticipated to be applicable to the subject resource. MM&A has not received exploration-based geotechnical information and has not conducted geotechnical modeling or assessments as part of this engagement. Such modeling would generally be applied to a reserve level analysis. 8 Sample Preparation Analyses and Security 8.1 Prior to Sending to the Lab Coal samples have been obtained from the Property by subsurface exploration using core drilling techniques. The protocol for preparing and testing the samples has varied over time and is not well documented for the older holes drilled on the Property. Typical core-drilling sampling methods for coal in the United States involves drilling through the seam, removing the core from the barrel, describing the lithology, wrapping the coal sample in a sealed plastic sleeve, and placing it lengthwise into a covered core box, and carefully marking hole ID and depth intervals on each box and lid, allowing the core to be delivered to a laboratory in correct stratigraphic order, and with original moisture content. This process has been the norm for both historical and ongoing exploration activities at the Property. This work is typically performed by the supervising driller, geologist, or company personnel. Samples are most often delivered to the company by the driller after each shift or acquired by company personnel or representatives. Coal core samples were obtained by previous or current operators on the Property. MM&A did not participate in the collection, sampling, shipment of core, and analysis of core samples. However, it is reasonable to assume, given the consistency of quality from other previous operators, that these samples were generally collected and processed under industry best practices. This assumption is based on MM&A’s familiarity with the operating companies and the companies used to perform the analysis. In addition to the steps taken to ensure the accuracy of the historical data as described above, Alpha reports that the company employs a detailed chain of custody process during their current sampling programs. This chain of custody process follows the sample from the time it is drilled until the final quality results are entered into a database for preparation of geologic models. 8.2 Lab Procedures Coal-quality testing has been performed over many years by operating companies using different laboratories and testing regimens. Some of the samples have raw analyses and washability’s on the full seam (with coal and rock parting layers co-mingled) and are mainly useful for characterizing the coal quality for projected production from underground mining. Other samples have coal and rock analyzed separately, the results which can be manipulated to forecast underground mining quality. Care has

Alpha Metallurgical Resources, Inc. Statement of Coal Resources for the Power Mountain Underground Complex in Accordance with United States SEC Standards as of December 31, 2023 Central Appalachian Coal Basin West Virginia, USA MARSHALL MILLER & ASSOCIATES, INC. 23 been taken to use only those analyses that are representative of the coal quality parameters for the appropriate mining type for each sample. Standard procedure upon receipt of core samples by the testing laboratory is to: 1) log the depth and thickness of the sample; then 2) perform testing as specified by a representative of the operating company. Each sample is then analyzed in accordance with procedures defined under ASTM International (ASTM) standards including, but not limited to washability (ASTM D4371); ash (ASTM D3174); sulfur (ASTM D4239); Btu/lb. (ASTM D5865); volatile matter (ASTM D3175); and Free Swell Index (FSI) (ASTM D720). While not confirmed by MM&A, it is assumed that best practices and ASTM (or equivalent standards at the time of testing) were utilized in laboratory quality testing. 9 Data Verification 9.1 Procedures of Qualified Person MM&A reviewed the Alpha-supplied digital geologic database and supplemented the database with its own in-house records which have been maintained for both Alpha and previous operators of the Property. The database consists of data records, which include drill hole information for holes that lie within and adjacent to the Property and records for numerous supplemental coal seam thickness measurements. Once the initial integrity of the database was established, stratigraphic columnar sections were generated using cross-sectional analysis to establish or confirm coal seam correlations. Geophysical logs were used wherever available to assist in confirming the seam correlation and to verify proper seam thickness measurements and recovery of coal samples. Additionally, an audit of the Alpha digital database was conducted in 2021 by comparing seam depths, coal, and parting thicknesses in the database against the source drill logs and the results were acceptable. After establishing and/or verifying proper seam correlation, seam data control maps and geological cross-sections were generated and again used to verify seam correlations and data integrity. Once the database was fully vetted, seam thickness, base-of-seam elevation, roof and floor lithology, and overburden maps were independently generated for use in the mine planning process. Coal quality was analyzed and summarized by MM&A’s team of geologists and engineers. Quality was provided by Alpha in various database formats, laboratory data sheets, and also obtained directly from MM&A’s files. Care was taken to ensure that sampled data was representative of the mineable section. In instances where minimal representative data was noted, geological tonnages were estimated based upon applying assumed densities of coal and non-coal material to thicknesses expressed in geological database files. Alpha Metallurgical Resources, Inc. Statement of Coal Resources for the Power Mountain Underground Complex in Accordance with United States SEC Standards as of December 31, 2023 Central Appalachian Coal Basin West Virginia, USA MARSHALL MILLER & ASSOCIATES, INC. 24 9.2 Limitations MM&A did not encounter material limitations when verifying the integrity of exploration data. Where appropriate, modifications were made to lithological correlations to reflect MM&A’s best interpretations of the geological setting. As with any geological model, the accuracy of correlations is limited to the extent of available data. Further exploration could potentially modify geological interpretations expressed by MM&A in this TRS. 9.3 Opinion of the Qualified Person Sufficient data has been obtained through various exploration and sampling programs and mining operations to support the geological interpretations of seam structure and thickness for coal horizons situated on the Power Mountain Property. The data is of sufficient quantity and reliability to reasonably support the coal resource estimates in this TRS. 10 Mineral Processing 10.1 Testing Procedures Basic chemical analyses (both raw and washed quality), petrographic data, rheological data and ash, ultimate and sulfur analysis are available but not summarized for this filing. Available coal quality data sourced from MM&A’s vaults (associated with former projects for Alpha and its predecessors) was tabulated by resource area in a Microsoft® EXCEL workbook. Such data contained laboratory sheets which MM&A utilized to confirm that sampled intervals were representative of geological models and confirm that appropriate laboratory procedures were utilized to derive raw and clean coal parameters. Additionally, Alpha provided MM&A with a database of its own in-house coal quality information which did not include backup laboratory information or sampled intervals. MM&A compared wash recovery values from Alpha’s dataset to proximal holes with wash recovery data in MM&A’s dataset and calculated estimates of wash recovery based upon the relative percentages of coal and rock from lithologic descriptions. In general, MM&A found that Alpha’s dataset was representative and appropriate for inclusion in coal quality summaries. Quality tables also provide basic statistical analyses of the coal quality datasets, including average value; maximum and minimum values; and the number of samples available to represent each quality parameter of the seam. Coal samples that were deemed by MM&A geologists to be unrepresentative were not used for statistical analysis of coal quality, as documented in the tabulations. The amount and areal extent of coal sampling for geological data is generally sufficient to represent the quality characteristics of the coal horizons and allow for proper market placement of the subject coal seams. For some of the coal deposits, there are considerable laboratory data from core samples that are representative of the full extent of the resource area; and for others there are more limited data to

Alpha Metallurgical Resources, Inc. Statement of Coal Resources for the Power Mountain Underground Complex in Accordance with United States SEC Standards as of December 31, 2023 Central Appalachian Coal Basin West Virginia, USA MARSHALL MILLER & ASSOCIATES, INC. 25 represent the resource area. For example, in the active operations with considerable previous mining, there may be limited quality data within some of the remaining resource areas; however, in those cases the core sampling data can be supplemented with operational data from mining and shipped quality samples representative of the resource area. A summary of the available washed coal quality information for the Property is provided in Table 10-1, along with a summary of raw coal quality data in Table 10-2. Table 10-1: Average Washed Coal Quality at 1.50 Float by Resource Area Resource Area Estimated Visual Recovery % % Recovery % Ash % Sulfur Btu/lb. No. of Samples Powellton Multi-Bench 56.93 67.56 4.60 1.48 14,628 14/ 2 / 4 / 4 / 4 Powellton Single Bench 77.43 82.37 4.88 1.16 14457 20 / 15 / 14 / 15 / 12 Eagle – North Block A 82.87 86.78 5.50 0.78 14,385 3 Eagle South Block B and D 85.31 85.08 5.90 0.82 14,446 10 / 19 /19 /19 /17 Eagle Block C 81.54 93.36 6.44 0.69 14,298 1 1. Coal quality is reported on a clean basis for informational purposes only. Resources reported in this TRS are expressed on an in- place basis, inclusive of high ash parting material which is removed during coal cleaning. 2. No. of samples for each parameter denoted for each category if different. Table 10-2: Average Raw Coal Quality (Dry Basis) by Resource Area Resource Area % Ash % Sulfur Btu/lb. No. of Samples Powellton Multi-Bench 19.69 5.21 11,947 2 Powellton Single Bench 15.32 1.18 12,651 13 Eagle – North Block A 10.50 0.84 13,801 5 / 1 / 1 Eagle South Block B 9.31 - - 4 / 0 / 0 Eagle Block C 7.91 - - 1 / 0 / 0 10.2 Relationship of Tests to the Whole The extensive sampling and testing procedures typically followed in the Coal Industry result in an excellent correlation between samples and Marketable product. The Power Mountain Property has a long history of saleable production, in the High-volatile metallurgical markets, confirming exploration results. 10.3 Lab Information Each sample is analyzed at area Laboratories that operate in accordance with procedures defined under ASTM standards including, but not limited to; washability (ASTM D4371); ash (ASTM D3174); sulfur (ASTM D4239); Btu/lb. (ASTM D5865); volatile matter (ASTM D3175); Free Swell Index (FSI) (ASTM D720). 10.4 Relevant Results No critical factors have been found that would adversely affect the recovery of the resources. Any quality issues that occur, either localized or general, are accounted for in the resource analysis. Alpha Metallurgical Resources, Inc. Statement of Coal Resources for the Power Mountain Underground Complex in Accordance with United States SEC Standards as of December 31, 2023 Central Appalachian Coal Basin West Virginia, USA MARSHALL MILLER & ASSOCIATES, INC. 26 11 Mineral Resource Estimates MM&A independently created a geologic model to define the coal resources at the Property. Coal resources were estimated as of December 31, 2023. The resource estimates criteria were developed using industry-accepted standards to assure that the basic geologic characteristics of the coal resources are in reasonable conformity with those currently being mined and marketed in the region. The tonnage estimates provided herein report in-situ coal resources as measured, indicated, and inferred. 11.1 Assumptions, Parameters and Methodology Geological data was imported into Carlson Mining® (formerly SurvCADD®) geological modelling software in the form of Microsoft® Excel files incorporating drill hole collars, seam and thickness picks, bottom seam elevations and raw and washed coal quality. These data files were validated prior to importing into the software. Once imported, a geologic model was created, reviewed, and verified with a key element being a gridded model of coal seam thickness. Resource tons were estimated by using the seam thickness grid based on each valid point of observation and by defining resource confidence arcs around the points of observation. Points of observation for Measured and Indicated confidence arcs were defined for all valid drillholes that intersected the seam using standards deemed acceptable by MM&A based on a detailed geologic evaluation and a statistical analysis of all drill holes within the projected resource areas as described in Section 11.1.1. The geological evaluation incorporated an analysis of seam thickness related to depositional environments, adjacent roof, and floor lithologies. After validating coal seam data and establishing correlations, the seam thickness, coal thickness and elevation for seams of economic interest were used to generate a geologic model. Local geologic and physical conditions were incorporated into the model where mineability and or mining costs could be affected by the conditions. Both coal thickness and quality data are deemed by MM&A to be reasonably sufficient within the resource areas. Therefore, there is a reasonable level of confidence in the geologic interpretations required for coal resource determination based on the available data and the techniques applied to the data. Table 11-1 below provides the geological mapping and coal tonnage estimation criteria used for the coal resource evaluation. These cut-off parameters have been developed by MM&A based on its experience with the Property and are typical of mining operations in the Central Appalachian coal basin.

Alpha Metallurgical Resources, Inc. Statement of Coal Resources for the Power Mountain Underground Complex in Accordance with United States SEC Standards as of December 31, 2023 Central Appalachian Coal Basin West Virginia, USA MARSHALL MILLER & ASSOCIATES, INC. 27 Table 11-1: General Resource Evaluation Criteria Item Parameters Technical Notes & Exceptions* • General Reserve Criteria Reserve Classification Resource Coal resources as reported are exclusive of coal reserves (have not been converted to reserve). Reliability Categories Resource (Measured, Indicated & Inferred) To better reflect geological conditions of the coal deposits, distance between points of observation is determined via statistical analysis Measured Classification 0.25 Mile, (1320’) Projection form Measurement Point Based on 11.1.1 Analysis Indicated Classification 0.25 to 0.75 Mile, (1320’ to 3960’) Projection form Measurement Point Based on 11.1.1 Analysis Inferred Classification 0.75 to 3.0 Mile, (3960’ to 15,840) Projection form Measurement Point Based on 11.1.1 Analysis Effective Date of Resource Estimate December 31, 2023 Coal resources were estimated based upon depletion maps as of September 30, 2023, and a fourth quarter 2023 production depletion adjustment. Seam Density - with Raw Seam Analysis 1.25 + (Raw Ash% / 100) Seam Density - without Raw Seam Analysis Estimated by (1) assuming specific gravity of 1.30 for coal and 2.25 for rock parting • Underground-Mineable Criteria Map Thickness Total seam thickness Minimum Seam Thickness 2.5 Feet, 30 inches Minor Exceptions for localized zones of thinner coal Minimum Mining Thickness Not Considered Resource Only Study Minimum Total Coal Thickness 2.5 Feet, 30 inches Minor Exceptions for localized zones of thinner coal Minimum In-Seam Wash Recovery Not Considered Resource Only Study. Wash Recovery Applied to Coal Reserves Not Applicable Resources Reported on an In-Situ Basis Out-of-Seam Dilution Thickness for Run-of-Mine Tons Applied to ROM tonnages Not Considered Mine Barrier Not Considered Minimum Resource Tonnage 400 thousand recoverable tons for individual area (logical mining unit) Minimum Overburden Depth 100 feet Minimum Interval to Rider Coal Considered on a case-by-case basis, depending on interval lithology, etc. Minimum Interval to Overlying or Underlying Reserves Not Applicable Minimum Interval to Overlying or Underlying Mined Areas Not Applicable Adjustments Applied to Coal Resources Not Applicable Resources Reported on an In-Situ Basis 11.1.1 Geostatistical Analysis for Classification MM&A completed a geostatistical analysis on drill holes within the resource boundaries to determine the applicability of the common United States classification system for measured and indicated coal resources. Historically, the United States has assumed that coal within ¼-mile (1,320 feet) of a point of observation represents a measured resource whereas coal between ¼-mile (1,320 feet) and ¾-mile (3,960 feet) from a point of observation is classified as indicated. Inferred resources are commonly assumed to be located between ¾-mile (3,960 feet) and 3 miles (15,840 feet) from a point of observation. Alpha Metallurgical Resources, Inc. Statement of Coal Resources for the Power Mountain Underground Complex in Accordance with United States SEC Standards as of December 31, 2023 Central Appalachian Coal Basin West Virginia, USA MARSHALL MILLER & ASSOCIATES, INC. 28 MM&A performed a geostatistical analysis test of the Powellton seam data set using the Drill Hole Spacing Analysis (DHSA) method. This method attempts to quantify the uncertainty of applying a measurement from a central location to increasingly larger square blocks and provides recommendations for determining the distances between drill holes for measured, indicated, and inferred resources. To perform DHSA the data set was processed to remove any erroneous data points, clustered data points, as well as directional trends. This was achieved using histograms, as seen in Figure 11-1, color coded scatter plots showing the geospatial positioning of the borings, Figure 11-2, and trend analysis. Figure 11-1: Histogram of the Total Seam Thickness for the Powellton Seam Present in the Property Figure 11-2: Scatter Plot of the Total Seam Thickness for the Powellton Seam Present in the Property Following the completion of data processing, a variogram of the data set was created, Figure 11-3. The variogram plots average square difference against the separation distance between the data pairs. The separation distance is broken up into separate bins defined by a uniform lag distance (e.g., for a lag distance of 499 feet the bins would be 0 – 499 feet, 502 – 1,000 feet, etc.). Each pair of data points that are less than one lag distance apart are reported in the first bin. If the data pair is further apart than one lag distance but less than two lag distances apart, then the variance is reported in the second bin. The numerical average for differences reported for each bin is then plotted on the variogram. Care was taken to define the lag distance in such a way as to not overestimate any nugget effect present in the data set. Lastly, modeled equations, often spherical, gaussian, or exponential, are applied to the variogram to represent the data set across a continuous spectrum.

Alpha Metallurgical Resources, Inc. Statement of Coal Resources for the Power Mountain Underground Complex in Accordance with United States SEC Standards as of December 31, 2023 Central Appalachian Coal Basin West Virginia, USA MARSHALL MILLER & ASSOCIATES, INC. 29 Figure 11-3: Variogram of the Total Seam Thickness for the Powellton Seam The estimation variance is then calculated using information from the modeled variogram as well as charts published by Journal and Huijbregts (1978). This value estimates the variance from applying a single central measurement to increasingly larger square blocks. Care was taken to ensure any nugget effect present was added back into the data. This process was repeated for each test block size. The final step of the process is to calculate the global estimation variance. In this step the number square blocks that would fit inside the selected study area is determined for each block size that was investigated in the previous step. The estimation variance is then divided by the number of blocks that would fit inside the study area for each test block size. Following this determination, the data is then transformed back to represent the relative error in the 95th-percentile range. Figure 11-4 shows the results of the DHSA performed on the Powellton seam data for the Property. DHSA provides hole to hole spacing values, these distances need to be converted to radius from a central point in order to compare to the historical standards. A summary of the radius data is shown in Table 11-2. DHSA prescribes measured, indicated, and inferred drill hole spacings be determined at the 10-percent, 20-percent, and 50-percent levels of relative error, respectively. Alpha Metallurgical Resources, Inc. Statement of Coal Resources for the Power Mountain Underground Complex in Accordance with United States SEC Standards as of December 31, 2023 Central Appalachian Coal Basin West Virginia, USA MARSHALL MILLER & ASSOCIATES, INC. 30 Figure 11-4: Result of DHSA for the Powellton Seam Present in the Property Table 11-2: DHSA Results Summary for Radius from a Central Point Model: Measured Radial Distance (10% Relative Error) Indicated Radial Distance (20% Relative Error) Inferred Radial Distance (50% Relative Error) (miles) (miles) (miles) Gaussian: 0.40 0.65 1.49 Spherical: 0.38 0.64 1.48 Exponential: 0.36 0.62 1.38 Comparing the results of the DHSA to the historical standards, it is evident that the historical standards are more conservative than even the most conservative DHSA model with regards to determining measured resources. The Exponential model recommends using a radius of 0.36 miles for measured resources compared to the historical value of 0.25 miles. With respect to indicated resources, the DHSA falls closely in line with the historical standards. The Gaussian and Spherical models recommend using a radius 0.65 miles and 0.64 miles, respectively, while the Exponential model recommends a radius of 0.62 miles. These values align closely with the historical radius of 0.75 miles. These results have led the QPs to report the data following the historical classification standards, rather than use the results of the DHSA. 11.2 Resources Exclusive of Reserves The Power Mountain property contains multiple resource blocks within the two coal seals which were not evaluated as having reserve potential at the time of the study. These resources, formally identified

Alpha Metallurgical Resources, Inc. Statement of Coal Resources for the Power Mountain Underground Complex in Accordance with United States SEC Standards as of December 31, 2023 Central Appalachian Coal Basin West Virginia, USA MARSHALL MILLER & ASSOCIATES, INC. 31 as resources exclusive of reserves (i.e., which have not been converted to reserve), are in the: Powellton Seam at Rolling Thunder and the Eagle Seam at Jerry Fork. By assignment, the resources were not evaluated by all modifying factors necessary for a reserve classification. Figure 11-1 shows the relative location of the Power Mountain coal resources. Figure 11-5: Power Mountain Coal Reserves 11.2.1 Powellton Coal Seam The Powellton coal seam resources are located in the Rolling Thunder area. The resource block is located approximately 10 miles west of the Power Mountain preparation plant. The Powellton seam is generally one main bench that averages approximately 3.6 feet thick. In localized areas, a rider coal is included within the mine horizon that increase the seam thickness to approximately 7.3 feet. The roof rock is composed of areas of sandstone in the form of roof channels that laterally transition to a dominate shale roof. The floor rock is dominated by shale although isolated floor sandstone channels are present. Historically, previous operators referred to the Powellton seam as the Peerless seam. Correlation of coal seams through Alpha properties indicated a Powellton seam correlation. The West Virginia Geologic and Economic Survey (WVGES) refers to this coal seam as the No. 2 Gas seam. Alpha Metallurgical Resources, Inc. Statement of Coal Resources for the Power Mountain Underground Complex in Accordance with United States SEC Standards as of December 31, 2023 Central Appalachian Coal Basin West Virginia, USA MARSHALL MILLER & ASSOCIATES, INC. 32 11.2.2 Eagle Coal Seam The Eagle coal seam resources are located within the active Jerry Fork underground mine. The Jerry Fork mine entrance is located within the Power Mountain surface facilities near the preparation plant. The Eagle seam is consistently in one bench that averages approximately 3.1 feet thick. The roof rock is dominated by shale and sandy shale. Distinct sandstone channels are also locally present within the resource blocks and adjoining the resource area. 11.2.2.1 Initial Economic Analysis Supporting Resource MM&A completed an initial economic assessment to determine the potential economic viability of resources exclusive of reserves. MM&A applied relevant technical factors to estimate potential saleable tons without the resource blocks, should the resources be extracted via deep, continuous mining methods. MM&A developed cash cost profiles for the resource blocks, including direct cash costs (labor, supplies, roof control, maintenance and repair, power, and other); washing, trucking, materials handling, general and administrative, and environmental costs; and indirect cash costs (royalties, production taxes, property tax, insurance). Costs were developed based off relevant cost drivers (per-ft, per-raw-ton, per-clean-ton). Additionally, MM&A estimated capital costs to access resources. Capital costs associated with mine development were amortized across the resource’s potential saleable tonnages). Additional non-cash items (depreciation of equipment and depletion) and cash costs were compared to an assumed sale price of $130 per ton for the Eagle seam and $125 for the Powellton netback FOB loadout (approximately $154 per ton (Eagles seam) and $161 (Powellton seam) U.S. East Coast basis) for high-volatile markets. This resource assumed sales value was developed as a premium to the market-based reserve sales value to properly estimate the sales-related expenses should these resources be extracted during higher-than-average market conditions. The results of the analysis are shown below and demonstrate potential profitability on a fully loaded cost basis. Detailed summaries are shown in Appendix B.

Alpha Metallurgical Resources, Inc. Statement of Coal Resources for the Power Mountain Underground Complex in Accordance with United States SEC Standards as of December 31, 2023 Central Appalachian Coal Basin West Virginia, USA MARSHALL MILLER & ASSOCIATES, INC. 33 Table 11-3: Results of Initial Economic Assessment ($/ton) Mine Seam Direct Cash Transportation, Washing, Enviro, G&A Indirect Non-Cash Total Cost Fully Loaded P&L Rolling Thunder Powellton $56.13 $29.39 $15.42 $8.06 $109.00 $16.00 Jerry Fork Eagle $73.17 $20.93 $12.37 $7.73 $114.20 $15.80 Figure 11-6: Results of Initial Economic Assessment 11.3 Qualified Person’s Estimates Based on the geologic models, methodology and assumption described previously in this report, the Power Mountain resources total 55.48 million tons. Of this total, 30.94 million tons are in the measured category, 23.74 million tons are in the indicated category, and 0.80 million tons are in the inferred category. The resource tonnage classification is summarized in Table 11-4 and in Appendix A. Mineral resource estimates represent the in-situ coal for the Power Mountain complex controlled by Alpha on a dry basis. Alpha Metallurgical Resources, Inc. Statement of Coal Resources for the Power Mountain Underground Complex in Accordance with United States SEC Standards as of December 31, 2023 Central Appalachian Coal Basin West Virginia, USA MARSHALL MILLER & ASSOCIATES, INC. 34 Table 11-4: Coal Resources Summary as of December 31, 2023 Coal Resource (Dry Tons, In Situ) By Reliability Category By Control Type By Permit Status Mine/Area Seam Measured Indicated Total Inferred Grand Total Owned Leased Permitted Not Permitted Rolling Thunder Powellton 26,437,000 22,308,000 48,745,000 800,000 49,545,000 10,757,000 37,988,000 16,508,000 32,237,000 Jerry Fork Mine Eagle 4,507,000 1,431,000 5,938,000 0 5,938,000 5,938,000 0 5,938,000 0 Total 30,944,000 23,739,000 54,683,000 800,000 55,483,000 16,695,000 37,988,000 22,446,000 32,237,000 Note: All Power Mountain resources are reported exclusive of reserves (have not been converted to reserve). 11.4 Qualified Person’s Opinion MM&A geologists and engineers modeled the deposit and resource areas to reflect realistic mining scenarios, giving special consideration to seam thickness, floor and roof conditions, overburden, etc. This statistical study demonstrates that for each configuration of mineable seams, the classification system of measured (0 – ¼ mile), indicated (¼ to ¾ mile), and inferred (¾ to 3 miles) is reasonably adequate to predict seam thickness variation for modeling and mining purposes. Based on MM&A’s geostatistical analysis, it would be possible to extend the measured arcs slightly beyond historically accepted practices due to consistent geological settings. The QP’s have again elected not to extend arc distances, introducing a level of conservatism in measured coal classification. 12 Mineral Reserve Estimates Coal reserves were not estimated as part of this study. 13 Mining Methods Mining methods have not been considered at this stage. All economic analysis considers common underground room-and-pillar mining practices in mining cost considerations (Section 11). 14 Processing and Recovery Methods Detailed processing and recovery methods have not been considered at this stage. Processing of the subject resource would be based upon typical industry methods and would not require novel technologies.

Alpha Metallurgical Resources, Inc. Statement of Coal Resources for the Power Mountain Underground Complex in Accordance with United States SEC Standards as of December 31, 2023 Central Appalachian Coal Basin West Virginia, USA MARSHALL MILLER & ASSOCIATES, INC. 35 15 Infrastructure Existing infrastructure on the Power Mountain Complex including the coal preparation plant, loadout and Eagle seam Jerry Fork Mine are fully in place. The Rolling Thunder Powellton seam was developed in 2023. Production from Rolling Thunder Powellton is projected to be transported to the Power Mountain facilities for processing and market access. During the initial startup of operations, raw coal is trucked to the nearby Mammoth preparation plant for processing and market access. The Power Mountain plant, originally constructed in 1985, has a capacity of 1,200 tph and utilization of 25.65% in 2023. An aerial photo of the Power Mountain facility follows in Figure 15-1. Figure 15-1: Power Mountain Facilities 16 Market Studies 16.1 Market Description The quality characteristics for the subject coal resources have been reviewed in detail by MM&A. The drill hole data was used to develop average coal quality characteristics for the mining site. These Alpha Metallurgical Resources, Inc. Statement of Coal Resources for the Power Mountain Underground Complex in Accordance with United States SEC Standards as of December 31, 2023 Central Appalachian Coal Basin West Virginia, USA MARSHALL MILLER & ASSOCIATES, INC. 36 average coal quality characteristics were then used as the basis for determining the various markets into which the saleable coal will likely be placed. Typical quality specifications for the Power Mountain products are as shown in Table 16-1. Table 16-1: Dry Quality Specifications Powellton Eagle HVB HVB Ash (%) 4.82 7.46 Sulfur (%) 1.22 0.75 Volatile Matter (%) 35.80 33.7 The mine production serves the high-volatile metallurgical markets. 16.2 Price Forecasts Pricing data as provided by Alpha from third party sources is described in Table 16-2. The pricing data assumes a flat-line long term realization of $154 per short ton port pricing, with an average of $130 per ton netback pricing reflective of the high-volatile metallurgical Eagle seam product currently sold at Power Mountain. The Powellton seam pricing data assumes a flat-line long term realization of $161 per short ton port pricing, with an average $125 per ton netback pricing reflective of the high-volatile metallurgical product. Pricing was judgmentally selected by the QP based on review of historical average pricing over the past 5 years. A large majority of the coal sold by Alpha and their Power Mountain business group is shipped internationally as part of blended products from other business units within Alpha or sourced from other companies. These netback adjustments reflect these additional costs carried after the products leave the Power Mountain business unit. Table 16-2: Price Forecast Coal Quality Market Pricing Per Ton (1) (2) High-Vol. B $154 to $161 (1) - Market pricing shown on U.S. East Coast basis. (2) - Metallurgical pricing based on review of historical average pricing over the past 5 years. 17 Environmental Studies, Permitting and Plans 17.1 Environmental Permit Requirements and Status All mining operations are subject to federal and state laws and must obtain permits to operate mines, coal preparation and related facilities, haul roads, and other incidental surface disturbances necessary for mining to occur. Permits generally require that the permittee post a performance bond in an amount established by the regulatory program to provide assurance that any disturbance or liability created during mining operations is properly restored to an approved post-mining land use and that all

Alpha Metallurgical Resources, Inc. Statement of Coal Resources for the Power Mountain Underground Complex in Accordance with United States SEC Standards as of December 31, 2023 Central Appalachian Coal Basin West Virginia, USA MARSHALL MILLER & ASSOCIATES, INC. 37 regulations and requirements of the permits are fully satisfied before the bond is returned to the permittee. Significant penalties exist for any permittee who fails to meet the obligations of the permits including cessation of mining operations, which can lead to potential forfeiture of the bond. Any company, and its directors, owners, and officers, which are subject to bond forfeiture can be denied future permits under the program.1 Any future mining endeavor could acquire rights to the surface property and the existing permits which are in various states of reclamation. The permits have a timeline savings in that environmental studies have been performed and accepted by the state agencies in the original permit reviews. The existing permits can be modified to add additional surface disturbance areas to expand the planned mining. Permit revisions will occasionally be necessary to facilitate the expansion or addition of new mining areas on the Property. New or modified mining permits are subject to a public advertisement process and comment period, and the public is provided an opportunity to raise objections to any proposed mining operation. MM&A is not aware of any specific prohibition of mining on the subject property and given sufficient time and planning, a Mining Entity should be able to secure new permits to develop its planned mining operations within the context of current regulations. Portions of the Property are located near local communities. Regulations prohibit surface disturbance associated with mining activities within 300 feet of a residential dwelling, school, church, or similar structure unless written consent is first obtained from the owner of the structure. MM&A is unaware of any obvious or current permitting issues that are expected to prevent the issuance of future permits on the subject property. All coal producers are subject to a level of uncertainty regarding future clean water permits due to United States Environmental Protection Agency (EPA) and United States Fish and Wildlife (USFW) involvement with state programs. Table 17-1 lists the permits found at the subject Property. Table 17-1: Mining Permits with the Subject Property Permit Holder Permit Type Permit Status Expires Acres Disturbed Acres Reclaimed Acres Bonded Power Mountain Contura, LLC HPM Preparation Plant O-0002-85 Active, no coal removed 01/07/25 162.4 21.7 162.4 HPM Loadout O-0027-85 Active, no coal removed 05/21/25 85.4 38.5 85.4 Sugarcamp Branch Coal Refuse D O-3014-99 Active, no coal removed 04/18/28 436.18 0 436.18 Coal Surface Mine S-0053-84 Active, no coal removed 08/03/24 192.0 98.81 192.0 Nicholas Contura, LLC Coal Underground – Peerless #1 Mine U-3008-04 Active, Moving Coal 10/03/25 21.44 0 31.3 Coal Underground – Jerry Fork Eagle Mine U-3007-98 Active, Moving Coal 07/08/24 23.87 45.8 69.67 Note: Permit status and expiration dates are based on information obtained from regulatory agency website. Permits in reclamation status receive Renewal Waivers and may show expired dates. 1 Monitored under the Applicant Violator System (AVS) by the Federal Office of Surface Mining. Alpha Metallurgical Resources, Inc. Statement of Coal Resources for the Power Mountain Underground Complex in Accordance with United States SEC Standards as of December 31, 2023 Central Appalachian Coal Basin West Virginia, USA MARSHALL MILLER & ASSOCIATES, INC. 38 18 Capital and Operating Costs Costs have not been studied in detail at this stage aside from those discussed in the Mineral Resource analysis (Section 11). 19 Economic Analysis An economic analysis was not part of this study aside from that discussed in the Mineral Resource analysis (Section 11). 20 Adjacent Properties No proprietary information associated with neighboring properties was used as part of this study. 21 Other Relevant Data and Information MM&A performed a previous evaluation of all the Property in year 2022 for resources effective as of December 31, 2022, for Alpha based on the (SEC) S-K 1300 regulations. Additionally, an audit of all the Property in previous years for Alpha and/or prior owners of the Property based on SEC Industry Guide 7 standards. MM&A utilized these former studies as the basis of an updated study for the TRS dated December 31, 2023. 22 Interpretation and Conclusions Geologic data is of sufficient density and reliability to reasonably support the coal resource estimates documented in this TRS. In summary: > Potentially underground mineable resources totalling 55.48 million in-place tons have been estimated for the licenses of the Property. Of this total, 30.94 million tons are in the measured category, 23.74 million tons are in the indicated category, and 0.80 million tons are in the inferred category. > The total measured and indicated categories contain 54.68 million resource tons representing approximately 99 percent of the coal resource.

Alpha Metallurgical Resources, Inc. Statement of Coal Resources for the Power Mountain Underground Complex in Accordance with United States SEC Standards as of December 31, 2023 Central Appalachian Coal Basin West Virginia, USA MARSHALL MILLER & ASSOCIATES, INC. 39 Coal resources have been estimated as potentially underground mineable without an actual underground mine plan. Since the coal resource for the Property has not been evaluated to the level of a reserve, the extent to which coal resources may be affected by any known or unknown environmental, permitting, legal, title, socio-economic, marketing, political, or other relevant issues, has not undergone the same type of rigorous review afforded coal reserves. Such factors should be considered risks and uncertainties. Similarly, the extent to which the estimate of coal resources may be materially affected by a future mine plan and workforce, requirements for coal preparation/processing, infrastructure, or other relevant factors has also not been reviewed to the level of reserve reporting in this TRS. Such factors should be considered risks and uncertainties. 23 Recommendations It is the opinion of MM&A that the Property contains potentially metallurgical-grade coal resources that warrant further exploration and analysis. Analysis of data for the Property supports the estimate of coal resource defined herein. 24 References Publicly available information from various State and Federal agencies was used where relevant. JOURNEL, A.G., & HUIJBREGTS, CH, J., 1978: Mining Geostatistics, The Blackburn Press Caldwell, New Jersey. 25 Reliance on Information Provided by Registrant A summary of the information provided by Alpha relied upon by MM&A for the purposes of this TRS is provided in Table 25-1. Table 25-1: Information from Registrant Relied Upon by MM&A Category Information Provided by Alpha Report Section Legal Mineral control and surface control rights as shown on maps 3.2, 3.3 Marketing Long-term price forecast used in financial projections 16 Environmental Permitted areas on shown on maps 17 APPENDIX A SUMMARY TABLE

Alpha Metallurgical Resources 2023 SEC Update - Power Mountain Summary of Coal Resource (Short Tons) • Effective December 31, 2023 Appendix A Table 1 Mine/Area Seam Measured Indicated Total Inferred Grand Total Owned Leased Permitted Not Permitted Ash% Sulfur% VM% Power Mountain - Rolling Thunder Powellton 26,437,000 22,308,000 48,745,000 800,000 49,545,000 10,757,000 37,988,000 16,508,000 32,237,000 17 2.5 31 Power Mountain - Jerry Fork Mine Eagle 4,507,000 1,431,000 5,938,000 0 5,938,000 5,938,000 0 5,938,000 0 10 - - Total 30,944,000 23,739,000 54,683,000 800,000 55,483,000 16,695,000 37,988,000 22,446,000 32,237,000 16 - - Note(1): Resource tons are exclusive of reserve tons (have not been converted to reserve). Note (2): Coal resources are reported on a dry basis. Surface moisture and inherent moisture are excluded. Note (3): The Property contains 54.68 million tons (Mt) of dry, in-place measured and indicated coal resources exclusive of reserves as of December 31, 2023. All resources exclusive of reserves are considered a met market. Totals may not add due to rounding. Coal Resource (Dry Tons, In Situ) Quality (Dry Basis) By Reliability Category By Control Type By Permit Status AMR118 Power Mountain Tables (2024-02-06).xlsx • ANR Resource Report • 2/6/2024 Page 1 of 1 APPENDIX B INITIAL ECONOMIC ASSESSMENT RESOURCES EXCLUSIVE OF RESERVES

Alpha Metallurgical Resources, LLC Initial Economic Assessment, Resources Exclusive of Reserves (per Ton) Appendix B: Power Mountain Complex Seam: Eagle Powellton Power Mountain Power Mountain Area: Jerry Fork Rolling Thunder In-Place Resource Tons (not adjusted for Q4 2023 Depletion) 6,892,673 50,009,357 Potentially Recoverable Tons* 2,373,109 15,476,115 Mining Method Deep - CM Deep - CM Assumed Sales Realization at Plant** 130$ 125$ Iniital Capex Estimate to Access Resources*** -$ 5,000,000$ Direct Mining Costs: Labor**** 36.08$ 27.96$ Supplies, Excluding Roof Control 7.68$ 5.95$ Roof Control 9.36$ 7.25$ M&R 13.69$ 10.21$ Power 3.18$ 2.37$ Other 3.18$ 2.37$ Total Direct Cash Costs 73.17$ 56.13$ Transporation, Washing, Environmental & G&A Costs: Coal Prep***** 14.33$ 10.68$ Materials Handling 1.50$ 1.50$ Raw Coal Trucking***** -$ 12.11$ Clean Coal Trucking 1.25$ 1.25$ Enviro****** 0.35$ 0.35$ G&A 3.50$ 3.50$ Total Transporation, Washing, Environmental & G&A Costs: 20.93$ 29.39$ Indirect Cash Costs Royalty 4.20$ 7.50$ Black Lung Excise Tax 0.55$ 0.55$ SMCRA 0.12$ 0.12$ State Severance 6.50$ 6.25$ Property Tax & Insurance 1.00$ 1.00$ Total Indirect Cash Costs 12.37$ 15.42$ Non Cash Costs Amoritiztion of Development Capital -$ 0.32$ Depreciation of Initial Equipment and Sustaining Capital 6.73$ 6.73$ Depletion 1.00$ 1.00$ Total Non Cash 7.73$ 8.06$ Total Cash Cost 106.47$ 100.94$ EBITDA 23.53$ 24.06$ Fully Loaded Cost 114.20$ 109.00$ Fully Loaded P&L 15.80$ 16.00$ Passes Resource Iniital Economic Assessment? YES YES *Potentially recoverable tons are calculated by applying appropriate modifying factors to in-place resource tonnages **Sales relization represents estimated long range sales price. ***No initial capital required where resources are accessible from existing mines. ****Labor rates are driven based off of super section productivities assuming 250 to 300 feet per unit shift per section. *****Processing assumed to occur at Power Mountain plant. ******Environmental costs assumed to include permiting, outfall maintenance, etc. AMR118 Power Mountain Initial Economic Assessment Resources Exclusive of Reserves 12-06-23_sp02062024.xlsx Page 1 of 1 APPENDIX C MAPS

Mountain State Mine Bells Creek Mine No. 1 Cannelton Industries No. 10 Mine 1 Scale In Miles 0 Data Point Location Map 1 Power Mountain Area Rolling Thunder Mine - Powellton Seam Alpha Metallurgical Resource, LLC Boone & Raleigh Counties, West Virginia Coordinate System: West Virginia South State Plane NAD 27 Controlled Underground Reserve / Resource as of 12/31/23 Previous Underground Mining N Resource Exclusive of Reserve / Not Converted to Reserve S E A L S S E A L S TERRY EAGLE COAL CO. HUTCHINSON BR. MINE MSHA ID 46-07899 STATE ID U-3002-90 SEALED AREA SEALED AREA Jerry Fork Eagle Mine Terry Eagle Coal Co. Hutchinson Br. Mine SEALED AREA SE AL ED A RE A 4000 Scale In Feet 0 Data Point Location Map 2 Power Mountain Area Jerry Fork Mine - Eagle Seam Alpha Metallurgical Resource, LLC Boone & Raleigh Counties, West Virginia Coordinate System: West Virginia South State Plane NAD 27 Controlled Underground Reserve / Resource as of 12/31/23 Previous Underground Mining N Resource Exclusive of Reserve / Not Converted to Reserve
EX-97
20
a12312023exhibit97.htm
AMR, INC. EXECUTIVE OFFICER INCENTIVE COMPENSATION RECOUPMENT (CLAWBACK) POLICY
Document
ALPHA METALLURGICAL RESOURCES, INC.
AMENDED AND RESTATED EXECUTIVE OFFICER INCENTIVE COMPENSATION RECOUPMENT (CLAWBACK) POLICY
Effective October 31, 2023
1.Purpose. The purpose of this Alpha Metallurgical Resources, Inc. (the “Company”) Amended and Restated Executive Officer Incentive Compensation Recoupment (Clawback) Policy (this “Policy”) is to enable the Company to recover Erroneously Awarded Compensation from Covered Executive Officers in the event that the Company is required to prepare an Accounting Restatement. This Policy is designed to comply with, and shall be interpreted to be consistent with, Section 954 of the Dodd-Frank Wall Street Reform and Consumer Protection Act of 2010, as codified in Section 10D of the Securities Exchange Act of 1934, as amended (the “Exchange Act”), Rule 10D-1 promulgated under the Exchange Act (“Rule 10D-1”) and Section 303A.14 of the New York Stock Exchange (“NYSE”) Listed Company Manual (the “Listing Standards”). Unless otherwise defined in this Policy, capitalized terms shall have the meaning ascribed to such terms in Section 2.
2.Definitions. As used in this Policy, the following capitalized terms shall have the meanings set forth below.
a.“Accounting Restatement” means an accounting restatement of the Company’s financial statements due to the Company’s material noncompliance with any financial reporting requirement under the securities laws, including any required accounting restatement to correct an error in previously issued financial statements that is material to the previously issued financial statements (i.e., a “Big R” restatement), or to correct an error that is not material to the previously issued financial statements, but that would result in a material misstatement if the error were corrected in the current period or left uncorrected in the current period (i.e., a “little r” restatement).
b.“Accounting Restatement Date” means the earlier to occur of: (i) the date the Board, a committee of the Board, or the officer or officers of the Company authorized to take such action if the Board’s action is not required, concludes, or reasonably should have concluded, that the Company is required to prepare an Accounting Restatement and (ii) the date a court, regulator or other legally authorized body directs the Company to prepare an Accounting Restatement.
c.“Applicable Period” means, with respect to any Accounting Restatement, the three completed fiscal years immediately preceding the Accounting Restatement Date, as well as any transition period (that results from a change in the Company’s fiscal year) within or immediately following those three completed fiscal years (except that a transition period that comprises a period of at least nine months shall count as a completed fiscal year).
d.“Board” means the board of directors of the Company.
e.“Code” means the U.S. Internal Revenue Code of 1986, as amended. Any reference to a section of the Code or regulation thereunder includes such section or regulation, any valid regulation or other official guidance promulgated under such section, and any comparable provision of any future legislation or regulation amending, supplementing or superseding such section or regulation.
f.“Covered Executive Officer” means an individual who is currently or previously served as the Company’s principal executive officer, principal financial officer, principal accounting officer (or, if there is no such accounting officer, the controller), vice-president of the Company in charge of a principal business unit, division or function (such as sales, administration, or finance), an officer who performs (or performed) a policy-making function, or any other person who performs (or performed) similar policy-making functions for the Company or is otherwise determined to be an executive officer of the Company pursuant to Item 4.01(b) of Regulation S-K. An executive officer of the Company’s parent or subsidiary is deemed a “Covered Executive Officer” if the executive officer performs (or performed) such policy making functions for the Company.
g.“Erroneously Awarded Compensation” means, in the event of an Accounting Restatement, the amount of Incentive-Based Compensation previously received that exceeds the amount of Incentive-Based Compensation that otherwise would have been received had it been determined based on the restated amounts in such Accounting Restatement, and must be computed without regard to any taxes paid by the relevant Covered Executive Officer; provided, however, that for Incentive-Based Compensation based on stock price or total stockholder return, where the amount of Erroneously Awarded Compensation is not subject to mathematical recalculation directly from the information in an Accounting Restatement: (i) the amount of Erroneously Awarded Compensation must be based on a reasonable estimate of the effect of the Accounting Restatement on the stock price or total stockholder return upon which the Incentive-Based Compensation was received, and (ii) the Company must maintain documentation of the determination of that reasonable estimate and provide such documentation to the NYSE.
h.“Financial Reporting Measure” means any measure that is determined and presented in accordance with the accounting principles used in preparing the Company’s financial statements and any measure that is derived wholly or in part from such measure. Financial Reporting Measures include, but are not limited to, the following (and any measures derived from the following): the Company’s stock price; total shareholder return; revenues; net income; operating income; profitability of one or more reportable segments; financial ratios (e.g., accounts receivable turnover and inventory turnover rates); earnings before interest, taxes, depreciation and amortization; funds from operations and adjusted funds from operations; liquidity measures (e.g., working capital, operating cash flow); return measures (e.g., return on invested capital, return on assets); earnings measures (e.g., earnings per share); sales, where sales are subject to an Accounting Restatement; revenue per user, or average revenue per user, where revenue is subject to an Accounting Restatement; cost per employee, where cost is subject to an Accounting Restatement; any of such financial reporting measures relative to a peer group, where the Company’s financial reporting measure is subject to an Accounting Restatement; and tax basis income. A Financial Reporting Measure is not required to be presented within the Company’s financial statements or included in a filing with the U.S. Securities and Exchange Commission (the “SEC”) to qualify as a “Financial Reporting Measure.”
i.“Incentive-Based Compensation” means any compensation that is granted, earned or vested based wholly or in part upon the attainment of a Financial Reporting Measure. Incentive-Based Compensation is deemed “received” for purposes of this Policy in the Company’s fiscal period during which the Financial Reporting Measure specified in the Incentive-Based Compensation award is attained, even if the payment or grant of such Incentive-Based Compensation occurs after the end of that period.
3.Administration. This Policy shall be administered by the Compensation Committee of the Board (the “Compensation Committee”). For purposes of this Policy, the Compensation Committee shall be referred to herein as the “Administrator.” The Administrator is authorized to interpret and construe this Policy and to make all determinations necessary, appropriate or advisable for the administration of this Policy, in each case, to the extent permitted under the Listing Standards and in compliance with (or pursuant to an exemption from the application of) Section 409A of the Code. All determinations and decisions made by the Administrator pursuant to the provisions of this Policy shall be final, conclusive and binding on all persons, including the Company, its
affiliates, its stockholders and Covered Executive Officers, and need not be uniform with respect to each person covered by this Policy.
In the administration of this Policy, the Administrator is authorized and directed to consult with the full Board, the Audit Committee of the Board and/or any such other committee of the Board as may be necessary or appropriate as to matters within the scope of such other committee’s responsibility and authority. Subject to any limitation at applicable law, the Administrator may authorize and empower any officer or employee of the Company to take any and all actions necessary or appropriate to carry out the purpose and intent of this Policy (other than with respect to any recovery under this Policy involving such officer or employee). Any action or inaction by the Administrator with respect to a Covered Executive Officer under this Policy in no way limits the Administrator’s decision to act or not to act with respect to any other Covered Executive Officer under this Policy or under any similar policy, agreement or arrangement, nor shall any such action or inaction serve as a waiver of any rights the Company may have against any Covered Executive Officer other than as set forth in this Policy.
4.Application. This Policy applies to all Incentive-Based Compensation received by a person: (a) after beginning service as a Covered Executive Officer; (b) who served as a Covered Executive Officer at any time during the performance period for such Incentive-Based Compensation; (c) while the Company had a listed class of securities on a national securities exchange; and (d) during the Applicable Period. For the avoidance of doubt, Incentive-Based Compensation that is subject to both a Financial Reporting Measure vesting condition and a service-based vesting condition shall be considered received when the relevant Financial Reporting Measure is achieved, even if the Incentive-Based Compensation continues to be subject to the service-based vesting condition.
5.Recovery Requirement. In the event of an Accounting Restatement, the Company must recover Erroneously Awarded Compensation reasonably promptly, in amounts determined pursuant to this Policy. The Company’s obligation to recover Erroneously Awarded Compensation is not dependent on the filing of restated financial statements. Recovery under this Policy with respect to a Covered Executive Officer shall not require the finding of any misconduct by such Covered Executive Officer or such Covered Executive Officer being found responsible for the accounting error leading to an Accounting Restatement. In the event of an Accounting Restatement, the method for recouping Erroneously Awarded Compensation shall be determined by the Administrator in its sole and absolute discretion, to the extent permitted under the Listing Standards and in compliance with (or pursuant to an exemption from the application of) Section 409A of the Code.
Recovery may include, without limitation, (i) reimbursement of all or a portion of any incentive compensation award, (ii) cancellation of incentive compensation awards and (iii) any other method authorized by applicable law or contract.
To the extent that a Covered Executive Officer fails to repay all Erroneously Awarded Compensation to the Company when due, the Company shall take all actions reasonable and appropriate to recover such Erroneously Awarded Compensation from the applicable Covered Executive Officer, subject to the provisions of the immediately following paragraph. The applicable Covered Executive Officer shall be required to reimburse the Company for any and all expenses reasonably incurred (including legal fees) by the Company in recovering such Erroneously Awarded Compensation in accordance with the immediately preceding sentence.
The Company is authorized and directed pursuant to this Policy to recover Erroneously Awarded Compensation in compliance with this Policy unless the Administrator has determined that recovery would be impracticable solely for the following limited reasons, and subject to the following procedural and disclosure requirements:
a.The direct expenses paid to a third party to assist in enforcing this Policy would exceed the amount to be recovered. Before reaching such conclusion, the Administrator must make a reasonable attempt to recover such Erroneously Awarded Compensation, document such reasonable attempt(s) to recover, and provide that documentation to the NYSE;
b.Recovery would violate home country law where that law was adopted prior to November 28, 2022. Before reaching such conclusion, the Administrator must obtain an opinion of home country counsel, acceptable to the NYSE, that recovery would result in such a violation, and must provide such opinion to the NYSE; or
c.Recovery would likely cause an otherwise tax-qualified retirement plan, under which benefits are broadly available to employees of the Company, to fail to meet the requirements of Section 401(a)(13) or Section 411(a) of the Code.
6.Prohibition on Indemnification and Insurance Reimbursement. The Company shall not indemnify any Covered Executive Officer against the loss of any Erroneously Awarded Compensation. Further, the Company shall not pay or reimburse a Covered Executive Officer for the cost of purchasing insurance to cover any such loss. The Company shall also not enter into any agreement or arrangement whereby this Policy would not apply or fail to be enforced against a Covered Executive Officer.
7.Required Policy-Related Filings. The Company shall file all disclosures with respect to this Policy in accordance with the requirements of the federal securities laws, including disclosures required to be included in SEC filings. A copy of this Policy and any amendments hereto shall be posted on the Company’s website and filed as an exhibit to the Company’s annual report on Form 10-K.
8.Acknowledgement. Each Covered Executive Officer shall sign and return to the Company, within thirty (30) calendar days following the later of (i) the effective date of this Policy set forth below or (ii) the date such individual becomes a Covered Executive Officer, the Acknowledgement Form attached hereto as Exhibit A, pursuant to which the Covered Executive Officer agrees to be bound by, and to comply with, the terms and conditions of this Policy.
9.Amendment; Termination. The Administrator may amend this Policy from time to time in its sole and absolute discretion and shall amend this Policy as it deems necessary to reflect the Listing Standards or to comply with (or maintain an exemption from the application of) Section 409A of the Code. The Administrator may terminate this Policy at any time, provided that the termination of this Policy would not cause the Company to violate any federal securities laws, rules promulgated by the SEC or the Listing Standards.
10.Effective Date. This Policy amends and restates the Executive Officer Incentive Compensation Recoupment (Clawback) Policy, dated as of April 28, 2021 (the “2021 Clawback Policy”), and shall be effective as of October 31 (the “Effective Date”). The terms of this Policy shall apply to any Incentive-Based Compensation that is received by Covered Executive Officers on or after the Effective Date, even if such Incentive-Based Compensation was approved, awarded or granted to Covered Executive Officers prior to the Effective Date, and shall not limit any right of recovery with respect to compensation received prior to the Effective Date.
11.Other Recovery Obligations; General Rights. The Administrator intend that this Policy shall be applied to the fullest extent of the law. To the extent that the application of this Policy would provide for recovery of Incentive-Based Compensation that the Company already recovered pursuant to Section 304 of the Sarbanes-Oxley Act or other recovery obligations, any such amount recovered from a Covered Executive Officer will be credited to any recovery required under this Policy in respect of such Covered Executive Officer.
This Policy shall not limit the rights of the Company to take any other actions or pursue other remedies that the Company may deem appropriate under the circumstances and under applicable law, in each case, to the extent permitted under the Listing Standards and in compliance with (or pursuant to an exemption from the application of) Section 409A of the Code.
This Policy is binding and enforceable against all Covered Executive Officers and their beneficiaries, heirs, executors, administrators or other legal representatives.
EXHIBIT A
ALPHA METALLURGICAL RESOURCES, INC.
CLAWBACK POLICY
ACKNOWLEDGEMENT FORM
By signing below, the undersigned acknowledges and confirms that the undersigned has received and reviewed a copy of the ALPHA METALLURGICAL RESOURCES, INC. (the “Company”) Amended and Restated Executive Officer Incentive Compensation Recoupment (Clawback) Policy (the “Policy”).
By signing this Acknowledgement Form, the undersigned acknowledges that the undersigned is and will continue to be subject to the Policy and that the Policy will apply both during and after the undersigned’s employment or service with the Company. Further, by signing below, the undersigned agrees to abide by the terms of the Policy, including, without limitation, by returning any Erroneously Awarded Compensation (as defined in the Policy) to the Company to the extent required by, and in a manner consistent with, the Policy and notwithstanding anything to the contrary in any other policy or agreement to which the undersigned is subject or party.
|
|
|
|
|
|
|
EXECUTIVE OFFICER |
|
|
|
Signature |
|
|
|
Print Name |
|
|
|
Date |