UNITED STATES SECURITIES AND EXCHANGE COMMISSION
WASHINGTON DC 20549
FORM 8-K
CURRENT REPORT
PURSUANT TO SECTION 13 OR 15(d) OF THE
SECURITIES EXCHANGE ACT OF 1934
Date of Report (Date of earliest event reported) November 19, 2025
| CONSUMER PORTFOLIO SERVICES, INC. | ||
| (Exact Name of Registrant as Specified in Charter) |
| CALIFORNIA | 1-11416 | 33-0459135 | ||
|
(State or Other Jurisdiction of Incorporation) |
(Commission File Number) |
(IRS Employer Identification No.) |
| 3800 Howard Hughes Pkwy, Suite 1400, Las Vegas, NV 89169 | ||
| (Address of Principal Executive Offices) (Zip Code) |
Registrant's telephone number, including area code (949) 753-6800
| Not Applicable | ||
| (Former name or former address, if changed since last report) |
Check the appropriate box below if the Form 8-K filing is intended to simultaneously satisfy the filing obligation of the registrant under any of the following provisions (see General Instruction A.2. below):
☐ Written communications pursuant to Rule 425 under the Securities Act (17 CFR 230.425)
☐ Soliciting material pursuant to Rule 14a-12 under the Exchange Act (17 CFR 240.14a-12)
☐ Pre-commencement communications pursuant to Rule 14d-2(b) under the Exchange Act (17 CFR 240.14d-2(b))
☐ Pre-commencement communications pursuant to Rule 13e-4(c) under the Exchange Act (17 CFR 240.13e-4(c))
Securities registered pursuant to Section 12(b) of the Act:
| Title of each class | Trading Symbol(s) | Name of each exchange on which registered |
| Common Stock, no par value | CPSS | The Nasdaq Stock Market LLC (Global Market) |
Indicate by check mark whether the registrant is an emerging growth company as defined in Rule 405 of the Securities Act of 1933 (§230.405 of this chapter) or Rule 12b-2 of the Securities Exchange Act of 1934 (§240.12b-2 of this chapter).
Emerging growth company ☐
If an emerging growth company, indicate by check mark if the registrant has elected not to use the extended transition period for complying with any new or revised financial accounting standards provided pursuant to Section 13(a) of the Exchange Act. ☐
|
|
ITEM 7.01. REGULATION FD DISCLOSURE.
We are today making available one presentation consisting of 19 slides. A copy is attached as an exhibit. Although the exhibit is an update of similar presentations made available from time to time as an exhibit to a report on Form 8-K, we are not undertaking to update further any of the information that is contained in the attached presentation. The same presentation furnished as an exhibit to this report will be made available on our website, at this address:
http://ir.consumerportfolio.com/events-and-presentations/presentations
We routinely post important information, including news releases and reports to the U.S. Securities and Exchange Commission, on our website.
The information furnished in this report shall not be deemed “filed” for purposes of Section 18 of the Securities Exchange Act of 1934, as amended.
ITEM 9.01. FINANCIAL STATEMENTS AND EXHIBITS.
Neither financial statements nor pro forma financial information are filed with this report.
(d) Exhibits
One exhibit is attached:
| 99.1 | Company Summary as of September 30, 2025 |
| 104 | Cover Page Interactive Data File (embedded within the Inline XBRL document). |
|
|
SIGNATURES
Pursuant to the requirements of the Securities Exchange Act of 1934, as amended, the registrant has duly caused this report to be signed on its behalf by the undersigned, thereunto duly authorized.
| CONSUMER PORTFOLIO SERVICES, INC. | |
| Dated: November 19, 2025 | By: /s/ Denesh Bharwani |
|
Denesh Bharwani Executive Vice President and Chief Financial Officer Signing on behalf of the registrant |
|
|
Exhibit 99.1

The Subprime Source Since 1991 September 2025 Investor Presentation SAFE HARBOR STATEMENT Forward - looking statements in this presentation include the Company’s expectations of growth and the Company's recorded figures representing allowances for remaining expected lifetime credit losses, its estimates of fair value (most significantly for its receivables accounted for at fair value), its provision for credit losses, its entries offsetting the preceding, and figures derived from any of the preceding. In each case, such figures are forward - looking statements because they are dependent on the Company’s estimates of losses to be incurred in the future. The accuracy of such statements may be adversely affected by various factors, which include the following: possible increased delinquencies; repossessions and losses on retail installment contracts; incorrect prepayment speed and/or discount rate assumptions; possible unavailability of qualified personnel, which could adversely affect the Company’s ability to service its portfolio; possible increases in the rate of consumer bankruptcy filings, which could adversely affect the Company’s rights to collect payments from its portfolio; other changes in government regulations affecting consumer credit; possible declines in the market price for used vehicles, which could adversely affect the Company’s realization upon repossessed vehicles; economic conditions in geographic areas in which the Company's business is concentrated; and our ability to generate sufficient operating and financing cash flows. Any or all of such factors also may affect the Company’s future financial results, as to which there can be no assurance. Any implication that the results of the most recently completed quarter are indicative of future results is disclaimed, and the reader should draw no such inference. Factors such as those identified above in relation to losses to be incurred in the future may affect future performance. 2 COMPANY OVERVIEW Consumer Portfolio Services specializes in purchasing and servicing automobile contracts originated by licensed motor vehicle dealers in the sale of new and used automobiles, light trucks and passenger vans.
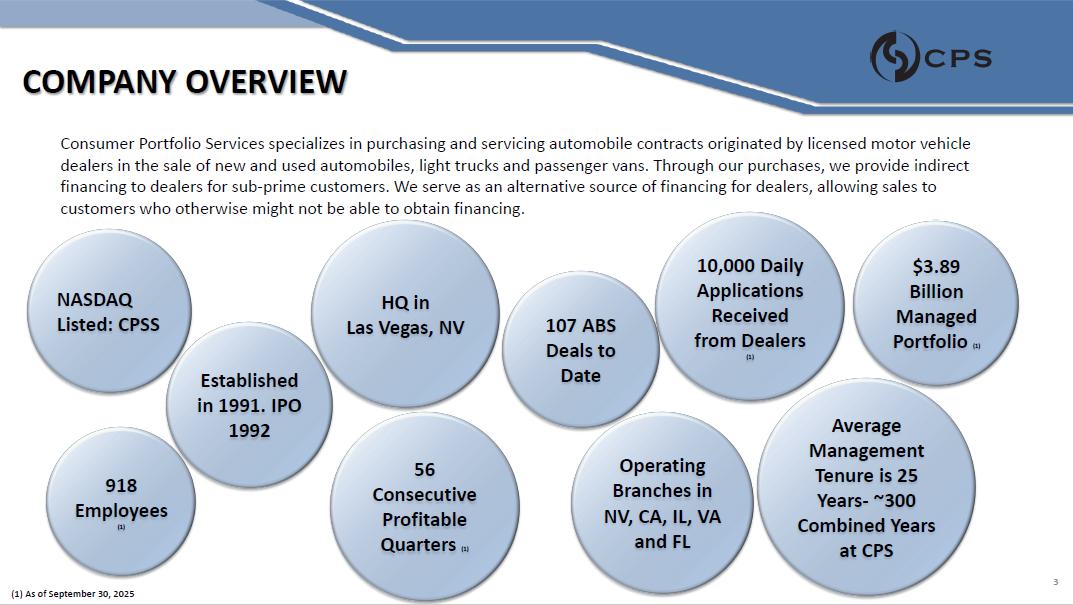
Through our purchases, we provide indirect financing to dealers for sub - prime customers. We serve as an alternative source of financing for dealers, allowing sales to customers who otherwise might not be able to obtain financing. $3.89 Billion Managed Portfolio (1) NASDAQ Listed: CPSS Average Management Tenure is 25 Years - ~300 Combined Years at CPS HQ in Las Vegas, NV Operating Branches in NV, CA, IL, VA and FL 918 Employees (1) 10,000 Daily Applications Received from Dealers (1) Established in 1991.
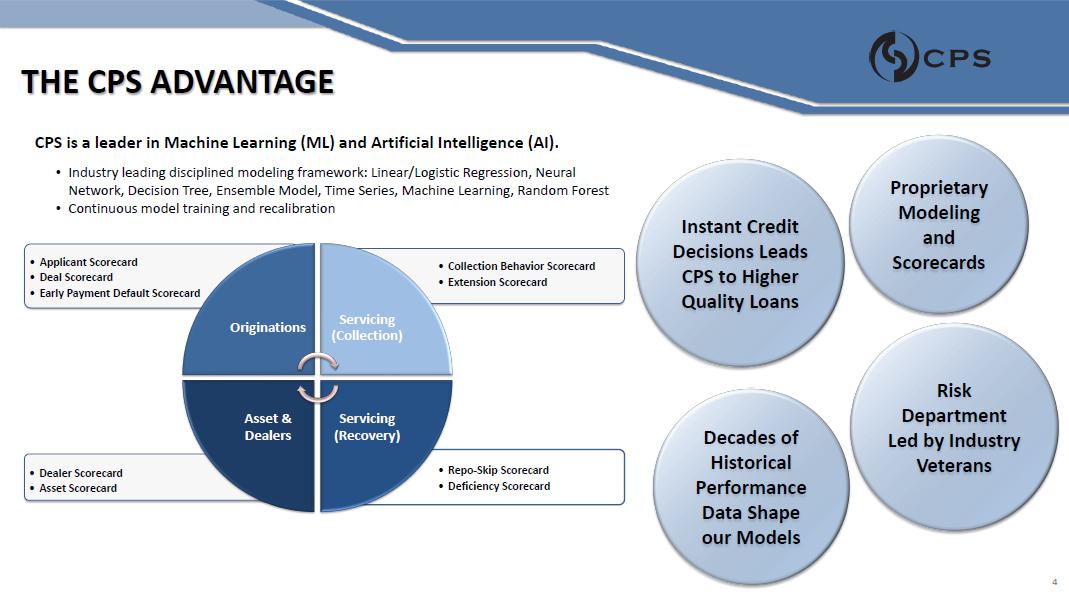
IPO 1992 56 Consecutive Profitable Quarters (1) 107 ABS Deals to Date (1) As of September 30, 2025 3 THE CPS ADVANTAGE • Repo - Skip Scorecard • Deficiency Scorecard • Dealer Scorecard • Asset Scorecard • Collection Behavior Scorecard • Extension Scorecard • Applicant Scorecard • Deal Scorecard • Early Payment Default Scorecard Originations Servicing (Collection) Servicing (Recovery) Asset & Dealers CPS is a leader in Machine Learning (ML) and Artificial Intelligence (AI). • Industry leading disciplined modeling framework: Linear/Logistic Regression, Neural Network, Decision Tree, Ensemble Model, Time Series, Machine Learning, Random Forest • Continuous model training and recalibration Proprietary Modeling and Scorecards Instant Credit Decisions Leads CPS to Higher Quality Loans Risk Department Led by Industry Veterans Decades of Historical Performance Data Shape our Models 4 LEADERSHIP Charles “Brad” Bradley CEO, Chairman of the Board • CEO since 1992 • Chairman of the Board since 2001 • 34 years at CPS Mike Lavin President, COO, CLO • President since 2022 • COO since 2019.

CLO since 2014 • 24 Years at CPS Danny Bharwani CFO • CFO since 2022 • 28 years at CPS CPS’ senior management team consists of 12 executives that are led by Brad, Mike and Danny. Each has significant industry experience and, on average, 25 years with CPS. Combined, senior management has over 300 years of auto lending experience just at CPS . 5 MARKET • $1.6 trillion auto loans outstanding at Q2 2025 (1) • ~16% of auto financings in Q2 2025 were sub - prime (1) Large Total Addressable Market (TAM) • Capital - intensive • Highly regulated industry High Barrier to Entry • Few dominant players • Compete on rates and fees Small, Fragmented Market Dynamics Footprint Powered by Bing © GeoNames, Microsoft, TomTom (1) According to Experian Automotive (2) As of September 30, 2025 6 6% 7% 10% 6% 5% • Highest volume originating states for CPS (2) • Contracts purchased in 47 states (2)

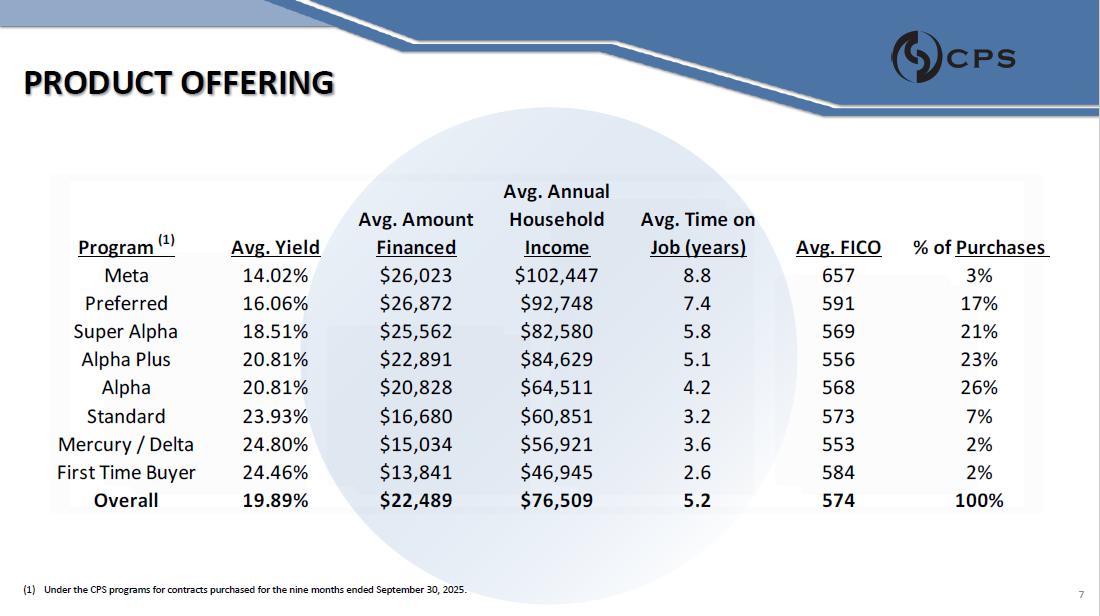
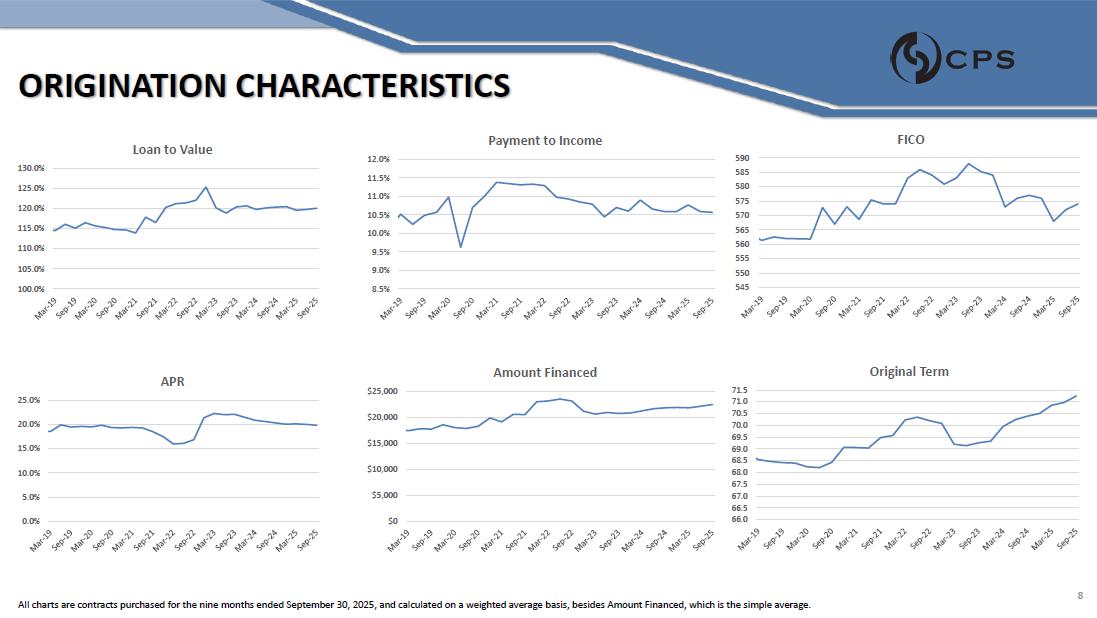
PRODUCT OFFERING Meta 14.02% $102,447 3% Preferred 16.06% $92,748 17% Super Alpha 18.51% $82,580 21% Alpha Plus 20.81% $84,629 23% Alpha 20.81% $64,511 26% Standard 23.93% $60,851 7% Mercury / Delta 24.80% $56,921 2% First Time Buyer 24.46% $46,945 2% Overall 19.89% $25,562 $22,891 $20,828 $16,680 $15,034 $13,841 $22,489 $76,509 591 569 556 568 573 553 584 574 100% % of Purchases Avg. Yield Program (1) Avg. Amount Financed $26,023 $26,872 Avg. Annual Household Income Avg. Time on Job (years) 8.8 7.4 5.8 5.1 4.2 3.2 3.6 2.6 5.2 Avg. FICO 657 (1) Under the CPS programs for contracts purchased for the nine months ended September 30, 2025. 7 ORIGINATION CHARACTERISTICS 100.0% 105.0% 110.0% 115.0% 120.0% 125.0% 130.0% Loan to Value 8.5% 9.0% 9.5% 10.0% 10.5% 11.0% 11.5% 12.0% Payment to Income 590 585 580 575 570 565 560 555 550 545 FICO 0.0% 5.0% 10.0% 15.0% 20.0% 25.0% APR $0 $5,000 $10,000 $15,000 $20,000 $25,000 Amount Financed 71.5 71.0 70.5 70.0 69.5 69.0 68.5 68.0 67.5 67.0 66.5 66.0 Original Term 8 All charts are contracts purchased for the nine months ended September 30, 2025, and calculated on a weighted average basis, besides Amount Financed, which is the simple average.
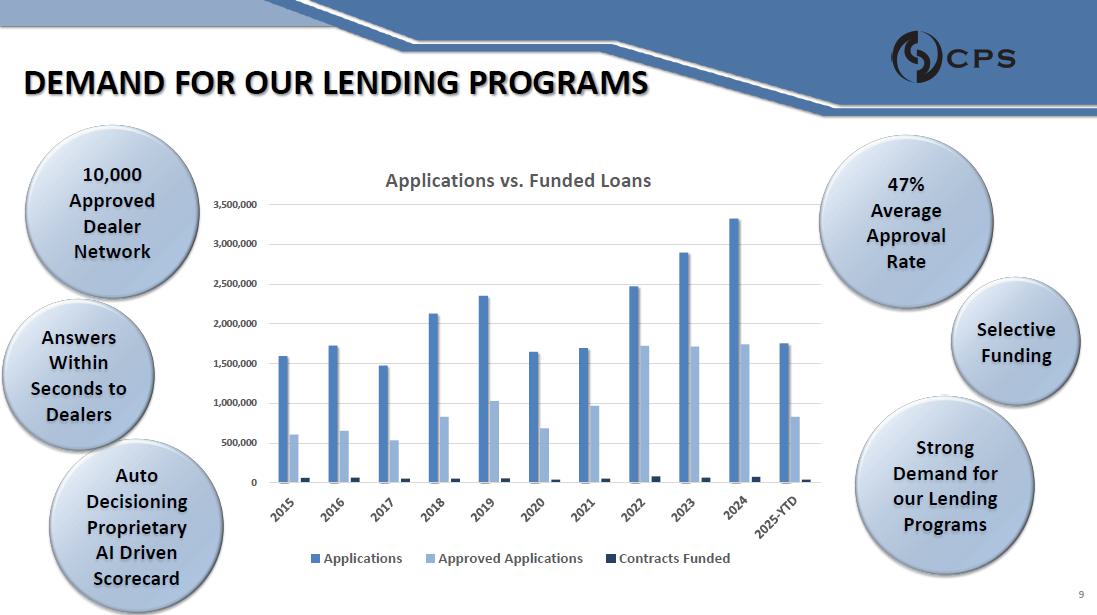
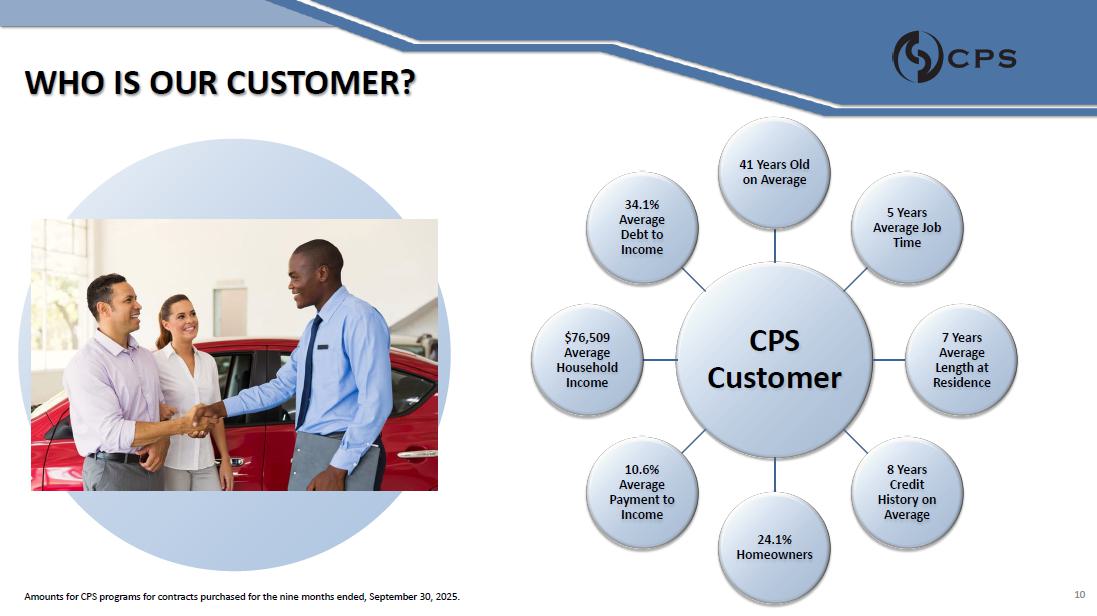
DEMAND FOR OUR LENDING PROGRAMS 0 500,000 1,000,000 1,500,000 2,000,000 2,500,000 3,000,000 3,500,000 Applications vs. Funded Loans Applications Approved Applications Contracts Funded 47% Average Approval Rate 10,000 Approved Dealer Network Strong Demand for our Lending Programs Auto Decisioning Proprietary AI Driven Scorecard Selective Funding Answers Within Seconds to Dealers 9 WHO IS OUR CUSTOMER? CPS Customer 41 Years Old on Average 5 Years Average Job Time 7 Years Average Length at Residence 8 Years Credit History on Average 24.1% Homeowners 10.6% Average Payment to Income $76,509 Average Household Income 34.1% Average Debt to Income 10 Amounts for CPS programs for contracts purchased for the nine months ended, September 30, 2025.

WHAT DO OUR CUSTOMERS DRIVE? Certified Pre - Owned, 18% Pre - Owned, 72% VEHICLE TYPE New, 10% Factory Franchised, 71% ORIGINATING DEALERSHIP Independent, 29% Domestic, 49% 11 Charts show data of CPS programs for contracts purchased for the six months ended September 30, 2025. Imports , 51% VEHICLE MAKE PORTFOLIO PERFORMANCE Data shown is CNL performance by origination quarter, and as of September 30, 2025.
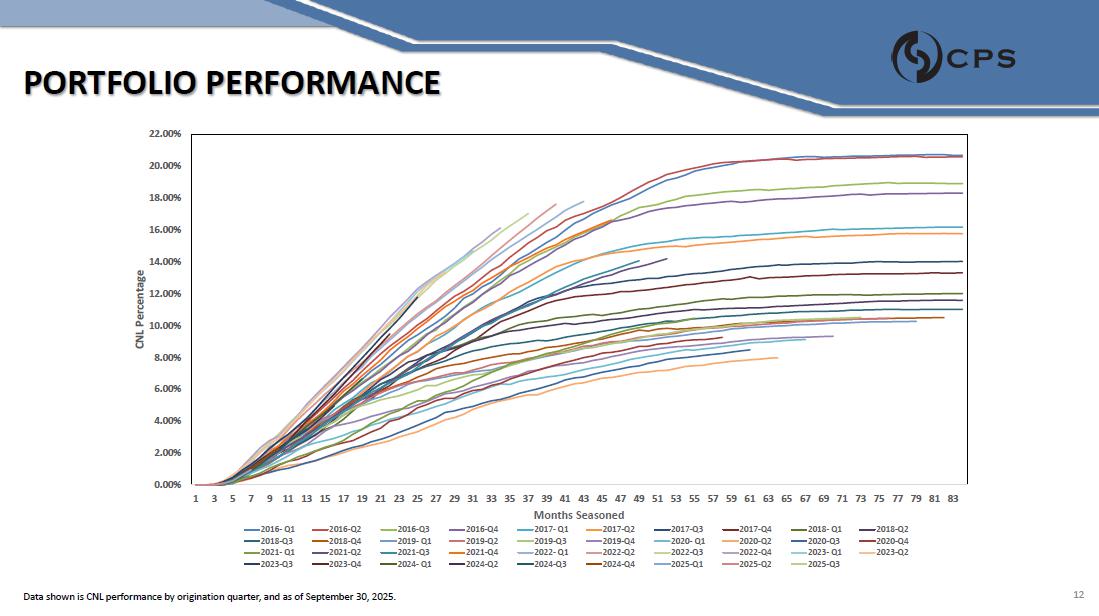
12 22.00% 20.00% 18.00% 16.00% 14.00% 12.00% 10.00% 8.00% 6.00% 4.00% 2.00% 0.00% CNL Percentage 2018 - Q2 2020 - Q4 2023 - Q2 1 3 5 7 9 11 13 15 17 19 21 23 25 27 29 31 33 35 37 39 41 43 45 47 49 51 53 55 57 59 61 63 65 67 69 71 73 75 77 79 81 83 Months Seasoned 2016 - Q1 2018 - Q3 2021 - Q1 2023 - Q3 2016 - Q2 2018 - Q4 2021 - Q2 2023 - Q4 2016 - Q3 2019 - Q1 2021 - Q3 2024 - Q1 2016 - Q4 2019 - Q2 2021 - Q4 2024 - Q2 2017 - Q1 2019 - Q3 2022 - Q1 2024 - Q3 2017 - Q2 2019 - Q4 2022 - Q2 2024 - Q4 2017 - Q3 2020 - Q1 2022 - Q3 2025 - Q1 2017 - Q4 2020 - Q2 2022 - Q4 2025 - Q2 2018 - Q1 2020 - Q3 2023 - Q1 2025 - Q3 ECONOMIC MODEL Interest Income September 30, 2025 September 30, 2024 11.4% 11.4% December 31, 2024 11.4% Mark to Fin.
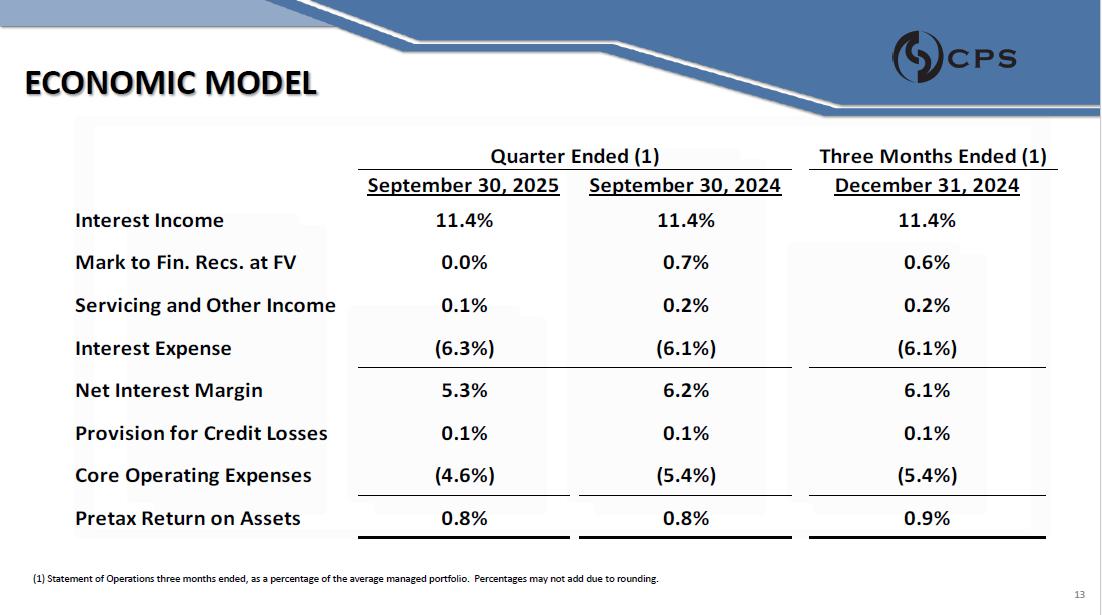
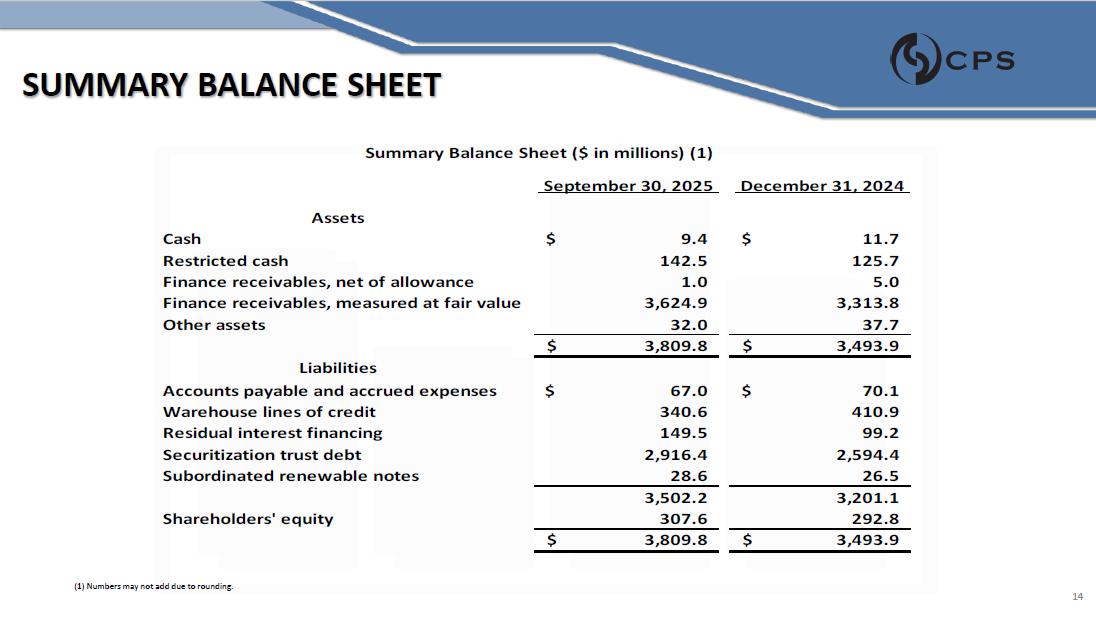
Recs. at FV 0.6% Servicing and Other Income 0.2% Interest Expense (6.1%) Net Interest Margin 6.1% Provision for Credit Losses 0.1% Core Operating Expenses (5.4%) Pretax Return on Assets 0.0% 0.7% 0.1% 0.2% (6.3%) (6.1%) 5.3% 6.2% 0.1% 0.1% (4.6%) (5.4%) 0.8% 0.8% 0.9% Quarter Ended (1) Three Months Ended (1) (1) Statement of Operations three months ended, as a percentage of the average managed portfolio. Percentages may not add due to rounding. 13 SUMMARY BALANCE SHEET September 30, 2025 December 31, 2024 Assets Cash $ $ Restricted cash 11.7 125.7 Finance receivables, net of allowance 5.0 Finance receivables, measured at fair value 3,313.8 Other assets 9.4 142.5 1.0 3,624.9 32.0 37.7 3,809.8 $ 3,493.9 $ Liabilities Accounts payable and accrued expenses $ 70.1 $ Warehouse lines of credit 410.9 Residual interest financing 99.2 Securitization trust debt 2,594.4 Subordinated renewable notes 67.0 340.6 149.5 2,916.4 28.6 26.5 3,201.1 Shareholders' equity 3,502.2 307.6 292.8 3,809.8 $ 3,493.9 $ Summary Balance Sheet ($ in millions) (1) (1) Numbers may not add due to rounding . 14
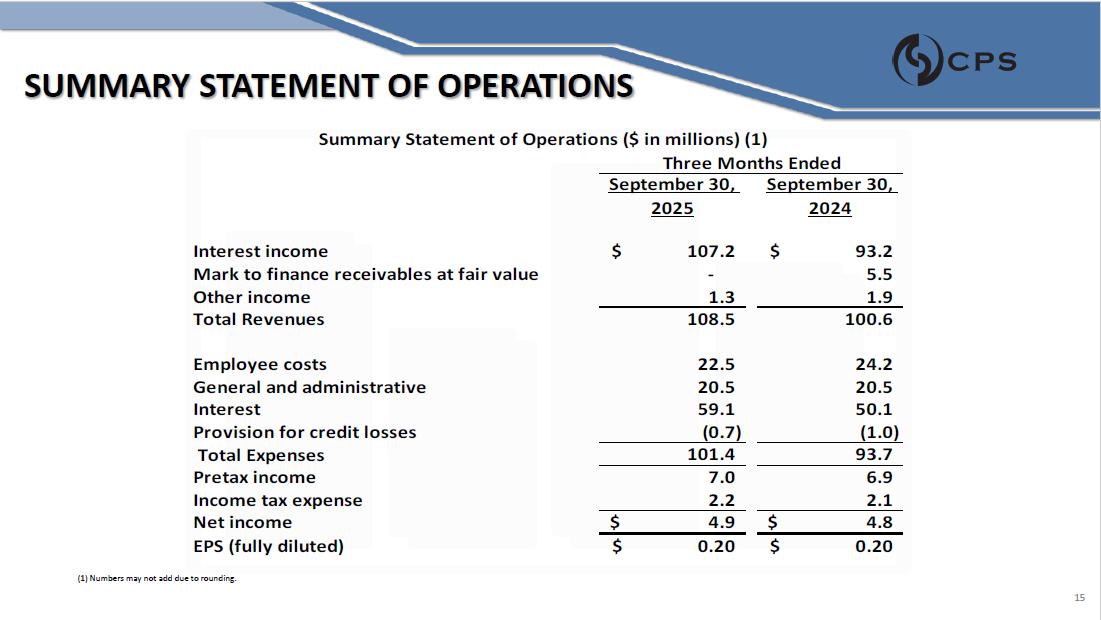
SUMMARY STATEMENT OF OPERATIONS (1) Numbers may not add due to rounding. September 30, 2025 September 30, 2024 Interest income 107.2 $ Mark to finance receivables at fair value - Other income 1.3 $ 93.2 5.5 1.9 Total Revenues 108.5 100.6 Employee costs 22.5 24.2 General and administrative 20.5 20.5 Interest 59.1 50.1 Provision for credit losses (0.7) (1.0) Total Expenses 101.4 93.7 Pretax income 7.0 Income tax expense 2.2 6.9 2.1 Net income $ 4.8 4.9 $ EPS (fully diluted) 0.20 $ 0.20 $ Summary Statement of Operations ($ in millions) (1) Three Months Ended 15 SELECTED FINANCIAL DATA ($ in millions) September 30, 2025 September 30, 2024 Auto contract purchases 391.1 Total portfolio 3,760.3 Risk - adjusted margin (1) 50.0 $ $ $ Core operating expenses (2) $ Amount 43.0 $ % of avg.
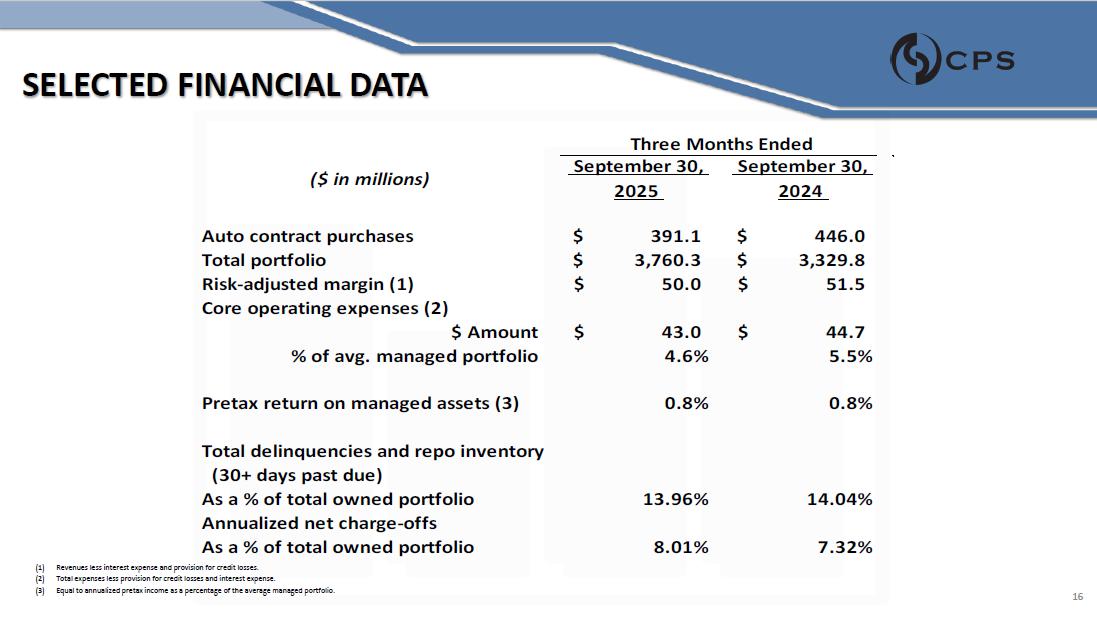
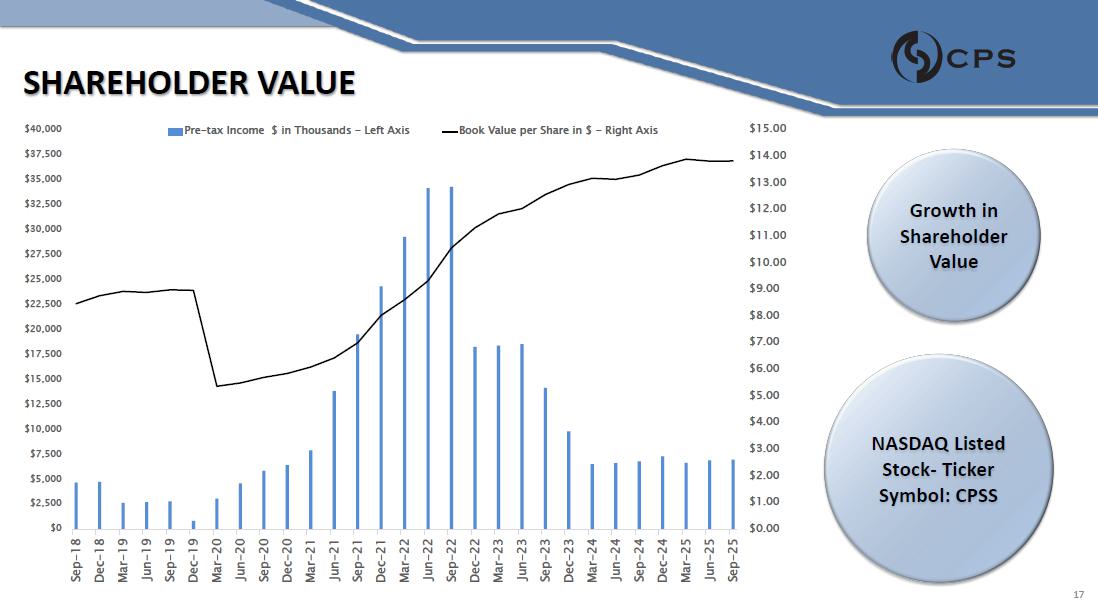
managed portfolio 4.6% $ 446.0 $ 3,329.8 $ 51.5 $ 44.7 5.5% Pretax return on managed assets (3) 0.8% 0.8% Total delinquencies and repo inventory (30+ days past due) As a % of total owned portfolio 13.96% 14.04% Annualized net charge - offs As a % of total owned portfolio 8.01% 7.32% Three Months Ended Total expenses less provision for credit losses and interest expense. (1) Revenues less interest expense and provision for credit losses. (2) (3) Equal to annualized pretax income as a percentage of the average managed portfolio . 16 SHAREHOLDER VALUE Growth in Shareholder Value NASDAQ Listed Stock - Ticker Symbol: CPSS $0 $2,500 $5,000 $7,500 $10,000 $12,500 $15,000 $17,500 $20,000 $22,500 $25,000 $27,500 $30,000 $32,500 $35,000 $15.00 Book Value per Share in $ - Right Axis $ in Thousands - Left Axis Pre - tax Income $40,000 $14.00 $37,500 Sep - 18 Dec - 18 Mar - 19 Jun - 19 Sep - 19 Dec - 19 Mar - 20 Jun - 20 Sep - 20 Dec - 20 Mar - 21 Jun - 21 Sep - 21 Dec - 21 Mar - 22 Jun - 22 Sep - 22 Dec - 22 Mar - 23 Jun - 23 Sep - 23 Dec - 23 Mar - 24 Jun - 24 Sep - 24 Dec - 24 Mar - 25 Jun - 25 Sep - 25 $0.00 $1.00 $2.00 $3.00 $4.00 $5.00 $6.00 $7.00 $8.00 $9.00 $10.00 $11.00 $12.00 $13.00 17

INVESTMENT OUTLOOK Continuous Growth Strong macroeconomic factors AI - driven Originations Scorecard Strong Fundamentals • Originations volumes are driving top line revenue growth • Managed portfolio is at largest amount in company history • Shareholder continues to increase • Raised Wtd. Avg APRs in originations from 17.72% in Dec 2022 to 19.89% in September 2025 • Favorable demand for used vehicles • Stable delinquencies • Lower borrowing rates on our credit facilities • Improves efficiency and customer satisfaction • Upcoming AI Scorecard Refresh (refresh every 18 - 24 months) • Industry leading technology in all facets of our business • Decreased leverage on the portfolio puts CPS in a position to grow faster than competitors • Increasing shareholder equity - highest in company history • Decreasing core operating expenses, while portfolio grows Investor Relations Contact Mike Lavin, President/ COO/ CLO MichaelL@consumerportfolio.com 18 REFERENCE TO PUBLIC REPORTS Any person considering an investment in securities issued by CPS is urged to review the materials filed by CPS with the U.S. Securities and Exchange Commission ("Commission"). Such materials may be found by inquiring of the Commission‘s EDGAR search page www.sec.gov/edgar/searchedgar/companysearch.html using CPS's ticker symbol, which is "CPSS." Risk factors that should be considered are described in Item 1A, “Risk Factors," of CPS’s most recent annual report on Form 10 - K and subsequent reports on Form 10 - Q, which reports are on file with the Commission and available for review at the Commission's website. Such description of risk factors is incorporated herein by reference. 19
