UNITED STATES
SECURITIES AND EXCHANGE COMMISSION
Washington, D.C. 20549
FORM 8-K
CURRENT REPORT
Pursuant to Section 13 or 15(d) of the
Securities Exchange Act of 1934
Date of Report (Date of earliest event reported): February 19, 2025
INSEEGO CORP.
(Exact Name of Registrant as Specified in Charter)
| Delaware | 001-38358 | 81-3377646 | ||
|
(State or other jurisdiction of incorporation) |
(Commission File Number) |
(IRS Employer Identification No.) |
9710 Scranton Road, Suite 200
San Diego, California 92121
(Address of principal executive offices) (Zip Code)
(858) 812-3400
(Registrant’s telephone number, including area code)
Not Applicable
(Former name or former address, if changed since last report)
Check the appropriate box below if the Form 8-K filing is intended to simultaneously satisfy the filing obligation of the registrant under any of the following provisions:
| ☐ | Written communications pursuant to Rule 425 under the Securities Act (17 CFR 230.425) |
| ☐ | Soliciting material pursuant to Rule 14a-12 under the Exchange Act (17 CFR 240.14a-12) |
| ☐ | Pre-commencement communications pursuant to Rule 14d-2(b) under the Exchange Act (17 CFR 240.14d-2(b)) |
| ☐ | Pre-commencement communications pursuant to Rule 13e-4(c) under the Exchange Act (17 CFR 240.13e-4(c)) |
| Title of each class | Trading Symbol(s) | Name of each exchange on which registered |
Common Stock, par value $0.001 per share |
INSG | Nasdaq Global Select Market |
Indicate by check mark whether the registrant is an emerging growth company as defined in Rule 405 of the Securities Act of 1933 (§230.405 of this chapter) or Rule 12b-2 of the Securities Exchange Act of 1934 (§240.12b-2 of this chapter).
Emerging growth company ☐
If an emerging growth company, indicate by check mark if the registrant has elected not to use the extended transition period for complying with any new or revised financial accounting standards provided pursuant to Section 13(a) of the Exchange Act. ☐
|
|
| Item 2.02. | Results of Operations and Financial Condition. |
On February 19, 2025, Inseego Corp. (the “Company”) issued a press release containing preliminary financial results for the year and quarter ended December 31, 2024. On February 19, 2025, the Company also posted an investor presentation to its website at https://investor.inseego.com/events-presentations (the “Investor Presentation”). The text of the press release and Investor Presentation are furnished as Exhibits 99.1 and 99.2 to this Form 8-K and incorporated herein by reference.
The information in “Item 2.02 Results of Operations and Financial Condition” of this Current Report on Form 8-K and in Exhibits 99.1 and 99.2, attached hereto, is furnished and shall not be deemed “filed” for purposes of Section 18 of the Securities Exchange Act of 1934, as amended (the “Exchange Act”), or otherwise subject to the liabilities of that section. It may be incorporated by reference in a filing under the Exchange Act or the Securities Act of 1933, as amended (the “Securities Act”), only if such subsequent filing specifically references such disclosure in this Form 8-K.
| Item 9.01. | Financial Statements and Exhibits. |
| (d) Exhibits. | ||
| 99.1 | Press Release dated February 19, 2025, containing Inseego Corp. preliminary financial results for the year and quarter ended December 31, 2024. | |
| 99.2 | Investor Presentation, dated February 19, 2025. | |
| 104 | Cover Page Interactive Data File (embedded within the Inline XBRL document). | |
|
|
SIGNATURE
Pursuant to the requirements of the Securities Exchange Act of 1934, the registrant has duly caused this Current Report on Form 8-K to be signed on its behalf by the undersigned hereunto duly authorized.
| INSEEGO CORP. | |||
| Date: February 19, 2025 | By: | /s/ Steven Gatoff | |
| Name: Steven Gatoff | |||
| Title: Chief Financial Officer | |||
|
|
Exhibit 99.1

Inseego Reports Fourth Quarter and Full Year 2024 Financial Results
Q4 2024 revenue of $48.1 million
Q4 2024 positive Adjusted EBITDA of $5.4 million and GAAP Operating Income of $1.8 million
Completed sale of telematics business for $52.7 million in cash
Completed convertible debt restructurings with material reductions in debt
SAN DIEGO—February 19, 2025—Inseego Corp. (Nasdaq: INSG) (the “Company”), a technology leader in 5G mobile and fixed wireless solutions for mobile network operators, Fortune 500 enterprises and SMBs, today reported its results for the fourth quarter and full year ended December 31, 2024.
“My first weeks at Inseego have been very positive, and we are already making progress towards positioning the company as the wireless broadband partner of choice within the wireless ecosystem,” stated Juho Sarvikas, Chief Executive Officer of Inseego. “Our fourth-quarter operational performance delivered encouraging results, reflecting strength in both revenue and Adjusted EBITDA. While we see some near-term headwinds in the first quarter, I am confident that we are on track to deliver year-on-year growth in 2025 as we focus on expanding both our solution portfolio and customer base. Together, as a team, we remain committed to driving long-term growth to create stockholder value."
“We continue to be focused on driving stockholder value and were pleased to close both the restructuring of our outstanding convertible notes and the sale of our Telematics business, receiving $52 million in cash in the quarter,” Steven Gatoff, Chief Financial Officer of Inseego, commented. "These transactions right-sized the Company’s capital structure and provided meaningful additional liquidity and flexibility as we move forward to develop new products and drive growth.”
Financial Highlights
| • | Revenue for Q4 2024 was $48.1 million; full year 2024 revenue was $191.2 million. | |
| • | Adjusted EBITDA for Q4 2024 was $5.4 million; full year 2024 Adjusted EBITDA was $20.5 million. | |
| • | GAAP gross margin for Q4 2024 was 37.3%; full year 2024 GAAP gross margin was 36.0%. |
|
|
Capital Structure Improvements
| • | On November 6, 2024, the Company completed its capital structure management initiative and material debt reduction by exchanging $91.5 million of principal value of the Company’s 3.25% convertible notes due 2025 for long-term debt and equity; the Company has now repurchased or exchanged at a discount approximately $147 million, or 91% of aggregate principal amount, of the $162 million of the convertible notes that were outstanding as of December 31, 2023. See separate press release issued on November 12, 2024 for further details. |
Business Highlights
| • | Completed the sale of the Company’s Telematics business for $52.7 million in cash. | |
| • | Appointed Juho Sarvikas as the new Chief Executive Officer and Board member. | |
| • | Achieved highest quarterly MiFi X PRO sales ever with one major North American carrier who continues to see great success with our device especially with public sector customers. | |
| • | Received award letter from a large service provider for our next generation indoor FWA device. | |
| • | Ranged MiFi X PRO with a global communications solutions provider for business and government agencies. | |
| • | Executed large FWA order with a major Internet Service Provider who uses Inseego devices to deliver ultra-fast, SLA-guaranteed, symmetrical fixed wireless access to businesses. | |
| • | Completed transaction with a global medical device manufacturer to improve patient outcomes by providing reliable wireless connectivity to automatic external defibrillators. | |
| • | Selected in two competitive opportunities to be the hardware supplier to large nonprofit telecom companies that provide affordable broadband services to bridge the digital divide. |
Q1 2025 Guidance
| • | Total revenue in the range of $30.0 million to $33.0 million. | |
| • | Adjusted EBITDA in the range of $2.0 million to $3.0 million. |
|
|
Conference Call Information
Inseego will host a conference call and live webcast today at 5:00 p.m. ET. To access the conference call:
| • | Online, visit https://investor.inseego.com/events-presentations | |
| • | Those without internet access may dial in by calling: |
| ◦ | In the United States, call 1-844-282-4463 | |
| ◦ | International parties can access the call at 1-412-317-5613 |
An audio replay of the conference call will be available one hour after the call through March 5, 2025. To hear the replay, parties in the United States may call 1-877-344-7529 and enter access code 9063175 followed by the # key. International parties may call 1-412-317-0088. In addition, the Inseego Corp. press release will be accessible from the Company's website before the conference call begins.
|
|
About Inseego Corp.
Inseego Corp. (Nasdaq: INSG) is the industry leader in 5G Enterprise cloud WAN solutions, with millions of end customers and thousands of enterprise and SMB customers on its 4G, 5G, and cloud platforms. Inseego’s 5G Edge Cloud combines the industry’s best 5G technology, rich cloud networking features, and intelligent edge applications. Inseego powers new business experiences by connecting distributed sites and workforces, securing enterprise data, and improving business outcomes with intelligent operational visibility---all over a 5G network. For more information on Inseego, visit www.inseego.com #Putting5GtoWork
©2025. Inseego Corp. All rights reserved. MiFi and the Inseego name and logo are registered trademarks of Inseego Corp. Other company, product, or service names mentioned herein are the trademarks of their respective owners.
Cautionary Note Regarding Forward-Looking Statements
Some of the information presented in this news release may constitute forward-looking statements within the meaning of the Private Securities Litigation Reform Act of 1995. In this context, forward-looking statements often address expected future business and financial performance and often contain words such as “may,” “estimate,” “anticipate,” “believe,” “expect,” “intend,” “plan,” “project,” “will” and similar words and phrases indicating future results. The information presented in this news release related to our future business outlook, the future demand for our products, and other statements that are not purely historical facts are forward-looking. These forward-looking statements are based on management’s current expectations, assumptions, estimates, and projections. They are subject to significant risks and uncertainties that could cause results to differ materially from those anticipated in such forward-looking statements. We, therefore, cannot guarantee future results, performance, or achievements. Actual results could differ materially from our expectations.
Factors that could cause actual results to differ materially from the Company’s expectations include: (1) the Company’s dependence on a small number of customers for a substantial portion of our revenues; (2) the future demand for wireless broadband access to data and asset management software and services and our ability to accurately forecast; (3) the growth of wireless wide-area networking and asset management software and services; (4) customer and end-user acceptance of the Company’s current product and service offerings and market demand for the Company’s anticipated new product and service offerings; (5) our ability to develop sales channels and to onboard channel partners; (6) increased competition and pricing pressure from participants in the markets in which the Company is engaged; (7) dependence on third-party manufacturers and key component suppliers worldwide; (8) the impact of fluctuations of foreign currency exchange rates; (9) the impact of supply chain challenges on our ability to source components and manufacture our products; (10) unexpected liabilities or expenses; (11) the Company’s ability to introduce new products and services in a timely manner, including the ability to develop and launch 5G products at the speed and functionality required by our customers; (12) litigation, regulatory and IP developments related to our products or components of our products; (13) the Company’s ability to raise additional financing when the Company requires capital for operations or to satisfy corporate obligations; (14) the Company’s plans and expectations relating to acquisitions, divestitures, strategic relationships, international expansion, software and hardware developments, personnel matters, and cost containment initiatives, including restructuring activities and the timing of their implementations; (15) the global semiconductor shortage and any related price increases or supply chain disruptions, (16) the potential impact of COVID-19 or other global public health emergencies on the business, (17) the impact of high rates of inflation and rising interest rates, (18) the impact of import tariffs on our materials and products, and (19) the impact of geopolitical instability on our business.
|
|
These factors, as well as other factors set forth as risk factors or otherwise described in the reports filed by the Company with the SEC (available at www.sec.gov), could cause results to differ materially from those expressed in the Company’s forward-looking statements. The Company assumes no obligation to update publicly any forward-looking statements, even if new information becomes available or other events occur in the future, except as otherwise required under applicable law and our ongoing reporting obligations under the Securities Exchange Act of 1934, as amended.
Non-GAAP Financial Measures
Inseego Corp. has provided financial information in this press release that has not been prepared in accordance with GAAP. Adjusted EBITDA and non-GAAP operating costs and expenses, for example, exclude preferred stock dividends, share-based compensation expense, amortization of intangible assets purchased through acquisitions, amortization of discount and issuance costs related to our 2025 Notes and revolving credit facility, fair value adjustments on derivative instruments, and other non-recurring expenses. Adjusted EBITDA excludes interest, taxes, depreciation, amortization, impairment of capitalized software, impairment of long-lived assets, debt restructuring costs and divestiture related costs, along with certain other non-recurring expenses and foreign exchange gains and losses.
Adjusted EBITDA, non-GAAP cost of revenues, and non-GAAP operating costs and expenses are supplemental measures of our performance that are not required by, or presented in accordance with, GAAP. These non-GAAP financial measures have limitations as an analytical tool. They are not intended to be used in isolation or as a substitute for cost of revenues, operating expenses, net loss, net loss per share or any other performance measure determined in accordance with GAAP. We present these non-GAAP financial measures because we consider them to be an important supplemental performance measure.
We use these non-GAAP financial measures to make operational decisions, evaluate our performance, prepare forecasts and determine compensation. Further, management and investors benefit from referring to these non-GAAP financial measures in assessing our performance when planning, forecasting and analyzing future periods. Share-based compensation expenses are expected to vary depending on the number of new incentive award grants issued to both current and new employees, the number of such grants forfeited by former employees, and changes in our stock price, stock market volatility, expected option term and risk-free interest rates, all of which are difficult to estimate. In calculating non-GAAP financial measures, we exclude certain non-cash and one-time items to facilitate comparability of our operating performance on a period-to-period basis because such expenses are not, in our view, related to our ongoing operational performance. We use this view of our operating performance to compare it with the business plan and individual operating budgets and in the allocation of resources.
We believe that these non-GAAP financial measures are helpful to investors in providing greater transparency to the information used by management in its operational decision-making. The Company believes that using these non-GAAP financial measures also facilitates comparing our underlying operating performance with other companies in our industry, which use similar non-GAAP financial measures to supplement their GAAP results.
In the future, we expect to continue to incur expenses similar to the non-GAAP adjustments described above, and the exclusion of these items in the presentation of our non-GAAP financial measures should not be construed as an inference that these costs are unusual, infrequent, or non-recurring. Investors and potential investors are cautioned that material limitations are associated with using non-GAAP financial measures as an analytical tool. The limitations of relying on non-GAAP financial measures include, but are not limited to, the fact that other companies, including other companies in our industry, may calculate non-GAAP financial measures differently than we do, limiting their usefulness as a comparative tool.
Investors and potential investors are encouraged to review the reconciliation of our non-GAAP financial measures in this press release with our GAAP financial results.
Investor Relations Contact:
Matt Glover, Gateway Group: (949) 574-3860
IR@inseego.com
|
|
INSEEGO CORP.
CONSOLIDATED STATEMENTS OF OPERATIONS
(In thousands, except share and per share data)
(Unaudited)
|
Three Months Ended December 31, |
Year Ended December 31, |
|||||||||||||||
| 2024 | 2023 | 2024 | 2023 | |||||||||||||
| Revenues: | ||||||||||||||||
| Mobile solutions | $ | 25,499 | $ | 16,029 | $ | 98,930 | $ | 80,498 | ||||||||
| Fixed wireless access solutions | 10,427 | 12,411 | 47,649 | 54,900 | ||||||||||||
| Product | 35,926 | 28,440 | 146,579 | 135,398 | ||||||||||||
| Services and other | 12,161 | 7,479 | 44,665 | 31,888 | ||||||||||||
| Total revenues | 48,087 | 35,919 | 191,244 | 167,286 | ||||||||||||
| Cost of revenues: | ||||||||||||||||
| Product | 28,578 | 25,782 | 115,390 | 127,157 | ||||||||||||
| Services and other | 1,565 | 794 | 7,057 | 4,353 | ||||||||||||
| Total cost of revenues | 30,143 | 26,576 | 122,447 | 131,510 | ||||||||||||
| Gross profit (loss) | 17,944 | 9,343 | 68,797 | 35,776 | ||||||||||||
| Operating costs and expenses: | ||||||||||||||||
| Research and development | 5,564 | 5,356 | 20,596 | 19,725 | ||||||||||||
| Sales and marketing | 3,775 | 2,929 | 15,951 | 16,632 | ||||||||||||
| General and administrative | 4,545 | 3,527 | 17,240 | 15,853 | ||||||||||||
| Depreciation and amortization | 2,270 | 5,283 | 12,368 | 18,408 | ||||||||||||
| Impairment of capitalized software | – | – | 927 | 1,115 | ||||||||||||
| Total operating costs and expenses | 16,154 | 17,095 | 67,082 | 71,733 | ||||||||||||
| Operating income (loss) | 1,790 | (7,752 | ) | 1,715 | (35,957 | ) | ||||||||||
| Other (expense) income: | ||||||||||||||||
| (Loss)/Gain on debt restructurings, net | (16,541 | ) | – | (2,851 | ) | – | ||||||||||
| Loss on extinguishment of revolving credit facility | – | – | (788 | ) | – | |||||||||||
| Interest expense, net | (1,220 | ) | (2,176 | ) | (10,906 | ) | (9,086 | ) | ||||||||
| Other income (expense), net | 14 | 19 | (850 | ) | 70 | |||||||||||
| Income (Loss) before income taxes | (15,957 | ) | (9,909 | ) | (13,680 | ) | (44,973 | ) | ||||||||
| Income tax provision | 518 | (1 | ) | 689 | 43 | |||||||||||
| Income (Loss) from continuing operations | (16,475 | ) | (9,908 | ) | (14,369 | ) | (45,016 | ) | ||||||||
| Income from discontinued operations, net of income tax provision | 15,909 | (4,432 | ) | 18,941 | (1,169 | ) | ||||||||||
| Net income (loss) | (566 | ) | (14,340 | ) | 4,572 | (46,185 | ) | |||||||||
| Preferred stock dividends | (844 | ) | (773 | ) | (3,269 | ) | (2,991 | ) | ||||||||
| Net income (loss) attributable to common stockholders | $ | (1,410 | ) | $ | (15,113 | ) | $ | 1,303 | $ | (49,176 | ) | |||||
| Per share data: | ||||||||||||||||
| Net earnings (loss) per share: | ||||||||||||||||
| Basic and diluted: | ||||||||||||||||
| Continuing operations | $ | (1.23 | ) | $ | (0.90 | ) | $ | (1.41 | ) | $ | (4.22 | ) | ||||
| Discontinued operations | $ | 1.13 | $ | (0.38 | ) | $ | 1.51 | $ | (0.10 | ) | ||||||
| Basic earnings (loss) per share (*) | $ | (0.10 | ) | $ | (1.28 | ) | $ | 0.10 | $ | (4.32 | ) | |||||
| Weighted-average shares used in computation of net earnings (loss) per share | ||||||||||||||||
| Basic and diluted (*) | 14,032,056 | 11,809,306 | 12,535,756 | 11,372,069 | ||||||||||||
(*) Adjusted retroactively for reverse stock split that occurred on January 24, 2024
|
|
INSEEGO CORP.
CONSOLIDATED BALANCE SHEETS
(In thousands)
(Unaudited)
| December 31, 2024 |
December 31, 2023 |
|||||||
| ASSETS | ||||||||
| Current assets: | ||||||||
| Cash and cash equivalents | $ | 39,596 | $ | 2,409 | ||||
| Accounts receivable, net | 13,803 | 18,202 | ||||||
| Inventories | 13,575 | 20,555 | ||||||
| Prepaid expenses and other | 5,926 | 4,937 | ||||||
| Current assets held for sale | – | 12,123 | ||||||
| Total current assets | 72,900 | 58,226 | ||||||
| Property, plant and equipment, net | 1,102 | 2,389 | ||||||
| Intangible assets, net | 18,747 | 25,718 | ||||||
| Goodwill | 3,949 | 3,949 | ||||||
| Operating lease right-of-use assets | 2,855 | 4,022 | ||||||
| Other assets | 446 | 1,256 | ||||||
| Non-current assets held for sale | – | 26,237 | ||||||
| Total assets | $ | 99,999 | $ | 121,797 | ||||
| LIABILITIES AND STOCKHOLDERS’ DEFICIT | ||||||||
| Current liabilities: | ||||||||
| Accounts payable | $ | 18,433 | $ | 23,408 | ||||
| Accrued expenses and other current liabilities | 30,133 | 21,049 | ||||||
| 2025 Convertible Notes, net | 14,905 | – | ||||||
| Revolving credit facility, net | – | 4,094 | ||||||
| Current liabilities held for sale | – | 7,360 | ||||||
| Total current liabilities | 63,471 | 55,911 | ||||||
| Long-term liabilities: | ||||||||
| 2025 Convertible Notes, net | – | 159,912 | ||||||
| Operating lease liabilities | 2,627 | 3,972 | ||||||
| Deferred tax liabilities, net | 174 | 112 | ||||||
| 2029 Senior Secured Notes, net | 41,830 | – | ||||||
| Other long-term liabilities | 4,755 | 2,351 | ||||||
| Non-current liabilities held for sale | – | 1,644 | ||||||
| Total liabilities | 112,857 | 223,902 | ||||||
| Commitments and contingencies | ||||||||
| Stockholders’ deficit: | ||||||||
| Preferred stock (aggregate liquidation preference of $38.4 million) | – | – | ||||||
| Common stock | 15 | 12 | ||||||
| Additional paid-in capital | 892,534 | 810,138 | ||||||
| Accumulated other comprehensive loss | 218 | (5,327 | ) | |||||
| Accumulated deficit | (905,625 | ) | (906,928 | ) | ||||
| Total stockholders’ deficit | (12,858 | ) | (102,105 | ) | ||||
| Total liabilities and stockholders’ deficit | $ | 99,999 | $ | 121,797 | ||||
|
|
INSEEGO CORP.
CONSOLIDATED STATEMENTS OF CASH FLOWS
(In thousands)
(Unaudited)
| Year Ended December 31, | ||||||||
| 2024 | 2023 | |||||||
| Cash flows from operating activities: | ||||||||
| Net income (loss) | $ | 4,572 | $ | (46,185 | ) | |||
| Adjustments to reconcile Net income (loss) to net cash provided by operating activities | ||||||||
| (Income) Loss from discontinued operations, net of tax | (18,941 | ) | 1,169 | |||||
| Depreciation and amortization | 12,529 | 18,709 | ||||||
| Provision for expected credit losses | 216 | 302 | ||||||
| Impairment of capitalized software | 927 | 1,115 | ||||||
| Provision for excess and obsolete inventory | (54 | ) | 9,491 | |||||
| Write-off of capitalized inventory order fees | – | 1,275 | ||||||
| Impairment of operating lease right-of-use assets | 138 | 469 | ||||||
| Share-based compensation expense | 3,824 | 6,971 | ||||||
| Amortization of debt discount and debt issuance costs | 4,399 | 1,953 | ||||||
| Loss on extinguishment of revolving credit facility | 788 | – | ||||||
| Loss on debt restructurings, net | 2,851 | – | ||||||
| Deferred income taxes | 62 | 9 | ||||||
| Non-cash operating lease expense | 1,035 | 1,038 | ||||||
| Changes in assets and liabilities, net of effects of divestiture: | ||||||||
| Accounts receivable | 4,670 | 3,068 | ||||||
| Inventories | 6,923 | 4,272 | ||||||
| Prepaid expenses and other assets | (71 | ) | 1,933 | |||||
| Accounts payable | (6,947 | ) | (802 | ) | ||||
| Accrued expenses other liabilities | 10,966 | 235 | ||||||
| Operating lease liabilities | (1,230 | ) | (1,272 | ) | ||||
| Operating cash flows from continuing operations | 26,657 | 3,750 | ||||||
| Operating cash flows from discontinued operations | 6,862 | 2,207 | ||||||
| Net cash provided by operating activities | 33,519 | 5,957 | ||||||
| Cash flows from investing activities: | ||||||||
| Purchases of property, plant and equipment | (100 | ) | (224 | ) | ||||
| Additions to capitalized software development costs and purchases of intangible assets | (4,961 | ) | (8,112 | ) | ||||
| Investing cash flows from continuing operations | (5,061 | ) | (8,336 | ) | ||||
| Investing cash flows from discontinued operations | 48,092 | (1,833 | ) | |||||
| Net cash provided by (used in) investing activities | 43,031 | (10,169 | ) | |||||
| Cash flows from financing activities: | ||||||||
| Payments related to repurchases of 2025 Convertible Notes | (33,769 | ) | – | |||||
| Proceeds from issuance of short-term loan and warrants, net of issuance costs | 19,350 | – | ||||||
| Repayments on short-term loan | (19,500 | ) | – | |||||
| Net repayments on asset-backed revolving credit facility | (4,882 | ) | (3,757 | ) | ||||
| Net repayment of bank and overdraft facilities | – | (186 | ) | |||||
| Proceeds from a public offering, net of issuance costs | – | 6,057 | ||||||
| Proceeds from stock option exercises and ESPP | 20 | 97 | ||||||
| Financing cash flows from continuing operations | (38,781 | ) | 2,211 | |||||
| Financing cash flows from discontinued operations | – | – | ||||||
| Net cash provided by (used in) financing activities | (38,781 | ) | 2,211 | |||||
| Effect of exchange rates on cash | (582 | ) | 1,169 | |||||
| Net increase (decrease) in cash, cash equivalents and restricted cash | 37,187 | (832 | ) | |||||
| Cash, cash equivalents and restricted cash, beginning of period | 2,409 | 3,241 | ||||||
| Cash, cash equivalents and restricted cash, end of period | $ | 39,596 | $ | 2,409 | ||||
|
|
INSEEGO CORP.
Supplemental 2024 Statement of Operations Data by Quarter
(In thousands)
(Unaudited)
| Year Ended | Three Months Ended | |||||||||||||||||||
| December 31, 2024 | December 31, 2024 | September 30, 2024 |
June 30, 2024 |
March 31, 2024 |
||||||||||||||||
| Revenues: | ||||||||||||||||||||
| Mobile solutions | $ | 98,930 | $ | 25,499 | $ | 32,282 | $ | 25,879 | $ | 15,270 | ||||||||||
| Fixed wireless access solutions | 47,649 | 10,427 | 9,723 | 13,317 | 14,182 | |||||||||||||||
| Product | 146,579 | 35,926 | 42,005 | 39,196 | 29,452 | |||||||||||||||
| Services and other | 44,665 | 12,161 | 12,027 | 12,424 | 8,053 | |||||||||||||||
| Total revenues | 191,244 | 48,087 | 54,032 | 51,620 | 37,505 | |||||||||||||||
| Cost of revenues: | ||||||||||||||||||||
| Product | 115,390 | 28,578 | 33,592 | 30,507 | 22,713 | |||||||||||||||
| Services and other | 7,057 | 1,565 | 1,640 | 2,304 | 1,548 | |||||||||||||||
| Total cost of revenues | 122,447 | 30,143 | 35,232 | 32,811 | 24,261 | |||||||||||||||
| Gross profit (loss) | 68,797 | 17,944 | 18,800 | 18,809 | 13,244 | |||||||||||||||
| Operating costs and expenses: | ||||||||||||||||||||
| Research and development | 20,596 | 5,564 | 5,176 | 5,173 | 4,683 | |||||||||||||||
| Sales and marketing | 15,951 | 3,775 | 4,125 | 4,212 | 3,839 | |||||||||||||||
| General and administrative | 17,240 | 4,545 | 4,822 | 3,918 | 3,955 | |||||||||||||||
| Depreciation and amortization | 12,368 | 2,270 | 3,154 | 3,652 | 3,292 | |||||||||||||||
| Impairment of capitalized software | 927 | – | 507 | – | 420 | |||||||||||||||
| Total operating costs and expenses | 67,082 | 16,154 | 17,784 | 16,955 | 16,189 | |||||||||||||||
| Operating income (loss) | 1,715 | 1,790 | 1,016 | 1,854 | (2,945 | ) | ||||||||||||||
| Other (expense) income: | ||||||||||||||||||||
| (Loss)/Gain on debt restructurings, net | (2,851 | ) | (16,541 | ) | 12,366 | 1,324 | – | |||||||||||||
| Loss on extinguishment of revolving credit facility | (788 | ) | – | – | (788 | ) | – | |||||||||||||
| Interest expense, net | (10,906 | ) | (1,220 | ) | (5,731 | ) | (1,776 | ) | (2,179 | ) | ||||||||||
| Other income (expense), net | (850 | ) | 14 | (72 | ) | (417 | ) | (375 | ) | |||||||||||
| Income (Loss) before income taxes | (13,680 | ) | (15,957 | ) | 7,579 | 197 | (5,499 | ) | ||||||||||||
| Income tax provision | 689 | 518 | 36 | 118 | 17 | |||||||||||||||
| Income (Loss) from continuing operations | (14,369 | ) | (16,475 | ) | 7,543 | 79 | (5,516 | ) | ||||||||||||
| Income from discontinued operations, net of income tax provision | 18,941 | 15,909 | 1,426 | 545 | 1,061 | |||||||||||||||
| Net income (loss) | 4,572 | (566 | ) | 8,969 | 624 | (4,455 | ) | |||||||||||||
| Preferred stock dividends | (3,269 | ) | (844 | ) | (827 | ) | (808 | ) | (790 | ) | ||||||||||
| Net income (loss) attributable to common stockholders | $ | 1,303 | $ | (1,410 | ) | $ | 8,142 | $ | (184 | ) | $ | (5,245 | ) | |||||||
|
|
INSEEGO CORP.
Supplemental 2023 Statement of Operations Data by Quarter
(In thousands)
(Unaudited)
| Year Ended | Three Months Ended | |||||||||||||||||||
| December 31, 2023 | December 31, 2023 | September 30, 2023 |
June 30, 2023 |
March 31, 2023 |
||||||||||||||||
| Revenues: | ||||||||||||||||||||
| Mobile solutions | $ | 80,498 | $ | 16,029 | $ | 22,534 | $ | 18,895 | $ | 23,040 | ||||||||||
| Fixed wireless access solutions | 54,900 | 12,411 | 11,114 | 19,505 | 11,870 | |||||||||||||||
| Product | 135,398 | 28,440 | 33,648 | 38,400 | 34,910 | |||||||||||||||
| Services and other | 31,888 | 7,479 | 7,709 | 7,983 | 8,717 | |||||||||||||||
| Total revenues | 167,286 | 35,919 | 41,357 | 46,383 | 43,627 | |||||||||||||||
| Cost of revenues: | ||||||||||||||||||||
| Product | 127,157 | 25,782 | 42,788 | 30,620 | 27,967 | |||||||||||||||
| Services and other | 4,353 | 794 | 734 | 1,139 | 1,686 | |||||||||||||||
| Total cost of revenues | 131,510 | 26,576 | 43,522 | 31,759 | 29,653 | |||||||||||||||
| Gross profit (loss) | 35,776 | 9,343 | (2,165 | ) | 14,624 | 13,974 | ||||||||||||||
| Operating costs and expenses: | ||||||||||||||||||||
| Research and development | 19,725 | 5,356 | 5,200 | 5,822 | 3,347 | |||||||||||||||
| Sales and marketing | 16,632 | 2,929 | 3,893 | 4,575 | 5,235 | |||||||||||||||
| General and administrative | 15,853 | 3,527 | 3,429 | 4,281 | 4,616 | |||||||||||||||
| Depreciation and amortization | 18,408 | 5,283 | 3,848 | 4,327 | 4,950 | |||||||||||||||
| Impairment of capitalized software | 1,115 | – | 611 | – | 504 | |||||||||||||||
| Total operating costs and expenses | 71,733 | 17,095 | 16,981 | 19,005 | 18,652 | |||||||||||||||
| Operating income (loss) | (35,957 | ) | (7,752 | ) | (19,146 | ) | (4,381 | ) | (4,678 | ) | ||||||||||
| Other (expense) income: | ||||||||||||||||||||
| Interest expense, net | (9,086 | ) | (2,176 | ) | (2,894 | ) | (2,017 | ) | (1,999 | ) | ||||||||||
| Other income (expense), net | 70 | 19 | 45 | 23 | (17 | ) | ||||||||||||||
| Income (Loss) before income taxes | (44,973 | ) | (9,909 | ) | (21,995 | ) | (6,375 | ) | (6,694 | ) | ||||||||||
| Income tax provision | 43 | (1 | ) | 30 | 15 | (1 | ) | |||||||||||||
| Income (Loss) from continuing operations | (45,016 | ) | (9,908 | ) | (22,025 | ) | (6,390 | ) | (6,693 | ) | ||||||||||
| Income from discontinued operations, net of income tax provision | (1,169 | ) | (4,432 | ) | 220 | 1,454 | 1,589 | |||||||||||||
| Net income (loss) | (46,185 | ) | (14,340 | ) | (21,805 | ) | (4,936 | ) | (5,104 | ) | ||||||||||
| Preferred stock dividends | (2,991 | ) | (773 | ) | (756 | ) | (739 | ) | (723 | ) | ||||||||||
| Net income (loss) attributable to common stockholders | $ | (49,176 | ) | $ | (15,113 | ) | $ | (22,561 | ) | $ | (5,675 | ) | $ | (5,827 | ) | |||||
|
|
INSEEGO CORP.
Supplemental 2024 Reconciliation of GAAP Income (Loss) from Continuing Operations to Adjusted EBITDA
(In thousands)
(Unaudited)
| Year Ended | Three Months Ended | |||||||||||||||||||
| December 31, 2024 | December 31, 2024 | September 30, 2024 |
June 30, 2024 |
March 31, 2024 |
||||||||||||||||
| Income (Loss) from continuing operations | $ | (14,369 | ) | $ | (16,475 | ) | $ | 7,543 | $ | 79 | $ | (5,516 | ) | |||||||
| Income tax provision (benefit) | 689 | 518 | 36 | 118 | 17 | |||||||||||||||
| Interest expense, net | 10,906 | 1,220 | 5,731 | 1,776 | 2,179 | |||||||||||||||
| Loss on extinguishment of revolving credit facility | 788 | – | – | 788 | – | |||||||||||||||
| Loss/(Gain) on debt restructurings, net | 2,851 | 16,541 | (12,366 | ) | (1,324 | ) | – | |||||||||||||
| Other (income) expense, net | 850 | (14 | ) | 72 | 417 | 375 | ||||||||||||||
| Depreciation and amortization | 12,529 | 2,308 | 3,193 | 3,691 | 3,337 | |||||||||||||||
| Share-based compensation expense | 3,823 | 1,109 | 1,193 | 834 | 687 | |||||||||||||||
| Debt restructuring costs | 1,322 | 201 | 669 | 452 | – | |||||||||||||||
| Impairment of operating lease right-of-use assets | 139 | – | 139 | – | – | |||||||||||||||
| Impairment of capitalized software | 927 | – | 507 | – | 420 | |||||||||||||||
| Adjusted EBITDA from continuing operations | 20,455 | 5,408 | 6,717 | 6,831 | 1,499 | |||||||||||||||
See “Non-GAAP Financial Measures” for information regarding our use of Non-GAAP financial measures.
|
|
INSEEGO CORP.
Supplemental 2023 Reconciliation of GAAP Income (Loss) from Continuing Operations to Adjusted EBITDA
(In thousands)
(Unaudited)
| Year Ended | Three Months Ended | |||||||||||||||||||
| December 31, 2023 | December 31, 2023 | September 30, 2023 |
June 30, 2023 |
March 31, 2023 |
||||||||||||||||
| Income (Loss) from continuing operations | $ | (45,016 | ) | $ | (9,908 | ) | $ | (22,025 | ) | $ | (6,390 | ) | $ | (6,693 | ) | |||||
| Income tax provision (benefit) | 43 | (1 | ) | 30 | 15 | (1 | ) | |||||||||||||
| Interest expense, net | 9,086 | 2,176 | 2,894 | 2,017 | 1,999 | |||||||||||||||
| Other (income) expense, net | (70 | ) | (19 | ) | (45 | ) | (23 | ) | 17 | |||||||||||
| Depreciation and amortization | 18,713 | 5,350 | 4,421 | 4,438 | 4,504 | |||||||||||||||
| Share-based compensation expense | 6,972 | 1,333 | 2,123 | 1,820 | 1,696 | |||||||||||||||
| Impairment of operating lease right-of-use assets | 469 | – | – | 469 | – | |||||||||||||||
| Inventory adjustments - E&O and contract manufacturer liability ** | 16,427 | 3,370 | 13,057 | – | – | |||||||||||||||
| Write-off of capitalized inventory order fees ** | 924 | – | 924 | – | – | |||||||||||||||
| Impairment of capitalized software | 1,115 | – | 611 | – | 504 | |||||||||||||||
| Adjusted EBITDA from continuing operations | 8,663 | 2,301 | 1,990 | 2,346 | 2,026 | |||||||||||||||
** These items are not adjusted from the period ending December 31, 2023 going forward
See “Non-GAAP Financial Measures” for information regarding our use of Non-GAAP financial measures.
|
|
Exhibit 99.2

Q4 AND 2024 EARNINGS RESULTS February 19, 2025

New CEO Juho Sarvikas | Leadership Rooted in Wireless Innovation On January 6, 2025, Juho Sarvikas, the former President of Qualcomm North America joined Inseego as CEO and board member. x Proven Leadership in Wireless Technology – As CEO, Juho Sarvikas brings a strategic vision focused on leveraging engineering excellence to drive technology and product leadership in the wireless market. x Extensive Global Executive Experience – Over two decades of expertise in strategy development and scaling organizations across both large enterprises and start - ups. x Track Record in Product and Business Growth – Led the relaunch of Nokia phones as Chief Product Officer at HMD Global, growing the company into a multi - billion - dollar business. x Deep Industry Knowledge in OEM and Wireless Ecosystems – Broad expertise spanning product management, engineering, sales, marketing, and supply chain, combined with strong relationships with network operators. x Successful Market Expansion and Diversification – As President of Qualcomm North America, he drove new go - to - market strategies to diversify the company’s presence in the region.


Scalable Business Model Healthy Total Gross Margin Profile Successfully Resolved Convertible Debt Overhang Return to Profitability Generating Free Cash Flow Return to Revenue Growth Diversified Hardware & SaaS Revenue Streams Divested Telematics Portfolio to Focus on Key 5G Growth Areas Inseego Financial Profile | Compelling Improvements & Trajectory 3 Q4 2024 RESULTS * (Feb 19, 2025) GUIDANCE (Nov 12, 2024) $48.1m $43m - $47m TOTAL REVENUE (continuing operations) $5.4m $3.0m - $4.0m ADJ EBITDA (continuing operations) 11% 7 - 8% Implied margin 4 * Q4 2024 Results represent total Company results from Continuing Operations (which excludes the Telematics business that was sold in Q4 2024) The Company's guidance for Q4 2024 was provided on Nov. 12, 2024 for Continuing Operations only, meaning it excluded the Telematics business. The Company’s sale of its Telematics business was completed on Nov. 27, 2024. Accordingly, the financial results categorize the Telematics financial results as Discontinued Operations and the Company’s overall financial results are reported on a Continuing Operations basis, consistent with how guidance was provided.

Q4 2024 Financial Results | Beat Guidance Strong Revenue From Continuing Operations of $48.1m, growing +34% YoY vs. Q4 2023 on robust performance in both Product and Services & Other portfolios Q4 2024 Financial Results | Selected Key Highlights Comments and results reference the Company’s Continuing Operations unless otherwise mentioned, that is, they are pro forma for the sale of the Telematics operations. Inseego has delivered multiple quarters of both revenue and profitability expansion reflecting the positive trajectory across the business. The Company now runs an efficient cost structure while driving growth across both Product and SaaS offerings, resulting in much - improved profitability and positive cash generation. Q4 2024 Financial Highlights Include: • 1 2 • Solid non - GAAP Gross Margin of 37.8% , +180 bps higher YoY vs. Q4 2023 3 • Efficient non - GAAP Operating Expenses with lower $ and expense/revenue ratio vs. Q4 2023 4 • Achieved positive GAAP Operating Income of $1.7m for third sequential quarter; first time in several years 5 • Third consecutive quarter of double - digit Adj EBITDA margin %, with Adj EBITDA delivering growth of +$3.1m vs. Q4 2023 6 • Completed sale of Telematics business , a non - core asset, for $52m in Cash 7 • Finalized material debt reduction in closing the restructuring of convertible notes due in 2025; exchanging $91.5m or 91% of face value outstanding convertible notes for long - term debt & equity 5 x Achieved highest quarterly MiFi X PRO sales ever with one major North American carrier who continues to see great success with our device, especially with public sector customers.

x Completed rigorous hiring process for new CEO to lead Inseego in its next phase of growth following the company’s successful overhaul of its capital structure. x Delivered continued growth in our expanding Channel business , off the back of a successful launch of the Inseego Ignite program. x Received award letter from large service provider to range our next generation indoor FWA device. x Ranged MiFi X PRO with a global communications solution provider for business and government agencies. x Executed large FWA order with a major Internet Service Provider who uses Inseego devices to deliver ultra - fast, SLA - guaranteed, symmetrical fixed wireless access to businesses. x Selected in two competitive opportunities to be the hardware supplier to large nonprofit telecom companies that provide affordable broadband services to bridge the digital divide .

6 Q4 2024 | Selected Business Highlights 135.4 146.6 31.9 44.7 167.3 191.2 2023 2024 34.9 38.4 33.6 28.4 29.5 39.2 42.0 35.9 8.7 8.0 7.7 7.5 8.1 12.4 12.0 12.2 43.6 46.4 41.4 35.9 37.5 51.6 54.0 48.1 Q1 2023 Q2 2023 Q3 2023 Q4 2023 Q1 2024 Q2 2024 Q3 2024 Q4 2024 Product Revenue Services & Other Revenue Total Revenue | Return to Growth Trajectory ($ millions) Q4 2024 revenue grew +34% YoY with favorable change in growth trajectory across all segments. Comments and results reference the Company’s Continuing Operations unless otherwise mentioned, that is, they are pro forma for the sale of the Telematics operations. 7 Compelling Portfolio | Increasing High - Value Services Contribution Revenue mix continues to shift to higher - profitability Services & Other offerings.

Comments and results reference the Company’s Continuing Operations unless otherwise mentioned, that is, they are pro forma for the sale of the Telematics operations. 80% 83% 81% 79% 79% 76% 78% 75% 20% 17% 19% 21% 21% 24% 22% 25% 2024 2023 Q4 Q3 Q2 Q1 Q4 Q3 Q2 Q1 2024 2024 2024 2024 2023 2023 2023 2023 Product Revenue Mix Services & Other Revenue Mix 81% 77% 19% 23% 8 32.4% 9 32.0% 29.2% 35.6% 35.4% 36.5% 34.8% 37.4% Q4 Q3 Q2 Q1 Q4 Q3 Q2 Q1 2024 2024 2024 2024 2023 2023 2023 2023 Gross Margin | Expanding Contribution The Company has materially improved its gross margins through a combination of improved pricing, operational efficiencies, and new channel distribution and looks forward to further gross margin expansion with new products launching in 2025.
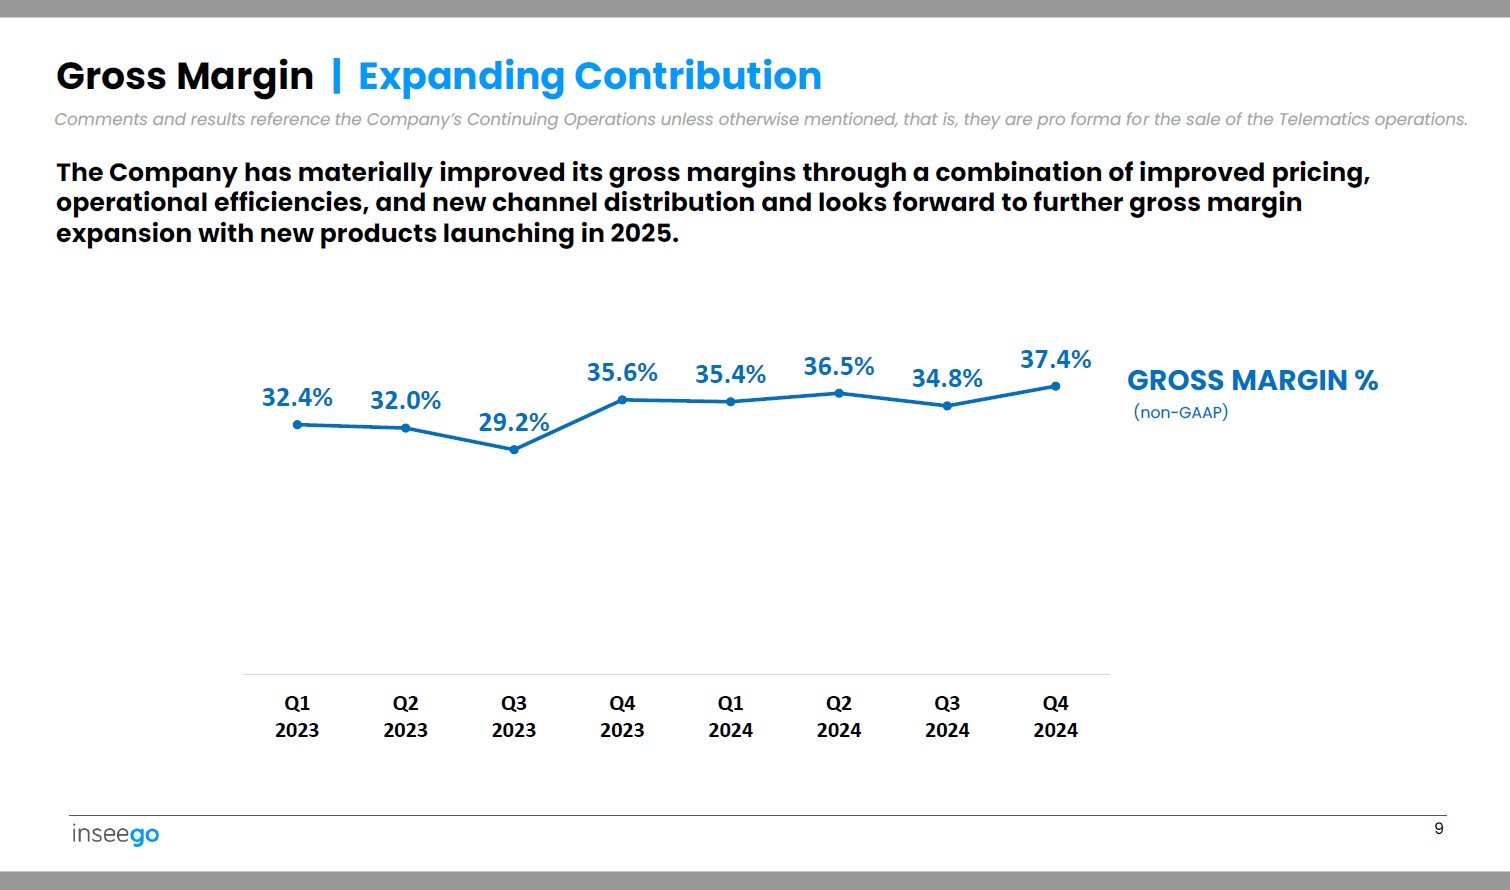
GROSS MARGIN % (non - GAAP) Comments and results reference the Company’s Continuing Operations unless otherwise mentioned, that is, they are pro forma for the sale of the Telematics operations.

3.6 2.9 2.4 2.8 3.6 2.8 3.7 8% 6% 6% 8% 5% 3.1 10% 6% 8% Q1 Q2 Q3 Q4 Q1 Q2 Q3 Q4 2023 2023 2023 2023 2024 2024 2024 2024 5.0 4.3 3.6 2.7 3.7 4.2 4.0 3.7 11% 9% 9% 7% 10% 8% 7% 8% Q1 Q2 Q3 Q4 Q1 Q2 Q3 Q4 2023 2023 2023 2023 2024 2024 2024 2024 Operating Expense Efficiency | Improving Operations at Scale Comments and results reference the Company’s Continuing Operations unless otherwise mentioned, that is, they are pro forma for the sale of the Telematics operations. Disciplined cost management and economies of scale are now resulting in improved expense/revenue ratios across all Operating Expense lines. Sales & Marketing (non - GAAP) General & Administrative (non - GAAP) Operating Expense / Revenue ratio NOTE: These OpEx categories do not include depreciation & amortization expense as that is reported in its own line item; see financial statements for full details. ($ millions) 3.1 10 5.4 4.6 5.1 4.5 5.1 5.3 7% 12% 11% Research & Development (non - GAAP) 14% 12% 10% 9% 5.0 11% Q1 Q2 Q3 Q4 Q1 Q2 Q3 Q4 2023 2023 2023 2023 2024 2024 2024 2024 2.0 11 2.3 2.0 2.3 1.5 6.8 6.7 5.4 4.6% 5.1% 4.9% 6.4% 4.0% 11.2% Comments and results reference the Company’s Continuing Operations unless otherwise mentioned, that is, they are pro forma for the sale of the Telematics operations.

The Company has significantly improved and delivered meaningful adjusted EBITDA profitability following transformative changes and particularly strong recent business traction. 13.2% 12.5% Q4 Q3 Q2 Q1 Q4 Q3 Q2 Q1 2024 2024 2024 2024 2023 2023 2023 2023 Profitability | Meaningful Shift and Expansion in Adj EBITDA Generation ADJ EBITDA MARGIN % ADJ EBITDA $ ($ millions)

December 31, December 31, 2023 2024 ASSETS $2,409 $39,596 Cash and cash equivalents 18,202 13,803 Accounts receivable, net 20,555 13,575 Inventory 4,937 5,926 Prepaid expenses and other 12,123 — Current assets held for sale 58,226 72,900 Total current assets 2,389 1,102 Property, plant and equipment, net 29,667 22,696 Goodwill and intangible assets, net 5,278 3,301 Other assets 26,237 — Non - current assets held for sale $121,797 $99,999 Total assets LIABILITIES AND STOCKHOLDERS’ DEFICIT $44,457 $48,566 Accounts payable and other accrued liabilities — 14,905 2025 Convertible Notes, net 4,094 — Revolving credit facility 7,360 — Current liabilities held for sale 55,911 63,471 Total current liabilities — 41,830 2029 Senior Secured Notes, net 159,912 — 2025 Convertible Notes, net 6,435 7,556 Long - term liabilities 1,644 — Non - current liabilities held for sale 223,902 112,857 Total liabilities (102,105) (12,858) Total stockholders’ deficit ( aggregate preferred stock liquidation preference of $38,392 ) $121,797 $99,999 Total liabilities and stockholders’ deficit 12 Balance Sheet | Strong Improvement and Financial Position Results reflect the Company’s Continuing Operations, where the Telematics operations are reported in Held For Sale. ($ thousands)

The Company signed an agreement on September 16, 2024 to sell its remaining Telematics operations to an affiliate of Convergence Partners, an international investment management firm, for $52 million in Cash. • The transaction closed on November 27, 2024, at which time the full $52 million purchase price was received. Subsequent to closing, the Company received an additional $0.7 million in cash related to the settlement of net working capital, bringing the total cash sale price to $52.7 million. • The Telematics business operated across the UK, European Union, Australia, and New Zealand; Convergence Partners had previously purchased the Company’s South Africa Telematics business in 2021 for $33 million. • The transaction strengthened Inseego’s balance sheet and continues the streamlining of the Company’s focus on and allocation of resources to the strongest growth opportunities around the core product offerings. • Consistent with Q3, the Company is reporting the results of the Telematics business in a single line on its Statement of Operations as “Discontinued Operations” and on its Balance Sheet as “Assets Held For Sale.” • The Company used a portion of the proceeds of the Telematics sale, along with balance sheet cash and cash flow generation, to further reduce total debt in funding the pay - off the $15m stub of the 2025 Convert and a $6m short - term loan that was paid - off in Q4 2024. 13 Telematics Sale | Completed with $52.7m in Cash Proceeds CONVERTIBLE NOTES RESTRUCTURING The Company began 2024 with $162m face value of its 3.25% Convertible Notes due May 1, 2025.
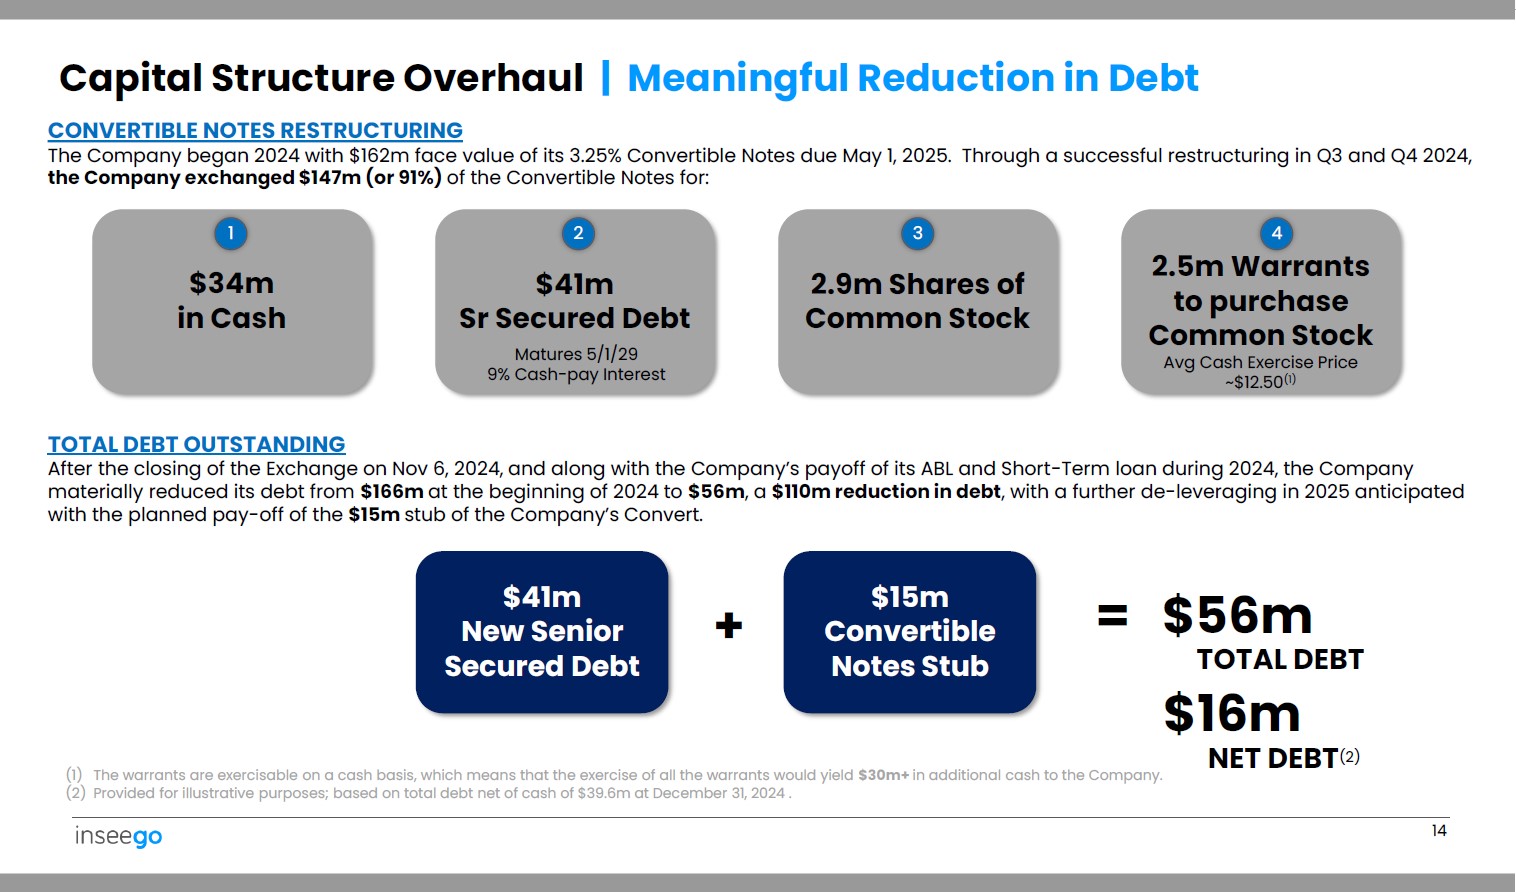
Through a successful restructuring in Q3 and Q4 2024, the Company exchanged $147m (or 91%) of the Convertible Notes for: (1) The warrants are exercisable on a cash basis, which means that the exercise of all the warrants would yield $30m+ in additional cash to the Company. (2) Provided for illustrative purposes; based on total debt net of cash of $39.6m at December 31, 2024 . TOTAL DEBT OUTSTANDING After the closing of the Exchange on Nov 6, 2024, and along with the Company’s payoff of its ABL and Short - Term loan during 2024, the Company materially reduced its debt from $166m at the beginning of 2024 to $56m , a $110m reduction in debt , with a further de - leveraging in 2025 anticipated with the planned pay - off of the $15m stub of the Company’s Convert. 1 $34m in Cash 2 $41m Sr Secured Debt Matures 5/1/29 9% Cash - pay Interest 3 2.9m Shares of Common Stock 4 2.5m Warrants to purchase Common Stock Avg Cash Exercise Price ~$12.50 (1) $41m New Senior Secured Debt $15m Convertible Notes Stub 14 + = $56m TOTAL DEBT $16m Capital Structure Overhaul | Meaningful Reduction in Debt NET DEBT (2)

Q1 2025 GUIDANCE Q1 2024 Actual $30m - $33m $37.5m Revenue $2m - $3m $1.5m Adj EBITDA 15 On the Company’s February 19, 2025 Earnings Call, management provided the following guidance for Total Revenue and Adjusted EBITDA from Continuing Operations for Q1 2025: Company Guidance | Q1 2025 (ISSUED: FEB 19, 2025)

$24b TAM across the Mobile Broadband and Fixed Wireless Access markets Improved financial profile with return to revenue growth, profitability and free cash flow generation Addressed convertible overhang, reducing debt and right - sizing capital structure Unique positioning of products built to meet strict US government requirements in support of the “homegrown” US tech initiative 25+ year track record of wireless technology leadership and strong relationships with Tier 1 Service Providers and Fortune 500 customers Inseego Investment Highlights | Compelling Trajectory 16 APPENDIX • Telematics Sale | Pro Forma Historical Financial Info • Reconciliation of non - GAAP numbers


TELEMATICS SALE Pro Forma Historical Financial Information Inseego P&L – By Quarter | 2024 As a result of the Sale of the Telematics B usiness in November 2024, all results for Telematics are classified below in the 2024 financial results as Discontinued Operations and all other line items within the Statement of Operations consist solely of the results from the Company's continuing operations.
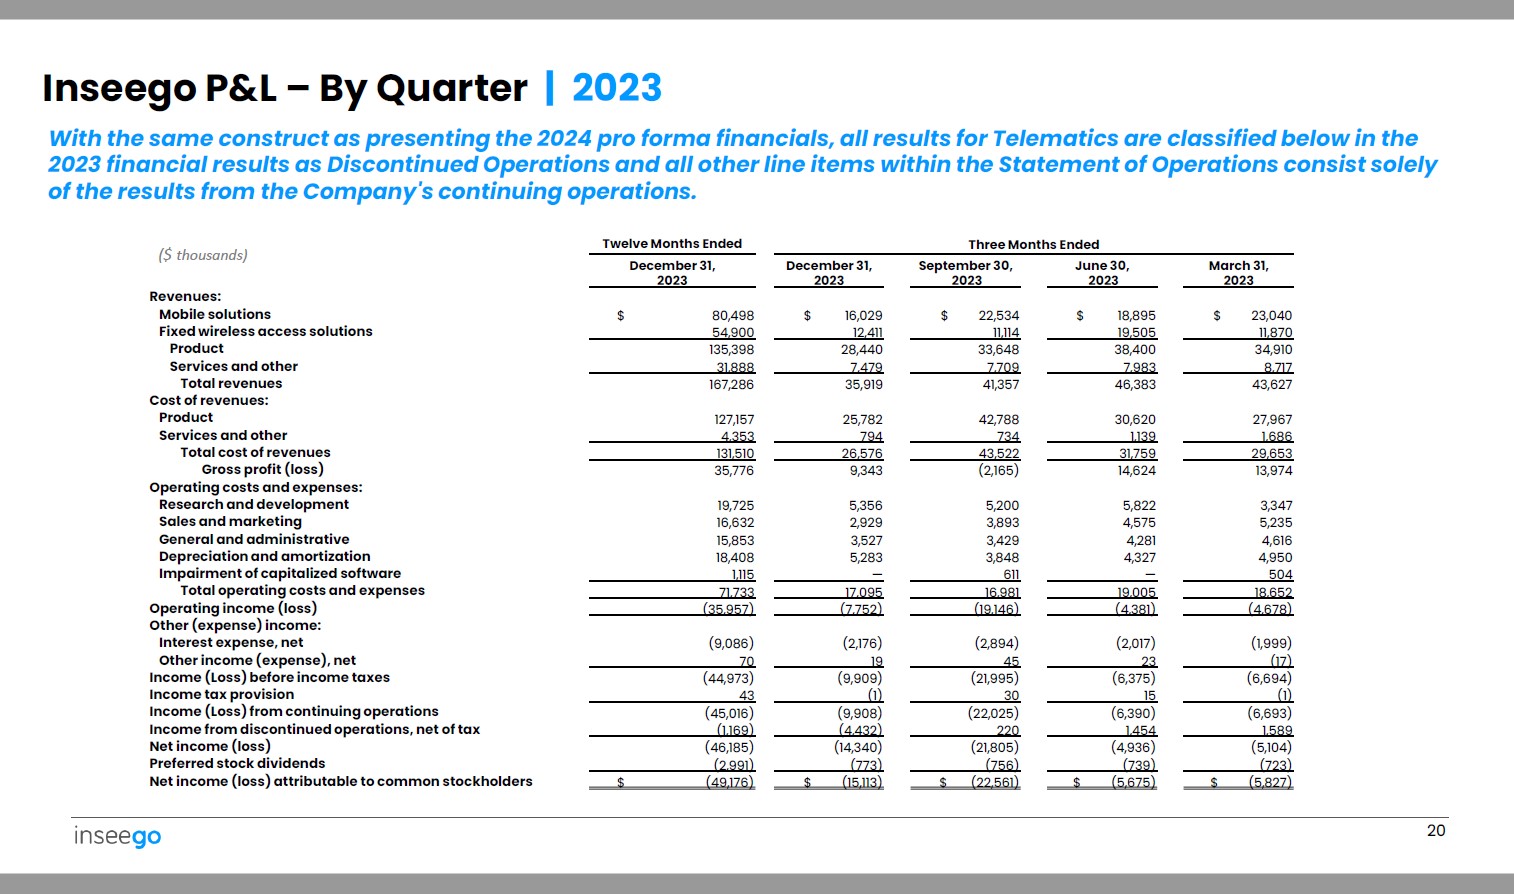
($ thousands) Revenues: 19 $ 15,270 $ 25,879 $ 32,282 $ 25,499 $ 98,930 Mobile solutions 14,182 13,317 9,723 10,427 47,649 Fixed wireless access solutions 29,452 39,196 42,005 35,926 146,579 Product 8,053 12,424 12,027 12,161 44,665 Services and other 37,505 51,620 54,032 48,087 Total revenues 191,244 22,713 30,507 33,592 28,578 115,390 Cost of revenues: Product 1,548 2,304 1,640 1,565 7,057 Services and other 24,261 32,811 35,232 30,143 122,447 Total cost of revenues 13,244 18,809 18,800 17,944 68,797 Gross profit (loss) 4,683 5,173 5,176 5,564 20,596 Operating costs and expenses: Research and development 3,839 4,212 4,125 3,775 15,951 Sales and marketing 3,955 3,918 4,822 4,545 17,240 General and administrative 3,292 3,652 3,154 2,270 12,368 Depreciation and amortization 420 — 507 - 927 Impairment of capitalized software 16,189 16,955 17,784 16,154 67,082 Total operating costs and expenses (2,945) 1,854 1,016 1,790 Operating income (loss) 1,715 Other (expense) income: (2,179) (1,776) (5,731) (1,220) (10,906) Interest expense, net — (788) — - (788) Loss on extinguishment of revolving credit facility — 1,324 12,366 (16,541) (2,851) (Loss)/Gain on debt restructurings, net (375) (417) (72) 14 (850) Other income (expense), net (5,499) 197 7,579 (15,957) (13,680) Income (Loss) before income taxes 17 118 36 518 689 Income tax provision (5,516) 79 7,543 (16,475) (14,369) Income (Loss) from continuing operations 1,061 545 1,426 15,909 18,941 Income from discontinued operations, net of tax (4,455) 624 8,969 (566) 4,572 Net income (loss) (790) (808) (827) (844) (3,269) Preferred stock dividends $ (5,245) $ (184) $ 8,142 $ (1,410) $ 1,303 Net income (loss) attributable to common stockholders Year Ended Three Months Ended December 31, 2024 March 31, June 30, September 30, December 31, 2024 2024 2024 2024 Inseego P&L – By Quarter | 2023 ($ thousands) March 31, June 30, September 30, December 31, December 31, 2023 2023 2023 2023 2023 Twelve Months Ended 20 Three Months Ended Revenues: $ 23,040 $ 18,895 $ 22,534 $ 16,029 $ 80,498 Mobile solutions 11,870 19,505 11,114 12,411 54,900 Fixed wireless access solutions 34,910 38,400 33,648 28,440 135,398 Product 8,717 7,983 7,709 7,479 31,888 Services and other 43,627 46,383 41,357 35,919 Total revenues 167,286 27,967 30,620 42,788 25,782 127,157 Cost of revenues: Product 1,686 1,139 734 794 4,353 Services and other 29,653 31,759 43,522 26,576 131,510 Total cost of revenues 13,974 14,624 (2,165) 9,343 35,776 Gross profit (loss) 3,347 5,822 5,200 5,356 19,725 Operating costs and expenses: Research and development 5,235 4,575 3,893 2,929 16,632 Sales and marketing 4,616 4,281 3,429 3,527 15,853 General and administrative 4,950 4,327 3,848 5,283 18,408 Depreciation and amortization 504 — 611 — 1,115 Impairment of capitalized software 18,652 19,005 16,981 17,095 71,733 Total operating costs and expenses (4,678) (4,381) (19,146) (7,752) Operating income (loss) (35,957) Other (expense) income: (1,999) (2,017) (2,894) (2,176) (9,086) Interest expense, net (17) 23 45 19 70 Other income (expense), net (6,694) (6,375) (21,995) (9,909) (44,973) Income (Loss) before income taxes (1) 15 30 (1) 43 Income tax provision (6,693) (6,390) (22,025) (9,908) (45,016) Income (Loss) from continuing operations 1,589 1,454 220 (4,432) (1,169) Income from discontinued operations, net of tax (5,104) (4,936) (21,805) (14,340) (46,185) Net income (loss) (723) (739) (756) (773) (2,991) Preferred stock dividends $ (5,827) $ (5,675) $ (22,561) $ (15,113) $ (49,176) Net income (loss) attributable to common stockholders With the same construct as presenting the 2024 pro forma financials, all results for Telematics are classified below in the 2023 financial results as Discontinued Operations and all other line items within the Statement of Operations consist solely of the results from the Company's continuing operations.


NON - GAAP NUMBERS Reconciliations to GAAP Financials Income (Loss) From Continuing Operations to Adjusted EBITDA | 2024 22 NON - GAAP TO GAAP RECONCILIATION Three Months Ended Year Ended March 31, 2024 June 30, 2024 September 30, 2024 December 31, 2024 December 31, 2024 ($ thousands) $ (5,516) $ 79 $ 7,543 $ (16,475) $ (14,369) Income (loss) from continuing operations 17 118 36 518 689 Income tax provision (benefit) 2,179 1,776 5,731 1,220 10,906 Interest expense, net — 788 — - 788 Loss on extinguishment of revolving credit facility — (1,324) (12,366) 16,541 2,851 Loss (gain) on debt restructurings, net 375 417 72 (14) 850 Other (income) expense, net 3,337 3,691 3,193 2,308 12,529 Depreciation and amortization 687 834 1,193 1,109 3,823 Share - based compensation expense — 452 669 201 1,322 Debt restructuring costs — — 139 — 139 Impairment of operating lease right - of - use assets 420 — 507 — 927 Impairment of capitalized software $ 1,499 $ 6,831 $ 6,717 $ 5,408 $ 20,455 Adjusted EBITDA from continuing operations NON - GAAP TO GAAP RECONCILIATION 23 Income (Loss) From Continuing Operations to Adjusted EBITDA | 2023 March 31, June 30, September 30, December 31, December 31, ($ thousands) 2023 2023 2023 2023 2023 $ (6,693) $ (6,390) $ (22,025) $ (9,908) $ (45,016) Loss from continuing operations (1) 15 30 (1) 43 Income tax provision (benefit) 1,999 2,017 2,894 2,176 9,086 Interest expense, net 17 (23) (45) (19) (70) Other (income) expense, net 4,504 4,438 4,421 5,350 18,713 Depreciation and amortization 1,696 1,820 2,123 1,333 6,972 Share - based compensation expense — 469 — — 469 Impairment of operating lease right - of - use assets — — 13,057 3,370 16,427 Inventory adjustments - E&O and contract manufacturer liability ** — — 924 — 924 Write - off of capitalized inventory order fees ** 504 — 611 — 1,115 Impairment of capitalized software $ 2,026 $ 2,346 $ 1,990 $ 2,301 $ 8,663 Adjusted EBITDA from continuing operations Year Ended Three Months Ended ** These items are not adjusted from the period ending December 31, 2023 going forward


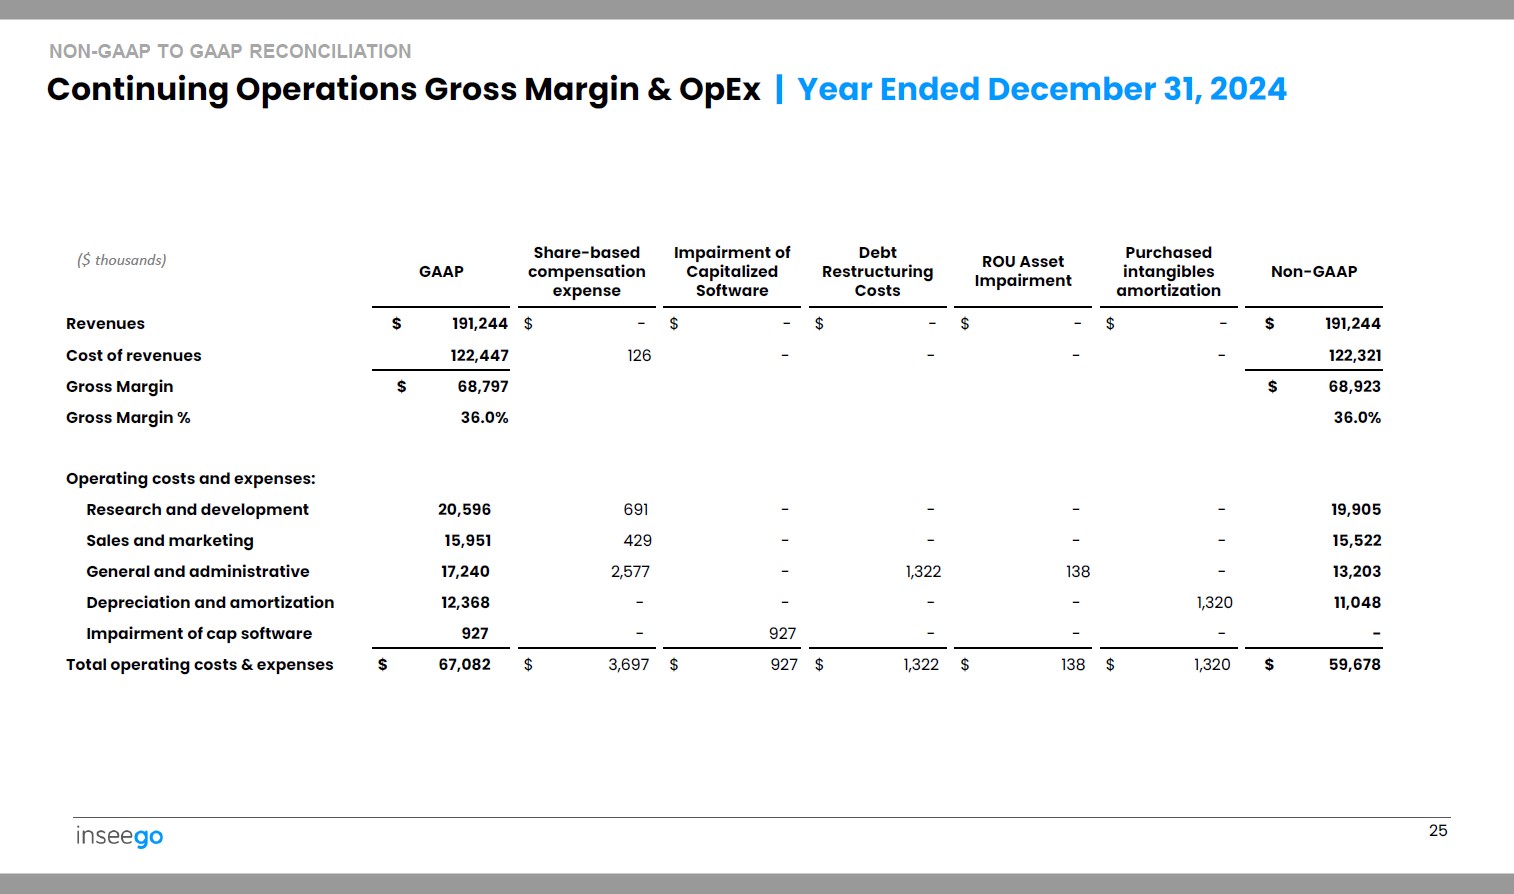
Continuing Operations Gross Margin & OpEx | Three Months Ended December 31, 2024 24 NON - GAAP TO GAAP RECONCILIATION Non - GAAP Purchased intangibles amortization Debt Restructuring Costs Share - based compensation expense GAAP ($ thousands) $ 48,087 $ - $ - $ - $ 48,087 Revenues 30,092 - - 51 30,143 Cost of revenues $ 17,995 $ 17,944 Gross Margin 37.4% 37.3% Gross Margin % Operating costs and expenses: 5,310 - - 254 5,564 Research and development 3,659 - - 116 3,775 Sales and marketing 3,655 - 201 689 4,545 General and administrative 1,940 330 - - 2,270 Depreciation and amortization - - - - - Impairment of cap software $ 14,564 $ 330 $ 201 $ 1,059 $ 16,154 Total operating costs & expenses NON - GAAP TO GAAP RECONCILIATION 25 Continuing Operations Gross Margin & OpEx | Year Ended December 31, 2024 Non - GAAP Purchased intangibles amortization ROU Asset Impairment Debt Restructuring Costs Impairment of Capitalized Software Share - based compensation expense GAAP ($ thousands) $ 191,244 $ - $ - $ - $ - $ - $ 191,244 Revenues 122,321 - - - - 126 122,447 Cost of revenues $ 68,923 $ 68,797 Gross Margin 36.0% 36.0% Gross Margin % Operating costs and expenses: 19,905 - - - - 691 20,596 Research and development 15,522 - - - - 429 15,951 Sales and marketing 13,203 - 138 1,322 - 2,577 17,240 General and administrative 11,048 1,320 - - - - 12,368 Depreciation and amortization - - - - 927 - 927 Impairment of cap software $ 59,678 $ 1,320 $ 138 $ 1,322 $ 927 $ 3,697 $ 67,082 Total operating costs & expenses

Safe Harbor Statement This presentation contains statements about expected future events that are forward - looking and subject to risks and uncertainties. For these statements, we claim the safe harbor for “forward - looking statements” within the meaning of the Private Securities Litigation Reform Act of 1995. For a discussion of factors that could cause actual results to differ materially from expectations, please refer to the risk factors described in our filings with the SEC. Non - GAAP Financial Measures Non - GAAP gross margins and operating expenses exclude restructuring charges, share based compensation expenses, debt restructuring charges, impairments of capitalized software charges, charges related to acquisition and divestiture activities and acquisition - related intangible asset amortization. This presentation contains references to certain non - GAAP financial measures and should be viewed in conjunction with our press releases and supplementary information on our website ( www.inseego.com/investors ) which present a complete reconciliation of GAAP and Non - GAAP results. 26 Disclaimers

www.inseego.com NASDAQ: INSG