UNITED STATES
SECURITIES AND EXCHANGE COMMISSION
Washington, D.C. 20549
FORM 8-K
CURRENT REPORT
Pursuant to Section 13 OR 15(d) of the
Securities Exchange Act of 1934
Date of Report (Date of earliest event reported): October 13, 2022
DELTA AIR LINES, INC.
(Exact name of registrant as specified in its charter)
| Delaware | 001-05424 | 58-0218548 | ||
| (State or other jurisdiction of incorporation) |
(Commission File Number) |
(IRS Employer Identification No.) |
P.O. Box 20706, Atlanta, Georgia 30320-6001
(Address of principal executive offices)
Registrant’s telephone number, including area code: (404) 715-2600
Registrant’s Web site address: www.delta.com
Check the appropriate box below if the Form 8-K filing is intended to simultaneously satisfy the filing obligation of the registrant under any of the following provisions (see General Instruction A.2. below):
☐ Written communications pursuant to Rule 425 under the Securities Act (17 CFR 230.425)
☐ Soliciting material pursuant to Rule 14a-12 under the Exchange Act (17 CFR 240.14a-12)
☐ Pre-commencement communications pursuant to Rule 14d-2(b) under the Exchange Act (17 CFR 240.14d-2(b))
☐ Pre-commencement communications pursuant to Rule 13e-4(c) under the Exchange Act (17 CFR 240.13e-4(c))
Securities registered pursuant to Section 12(b) of the Act:
| Title of each class | Trading Symbol | Name of each exchange on which registered |
| Common Stock, par value $0.0001 per share | DAL | New York Stock Exchange |
Indicate by check mark whether the registrant is an emerging growth company as defined in Rule 405 of the Securities Act of 1933 (17 CFR 230.405) or Rule 12b-2 of the Securities Exchange Act of 1934 (17 CFR 240.12b-2).
Emerging growth company ☐
If an emerging growth company, indicate by check mark if the registrant has elected not to use the extended transition period for complying with any new or revised financial accounting standards provided pursuant to Section 13(a) of the Exchange Act. ☐
| Item 2.02 | Results of Operations and Financial Condition. |
Delta Air Lines, Inc. (“Delta”) today issued a press release reporting financial results for the quarter ended September 30, 2022. The press release is furnished as Exhibit 99.1 to this Form 8-K. In addition, a summary containing supplemental information relating to Delta’s third quarter earnings is being furnished as Exhibit 99.2 to this Form 8-K.
The information furnished in this Form 8-K, including Exhibits 99.1 and 99.2 attached hereto, shall not be deemed incorporated by reference into any other filing with the Securities and Exchange Commission.
| Item 9.01 | Financial Statements and Exhibits. |
(d) Exhibits.
| Exhibit 99.1 | Press Release dated October 13, 2022 titled “Delta Air Lines Announces September Quarter 2022 Financial Results” |
| Exhibit 99.2 | September Quarter 2022 Supplemental Information |
| Exhibit 104 | The cover page from this Current Report on Form 8-K, formatted in Inline XBRL |
|
|
SIGNATURES
Pursuant to the requirements of the Securities Exchange Act of 1934, the registrant has duly caused this report to be signed on its behalf by the undersigned hereunto duly authorized.
|
DELTA AIR LINES, INC.
|
|
| By: /s/ Daniel C. Janki | |
| Date: October 13, 2022 |
Daniel C. Janki Executive Vice President & Chief Financial Officer |
|
|
Exhibit 99.1

| CONTACT: | Investor Relations | Corporate Communications |
| 404-715-2170 | 404-715-2554 | |
| InvestorRelations@delta.com | Media@delta.com |
Delta Air Lines Announces September Quarter 2022 Profit
Record quarterly revenue and second consecutive quarter of double-digit operating margin
Returned operations to industry-leading reliability
Expect December quarter revenue recovery to accelerate relative to 2019
On track to achieve 2024 targets of over $7 adj. EPS and $4 billion of free cash flow
ATLANTA, Oct. 13, 2022 – Delta Air Lines (NYSE:DAL) today reported financial results for the September quarter 2022 and provided its outlook for the December quarter 2022. Highlights of the September quarter 2022 results, including both GAAP and adjusted metrics, are on page five and are incorporated here.
“Thanks to the incredible work of our entire team, Delta delivered a strong September quarter with record quarterly revenues and a double-digit operating margin. The travel recovery continues as consumer spend shifts to experiences and demand improves in corporate and international,” said Ed Bastian, Delta’s chief executive officer. “In this environment, we expect December quarter revenue growth to accelerate versus 2019 with an operating margin of approximately 10 percent.”
“With strong demand and a return to best-in-class operational performance, we are ahead of our plan for the year on profitability and expect to be free cash flow positive. We’re working towards full network restoration by summer of 2023, which supports a meaningful step up in profitability and cash flow next year on our path to earn over $7 of EPS and $4 billion of free cash flow in 2024,” Bastian said.
September Quarter 2022 GAAP Financial Results
| • | Operating revenue of $14.0 billion | |
| • | Operating income of $1.5 billion with an operating margin of 10.4 percent | |
| • | Earnings per share of $1.08 | |
| • | Operating cash flow of $869 million | |
| • | Payments on debt and finance lease obligations of $1.8 billion | |
| • | Total debt and finance lease obligations of $23.2 billion at quarter end |
September Quarter 2022 Adjusted Financial Results
| • | Operating revenue of $12.8 billion, 3 percent higher than September quarter 2019, including a $35 million impact from Hurricane Ian | |
| • | Operating income of $1.5 billion with an operating margin of 11.6 percent | |
| • | Earnings per share of $1.51, including a 3¢ impact from Hurricane Ian | |
| • | $11.2 billion in liquidity* and adjusted net debt of $20.5 billion at quarter end |
*Includes cash and cash equivalents, short-term investments and undrawn revolving credit facilities
|
|
December Quarter Outlook1
| 4Q22 Forecast | |
| Total Revenue2 | Up 5 - 9% |
| Operating Margin | 9 - 11% |
| Earnings Per Share | $1.00 - $1.25 |
| Adjusted Net Debt | ~$22.5 billion |
1 Non-GAAP measures; Refer to Non-GAAP reconciliations for 4Q19 comparison figures
2 Compared to December quarter 2019
Additional metrics for financial modeling can be found in the Supplemental Information section under Quarterly Results on ir.delta.com
September Quarter Revenue Environment and Outlook
“We reached a major milestone this quarter, with adjusted revenue 3 percent higher and unit revenues up 23 percent compared to 2019, marking the highest revenue and unit revenue quarter in Delta's history. Our results reflect the strength of our brand and diverse revenue streams, with another quarter of record co-brand remuneration and continued premium product outperformance,” said Glen Hauenstein, Delta's president. “With corporate travel improving and robust domestic and international demand, we expect December quarter revenue to be up 5 to 9 percent compared to December quarter 2019.”
| • | Consumer demand remains robust with improving demand for international travel: Domestic passenger revenue was 2 percent higher and international passenger revenue was 97 percent recovered compared to the September quarter 2019. International unit revenue growth outpaced domestic for the first time since the pandemic. Transatlantic demand was driven by leisure destinations such as Italy, Spain and Greece and improving business demand, with Transatlantic revenue up 12 percent compared to 2019. | |
| • | Business bookings improve post Labor Day: Corporate sales* increased after Labor Day and are at the strongest recovery rates since the start of the pandemic, exiting the quarter at 80 percent of 2019 levels. Recovery in the least restored sectors accelerated, and recent corporate survey results show positive expectations for business travel, with nearly 90 percent of accounts indicating their travel will stay the same or increase in the December quarter compared to the September quarter. | |
| • | Premium product outperformance continues: Premium revenue was up 8 percent versus 2019, 10 points higher than the main cabin revenue growth. Premium and other diversified revenue streams, including Loyalty, Cargo and MRO, comprised 54 percent of total revenues. | |
| • | Record American Express remuneration supports higher full year outlook: Remuneration for the September quarter was $1.4 billion, 37 percent higher compared to the September quarter 2019 and is now expected to be $5.5 billion for the full year. September quarter co-brand card spend was up 44 percent compared to the September quarter 2019 with co-brand card acquisitions up 17 percent. | |
| • | Cargo revenue remains ahead of 2019; MRO revenue surpasses 2019 levels: Cargo revenue was $240 million in the September quarter, a 27 percent increase compared to the same period in 2019. MRO revenue in the September quarter was $221 million, a 4 percent increase compared to 2019. | |
| • | Hurricane Ian impact to September and December quarters expected to be similar: The impact of Hurricane Ian on September month revenue was $35 million, driven by cancellations and related booking softness to affected areas. A similar impact is expected in the month of October. |
*Corporate sales include tickets sold to corporate contracted customers, including tickets for travel during and beyond the referenced time period
|
|
September Quarter Cost Performance and Outlook
“We delivered $1.5 billion of operating profit with a 12 percent operating margin in the September quarter despite costs related to our rebuild efforts as well as inflationary impacts felt across the industry,” said Dan Janki, Delta's chief financial officer. “With capacity expected to be 91 to 92 percent restored to 2019 in the December quarter, non-fuel unit costs are expected to be 12 to 13 percent higher, improving 10 points sequentially. Improving asset utilization and efficiency remain key priorities as we move into the final stages of rebuilding the airline and work to drive a competitive cost structure.”
| • | Operating expense of $12.5 billion and total adjusted operating expense of $11.3 billion | |
| • | Adjusted non-fuel costs of $7.8 billion | |
| • | Non-fuel CASM was 22.5 percent higher than September quarter 2019 on 17 percent less capacity | |
| • | Adjusted fuel expense of $3.3 billion was up 45 percent compared to the September quarter 2019 | |
| • | Adjusted fuel price of $3.53 per gallon includes a refinery benefit of 21¢ per gallon | |
| • | Fuel efficiency, defined as gallons per 1,000 ASMs, was 14.8, a 3.0 percent improvement versus 2019 |
September Quarter Balance Sheet, Cash and Liquidity
“We repaid $1.8 billion of debt during the quarter, bringing year-to-date debt repayment to more than $4 billion,” Janki said. “We remain committed to strengthening our balance sheet, targeting adjusted net debt of $15 billion and investment grade metrics by 2024.”
| • | Adjusted net debt of $20.5 billion at quarter end; Weighted average interest rate of 4.5 percent with 83 percent fixed rate debt and 17 percent variable rate debt | |
| • | Payments on debt and finance lease obligations of $1.8 billion, bringing year-to-date total to $4.2 billion | |
| • | Operating cash flow of $869 million and gross capital expenditures of $1.5 billion | |
| • | Air Traffic Liability ended September at $9.1 billion, down $817 million compared to June | |
| • | Liquidity of $11.2 billion, including $2.8 billion in undrawn revolver capacity |
Fleet and Partner Updates
On July 18, Delta announced it had reached an agreement with The Boeing Company to purchase 100 Boeing 737-10 aircraft, with options for 30 more. Deliveries of the aircraft will begin in 2025. In addition to improved fuel efficiency, these aircraft will have higher gauge and more premium seating. Delta's 737 fleet will grow to over 300 aircraft by 2030, making it one of the company's largest fleet families. The company also announced a service agreement with CFM International to service the more sustainable next-generation LEAP engines. Delta TechOps will be one of a select few maintenance, repair and overhaul providers worldwide for the LEAP-1B engine.
On September 30, the U.S. Department of Transportation approved and granted antitrust immunity to the trans-American Joint Venture Agreement between Delta and LATAM. The carriers' deepened cooperation under the Joint Venture Agreement will improve travel options and services for customers traveling between the U.S./Canada and South America. Both airlines will work closely to deliver the customer benefits that this approval unlocks, including expanded capacity, increased routing options, superior frequent flyer benefits and shared airport facilities and amenities.
On October 11, Delta announced a strategic partnership with Joby Aviation, Inc., an all-electric vertical take-off and landing (eVTOL) innovator. Delta and Joby share a commitment to delivering a seamless, zero-operating-emission, premium customer experience for eVTOL service. The partnership will leverage Delta’s commercial and operational expertise to develop Joby’s transformational home-to-airport transportation service for Delta customers.
On October 12, Delta and Starbucks announced a new strategic loyalty partnership between Delta SkyMiles and Starbucks Rewards that allows members to link accounts and unlock more ways to earn rewards. This partnership enables more meaningful connection and gets members of both programs even closer to these brands that they love. Delta is Starbucks’ first account linking partner in the U.S., and this will be a strong membership and engagement driver for both brands.
|
|
Other September Quarter Highlights
Operational Reliability
| • | Significant improvement in operational reliability in the September quarter, driven by schedule adjustments, continued hiring and staffing, better crew availability and process improvements | |
| • | September performance prior to Hurricane Ian was the best month of 2022, and we achieved a 99.9 percent Mainline domestic completion factor through September 26, which was no. 1 in our competitive set. On-Time Arrival rate was no. 1 for the full month of September* |
Culture and People
| • | Recorded $291 million of profit-sharing accrual year-to-date, expected to be paid out to Delta employees in February 2023 | |
| • | Contributed over $500K to the American Red Cross toward Hurricane relief efforts | |
| • | Recognized as one of Forbes’ Best Workplaces for Women in the U.S. for a second year in a row, with employees giving Delta top marks on the airline's benefits and representation of women in leadership | |
| • | Scored 100 percent on the Disability Equality Index for the seventh year in a row ranking it as one of the nation's “Best Places to Work for Disability Inclusion” |
Customer Experience and Loyalty
| • | Welcomed record number of new SkyMiles members and achieved record American Express co-brand spend | |
| • | Delta SkyMiles was ranked one of U.S. News & World Report’s best travel rewards programs for the sixth consecutive year, outperforming all other U.S. global airlines | |
| • | Named the best U.S. airline by The Points Guy for the fourth year, with the online travel platform noting Delta's excellence in on-time reliability, a customer-centered experience and an extensive global network | |
| • | Launched Delta Business, an all-encompassing travel brand featuring premium benefits, industry-leading services and award-winning account support to elevate every journey | |
| • | Unveiled Delta Premium Select enhancements providing a refreshed onboard experience, with elevated dining and premium amenities including an upgraded amenity kit and noise-canceling headsets | |
| • | Opened Delta’s new Sky Club at Tokyo’s Haneda Airport and renovated our Delta Sky Club in Boston | |
| • | Announced two nonstop routes from Atlanta to Cape Town and Los Angeles to Tahiti, both beginning December 17, in addition to nonstop service from Atlanta to Tel Aviv beginning March 2023. Atlanta to Cape Town is subject to foreign government approval | |
| • | Announced nonstop service from Los Angeles to Haneda and launched new daily service between Honolulu and Haneda, both beginning December 1 |
Environmental, Social and Governance
| • | Issued our second Close the Gap report, highlighting increased representation of women, Black talent and other underrepresented racial and ethnic groups in roles across the company while underscoring that work remains to be done, and the company will continue to be transparent about progress | |
| • | Engaged more than 50 percent of our officer group in Racial Equity Leadership Workshops, led by the Groundwater Institute | |
| • | Validated our Science Based Targets initiative goal to reduce well-to-wake (lifecycle) scope 1 and 3 jet fuel greenhouse gas emissions by 45 percent per revenue tonne kilometer by 2035 from a 2019 base year** | |
| • | Announced collaboration with MIT to test methods and develop tools to eliminate persistent contrails, which are about 10% of all contrails and thought to be one of aviation’s largest environmental impacts | |
| • | Partnered with DG Fuels to provide Delta with 55 million gallons of SAF annually for seven years with delivery anticipated to begin by the end of 2027 | |
| • | In an open letter, Delta challenged Atlanta business leaders to join OneTen, the national coalition aiming to close the opportunity gap for Black talent by taking a skills-first approach to hiring and promotions |
*Based on FlightStats preliminary data for Delta Air Lines for all Delta flights system wide, from September 1-30, 2022, and as compared to Delta’s competitive set (AA, UA, B6, AS, WN, and DL). On-time is defined as A0
**Non-CO2e effects which may also contribute to aviation induced warming are not included in this target. Delta Air Lines commits to publicly report on non-CO2e impacts of aviation over its target timeframe
|
|
September Quarter Results
September quarter results have been adjusted primarily for the unrealized losses on investments, loss on extinguishment of debt and third-party refinery sales as described in the reconciliations in Note A.
| GAAP | $ | % | ||||||||||||||
| ($ in millions except per share and unit costs) | 3Q22 | 3Q19 | Change | Change | ||||||||||||
| Operating income | 1,456 | 2,071 | (615 | ) | (30)% | |||||||||||
| Pre-tax income | 962 | 1,947 | (985 | ) | (51)% | |||||||||||
| Net income | 695 | 1,495 | (800 | ) | (54)% | |||||||||||
| Diluted earnings per share | 1.08 | 2.31 | (1.23 | ) | (53)% | |||||||||||
| Operating margin | 10.4 | % | 16.5 | % | (6.1 | ) | pts | (37)% | ||||||||
| Operating revenue | 13,975 | 12,560 | 1,415 | 11% | ||||||||||||
| Total revenue per available seat mile (TRASM) (cents) | 22.18 | 16.58 | 5.60 | 34% | ||||||||||||
| Operating expense | 12,519 | 10,489 | 2,030 | 19% | ||||||||||||
| Operating cash flow | 869 | 2,245 | (1,376 | ) | (61)% | |||||||||||
| Capital expenditures | 1,442 | 945 | 497 | 53% | ||||||||||||
| Cost per available seat mile (CASM) (cents) | 19.87 | 13.85 | 6.02 | 43% | ||||||||||||
| Fuel expense | 3,318 | 2,239 | 1,079 | 48% | ||||||||||||
| Average fuel price per gallon | 3.57 | 1.94 | 1.63 | 84% | ||||||||||||
| Total debt and finance lease obligations | 23,233 | 10,119 | 13,114 | NM | ||||||||||||
| Adjusted | $ | % | ||||||||||||||
| ($ in millions except per share and unit costs) | 3Q22 | 3Q19 | Change | Change | ||||||||||||
| Operating income | 1,492 | 2,047 | (555 | ) | (27)% | |||||||||||
| Pre-tax income | 1,276 | 1,968 | (692 | ) | (35)% | |||||||||||
| Net income | 966 | 1,507 | (541 | ) | (36)% | |||||||||||
| Diluted earnings per share | 1.51 | 2.33 | (0.82 | ) | (35)% | |||||||||||
| Operating margin | 11.6 | % | 16.4 | % | (4.8 | ) | pts | (29)% | ||||||||
| Operating revenue | 12,840 | 12,507 | 333 | 3% | ||||||||||||
| TRASM (cents) | 20.38 | 16.51 | 3.87 | 23% | ||||||||||||
| Operating expense | 11,348 | 10,460 | 888 | 8% | ||||||||||||
| Gross capital expenditures | 1,467 | 1,223 | 244 | 20% | ||||||||||||
| Non-fuel cost | 7,829 | 7,685 | 144 | 2% | ||||||||||||
| Non-fuel unit cost (CASM-Ex) (cents) | 12.43 | 10.15 | 2.28 | 22.5% | ||||||||||||
| Fuel expense | 3,282 | 2,257 | 1,025 | 45% | ||||||||||||
| Average fuel price per gallon | 3.53 | 1.96 | 1.57 | 80% | ||||||||||||
| Adjusted net debt | 20,541 | 10,265 | 10,276 | NM | ||||||||||||
|
|
About Delta Air Lines More than 4,000 Delta Air Lines (NYSE: DAL) flights take off every day, connecting people across more than 275 destinations on six continents with a commitment to industry-leading customer service, safety and innovation.
More than 80,000 Delta people lead the way in delivering a world-class customer experience, and we're continuing to ensure the future of travel is personalized, enjoyable and stress-free. Our people's genuine and enduring motivation is to make every customer feel welcomed and respected across every point of their journey with us.
Delta has served as many as 200 million customers annually. Headquartered in Atlanta, Delta operates significant hubs and key markets in Amsterdam, Atlanta, Boston, Detroit, London-Heathrow, Los Angeles, Mexico City, Minneapolis-St. Paul, New York-JFK and LaGuardia, Paris-Charles de Gaulle, Salt Lake City, Seattle, Seoul-Incheon and Tokyo.
Powered by innovative and strategic partnerships with Aeromexico, Air France-KLM, China Eastern, Korean Air, LATAM, Virgin Atlantic and WestJet, Delta brings more choice and competition to customers worldwide.
Delta is America's most-awarded airline thanks to the dedication, passion and professionalism of its people, recognized by Fortune, the Wall Street Journal, and Business Travel News, among many others.
Forward Looking Statements
Statements made in this press release that are not historical facts, including statements regarding our estimates, expectations, beliefs, intentions, projections, goals, aspirations, commitments or strategies for the future, should be considered “forward-looking statements” under the Securities Act of 1933, as amended, the Securities Exchange Act of 1934, as amended, and the Private Securities Litigation Reform Act of 1995. Such statements are not guarantees or promised outcomes and should not be construed as such. All forward-looking statements involve a number of risks and uncertainties that could cause actual results to differ materially from the estimates, expectations, beliefs, intentions, projections, goals, aspirations, commitments and strategies reflected in or suggested by the forward-looking statements. These risks and uncertainties include, but are not limited to, the material adverse effect that the COVID-19 pandemic has had on our business; the impact of incurring significant debt in response to the pandemic; failure to comply with the financial and other covenants in our financing agreements; the possible effects of accidents involving our aircraft or aircraft of our airline partners; breaches or lapses in the security of technology systems on which we rely and of the data stored within them, as well as compliance with ever-evolving global privacy and security regulatory obligations; disruptions in our information technology infrastructure; our dependence on technology in our operations; our commercial relationships with airlines in other parts of the world and the investments we have in certain of those airlines; the effects of a significant disruption in the operations or performance of third parties on which we rely; failure to realize the full value of intangible or long-lived assets; labor issues; the effects of weather, natural disasters and seasonality on our business; changes in the cost of aircraft fuel; extended disruptions in the supply of aircraft fuel, including from Monroe Energy, LLC (“Monroe”), a wholly-owned subsidiary of Delta; failure or inability of insurance to cover a significant liability at Monroe’s Trainer refinery; failure to comply with existing and future environmental regulations to which Monroe’s refinery operations are subject, including costs related to compliance with renewable fuel standard regulations; our ability to retain senior management and other key employees, and to maintain our company culture; significant damage to our reputation and brand, including from exposure to significant adverse publicity or inability to achieve certain sustainability goals; the effects of terrorist attacks, geopolitical conflict or security events; competitive conditions in the airline industry; extended interruptions or disruptions in service at major airports at which we operate or significant problems associated with types of aircraft or engines we operate; the effects of extensive government regulation we are subject to; the impact of environmental regulation, including but not limited to increased regulation to reduce emissions and other risks associated with climate change, and the cost of compliance with more stringent environmental regulations; and unfavorable economic or political conditions in the markets in which we operate or volatility in currency exchange rates.
Additional information concerning risks and uncertainties that could cause differences between actual results and forward-looking statements is contained in our Securities and Exchange Commission filings, including our Annual Report on Form 10-K for the fiscal year ended December 31, 2021 and our Quarterly Reports on Forms 10-Q for the quarterly period ended June 30, 2022. Caution should be taken not to place undue reliance on our forward-looking statements, which represent our views only as of the date of this press release, and which we undertake no obligation to update except to the extent required by law.
|
|
DELTA AIR LINES, INC.
Consolidated Statements of Operations
(Unaudited)
| Three Months Ended | Nine Months Ended | |||||||||||||||||||||||||||||||
| September 30, | September 30, | |||||||||||||||||||||||||||||||
| (in millions, except per share data) | 2022 | 2019 | $ Change | % Change | 2022 | 2019 | $ Change | % Change | ||||||||||||||||||||||||
| Operating Revenue: | ||||||||||||||||||||||||||||||||
| Passenger | $ | 11,464 | $ | 11,410 | $ | 54 | –% | $ | 29,329 | $ | 32,032 | $ | (2,703 | ) | (8)% | |||||||||||||||||
| Cargo | 240 | 189 | 51 | 27% | 801 | 567 | 234 | 41% | ||||||||||||||||||||||||
| Other | 2,271 | 961 | 1,310 | NM | 7,017 | 2,969 | 4,048 | NM | ||||||||||||||||||||||||
| Total operating revenue | 13,975 | 12,560 | 1,415 | 11% | 37,147 | 35,568 | 1,579 | 4% | ||||||||||||||||||||||||
| Operating Expense: | ||||||||||||||||||||||||||||||||
| Salaries and related costs | 3,050 | 2,976 | 74 | 2% | 8,832 | 8,555 | 277 | 3% | ||||||||||||||||||||||||
| Aircraft fuel and related taxes | 3,318 | 2,239 | 1,079 | 48% | 8,633 | 6,508 | 2,125 | 33% | ||||||||||||||||||||||||
| Ancillary businesses and refinery | 1,349 | 279 | 1,070 | NM | 4,449 | 945 | 3,504 | NM | ||||||||||||||||||||||||
| Contracted services | 881 | 760 | 121 | 16% | 2,425 | 2,200 | 225 | 10% | ||||||||||||||||||||||||
| Landing fees and other rents | 562 | 566 | (4 | ) | (1)% | 1,611 | 1,638 | (27 | ) | (2)% | ||||||||||||||||||||||
| Depreciation and amortization | 538 | 631 | (93 | ) | (15)% | 1,554 | 1,960 | (406 | ) | (21)% | ||||||||||||||||||||||
| Regional carrier expense | 528 | 543 | (15 | ) | (3)% | 1,547 | 1,622 | (75 | ) | (5)% | ||||||||||||||||||||||
| Aircraft maintenance materials and outside repairs | 487 | 424 | 63 | 15% | 1,474 | 1,334 | 140 | 10% | ||||||||||||||||||||||||
| Passenger commissions and other selling expenses | 546 | 597 | (51 | ) | (9)% | 1,385 | 1,668 | (283 | ) | (17)% | ||||||||||||||||||||||
| Passenger service | 406 | 360 | 46 | 13% | 1,050 | 988 | 62 | 6% | ||||||||||||||||||||||||
| Aircraft rent | 131 | 110 | 21 | 19% | 380 | 318 | 62 | 19% | ||||||||||||||||||||||||
| Profit sharing | 237 | 517 | (280 | ) | (54)% | 291 | 1,256 | (965 | ) | (77)% | ||||||||||||||||||||||
| Other | 486 | 487 | (1 | ) | –% | 1,325 | 1,357 | (32 | ) | (2)% | ||||||||||||||||||||||
| Total operating expense | 12,519 | 10,489 | 2,030 | 19% | 34,956 | 30,349 | 4,607 | 15% | ||||||||||||||||||||||||
| Operating Income | 1,456 | 2,071 | (615 | ) | (30)% | 2,191 | 5,219 | (3,028 | ) | (58)% | ||||||||||||||||||||||
| Non-Operating Expense: | ||||||||||||||||||||||||||||||||
| Interest expense, net | (248 | ) | (70 | ) | (178 | ) | NM | (791 | ) | (228 | ) | (563 | ) | NM | ||||||||||||||||||
| Equity method results | 4 | 27 | (23 | ) | (85)% | (8 | ) | (44 | ) | 36 | (82)% | |||||||||||||||||||||
| Gain/(loss) on investments, net | (245 | ) | (35 | ) | (210 | ) | NM | (613 | ) | (17 | ) | (596 | ) | NM | ||||||||||||||||||
| Loss on extinguishment of debt | (34 | ) | – | (34 | ) | NM | (100 | ) | – | (100 | ) | NM | ||||||||||||||||||||
| Pension and related benefit/(expense) | 73 | (17 | ) | 90 | NM | 218 | (49 | ) | 267 | NM | ||||||||||||||||||||||
| Miscellaneous, net | (44 | ) | (29 | ) | (15 | ) | 52% | (103 | ) | (81 | ) | (22 | ) | 27% | ||||||||||||||||||
| Total non-operating expense, net | (494 | ) | (124 | ) | (370 | ) | NM | (1,397 | ) | (419 | ) | (978 | ) | NM | ||||||||||||||||||
| Income Before Income Taxes | 962 | 1,947 | (985 | ) | (51)% | 794 | 4,800 | (4,006 | ) | (83)% | ||||||||||||||||||||||
| Income Tax (Provision)/Benefit | (267 | ) | (452 | ) | 185 | (41)% | (305 | ) | (1,131 | ) | 826 | (73)% | ||||||||||||||||||||
| Net Income | $ | 695 | $ | 1,495 | $ | (800 | ) | (54)% | $ | 489 | $ | 3,669 | $ | (3,180 | ) | (87)% | ||||||||||||||||
| Basic Earnings Per Share | $ | 1.09 | $ | 2.32 | $ | 0.77 | $ | 5.61 | ||||||||||||||||||||||||
| Diluted Earnings Per Share | $ | 1.08 | $ | 2.31 | $ | 0.76 | $ | 5.59 | ||||||||||||||||||||||||
| Basic Weighted Average Shares Outstanding | 638 | 646 | 638 | 654 | ||||||||||||||||||||||||||||
| Diluted Weighted Average Shares Outstanding | 641 | 648 | 641 | 656 | ||||||||||||||||||||||||||||
|
|
DELTA AIR LINES, INC.
Passenger Revenue
(Unaudited)
| Three Months Ended | Nine Months Ended | |||||||||||||||||||||||||||||||
| September 30, | September 30, | |||||||||||||||||||||||||||||||
| (in millions) | 2022 | 2019 | $ Change | % Change | 2022 | 2019 | $ Change | % Change | ||||||||||||||||||||||||
| Ticket - Main cabin | $ | 5,893 | $ | 5,990 | $ | (97 | ) | (2)% | $ | 15,000 | $ | 16,581 | $ | (1,581 | ) | (10)% | ||||||||||||||||
| Ticket - Premium products | 4,354 | 4,039 | 315 | 8% | 11,005 | 11,405 | (400 | ) | (4)% | |||||||||||||||||||||||
| Loyalty travel awards | 786 | 732 | 54 | 7% | 2,073 | 2,174 | (101 | ) | (5)% | |||||||||||||||||||||||
| Travel-related services | 431 | 649 | (218 | ) | (34)% | 1,251 | 1,872 | (621 | ) | (33)% | ||||||||||||||||||||||
| Total passenger revenue | $ | 11,464 | $ | 11,410 | $ | 54 | –% | $ | 29,329 | $ | 32,032 | $ | (2,703 | ) | (8)% | |||||||||||||||||
DELTA AIR LINES, INC.
Other Revenue
(Unaudited)
| Three Months Ended | Nine Months Ended | |||||||||||||||||||||||||||||||
| September 30, | September 30, | |||||||||||||||||||||||||||||||
| (in millions) | 2022 | 2019 | $ Change | % Change | 2022 | 2019 | $ Change | % Change | ||||||||||||||||||||||||
| Refinery | $ | 1,134 | $ | 6 | $ | 1,128 | NM | $ | 3,835 | $ | 94 | $ | 3,741 | NM | ||||||||||||||||||
| Loyalty program | 655 | 485 | 170 | 35% | 1,877 | 1,443 | 434 | 30% | ||||||||||||||||||||||||
| Ancillary businesses | 249 | 285 | (36 | ) | (13)% | 665 | 896 | (231 | ) | (26)% | ||||||||||||||||||||||
| Miscellaneous | 233 | 185 | 48 | 26% | 640 | 536 | 104 | 19% | ||||||||||||||||||||||||
| Total other revenue | $ | 2,271 | $ | 961 | $ | 1,310 | NM | $ | 7,017 | $ | 2,969 | $ | 4,048 | NM | ||||||||||||||||||
DELTA AIR LINES, INC.
Total Revenue
(Unaudited)
| Increase (Decrease) | ||||||||||||||||||||
| 3Q22 vs 3Q19 | ||||||||||||||||||||
| Revenue | 3Q22($M) | Change | Unit Revenue | Yield | Capacity | |||||||||||||||
| Domestic | $ | 8,154 | 2% | 15% | 18% | (11)% | ||||||||||||||
| Atlantic | 2,313 | 12% | 25% | 26% | (11)% | |||||||||||||||
| Latin America | 659 | (2)% | 21% | 21% | (19)% | |||||||||||||||
| Pacific | 338 | (51)% | 55% | 55% | (68)% | |||||||||||||||
| Total Passenger | $ | 11,464 | –% | 21% | 23% | (17)% | ||||||||||||||
| Cargo Revenue | 240 | 27% | ||||||||||||||||||
| Other Revenue | 2,271 | NM | ||||||||||||||||||
| Total Revenue | $ | 13,975 | 11% | 34% | ||||||||||||||||
| Third Party Refinery Sales | (1,134 | ) | ||||||||||||||||||
| Total Revenue, adjusted | $ | 12,840 | 3% | 23% | ||||||||||||||||
|
|
DELTA AIR LINES, INC.
Statistical Summary
(Unaudited)
| Three Months Ended | Nine Months Ended | ||||||||||||||||||||||||||||
| September 30, | September 30, | ||||||||||||||||||||||||||||
| 2022 | 2019 | Change | 2022 | 2019 | Change | ||||||||||||||||||||||||
| Revenue passenger miles (millions) | 54,786 | 66,862 | (18 | ) | % | 145,004 | 181,652 | (20 | ) | % | |||||||||||||||||||
| Available seat miles (millions) | 63,007 | 75,742 | (17 | ) | % | 173,720 | 209,911 | (17 | ) | % | |||||||||||||||||||
| Passenger mile yield (cents) | 20.93 | 17.07 | 23 | % | 20.23 | 17.63 | 15 | % | |||||||||||||||||||||
| Passenger revenue per available seat mile (cents) | 18.19 | 15.06 | 21 | % | 16.88 | 15.26 | 11 | % | |||||||||||||||||||||
| Total revenue per available seat mile (cents) | 22.18 | 16.58 | 34 | % | 21.38 | 16.94 | 26 | % | |||||||||||||||||||||
| TRASM, adjusted - see Note A (cents) | 20.38 | 16.51 | 23 | % | 19.18 | 16.83 | 14 | % | |||||||||||||||||||||
| Cost per available seat mile (cents) | 19.87 | 13.85 | 43 | % | 20.12 | 14.46 | 39 | % | |||||||||||||||||||||
| CASM-Ex - see Note A (cents) | 12.43 | 10.15 | 22.5 | % | 12.78 | 10.66 | 20 | % | |||||||||||||||||||||
| Passenger load factor | 87% | 88% | (1 | ) | pt | 83% | 87% | (4 | ) | pts | |||||||||||||||||||
| Fuel gallons consumed (millions) | 930 | 1,154 | (19 | ) | % | 2,543 | 3,215 | (21 | ) | % | |||||||||||||||||||
| Average price per fuel gallon | $ | 3.57 | $ | 1.94 | 84 | % | $ | 3.39 | $ | 2.03 | 67 | % | |||||||||||||||||
| Average price per fuel gallon, adjusted - see Note A | $ | 3.53 | $ | 1.96 | 80 | % | $ | 3.41 | $ | 2.02 | 69 | % | |||||||||||||||||
|
|
DELTA AIR LINES, INC.
Consolidated Statements of Cash Flows
(Unaudited)
| Three Months Ended | ||||||||
| September 30, | ||||||||
| (in millions) | 2022 | 2019 | ||||||
| Cash Flows From Operating Activities: | ||||||||
| Net income | $ | 695 | $ | 1,495 | ||||
| Depreciation and amortization | 538 | 631 | ||||||
| Changes in air traffic liability | (817 | ) | (854 | ) | ||||
| Changes in balance sheet and other, net | 453 | 973 | ||||||
| Net cash provided by operating activities | 869 | 2,245 | ||||||
| Cash Flows From Investing Activities: | ||||||||
| Property and equipment additions: | ||||||||
| Flight equipment, including advance payments | (973 | ) | (549 | ) | ||||
| Ground property and equipment, including technology | (469 | ) | (396 | ) | ||||
| Purchase of short-term investments | (101 | ) | – | |||||
| Redemption of short-term investments | 295 | – | ||||||
| Other, net | (40 | ) | (180 | ) | ||||
| Net cash used in investing activities | (1,288 | ) | (1,125 | ) | ||||
| Cash Flows From Financing Activities: | ||||||||
| Payments on debt and finance lease obligations | (1,795 | ) | (355 | ) | ||||
| Repurchase of common stock | – | (208 | ) | |||||
| Cash dividends | – | (260 | ) | |||||
| Other, net | (13 | ) | (628 | ) | ||||
| Net cash used in by financing activities | (1,808 | ) | (1,451 | ) | ||||
| Net Decrease in Cash, Cash Equivalents and Restricted Cash Equivalents | (2,227 | ) | (331 | ) | ||||
| Cash, cash equivalents and restricted cash equivalents at beginning of period | 9,552 | 3,029 | ||||||
| Cash, cash equivalents and restricted cash equivalents at end of period | $ | 7,325 | $ | 2,698 | ||||
The following table provides a reconciliation of cash, cash equivalents and restricted cash reported within the Consolidated Balance Sheets to the total of the same such amounts shown above:
| Current assets: | ||||||||
| Cash and cash equivalents | $ | 7,023 | $ | 1,899 | ||||
| Restricted cash included in prepaid expenses and other | 149 | 46 | ||||||
| Other assets: | ||||||||
| Restricted cash included in other noncurrent assets | 153 | 753 | ||||||
| Total cash, cash equivalents and restricted cash equivalents | $ | 7,325 | $ | 2,698 |
|
|
DELTA AIR LINES, INC.
Consolidated Balance Sheets
(Unaudited)
| September 30, | December 31, | |||||||
| (in millions) | 2022 | 2021 | ||||||
| ASSETS | ||||||||
| Current Assets: | ||||||||
| Cash and cash equivalents | $ | 7,023 | $ | 7,933 | ||||
| Short-term investments | 1,345 | 3,386 | ||||||
| Accounts receivable, net | 3,097 | 2,404 | ||||||
| Fuel inventory, expendable parts and supplies inventories, net | 1,473 | 1,098 | ||||||
| Prepaid expenses and other | 1,861 | 1,119 | ||||||
| Total current assets | 14,799 | 15,940 | ||||||
| Property and Equipment, Net: | ||||||||
| Property and equipment, net | 31,512 | 28,749 | ||||||
| Other Assets: | ||||||||
| Operating lease right-of-use assets | 6,961 | 7,237 | ||||||
| Goodwill | 9,753 | 9,753 | ||||||
| Identifiable intangibles, net | 5,994 | 6,001 | ||||||
| Equity investments | 1,585 | 1,712 | ||||||
| Deferred income taxes, net | 935 | 1,294 | ||||||
| Other noncurrent assets | 1,057 | 1,773 | ||||||
| Total other assets | 26,285 | 27,770 | ||||||
| Total assets | $ | 72,596 | $ | 72,459 | ||||
| LIABILITIES AND STOCKHOLDERS' EQUITY | ||||||||
| Current Liabilities: | ||||||||
| Current maturities of debt and finance leases | $ | 2,031 | $ | 1,782 | ||||
| Current maturities of operating leases | 738 | 703 | ||||||
| Air traffic liability | 8,947 | 6,228 | ||||||
| Accounts payable | 4,958 | 4,240 | ||||||
| Accrued salaries and related benefits | 2,796 | 2,457 | ||||||
| Loyalty program deferred revenue | 3,478 | 2,710 | ||||||
| Fuel card obligation | 1,100 | 1,100 | ||||||
| Other accrued liabilities | 1,822 | 1,746 | ||||||
| Total current liabilities | 25,870 | 20,966 | ||||||
| Noncurrent Liabilities: | ||||||||
| Debt and finance leases | 21,202 | 25,138 | ||||||
| Noncurrent air traffic liability | 150 | 130 | ||||||
| Pension, postretirement and related benefits | 5,470 | 6,035 | ||||||
| Loyalty program deferred revenue | 4,382 | 4,849 | ||||||
| Noncurrent operating leases | 6,865 | 7,056 | ||||||
| Other noncurrent liabilities | 4,067 | 4,398 | ||||||
| Total noncurrent liabilities | 42,136 | 47,606 | ||||||
| Commitments and Contingencies | ||||||||
| Stockholders' Equity: | 4,590 | 3,887 | ||||||
| Total liabilities and stockholders' equity | $ | 72,596 | $ | 72,459 | ||||
|
|
Note A: The following tables show reconciliations of non-GAAP financial measures. The reasons Delta uses these measures are described below. Reconciliations may not calculate due to rounding.
Delta sometimes uses information (“non-GAAP financial measures”) that is derived from the Consolidated Financial Statements, but that is not presented in accordance with accounting principles generally accepted in the U.S. (“GAAP”). Under the Securities and Exchange Commission rules, non-GAAP financial measures may be considered in addition to results prepared in accordance with GAAP, but should not be considered a substitute for or superior to GAAP results. The tables below show reconciliations of non-GAAP financial measures used in this release to the most directly comparable GAAP financial measures.
Forward Looking Projections. Delta is not able to reconcile forward looking non-GAAP financial measures without unreasonable effort because the adjusting items such as those used in the reconciliations below will not be known until the end of the period and could be significant.
Adjustments. These reconciliations include certain adjustments to GAAP measures, that are directly related to the impact of COVID-19 and our response. These adjustments are made to provide comparability between the reported periods, if applicable, as indicated below:
Restructuring charges. During 2020, we recorded restructuring charges for items such as fleet impairments and voluntary early retirement and separation programs following strategic business decisions in response to the COVID-19 pandemic. In the September quarter 2022 and nine months ended September 2022, we recognized $1 million and $6 million, respectively, of net adjustments to certain of those restructuring charges, representing changes in our estimates.
Loss on extinguishment of debt. This adjustment relates to early termination of a portion of our debt.
We also regularly adjust certain GAAP measures for the following items, if applicable, for the reasons indicated below:
Third-party refinery sales. Refinery sales to third parties, and related expenses, are not related to our airline segment. Excluding these sales therefore provides a more meaningful comparison of our airline operations to the rest of the airline industry.
Delta Private Jets adjustment. Because we combined Delta Private Jets with Wheels Up in January 2020, we have excluded the impact of Delta Private Jets from 2019 results for comparability.
MTM adjustments and settlements on hedges. Mark-to-market ("MTM") adjustments are defined as fair value changes recorded in periods other than the settlement period. Such fair value changes are not necessarily indicative of the actual settlement value of the underlying hedge in the contract settlement period, and therefore we remove this impact to allow investors to better understand and analyze our core performance. Settlements represent cash received or paid on hedge contracts settled during the applicable period.
MTM adjustments on investments. Unrealized gains/losses result from our equity investments that are accounted for at fair value in non-operating expense. The gains/losses are driven by changes in stock prices, foreign currency fluctuations and other valuation techniques for investments in companies without publicly-traded shares. Adjusting for these gains/losses allows investors to better understand and analyze our core operational performance in the periods shown.
Equity investment MTM adjustments. We adjust for our proportionate share of our equity method investee, Virgin Atlantic’s, hedge portfolio MTM adjustments (recorded in non-operating expense) to allow investors to understand and analyze our core operational performance in the periods shown.
Aircraft fuel and related taxes. The volatility in fuel prices impacts the comparability of year-over-year financial performance. The adjustment for aircraft fuel and related taxes allows investors to better understand and analyze our non-fuel costs and year-over-year financial performance.
Profit sharing. We adjust for profit sharing because this adjustment allows investors to better understand and analyze our recurring cost performance and provides a more meaningful comparison of our core operating costs to the airline industry.
|
|
Operating Revenue, adjusted and Total Revenue Per Available Seat Mile (“TRASM”), adjusted
| Three Months Ended | 3Q22 vs 3Q19 |
|||||||||||||||
| (in millions) | September 30, 2022 | December 31, 2019 | September 30, 2019 | % Change | ||||||||||||
| Operating revenue | $ | 13,975 | $ | 11,439 | $ | 12,560 | ||||||||||
| Adjusted for: | ||||||||||||||||
| Third-party refinery sales | (1,134 | ) | (2 | ) | (6 | ) | ||||||||||
| Delta Private Jets adjustment | – | (53 | ) | (47 | ) | |||||||||||
| Operating revenue, adjusted | $ | 12,840 | $ | 11,384 | $ | 12,507 | 3% | |||||||||
| Three Months Ended | 3Q22 vs 3Q19 | |||||||||||||||
| September 30, 2022 | September 30, 2019 | % Change | ||||||||||||||
| TRASM (cents) | 22.18 | 16.58 | ||||||||||||||
| Adjusted for: | ||||||||||||||||
| Third-party refinery sales | (1.80 | ) | (0.01 | ) | ||||||||||||
| Delta Private Jets adjustment | – | (0.06 | ) | |||||||||||||
| TRASM, adjusted | 20.38 | 16.51 | 23% | |||||||||||||
| Nine Months Ended | ||||||||||||||||
| September 30, 2022 | September 30, 2019 | Change | ||||||||||||||
| TRASM (cents) | 21.38 | 16.94 | ||||||||||||||
| Adjusted for: | ||||||||||||||||
| Third-party refinery sales | (2.20 | ) | (0.05 | ) | ||||||||||||
| Delta Private Jets adjustment | – | (0.07 | ) | |||||||||||||
| TRASM, adjusted | 19.18 | 16.83 | 14% | |||||||||||||
Operating Income, adjusted
| Three Months Ended | ||||||||
| (in millions) | September 30, 2022 | September 30, 2019 | ||||||
| Operating Income | $ | 1,456 | $ | 2,071 | ||||
| Adjusted for: | ||||||||
| Restructuring charges | 1 | – | ||||||
| MTM adjustments and settlements on hedges | 36 | (25 | ) | |||||
| Delta Private Jets adjustment | – | 1 | ||||||
| Operating Income, adjusted | $ | 1,492 | $ | 2,047 | ||||
Operating Margin, adjusted
| Three Months Ended | ||||||||
| September 30, 2022 | September 30, 2019 | |||||||
| Operating margin | 10.4% | 16.5% | ||||||
| Adjusted for: | ||||||||
| MTM adjustments and settlements on hedges | 0.3 | (0.2) | ||||||
| Third-party refinery sales | 0.9 | 0.1 | ||||||
| Operating margin, adjusted | 11.6% | 16.4% | ||||||
|
|
Pre-Tax Income, Net Income, and Diluted Earnings per Share, adjusted
| Three Months Ended | Three Months Ended | |||||||||||||||
| September 30, 2022 | September 30, 2022 | |||||||||||||||
| Pre-Tax | Income | Net | Earnings | |||||||||||||
| (in millions, except per share data) | Income | Tax | Income | Per Diluted Share | ||||||||||||
| GAAP | $ | 962 | $ | (267 | ) | $ | 695 | $ | 1.08 | |||||||
| Adjusted for: | ||||||||||||||||
| Restructuring charges | 1 | |||||||||||||||
| Loss on extinguishment of debt | 34 | |||||||||||||||
| MTM adjustments and settlements on hedges | 36 | |||||||||||||||
| MTM adjustments on investments | 245 | |||||||||||||||
| Non-GAAP | $ | 1,276 | $ | (311 | ) | $ | 966 | $ | 1.51 | |||||||
| Three Months Ended | Three Months Ended | |||||||||||||||
| September 30, 2019 | September 30, 2019 | |||||||||||||||
| Pre-Tax | Income | Net | Earnings | |||||||||||||
| (in millions, except per share data) | Income | Tax | Income | Per Diluted Share | ||||||||||||
| GAAP | $ | 1,947 | $ | (452 | ) | $ | 1,495 | $ | 2.31 | |||||||
| Adjusted for: | ||||||||||||||||
| MTM adjustments and settlements on hedges | (25 | ) | ||||||||||||||
| Equity investment MTM adjustments | 10 | |||||||||||||||
| MTM adjustments on investments | 35 | |||||||||||||||
| Delta Private Jets adjustment | 1 | |||||||||||||||
| Non-GAAP | $ | 1,968 | $ | (461 | ) | $ | 1,507 | $ | 2.33 | |||||||
Adjusted Net Debt. Delta uses adjusted total debt, including aircraft rent, in addition to adjusted debt and finance leases, to present estimated financial obligations. Delta reduces adjusted total debt by cash, cash equivalents and short-term investments, and LGA restricted cash, resulting in adjusted net debt, to present the amount of assets needed to satisfy the debt. Management believes this metric is helpful to investors in assessing the company's overall debt profile.
| (in millions) | September 30, 2022 | September 30, 2019 | ||||||
| Debt and finance lease obligations | $ | 23,233 | $ | 10,119 | ||||
| Plus: sale-leaseback financing liabilities | 2,194 | – | ||||||
| Plus: unamortized discount/(premium) and debt issue cost, net and other | 151 | (151 | ) | |||||
| Adjusted debt and finance lease obligations | $ | 25,578 | $ | 9,968 | ||||
| Plus: 7x last twelve months' aircraft rent | 3,485 | 2,948 | ||||||
| Adjusted total debt | $ | 29,062 | $ | 12,916 | ||||
| Less: cash, cash equivalents and short-term investments | (8,368 | ) | (1,899 | ) | ||||
| Less: LGA restricted cash | (153 | ) | (753 | ) | ||||
| Adjusted net debt | $ | 20,541 | $ | 10,265 | ||||
|
|
Operating Expense, adjusted
| Three Months Ended | ||||||||||||
| (in millions) | September 30, 2022 | June 30, 2022 | September 30, 2019 | |||||||||
| Operating expense | $ | 12,519 | $ | 12,305 | $ | 10,489 | ||||||
| Adjusted for: | ||||||||||||
| Restructuring charges | (1 | ) | 1 | – | ||||||||
| MTM adjustments and settlements on hedges | (36 | ) | 73 | 25 | ||||||||
| Third-party refinery sales | (1,134 | ) | (1,514 | ) | (6 | ) | ||||||
| Delta Private Jets adjustment | – | – | (49 | ) | ||||||||
| Operating expense, adjusted | $ | 11,348 | $ | 10,866 | $ | 10,460 | ||||||
Adjusted Non-Fuel Cost and Non-Fuel Unit Cost or Cost per Available Seat Mile, (“CASM-Ex”)
| Three Months Ended | 3Q22 vs 3Q19 |
|||||||||||||||
| (in millions) | September 30, 2022 | June 30, 2022 | September 30, 2019 | % Change | ||||||||||||
| Operating Expense | $ | 12,519 | $ | 12,305 | $ | 10,489 | ||||||||||
| Adjusted for: | ||||||||||||||||
| Restructuring charges | (1 | ) | 1 | – | ||||||||||||
| Aircraft fuel and related taxes | (3,318 | ) | (3,223 | ) | (2,239 | ) | ||||||||||
| Third-party refinery sales | (1,134 | ) | (1,514 | ) | (6 | ) | ||||||||||
| Profit sharing | (237 | ) | (54 | ) | (517 | ) | ||||||||||
| Delta Private Jets adjustment | – | – | (42 | ) | ||||||||||||
| Non-Fuel Cost | $ | 7,829 | $ | 7,516 | $ | 7,685 | 2% | |||||||||
| Three Months Ended |
3Q22 vs 3Q19 |
|||||||||||||||
| September 30, 2022 | December 31, 2019 | September 30, 2019 | % Change | |||||||||||||
| CASM (cents) | 19.87 | 15.34 | 13.85 | |||||||||||||
| Adjusted for: | ||||||||||||||||
| Aircraft fuel and related taxes | (5.26 | ) | (3.08 | ) | (2.96 | ) | ||||||||||
| Third-party refinery sales | (1.80 | ) | – | (0.01 | ) | |||||||||||
| Profit sharing | (0.38 | ) | (0.59 | ) | (0.68 | ) | ||||||||||
| Delta Private Jets adjustment | – | (0.07 | ) | (0.05 | ) | |||||||||||
| CASM-Ex | 12.43 | 11.59 | 10.15 | 22.5% | ||||||||||||
| Nine Months Ended | ||||||||||||||||
| September 30, 2022 | September 30, 2019 | Change | ||||||||||||||
| CASM (cents) | 20.12 | 14.46 | ||||||||||||||
| Adjusted for: | ||||||||||||||||
| Aircraft fuel and related taxes | (4.97 | ) | (3.10 | ) | ||||||||||||
| Third-party refinery sales | (2.20 | ) | (0.05 | ) | ||||||||||||
| Profit sharing | (0.17 | ) | (0.60 | ) | ||||||||||||
| Delta Private Jets adjustment | – | (0.06 | ) | |||||||||||||
| CASM-Ex | 12.78 | 10.66 | 20% | |||||||||||||
|
|
Total Fuel expense, adjusted and Average fuel price per gallon, adjusted
| Average Price Per Gallon | ||||||||||||||||||||||||
| Three Months Ended | Three Months Ended | |||||||||||||||||||||||
| September 30, | June 30, | September 30, | September 30, | June 30, | September 30, | |||||||||||||||||||
| (in millions, except per gallon data) | 2022 | 2022 | 2019 | 2022 | 2022 | 2019 | ||||||||||||||||||
| Total fuel expense | $ | 3,318 | $ | 3,223 | $ | 2,239 | $ | 3.57 | $ | 3.74 | $ | 1.94 | ||||||||||||
| Adjusted for: | ||||||||||||||||||||||||
| MTM adjustments and settlements on hedges | (36 | ) | 73 | 25 | (0.04 | ) | 0.08 | 0.02 | ||||||||||||||||
| Delta Private Jets adjustment | – | – | (7 | ) | – | – | (0.01 | ) | ||||||||||||||||
| Total fuel expense, adjusted | $ | 3,282 | $ | 3,296 | $ | 2,257 | $ | 3.53 | $ | 3.82 | $ | 1.96 | ||||||||||||
| Average Price Per Gallon | ||||||||||||||||||||||||
| Nine Months Ended | Nine Months Ended | |||||||||||||||||||||||
| September 30, | September 30, | September 30, | September 30, | |||||||||||||||||||||
| (in millions, except per gallon data) | 2022 | 2019 | 2022 | 2019 | ||||||||||||||||||||
| Total fuel expense | $ | 8,633 | $ | 6,508 | $ | 3.39 | $ | 2.03 | ||||||||||||||||
| Adjusted for: | ||||||||||||||||||||||||
| MTM adjustments and settlements on hedges | 41 | 8 | 0.02 | – | ||||||||||||||||||||
| Delta Private Jets adjustment | – | (22 | ) | – | (0.01 | ) | ||||||||||||||||||
| Total fuel expense, adjusted | $ | 8,674 | $ | 6,494 | $ | 3.41 | $ | 2.02 | ||||||||||||||||
Gross Capital Expenditures. We adjust capital expenditures for the following items to determine gross capital expenditures for the reasons described below:
Financed aircraft acquisitions. This adjusts capital expenditures to reflect aircraft deliveries that are leased as capital expenditures. The adjustment is based on their original contractual purchase price or an estimate of the aircraft's fair value and provides a more meaningful view of our investing activities.
Net cash flows related to certain airport construction projects. Cash flows related to certain airport construction projects are included in capital expenditures. We have adjusted for these items because management believes investors should be informed that a portion of these capital expenditures from airport construction projects are either funded with restricted cash specific to these projects or reimbursed by a third party.
| Three Months Ended | ||||||||
| (in millions) | September 30, 2022 | September 30, 2019 | ||||||
| Flight equipment, including advance payments | $ | 973 | $ | 549 | ||||
| Ground property and equipment, including technology | 469 | 396 | ||||||
| Adjusted for: | ||||||||
| Financed aircraft acquisitions | 137 | 401 | ||||||
| Net cash flows related to certain airport construction projects | (112 | ) | (123 | ) | ||||
| Gross capital expenditures | $ | 1,467 | $ | 1,223 | ||||
|
|
Exhibit 99.2
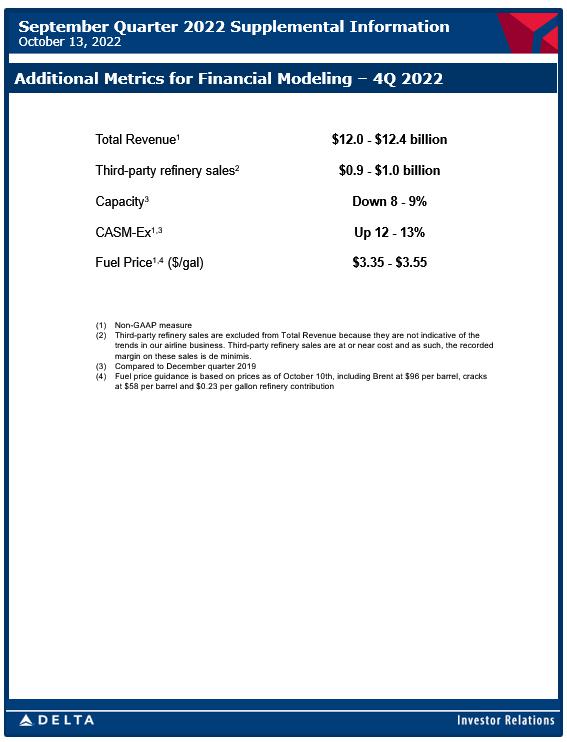
Delta has updated its cost outlook using the non - fuel CASM framework introduced at Capital Markets Day 1 (CMD) on December 16, 2021. Additional Metrics for Financial Modeling – 4Q 2022 September Quarter 2022 Supplemental Information October 13, 2022 Total Revenue 1 $12.0 - $12.4 billion Third - party refinery sales 2 $0.9 - $1.0 billion Capacity 3 Down 8 - 9% CASM - Ex 1,3 Up 12 - 13% Fuel Price 1,4 ($/gal) $3.35 - $3.55 (1) Non - GAAP measure (2) Third - party refinery sales are excluded from Total Revenue because they are not indicative of the trends in our airline business. Third - party refinery sales are at or near cost and as such, the recorded margin on these sales is de minimis. (3) Compared to December quarter 2019 (4) Fuel price guidance is based on prices as of October 10th, including Brent at $96 per barrel, cracks at $58 per barrel and $0.23 per gallon refinery contribution
Forward Looking Statements Statements made in this presentation that are not historical facts, including statements regarding our estimates, expectation s, beliefs, intentions, projections, goals, aspirations, commitments or strategies for the future, should be considered “forward - looking statements” under the Securities Act of 1933, as amended, the Securities Exchange Act of 1934, as amended, and the Private Securities Litigation Reform Act of 1995. Such statements are not guarantees or promised outcomes and should not be construed as such. All forward - looking statements involve a number of risks and uncertainties that could cause actual results to differ materially from the estimates, expectations, beliefs, intentions, projections, goals, aspirations, commitments and str ate gies reflected in or suggested by the forward - looking statements. These risks and uncertainties include, but are not limited to, the material adverse effect that the COVID - 19 pandemic has had on our business; the impact of incurring significant debt in response to the pandemic; failure to comply with the financial and other covenants in our financing agreements; the possible effects of accidents involving our aircraft or aircraft of our airline partners; breaches or lapses in the security of techno log y systems on which we rely and of the data stored within them, as well as compliance with ever - evolving global privacy and security regulatory obligations; disruptions in our information technology infrastructure; our dependence on technology in ou r operations; our commercial relationships with airlines in other parts of the world and the investments we have in certain of tho se airlines; the effects of a significant disruption in the operations or performance of third parties on which we rely; failure to realize the full value of intangible or long - lived assets; labor issues; the effects of weather, natural disasters and seasonality on ou r business; changes in the cost of aircraft fuel; extended disruptions in the supply of aircraft fuel, including from Monroe En erg y, LLC ("Monroe"), a wholly owned subsidiary of Delta; failure or inability of insurance to cover a significant liability at Mon roe ’s Trainer refinery; failure to comply with existing and future environmental regulations to which Monroe’s refinery operations are subject, including costs related to compliance with renewable fuel standard regulations; our ability to retain senior managem ent and other key employees, and to maintain our company culture; significant damage to our reputation and brand, including from exposure to significant adverse publicity or inability to achieve certain sustainability goals; the effects of terrorist atta cks , geopolitical conflict or security events; competitive conditions in the airline industry; extended interruptions or disruptio ns in service at major airports at which we operate or significant problems associated with types of aircraft or engines we operate ; t he effects of extensive government regulation we are subject to; the impact of environmental regulation, including but not limit ed to increased regulation to reduce emissions and other risks associated with climate change, and the cost of compliance with more stringent environmental regulations; and unfavorable economic or political conditions in the markets in which we operate or volatility in currency exchange rates. Additional information concerning risks and uncertainties that could cause differences between actual results and forward - lookin g statements is contained in our Securities and Exchange Commission filings, including our Annual Report on Form 10 - K for the fiscal year ended December 31, 2021 and our Quarterly Report on Form 10 - Q for the quarterly period ended June 30, 2022. Caution should be taken not to place undue reliance on our forward - looking statements, which represent our views only as of the date of this presentation, and which we undertake no obligation to update except to the extent required by law . Non - GAAP Financial Measures Delta sometimes uses information ("non - GAAP financial measures") that is derived from the Consolidated Financial Statements, but that is not presented in accordance with accounting principles generally accepted in the U.S. (“GAAP”). Under the U.S. Securities and Exchange Commission rules, non - GAAP financial measures may be considered in addition to results prepared in accordance with GAAP, but should not be considered a substitute for or superior to GAAP results. The table below shows a reconciliation of the non - GAAP financial measure used in this update to the most directly comparable GAAP financial measure. The reconciliation may not calculate due to rounding. Delta is not able to reconcile certain forward looking non - GAAP financial measures without unreasonable effort because the adjusting items such as those used in the reconciliations below will not be known until the end of the indicated future perio ds and could be significant. Non - GAAP Reconciliations
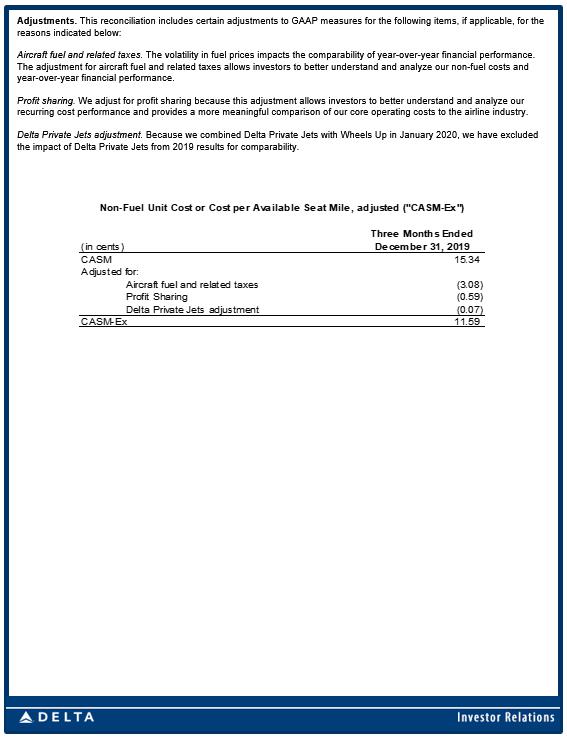
Adjustments. This reconciliation includes certain adjustments to GAAP measures for the following items, if applicable, for the reasons indicated below: Aircraft fuel and related taxes. The volatility in fuel prices impacts the comparability of year - over - year financial performance. The adjustment for aircraft fuel and related taxes allows investors to better understand and analyze our non - fuel costs and year - over - year financial performance. Profit sharing. We adjust for profit sharing because this adjustment allows investors to better understand and analyze our recurring cost performance and provides a more meaningful comparison of our core operating costs to the airline industry. Delta Private Jets adjustment. Because we combined Delta Private Jets with Wheels Up in January 2020, we have excluded the impact of Delta Private Jets from 2019 results for comparability. Three Months Ended (in cents) December 31, 2019 CASM 15.34 Aircraft fuel and related taxes (3.08) Profit Sharing (0.59) Delta Private Jets adjustment (0.07) 11.59 CASM-Ex Adjusted for: Non-Fuel Unit Cost or Cost per Available Seat Mile, adjusted ("CASM-Ex")