| Ireland | 001-37757 | 98-1328821 | ||||||
| (State or Other Jurisdiction of Incorporation) | (Commission File Number) | (IRS Employer Identification Number) | ||||||
|
3 Dublin Landings, North Wall Quay
Dublin 1, Ireland D01 H104
| ||
| (Address of principal executive offices) | ||
| Title of class | Trading symbol(s) | Name of exchange on which registered | ||||||||||||
| Ordinary Shares, par value $0.001 | ADNT | New York Stock Exchange | ||||||||||||
| EXHIBIT INDEX | ||||||||
| Exhibit No. | Exhibit Description | |||||||
| 99.1 | ||||||||
| 104 | Cover Page Interactive Data File (the Cover Page Interactive Data File is embedded within the Inline XBRL document). |
|||||||
| ADIENT PLC | ||||||||
| Date: May 3, 2024 | By: | /s/ Heather M. Tiltmann | ||||||
| Name: | Heather M. Tiltmann | |||||||
| Title: | Executive Vice President, Chief Legal and Human Resources Officer, and Corporate Secretary |
|||||||

| Three Months Ended March 31, |
||||||||||||||
| (in millions, except per share data) | 2024 | 2023 | ||||||||||||
| Net sales | $ | 3,750 | $ | 3,912 | ||||||||||
| Cost of sales | 3,520 | 3,662 | ||||||||||||
| Gross profit | 230 | 250 | ||||||||||||
| Selling, general and administrative expenses | 115 | 141 | ||||||||||||
| Restructuring and impairment costs | 125 | 17 | ||||||||||||
| Equity income | 18 | 4 | ||||||||||||
| Earnings before interest and income taxes | 8 | 96 | ||||||||||||
| Net financing charges | 47 | 59 | ||||||||||||
| Other pension expense | 2 | 2 | ||||||||||||
| Income (loss) before income taxes | (41) | 35 | ||||||||||||
| Income tax expense (benefit) | 8 | 25 | ||||||||||||
| Net income (loss) | (49) | 10 | ||||||||||||
| Income (loss) attributable to noncontrolling interests | 21 | 25 | ||||||||||||
| Net income (loss) attributable to Adient | $ | (70) | $ | (15) | ||||||||||
| Diluted earnings (loss) per share | $ | (0.77) | $ | (0.16) | ||||||||||
| Shares outstanding at period end | 89.8 | 94.7 | ||||||||||||
| Diluted weighted average shares | 90.5 | 95.3 | ||||||||||||
| March 31, | September 30, | |||||||||||||
| (in millions) | 2024 | 2023 | ||||||||||||
| Assets | ||||||||||||||
| Cash and cash equivalents | $ | 905 | $ | 1,110 | ||||||||||
Accounts receivable - net |
1,896 | 1,874 | ||||||||||||
| Inventories | 791 | 841 | ||||||||||||
| Other current assets | 533 | 491 | ||||||||||||
| Current assets | 4,125 | 4,316 | ||||||||||||
| Property, plant and equipment - net | 1,371 | 1,382 | ||||||||||||
| Goodwill | 2,099 | 2,094 | ||||||||||||
| Other intangible assets - net | 382 | 408 | ||||||||||||
| Investments in partially-owned affiliates | 330 | 303 | ||||||||||||
| Assets held for sale | 8 | 7 | ||||||||||||
| Other noncurrent assets | 963 | 914 | ||||||||||||
| Total assets | $ | 9,278 | $ | 9,424 | ||||||||||
| Liabilities and Shareholders' Equity | ||||||||||||||
| Short-term debt | $ | 134 | $ | 134 | ||||||||||
| Accounts payable and accrued expenses | 2,856 | 2,926 | ||||||||||||
| Other current liabilities | 668 | 678 | ||||||||||||
| Current liabilities | 3,658 | 3,738 | ||||||||||||
| Long-term debt | 2,401 | 2,401 | ||||||||||||
| Other noncurrent liabilities | 759 | 682 | ||||||||||||
| Redeemable noncontrolling interests | 58 | 57 | ||||||||||||
| Shareholders' equity attributable to Adient | 2,075 | 2,228 | ||||||||||||
| Noncontrolling interests | 327 | 318 | ||||||||||||
| Total liabilities and shareholders' equity | $ | 9,278 | $ | 9,424 | ||||||||||
| Three Months Ended March 31, |
||||||||||||||
| (in millions) | 2024 | 2023 | ||||||||||||
| Operating Activities | ||||||||||||||
| Net income (loss) attributable to Adient | $ | (70) | $ | (15) | ||||||||||
| Income attributable to noncontrolling interests | 21 | 25 | ||||||||||||
| Net income (loss) | (49) | 10 | ||||||||||||
| Adjustments to reconcile net income (loss) to cash provided (used) by operating activities: | ||||||||||||||
| Depreciation | 70 | 71 | ||||||||||||
| Amortization of intangibles | 12 | 13 | ||||||||||||
| Pension and postretirement benefit expense (benefit) | 3 | 4 | ||||||||||||
| Pension and postretirement contributions, net | (6) | (6) | ||||||||||||
| Equity in earnings of partially-owned affiliates, net of dividends received | (14) | (10) | ||||||||||||
| Impairment of interests in nonconsolidated partially-owned affiliates | — | 7 | ||||||||||||
| Premium paid on repurchase of debt | — | 7 | ||||||||||||
| Deferred income taxes | (1) | (3) | ||||||||||||
| Equity-based compensation | 10 | 10 | ||||||||||||
| Other | 2 | 5 | ||||||||||||
| Changes in assets and liabilities: | ||||||||||||||
| Receivables | (267) | (265) | ||||||||||||
| Inventories | 27 | 59 | ||||||||||||
| Other assets | 22 | (24) | ||||||||||||
| Accounts payable and accrued liabilities | 292 | 249 | ||||||||||||
| Accrued income taxes | (20) | (1) | ||||||||||||
| Cash provided (used) by operating activities | 81 | 126 | ||||||||||||
| Investing Activities | ||||||||||||||
| Capital expenditures | (69) | (56) | ||||||||||||
| Business acquisitions | — | (5) | ||||||||||||
| Cash provided (used) by investing activities | (69) | (61) | ||||||||||||
| Financing Activities | ||||||||||||||
| Increase (decrease) in short-term debt | (7) | (2) | ||||||||||||
| Increase (decrease) in long-term debt | — | 1,000 | ||||||||||||
| Repayment of long-term debt | (1) | (1,102) | ||||||||||||
| Debt financing costs | (5) | (16) | ||||||||||||
| Share repurchases | (50) | (28) | ||||||||||||
| Dividends paid to noncontrolling interests | (3) | (2) | ||||||||||||
| Share based compensation and other | — | 1 | ||||||||||||
| Cash provided (used) by financing activities | (66) | (149) | ||||||||||||
| Effect of exchange rate changes on cash and cash equivalents | (31) | 9 | ||||||||||||
| Increase (decrease) in cash and cash equivalents | $ | (85) | $ | (75) | ||||||||||
| (in millions) | Three months ended March 31, 2024 | |||||||||||||||||||||||||||||||
| Americas | EMEA | Asia | Corporate/Eliminations | Consolidated | ||||||||||||||||||||||||||||
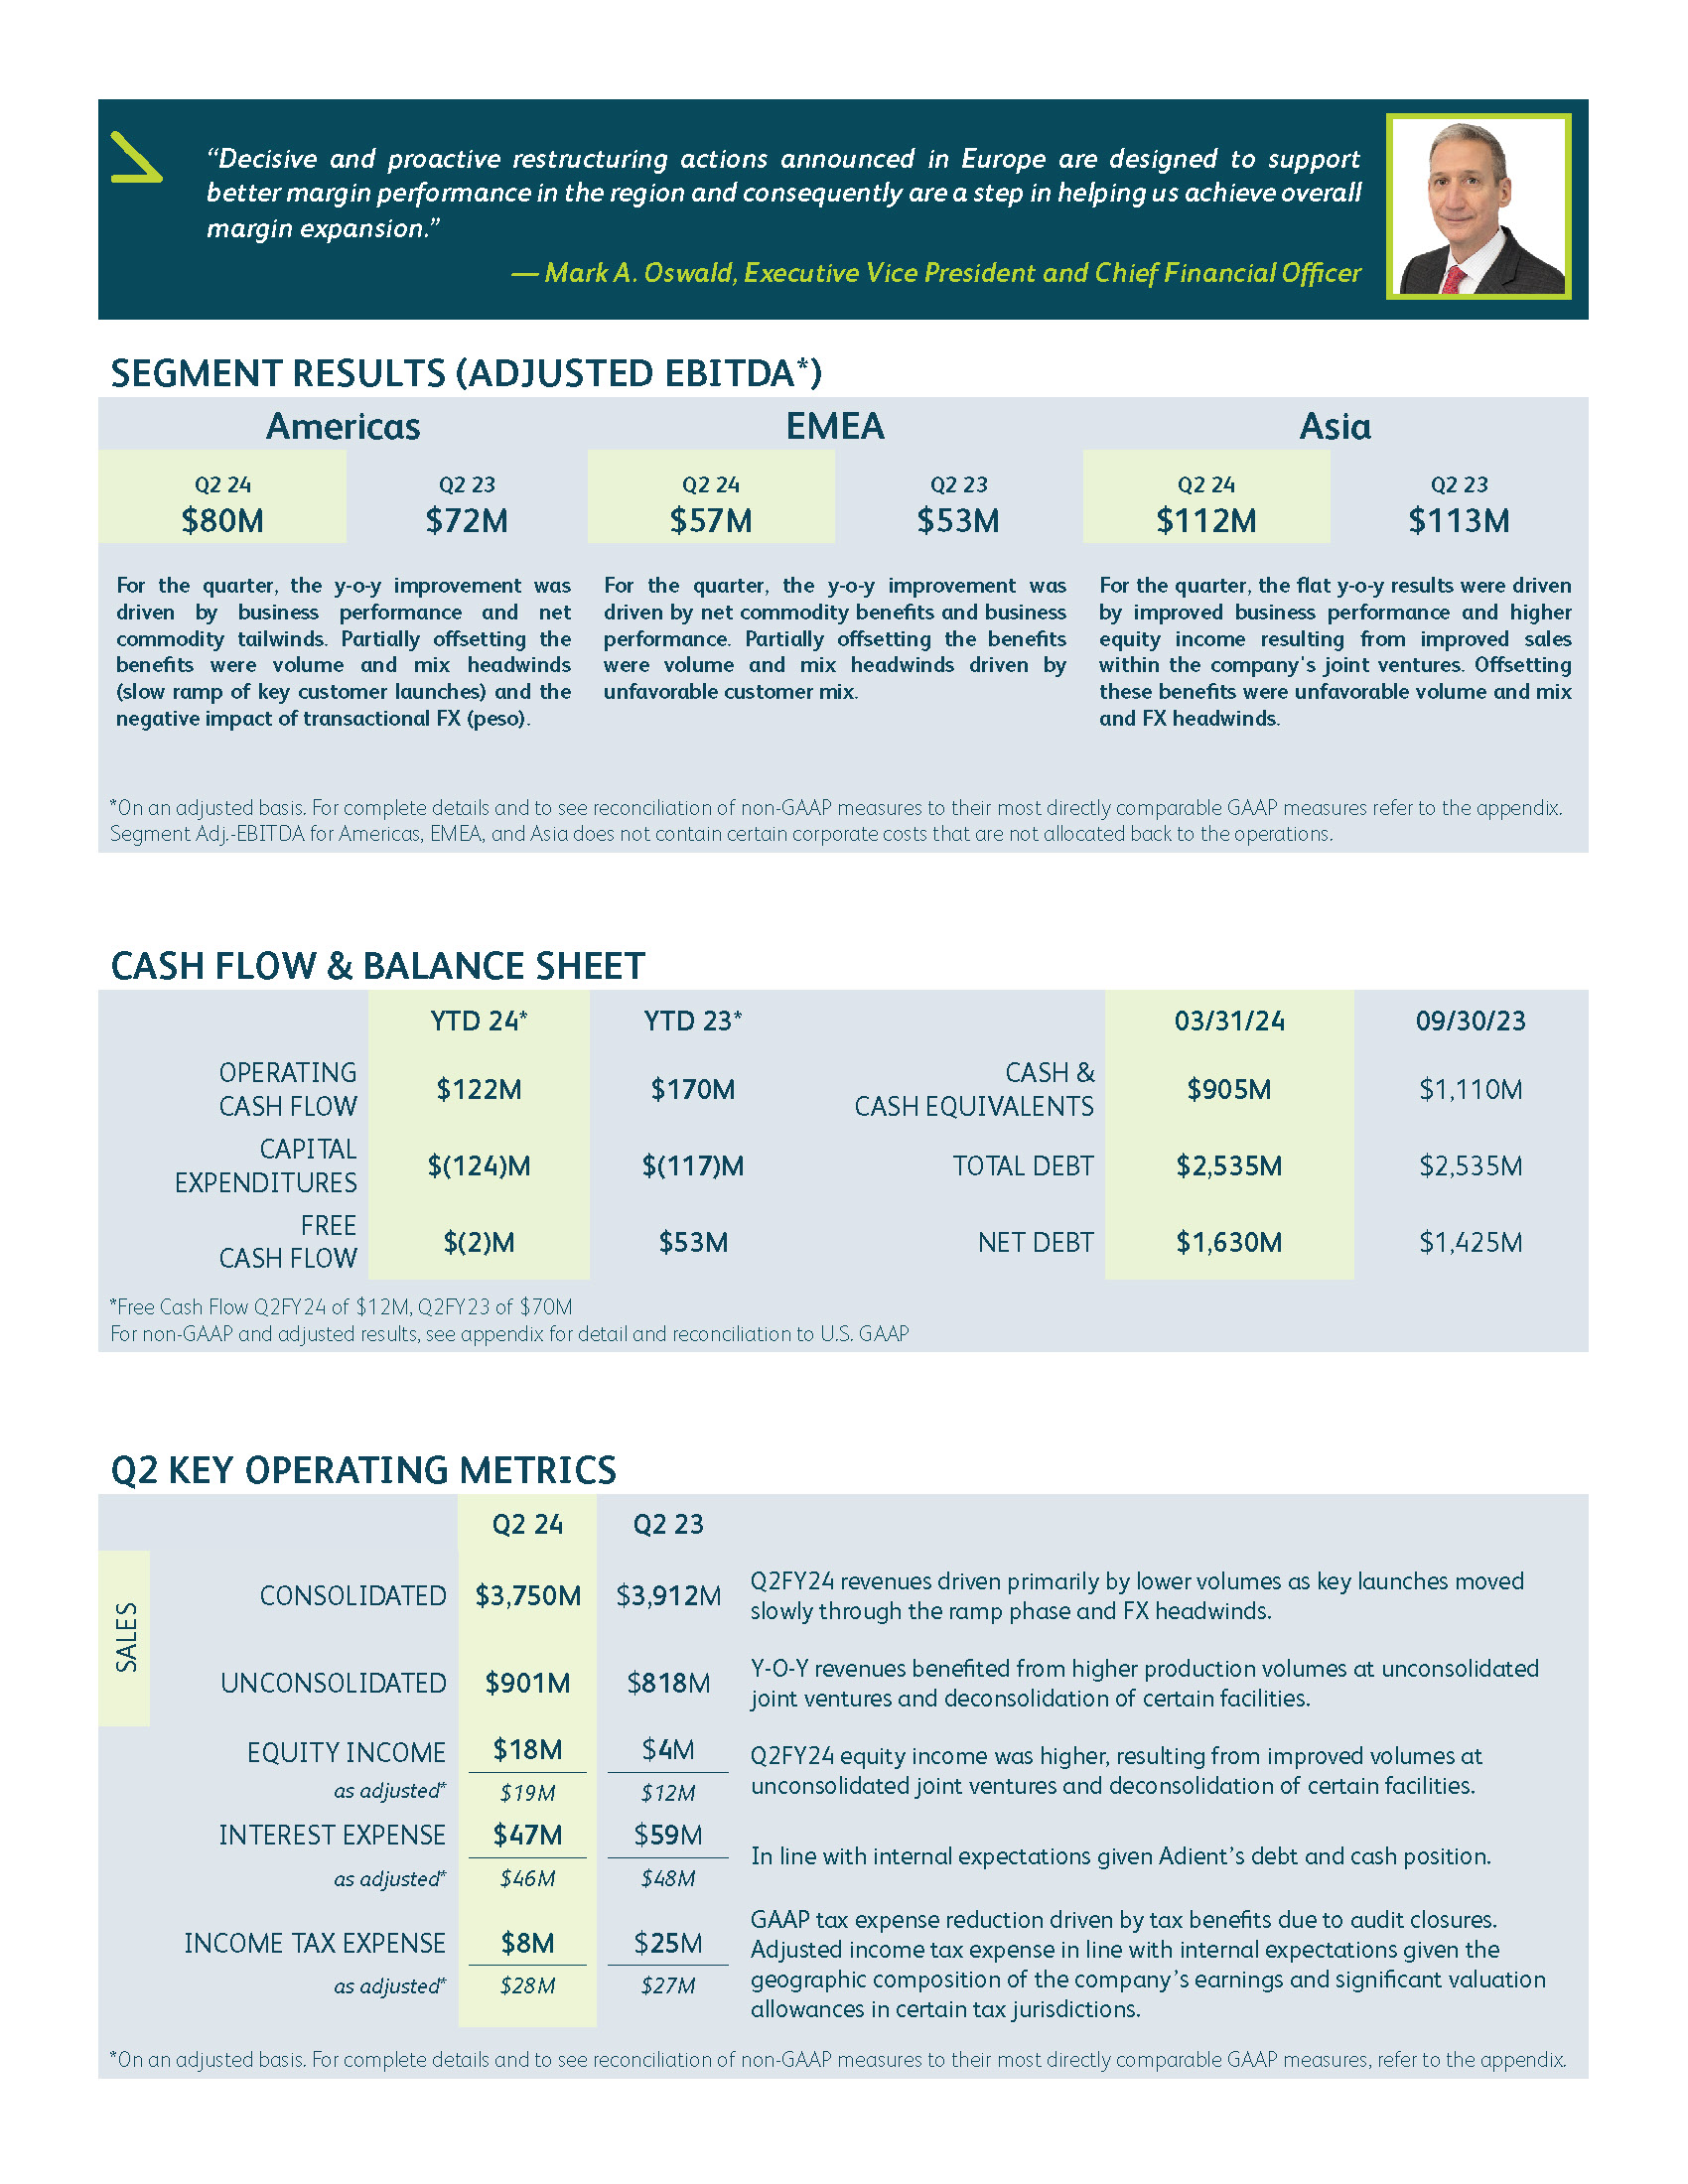
| Net sales | $ | 1,660 | $ | 1,370 | $ | 742 | $ | (22) | $ | 3,750 | ||||||||||||||||||||||
| Adjusted EBITDA | $ | 80 | $ | 57 | $ | 112 | $ | (22) | $ | 227 | ||||||||||||||||||||||
| Adjusted EBITDA margin | 4.8 | % | 4.2 | % | 15.1 | % | N/A | 6.1 | % | |||||||||||||||||||||||
| Three months ended March 31, 2023 | ||||||||||||||||||||||||||||||||
| Americas | EMEA | Asia | Corporate/Eliminations | Consolidated | ||||||||||||||||||||||||||||
| Net sales | $ | 1,761 | $ | 1,401 | $ | 774 | $ | (24) | $ | 3,912 | ||||||||||||||||||||||
| Adjusted EBITDA | $ | 72 | $ | 53 | $ | 113 | $ | (23) | $ | 215 | ||||||||||||||||||||||
| Adjusted EBITDA margin | 4.1 | % | 3.8 | % | 14.6 | % | N/A | 5.5 | % | |||||||||||||||||||||||
| Three Months Ended March 31, |
||||||||||||||
| (in millions) | 2024 | 2023 | ||||||||||||
| Adjusted EBITDA | ||||||||||||||
| Americas | $ | 80 | $ | 72 | ||||||||||
| EMEA | 57 | 53 | ||||||||||||
| Asia | 112 | 113 | ||||||||||||
| Subtotal | 249 | 238 | ||||||||||||
Corporate-related costs (1) |
(22) | (23) | ||||||||||||
Restructuring and impairment costs (2) |
(125) | (17) | ||||||||||||
Purchase accounting amortization (3) |
(13) | (14) | ||||||||||||
Restructuring related activities (4) |
(2) | — | ||||||||||||
Impairment of interests in nonconsolidated partially-owned affiliates (6) |
— | (7) | ||||||||||||
| Equity based compensation | (10) | (10) | ||||||||||||
| Depreciation | (70) | (71) | ||||||||||||
Other items (5) |
1 | — | ||||||||||||
| Earnings before interest and income taxes | $ | 8 | $ | 96 | ||||||||||
| Net financing charges | (47) | (59) | ||||||||||||
| Other pension income (expense) | (2) | (2) | ||||||||||||
| Income (loss) before income taxes | $ | (41) | $ | 35 | ||||||||||
| Three Months Ended March 31, |
||||||||||||||
| (in millions, except per share data) | 2024 | 2023 | ||||||||||||
| Income available to shareholders | ||||||||||||||
| Net income (loss) attributable to Adient | $ | (70) | $ | (15) | ||||||||||
| Weighted average shares outstanding | ||||||||||||||
| Basic weighted average shares outstanding | 90.5 | 95.3 | ||||||||||||
| Effect of dilutive securities: | ||||||||||||||
| Unvested restricted stock and unvested performance share awards | — | — | ||||||||||||
| Diluted weighted average shares outstanding | 90.5 | 95.3 | ||||||||||||
| Earnings (loss) per share: | ||||||||||||||
| Basic | $ | (0.77) | $ | (0.16) | ||||||||||
| Diluted | $ | (0.77) | $ | (0.16) | ||||||||||
| (a) | Adjusted EBIT is defined as income (loss) before income taxes and noncontrolling interests excluding net financing charges, restructuring, impairment and related costs, purchase accounting amortization, transaction gains/losses, other significant non-recurring items, and net mark-to-market adjustments on pension and postretirement plans. Adjusted EBIT margin is adjusted EBIT as a percentage of net sales. | ||||
| (b) | Adjusted EBITDA is defined as adjusted EBIT excluding depreciation and equity based compensation. Certain corporate-related costs are not allocated to the business segments in determining Adjusted EBITDA. Adjusted EBITDA margin is adjusted EBITDA as a percentage of net sales. | ||||
| (c) | Adjusted net income attributable to Adient is defined as net income (loss) attributable to Adient excluding restructuring, impairment and related costs, purchase accounting amortization, transaction gains/losses, expenses associated with becoming an independent company, other significant non-recurring items, net mark-to-market adjustments on pension and postretirement plans, the tax impact of these items and other discrete tax charges/benefits. | ||||
| (d) | Adjusted income tax expense is defined as income tax expense (benefit) adjusted for the tax effect of the adjustments to income (loss) before income taxes and other discrete tax changes/benefits. Adjusted effective tax rate is defined as adjusted income tax provision as a percentage of adjusted income (loss) before income taxes. | ||||
| (e) | Adjusted diluted earnings per share is defined as adjusted net income attributable to Adient divided by diluted weighted average shares. | ||||
| (f) | Adjusted equity income is defined as equity income excluding amortization of Adient's intangible assets related to its non-consolidated joint ventures and other unusual or non-recurring items impacting equity income. | ||||
| (g) | Adjusted interest expense is defined as net financing charges excluding unusual or one-time items impacting interest expense. | ||||
| (h) | Free cash flow is defined as cash provided by operating activities less capital expenditures. | ||||
| (i) | Net debt is calculated as total debt (short-term and long-term) less cash and cash equivalents. | ||||
| (j) | Net leverage ratio is calculated as net debt divided by adjusted EBITDA for the last four quarters. | ||||
| Three Months Ended March 31, |
||||||||||||||
| (in millions) | 2024 | 2023 | ||||||||||||
| Net income (loss) | $ | (49) | $ | 10 | ||||||||||
| Net financing charges | 47 | 59 | ||||||||||||
| Other pension expense | 2 | 2 | ||||||||||||
| Income tax expense (benefit) | 8 | 25 | ||||||||||||
| Earnings before interest and income taxes (EBIT) | $ | 8 | $ | 96 | ||||||||||
| EBIT adjustments: | ||||||||||||||
Restructuring charges (2) |
125 | 17 | ||||||||||||
Purchase accounting amortization (3) |
13 | 14 | ||||||||||||
Restructuring related activities (4) |
2 | — | ||||||||||||
Impairment of interests in nonconsolidated partially-owned affiliates (6) |
— | 7 | ||||||||||||
| Transaction costs | — | 1 | ||||||||||||
| Brazil indirect tax recoveries | (1) | (1) | ||||||||||||
| EBIT adjustments total | 139 | 38 | ||||||||||||
| Adjusted EBIT | $ | 147 | $ | 134 | ||||||||||
| EBITDA adjustments: | ||||||||||||||
| Depreciation | 70 | 71 | ||||||||||||
| Equity based compensation | 10 | 10 | ||||||||||||
| Adjusted EBITDA | $ | 227 | $ | 215 | ||||||||||
| Net sales | $ | 3,750 | $ | 3,912 | ||||||||||
| Net income (loss) as % of net sales | (1.3) | % | 0.3 | % | ||||||||||
| EBIT as % of net sales | 0.2 | % | 2.5 | % | ||||||||||
| Adjusted EBIT as % of net sales | 3.9 | % | 3.4 | % | ||||||||||
| Adjusted EBITDA as % of net sales | 6.1 | % | 5.5 | % | ||||||||||
| Three Months Ended March 31, |
||||||||||||||
| (in millions) | 2024 | 2023 | ||||||||||||
| Net income (loss) attributable to Adient | $ | (70) | $ | (15) | ||||||||||
| Net income adjustments: | ||||||||||||||
| EBIT adjustments total - see table (a) & (b) | 139 | 38 | ||||||||||||
| Tax impact of EBIT adjustments and other tax items - see table (d) | (20) | (2) | ||||||||||||
| Fees paid on Term Loan B modifications | 1 | — | ||||||||||||
| Premium paid on repurchase of debt | — | 7 | ||||||||||||
| Write off of deferred financing costs upon repurchase of debt | — | 4 | ||||||||||||
Impact of adjustments on noncontrolling interests (7) |
(1) | (1) | ||||||||||||
| Net income adjustments total | 119 | 46 | ||||||||||||
| Adjusted net income attributable to Adient | $ | 49 | $ | 31 | ||||||||||
| Three months ended March 31, | ||||||||||||||||||||||||||||||||||||||
| 2024 | 2023 | |||||||||||||||||||||||||||||||||||||
| (in millions, except effective tax rate) | Income (loss) before income taxes | Income tax expense (benefit) | Effective tax rate | Income (loss) before income taxes | Income tax expense (benefit) | Effective tax rate | ||||||||||||||||||||||||||||||||
| As reported | $ | (41) | $ | 8 | (19.5) | % | $ | 35 | $ | 25 | 71.4 | % | ||||||||||||||||||||||||||
| Adjustments | ||||||||||||||||||||||||||||||||||||||
| EBIT adjustments - see table (a) & (b) | 139 | 3 | 2.2 | % | 38 | 1 | 2.6 | % | ||||||||||||||||||||||||||||||
| Tax audit closures and statute expirations | — | 14 | nm | — | 1 | nm | ||||||||||||||||||||||||||||||||
| Net financing charges | 1 | — | — | % | 11 | — | — | % | ||||||||||||||||||||||||||||||
| FX remeasurements of tax balances | — | 3 | nm | — | 2 | nm | ||||||||||||||||||||||||||||||||
| Other | — | — | nm | — | (2) | nm | ||||||||||||||||||||||||||||||||
| Subtotal of adjustments | 140 | 20 | 14.3 | % | 49 | 2 | 4.1 | % | ||||||||||||||||||||||||||||||
| As adjusted | $ | 99 | $ | 28 | 28.3 | % | $ | 84 | $ | 27 | 32.1 | % | ||||||||||||||||||||||||||
| Three Months Ended March 31, |
||||||||||||||
| (in millions, except per share data) | 2024 | 2023 | ||||||||||||
| Numerator: | ||||||||||||||
| Adjusted net income attributable to Adient - see table (c) | $ | 49 | $ | 31 | ||||||||||
| Denominator: | ||||||||||||||
| Basic weighted average shares outstanding | 90.5 | 95.3 | ||||||||||||
| Effect of dilutive securities: | ||||||||||||||
| Unvested restricted stock and unvested performance share awards | 0.7 | 0.8 | ||||||||||||
| Diluted weighted average shares outstanding | 91.2 | 96.1 | ||||||||||||
| Adjusted diluted earnings per share | $ | 0.54 | $ | 0.32 | ||||||||||
| Three Months Ended March 31, |
||||||||||||||
| 2024 | 2023 | |||||||||||||
| Diluted earnings (loss) per share as reported | $ | (0.77) | $ | (0.16) | ||||||||||
| EBIT adjustments total | 1.53 | 0.40 | ||||||||||||
| Tax impact of EBIT adjustments and other tax items | (0.22) | (0.02) | ||||||||||||
| Fees paid on Term Loan B modifications | 0.01 | — | ||||||||||||
| Premium paid on repurchase of debt | — | 0.07 | ||||||||||||
| Write off of deferred financing costs upon repurchase of debt | — | 0.04 | ||||||||||||
| Impact of adjustments on noncontrolling interests | (0.01) | (0.01) | ||||||||||||
| Adjusted diluted earnings per share | $ | 0.54 | $ | 0.32 | ||||||||||
| Three Months Ended March 31, |
||||||||||||||
| (in millions) | 2024 | 2023 | ||||||||||||
| Equity income | $ | 18 | $ | 4 | ||||||||||
| Equity income adjustments: | ||||||||||||||
| Impairment of interests in nonconsolidated partially owned affiliates | — | 7 | ||||||||||||
| Purchase accounting amortization | 1 | 1 | ||||||||||||
| Equity income adjustments total | 1 | 8 | ||||||||||||
| Adjusted equity income | $ | 19 | $ | 12 | ||||||||||
| Three Months Ended March 31, |
||||||||||||||
| (in millions) | 2024 | 2023 | ||||||||||||
| Net financing charges | $ | 47 | $ | 59 | ||||||||||
| Interest expense adjustments: | ||||||||||||||
| Premium paid on repurchase of debt | — | (7) | ||||||||||||
| Write off of deferred financing costs upon repurchase of debt | — | (4) | ||||||||||||
| Fees paid on Term Loan B modifications | (1) | — | ||||||||||||
| Interest expense adjustments total | (1) | (11) | ||||||||||||
| Adjusted net financing charges | $ | 46 | $ | 48 | ||||||||||
| Three Months Ended March 31, |
Six Months Ended March 31, |
|||||||||||||||||||||||||
| (in millions) | 2024 | 2023 | 2024 | 2023 | ||||||||||||||||||||||
| Operating cash flow | $ | 81 | $ | 126 | $ | 122 | $ | 170 | ||||||||||||||||||
| Capital expenditures | (69) | (56) | (124) | (117) | ||||||||||||||||||||||
| Free cash flow | $ | 12 | $ | 70 | $ | (2) | $ | 53 | ||||||||||||||||||
| Three Months Ended March 31, |
Six Months Ended March 31, |
|||||||||||||||||||||||||
| (in millions) | 2024 | 2023 | 2024 | 2023 | ||||||||||||||||||||||
| Adjusted EBITDA | $ | 227 | $ | 215 | $ | 443 | $ | 427 | ||||||||||||||||||
| Adjusted equity income | (19) | (12) | (44) | (39) | ||||||||||||||||||||||
| Dividend | 5 | 1 | 21 | 13 | ||||||||||||||||||||||
| Restructuring (cash) | (11) | (10) | (21) | (40) | ||||||||||||||||||||||
| Net customer tooling | 19 | (23) | 2 | (37) | ||||||||||||||||||||||
| Trade working capital (Net AR/AP + Inventory) | (76) | (14) | 35 | 32 | ||||||||||||||||||||||
| Accrued compensation | 14 | 38 | (50) | 10 | ||||||||||||||||||||||
| Interest paid | (37) | (64) | (97) | (88) | ||||||||||||||||||||||
| Tax refund/taxes paid | (28) | (29) | (52) | (49) | ||||||||||||||||||||||
| Non-income related taxes (VAT) | 7 | 27 | (21) | 8 | ||||||||||||||||||||||
| Commercial settlements | (24) | 45 | (8) | 28 | ||||||||||||||||||||||
| Capitalized engineering | 6 | (9) | (11) | (34) | ||||||||||||||||||||||
| Prepaids | (2) | (1) | (21) | (25) | ||||||||||||||||||||||
| Other | — | (38) | (54) | (36) | ||||||||||||||||||||||
| Operating cash flow | 81 | 126 | 122 | 170 | ||||||||||||||||||||||
| Capital expenditures | (69) | (56) | (124) | (117) | ||||||||||||||||||||||
| Free cash flow | $ | 12 | $ | 70 | $ | (2) | $ | 53 | ||||||||||||||||||
| March 31, | September 30, | |||||||||||||
| (in millions) | 2024 | 2023 | ||||||||||||
| Numerator: | ||||||||||||||
| Short-term debt | $ | — | $ | 2 | ||||||||||
| Current portion of long-term debt | 134 | 132 | ||||||||||||
| Long-term debt | 2,401 | 2,401 | ||||||||||||
| Total debt | 2,535 | 2,535 | ||||||||||||
| Less: cash and cash equivalents | (905) | (1,110) | ||||||||||||
| Net debt | $ | 1,630 | $ | 1,425 | ||||||||||
| Denominator: | ||||||||||||||
| Adjusted EBITDA - last four quarters | ||||||||||||||
| Q1 2023 | na | 212 | ||||||||||||
| Q2 2023 | na | 215 | ||||||||||||
| Q3 2023 | 276 | 276 | ||||||||||||
| Q4 2023 | 235 | 235 | ||||||||||||
| Q1 2024 | 216 | na | ||||||||||||
| Q2 2024 - see table (a) & (b) | 227 | na | ||||||||||||
| Last four quarters | $ | 954 | $ | 938 | ||||||||||
| Net leverage ratio | 1.71 | 1.52 | ||||||||||||
| Three Months Ended March 31, |
||||||||||||||
| (in millions) | 2024 | 2023 | ||||||||||||
| Transaction costs | $ | — | $ | (1) | ||||||||||
| Brazil indirect tax recoveries | 1 | 1 | ||||||||||||
| $ | 1 | $ | — | |||||||||||