| Ireland | 001-37757 | 98-1328821 | ||||||
| (State or Other Jurisdiction of Incorporation) | (Commission File Number) | (IRS Employer Identification Number) | ||||||
|
3 Dublin Landings, North Wall Quay
Dublin 1, Ireland D01 H104
| ||
| (Address of principal executive offices) | ||
| Title of class | Trading symbol(s) | Name of exchange on which registered | ||||||||||||
| Ordinary Shares, par value $0.001 | ADNT | New York Stock Exchange | ||||||||||||
| EXHIBIT INDEX | ||||||||
| Exhibit No. | Exhibit Description | |||||||
| 99.1 | ||||||||
| 104 | Cover Page Interactive Data File (the Cover Page Interactive Data File is embedded within the Inline XBRL document). |
|||||||
| ADIENT PLC | ||||||||
| Date: February 7, 2024 | By: | /s/ Heather M. Tiltmann | ||||||
| Name: | Heather M. Tiltmann | |||||||
| Title: | Executive Vice President, Chief Legal and Human Resources Officer, and Corporate Secretary |
|||||||
| Three Months Ended December 31, |
||||||||||||||
| (in millions, except per share data) | 2023 | 2022 | ||||||||||||
| Net sales | $ | 3,660 | $ | 3,699 | ||||||||||
| Cost of sales | 3,414 | 3,468 | ||||||||||||
| Gross profit | 246 | 231 | ||||||||||||
| Selling, general and administrative expenses | 147 | 138 | ||||||||||||
| Restructuring and impairment costs | 11 | 7 | ||||||||||||
| Equity income | 23 | 28 | ||||||||||||
| Earnings before interest and income taxes | 111 | 114 | ||||||||||||
| Net financing charges | 44 | 41 | ||||||||||||
| Other pension expense | 2 | 9 | ||||||||||||
| Income before income taxes | 65 | 64 | ||||||||||||
| Income tax provision (benefit) | 20 | 31 | ||||||||||||
| Net income | 45 | 33 | ||||||||||||
| Income attributable to noncontrolling interests | 25 | 21 | ||||||||||||
| Net income attributable to Adient | $ | 20 | $ | 12 | ||||||||||
| Diluted earnings per share | $ | 0.21 | $ | 0.13 | ||||||||||
| Shares outstanding at period end | 91.2 | 95.4 | ||||||||||||
| Diluted weighted average shares | 93.6 | 95.9 | ||||||||||||
| December 31, | September 30, | |||||||||||||
| (in millions) | 2023 | 2023 | ||||||||||||
| Assets | ||||||||||||||
| Cash and cash equivalents | $ | 990 | $ | 1,110 | ||||||||||
Accounts receivable - net |
1,661 | 1,874 | ||||||||||||
| Inventories | 833 | 841 | ||||||||||||
| Other current assets | 590 | 491 | ||||||||||||
| Current assets | 4,074 | 4,316 | ||||||||||||
| Property, plant and equipment - net | 1,401 | 1,382 | ||||||||||||
| Goodwill | 2,138 | 2,094 | ||||||||||||
| Other intangible assets - net | 401 | 408 | ||||||||||||
| Investments in partially-owned affiliates | 322 | 303 | ||||||||||||
| Assets held for sale | 7 | 7 | ||||||||||||
| Other noncurrent assets | 954 | 914 | ||||||||||||
| Total assets | $ | 9,297 | $ | 9,424 | ||||||||||
| Liabilities and Shareholders' Equity | ||||||||||||||
| Short-term debt | $ | 144 | $ | 134 | ||||||||||
| Accounts payable and accrued expenses | 2,751 | 2,926 | ||||||||||||
| Other current liabilities | 653 | 678 | ||||||||||||
| Current liabilities | 3,548 | 3,738 | ||||||||||||
| Long-term debt | 2,403 | 2,401 | ||||||||||||
| Other noncurrent liabilities | 673 | 682 | ||||||||||||
| Redeemable noncontrolling interests | 57 | 57 | ||||||||||||
| Shareholders' equity attributable to Adient | 2,285 | 2,228 | ||||||||||||
| Noncontrolling interests | 331 | 318 | ||||||||||||
| Total liabilities and shareholders' equity | $ | 9,297 | $ | 9,424 | ||||||||||
| Three Months Ended December 31, |
||||||||||||||
| (in millions) | 2023 | 2022 | ||||||||||||
| Operating Activities | ||||||||||||||
| Net income attributable to Adient | $ | 20 | $ | 12 | ||||||||||
| Income attributable to noncontrolling interests | 25 | 21 | ||||||||||||
| Net income | 45 | 33 | ||||||||||||
| Adjustments to reconcile net income to cash provided (used) by operating activities: | ||||||||||||||
| Depreciation | 72 | 69 | ||||||||||||
| Amortization of intangibles | 11 | 12 | ||||||||||||
| Pension and postretirement benefit expense (benefit) | 3 | 9 | ||||||||||||
| Pension and postretirement contributions, net | (10) | (3) | ||||||||||||
| Equity in earnings of partially-owned affiliates, net of dividends received | (6) | (16) | ||||||||||||
| Deferred income taxes | (6) | (1) | ||||||||||||
| Equity-based compensation | 13 | 8 | ||||||||||||
| Other | — | (3) | ||||||||||||
| Changes in assets and liabilities: | ||||||||||||||
| Receivables | 234 | 167 | ||||||||||||
| Inventories | 29 | 22 | ||||||||||||
| Other assets | (81) | (47) | ||||||||||||
| Restructuring reserves | (9) | (27) | ||||||||||||
| Accounts payable and accrued liabilities | (256) | (191) | ||||||||||||
| Accrued income taxes | 2 | 12 | ||||||||||||
| Cash provided (used) by operating activities | 41 | 44 | ||||||||||||
| Investing Activities | ||||||||||||||
| Capital expenditures | (55) | (61) | ||||||||||||
| Sale of property, plant and equipment | 14 | 15 | ||||||||||||
| Business acquisitions | — | (6) | ||||||||||||
| Proceeds from business divestitures, net | (3) | 3 | ||||||||||||
| Other | — | (1) | ||||||||||||
| Cash provided (used) by investing activities | (44) | (50) | ||||||||||||
| Financing Activities | ||||||||||||||
| Increase (decrease) in short-term debt | 5 | — | ||||||||||||
| Increase (decrease) in long-term debt | — | 2 | ||||||||||||
| Repayment of long-term debt | — | (2) | ||||||||||||
| Debt financing costs | — | (7) | ||||||||||||
| Share repurchases | (100) | — | ||||||||||||
| Dividends paid to noncontrolling interests | (48) | (50) | ||||||||||||
| Share based compensation and other | (12) | (12) | ||||||||||||
| Cash provided (used) by financing activities | (155) | (69) | ||||||||||||
| Effect of exchange rate changes on cash and cash equivalents | 38 | 29 | ||||||||||||
| Increase (decrease) in cash and cash equivalents | $ | (120) | $ | (46) | ||||||||||
| Three Months Ended December 31, |
||||||||||||||
| (in millions) | 2023 | 2022 | ||||||||||||
| Net Sales | ||||||||||||||
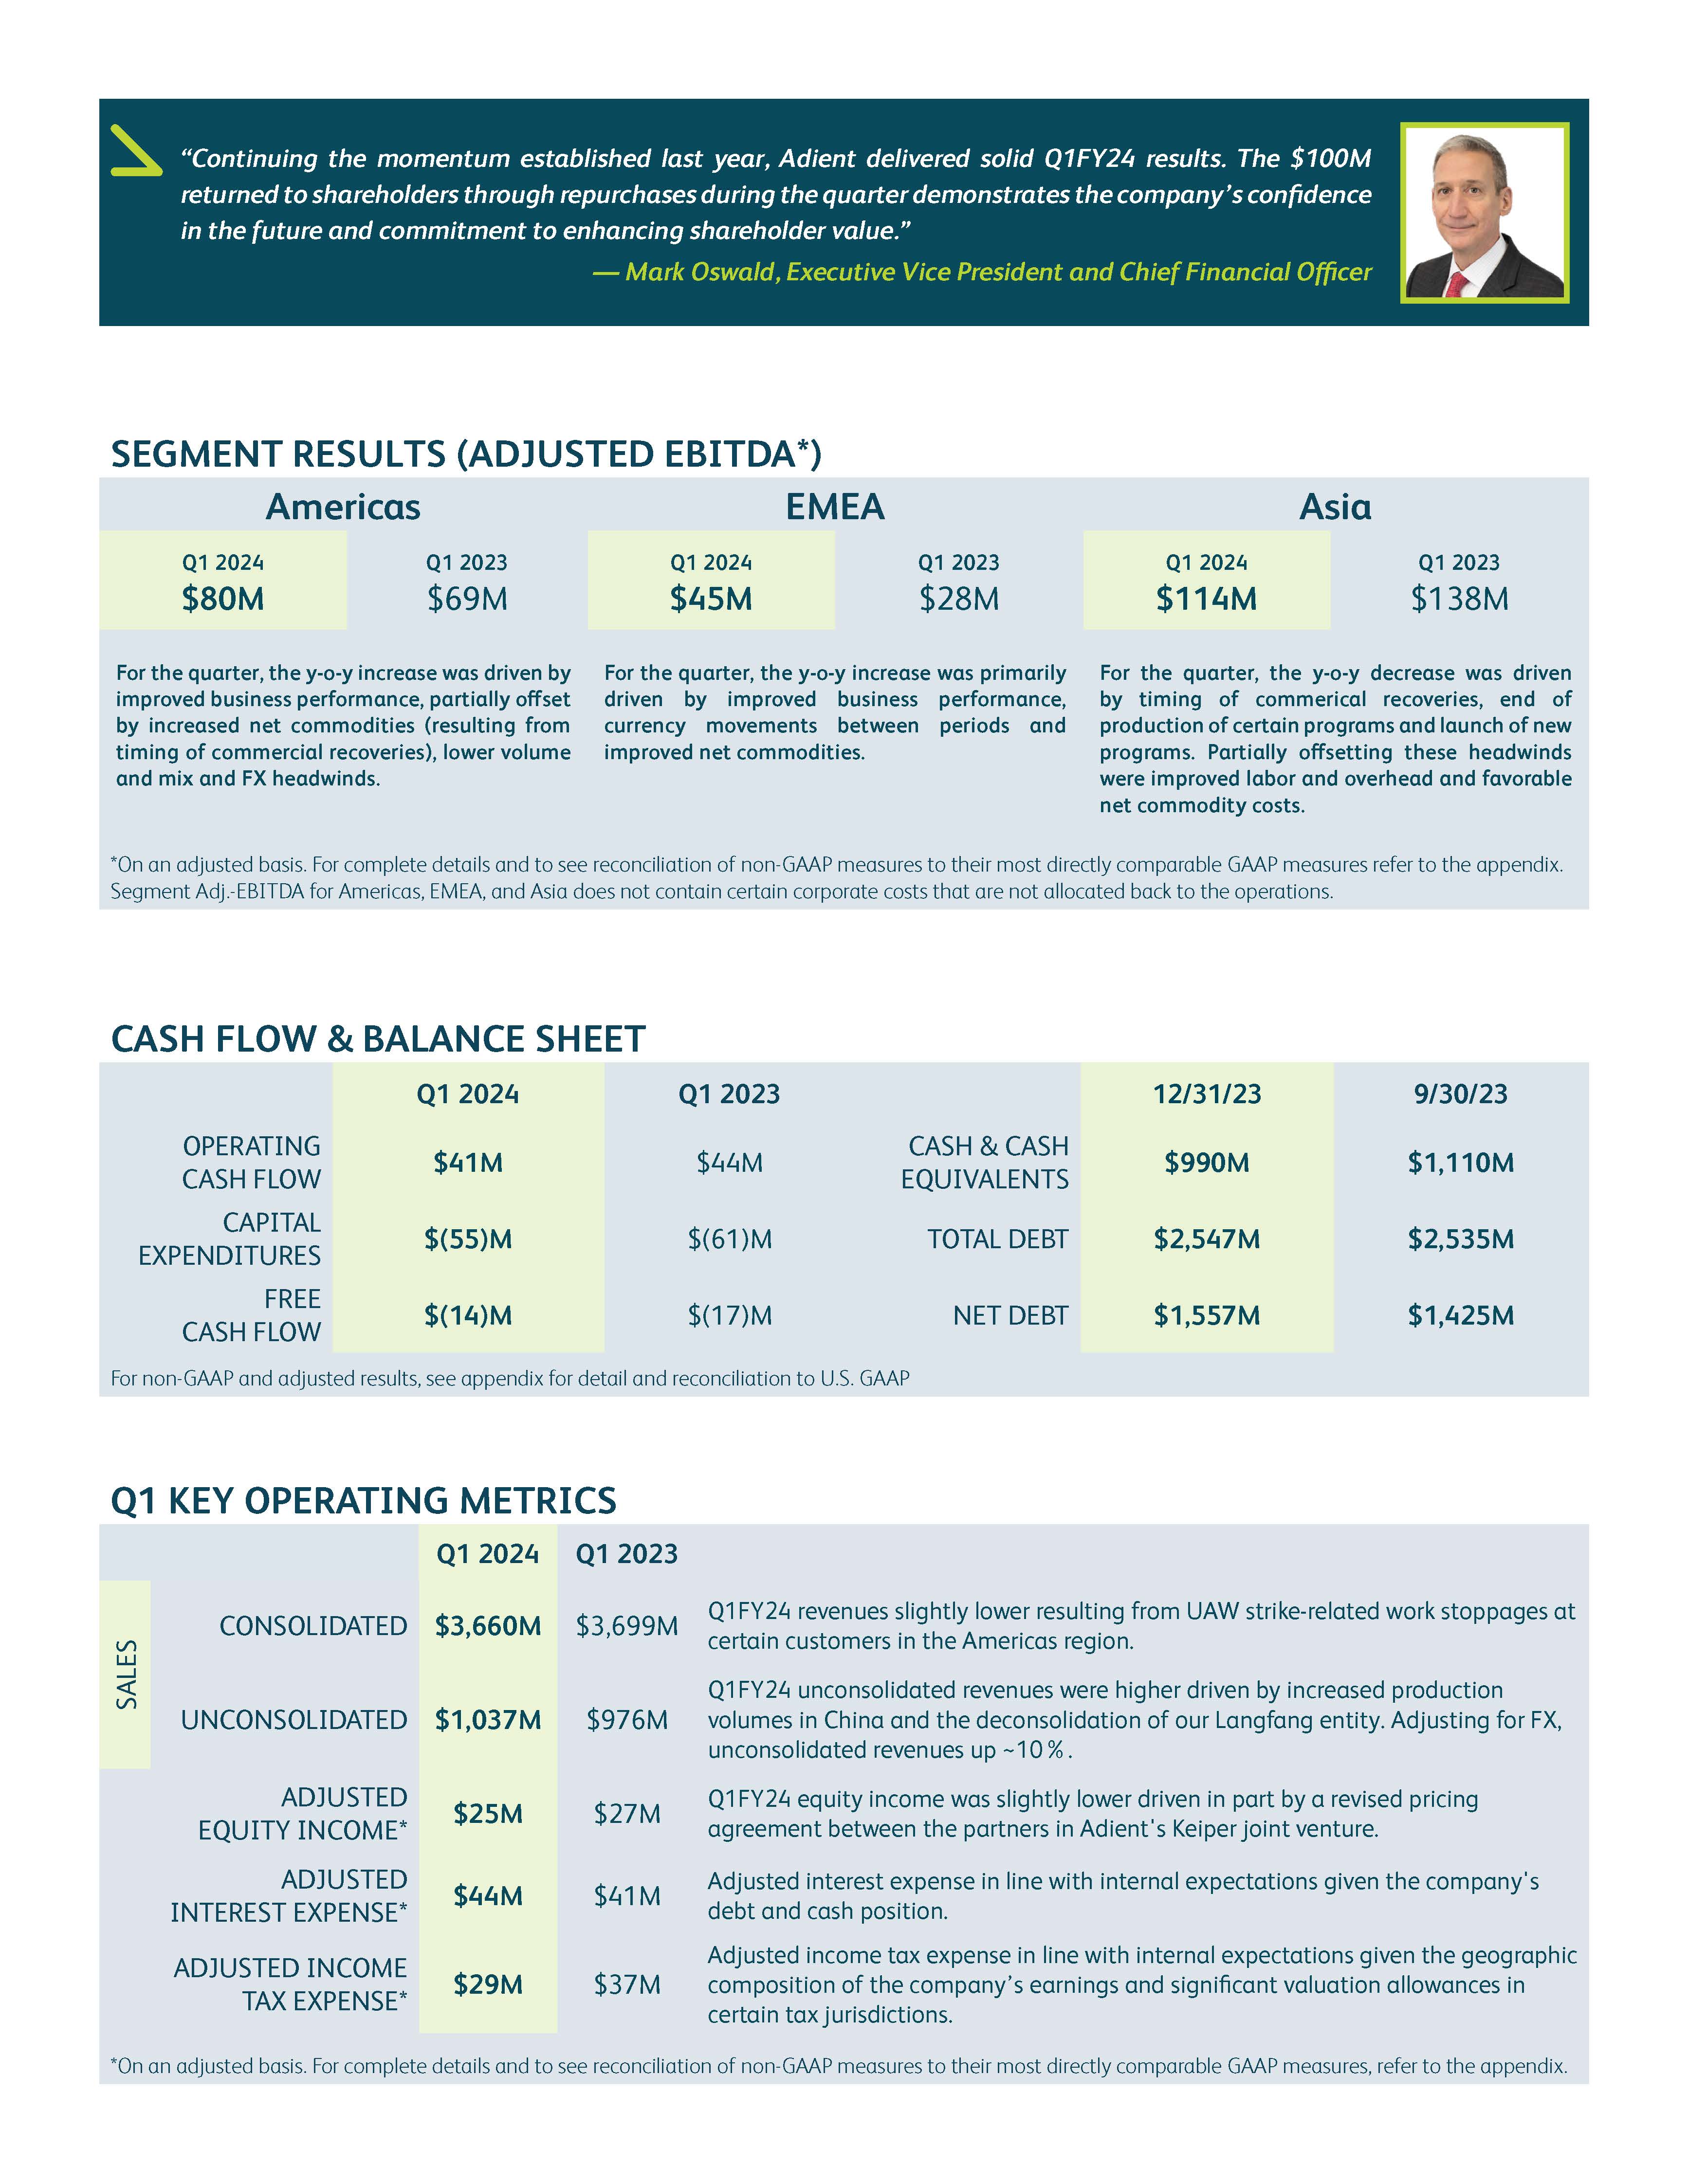
| Americas | $ | 1,647 | $ | 1,724 | ||||||||||
| EMEA | 1,268 | 1,182 | ||||||||||||
| Asia | 770 | 821 | ||||||||||||
| Eliminations | (25) | (28) | ||||||||||||
| Total net sales | $ | 3,660 | $ | 3,699 | ||||||||||
| Three Months Ended December 31, |
||||||||||||||
| (in millions) | 2023 | 2022 | ||||||||||||
| Adjusted EBITDA | ||||||||||||||
| Americas | $ | 80 | $ | 69 | ||||||||||
| EMEA | 45 | 28 | ||||||||||||
| Asia | 114 | 138 | ||||||||||||
Corporate-related costs (1) |
(23) | (23) | ||||||||||||
Restructuring and impairment costs (2) |
(11) | (7) | ||||||||||||
Purchase accounting amortization (3) |
(11) | (12) | ||||||||||||
Restructuring related activities (4) |
9 | (3) | ||||||||||||
Stock based compensation (12) |
(13) | (8) | ||||||||||||
| Depreciation | (72) | (69) | ||||||||||||
Other items (5) |
(7) | 1 | ||||||||||||
| Earnings before interest and income taxes | $ | 111 | $ | 114 | ||||||||||
| Net financing charges | (44) | (41) | ||||||||||||
| Other pension income (expense) | (2) | (9) | ||||||||||||
| Income before income taxes | $ | 65 | $ | 64 | ||||||||||
| Three Months Ended December 31, |
||||||||||||||
| (in millions, except per share data) | 2023 | 2022 | ||||||||||||
| Income available to shareholders | ||||||||||||||
| Net income attributable to Adient | $ | 20 | $ | 12 | ||||||||||
| Weighted average shares outstanding | ||||||||||||||
| Basic weighted average shares outstanding | 92.9 | 95.1 | ||||||||||||
| Effect of dilutive securities: | ||||||||||||||
| Stock options, unvested restricted stock and unvested performance share awards | 0.7 | 0.8 | ||||||||||||
| Diluted weighted average shares outstanding | 93.6 | 95.9 | ||||||||||||
| • | Adjusted EBIT is defined as income before income taxes and noncontrolling interests excluding net financing charges, restructuring, impairment and related costs, purchase accounting amortization, transaction gains/losses, other significant non-recurring items, and net mark-to-market adjustments on pension and postretirement plans. Adjusted EBIT margin is adjusted EBIT as a percentage of net sales. | ||||
| • | Adjusted EBITDA is defined as adjusted EBIT excluding depreciation and stock based compensation. Certain corporate-related costs are not allocated to the business segments in determining Adjusted EBITDA. Adjusted EBITDA margin is adjusted EBITDA as a percentage of net sales. Adjusted EBITDA excluding adjusted equity income, each as defined herein, is also presented. | ||||
| • | Adjusted net income attributable to Adient is defined as net income attributable to Adient excluding restructuring, impairment and related costs, purchase accounting amortization, transaction gains/losses, expenses associated with becoming an independent company, other significant non-recurring items, net mark-to-market adjustments on pension and postretirement plans, the tax impact of these items and other discrete tax charges/benefits. | ||||
| • | Adjusted effective tax rate is defined as adjusted income tax provision as a percentage of adjusted income before income taxes. | ||||
| • | Adjusted earnings per share is defined as Adjusted net income attributable to Adient divided by diluted weighted average shares. | ||||
| • | Adjusted equity income is defined as equity income excluding amortization of Adient's intangible assets related to its non-consolidated joint ventures and other unusual or one-time items impacting equity income. | ||||
| • | Adjusted interest expense is defined as net financing charges excluding unusual or one-time items impacting interest expense. | ||||
| • | Free cash flow is defined as cash provided by operating activities less capital expenditures. | ||||
| • | Net debt is calculated as gross debt (short-term and long-term) less cash and cash equivalents. | ||||
| • | Net leverage ratio is calculated as net debt divided by LTM Adjusted EBITDA | ||||
| Three Months Ended December 31, | ||||||||||||||||||||||||||||||||||||||
| 2023 | 2022 | |||||||||||||||||||||||||||||||||||||
| (in millions, except per share data) | GAAP Results | Adj. | Adjusted Results | GAAP Results | Adj. | Adjusted Results | ||||||||||||||||||||||||||||||||
| Net sales | $ | 3,660 | $ | — | $ | 3,660 | $ | 3,699 | $ | — | $ | 3,699 | ||||||||||||||||||||||||||
Cost of sales (6) |
3,414 | (1) | 3,413 | 3,468 | (1) | 3,467 | ||||||||||||||||||||||||||||||||
| Gross profit | 246 | 1 | 247 | 231 | 1 | 232 | ||||||||||||||||||||||||||||||||
Selling, general and administrative expenses (7) |
147 | (6) | 141 | 138 | (14) | 124 | ||||||||||||||||||||||||||||||||
Restructuring and impairment costs (2) |
11 | (11) | — | 7 | (7) | — | ||||||||||||||||||||||||||||||||
Equity income (8) |
23 | 2 | 25 | 28 | (1) | 27 | ||||||||||||||||||||||||||||||||
| Earnings before interest and income taxes (EBIT) | 111 | 20 | 131 | 114 | 21 | 135 | ||||||||||||||||||||||||||||||||
| Memo accounts: | ||||||||||||||||||||||||||||||||||||||
| Depreciation | 72 | 69 | ||||||||||||||||||||||||||||||||||||
| Equity based compensation | 13 | 8 | ||||||||||||||||||||||||||||||||||||
| Adjusted EBITDA | $ | 216 | $ | 212 | ||||||||||||||||||||||||||||||||||
| Net financing charges | 44 | — | 44 | 41 | — | 41 | ||||||||||||||||||||||||||||||||
| Other pension expense (income) | 2 | — | 2 | 9 | (8) | 1 | ||||||||||||||||||||||||||||||||
| Income before income taxes | 65 | 20 | 85 | 64 | 29 | 93 | ||||||||||||||||||||||||||||||||
Income tax provision (benefit) (9) |
20 | 9 | 29 | 31 | 6 | 37 | ||||||||||||||||||||||||||||||||
| Net income attributable to Adient | 20 | 9 | 29 | 12 | 21 | 33 | ||||||||||||||||||||||||||||||||
| Diluted earnings per share | 0.21 | 0.10 | 0.31 | 0.13 | 0.21 | 0.34 | ||||||||||||||||||||||||||||||||
| Diluted weighted average shares | 93.6 | — | 93.6 | 95.9 | — | 95.9 | ||||||||||||||||||||||||||||||||
| Three months ended December 31, 2023 | ||||||||||||||||||||||||||||||||
| Americas | EMEA | Asia | Corporate/Eliminations | Consolidated | ||||||||||||||||||||||||||||
| Net sales | $ | 1,647 | $ | 1,268 | $ | 770 | $ | (25) | $ | 3,660 | ||||||||||||||||||||||
| Adjusted EBITDA | $ | 80 | $ | 45 | $ | 114 | $ | (23) | $ | 216 | ||||||||||||||||||||||
| Adjusted EBITDA margin | 4.9 | % | 3.5 | % | 14.8 | % | N/A | 5.9 | % | |||||||||||||||||||||||
| Three months ended December 31, 2022 | ||||||||||||||||||||||||||||||||
| Americas | EMEA | Asia | Corporate/Eliminations | Consolidated | ||||||||||||||||||||||||||||
| Net sales | $ | 1,724 | $ | 1,182 | $ | 821 | $ | (28) | $ | 3,699 | ||||||||||||||||||||||
| Adjusted EBITDA | $ | 69 | $ | 28 | $ | 138 | $ | (23) | $ | 212 | ||||||||||||||||||||||
| Adjusted EBITDA margin | 4.0 | % | 2.4 | % | 16.8 | % | N/A | 5.7 | % | |||||||||||||||||||||||
| Three Months Ended December 31, |
||||||||||||||
| (in millions) | 2023 | 2022 | ||||||||||||
| Adjusted EBITDA | $ | 216 | $ | 212 | ||||||||||
| Less: Adjusted Equity Income | 25 | 27 | ||||||||||||
| Adjusted EBITDA Excluding Adjusted Equity Income | $ | 191 | $ | 185 | ||||||||||
| % of Sales | 5.2 | % | 5.0 | % | ||||||||||
| Three months ended December 31, | ||||||||||||||||||||||||||||||||||||||
| 2023 | 2022 | |||||||||||||||||||||||||||||||||||||
| (in millions, except effective tax rate) | Income before income taxes | Tax impact | Effective tax rate | Income before income taxes | Tax impact | Effective tax rate | ||||||||||||||||||||||||||||||||
| As reported | $ | 65 | $ | 20 | 30.8% | $ | 64 | $ | 31 | 48.4% | ||||||||||||||||||||||||||||
Adjustments (9) |
20 | 9 | 45.0% | 29 | 6 | 20.7% | ||||||||||||||||||||||||||||||||
| As adjusted | $ | 85 | $ | 29 | 34.1% | $ | 93 | $ | 37 | 39.8% | ||||||||||||||||||||||||||||
| Three Months Ended December 31, |
||||||||||||||
| (in millions) | 2023 | 2022 | ||||||||||||
| Net income attributable to Adient | $ | 20 | $ | 12 | ||||||||||
Restructuring and impairment costs (2) |
11 | 7 | ||||||||||||
Purchase accounting amortization (3) |
11 | 12 | ||||||||||||
Restructuring related activities (4) |
(9) | 3 | ||||||||||||
Pension mark-to-market and curtailment/settlement (gain)/loss (11) |
— | 8 | ||||||||||||
Other items (5) |
7 | (1) | ||||||||||||
Impact of adjustments on noncontrolling interests (10) |
(2) | (2) | ||||||||||||
Tax impact of above adjustments and other tax items (9) |
(9) | (6) | ||||||||||||
| Adjusted net income attributable to Adient | $ | 29 | $ | 33 | ||||||||||
| Three Months Ended December 31, |
||||||||||||||
| 2023 | 2022 | |||||||||||||
| Diluted earnings per share as reported | $ | 0.21 | $ | 0.13 | ||||||||||
Restructuring and impairment costs (2) |
0.12 | 0.07 | ||||||||||||
Purchase accounting amortization (3) |
0.12 | 0.12 | ||||||||||||
Restructuring related activities (4) |
(0.10) | 0.03 | ||||||||||||
Pension mark-to-market and curtailment/settlement (gain)/loss (11) |
— | 0.08 | ||||||||||||
Other items (5) |
0.07 | (0.01) | ||||||||||||
Impact of adjustments on noncontrolling interests (10) |
(0.02) | (0.02) | ||||||||||||
Tax impact of above adjustments and other tax items (9) |
(0.09) | (0.06) | ||||||||||||
| Adjusted diluted earnings per share | $ | 0.31 | $ | 0.34 | ||||||||||
| December 31, | September 30, | |||||||||||||
| (in millions) | 2023 | 2023 | ||||||||||||
| Cash | $ | 990 | $ | 1,110 | ||||||||||
| Total debt | 2,547 | 2,535 | ||||||||||||
| Net debt | 1,557 | 1,425 | ||||||||||||
| LTM Adjusted EBITDA | $ | 942 | $ | 938 | ||||||||||
| Net leverage ratio | 1.65 | 1.52 | ||||||||||||
| Three Months Ended December 31, |
||||||||||||||
| (in millions) | 2023 | 2022 | ||||||||||||
| Operating cash flow | $ | 41 | $ | 44 | ||||||||||
| Capital expenditures | (55) | (61) | ||||||||||||
| Free cash flow | $ | (14) | $ | (17) | ||||||||||
| Three Months Ended December 31, |
||||||||||||||
| (in millions) | 2023 | 2022 | ||||||||||||
| Adjusted EBITDA excluding adjusted equity income | $ | 191 | $ | 185 | ||||||||||
| Dividend | 16 | 12 | ||||||||||||
| Restructuring (cash) | (10) | (30) | ||||||||||||
| Net customer tooling | (17) | (14) | ||||||||||||
| Trade working capital (Net AR/AP + Inventory) | 111 | 46 | ||||||||||||
| Accrued compensation | (64) | (28) | ||||||||||||
| Interest paid | (60) | (24) | ||||||||||||
| Tax refund/taxes paid | (24) | (20) | ||||||||||||
| Non-income related taxes (VAT) | (28) | (19) | ||||||||||||
| Commercial settlements | 16 | (17) | ||||||||||||
| Capitalized engineering | (17) | (25) | ||||||||||||
| Prepaids | (19) | (24) | ||||||||||||
| Other | (54) | 2 | ||||||||||||
| Operating cash flow | 41 | 44 | ||||||||||||
| Capital expenditures | (55) | (61) | ||||||||||||
| Free cash flow | $ | (14) | $ | (17) | ||||||||||
| Three Months Ended December 31, |
||||||||||||||
| (in millions) | 2023 | 2022 | ||||||||||||
| Restructuring charges | $ | (11) | $ | (7) | ||||||||||
| $ | (11) | $ | (7) | |||||||||||
| Three Months Ended December 31, |
||||||||||||||
| (in millions) | 2023 | 2022 | ||||||||||||
| Restructuring related charges | $ | (1) | $ | (3) | ||||||||||
| Gain on sale of restructured facility | 10 | — | ||||||||||||
| $ | 9 | $ | (3) | |||||||||||
| Three Months Ended December 31, |
||||||||||||||
| (in millions) | 2023 | 2022 | ||||||||||||
| Non-recurring contract related settlement | $ | 3 | $ | — | ||||||||||
| One-time divestiture related tax impact at an affiliate | (2) | — | ||||||||||||
| Loss on business divestiture | (8) | — | ||||||||||||
| Transaction costs | — | (1) | ||||||||||||
| Adjustment to nonconsolidated partially-owned affiliates | — | 1 | ||||||||||||
| Brazil indirect tax recoveries | — | 1 | ||||||||||||
| $ | (7) | $ | 1 | |||||||||||
| Three Months Ended December 31, |
||||||||||||||
| (in millions) | 2023 | 2022 | ||||||||||||
| Restructuring related activities | $ | (1) | $ | (2) | ||||||||||
| Brazil indirect tax recoveries | — | 1 | ||||||||||||
| $ | (1) | $ | (1) | |||||||||||
| Three Months Ended December 31, |
||||||||||||||
| (in millions) | 2023 | 2022 | ||||||||||||
| Purchase accounting amortization | $ | (11) | $ | (12) | ||||||||||
| Loss on business divestiture | (8) | — | ||||||||||||
| Gain on sale of restructured facility | 10 | — | ||||||||||||
| Non-recurring contract related settlement | 3 | — | ||||||||||||
| Transaction costs | — | (1) | ||||||||||||
| Restructuring related activities | — | (1) | ||||||||||||
| $ | (6) | $ | (14) | |||||||||||
| Three Months Ended December 31, |
||||||||||||||
| (in millions) | 2023 | 2022 | ||||||||||||
| One-time divestiture related tax impact at an affiliate | $ | 2 | $ | — | ||||||||||
| Adjustment to nonconsolidated partially-owned affiliates | — | (1) | ||||||||||||
| $ | 2 | $ | (1) | |||||||||||
| Three Months Ended December 31, |
||||||||||||||
| (in millions) | 2023 | 2022 | ||||||||||||
| Tax audit closures and statute expirations | $ | (7) | $ | (3) | ||||||||||
Amortization |
(2) | (2) | ||||||||||||
| Pension curtailment loss | — | (2) | ||||||||||||
| Other reconciling items | — | 1 | ||||||||||||
| $ | (9) | $ | (6) | |||||||||||