© Atkore Investor Presentation & Company Overview May 2023

This presentation is provided for general informational purposes only and it does not include every item which may be of interest, nor does it purport to present full and fair disclosure with respect to Atkore Inc. (the “Company” or “Atkore”) or its operational and financial information. Atkore expressly disclaims any current intention to update any forward-looking statements contained in this presentation as a result of new information or future events or developments or otherwise, except as required by federal securities laws. This presentation is not a prospectus and is not an offer to sell securities. This presentation contains forward-looking statements that are subject to known and unknown risks and uncertainties, many of which are beyond our control. All statements other than statements of historical fact included in this presentation are forward-looking statements. Forward-looking statements appearing throughout this presentation include, without limitation, statements regarding our intentions, beliefs, assumptions or current expectations concerning, among other things, financial position; results of operations; cash flows; prospects; growth strategies or expectations; customer retention; the outcome (by judgment or settlement) and costs of legal, administrative or regulatory proceedings, investigations or inspections, including, without limitation, collective, representative or any other litigation; and the impact of prevailing economic conditions. You can identify forward-looking statements by the fact that they do not relate strictly to historical or current facts. These statements may include words such as “believes,” “expects,” “may,” “will,” “shall,” “should,” “would,” “could,” “seeks,” “aims,” “projects,” “is optimistic,” “intends,” “plans,” “estimates,” “anticipates” and other comparable terms. We caution you that forward-looking statements are not guarantees of future performance or outcomes and that actual performance and outcomes, including, without limitation, our actual results of operations, financial condition and liquidity, and the development of the market in which we operate, may differ materially from those made in or suggested by the forward-looking statements contained in this presentation. In addition, even if our results of operations, financial condition and cash flows, and the development of the market in which we operate, are consistent with the forward-looking statements contained in this presentation, those results or developments may not be indicative of results or developments in subsequent periods. A number of important factors, including, without limitation, the risks and uncertainties disclosed in the Company’s filings with the U.S. Securities and Exchange Commission, including but not limited to the Company’s most recent Annual Report on Form 10-K and reports on Form 10-Q and Form 8-K could cause actual results and outcomes to differ materially from those reflected in the forward-looking statements. Because of these risks, we caution that you should not place undue reliance on any of our forward-looking statements. New risks and uncertainties arise from time to time, and it is impossible for us to predict those events or how they may affect us. Further, any forward-looking statement speaks only as of the date on which it is made. We undertake no obligation to revise the forward-looking statements in this presentation after the date of this presentation. Market data and industry information used throughout this presentation are based on management’s knowledge of the industry and the good faith estimates of management. We also relied, to the extent available, upon management’s review of independent industry surveys, forecasts and publications and other publicly available information prepared by a number of third-party sources. All of the market data and industry information used in this presentation involves a number of assumptions and limitations which we believe to be reasonable, but you are cautioned not to give undue weight to such estimates. Although we believe that these sources are reliable, we cannot guarantee the accuracy or completeness of this information, and we have not independently verified this information. While we believe the estimated market position, market opportunity and market size information included in this presentation are generally reliable, such information, which is derived in part from management’s estimates and beliefs, is inherently uncertain and imprecise. Projections, assumptions and estimates of our future performance and the future performance of the industry in which we operate are subject to a high degree of uncertainty and risk due to a variety of factors, including those described above. These and other factors could cause results to differ materially from those expressed in our estimates and beliefs and in the estimates prepared by independent parties. This presentation should be read along with the historical financial statements of Atkore, including the most recent audited financial statements. Historical results may not be indicative of future results. We use non-GAAP financial measures to help us describe our operating and financial performance. These measures may include Adjusted EBITDA, Adjusted EBITDA margin (Adjusted EBITDA over Net sales), Net debt (total debt less cash and cash equivalents), Adjusted Net Income Per Diluted Share (also referred to as “Adjusted Diluted EPS”), Leverage ratio (net debt or total debt less cash and cash equivalents, over Adjusted EBITDA on trailing twelve month (“TTM”) basis), Free Cash Flow (net cash provided by operating activities less capital expenditures) and Return on Capital to help us describe our operating and financial performance. These non-GAAP financial measures are commonly used in our industry and have certain limitations and should not be construed as alternatives to net income, total debt, net cash provided by operating activities, return on assets, and other income data measures as determined in accordance with generally accepted accounting principles in the United States, or GAAP, or as better indicators of operating performance. These non-GAAP financial measures as defined by us may not be comparable to similarly-titled non-GAAP measures presented by other companies. Our presentation of such non-GAAP financial measures should not be construed as an inference that our future results will be unaffected by unusual or non-recurring items. See the appendix to this presentation for a reconciliation of the non-GAAP financial measures presented herein to the most comparable financial measures as determined in accordance with GAAP. Fiscal Periods - The Company has a fiscal year that ends on September 30th. It is the Company's practice to establish quarterly closings using a 4-5-4 calendar. The Company's fiscal quarters typically end on the last Friday in December, March and June. Cautionary Statements

3© Atkore Atkore: a Compelling Investment Disciplined Operational Focus Values-based organization driven by the Atkore Business System Track Record of Success Strong track record of earnings growth, increasing free cash flow and excellent return on capital Market Leadership Leading market share in key product categories with a portfolio of must-stock products for electrical distributors Strong Secular Tailwinds Our solutions are critical to enabling the energy transition and investment in digital infrastructure Opportunities for Growth Multiple levers and opportunities to drive sustainable growth through both organic and inorganic investments Strong Financial Profile & Long-Term Outlook Strong liquidity position with a balance sheet ready to support and help drive future growth 3

4© Atkore Our Foundation Is the Atkore Business System

5© Atkore Our Products Are All Around You HDPE Conduit Wire Basket Cable Tray & Fittings Telescoping Sign Support System Cable Tray, Ladder & Fittings Steel Conduit & Fittings PVC and Metal Trunking Electrical Prefabrication Flexible & Liquid Tight Electrical Conduit Industrial Flexible Electrical Conduit Roller Tube for Conveyor PVC and Fiberglass Electrical Conduit & Fittings Metal Framing & Fittings (Including Seismic) Perimeter Security Solutions Security Bollards Armored Cable Specialty Electrical Conduit: Stainless Steel, PVC-Coated & Aluminum

6© Atkore Transformed sales mix to drive significant revenue growth and profitability through organic and inorganic activities while increasing our total addressable market opportunity Our Business Has Transformed Since IPO 1. See non-GAAP reconciliation in appendix. 2. Sales of “Other Electrical products” and “Other Safety & Infrastructure products” have been allocated and included in the presentation of the product area groupings listed for presentation purposes. Source: Management estimates. $1.5B FY2022FY2017 $3.9B Plastic Pipe, Conduit & Fittings Metal Electrical Conduit & Fittings Mechanical Tube & OtherMetal Framing, Cable Management & Construction Services Electrical Cable & Flexible Conduit Adjusted EBITDA Margin1 34.3% Adjusted EBITDA Margin1 15.1% Net Sales by Key Product Area2 39% 19% 17% 14% 11% 18% 23% 18% 24% 17% $40B+ Total Addressable Market Opportunity >2X Addressable Market Increase Since IPO

7© Atkore Growth Driven by Atkore Business System 1. See non-GAAP reconciliation in appendix. Historical Adjusted EBITDA1 Bridge Historical Net Sales Bridge $101 $1,924 $593 $21 $15 2017 PriceVolume/Mix $1,504M M&A Divestitures Other 2022 $3,914M $757 $229 $5 $93 $585 2017 Volume/Mix DivestituresPrice vs. Cost $2 M&A Productivity / Investment / F/X / Other 2022 $228M $985 $1,342M ~$400 ~$585 Est. Pricing Outperformance Est. Sustainable Pricing Improvements A B A C E • Analysis understanding customer and product level profitability minimized impact of volume declines; Examples include strategic determination to reduce retail exposure • Combined benefit from strategic acquisitions completed between FY17 to FY22 • Estimate ~40% of pricing improvements are sustainable • Estimated pricing outperformance primarily driven by plastic pipe and conduit related products in FY21 and FY22 • Estimate approximately one-third of this unfavorable impact is related to discretionary one-time investments in the business Key Discussion Items A B C D D E B
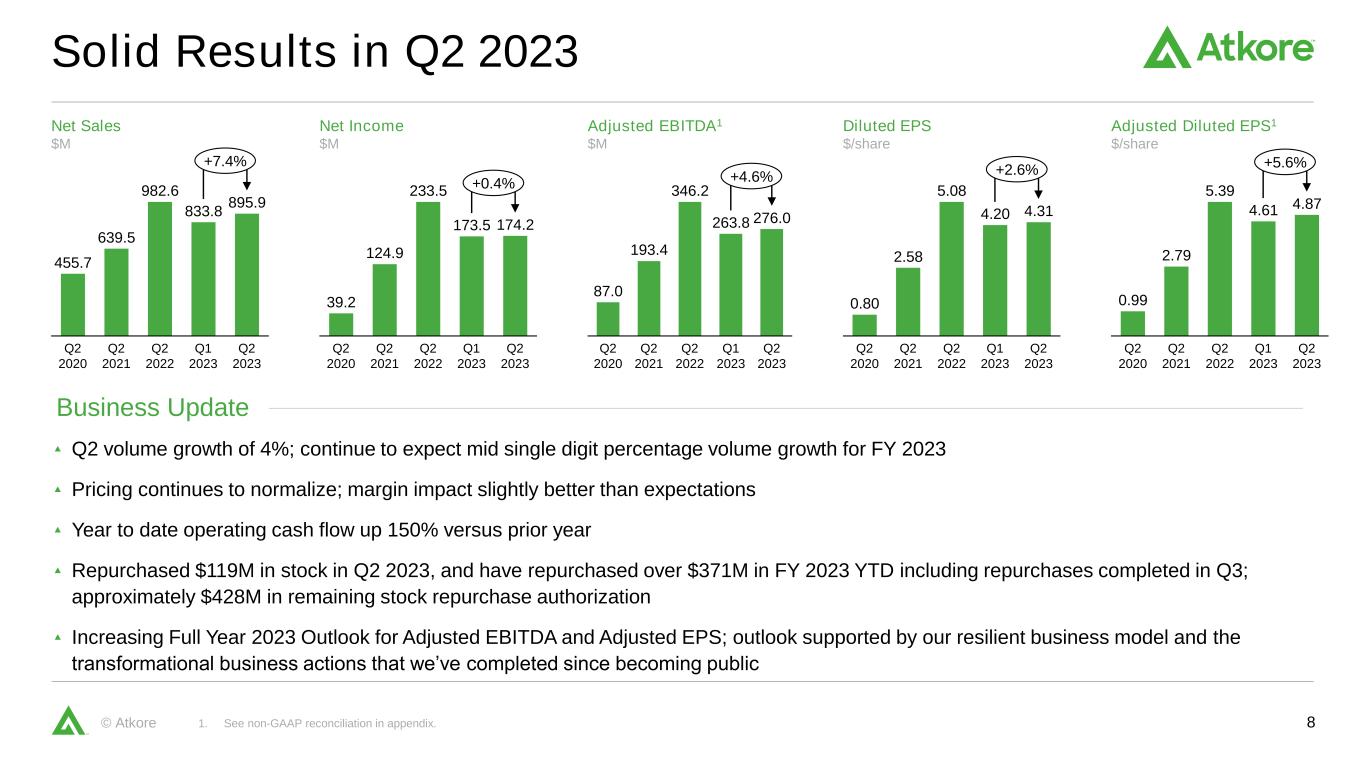
8© Atkore Solid Results in Q2 2023 1. See non-GAAP reconciliation in appendix. 455.7 639.5 982.6 833.8 895.9 Q2 2023 Q2 2020 Q2 2021 Q2 2022 Q1 2023 +7.4% 39.2 124.9 233.5 173.5 174.2 Q2 2020 Q1 2023 Q2 2023 Q2 2021 Q2 2022 +0.4% 87.0 193.4 346.2 263.8 276.0 Q2 2020 Q2 2021 Q2 2022 Q1 2023 Q2 2023 +4.6% 0.99 2.79 5.39 4.61 4.87 Q1 2023 Q2 2022 Q2 2020 Q2 2021 Q2 2023 +5.6% Net Sales $M Net Income $M Adjusted EBITDA1 $M Adjusted Diluted EPS1 $/share 0.80 2.58 5.08 4.20 4.31 Q1 2023 Q2 2021 Q2 2022 Q2 2020 Q2 2023 +2.6% Diluted EPS $/share Q2 volume growth of 4%; continue to expect mid single digit percentage volume growth for FY 2023 Pricing continues to normalize; margin impact slightly better than expectations Year to date operating cash flow up 150% versus prior year Repurchased $119M in stock in Q2 2023, and have repurchased over $371M in FY 2023 YTD including repurchases completed in Q3; approximately $428M in remaining stock repurchase authorization Increasing Full Year 2023 Outlook for Adjusted EBITDA and Adjusted EPS; outlook supported by our resilient business model and the transformational business actions that we’ve completed since becoming public Business Update

9© Atkore Diversity of End-Market Use Enables Resilience Non-Residential Construction (Global) Residential (U.S.) OEM / OTHER Commercial & Industrial Institutional Data Centers & Warehouses Utility Multi-Family Single Family Plastic Pipe, Conduit & Fittings Metal Electrical Conduit & Fittings Metal Framing, Cable Management & Construction Services Electrical Cable & Flexible Conduit Mechanical Tube & Other Est. % of total sales ~65-75% ~15-20% ~10-15% Estimated Net Sales by Key Product Area & Market Source: Company analysis and estimates

10© Atkore Executing Our Conduits of Growth Funnel of targets remains robust Maintaining disciplined approach to valuation Atkore is well positioned as a buyer given the strength of our balance sheet Strong growth in solar related products in Q2 Capital investment projects in Dallas facility progressing well Expanding product and service offering capabilities globally to support large mega-projects Product Vitality Index reached 9% of Net Sales in Q2 2023 MC Glide Luminary LITETM and TUFFTM Won “Product of the Year” from EC&M M&A Pipeline Category Expansion Initiatives Focused Product Category Growth & Innovation

11© Atkore Between recent organic and inorganic investments, we expect our HDPE related products to be a strong driver of growth for the next several years given the secular tailwinds behind the products and our execution of the Atkore Business System HDPE Products Expected to Drive Growth HDPE Products Market Review Category Expansion Example TOTAL MARKET SIZE KEY APPLICATIONS SERVED BY ATKORE GROWTH DRIVERS ~$7B Product Categories Included: Conduit, Pressure Pipe, Water Pipe, and Corrugated Broadband & Telecom Power Utility and Renewable Energy Oil & Gas Transmissions & Distribution Water Infrastructure Transportation Expansion of 5G Networks & “Fiber to the Home” and IIJA tailwind Vertical integration opportunities with internal recycling business Execution of the Atkore Business System ATKORE PRESENCE Broadband and Telecom Applications Expected to Drive Solid Growth for Conduit Products Over the Next Several Years Four Acquisitions since December 2021 Organic Expansion Plans in Dallas, Texas #2 Position in Conduit Products Expect to be a Top 10 player in overall HDPE market across all product categories
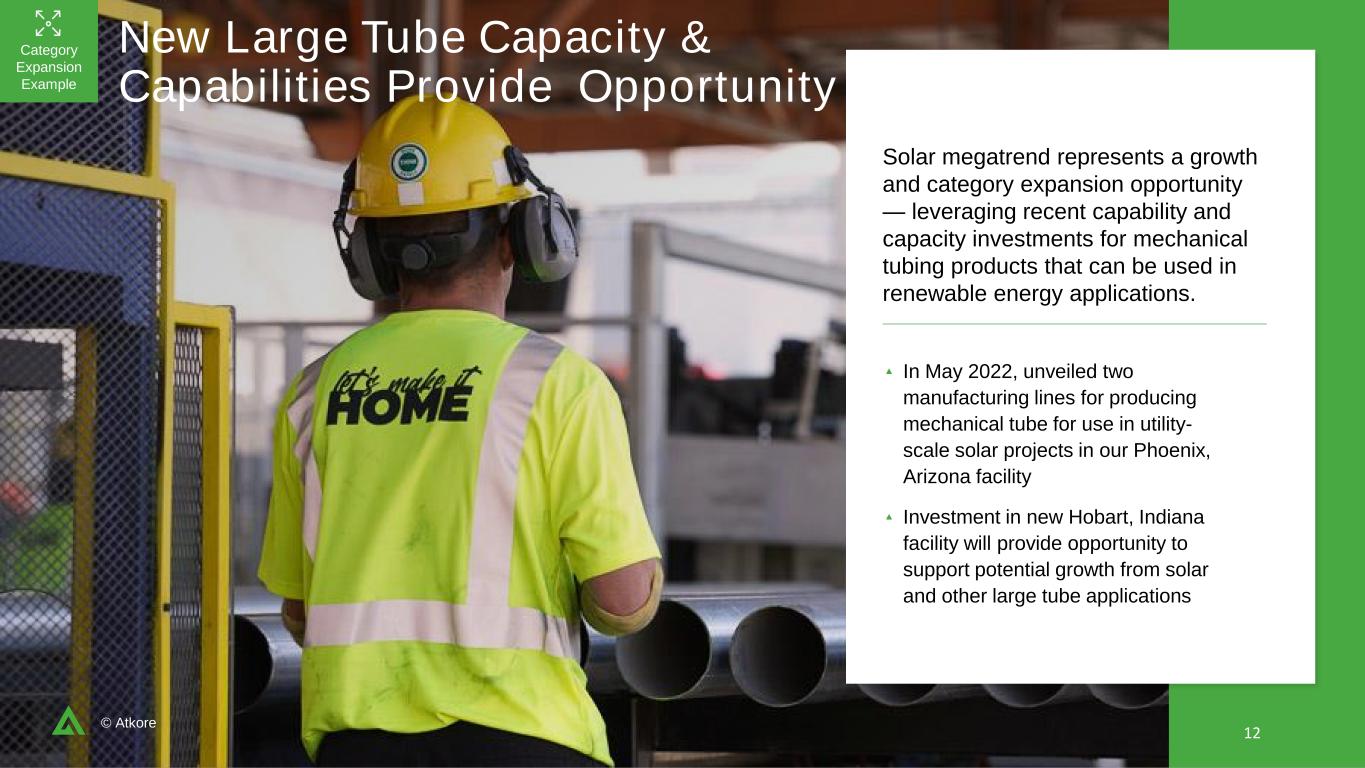
12© Atkore New Large Tube Capacity & Capabilities Provide Opportunity Solar megatrend represents a growth and category expansion opportunity — leveraging recent capability and capacity investments for mechanical tubing products that can be used in renewable energy applications. In May 2022, unveiled two manufacturing lines for producing mechanical tube for use in utility- scale solar projects in our Phoenix, Arizona facility Investment in new Hobart, Indiana facility will provide opportunity to support potential growth from solar and other large tube applications Category Expansion Example 12

13© Atkore Capital Deployment Framework 1. Plan announced in November 2021. Capital Deployment Focused on Driving Growth in Adjusted Diluted EPS Capital Deployment Model – FY 2023 & Forward Capital Expenditures, Organic Growth, and Capacity Investments M&A Stock Repurchases Priority Uses for Capital Maintain Gross Debt to normalized Adj. EBITDA ratio at ~2x or below; willing to go above for select strategic opportunities ~$200M in expected capital expenditures in FY23; includes investment in HDPE product expansion initiatives; Expect future capital spending to be between 3-4% of net sales Solid pipeline with a disciplined approach; Expect M&A to be focused on growing portfolio to expand and capture more of our total addressable market $1.3B in authorization; over $871M in stock repurchases completed since initial program authorization in November 2021 Target Cash Flow from Operating Activities to be approximately 100% of Net Income Averaged Over a 3-Year Period Status Update

14© Atkore Cash Flow from Operating Activities FY23 YTD Cash Bridge FY23 Cash Flow Summary $389M $354M $403M $73M $83M $269M $13M FY22 YE Cash Balance Cash Flow From Operating Activities M&ACapital Expenditures Stock Repurchases Net Other Uses of Cash FY23 YTD Cash Balance $161M $403M FY22 YTD FY23 YTD +150% 37% 116% Cash flow from Operating Activities as % of Net Income
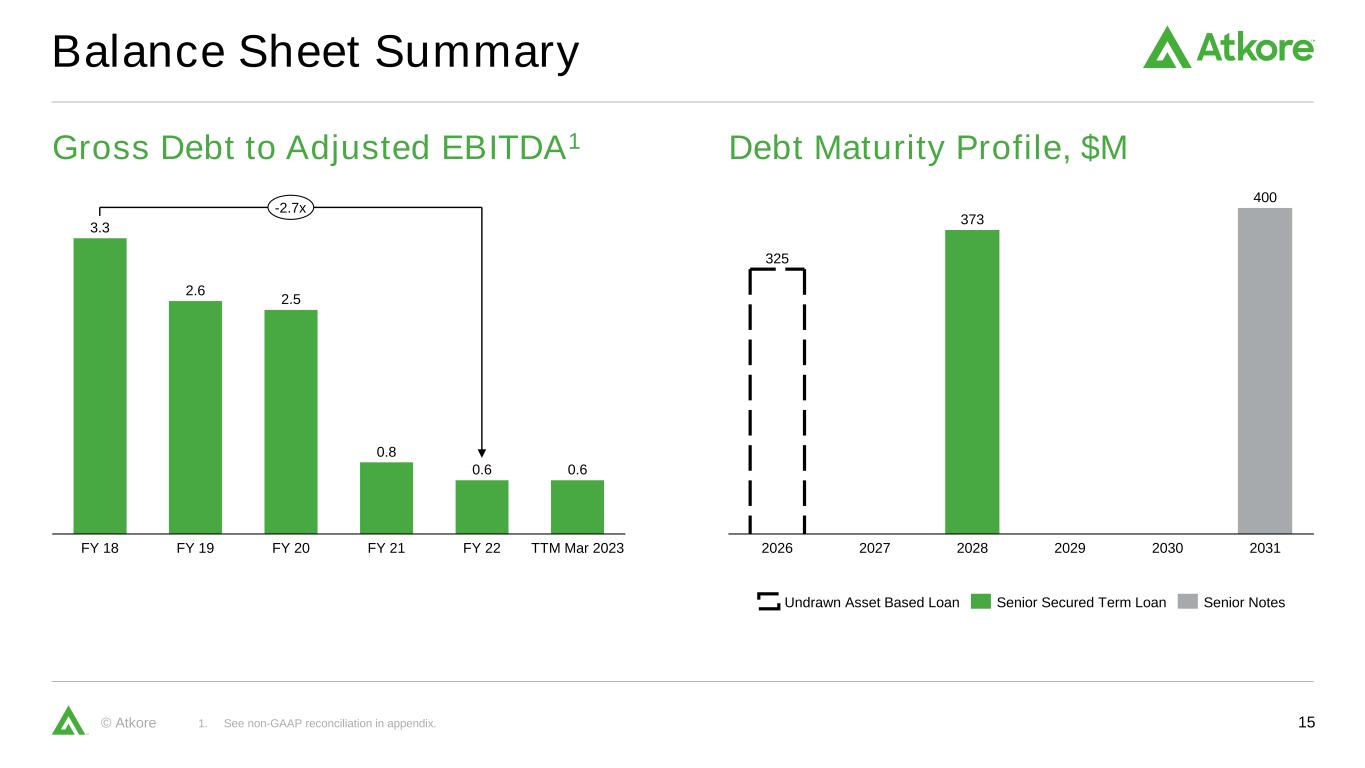
15© Atkore Gross Debt to Adjusted EBITDA1 Debt Maturity Profile, $M Balance Sheet Summary 1. See non-GAAP reconciliation in appendix. 325 373 400 20292027 20302026 2028 2031 Undrawn Asset Based Loan Senior Secured Term Loan Senior Notes 3.3 2.6 2.5 0.8 0.6 0.6 FY 18 FY 21FY 20 FY 22 TTM Mar 2023FY 19 -2.7x

16© Atkore Atkore: a Compelling Investment Disciplined Operational Focus Values-based organization driven by the Atkore Business System Track Record of Success Strong track record of earnings growth, increasing free cash flow and excellent return on capital Market Leadership Leading market share in key product categories with a portfolio of must-stock products for electrical distributors Strong Secular Tailwinds Our solutions are critical to enabling the energy transition and investment in digital infrastructure Opportunities for Growth Multiple levers and opportunities to drive sustainable growth through both organic and inorganic investments Strong Financial Profile & Long-Term Outlook Strong liquidity position with a balance sheet ready to support and help drive future growth 16

17© Atkore Questions?
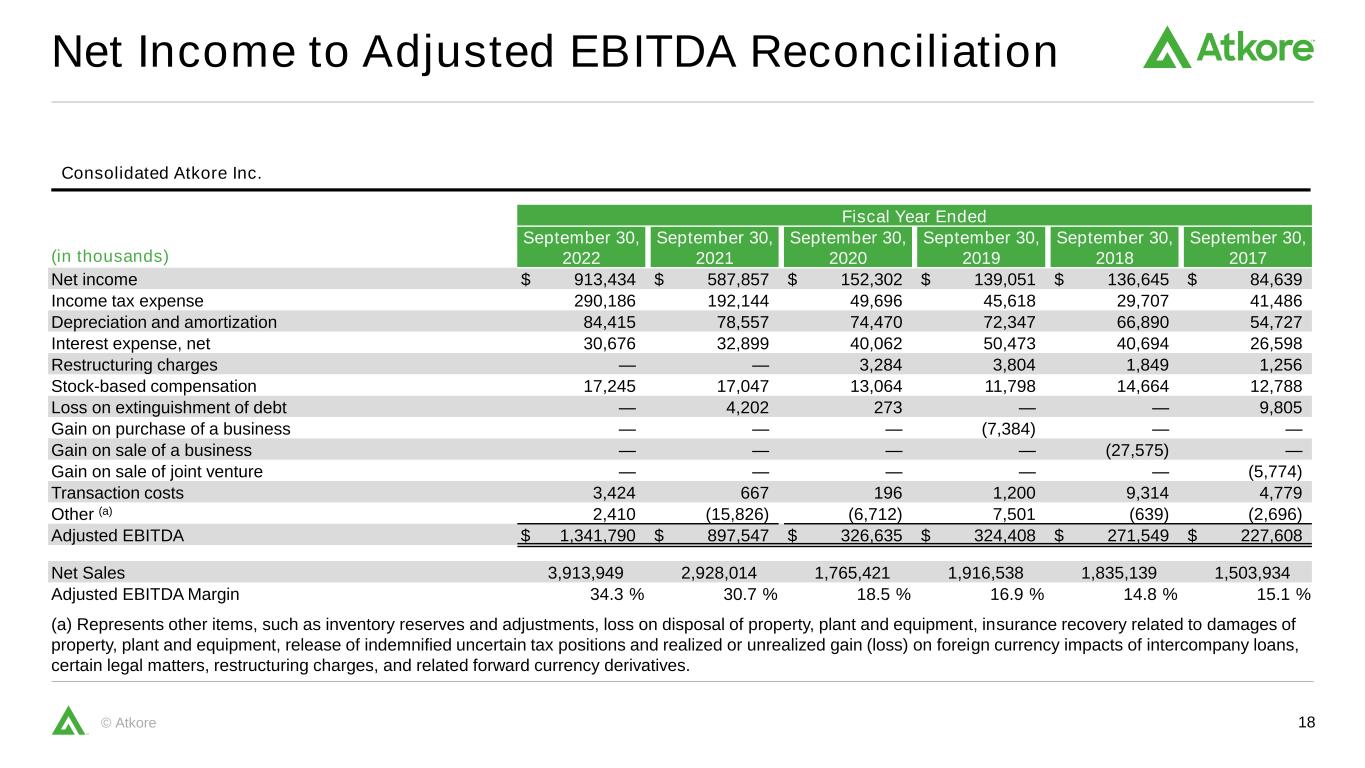
18© Atkore Net Income to Adjusted EBITDA Reconciliation Consolidated Atkore Inc. Fiscal Year Ended (in thousands) September 30, 2022 September 30, 2021 September 30, 2020 September 30, 2019 September 30, 2018 September 30, 2017 Net income $ 913,434 $ 587,857 $ 152,302 $ 139,051 $ 136,645 $ 84,639 Income tax expense 290,186 192,144 49,696 45,618 29,707 41,486 Depreciation and amortization 84,415 78,557 74,470 72,347 66,890 54,727 Interest expense, net 30,676 32,899 40,062 50,473 40,694 26,598 Restructuring charges — — 3,284 3,804 1,849 1,256 Stock-based compensation 17,245 17,047 13,064 11,798 14,664 12,788 Loss on extinguishment of debt — 4,202 273 — — 9,805 Gain on purchase of a business — — — (7,384) — — Gain on sale of a business — — — — (27,575) — Gain on sale of joint venture — — — — — (5,774) Transaction costs 3,424 667 196 1,200 9,314 4,779 Other (a) 2,410 (15,826) (6,712) 7,501 (639) (2,696) Adjusted EBITDA $ 1,341,790 $ 897,547 $ 326,635 $ 324,408 $ 271,549 $ 227,608 Net Sales 3,913,949 2,928,014 1,765,421 1,916,538 1,835,139 1,503,934 Adjusted EBITDA Margin 34.3 % 30.7 % 18.5 % 16.9 % 14.8 % 15.1 % (a) Represents other items, such as inventory reserves and adjustments, loss on disposal of property, plant and equipment, insurance recovery related to damages of property, plant and equipment, release of indemnified uncertain tax positions and realized or unrealized gain (loss) on foreign currency impacts of intercompany loans, certain legal matters, restructuring charges, and related forward currency derivatives.

19© Atkore Net Income to Adjusted EBITDA Reconciliation Consolidated Atkore Inc. Three months ended (in thousands) March 31, 2023 December 30, 2022 March 25, 2022 March 26, 2021 March 27, 2020 Net income $ 174,194 $ 173,492 $ 233,477 $ 124,933 $ 39,193 Interest expense, net 8,475 9,488 7,514 8,416 10,564 Income tax expense 53,364 48,559 78,613 38,304 13,100 Depreciation and amortization 28,598 25,967 19,994 19,265 18,478 Stock-based compensation 6,863 5,270 6,128 4,868 4,523 Other (a) 4,547 1,069 440 (2,421) 1,148 Adjusted EBITDA $ 276,041 $ 263,845 $ 346,166 $ 193,365 $ 87,006 (a) Represents other items, such as inventory reserves and adjustments, loss on disposal of property, plant and equipment, release of indemnified uncertain tax positions, gain on purchase of business, loss on assets held for sale (includes loss on assets held for sale in Russia. See Note 11, “Goodwill and Intangible Assets” in the form 10-Q filed May 9, 2023 for additional information.), realized or unrealized gain (loss) on foreign currency impacts of intercompany loans and related forward currency derivatives, transaction and restructuring costs.
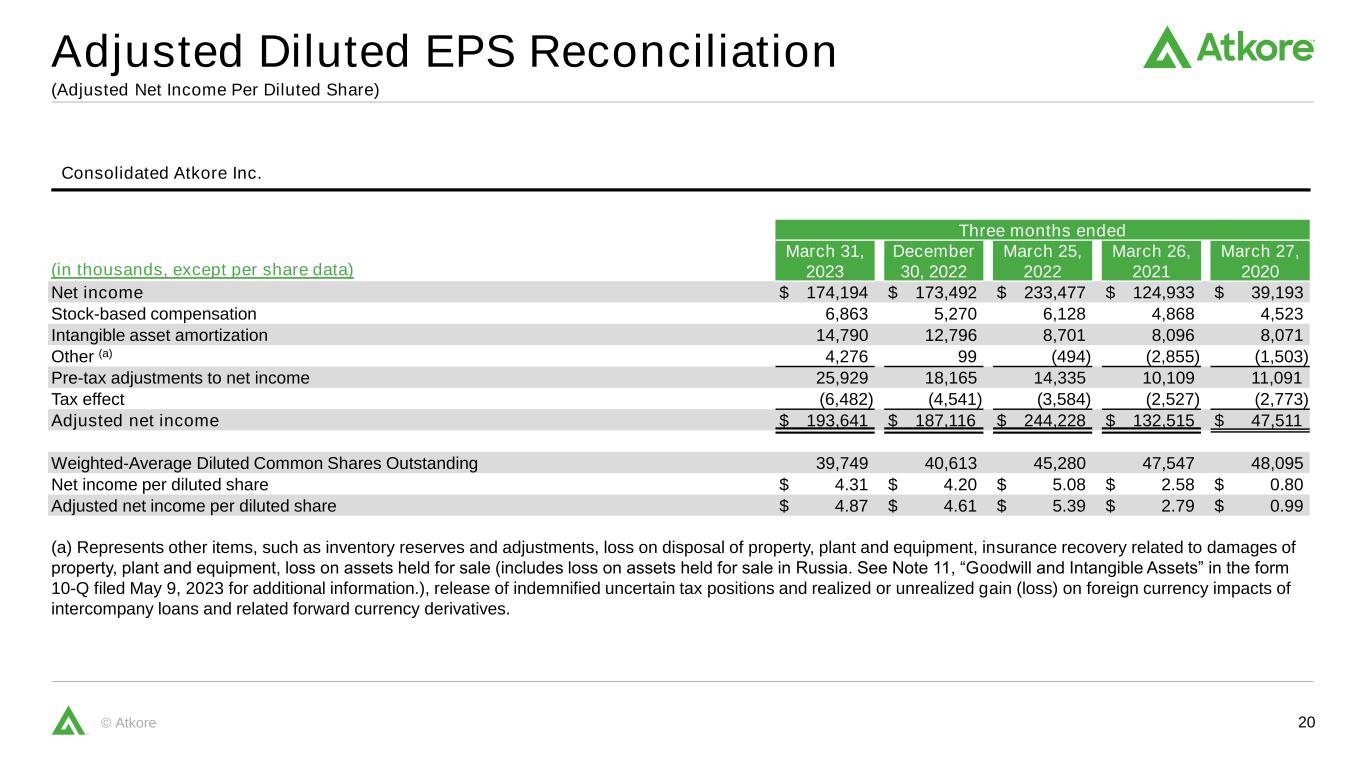
20© Atkore Adjusted Diluted EPS Reconciliation Consolidated Atkore Inc. Three months ended (in thousands, except per share data) March 31, 2023 December 30, 2022 March 25, 2022 March 26, 2021 March 27, 2020 Net income $ 174,194 $ 173,492 $ 233,477 $ 124,933 $ 39,193 Stock-based compensation 6,863 5,270 6,128 4,868 4,523 Intangible asset amortization 14,790 12,796 8,701 8,096 8,071 Other (a) 4,276 99 (494) (2,855) (1,503) Pre-tax adjustments to net income 25,929 18,165 14,335 10,109 11,091 Tax effect (6,482) (4,541) (3,584) (2,527) (2,773) Adjusted net income $ 193,641 $ 187,116 $ 244,228 $ 132,515 $ 47,511 Weighted-Average Diluted Common Shares Outstanding 39,749 40,613 45,280 47,547 48,095 Net income per diluted share $ 4.31 $ 4.20 $ 5.08 $ 2.58 $ 0.80 Adjusted net income per diluted share $ 4.87 $ 4.61 $ 5.39 $ 2.79 $ 0.99 (a) Represents other items, such as inventory reserves and adjustments, loss on disposal of property, plant and equipment, insurance recovery related to damages of property, plant and equipment, loss on assets held for sale (includes loss on assets held for sale in Russia. See Note 11, “Goodwill and Intangible Assets” in the form 10-Q filed May 9, 2023 for additional information.), release of indemnified uncertain tax positions and realized or unrealized gain (loss) on foreign currency impacts of intercompany loans and related forward currency derivatives. (Adjusted Net Income Per Diluted Share)
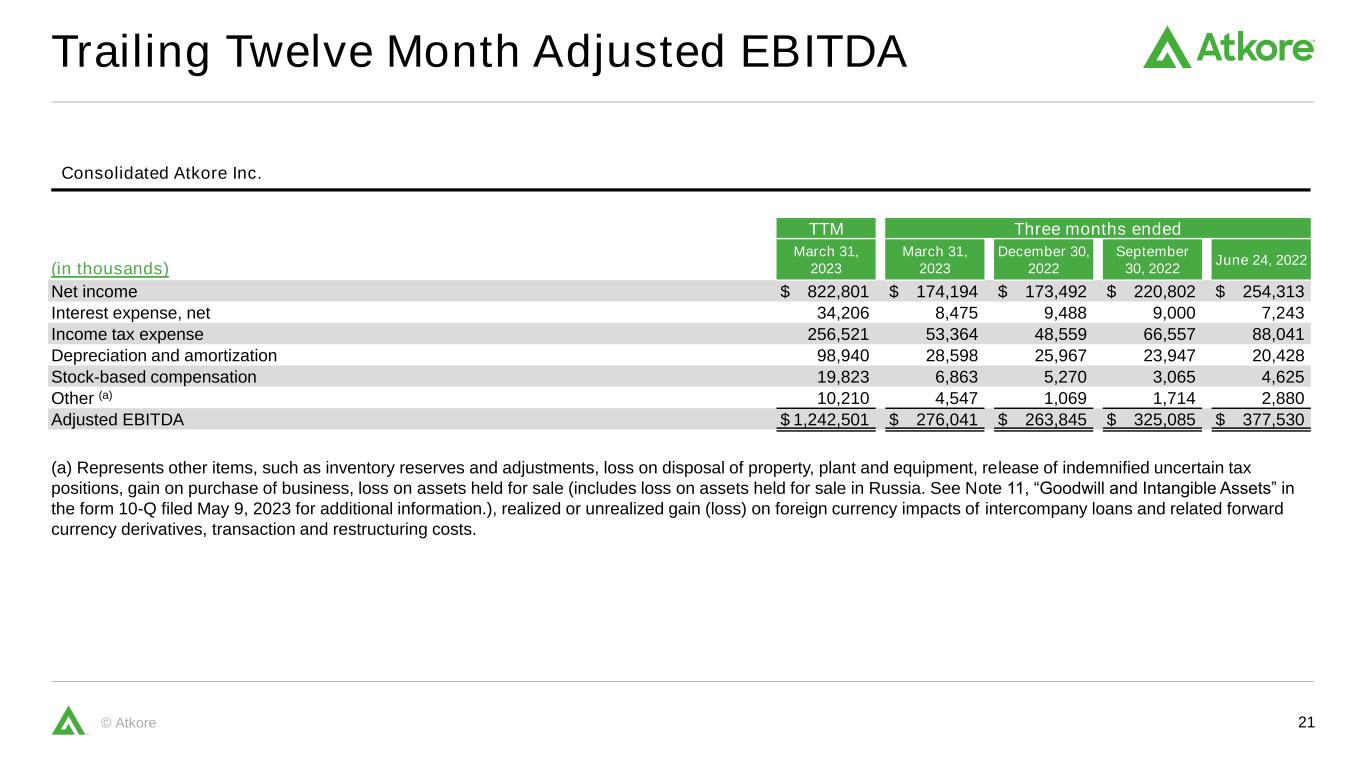
21© Atkore Trailing Twelve Month Adjusted EBITDA Consolidated Atkore Inc. TTM Three months ended (in thousands) March 31, 2023 March 31, 2023 December 30, 2022 September 30, 2022 June 24, 2022 Net income $ 822,801 $ 174,194 $ 173,492 $ 220,802 $ 254,313 Interest expense, net 34,206 8,475 9,488 9,000 7,243 Income tax expense 256,521 53,364 48,559 66,557 88,041 Depreciation and amortization 98,940 28,598 25,967 23,947 20,428 Stock-based compensation 19,823 6,863 5,270 3,065 4,625 Other (a) 10,210 4,547 1,069 1,714 2,880 Adjusted EBITDA $ 1,242,501 $ 276,041 $ 263,845 $ 325,085 $ 377,530 (a) Represents other items, such as inventory reserves and adjustments, loss on disposal of property, plant and equipment, release of indemnified uncertain tax positions, gain on purchase of business, loss on assets held for sale (includes loss on assets held for sale in Russia. See Note 11, “Goodwill and Intangible Assets” in the form 10-Q filed May 9, 2023 for additional information.), realized or unrealized gain (loss) on foreign currency impacts of intercompany loans and related forward currency derivatives, transaction and restructuring costs.

22© Atkore Net Debt to Total Debt and Leverage Ratio Consolidated Atkore Inc. ($ in thousands) March 31, 2023 September 30, 2022 September 30, 2021 September 30, 2020 September 30, 2019 September 30, 2018 Short-term debt and current maturities of long-term debt $ — $ — $ — $ — $ — $ 26,561 Long-term debt 761,612 760,537 758,386 803,736 845,317 877,686 Total debt 761,612 760,537 758,386 803,736 845,317 904,247 Less cash and cash equivalents 354,342 388,751 576,289 284,471 123,415 126,662 Net debt $ 407,270 $ 371,786 $ 182,097 $ 519,265 $ 721,902 $ 777,585 TTM Adjusted EBITDA (a) $ 1,242,501 $ 1,341,790 $ 897,547 $ 326,635 $ 324,408 $ 271,549 Total debt/TTM Adjusted EBITDA 0.6 x 0.6 x 0.8 x 2.5 x 2.6 x 3.3 x Net debt/TTM Adjusted EBITDA 0.3 x 0.3 x 0.2 x 1.6 x 2.2 x 2.9 x (a) Leverage ratio and TTM Adjusted EBITDA reconciliations for all periods above can be found either in the appendix, or in Exhibit 99.1 to form 8-K filed on May 9, 2023, November 18, 2022, November 18, 2021, November 19, 2020, November 22, 2019, and November 28, 2018.

23© Atkore atkore.com © Atkore


