Document
ENDAVA ANNOUNCES FIRST QUARTER FISCAL YEAR 2025 RESULTS
Q1 FY2025
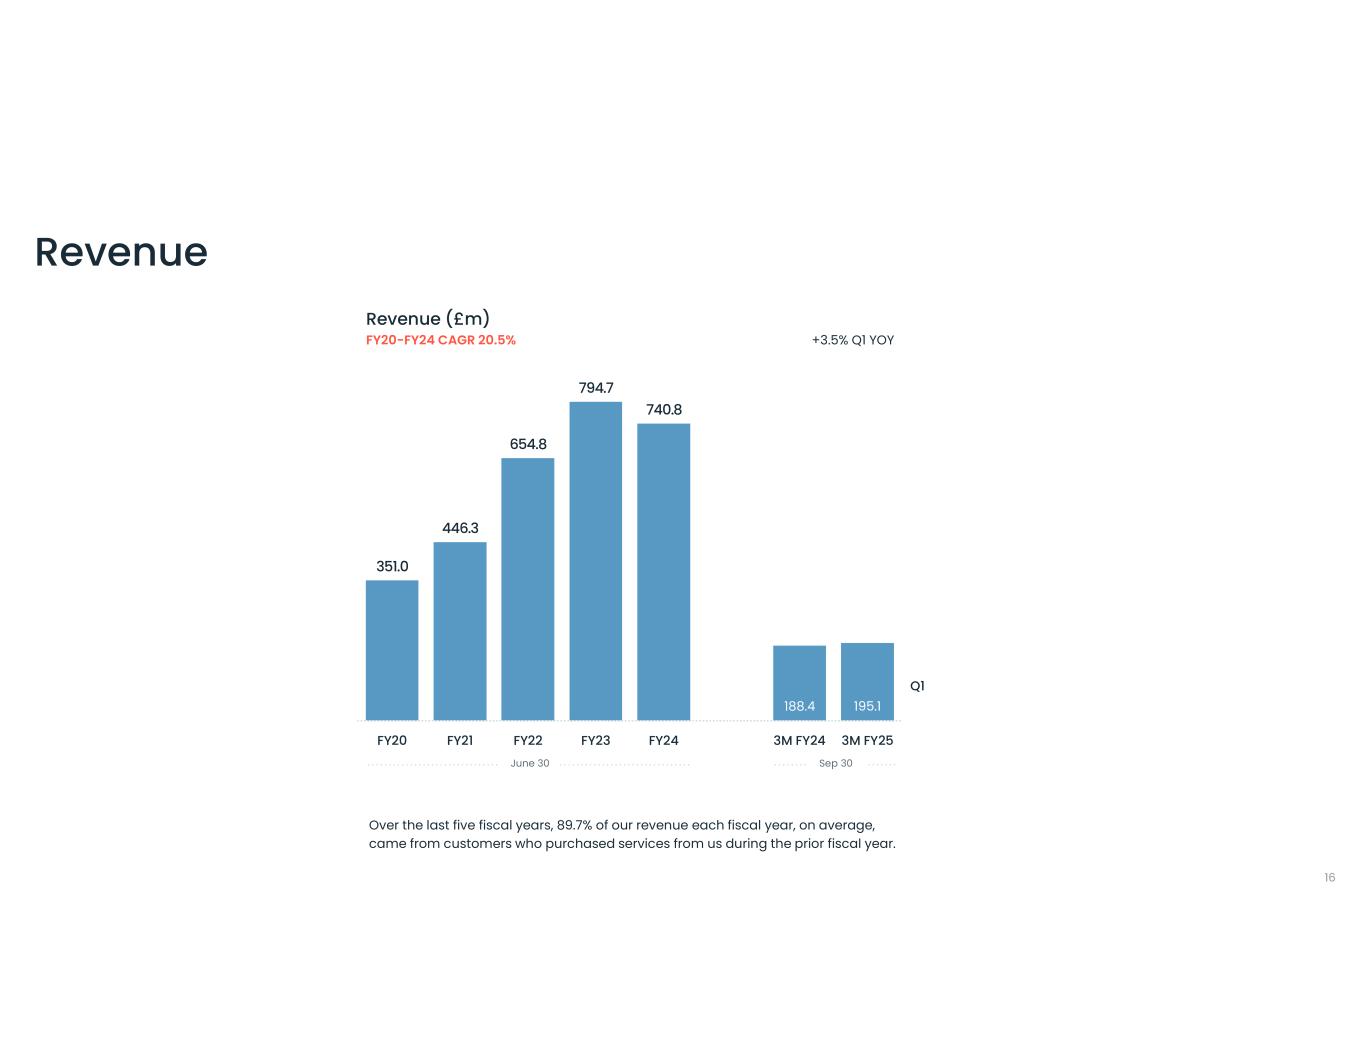
3.5% Year on Year Revenue Increase to £195.1 million
5.2% Revenue Increase at Constant Currency
Diluted EPS £0.04 compared to £0.21 in the prior comparative period
Adjusted Diluted EPS £0.25 compared to £0.39 in the prior comparative period
London, U.K. – Endava plc (NYSE: DAVA) ("Endava" or the "Company"), a leading technology services company combining world-class engineering, industry expertise and a people-centric mindset, today announced results for the three months ended September 30, 2024, the first quarter of its 2025 fiscal year ("Q1 FY2025").
"We are pleased with our results for the first quarter of FY25 showing both year on year and quarter on quarter revenue growth. We believe our business is well set up for new growth areas whilst reducing our industry vertical concentration. Our focus on AI is establishing leading edge propositions to solve real business challenges and our acquisition of GalaxE has enhanced our core modernization capability, adding patented IP that provides clients with a more efficient and cost effective path to their new digital future. These capabilities give us access to larger, more complex transformation programmes, with a powerful proprietary set of accelerators, providing us with a compelling sales offering. Our focus on digital solutions, initially built around the core, is now extending directly into the core itself," said John Cotterell, Endava's CEO.
FIRST QUARTER FISCAL YEAR 2025 FINANCIAL HIGHLIGHTS:
•Revenue for Q1 FY2025 was £195.1 million, an increase of 3.5% compared to £188.4 million in the same period in the prior year.
•Revenue increase at constant currency (a non-IFRS measure)* was 5.2% for Q1 FY2025.
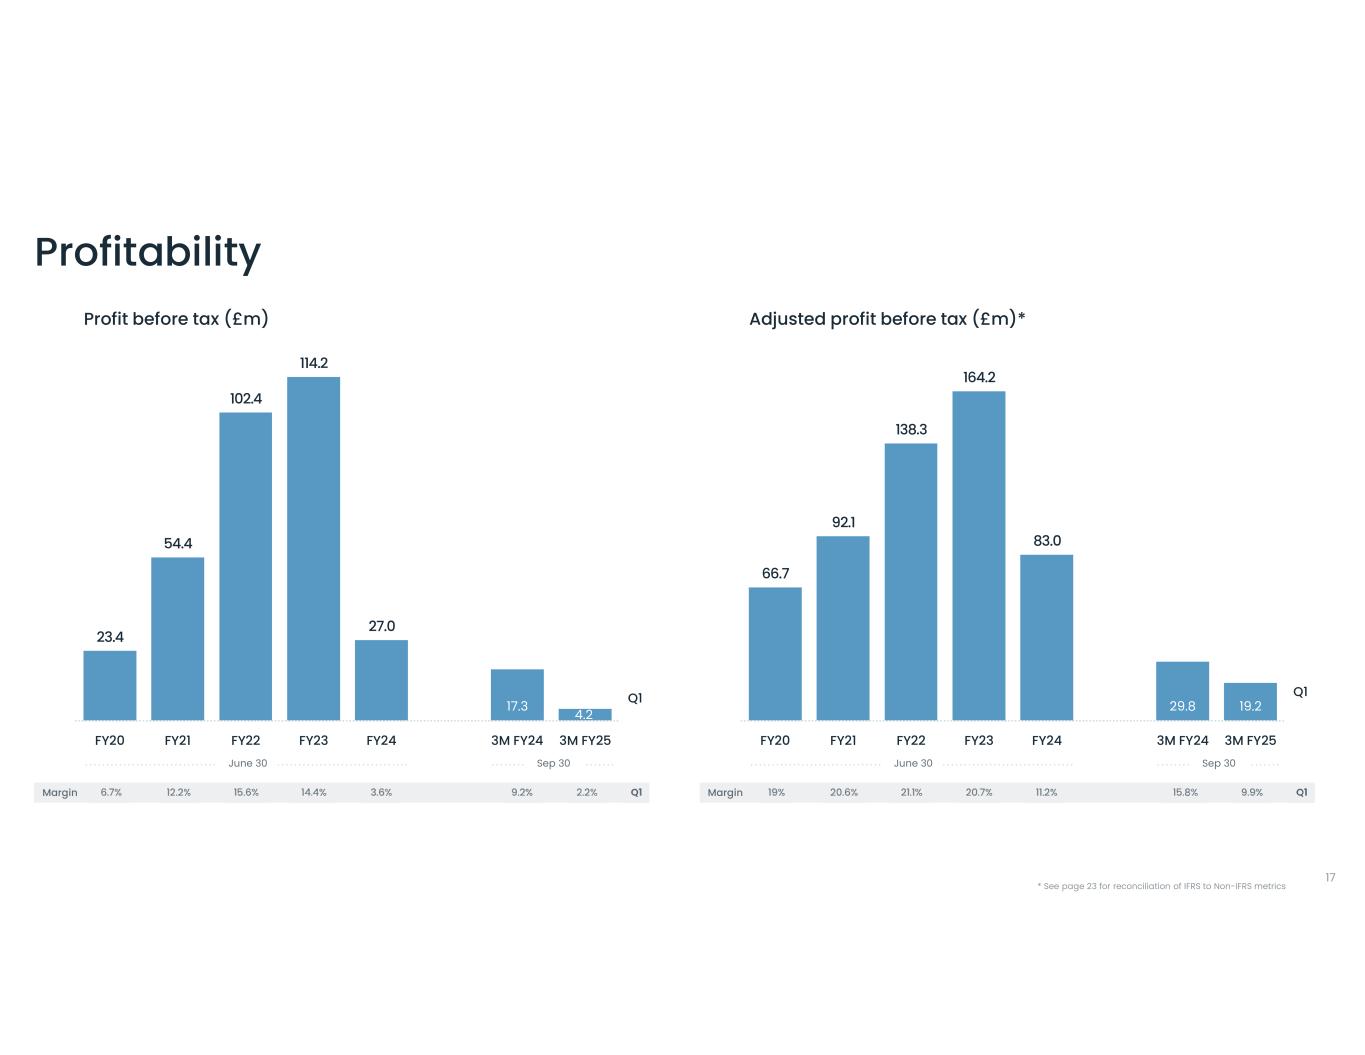
•Profit before tax for Q1 FY2025 was £4.2 million, compared to £17.3 million in the same period in the prior year.
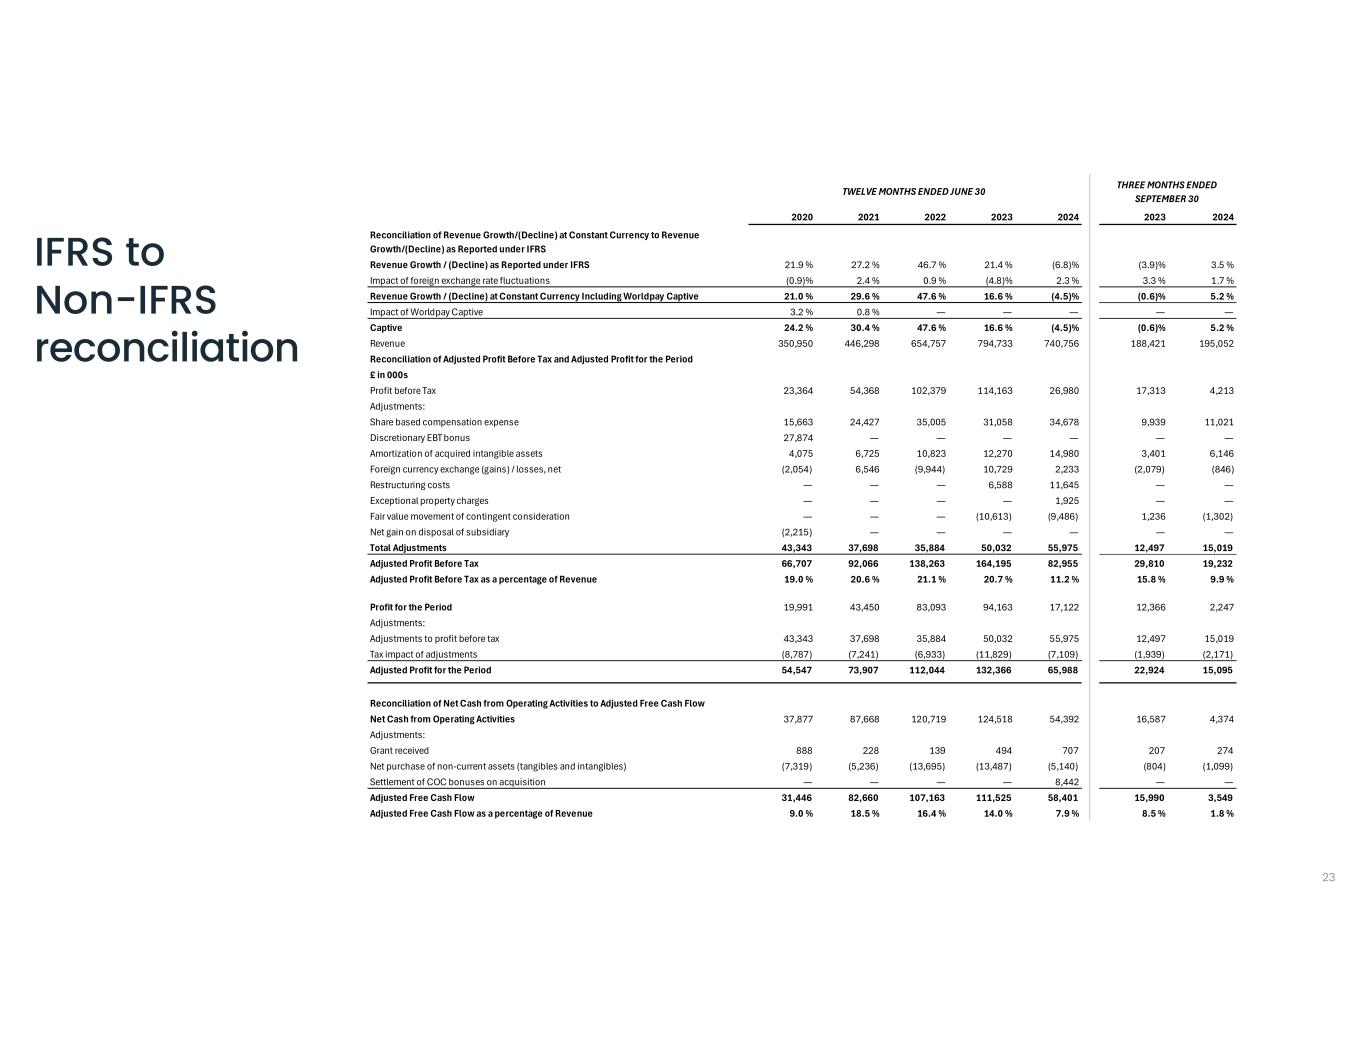
•Adjusted profit before tax (a non-IFRS measure)* for Q1 FY2025 was £19.2 million, or 9.9% of revenue, compared to £29.8 million, or 15.8% of revenue, in the same period in the prior year.
•Profit for the period was £2.2 million, resulting in a diluted earnings per share ("EPS") of £0.04, compared to profit of £12.4 million and diluted EPS of £0.21 in the same period in the prior year.
•Adjusted profit for the period (a non-IFRS measure)* was £15.1 million, resulting in adjusted diluted EPS (a non-IFRS measure)* of £0.25, compared to adjusted profit for the period of £22.9 million and adjusted diluted EPS of £0.39 in the same period in the prior year.
CASH FLOW:
•Net cash from operating activities was £4.4 million in Q1 FY2025, compared to net cash from operating activities of £16.6 million in the same period in the prior year.
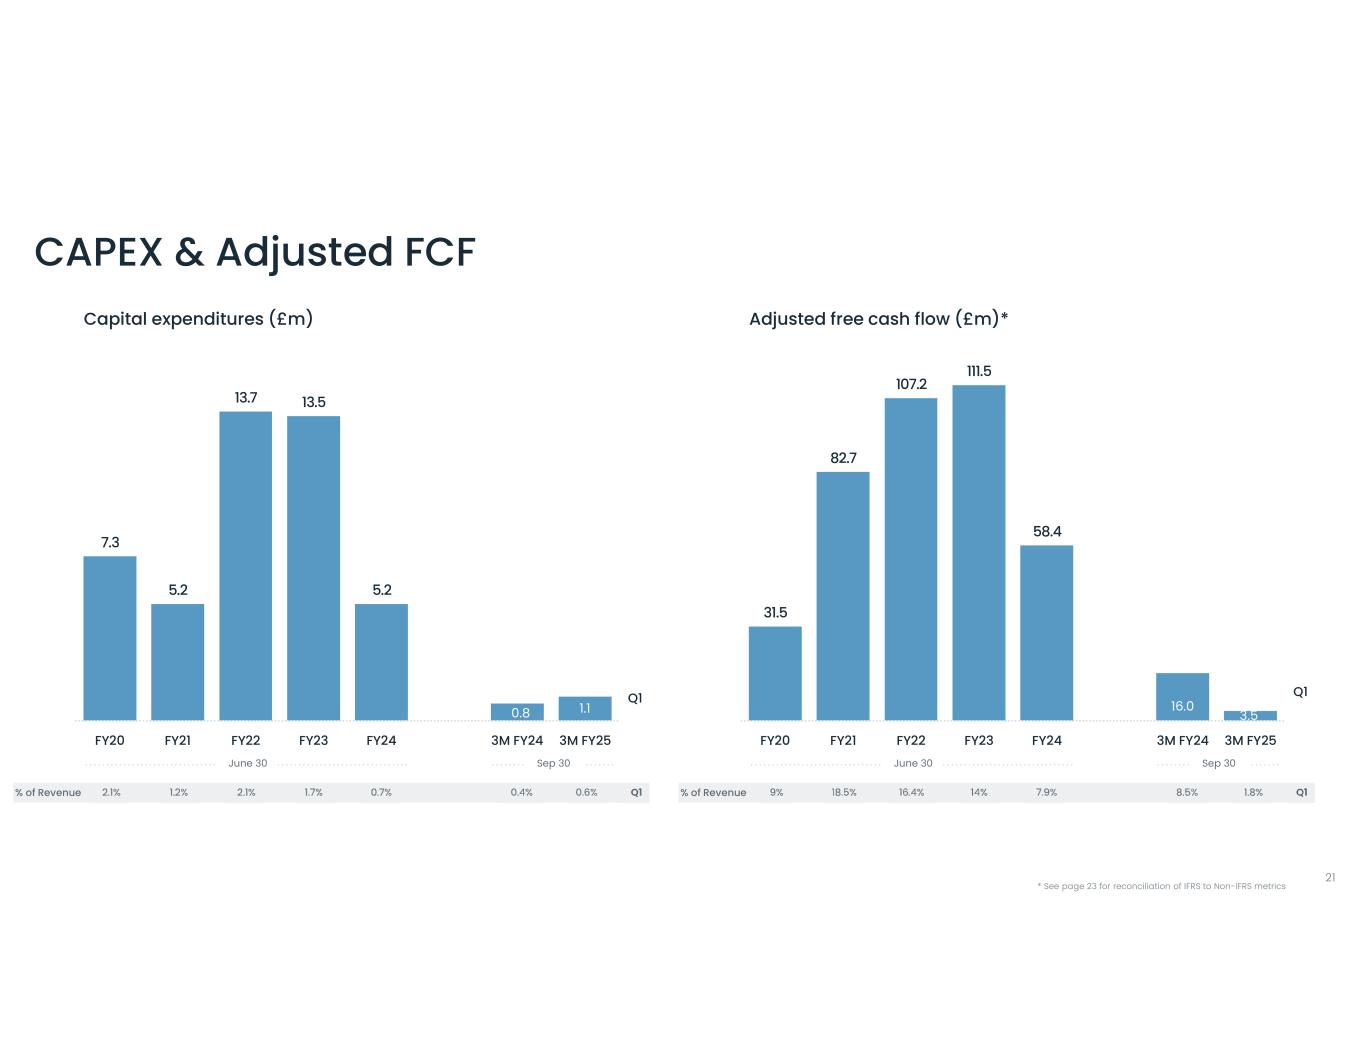
•Adjusted free cash flow (a non-IFRS measure)* was £3.5 million in Q1 FY2025, compared to £16.0 million in the same period in the prior year.
•At September 30, 2024, Endava had cash and cash equivalents of £52.8 million, compared to £62.4 million at June 30, 2024.
* Definitions of the non-IFRS measures used by the Company and a reconciliation of such measures to the related IFRS financial measure can be found under the sections below titled “Non-IFRS Financial Information” and “Reconciliation of IFRS Financial Measures to Non-IFRS Financial Measures.”
OTHER METRICS FOR THE QUARTER ENDED SEPTEMBER 30, 2024:
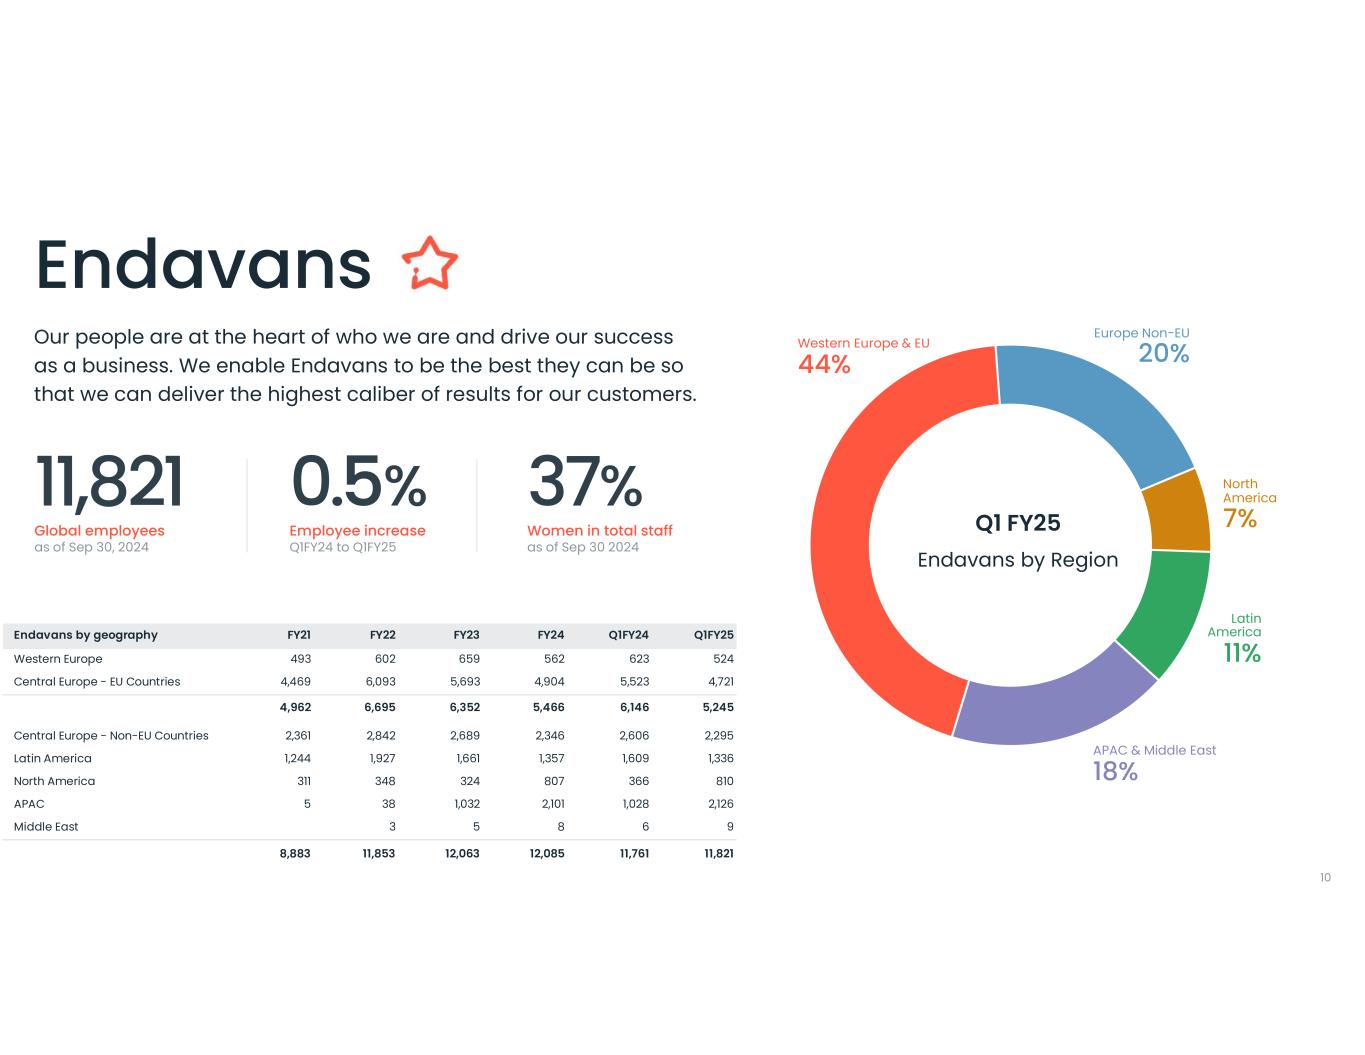
•Headcount totaled 11,821 at September 30, 2024, with an average of 10,627 operational employees in Q1 FY2025, compared to a headcount of 11,761 at September 30, 2023 and an average of 10,751 operational employees in the same period in the prior year.
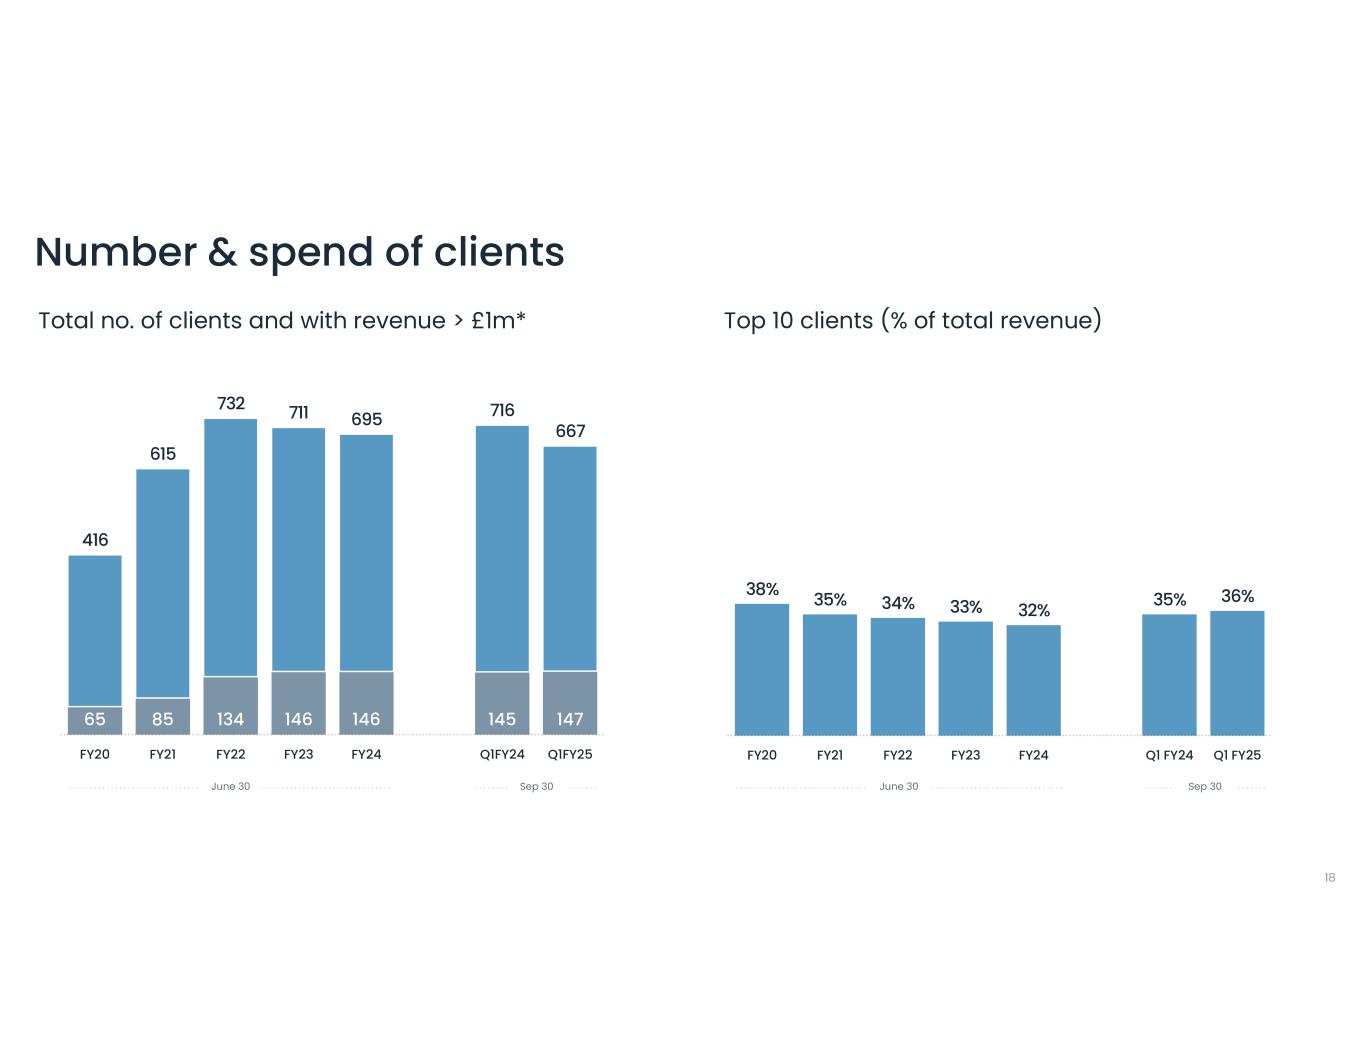
•Number of clients with over £1 million in revenue on a rolling twelve-month basis was 147 at September 30, 2024, compared to 145 clients at September 30, 2023.
•Top 10 clients accounted for 36% of revenue in Q1 FY2025, compared to 35% in the same period in the prior year.
•By geographic region, 39% of revenue was generated in North America, 25% was generated in Europe, 31% was generated in the United Kingdom and 5% was generated in the rest of the world in Q1 FY2025. This compares to 30% in North America, 25% in Europe, 35% in the United Kingdom and 10% in the Rest of the World in the same period in the prior year.
•By industry vertical, 20% of revenue was generated from Payments, 17% from BCM, 9% from Insurance, 21% from TMT, 9% from Mobility, 12% from Healthcare, and 12% from Other in Q1 FY2025. This compares to 27% from Payments, 14% from BCM, 8% from Insurance, 23% from TMT, 11% from Mobility, 4% from Healthcare, and 13% from Other in the same period in the prior year.
OUTLOOK:
Second Quarter Fiscal Year 2025:
Endava expects revenue will be in the range of £195.0 million to £197.0 million, representing a constant currency revenue increase of between 8.5% and 9.5% on a year over year basis. Endava expects adjusted diluted EPS to be in the range of £0.24 to £0.25 per share.
Full Fiscal Year 2025:
Endava expects revenue will be in the range of £800.0 million to £810.0 million, representing a constant currency revenue increase of between 10.0% and 11.5% on a year over year basis. Endava expects adjusted diluted EPS to be in the range of £1.12 to £1.17 per share.
This above guidance for the second quarter and full fiscal year 2025 assumes the exchange rates on October 31, 2024 (when the exchange rate was 1 British Pound to 1.30 US Dollar and 1.19 Euro).
Endava is not able, at this time, to reconcile its expectations for the second quarter and full fiscal year 2025 for a rate of revenue growth or decline at constant currency or adjusted diluted EPS to their respective most directly comparable IFRS measures as a result of the uncertainty regarding, and the potential variability of, reconciling items such as share-based compensation expense, amortisation of acquired intangible assets, foreign currency exchange losses / (gains), net, and fair value movement of contingent consideration, as applicable. Accordingly, a reconciliation is not available without unreasonable effort, although it is important to note that these factors could be material to Endava's results computed in accordance with IFRS.
The guidance provided above is forward-looking in nature. Actual results may differ materially. See “Forward-Looking Statements” below.
CONFERENCE CALL DETAILS:
The Company will host a conference call at 8:00 am ET today, November 12, 2024, to review its Q1 FY2025 results. To participate in Endava’s Q1 FY2025 earnings conference call, please dial in at least five minutes prior to the scheduled start time (844) 481-2736 or (412) 317-0665 for international participants, Conference ID: Endava Call.
Investors may listen to the call on Endava’s Investor Relations website at http://investors.Endava.com. The webcast will be recorded and available for replay until Friday, December 13, 2024.
ABOUT ENDAVA PLC:
We are a leading provider of next-generation technology services, dedicated to enabling our customers to drive real impact and meaningful change. By combining world-class engineering, deep industry expertise and a customer-centric mindset, we consult and partner with our customers to create technological solutions that fuel transformation and empower businesses to succeed in the AI-driven digital shift. From ideation to production, we support our customers with tailor-made solutions at every stage of their digital transformation, regardless of industry, region or scale.
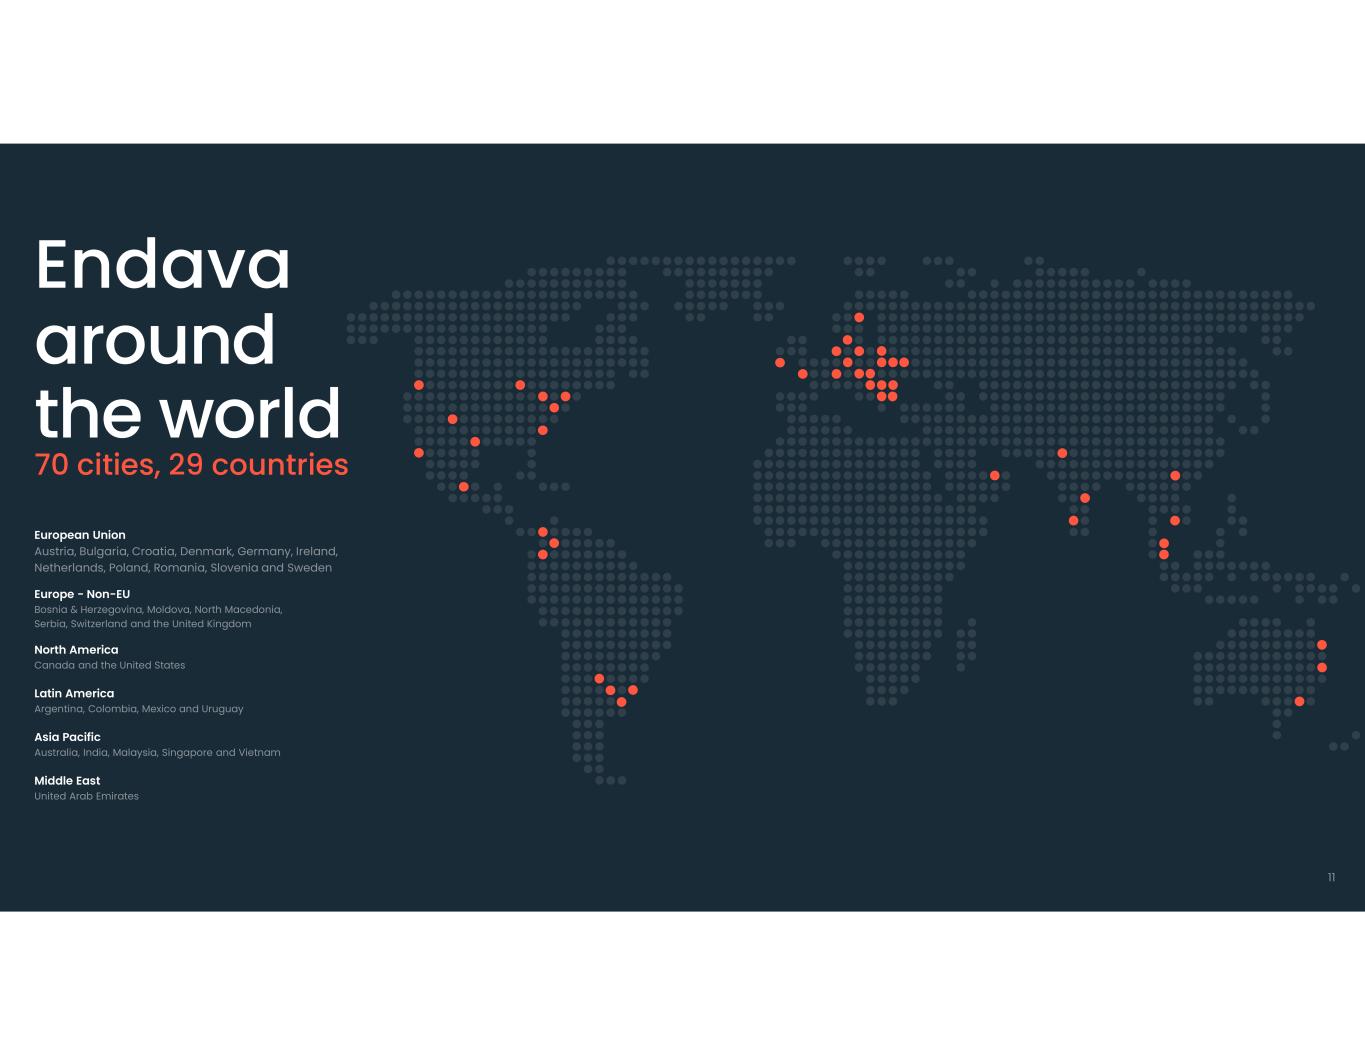
Endava’s clients span payments, insurance, finance and banking, technology, media, telecommunications, healthcare and life sciences, mobility, retail and consumer goods and more. As of September 30, 2024, 11,821 Endavans are helping clients break new ground across locations in Europe, the Americas, Asia Pacific and the Middle East.
NON-IFRS FINANCIAL INFORMATION:
To supplement Endava’s Condensed Consolidated Statements of Comprehensive Income, Condensed Consolidated Balance Sheets and Condensed Consolidated Statements of Cash Flows presented in accordance with IFRS, the Company uses non-IFRS measures of certain components of financial performance in this press release. These measures include revenue growth/(decline) rate at constant currency, adjusted profit before tax, adjusted profit for the period, adjusted diluted EPS and adjusted free cash flow.
Revenue growth/(decline) rate at constant currency is calculated by translating revenue from entities reporting in foreign currencies into British Pounds using the comparable foreign currency exchange rates from the prior period. For example, the average currency rates in effect for the fiscal quarter ended September 30, 2023 were used to convert revenue for the fiscal quarter ended September 30, 2024 and the revenue for the comparable prior period.
Adjusted profit before tax ("Adjusted PBT") is defined as the Company’s profit before tax adjusted to exclude the impact of share-based compensation expense, amortisation of acquired intangible assets, realised and unrealised foreign currency exchange (gains)/losses, net, and fair value movement of contingent consideration, all of which are non-cash items except for realised foreign currency exchange (gains)/losses, net. Our Adjusted PBT margin is our Adjusted PBT as a percentage of our total revenue.
Adjusted profit for the period is defined as Adjusted PBT less the tax charge for the period adjusted for the tax impact of the adjustments to PBT.
Adjusted diluted EPS is defined as Adjusted profit for the period, divided by weighted average number of shares outstanding - diluted.
Adjusted free cash flow is the Company’s net cash from operating activities, plus grants received, less net purchases of non-current assets (tangible and intangible). Adjusted free cash flow is not intended to be a measure of residual cash available for management's discretionary use since it omits significant sources and uses of cash flow, including mandatory debt repayments and changes in working capital.
Management believes these measures help illustrate underlying trends in the Company's business and uses the measures to establish budgets and operational goals, communicated internally and externally, for managing the Company's business and evaluating its performance.
Management also believes the presentation of its non-IFRS financial measures enhances an investor’s overall understanding of the Company’s historical financial performance. The presentation of the Company’s non-IFRS financial measures is not meant to be considered in isolation or as a substitute for the Company’s financial results prepared in accordance with IFRS, and its non-IFRS measures may be different from non-IFRS measures used by other companies. Investors should review the reconciliation of the Company’s non-IFRS financial measures to the comparable IFRS financial measures included below, and not rely on any single financial measure to evaluate the Company’s business.
FORWARD-LOOKING STATEMENTS:
This press release includes forward-looking statements within the meaning of the Private Securities Litigation Reform Act of 1995. These forward-looking statements may be identified by the use of terms and phrases such as “believe,” “expect,” "outlook," “may,” “will,” and other similar terms and phrases. Such forward-looking statements include, but are not limited to, the statements regarding Endava’s ability to develop AI into leading edge propositions to solve real business challenges; the impact of GalaxE on Endava’s capabilities; Endava's business initiatives, growth opportunities and offerings; Endava's addressable market size; and management's financial outlook for the second quarter and full fiscal year 2025. Forward-looking statements involve known and unknown risks, uncertainties and other factors that could cause actual results to differ materially from the results anticipated by these forward-looking statements, including, but not limited to: Endava’s ability to achieve its revenue growth goals including as a result of a slower conversion of its pipeline; Endava's expectations of future operating results or financial performance; Endava’s ability to accurately forecast and achieve its announced guidance; Endava's ability to retain existing clients and attract new clients, including its ability to increase revenue from existing clients and diversify its revenue concentration; Endava’s ability to attract and retain highly-skilled IT professionals at cost-effective rates; Endava's ability to successfully identify acquisition targets, consummate acquisitions and successfully integrate acquired businesses and personnel; Endava's ability to penetrate new industry verticals and geographies and grow its revenue in current industry verticals and geographies; Endava’s ability to maintain favorable pricing and utilization rates to support its gross margin; the effects of increased competition as well as innovations by new and existing competitors in its market; the size of Endava's addressable market and market trends; Endava’s ability to adapt to technological change and industry trends and innovate solutions for
its clients; Endava's plans for growth and future operations, including its ability to manage its growth; Endava's ability to effectively manage its international operations, including Endava's exposure to foreign currency exchange rate fluctuations; Endava's future financial performance, including trends in revenue, cost of sales, gross profit, selling, general and administrative expenses, finance income and expense and taxes; the impact of unstable market and economic conditions, including as a result of actual or anticipated changes in interest rates, economic inflation and the responses by central banking authorities to control such inflation; and the impact of political instability, natural disaster, events of terrorism and wars, including the military conflict between Ukraine and Russia and related sanctions, as well as other risks and uncertainties discussed in the “Risk Factors” section of Endava's Annual Report on Form 20-F for the year ended June 30, 2024 filed with the SEC on September 19, 2024 and in other filings that Endava makes from time to time with the SEC. In addition, the forward-looking statements included in this press release represent Endava’s views and expectations as of the date hereof and are based on information currently available to Endava. Endava anticipates that subsequent events and developments may cause its views to change. Endava specifically disclaims any obligation to update the forward-looking statements in this press release except as required by law. These forward-looking statements should not be relied upon as representing Endava’s views as of any date subsequent to the date hereof.
INVESTOR CONTACT:
Endava plc
Laurence Madsen, Head of Investor Relations
Investors@endava.com
CONDENSED CONSOLIDATED STATEMENTS OF COMPREHENSIVE INCOME
|
|
|
|
|
|
|
|
|
|
|
|
|
Three Months Ended September 30 |
|
|
|
2024 |
2023 |
|
|
|
£’000 |
£’000 |
| REVENUE |
|
|
195,052 |
188,421 |
| Cost of sales |
|
|
|
|
| Direct cost of sales |
|
|
(139,520) |
(127,319) |
| Allocated cost of sales |
|
|
(6,873) |
(6,632) |
| Total cost of sales |
|
|
(146,393) |
(133,951) |
| GROSS PROFIT |
|
|
48,659 |
54,470 |
| Selling, general and administrative expenses |
|
|
(43,969) |
(38,363) |
|
|
|
|
|
| OPERATING PROFIT |
|
|
4,690 |
16,107 |
| Net finance income/(expense) |
|
|
(477) |
1,206 |
|
|
|
|
|
| PROFIT BEFORE TAX |
|
|
4,213 |
17,313 |
| Tax on profit on ordinary activities |
|
|
(1,966) |
(4,947) |
| PROFIT FOR THE PERIOD |
|
|
2,247 |
12,366 |
| OTHER COMPREHENSIVE INCOME |
|
|
|
|
| Items that may be reclassified subsequently to profit or loss: |
|
|
|
|
| Exchange differences on translating foreign operations and net investment hedge impact |
|
|
(23,340) |
4,742 |
| TOTAL COMPREHENSIVE INCOME/(LOSS) FOR THE PERIOD ATTRIBUTABLE TO OWNERS OF THE COMPANY |
|
|
(21,093) |
17,108 |
|
|
|
|
|
| EARNINGS PER SHARE (EPS): |
|
|
|
|
| Weighted average number of shares outstanding - Basic |
|
|
59,051,116 |
|
57,901,454 |
|
| Weighted average number of shares outstanding - Diluted |
|
|
59,430,225 |
|
58,438,198 |
|
| Basic EPS (£) |
|
|
0.04 |
|
0.21 |
|
| Diluted EPS (£) |
|
|
0.04 |
|
0.21 |
|
CONDENSED CONSOLIDATED BALANCE SHEETS
|
|
|
|
|
|
|
|
|
|
|
|
|
September 30, 2024 |
June 30, 2024 |
September 30, 2023 (1) |
|
£’000 |
£’000 |
£’000 |
|
|
|
|
| ASSETS - NON-CURRENT |
|
|
|
| Goodwill |
494,409 |
|
515,724 |
|
257,523 |
|
| Intangible assets |
115,598 |
|
127,797 |
|
65,450 |
|
| Property, plant and equipment |
18,197 |
|
20,638 |
|
24,506 |
|
| Lease right-of-use assets |
50,474 |
|
53,294 |
|
65,100 |
|
| Deferred tax assets |
18,613 |
|
18,323 |
|
21,371 |
|
| Financial assets and other receivables |
9,455 |
|
10,499 |
|
3,177 |
|
| TOTAL |
706,746 |
|
746,275 |
|
437,127 |
|
| ASSETS - CURRENT |
|
|
|
|
|
|
|
| Trade and other receivables |
198,201 |
|
193,673 |
|
187,434 |
|
| Corporation tax receivable |
9,783 |
|
11,402 |
|
5,347 |
|
| Financial assets |
181 |
|
183 |
|
67 |
|
| Cash and cash equivalents |
52,811 |
|
62,358 |
|
168,191 |
|
| TOTAL |
260,976 |
|
267,616 |
|
361,039 |
|
| TOTAL ASSETS |
967,722 |
|
1,013,891 |
|
798,166 |
|
| LIABILITIES - CURRENT |
|
|
|
| Lease liabilities |
14,161 |
|
14,450 |
|
14,698 |
|
| Trade and other payables |
102,146 |
|
116,569 |
|
84,617 |
|
| Corporation tax payable |
8,645 |
|
8,556 |
|
7,549 |
|
| Contingent consideration |
6,651 |
|
8,444 |
|
8,067 |
|
| Deferred consideration |
5,749 |
|
5,840 |
|
155 |
|
|
|
|
|
| TOTAL |
137,352 |
|
153,859 |
|
115,086 |
|
| LIABILITIES - NON CURRENT |
|
|
|
| Borrowings |
132,638 |
|
144,754 |
|
— |
|
| Lease liabilities |
40,811 |
|
43,557 |
|
54,253 |
|
| Deferred tax liabilities |
29,110 |
|
30,814 |
|
14,047 |
|
| Contingent consideration |
— |
|
— |
|
9,336 |
|
|
|
|
|
| Deferred consideration |
943 |
|
943 |
|
5,676 |
|
| Other liabilities |
424 |
|
509 |
|
522 |
|
| TOTAL |
203,926 |
|
220,577 |
|
83,834 |
|
| EQUITY |
|
|
|
| Share capital |
1,180 |
|
1,180 |
|
1,155 |
|
| Share premium |
21,280 |
|
21,280 |
|
14,635 |
|
| Merger relief reserve |
63,440 |
|
63,440 |
|
42,805 |
|
| Retained earnings |
583,969 |
|
573,640 |
|
546,111 |
|
| Other reserves |
(43,399) |
|
(20,059) |
|
(5,434) |
|
| Investment in own shares |
(26) |
|
(26) |
|
(26) |
|
| TOTAL |
626,444 |
|
639,455 |
|
599,246 |
|
| TOTAL LIABILITIES AND EQUITY |
967,722 |
|
1,013,891 |
|
798,166 |
|
CONDENSED CONSOLIDATED STATEMENTS OF CASH FLOWS
|
|
|
|
|
|
|
|
|
|
|
|
|
Three Months Ended September 30(2) |
|
|
|
2024 |
2023 |
|
|
|
£’000 |
£’000 |
| OPERATING ACTIVITIES |
|
|
|
|
| Profit for the period |
|
|
2,247 |
|
12,366 |
|
| Income tax charge |
|
|
1,966 |
|
4,947 |
|
| Non-cash adjustments |
|
|
23,593 |
|
15,800 |
|
| Tax paid |
|
|
(1,320) |
|
(2,348) |
|
|
|
|
|
|
| Net changes in working capital |
|
|
(22,112) |
|
(14,178) |
|
| Net cash from operating activities |
|
|
4,374 |
|
16,587 |
|
| |
|
|
|
|
| INVESTING ACTIVITIES |
|
|
|
|
| Purchase of non-current assets (tangibles and intangibles) |
|
|
(1,135) |
|
(807) |
|
| Proceeds from disposal of non-current assets |
|
|
36 |
|
3 |
|
| Payment for acquisition of subsidiary, net of cash acquired |
|
|
(68) |
|
(4,182) |
|
| Other acquisition-related settlements |
|
|
— |
|
(6,680) |
|
|
|
|
|
|
| Interest received |
|
|
367 |
|
1,565 |
|
| Net cash used in investing activities |
|
|
(800) |
|
(10,101) |
|
|
|
|
|
|
| FINANCING ACTIVITIES |
|
|
|
|
| Proceeds from sublease |
|
|
30 |
|
56 |
|
|
|
|
|
|
| Repayment of borrowings |
|
|
(7,000) |
|
— |
|
| Repayment of lease liabilities |
|
|
(3,093) |
|
(3,348) |
|
| Repayment of lease interest |
|
|
(507) |
|
(572) |
|
| Interest and debt financing costs paid |
|
|
(2,252) |
|
(287) |
|
| Grant received |
|
|
274 |
|
207 |
|
|
|
|
|
|
|
|
|
|
|
| Proceeds from exercise of options |
|
|
— |
|
11 |
|
| Net cash used in financing activities |
|
|
(12,548) |
|
(3,933) |
|
| Net change in cash and cash equivalents |
|
|
(8,974) |
|
2,553 |
|
|
|
|
|
|
| Cash and cash equivalents at the beginning of the period |
|
|
62,358 |
|
164,703 |
|
| Exchange differences on cash and cash equivalents |
|
|
(573) |
|
935 |
|
| Cash and cash equivalents at the end of the period |
|
|
52,811 |
|
168,191 |
|
RECONCILIATION OF IFRS FINANCIAL MEASURES TO NON-IFRS FINANCIAL MEASURES
RECONCILIATION OF REVENUE GROWTH/(DECLINE) RATE AS REPORTED UNDER IFRS TO REVENUE GROWTH/(DECLINE) RATE AT CONSTANT CURRENCY:
|
|
|
|
|
|
|
|
|
|
|
|
|
Three Months Ended September 30 |
|
|
|
2024 |
2023 |
| REVENUE GROWTH/(DECLINE) RATE AS REPORTED UNDER IFRS |
|
|
3.5 |
% |
(3.9 |
%) |
| Impact of Foreign exchange rate fluctuations |
|
|
1.7 |
% |
3.3 |
% |
| REVENUE GROWTH/(DECLINE) RATE AT CONSTANT CURRENCY |
|
|
5.2 |
% |
(0.6 |
%) |
|
|
|
|
|
|
|
|
|
|
RECONCILIATION OF ADJUSTED PROFIT BEFORE TAX AND ADJUSTED PROFIT FOR THE PERIOD:
|
|
|
|
|
|
|
|
|
|
|
|
|
Three Months Ended September 30 |
|
|
|
2024 |
2023 |
|
|
|
£’000 |
£’000 |
|
|
|
|
|
| PROFIT BEFORE TAX |
|
|
4,213 |
|
17,313 |
|
| Adjustments: |
|
|
|
|
| Share-based compensation expense |
|
|
11,021 |
|
9,939 |
|
|
|
|
|
|
| Amortisation of acquired intangible assets |
|
|
6,146 |
|
3,401 |
|
| Foreign currency exchange (gains)/losses, net |
|
|
(846) |
|
(2,079) |
|
|
|
|
|
|
|
|
|
|
|
|
|
|
|
|
|
|
|
|
|
|
|
|
|
|
|
|
|
|
|
|
|
|
|
|
| Fair value movement of contingent consideration |
|
|
(1,302) |
|
1,236 |
|
| Total adjustments |
|
|
15,019 |
|
12,497 |
|
| ADJUSTED PROFIT BEFORE TAX |
|
|
19,232 |
|
29,810 |
|
|
|
|
|
|
| PROFIT FOR THE PERIOD |
|
|
2,247 |
|
12,366 |
|
| Adjustments: |
|
|
|
|
| Adjustments to profit before tax |
|
|
15,019 |
|
12,497 |
|
| Tax impact of adjustments |
|
|
(2,171) |
|
(1,939) |
|
| ADJUSTED PROFIT FOR THE PERIOD |
|
|
15,095 |
|
22,924 |
|
|
|
|
|
|
RECONCILIATION OF ADJUSTED DILUTED EARNINGS PER SHARE:
|
|
|
|
|
|
|
|
|
|
|
|
|
Three Months Ended September 30 |
|
|
|
2024 |
2023 |
|
|
|
£’000 |
£’000 |
|
|
|
|
|
| DILUTED EARNINGS PER SHARE (£) |
|
|
0.04 |
|
0.21 |
|
| Adjustments: |
|
|
|
|
| Share-based compensation expense |
|
|
0.19 |
|
0.17 |
|
| Amortisation of acquired intangible assets |
|
|
0.10 |
|
0.06 |
|
| Foreign currency exchange (gains)/losses, net |
|
|
(0.01) |
|
(0.04) |
|
|
|
|
|
|
|
|
|
|
|
| Fair value movement of contingent consideration |
|
|
(0.03) |
|
0.02 |
|
| Tax impact of adjustments |
|
|
(0.04) |
|
(0.03) |
|
| Total adjustments |
|
|
0.21 |
|
0.18 |
|
| ADJUSTED DILUTED EARNINGS PER SHARE (£) |
|
|
0.25 |
|
0.39 |
|
RECONCILIATION OF NET CASH FROM OPERATING ACTIVITIES TO ADJUSTED FREE CASH FLOW
|
|
|
|
|
|
|
|
|
|
|
|
|
Three Months Ended September 30 |
|
|
|
2024 |
2023 |
|
|
|
£’000 |
£’000 |
|
|
|
|
|
| NET CASH FROM OPERATING ACTIVITIES |
|
|
4,374 |
|
16,587 |
|
| Adjustments: |
|
|
|
|
| Grant received |
|
|
274 |
|
207 |
|
| Net purchase of non-current assets (tangibles and intangibles) |
|
|
(1,099) |
|
(804) |
|
|
|
|
|
|
| ADJUSTED FREE CASH FLOW |
|
|
3,549 |
|
15,990 |
|
SUPPLEMENTARY INFORMATION
SHARE-BASED COMPENSATION EXPENSE
|
|
|
|
|
|
|
|
|
|
|
|
|
Three Months Ended September 30 |
|
|
|
2024 |
2023 |
|
|
|
£’000 |
£’000 |
|
|
|
|
|
| Direct cost of sales |
|
|
7,794 |
|
6,802 |
|
| Selling, general and administrative expenses |
|
|
3,227 |
|
3,137 |
|
| Total |
|
|
11,021 |
|
9,939 |
|
DEPRECIATION AND AMORTISATION
|
|
|
|
|
|
|
|
|
|
|
|
|
Three Months Ended September 30 |
|
|
|
2024 |
2023 |
|
|
|
£’000 |
£’000 |
|
|
|
|
|
| Direct cost of sales |
|
|
5,180 |
|
5,196 |
|
| Selling, general and administrative expenses |
|
|
6,897 |
|
4,223 |
|
| Total |
|
|
12,077 |
|
9,419 |
|
EMPLOYEES, TOP 10 CUSTOMERS AND REVENUE SPLIT
|
|
|
|
|
|
|
|
|
|
|
|
|
Three Months Ended September 30 |
|
|
|
2024 |
2023 |
|
|
|
|
|
| Closing number of total employees (including directors) |
|
|
11,821 |
11,761 |
| Average operational employees |
|
|
10,627 |
10,751 |
|
|
|
|
|
| Top 10 customers % |
|
|
36% |
35% |
Number of clients with > £1m of revenue
(rolling 12 months) |
|
|
147 |
145 |
|
|
|
|
|
| Geographic split of revenue % |
|
|
|
|
| North America |
|
|
39% |
30% |
| Europe |
|
|
25% |
25% |
| UK |
|
|
31% |
35% |
| Rest of World (RoW) |
|
|
5% |
10% |
|
|
|
|
|
| Industry vertical split of revenue % |
|
|
|
|
| Payments |
|
|
20% |
27% |
| Banking and Capital Markets |
|
|
17% |
14% |
| Insurance |
|
|
9% |
8% |
| TMT |
|
|
21% |
23% |
| Mobility |
|
|
9% |
11% |
| Healthcare |
|
|
12% |
4% |
| Other |
|
|
12% |
13% |
FOOTNOTES
(1) Restated to include the effect of revisions arising from provisional to final acquisition accounting for DEK and Mudbath.
(2) The presentation of the Consolidated Statement of Cash Flows has been changed to separately present the repayment of lease interest from the total repayments of lease liabilities.


