Document
ENDAVA ANNOUNCES THIRD QUARTER FISCAL YEAR 2023 RESULTS
Q3 FY2023
20.3% Year on Year Revenue Growth to £203.5 million
14.6% Revenue Growth at Constant Currency
IFRS diluted EPS £0.42 compared to £0.35 in the prior year comparative period
Adjusted diluted EPS £0.59 compared to £0.48 in the prior year comparative period
London, U.K. – Endava plc (NYSE: DAVA) ("Endava" or the "Company") a global provider of digital transformation, agile development and intelligent automation services, today announced results for the three months ended March 31, 2023, the third quarter of its 2023 fiscal year ("Q3 FY2023").
“Endava reported another solid quarter for Q3 FY2023 despite the challenging economic environment,” said John Cotterell, Endava's CEO. "Demand from new and existing clients continued to drive revenue growth in the quarter, leading to a revenue increase of 14.6% in constant currency for Q3 FY2023.”
THIRD QUARTER FISCAL YEAR 2023 FINANCIAL HIGHLIGHTS:
•Revenue for Q3 FY2023 was £203.5 million, an increase of 20.3% compared to £169.2 million in the same period in the prior year.
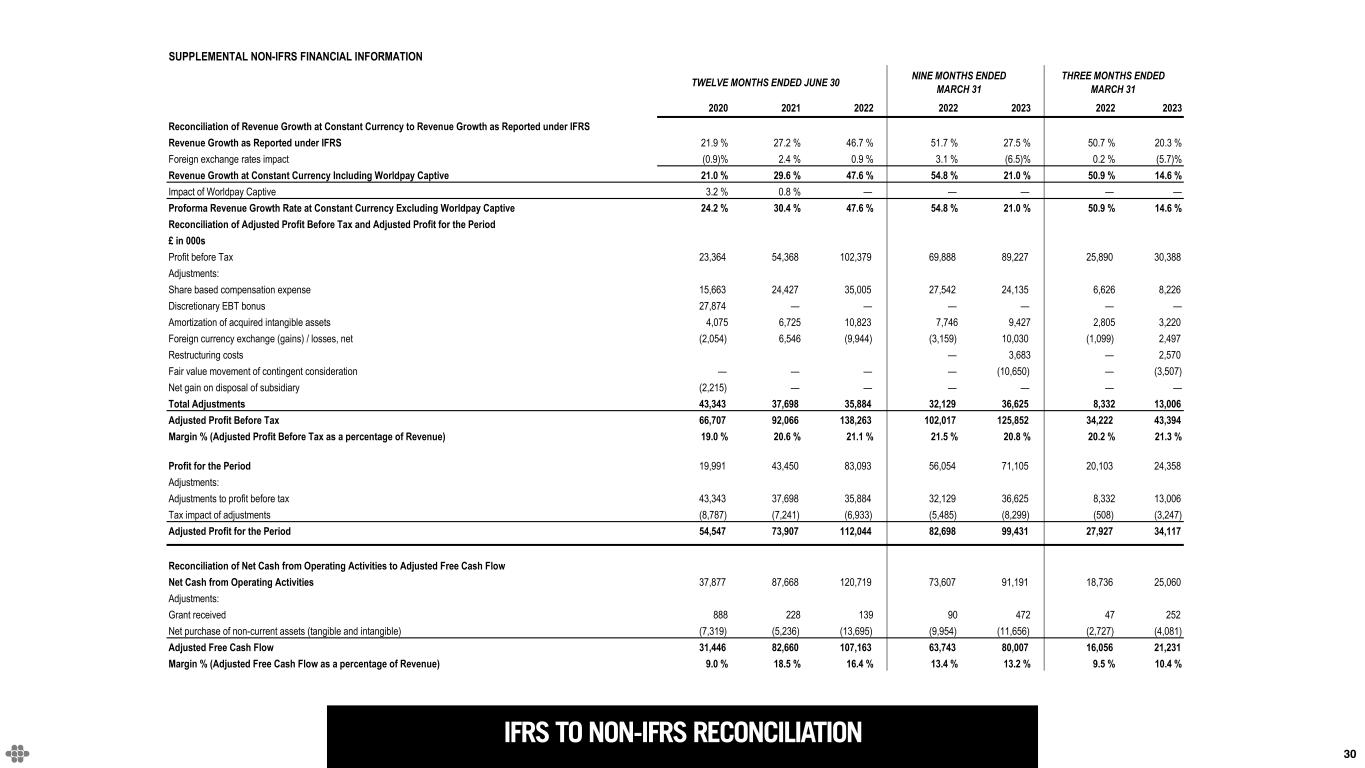
•Revenue growth rate at constant currency (a non-IFRS measure)* was 14.6% for Q3 FY2023, compared to 50.9% in the same period in the prior year.
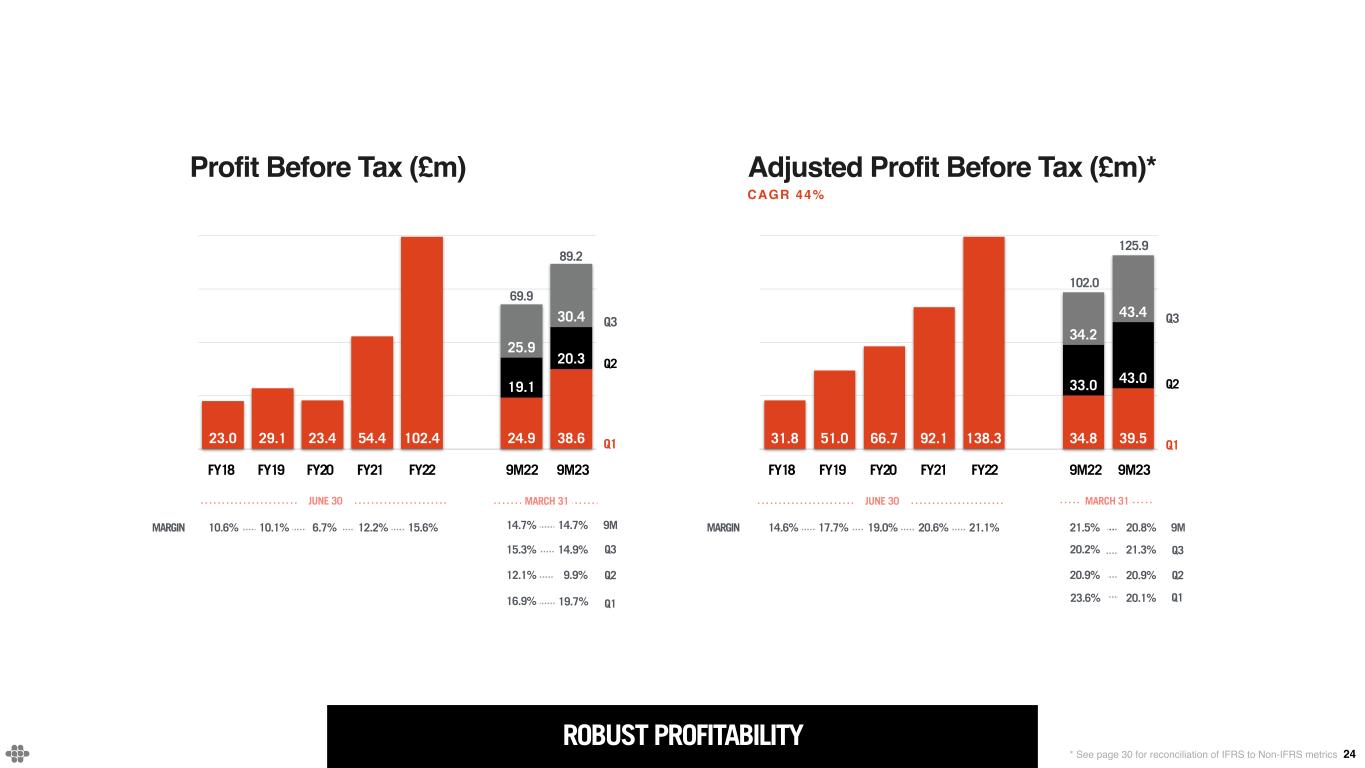
•Profit before tax for Q3 FY2023 was £30.4 million, compared to £25.9 million in the same period in the prior year.
•Adjusted profit before tax (a non-IFRS measure)* for Q3 FY2023 was £43.4 million, compared to £34.2 million in the same period in the prior year, or 21.3% of revenue, compared to 20.2% of revenue in the same period in the prior year.
•Profit for the period was £24.4 million in Q3 FY2023, resulting in a diluted earnings per share ("EPS") of £0.42, compared to profit of £20.1 million and diluted EPS of £0.35 in the same period in the prior year.
•Adjusted profit for the period (a non-IFRS measure)* was £34.1 million in Q3 FY2023, resulting in adjusted diluted EPS (a non-IFRS measure)* of £0.59, compared to adjusted profit for the period of £27.9 million and adjusted diluted EPS of £0.48 in the same period in the prior year.
CASH FLOW:
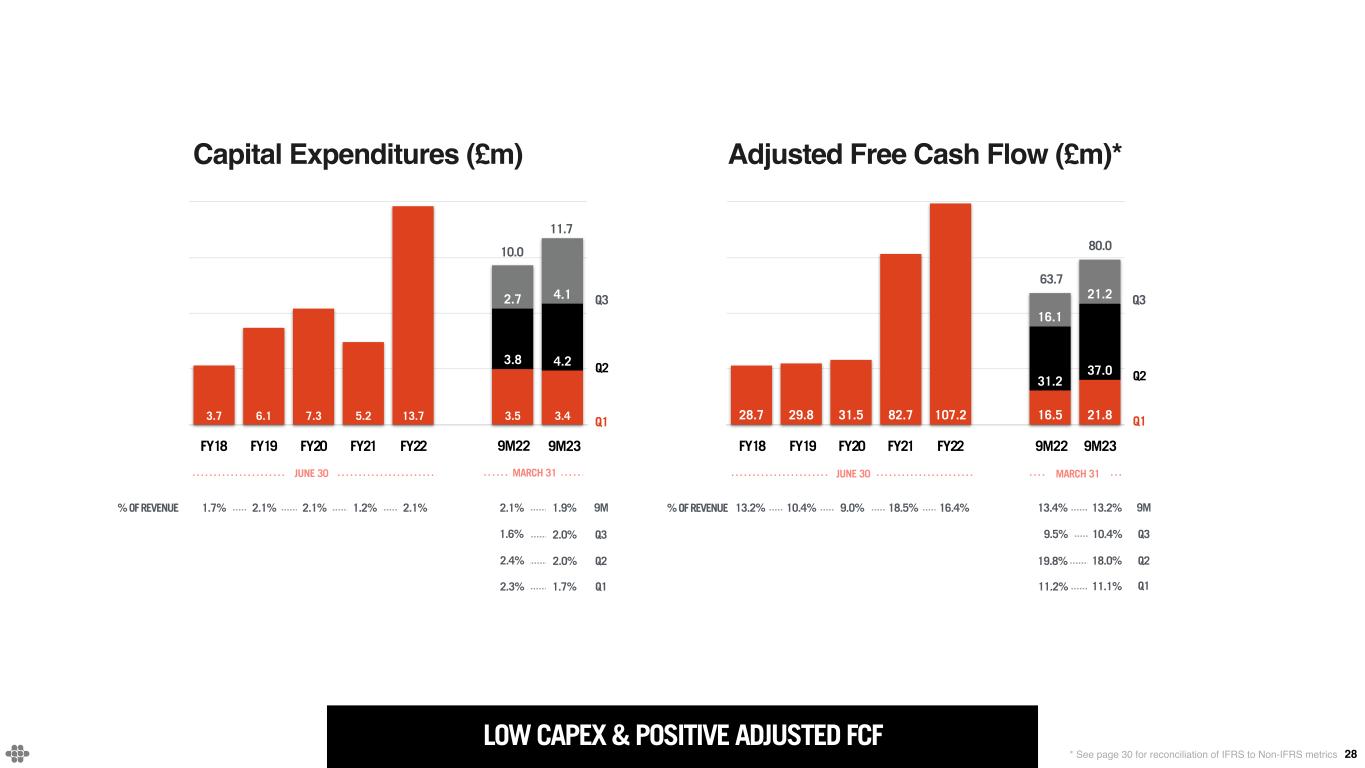
•Net cash from operating activities was £25.1 million in Q3 FY2023, compared to £18.7 million in the same period in the prior year.
•Adjusted free cash flow (a non-IFRS measure)* was £21.2 million in Q3 FY2023, compared to £16.1 million in the same period in the prior year.
•At March 31, 2023, Endava had cash and cash equivalents of £199.2 million, compared to £162.8 million at June 30, 2022.
* Definitions of the non-IFRS measures used by the Company and a reconciliation of such measures to the related IFRS financial measure can be found under the sections below titled “Non-IFRS Financial Information” and “Reconciliation of IFRS Financial Measures to Non-IFRS Financial Measures.”
OTHER METRICS FOR THE QUARTER ENDED MARCH 31, 2023:
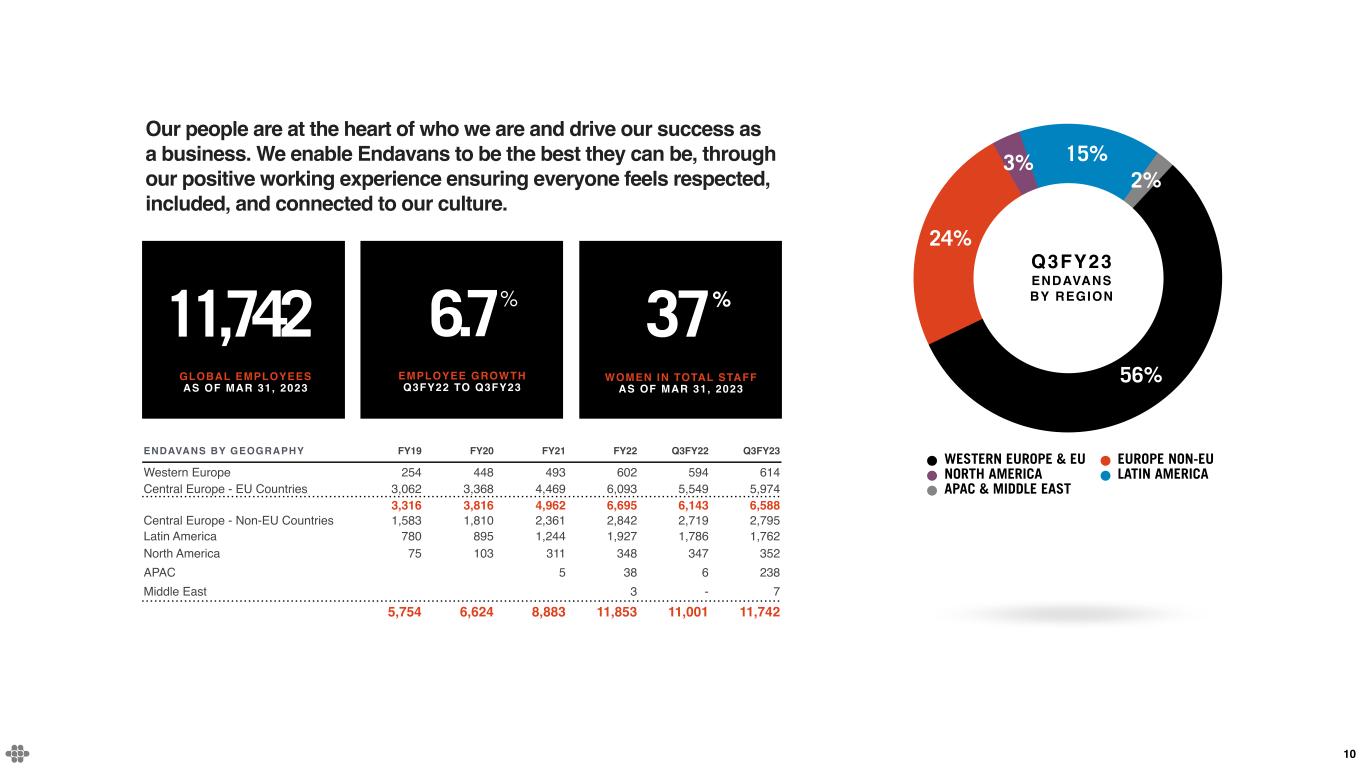
•Headcount totaled 11,742 at March 31, 2023, with 10,818 average operational employees in Q3 FY2023, compared to a headcount of 11,001 at March 31, 2022 and 9,851 average operational employees in the same quarter of the prior year.
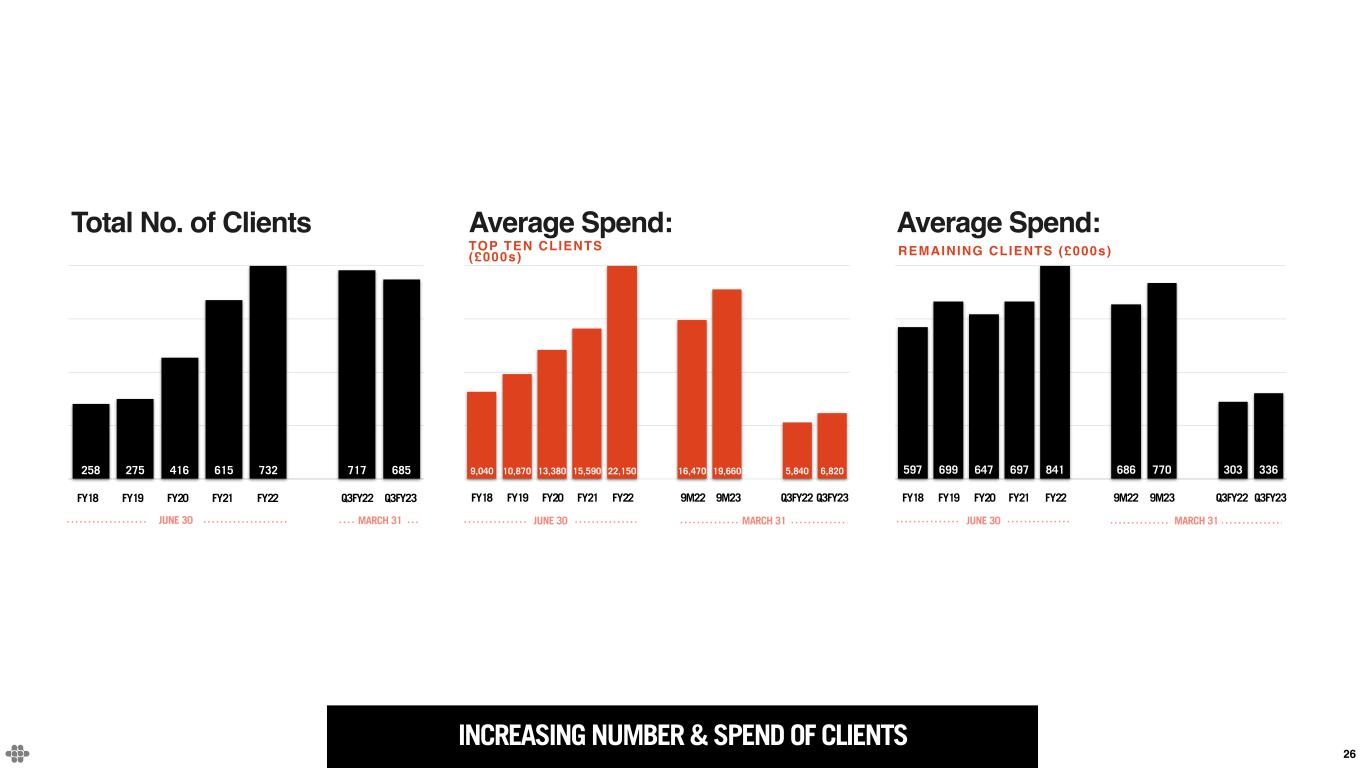
•Number of clients with over £1 million in revenue on a rolling twelve-month basis was 155 at March 31, 2023, compared to 118 clients at March 31, 2022.
•Top 10 clients accounted for 33% of revenue in Q3 FY2023, compared to 35% in the same period in the prior year.
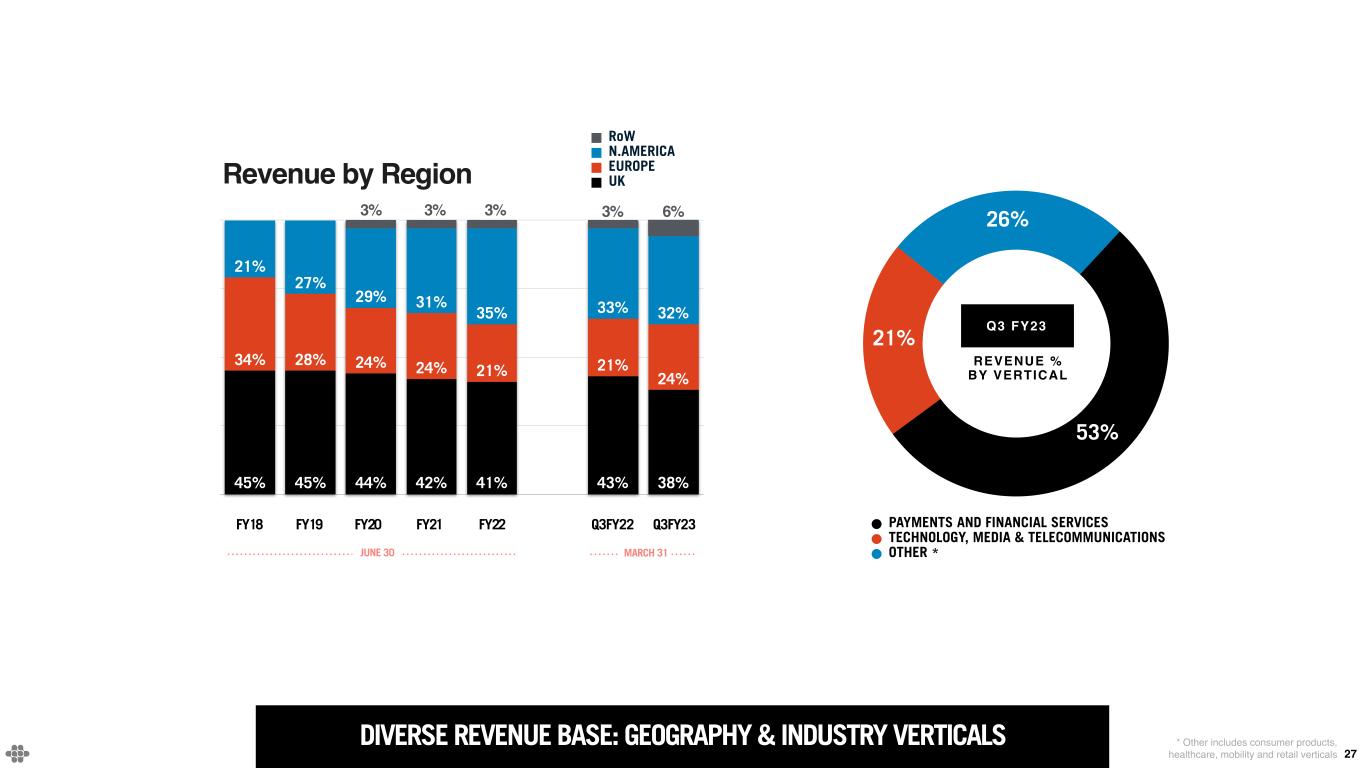
•By geographic region, 32% of revenue was generated in North America, 24% was generated in Europe, 38% was generated in the United Kingdom and 6% was generated in the rest of the world in Q3 FY2023. This compares to 33% in North America, 21% in Europe, 43% in the United Kingdom and 3% in the rest of the world in the same period in the prior year.
•By industry vertical, 53% of revenue was generated from Payments and Financial Services, 21% from technology, media and telecommunications (TMT) and 26% from Other in Q3 FY2023. This compares to 51% from Payments and Financial Services, 25% from TMT and 24% from Other in the same period in the prior year.
OUTLOOK:
Fourth Quarter Fiscal Year 2023:
Endava expects revenues will be in the range of £187.0 million to £189.0 million, representing constant currency revenue growth between 3.0% and 4.0%. Endava expects adjusted diluted EPS to be in the range of £0.44 to £0.45 per share.
Full Fiscal Year 2023:
Endava expects revenues will be in the range of £792.0 million to £794.0 million, representing constant currency growth between 16.0% and 16.5%. Endava expects adjusted diluted EPS to be in the range of £2.15 to £2.16 per share.
This above guidance for Q4 Fiscal Year 2023 and the Full Fiscal Year 2023 assumes the exchange rates on April 30, 2023 (when the exchange rate was 1 British Pound to 1.26 US Dollar and 1.13 Euro).
Endava is not able, at this time, to provide an outlook for IFRS diluted EPS for Q4 FY2023 or FY2023 because of the unreasonable effort of estimating on a forward-looking basis certain items that are excluded from adjusted diluted EPS, including, for example, share-based compensation expense, amortisation of acquired intangible assets and foreign currency exchange (gains)/losses, the effect of which may be significant. Endava is also not able, at this time, to reconcile to an outlook for revenue growth not at constant currency because of the unreasonable effort of estimating foreign currency exchange (gains)/losses, the effect of which may be significant, on a forward-looking basis.
The guidance provided above is forward-looking in nature. Actual results may differ materially. See the cautionary note regarding “Forward-Looking Statements” below.
RECENT BUSINESS HIGHLIGHTS:
On May 2, 2023, Endava announced the appointment of Patrick Butcher to its Board of Directors.
Mr. Butcher most recently served as Group Chief Financial Officer of the Headlam Group plc from April 2022 until March 2023. From January 2019 to November 2020, he served as Group Chief Financial Officer at Capita plc. Prior to that, Mr. Butcher served as Chief Financial Officer at various companies including The Go-Ahead Group plc, Network Rail Limited, English and Scottish Railway and Mapeley Limited. Mr. Butcher received his B. Compt. (Hons) in Accounting and Finance from the University of South Africa and is a qualified Chartered Accountant (South Africa).
On May 2, 2023, Endava also announced a number of changes to the executive team, effective July 1, 2023.
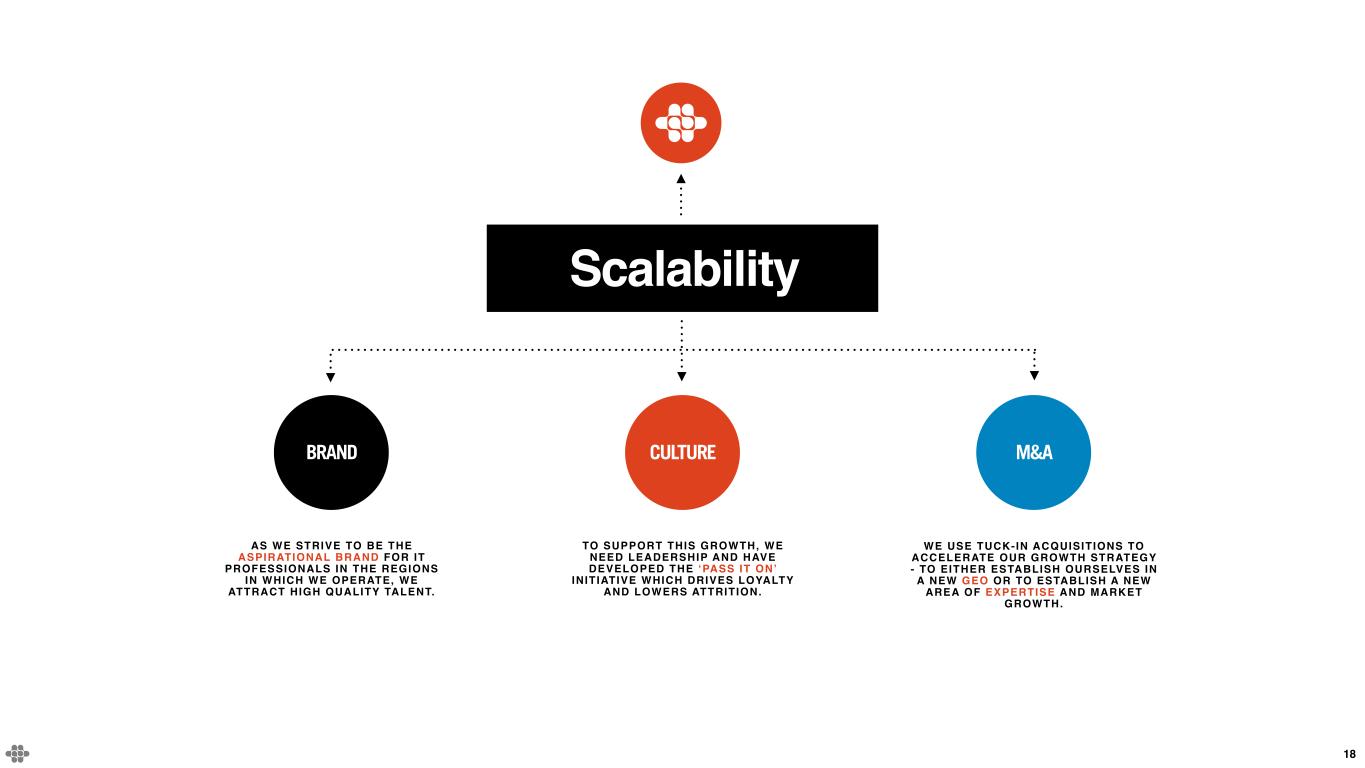
Rob Machin, the Company's current Chief Operating Officer, will be transitioning off the Endava executive team to focus on Endava's internal Business Transformation programme, designed to enable the company to scale through 2030. Over the past few years, Endava has been shifting to an industry vertical go to market, which is a significant point of differentiation in client engagements. To further accelerate this shift, Julian Bull, the Company's current Chief Commercial Officer, will be taking over the role of Chief Operating Officer, and will be responsible for both Sales and Client Delivery to Endava's industry verticals.
In addition, Matt Cloke will be promoted to the position of Chief Technology Officer, and both he and David Churchill, Endava's Chief People Officer, who currently reports to Rob Machin, will be joining Endava’s executive team, reporting directly to Endava's Chief Executive Officer.
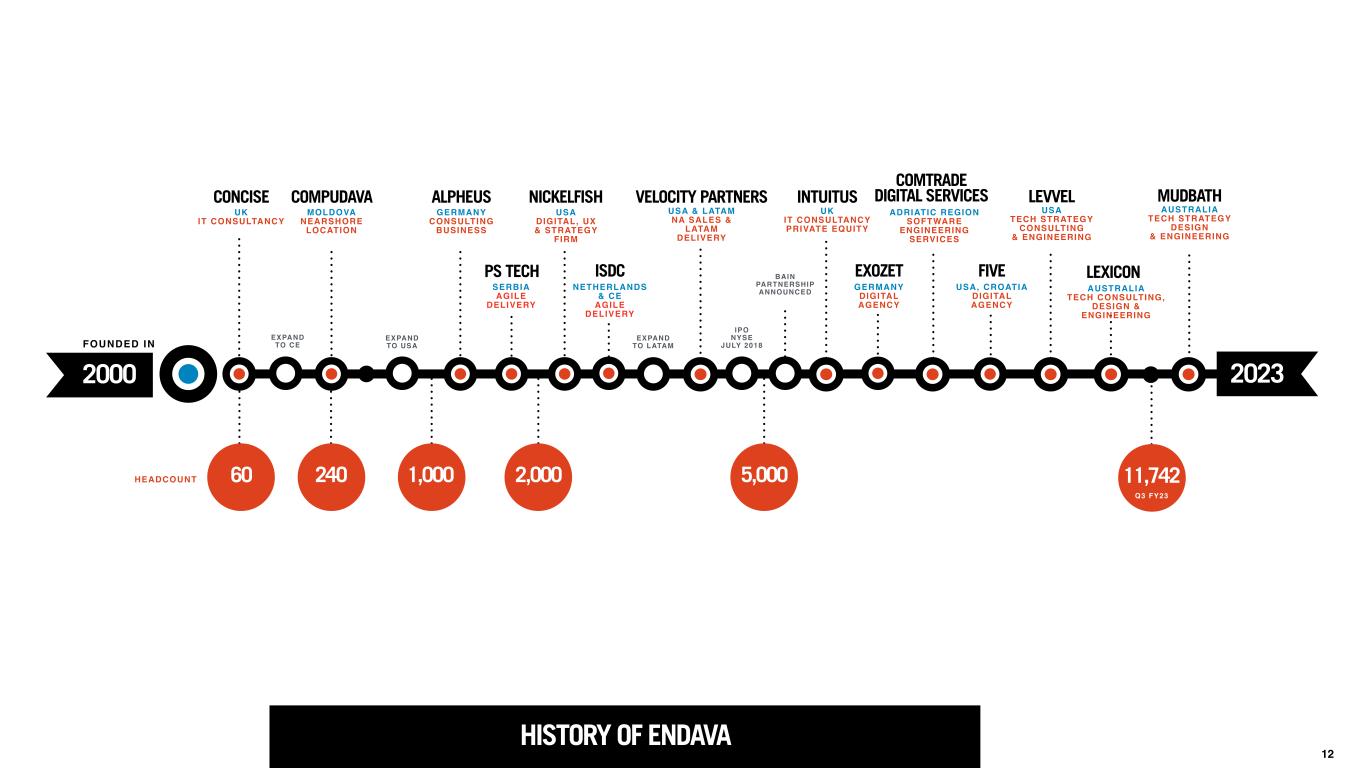
On May 10, 2023, Endava announced the acquisition of Mudbath & Co. Pty Ltd, headquartered in Newcastle, Australia (“Mudbath”).
Mudbath is an Australian-based technology firm specialising in strategy, design and engineering services. Mudbath partners with businesses to build new digital solutions, enhance user experiences and accelerate digital transformation programs across enterprise systems, web and mobile products using their proven agile delivery methodology. Mudbath’s clients span broad industry verticals, including retail, mining (and adjacent activities including rail and tools), health, insurance, banking and travel. Mudbath’s employees are based primarily in Newcastle, Sydney and Melbourne, Australia.
CONFERENCE CALL DETAILS:
The Company will host a conference call at 8:00 am ET today, May 23, 2023, to review its Q3 FY2023 results. To participate in Endava’s Q3 FY2023 earnings conference call, please dial in at least five minutes prior to the scheduled start time (866) 652-5200 or (412) 317-6060 for international participants, Conference ID: Endava Call.
Investors may listen to the call on Endava’s Investor Relations website at http://investors.Endava.com. The webcast will be recorded and available for replay until Thursday, June 22, 2023.
ABOUT ENDAVA PLC:
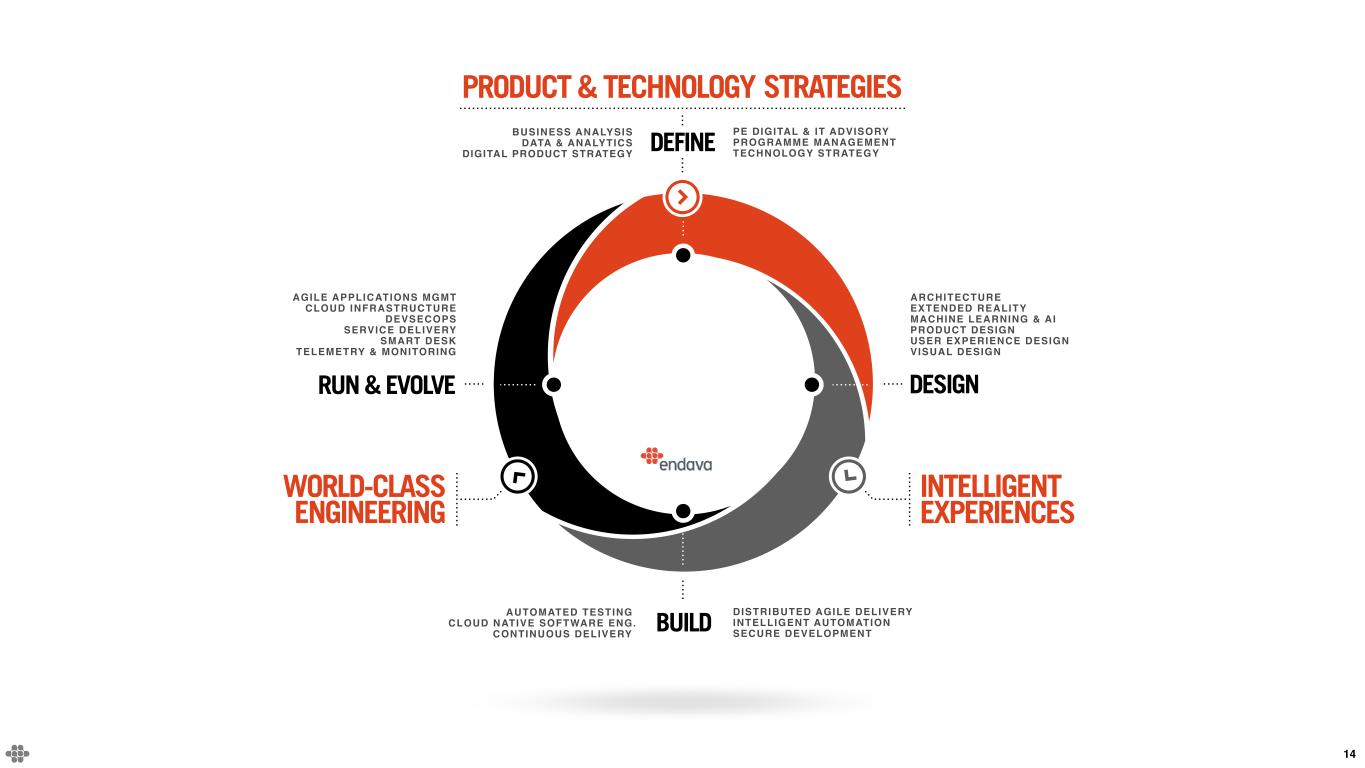
Endava is reimagining the relationship between people and technology. By leveraging next-generation technologies, its agile, multi-disciplinary teams provide a combination of product & technology strategies, intelligent experiences, and world class engineering to help clients become digital, experience-driven businesses by assisting them in their journey from idea generation to development and deployment of products, platforms and solutions. Endava collaborates with its clients, seamlessly integrating with their teams, catalysing ideation and delivering robust solutions.
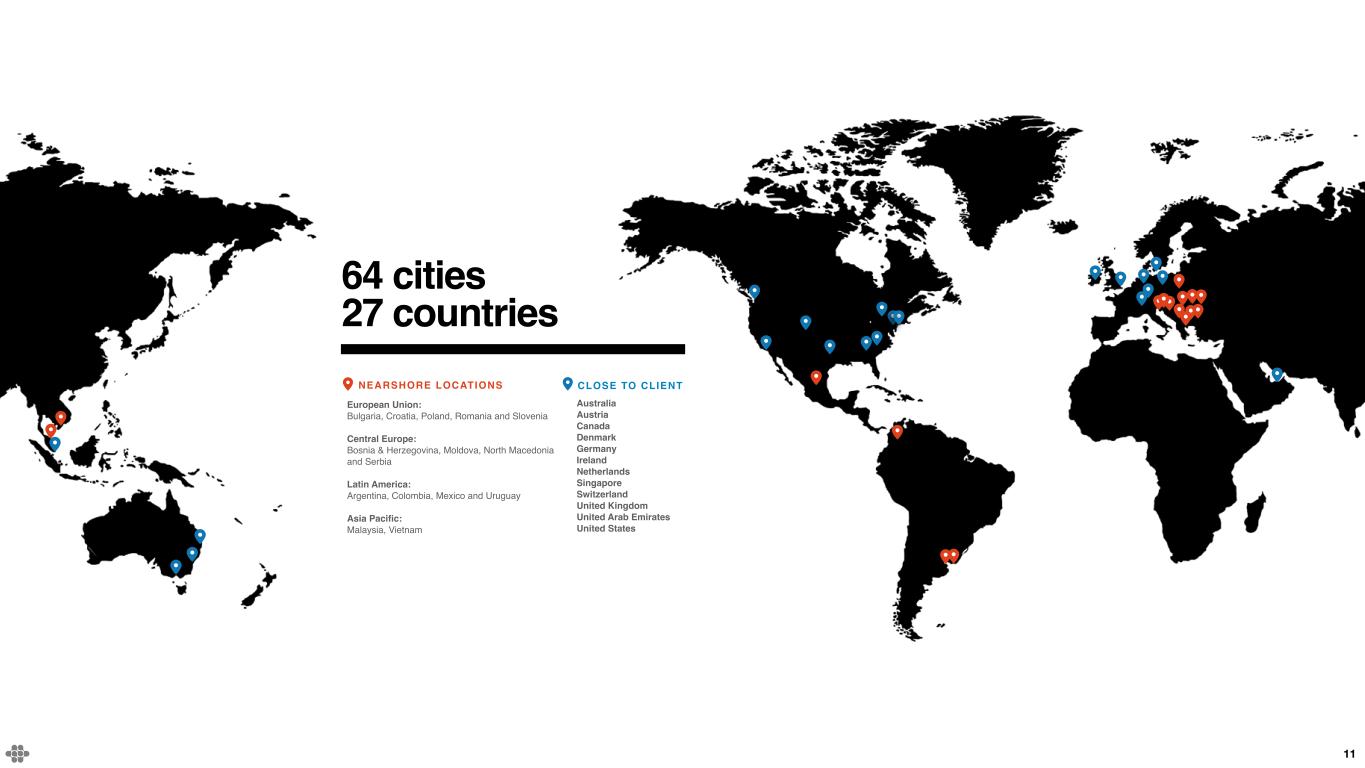
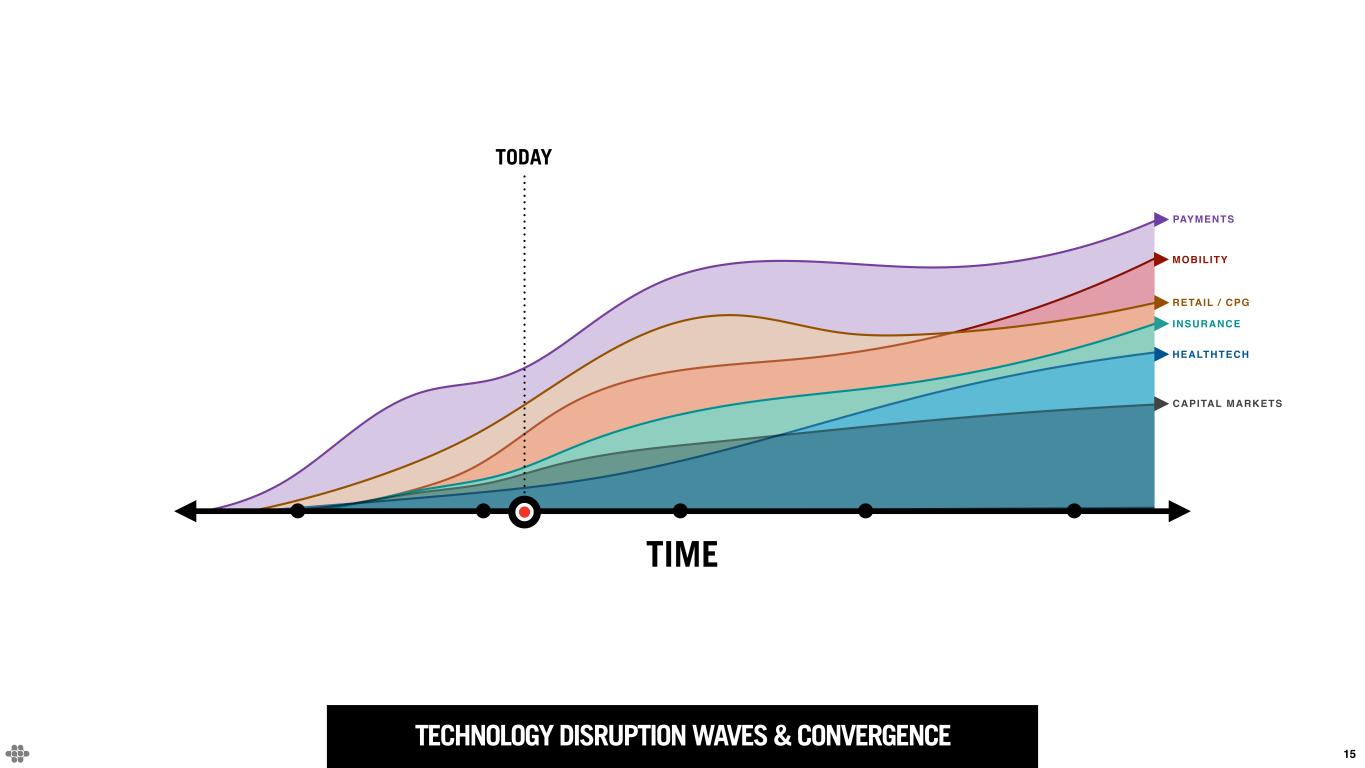
Endava services clients in Payments and Financial Services, TMT, Consumer Products, Retail, Mobility and Healthcare. As of March 31, 2023, 11,742 Endavans served clients from locations in Asia-Pacific, Middle East, North America and Western Europe and delivery locations in Argentina, Bosnia & Herzegovina, Bulgaria, Colombia, Croatia, Malaysia, Mexico, Moldova, North Macedonia, Poland, Romania, Serbia, Slovenia, Uruguay and Vietnam.
NON-IFRS FINANCIAL INFORMATION:
To supplement Endava’s Condensed Consolidated Statements of Comprehensive Income, Condensed Consolidated Balance Sheets and Condensed Consolidated Statements of Cash Flows presented in accordance with IFRS, the Company uses non-IFRS measures of certain components of financial performance. These measures include: revenue growth rate at constant currency, adjusted profit before tax, adjusted profit for the period, adjusted diluted EPS and adjusted free cash flow.
Revenue growth rate at constant currency is calculated by translating revenue from entities reporting in foreign currencies into British Pounds using the comparable foreign currency exchange rates from the prior period. For example, the average currency rates in effect for the fiscal quarter ended March 31, 2022 were used to convert revenue for the fiscal quarter ended March 31, 2023 and the revenue for the comparable prior period.
Adjusted profit before tax ("Adjusted PBT") is defined as the Company’s profit before tax adjusted to exclude the impact of share-based compensation expense, amortisation of acquired intangible assets, realised and unrealised foreign currency exchange (gains)/losses, restructuring costs and fair value movement of contingent consideration, all of which are non-cash items except for the restructuring costs and realised foreign currency exchange (gains)/losses. Adjusted PBT margin is Adjusted PBT as a percentage of total revenue.
Adjusted profit for the period is defined as Adjusted PBT together with the tax impact of these adjustments.
Adjusted diluted EPS is defined as Adjusted profit for the period, divided by weighted average number of shares outstanding - diluted.
Adjusted free cash flow is the Company’s net cash from operating activities, plus grants received, less net purchases of non-current assets (tangible and intangible).
Management believes these measures help illustrate underlying trends in the Company's business and uses the measures to establish budgets and operational goals, communicated internally and externally, for managing the Company's business and evaluating its performance. Management also believes the presentation of its non-IFRS financial measures enhances an investor’s overall understanding of the Company’s historical financial performance.
The presentation of the Company’s non-IFRS financial measures is not meant to be considered in isolation or as a substitute for the Company’s financial results prepared in accordance with IFRS, and its non-IFRS measures may be different from non-IFRS measures used by other companies. Investors should review the reconciliation of the Company’s non-IFRS financial measures to the comparable IFRS financial measures included below, and not rely on any single financial measure to evaluate the Company’s business.
FORWARD-LOOKING STATEMENTS:
This press release includes forward-looking statements within the meaning of the Private Securities Litigation Reform Act of 1995. These forward-looking statements may be identified by the use of terms and phrases such as “believe,” “expect,” "outlook," “may,” “will,” and other similar terms and phrases. Such forward-looking statements include, but are not limited to, the statements regarding Endava’s projected financial performance for the fourth fiscal quarter of fiscal year 2023 and the full fiscal year 2023; the perceived impact and effect of macroeconomic conditions on Endava and its customers including the March 2023 banking collapse; expectations of increased demand for Endava offerings in upcoming periods and resulting impact on revenue; the impact that Endava’s management changes will have on the business and its growth; and Endava’s ability to achieve its anticipated growth. Forward-looking statements involve known and unknown risks, uncertainties and other factors that could cause actual results to differ materially from the results anticipated by these forward-looking statements, including, but not limited to: Endava’s business, results of operations and financial condition may be negatively impacted by the Russia-Ukraine armed conflict or if general economic conditions in Europe, the United States or the global economy continue to worsen, including increased inflation and recent and potential future bank failures; Endava’s ability to retain existing clients and attract new clients, including its ability to increase revenue from existing clients and diversify its revenue concentration; Endava’s ability to attract and retain highly-skilled IT professionals at cost-effective rates; Endava's ability to penetrate new industry verticals and geographies and grow its revenue in current industry verticals and geographies; Endava’s ability to maintain favorable pricing and utilization rates; Endava’s ability to successfully identify acquisition targets, consummate acquisitions and successfully integrate acquired businesses and personnel; the effects of increased competition as well as innovations by new and existing competitors in its market; Endava’s ability to adapt to technological change and innovate solutions for its clients; Endava’s ability to collect on billed and unbilled receivables
from clients; Endava’s ability to effectively manage its international operations, including Endava's exposure to foreign currency exchange rate fluctuations; Endava’s ability to maintain an effective system of disclosure controls and internal control over financial reporting; and Endava’s future financial performance, including trends in revenue, cost of sales, gross profit, selling, general and administrative expenses, finance income and expense and taxes, as well as other risks and uncertainties discussed in the “Risk Factors” section of Endava's Annual Report filed with the SEC on October 31, 2022. In addition, the forward-looking statements included in this press release represent Endava’s views and expectations as of the date hereof and are based on information currently available to Endava. Endava anticipates that subsequent events and developments may cause its views to change. Endava specifically disclaims any obligation to update the forward-looking statements in this press release except as required by law. These forward-looking statements should not be relied upon as representing Endava’s views as of any date subsequent to the date hereof.
INVESTOR CONTACT:
Endava plc
Laurence Madsen, Investor Relations Manager
Investors@endava.com
CONDENSED CONSOLIDATED STATEMENTS OF COMPREHENSIVE INCOME
|
|
|
|
|
|
|
|
|
|
|
|
|
|
|
|
Nine Months Ended March 31 |
Three Months Ended March 31 |
|
2023 |
2022 |
2023 |
2022 |
|
£’000 |
£’000 |
£’000 |
£’000 |
| REVENUE |
604,942 |
474,353 |
203,532 |
169,220 |
| Cost of sales |
|
|
|
|
| Direct cost of sales |
(381,711) |
(297,384) |
(132,458) |
(108,092) |
| Allocated cost of sales |
(18,676) |
(16,797) |
(6,433) |
(5,707) |
| Total cost of sales |
(400,387) |
(314,181) |
(138,891) |
(113,799) |
| GROSS PROFIT |
204,555 |
160,172 |
64,641 |
55,421 |
| Selling, general and administrative expenses |
(114,158) |
(89,613) |
(37,916) |
(29,989) |
| Net impairment (losses) / gains on financial assets |
(265) |
|
(1,826) |
|
3,379 |
(14) |
| OPERATING PROFIT |
90,132 |
68,733 |
30,104 |
25,418 |
| Net Finance (expense) / income |
(905) |
1,155 |
284 |
472 |
|
|
|
|
|
| PROFIT BEFORE TAX |
89,227 |
69,888 |
30,388 |
25,890 |
| Tax on profit on ordinary activities |
(18,122) |
(13,834) |
(6,030) |
(5,787) |
| PROFIT FOR THE PERIOD |
71,105 |
56,054 |
24,358 |
20,103 |
| OTHER COMPREHENSIVE INCOME |
|
|
|
|
| Items that may be reclassified subsequently to profit or loss: |
|
|
|
|
| Exchange differences on translating foreign operations |
(3,001) |
1,187 |
(3,824) |
2,715 |
| TOTAL COMPREHENSIVE INCOME FOR THE PERIOD ATTRIBUTABLE TO OWNERS OF THE PARENT |
68,104 |
57,241 |
20,534 |
22,818 |
|
|
|
|
|
| EARNINGS PER SHARE (EPS): |
|
|
|
|
| Weighted average number of shares outstanding - Basic |
57,176,428 |
|
56,135,980 |
|
57,603,730 |
|
56,585,768 |
|
| Weighted average number of shares outstanding - Diluted |
58,070,352 |
|
57,945,549 |
|
58,210,601 |
|
57,999,337 |
|
| Basic EPS (£) |
1.24 |
|
1.00 |
|
0.42 |
|
0.36 |
|
| Diluted EPS (£) |
1.22 |
|
0.97 |
|
0.42 |
|
0.35 |
|
CONDENSED CONSOLIDATED BALANCE SHEETS
|
|
|
|
|
|
|
|
|
|
|
|
|
March 31, 2023 |
June 30, 2022 |
March 31, 2022(1) |
|
£’000 |
£’000 |
£’000 |
|
|
|
|
| ASSETS - NON-CURRENT |
|
|
|
| Goodwill |
186,946 |
|
145,916 |
|
143,346 |
|
| Intangible assets |
50,924 |
|
56,189 |
|
53,585 |
|
| Property, plant and equipment |
26,459 |
|
21,260 |
|
18,677 |
|
| Lease right-of-use assets |
58,727 |
|
50,818 |
|
50,780 |
|
| Deferred tax assets |
13,515 |
|
17,218 |
|
19,342 |
|
| Financial assets |
1,992 |
|
2,276 |
|
189 |
|
| TOTAL |
338,563 |
|
293,677 |
|
285,919 |
|
| ASSETS - CURRENT |
|
|
|
|
|
|
|
| Trade and other receivables |
183,533 |
|
162,671 |
|
159,197 |
|
| Corporation tax receivable |
678 |
|
2,309 |
|
1,636 |
|
| Financial assets |
136 |
|
392 |
|
318 |
|
| Cash and cash equivalents |
199,200 |
|
162,806 |
|
120,407 |
|
| TOTAL |
383,547 |
|
328,178 |
|
281,558 |
|
| TOTAL ASSETS |
722,110 |
|
621,855 |
|
567,477 |
|
| LIABILITIES - CURRENT |
|
|
|
| Lease liabilities |
13,859 |
|
11,898 |
|
11,779 |
|
| Trade and other payables |
92,649 |
|
98,252 |
|
88,762 |
|
| Corporation tax payable |
5,569 |
|
3,477 |
|
4,333 |
|
| Contingent consideration |
3,511 |
|
4,183 |
|
4,014 |
|
| Deferred consideration |
6,538 |
|
10,604 |
|
7,036 |
|
|
|
|
|
| TOTAL |
122,126 |
|
128,414 |
|
115,924 |
|
| LIABILITIES - NON CURRENT |
|
|
|
| Lease liabilities |
50,193 |
|
43,999 |
|
44,036 |
|
| Contingent consideration |
— |
|
4,331 |
|
3,995 |
|
| Deferred tax liabilities |
10,152 |
|
10,826 |
|
8,551 |
|
| Deferred consideration |
1,363 |
|
1,062 |
|
3,992 |
|
| Other liabilities |
525 |
|
500 |
|
191 |
|
| TOTAL |
62,233 |
|
60,718 |
|
60,765 |
|
| EQUITY |
|
|
|
| Share capital |
1,153 |
|
1,135 |
|
1,134 |
|
| Share premium |
13,546 |
|
9,152 |
|
7,605 |
|
| Merger relief reserve |
39,976 |
|
30,003 |
|
30,003 |
|
| Retained earnings |
491,739 |
|
398,102 |
|
363,108 |
|
| Other reserves |
(8,515) |
|
(5,514) |
|
(10,907) |
|
| Investment in own shares |
(148) |
|
(155) |
|
(155) |
|
| TOTAL |
537,751 |
|
432,723 |
|
390,788 |
|
| TOTAL LIABILITIES AND EQUITY |
722,110 |
|
621,855 |
|
567,477 |
|
CONDENSED CONSOLIDATED STATEMENTS OF CASH FLOWS
|
|
|
|
|
|
|
|
|
|
|
|
|
|
|
|
Nine Months Ended March 31 |
Three Months Ended March 31 |
|
2023 |
2022 |
2023 |
2022 |
|
£’000 |
£’000 |
£’000 |
£’000 |
| OPERATING ACTIVITIES |
|
|
|
|
| Profit for the period |
71,105 |
|
56,054 |
|
24,358 |
|
20,103 |
|
| Income tax charge |
18,122 |
|
13,834 |
|
6,030 |
|
5,787 |
|
| Non-cash adjustments |
40,216 |
|
46,228 |
|
15,242 |
|
13,258 |
|
| Tax paid |
(16,189) |
|
(9,187) |
|
(6,142) |
|
(3,486) |
|
|
|
|
|
|
| Net changes in working capital |
(22,063) |
|
(33,322) |
|
(14,428) |
|
(16,926) |
|
| Net cash from operating activities |
91,191 |
|
73,607 |
|
25,060 |
|
18,736 |
|
| |
|
|
|
|
| INVESTING ACTIVITIES |
|
|
|
|
| Purchase of non-current assets (tangibles and intangibles) |
(11,804) |
|
(10,195) |
|
(4,213) |
|
(2,797) |
|
| Proceeds from disposal of non-current assets |
148 |
|
241 |
|
132 |
|
70 |
|
| Payment for acquisition of subsidiary, net of cash acquired |
(35,773) |
|
(10,135) |
|
(3,376) |
|
(9,524) |
|
|
|
|
|
|
| Interest received |
1,851 |
|
65 |
|
1,054 |
|
45 |
|
| Net cash used in investing activities |
(45,578) |
|
(20,024) |
|
(6,403) |
|
(12,206) |
|
|
|
|
|
|
| FINANCING ACTIVITIES |
|
|
|
|
| Proceeds from sublease |
325 |
|
418 |
|
88 |
|
141 |
|
|
|
|
|
|
|
|
|
|
|
| Repayment of lease liabilities |
(9,960) |
|
(10,468) |
|
(3,469) |
|
(3,345) |
|
| Interest and debt financing costs paid |
(3,532) |
|
(695) |
|
(3,109) |
|
(220) |
|
| Grant received |
472 |
|
90 |
|
252 |
|
47 |
|
|
|
|
|
|
|
|
|
|
|
| Issue of shares |
4,398 |
|
7,366 |
|
2,132 |
|
3,067 |
|
| Net cash used in financing activities |
(8,297) |
|
(3,289) |
|
(4,106) |
|
(310) |
|
| Net change in cash and cash equivalents |
37,316 |
|
50,294 |
|
14,551 |
|
6,220 |
|
|
|
|
|
|
| Cash and cash equivalents at the beginning of the period |
162,806 |
|
69,884 |
|
185,323 |
|
114,176 |
|
| Exchange differences on cash and cash equivalents |
(922) |
|
229 |
|
(674) |
|
11 |
|
| Cash and cash equivalents at the end of the period |
199,200 |
|
120,407 |
|
199,200 |
|
120,407 |
|
RECONCILIATION OF IFRS FINANCIAL MEASURES TO NON-IFRS FINANCIAL MEASURES
RECONCILIATION OF REVENUE GROWTH RATE AS REPORTED UNDER IFRS TO REVENUE GROWTH RATE AT CONSTANT CURRENCY:
|
|
|
|
|
|
|
|
|
|
|
|
|
|
|
|
Nine Months Ended March 31 |
Three Months Ended March 31 |
|
2023 |
2022 |
2023 |
2022 |
| REVENUE GROWTH RATE AS REPORTED UNDER IFRS |
27.5 |
% |
51.7 |
% |
20.3 |
% |
50.7 |
% |
| Foreign exchange rates impact |
(6.5 |
%) |
3.1 |
% |
(5.7 |
%) |
0.2 |
% |
| REVENUE GROWTH RATE AT CONSTANT CURRENCY |
21.0 |
% |
54.8 |
% |
14.6 |
% |
50.9 |
% |
|
|
|
|
|
|
|
|
|
|
RECONCILIATION OF ADJUSTED PROFIT BEFORE TAX AND ADJUSTED PROFIT FOR THE PERIOD:
|
|
|
|
|
|
|
|
|
|
|
|
|
|
|
|
Nine Months Ended March 31 |
Three Months Ended March 31 |
|
2023 |
2022 |
2023 |
2022 |
|
£’000 |
£’000 |
£’000 |
£’000 |
|
|
|
|
|
| PROFIT BEFORE TAX |
89,227 |
|
69,888 |
|
30,388 |
|
25,890 |
|
| Adjustments: |
|
|
|
|
| Share-based compensation expense |
24,135 |
|
27,542 |
|
8,226 |
|
6,626 |
|
|
|
|
|
|
| Amortisation of acquired intangible assets |
9,427 |
|
7,746 |
|
3,220 |
|
2,805 |
|
| Foreign currency exchange losses / (gains), net |
10,030 |
|
(3,159) |
|
2,497 |
|
(1,099) |
|
|
|
|
|
|
|
|
|
|
|
|
|
|
|
|
|
|
|
|
|
|
|
|
|
|
Restructuring costs (2) |
3,683 |
|
— |
|
2,570 |
|
— |
|
| Fair value movement of contingent consideration |
(10,650) |
|
— |
|
(3,507) |
|
— |
|
| Total adjustments |
36,625 |
|
32,129 |
|
13,006 |
|
8,332 |
|
| ADJUSTED PROFIT BEFORE TAX |
125,852 |
|
102,017 |
|
43,394 |
|
34,222 |
|
|
|
|
|
|
| PROFIT FOR THE PERIOD |
71,105 |
|
56,054 |
|
24,358 |
|
20,103 |
|
| Adjustments: |
|
|
|
|
| Adjustments to profit before tax |
36,625 |
|
32,129 |
|
13,006 |
|
8,332 |
|
| Tax impact of adjustments |
(8,299) |
|
(5,485) |
|
(3,247) |
|
(508) |
|
| ADJUSTED PROFIT FOR THE PERIOD |
99,431 |
|
82,698 |
|
34,117 |
|
27,927 |
|
|
|
|
|
|
| Diluted EPS (£) |
1.22 |
0.97 |
0.42 |
0.35 |
| Adjusted diluted EPS (£) |
1.71 |
1.43 |
0.59 |
0.48 |
RECONCILIATION OF NET CASH FROM OPERATING ACTIVITIES TO ADJUSTED FREE CASH FLOW
|
|
|
|
|
|
|
|
|
|
|
|
|
|
|
|
Nine Months Ended March 31 |
Three Months Ended March 31 |
|
2023 |
2022 |
2023 |
2022 |
|
£’000 |
£’000 |
£’000 |
£’000 |
|
|
|
|
|
| Net cash from operating activities |
91,191 |
|
73,607 |
|
25,060 |
|
18,736 |
|
| Adjustments: |
|
|
|
|
| Grant received |
472 |
|
90 |
|
252 |
|
47 |
|
| Net purchase of non-current assets (tangibles and intangibles) |
(11,656) |
|
(9,954) |
|
(4,081) |
|
(2,727) |
|
| Adjusted Free cash flow |
80,007 |
|
63,743 |
|
21,231 |
|
16,056 |
|
SUPPLEMENTARY INFORMATION
SHARE-BASED COMPENSATION EXPENSE
|
|
|
|
|
|
|
|
|
|
|
|
|
|
|
|
Nine Months Ended March 31 |
Three Months Ended March 31 |
|
2023 |
2022 |
2023 |
2022 |
|
£’000 |
£’000 |
£’000 |
£’000 |
|
|
|
|
|
| Direct cost of sales |
15,996 |
|
17,020 |
|
5,699 |
|
4,345 |
|
| Selling, general and administrative expenses |
8,139 |
|
10,522 |
|
2,527 |
|
2,281 |
|
| Total |
24,135 |
|
27,542 |
|
8,226 |
|
6,626 |
|
DEPRECIATION AND AMORTISATION
|
|
|
|
|
|
|
|
|
|
|
|
|
|
|
|
Nine Months Ended March 31 |
Three Months Ended March 31 |
|
2023 |
2022 |
2023 |
2022 |
|
£’000 |
£’000 |
£’000 |
£’000 |
|
|
|
|
|
| Direct cost of sales |
13,242 |
|
12,171 |
|
4,616 |
|
4,147 |
|
| Selling, general and administrative expenses |
11,406 |
|
9,554 |
|
3,945 |
|
3,392 |
|
| Total |
24,648 |
|
21,725 |
|
8,561 |
|
7,539 |
|
EMPLOYEES, TOP 10 CUSTOMERS AND REVENUE SPLIT
|
|
|
|
|
|
|
|
|
|
|
|
|
|
|
| Six Months Ended December 31 |
Nine Months Ended March 31 |
Three Months Ended March 31 |
|
2023 |
2022 |
2023 |
2022 |
|
|
|
|
|
| Closing number of total employees (including directors) |
11,742 |
11,001 |
11,742 |
11,001 |
| Average operational employees |
10,960 |
9,167 |
10,818 |
9,851 |
|
|
|
|
|
| Top 10 customers % |
33% |
35% |
33% |
35% |
Number of clients with > £1m of revenue
(rolling 12 months) |
155 |
118 |
155 |
118 |
|
|
|
|
|
| Geographic split of revenue % |
|
|
|
|
| North America |
33% |
35% |
32% |
33% |
| Europe |
23% |
21% |
24% |
21% |
| UK |
39% |
41% |
38% |
43% |
| Rest of World (RoW) |
5% |
3% |
6% |
3% |
| Industry vertical split of revenue % |
|
|
|
|
| Payments and Financial Services |
52% |
51% |
53% |
51% |
| TMT |
22% |
25% |
21% |
25% |
| Other |
26% |
24% |
26% |
24% |
FOOTNOTES
(1) The Condensed Consolidated Balance Sheet as of March 31, 2022 has been restated to include the effects of IFRIC agenda decision on cloud configuration and customisation costs and to include the effect of revisions arising from provisional to final acquisition accounting for Five and Levvel (refer to note 3C from Endava's Annual Report on Form 20-F for the fiscal year ended June 30, 2022 for further details).
(2) Management has decided to exclude the impact of restructuring costs from profit before tax, costs which are one-off in nature. Restructuring costs of £3.7 million for the nine months ended March 31, 2023 include £1.1 million in costs related to the three months ended December 31, 2022.


