UNITED STATES
SECURITIES AND EXCHANGE COMMISSION
Washington, D.C. 20549
FORM 10-K
ANNUAL REPORT PURSUANT TO SECTION 13 OR 15(D)
OF THE SECURITIES EXCHANGE ACT OF 1934
For the fiscal year ended: December 31, 2024
000-27205
(Commission File No.)
Peoples Bancorp of North Carolina, Inc. |
(Exact Name of Registrant as Specified in Its Charter) |
North Carolina |
|
56-2132396 |
(State or Other Jurisdiction of Incorporation) |
|
(IRS Employer Identification No.) |
|
|
|
518 West C Street, Newton, North Carolina |
|
28658 |
(Address of Principal Executive Offices) |
|
(Zip Code) |
(828) 464-5620 | ||||||||
(Registrant’s Telephone Number, Including Area Code) | ||||||||
| ||||||||
Securities Registered Pursuant to Section 12(b) of the Act: None | ||||||||
| ||||||||
Securities Registered Pursuant to Section 12(g) of the Act: | ||||||||
| ||||||||
Common Stock, no par value | ||||||||
(title of class) |
Indicate by check mark if the registrant is a well-known seasoned issuer, as defined in Rule 405 of the Securities Act. Yes ☐ No ☒
Indicate by check mark if the registrant is not required to file reports pursuant to Section 13 or Section 15(d) of the Act. Yes ☐ No ☒
Indicate by check mark whether the registrant (1) has filed all reports required to be filed by Section 13 or 15(d) of the Securities Exchange Act of 1934 during the preceding 12 months (or for such shorter period that the registrant was required to file such reports), and (2) has been subject to such filing requirements for the past 90 days. Yes ☒ No ☐
Indicate by check mark whether the registrant has submitted electronically every Interactive Data File required to be submitted pursuant to Rule 405 of Regulation S-T (§ 232.405 of this chapter) during the preceding 12 months (or for such shorter period that the registrant was required to submit and post such files). Yes ☒ No ☐
Indicate by check mark whether the registrant is a large accelerated filer, an accelerated filer, a non-accelerated filer, a smaller reporting company, or an emerging growth company. See the definitions of “large accelerated filer”, “accelerated filer”, “smaller reporting company”, and “emerging growth company” in Rule 12b-2 of the Exchange Act.
Large accelerated filer |
☐ |
Accelerated filer |
☐ |
Non-accelerated filer |
☒ |
Smaller reporting company |
☒ |
|
|
Emerging growth company |
☐ |
If an emerging growth company, indicate by check mark if the registrant has elected not to use the extended transition period for complying with any new or revised financial accounting standards provided pursuant to Section 13 (a) ☐
Indicate by check mark whether the registrant has filed a report on and attestation to its management’s assessment of the effectiveness of its internal control over financial reporting under Section 404(b) of the Sarbanes-Oxley Act (15 U.S.C. 7262(b)) by the registered public accounting firm that prepared or issued its audit report. ☐
If securities are registered pursuant to Section 12(b) of the Act, indicate by check mark whether the financial statements of the registrant included in the filing reflect the correction of an error to previously issued financial statements. ☐
Indicate by check mark whether any of those error corrections are restatements that required a recovery analysis of incentive-based compensation received by any of the registrant’s executive officers during the relevant recovery period pursuant to §240.10D-1(b). ☐
Indicate by check mark whether the registrant is a shell company (as defined in Rule 12b-2 of the Exchange Act). Yes ☐ No ☒
State the aggregate market value of the voting and non-voting common equity held by non-affiliates computed by reference to the price at which the common equity was last sold, or the average bid and asked price of such common equity, as of the last business day of the registrant’s most recently completed second fiscal quarter. $131,635,297 based on the closing price of such common stock on June 30, 2024, which was $29.20 per share.
Indicate the number of shares outstanding of each of the registrant's classes of common stock, as of the latest practicable date. 5,455,999 shares of common stock, outstanding at February 28, 2025.
Auditor firm ID 686
DOCUMENTS INCORPORATED BY REFERENCE
Portions of the Annual Report of Peoples Bancorp of North Carolina, Inc. (the “Company”) for the year ended December 31, 2024 (the “Annual Report”), which will be included as Appendix A to the Company’s Proxy Statement for the 2025 Annual Meeting of Shareholders to be held on May 1, 2025 (the “Proxy Statement”), are incorporated by reference into Part II and filed as Exhibit 13 to this Form 10-K.
Portions of the Company’s Proxy Statement to be filed pursuant to Regulation 14A, are incorporated by reference into Part III. The Proxy Statement will be filed on or before April 30, 2025.
This report contains certain forward-looking statements with respect to the financial condition, results of operations and business of the Company. These forward-looking statements involve risks and uncertainties and are based on the beliefs and assumptions of management of the Company and on the information available to management at the time that these disclosures were prepared. These statements can be identified by the use of words like “expect,” “anticipate,” “estimate” and “believe,” variations of these words and other similar expressions. Readers should not place undue reliance on forward-looking statements as a number of important factors could cause actual results to differ materially from those in the forward-looking statements. Factors that could cause actual results to differ materially include, but are not limited to, (1) competition in the markets served by the Company’s subsidiary, Peoples Bank, (2) changes in the interest rate environment, (3) general national, regional or local economic conditions may be less favorable than expected, resulting in, among other things, a deterioration in credit quality and the possible impairment of collectibility of loans, (4) legislative or regulatory changes, including changes in accounting standards, (5) significant changes in the federal and state legal and regulatory environment and tax laws, (6) the impact of changes in monetary and fiscal policies, laws, rules and regulations and (7) other risks and factors identified in the Company’s other filings with the Securities and Exchange Commission. The Company undertakes no obligation to update any forward-looking statements.
| 2 |
| Table of Contents |
PEOPLES BANCORP OF NORTH CAROLINA, INC. | |||||
FORM 10-K CROSS REFERENCE INDEX | |||||
|
|
|
|||
|
10-K |
|
Proxy Statement and Annual Report |
|
|
|
Page |
|
Page |
|
|
|
|
|
|||
|
4 - 15 |
|
N/A |
|
|
|
15 - 25 |
|
N/A |
|
|
|
25 |
|
N/A |
|
|
|
25 |
|
N/A |
|
|
|
26 |
|
N/A |
|
|
|
27 |
|
N/A |
|
|
|
27 |
|
N/A |
|
|
|
|
|
|||
|
|
|
|||
|
28 - 29 |
|
N/A |
|
|
|
29 |
|
A-3 |
|
|
Item 7 - Management’s Discussion and Analysis of Financial Condition and Results of Operations |
|
29 |
|
A-4 - A-19 |
|
Item 7A - Quantitative and Qualitative Disclosures About Market Risk |
|
29 |
|
N/A |
|
|
29 |
|
A-20 - A-62 |
|
|
Item 9 - Changes in and Disagreements with Accountants on Accounting and Financial Disclosure |
|
29 |
|
N/A |
|
|
30 |
|
N/A |
|
|
|
30 |
|
N/A |
|
|
Item 9C - Disclosure Regarding Foreign Jurisdictions that Prevent Inspections |
|
30 |
|
N/A |
|
|
|
|
|||
|
|
|
|||
Item 10 - Directors and Executive Officers and Corporate Governance |
|
31 |
|
15 and A-63 |
|
|
31 |
|
19 - 26 |
|
|
|
31 - 32 |
|
5 - 7 |
|
|
Item 13 - Certain Relationships and Related Transactions and Director Independence |
|
32 |
|
6, 7 and 26 |
|
|
32 |
|
27 |
|
|
|
|
|
|||
|
|
|
|||
|
33 - 36 |
|
N/A |
|
|
|
|
|
|||
|
37 |
|
N/A |
|
|
| 3 |
| Table of Contents |
PART I
ITEM 1. BUSINESS
General Business
Peoples Bancorp of North Carolina, Inc. (the “Company”), was formed in 1999 to serve as the holding company for Peoples Bank (the “Bank”). The Company is a bank holding company registered with the Board of Governors of the Federal Reserve System (the “Federal Reserve”) under the Bank Holding Company Act of 1956, as amended (the “BHCA”). The Company’s principal source of income is dividends declared and paid by the Bank on its capital stock, if any. The Company has no operations and conducts no business of its own other than owning the Bank and PEBK Capital Trust II. Accordingly, the discussion of the business which follows primarily concerns the business conducted by the Bank. Our principal executive offices are located at 518 West C Street, Newton, North Carolina, 28658, and our telephone number is (828) 464-5620.
The Bank, founded in 1912, is a state-chartered commercial bank serving the citizens and business interests of the Catawba Valley and surrounding communities through 16 banking offices, located in Lincolnton, Newton, Denver, Catawba, Conover, Maiden, Claremont, Hiddenite, Hickory, Charlotte, Huntersville, Mooresville and Raleigh, North Carolina. The Bank also operates loan production offices in Charlotte, Denver, Salisbury and Winston-Salem North Carolina. The Company’s fiscal year ends December 31. At December 31, 2024, the Company had total assets of $1.7 billion, net loans of $1.1 billion, deposits of $1.5 billion, total securities of $390.7 million, and shareholders’ equity of $130.6 million.
The Bank has a diversified loan portfolio, with no foreign loans and few agricultural loans. Real estate loans are predominately variable rate and fixed rate commercial property loans, which include residential development loans to commercial customers. Commercial loans are spread throughout a variety of industries with no one particular industry or group of related industries accounting for a significant portion of the commercial loan portfolio. The majority of the Bank’s deposit and loan customers are individuals and small-to medium-sized businesses located in the Bank’s market area. Additional discussion of the Bank’s loan portfolio and sources of funds for loans can be found in “Management’s Discussion and Analysis of Financial Condition and Results of Operations” on pages A-4 through A-19 of the Annual Report, which is included in this Form 10-K as Exhibit (13).
The operations of the Bank are significantly influenced by general economic conditions and by related monetary and fiscal policies of the Company and the Bank’s regulatory agencies, including the Federal Reserve, the Federal Deposit Insurance Corporation (the “FDIC”) and the North Carolina Commissioner of Banks (the “Commissioner”).
At December 31, 2024, the Company employed 281 full-time employees and 13 part-time employees, which equated to 288 full-time equivalent employees.
Subsidiaries
The Bank is a subsidiary of the Company. At December 31, 2024, the Bank had four subsidiaries, Peoples Investment Services, Inc., Real Estate Advisory Services, Inc., Community Bank Real Estate Solutions, LLC (“CBRES”) and PB Real Estate Holdings, LLC. Through a relationship with Raymond James Financial Services, Inc., Peoples Investment Services, Inc. provides the Bank’s customers access to investment counseling and non-deposit investment products such as stocks, bonds, mutual funds, tax deferred annuities, and related brokerage services. Real Estate Advisory Services, Inc. provides real estate appraisal and real estate brokerage services. CBRES serves as a “clearing-house” for appraisal services for community banks. Other banks are able to contract with CBRES to find and engage appropriate appraisal companies. As a separate legal entity, CBRES’s services and the appraisal process are conducted independent from the financing process of the Bank. PB Real Estate Holdings, LLC acquires, manages and disposes of real property, other collateral and assets obtained in the ordinary course of collecting debts previously contracted. All of the Bank’s subsidiaries are incorporated in the state of North Carolina.
In June 2006, the Company formed a wholly owned Delaware statutory trust, PEBK Capital Trust II (“PEBK Trust II”), to facilitate the issuance of $20.6 million of trust preferred securities. PEBK Trust II is not included in the consolidated financial statements. The Company redeemed $5.0 million of outstanding trust preferred securities in 2019.
| 4 |
| Table of Contents |
Market Area and Competition
The Bank’s primary market consists of the communities in an approximate 50-mile radius around its headquarters office in Newton, North Carolina. This area includes Catawba County, Alexander County, Lincoln County, Iredell County and portions of northeast Gaston County, North Carolina. The Bank also conducts a portion of its business outside of this area. The Bank is located only 40 miles north of Charlotte, North Carolina, and the Bank’s primary market area is and will continue to be significantly affected by its close proximity to this major metropolitan area.
Employment in the Bank’s primary market area is diversified among manufacturing, retail and wholesale trade, technology, services and utilities. Catawba County’s largest employers include Catawba County Schools, Catawba Valley Medical Center, Duke LifePoint/Frye Regional Medical Center, CommScope, Inc. (manufacturer of fiber optic cable and accessories), Corning Optical Communications (manufacturer of fiber optic cable and accessories), Target Stores Distribution Center (transportation and warehousing), Catawba County, GKN ePowertrain (manufacturing), Wal-Mart Associates, Inc. and Pierre Foods, Inc. Lincoln County’s largest employers include Lincoln County Schools, County of Lincoln, Atrium Health, Lincoln Charter Schools, Inc., American Woodmark - RSI Home Products (manufacturing), Wal-Mart Associates, Inc., The Timken Company (manufacturing), Blum, Inc. (manufacturing), Lowes Home Centers, Inc. and Cataler North America (manufacturing).
The Bank has operated in the Catawba Valley region of North Carolina for over 110 years and is the only financial institution headquartered in Newton, North Carolina. Nevertheless, the Bank faces strong competition both in attracting deposits and making loans. Direct competition for deposits has historically come from other commercial banks, credit unions and brokerage firms located in its primary market area, including large financial institutions. One national money center commercial bank is headquartered in Charlotte, North Carolina. Based upon June 30, 2024 comparative data, the Bank had 21.49% of the deposits in Catawba County, placing it second in deposit size among a total of 12 banks with branch offices in Catawba County; 16.37% of the deposits in Lincoln County, placing it second in deposit size among a total of 10 banks with branch offices in Lincoln County; and 16.10% of the deposits in Alexander County, placing it fourth in deposit size among a total of four banks with branch offices in Alexander County.
The Bank also faces additional significant competition for investors’ funds from short-term money market securities and other corporate and government securities. The Bank’s core deposit base has grown principally due to economic growth in the Bank’s market area coupled with the implementation of new and competitive deposit products. The ability of the Bank to attract and retain deposits depends on its ability to generally provide a rate of return, liquidity and risk comparable to that offered by competing investment opportunities.
The Bank experiences strong competition for loans from commercial banks and mortgage banking companies. The Bank competes for loans primarily through the interest rates and loan fees it charges and the efficiency and quality of services it provides to borrowers. Competition is increasing as a result of the continuing reduction of restrictions on the interstate operations of financial institutions.
Lending Policies and Procedures
Our lending activities follow written, non-discriminatory underwriting standards and loan origination procedures established by the Board of Directors of the Bank (the “Bank Board”). The loan approval process is intended to assess the borrower’s ability to repay the loan and the value of the collateral that will secure the loan. To assess the borrower’s ability to repay, we review the borrower’s employment, credit history, and other information on the historical and projected income and expenses of the borrower.
The objectives of our lending program are to: (i) establish a sound asset structure; (ii) provide a sound and profitable loan portfolio to (a) protect the depositor’s funds and (b) maximize our shareholders’ return on investment; (iii) promote the stable economic growth and development of the market area served by the Bank; and (iv) comply with all regulatory agency requirements and applicable law.
The Bank’s legal lending limit is set by law and is monitored by the FDIC and the Commissioner. As of December 31, 2024, the Bank’s legal lending limit was $29.1 million (absent fully marketable collateral), and the largest credit relationship was $19.1 million. The underwriting standards and loan origination procedures include officer lending limits, which are approved by the Bank Board. The Executive Loan Committee of the Bank has loan authority of up to the legal lending limit of the Bank. As of December 31, 2024, the individual lending authority of the Chief Credit Officer/Executive Vice President was set at $8.0 million.
| 5 |
| Table of Contents |
It is the policy of the Bank to ensure that the Bank Board is fully apprised of the status and critical factors affecting the quality and performance of the loan portfolio. These factors include, but are not limited to: (i) credit underwriting policies and procedures; (ii) results of loan reviews and loan audits; and, (iii) credit concentrations (single borrowers and specific industries).
Management provides the Bank Board with the loan portfolio information as described below:
Monthly:
The following reports are submitted to the Bank Board for review and approval on a monthly basis:
· |
Loan Quality/Yield/Growth/Trend Report |
· |
Risk Grade Report with Details of Loans Risk Graded 5-8 |
· |
Commercial Loan Delinquency |
· |
New Loans - $250,000 and Greater |
· |
Comparison of New Loans in Prior Month with Same Month in Prior Year |
· |
Outstanding Commitments - $500,000 and Greater |
· |
Commitment Pipeline Report – outstanding commitments of $2,000,000 and greater (pending final approval and/or acceptance by the applicant) |
· |
Underwriting Exception Report (Commercial, Consumer and Mortgage) |
· |
Documentation Exception Report (Commercial and Consumer – quarterly comparison with current month) |
· |
All New Loans for Prior Month – Details |
Quarterly:
The following reports are submitted to the Bank Board for review and approval on a quarterly basis:
· |
Real Estate Secured Loans with Non-Conforming Loan-To-Value Ratio |
· |
Status of Other Real Estate Owned |
· |
Nonaccrual |
· |
Impaired Loan Report |
· |
Letters of Credit Outstanding |
· |
Portfolio Status Report - Detailed analytical report summarizing the composition of the Bank's loan portfolio |
· |
Portfolio Stress Tests |
· |
Matured Home Equity Loan Report |
Semi-annually:
The following report is submitted to the Bank Board for review and approval on a semi-annual basis:
· |
Participation Status Report |
Annually:
On an annual basis, the Bank Board:
· |
Reviews and approves the Bank’s credit underwriting policies and procedures |
· |
Reviews findings of the annual independent loan review of borrowing relationships of $1.5 million and greater as well as a periodic sample of commercial relationships with exposures below $1.5 million prepared by an independent loan review company engaged by the Bank |
· |
Receives information from management detailing all new committed borrowing relationships exceeding $3.0 million and is informed during the year if a borrowing relationship exceeds $2.5 million |
· |
Mortgage Report |
Investment Policies and Procedures
The Bank’s investment policy is designed to provide flexibility as necessary to maintain satisfactory liquidity while maximizing earnings on funds available for investment. The Bank maintains an investment portfolio of high-quality investment securities that is managed in a manner consistent with safe and sound banking practices. The characteristics and financial goals of the investment portfolio are complementary to the Bank’s broader business strategies and congruent with the Bank’s capital policies, technical expertise, and risk tolerances.
| 6 |
| Table of Contents |
The Bank’s specific investment objectives are as follows:
A. Provide Earnings – Maximize the total return on invested funds in a manner that is consistent with the Bank’s overall financial goals and risk considerations. This objective is fulfilled by investing in, holding, and divesting from individual securities that, when considered in combination, contribute to a superior risk/reward for the total portfolio.
B. Provide Liquidity – Remain sufficiently liquid to meet anticipated funding demands either through declines in deposits and/or increases in loan demand. The Bank makes investments that are marketable and capable of being converted to cash at their market values in a relatively short period of time.
C. Mitigate Interest Rate Risk – Utilize portfolio strategies to assist the Bank in managing its overall interest rate sensitivity position in accordance with the goals and objectives approved by the Asset/Liability Management Committee (“ALCO”) of the Bank.
D. Ensure the Safety of Principal –At all times, the safety of principal is a primary consideration. Upon purchase, the Bank’s investments are limited to investment-grade instruments that fully comply with all applicable regulatory guidelines and limitations.
E. Manage Tax Liabilities – Conduct portfolio management in light of the Bank’s current and projected tax position in order to improve overall profitability by reducing the Bank’s tax exposure to its minimum permissible level.
F. Meet Pledging Requirements – Provide collateral for various deposit and funding products such as public funds, trust deposits, repurchase agreements and FHLB borrowings.
The Bank Board reviews and approves the Bank’s Investment Policy annually or more frequently, if appropriate. All investment portfolio activities are reported to the ALCO and the Bank Board. The Bank Board oversees the establishment of appropriate systems and internal controls designed to keep portfolio strategies and holdings consistent with the overall strategies of the Bank.
The Bank Board designates a Primary Investment Officer who is directed to implement the Investment Policy of the Bank in a safe and sound manner. The Primary Investment Officer of the Bank is charged with the responsibility to actively manage the Bank's investment portfolio, in conformity with the preceding objectives and the following approval requirements. Such responsibility includes the purchase and/or disposition of any holding within the investment portfolio up to $8 million and the ability to establish accounts with other depository institutions or investment firms as needed to process investment activity approved under this policy. Any activity over $8 million and less than 20% of the Bank’s capital as defined by accounting principles generally accepted in the United States of America (“GAAP”) must be approved by the ALCO. Transactions exceeding 20% of GAAP capital must be approved by the Bank Board. Also, any sale of securities that will result in a gain of more than $500,000 or a loss before income taxes exceeding the lesser of $250,000 or 2.5% of the current year’s projected net income must be approved by the Bank Board. The Investment Officer may designate certain investment functions to other officers of the Bank and may also seek outside sources for investment advice or periodic appraisals of the portfolio. The Executive Vice President/Chief Financial Officer serves as the Primary Investment Officer.
Human Capital Management
At December 31, 2024, the Company employed 281 full-time employees and 13 part-time employees, which equated to 288 full-time equivalent employees. We are not a party to any collective bargaining agreements, and we consider our employee relations to be good.
Oversight of our corporate culture is an important element of our Board of Directors oversight of risk because our people are critical to the success of our corporate strategy. Our Board of Directors sets the “tone at the top,” and holds senior management accountable for embodying, maintaining, and communicating our culture to employees. Our culture is guided by our guiding principles below:
| 7 |
| Table of Contents |
Our Core Values
|
- |
Employees – We are informed, encouraged, and committed |
|
- |
Integrity – We are fair and truthful |
|
- |
Exceptional Customer Service – We surpass our customers’ expectation |
|
- |
Accountability – We are accountable for our own actions and bank goals |
|
- |
Progressive and Positive – We see change as an opportunity |
|
- |
Our brand story |
Our Bank Promise, Vision, and Mission
We are committed to fostering, cultivating, and preserving a culture of diversity and inclusion. We are working to cultivate our leaders and shape future talent pools to help us meet the needs of our customers now and in the future. Our human capital is the most valuable asset we have. The collective sum of the individual differences, life experiences, knowledge, inventiveness, innovation, self-expression, unique capabilities, and talent that our employees invest in their work represents a significant part of not only our culture but our reputation and our achievement as well. We embrace our employees’ differences in age, color, disability, ethnicity, family or marital status, gender identity or expression, language, national origin, physical and mental ability, political affiliation, race, religion, sexual orientation, socio-economic status, veteran status, and other characteristics that make our employees unique.
By emphasizing a consistent set of principles that all employees follow, we believe that our employees work experience is more satisfying, and they are better able to serve their customers consistently and at a high level.
Our employees are key to our success as an organization. We are committed to attracting, retaining and promoting top quality talent regardless of sex, sexual orientation, gender identity, race, color, national origin, age, religion and physical ability. We strive to identify and select the best candidates for all open positions based on qualifying factors for each job. We are dedicated to providing a workplace for our employees that is inclusive, supportive, and free of any form of discrimination or harassment; rewarding and recognizing our employees based on their individual results and performance; and recognizing and respecting all of the characteristics and differences that make each of our employees unique.
Employees have annual assignments related to “valuing differences” and diversity training is an integrated part of our leadership training as well. We expanded our Diversity, Equity & Inclusion (“DEI”) course library to support our ongoing culture sustainability program development. We launched our “Courageous Conversations” initiative in 2020, a program we will continue to build on annually.
We also seek to design careers within our organization that are fulfilling ones, with competitive compensation and benefits alongside a positive work-life balance. We dedicate resources to fostering professional and personal growth with continuing education, on-the-job training and development programs.
Supervision and Regulation
Bank holding companies and commercial banks are extensively regulated under both federal and state law. The following is a brief summary of certain statutes and rules and regulations that affect or will affect the Company, the Bank and their subsidiaries. This summary is qualified in its entirety by reference to the particular statute and regulatory provisions referred to below and is not intended to be an exhaustive description of the statutes or regulations applicable to the business of the Company, the Bank and their subsidiaries. Supervision, regulation and examination of the Company and the Bank by the regulatory agencies are intended primarily for the protection of depositors rather than shareholders of the Company. Statutes, rules and regulations which contain wide-ranging proposals for altering the structures, regulations and competitive relationship of financial institutions are introduced regularly. The Company cannot predict whether or in what form any proposed statute, rule or regulation will be adopted or the extent to which the business of the Company and the Bank may be affected by such statute or regulation.
General. There are a number of obligations and restrictions imposed on bank holding companies and their depository institution subsidiaries by law and regulatory policy that are designed to minimize potential loss to depositors and the FDIC deposit insurance fund in the event a depository institution becomes in danger of default or in default. For example, to mitigate the risk of failure, bank holding companies are required to guarantee the compliance of any insured depository institution subsidiary that may become “undercapitalized” with the terms of the capital restoration plan filed by such subsidiary with its appropriate federal banking agency up to the lesser of (i) an amount equal to 5% of the bank’s total assets at the time the bank became undercapitalized or (ii) the amount which is necessary (or would have been necessary) to bring the bank into compliance with all capital standards as of the time the bank fails to comply with such capital restoration plan. The Company, as a registered bank holding company, is subject to the regulation of the Federal Reserve. Under a policy of the Federal Reserve with respect to bank holding company operations, a bank holding company is required to serve as a source of financial strength to its subsidiary depository institutions and to commit resources to support such institutions in circumstances where it might not do so absent such policy. The Federal Reserve under the BHCA also has the authority to require a bank holding company to terminate any activity or to relinquish control of a nonbank subsidiary (other than a nonbank subsidiary of a bank) upon the Federal Reserve’s determination that such activity or control constitutes a serious risk to the financial soundness and stability of any bank subsidiary of the bank holding company.
| 8 |
| Table of Contents |
As a result of the Company’s ownership of the Bank, the Company is also registered under the bank holding company laws of North Carolina. Accordingly, the Company is also subject to regulation and supervision by the Commissioner.
Dodd-Frank Wall Street Reform and Consumer Protection Act (the “Dodd-Frank Act”) and the Economic Growth, Regulatory Relief and Consumer Protection Act (the “Economic Growth Act”). On July 21, 2010, the Dodd-Frank Act became law. The Dodd-Frank Act has had and will continue to have a broad impact on the financial services industry, including significant regulatory and compliance changes including, among other things,
|
· |
enhanced authority over troubled and failing banks and their holding companies; |
|
· |
increased capital and liquidity requirements; |
|
· |
increased regulatory examination fees; and |
|
· |
specific provisions designed to improve supervision and safety and soundness by imposing restrictions and limitations on the scope and type of banking and financial activities. |
In May 2018, the Economic Growth Act, was enacted to modify or remove certain financial reform rules and regulations, including some of those implemented under the Dodd-Frank Act. While the Economic Growth Act maintains most of the regulatory structure established by the Dodd-Frank Act, it amends certain aspects of the regulatory framework for small depository institutions with assets less than $10 billion and for large banks with assets of more than $50 billion.
The Economic Growth Act, among other matters, expands the definition of qualified mortgages which may be held by a financial institution and provides for an alternative capital rule which financial institutions and their holding companies with total consolidated assets of less than $10 billion may elect to utilize. The Economic Growth Act instructed the federal banking regulators to establish a single “Community Bank Leverage Ratio” of between 8% and 10%. In addition, the Economic Growth Act includes regulatory relief for community banks of certain sizes regarding regulatory examination cycles, call reports, the Volcker Rule (proprietary trading prohibitions), mortgage disclosures and risk weights for certain high-risk commercial real estate loans. We have not opted to utilize the Community Bank Leverage Ratio and have instead continued to use the Basel III standards (see discussion on Basel III standards under the heading “Capital Adequacy” below).
It is difficult at this time to predict when or how any new standards under the Economic Growth Act will ultimately be applied to, or what specific impact the Economic Growth Act and the yet-to-be-written implementing rules and regulations will have on us.
Capital Adequacy. At December 31, 2024, the Bank exceeded each of its minimum capital requirements with a Tier 1 leverage capital ratio of 10.71%, common equity Tier 1 risk-based capital ratio of 14.35%, Tier 1 risk-based capital ratio of 14.35% and total risk-based capital ratio of 15.22%. At December 31, 2024, the Company also exceeded each of its minimum capital requirements with a Tier 1 leverage capital ratio of 10.88%, common equity Tier 1 risk-based capital ratio of 13.29%, Tier 1 risk-based capital ratio of 14.47% and total risk-based capital ratio of 15.34%.
On July 2, 2013, the Federal Reserve approved a final rule that establishes an integrated regulatory capital framework that addresses shortcomings in certain capital requirements. The rule, which became effective on January 1, 2015, implements in the United States the Basel III regulatory capital reforms from the Basel Committee on Banking Supervision and certain changes required by the Dodd-Frank Act. The final rule:
| 9 |
| Table of Contents |
|
· |
established a new minimum common equity Tier 1 risk-based capital ratio (common equity Tier 1 capital to total risk-weighted assets) of 4.5% and increased the minimum Tier 1 risk-based capital ratio from 4.0% to 6.0%, while maintaining the minimum total risk-based capital ratio of 8.0% and the minimum Tier 1 leverage capital ratio of 4.0%; |
|
· |
revised the rules for calculating risk-weighted assets to enhance their risk sensitivity; |
|
· |
phased out trust preferred securities and cumulative perpetual preferred stock as Tier 1 capital; |
|
· |
added a requirement to maintain a minimum conservation buffer, composed of common equity Tier 1 capital, of 2.5% of risk-weighted assets, to be applied to the new common equity Tier 1 risk-based capital ratio, the Tier 1 risk-based capital ratio and the Total risk-based capital ratio, which means that banking organizations, on a fully phased in basis no later than January 1, 2019, must maintain a minimum common equity Tier 1 risk-based capital ratio of 7.0%, a minimum Tier 1 risk-based capital ratio of 8.5% and a minimum Total risk-based capital ratio of 10.5%; and |
|
· |
changed the definitions of capital categories for insured depository institutions for purposes of the Federal Deposit Insurance Corporation Improvement Act of 1991 prompt corrective action provisions. Under these revised definitions, to be considered well-capitalized, an insured depository institution must have a Tier 1 leverage capital ratio of at least 5.0%, a common equity Tier 1 risk-based capital ratio of at least 6.5%, a Tier 1 risk-based capital ratio of at least 8.0% and a total risk-based capital ratio of at least 10.0%. |
The new minimum regulatory capital ratios and changes to the calculation of risk-weighted assets became effective for the Bank and the Company on January 1, 2015. The required minimum conservation buffer was phased in incrementally, starting at 0.625% on January 1, 2016 and increased to 1.25% on January 1, 2017, 1.875% on January 1, 2018, and 2.5% on January 1, 2019.
The final rule established common equity Tier 1 capital as a new capital component. Common equity Tier 1 capital consists of common stock instruments that meet the eligibility criteria in the final rule, retained earnings, accumulated other comprehensive income/loss and common equity Tier 1 minority interest. As a result, Tier 1 capital has two components: common equity Tier 1 capital and additional Tier 1 capital. The final rule also revised the eligibility criteria for inclusion in additional Tier 1 and Tier 2 capital. As a result of these changes, certain non-qualifying capital instruments, including cumulative preferred stock and trust preferred securities, are excluded as a component of Tier 1 capital for institutions of the size of the Company.
The final rule further requires that certain items be deducted from common equity Tier 1 capital, including (1) goodwill and other intangible assets, other than mortgage servicing rights, net of deferred tax liabilities (“DTLs”); (2) deferred tax assets that arise from operating losses and tax credit carryforwards, net of valuation allowances and DTLs; (3) after-tax gain-on-sale associated with a securitization exposure; and (4) defined benefit pension fund assets held by a depository institution holding company, net of DTLs. In addition, banking organizations must deduct from common equity Tier 1 capital the amount of certain assets, including mortgage servicing assets, that exceed certain thresholds. The final rule also allows all but the largest banking organizations to make a one-time election not to recognize unrealized gains and losses on available for sale debt securities in regulatory capital, as under prior capital rules.
The final rule provides that the failure to maintain the minimum conservation buffer will result in restrictions on capital distributions and discretionary cash bonus payments to executive officers. If a banking organization’s conservation buffer is less than 0.625%, the banking organization may not make any capital distributions or discretionary cash bonus payments to executive officers. If the conservation buffer is greater than 0.625% but not greater than 1.25%, capital distributions and discretionary cash bonus payments are limited to 20% of net income for the four calendar quarters preceding the applicable calendar quarter (net of any such capital distributions), or eligible retained income. If the conservation buffer is greater than 1.25% but not greater than 1.875%, the limit is 40% of eligible retained income, and if the conservation buffer is greater than 1.875% but not greater than 2.5%, the limit is 60% of eligible retained income. The preceding thresholds for the conservation buffer and related restrictions represent the fully phased in rules effective January 1, 2019.
Dividend and Repurchase Limitations. Federal regulations provide that the Company must obtain Federal Reserve approval prior to repurchasing its common stock for consideration in excess of 10% of its net worth during any twelve-month period unless the Company (i) both before and after the redemption satisfies capital requirements for a “well capitalized” bank holding company; (ii) received a one or two rating in its last examination; and (iii) is not the subject of any unresolved supervisory issues.
The ability of the Company to pay dividends or repurchase shares is largely dependent upon the Company’s receipt of dividends from the Bank. North Carolina commercial banks, such as the Bank, are subject to legal limitations on the amounts of dividends they are permitted to pay. Also, an insured depository institution, such as the Bank, is prohibited from making capital distributions, including the payment of dividends, if, after making such distribution, the institution would become “undercapitalized” (as such term is defined in the applicable law and regulations).
| 10 |
| Table of Contents |
Deposit Insurance. As a member of the FDIC, our deposits are insured up to applicable limits by the FDIC, and such insurance is backed by the full faith and credit of the United States Government. The basic deposit insurance level is generally $250,000, as specified in FDIC regulations. For this protection, each insured bank pays a quarterly statutory assessment and is subject to the rules and regulations of the FDIC.
We recognized approximately $764,000, $745,000 and $461,000 in FDIC insurance expense in 2024, 2023, and 2022, respectively. The increase in 2023 is primarily due to the FDIC insurance assessment rate changing from 0.03% to 0.05% effective January 1, 2023.
The FDIC may conduct examinations of and require reporting by FDIC-insured institutions. It may also prohibit an institution from engaging in any activity that it determines by regulation or order to pose a serious risk to the deposit insurance fund and may terminate the Bank’s deposit insurance if it determines that the institution has engaged in unsafe or unsound practices or is in an unsafe or unsound condition.
Federal Home Loan Bank System. The Federal Home Loan Bank (“FHLB”) system provides a central credit facility for member institutions. As a member of the FHLB of Atlanta, the Bank is required to own capital stock in the FHLB of Atlanta in an amount at least equal to 0.20% (or 20 basis points) of the Bank’s total assets at the end of each calendar year, plus 4.25% of its outstanding advances (borrowings) from the FHLB of Atlanta under the new activity-based stock ownership requirement. On December 31, 2024, the Bank was in compliance with this requirement.
Community Reinvestment. Under the Community Reinvestment Act (“CRA”), as implemented by regulations of the FDIC, an insured institution has a continuing and affirmative obligation consistent with its safe and sound operation to help meet the credit needs of its entire community, including low and moderate income neighborhoods. The CRA does not establish specific lending requirements or programs for financial institutions, nor does it limit an institution’s discretion to develop, consistent with the CRA, the types of products and services that it believes are best suited to its particular community. The CRA requires the federal banking regulators, in connection with their examinations of insured institutions, to assess the institutions’ records of meeting the credit needs of their communities, using the ratings of “outstanding,” “satisfactory,” “needs to improve,” or “substantial noncompliance,” and to take that record into account in its evaluation of certain applications by those institutions. All institutions are required to make public disclosure of their CRA performance ratings. The Bank received a “satisfactory” rating in its last CRA examination, which was conducted in May 2023.
In October 2023, the Federal Reserve, FDIC, and OCC issued a final rule to amend their regulations implementing the CRA. The rule materially revises the current CRA framework, including the assessment areas in which a bank is evaluated to include activities associated with online and mobile banking, the tests used to evaluate the bank in its assessment areas, new methods of calculating credit for lending, investment and service activities, and additional data collection and reporting requirements. The rule is expected to result in a significant increase in the thresholds for large banks to receive “Outstanding” ratings in the future. Most of the provisions become applicable on January 1, 2026. Reporting of the collected data will not be required until 2027.
Changes in Control. The BHCA prohibits the Company from acquiring direct or indirect control of more than 5% of the outstanding voting stock or substantially all of the assets of any bank or savings bank or merging or consolidating with another bank or financial holding company or savings bank holding company without prior approval of the Federal Reserve. Similarly, Federal Reserve approval (or, in certain cases, non‑objection) must be obtained prior to any person acquiring control of the Company. Control is deemed to exist if, among other things, a person acquires 25% or more of any class of voting stock of the Company or controls in any manner the election of a majority of the directors of the Company.
Federal Securities Law. The Company has registered its common stock with the Securities and Exchange Commission (“SEC”) pursuant to Section 12(g) of the Securities Exchange Act of 1934, as amended from time to time (the “Exchange Act”). As a result of such registration, the proxy and tender offer rules, insider trading reporting requirements, annual and periodic reporting and other requirements of the Exchange Act are applicable to the Company. In addition, the SEC and Nasdaq have adopted regulations under the Sarbanes-Oxley Act of 2002 and the Dodd Frank Act that apply to the Company as a Nasdaq-traded, public company, which seek to improve corporate governance, provide enhanced penalties for financial reporting improprieties and improve the reliability of disclosures in SEC filings.
| 11 |
| Table of Contents |
Transactions with Affiliates. Under current federal law, depository institutions are subject to the restrictions and limitations contained in Section 22(h) of the Federal Reserve Act with respect to loans to directors, executive officers and principal shareholders. In addition to limitations on the dollar value of loans to directors, executive officers and principal shareholders, pursuant to Section 22(h), the Federal Reserve requires that loans to directors, executive officers, and principal shareholders be made on terms substantially the same as offered in comparable transactions with non-executive employees of the Bank. The FDIC has imposed additional limits on the amount a bank can loan to an executive officer.
Loans to One Borrower. The Bank is subject to the loans-to-one-borrower limits established by North Carolina law, which are substantially the same as those applicable to national banks. Under these limits, no loans and extensions of credit to any borrower outstanding at one time and not fully secured by readily marketable collateral may exceed 15% of the Bank’s total equity capital. At December 31, 2024, this limit was $29.1 million. This limit is increased by an additional 10% of the Bank’s total equity capital, or $48.6 million as of December 31, 2024, for loans and extensions of credit that are fully secured by readily marketable collateral.
Anti-Money Laundering and the USA Patriot Act. A major focus of governmental policy on financial institutions in recent years has been aimed at combating money laundering and terrorist financing. The USA PATRIOT Act of 2001 (the "USA Patriot Act""), substantially broadened the scope of United States anti-money laundering laws and regulations by imposing significant new compliance and due diligence obligations on financial institutions, creating new crimes and penalties and expanding the extra-territorial jurisdiction of the United States. Financial institutions are also prohibited from entering into specified financial transactions and account relationships and must use enhanced due diligence procedures in their dealings with certain types of high-risk customers and implement a written customer identification program. Financial institutions must take certain steps to assist government agencies in detecting and preventing money laundering and report certain types of suspicious transactions. Regulatory authorities routinely examine financial institutions for compliance with these obligations, and failure of a financial institution to maintain and implement adequate programs to combat money laundering and terrorist financing, or to comply with all of the relevant laws or regulations, could have serious financial, legal and reputational consequences for the institution, including causing applicable bank regulatory authorities not to approve merger or acquisition transactions when regulatory approval is required or to prohibit such transactions even if approval is not required. Regulatory authorities have imposed cease and desist orders and civil money penalties against institutions found to be violating these obligations.
The Anti-Money Laundering Act of 2020 (“AMLA”), which amends the Bank Secrecy Act of 1970 (“BSA”), was enacted in January 2021. The AMLA is intended to be a comprehensive reform and modernization to U.S. bank secrecy and anti-money laundering laws. Among other things, it codifies a risk-based approach to anti-money laundering compliance for financial institutions; requires the development of standards for evaluating technology and internal processes for BSA compliance; expands enforcement- and investigation-related authority, including increasing available sanctions for certain BSA violations and instituting BSA whistleblower incentives and protections.
Interstate Banking and Branching. The BHCA was amended by the Interstate Banking Act. The Interstate Banking Act provides that adequately capitalized and managed financial and bank holding companies are permitted to acquire banks in any state. State law prohibiting interstate banking or discriminating against out-of-state banks is preempted. States are not permitted to enact laws opting out of this provision; however, states are allowed to adopt a minimum age restriction requiring that target banks located within the state be in existence for a period of years, up to a maximum of five years, before a bank may be subject to the Interstate Banking Act. The Interstate Banking Act, as amended by the Dodd-Frank Act, establishes deposit caps which prohibit acquisitions that result in the acquiring company controlling 30% or more of the deposits of insured banks and thrift institutions held in the state in which the target maintains a branch or 10% or more of the deposits nationwide. States have the authority to waive the 30% deposit cap. State-level deposit caps are not preempted as long as they do not discriminate against out-of-state companies, and the federal deposit caps apply only to initial entry acquisitions.
Limits on Rates Paid on Deposits and Brokered Deposits. FDIC regulations limit the ability of insured depository institutions to accept, renew or roll-over deposits by offering rates of interest which are significantly higher than the prevailing rates of interest on deposits offered by other insured depository institutions having the same type of charter in such depository institution’s normal market area. Under these regulations, “well capitalized” depository institutions may accept, renew or roll-over such deposits without restriction, “adequately capitalized” depository institutions may accept, renew or roll-over such deposits with a waiver from the FDIC (subject to certain restrictions on payments of rates) and “undercapitalized” depository institutions may not accept, renew, or roll-over such deposits. Definitions of “well capitalized,” “adequately capitalized” and “undercapitalized” are the same as the definitions adopted by federal banking agencies to implement the prompt corrective action provisions discussed above.
| 12 |
| Table of Contents |
Current Expected Credit Loss Accounting Standard. The Financial Accounting Standards Board (“FASB”) has adopted a new accounting standard related to reserving for credit losses. This standard, referred to as Current Expected Credit Loss (or “CECL”), requires FDIC-insured institutions and their holding companies (banking organizations) to recognize credit losses expected over the life of certain financial assets. The Company adopted CECL as of January 1, 2023. Since the adoption of CECL, the allowance for credit losses represents management’s estimate of credit losses for the remaining estimated life of the Bank’s financial assets, including loan receivables and some off-balance sheet credit exposures. Estimating the amount of the allowance for credit losses requires significant judgment and the use of estimates related to historical experience, current conditions, reasonable and supportable forecasts, and the value of collateral on collateral-dependent loans. The loan portfolio also represents the largest asset type on our consolidated balance sheet. Loan losses are charged against the allowance, while recoveries of amounts previously charged off are credited to the allowance. A provision for credit losses is charged to operations based on management’s periodic evaluation of the factors previously mentioned, as well as other pertinent factors.
There are many factors affecting the allowance for credit losses; some are quantitative while others require qualitative judgment. Although management believes its process for determining the allowance adequately considers all the potential factors that could potentially result in credit losses, the process includes subjective elements and is susceptible to significant change. To the extent actual outcomes differ from management estimates, additional provision for credit losses could be required that could adversely affect our earnings or financial position in future periods.
Financial Privacy and Cybersecurity. The federal banking regulators have adopted rules that limit the ability of banks and other financial institutions to disclose non-public information about consumers to non-affiliated third parties. These limitations require disclosure of privacy policies to consumers and, in some circumstances, allow consumers to prevent disclosure of certain personal information to a non-affiliated third party. These regulations affect how consumer information is transmitted through diversified financial companies and conveyed to outside vendors. In addition, consumers may also prevent disclosure of certain information among affiliated companies that is assembled or used to determine eligibility for a product or service, such as that shown on consumer credit reports and asset and income information from applications. Consumers also have the option to direct banks and other financial institutions not to share information about transactions and experiences with affiliated companies for the purpose of marketing products or services.
Under various policy statements, financial institutions should design multiple layers of security controls to establish lines of defense and to ensure that their risk management processes also address the risk posed by compromised customer credentials, including security measures to reliably authenticate customers accessing internet-based services of the financial institution. Additionally, management is expected to maintain sufficient business continuity planning processes to ensure the rapid recovery, resumption, and maintenance of the institution’s operations after a cyber-attack involving destructive malware. A financial institution is also expected to develop appropriate processes to enable recovery of data and business operations and address rebuilding network capabilities and restoring data if the institution or its critical service providers fall victim to this type of cyber-attack. The Company has multiple information security programs that reflect the requirements of this guidance. If, however, we fail to observe the regulatory guidance in the future, we could be subject to various regulatory sanctions, including financial penalties.
In November 2021, the federal banking regulators adopted a regulation that, among other things, requires a banking organization to notify its primary federal regulators as soon as possible and within 36 hours after identifying a “computer-security incident” that the banking organization believes in good faith is reasonably likely to materially disrupt or degrade its business or operations in a manner that would, among other things, jeopardize the viability of its operations, result in customers being unable to access their deposit and other accounts, result in a material loss of revenue, profit or stock price, or pose a threat to the financial stability of the U.S.
In July, 2023, the SEC adopted new cybersecurity disclosure rules for public companies that require disclosure regarding cybersecurity risk management (including the role of the Board in overseeing cybersecurity risks, management’s role and expertise in assessing and managing cybersecurity risks, and processes for assessing, identifying and managing cybersecurity risks) in annual reports. These new cybersecurity disclosure rules also require the disclosure of material cybersecurity incidents in a Form 8-K, generally within four days of determining an incident is material. See Item 1A, “Risk Factors,” and Item 1C, "Cybersecurity," for additional disclosures related to cybersecurity.
| 13 |
| Table of Contents |
In the ordinary course of business, we rely on electronic communications and information systems to conduct our operations and to store sensitive data. We employ an in-depth, layered, defensive approach that leverages people, processes, and technology to manage and maintain cybersecurity controls. We employ a variety of preventative and detective tools to monitor, block, and provide alerts regarding suspicious activity, as well as to report on any suspected advanced persistent threats. Notwithstanding the strength of our defensive measures, the threat from cyber-attacks is severe, attacks are sophisticated and increasing in volume, and attackers respond rapidly to changes in defensive measures. While to date we have not detected a significant compromise, the risks of significant data loss or any material financial losses related to cybersecurity attacks are expected to remain high for the foreseeable future due to the rapidly evolving nature and sophistication of these threats. Additional discussion of our cybersecurity risk management process and strategy are contained in Item 1C. of this Report.
The Bank Secrecy Act (BSA). The BSA requires all financial institutions, including banks and securities broker-dealers, to, among other things, establish a risk-based system of internal controls reasonably designed to prevent money laundering and the financing of terrorism. It includes a variety of recordkeeping and reporting requirements (such as cash and suspicious activity reporting) as well as due diligence/know-your-customer documentation requirements. The Bank has established an anti-money laundering program to comply with the BSA requirements.
The Sarbanes-Oxley Act. The Sarbanes-Oxley Act of 2002 ("SOX") implements a broad range of corporate governance and accounting measures for public companies (including publicly-held bank holding companies such as the Company) designed to promote honesty and transparency in corporate America and better protect investors from the types of corporate wrongdoings that occurred at Enron and WorldCom, among other companies. SOX's principal provisions, many of which have been implemented through regulations released and policies and rules adopted by the securities exchanges in 2003 and 2004, provide for and include, among other things:
|
· |
The creation of an independent accounting oversight board; |
|
· |
Auditor independence provisions which restrict non-audit services that accountants may provide to clients; |
|
· |
Additional corporate governance and responsibility measures, including the requirement that the chief executive officer and chief financial officer of a public company certify financial statements; |
|
· |
The forfeiture of bonuses or other incentive-based compensation and profits from the sale of an issuer's securities by directors and senior officers in the twelve-month period following initial publication of any financial statements that later require restatement; |
|
· |
An increase in the oversight of, and enhancement of certain requirements relating to, audit committees of public companies and how they interact with the public company's independent auditors; |
|
· |
Requirements that audit committee members must be independent and are barred from accepting consulting, advisory or other compensatory fees from the issuer; |
|
· |
Requirements that companies disclose whether at least one member of the audit committee is a 'financial expert' (as such term is defined by the SEC), and if not, why not; |
|
· |
Expanded disclosure requirements for corporate insiders, including accelerated reporting of stock transactions by insiders and a prohibition on insider trading during certain blackout periods; |
|
· |
A prohibition on personal loans to directors and officers, except certain loans made by insured financial institutions, such as the Bank, on non-preferential terms and in compliance with bank regulatory requirements; |
|
· |
Disclosure of a code of ethics and filing a Form 8-K in the event of a change or waiver of such code; and |
|
· |
A range of enhanced penalties for fraud and other violations. |
The Company complies with the provisions of SOX and its underlying regulations. Management believes that such compliance efforts have strengthened the Company's overall corporate governance structure, and does not believe that such compliance has to date had, or will in the future have, a material impact on the Company’s results of operations or financial condition.
Standards for Safety and Soundness. Pursuant to the Federal Deposit Insurance Corporation Improvement Act of 1991 ("FDICIA") the federal bank regulatory agencies have prescribed, by regulation, standards and guidelines for all insured depository institutions and depository institution holding companies relating to: (i) internal controls, information systems and internal audit systems; (ii) loan documentation; (iii) credit underwriting; (iv) interest rate risk exposure; (v) asset growth; and (vi) compensation, fees and benefits. The compensation standards prohibit employment contracts, compensation or benefit arrangements, stock option plans, fee arrangements or other compensatory arrangements that would provide "excessive" compensation, fees or benefits, or that could lead to material financial loss. In addition, the federal bank regulatory agencies are required by FDICIA to prescribe standards specifying: (i) maximum classified assets to capital ratios; (ii) minimum earnings sufficient to absorb losses without impairing capital; and (iii) to the extent feasible, a minimum ratio of market value to book value for publicly-traded shares of depository institutions and depository institution holding companies.
| 14 |
| Table of Contents |
Other. Additional regulations require annual examinations of all insured depository institutions by the appropriate federal banking agency and establish operational and managerial, asset quality, earnings and stock valuation standards for insured depository institutions, as well as compensation standards.
The Bank is subject to examination by the FDIC and the Commissioner. In addition, the Bank is subject to various other state and federal laws and regulations, including state usury laws, laws relating to fiduciaries, consumer credit, equal credit and fair credit reporting laws and laws relating to branch banking. The Bank, as an insured North Carolina commercial bank, is prohibited from engaging as a principal in activities that are not permitted for national banks, unless (i) the FDIC determines that the activity would pose no significant risk to the appropriate deposit insurance fund and (ii) the Bank is, and continues to be, in compliance with all applicable capital standards.
Future Requirements. Statutes and regulations, which contain wide-ranging proposals for altering the structures, regulations and competitive relationships of financial institutions, are introduced regularly. Neither the Company nor the Bank can predict whether or what form any proposed statute or regulation will be adopted or the extent to which the business of the Company or the Bank may be affected by such statute or regulation.
Available Information
The Company makes its Annual Report on Form 10-K, Quarterly Reports on Form 10-Q, Current Reports on Form 8-K and amendments to those reports available free of charge on its internet website www.peoplesbanknc.com as soon as reasonably practicable after the reports are electronically filed with the SEC. The Company’s Annual Report on Form 10-K and Quarterly Reports on Form 10-Q are also available on its internet website in interactive data format using the eXtensible Business Reporting Language (XBRL), which allows financial statement information to be downloaded directly into spreadsheets, analyzed in a variety of ways using commercial off-the-shelf software and used within investment models in other software formats. The SEC maintains an Internet site that contains reports, proxy information, statements and other information filed by the Company with the SEC electronically. These filings are also accessible on the SEC’s website at https://www.sec.gov.
The Company maintains an internet website at www.peoplesbanknc.com. The Company’s corporate governance policies, including the charters of the Audit and Enterprise Risk, Compensation, and Governance Committees, and the Code of Business Conduct and Ethics may be found on the Company’s website. A written copy of the foregoing corporate governance policies is available upon written request to the Company. Information included on the Company’s website is not incorporated by reference into this Annual Report.
ITEM 1A. RISK FACTORS
The risks and uncertainties described below are not the only ones the Company faces. Additional risks and uncertainties that we are unaware of, or that we currently deem immaterial, also may become important factors that affect us and our business. If any of these risks were to materialize, our business, financial condition or results of operations could be materially and adversely affected.
RISK FACTORS RELATED TO OUR BUSINESS
Unfavorable economic conditions could adversely affect our business.
Our business is subject to periodic fluctuations based on national, regional and local economic conditions. These fluctuations are not predictable, cannot be controlled, and may have a material adverse impact on our operationsand financial condition. Our banking operations are primarily locally oriented and community-based. Our retail and commercial banking activities are primarily concentrated within the same geographic footprint. Our market is primarily based in the Catawba Valley region of North Carolina and surrounding communities. Adverse economic conditions within our markets could have a material adverse effect on our financial condition, results of operations and cash flows. Accordingly, we expect to continue to be dependent upon local business conditions as well as conditions in the local residential and commercial real estate markets we serve. Unfavorable changes in unemployment, real estate values, interest rates, inflation and other factors could weaken the economies of the communities we serve. Weakness in any of our market areas could have an adverse impact on our earnings, and consequently our financial condition and capital adequacy.
| 15 |
| Table of Contents |
Inflation can have an adverse impact on our customers and their ability to repay.
Inflation risk is the risk that the value of assets or income from investments will be worth less in the future as inflation decreases the value of money. In recent years, there has been a pronounced rise in inflation and, until recently, the Federal Reserve has responded by raising certain benchmark interest rates in an effort to combat this trend. Our customers may also be affected by inflation and the rising costs of goods and services used in their households and businesses, which could have a negative impact on their ability to repay their loans with us.
Recessionary conditions could result in increases in our level of nonperforming loans and/or reduce demand for our products and services, which would lead to lower revenue, higher loan losses and lower earnings.
Recessionary conditions and/or negative developments in the domestic and international credit markets may significantly affect the markets in which we do business, the value of our loans and investments, and our ongoing operations, costs and profitability. Declines in real estate values and sales volumes and increased unemployment levels may result in higher than expected loan delinquencies, increases in our levels of nonperforming and classified assets and a decline in demand for our products and services. These negative events may cause us to incur losses and may adversely affect our capital, liquidity, and financial condition.
We are subject to credit risk and may incur losses if loans are not repaid.
There are inherent risks associated with our lending activities. These risks include, among other things, the impact of changes in interest rates and changes in the economic conditions in the markets where we operate as well as those across the United States and abroad. Increases in interest rates and/or negative economic conditions could adversely impact the ability of borrowers to repay outstanding loans and the value of the collateral securing these loans. We seek to mitigate the risks inherent in our loan portfolio by adhering to specific underwriting practices. Although we believe that our underwriting criteria are appropriate for the various kinds of loans we make, we may incur losses on loans that meet our underwriting criteria, and these losses may exceed the amounts set aside as reserves in our allowance for credit losses.
Our loan portfolio includes loans with a higher risk of loss.
We originate commercial real estate loans, commercial loans, construction and land development loans, and residential mortgage loans primarily within our market area. Commercial real estate, commercial, and construction and land development loans tend to involve larger loan balances to a single borrower or groups of related borrowers and are most susceptible to a risk of loss during a downturn in the business cycle. These loans also have historically had greater credit risk than other loans for the following reasons:
· |
Commercial Real Estate Loans. Repayment is dependent on income being generated in amounts sufficient to cover operating expenses and debt service. These loans also involve greater risk because they are generally not fully amortizing over the loan period, but rather have a balloon payment due at maturity. A borrower’s ability to make a balloon payment typically will depend on being able to either refinance the loan or timely sell the underlying property. |
|
|
· |
Commercial Loans. Repayment is generally dependent upon the successful operation of the borrower’s business. In addition, the collateral securing the loans may depreciate over time, be difficult to appraise, be illiquid, or fluctuate in value based on the success of the business. |
|
|
· |
Construction and land development loans. The risk of loss is largely dependent on the initial estimate of whether the property’s value at completion equals or exceeds the cost of property construction and the availability of take-out financing. During the construction phase, a number of factors can result in delays or cost overruns. If the estimate is inaccurate or if actual construction costs exceed estimates, the value of the property securing the loan may be insufficient to ensure full repayment when completed through a permanent loan, sale of the property, or by seizure of collateral. |
|
|
· |
Single-family residential loans. Declining home sales volumes, decreased real estate values and higher than normal levels of unemployment could contribute to losses on these loans. |
| 16 |
| Table of Contents |
A significant amount of the Bank’s business is concentrated in lending which is secured by property located in the Catawba Valley and surrounding areas.
In addition to the financial strength and cash flow characteristics of the borrower in each case, the Bank often secures its loans with real estate collateral. The real estate collateral in each case provides an alternate source of repayment in the event of default by the borrower and may deteriorate in value during the time the credit is extended. If the Bank is required to liquidate the collateral securing a loan during a period of reduced real estate values to satisfy the debt, the Bank’s earnings and capital could be adversely affected.
Additionally, with most of the Bank’s loans concentrated in the Catawba Valley and surrounding areas, a decline in local economic conditions could adversely affect the values of the Bank’s real estate collateral. Consequently, a decline in local economic conditions may have a greater effect on the Bank’s earnings and capital than on the earnings and capital of larger financial institutions whose real estate loan portfolios are more geographically diverse.
Our use of appraisals in deciding whether to make a loan on or secured by real property does not ensure the value of the real property collateral.
In considering whether to make a loan secured by real property, we typically require an appraisal of the property. However, an appraisal is only an estimate of the value of the property at the time the appraisal is made. If the appraisal does not reflect the amount that may be obtained upon any sale or foreclosure of the property, we may not realize an amount equal to the indebtedness secured by the property.
Our allowance for credit losses may be insufficient and could therefore reduce earnings.
The risk of credit losses on loans varies with, among other things, general economic conditions, the creditworthiness of the borrower over the term of the loan and, in the case of a collateralized loan, the value and marketability of the collateral for the loan. Management maintains an allowance for credit losses based upon, among other things, historical experience, an evaluation of economic conditions and regular reviews of delinquencies and loan portfolio quality. Management believes it has established the allowance in accordance with U.S. Generally Accepted Accounting Principles (“GAAP”) and in consideration of the current economic environment. Although management uses the best information available to make evaluations, significant future additions to the allowance may be necessary based on changes in economic and other conditions, thus adversely affecting the operating results of the Company. If management’s assumptions and judgments prove to be incorrect and the allowance for credit losses is inadequate to absorb future losses, or if the bank regulatory authorities require the Bank to increase the allowance for credit losses as a part of their examination process, the Bank’s earnings and capital could be significantly and adversely affected. For further discussion related to our process for determining the appropriate level of the allowance for credit losses, see “Allowance for Credit Losses” within “Item 7. Management’s Discussion and Analysis of Financial Condition and Results and Operation” of the Annual Report, which is included in this Form 10-K as Exhibit (13).
If our non-performing assets increase, our earnings will suffer.
Our non-performing assets adversely affect our net income in various ways. We do not record interest income on non-accrual loans or real estate owned. We must reserve for probable losses, which is established through a current period charge to the provision for loan losses as well as from time to time, as appropriate, the write down of the value of properties in our other real estate owned portfolio to reflect changing market values. Additionally, there are legal fees associated with the resolution of problem assets as well as carrying costs such as taxes, insurance and maintenance related to our other real estate owned. Further, the resolution of non-performing assets requires the active involvement of management, which can distract them from more profitable activity. Finally, if our estimate for the recorded allowance for credit losses proves to be incorrect and our allowance is inadequate, we will have to increase the allowance accordingly.
Changes in interest rates affect profitability and assets.
Changes in prevailing interest rates may hurt the Bank’s business. The Bank derives its income primarily from the difference or “spread” between the interest earned on loans, securities and other interest-earning assets, and interest paid on deposits, borrowings and other interest-bearing liabilities. In general, the larger the spread, the more the Bank earns. When market rates of interest change, and in particular during periods of rapid rate movements as experienced in 2022 and 2023, the interest the Bank receives on its assets and the interest the Bank pays on its liabilities will fluctuate. This can cause decreases in the “spread” and can adversely affect the Bank’s income. Changes in market interest rates could reduce the value of the Bank’s financial assets. Fixed-rate investments, mortgage-backed and related securities and mortgage loans generally decrease in value as interest rates rise. In addition, interest rates affect how much money the Bank lends. For example, when interest rates rise, the cost of borrowing increases and the loan originations tend to decrease. If the Bank is unsuccessful in managing the effects of changes in interest rates, the financial condition and results of operations could suffer.
| 17 |
| Table of Contents |
A small number of large deposit relationships provide a significant level of funding for the Bank.
The Bank’s two largest deposit relationships, amounted to $117.0 million at December 31, 2024. These balances represent 7.88% of total deposits at December 31, 2024. Withdrawals of deposits by any one of our largest depositors could force us to rely more heavily on borrowings and other sources of funding for our business and withdrawal demands, adversely affecting our net interest margin and results of operations. We may also be forced, as a result of any withdrawal of deposits, to rely more heavily on other, potentially more expensive and less stable funding sources. Consequently, the occurrence of any of these events could have a material adverse effect on our business, results of operations, financial condition and future prospects.
We may not be able to retain or grow our deposit base, which could adversely impact our funding costs.
Like many financial institutions, the Bank relies on customer deposits as its primary source of funding for its lending activities, and the Bank continues to seek customer deposits to maintain this funding base. The Bank’s future growth will largely depend on its ability to retain and grow its deposit base. As of December 31, 2024, the Bank had $1.48 billion in deposits. The Bank’s deposits are subject to potentially dramatic fluctuations in availability or price due to certain factors outside of its control, such as increasing competitive pressures for deposits, changes in interest rates and returns on other investment classes, customer perceptions of its financial health and general reputation, and a loss of confidence by customers in the Bank or the banking sector generally, which could result in significant outflows of deposits within short periods of time or significant changes in pricing necessary to maintain current customer deposits or attract additional deposits. The availability of deposits can also be impacted by regulatory changes (e.g., changes in FDIC insurance, the liquidity coverage ratio, etc.), changes in the financial condition of the Bank, or the banking industry in general, and other events which can impact the perceived safety and soundness or economic benefits of bank deposits. Any loss by the Bank of its deposit base could limit its lending ability resulting in lower loan originations, which could have a material adverse effect on the Bank’s business, financial condition and results of operations.
Increases in FDIC insurance premiums may adversely affect our net income and profitability.
The Company is generally unable to control the amount of premiums that the Bank is required to pay for FDIC insurance. If there are bank or financial institution failures that exceed the FDIC’s expectations, the Bank may be required to pay higher FDIC premiums than those currently in force. Any future increases or required prepayments of FDIC insurance premiums may adversely impact the Company’s earnings and financial condition.
Cybersecurity incidents could disrupt business operations, result in the loss of critical and confidential information, and adversely impact our reputation and results of operations.
Global cybersecurity threats and incidents can range from uncoordinated individual attempts to gain unauthorized access to information technology (IT) systems to sophisticated and targeted measures known as advanced persistent threats, directed at the Company and/or its third-party service providers. While we have experienced, and expect to continue to experience, these types of threats and incidents, none of them to date have been material to the Company. Although we employ comprehensive measures to prevent, detect, address and mitigate these threats (including access controls, employee training, data encryption, vulnerability assessments, continuous monitoring of our IT networks and systems and maintenance of backup and protective systems), cybersecurity incidents, depending on their nature and scope, could potentially result in the misappropriation, destruction, corruption or unavailability of critical data and confidential or proprietary information (our own or that of third parties) and the disruption of business operations. The potential consequences of a material cybersecurity incident include reputational damage, litigation with third parties and increased cybersecurity protection and remediation costs, which in turn could materially adversely affect our results of operations.
| 18 |
| Table of Contents |
Our business continuity plans or data security systems could prove to be inadequate, resulting in a material interruption in, or disruption to, our business and a negative impact on our results of operations.
We rely heavily on communications and information systems to conduct our business. Our daily operations depend on the operational effectiveness of our technology. We rely on our systems to accurately track and record our assets and liabilities. Any failure, interruption or breach in security of our computer systems or outside technology, whether due to severe weather, natural disasters, acts of war or terrorism, criminal activity, cyberattacks or other factors, could result in failures or disruptions in general ledger, deposit, loan, customer relationship management, and other systems leading to inaccurate financial records. This could materially affect our business operations and financial condition.
While we have disaster recovery and other policies and procedures designed to prevent or limit the effect of any failure, interruption or security breach of our information systems, there can be no assurance that any such failures, interruptions, or security breaches will not occur or, if they do occur, that they will be adequately addressed. The occurrence of any failures, interruptions or security breaches of our information systems could damage our reputation, result in a loss of customer business, subject us to additional regulatory scrutiny, or expose us to civil litigation and possible financial liability, any of which could have a material adverse effect on our results of operations.
In addition, the Bank provides its customers the ability to bank online and through mobile banking. The secure transmission of confidential information over the Internet is a critical element of online and mobile banking. While we use qualified third-party vendors to test and audit our network, our network could become vulnerable to unauthorized access, computer viruses, phishing schemes and other security issues. The Bank may be required to spend significant capital and other resources to alleviate problems caused by security breaches or computer viruses.
To the extent that the Bank’s activities or the activities of its customers involve the storage and transmission of confidential information, security breaches and viruses could expose the Bank to claims, litigation, and other potential liabilities. Any inability to prevent security breaches or computer viruses could also cause existing customers to lose confidence in the Bank’s systems and could adversely affect its reputation and its ability to generate deposits.
Additionally, we outsource the processing of transactional activity, as well as other systems such as online banking, to third party vendors. Prior to establishing an outsourcing relationship, and on an ongoing basis thereafter, management monitors key vendor controls and procedures related to information technology, which includes reviewing reports of service auditor’s examinations. If our third-party provider encounters difficulties or if we have difficulty in communicating with such third party, it will significantly affect our ability to adequately process and account for customer transactions, which would significantly affect our business operations.
In the normal course of business, we process large volumes of transactions involving millions of dollars. If our internal controls fail to work as expected, if our systems are used in an unauthorized manner, or if our employees subvert our internal controls, we could experience significant losses.
We process large volumes of transactions on a daily basis involving millions of dollars and are exposed to numerous types of operational risk. Operational risk includes the risk of fraud by persons inside or outside the Company, the execution of unauthorized transactions by employees, errors relating to transaction processing and systems and breaches of the internal control system and compliance requirements. This risk also includes potential legal actions that could arise as a result of an operational deficiency or as a result of noncompliance with applicable regulatory standards.
We establish and maintain systems of internal operational controls that provide us with timely and accurate information about our level of operational risk. Although not foolproof, these systems have been designed to manage operational risk at appropriate, cost-effective levels. Procedures exist that are designed to ensure that policies relating to conduct, ethics, and business practices are followed. From time to time, losses from operational risk may occur, including the effects of operational errors. We continually monitor and improve our internal controls, data processing systems, and corporate-wide processes and procedures, but there can be no assurance that future losses will not occur.
Financial services companies depend on the accuracy and completeness of information about customers and counterparties.
In deciding whether to extend credit or enter into other transactions, we may rely on information furnished by or on behalf of customers and counterparties, including financial statements, credit reports, and other financial information. We may also rely on representations of those customers, counterparties, or other third parties, such as independent auditors, as to the accuracy and completeness of that information. Reliance on inaccurate or misleading financial statements, financial advisors and consultants, credit reports, or other financial information could cause us to enter into unfavorable transactions, which could have a material adverse effect on our financial condition and results of operations.
| 19 |
| Table of Contents |
We are subject to extensive regulation, which could have an adverse effect on our operations.
The Company and the Bank are subject to extensive regulation and supervision from the Commissioner, the FDIC and the Federal Reserve. This regulation and supervision is intended primarily to enhance the safe and sound operation of the Bank and for the protection of the FDIC insurance fund and our depositors and borrowers, rather than for holders of our equity securities. In the past, our business has been materially affected by these regulations. This trend is likely to continue in the future.
Regulatory authorities have extensive discretion in their supervisory and enforcement activities, including the imposition of restrictions on operations, the classification of our assets and the determination of the level of allowance for credit losses. Changes in the regulations that apply to us, or changes in our compliance with regulations, could have a material impact on our operations.
We face a risk of noncompliance with the Bank Secrecy Act and other anti-money laundering statutes and regulations and related enforcement actions.
The federal BSA, the USA Patriot Act and other laws and regulations require financial institutions, among other duties, to institute and maintain effective anti-money laundering programs and file suspicious activity and currency transaction reports as appropriate. The Financial Crimes Enforcement Network (“FINCEN”), established by the Treasury to administer the BSA, is authorized to impose significant civil money penalties for violations of those requirements and has recently engaged in coordinated enforcement efforts with the individual federal banking regulators, as well as the U.S. Department of Justice, Drug Enforcement Administration and Internal Revenue Service. There is also increased scrutiny of compliance with the rules enforced by the OFAC. Federal and state bank regulators also have begun to focus on compliance with BSA and AML regulations. If our policies, procedures and systems are deemed deficient or the policies, procedures and systems of the financial institutions that we have already acquired or may acquire in the future are deficient, we would be subject to liability, including fines and regulatory actions such as restrictions on our ability to pay dividends and the necessity to obtain regulatory approvals to proceed with certain aspects of our business plan, including our acquisition plans, which would negatively impact our business, financial condition and results of operations. Failure to maintain and implement adequate programs to combat money laundering and terrorist financing could also have serious reputational consequences for us.
We are subject to federal and state fair lending laws, and failure to comply with these laws could lead to material penalties.
Federal and state fair lending laws and regulations, such as the Equal Credit Opportunity Act and the Fair Housing Act, impose nondiscriminatory lending requirements on financial institutions. The Department of Justice, the Consumer Finance Protection Bureau and other federal and state agencies are responsible for enforcing these laws and regulations. Private parties may also have the ability to challenge an institution’s performance under fair lending laws in private class action litigation. A successful challenge to our performance under the fair lending laws and regulations could adversely impact our CRA rating and result in a wide variety of sanctions, including the required payment of damages and civil money penalties, injunctive relief, imposition of restrictions on or delays in approving merger and acquisition activity and restrictions on expansion activity, which could negatively impact our reputation, business, financial condition and results of operations.
Consumers may decide not to use banks to complete their financial transactions.
Technology and other changes are allowing parties to complete financial transactions through alternative methods that historically have involved banks. For example, consumers can now maintain funds that would have historically been held as bank deposits in brokerage accounts, mutual funds or general-purpose reloadable prepaid cards. Consumers can also complete transactions such as paying bills and/or transferring funds directly without the assistance of banks. The process of eliminating banks as intermediaries, known as “disintermediation,” could result in the loss of fee income, as well as the loss of customer deposits and the related income generated from those deposits. The loss of these revenue streams and the lower cost of deposits as a source of funds could have a material adverse effect on our financial condition and results of operations.
| 20 |
| Table of Contents |
The soundness of other financial institutions could adversely affect us.
Our ability to engage in routine funding transactions could be adversely affected by the actions and commercial soundness of other financial institutions. Financial services companies are interrelated as a result of trading, clearing, counterparty or other relationships. We have exposure to many different industries and counterparties, and we routinely execute transactions with counterparties in the financial services industry, including brokers and dealers, commercial banks, and investment banks. Defaults by, or even rumors or questions about, one or more financial services companies, or the financial services industry generally, have led to market-wide liquidity problems and could lead to losses or defaults by us or by other institutions. We can make no assurance that any such losses would not materially and adversely affect our business, financial condition or results of operations.
Liquidity risk could impair our ability to fund operations and jeopardize our financial condition.
Liquidity is essential to our business. We rely on a number of different sources in order to meet our potential liquidity demands. Our primary sources of liquidity are increases in deposit accounts, cash flows from loan payments and our securities portfolio. Borrowings also provide us with a source of funds to meet liquidity demands. An inability to raise funds through deposits, borrowings, the sale of loans and other sources could have a substantial negative effect on our liquidity.
Our access to funding sources in amounts adequate to finance our activities or on terms which are acceptable to us could be impaired by factors that affect us specifically, or the financial services industry or economy in general. Factors that could detrimentally impact our access to liquidity sources include adverse regulatory action against us or a decrease in the level of our business activity as a result of a downturn in the markets in which our loans are concentrated. Our ability to borrow could also be impaired by factors that are not specific to us, such as a disruption in the financial markets or negative views and expectations about the prospects for the financial services industry in light of the recent turmoil faced by banking organizations or deterioration in credit markets.
Risks related to decline in value of investment securities portfolio.
At December 31, 2024, unrealized losses in our available for sale investment securities portfolio totaled $51.1 million. These unrealized losses arose due to changing interest rates and are considered to be temporary; however, in the event that we sell these securities while they are in an unrealized loss position, we will recognize a corresponding loss, which could have a material adverse effect on our earnings and financial condition.
We could experience losses due to competition with other financial institutions.
We face substantial competition in all areas of our operations from a variety of different competitors, both within and beyond our principal markets, many of which are larger and may have more financial resources. Such competitors primarily include national, regional and internet banks within the various markets in which we operate. We also face competition from many other types of financial institutions, including, without limitation, thrifts, credit unions, finance companies, brokerage firms, insurance companies and other financial intermediaries, such as online lenders and banks. The financial services industry could become even more competitive as a result of legislative and regulatory changes and continued consolidation. In addition, as customer preferences and expectations continue to evolve, technology has lowered barriers to entry and made it possible for nonbanks to offer products and services traditionally provided by banks, such as automatic transfer and automatic payment systems. Banks, securities firms and insurance companies can merge under the umbrella of a financial holding company, which can offer virtually any type of financial service, including banking, securities underwriting, insurance (both agency and underwriting) and merchant banking. Many of our competitors have fewer regulatory constraints and may have lower cost structures. Additionally, due to their size, many competitors may be able to achieve economies of scale and, as a result, may offer a broader range of products and services as well as better pricing for those products and services than we can.
Our ability to compete successfully depends on a number of factors, including, among other things:
· |
the ability to develop, maintain, and build upon long-term customer relationships based on top quality service, high ethical standards, and safe, sound assets; |
· |
the ability to expand our market position; |
· |
the scope, relevance, and pricing of products and services offered to meet customer needs and demands; |
· |
the rate at which we introduce new products and services relative to our competitors; |
· |
customer satisfaction with our level of service; and |
· |
industry and general economic trends. |
| 21 |
| Table of Contents |
Failure to perform in any of these areas could significantly weaken our competitive position, which could adversely affect our growth and profitability, which, in turn, could have a material adverse effect on our financial condition and results of operations.
Failure to keep pace with technological change could adversely affect our business.
The financial services industry is continually undergoing rapid technological change with frequent introductions of new technology-driven products and services. The effective use of technology increases efficiency and enables financial institutions to better serve customers and to reduce costs. Our future success depends, in part, upon our ability to address the needs of our customers by using technology to provide products and services that will satisfy customer demands, as well as to create additional efficiencies in our operations. Many of our competitors have substantially greater resources to invest in technological improvements. We may not be able to effectively implement new technology-driven products and services or be successful in marketing these products and services to our customers. Failure to successfully keep pace with technological change affecting the financial services industry could have a material adverse impact on our business and, in turn, our financial condition and results of operations.
We rely on other companies to provide key components of our business infrastructure.
Third party vendors provide key components of our business infrastructure such as internet connections, network access and core application processing. While we have selected these third-party vendors carefully, we do not control their actions. Any problems caused by these third parties, including as a result of their not providing us their services for any reason or their performing their services poorly, could adversely affect our ability to deliver products and services to our customers and otherwise to conduct our business and could negatively impact our reputation. Replacing these third-party vendors could also entail significant delay and expense.
Negative publicity could damage our reputation.
Reputation risk, or the risk to our earnings and capital from negative public opinion, is inherent in our business. Negative public opinion could adversely affect our ability to keep and attract customers and expose us to adverse legal and regulatory consequences. Negative public opinion could result from our actual or alleged conduct in any number of activities, including lending practices, corporate governance, regulatory compliance, mergers and acquisitions, and disclosure, sharing or inadequate protection of customer information, and from actions taken by government regulators and community organizations in response to that conduct. Our reputation could also be adversely impacted by negative public opinion regarding the financial services industry in general.
Loss of key personnel could adversely impact results.
The success of the Bank has been and will continue to be greatly influenced by the ability to retain the services of existing senior management. The unexpected loss of the services of any of the key management personnel, or the inability to recruit and retain qualified personnel in the future, could have an adverse impact on the business and financial results of the Bank.
We may be subject to examinations by taxing authorities which could adversely affect our results of operations.
In the normal course of business, we may be subject to examinations from federal and state taxing authorities regarding the amount of taxes due in connection with investments we have made and the businesses in which we are engaged. Recently, federal and state taxing authorities have become increasingly aggressive in challenging tax positions taken by financial institutions. The challenges made by taxing authorities may result in adjustments to the timing or amount of taxable income or deductions or the allocation of income among tax jurisdictions. If any such challenges are made and are not resolved in our favor, they could have an adverse effect on our financial condition and results of operations.
Changes in our accounting policies or in accounting standards could materially affect how we report our financial results and condition.
Our accounting policies are fundamental to understanding our financial results and condition. Some of these policies require use of estimates and assumptions that may affect the value of our assets or liabilities and financial results. Some of our accounting policies are critical because they require management to make difficult, subjective and complex judgments about matters that are inherently uncertain and because it is likely that materially different amounts would be reported under different conditions or using different assumptions.
| 22 |
| Table of Contents |
From time to time the FASB and the SEC change the financial accounting and reporting standards or the interpretation of those standards that govern the preparation of our external financial statements. These changes are beyond our control, can be hard to predict and could materially impact how we report our results of operations and financial condition. We could be required to apply a new or revised standard retroactively, resulting in our restating prior period financial statements in material amounts.
Our internal controls may be ineffective.
Management regularly reviews and updates our internal controls, disclosure controls and procedures, and corporate governance policies and procedures. Any system of controls, however well designed and operated, is based in part on certain assumptions and can provide only reasonable, not absolute, assurances that the objectives of the system are met. Any failure or circumvention of our controls and procedures or failure to comply with regulations related to controls and procedures could have a material adverse effect on our business, results of operations, and financial condition.
Credit losses on investment securities or inability to realize deferred tax assets could require charges to earnings, which could result in a negative impact on our results of operations.
In assessing the impairment of investment securities, management considers the extent to which the fair value has been less than cost, the financial condition and near-term prospects of the issues, and the intent and ability of the Company to retain its investment in the issuer for a period of time sufficient to allow for any anticipated recovery of fair value in the near term. In assessing the future ability of the Company to realize the deferred tax assets, management considers whether it is more likely than not that some portion or all of the deferred tax assets will not be realized. The ultimate realization of deferred tax assets is dependent upon the generation of future taxable income during the periods in which those temporary differences become deductible. The impact of each of these impairment matters could have a material adverse effect on our business, results of operations, and financial condition.
Because we engage in lending secured by real estate and may be forced to foreclose on the collateral property and own the underlying real estate, we may be subject to the increased costs associated with the ownership of real property, which could result in reduced net income.
Since we originate loans secured by real estate, we may have to foreclose on the collateral property to protect our investment and may thereafter own and operate such property, in which case we are exposed to the risks inherent in the ownership of real estate. The amount that we, as a mortgagee, may realize after a default is dependent upon factors outside of our control, including, but not limited to:
· |
general or local economic conditions; |
· |
environmental cleanup liability; |
· |
neighborhood values; |
· |
interest rates; |
· |
real estate tax rates; |
· |
operating expenses of the mortgaged properties; |
· |
supply of and demand for rental units or properties; |
· |
ability to obtain and maintain adequate occupancy of the properties; |
· |
zoning laws; |
· |
governmental rules, regulations and fiscal policies; and |
· |
acts of God. |
Certain expenditures associated with the ownership of real estate, principally real estate taxes and maintenance costs, may adversely affect the income from the real estate. Therefore, the cost of operating real property may exceed the rental income earned from such property, and we may have to advance funds in order to protect our investment or we may be required to dispose of the real property at a loss.
We are subject to losses due to errors, omissions or fraudulent behavior by our employees, clients, counterparties or other third parties.
We are exposed to many types of operational risk, including the risk of fraud by employees and third parties, clerical recordkeeping errors and transactional errors. Our business is dependent on our employees as well as third-party service providers to process a large number of increasingly complex transactions. We could be materially and adversely affected if employees, clients, counterparties or other third parties caused an operational breakdown or failure, either as a result of human error, fraudulent manipulation or purposeful damage to any of our operations or systems.
| 23 |
| Table of Contents |
In deciding whether to extend credit or to enter into other transactions with clients and counterparties, we may rely on information furnished to us by or on behalf of clients and counterparties, including financial statements and other financial information, which we do not independently verify. We also may rely on representations of clients and counterparties as to the accuracy and completeness of that information and, with respect to financial statements, on reports of independent auditors. For example, in deciding whether to extend credit to a client, we may assume that the client’s audited financial statements conform with GAAP and present fairly, in all material respects, the financial condition, results of operations and cash flows of the client. Our financial condition and results of operations could be negatively affected to the extent we rely on financial statements that do not comply with GAAP or are materially misleading, any of which could be caused by errors, omissions, or fraudulent behavior by our employees, clients, counterparties, or other third parties.
Our articles of incorporation and bylaws, and certain banking laws may have an anti-takeover effect.
Provisions of our articles of incorporation and bylaws, and federal banking laws, including regulatory approval requirements, could make it more difficult for a third party to acquire us, even if doing so would be perceived to be beneficial to our shareholders. The combination of these provisions may prohibit a non-negotiated merger or other business combination, which, in turn, could adversely affect the market price of our common stock.
RISKS RELATED TO THE COMPANY’S STOCK
Our stock price can be volatile.
Stock price volatility may make it more difficult for you to resell your common stock when you want and at prices you find attractive. Our stock price can fluctuate significantly in response to a variety of factors including the risk factors discussed elsewhere in this report that are outside of our control and which may occur regardless of our operating results.
Future sales of our stock by our shareholders or the perception that those sales could occur may cause our stock price to decline.
Although our common stock is listed for trading in The NASDAQ Global Select Market under the symbol “PEBK”, the trading volume in our common stock is lower than that of other larger financial services companies. A public trading market having the desired characteristics of depth, liquidity and orderliness depends on the presence in the marketplace of willing buyers and sellers of our common stock at any given time. This presence depends on the individual decisions of investors and general economic and market conditions over which we have no control. Given the relatively low trading volume of our common stock, significant sales of our common stock in the public market, or the perception that those sales may occur, could cause the trading price of our common stock to decline or to be lower than it otherwise might be in the absence of those sales or perceptions.
Our common stock is not FDIC insured.
The Company’s common stock is not a savings or deposit account or other obligation of any bank and is not insured by the FDIC or any other governmental agency and is subject to investment risk, including the possible loss of principal. Investment in our common stock is inherently risky for the reasons described in this “Risk Factors” section and elsewhere in this report and is subject to the same market forces that affect the price of common stock in any company. As a result, holders of our common stock may lose some or all of their investment.
We may reduce or eliminate dividends on our common stock.
Although we have historically paid a quarterly cash dividend to the holders of our common stock, holders of our common stock are not entitled to receive dividends. Downturns in the domestic and global economies could cause our Board of Directors to consider, among other things, reducing or eliminating dividends paid on our common stock. This could adversely affect the market price of our common stock. Furthermore, as a bank holding company, our ability to pay dividends is subject to the guidelines of the Federal Reserve regarding capital adequacy and dividends before declaring or paying any dividends. Dividends also may be limited as a result of safety and soundness considerations.
| 24 |
| Table of Contents |
We may need additional access to capital, which we may be unable to obtain on attractive terms or at all.
We may need to incur additional debt or equity financing in the future to make strategic acquisitions or investments, for future growth or to fund losses or additional provision for loan losses in the future. Our ability to raise additional capital, if needed, will depend in part on conditions in the capital markets at that time, which are outside our control, and on our financial performance. Accordingly, we may be unable to raise additional capital, if and when needed, on terms acceptable to it, or at all. If we cannot raise additional capital when needed, our ability to further expand our operations through internal growth and acquisitions could be materially impaired and our stock price negatively affected.
ITEM 1B. UNRESOLVED STAFF COMMENTS
Not applicable.
ITEM 1C. CYBERSECURITY
Risk Management and Strategy
Our risk management program is designed to identify, assess, and mitigate risks across various aspects of the Company, including financial, operational, regulatory, reputational, and legal. Cybersecurity is a critical component of this program, given the increasing reliance on technology and potential of cyber threats. Our Director of Technology, is primarily responsible for this cybersecurity component and is a key member of Bank management, reporting directly to the Chief Operations Officer and, as discussed below, periodically to the Bank Board.
Our objective for managing cybersecurity risk is to avoid or minimize the impacts of external threat events or other efforts to penetrate, disrupt or misuse our systems or information. The structure of our cybersecurity program is designed around the MITRE Adversarial Tactics, Techniques and Common Knowledge (“ATT&CK”) Framework, regulatory guidance, and other industry standards. In addition, we leverage certain industry and government associations, third-party benchmarking, audits, and threat intelligence to facilitate and promote program effectiveness. Our Director of Technology, Information Security Officer, Chief Operations Officer and key members of their teams collaborate with peer banks and industry groups to review cybersecurity trends and issues and identify best practices. The information security program is periodically reviewed by such personnel with the goal of addressing changing threats and conditions.
We leverage people, processes, and technology as part of our efforts to manage and maintain cybersecurity controls. We employ a variety of preventative and detective tools designed to monitor, block, and provide alerts regarding suspicious activity, as well as to report on suspected advanced persistent threats. We have established processes and systems designed to mitigate cyber risk, including regular and on-going education and training for employees, preparedness simulations and tabletop exercises, and recovery and resilience tests. We provide regular updates across the Company to highlight recent examples of risks as they are identified. We engage in regular assessments of our infrastructure, software systems, and network architecture, using internal cybersecurity experts and third-party specialists. We maintain a third-party risk management program designed to identify, assess, and manage risks, including cybersecurity risks, associated with external service providers and our supply chain. We actively monitor our email gateways for malicious phishing email campaigns and monitor remote connections.
We maintain an Incident Response Plan that provides a documented framework for responding to actual or potential cybersecurity incidents, including timely notification of and escalation to the appropriate management committees and Bank Board. The Incident Response Plan is coordinated through the Chief Operations Officer, and key members of management are embedded into the Plan by its design. The Incident Response Plan facilitates coordination across multiple parts of our organization and is evaluated at least annually.
Notwithstanding our defensive measures and processes, the threat posed by cyber-attacks is severe. Our internal systems, processes, and controls are designed to mitigate loss from cyber-attacks. At this time, we have not identified risks from known cybersecurity threats, including as a result of any prior cybersecurity incidents, that have materially affected us, including our operations, business strategy, results of operations, or financial condition. For further discussion of risks from cybersecurity threats, see the section captioned “Cybersecurity incidents could disrupt business operations, result in the loss of critical and confidential information, and adversely impact our reputation and results of operations” and “Our business continuity plans or data security systems could prove to be inadequate, resulting in a material interruption in, or disruption to, our business and a negative impact on our results of operations” in Item 1A. Risk Factors.
| 25 |
| Table of Contents |
Governance
Our Chief Operations Officer and Information Security Officer, along with their departments, are accountable for managing our enterprise information security and delivering our information security program. Their responsibilities include cybersecurity risk assessment, defense operations, incident response, vulnerability assessment, threat intelligence, identity access governance, third-party risk management, and business resilience. Certain individuals within their departments are generally subject to professional education and certification requirements. In particular, our Information Security Officer and Director of Technology have relevant expertise in the areas of information security and cybersecurity risk management.
The Bank’s Technology Steering Committee provides oversight and governance of the Bank’s technology program and the information security program. Members of this committee include executive management, our Information Security Officer and Director of Technology. This committee meets monthly to provide oversight of the risk management strategy, standards, policies, practices, controls, and mitigation and prevention efforts employed to manage security risks. The Chief Operations Officer regularly reports summaries of key issues that would include cybersecurity incidents or other related information from the Technology Steering Committee to the Bank Board.
The Bank Board is ultimately responsible for overseeing our information security and technology programs, including management’s actions to identify, assess, mitigate, and remediate or prevent material cybersecurity issues and risks. Our Information Security Officer and Director of Technology provide reports to the Bank Board, at least annually, regarding the information security program and the technology program, key enterprise cybersecurity initiatives, and other matters relating to cybersecurity processes. The Bank Board reviews and approves our information security and technology policies annually.
ITEM 2. PROPERTIES
At December 31, 2024, the Company and the Bank conducted their business from their headquarters office in Newton, North Carolina and the Bank’s 16 branch offices in Lincolnton, Hickory, Newton, Catawba, Conover, Claremont, Maiden, Denver, Triangle, Hiddenite, Charlotte, Huntersville, Mooresville and Raleigh, North Carolina. The Bank also operates loan production offices in Charlotte, Denver, Salisbury and Winston-Salem, North Carolina. The following table sets forth certain information regarding the Bank’s properties at December 31, 2024.
| 26 |
| Table of Contents |
Owned |
|
Leased |
|
Corporate Office 518 West C Street Newton, North Carolina 28658 |
|
1333 2nd Street NE Hickory, North Carolina 28601 |
|
|
|
|
420 West A Street Newton, North Carolina 28658 |
|
6350 South Boulevard Charlotte, North Carolina 28217 |
|
|
|
|
213 1st Street, West Conover, North Carolina 28613 |
|
3752/3754 Highway 16 North Denver, North Carolina 28037 |
|
|
|
|
3261 East Main Street Claremont, North Carolina 28610 |
|
9617 Holly Point Drive Huntersville, NC 28078 |
|
|
|
|
6125 Highway 16 South Denver, North Carolina 28037 |
|
4000 Westchase Boulevard Suite 100 Raleigh, North Carolina 27607 |
|
|
|
|
5153 N.C. Highway 90E Hiddenite, North Carolina 28636 |
|
13840 Ballantyne Corporate Place Suite 150 Charlotte, North Carolina 28277 |
|
|
|
|
200 Island Ford Road Maiden, North Carolina 28650 |
|
118 East Council Street Suite 1 Salisbury, NC 28144 |
|
|
|
|
3310 Springs Road NE Hickory, North Carolina 28601 |
|
380 Knollwood Street Suite D Winston-Salem, NC 27103 |
|
|
|
|
142 South Highway 16 Denver, North Carolina 28037 |
|
615 East 6th Street Suite 118 Charlotte, NC 28202 |
|
|
|
|
106 North Main Street Catawba, North Carolina 28609 |
|
|
|
|
|
|
2050 Catawba Valley Boulevard Hickory, North Carolina 28601 |
|
|
|
|
|
|
163 Plantation Ridge Drive Mooresville, North Carolina 28117 |
|
|
|
|
|
|
1910 East Main Street Lincolnton, North Carolina 28092 |
|
|
ITEM 3. LEGAL PROCEEDINGS
In the opinion of management, the Company is not involved in any material pending legal proceedings other than routine proceedings occurring in the ordinary course of business.
ITEM 4. MINE SAFETY DISCLOSURES
Not applicable.
| 27 |
| Table of Contents |
PART II
ITEM 5. MARKET FOR REGISTRANT'S COMMON EQUITY, RELATED STOCKHOLDER MATTERS AND ISSUER PURCHASES OF EQUITY SECURITIES
The Company’s common stock is listed on the NASDAQ Global Market, under the symbol “PEBK.” Market makers for the Company’s shares include Raymond James Financial, Inc. and Hovde Group, LLC.
The ability of the Company to pay dividends and repurchase shares is largely dependent upon the Company’s receipt of dividends from the Bank. The Bank’s ability to pay dividends is limited. North Carolina commercial banks, such as the Bank, are subject to legal limitations on the amount of dividends they are permitted to pay. Dividends may be paid by the Bank from undivided profits, which are determined by deducting and charging certain items against actual profits, including any contributions to surplus required by North Carolina law. Also, an insured depository institution, such as the Bank, is prohibited from making capital distributions, including the payment of dividends, if, after making such distribution, the institution would become “undercapitalized” (as such term is defined in the applicable law and regulations). For further discussion, see Supervision and Regulation under Item 1 Business.
As of February 28, 2025, the Company had 657 shareholders of record, not including the number of persons or entities whose stock is held in nominee or street name through various brokerage firms or banks.
STOCK PERFORMANCE GRAPH
The following graph compares the Company’s cumulative shareholder return on its common stock with a NASDAQ index and with a southeastern bank index. The graph was prepared by S&P Global Market Intelligence, using data as of December 31, 2024.
COMPARISON OF FIVE-YEAR CUMULATIVE TOTAL RETURNS
Performance Report for
Peoples Bancorp of North Carolina, Inc.
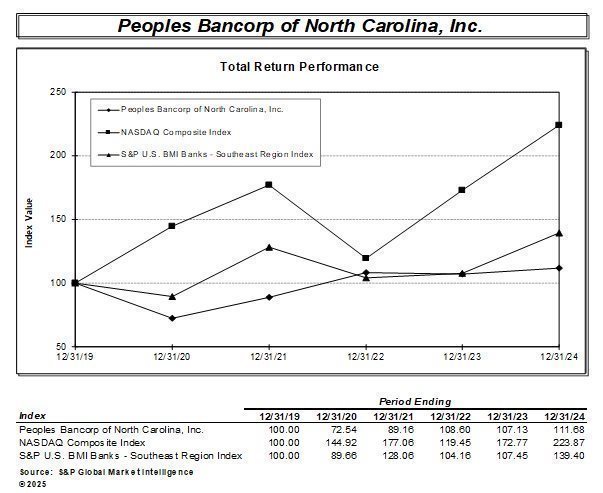
| 28 |
| Table of Contents |
The information required by Item 201(d) concerning securities authorized for issuance under equity compensation plans is set forth in Item 12 hereof.
ISSUER PURCHASES OF EQUITY SECURITIES
|
|
|
|
|
|
|
|
|
|
|
|
|
||||
Period |
|
Total Number of Shares Purchased (1) |
|
|
Average Price Paid per Share |
|
|
Total Number of Shares Purchased as Part of Publicly Announced Plans or Programs (2) |
|
|
Maximum Number (or Approximate Dollar Value) of Shares that May Yet Be Purchased Under the Plans or Programs (3) |
|
||||
|
|
|
|
|
|
|
|
|
|
|
|
|
||||
October 1 - 31, 2024 |
|
|
1,095 |
|
|
$ | 26.03 |
|
|
|
- |
|
|
$ | 2,000,000 |
|
|
|
|
|
|
|
|
|
|
|
|
|
|
|
|
|
|
November 1 - 30, 2024 |
|
|
- |
|
|
$ | - |
|
|
|
- |
|
|
$ | 2,000,000 |
|
|
|
|
|
|
|
|
|
|
|
|
|
|
|
|
|
|
December 1 - 31, 2024 |
|
|
180 |
|
|
$ | 31.93 |
|
|
|
- |
|
|
$ | 2,000,000 |
|
|
|
|
|
|
|
|
|
|
|
|
|
|
|
|
|
|
Total |
|
|
1,275 |
|
|
$ | 26.86 |
|
|
|
- |
|
|
|
|
|
(1) |
The Company purchased 1,275 shares on the open market in the three months ended December 31, 2024 for its deferred compensation plan. All purchases were funded by participant contributions to the plan. |
|
|
(2) |
Reflects shares purchased under the Company's publicly announced stock repurchase program. |
|
|
(3) |
Reflects dollar value of balance available for repurchase at end of period under the Company's stock repurchase program, which was authorized in June 2024. |
ITEM 6. RESERVED
ITEM 7. MANAGEMENT'S DISCUSSION AND ANALYSIS OF FINANCIAL CONDITION AND RESULTS OF OPERATIONS
The information required by this Item is set forth in the section captioned “Management’s Discussion and Analysis of Financial Condition and Results of Operations” on pages A-4 through A-19 of the Annual Report, which section is filed with this Form 10-K as Exhibit (13). The section captioned “Management’s Discussion and Analysis of Financial Condition and Results of Operations” is incorporated herein by reference.
ITEM 7A. QUANTITATIVE AND QUALITATIVE DISCLOSURES ABOUT MARKET RISK
Not applicable
ITEM 8. FINANCIAL STATEMENTS AND SUPPLEMENTARY DATA
The consolidated financial statements of the Company and supplementary data are set forth on pages A-20 through A-63 of the Annual Report, which Annual Report is filed with this Form 10-K as Exhibit (13). The consolidated financial statements of the Company and supplementary data set forth on pages A-20 through A-62 of the Annual Report are incorporated herein by reference.
ITEM 9. CHANGES IN AND DISAGREEMENTS WITH ACCOUNTANTS ON ACCOUNTING AND FINANCIAL DISCLOSURE
Not applicable
| 29 |
| Table of Contents |
ITEM 9A. CONTROLS AND PROCEDURES
Evaluation of Disclosure Controls and Procedures
The Company’s management, under the supervision and with the participation of the Chief Executive Officer and the Chief Financial Officer of the Company, has concluded, based on their evaluation as of the end of the period covered by this Report, that the Company’s disclosure controls and procedures (as defined in Rule 13A-15(e) promulgated under the Exchange Act) are effective to ensure that information required to be disclosed by the Company in the reports filed or submitted by it under the Exchange Act is recorded, processed, summarized and reported within the time periods specified in the applicable rules and forms and include controls and procedures designed to ensure that information required to be disclosed by the Company in such reports is accumulated and communicated to the Company’s management including the Chief Executive Officer and the Chief Financial Officer of the Company as appropriate to allow timely decisions regarding required disclosure.
Changes in Internal Controls over Financial Reporting
There have been no changes in internal control over financial reporting during the quarter ended December 31, 2024 that have materially affected, or are reasonably likely to materially affect, the Company’s internal control over financial reporting.
Management’s Annual Report on Internal Controls over Financial Reporting
The Company’s management is responsible for establishing and maintaining adequate internal control over financial reporting. Internal control over financial reporting is defined in Rule 13a-15(f) promulgated under the Exchange Act. The Company’s internal control over financial reporting is a process designed to provide reasonable assurance regarding the reliability of financial reporting and the preparation of financial statements for external purposes in accordance with accounting principles generally accepted in the United States of America. Internal control over financial reporting includes those policies and procedures that (1) pertain to the maintenance of records that in reasonable detail accurately and fairly reflect the transactions and dispositions of the assets of the company, (2) provide reasonable assurance that transactions are recorded as necessary to permit preparation of financial statements in accordance with accounting principles generally accepted in the United States of America, and that receipts and expenditures of the company are being made only in accordance with authorizations of management and directors of the company and (3) provide reasonable assurance regarding prevention or timely detection of unauthorized acquisition, use or disposition of the company’s assets that could have a material effect on the financial statements.
Because of its inherent limitations, internal control over financial reporting may not prevent or detect misstatements. Projections of any evaluation of effectiveness to future periods are subject to the risk that controls may become inadequate because of changes in conditions, or that the degree of compliance with the policies or procedures may deteriorate.
Management assessed the effectiveness of the Company’s internal control over financial reporting as of December 31, 2024. In making this assessment, management used the criteria established in “Internal Control – Integrated Framework” issued by the Committee of Sponsoring Organizations of the Treadway Commission in 2013. Based on our assessment and those criteria, management believes that the Company maintained effective internal control over financial reporting as of December 31, 2024.
This Annual Report on Form 10-K does not include an attestation report of the Company’s independent registered public accounting firm regarding internal control over financial reporting. As a non-accelerated filer, management’s report was not subject to attestation by the Company’s independent registered public accounting firm.
ITEM 9B. OTHER INFORMATION
Trading Arrangements of Section 16 Reporting Persons.
During the quarter ended December 31, 2024, no person who is required to file reports pursuant to Section 16(a) of the Securities and Exchange Act of 1934, as amended, with respect to holdings of, and transactions in, the Company’s common shares (i.e. directors and certain officers of the Company) maintained, adopted, modified or terminated a “Rule 10b5-1 trading arrangement” or “non-Rule 10b5-1(c) arrangement”, as those terms are defined in Section 229.408 of the regulations of the SEC.
ITEM 9C. DISCLOSURE REGARDING FOREIGN JURISDICTIONS THAT PREVENT INSPECTIONS
Not applicable
| 30 |
| Table of Contents |
PART III
ITEM 10. DIRECTORS AND EXECUTIVE OFFICERS AND CORPORATE GOVERNANCE
The information required by this Item is set forth under the sections captioned “Director Nominees”, “Executive Officers of the Company “, “Security Ownership Of Certain Beneficial Owners and Management, “Section 16(a) Beneficial Ownership Reporting Compliance”, “Code of Business Conduct and Ethics”, “Board Committees – Governance Committee”, “Insider Trading Plans” and “Board Committees – Audit and Enterprise Risk Committee” contained in the Proxy Statement, which sections are incorporated herein by reference.
ITEM 11. EXECUTIVE COMPENSATION
The information required by this Item is set forth under the section captioned “Compensation Discussion and Analysis”, “Summary Compensation Table”, “Grants of Plan-Based Awards”, “Outstanding Equity Awards at Fiscal Year End”, “Option Exercises and Stock Vested”, “Pension Benefits”, “Nonqualified Deferred Compensation”, “Employment Agreements”, “Potential Payments upon Termination or Change in Control”, “Omnibus Stock Option and Long Term Incentive Plan”, “Director Compensation”, “Compensation Committee – Compensation Committee Interlocks and Insider Participation”, “Compensation Committee – Compensation Committee Report”, and “Pay versus Performance”, contained in the Proxy Statement, which sections are incorporated herein by reference.
ITEM 12. SECURITY OWNERSHIP OF CERTAIN BENEFICIAL OWNERS AND MANAGEMENT AND RELATED STOCKHOLDER MATTERS
For the information required by the Item see the section captioned “Security Ownership of Certain Beneficial Owners and Management” contained in the Proxy Statement, which section is incorporated herein by reference.
The following table presents the number of shares of Company common stock to be issued upon the exercise of outstanding options, warrants and rights; the weighted-average price of the outstanding options, warrants and rights; and the number of options, warrants and rights remaining that may be issued under the Company’s Omnibus Stock Ownership and Long Term Incentive Plans, in each case as of December 31, 2024.
| 31 |
| Table of Contents |
|
|
As of December 31, 2024 |
|
|||||||||
Plan Category |
|
Number of securities to be issued upon exercise of outstanding options, warrants and rights (1) |
|
|
Weighted-average exercise price of outstanding options, warrants and rights (2) |
|
|
Number of securities remaining available for future issuance under equity compensation plans (excluding securities reflected in column (a)) |
|
|||
|
|
(a) |
|
|
(b) |
|
|
(c) |
|
|||
Equity compensation plans approved by security holders |
|
|
24,265 |
|
|
$ | 0.00 |
|
|
|
268,100 |
|
Equity compensation plans not approved by security holders |
|
|
- |
|
|
|
- |
|
|
|
- |
|
Total |
|
|
24,265 |
|
|
$ | 0.00 |
|
|
|
268,100 |
|
(1) |
Includes: 7,060 restricted stock units granted on February 3, 2021 under the 2020 Omnibus Stock Ownership and Long Term Incentive Plan, all of which vested on February 3, 2025; 5,385 restricted stock units granted on January 20, 2022 under the 2020 Omnibus Stock Ownership and Long Term Incentive Plan, all of which vest on January 20, 2026; 5,370 restricted stock units granted on January 19, 2023 under the 2020 Omnibus Stock Ownership and Long Term Incentive Plan, all of which vest on January 19, 2027; and 6,450 restricted stock units granted on January 22, 2024 under the 2020 Omnibus Stock Ownership and Long Term Incentive Plan, all of which vest on January 22, 2028. |
|
|
(2) |
The restricted stock units granted by the Company under the Omnibus Plans do not have an exercise price. |
The above table excludes shares awarded from time to time pursuant to the Service Recognition Program. The Service Recognition Program is described under the section captioned “Discretionary Bonus and Service Awards” contained in the Proxy Statement.
ITEM 13. CERTAIN RELATIONSHIPS AND RELATED TRANSACTIONS AND DIRECTOR INDEPENDENCE
See the sections captioned “Indebtedness of and Transactions with Management and Directors” and “Board Leadership Structure and Risk Oversight” contained in the Proxy Statement, which sections are incorporated herein by reference.
ITEM 14. PRINCIPAL ACCOUNTANT FEES AND SERVICES
See the section captioned “Proposal 2 - Ratification of Selection of Independent Registered Public Accounting Firm” contained in the Proxy Statement, which section is incorporated herein by reference.
| 32 |
| Table of Contents |
PART IV
ITEM 15. EXHIBITS AND FINANCIAL STATEMENT SCHEDULES
15(a)1. |
Consolidated Financial Statements (contained in the Annual Report attached hereto as Exhibit (13) and incorporated herein by reference) |
|
(a) |
Reports of Independent Registered Public Accounting Firm |
|
|
|
|
(b) |
Consolidated Balance Sheets as of December 31, 2024 and 2023 |
|
|
|
|
(c) |
Consolidated Statements of Earnings for the Years Ended December 31, 2024, 2023 and 2022 |
|
|
|
|
(d) |
Consolidated Statements of Comprehensive Income (Loss) for the Years Ended December 31, 2024, 2023 and 2022 |
|
|
|
|
(e) |
Consolidated Statements of Changes in Shareholders’ Equity for the Years Ended December 31, 2024, 2023 and 2022 |
|
|
|
|
(f) |
Consolidated Statements of Cash Flows for the Years Ended December 31, 2024, 2023 and 2022 |
|
|
|
|
(g) |
Notes to Consolidated Financial Statements |
15(a)2. |
Consolidated Financial Statement Schedules |
|
|
|
All schedules have been omitted, as the required information is either inapplicable or included in the Notes to Consolidated Financial Statements. |
15(a)3. |
Exhibits |
|
||
|
|
|
|
||
|
|
|
|
||
|
|
|
|
||
|
|
|
|
||
|
|
|
|
| 33 |
| Table of Contents |
|
||
|
|
|
|
||
|
|
|
|
||
|
|
|
|
||
|
|
|
|
||
|
|
|
|
||
|
|
|
|
||
|
|
|
|
||
|
|
|
|
||
|
|
|
|
||
|
|
|
|
| 34 |
| Table of Contents |
|
||
|
|
|
|
||
|
|
|
|
||
|
|
|
|
||
|
|
|
|
||
|
|
|
|
||
|
|
|
|
||
|
|
|
|
||
|
|
|
|
||
|
|
|
|
||
|
|
|
|
| 35 |
| Table of Contents |
|
Amended and Restated Insider Trading and Section 16 Reporting Policy |
|
|
|
|
|
||
|
|
|
|
||
|
|
|
|
||
|
|
|
|
||
|
|
|
|
||
|
|
|
|
||
|
|
|
|
||
|
|
|
|
||
|
|
|
|
Exhibit (101) |
The following materials from the Company’s 10-K Report for the annual period ended December 31, 2024, formatted in eXtensible Business Reporting Language (“XBRL”): (i) the Condensed Consolidated Balance Sheets, (ii) the Condensed Consolidated Statements of Earnings, (iii) the Condensed Consolidated Statements of Comprehensive Income (iv) the Condensed Consolidated Statements of Changes in Shareholders’ Equity, (v) the Condensed Consolidated Statements of Cash Flows, and (vi) the Notes to the Condensed Consolidated Financial Statements. |
Management contracts, compensatory plans and arrangement are marked with an asterisk (*)
| 36 |
| Table of Contents |
SIGNATURES
Pursuant to the requirements of Section 13 or 15(d) of the Securities Exchange Act of 1934, the registrant has duly caused this report to be signed on its behalf by the undersigned, thereunto duly authorized.
|
PEOPLES BANCORP OF NORTH CAROLINA, INC. (Registrant) |
|||
| By: | /s/ William D. Cable, Sr. | ||
|
|
William D. Cable, Sr. | |
| President and Chief Executive Officer | |||
|
|
Date: March 12, 2025 |
|
Pursuant to the requirements of the Securities Exchange Act of 1934, this report has been signed below by the following persons on behalf of the registrant and in the capacities and on the dates indicated:
Signature |
|
Title |
|
Date |
||
|
|
|
|
|
||
/s/ William D. Cable, Sr. |
|
President and Chief Executive Officer |
|
March 12, 2025 |
||
William D. Cable, Sr. |
|
(Principal Executive Officer) |
|
|
||
|
|
|
|
|
||
/s/ James S. Abernethy |
|
Director |
|
March 12, 2025 |
||
James S. Abernethy |
|
|
|
|
||
|
|
|
|
|
||
/s/ Robert C. Abernethy, Sr. |
|
Chairman of the Board and Director |
|
March 12, 2025 |
||
Robert C. Abernethy. Sr. |
|
|
|
|
||
|
|
|
|
|
||
/s/ Douglas S. Howard |
|
Director |
|
March 12, 2025 |
||
Douglas S. Howard |
|
|
|
|
||
|
|
|
|
|
||
/s/ Jeffrey N. Hooper |
|
Executive Vice President and Chief |
|
March 12, 2025 |
||
Jeffrey N. Hooper |
|
Financial Officer (Principal Financial |
|
|
||
|
|
and Principal Accounting Officer) |
|
|
||
|
|
|
|
|
||
/s/ John W. Lineberger, Jr. |
|
Director |
|
March 12, 2025 |
||
John W. Lineberger, Jr. |
|
|
|
|
||
|
|
|
|
|
||
/s/ Gary E. Matthews |
|
Director |
|
March 12, 2025 |
||
Gary E. Matthews |
|
|
|
|
||
|
|
|
|
|
||
/s/ Billy L. Price, Jr., M.D. |
|
Director |
|
March 12, 2025 |
||
Billy L. Price, Jr., M.D. |
|
|
|
|
||
|
|
|
|
|
||
/s/ Larry E. Robinson |
|
Director |
|
March 12, 2025 |
||
Larry E. Robinson |
|
|
|
|
||
|
|
|
|
|
||
/s/ William Gregory Terry |
|
Director |
|
March 12, 2025 |
||
William Gregory Terry |
|
|
|
|
||
|
|
|
|
|
||
/s/ Dan Ray Timmerman, Sr. |
|
Director |
|
March 12, 2025 |
||
Dan Ray Timmerman, Sr. |
|
|
|
|
||
|
|
|
|
|
||
/s/ Benjamin I. Zachary |
|
Director |
|
March 12, 2025 |
||
Benjamin I. Zachary |
|
|
|
|
||
|
|
|
|
|
||
/s/ Ashton V. Abernethy |
|
Director |
|
March 12, 2025 |
||
Ashton V. Abernethy |
|
|
|
|
||
|
|
|
|
|
||
/s/ Robert C. Abernethy, Jr. |
|
Director |
|
March 12, 2025 |
||
Robert C. Abernethy, Jr. |
|
|
|
|
||
|
|
|
|
|
||
/s/ Dan Ray Timmerman, Jr. |
|
Director |
|
March 12, 2025 |
||
Dan Ray Timmerman, Jr. |
|
|
|
|
||
| 37 |
EXHIBIT (10)(xxi)

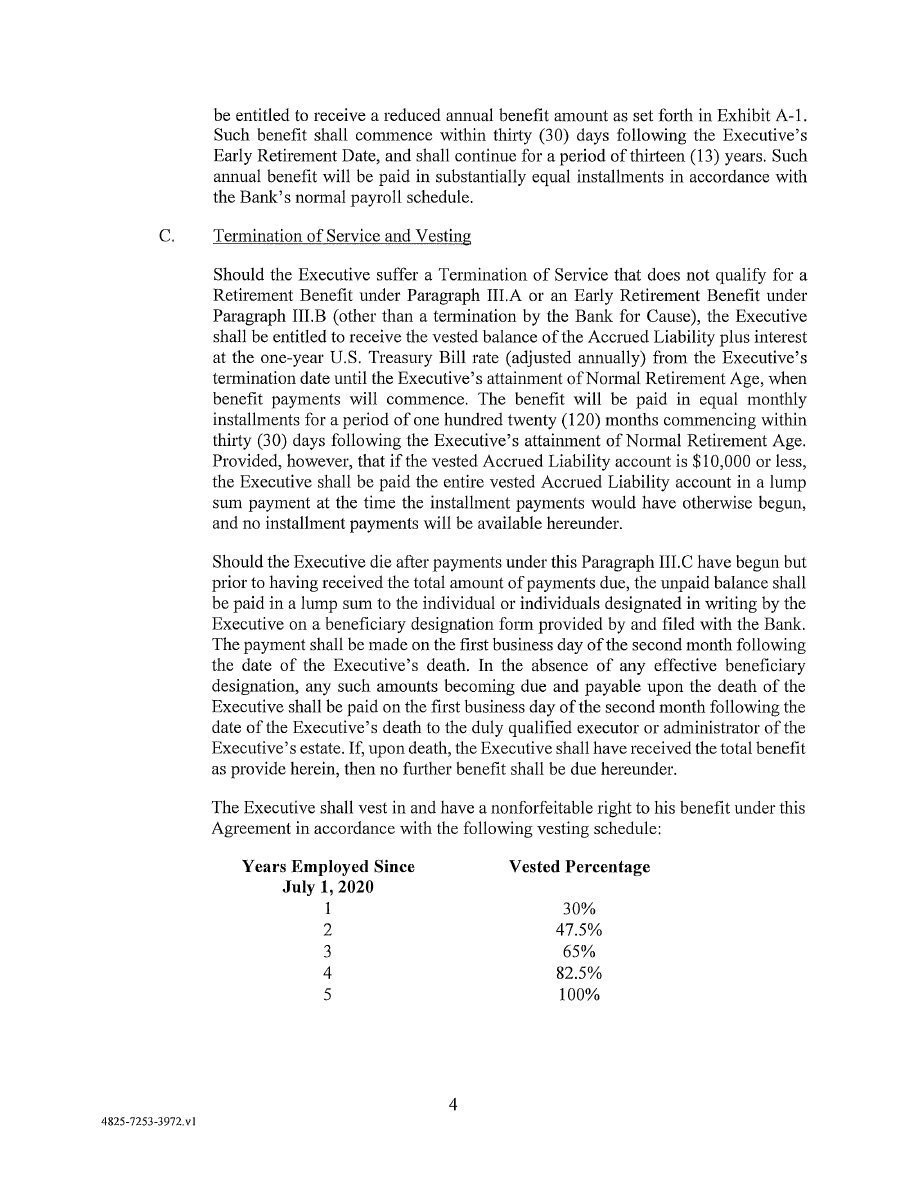


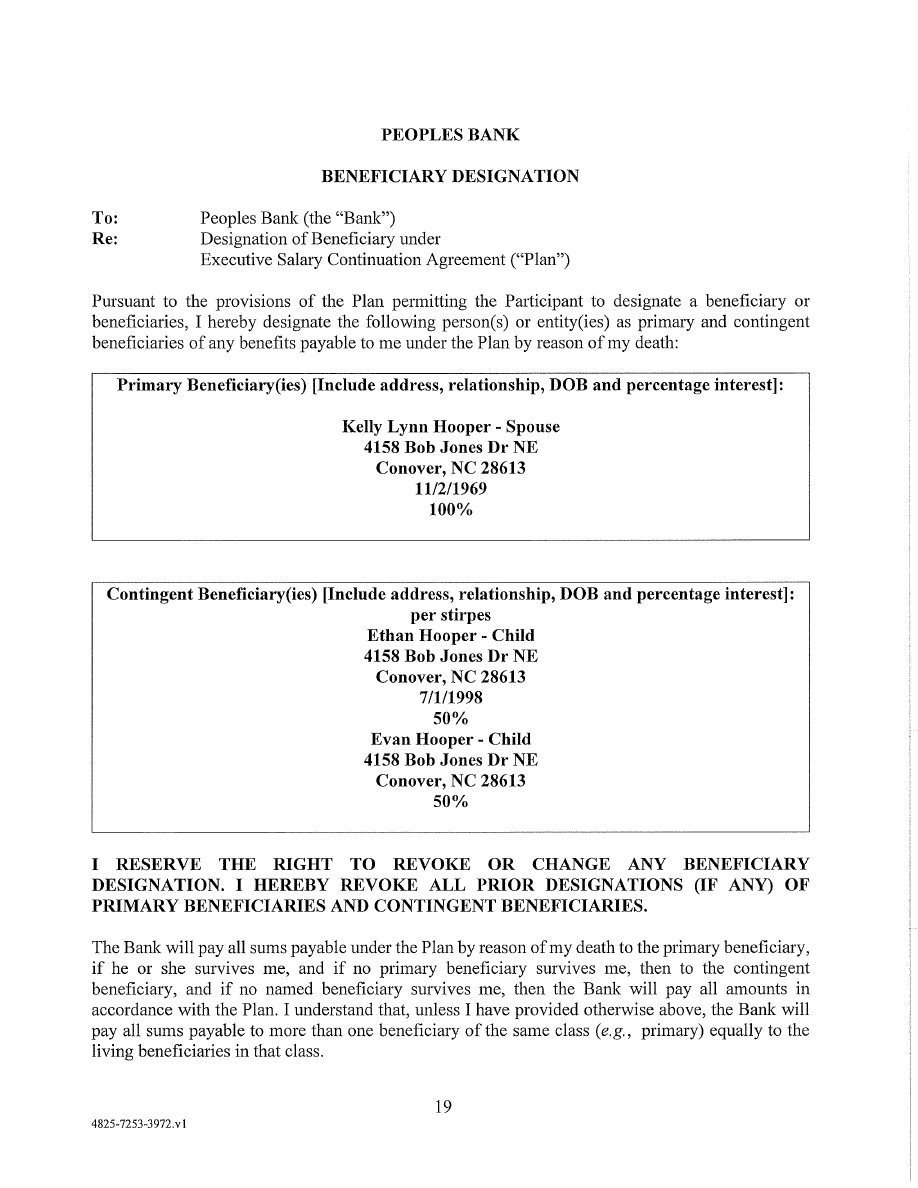


EXHIBIT (13)
The Annual Report to Security Holders is Appendix A to the Proxy Statement for the 2024 Annual Meeting of Shareholders and is incorporated herein by reference.
PEOPLES BANCORP OF NORTH CAROLINA, INC.
General Description of Business
Peoples Bancorp of North Carolina, Inc. (the “Company”), was formed in 1999 to serve as the holding company for Peoples Bank (the “Bank”). The Company is a bank holding company registered with the Board of Governors of the Federal Reserve System (the “Federal Reserve”) under the Bank Holding Company Act of 1956, as amended (the “BHCA”). The Company’s principal source of income is dividends declared and paid by the Bank on its capital stock, if any. The Company has no operations and conducts no business of its own other than owning the Bank and PEBK Capital Trust II. Accordingly, the discussion of the business which follows primarily concerns the business conducted by the Bank. Our principal executive offices are located at 518 West C Street, Newton, North Carolina, 28658, and our telephone number is (828) 464-5620.
The Bank, founded in 1912, is a state-chartered commercial bank serving the citizens and business interests of the Catawba Valley and surrounding communities through 16 banking offices, located in Lincolnton, Newton, Denver, Catawba, Conover, Maiden, Claremont, Hiddenite, Hickory, Charlotte, Huntersville, Mooresville and Raleigh, North Carolina. The Bank also operates loan production offices in Charlotte, Denver, Salisbury and Winston-Salem North Carolina. The Company’s fiscal year ends December 31. At December 31, 2024, the Company had total assets of $1.7 billion, net loans of $1.1 billion, deposits of $1.5 billion, total securities of $390.7 million, and shareholders’ equity of $130.6 million.
The Bank has a diversified loan portfolio, with no foreign loans and few agricultural loans. Real estate loans are predominately variable rate and fixed rate commercial property loans, which include residential development loans to commercial customers. Commercial loans are spread throughout a variety of industries with no one particular industry or group of related industries accounting for a significant portion of the commercial loan portfolio. The majority of the Bank’s deposit and loan customers are individuals and small-to medium-sized businesses located in the Bank’s market area. Additional discussion of the Bank’s loan portfolio and sources of funds for loans can be found in “Management’s Discussion and Analysis of Financial Condition and Results of Operations” on pages A-4 through A-19 of the Annual Report, which is included in this Form 10-K as Exhibit (13).
The operations of the Bank are significantly influenced by general economic conditions and by related monetary and fiscal policies of the Company and the Bank’s regulatory agencies, including the Federal Reserve, the Federal Deposit Insurance Corporation (the “FDIC”) and the North Carolina Commissioner of Banks (the “Commissioner”).
At December 31, 2024, the Company employed 281 full-time employees and 13 part-time employees, which equated to 288 full-time equivalent employees.
Subsidiaries
The Bank is a subsidiary of the Company. At December 31, 2024, the Bank had four subsidiaries, Peoples Investment Services, Inc., Real Estate Advisory Services, Inc., Community Bank Real Estate Solutions, LLC (“CBRES”) and PB Real Estate Holdings, LLC. Through a relationship with Raymond James Financial Services, Inc., Peoples Investment Services, Inc. provides the Bank’s customers access to investment counseling and non-deposit investment products such as stocks, bonds, mutual funds, tax deferred annuities, and related brokerage services. Real Estate Advisory Services, Inc. provides real estate appraisal and real estate brokerage services. CBRES serves as a “clearing-house” for appraisal services for community banks. Other banks are able to contract with CBRES to find and engage appropriate appraisal companies. As a separate legal entity, CBRES’s services and the appraisal process are conducted independent from the financing process of the Bank. PB Real Estate Holdings, LLC acquires, manages and disposes of real property, other collateral and assets obtained in the ordinary course of collecting debts previously contracted. All of the Bank’s subsidiaries are incorporated in the state of North Carolina.
In June 2006, the Company formed a wholly-owned Delaware statutory trust, PEBK Capital Trust II (“PEBK Trust II”), to facilitate the issuance of $20.6 million of trust preferred securities. PEBK Trust II is not included in the consolidated financial statements. The Company redeemed $5.0 million of outstanding trust preferred securities in 2019.
| A-1 |
This report contains certain forward-looking statements with respect to the financial condition, results of operations and business of the Company. These forward-looking statements involve risks and uncertainties and are based on the beliefs and assumptions of management of the Company and on the information available to management at the time that these disclosures were prepared. These statements can be identified by the use of words like “expect,” “anticipate,” “estimate” and “believe,” variations of these words and other similar expressions. Readers should not place undue reliance on forward-looking statements as a number of important factors could cause actual results to differ materially from those in the forward-looking statements. Factors that could cause actual results to differ materially include, but are not limited to, (1) competition in the markets served by the Company’s subsidiary, Peoples Bank, (2) changes in the interest rate environment, (3) general national, regional or local economic conditions may be less favorable than expected, resulting in, among other things, a deterioration in credit quality and the possible impairment of collectibility of loans, (4) legislative or regulatory changes, including changes in accounting standards, (5) significant changes in the federal and state legal and regulatory environment and tax laws, (6) the impact of changes in monetary and fiscal policies, laws, rules and regulations and (7) other risks and factors identified in the Company’s other filings with the Securities and Exchange Commission. The Company undertakes no obligation to update any forward-looking statements.
| A-2 |
SELECTED FINANCIAL DATA | ||||||||||||
Dollars in Thousands Except Per Share Amounts | ||||||||||||
|
|
|
|
|
|
|
|
|
|
|||
|
|
2024 |
|
|
2023 |
|
|
2022 |
|
|||
Summary of Operations |
|
|
|
|
|
|
|
|
|
|||
Interest income |
|
$ | 80,733 |
|
|
|
71,862 |
|
|
|
54,431 |
|
Interest expense |
|
|
26,654 |
|
|
|
17,143 |
|
|
|
3,323 |
|
Net interest income |
|
|
54,079 |
|
|
|
54,719 |
|
|
|
51,108 |
|
Provision for (recovery of) credit losses |
|
|
(285 | ) |
|
|
1,566 |
|
|
|
1,472 |
|
Net interest income after provision |
|
|
|
|
|
|
|
|
|
|
|
|
for credit losses |
|
|
54,364 |
|
|
|
53,153 |
|
|
|
49,636 |
|
Non-interest income |
|
|
27,715 |
|
|
|
22,914 |
|
|
|
26,689 |
|
Non-interest expense |
|
|
61,150 |
|
|
|
56,144 |
|
|
|
56,030 |
|
Earnings before income taxes |
|
|
20,929 |
|
|
|
19,923 |
|
|
|
20,295 |
|
Income tax expense |
|
|
4,576 |
|
|
|
4,377 |
|
|
|
4,172 |
|
Net earnings |
|
$ | 16,353 |
|
|
|
15,546 |
|
|
|
16,123 |
|
|
|
|
|
|
|
|
|
|
|
|
|
|
Selected Year-End Balances |
|
|
|
|
|
|
|
|
|
|
|
|
Assets |
|
$ | 1,651,962 |
|
|
|
1,635,910 |
|
|
|
1,620,927 |
|
Investment securities available for sale |
|
|
388,003 |
|
|
|
391,924 |
|
|
|
445,394 |
|
Net loans |
|
|
1,128,409 |
|
|
|
1,082,025 |
|
|
|
1,022,114 |
|
Mortgage loans held for sale |
|
|
1,367 |
|
|
|
686 |
|
|
|
211 |
|
Interest-earning assets |
|
|
1,559,313 |
|
|
|
1,538,570 |
|
|
|
1,502,868 |
|
Deposits |
|
|
1,484,731 |
|
|
|
1,392,045 |
|
|
|
1,435,215 |
|
Interest-bearing liabilities |
|
|
1,097,941 |
|
|
|
1,061,537 |
|
|
|
975,279 |
|
Shareholders' equity |
|
$ | 130,563 |
|
|
|
121,016 |
|
|
|
105,195 |
|
Shares outstanding |
|
|
5,457,646 |
|
|
|
5,534,499 |
|
|
|
5,636,830 |
|
|
|
|
|
|
|
|
|
|
|
|
|
|
Selected Average Balances |
|
|
|
|
|
|
|
|
|
|
|
|
Assets |
|
$ | 1,653,356 |
|
|
|
1,605,386 |
|
|
|
1,663,665 |
|
Investment securities available for sale |
|
|
442,097 |
|
|
|
454,823 |
|
|
|
467,484 |
|
Loans |
|
|
1,113,488 |
|
|
|
1,061,075 |
|
|
|
949,175 |
|
Interest-earning assets |
|
|
1,611,816 |
|
|
|
1,561,825 |
|
|
|
1,601,168 |
|
Deposits |
|
|
1,465,965 |
|
|
|
1,395,265 |
|
|
|
1,480,113 |
|
Interest-bearing liabilities |
|
|
1,094,699 |
|
|
|
1,003,479 |
|
|
|
979,315 |
|
Shareholders' equity |
|
$ | 129,866 |
|
|
|
116,295 |
|
|
|
123,887 |
|
Shares outstanding |
|
|
5,300,964 |
|
|
|
5,424,890 |
|
|
|
5,480,123 |
|
|
|
|
|
|
|
|
|
|
|
|
|
|
Profitability Ratios |
|
|
|
|
|
|
|
|
|
|
|
|
Return on average total assets |
|
|
0.99 | % |
|
|
0.97 | % |
|
|
0.97 | % |
Return on average shareholders' equity |
|
|
12.59 | % |
|
|
13.37 | % |
|
|
13.01 | % |
Dividend payout ratio |
|
|
30.86 | % |
|
|
32.86 | % |
|
|
30.61 | % |
|
|
|
|
|
|
|
|
|
|
|
|
|
Liquidity and Capital Ratios (averages) |
|
|
|
|
|
|
|
|
|
|
|
|
Loan to deposit |
|
|
75.96 | % |
|
|
76.05 | % |
|
|
64.13 | % |
Shareholders' equity to total assets |
|
|
7.85 | % |
|
|
7.24 | % |
|
|
7.45 | % |
|
|
|
|
|
|
|
|
|
|
|
|
|
Per share of Common Stock |
|
|
|
|
|
|
|
|
|
|
|
|
Basic net earnings |
|
$ | 3.08 |
|
|
|
2.87 |
|
|
|
2.94 |
|
Diluted net earnings |
|
$ | 2.98 |
|
|
|
2.77 |
|
|
|
2.85 |
|
Cash dividends |
|
$ | 0.92 |
|
|
|
0.91 |
|
|
|
0.87 |
|
Book value |
|
$ | 24.64 |
|
|
|
22.53 |
|
|
|
19.24 |
|
| A-3 |
Management's Discussion and Analysis of Financial Condition
and Results of Operations
The following is a discussion of our financial position and results of operations and should be read in conjunction with the information set forth under Item 1A Risk Factors in the Company’s Annual Report on Form 10-K and the Company’s consolidated financial statements and notes thereto on pages A-20 through A-63.
Introduction
Management’s discussion and analysis of earnings and related data are presented to assist in understanding the consolidated financial condition and results of operations of the Company, for the years ended December 31, 2024, 2023 and 2022. The Company is a registered bank holding company operating under the supervision of the Board of Governors of the Federal Reserve System (the “Federal Reserve”) and the parent company of the “Bank. The Bank is a North Carolina-chartered bank, with offices in Catawba, Lincoln, Alexander, Mecklenburg, Iredell, Wake, Rowan and Forsyth counties, operating under the banking laws of North Carolina and the rules and regulations of the Federal Deposit Insurance Corporation (the “FDIC”).
Overview
Our business consists principally of attracting deposits from the general public and investing these funds in commercial loans, real estate mortgage loans, real estate construction loans and consumer loans. Our profitability depends primarily on our net interest income, which is the difference between the income we receive on our loan and investment securities portfolios and our cost of funds, which consists of interest paid on deposits and borrowed funds. Net interest income also is affected by the relative amounts of our interest-earning assets and interest-bearing liabilities. When interest-earning assets approximate or exceed interest-bearing liabilities, a positive interest rate spread will generate net interest income. Our profitability is also affected by the level of other income and operating expenses. Other income consists primarily of miscellaneous fees related to our loans and deposits, mortgage banking income and commissions from sales of annuities and mutual funds. Operating expenses consist of compensation and benefits, occupancy related expenses, federal deposit and other insurance premiums, data processing, advertising and other expenses.
Our operations are influenced significantly by local economic conditions and by policies of financial institution regulatory authorities. The earnings on our assets are influenced by the effects of, and changes in, trade, monetary and fiscal policies and laws, including interest rate policies of the Federal Reserve, inflation, interest rates, market and monetary fluctuations. Lending activities are affected by the demand for commercial and other types of loans, which in turn is affected by the interest rates at which such financing may be offered. Our cost of funds is influenced by interest rates on competing investments and by rates offered on similar investments by competing financial institutions in our market area, as well as general market interest rates. These factors can cause fluctuations in our net interest income and other income. In addition, local economic conditions can impact the credit risk of our loan portfolio, in that (1) local employers may be required to eliminate employment positions of individual borrowers, and (2) small businesses and commercial borrowers may experience a downturn in their operating performance and become unable to make timely payments on their loans. Management evaluates these factors in estimating the allowance for credit losses (“ACL”, “allowance for credit losses”, or “allowance”) and changes in these economic factors could result in increases or decreases to the provision for loan losses.
Prior to the COVID-19 pandemic, economic conditions, while not as robust as the period from 2004 to 2007, had stabilized such that businesses in our market area were growing and investing again. The uncertainty expressed in the local, national and international markets through the primary economic indicators of activity were previously sufficiently stable to allow for reasonable economic growth in our markets. Subsequently, continuing supply-chain disruption and rising inflation has caused the Federal Reserve Federal Open Market Committee (“FOMC”) to increase the target federal funds rate 500 basis points between March 2022 and July 2023 before being reduced to a range of 4.25% to 4.50% at December 31, 2024.
Although we are unable to control the external factors that influence our business, by maintaining high levels of balance sheet liquidity, managing our interest rate exposures and by actively monitoring asset quality, we seek to minimize the potentially adverse risks of unforeseen and unfavorable economic trends. Because the assets and liabilities of a bank are primarily monetary in nature (payable in fixed, determinable amounts), the performance of a bank is affected more by changes in interest rates than by inflation. Interest rates generally increase as the rate of inflation increases, but the magnitude of the change in rates may not be the same. The effect of inflation on banks is normally not as significant as its influence on those businesses that have large investments in plants and inventories. During periods of high inflation there are normally corresponding increases in the money supply, and banks will normally experience above average growth in assets, loans, and deposits. Also, general increases in the price of goods and services can be expected to result in increased operating expenses.
| A-4 |
Our business emphasis has been and continues to be to operate as a well-capitalized, profitable and independent community-oriented financial institution dedicated to providing quality customer service. We are committed to meeting the financial needs of the communities in which we operate. We expect growth to be achieved in our local markets and through expansion opportunities in contiguous or nearby markets. While we would be willing to consider growth by acquisition in certain circumstances, we do not consider the acquisition of another company to be necessary for our continued ability to provide a reasonable return to our shareholders. We believe that we can be more effective in serving our customers than many of our non-local competitors because of our ability to quickly and effectively provide senior management responses to customer needs and inquiries. Our ability to provide these services is enhanced by the stability and experience of our Bank officers and managers.
The Company does not have specific plans for additional offices in 2025 but will continue to look for growth opportunities in nearby markets and may expand if considered a worthwhile opportunity.
Summary of Critical Accounting Policies
The consolidated financial statements include the financial statements of the Company and its wholly owned subsidiary, the Bank, along with the Bank’s wholly owned subsidiaries, Peoples Investment Services, Inc., Real Estate Advisory Services, Inc., Community Bank Real Estate Solutions, LLC and PB Real Estate Holdings, LLC. All significant intercompany balances and transactions have been eliminated in consolidation.
The Company’s accounting policies are fundamental to understanding management’s discussion and analysis of results of operations and financial condition. The following is a summary of the Company’s critical accounting policy, which is the most subjective and complex accounting policies of the Company. A more complete description of the Company’s significant accounting policies can be found in Note 1 of the Notes to Consolidated Financial Statements in the Company’s 2024 Annual Report to Shareholders which is Appendix A to the Proxy Statement for the May 1, 2025 Annual Meeting of Shareholders.
The allowance for credit losses reflects management’s assessment and estimate of the risks associated with extending credit and its evaluation of the quality of the loan portfolio. The Bank periodically analyzes the loan portfolio in an effort to review asset quality and to establish an allowance for credit losses that management believes will be adequate in light of anticipated risks and loan losses.
The collectability of loans is reflected through the Company’s estimate of the allowance for credit losses. The Company performs periodic and systematic detailed reviews of its lending portfolio to assess overall collectability. The Company’s internal models generally involve present value of cash flow techniques. The various techniques are discussed in greater detail elsewhere in this management’s discussion and analysis and the Notes to Consolidated Financial Statements.
Management of the Company has made a number of estimates and assumptions relating to reporting of assets and liabilities and the disclosure of contingent assets and liabilities to prepare the accompanying consolidated financial statements in conformity with GAAP. Actual results could differ from those estimates.
| A-5 |
Results of Operations
Summary. The Company reported net earnings of $16.4 million or $3.08 per share and $2.98 per diluted share for the year ended December 31, 2024, compared to $15.5 million or $2.87 per share and $2.77 per diluted share for the year ended December 31, 2023. The increase in net earnings is primarily attributable to an increase in non-interest income and a decrease in the provision for credit losses, which were partially offset by a decrease in net interest income and an increase in non-interest expense, compared to the prior year, as discussed below.
The Company reported net earnings of $15.5 million or $2.87 per share and $2.77 per diluted share for the year ended December 31, 2023, as compared to $16.1 million or $2.94 per share and $2.85 per diluted share for the year ended December 31, 2022.
The return on average assets in 2024 was 0.99%, as compared to 0.97% in 2023 and 2022. The return on average shareholders’ equity was 12.59% in 2024, as compared to 13.37% in 2023 and 13.01% in 2022.
Net Interest Income. Net interest income, the major component of the Company’s net income, is the amount by which interest and fees generated by interest-earning assets exceed the total cost of funds used to carry them. Net interest income is affected by changes in the volume and mix of interest-earning assets and interest-bearing liabilities, as well as changes in the yields earned and rates paid. Net interest margin is calculated by dividing tax-equivalent net interest income by average interest-earning assets, and represents the Company’s net yield on its interest-earning assets.
Net interest income was $54.1 million for the year ended December 31, 2024, compared to $54.7 million for the year ended December 31, 2023. The decrease in net interest income is due to a $9.5 million increase in interest expense, partially offset by a $8.9 million increase in interest income. The increase in interest income reflects a $7.4 million increase in interest income and fees on loans, a $580,000 increase in interest income on balances due from banks and a $878,000 increase in interest income on investment securities. The increase in interest income and fees on loans is primarily due to an increase in total loans and rate increases implemented by the Federal Reserve between December 2022 and July 2023. The increase in interest income on balances due from banks is also due to an increase in average balances outstanding and Federal Reserve rate increases. The increase in interest income on investment securities is primarily due to increases in yields on variable rate securities and higher yields on securities held during the more recent reporting period. The increase in interest expense is due to an increase in balances of interest-bearing liabilities and an increase in rates paid on interest-bearing liabilities. Net interest income increased to $54.7 million in 2023 from $51.1 million in 2022.
Table 1 sets forth for each category of interest-earning assets and interest-bearing liabilities, the average amounts outstanding, the interest incurred on such amounts and the average rate earned or incurred for the years ended December 31, 2024, 2023 and 2022. The table also sets forth the average rate earned on total interest-earning assets, the average rate paid on total interest-bearing liabilities, and the net yield on total average interest-earning assets for the same periods. Yield information does not give effect to changes in fair value that are reflected as a component of shareholders’ equity. Yields and interest income on tax-exempt investments have been adjusted to a tax equivalent basis using an effective tax rate of 22.98% for securities that are both federal and state tax exempt and an effective tax rate of 20.48% for federal tax-exempt securities. Non-accrual loans and the interest income that was recorded on non-accrual loans, if any, are included in the yield calculations for loans in all periods reported. The Company believes the presentation of net interest income on a tax-equivalent basis provides comparability of net interest income from both taxable and tax-exempt sources and facilitates comparability within the industry. Although the Company believes these non-GAAP financial measures enhance investors’ understanding of its business and performance, these non-GAAP financial measures should not be considered an alternative to GAAP. The reconciliations of these non-GAAP financial measures to their most directly comparable GAAP financial measures are presented below.
| A-6 |
Table 1 - Average Balance Table |
|
|
|
|
|
|
|
|
|
|
|
|
|
|
|
|
|
|||||||||||||||||||
|
|
|
|
|
|
|
|
|
|
|
|
|
|
|
|
|
|
|
||||||||||||||||||
|
|
December 31, 2024 |
|
|
December 31, 2023 |
|
|
December 31, 2022 |
|
|||||||||||||||||||||||||||
(Dollars in thousands) |
|
Average Balance |
|
|
Interest |
|
|
Yield / Rate |
|
|
Average Balance |
|
|
Interest |
|
|
Yield / Rate |
|
|
Average Balance |
|
|
Interest |
|
|
Yield / Rate |
|
|||||||||
Interest-earning assets: |
|
|
|
|
|
|
|
|
|
|
|
|
|
|
|
|
|
|
|
|
|
|
|
|
|
|
|
|||||||||
Loans receivable |
|
$ | 1,113,488 |
|
|
|
62,920 |
|
|
|
5.65 | % |
|
|
1,061,075 |
|
|
|
55,507 |
|
|
|
5.23 | % |
|
|
949,175 |
|
|
|
43,077 |
|
|
|
4.54 | % |
Investments - taxable |
|
|
431,205 |
|
|
|
14,592 |
|
|
|
3.38 | % |
|
|
436,114 |
|
|
|
13,374 |
|
|
|
3.07 | % |
|
|
399,036 |
|
|
|
7,159 |
|
|
|
1.79 | % |
Investments - nontaxable* |
|
|
14,146 |
|
|
|
449 |
|
|
|
3.17 | % |
|
|
21,888 |
|
|
|
836 |
|
|
|
3.82 | % |
|
|
71,943 |
|
|
|
2,355 |
|
|
|
3.27 | % |
Due from banks |
|
|
52,977 |
|
|
|
2,796 |
|
|
|
5.28 | % |
|
|
42,748 |
|
|
|
2,216 |
|
|
|
5.18 | % |
|
|
181,014 |
|
|
|
2,223 |
|
|
|
1.23 | % |
|
|
|
|
|
|
|
|
|
|
|
|
|
|
|
|
|
|
|
|
|
|
|
|
|
|
|
|
|
|
|
|
|
|
|
|
|
Total interest-earning assets |
|
|
1,611,816 |
|
|
|
80,757 |
|
|
|
5.01 | % |
|
|
1,561,825 |
|
|
|
71,933 |
|
|
|
4.61 | % |
|
|
1,601,168 |
|
|
|
54,814 |
|
|
|
3.42 | % |
|
|
|
|
|
|
|
|
|
|
|
|
|
|
|
|
|
|
|
|
|
|
|
|
|
|
|
|
|
|
|
|
|
|
|
|
|
Cash and due from banks |
|
|
30,207 |
|
|
|
|
|
|
|
|
|
|
|
35,772 |
|
|
|
|
|
|
|
|
|
|
|
36,778 |
|
|
|
|
|
|
|
|
|
Other assets |
|
|
21,919 |
|
|
|
|
|
|
|
|
|
|
|
17,820 |
|
|
|
|
|
|
|
|
|
|
|
35,373 |
|
|
|
|
|
|
|
|
|
Allowance for credit losses |
|
|
(10,586 | ) |
|
|
|
|
|
|
|
|
|
|
(10,031 | ) |
|
|
|
|
|
|
|
|
|
|
(9,654 | ) |
|
|
|
|
|
|
|
|
|
|
|
|
|
|
|
|
|
|
|
|
|
|
|
|
|
|
|
|
|
|
|
|
|
|
|
|
|
|
|
|
|
|
|
|
|
Total assets |
|
$ | 1,653,356 |
|
|
|
|
|
|
|
|
|
|
|
1,605,386 |
|
|
|
|
|
|
|
|
|
|
|
1,663,665 |
|
|
|
|
|
|
|
|
|
|
|
|
|
|
|
|
|
|
|
|
|
|
|
|
|
|
|
|
|
|
|
|
|
|
|
|
|
|
|
|
|
|
|
|
|
|
Interest-bearing liabilities: |
|
|
|
|
|
|
|
|
|
|
|
|
|
|
|
|
|
|
|
|
|
|
|
|
|
|
|
|
|
|
|
|
|
|
|
|
|
|
|
|
|
|
|
|
|
|
|
|
|
|
|
|
|
|
|
|
|
|
|
|
|
|
|
|
|
|
|
|
|
|
|
|
|
Interest-bearing demand, |
|
|
|
|
|
|
|
|
|
|
|
|
|
|
|
|
|
|
|
|
|
|
|
|
|
|
|
|
|
|
|
|
|
|
|
|
MMDA & savings deposits |
|
$ | 699,690 |
|
|
|
10,237 |
|
|
|
1.46 | % |
|
|
689,795 |
|
|
|
6,731 |
|
|
|
0.98 | % |
|
|
824,955 |
|
|
|
2,019 |
|
|
|
0.24 | % |
Time deposits |
|
|
346,246 |
|
|
|
14,316 |
|
|
|
4.13 | % |
|
|
228,309 |
|
|
|
7,916 |
|
|
|
3.47 | % |
|
|
99,880 |
|
|
|
562 |
|
|
|
0.56 | % |
Junior subordinated debentures |
|
|
15,464 |
|
|
|
1,116 |
|
|
|
7.22 | % |
|
|
15,464 |
|
|
|
1,079 |
|
|
|
6.98 | % |
|
|
15,464 |
|
|
|
529 |
|
|
|
3.42 | % |
Other |
|
|
33,299 |
|
|
|
985 |
|
|
|
2.96 | % |
|
|
69,911 |
|
|
|
1,417 |
|
|
|
2.03 | % |
|
|
39,016 |
|
|
|
213 |
|
|
|
0.55 | % |
|
|
|
|
|
|
|
|
|
|
|
|
|
|
|
|
|
|
|
|
|
|
|
|
|
|
|
|
|
|
|
|
|
|
|
|
|
Total interest-bearing liabilities |
|
|
1,094,699 |
|
|
|
26,654 |
|
|
|
2.43 | % |
|
|
1,003,479 |
|
|
|
17,143 |
|
|
|
1.71 | % |
|
|
979,315 |
|
|
|
3,323 |
|
|
|
0.34 | % |
|
|
|
|
|
|
|
|
|
|
|
|
|
|
|
|
|
|
|
|
|
|
|
|
|
|
|
|
|
|
|
|
|
|
|
|
|
Demand deposits |
|
|
420,029 |
|
|
|
|
|
|
|
|
|
|
|
477,162 |
|
|
|
|
|
|
|
|
|
|
|
555,278 |
|
|
|
|
|
|
|
|
|
Other liabilities |
|
|
8,762 |
|
|
|
|
|
|
|
|
|
|
|
8,449 |
|
|
|
|
|
|
|
|
|
|
|
5,185 |
|
|
|
|
|
|
|
|
|
Shareholders' equity |
|
|
129,866 |
|
|
|
|
|
|
|
|
|
|
|
116,296 |
|
|
|
|
|
|
|
|
|
|
|
123,887 |
|
|
|
|
|
|
|
|
|
|
|
|
|
|
|
|
|
|
|
|
|
|
|
|
|
|
|
|
|
|
|
|
|
|
|
|
|
|
|
|
|
|
|
|
|
|
Total liabilities and shareholder's equity |
|
$ | 1,653,356 |
|
|
|
|
|
|
|
|
|
|
|
1,605,386 |
|
|
|
|
|
|
|
|
|
|
|
1,663,665 |
|
|
|
|
|
|
|
|
|
|
|
|
|
|
|
|
|
|
|
|
|
|
|
|
|
|
|
|
|
|
|
|
|
|
|
|
|
|
|
|
|
|
|
|
|
|
Net interest spread |
|
|
|
|
|
$ | 54,103 |
|
|
|
2.58 | % |
|
|
|
|
|
$ | 54,790 |
|
|
|
2.90 | % |
|
|
|
|
|
$ | 51,491 |
|
|
|
3.08 | % |
|
|
|
|
|
|
|
|
|
|
|
|
|
|
|
|
|
|
|
|
|
|
|
|
|
|
|
|
|
|
|
|
|
|
|
|
|
Net yield on interest-earning assets |
|
|
|
|
|
|
|
|
|
|
3.36 | % |
|
|
|
|
|
|
|
|
|
|
3.51 | % |
|
|
|
|
|
|
|
|
|
|
3.22 | % |
|
|
|
|
|
|
|
|
|
|
|
|
|
|
|
|
|
|
|
|
|
|
|
|
|
|
|
|
|
|
|
|
|
|
|
|
|
Taxable equivalent adjustment |
|
|
|
|
|
|
|
|
|
|
|
|
|
|
|
|
|
|
|
|
|
|
|
|
|
|
|
|
|
|
|
|
|
|
|
|
Investment securities |
|
|
|
|
|
$ | 24 |
|
|
|
|
|
|
|
|
|
|
$ | 71 |
|
|
|
|
|
|
|
|
|
|
$ | 383 |
|
|
|
|
|
|
|
|
|
|
|
|
|
|
|
|
|
|
|
|
|
|
|
|
|
|
|
|
|
|
|
|
|
|
|
|
|
|
|
|
|
|
Net interest income |
|
|
|
|
|
$ | 54,079 |
|
|
|
|
|
|
|
|
|
|
$ | 54,719 |
|
|
|
|
|
|
|
|
|
|
$ | 51,108 |
|
|
|
|
|
|
|
|
|
|
|
|
|
|
|
|
|
|
|
|
|
|
|
|
|
|
|
|
|
|
|
|
|
|
|
|
|
|
|
|
|
|
*Includes U.S. Government agency securities that are non-taxable for state income tax purposes of $10.2 million in 2024, $11.7 million in 2023 and $13.3 million in 2022. A tax rate of 2.50% was used to calculate the tax equivalent yields on these securities in 2024, 2023 and 2022. | ||||||||||||||||||||||||||||||||||||
Changes in interest income and interest expense can result from variances in both volume and rates. Table 2 describes the impact on the Company’s tax equivalent net interest income resulting from changes in average balances and average rates for the periods indicated. The changes in net interest income due to both volume and rate changes have been allocated to volume and rate changes in proportion to the relationship of the absolute dollar amounts of the changes in each.
| A-7 |
Table 2 - Rate/Volume Variance Analysis-Tax Equivalent Basis |
|
|
|
|
|
|
|
|
|
|
||||||||||||||
|
|
|
|
|
|
|
|
|
|
|
|
|
|
|
|
|
|
|
||||||
|
|
December 31, 2024 |
|
|
December 31, 2023 |
|
||||||||||||||||||
(Dollars in thousands) |
|
Changes in average volume |
|
|
Changes in average rates |
|
|
Total Increase (Decrease) |
|
|
Changes in average volume |
|
|
Changes in average rates |
|
|
Total Increase (Decrease) |
|
||||||
Interest income: |
|
|
|
|
|
|
|
|
|
|
|
|
|
|
|
|
|
|
||||||
Loans: Net of unearned income |
|
$ | 2,852 |
|
|
|
4,561 |
|
|
|
7,413 |
|
|
$ | 5,466 |
|
|
|
6,964 |
|
|
|
12,430 |
|
Investments - taxable |
|
|
(158 | ) |
|
|
1,376 |
|
|
|
1,218 |
|
|
|
901 |
|
|
|
5,314 |
|
|
|
6,215 |
|
Investments - nontaxable |
|
|
(271 | ) |
|
|
(116 | ) |
|
|
(387 | ) |
|
|
(1,775 | ) |
|
|
256 |
|
|
|
(1,519 | ) |
Due from banks |
|
|
535 |
|
|
|
45 |
|
|
|
580 |
|
|
|
(4,433 | ) |
|
|
4,426 |
|
|
|
(7 | ) |
Total interest income |
|
|
2,958 |
|
|
|
5,866 |
|
|
|
8,824 |
|
|
|
159 |
|
|
|
16,960 |
|
|
|
17,119 |
|
|
|
|
|
|
|
|
|
|
|
|
|
|
|
|
|
|
|
|
|
|
|
|
|
|
Interest expense: |
|
|
|
|
|
|
|
|
|
|
|
|
|
|
|
|
|
|
|
|
|
|
|
|
Interest-bearing demand, |
|
|
|
|
|
|
|
|
|
|
|
|
|
|
|
|
|
|
|
|
|
|
|
|
MMDA & savings deposits |
|
|
121 |
|
|
|
3,385 |
|
|
|
3,506 |
|
|
|
(825 | ) |
|
|
5,537 |
|
|
|
4,712 |
|
Time deposits |
|
|
4,483 |
|
|
|
1,917 |
|
|
|
6,400 |
|
|
|
2,588 |
|
|
|
4,766 |
|
|
|
7,354 |
|
Junior subordinated debentures |
|
|
- |
|
|
|
37 |
|
|
|
37 |
|
|
|
- |
|
|
|
550 |
|
|
|
550 |
|
Other |
|
|
(913 | ) |
|
|
481 |
|
|
|
(432 | ) |
|
|
397 |
|
|
|
807 |
|
|
|
1,204 |
|
Total interest expense |
|
|
3,691 |
|
|
|
5,820 |
|
|
|
9,511 |
|
|
|
2,160 |
|
|
|
11,660 |
|
|
|
13,820 |
|
Net interest income |
|
$ | (733 | ) |
|
|
46 |
|
|
|
(687 | ) |
|
$ | (2,001 | ) |
|
|
5,300 |
|
|
|
3,299 |
|
Net interest income on a tax equivalent basis totaled $54.1 million in 2024, as compared to $54.8 million in 2023. The net interest spread, which represents the rate earned on interest-earning assets less the rate paid on interest-bearing liabilities, was 2.58% in 2024, as compared to 2.90% in 2023. The net yield on interest-earning assets was 3.36% in 2024 and 3.51% in 2023.
Tax equivalent interest income increased $8.8 million in 2024 primarily due to a $7.4 million increase in interest income and fees on loans, a $831,000 increase in tax equivalent interest income on investment securities, and a $580,000 increase in interest income on balances due from banks. The increase in interest income and fees on loans is primarily due to an increase in total loans and rate increases implemented by the Federal Reserve between December 2022 and July 2023. The increase in interest income on balances due from banks is also due to an increase in average balances outstanding and Federal Reserve rate increases. The increase in interest income on investment securities is primarily due to increases in yields on variable rate securities and higher yields on securities held during the more recent reporting period. The yield on interest-earning assets was 5.01% in 2024, as compared to 4.61% in 2023.
Interest expense totaled $26.7 million in 2024, as compared to $17.1 million in 2023. The increase in interest expense is due to an increase in increase in balances of interest-bearing liabilities and an increase in rates paid on interest-bearing liabilities. Average interest-bearing liabilities increased by $91.2 million to $1.09 billion in 2024, as compared to $1.00 billion in 2023. The cost of funds increased to 2.43% in 2024 from 1.71% in 2023.
In 2023, net interest income on a tax equivalent basis was $54.8 million, as compared to $51.5 million in 2022. The net interest spread was 2.90% in 2023, as compared to 3.08% in 2022. The net yield on interest-earning assets was 3.51% in 2023, as compared to 3.22% in 2022.
Provision for Credit Losses. Provisions for credit losses are charged to income in order to bring the total allowance for credit losses to a level deemed appropriate by management of the Company based on factors such as management’s judgment as to losses within the Bank’s loan portfolio, including loan growth, net charge-offs, changes in the composition of the loan portfolio, delinquencies and management’s assessment of the quality of the loan portfolio and general economic climate.
The provision for credit losses for the year ended December 31, 2024 was a recovery of $285,000, compared to an expense of $1.6 million for the year ended December 31, 2023. Loan balances in 2024 increased by about $45.3 million, but decreases in balances for funded and unfunded loans with higher loss rates than other categories of loans in the portfolio resulted in a decrease in provision for the year ended December 31, 2024. The decrease in the provision for credit losses during the year ended December 31, 2024 is primarily attributable to a negative provision of $1.2 million related to funded and unfunded balance reductions of $37.9 million in construction loans being paid off or transitioning to permanent financing in loan categories within the portfolio with lower loss rates, a $385,000 negative provision for loans secured by owner-occupied real estate resulting from a recovery of $200,000, and offset by a $713,000 provision related to $432,000 in charge-offs of individually evaluated loans.
| A-8 |
During the fourth quarter 2024 an update to the general forecast function in the model was set for all pools that projects the next four quarters to have similar loss rates to the period between December 2018 and February 2020, followed by a reversion to the long-term average over four quarters. This is intended to reflect the Bank's experience when the Federal Reserve began its last series of rate cuts beginning in July 2019 up to, but excluding, the two March 2020 cuts that occurred at the outset of COVID. This adjusted the previous general forecast function in the model during 2024 that utilized historical loss rates for the period between November 2015 and September 2019, reflecting a period of interest rate increases. The general forecast function adjustment resulted in a reduction of ACL for 2024 of approximately $409,000.
Net charge-offs for the year ended December 31, 2024 were $1.4 million, compared to $306,000 for the year ended December 31, 2023. The increase in net charge-offs during the year ended December 31, 2024, compared to the year ended December 31, 2023, is primarily due to commercial and industrial loan charge-offs of $432,000 during the year ended December 31 2024, which were previously reflected in reserves on individually evaluated loans.
The ratio of net charge-offs/(recoveries) to average total loans was 0.13% in 2024, 0.04% in 2023 and 0.03% in 2022. The allowance for credit losses was $10.0 million or 0.88% of total loans outstanding at December 31, 2024. For December 31, 2023 and 2022, the allowance for credit losses amounted to $11.0 million or 1.01% of total loans outstanding and $10.5 million, or 1.02% of total loans outstanding, respectively. The decrease as a percentage of total loans outstanding from December 31, 2023 to December 31, 2024 is primarily due to the general forecast function adjustment in 2024.
Table 3 presents a summary of net charge off activity for the years ended December 31, 2024, 2023 and 2022.
Table 3 - Net Charge-off Analysis |
|
|
|
|
|
|
|
|
|
|
|
|
|
|
|
|
|
|
||||||
|
|
|
|
|
|
|
|
|
|
|
|
|
|
|
|
|
|
|
||||||
|
|
Net charge-offs/(recoveries) |
|
|
Net charge-offs/(recoveries) as a percent of average loans outstanding |
|
||||||||||||||||||
|
|
Years ended December 31, |
|
|
Years ended December 31, |
|
||||||||||||||||||
(Dollars in thousands) |
|
2024 |
|
|
2023 |
|
|
2022 |
|
|
2024 |
|
|
2023 |
|
|
2022 |
|
||||||
Real estate loans |
|
|
|
|
|
|
|
|
|
|
|
|
|
|
|
|
|
|
||||||
Construction and land development |
|
$ | - |
|
|
|
- |
|
|
|
- |
|
|
|
0.00 | % |
|
|
0.00 | % |
|
|
0.00 | % |
Single-family residential |
|
|
4 |
|
|
|
(171 | ) |
|
|
(101 | ) |
|
|
0.00 | % |
|
|
-0.05 | % |
|
|
-0.03 | % |
Commercial |
|
|
(202 | ) |
|
|
(6 | ) |
|
|
(9 | ) |
|
|
-0.05 | % |
|
|
0.00 | % |
|
|
0.00 | % |
Multifamily and farmland |
|
|
- |
|
|
|
- |
|
|
|
- |
|
|
|
0.00 | % |
|
|
0.00 | % |
|
|
0.00 | % |
Total real estate loans |
|
|
(198 | ) |
|
|
(177 | ) |
|
|
(110 | ) |
|
|
-0.02 | % |
|
|
-0.02 | % |
|
|
-0.01 | % |
Loans not secured by real estate |
|
|
|
|
|
|
|
|
|
|
|
|
|
|
|
|
|
|
|
|
|
|
|
|
Commercial loans |
|
|
1,078 |
|
|
|
62 |
|
|
|
(39 | ) |
|
|
1.60 | % |
|
|
0.08 | % |
|
|
-0.05 | % |
Farm loans |
|
|
- |
|
|
|
- |
|
|
|
- |
|
|
|
0.00 | % |
|
|
0.00 | % |
|
|
0.00 | % |
Consumer loans (1) |
|
|
445 |
|
|
|
421 |
|
|
|
482 |
|
|
|
6.57 | % |
|
|
6.07 | % |
|
|
7.27 | % |
All other loans |
|
|
107 |
|
|
|
- |
|
|
|
- |
|
|
|
0.58 | % |
|
|
0.00 | % |
|
|
0.00 | % |
Total loans |
|
$ | 1,432 |
|
|
|
306 |
|
|
|
333 |
|
|
|
0.13 | % |
|
|
0.04 | % |
|
|
0.03 | % |
|
|
|
|
|
|
|
|
|
|
|
|
|
|
|
|
|
|
|
|
|
|
|
|
|
Provision for (recovery of) credit losses |
|
|
|
|
|
|
|
|
|
|
|
|
|
|
|
|
|
|
|
|
|
|
|
|
for the period |
|
$ | (285 | ) |
|
|
1,566 |
|
|
|
1,472 |
|
|
|
|
|
|
|
|
|
|
|
|
|
Allowance for credit losses at end of period |
|
$ | 9,995 |
|
|
|
11,041 |
|
|
|
10,494 |
|
|
|
|
|
|
|
|
|
|
|
|
|
Total loans at end of period |
|
$ | 1,138,404 |
|
|
|
1,093,066 |
|
|
|
1,032,608 |
|
|
|
|
|
|
|
|
|
|
|
|
|
Non-accrual loans at end of period |
|
$ | 440 |
|
|
|
3,887 |
|
|
|
3,728 |
|
|
|
|
|
|
|
|
|
|
|
|
|
Allowance for credit losses as a percent of |
|
|
|
|
|
|
|
|
|
|
|
|
|
|
|
|
|
|
|
|
|
|
|
|
total loans outstanding at end of period |
|
|
0.88 | % |
|
|
1.01 | % |
|
|
1.02 | % |
|
|
|
|
|
|
|
|
|
|
|
|
Non-accrual loans as a percent of |
|
|
|
|
|
|
|
|
|
|
|
|
|
|
|
|
|
|
|
|
|
|
|
|
total loans outstanding at end of period |
|
|
0.04 | % |
|
|
0.36 | % |
|
|
0.36 | % |
|
|
|
|
|
|
|
|
|
|
|
|
Allowance for credit losses as a percent of |
|
|
|
|
|
|
|
|
|
|
|
|
|
|
|
|
|
|
|
|
|
|
|
|
nonaccrual loans at end of period |
|
|
225.11 | % |
|
|
284.05 | % |
|
|
281.49 | % |
|
|
|
|
|
|
|
|
|
|
|
|
|
|
|
|
|
|
|
|
|
|
|
|
|
|
|
|
|
|
|
|
|
|
|
|
|
(1) The loss ratio for consumer loans is elevated because overdraft charge-offs related to DDA and NOW accounts are reported in consumer loan charge-offs and recoveries. The net overdraft charge-offs are not considered material and are therefore not shown separately. | ||||||||||||||||||||||||
Please see the section below entitled “Allowance for Credit Losses” for a more complete discussion of the Bank’s policy for addressing potential loan losses.
| A-9 |
Non-Interest Income. Non-interest income was $27.7 million for the year ended December 31, 2024, compared to $22.9 million for the year ended December 31, 2023. The increase in non-interest income is primarily attributable to a $2.5 million net loss on the sales of securities during the year ended December 31, 2023 compared to a $5,000 net gain on the sales of securities during the year ended December 31, 2024, and a $2.1 million increase in appraisal management fee income due to an increase in appraisal volume in 2024.
Non-interest income was $22.9 million for the year ended December 31, 2023, compared to $26.7 million for the year ended December 31, 2022. The decrease in non-interest income is primarily attributable to a $2.5 million net loss on the sales of securities and a $2.1 million decrease in appraisal management fee income due to a decrease in appraisal volume related to national trends in real estate purchases, which were partially offset by a $454,000 increase in miscellaneous non-interest income primarily due to an increase in income on mutual funds held in deferred compensation trust due to an increase in valuations for the assets in the deferred compensation plan.
The Company periodically evaluates its investments for credit losses. There were no credit losses on investments in 2024, 2023 or 2022.
Table 4 presents a summary of non-interest income for the years ended December 31, 2024, 2023 and 2022.
| Table 4 - Non-Interest Income |
|
|
|
|
|
|
|
|
|
|||
|
|
|
|
|
|
|
||||||
| (Dollars in thousands) |
|
2024 |
|
|
2023 |
|
|
2022 |
|
|||
| Service charges |
|
$ | 5,653 |
|
|
$ | 5,496 |
|
|
$ | 5,290 |
|
| Other service charges and fees |
|
|
685 |
|
|
|
697 |
|
|
|
734 |
|
| Gain (loss) on sale of securities, net |
|
|
5 |
|
|
|
(2,488 | ) |
|
|
- |
|
| Mortgage banking income |
|
|
357 |
|
|
|
301 |
|
|
|
393 |
|
| Insurance and brokerage commissions |
|
|
989 |
|
|
|
929 |
|
|
|
945 |
|
| Gain/(loss) on sale of premises and equipment, net |
|
|
- |
|
|
|
184 |
|
|
|
(85 | ) |
| Bank owned life insurance income |
|
|
783 |
|
|
|
432 |
|
|
|
458 |
|
Visa debit card income |
|
|
4,417 |
|
|
|
4,717 |
|
|
|
4,901 |
|
| Appraisal management fee income |
|
|
11,691 |
|
|
|
9,592 |
|
|
|
11,663 |
|
| Income on mutual funds held in deferred compensation trust |
|
|
555 |
|
|
|
844 |
|
|
|
(183 | ) |
| Miscellaneous |
|
|
2,580 |
|
|
|
2,210 |
|
|
|
2,573 |
|
| Total non-interest income |
|
$ | 27,715 |
|
|
$ | 22,914 |
|
|
$ | 26,689 |
|
Non-Interest Expense. Non-interest expense was $61.2 million for the year ended December 31, 2024, compared to $56.1 million for the year ended December 31, 2023. The increase in non-interest expense is primarily attributable to a $1.6 million increase in salaries and employee benefits expense primarily due to increases in salary and supplemental executive retirement plan expenses, a $724,000 increase in occupancy expense that includes a $362,000 write-off of leasehold improvements for the Bank’s branch in Cary, North Carolina, which was closed in June 2024, a $1.7 million increase in appraisal management fee expense due to an increase in appraisal volume and a $1.0 million increase in other non-interest expense primarily due to increases in consulting fees and debit card fraud expense.
Non-interest expense was $56.1 million for the year ended December 31, 2023 compared to $56.0 million for the year ended December 31, 2022. The increase in non-interest expense is primarily attributable to a $1.2 million increase in other non-interest expenses primarily due to an increase in deferred compensation expense due to an increase in valuations for the assets in the deferred compensation plan and a $510,000 increase in salaries and employee benefits expense primarily due to a reduction in the amortization of loan origination costs, which were partially offset by a $1.7 million decrease in appraisal management fee expense due to a decrease in appraisal volume related to national trends in real estate purchases.
| A-10 |
Table 5 presents a summary of non-interest expense for the years ended December 31, 2024, 2023 and 2022.
Table 5 - Non-Interest Expense |
|
|
|
|
|
|
|
|
|
|||
|
|
|
|
|
|
|
|
|
|
|||
(Dollars in thousands) |
|
2024 |
|
|
2023 |
|
|
2022 |
|
|||
Salaries and employee benefits |
|
$ | 28,209 |
|
|
$ | 26,640 |
|
|
$ | 26,130 |
|
Occupancy expense |
|
|
8,686 |
|
|
|
7,962 |
|
|
|
8,048 |
|
Office supplies |
|
|
534 |
|
|
|
482 |
|
|
|
532 |
|
FDIC deposit insurance |
|
|
764 |
|
|
|
745 |
|
|
|
461 |
|
Visa debit card expense |
|
|
1,391 |
|
|
|
1,255 |
|
|
|
1,224 |
|
Professional services |
|
|
673 |
|
|
|
673 |
|
|
|
451 |
|
Postage |
|
|
202 |
|
|
|
237 |
|
|
|
238 |
|
Telephone |
|
|
595 |
|
|
|
664 |
|
|
|
691 |
|
Director fees and expense |
|
|
564 |
|
|
|
503 |
|
|
|
454 |
|
Advertising |
|
|
791 |
|
|
|
750 |
|
|
|
693 |
|
Consulting fees |
|
|
1,643 |
|
|
|
1,043 |
|
|
|
1,464 |
|
Taxes and licenses |
|
|
202 |
|
|
|
143 |
|
|
|
277 |
|
Foreclosure/OREO expense |
|
|
19 |
|
|
|
1 |
|
|
|
7 |
|
Internet banking expense |
|
|
1,067 |
|
|
|
996 |
|
|
|
949 |
|
Appraisal management fee expense |
|
|
9,263 |
|
|
|
7,559 |
|
|
|
9,264 |
|
Deferred comp expense (benefit) |
|
|
555 |
|
|
|
844 |
|
|
|
(183 | ) |
Other operating expense |
|
|
5,992 |
|
|
|
5,647 |
|
|
|
5,330 |
|
Total non-interest expense |
|
$ | 61,150 |
|
|
$ | 56,144 |
|
|
$ | 56,030 |
|
Income Taxes. The Company reported income tax expense of $4.6 million, $4.4 million and $4.2 million for the years ended December 31, 2024, 2023 and 2022, respectively. The Company’s effective tax rates were 21.86%, 21.97 % and 20.56% in 2024, 2023 and 2022, respectively. Income tax expense for the year ended December 31, 2024 reflects the revaluation of the deferred tax asset due to planned reductions in the North Carolina corporate income tax rate, which will be phased out over a five year period, starting in 2025.
Liquidity. The objectives of the Company’s liquidity policy are to provide for the availability of adequate funds to meet the needs of loan demand, deposit withdrawals, maturing liabilities and to satisfy regulatory requirements. Both deposit and loan customer cash needs can fluctuate significantly depending upon business cycles, economic conditions and yields and returns available from alternative investment opportunities. In addition, the Company’s liquidity is affected by off-balance sheet commitments to lend in the form of unfunded commitments to extend credit and standby letters of credit. As of December 31, 2024, such unfunded commitments to extend credit were $348.9 million, while commitments in the form of standby letters of credit totaled $1.7 million.
The Company uses several funding sources to meet its liquidity requirements. The primary funding source is core deposits, a non-GAAP measure, which includes demand deposits, savings accounts and non-brokered certificates of deposits of denominations less than $250,000. Management believes it is useful to calculate and present core deposits because of the positive impact this low cost funding source provides to the Bank’s funding base The Company considers these to be a stable portion of the Company’s liability mix and the result of on-going consumer and commercial banking relationships. As of December 31, 2024, the Company’s core deposits totaled $1.34 billion, or 90% of total deposits.
The Bank’s two largest deposit relationships, including securities sold under agreements to repurchase, amounted to $117.0 million and $106.9 million at December 31, 2024 and 2023, respectively. These balances represent 7.88% of total deposits at December 31, 2024, as compared to 7.23% of total deposits and securities sold under agreements to repurchase combined at December 31, 2023.
The other sources of funding for the Company are through large denomination certificates of deposit, including brokered deposits, federal funds purchased, securities under agreement to repurchase and FHLB borrowings. The Bank is also able to borrow from the Federal Reserve Bank (“FRB”) on a short-term basis. The Bank’s policies include the ability to access wholesale funding up to 40% of total assets. The Bank’s wholesale funding includes FHLB borrowings, FRB borrowings, brokered deposits and internet certificates of deposit. The Bank did not have any wholesale funding at December 31, 2024.
The Bank has a line of credit with the FHLB equal to 20% of the Bank’s total assets, with no balances outstanding at December 31, 2024. At December 31, 2024, the carrying value of loans pledged as collateral totaled approximately $232.9 million. The availability under the line of credit with the FHLB was $131.9 million at December 31, 2024. The Bank had no borrowings from the FRB at December 31, 2024. FRB borrowings are collateralized by a blanket assignment on all qualifying loans that the Bank owns that are not pledged to the FHLB. At December 31, 2024, the carrying value of loans pledged as collateral to the FRB totaled approximately $637.9 million. Availability under the line of credit with the FRB was $511.9 million at December 31, 2024.
| A-11 |
The Bank also had the ability to borrow up to $110.5 million for the purchase of overnight federal funds from five correspondent financial institutions as of December 31, 2024.
The liquidity ratio for the Bank, which is defined as net cash, interest-bearing deposits with banks, federal funds sold and certain investment securities, as a percentage of net deposits and short-term liabilities was 28.16%, 25.39% and 30.32% at December 31, 2024, 2023 and 2022, respectively. The minimum required liquidity ratio as defined in the Bank’s Asset/Liability and Interest Rate Risk Management Policy for on balance sheet liquidity was 10% at December 31, 2024, 2023 and 2022.
As disclosed in the Company’s Consolidated Statements of Cash Flows, net cash provided by operating activities was $20.6 million during 2024. Net cash used in investing activities was $42.6 million during 2024 and net cash used by financing activities was $1.0 million during 2024.
Asset Liability and Interest Rate Risk Management. The objective of the Company’s Asset Liability and Interest Rate Risk strategies is to identify and manage the sensitivity of net interest income to changing interest rates and to minimize the interest rate risk between interest-earning assets and interest-bearing liabilities at various maturities. This is done in conjunction with the need to maintain adequate liquidity and the overall goal of maximizing net interest income. Table 6 presents an interest rate sensitivity analysis for the interest-earning assets and interest-bearing liabilities for the year ended December 31, 2024.
Table 6 - Interest Sensitivity Analysis |
|
|
|
|
|
|
|
|
|
|
|
|
|
|
|
|
|
|||||||
|
|
|
|
|
|
|
|
|
|
|
|
|
|
|
|
|
|
|||||||
(Dollars in thousands) |
|
Immediate |
|
|
1-3 months |
|
|
4-12 months |
|
|
Total Within One Year |
|
|
Over One Year & Non-sensitive |
|
|
Total |
|
||||||
Interest-earning assets: |
|
|
|
|
|
|
|
|
|
|
|
|
|
|
|
|
|
|
||||||
Loans |
|
$ | 194,074 |
|
|
|
4,229 |
|
|
|
15,485 |
|
|
|
213,788 |
|
|
|
924,616 |
|
|
|
1,138,404 |
|
Mortgage loans held for sale |
|
|
1,367 |
|
|
|
- |
|
|
|
- |
|
|
|
1,367 |
|
|
|
- |
|
|
|
1,367 |
|
Investment securities available for sale |
|
|
- |
|
|
|
86,320 |
|
|
|
7,615 |
|
|
|
93,935 |
|
|
|
294,068 |
|
|
|
388,003 |
|
Interest-bearing deposit accounts |
|
|
28,347 |
|
|
|
- |
|
|
|
- |
|
|
|
28,347 |
|
|
|
- |
|
|
|
28,347 |
|
Other interest-earning assets |
|
|
- |
|
|
|
- |
|
|
|
- |
|
|
|
- |
|
|
|
3,192 |
|
|
|
3,192 |
|
Total interest-earning assets |
|
|
223,788 |
|
|
|
90,549 |
|
|
|
23,100 |
|
|
|
337,437 |
|
|
|
1,221,876 |
|
|
|
1,559,313 |
|
|
|
|
|
|
|
|
|
|
|
|
|
|
|
|
|
|
|
|
|
|
|
|
|
|
Interest-bearing liabilities: |
|
|
|
|
|
|
|
|
|
|
|
|
|
|
|
|
|
|
|
|
|
|
|
|
NOW, savings, and money market deposits |
|
|
741,363 |
|
|
|
- |
|
|
|
- |
|
|
|
741,363 |
|
|
|
- |
|
|
|
741,363 |
|
Time deposits |
|
|
32,625 |
|
|
|
74,148 |
|
|
|
218,188 |
|
|
|
324,961 |
|
|
|
16,153 |
|
|
|
341,114 |
|
Trust preferred securities |
|
|
- |
|
|
|
15,464 |
|
|
|
- |
|
|
|
15,464 |
|
|
|
- |
|
|
|
15,464 |
|
Total interest-bearing liabilities |
|
|
773,988 |
|
|
|
89,612 |
|
|
|
218,188 |
|
|
|
1,081,788 |
|
|
|
16,153 |
|
|
|
1,097,941 |
|
|
|
|
|
|
|
|
|
|
|
|
|
|
|
|
|
|
|
|
|
|
|
|
|
|
Interest-sensitive gap |
|
$ | (550,200 | ) |
|
|
937 |
|
|
|
(195,088 | ) |
|
|
(744,351 | ) |
|
|
1,205,723 |
|
|
|
461,372 |
|
|
|
|
|
|
|
|
|
|
|
|
|
|
|
|
|
|
|
|
|
|
|
|
|
|
Cumulative interest-sensitive gap |
|
$ | (550,200 | ) |
|
|
(549,263 | ) |
|
|
(744,351 | ) |
|
|
(744,351 | ) |
|
|
461,372 |
|
|
|
|
|
|
|
|
|
|
|
|
|
|
|
|
|
|
|
|
|
|
|
|
|
|
|
|
|
|
Interest-earning assets as a percentage of interest-bearing liabilities |
|
|
28.91 | % |
|
|
101.05 | % |
|
|
10.59 | % |
|
|
31.19 | % |
|
|
7,564.39 |
|
|
% |
|
|
The Company manages its exposure to fluctuations in interest rates through policies established by the Asset/Liability Committee (“ALCO”) of the Bank. The ALCO meets quarterly and has the responsibility for approving asset/liability management policies, formulating and implementing strategies to improve balance sheet positioning and/or earnings and reviewing the interest rate sensitivity of the Company. The ALCO seeks to minimize interest rate risk between interest-earning assets and interest-bearing liabilities by attempting to minimize wide fluctuations in net interest income due to interest rate movements. The ability to control these fluctuations has a direct impact on the profitability of the Company. Management monitors this activity on a regular basis through analysis of its portfolios to determine the difference between rate sensitive assets and rate sensitive liabilities.
The Company’s rate sensitive assets are those earning interest at variable rates and those with contractual maturities within one year. Rate sensitive assets therefore include both loans and available for sale (“AFS”) securities. Rate sensitive liabilities include interest-bearing checking accounts, money market deposit accounts, savings accounts, time deposits and borrowed funds. At December 31, 2024, rate sensitive assets and rate sensitive liabilities totaled $1.61 billion and $1.09 billion, respectively.
| A-12 |
Included in the rate sensitive assets are $189.4 million in variable rate loans indexed to prime rate subject to immediate repricing upon changes by the FOMC. The Bank utilizes interest rate floors on certain variable rate loans to protect against further downward movements in the prime rate. At December 31, 2024, the Bank had $127.2 million in loans with interest rate floors. No floors were in effect on these loans at December 31, 2024.
An analysis of the Company’s financial condition and growth can be made by examining the changes and trends in interest-earning assets and interest-bearing liabilities. A discussion of these changes and trends follows.
Analysis of Financial Condition
Investment Securities. The composition of the investment securities portfolio reflects the Company’s investment strategy of maintaining an appropriate level of liquidity while providing a relatively stable source of income. The investment portfolio also provides a balance to interest rate risk and credit risk in other categories of the balance sheet while providing a vehicle for the investment of available funds, furnishing liquidity, and supplying securities to pledge as required collateral for certain deposits.
All of the Company’s investment securities are held in the available for sale (“AFS”) category. At December 31, 2024 the market value of AFS securities totaled $388.0 million, as compared to $391.9 million at December 31, 2023.
The Company’s investment portfolio consists of U.S. Government sponsored enterprise securities, municipal securities, U.S. Treasury securities, U.S. Government sponsored enterprise mortgage-backed securities, private label mortgage-backed securities, trust preferred securities and equity securities. AFS securities averaged $442.1 million in 2024 and $454.8 million in 2023.
Table 7 presents the book value of AFS securities held by the Company by maturity category at December 31, 2024. Yield information does not give effect to changes in fair value that are reflected as a component of shareholders’ equity. Yields are calculated on a tax equivalent basis. Yields and interest income on tax-exempt investments have been adjusted to a tax equivalent basis using an effective tax rate of 22.98% for securities that are both federal and state tax exempt and an effective tax rate of 20.48% for federal tax-exempt securities.
Table 7 - Maturity Distribution and Weighted Average Yield on Investments |
|
|
|
|
|
|
|
|
|
|
|
|||||||||||||||||||||||||||||
|
|
|
|
|
|
|
|
|
|
|
|
|
|
|
|
|
|
|
|
|
||||||||||||||||||||
|
|
|
|
|
|
After One Year |
|
|
After 5 Years |
|
|
|
|
|
|
|
|
|
||||||||||||||||||||||
|
|
One Year or Less |
|
|
Through 5 Years |
|
|
Through 10 Years |
|
|
After 10 Years |
|
|
Totals |
|
|||||||||||||||||||||||||
(Dollars in thousands) |
|
Amount |
|
|
Yield |
|
|
Amount |
|
|
Yield |
|
|
Amount |
|
|
Yield |
|
|
Amount |
|
|
Yield |
|
|
Amount |
|
|
Yield |
|
||||||||||
Book value: |
|
|
|
|
|
|
|
|
|
|
|
|
|
|
|
|
|
|
|
|
|
|
|
|
|
|
|
|
|
|
||||||||||
U.S. Treasuries |
|
|
- |
|
|
|
- |
|
|
|
7,257 |
|
|
|
1.20 | % |
|
|
- |
|
|
|
- |
|
|
|
- |
|
|
|
- |
|
|
|
7,257 |
|
|
|
1.20 | % |
U.S. Government sponsored enterprises |
|
|
2,991 |
|
|
|
3.02 | % |
|
|
198 |
|
|
|
1.78 | % |
|
|
4,416 |
|
|
|
2.68 | % |
|
|
1,127 |
|
|
|
6.52 | % |
|
|
8,732 |
|
|
|
3.46 | % |
GSE - Mortgage-backed securities |
|
|
- |
|
|
|
- |
|
|
|
5,052 |
|
|
|
2.19 | % |
|
|
24,836 |
|
|
|
2.17 | % |
|
|
195,904 |
|
|
|
3.88 | % |
|
|
225,792 |
|
|
|
3.58 | % |
Private label mortgage-backed securities |
|
|
5,000 |
|
|
|
5.60 | % |
|
|
- |
|
|
|
- |
|
|
|
- |
|
|
|
- |
|
|
|
36,767 |
|
|
|
5.24 | % |
|
|
41,767 |
|
|
|
5.27 | % |
State and political subdivisions |
|
|
- |
|
|
|
- |
|
|
|
11,452 |
|
|
|
2.58 | % |
|
|
55,574 |
|
|
|
2.07 | % |
|
|
37,429 |
|
|
|
1.88 | % |
|
|
104,455 |
|
|
|
1.85 | % |
Total securities |
|
$ | 7,991 |
|
|
|
4.31 | % |
|
|
23,959 |
|
|
|
2.09 | % |
|
|
84,826 |
|
|
|
2.35 | % |
|
|
271,227 |
|
|
|
4.23 | % |
|
|
388,003 |
|
|
|
3.25 | % |
Loans. The loan portfolio is the largest category of the Company’s earning assets and is comprised of commercial loans, real estate mortgage loans, real estate construction loans and consumer loans. The Bank makes loans and extensions of credit primarily within the Catawba Valley region of North Carolina, which encompasses Catawba, Alexander, Iredell and Lincoln counties and also in Mecklenburg, Wake, Rowan and Forsyth counties in North Carolina.
Although the Bank has a diversified loan portfolio, a substantial portion of the loan portfolio is collateralized by real estate, which is dependent upon the real estate market. Real estate mortgage loans include both commercial and residential mortgage loans. At December 31, 2024, the Bank had $121.5 million in residential mortgage loans, $115.0 million in home equity loans and $688.5 million in commercial mortgage loans, which include $541.1 million secured by commercial property and $147.4 million secured by residential property. All residential mortgage loans are originated as fully amortizing loans, with no negative amortization. The Bank also had construction and land development loans totaling $122.3 million at December 31, 2024.
The mortgage loans originated in the traditional banking offices are generally 15–30 year fixed rate loans with attributes that prevent the loans from being sellable in the secondary market. These factors may include higher loan-to-value ratio, limited documentation on income, non-conforming appraisal or non-conforming property type. These loans are generally made to existing Bank customers and have been originated throughout the Bank’s seven county service area, with no geographic concentration.
| A-13 |
As of December 31, 2024, gross loans outstanding were $1.14 billion, as compared to $1.09 billion at December 31, 2023. Average loans represented 69% and 68% of average total earning assets for the years ended December 31, 2024 and 2023, respectively. The Bank had $1.4 million and $686,000 in mortgage loans held for sale as of December 31, 2024 and 2023, respectively.
Table 8 identifies the maturities of all loans as of December 31, 2024 and addresses the sensitivity of these loans to changes in interest rates.
Table 8 - Maturity and Repricing Data for Loans |
|
|
|
|
|
|
|
|
|
|
|
|
|
|||||||
|
|
|
|
|
|
|
|
|
|
|
|
|
|
|
|
|||||
(Dollars in Thousands) |
|
Within one year or less |
|
|
After one year through five years |
|
|
After five years through 15 years |
|
|
After 15 years |
|
|
Total Loans |
|
|||||
Real estate loans |
|
|
|
|
|
|
|
|
|
|
|
|
|
|
|
|||||
Construction and land development |
|
$ | 39,182 |
|
|
$ | 58,438 |
|
|
$ | 24,388 |
|
|
$ | 320 |
|
|
$ | 122,328 |
|
Single-family residential |
|
|
134,740 |
|
|
|
132,315 |
|
|
|
71,864 |
|
|
|
45,590 |
|
|
|
384,509 |
|
Commercial |
|
|
52,377 |
|
|
|
325,983 |
|
|
|
88,958 |
|
|
|
4,126 |
|
|
|
471,444 |
|
Multifamily and farmland |
|
|
6,593 |
|
|
|
25,140 |
|
|
|
20,774 |
|
|
|
17,164 |
|
|
|
69,671 |
|
Total real estate loans |
|
|
232,892 |
|
|
|
541,876 |
|
|
|
205,984 |
|
|
|
67,200 |
|
|
|
1,047,952 |
|
|
|
|
|
|
|
|
|
|
|
|
|
|
|
|
|
|
|
|
|
|
Commercial loans (not secured by real estate) |
|
|
23,389 |
|
|
|
23,863 |
|
|
|
16,585 |
|
|
|
- |
|
|
|
63,837 |
|
Farm loans (not secured by real estate) |
|
|
151 |
|
|
|
131 |
|
|
|
119 |
|
|
|
- |
|
|
|
401 |
|
Consumer loans (not secured by real estate) |
|
|
2,589 |
|
|
|
3,150 |
|
|
|
736 |
|
|
|
- |
|
|
|
6,475 |
|
All other loans (not secured by real estate) |
|
|
12,195 |
|
|
|
6,560 |
|
|
|
984 |
|
|
|
- |
|
|
|
19,739 |
|
Total loans |
|
$ | 271,216 |
|
|
$ | 575,580 |
|
|
$ | 224,408 |
|
|
$ | 67,200 |
|
|
$ | 1,138,404 |
|
|
|
|
|
|
|
|
|
|
|
|
|
|
|
|
|
|
|
|
|
|
Total fixed rate loans |
|
$ | 57,428 |
|
|
$ | 557,284 |
|
|
$ | 190,123 |
|
|
$ | 67,200 |
|
|
$ | 872,035 |
|
Total floating rate loans |
|
|
213,788 |
|
|
|
18,296 |
|
|
|
34,285 |
|
|
|
|
|
|
|
266,369 |
|
Total loans |
|
$ | 271,216 |
|
|
$ | 575,580 |
|
|
$ | 224,408 |
|
|
$ | 67,200 |
|
|
$ | 1,138,404 |
|
In the normal course of business, there are various commitments outstanding to extend credit that are not reflected in the financial statements. At December 31, 2023, outstanding loan commitments totaled $367.5 million. Commitments to extend credit are agreements to lend to a customer as long as there is no violation of any condition established in the commitment contract. Commitments generally have fixed expiration dates or other termination clauses and may require payment of a fee. Since many of the commitments may expire without being drawn upon, the total commitment amounts do not necessarily represent future cash requirements. Additional information regarding commitments is provided below in the section entitled “Commitments and Contingencies” and in Note 11 to the Consolidated Financial Statements.
Allowance for Credit Losses (ACL). The allowance for credit losses reflects management’s assessment and estimate of the risks associated with extending credit and its evaluation of the quality of the loan portfolio. The Bank periodically analyzes the loan portfolio in an effort to review asset quality and to establish an allowance that management believes will be adequate in light of anticipated risks and loan losses. In assessing the adequacy of the allowance, size, quality and risk of loans in the portfolio are reviewed.
The allowance for credit losses on loans is a valuation account that is deducted from the loans' amortized cost basis to present the net amount expected to be collected on the loans. Loans are charged off against the allowance when management believes the uncollectibility of a loan balance is confirmed. Expected recoveries do not exceed the aggregate of amounts previously charged-off and expected to be charged-off. Accrued interest receivable is excluded from the estimate of credit losses. The allowance for credit losses represents management’s estimate of lifetime credit losses inherent in loans as of December 31, 2024. The allowance for credit losses is estimated by management using relevant available information, from both internal and external sources, relating to past events, current conditions, and reasonable and supportable forecasts. The Company measures expected credit losses for loans on a pooled basis when similar risk characteristics exist. The Company calculates the allowance for credit losses using a Weighted Average Remaining Maturity (“WARM”) methodology.
| A-14 |
Additionally, the allowance for credit losses calculation includes subjective adjustments for qualitative risk factors that are likely to cause estimated credit losses to differ from historical experience. These qualitative adjustments may increase or decrease reserve levels and include adjustments for: local, state and national economic outlook; levels and trends of delinquencies; trends in volume, mix and size of loans; seasoning of the loan portfolio; experience of staff; concentrations of credit; and interest rate risk.
The portion of the ACL balance attributable to qualitative factors was $5.2 million at December 31, 2024 and December 31, 2023. The risk factors are weighted as follows: Local, State and National Economic Outlook – 30%, Concentrations of Credit – 5%, Interest Rate Risk – 5%, Trends in Terms of Volume, Mix and Size of Loans – 15%, Seasoning of the Loan Portfolio – 10%, Experience of Staff – 10%, and Levels and Trends of Delinquencies – 25%. No changes to the risk status of any of the risk factors was made during year ended 2024.
Loans that do not share risk characteristics are evaluated on an individual basis. When management determines that foreclosure is probable and the borrower is experiencing financial difficulty, the expected credit losses are based on the fair value of collateral at the reporting date adjusted for selling costs as appropriate. There were no loans individually evaluated as of December 31, 2024, and two loans totaling $432,000 were individually evaluated as of December 31, 2023, which were fully reserved for at December 31, 2023.
Financial instruments include off-balance sheet credit instruments, such as commitments to make loans and commercial letters of credit issued to meet customer financing needs. The Company’s exposure to credit loss in the event of nonperformance by the other party to the financial instrument for off-balance sheet loan commitments represents the contractual amount of those instruments. Such financial instruments are recorded when they are funded.
The Company records an allowance for credit losses on off-balance sheet credit exposures, unless the commitments to extend credit are unconditionally cancelable. The allowance for credit losses on off-balance sheet credit exposures is estimated by loan segment at each balance sheet date under the current expected credit loss model using the same methodologies as portfolio loans, taking into consideration the likelihood that funding will occur as well as any third-party guarantees. The allowance for unfunded commitments is included in other liabilities on the Company’s consolidated balance sheets.
The allowance for credit losses on unfunded commitments was $1.1 million at December 31, 2024, compared to $1.8 million at December 31, 2023. The decrease in the allowance for credit losses on unfunded commitments was primarily due to a $503,000 decrease in the allowance for other construction loans and all land development and other land loans resulting from a $19.6 million decrease in unfunded commitments in this category during the year ended December 31, 2024.
Management uses several measures to assess and monitor the credit risks in the loan portfolio, including a loan grading system that begins upon loan origination and continues until the loan is collected or collectability becomes doubtful. Upon loan origination, the Bank’s originating loan officer evaluates the quality of the loan and assigns one of eight risk grades. The loan officer monitors the loan’s performance and credit quality and makes changes to the credit grade as conditions warrant. When originated or renewed, all loans over a certain dollar amount receive in-depth reviews and risk assessments by the Bank’s Credit Administration. Before making any changes in these risk grades, management considers assessments as determined by the third-party credit review firm (as described below), regulatory examiners and the Bank’s Credit Administration. Any issues regarding the risk assessments are addressed by the Bank’s senior credit administrators and factored into management’s decision to originate or renew the loan. The board of directors of the Bank (the “Bank Board”) reviews, on a monthly basis, an analysis of the Bank’s reserves relative to the range of reserves estimated by the Bank’s Credit Administration.
As an additional measure, the Bank engages an independent third party to review the underwriting, documentation and risk grading analyses. This independent third party reviews and evaluates loan relationships greater than or equal to $1.5 million as well as a periodic sample of commercial relationships with exposures below $1.5 million, excluding loans in default, and loans in process of litigation or liquidation. The third party’s evaluation and report is shared with management and the Bank Board.
Since the adoption of Current Expected Credit Loss (“CECL”) methodology on January 1, 2023, the allowance for credit losses represents management’s estimate of credit losses for the remaining estimated life of the Bank’s financial assets, including loan receivables and some off-balance sheet credit exposures. Estimating the amount of the allowance for credit losses requires significant judgment and the use of estimates related to historical experience, current conditions, reasonable and supportable forecasts, and the value of collateral on collateral-dependent loans. The loan portfolio also represents the largest asset type on our consolidated balance sheet. Credit losses are charged against the allowance, while recoveries of amounts previously charged off are credited to the allowance. A provision for credit losses is charged to operations based on management’s periodic evaluation of the factors previously mentioned, as well as other pertinent factors.
| A-15 |
There are many factors affecting the allowance for credit losses; some are quantitative while others require qualitative judgment. Although management believes its process for determining the allowance adequately considers all the potential factors that could potentially result in credit losses, the process includes subjective elements and is susceptible to significant change. To the extent actual outcomes differ from management estimates, additional provision for credit losses could be required that could adversely affect our earnings or financial position in future periods.
Various regulatory agencies, as an integral part of their examination process, periodically review the Bank’s allowance. Such agencies may require adjustments to the allowance based on their judgments of information available to them at the time of their examinations. Management believes it has established the allowance for credit losses pursuant to CECL, and has taken into account the views of its regulators and the current economic environment. Management considers the allowance adequate to cover the estimated losses inherent in the Bank’s loan portfolio as of the date of the financial statements. Although management uses the best information available to make evaluations, significant future additions to the allowance may be necessary based on changes in economic and other conditions, thus adversely affecting the operating results of the Company.
Table 9 presents an analysis of the allowance for loan losses, including charge-off activity.
Table 9 - Analysis of Allowance for Credit Losses |
|
|
|
|
|
|
|
|
|
|||
|
|
|
|
|
|
|
|
|
|
|||
(Dollars in thousands) |
|
2024 |
|
|
2023 |
|
|
2022 |
|
|||
Allowance for Credit losses at beginning of year |
|
$ | 12,811 |
|
|
$ | 10,494 |
|
|
$ | 9,355 |
|
|
|
|
|
|
|
|
|
|
|
|
|
|
Adjustment for CECL implementation |
|
|
- |
|
|
|
1,058 |
|
|
|
- |
|
|
|
|
|
|
|
|
|
|
|
|
|
|
Real estate loans: |
|
|
|
|
|
|
|
|
|
|
|
|
Single-family residential |
|
|
131 |
|
|
|
- |
|
|
|
128 |
|
Total real estate loans |
|
|
131 |
|
|
|
- |
|
|
|
128 |
|
Loans not secured by real estate: |
|
|
|
|
|
|
|
|
|
|
|
|
Commercial loans |
|
|
1,134 |
|
|
|
129 |
|
|
|
33 |
|
Consumer loans |
|
|
716 |
|
|
|
569 |
|
|
|
591 |
|
Total chargeoffs |
|
|
1,981 |
|
|
|
698 |
|
|
|
752 |
|
|
|
|
|
|
|
|
|
|
|
|
|
|
Recoveries of losses previously charged off: |
|
|
|
|
|
|
|
|
|
|
|
|
Real estate loans: |
|
|
|
|
|
|
|
|
|
|
|
|
Single-family residential |
|
|
129 |
|
|
|
171 |
|
|
|
229 |
|
Commercial |
|
|
202 |
|
|
|
6 |
|
|
|
9 |
|
Total real estate loans |
|
|
331 |
|
|
|
177 |
|
|
|
238 |
|
Loans not secured by real estate: |
|
|
|
|
|
|
|
|
|
|
|
|
Commercial loans |
|
|
55 |
|
|
|
67 |
|
|
|
72 |
|
Consumer loans |
|
|
165 |
|
|
|
147 |
|
|
|
109 |
|
Total recoveries |
|
|
551 |
|
|
|
391 |
|
|
|
419 |
|
Net loans charged off |
|
|
1,430 |
|
|
|
307 |
|
|
|
333 |
|
|
|
|
|
|
|
|
|
|
|
|
|
|
Provision for (recovery of)credit losses |
|
|
(285 | ) |
|
|
1,566 |
|
|
|
1,472 |
|
|
|
|
|
|
|
|
|
|
|
|
|
|
Allowance for credit losses at end of year |
|
$ | 11,096 |
|
|
$ | 12,811 |
|
|
$ | 10,494 |
|
|
|
|
|
|
|
|
|
|
|
|
|
|
Allowance for credit loss-loans |
|
$ | 9,995 |
|
|
$ | 11,041 |
|
|
$ | - |
|
Alowance for credit loss-unfunded loan commitments |
|
|
1,101 |
|
|
|
1,770 |
|
|
|
- |
|
Total allowance for credit losses |
|
$ | 11,096 |
|
|
$ | 12,811 |
|
|
$ | - |
|
|
|
|
|
|
|
|
|
|
|
|
|
|
Loans charged off net of recoveries, as |
|
|
|
|
|
|
|
|
|
|
|
|
a percent of average loans outstanding |
|
|
0.13 | % |
|
|
0.03 | % |
|
|
0.04 | % |
|
|
|
|
|
|
|
|
|
|
|
|
|
Allowance for loan losses as a percent |
|
|
|
|
|
|
|
|
|
|
|
|
of total loans outstanding at end of year |
|
|
0.88 | % |
|
|
1.01 | % |
|
|
1.02 | % |
| A-16 |
Table 10 presents the allocation of the allowance for credit losses on loans at December 31, 2024.
Table 10 - Allocation of Allowance for Credit Losses on Loans |
|
|
|
|
|
|
|
|
|
|
|
|
|
|
||||||||||
(Dollars in thousands) |
|
|
|
|
|
|
|
|
|
|
|
|
|
|
|
|||||||||
|
|
|
|
|
|
|
|
|
|
|
|
|
|
|
|
|||||||||
|
|
December 31, 2024 |
|
|
Percent of Total Loans In Category to Total Loans Outstanding |
|
|
December 31, 2023 |
|
|
Percent of Total Loans In Category to Total Loans Outstanding |
|
|
December 31, 2022 |
|
|
Percent of Total Loans In Category to Total Loans Outstanding |
|
||||||
Construction and land development |
|
$ | 3,385 |
|
|
|
11 | % |
|
|
3,913 |
|
|
|
12 | % |
|
|
1,415 |
|
|
|
11 | % |
Single-family residential |
|
|
3,386 |
|
|
|
34 | % |
|
|
3,484 |
|
|
|
34 | % |
|
|
3,085 |
|
|
|
33 | % |
Commercial |
|
|
2,322 |
|
|
|
41 | % |
|
|
2,317 |
|
|
|
39 | % |
|
|
3,207 |
|
|
|
39 | % |
Multifamily and farmland |
|
|
246 |
|
|
|
6 | % |
|
|
268 |
|
|
|
6 | % |
|
|
164 |
|
|
|
6 | % |
Commercial |
|
|
446 |
|
|
|
5 | % |
|
|
812 |
|
|
|
6 | % |
|
|
657 |
|
|
|
8 | % |
Farm |
|
|
1 |
|
|
|
0 | % |
|
|
2 |
|
|
|
0 | % |
|
|
- |
|
|
|
0 | % |
Consumer |
|
|
134 |
|
|
|
1 | % |
|
|
150 |
|
|
|
1 | % |
|
|
204 |
|
|
|
1 | % |
All other |
|
|
75 |
|
|
|
2 | % |
|
|
95 |
|
|
|
2 | % |
|
|
1,762 |
|
|
|
2 | % |
|
|
|
|
|
|
|
|
|
|
|
|
|
|
|
|
|
|
|
|
|
|
|
|
|
Total allowance for credit losses on loans |
|
$ | 9,995 |
|
|
|
100 | % |
|
|
11,041 |
|
|
|
100 | % |
|
|
10,494 |
|
|
|
100 | % |
Non-performing Assets. Non-performing assets were $4.8 million or 0.29% of total assets at December 31, 2024, compared to $3.9 million or 0.24% of total assets December 31, 2023. Non-accrual loans over $250,000 are individually evaluated for specific reserves. Non-performing assets include $3.7 million in residential mortgage loans, $463,000 in commercial mortgage loans, $257,000 in other loans, and $369,000 in other real estate owned at December 31, 2024, compared to $3.3 million in residential mortgage loans, $76,000 in commercial mortgage loans, and $464,000 in other loans at December 31, 2023. The Bank had no other real estate owned at December 31, 2023. The Bank had no repossessed assets as of December 31, 2024 and 2023.
At December 31, 2024, the Bank had non-performing loans, defined as non-accrual and accruing loans past due more than 90 days, of $4.4 million or 0.39% of total loans. Non-performing loans at December 31, 2023 were $3.9 million or 0.36% of total loans.
Management continually monitors the loan portfolio to ensure that all loans potentially having a material adverse impact on future operating results, liquidity or capital resources have been classified as non-performing. Should economic conditions deteriorate, the inability of distressed customers to service their existing debt could cause higher levels of non-performing loans. Management expects the future level of non-accrual loans to continue to be in-line with the level of non-accrual loans at December 31, 2024 and 2023.
It is the general policy of the Bank to stop accruing interest income when a loan is placed on non-accrual status and any interest previously accrued but not collected is reversed against current income. Generally, a loan is placed on non-accrual status when it is over 90 days past due and there is reasonable doubt that all principal will be collected.
Deposits. The Bank primarily uses deposits to fund its loan and investment portfolios. The Bank offers a variety of deposit accounts to individuals and businesses. Deposit accounts include checking, savings, money market and time deposits. Deposits were $1.48 billion as of December 31, 2024, compared to $1.39 billion as of December 31, 2023. Core deposits, a non-GAAP measure, which include noninterest-bearing demand deposits, NOW, MMDA, savings and non-brokered certificates of deposit of denominations of $250,000 or less, were $1.34 billion at December 31, 2024, compared to $1.24 billion at December 31, 2023. Management believes it is useful to calculate and present core deposits because of the positive impact this low cost funding source provides to the Bank’s overall cost of funds and profitability.
Certificates of deposit in amounts of more than $250,000 totaled $145.9 million at December 31, 2024, compared to $148.9 million at December 31, 2023. Other time deposits totaled $195.2 million at December 31, 2024, compared to $190.2 million at December 31, 2023.
Table 11 is a summary of the maturity distribution of time deposits in amounts of more than $250,000 as of December 31, 2024.
Table 11 - Maturities of Time Deposits over $250,000 |
|
|
|
|
|
|
|
|
|
(Dollars in thousands) |
|
2024 |
|
|
Three months or less |
|
$ | 43,504 |
|
Over three months through six months |
|
|
99,032 |
|
Over six months through twelve months |
|
|
3,146 |
|
Over twelve months |
|
|
257 |
|
Total |
|
$ | 145,939 |
|
| A-17 |
Estimated uninsured deposits totaled $396.5 million, or 26.71% of total deposits, at December 31, 2024, compared to $382.1 million, or 27.45% of total deposits, at December 31, 2023. Uninsured amounts are estimated based on the portion of account balances in excess of FDIC insurance limits. The Bank did not have any significant deposit concentrations based on the North American Industry Classification System at December 31, 2024 and 2023. The Bank has two customer relationships that had deposits totaling $117.0 million, or 7.88% of total deposits, at December 31, 2024, and $106.9 million, or 7.68% of total deposits, at December 31, 2023.
Borrowed Funds. The Bank has access to various short-term borrowings, including the purchase of federal funds and borrowing arrangements from the FHLB and other financial institutions. There were no FHLB borrowings outstanding at December 31, 2024 and 2023. Average FHLB borrowings for 2024 and 2023 were zero. Additional information regarding FHLB borrowings is provided in Note 7 to the Consolidated Financial Statements.
The Bank had no borrowings from the FRB at December 31, 2024 and 2023. FRB borrowings are collateralized by a blanket assignment on all qualifying loans that the Bank owns which are not pledged to the FHLB.
Securities sold under agreements to repurchase were zero at December 31, 2024, compared to $86.7 million at December 31, 2023. The decrease in securities sold under agreements to repurchase is due to customers transferring funds from securities sold under agreements to repurchase to deposits held via the IntraFi network’s Insured Cash Sweep (“ICS”) program during the year ended December 31, 2024.
Junior subordinated debentures were $15.5 million at December 31, 2024 and December 31, 2023.
Contractual Obligations and Off-Balance Sheet Arrangements. The Company’s contractual obligations include junior subordinated debentures, as well as certain payments under current lease agreements. Other commitments include commitments to extend credit.
The Company enters into derivative contracts to manage various financial risks. A derivative is a financial instrument that derives its cash flows, and therefore its value, by reference to an underlying instrument, index or referenced interest rate. Derivative contracts are carried at fair value on the consolidated balance sheet with the fair value representing the net present value of expected future cash receipts or payments based on market interest rates as of the balance sheet date. Derivative contracts are written in amounts referred to as notional amounts, which only provide the basis for calculating payments between counterparties and are not a measure of financial risk. Therefore, the derivative amounts recorded on the balance sheet do not represent the amounts that may ultimately be paid under these contracts. Further discussions of derivative instruments are included above in the section entitled “Asset Liability and Interest Rate Risk Management” beginning on page A-12 and in Note 1 to the Consolidated Financial Statements. There were no derivatives at December 31, 2024 or 2023.
Capital Resources. Shareholders’ equity was $130.6 million, or 7.90% of total assets, at December 31, 2024, compared to $121.0 million, or 7.40% of total assets, at December 31, 2023.
Average shareholders’ equity as a percentage of total average assets was 7.85%, 7.24% and 7.45% for 2024, 2023 and 2022, respectively. The return on average shareholders’ equity was 12.59% at December 31, 2024, as compared to 13.37% and 13.01% at December 31, 2023 and December 31, 2022, respectively. Total cash dividends paid on common stock were $5.0 million, $5.1 million and $4.9 million during 2024, 2023 and 2022, respectively.
The Board of Directors, at its discretion, can issue up to 5,000,000 shares of preferred stock. The Board is authorized to determine the number of shares, voting powers, designations, preferences, limitations and relative rights.
In the first quarter of 2023, the Board of Directors authorized a stock repurchase program, whereby up to $2.0 million was allocated to repurchase the Company’s common stock. In the fourth quarter of 2023, the Board of Directors authorized an additional $2.0 million to be allocated to repurchase the Company’s common stock, which increased the total amount authorized in 2023 to $4.0 million. The Company repurchased approximately $4.0 million, or 181,022 shares of its common stock, under this stock repurchase program through March 31, 2024, when the program expired.
In June of 2024, the Board of Directors authorized a stock repurchase program, whereby up to $2.0 million may be allocated to repurchase the Company’s common stock. Any purchases under the Company’s stock repurchase program may be made periodically as permitted by securities laws and other legal requirements in the open market or in privately-negotiated transactions. The timing and amount of any repurchase of shares will be determined by the Company’s management, based on its evaluation of market conditions and other factors. The stock repurchase program may be suspended at any time or from time-to-time without prior notice. The Company had not repurchased any shares of its common stock under this stock repurchase program as of December 31, 2024.
| A-18 |
In 2013, the FRB approved its final rule on the Basel III capital standards, which implement changes to the regulatory capital framework for banking organizations. The Basel III capital standards, which became effective January 1, 2015, include new risk-based capital and leverage ratios, which were phased in from 2015 to 2019. The new minimum capital level requirements applicable to the Company and the Bank under the final rules are as follows: (i) a new common equity Tier 1 capital ratio of 4.5%; (ii) a Tier 1 capital ratio of 6% (increased from 4%); (iii) a total risk based capital ratio of 8% (unchanged from previous rules); and (iv) a Tier 1 leverage ratio of 4% (unchanged from previous rules). An additional capital conservation buffer was added to the minimum requirements for capital adequacy purposes beginning on January 1, 2016 and was phased in through 2019 (increasing by 0.625% on January 1, 2016 and each subsequent January 1, until it reached 2.5% on January 1, 2019). This resulted in the following minimum ratios beginning in 2019: (i) a common equity Tier 1 capital ratio of 7.0%, (ii) a Tier 1 capital ratio of 8.5%, and (iii) a total capital ratio of 10.5%. Under the final rules, institutions would be subject to limitations on paying dividends, engaging in share repurchases, and paying discretionary bonuses if its capital level falls below the buffer amount. These limitations establish a maximum percentage of eligible retained earnings that could be utilized for such actions.
Under the regulatory capital guidelines, financial institutions are currently required to maintain a total risk-based capital ratio of 8.0% or greater, with a Tier 1 risk-based capital ratio of 6.0% or greater and a common equity Tier 1 capital ratio of 4.5% or greater, as required by the Basel III capital standards referenced above. Tier 1 capital is generally defined as shareholders’ equity and trust preferred securities less all intangible assets and goodwill. Tier 1 capital includes $15.0 million in trust preferred securities at December 31, 2024 and December 31, 2023. The Company’s Tier 1 capital ratio was 14.47% and 13.94% at December 31, 2024 and December 31, 2023, respectively. Total risk-based capital is defined as Tier 1 capital plus supplementary capital. Supplementary capital, or Tier 2 capital, consists of the Company’s allowance for credit losses, not exceeding 1.25% of the Company’s risk-weighted assets. Total risk-based capital ratio is therefore defined as the ratio of total capital (Tier 1 capital and Tier 2 capital) to risk-weighted assets. The Company’s total risk-based capital ratio was 15.34% and 14.96% at December 31, 2024 and December 31, 2023, respectively. The Company’s common equity Tier 1 capital consists of common stock and retained earnings. The Company’s common equity Tier 1 capital ratio was 13.29% and 12.75% at December 31, 2024 and December 31, 2023, respectively. Financial institutions are also required to maintain a leverage ratio of Tier 1 capital to total average assets of 4.0% or greater. The Company’s Tier 1 leverage capital ratio was 10.88% and 10.51% at December 31, 2024 and December 31, 2023, respectively.
The Bank’s Tier 1 risk-based capital ratio was 14.35% and 13.83% at December 31, 2024 and December 31, 2023, respectively. The total risk-based capital ratio for the Bank was 15.22% and 14.85% at December 31, 2024 and December 31, 2023, respectively. The Bank’s common equity Tier 1 capital ratio was 14.35% and 13.83% at December 31, 2024 and December 31, 2023, respectively. The Bank’s Tier 1 leverage capital ratio was 10.71% and 10.35% at December 31, 2024 and December 31, 2023, respectively.
A bank is considered to be “well capitalized” if it has a total risk-based capital ratio of 10.0% or greater, a Tier 1 risk-based capital ratio of 8.0% or greater, a common equity Tier 1 capital ratio of 6.5% or greater and a leverage ratio of 5.0% or greater. Based upon these guidelines, the Bank was considered to be “well capitalized” at December 31, 2024.
| A-19 |
PEOPLES BANCORP OF NORTH CAROLINA, INC. | |
Consolidated Financial Statements | |
December 31, 2024, 2023 and 2022 | |
INDEX | |
PAGE(S) |
|
Reports of Independent Registered Public Accounting Firm on the Consolidated Financial Statements |
A-20- A-24 |
|
|
Financial Statements |
|
|
|
A-25 |
|
|
|
Consolidated Statements of Earnings for the years ended December 31, 2024, 2023 and 2022 |
A-26 |
|
|
A-27 |
|
|
|
A-28 |
|
|
|
Consolidated Statements of Cash Flows for the years ended December 31, 2024, 2023 and 2022 |
A-29 - A-30 |
|
|
A-31 - A-63 |
|
| A-20 |
Report of Independent Registered Public Accounting Firm
Shareholders and the Board of Directors
Peoples Bancorp of North Carolina, Inc.
Opinion on the Consolidated Financial Statements
We have audited the accompanying consolidated balance sheet of Peoples Bancorp of North Carolina, Inc. (the “Company”) as of December 31, 2024, the related consolidated statements of earnings, comprehensive income (loss), changes in shareholders’ equity and cash flows for the year ended December 31, 2024, and the related notes (collectively referred to as the “financial statements”). In our opinion, the financial statements referred to above present fairly, in all material respects, the financial position of the Company as of December 31, 2024, and the results of its operations and its cash flows for the year ended December 31, 2024, in conformity with accounting principles generally accepted in the United States of America.
We also have audited the adjustments to the 2023 and 2022 financial statements to retrospectively apply the change in accounting for segment reporting, as described in Note 16. In our opinion, such adjustments are appropriate and have been properly applied. We were not engaged to audit, review, or apply any procedures to the 2023 and 2022 financial statements of the Company other than with respect to these adjustments and, accordingly, we do not express an opinion or any other form of assurance on the 2023 and 2022 financial statements taken as a whole.
Basis for Opinion
These financial statements are the responsibility of the Company’s management. Our responsibility is to express an opinion on the Company’s financial statements based on our audits.
We are a public accounting firm registered with the Public Company Accounting Oversight Board (United States) (“PCAOB”) and are required to be independent with respect to the Company in accordance with the U.S. federal securities laws and the applicable rules and regulations of the Securities and Exchange Commission and the PCAOB.
We conducted our audits in accordance with the standards of the PCAOB. Those standards require that we plan and perform the audit to obtain reasonable assurance about whether the financial statements are free of material misstatement, whether due to error or fraud.
Our audits included performing procedures to assess the risks of material misstatement of the financial statements, whether due to error or fraud, and performing procedures that respond to those risks. Such procedures include examining, on a test basis, evidence regarding the amounts and disclosures in the financial statements. Our audits also included evaluating the accounting principles used and significant estimates made by management, as well as evaluating the overall presentation of the financial statements. We believe that our audits provide a reasonable basis for our opinion.
Critical Audit Matter
The critical audit matter communicated below is a matter arising from the current-period audit of the financial statements that was communicated or required to be communicated to the audit committee and that: (1) relates to accounts or disclosures that are material to the financial statements and (2) involved our especially challenging, subjective, or complex judgments. The communication of the critical audit matter does not alter in any way our opinion on the financial statements, taken as a whole, and we are not, by communicating the critical audit matter below, providing separate opinions on the critical audit matter or on the accounts or disclosures to which it relates.
| A-21 |
Allowance for Credit Losses on Loans
As further described in Notes 1 and 3 to the consolidated financial statements, the Company’s loan portfolio and the associated allowance for credit losses (“ACL”) were $1.14 billion and $10.0 million as of December 31, 2024, respectively. The ACL measures expected credit losses on a collective pool basis when similar risk characteristics exist. The Company calculates the ACL using a Weighted Average Remaining Maturity (“WARM”) methodology. The calculation of the ACL also includes subjective adjustments for qualitative risk factors that are likely to cause estimated credit losses to differ from historical experience. These qualitative adjustments may increase or reduce reserve levels and include adjustments for: local, state and national economic outlook; levels and trends of delinquencies; trends in volume, mix and size of loans; seasoning of the loan portfolio; experience of staff; concentrations of credit; and interest rate risk.
We identified the allowance for credit losses, and more specifically the qualitative factor adjustments applied in the allowance, as a critical audit matter. The principal consideration for our determination of the qualitative factor adjustments as a critical audit matter is the high degree of judgment and subjectivity relating to management’s identification and measurement of the qualitative factors. Therefore, applying audit procedures required a higher degree of auditor judgment and subjectivity due to the nature and extent of audit evidence and effort required to address this matter.
The primary audit procedures we performed to address this critical audit matter included:
· |
Obtained an understanding of the Company’s process for establishing the ACL, including the identification, basis for development and related adjustments of the qualitative factor components of the ACL. |
|
|
· |
Evaluated the reasonableness of management’s application of qualitative factors to the ACL, including the comparison of factors considered by management to third party or internal sources, where applicable, as well as evaluated the appropriateness of the qualitative factor adjustments. |
|
|
· |
Evaluated the mathematical accuracy of the ACL, including the mathematical application of the qualitative adjustments on the loan segments and the reasonableness of assumptions and judgments used in the forecast components. |
/s/ Forvis Mazars, LLP
We have served as the Company’s auditor since 2024.
Charlotte, North Carolina
March 12, 2025
| A-22 |
Report of Independent Registered Public Accounting Firm
To the Shareholders and the Board of Directors of Peoples Bancorp of North Carolina, Inc.
Opinion on the Financial Statements
We have audited, before the effects of the adjustments to retrospectively apply the changes in the Company's disclosures about segments and related information in Note 16, the accompanying consolidated balance sheet of Peoples Bancorp of North Carolina, Inc. and its subsidiaries (the Company) as of December 31, 2023, the related consolidated statements of earnings, comprehensive income (loss), changes in shareholders' equity and cash flows for each of the two years in the period ended December 31, 2023, and the related notes to the consolidated financial statements (collectively, the financial statements). The 2023 financial statements before the effects of the adjustments described in Note 16 are not presented herein. In our opinion, before the effects of the adjustments to retrospectively apply the changes in the Company's disclosures about segments and related information in Note 16, the financial statements present fairly, in all material respects, the financial position of the Company as of December 31, 2023, and the results of its operations and its cash flows for each of the two years in the period ended December 31, 2023, in conformity with accounting principles generally accepted in the United States of America.
We were not engaged to audit, review, or apply any procedures to retrospectively apply the changes in the Company's disclosures about segments and related information in Note 16 and, accordingly we do not express an opinion or any other form of assurance about whether such adjustments are appropriate and have been properly applied. Those adjustments were audited by other auditors.
Basis for Opinion
These financial statements are the responsibility of the Company’s management. Our responsibility is to express an opinion on the Company’s financial statements based on our audits. We are a public accounting firm registered with the Public Company Accounting Oversight Board (United States) (PCAOB) and are required to be independent with respect to the Company in accordance with U.S. federal securities laws and the applicable rules and regulations of the Securities and Exchange Commission and the PCAOB.
| A-23 |
We conducted our audits in accordance with the standards of the PCAOB. Those standards require that we plan and perform the audit to obtain reasonable assurance about whether the financial statements are free of material misstatement, whether due to error or fraud. Our audits included performing procedures to assess the risks of material misstatement of the financial statements, whether due to error or fraud, and performing procedures that respond to those risks. Such procedures included examining, on a test basis, evidence regarding the amounts and disclosures in the financial statements. Our audits also included evaluating the accounting principles used and significant estimates made by management, as well as evaluating the overall presentation of the financial statements. We believe that our audits provide a reasonable basis for our opinion.
/s/ Elliott Davis, PLLC
We served as the Company’s auditor from 2015 to 2023.
Raleigh, North Carolina
March 7, 2024
| A-24 |
PEOPLES BANCORP OF NORTH CAROLINA, INC. | ||||||||
|
|
|
|
|
||||
Consolidated Balance Sheets | ||||||||
|
|
|
|
|
||||
December 31, 2024 and December 31, 2023 | ||||||||
|
|
|
|
|
||||
(Dollars in thousands) | ||||||||
|
|
December 31, |
|
|
December 31, |
|
||
Assets |
|
2024 |
|
|
2023 |
|
||
|
|
(Audited) |
|
|
(Audited) |
|
||
|
|
|
|
|
|
|
||
Cash and due from banks |
|
$ | 30,919 |
|
|
|
32,819 |
|
Interest-bearing deposits |
|
|
28,347 |
|
|
|
49,556 |
|
Cash and cash equivalents |
|
|
59,266 |
|
|
|
82,375 |
|
|
|
|
|
|
|
|
|
|
Investment securities available for sale |
|
|
388,003 |
|
|
|
391,924 |
|
Other investments |
|
|
2,728 |
|
|
|
2,874 |
|
Total securities |
|
|
390,731 |
|
|
|
394,798 |
|
|
|
|
|
|
|
|
|
|
Mortgage loans held for sale |
|
|
1,367 |
|
|
|
686 |
|
|
|
|
|
|
|
|
|
|
Loans |
|
|
1,138,404 |
|
|
|
1,093,066 |
|
Less allowance for credit losses |
|
|
(9,995 | ) |
|
|
(11,041 | ) |
Net loans |
|
|
1,128,409 |
|
|
|
1,082,025 |
|
|
|
|
|
|
|
|
|
|
Premises and equipment, net |
|
|
14,847 |
|
|
|
16,702 |
|
Cash surrender value of life insurance |
|
|
17,675 |
|
|
|
18,134 |
|
Other real estate |
|
|
369 |
|
|
|
- |
|
Right of use lease asset |
|
|
4,013 |
|
|
|
4,731 |
|
Accrued interest receivable and other assets |
|
|
35,285 |
|
|
|
36,459 |
|
Total assets |
|
$ | 1,651,962 |
|
|
|
1,635,910 |
|
|
|
|
|
|
|
|
|
|
Liabilities and Shareholders' Equity |
|
|
|
|
|
|
|
|
|
|
|
|
|
|
|
|
|
Deposits: |
|
|
|
|
|
|
|
|
Noninterest-bearing demand |
|
$ | 402,254 |
|
|
|
432,687 |
|
Interest-bearing demand, MMDA & savings |
|
|
741,363 |
|
|
|
620,244 |
|
Time, over $250,000 |
|
|
145,939 |
|
|
|
148,904 |
|
Other time |
|
|
195,175 |
|
|
|
190,210 |
|
Total deposits |
|
|
1,484,731 |
|
|
|
1,392,045 |
|
|
|
|
|
|
|
|
|
|
Securities sold under agreements to repurchase |
|
|
- |
|
|
|
86,715 |
|
Junior subordinated debentures |
|
|
15,464 |
|
|
|
15,464 |
|
Lease liability |
|
|
4,136 |
|
|
|
4,832 |
|
Accrued interest payable and other liabilities |
|
|
17,068 |
|
|
|
15,838 |
|
Total liabilities |
|
|
1,521,399 |
|
|
|
1,514,894 |
|
|
|
|
|
|
|
|
|
|
Commitments and Contingencies |
|
|
|
|
|
|
|
|
|
|
|
|
|
|
|
|
|
Shareholders' equity: |
|
|
|
|
|
|
|
|
Preferred stock, no par value; authorized 5,000,000 shares; no shares issued and outstanding |
|
|
- |
|
|
|
- |
|
Common stock, no par value; authorized 20,000,000 shares; issued and outstanding 5,457,646 shares at December 31, 2024 and 5,534,499 shares at December 31, 2023 |
|
|
48,658 |
|
|
|
50,625 |
|
Common stock held by deferred compensation trust, at cost; 158,580 shares at December 31, 2024 and 163,702 shares at December 31, 2023 |
|
|
(1,757 | ) |
|
|
(1,910 | ) |
Deferred compensation |
|
|
1,757 |
|
|
|
1,910 |
|
Retained earnings |
|
|
121,062 |
|
|
|
109,756 |
|
Accumulated other comprehensive loss |
|
|
(39,157 | ) |
|
|
(39,365 | ) |
Total shareholders' equity |
|
|
130,563 |
|
|
|
121,016 |
|
|
|
|
|
|
|
|
|
|
Total liabilities and shareholders' equity |
|
$ | 1,651,962 |
|
|
|
1,635,910 |
|
|
|
|
|
|
|
|
|
|
See accompanying Notes to Consolidated Financial Statements. | ||||||||
| A-25 |
PEOPLES BANCORP OF NORTH CAROLINA, INC. | ||||||||||||
|
|
|
|
|
|
|
||||||
Consolidated Statements of Earnings | ||||||||||||
|
|
|
|
|
|
|
||||||
For the Years Ended December 31, 2024, 2023 and 2022 | ||||||||||||
|
|
|
|
|
|
|
||||||
(Dollars in thousands, except per share amounts) | ||||||||||||
|
|
|
|
|
||||||||
|
|
2024 |
|
|
2023 |
|
|
2022 |
|
|||
|
|
(Audited) |
|
|
(Audited) |
|
|
(Audited) |
|
|||
|
|
|
|
|
|
|
|
|
|
|||
Interest income: |
|
|
|
|
|
|
|
|
|
|||
Interest and fees on loans |
|
$ | 62,920 |
|
|
|
55,507 |
|
|
|
43,077 |
|
Interest on due from banks |
|
|
2,796 |
|
|
|
2,216 |
|
|
|
2,223 |
|
Interest on investment securities: |
|
|
|
|
|
|
|
|
|
|
|
|
U.S. Government sponsored enterprises |
|
|
9,979 |
|
|
|
9,365 |
|
|
|
4,150 |
|
States and political subdivisions |
|
|
2,779 |
|
|
|
2,949 |
|
|
|
4,075 |
|
Other |
|
|
2,259 |
|
|
|
1,825 |
|
|
|
906 |
|
Total interest income |
|
|
80,733 |
|
|
|
71,862 |
|
|
|
54,431 |
|
|
|
|
|
|
|
|
|
|
|
|
|
|
Interest expense: |
|
|
|
|
|
|
|
|
|
|
|
|
Now, MMDA & savings deposits |
|
|
10,237 |
|
|
|
6,731 |
|
|
|
2,019 |
|
Time deposits |
|
|
14,316 |
|
|
|
7,916 |
|
|
|
562 |
|
Junior subordinated debentures |
|
|
1,116 |
|
|
|
1,079 |
|
|
|
529 |
|
Other |
|
|
985 |
|
|
|
1,417 |
|
|
|
213 |
|
Total interest expense |
|
|
26,654 |
|
|
|
17,143 |
|
|
|
3,323 |
|
|
|
|
|
|
|
|
|
|
|
|
|
|
Net interest income |
|
|
54,079 |
|
|
|
54,719 |
|
|
|
51,108 |
|
|
|
|
|
|
|
|
|
|
|
|
|
|
Provision for (recovery of) credit losses |
|
|
(285 | ) |
|
|
1,566 |
|
|
|
1,472 |
|
|
|
|
|
|
|
|
|
|
|
|
|
|
Net interest income after provision for credit losses |
|
|
54,364 |
|
|
|
53,153 |
|
|
|
49,636 |
|
|
|
|
|
|
|
|
|
|
|
|
|
|
Non-interest income: |
|
|
|
|
|
|
|
|
|
|
|
|
Service charges |
|
|
5,653 |
|
|
|
5,496 |
|
|
|
5,290 |
|
Other service charges and fees |
|
|
685 |
|
|
|
697 |
|
|
|
734 |
|
Gain ( loss) on sale of securities, net |
|
|
5 |
|
|
|
(2,488 | ) |
|
|
- |
|
Mortgage banking income |
|
|
357 |
|
|
|
301 |
|
|
|
393 |
|
Insurance and brokerage commissions |
|
|
989 |
|
|
|
929 |
|
|
|
945 |
|
Appraisal management fee income |
|
|
11,691 |
|
|
|
9,592 |
|
|
|
11,663 |
|
Gain (loss) on sale of premises and equipment |
|
|
- |
|
|
|
184 |
|
|
|
(85 | ) |
Miscellaneous |
|
|
8,335 |
|
|
|
8,203 |
|
|
|
7,749 |
|
Total non-interest income |
|
|
27,715 |
|
|
|
22,914 |
|
|
|
26,689 |
|
|
|
|
|
|
|
|
|
|
|
|
|
|
Non-interest expense: |
|
|
|
|
|
|
|
|
|
|
|
|
Salaries and employee benefits |
|
|
28,209 |
|
|
|
26,640 |
|
|
|
26,130 |
|
Occupancy |
|
|
8,686 |
|
|
|
7,962 |
|
|
|
8,048 |
|
Professional fees |
|
|
2,316 |
|
|
|
1,716 |
|
|
|
1,915 |
|
Advertising |
|
|
791 |
|
|
|
750 |
|
|
|
693 |
|
Debit card expense |
|
|
1,391 |
|
|
|
1,255 |
|
|
|
1,224 |
|
FDIC insurance |
|
|
764 |
|
|
|
745 |
|
|
|
461 |
|
Appraisal management fee expense |
|
|
9,263 |
|
|
|
7,559 |
|
|
|
9,264 |
|
Other |
|
|
9,730 |
|
|
|
9,517 |
|
|
|
8,295 |
|
Total non-interest expense |
|
|
61,150 |
|
|
|
56,144 |
|
|
|
56,030 |
|
|
|
|
|
|
|
|
|
|
|
|
|
|
Earnings before income taxes |
|
|
20,929 |
|
|
|
19,923 |
|
|
|
20,295 |
|
|
|
|
|
|
|
|
|
|
|
|
|
|
Income tax expense |
|
|
4,576 |
|
|
|
4,377 |
|
|
|
4,172 |
|
|
|
|
|
|
|
|
|
|
|
|
|
|
Net earnings |
|
$ | 16,353 |
|
|
|
15,546 |
|
|
|
16,123 |
|
|
|
|
|
|
|
|
|
|
|
|
|
|
Basic net earnings per share |
|
$ | 3.08 |
|
|
|
2.87 |
|
|
|
2.94 |
|
Diluted net earnings per share |
|
$ | 2.98 |
|
|
|
2.77 |
|
|
|
2.85 |
|
Cash dividends declared per share |
|
$ | 0.92 |
|
|
|
0.91 |
|
|
|
0.87 |
|
|
|
|
|
|
|
|
|
|
|
|
|
|
See accompanying Notes to Consolidated Financial Statements. | ||||||||||||
| A-26 |
PEOPLES BANCORP OF NORTH CAROLINA, INC. | ||||||||||||
|
|
|
|
|
|
|
||||||
Consolidated Statements of Comprehensive Income (Loss) | ||||||||||||
|
|
|
|
|
|
|
||||||
For the Years Ended December 31, 2024, 2023 and 2022 | ||||||||||||
|
|
|
|
|
|
|
||||||
(Dollars in thousands) | ||||||||||||
|
|
|
|
|
||||||||
|
|
2024 |
|
|
2023 |
|
|
2022 |
|
|||
|
|
|
|
|
|
|
|
|
|
|||
Net earnings |
|
$ | 16,353 |
|
|
|
15,546 |
|
|
|
16,123 |
|
|
|
|
|
|
|
|
|
|
|
|
|
|
Other comprehensive income (loss): |
|
|
|
|
|
|
|
|
|
|
|
|
|
|
|
|
|
|
|
|
|
|
|
|
|
Unrealized holding gains (losses) on securities available for sale |
|
|
275 |
|
|
|
8,199 |
|
|
|
(61,919 | ) |
|
|
|
|
|
|
|
|
|
|
|
|
|
Reclassification adjustment for (gains) losses on securities available for sale included in net earnings, net |
|
|
(5 | ) |
|
|
2,488 |
|
|
|
- |
|
|
|
|
|
|
|
|
|
|
|
|
|
|
Total other comprehensive income (loss), before income taxes |
|
|
270 |
|
|
|
10,687 |
|
|
|
(61,919 | ) |
|
|
|
|
|
|
|
|
|
|
|
|
|
Income tax expense (benefit) related to other comprehensive income (loss): |
|
|
|
|
|
|
|
|
|
|
|
|
|
|
|
|
|
|
|
|
|
|
|
|
|
Unrealized holding gain (losses) on securities available for sale |
|
|
63 |
|
|
|
1,884 |
|
|
|
(14,226 | ) |
|
|
|
|
|
|
|
|
|
|
|
|
|
Reclassification adjustment for (gains) losses on securities available for sale included in net earnings |
|
|
(1 | ) |
|
|
571 |
|
|
|
- |
|
|
|
|
|
|
|
|
|
|
|
|
|
|
Total income tax expense (benefit) related to other comprehensive income (loss) |
|
|
62 |
|
|
|
2,455 |
|
|
|
(14,226 | ) |
|
|
|
|
|
|
|
|
|
|
|
|
|
Total other comprehensive income (loss), net of tax |
|
|
208 |
|
|
|
8,232 |
|
|
|
(47,693 | ) |
|
|
|
|
|
|
|
|
|
|
|
|
|
Total comprehensive income (loss) |
|
$ | 16,561 |
|
|
|
23,778 |
|
|
|
(31,570 | ) |
|
|
|
|
|
|
|
|
|
|
|
|
|
See accompanying Notes to Consolidated Financial Statements. | ||||||||||||
| A-27 |
PEOPLES BANCORP OF NORTH CAROLINA, INC. | ||||||||||||||||||||||||||||
|
|
|
|
|
|
|
|
|
|
|
|
|
|
|
|
|
|
|
|
|
|
|||||||
Consolidated Statements of Changes in Shareholders' Equity | ||||||||||||||||||||||||||||
|
|
|
|
|
|
|
|
|
|
|
|
|
|
|
|
|
|
|
|
|
|
|||||||
For the Years Ended December 31, 2024, 2023 and 2022 | ||||||||||||||||||||||||||||
|
|
|
|
|
|
|
|
|
|
|
|
|
|
|
|
|
|
|
|
|
|
|||||||
(Dollars in thousands) | ||||||||||||||||||||||||||||
|
|
|
|
|
|
|
|
|
|
|
|
|
|
Common Stock |
|
|
|
|
||||||||||
|
|
|
|
|
|
|
|
|
|
|
|
|
|
Held By |
|
|
Accumulated |
|
|
|
|
|||||||
|
|
Common |
|
|
Common |
|
|
|
|
|
|
|
|
Deferred |
|
|
Other |
|
|
|
|
|||||||
|
|
Stock |
|
|
Stock |
|
|
Retained |
|
|
Deferred |
|
|
Compensation |
|
|
Comprehensive |
|
|
|
|
|||||||
|
|
Shares |
|
|
Amount |
|
|
Earnings |
|
|
Compensation |
|
|
Trust |
|
|
Income (Loss) |
|
|
Total |
|
|||||||
|
|
|
|
|
|
|
|
|
|
|
|
|
|
|
|
|
|
|
|
|
|
|||||||
Balance, December 31, 2021 |
|
|
5,661,569 |
|
|
$ | 53,305 |
|
|
|
88,968 |
|
|
|
1,992 |
|
|
|
(1,992 | ) |
|
|
96 |
|
|
|
142,369 |
|
|
|
|
|
|
|
|
|
|
|
|
|
|
|
|
|
|
|
|
|
|
|
|
|
|
|
|
|
|
Common stock repurchase |
|
|
(26,200 | ) |
|
|
(710 | ) |
|
|
- |
|
|
|
- |
|
|
|
- |
|
|
|
- |
|
|
|
(710 | ) |
Cash dividends declared on common stock ($0.87 per share) |
|
|
- |
|
|
|
- |
|
|
|
(4,935 | ) |
|
|
- |
|
|
|
- |
|
|
|
- |
|
|
|
(4,935 | ) |
Restricted stock units exercised |
|
|
1,461 |
|
|
|
41 |
|
|
|
- |
|
|
|
- |
|
|
|
- |
|
|
|
- |
|
|
|
41 |
|
Equity incentive plan, net |
|
|
- |
|
|
|
- |
|
|
|
- |
|
|
|
189 |
|
|
|
(189 | ) |
|
|
- |
|
|
|
- |
|
Net earnings |
|
|
- |
|
|
|
- |
|
|
|
16,123 |
|
|
|
- |
|
|
|
- |
|
|
|
- |
|
|
|
16,123 |
|
Change in accumulated other comprehensive loss, net of tax |
|
|
- |
|
|
|
- |
|
|
|
- |
|
|
|
- |
|
|
|
- |
|
|
|
(47,693 | ) |
|
|
(47,693 | ) |
Balance, December 31, 2022 |
|
|
5,636,830 |
|
|
$ | 52,636 |
|
|
|
100,156 |
|
|
|
2,181 |
|
|
|
(2,181 | ) |
|
|
(47,597 | ) |
|
|
105,195 |
|
|
|
|
|
|
|
|
|
|
|
|
|
|
|
|
|
|
|
|
|
|
|
|
|
|
|
|
|
|
Adoption of new accounting standard, net of tax |
|
|
- |
|
|
|
- |
|
|
|
(838 | ) |
|
|
- |
|
|
|
- |
|
|
|
- |
|
|
|
(838 | ) |
Common stock repurchase |
|
|
(102,522 | ) |
|
|
(1,997 | ) |
|
|
- |
|
|
|
- |
|
|
|
- |
|
|
|
- |
|
|
|
(1,997 | ) |
Cash dividends declared on common stock ($0.91 per share) |
|
|
- |
|
|
|
- |
|
|
|
(5,108 | ) |
|
|
- |
|
|
|
- |
|
|
|
- |
|
|
|
(5,108 | ) |
Restricted stock units exercised |
|
|
191 |
|
|
|
6 |
|
|
|
- |
|
|
|
- |
|
|
|
- |
|
|
|
- |
|
|
|
6 |
|
Excise tax on stock repurchase |
|
|
- |
|
|
|
(20 | ) |
|
|
- |
|
|
|
- |
|
|
|
- |
|
|
|
- |
|
|
|
(20 | ) |
Equity incentive plan, net |
|
|
- |
|
|
|
- |
|
|
|
- |
|
|
|
(271 | ) |
|
|
271 |
|
|
|
- |
|
|
|
- |
|
Net earnings |
|
|
- |
|
|
|
- |
|
|
|
15,546 |
|
|
|
- |
|
|
|
- |
|
|
|
- |
|
|
|
15,546 |
|
Change in accumulated other comprehensive income, net of tax |
|
|
- |
|
|
|
- |
|
|
|
- |
|
|
|
- |
|
|
|
- |
|
|
|
8,232 |
|
|
|
8,232 |
|
Balance, December 31, 2023 |
|
|
5,534,499 |
|
|
$ | 50,625 |
|
|
|
109,756 |
|
|
|
1,910 |
|
|
|
(1,910 | ) |
|
|
(39,365 | ) |
|
|
121,016 |
|
|
|
|
|
|
|
|
|
|
|
|
|
|
|
|
|
|
|
|
|
|
|
|
|
|
|
|
|
|
Common stock repurchase |
|
|
(78,500 | ) |
|
|
(1,998 | ) |
|
|
- |
|
|
|
- |
|
|
|
- |
|
|
|
- |
|
|
|
(1,998 | ) |
Cash dividends declared on common stock ($0.92 per share) |
|
|
- |
|
|
|
- |
|
|
|
(5,047 | ) |
|
|
- |
|
|
|
- |
|
|
|
- |
|
|
|
(5,047 | ) |
Restricted stock units exercised |
|
|
1,647 |
|
|
|
51 |
|
|
|
- |
|
|
|
- |
|
|
|
- |
|
|
|
- |
|
|
|
51 |
|
Excise tax on stock repurchase |
|
|
- |
|
|
|
(20 | ) |
|
|
- |
|
|
|
- |
|
|
|
- |
|
|
|
- |
|
|
|
(20 | ) |
Equity incentive plan, net |
|
|
- |
|
|
|
- |
|
|
|
- |
|
|
|
(153 | ) |
|
|
153 |
|
|
|
- |
|
|
|
- |
|
Net earnings |
|
|
- |
|
|
|
- |
|
|
|
16,353 |
|
|
|
- |
|
|
|
- |
|
|
|
- |
|
|
|
16,353 |
|
Change in accumulated other comprehensive income, net of tax |
|
|
- |
|
|
|
- |
|
|
|
- |
|
|
|
- |
|
|
|
- |
|
|
|
208 |
|
|
|
208 |
|
Balance, December 31, 2024 |
|
|
5,457,646 |
|
|
$ | 48,658 |
|
|
|
121,062 |
|
|
|
1,757 |
|
|
|
(1,757 | ) |
|
|
(39,157 | ) |
|
|
130,563 |
|
|
|
|
|
|
|
|
|
|
|
|
|
|
|
|
|
|
|
|
|
|
|
|
|
|
|
|
|
|
See accompanying Notes to Consolidated Financial Statements. | ||||||||||||||||||||||||||||
| A-28 |
PEOPLES BANCORP OF NORTH CAROLINA, INC. | ||||||||||||
|
|
|
|
|
|
|
|
|
|
|||
Consolidated Statements of Cash Flows | ||||||||||||
|
|
|
|
|
|
|
|
|
|
|||
For the Years Ended December 31, 2024, 2023 and 2022 | ||||||||||||
|
|
|
|
|
|
|
|
|
|
|||
(Dollars in thousands) | ||||||||||||
|
|
|
|
|
|
|
|
|
|
|||
|
|
2024 |
|
|
2023 |
|
|
2022 |
|
|||
|
|
|
|
|
|
|
|
|
|
|||
Cash flows from operating activities: |
|
|
|
|
|
|
|
|
|
|||
Net earnings |
|
$ | 16,353 |
|
|
|
15,546 |
|
|
|
16,123 |
|
Adjustments to reconcile net earnings to net cash provided by operating activities: |
|
|
|
|
|
|
|
|
|
|
|
|
Depreciation, amortization and accretion, net |
|
|
2,890 |
|
|
|
3,126 |
|
|
|
6,031 |
|
Provision for (recovery of) credit losses |
|
|
(285 | ) |
|
|
1,566 |
|
|
|
1,472 |
|
Deferred income taxes |
|
|
1,031 |
|
|
|
(453 | ) |
|
|
(541 | ) |
Gain on sale of held for sale mortgage loans |
|
|
(287 | ) |
|
|
(225 | ) |
|
|
(349 | ) |
(Gain) loss on sale of investment securities, net |
|
|
(5 | ) |
|
|
2,488 |
|
|
|
- |
|
Write-down of other real estate |
|
|
31 |
|
|
|
- |
|
|
|
- |
|
(Gain) loss on sale and writedowns of premises and equipment,net |
|
|
362 |
|
|
|
(184 | ) |
|
|
85 |
|
Restricted stock units expense |
|
|
212 |
|
|
|
187 |
|
|
|
249 |
|
Proceeds from sales of loans held for sale |
|
|
19,149 |
|
|
|
16,415 |
|
|
|
23,008 |
|
Origination of loans held for sale |
|
|
(19,543 | ) |
|
|
(16,665 | ) |
|
|
(19,233 | ) |
Change in: |
|
|
|
|
|
|
|
|
|
|
|
|
Cash surrender value of life insurance |
|
|
(470 | ) |
|
|
(431 | ) |
|
|
(403 | ) |
Right of use lease asset |
|
|
718 |
|
|
|
755 |
|
|
|
1,222 |
|
Other assets |
|
|
80 |
|
|
|
(310 | ) |
|
|
(3,506 | ) |
Lease liability |
|
|
(696 | ) |
|
|
(723 | ) |
|
|
(1,673 | ) |
Other liabilities |
|
|
1,018 |
|
|
|
1,688 |
|
|
|
131 |
|
|
|
|
|
|
|
|
|
|
|
|
|
|
Net cash provided by operating activities |
|
|
20,558 |
|
|
|
22,780 |
|
|
|
22,616 |
|
|
|
|
|
|
|
|
|
|
|
|
|
|
Cash flows from investing activities: |
|
|
|
|
|
|
|
|
|
|
|
|
Purchases of investment securities available for sale |
|
|
(29,052 | ) |
|
|
(9,615 | ) |
|
|
(149,738 | ) |
Proceeds from sales, calls and maturities of investment securities available for sale |
|
|
14,723 |
|
|
|
52,038 |
|
|
|
7,875 |
|
Proceeds from paydowns of investment securities available for sale |
|
|
17,671 |
|
|
|
18,250 |
|
|
|
37,400 |
|
Proceeds from paydowns of other investment securities |
|
|
201 |
|
|
|
150 |
|
|
|
1,162 |
|
Purchase of FHLB Stock |
|
|
(10 | ) |
|
|
(323 | ) |
|
|
(105 | ) |
Net change in loans |
|
|
(46,499 | ) |
|
|
(60,765 | ) |
|
|
(148,072 | ) |
Purchases of premises and equipment |
|
|
(587 | ) |
|
|
(1,948 | ) |
|
|
(4,563 | ) |
Proceeds from sale of premises and equipment |
|
|
- |
|
|
|
1,460 |
|
|
|
- |
|
Proceeds from bank owned life insurance |
|
|
929 |
|
|
|
- |
|
|
|
65 |
|
|
|
|
|
|
|
|
|
|
|
|
|
|
Net cash used by investing activities |
|
|
(42,624 | ) |
|
|
(753 | ) |
|
|
(255,976 | ) |
|
|
|
|
|
|
|
|
|
|
|
|
|
Cash flows from financing activities: |
|
|
|
|
|
|
|
|
|
|
|
|
Net change in deposits |
|
|
92,686 |
|
|
|
(43,170 | ) |
|
|
22,467 |
|
Net change in securities sold under agreement to repurchase |
|
|
(86,715 | ) |
|
|
39,027 |
|
|
|
10,594 |
|
Proceeds from FRB borrowings |
|
|
1 |
|
|
|
1 |
|
|
|
1 |
|
Repayments of FRB borrowings |
|
|
(1 | ) |
|
|
(1 | ) |
|
|
(1 | ) |
Proceeds from Fed Funds Purchased |
|
|
162 |
|
|
|
43,426 |
|
|
|
162 |
|
Repayments of Fed Funds Purchased |
|
|
(162 | ) |
|
|
(43,426 | ) |
|
|
(162 | ) |
Restricted stock units exercised |
|
|
51 |
|
|
|
- |
|
|
|
41 |
|
Excise tax on stock repurchased |
|
|
(20 | ) |
|
|
- |
|
|
|
- |
|
Common stock repurchased |
|
|
(1,998 | ) |
|
|
(1,997 | ) |
|
|
(710 | ) |
Cash dividends paid on common stock |
|
|
(5,047 | ) |
|
|
(5,108 | ) |
|
|
(4,935 | ) |
|
|
|
|
|
|
|
|
|
|
|
|
|
Net cash (used) provided by financing activities |
|
|
(1,043 | ) |
|
|
(11,248 | ) |
|
|
27,457 |
|
|
|
|
|
|
|
|
|
|
|
|
|
|
Net change in cash and cash equivalents |
|
|
(23,109 | ) |
|
|
10,779 |
|
|
|
(205,903 | ) |
|
|
|
|
|
|
|
|
|
|
|
|
|
Cash and cash equivalents at beginning of period |
|
|
82,375 |
|
|
|
71,596 |
|
|
|
277,499 |
|
|
|
|
|
|
|
|
|
|
|
|
|
|
Cash and cash equivalents at end of period |
|
$ | 59,266 |
|
|
|
82,375 |
|
|
|
71,596 |
|
| A-29 |
PEOPLES BANCORP OF NORTH CAROLINA, INC. | ||||||||||||
|
|
|
|
|
|
|
||||||
Consolidated Statements of Cash Flows, continued | ||||||||||||
|
|
|
|
|
|
|
||||||
For the Years Ended December 31, 2024, 2023 and 2022 | ||||||||||||
|
|
|
|
|
|
|
||||||
(Dollars in thousands) | ||||||||||||
|
|
|
|
|
|
|
||||||
|
|
2024 |
|
|
2023 |
|
|
2022 |
|
|||
|
|
|
|
|
|
|
|
|
|
|||
Supplemental disclosures of cash flow information: |
|
|
|
|
|
|
|
|
|
|||
Cash paid during the year for: |
|
|
|
|
|
|
|
|
|
|||
Interest |
|
$ | 28,079 |
|
|
|
16,487 |
|
|
|
3,284 |
|
Income taxes |
|
$ | 4,538 |
|
|
|
4,448 |
|
|
|
4,659 |
|
|
|
|
|
|
|
|
|
|
|
|
|
|
Noncash investing and financing activities: |
|
|
|
|
|
|
|
|
|
|
|
|
Change in unrealized gain (loss) on investment securities available for sale, net |
|
$ | 208 |
|
|
|
8,232 |
|
|
|
(47,693 | ) |
Transfer of loans to other real estate |
|
$ | 400 |
|
|
|
- |
|
|
|
- |
|
Restricted stock units issued |
|
$ |
- |
|
|
|
6 |
|
|
|
- |
|
Excise tax on stock repurchased |
|
$ |
- |
|
|
|
(20 |
) |
|
|
- |
|
Initial recognition of lease right of use asset and lease liability |
|
$ | - |
|
|
|
370 |
|
|
|
1,726 |
|
Allowance for credit losses recorded upon adoption of ASU 326, net of tax |
|
$ | - |
|
|
|
(838 | ) |
|
|
- |
|
|
|
|
|
|
|
|
|
|
|
|
|
|
See accompanying Notes to Consolidated Financial Statements. | ||||||||||||
| A-30 |
PEOPLES BANCORP OF NORTH CAROLINA, INC.
Notes to Consolidated Financial Statements
(1) Summary of Significant Accounting Policies
Organization
Peoples Bancorp of North Carolina, Inc. (the “Company”) has served as the holding company to Peoples Bank (the “Bank”) since 1999. The Company is primarily regulated by the Board of Governors of the Federal Reserve System, and serves as the one-bank holding company for the Bank.
The Bank commenced business in 1912 upon receipt of its banking charter from the North Carolina Commissioner of Banks (the “Commissioner”). The Bank is primarily regulated by the Commissioner and the Federal Deposit Insurance Corporation (the “FDIC”) and undergoes periodic examinations by these regulatory agencies. The Bank, whose main office is in Newton, North Carolina, provides a full range of commercial and consumer banking services primarily in Catawba, Alexander, Lincoln, Mecklenburg, Iredell and Wake counties in North Carolina.
Peoples Investment Services, Inc. (“PIS”) is a wholly owned subsidiary of the Bank and began operations in 1996 to provide investment and trust services through agreements with an outside party.
Real Estate Advisory Services, Inc. (“REAS”) is a wholly owned subsidiary of the Bank and began operations in 1997 to provide real estate appraisal and property management services to individuals and commercial customers of the Bank.
Community Bank Real Estate Solutions, LLC (“CBRES”) is a wholly owned subsidiary of the Bank and began operations in 2009 as a “clearing house” for appraisal services for community banks. Other banks are able to contract with CBRES to find and engage appropriate appraisal companies.
PB Real Estate Holdings, LLC (“PBREH”) is a wholly owned subsidiary of the Bank and began operation in 2015. PBREH acquires, manages and disposes of real property, other collateral and other assets obtained in the ordinary course of collecting debts previously contracted.
Principles of Consolidation
The consolidated financial statements include the financial statements of the Company and its wholly owned subsidiary, the Bank, along with the Bank’s wholly owned subsidiaries, PIS, REAS, CBRES and PBREH. All significant intercompany balances and transactions have been eliminated in consolidation.
Basis of Presentation
The accounting principles followed by the Company, and the methods of applying these principles, conform with accounting principles generally accepted in the United States of America (“GAAP”) and with general practices in the banking industry. In preparing the financial statements in conformity with GAAP, management is required to make estimates and assumptions that affect the reported amounts in the financial statements. Actual results could differ significantly from these estimates. Material estimates common to the banking industry that are particularly susceptible to significant change in the near term include, but are not limited to, the determination of the allowance for credit losses and valuation of real estate acquired in connection with or in lieu of foreclosure on loans.
Business Segments
Operating segments are components of an enterprise about which separate financial information is available that is evaluated regularly by management in deciding how to allocate resources and in assessing performance. Management has determined that the Company has two significant operating segment: Banking Operations and CBRES, as discussed more fully in Note 16. In determining the appropriateness of segment definition, the Company considers the criteria of Accounting Standards Codification (“ASC”) 280, Segment Reporting.
Cash and Cash Equivalents
Cash, due from banks, interest-bearing deposits and federal funds sold are considered cash and cash equivalents (original maturity date less than 90 days) for cash flow reporting purposes.
Investment Securities
The Company uses three classifications for its investment securities: trading, available for sale, or held to maturity. Trading securities are bought and held principally for sale in the near term. Held to maturity securities are those securities for which the Company has the ability and intent to hold until maturity. All other securities not included in trading or held to maturity are classified as available for sale. At December 31, 2024 and 2023, the Company classified all of its investment securities as available for sale.
| A-31 |
Available for sale securities are recorded at fair value. Unrealized holding gains and losses, net of the related tax effect, are excluded from earnings and are reported as a separate component of shareholders’ equity until realized.
Management evaluates investment securities for credit losses on a quarterly basis. A decline in the market value of any investment below cost that is deemed a credit loss is charged to earnings for the decline in value deemed to be credit related. The decline in value attributed to non-credit related factors is recognized in comprehensive income.
Premiums and discounts are recognized in interest income using the interest method over the terms of the securities. Realized gains and losses for securities classified as available for sale are included in earnings on a trade date basis and are derived using the specific identification method for determining the cost of securities sold.
Other Investments
Other investments include equity securities with no readily determinable fair value. These investments are carried at cost. Management evaluates other investments for credit losses on a quarterly basis.
Loans
Loans that management has the intent and ability to hold for the foreseeable future or until maturity are reported at the principal amount outstanding, net of the allowance for credit losses. Interest on loans is calculated by using the simple interest method on daily balances of the principal amount outstanding. The recognition of certain loan origination fee income and certain loan origination costs is deferred when such loans are originated and amortized over the life of the loan.
Accrual of interest is discontinued on a loan when management believes, after considering economic conditions and collection efforts, that the borrower’s financial condition is such that collection of interest is doubtful. Interest previously accrued but not collected is reversed against current period earnings.
Allowance for Credit Losses (ACL)
The allowance for credit losses reflects management’s assessment and estimate of the risks associated with extending credit and its evaluation of the quality of the loan portfolio. The Bank periodically analyzes the loan portfolio in an effort to review asset quality and to establish an allowance that management believes will be adequate in light of anticipated risks and loan losses. In assessing the adequacy of the allowance, size, quality and risk of loans in the portfolio are reviewed.
The allowance for credit losses on loans is a valuation account that is deducted from the loans' amortized cost basis to present the net amount expected to be collected on the loans. Loans are charged off against the allowance when management believes the uncollectibility of a loan balance is confirmed. Expected recoveries do not exceed the aggregate of amounts previously charged-off and expected to be charged-off. Accrued interest receivable is excluded from the estimate of credit losses. The allowance for credit losses represents management’s estimate of lifetime credit losses inherent in loans as of the balance sheet date. The allowance for credit losses is estimated by management using relevant available information, from both internal and external sources, relating to past events, current conditions, and reasonable and supportable forecasts. The Company measures expected credit losses for loans on a pooled basis when similar risk characteristics exist. The Company calculates the allowance for credit losses using a Weighted Average Remaining Maturity (“WARM”) methodology. The general forecast function in the model was set for all pools that projects the next four quarters to have similar loss rates to that experienced by the Bank in the period between December 2018 and February 2020, followed by a reversion to the long-term average over four quarters.
Additionally, the allowance for credit losses calculation includes subjective adjustments for qualitative risk factors that are likely to cause estimated credit losses to differ from historical experience. These qualitative adjustments may increase or reduce reserve levels and include adjustments for: local, state and national economic outlook; levels and trends of delinquencies; trends in volume, mix and size of loans; seasoning of the loan portfolio; experience of staff; concentrations of credit; and interest rate risk.
The portion of the ACL balance attributable to qualitative factors was $5.2 million at December 31, 2024 and December 31, 2023. The risk factors are weighted as follows: Local, State and National Economic Outlook – 30%, Concentrations of Credit – 5%, Interest Rate Risk – 5%, Trends in Terms of Volume, Mix and Size of Loans – 15%, Seasoning of the Loan Portfolio – 10%, Experience of Staff – 10%, and Levels and Trends of Delinquencies – 25%. No changes to the risk status of any of the risk factors was made during year ended 2024.
| A-32 |
Loans that do not share risk characteristics are evaluated on an individual basis. When management determines that foreclosure is probable and the borrower is experiencing financial difficulty, the expected credit losses are based on the fair value of collateral at the reporting date adjusted for selling costs as appropriate. There were no loans individually evaluated as of December 31, 2024, and two loans totaling $432,000 were individually evaluated as of December 31, 2023, which were fully reserved for at December 31, 2023.
Financial instruments include off-balance sheet credit instruments, such as commitments to make loans and commercial letters of credit issued to meet customer financing needs. The Company’s exposure to credit loss in the event of nonperformance by the other party to the financial instrument for off-balance sheet loan commitments represents the contractual amount of those instruments. Such financial instruments are recorded when they are funded.
The Company records an allowance for credit losses on off-balance sheet credit exposures, unless the commitments to extend credit are unconditionally cancelable. The allowance for credit losses on off-balance sheet credit exposures is estimated by loan segment at each balance sheet date under the current expected credit loss model using the same methodologies as portfolio loans, taking into consideration the likelihood that funding will occur as well as any third-party guarantees. The allowance for unfunded commitments is included in other liabilities on the Company’s consolidated balance sheets.
Since the adoption of CECL on January 1, 2023, the allowance for credit losses represents management’s estimate of credit losses for the remaining estimated life of the Bank’s financial assets, including loan receivables and some off-balance sheet credit exposures. Estimating the amount of the allowance for credit losses requires significant judgment and the use of estimates related to historical experience, current conditions, reasonable and supportable forecasts, and the value of collateral on collateral-dependent loans. The loan portfolio also represents the largest asset type on our consolidated balance sheet. Credit losses are charged against the allowance, while recoveries of amounts previously charged off are credited to the allowance. A provision for credit losses is charged to operations based on management’s periodic evaluation of the factors previously mentioned, as well as other pertinent factors.
There are many factors affecting the allowance for credit losses; some are quantitative while others require qualitative judgment. Although management believes its process for determining the allowance adequately considers all the potential factors that could potentially result in credit losses, the process includes subjective elements and is susceptible to significant change. To the extent actual outcomes differ from management estimates, additional provision for credit losses could be required that could adversely affect our earnings or financial position in future periods.
Various regulatory agencies, as an integral part of their examination process, periodically review the Bank’s allowance. Such agencies may require adjustments to the allowance based on their judgments of information available to them at the time of their examinations. Management believes it has established the allowance for credit losses pursuant to CECL, and has taken into account the views of its regulators and the current economic environment. Management considers the allowance adequate to cover the estimated losses inherent in the Bank’s loan portfolio as of the date of the financial statements. Although management uses the best information available to make evaluations, significant future additions to the allowance may be necessary based on changes in economic and other conditions, thus adversely affecting the operating results of the Company.
Mortgage Banking Activities
Mortgage banking income represents income from the sale of mortgage loans and fees received from borrowers and loan investors related to the Bank’s origination of single-family residential mortgage loans.
The Bank originates certain fixed rate mortgage loans and commits these loans for sale. The commitments to originate fixed rate mortgage loans are derivative contracts. The fair value of these derivative contracts is immaterial and has no effect on the recorded amounts in the financial statements.
Mortgage loans held for sale are carried at the lower of aggregate cost or market value. The cost of mortgage loans held for sale approximates the market value.
Premises and Equipment
Premises and equipment are stated at cost less accumulated depreciation. Depreciation is computed primarily using the straight-line method over the estimated useful lives of the assets. When assets are retired or otherwise disposed of, the cost and related accumulated depreciation are removed from the accounts, and any gain or loss is reflected in earnings for that period. The cost of maintenance and repairs that do not improve or extend the useful life of the respective asset is charged to earnings as incurred, whereas significant renewals and improvements are capitalized. The range of estimated useful lives for premises and equipment are generally as follows:
Buildings and improvements |
10 - 50 years |
Furniture and equipment |
3 - 10 years |
Leasehold improvements |
lease term |
| A-33 |
Other Real Estate
Foreclosed assets include all assets received in full or partial satisfaction of a loan. Foreclosed assets are initially recorded at fair value less estimated selling costs and subsequently carried at the lower of carrying value or fair value less selling costs. Any write-downs at the time of foreclosure are charged to the allowance for credit losses. Subsequent to foreclosure, valuations are periodically performed by management, and a valuation allowance is established if fair value less estimated selling costs declines below carrying value. Costs relating to the development and improvement of the property are capitalized. Revenues and expenses from operations are included in other expenses. Changes in the valuation allowance are included in write-down of other real estate.
Income Taxes
Deferred tax assets and liabilities are recognized for the future tax consequences attributable to differences between the financial statement carrying amounts of existing assets and liabilities and their respective tax bases. Additionally, the recognition of future tax benefits, such as net operating loss carryforwards, is required to the extent that the realization of such benefits is more likely than not to occur. Deferred tax assets and liabilities are measured using enacted tax rates expected to apply to taxable income in the years in which the assets and liabilities are expected to be recovered or settled. The effect on deferred tax assets and liabilities of a change in tax rates is recognized in income tax expense in the period that includes the enactment date.
In the event the future tax consequences of differences between the financial reporting bases and the tax bases of the Company’s assets and liabilities results in a deferred tax asset, an evaluation of the probability of being able to realize the future benefits indicated by such asset is required. A valuation allowance is provided for the portion of the deferred tax asset when it is more likely than not that some portion or all of the deferred tax asset will not be realized. In assessing the realizability of a deferred tax asset, management considers the scheduled reversals of deferred tax liabilities, projected future taxable income, and tax planning strategies.
Tax effects from an uncertain tax position can be recognized in the financial statements only when it is more likely than not that the tax position will be sustained upon examination by the appropriate taxing authority that would have full knowledge of all relevant information. A tax position that meets the more likely than not recognition threshold is measured at the largest amount of benefit that is greater than fifty percent likely of being realized upon ultimate settlement. Previously recognized tax positions that no longer meet the more likely than not recognition threshold should be derecognized in the first subsequent financial reporting period in which that threshold is no longer met. The Company assessed the impact of this guidance and determined that it did not have a material impact on the Company’s financial position, results of operations or disclosures. The Company did not have any uncertain tax positions at December 31, 2024 and 2023.
Revenue Recognition
The majority of the Company’s revenue is derived primarily from interest income from receivables (loans) and securities. Other revenues are derived from fees received in connection with deposit accounts, investment advisory, and appraisal services. Through the Company’s wholly-owned subsidiary, PIS, the Company contracts with a registered investment advisor to perform investment advisory services on behalf of the Company’s customers. The Company receives commissions from this third party investment advisor based on the volume of business that the Company’s customers do with such investment advisor. The Company utilizes third parties to contract with the Company’s customers to perform debit and credit card clearing services. These third parties pay the Company commissions based on the volume of transactions that they process on behalf of the Company’s customers. Through the Company’s wholly-owned subsidiary, REAS, the Company provides property appraisal services for negotiated fee amounts on a per appraisal basis. Through the Company’s wholly-owned subsidiary, CBRES, the Company provides appraisal management services. Appraisal management fee income and expense from CBRES are reported on separate line items under non-interest income and non-interest expense. None of the Company’s revenue is derived from contracts in which services are transferred over time. Revenue is recognized as the services are provided to customers. The Company has no contracts in which customers are billed in advance for services to be performed. There are no significant financing components in the Company’s contracts. Excluding deposit and appraisal service revenues which are primarily billed at a point in time as a fee for services incurred, all other contracts contain variable consideration in that fees earned are derived from market values of accounts which determine the amount of consideration to which the Company is entitled. The variability is resolved when the services are provided. The contracts do not include obligations for returns, refunds, or warranties. The contracts are specific to the amounts owed to the Company for services performed during a period should the contracts be terminated. Revenue is recognized as services are billed to the customers.
| A-34 |
Advertising Costs
Advertising costs are expensed as incurred.
Stock-Based Compensation
The Company has an Omnibus Stock Ownership and Long Term Incentive Plan that was approved by shareholders on May 7, 2009 (the “2009 Plan”) whereby certain stock-based rights, such as stock options, restricted stock, restricted stock units, performance units, stock appreciation rights or book value shares, were granted to eligible directors and employees. The 2009 Plan expired on May 7, 2019 but still governs the rights and obligations of the parties for grants previously made thereunder. No new awards may be made after May 7, 2019.
The Company granted 16,583 restricted stock units under the 2009 Plan at a grant date fair value of $16.34 per share during the first quarter of 2015. The Company granted 5,544 restricted stock units under the 2009 Plan at a grant date fair value of $16.91 per share during the first quarter of 2016. The Company granted 4,114 restricted stock units under the 2009 Plan at a grant date fair value of $25.00 per share during the first quarter of 2017. The Company granted 3,725 restricted stock units under the 2009 Plan at a grant date fair value of $31.43 per share during the first quarter of 2018. The Company granted 5,290 restricted stock units under the 2009 Plan at a grant date fair value of $28.43 per share during the first quarter of 2019. The number of restricted stock units granted and grant date fair values for the restricted stock units granted in 2015 through 2017 have been restated to reflect the 10% stock dividend that was paid in the fourth quarter of 2017. The Company recognizes compensation expense on the restricted stock units over the vesting period (four years from the grant date for the 2015, 2016, 2017, 2018 and 2019 grants). The amount of expense recorded each period reflects the changes in the Company’s stock price during such period. As of December 31, 2024, the Company did not have any unrecognized compensation expense related to the restricted stock unit grants under the 2009 Plan.
The Company also has an Omnibus Stock Ownership and Long Term Incentive Plan that was approved by shareholders on May 7, 2020 (the “2020 Plan”) whereby certain stock-based rights, such as stock options, restricted stock, restricted stock units, performance units, stock appreciation rights or book value shares, may be granted to eligible directors and employees. A total of 300,000 shares were reserved for possible issuance under the 2020 Plan when it was adopted. As of December 31, 2024, a total of 268,100 shares out of the initial 300,000 shares reserved remain available for future issuance under the 2020 Plan. No new awards may be made after May 7, 2030 (ten years from the 2020 Plan effective date).
The Company granted 7,635 restricted stock units under the 2020 Plan at a grant date fair value of $17.08 per share during the second quarter of 2020. The Company granted 7,060 restricted stock units under the 2020 Plan at a grant date fair value of $22.04 per share during the first quarter of 2021. The Company granted 5,385 restricted stock units under the 2020 Plan at a grant date fair value of $27.99 per share during the first quarter of 2022. The Company granted 5,370 restricted stock units under the 2020 Plan at a grant date fair value of $32.58 per share during the first quarter of 2023. The Company granted 6,450 restricted stock units under the 2020 Plan at a grant date fair value of $29.52 per share during the first quarter of 2024. The Company recognizes compensation expense on the restricted stock units over the vesting period (four years from the grant date for 2020, 2021, 2022 and 2023 grants). As of December 31, 2024, the total unrecognized compensation expense related to the restricted stock unit grants under the 2020 Plan was $282,000.
The Company recognized compensation expense for restricted stock units granted under the 2009 Plan and 2020 Plan of $212,000, $187,000 and $249,000 for the years ended December 31, 2024, 2023 and 2022, respectively.
Self Funded Insurance
The Company has a self-funded health insurance plan, which is administered by a third party provider (“TPP”). The TPP provides a monthly estimate of the cost of incurred but not reported (“IBNR”) claims. The Company’s unpaid claim liability for IBNR claims of $300,000 and $3600,000 at December 31, 2024 and 2023, respectively, is separately classified on the balance sheet within Other Liabilities.
The Company has a stop-loss insurance policy to mitigate the risk of high self-funded health insurance claim amounts. This policy has a specific stop loss limit that covers individual claims in excess of $135,000 and an aggregating specific stop loss limit that covers aggregate claims in excess of $200,000. Due to large self-funded health insurance claims in process at December 31, 2024, the Company had an additional $1.3 million separately classified on the balance sheet within Other Liabilities at December 31, 2024, which was partially offset by a $968,000 stop loss insurance receivable separately classified on the balance sheet within Other Assets at December 31, 2024.
| A-35 |
Comprehensive Income
The Company reports as comprehensive income all changes in shareholders’ equity during the year from sources other than shareholders. Other comprehensive income refers to all components (revenues, expenses, gains, and losses) of comprehensive income that are excluded from net income. The Company’s only component of other comprehensive income is unrealized gains and losses, net of income tax, on investment securities available for sale.
The following table presents the changes in accumulated other comprehensive loss for the year ended December 31, 2024, 2023 and 2022:
|
|
Year Ended December 31, |
|
|||||||||
(dollars in thousands) |
|
2024 |
|
|
2023 |
|
|
2022 |
|
|||
|
|
|
|
|
|
|
|
|
|
|||
Beginning balance |
|
$ | (39,365 | ) |
|
|
(47,597 | ) |
|
|
96 |
|
Other comprehensive income (loss) before reclassifications, net |
|
|
212 |
|
|
|
6,315 |
|
|
|
(47,693 | ) |
Amounts reclassified from accumulated other comprehensive (gain) loss, net |
|
|
(4 | ) |
|
|
1,917 |
|
|
|
- |
|
Net current period other comprehensive income (loss) |
|
|
208 |
|
|
|
8,232 |
|
|
|
(47,693 | ) |
Ending balance |
|
$ | (39,157 | ) |
|
|
(39,365 | ) |
|
|
(47,597 | ) |
Net Earnings Per Share
Net earnings per common share is based on the weighted average number of common shares outstanding during the period while the effects of potential common shares outstanding during the period are included in diluted earnings per common share. The average market price during the year is used to compute equivalent shares.
The reconciliations of the amounts used in the computation of both “basic earnings per common share” and “diluted earnings per common share” for the years ended December 31, 2024, 2023 and 2022 are as follows. There are no anti-dilutive shares to be excluded.
For the year ended December 31, 2024 |
|
|
|
|
|
|
||||||
|
|
Net Earnings (Dollars in thousands) |
|
|
Weighted Average Number of Shares |
|
|
Per Share Amount |
|
|||
Basic earnings per share |
|
$ | 16,353 |
|
|
|
5,300,964 |
|
|
$ | 3.08 |
|
Effect of dilutive securities: |
|
|
|
|
|
|
|
|
|
|
|
|
Restricted stock units - unvested |
|
|
- |
|
|
|
20,682 |
|
|
|
|
|
Shares held in deferred comp plan by deferred compensation trust |
|
|
|
|
|
|
161,141 |
|
|
|
|
|
Diluted earnings per share |
|
$ | 16,353 |
|
|
|
5,482,787 |
|
|
$ | 2.98 |
|
For the year ended December 31, 2023 |
|
|
|
|
|
|
||||||
|
|
Net Earnings (Dollars in thousands) |
|
|
Weighted Average Number of Shares |
|
|
Per Share Amount |
|
|||
Basic earnings per share |
|
$ | 15,546 |
|
|
|
5,424,890 |
|
|
$ | 2.87 |
|
Effect of dilutive securities: |
|
|
|
|
|
|
|
|
|
|
|
|
Restricted stock units - unvested |
|
|
- |
|
|
|
18,971 |
|
|
|
|
|
Shares held in deferred comp plan by deferred compensation trust |
|
|
|
|
|
|
166,353 |
|
|
|
|
|
Diluted earnings per share |
|
$ | 15,546 |
|
|
|
5,610,214 |
|
|
$ | 2.77 |
|
| A-36 |
For the year ended December 31, 2022 |
|
|
|
|
|
|
|
|
|
|||
|
|
Net Earnings (Dollars in thousands) |
|
|
Weighted Average Number of Shares |
|
|
Per Share Amount |
|
|||
Basic earnings per share |
|
$ |
16,123 |
|
|
|
5,480,123 |
|
|
$ |
2.94 |
|
Effect of dilutive securities: |
|
|
|
|
|
|
|
|
|
|
|
|
Restricted stock units - unvested |
|
|
- |
|
|
|
15,467 |
|
|
|
|
|
Shares held in deferred comp plan by deferred compensation trust |
|
|
|
|
|
|
165,599 |
|
|
|
|
|
Diluted earnings per share |
|
$ |
16,123 |
|
|
|
5,661,189 |
|
|
$ |
2.85 |
|
Recent Accounting Pronouncements
The following table provide a summary of Accounting Standards Updates (“ASU”) issued by the Financial Accounting Standards Board (“FASB”) that the Company has recently adopted.
ASU |
Description |
Effective Date |
Effect on Financial Statements or Other Significant Matters |
ASU 2023-07 Segment Reporting (Topic 280) |
The ASU provides amendments to improve reportable segment disclosure requirements, primarily through enhanced disclosures about significant segment expenses |
Annual periods after 12/15/23 and interim periods after 12/15/24 |
The adoption of this guidance did not have a material impact on the Company’s results of operations, financial position. The adoption of this guidance had an immaterial impact on disclosures. |
The following table provides a summary of ASU’s issued by FASB that the Company has not adopted as of December 31, 2024, which may impact the Company’s financial statements.
ASU |
Description |
Effective Date |
Effect on Financial Statements or Other Significant Matters |
ASU 2023-09 Income Taxes (Topic 740) |
The ASU provides amendments to improve the transparency of income tax disclosures. |
January 1, 2025 |
The adoption of this guidance is not expected to have a material impact on the Company’s results of operations, financial position. The adoption of this guidance is expected to have an immaterial impact on disclosures. |
ASU 2024-01 Compensation—Stock Compensation (Topic 718) |
The ASU adds an illustrative example (with four fact patterns) on how an entity would apply Accounting Standards Codification (ASC) 718 scope guidance. |
January 1, 2025 |
The adoption of this guidance is not expected to have a material impact on the Company’s results of operations, financial position or disclosures. |
ASU 2024-02 Codification Improvements Amendments to Remove References to Concepts Statements |
The ASU removes references to various Concepts Statements. In most instances, the references are extraneous and not required to understand or apply the guidance. In other instances, the references are a substitute for actual wording from a Concepts Statement. In most cases, the ASU is not intended to result in significant accounting changes for most entities. |
January 1, 2025 |
The adoption of this guidance is not expected to have a material impact on the Company’s results of operations, financial position or disclosures. |
ASU 2024-03—Income Statement—Reporting Comprehensive Income—Expense Disaggregation Disclosures (Subtopic 220-40) |
The ASU requires disaggregated disclosure of income statement expenses for public business entities (PBEs). |
Annual reporting periods after 12/15/26 |
The adoption of this guidance is not expected to have a material impact on the Company’s results of operations, financial position. The adoption of this guidance is expected to have an immaterial impact on disclosures. |
Other accounting standards that have been issued or proposed by FASB or other standards-setting bodies are not expected to have a material impact on the Company’s results of operations, financial position or disclosures.
Reclassification
Certain amounts in the 2023 and 2022 consolidated financial statements have been reclassified to conform to the 2024 presentation.
| A-37 |
(2) Investment Securities
Investment securities available for sale at December 31, 2024 and 2023 are as follows:
(Dollars in thousands) |
|
|
|
|
|
|
|
|
|
|
|
|
||||
|
|
December 31, 2024 |
|
|||||||||||||
|
|
Amortized Cost |
|
|
Gross Unrealized Gains |
|
|
Gross Unrealized Losses |
|
|
Fair Value |
|
||||
U.S. Treasuries |
|
$ | 7,981 |
|
|
|
- |
|
|
|
724 |
|
|
|
7,257 |
|
U.S. Government sponsored enterprises |
|
|
9,243 |
|
|
|
- |
|
|
|
511 |
|
|
|
8,732 |
|
GSE - Mortgage-backed securities |
|
|
248,837 |
|
|
|
162 |
|
|
|
23,207 |
|
|
|
225,792 |
|
Private label mortgage-backed securities |
|
|
43,118 |
|
|
|
74 |
|
|
|
1,425 |
|
|
|
41,767 |
|
State and political subdivisions |
|
|
129,659 |
|
|
|
- |
|
|
|
25,204 |
|
|
|
104,455 |
|
Total |
|
$ | 438,838 |
|
|
|
236 |
|
|
|
51,071 |
|
|
|
388,003 |
|
(Dollars in thousands) |
|
|
|
|
|
|
|
|
|
|
|
|
||||
|
|
December 31, 2023 |
|
|||||||||||||
|
|
Amortized Cost |
|
|
Gross Unrealized Gains |
|
|
Gross Unrealized Losses |
|
|
Fair Value |
|
||||
U.S. Treasuries |
|
$ | 10,974 |
|
|
|
- |
|
|
|
830 |
|
|
|
10,144 |
|
U.S. Government sponsored enterprises |
|
|
11,111 |
|
|
|
- |
|
|
|
596 |
|
|
|
10,515 |
|
GSE - Mortgage-backed securities |
|
|
257,705 |
|
|
|
185 |
|
|
|
22,988 |
|
|
|
234,902 |
|
Private label mortgage-backed securities |
|
|
33,317 |
|
|
|
16 |
|
|
|
2,063 |
|
|
|
31,270 |
|
State and political subdivisions |
|
|
129,922 |
|
|
|
- |
|
|
|
24,829 |
|
|
|
105,093 |
|
Total |
|
$ | 443,029 |
|
|
|
201 |
|
|
|
51,306 |
|
|
|
391,924 |
|
The current fair value and associated unrealized losses on investments in debt securities with unrealized losses at December 31, 2024 and 2023 are summarized in the tables below, with the length of time the individual securities have been in a continuous loss position.
(Dollars in thousands) |
|
|
|
|
|
|
|
|
|
|
|
|
|
|
|
|
|
|
||||||
|
|
December 31, 2024 |
|
|||||||||||||||||||||
|
|
Less than 12 Months |
|
|
12 Months or More |
|
|
Total |
|
|||||||||||||||
|
|
Fair Value |
|
|
Unrealized Losses |
|
|
Fair Value |
|
|
Unrealized Losses |
|
|
Fair Value |
|
|
Unrealized Losses |
|
||||||
U.S. Treasuries |
|
$ | - |
|
|
|
- |
|
|
|
7,257 |
|
|
|
724 |
|
|
|
7,257 |
|
|
|
724 |
|
U.S. government sponsored enterprises |
|
|
- |
|
|
|
- |
|
|
|
8,732 |
|
|
|
511 |
|
|
|
8,732 |
|
|
|
511 |
|
GSE -Mortgage-backed securities |
|
|
20,458 |
|
|
|
669 |
|
|
|
197,497 |
|
|
|
22,538 |
|
|
|
217,955 |
|
|
|
23,207 |
|
Private label mortgage-backed securities |
|
|
4,010 |
|
|
|
9 |
|
|
|
21,727 |
|
|
|
1,416 |
|
|
|
25,737 |
|
|
|
1,425 |
|
State and political subdivisions |
|
|
- |
|
|
|
- |
|
|
|
104,455 |
|
|
|
25,204 |
|
|
|
104,455 |
|
|
|
25,204 |
|
Total |
|
$ | 24,468 |
|
|
|
678 |
|
|
|
339,668 |
|
|
|
50,393 |
|
|
|
364,136 |
|
|
|
51,071 |
|
(Dollars in thousands) |
|
|
|
|
|
|
|
|
|
|
|
|
|
|
|
|
|
|
||||||
|
|
December 31, 2023 |
|
|||||||||||||||||||||
|
|
Less than 12 Months |
|
|
12 Months or More |
|
|
Total |
|
|||||||||||||||
|
|
Fair Value |
|
|
Unrealized Losses |
|
|
Fair Value |
|
|
Unrealized Losses |
|
|
Fair Value |
|
|
Unrealized Losses |
|
||||||
U.S. Treasuries |
|
$ | - |
|
|
|
- |
|
|
|
10,144 |
|
|
|
830 |
|
|
|
10,144 |
|
|
|
830 |
|
U.S. government sponsored enterprises |
|
|
- |
|
|
|
- |
|
|
|
10,515 |
|
|
|
596 |
|
|
|
10,515 |
|
|
|
596 |
|
GSE -Mortgage-backed securities |
|
|
24,167 |
|
|
|
546 |
|
|
|
203,234 |
|
|
|
22,442 |
|
|
|
227,401 |
|
|
|
22,988 |
|
Private label mortgage-backed securities |
|
|
3,416 |
|
|
|
43 |
|
|
|
23,095 |
|
|
|
2,020 |
|
|
|
26,511 |
|
|
|
2,063 |
|
State and political subdivisions |
|
|
- |
|
|
|
- |
|
|
|
105,093 |
|
|
|
24,829 |
|
|
|
105,093 |
|
|
|
24,829 |
|
Total |
|
$ | 27,583 |
|
|
|
589 |
|
|
|
352,081 |
|
|
|
50,717 |
|
|
|
379,664 |
|
|
|
51,306 |
|
| A-38 |
At December 31, 2024, unrealized losses in the investment securities portfolio relating to debt securities totaled $51.1 million. The unrealized losses on these debt securities arose due to changing interest rates and are considered to be temporary. From the December 31, 2024 tables above, both of the U.S. Treasury securities, all 108 of the securities issued by state and political subdivisions contained unrealized losses, all seven of the securities issued by U.S. Government sponsored enterprises (“GSE”), 114 of the 119 GSE mortgage-backed securities, and 11 of the 16 private label mortgage-backed securities contained unrealized losses. The Company did not have any reserves on securities at December 31, 2024, as no credit related losses were identified in the Company’s December 31, 2024 analysis. At December 31, 2023, unrealized losses in the investment securities portfolio relating to debt securities totaled $51.3 million. The unrealized losses on these debt securities arose due to changing interest rates and are considered to be temporary. From the December 31, 2023 tables above, all three of the U.S. Treasury securities, all 108 of the securities issued by state and political subdivisions contained unrealized losses, all seven of the securities issued by GSE, 114 of the 121 GSE mortgage-backed securities, and 12 of the 14 private label mortgage backed securities contained unrealized losses. The Company did not have an allowance for credit losses on available for sale securities at December 31, 2023, as no credit related losses were identified in the Company’s December 31, 2023 analysis.
The amortized cost and estimated fair value of investment securities available for sale, other than GSE mortgage-backed securities, at December 31, 2024, are shown below by contractual maturity. Expected maturities of mortgage-backed securities will differ from contractual maturities because borrowers have the right to call or prepay obligations with or without call or prepayment penalties.
December 31, 2024 |
|
|
|
|
||||
(Dollars in thousands) |
|
|
|
|
||||
|
|
Amortized Cost |
|
|
Fair Value |
|
||
Due within one year |
|
$ | 7,999 |
|
|
|
7,991 |
|
Due from one to five years |
|
|
32,911 |
|
|
|
29,586 |
|
Due from five to ten years |
|
|
76,298 |
|
|
|
61,674 |
|
Due after ten years |
|
|
72,793 |
|
|
|
62,960 |
|
GSE-Mortgage-backed securities |
|
|
248,837 |
|
|
|
225,792 |
|
Total |
|
$ | 438,838 |
|
|
|
388,003 |
|
During 2024, proceeds from sales of securities available for sale were $11.7 million and resulted in gross gains of $33,000 and gross losses of $28,000. During 2023, proceeds from sales of securities available for sale were $51.0 million and resulted in gross losses of $2.7 million and gross gains of $177,000. No securities available for sale were sold during 2022.
Securities with a fair value of approximately $40.0 million and $132.0 million at December 31, 2024 and 2023, respectively, were pledged to secure public deposits and for other purposes as required by law.
Taxable interest income on investment securities was $14.6 million and $13.4 million for the years ended December 31, 2024 and 2023, respectively. Non-taxable interest income on investment securities was $425,000 and $765,000 for the years ended December 31, 2024 and 2023, respectively.
| A-39 |
(3) Loans
Major classifications of loans at December 31, 2024 and 2023 are summarized as follows:
(Dollars in thousands) |
|
|
|
|
|
|
||
|
|
December 31, 2024 |
|
|
December 31, 2023 |
|
||
Real estate loans: |
|
|
|
|
|
|
||
Construction and land development |
|
$ | 122,328 |
|
|
|
136,401 |
|
Single-family residential |
|
|
384,509 |
|
|
|
372,825 |
|
Commercial |
|
|
471,444 |
|
|
|
425,820 |
|
Multifamily and farmland |
|
|
69,671 |
|
|
|
63,042 |
|
Total real estate loans |
|
|
1,047,952 |
|
|
|
998,088 |
|
|
|
|
|
|
|
|
|
|
Loans not secured by real estate: |
|
|
|
|
|
|
|
|
Commercial |
|
|
63,837 |
|
|
|
70,544 |
|
Farm |
|
|
401 |
|
|
|
550 |
|
Consumer |
|
|
6,475 |
|
|
|
6,966 |
|
All other |
|
|
19,739 |
|
|
|
16,918 |
|
|
|
|
|
|
|
|
|
|
Total loans |
|
|
1,138,404 |
|
|
|
1,093,066 |
|
|
|
|
|
|
|
|
|
|
Less allowance for credit losses |
|
|
(9,995 | ) |
|
|
(11,041 | ) |
|
|
|
|
|
|
|
|
|
Total net loans |
|
$ | 1,128,409 |
|
|
|
1,082,025 |
|
The above table includes deferred costs, net of deferred fees, totaling $714,000 and $807,000 at December 31, 2024 and December 31, 2023, respectively.
The Bank makes loans and extensions of credit primarily within the Catawba Valley region of North Carolina, which encompasses Catawba, Alexander, Iredell and Lincoln counties and also in Mecklenburg, Wake, Rowan and Forsyth counties of North Carolina. Although the Bank has a diversified loan portfolio, a substantial portion of the loan portfolio is collateralized by improved and unimproved real estate, the value of which is dependent upon the real estate market. Risk characteristics of the major components of the Bank’s loan portfolio are discussed below:
|
· |
Construction and land development loans – The risk of loss is largely dependent on the initial estimate of whether the property’s value at completion equals or exceeds the cost of property construction and the availability of take-out financing. During the construction phase, a number of factors can result in delays or cost overruns. If the estimate is inaccurate or if actual construction costs exceed estimates, the value of the property securing the loan may be insufficient to ensure full repayment when completed through a permanent loan, sale of the property, or by seizure of collateral. |
|
|
|
|
· |
Single-family residential loans – Declining home sales volumes, decreased real estate values and higher than normal levels of unemployment could contribute to losses on these loans. |
|
|
|
|
· |
Commercial real estate loans – Repayment is dependent on income being generated in amounts sufficient to cover operating expenses and debt service. These loans also involve greater risk because they are generally not fully amortizing over the loan period, but rather have a balloon payment due at maturity. A borrower’s ability to make a balloon payment typically will depend on being able to either refinance the loan or timely sell the underlying property. |
|
|
|
|
· |
Commercial loans – Repayment is generally dependent upon the successful operation of the borrower’s business. In addition, the collateral securing the loans may depreciate over time, be difficult to appraise, be illiquid, or fluctuate in value based on the success of the business. |
|
|
|
|
· |
Multifamily and farmland loans – Decreased real estate values and higher than normal levels of unemployment could contribute to losses on these loans. |
Loans are considered past due if the required principal and interest payments have not been received within 30 days of the date such payments were due. Loans are placed on non-accrual status when, in management’s opinion, the borrower may be unable to meet payment obligations as they become due, as well as when required by regulatory provisions. Generally, a loan is placed on non-accrual status when it is over 90 days past due and there is reasonable doubt that all principal will be collected. When interest accrual is discontinued, all unpaid accrued interest is reversed. Interest income is subsequently recognized only to the extent cash payments are received in excess of principal due. Loans are returned to accrual status when all the principal and interest amounts contractually due are brought current and future payments are reasonably assured.
| A-40 |
The following tables present an age analysis of past due loans, by loan type, as of December 31, 2024 and 2023:
December 31, 2024 |
|
|
|
|
|
|
|
|
|
|
|
|
|
|
|
|
|
|
||||||
(Dollars in thousands) |
|
|
|
|
|
|
|
|
|
|
|
|
|
|
|
|
|
|
||||||
|
|
Loans 30-89 Days Past Due |
|
|
Nonaccrual Loans |
|
|
Total Past Due Loans |
|
|
Total Current Loans |
|
|
Total Loans |
|
|
Accruing Loans 90 or More Days Past Due |
|
||||||
Real estate loans: |
|
|
|
|
|
|
|
|
|
|
|
|
|
|
|
|
|
|
||||||
Construction and land development |
|
$ | 131 |
|
|
|
37 |
|
|
|
168 |
|
|
|
122,160 |
|
|
|
122,328 |
|
|
|
- |
|
Single-family residential |
|
|
5,434 |
|
|
|
3,720 |
|
|
|
9,154 |
|
|
|
375,355 |
|
|
|
384,509 |
|
|
|
- |
|
Commercial |
|
|
87 |
|
|
|
426 |
|
|
|
513 |
|
|
|
470,931 |
|
|
|
471,444 |
|
|
|
- |
|
Multifamily and farmland |
|
|
- |
|
|
|
- |
|
|
|
- |
|
|
|
69,671 |
|
|
|
69,671 |
|
|
|
- |
|
Total real estate loans |
|
|
5,652 |
|
|
|
4,183 |
|
|
|
9,835 |
|
|
|
1,038,117 |
|
|
|
1,047,952 |
|
|
|
- |
|
|
|
|
|
|
|
|
|
|
|
|
|
|
|
|
|
|
|
|
|
|
|
|
|
|
Loans not secured by real estate: |
|
|
|
|
|
|
|
|
|
|
|
|
|
|
|
|
|
|
|
|
|
|
|
|
Commercial |
|
|
360 |
|
|
|
248 |
|
|
|
608 |
|
|
|
63,229 |
|
|
|
63,837 |
|
|
|
- |
|
Farm |
|
|
- |
|
|
|
- |
|
|
|
- |
|
|
|
401 |
|
|
|
401 |
|
|
|
- |
|
Consumer |
|
|
33 |
|
|
|
9 |
|
|
|
42 |
|
|
|
6,433 |
|
|
|
6,475 |
|
|
|
- |
|
All other |
|
|
- |
|
|
|
- |
|
|
|
- |
|
|
|
19,739 |
|
|
|
19,739 |
|
|
|
- |
|
Total loans |
|
$ | 6,045 |
|
|
|
4,440 |
|
|
|
10,485 |
|
|
|
1,127,919 |
|
|
|
1,138,404 |
|
|
|
- |
|
December 31, 2023 |
|
|
|
|
|
|
|
|
|
|
|
|
|
|
|
|
|
|
||||||
(Dollars in thousands) |
|
|
|
|
|
|
|
|
|
|
|
|
|
|
|
|
|
|
||||||
|
|
Loans 30-89 Days Past Due |
|
|
Nonaccrual Loans |
|
|
Total Past Due Loans |
|
|
Total Current Loans |
|
|
Total Loans |
|
|
Accruing Loans 90 or More Days Past Due |
|
||||||
Real estate loans: |
|
|
|
|
|
|
|
|
|
|
|
|
|
|
|
|
|
|
||||||
Construction and land development |
|
$ | 5 |
|
|
|
45 |
|
|
|
50 |
|
|
|
136,351 |
|
|
|
136,401 |
|
|
|
- |
|
Single-family residential |
|
|
3,761 |
|
|
|
3,302 |
|
|
|
7,063 |
|
|
|
365,762 |
|
|
|
372,825 |
|
|
|
- |
|
Commercial |
|
|
13 |
|
|
|
- |
|
|
|
13 |
|
|
|
425,807 |
|
|
|
425,820 |
|
|
|
- |
|
Multifamily and farmland |
|
|
- |
|
|
|
76 |
|
|
|
76 |
|
|
|
62,966 |
|
|
|
63,042 |
|
|
|
- |
|
Total real estate loans |
|
|
3,779 |
|
|
|
3,423 |
|
|
|
7,202 |
|
|
|
990,886 |
|
|
|
998,088 |
|
|
|
- |
|
|
|
|
|
|
|
|
|
|
|
|
|
|
|
|
|
|
|
|
|
|
|
|
|
|
Loans not secured by real estate: |
|
|
|
|
|
|
|
|
|
|
|
|
|
|
|
|
|
|
|
|
|
|
|
|
Commercial |
|
|
125 |
|
|
|
463 |
|
|
|
588 |
|
|
|
69,956 |
|
|
|
70,544 |
|
|
|
- |
|
Farm |
|
|
- |
|
|
|
1 |
|
|
|
1 |
|
|
|
549 |
|
|
|
550 |
|
|
|
- |
|
Consumer |
|
|
63 |
|
|
|
- |
|
|
|
63 |
|
|
|
6,903 |
|
|
|
6,966 |
|
|
|
- |
|
All other |
|
|
- |
|
|
|
- |
|
|
|
- |
|
|
|
16,918 |
|
|
|
16,918 |
|
|
|
- |
|
Total loans |
|
$ | 3,967 |
|
|
|
3,887 |
|
|
|
7,854 |
|
|
|
1,085,212 |
|
|
|
1,093,066 |
|
|
|
- |
|
The following table presents the Bank’s non-accrual loans as of December 31, 2024 and 2023:
|
|
December 31, 2024 |
|
|||||||||
|
|
Nonaccrual Loans |
|
|
Nonaccrual Loans |
|
|
Total |
|
|||
|
|
With No |
|
|
With |
|
|
Nonaccrual |
|
|||
(Dollars in thousands) |
|
Allowance |
|
|
Allowance |
|
|
Loans |
|
|||
Real estate loans: |
|
|
|
|
|
|
|
|
|
|||
Construction and land development |
|
$ | 37 |
|
|
|
- |
|
|
|
37 |
|
Single-family residential |
|
|
3,720 |
|
|
|
- |
|
|
|
3,720 |
|
Commercial |
|
|
426 |
|
|
|
- |
|
|
|
426 |
|
Multifamily and farmland |
|
|
- |
|
|
|
- |
|
|
|
- |
|
Total real estate loans |
|
|
4,183 |
|
|
|
- |
|
|
|
4,183 |
|
|
|
|
|
|
|
|
|
|
|
|
|
|
Loans not secured by real estate: |
|
|
|
|
|
|
|
|
|
|
|
|
Commercial |
|
|
248 |
|
|
|
- |
|
|
|
248 |
|
Consumer |
|
|
9 |
|
|
|
- |
|
|
|
9 |
|
Total |
|
$ | 4,440 |
|
|
|
- |
|
|
|
4,440 |
|
| A-41 |
|
|
December 31, 2023 |
|
|||||||||
|
|
Nonaccrual Loans |
|
|
Nonaccrual Loans |
|
|
Total |
|
|||
|
|
With No |
|
|
With |
|
|
Nonaccrual |
|
|||
(Dollars in thousands) |
|
Allowance |
|
|
Allowance |
|
|
Loans |
|
|||
Real estate loans: |
|
|
|
|
|
|
|
|
|
|||
Construction and land development |
|
$ | 45 |
|
|
|
- |
|
|
|
45 |
|
Single-family residential |
|
|
3,302 |
|
|
|
- |
|
|
|
3,302 |
|
Multifamily and farmland |
|
|
76 |
|
|
|
- |
|
|
|
76 |
|
Total real estate loans |
|
|
3,423 |
|
|
|
- |
|
|
|
3,423 |
|
|
|
|
|
|
|
|
|
|
|
|
|
|
Loans not secured by real estate: |
|
|
|
|
|
|
|
|
|
|
|
|
Commercial |
|
|
31 |
|
|
|
432 |
|
|
|
463 |
|
Consumer |
|
|
1 |
|
|
|
- |
|
|
|
1 |
|
Total |
|
$ | 3,455 |
|
|
|
432 |
|
|
|
3,887 |
|
No interest income was recognized on non-accrual loans for the years ended December 31, 2024 and 2023.
The following table represents the accrued interest receivables written off by reversing interest income during the years ended December 31, 2024 and 2023:
| (Dollars in thousands) |
|
|
|
|
|
|
||
|
|
For the Year Ended |
|
|
For the Year Ended |
|
||
|
|
December 31, 2024 |
|
|
December 31, 2023 |
|
||
| Real estate loans: |
|
|
|
|
|
|
||
Single-family residential |
|
$ | 39 |
|
|
|
33 |
|
Commercial |
|
|
9 |
|
|
|
- |
|
Total real estate loans |
|
|
48 |
|
|
|
33 |
|
|
|
|
|
|
|
|
|
|
| Loans not secured by real estate: |
|
|
|
|
|
|
|
|
Commercial |
|
|
8 |
|
|
|
12 |
|
Consumer |
|
|
2 |
|
|
|
1 |
|
|
|
|
|
|
|
|
|
|
Total |
|
$ | 58 |
|
|
|
46 |
|
A loan may be individually evaluated for determining the allowance for credit losses when it is determined that it does not share similar risk characteristics with other assets. Non-accrual loans with an outstanding balance of $250,000 or greater are individually evaluated and totaled $1.6 million at December 31, 2024. Nonaccrual loans evaluated collectively as a pool totaled $2.8 million at December 31, 2024. Collateral dependent loans are loans for which the repayment is expected to be provided substantially through the operation or sale of the collateral and the borrower is experiencing financial difficulty. Collateral dependent loans require an analysis of the collateral. The fair value of the collateral is discounted by estimated liquidation costs. If the discounted fair value of the collateral is greater than the amortized loan balance, no allowance is required. Otherwise the difference between the balance and the collateral is charged off if deemed uncollectible.
The following table details the amortized cost of collateral dependent loans and any related allowance at December 31, 2024.
|
|
December 31, 2024 |
|
|||||
|
|
|
|
Allowance for |
|
|||
(Dollars in thousands) |
|
Amortized Cost |
|
|
Credit Losses |
|
||
Real estate loans: |
|
|
|
|
|
|
||
Construction and land development |
|
$ | 37 |
|
|
|
- |
|
Single-family residential |
|
|
3,720 |
|
|
|
- |
|
Commercial |
|
|
426 |
|
|
|
- |
|
Multifamily and farmland |
|
|
- |
|
|
|
- |
|
Total real estate loans |
|
|
4,183 |
|
|
|
- |
|
|
|
|
|
|
|
|
|
|
Loans not secured by real estate: |
|
|
|
|
|
|
|
|
Commercial |
|
|
248 |
|
|
|
- |
|
Consumer |
|
|
- |
|
|
|
- |
|
Total |
|
$ | 4,431 |
|
|
|
- |
|
The following table details the amortized cost of non-accrual loans and any related allowance at December 31, 2023.
|
|
December 31, 2023 |
|
|||||
|
|
|
|
Allowance for |
|
|||
(Dollars in thousands) |
|
Amortized Cost |
|
|
Credit Losses |
|
||
Real estate loans: |
|
|
|
|
|
|
||
Construction and land development |
|
$ | - |
|
|
|
- |
|
Single-family residential |
|
|
- |
|
|
|
- |
|
Commercial |
|
|
- |
|
|
|
- |
|
Multifamily and farmland |
|
|
- |
|
|
|
- |
|
Total real estate loans |
|
|
- |
|
|
|
- |
|
|
|
|
|
|
|
|
|
|
Loans not secured by real estate: |
|
|
|
|
|
|
|
|
Commercial |
|
|
432 |
|
|
|
432 |
|
Consumer |
|
|
- |
|
|
|
- |
|
Total |
|
$ | 432 |
|
|
|
432 |
|
| A-42 |
The following tables provide a breakdown of collateral dependent loans by collateral type and collateral coverage at December 31, 2024 and 2023. These tables also show non-accrual loans not considered to be collateral dependent at December 31, 2024 and 2023.
|
|
December 31, 2024 |
|
|||||||||||||||||||||
|
|
|
|
|
|
|
|
|
|
|
|
|
|
Financial Assets Not Considered |
|
|
|
|
||||||
(Dollars in thousands) |
|
Residential |
|
|
Developed |
|
|
Commercial |
|
|
Business |
|
|
Collateral |
|
|
|
|
||||||
|
|
Property |
|
|
Land |
|
|
Property |
|
|
Assets |
|
|
Dependent |
|
|
Total |
|
||||||
Real estate loans: |
|
|
|
|
|
|
|
|
|
|
|
|
|
|
|
|
|
|
||||||
Construction and land development |
|
$ | - |
|
|
|
37 |
|
|
|
- |
|
|
|
- |
|
|
|
- |
|
|
|
37 |
|
Single-family residential |
|
|
3,720 |
|
|
|
- |
|
|
|
- |
|
|
|
- |
|
|
|
- |
|
|
|
3,720 |
|
Commercial |
|
|
- |
|
|
|
- |
|
|
|
426 |
|
|
|
- |
|
|
|
- |
|
|
|
426 |
|
Multifamily and farmland |
|
|
- |
|
|
|
- |
|
|
|
- |
|
|
|
- |
|
|
|
- |
|
|
|
- |
|
Total real estate loans |
|
|
3,720 |
|
|
|
37 |
|
|
|
426 |
|
|
|
- |
|
|
|
- |
|
|
|
4,183 |
|
|
|
|
|
|
|
|
|
|
|
|
|
|
|
|
|
|
|
|
|
|
|
|
|
|
Loans not secured by real estate: |
|
|
|
|
|
|
|
|
|
|
|
|
|
|
|
|
|
|
|
|
|
|
|
|
Commercial |
|
|
- |
|
|
|
- |
|
|
|
- |
|
|
|
248 |
|
|
|
- |
|
|
|
248 |
|
Consumer |
|
|
- |
|
|
|
- |
|
|
|
- |
|
|
|
- |
|
|
|
9 |
|
|
|
9 |
|
Total |
|
$ | 3,720 |
|
|
|
37 |
|
|
|
426 |
|
|
|
248 |
|
|
|
9 |
|
|
|
4,440 |
|
Collateral Value |
|
$ | 9,648 |
|
|
|
88 |
|
|
|
944 |
|
|
|
272 |
|
|
|
|
|
|
|
|
|
|
|
December 31, 2023 |
|
|||||||||||||||||||||
|
|
|
|
|
|
|
|
|
|
|
|
|
|
Financial Assets Not Considered |
|
|
|
|
||||||
(Dollars in thousands) |
|
Residential |
|
|
Developed |
|
|
Multifamily |
|
|
Business |
|
|
Collateral |
|
|
|
|
||||||
|
|
Property |
|
|
Land |
|
|
Property |
|
|
Assets |
|
|
Dependent |
|
|
Total |
|
||||||
Real estate loans: |
|
|
|
|
|
|
|
|
|
|
|
|
|
|
|
|
|
|
||||||
Construction and land development |
|
$ | - |
|
|
|
- |
|
|
|
- |
|
|
|
- |
|
|
|
- |
|
|
|
- |
|
Single-family residential |
|
|
- |
|
|
|
- |
|
|
|
- |
|
|
|
- |
|
|
|
- |
|
|
|
- |
|
Commercial |
|
|
- |
|
|
|
- |
|
|
|
- |
|
|
|
- |
|
|
|
- |
|
|
|
- |
|
Multifamily and farmland |
|
|
- |
|
|
|
- |
|
|
|
- |
|
|
|
- |
|
|
|
- |
|
|
|
- |
|
Total real estate loans |
|
|
- |
|
|
|
- |
|
|
|
- |
|
|
|
- |
|
|
|
- |
|
|
|
- |
|
|
|
|
|
|
|
|
|
|
|
|
|
|
|
|
|
|
|
|
|
|
|
|
|
|
Loans not secured by real estate: |
|
|
|
|
|
|
|
|
|
|
|
|
|
|
|
|
|
|
|
|
|
|
|
|
Commercial |
|
|
- |
|
|
|
- |
|
|
|
- |
|
|
|
350 |
|
|
|
82 |
|
|
|
432 |
|
Consumer |
|
|
- |
|
|
|
- |
|
|
|
- |
|
|
|
- |
|
|
|
- |
|
|
|
- |
|
Total |
|
$ | - |
|
|
|
- |
|
|
|
- |
|
|
|
350 |
|
|
|
82 |
|
|
|
432 |
|
Collateral Value |
|
$ | - |
|
|
|
- |
|
|
|
- |
|
|
|
350 |
|
|
|
|
|
|
|
|
|
The allowance for credit losses incorporates an estimate of lifetime expected credit losses and is recorded on each asset upon origination or acquisition. The starting point for the estimate of the allowance for credit losses is historical loss information, which includes losses from modifications of receivables to borrowers experiencing financial difficulty. An assessment of whether a borrower is experiencing financial difficulty is made on the date of a modification.
A change to the allowance for credit losses is evaluated based on the nature of the modification. Occasionally, the Bank modifies loans by providing principal forgiveness on certain loans. When principal forgiveness is provided, the amortized cost basis of the asset is written off against the allowance for credit losses. The amount of the principal forgiveness is deemed to be uncollectible; therefore, that portion of the loan is written off, resulting in a reduction of the amortized cost basis and a corresponding adjustment to the allowance for credit losses.
In some cases, the Bank may modify a certain loan by providing multiple types of concessions. Typically, one type of concession, such as a term extension, is granted initially. If the borrower continues to experience financial difficulty, another concession, such as principal forgiveness, may be granted.
The following tables show the amortized cost basis at December 31, 2024 and 2023 of the loans to borrowers experiencing financial difficulty that were modified during the years ended December 31, 2024 and 2023, disaggregated by loan class and type of concession granted.
(Dollars in thousands) |
|
|
|
|
|
|
|
|
|
|
|||
|
|
|
|
|
|
|
|
||||||
|
|
Amortized Cost Basis at December 31, 2024 |
|
|
% of Loan Class |
|
|
Modification Type |
|
Financial Effect |
|||
Loan class: |
|
|
|
|
|
|
|
|
|
|
|||
Single-family residential |
|
$ | 229 |
|
|
|
0.06 | % |
|
Interest rate reduction and term extension |
|
Adjustable rate loan converted to fixed rate loan and HELOC converted to amortizing term loan |
|
Total |
|
$ | 229 |
|
|
|
|
|
|
|
|
|
|
(Dollars in thousands) |
|
|
|
|
|
|
|
|
|
|
|||
|
|
|
|
|
|
|
|
||||||
|
|
Amortized Cost Basis at December 31, 2023 |
|
|
% of Loan Class |
|
|
Modification Type |
|
Financial Effect |
|||
Loan class: |
|
|
|
|
|
|
|
|
|
|
|||
Single-family residential |
|
$ | 149 |
|
|
|
0.04 | % |
|
Term extension |
|
Forbearance agreement on matured home equity line of credit (HELOC) that was modified to 180 month term. |
|
Commercial real estate |
|
|
669 |
|
|
|
0.16 | % |
|
Term extension |
|
Extended existing amortization from 148 months to 173 months to keep existing payment the same with the current market rate. |
|
Commercial not secured by real estate |
|
|
350 |
|
|
|
0.49 | % |
|
Term extension |
|
Matured balloon loan converted to amortizing term loan. |
|
Total |
|
$ | 1,168 |
|
|
|
|
|
|
|
|
|
|
One $71,000 commercial loan not secured by real estate that was modified in the year ended December 31, 2024 that were made to borrowers experiencing financial difficulty was written off at December 31, 2024. No loans modified in the year ended December 31, 2023 that were made to borrowers experiencing financial difficulty had been written off at December 31, 2023.
The Bank closely monitors the performance of those loans that are modified because borrowers are experiencing financial difficulty so as to understand the effectiveness of its modification efforts. The following tables show the performance of loans that have been modified in the years ended December 31, 2024 and 2023.
December 31, 2024 |
|
|
|
|
|
|
|
|
|
|||
(Dollars in thousands) |
|
|
|
|
|
|
|
|
|
|||
|
|
Payment Status (Amortized Cost Basis) |
|
|||||||||
|
|
Current |
|
|
30 - 89 Days Past Due |
|
|
90 + Days Past Due |
|
|||
Loan type: |
|
|
|
|
|
|
|
|
|
|||
Single-family residential |
|
$ | 229 |
|
|
|
|
|
|
|
||
Total |
|
$ | 229 |
|
|
|
- |
|
|
|
- |
|
| A-43 |
December 31, 2023 |
|
|
|
|
|
|
|
|
|
|||
(Dollars in thousands) |
|
|
|
|
|
|
|
|
|
|||
|
|
Payment Status (Amortized Cost Basis) |
|
|||||||||
|
|
Current |
|
|
30 - 89 Days Past Due |
|
|
90 + Days Past Due |
|
|||
Loan type: |
|
|
|
|
|
|
|
|
|
|||
Single-family residential |
|
$ | 149 |
|
|
|
- |
|
|
|
- |
|
Commercial real estate |
|
|
669 |
|
|
|
- |
|
|
|
- |
|
Commercial not secured by real estate |
|
|
350 |
|
|
|
|
|
|
|
|
|
Total |
|
$ | 1,168 |
|
|
|
- |
|
|
|
- |
|
The following table presents impaired loans as of and for the year ended December 31, 2022, under the incurred loss methodology:
December 31, 2022 |
|
|
|
|
|
|
|
|
|
|
|
|
|
|
|
|
|
|
|
|
|
|||||||
(Dollars in thousands) |
|
|
|
|
|
|
|
|
|
|
|
|
|
|
|
|
|
|
|
|
|
|||||||
|
|
|
|
|
|
|
|
|
|
|
|
|
|
|
|
|
|
|
|
|
|
|||||||
|
|
Unpaid Contractual Principal Balance |
|
|
Recorded Investment With No Allowance |
|
|
Recorded Investment With Allowance |
|
|
Recorded Investment in Impaired Loans |
|
|
Related Allowance |
|
|
Average Outstanding Impaired Loans |
|
|
YTD Interest Income Recognized |
|
|||||||
Real estate loans: |
|
|
|
|
|
|
|
|
|
|
|
|
|
|
|
|
|
|
|
|
|
|||||||
Construction and land development |
|
$ | 110 |
|
|
|
- |
|
|
|
110 |
|
|
|
110 |
|
|
|
2 |
|
|
|
75 |
|
|
|
8 |
|
Single-family residential |
|
|
14,353 |
|
|
|
236 |
|
|
|
13,048 |
|
|
|
13,284 |
|
|
|
671 |
|
|
|
13,951 |
|
|
|
746 |
|
Commercial |
|
|
1,785 |
|
|
|
421 |
|
|
|
1,346 |
|
|
|
1,767 |
|
|
|
9 |
|
|
|
1,916 |
|
|
|
93 |
|
Multifamily and farmland |
|
|
104 |
|
|
|
- |
|
|
|
91 |
|
|
|
91 |
|
|
|
- |
|
|
|
96 |
|
|
|
5 |
|
Total impaired real estate loans |
|
|
16,352 |
|
|
|
657 |
|
|
|
14,595 |
|
|
|
15,252 |
|
|
|
682 |
|
|
|
16,038 |
|
|
|
852 |
|
|
|
|
|
|
|
|
|
|
|
|
|
|
|
|
|
|
|
|
|
|
|
|
|
|
|
|
|
|
Loans not secured by real estate: |
|
|
|
|
|
|
|
|
|
|
|
|
|
|
|
|
|
|
|
|
|
|
|
|
|
|
|
|
Commercial |
|
|
116 |
|
|
|
- |
|
|
|
116 |
|
|
|
116 |
|
|
|
1 |
|
|
|
137 |
|
|
|
8 |
|
Consumer |
|
|
11 |
|
|
|
- |
|
|
|
9 |
|
|
|
9 |
|
|
|
- |
|
|
|
15 |
|
|
|
2 |
|
Total impaired loans |
|
$ | 16,479 |
|
|
|
657 |
|
|
|
14,720 |
|
|
|
15,377 |
|
|
|
683 |
|
|
|
16,190 |
|
|
|
862 |
|
Impaired loans collectively evaluated for impairment totaled $4.9 million at December 31, 2022 and are included in the tables above. Allowance on impaired loans collectively evaluated for impairment totaled $44,000 at December 31, 2022.
Management uses several measures to assess and monitor the credit risks in the loan portfolio, including a loan grading system that begins upon loan origination and continues until the loan is collected or collectability becomes doubtful. Upon loan origination, the Bank’s originating loan officer evaluates the quality of the loan and assigns one of eight risk grades. The loan officer monitors the loan’s performance and credit quality and makes changes to the credit grade as conditions warrant. When originated or renewed, all loans over a certain dollar amount receive in-depth reviews and risk assessments by the Bank’s Credit Administration. Before making any changes in these risk grades, management considers assessments as determined by the third-party credit review firm (as described below), regulatory examiners and the Bank’s Credit Administration. Any issues regarding the risk assessments are addressed by the Bank’s senior credit administrators and factored into management’s decision to originate or renew the loan. The Bank Board reviews, on a monthly basis, an analysis of the Bank’s reserves relative to the range of reserves estimated by the Bank’s Credit Administration.
As an additional measure, the Bank engages an independent third party to review the underwriting, documentation and risk grading analyses. This independent third party reviews and evaluates loan relationships greater than or equal to $1.5 million as well as a periodic sample of commercial relationships with exposures below $1.5 million, excluding loans in default, and loans in process of litigation or liquidation. The third party’s evaluation and report is shared with management and the Bank Board.
Management considers certain commercial loans with weak credit risk grades to be individually impaired and measures such impairment based upon available cash flows and the value of the collateral. Allowance or reserve levels are estimated for all other graded loans in the portfolio based on their assigned credit risk grade, type of loan and other matters related to credit risk.
| A-44 |
Management uses the information developed from the procedures described above in evaluating and grading the loan portfolio. This continual grading process is used to monitor the credit quality of the loan portfolio and to assist management in estimating the allowance. The provision for credit losses charged or credited to earnings is based upon management’s judgment of the amount necessary to maintain the allowance at a level appropriate to absorb probable incurred losses in the loan portfolio at the balance sheet date. The amount each quarter is dependent upon many factors, including growth and changes in the composition of the loan portfolio, net charge-offs, delinquencies, management’s assessment of loan portfolio quality, the value of collateral, and other macro-economic factors and trends. The evaluation of these factors is performed quarterly by management through an analysis of the appropriateness of the allowance.
The following tables present changes in the allowance for credit losses for the years ended December 31, 2024, 2023 and 2022. The December 31, 2024 and 2023 tables reflect the CECL methodology and the December 31, 2022 table reflects the Incurred Loss methodology. No loans were individually evaluated as of December 31, 2024.
(Dollars in thousands) |
|
|
|
|
|
|
|
|
|
|
|
|
|
|
|
|
|
|
|
|||||||||||||
|
|
Real Estate Loans |
|
|
|
|
|
|
|
|
|
|
|
|
|
|||||||||||||||||
|
|
Construction and Land Development |
|
|
Single-Family Residential |
|
|
Commercial |
|
|
Multifamily and Farmland |
|
|
Commercial |
|
|
Farm |
|
|
Consumer and All Other |
|
|
Total |
|
||||||||
Twelve months ended December 31, 2024 |
|
|
|
|
|
|
|
|
|
|
|
|
|
|
|
|
|
|
|
|
|
|
||||||||||
Allowance for credit losses: |
|
|
|
|
|
|
|
|
|
|
|
|
|
|
|
|
|
|
|
|
|
|
|
|
||||||||
Beginning balance |
|
$ | 3,913 |
|
|
|
3,484 |
|
|
|
2,317 |
|
|
|
268 |
|
|
|
812 |
|
|
|
2 |
|
|
|
245 |
|
|
|
11,041 |
|
Charge-offs |
|
|
- |
|
|
|
(131 | ) |
|
|
- |
|
|
|
- |
|
|
|
(1,134 | ) |
|
|
- |
|
|
|
(716 | ) |
|
|
(1,981 | ) |
Recoveries |
|
|
- |
|
|
|
129 |
|
|
|
202 |
|
|
|
- |
|
|
|
55 |
|
|
|
- |
|
|
|
165 |
|
|
|
551 |
|
Provision (recovery) for credit losses (1) |
|
|
(528 | ) |
|
|
(96 | ) |
|
|
(197 | ) |
|
|
(22 | ) |
|
|
713 |
|
|
|
(1 | ) |
|
|
515 |
|
|
|
384 |
|
Ending balance |
|
$ | 3,385 |
|
|
|
3,386 |
|
|
|
2,322 |
|
|
|
246 |
|
|
|
446 |
|
|
|
1 |
|
|
|
209 |
|
|
|
9,995 |
|
Allowance for credit loss-loans |
|
$ | 3,385 |
|
|
|
3,386 |
|
|
|
2,322 |
|
|
|
246 |
|
|
|
446 |
|
|
|
1 |
|
|
|
209 |
|
|
|
9,995 |
|
Allowance for credit loss unfunded loan commitments |
|
|
1,096 |
|
|
|
3 |
|
|
|
- |
|
|
|
- |
|
|
|
- |
|
|
|
- |
|
|
|
2 |
|
|
|
1,101 |
|
Total allowance for credit losses |
|
$ | 4,481 |
|
|
|
3,389 |
|
|
|
2,322 |
|
|
|
246 |
|
|
|
446 |
|
|
|
1 |
|
|
|
211 |
|
|
|
11,096 |
|
| ||||||||||||||||||||||||||||||||
(1) Excludes provision for credit losses related to unfunded commitments. Note 11,"Commitments and Contingencies" in the consolidated financial statements provides more detail concerning the provision for credit losses related to unfunded commitments. | ||||||||||||||||||||||||||||||||
(Dollars in thousands) |
|
|
|
|
|
|
|
|
|
|
|
|
|
|
|
|
|
|
|
|
|
|
||||||||||||||
|
|
Real Estate Loans |
|
|
|
|
|
|
|
|
|
|
|
|
|
|
|
|
||||||||||||||||||
|
|
Construction and Land Development |
|
|
Single-Family Residential |
|
|
Commercial |
|
|
Multifamily and Farmland |
|
|
Commercial |
|
|
Farm |
|
|
Consumer and All Other |
|
|
Unallocated |
|
|
Total |
|
|||||||||
Twelve months ended December 31, 2023 |
|
|
|
|
|
|
|
|
|
|
|
|
|
|
|
|
|
|
|
|
|
|
|
|
|
|||||||||||
Allowance for credit losses: |
|
|
|
|
|
|
|
|
|
|
|
|
|
|
|
|
|
|
|
|
|
|
|
|
|
|
|
|||||||||
Beginning balance |
|
$ | 1,415 |
|
|
|
3,085 |
|
|
|
3,207 |
|
|
|
164 |
|
|
|
657 |
|
|
|
- |
|
|
|
214 |
|
|
|
1,752 |
|
|
|
10,494 |
|
Adjustment for CECL implementation (1) |
|
|
1,584 |
|
|
|
64 |
|
|
|
(986 | ) |
|
|
115 |
|
|
|
(295 | ) |
|
|
2 |
|
|
|
48 |
|
|
|
(1,752 | ) |
|
|
(1,220 | ) |
Charge-offs |
|
|
- |
|
|
|
- |
|
|
|
- |
|
|
|
- |
|
|
|
(129 | ) |
|
|
- |
|
|
|
(569 | ) |
|
|
- |
|
|
|
(698 | ) |
Recoveries |
|
|
- |
|
|
|
171 |
|
|
|
6 |
|
|
|
- |
|
|
|
67 |
|
|
|
- |
|
|
|
147 |
|
|
|
- |
|
|
|
391 |
|
Provision (recovery) for credit losses (1) |
|
|
914 |
|
|
|
164 |
|
|
|
90 |
|
|
|
(11 | ) |
|
|
512 |
|
|
|
- |
|
|
|
405 |
|
|
|
- |
|
|
|
2,074 |
|
Ending balance |
|
$ | 3,913 |
|
|
|
3,484 |
|
|
|
2,317 |
|
|
|
268 |
|
|
|
812 |
|
|
|
2 |
|
|
|
245 |
|
|
|
- |
|
|
|
11,041 |
|
Allowance for credit loss-loans |
|
$ | 3,913 |
|
|
|
3,484 |
|
|
|
2,317 |
|
|
|
268 |
|
|
|
812 |
|
|
|
2 |
|
|
|
245 |
|
|
|
- |
|
|
|
11,041 |
|
Allowance for credit loss unfunded loan commitments |
|
|
1,759 |
|
|
|
8 |
|
|
|
- |
|
|
|
1 |
|
|
|
2 |
|
|
|
- |
|
|
|
- |
|
|
|
- |
|
|
|
1,770 |
|
Total allowance for credit losses |
|
$ | 5,672 |
|
|
|
3,492 |
|
|
|
2,317 |
|
|
|
269 |
|
|
|
814 |
|
|
|
2 |
|
|
|
245 |
|
|
|
- |
|
|
|
12,811 |
|
| ||||||||||||||||||||||||||||||||||||
(1) Excludes provision for credit losses related to unfunded commitments. Note 11,"Commitments and Contingencies" in the consolidated financial statements provides more detail concerning the provision for credit losses related to unfunded commitments. | ||||||||||||||||||||||||||||||||||||
| A-45 |
(Dollars in thousands) |
|
|
|
|
|
|
|
|
|
|
|
|
|
|
|
|
|
|
|
|
|
|
||||||||||||||
|
|
Real Estate Loans |
|
|
|
|
|
|
|
|
|
|
|
|
|
|
|
|
||||||||||||||||||
|
|
Construction and Land Development |
|
|
Single-Family Residential |
|
|
Commercial |
|
|
Multifamily and Farmland |
|
|
Commercial |
|
|
Farm |
|
|
Consumer and All Other |
|
|
Unallocated |
|
|
Total |
|
|||||||||
Twelve months ended December 31, 2022 |
|
|
|
|
|
|
|
|
|
|
|
|
|
|
|
|
|
|||||||||||||||||||
Allowance for loan losses: |
|
|
|
|
|
|
|
|
|
|
|
|
|
|
|
|
|
|
|
|
|
|
|
|
|
|
|
|||||||||
Beginning balance |
|
$ | 1,193 |
|
|
|
2,877 |
|
|
|
2,234 |
|
|
|
150 |
|
|
|
711 |
|
|
|
- |
|
|
|
110 |
|
|
|
2,080 |
|
|
|
9,355 |
|
Charge-offs |
|
|
- |
|
|
|
(128 | ) |
|
|
- |
|
|
|
- |
|
|
|
(33 | ) |
|
|
- |
|
|
|
(591 | ) |
|
|
- |
|
|
|
(752 | ) |
Recoveries |
|
|
- |
|
|
|
229 |
|
|
|
9 |
|
|
|
- |
|
|
|
72 |
|
|
|
- |
|
|
|
109 |
|
|
|
- |
|
|
|
419 |
|
Provision |
|
|
222 |
|
|
|
107 |
|
|
|
964 |
|
|
|
14 |
|
|
|
(93 | ) |
|
|
- |
|
|
|
586 |
|
|
|
(328 | ) |
|
|
1,472 |
|
Ending balance |
|
$ | 1,415 |
|
|
|
3,085 |
|
|
|
3,207 |
|
|
|
164 |
|
|
|
657 |
|
|
|
- |
|
|
|
214 |
|
|
|
1,752 |
|
|
|
10,494 |
|
|
|
|
|
|
|
|
|
|
|
|
|
|
|
|
|
|
|
|
|
|
|
|
|
|
|
|
|
|
|
|
|
|
|
|
|
|
Allowance for loan losses December 31, 2022 |
|
|
|
|
|
|
|
|
|
|
|
|
|
|
|
|
|
|
|
|
|
|
|
|||||||||||||
|
|
|
|
|
|
|
|
|
|
|
|
|
|
|
|
|
|
|
|
|
|
|
|
|
|
|
|
|
|
|
|
|
|
|||
Ending balance: individually evaluated for impairment |
|
$ | - |
|
|
|
633 |
|
|
|
6 |
|
|
|
- |
|
|
|
- |
|
|
|
- |
|
|
|
- |
|
|
|
- |
|
|
|
639 |
|
Ending balance: collectively evaluated for impairment |
|
|
1,415 |
|
|
|
2,452 |
|
|
|
3,201 |
|
|
|
164 |
|
|
|
657 |
|
|
|
- |
|
|
|
214 |
|
|
|
1,752 |
|
|
|
9,855 |
|
Ending balance |
|
$ | 1,415 |
|
|
|
3,085 |
|
|
|
3,207 |
|
|
|
164 |
|
|
|
657 |
|
|
|
- |
|
|
|
214 |
|
|
|
1,752 |
|
|
|
10,494 |
|
|
|
|
|
|
|
|
|
|
|
|
|
|
|
|
|
|
|
|
|
|
|
|
|
|
|
|
|
|
|
|
|
|
|
|
|
|
Loans at December 31, 2022 |
|
|
|
|
|
|
|
|
|
|
|
|
|
|
|
|
|
|
|
|
|
|
|
|
|
|
|
|
|
|
|
|
|
|
|
|
Ending balance |
|
$ | 114,446 |
|
|
|
342,281 |
|
|
|
406,750 |
|
|
|
65,562 |
|
|
|
81,307 |
|
|
|
938 |
|
|
|
21,324 |
|
|
|
- |
|
|
|
1,032,608 |
|
Ending balance: individually evaluated for impairment |
|
$ | - |
|
|
|
9,092 |
|
|
|
1,388 |
|
|
|
- |
|
|
|
- |
|
|
|
- |
|
|
|
- |
|
|
|
- |
|
|
|
10,480 |
|
Ending balance: collectively evaluated for impairment |
|
$ | 114,446 |
|
|
|
333,189 |
|
|
|
405,362 |
|
|
|
65,562 |
|
|
|
81,307 |
|
|
|
938 |
|
|
|
21,324 |
|
|
|
- |
|
|
|
1,022,128 |
|
The Bank utilizes several credit quality indicators to manage credit risk in an ongoing manner. The Bank uses an internal risk grade system that categorizes loans into pass, watch or substandard categories.
The Bank uses the following credit quality indicators:
|
· |
Pass – Includes loans ranging from excellent quality with a minimal amount of credit risk to loans with higher risk and servicing needs but still are considered to be acceptable. The higher risk loans in this category are not problem credits presently, but may be in the future if the borrower is unable to change its present course. |
|
· |
Watch – These loans are currently performing satisfactorily, but there has been some recent past due history on repayment and there are potential weaknesses that may, if not corrected, weaken the asset or inadequately protect the Bank’s position at some future date. |
|
· |
Substandard – A Substandard loan is inadequately protected by the current sound net worth and paying capacity of the obligor or the collateral pledged (if there is any). There is a well-defined weakness or weaknesses that jeopardize the liquidation of the debt. There is a distinct possibility that the Bank will sustain some loss if the deficiencies are not corrected. |
|
· |
Doubtful – Loans classified Doubtful have all the weaknesses inherent in loans classified Substandard, plus the added characteristic that the weaknesses make collection or liquidation in full on the basis of currently existing facts, conditions, and values highly questionable and improbable. |
|
· |
Loss – Loans classified Loss are considered uncollectable and of such little value that their continuance as bankable assets is not warranted. This classification does not mean that the asset has absolutely no recovery or salvage value, but rather that it is not practical or desirable to defer writing off this worthless loan even though partial recovery may be affected in the future. |
| A-46 |
The following table presents by credit quality indicator, loan class and year of origination, the amortized cost of the Bank’s loans as of December 31, 2024.
|
|
Term Loans by Origination Year |
|
|
|
|
|
Revolving |
|
|
|
|
||||||||||||||||||||||||
|
|
|
|
|
|
|
|
|
|
|
|
|
|
|
|
|
|
|
|
|
|
|
Loans |
|
|
|
|
|||||||||
(dollars in thousands) |
|
|
|
|
|
|
|
|
|
|
|
|
|
|
|
|
|
|
|
Revolving |
|
|
Converted to |
|
|
Total |
|
|||||||||
|
|
2024 |
|
|
2023 |
|
|
2022 |
|
|
2021 |
|
|
2020 |
|
|
Prior |
|
|
Loans |
|
|
Term Loans |
|
|
Loans |
|
|||||||||
December 31, 2024 |
|
|
|
|
|
|
|
|
|
|
|
|
|
|
|
|
|
|
|
|
|
|
|
|
|
|
|
|||||||||
Real Estate Loans |
|
|
|
|
|
|
|
|
|
|
|
|
|
|
|
|
|
|
|
|
|
|
|
|
|
|
|
|||||||||
Construction and land |
|
|
|
|
|
|
|
|
|
|
|
|
|
|
|
|
|
|
|
|
|
|
|
|
|
|
|
|||||||||
development |
|
|
|
|
|
|
|
|
|
|
|
|
|
|
|
|
|
|
|
|
|
|
|
|
|
|
|
|||||||||
Pass |
|
$ | 41,171 |
|
|
|
29,503 |
|
|
|
34,495 |
|
|
|
6,836 |
|
|
|
5,792 |
|
|
|
4,020 |
|
|
|
- |
|
|
|
- |
|
|
|
121,817 |
|
Watch |
|
|
- |
|
|
|
- |
|
|
|
- |
|
|
|
443 |
|
|
|
- |
|
|
|
- |
|
|
|
- |
|
|
|
- |
|
|
|
443 |
|
Substandard |
|
|
- |
|
|
|
- |
|
|
|
- |
|
|
|
- |
|
|
|
- |
|
|
|
68 |
|
|
|
- |
|
|
|
- |
|
|
|
68 |
|
Total Construction and |
|
|
|
|
|
|
|
|
|
|
|
|
|
|
|
|
|
|
|
|
|
|
|
|
|
|
|
|
|
|
|
|
|
|
|
|
land development |
|
$ | 41,171 |
|
|
|
29,503 |
|
|
|
34,495 |
|
|
|
7,279 |
|
|
|
5,792 |
|
|
|
4,088 |
|
|
|
- |
|
|
|
- |
|
|
|
122,328 |
|
Single family |
|
|
|
|
|
|
|
|
|
|
|
|
|
|
|
|
|
|
|
|
|
|
|
|
|
|
|
|
|
|
|
|
|
|
|
|
Pass |
|
$ | 22,169 |
|
|
|
35,865 |
|
|
|
73,663 |
|
|
|
43,900 |
|
|
|
22,363 |
|
|
|
66,074 |
|
|
|
113,067 |
|
|
|
- |
|
|
|
377,101 |
|
Watch |
|
|
- |
|
|
|
- |
|
|
|
- |
|
|
|
- |
|
|
|
- |
|
|
|
1,469 |
|
|
|
993 |
|
|
|
- |
|
|
|
2,462 |
|
Substandard |
|
|
- |
|
|
|
31 |
|
|
|
1,000 |
|
|
|
- |
|
|
|
124 |
|
|
|
3,467 |
|
|
|
324 |
|
|
|
- |
|
|
|
4,946 |
|
Total single family |
|
$ | 22,169 |
|
|
|
35,896 |
|
|
|
74,663 |
|
|
|
43,900 |
|
|
|
22,487 |
|
|
|
71,010 |
|
|
|
114,384 |
|
|
|
- |
|
|
|
384,509 |
|
Commercial |
|
|
|
|
|
|
|
|
|
|
|
|
|
|
|
|
|
|
|
|
|
|
|
|
|
|
|
|
|
|
|
|
|
|
|
|
Pass |
|
$ | 56,411 |
|
|
|
46,589 |
|
|
|
135,881 |
|
|
|
71,066 |
|
|
|
58,223 |
|
|
|
97,122 |
|
|
|
2,296 |
|
|
|
- |
|
|
|
467,588 |
|
Watch |
|
|
- |
|
|
|
- |
|
|
|
- |
|
|
|
- |
|
|
|
87 |
|
|
|
2,943 |
|
|
|
- |
|
|
|
- |
|
|
|
3,030 |
|
Substandard |
|
|
- |
|
|
|
- |
|
|
|
- |
|
|
|
- |
|
|
|
400 |
|
|
|
426 |
|
|
|
- |
|
|
|
- |
|
|
|
826 |
|
Total commercial |
|
$ | 56,411 |
|
|
|
46,589 |
|
|
|
135,881 |
|
|
|
71,066 |
|
|
|
58,710 |
|
|
|
100,491 |
|
|
|
2,296 |
|
|
|
- |
|
|
|
471,444 |
|
Multifamily and farmland |
|
|
|
|
|
|
|
|
|
|
|
|
|
|
|
|
|
|
|
|
|
|
|
|
|
|
|
|
|
|
|
|
|
|
|
|
Pass |
|
$ | 998 |
|
|
|
8,455 |
|
|
|
20,786 |
|
|
|
20,638 |
|
|
|
6,055 |
|
|
|
12,186 |
|
|
|
443 |
|
|
|
- |
|
|
|
69,561 |
|
Watch |
|
|
- |
|
|
|
- |
|
|
|
- |
|
|
|
- |
|
|
|
- |
|
|
|
43 |
|
|
|
- |
|
|
|
- |
|
|
|
43 |
|
Substandard |
|
|
- |
|
|
|
- |
|
|
|
- |
|
|
|
- |
|
|
|
- |
|
|
|
67 |
|
|
|
- |
|
|
|
- |
|
|
|
67 |
|
Total multifamily and |
|
|
|
|
|
|
|
|
|
|
|
|
|
|
|
|
|
|
|
|
|
|
|
|
|
|
|
|
|
|
|
|
|
|
|
|
farmland |
|
$ | 998 |
|
|
|
8,455 |
|
|
|
20,786 |
|
|
|
20,638 |
|
|
|
6,055 |
|
|
|
12,296 |
|
|
|
443 |
|
|
|
- |
|
|
|
69,671 |
|
Total real estate loans |
|
$ | 120,749 |
|
|
|
120,443 |
|
|
|
265,825 |
|
|
|
142,883 |
|
|
|
93,044 |
|
|
|
187,885 |
|
|
|
117,123 |
|
|
|
- |
|
|
|
1,047,952 |
|
Loans not secured by real estate |
|
|
|
|
|
|
|
|
|
|
|
|
|
|
|
|
|
|
|
|
|
|
|
|
|
|
|
|
|
|
|
|
|
|
|
|
Commercial |
|
|
|
|
|
|
|
|
|
|
|
|
|
|
|
|
|
|
|
|
|
|
|
|
|
|
|
|
|
|
|
|
|
|
|
|
Pass |
|
$ | 9,153 |
|
|
|
11,335 |
|
|
|
6,045 |
|
|
|
3,107 |
|
|
|
1,707 |
|
|
|
11,864 |
|
|
|
20,032 |
|
|
|
- |
|
|
|
63,243 |
|
Watch |
|
|
- |
|
|
|
- |
|
|
|
136 |
|
|
|
19 |
|
|
|
23 |
|
|
|
167 |
|
|
|
1 |
|
|
|
- |
|
|
|
346 |
|
Substandard |
|
|
- |
|
|
|
25 |
|
|
|
223 |
|
|
|
- |
|
|
|
- |
|
|
|
- |
|
|
|
- |
|
|
|
- |
|
|
|
248 |
|
Total Commercial |
|
$ | 9,153 |
|
|
|
11,360 |
|
|
|
6,404 |
|
|
|
3,126 |
|
|
|
1,730 |
|
|
|
12,031 |
|
|
|
20,033 |
|
|
|
- |
|
|
|
63,837 |
|
Farm |
|
|
|
|
|
|
|
|
|
|
|
|
|
|
|
|
|
|
|
|
|
|
|
|
|
|
|
|
|
|
|
|
|
|
|
|
Pass |
|
$ | 53 |
|
|
|
195 |
|
|
|
17 |
|
|
|
50 |
|
|
|
- |
|
|
|
- |
|
|
|
86 |
|
|
|
- |
|
|
|
401 |
|
Watch |
|
|
- |
|
|
|
- |
|
|
|
- |
|
|
|
- |
|
|
|
- |
|
|
|
- |
|
|
|
- |
|
|
|
- |
|
|
|
- |
|
Substandard |
|
|
- |
|
|
|
- |
|
|
|
- |
|
|
|
- |
|
|
|
- |
|
|
|
- |
|
|
|
- |
|
|
|
- |
|
|
|
- |
|
Total farm |
|
$ | 53 |
|
|
|
195 |
|
|
|
17 |
|
|
|
50 |
|
|
|
- |
|
|
|
- |
|
|
|
86 |
|
|
|
- |
|
|
|
401 |
|
Consumer |
|
|
|
|
|
|
|
|
|
|
|
|
|
|
|
|
|
|
|
|
|
|
|
|
|
|
|
|
|
|
|
|
|
|
|
|
Pass |
|
$ | 1,777 |
|
|
|
1,232 |
|
|
|
666 |
|
|
|
176 |
|
|
|
99 |
|
|
|
64 |
|
|
|
2,397 |
|
|
|
- |
|
|
|
6,411 |
|
Watch |
|
|
- |
|
|
|
- |
|
|
|
53 |
|
|
|
- |
|
|
|
- |
|
|
|
- |
|
|
|
- |
|
|
|
- |
|
|
|
53 |
|
Substandard |
|
|
- |
|
|
|
- |
|
|
|
- |
|
|
|
- |
|
|
|
- |
|
|
|
8 |
|
|
|
3 |
|
|
|
- |
|
|
|
11 |
|
Total consumer |
|
$ | 1,777 |
|
|
|
1,232 |
|
|
|
719 |
|
|
|
176 |
|
|
|
99 |
|
|
|
72 |
|
|
|
2,400 |
|
|
|
- |
|
|
|
6,475 |
|
All other |
|
|
|
|
|
|
|
|
|
|
|
|
|
|
|
|
|
|
|
|
|
|
|
|
|
|
|
|
|
|
|
|
|
|
|
|
Pass |
|
$ | 972 |
|
|
|
- |
|
|
|
10,002 |
|
|
|
376 |
|
|
|
217 |
|
|
|
2,878 |
|
|
|
5,164 |
|
|
|
- |
|
|
|
19,609 |
|
Watch |
|
|
- |
|
|
|
- |
|
|
|
- |
|
|
|
- |
|
|
|
- |
|
|
|
130 |
|
|
|
- |
|
|
|
- |
|
|
|
130 |
|
Substandard |
|
|
- |
|
|
|
- |
|
|
|
- |
|
|
|
- |
|
|
|
- |
|
|
|
- |
|
|
|
- |
|
|
|
- |
|
|
|
- |
|
Total all other |
|
$ | 972 |
|
|
|
- |
|
|
|
10,002 |
|
|
|
376 |
|
|
|
217 |
|
|
|
3,008 |
|
|
|
5,164 |
|
|
|
- |
|
|
|
19,739 |
|
Total loans not secured |
|
|
|
|
|
|
|
|
|
|
|
|
|
|
|
|
|
|
|
|
|
|
|
|
|
|
|
|
|
|
|
|
|
|
|
|
by real estate |
|
$ | 11,955 |
|
|
|
12,787 |
|
|
|
17,142 |
|
|
|
3,728 |
|
|
|
2,046 |
|
|
|
15,111 |
|
|
|
27,683 |
|
|
|
- |
|
|
|
90,452 |
|
Total loans |
|
$ | 132,704 |
|
|
|
133,230 |
|
|
|
282,967 |
|
|
|
146,611 |
|
|
|
95,090 |
|
|
|
202,996 |
|
|
|
144,806 |
|
|
|
- |
|
|
|
1,138,404 |
|
| A-47 |
The following table presents by credit quality indicator, loan class and year of origination, gross loan charge-offs as of December 31, 2024.
| December 31, 2024 |
|
Gross Loan Charge-offs by Origination Year |
|
|
|
|
Revolving |
|
|
|
||||||||||||||||||||||||||
|
|
|
|
|
|
|
|
|
|
|
|
|
|
|
|
Loans |
|
|
|
|||||||||||||||||
| (dollars in thousands) |
|
|
|
|
|
|
|
|
|
|
|
|
|
Revolving |
|
|
Converted to |
|
|
Total |
|
|||||||||||||||
|
|
2024 |
|
|
2023 |
|
|
2022 |
|
|
2021 |
|
|
2020 |
|
|
Prior |
|
|
Loans |
|
|
Term Loans |
|
|
Loans |
|
|||||||||
| Real estate loans: |
|
|
|
|
|
|
|
|
|
|
|
|
|
|
|
|
|
|
|
|
|
|
|
|
|
|
|
|||||||||
Construction and land development |
|
$ | - |
|
|
|
- |
|
|
|
- |
|
|
|
- |
|
|
|
- |
|
|
|
- |
|
|
|
- |
|
|
|
- |
|
|
|
- |
|
Single-family residential |
|
|
- |
|
|
|
- |
|
|
|
126 |
|
|
|
- |
|
|
|
- |
|
|
|
6 |
|
|
|
- |
|
|
|
- |
|
|
|
132 |
|
Commercial |
|
|
- |
|
|
|
- |
|
|
|
- |
|
|
|
- |
|
|
|
- |
|
|
|
- |
|
|
|
- |
|
|
|
- |
|
|
|
- |
|
Multifamily and farmland |
|
|
- |
|
|
|
- |
|
|
|
- |
|
|
|
- |
|
|
|
- |
|
|
|
- |
|
|
|
- |
|
|
|
- |
|
|
|
- |
|
Total real estate loans |
|
|
- |
|
|
|
- |
|
|
|
126 |
|
|
|
- |
|
|
|
- |
|
|
|
6 |
|
|
|
- |
|
|
|
- |
|
|
|
132 |
|
| Loans not secured by real estate: |
|
|
|
|
|
|
|
|
|
|
|
|
|
|
|
|
|
|
|
|
|
|
|
|
|
|
|
|
|
|
|
|
|
|
|
|
Commercial |
|
|
- |
|
|
|
447 |
|
|
|
397 |
|
|
|
74 |
|
|
|
179 |
|
|
|
36 |
|
|
|
- |
|
|
|
- |
|
|
|
1,133 |
|
Consumer |
|
|
5 |
|
|
|
37 |
|
|
|
9 |
|
|
|
- |
|
|
|
1 |
|
|
|
557 |
|
|
|
- |
|
|
|
- |
|
|
|
609 |
|
All other |
|
|
- |
|
|
|
- |
|
|
|
- |
|
|
|
- |
|
|
|
- |
|
|
|
107 |
|
|
|
- |
|
|
|
- |
|
|
|
107 |
|
|
|
|
|
|
|
|
|
|
|
|
|
|
|
|
|
|
|
|
|
|
|
|
|
|
|
|
|
|
|
|
|
|
|
|
|
|
Total gross charge-offs |
|
$ | 5 |
|
|
|
484 |
|
|
|
532 |
|
|
|
74 |
|
|
|
180 |
|
|
|
706 |
|
|
|
- |
|
|
|
- |
|
|
|
1,981 |
|
| A-48 |
The following table presents by credit quality indicator, loan class and year of origination, the amortized cost of the Bank’s loans as of December 31, 2023.
|
|
Term Loans by Origination Year |
|
|
|
|
|
Revolving |
|
|
|
|
||||||||||||||||||||||||
|
|
|
|
|
|
|
|
|
|
|
|
|
|
|
|
|
|
|
|
|
|
|
Loans |
|
|
|
|
|||||||||
(dollars in thousands) |
|
|
|
|
|
|
|
|
|
|
|
|
|
|
|
|
|
|
|
Revolving |
|
|
Converted to |
|
|
Total |
|
|||||||||
|
|
2023 |
|
|
2022 |
|
|
2021 |
|
|
2020 |
|
|
2019 |
|
|
Prior |
|
|
Loans |
|
|
Term Loans |
|
|
Loans |
|
|||||||||
December 31, 2023 |
|
|
|
|
|
|
|
|
|
|
|
|
|
|
|
|
|
|
|
|
|
|
|
|
|
|
|
|||||||||
Real Estate Loans |
|
|
|
|
|
|
|
|
|
|
|
|
|
|
|
|
|
|
|
|
|
|
|
|
|
|
|
|||||||||
Construction and land |
|
|
|
|
|
|
|
|
|
|
|
|
|
|
|
|
|
|
|
|
|
|
|
|
|
|
|
|||||||||
development |
|
|
|
|
|
|
|
|
|
|
|
|
|
|
|
|
|
|
|
|
|
|
|
|
|
|
|
|||||||||
Pass |
|
$ | 40,034 |
|
|
|
71,429 |
|
|
|
10,736 |
|
|
|
6,692 |
|
|
|
1,721 |
|
|
|
3,914 |
|
|
|
1,337 |
|
|
|
- |
|
|
|
135,863 |
|
Watch |
|
|
- |
|
|
|
- |
|
|
|
448 |
|
|
|
- |
|
|
|
- |
|
|
|
- |
|
|
|
- |
|
|
|
- |
|
|
|
448 |
|
Substandard |
|
|
- |
|
|
|
- |
|
|
|
- |
|
|
|
- |
|
|
|
- |
|
|
|
90 |
|
|
|
- |
|
|
|
- |
|
|
|
90 |
|
Total Construction and |
|
|
|
|
|
|
|
|
|
|
|
|
|
|
|
|
|
|
|
|
|
|
|
|
|
|
|
|
|
|
|
|
|
|
|
|
land development |
|
$ | 40,034 |
|
|
|
71,429 |
|
|
|
11,184 |
|
|
|
6,692 |
|
|
|
1,721 |
|
|
|
4,004 |
|
|
|
1,337 |
|
|
|
- |
|
|
|
136,401 |
|
Single family |
|
|
|
|
|
|
|
|
|
|
|
|
|
|
|
|
|
|
|
|
|
|
|
|
|
|
|
|
|
|
|
|
|
|
|
|
Pass |
|
$ | 32,333 |
|
|
|
76,326 |
|
|
|
47,490 |
|
|
|
24,813 |
|
|
|
12,984 |
|
|
|
64,847 |
|
|
|
106,962 |
|
|
|
- |
|
|
|
365,755 |
|
Watch |
|
|
- |
|
|
|
- |
|
|
|
- |
|
|
|
- |
|
|
|
89 |
|
|
|
1,389 |
|
|
|
860 |
|
|
|
- |
|
|
|
2,338 |
|
Substandard |
|
|
- |
|
|
|
- |
|
|
|
- |
|
|
|
- |
|
|
|
11 |
|
|
|
4,342 |
|
|
|
379 |
|
|
|
- |
|
|
|
4,732 |
|
Total single family |
|
$ | 32,333 |
|
|
|
76,326 |
|
|
|
47,490 |
|
|
|
24,813 |
|
|
|
13,084 |
|
|
|
70,578 |
|
|
|
108,201 |
|
|
|
- |
|
|
|
372,825 |
|
Commercial |
|
|
|
|
|
|
|
|
|
|
|
|
|
|
|
|
|
|
|
|
|
|
|
|
|
|
|
|
|
|
|
|
|
|
|
|
Pass |
|
$ | 45,755 |
|
|
|
109,255 |
|
|
|
78,645 |
|
|
|
61,973 |
|
|
|
29,579 |
|
|
|
92,753 |
|
|
|
2,158 |
|
|
|
- |
|
|
|
420,118 |
|
Watch |
|
|
232 |
|
|
|
- |
|
|
|
- |
|
|
|
116 |
|
|
|
- |
|
|
|
4,943 |
|
|
|
- |
|
|
|
- |
|
|
|
5,291 |
|
Substandard |
|
|
- |
|
|
|
- |
|
|
|
- |
|
|
|
411 |
|
|
|
- |
|
|
|
- |
|
|
|
- |
|
|
|
- |
|
|
|
411 |
|
Total commercial |
|
$ | 45,987 |
|
|
|
109,255 |
|
|
|
78,645 |
|
|
|
62,500 |
|
|
|
29,579 |
|
|
|
97,696 |
|
|
|
2,158 |
|
|
|
- |
|
|
|
425,820 |
|
Multifamily and farmland |
|
|
|
|
|
|
|
|
|
|
|
|
|
|
|
|
|
|
|
|
|
|
|
|
|
|
|
|
|
|
|
|
|
|
|
|
Pass |
|
$ | 7,987 |
|
|
|
13,286 |
|
|
|
21,512 |
|
|
|
6,624 |
|
|
|
3,158 |
|
|
|
9,851 |
|
|
|
501 |
|
|
|
- |
|
|
|
62,919 |
|
Watch |
|
|
- |
|
|
|
- |
|
|
|
- |
|
|
|
- |
|
|
|
- |
|
|
|
47 |
|
|
|
- |
|
|
|
- |
|
|
|
47 |
|
Substandard |
|
|
- |
|
|
|
- |
|
|
|
- |
|
|
|
- |
|
|
|
- |
|
|
|
76 |
|
|
|
- |
|
|
|
- |
|
|
|
76 |
|
Total multifamily and |
|
|
|
|
|
|
|
|
|
|
|
|
|
|
|
|
|
|
|
|
|
|
|
|
|
|
|
|
|
|
|
|
|
|
|
|
farmland |
|
$ | 7,987 |
|
|
|
13,286 |
|
|
|
21,512 |
|
|
|
6,624 |
|
|
|
3,158 |
|
|
|
9,974 |
|
|
|
501 |
|
|
|
- |
|
|
|
63,042 |
|
Total real estate loans |
|
$ | 126,341 |
|
|
|
270,296 |
|
|
|
158,831 |
|
|
|
100,629 |
|
|
|
47,542 |
|
|
|
182,252 |
|
|
|
112,197 |
|
|
|
- |
|
|
|
998,088 |
|
Loans not secured by real estate |
|
|
|
|
|
|
|
|
|
|
|
|
|
|
|
|
|
|
|
|
|
|
|
|
|
|
|
|
|
|
|
|
|
|
|
|
Commercial |
|
|
|
|
|
|
|
|
|
|
|
|
|
|
|
|
|
|
|
|
|
|
|
|
|
|
|
|
|
|
|
|
|
|
|
|
Pass |
|
$ | 9,561 |
|
|
|
14,122 |
|
|
|
4,841 |
|
|
|
2,942 |
|
|
|
2,232 |
|
|
|
12,030 |
|
|
|
23,411 |
|
|
|
- |
|
|
|
69,139 |
|
Watch |
|
|
- |
|
|
|
- |
|
|
|
- |
|
|
|
- |
|
|
|
57 |
|
|
|
102 |
|
|
|
783 |
|
|
|
- |
|
|
|
942 |
|
Substandard |
|
|
31 |
|
|
|
- |
|
|
|
- |
|
|
|
- |
|
|
|
- |
|
|
|
- |
|
|
|
- |
|
|
|
- |
|
|
|
31 |
|
Loss |
|
|
- |
|
|
|
82 |
|
|
|
- |
|
|
|
- |
|
|
|
- |
|
|
|
- |
|
|
|
350 |
|
|
|
|
|
|
|
432 |
|
Total Commercial |
|
$ | 9,592 |
|
|
|
14,204 |
|
|
|
4,841 |
|
|
|
2,942 |
|
|
|
2,289 |
|
|
|
12,132 |
|
|
|
24,544 |
|
|
|
- |
|
|
|
70,544 |
|
Farm |
|
|
|
|
|
|
|
|
|
|
|
|
|
|
|
|
|
|
|
|
|
|
|
|
|
|
|
|
|
|
|
|
|
|
|
|
Pass |
|
$ | 198 |
|
|
|
42 |
|
|
|
83 |
|
|
|
- |
|
|
|
1 |
|
|
|
27 |
|
|
|
199 |
|
|
|
- |
|
|
|
550 |
|
Watch |
|
|
- |
|
|
|
- |
|
|
|
- |
|
|
|
- |
|
|
|
- |
|
|
|
- |
|
|
|
- |
|
|
|
- |
|
|
|
- |
|
Substandard |
|
|
- |
|
|
|
- |
|
|
|
- |
|
|
|
- |
|
|
|
- |
|
|
|
- |
|
|
|
- |
|
|
|
- |
|
|
|
- |
|
Total farm |
|
$ | 198 |
|
|
|
42 |
|
|
|
83 |
|
|
|
- |
|
|
|
1 |
|
|
|
27 |
|
|
|
199 |
|
|
|
- |
|
|
|
550 |
|
Consumer |
|
|
|
|
|
|
|
|
|
|
|
|
|
|
|
|
|
|
|
|
|
|
|
|
|
|
|
|
|
|
|
|
|
|
|
|
Pass |
|
$ | 2,262 |
|
|
|
1,352 |
|
|
|
404 |
|
|
|
222 |
|
|
|
72 |
|
|
|
58 |
|
|
|
2,591 |
|
|
|
- |
|
|
|
6,961 |
|
Watch |
|
|
- |
|
|
|
- |
|
|
|
- |
|
|
|
- |
|
|
|
- |
|
|
|
- |
|
|
|
- |
|
|
|
- |
|
|
|
- |
|
Substandard |
|
|
- |
|
|
|
- |
|
|
|
2 |
|
|
|
- |
|
|
|
- |
|
|
|
- |
|
|
|
3 |
|
|
|
- |
|
|
|
5 |
|
Total consumer |
|
$ | 2,262 |
|
|
|
1,352 |
|
|
|
406 |
|
|
|
222 |
|
|
|
72 |
|
|
|
58 |
|
|
|
2,594 |
|
|
|
- |
|
|
|
6,966 |
|
All other |
|
|
|
|
|
|
|
|
|
|
|
|
|
|
|
|
|
|
|
|
|
|
|
|
|
|
|
|
|
|
|
|
|
|
|
|
Pass |
|
$ | 79 |
|
|
|
6,401 |
|
|
|
474 |
|
|
|
274 |
|
|
|
599 |
|
|
|
3,698 |
|
|
|
5,256 |
|
|
|
- |
|
|
|
16,781 |
|
Watch |
|
|
- |
|
|
|
- |
|
|
|
- |
|
|
|
- |
|
|
|
- |
|
|
|
74 |
|
|
|
63 |
|
|
|
- |
|
|
|
137 |
|
Substandard |
|
|
- |
|
|
|
- |
|
|
|
- |
|
|
|
- |
|
|
|
- |
|
|
|
- |
|
|
|
- |
|
|
|
- |
|
|
|
- |
|
Total all other |
|
$ | 79 |
|
|
|
6,401 |
|
|
|
474 |
|
|
|
274 |
|
|
|
599 |
|
|
|
3,772 |
|
|
|
5,319 |
|
|
|
- |
|
|
|
16,918 |
|
Total loans not secured |
|
|
|
|
|
|
|
|
|
|
|
|
|
|
|
|
|
|
|
|
|
|
|
|
|
|
|
|
|
|
|
|
|
|
|
|
by real estate |
|
$ | 12,131 |
|
|
|
21,999 |
|
|
|
5,804 |
|
|
|
3,438 |
|
|
|
2,961 |
|
|
|
15,989 |
|
|
|
32,656 |
|
|
|
- |
|
|
|
94,978 |
|
Total loans |
|
$ | 138,472 |
|
|
|
292,295 |
|
|
|
164,635 |
|
|
|
104,067 |
|
|
|
50,503 |
|
|
|
198,241 |
|
|
|
144,853 |
|
|
|
- |
|
|
|
1,093,066 |
|
| A-49 |
The following table presents by credit quality indicator, loan class and year of origination, gross loan charge-offs as of December 31, 2023.
December 31, 2023 |
|
Gross Loan Charge-offs by Origination Year |
|
|
|
|
|
Revolving |
|
|
|
|
||||||||||||||||||||||||
|
|
|
|
|
|
|
|
|
|
|
|
|
|
|
|
|
|
|
|
|
|
|
Loans |
|
|
|
|
|||||||||
(dollars in thousands) |
|
|
|
|
|
|
|
|
|
|
|
|
|
|
|
|
|
|
|
Revolving |
|
|
Converted to |
|
|
Total |
|
|||||||||
|
|
2023 |
|
|
2022 |
|
|
2021 |
|
|
2020 |
|
|
2019 |
|
|
Prior |
|
|
Loans |
|
|
Term Loans |
|
|
Loans |
|
|||||||||
Real estate loans: |
|
|
|
|
|
|
|
|
|
|
|
|
|
|
|
|
|
|
|
|
|
|
|
|
|
|
|
|||||||||
Construction and land development |
|
$ |
- |
|
|
|
- |
|
|
|
- |
|
|
|
- |
|
|
|
- |
|
|
|
- |
|
|
|
- |
|
|
|
- |
|
|
|
- |
|
Single-family residential |
|
|
- |
|
|
|
- |
|
|
|
- |
|
|
|
- |
|
|
|
- |
|
|
|
- |
|
|
|
- |
|
|
|
- |
|
|
|
- |
|
Commercial |
|
|
- |
|
|
|
- |
|
|
|
- |
|
|
|
- |
|
|
|
- |
|
|
|
- |
|
|
|
- |
|
|
|
- |
|
|
|
- |
|
Multifamily and farmland |
|
|
- |
|
|
|
- |
|
|
|
- |
|
|
|
- |
|
|
|
- |
|
|
|
- |
|
|
|
- |
|
|
|
- |
|
|
|
- |
|
Total real estate loans |
|
|
- |
|
|
|
- |
|
|
|
- |
|
|
|
- |
|
|
|
- |
|
|
|
- |
|
|
|
- |
|
|
|
- |
|
|
|
- |
|
Loans not secured by real estate: |
|
|
|
|
|
|
|
|
|
|
|
|
|
|
|
|
|
|
|
|
|
|
|
|
|
|
|
|
|
|
|
|
|
|
|
|
Commercial |
|
|
- |
|
|
|
49 |
|
|
|
51 |
|
|
|
16 |
|
|
|
- |
|
|
|
13 |
|
|
|
- |
|
|
|
- |
|
|
|
129 |
|
Farm |
|
|
- |
|
|
|
- |
|
|
|
- |
|
|
|
- |
|
|
|
- |
|
|
|
- |
|
|
|
- |
|
|
|
- |
|
|
|
- |
|
Consumer |
|
|
- |
|
|
|
41 |
|
|
|
53 |
|
|
|
6 |
|
|
|
1 |
|
|
|
468 |
|
|
|
- |
|
|
|
- |
|
|
|
569 |
|
All other |
|
|
- |
|
|
|
- |
|
|
|
- |
|
|
|
- |
|
|
|
- |
|
|
|
- |
|
|
|
- |
|
|
|
- |
|
|
|
- |
|
|
|
|
|
|
|
|
|
|
|
|
|
|
|
|
|
|
|
|
|
|
|
|
|
|
|
|
|
|
|
|
|
|
|
|
|
|
Total gross charge-offs |
|
$ | - |
|
|
|
90 |
|
|
|
104 |
|
|
|
22 |
|
|
|
1 |
|
|
|
481 |
|
|
|
- |
|
|
|
- |
|
|
|
698 |
|
| A-50 |
(4) Premises and Equipment
Major classifications of premises and equipment at December 31, 2024 and 2023 are summarized as follows:
(Dollars in thousands) |
|
|
|
|
|
|
||
|
|
2024 |
|
|
2023 |
|
||
|
|
|
|
|
|
|
||
Land |
|
$ | 4,365 |
|
|
|
4,373 |
|
Buildings and improvements |
|
|
18,602 |
|
|
|
19,054 |
|
Furniture and equipment |
|
|
21,600 |
|
|
|
20,607 |
|
Construction in process |
|
|
103 |
|
|
|
532 |
|
|
|
|
|
|
|
|
|
|
Total premises and equipment |
|
|
44,670 |
|
|
|
44,566 |
|
|
|
|
|
|
|
|
|
|
Less accumulated depreciation |
|
|
(29,823 | ) |
|
|
(27,864 | ) |
|
|
|
|
|
|
|
|
|
Total net premises and equipment |
|
$ | 14,847 |
|
|
|
16,702 |
|
The Bank recognized depreciation expense totaling $2.1 million, $2.2 million and $2.4 million for the years ended December 31, 2024, 2023 and 2022, respectively.
The Bank had a $362,000 write-off of leasehold improvements for the year ended December 31, 2024 due to the closure of Bank’s branch in Cary, North Carolina in 2024, which is included in other non-interest expense. The Bank had $184,000 net gains on the sale of and write-downs on premises and equipment for the year ended December 31, 2023. The Bank had $85,000 net losses on the sale of and write-downs on premises and equipment for the year ended December 31, 2022.
(5) Leases
The Bank leases various office spaces for banking and operational facilities and equipment under operating lease arrangements.
Total rent expense was approximately $817,000, $804,000 and $976,000 for the years ended December 31, 2024, 2023 and 2022, respectively.
As of December 31, 2024, the Bank had operating right of use assets of $4.0 million and operating lease liabilities of $4.1 million. As of December 31, 2023, the Bank had operating right of use assets of $4.7 million and operating lease liabilities of $4.8 million. The Bank maintains operating leases on land and buildings for some of the Bank’s branch facilities and loan production offices. Most leases include one option to renew, with renewal terms extending up to 15 years. The exercise of renewal options is based on the judgment of management as to whether or not the renewal option is reasonably certain to be exercised. Factors in determining whether an option is reasonably certain of exercise include, but are not limited to, the value of leasehold improvements, the value of renewal rates compared to market rates, and the presence of factors that would cause a significant economic penalty to the Bank if the option is not exercised. Leases with a term of 12 months or less are not recorded on the balance sheet and instead are recognized in lease expense on a straight-line basis over the lease term.
The following table presents lease cost and other lease information as of December 31, 2024 and 2023.
(Dollars in thousands) |
|
|
|
|
|
|
||
|
|
December 31, 2024 |
|
|
December 31, 2023 |
|
||
|
|
|
|
|
|
|
||
Operating lease cost |
|
$ | 840 |
|
|
$ | 815 |
|
|
|
|
|
|
|
|
|
|
Other information: |
|
|
|
|
|
|
|
|
Cash paid for amounts included in the measurement of lease liabilities |
|
|
819 |
|
|
|
787 |
|
Operating cash flows from operating leases |
|
|
- |
|
|
|
- |
|
Right-of-use assets obtained in exchange for new lease liabilities - operating leases |
|
|
- |
|
|
|
370 |
|
Weighted-average remaining lease term - operating leases |
|
|
7.91 |
|
|
|
8.45 |
|
Weighted-average discount rate - operating leases |
|
|
2.80 | % |
|
|
2.73 | % |
| A-51 |
The following table presents lease maturities as of December 31, 2024 and 2023.
(Dollars in thousands) |
|
|
|
|
|
|
|
|
|
Maturity Analysis of Operating Lease Liabilities: |
|
December 31, 2024 |
|
|
|
|
|
|
|
2025 |
|
$ | 773 |
|
2026 |
|
|
650 |
|
2027 |
|
|
612 |
|
2028 |
|
|
510 |
|
2029 |
|
|
422 |
|
Thereafter |
|
|
1,694 |
|
Total |
|
|
4,661 |
|
Less: Imputed Interest |
|
|
(525 | ) |
Operating Lease Liability |
|
$ | 4,136 |
|
(6) Deposits
The composition of deposits at December 31, 2024 and 2023 is as follows:
|
|
December 31, 2024 |
|
|
December 31, 2023 |
|
||||||||||
|
|
|
|
|
Percentage |
|
|
|
|
|
Percentage |
|
||||
|
|
Amount |
|
|
of Total |
|
|
Amount |
|
|
of Total |
|
||||
Noninterest-bearing demand |
|
$ | 402,254 |
|
|
|
27 | % |
|
$ | 432,687 |
|
|
|
31 | % |
Interest-bearing demand, MMDA & savings |
|
|
741,363 |
|
|
|
50 | % |
|
|
620,244 |
|
|
|
44 | % |
Time, $250,000 and over |
|
|
147,439 |
|
|
|
10 | % |
|
|
151,154 |
|
|
|
11 | % |
Other time |
|
|
193,675 |
|
|
|
13 | % |
|
|
187,960 |
|
|
|
14 | % |
Total |
|
$ | 1,484,731 |
|
|
|
100 | % |
|
$ | 1,392,045 |
|
|
|
100 | % |
At December 31, 2024, the scheduled maturities of time deposits are as follows:
|
|
Time Deposits |
|
|
Other |
|
||
(Dollars in thousands) |
|
$250,000 and over |
|
|
Time Deposits |
|
||
|
|
|
|
|
|
|
||
2025 |
|
$ | 142,536 |
|
|
$ | 182,425 |
|
2026 |
|
|
2,105 |
|
|
|
7,837 |
|
2027 |
|
|
1,041 |
|
|
|
3,320 |
|
2028 |
|
|
257 |
|
|
|
868 |
|
2029 |
|
|
- |
|
|
|
725 |
|
Thereafter |
|
|
- |
|
|
|
- |
|
Total |
|
$ | 145,939 |
|
|
$ | 195,175 |
|
The Bank did not have any brokered deposits at December 31, 2024. At December 31, 2023, the Bank had $8.1 million in time deposits purchased through third party brokers.
(7) Federal Home Loan Bank (FHLB) and Federal Reserve Bank Borrowings
The Bank had no borrowings from the FHLB at December 31, 2024 and 2023. FHLB borrowings are collateralized by a blanket assignment on all residential first mortgage loans, home equity lines of credit and loans secured by multi-family real estate that the Bank owns. At December 31, 2024, the carrying value of loans pledged as collateral totaled approximately $232.9 million. The availability under the line of credit with the FHLB was $131.9 million at December 31, 2024.
The Bank is required to purchase and hold certain amounts of FHLB stock in order to obtain FHLB borrowings. No ready market exists for the FHLB stock, and it has no quoted market value. The stock is redeemable at $100 per share subject to certain limitations set by the FHLB. The Bank owned $1.1 million of FHLB stock, included in other investments, at December 31, 2024 and 2023.
As of December 31, 2024 and 2023, the Bank had no borrowings from the Federal Reserve Bank (“FRB”). FRB borrowings are collateralized by a blanket assignment on all qualifying loans that the Bank owns which are not pledged to the FHLB. At December 31, 2024, the carrying value of loans pledged as collateral totaled approximately $637.9 million. Availability under the line of credit with the FRB was $511.9 million at December 31, 2024.
| A-52 |
(8) Junior Subordinated Debentures
In June 2006, the Company formed a second wholly owned Delaware statutory trust, PEBK Capital Trust II (“PEBK Trust II”), which issued $20.0 million of guaranteed preferred beneficial interests in the Company’s junior subordinated deferrable interest debentures. All of the common securities of PEBK Trust II are owned by the Company. The proceeds from the issuance of the common securities and the trust preferred securities were used by PEBK Trust II to purchase $20.6 million of junior subordinated debentures of the Company. The proceeds received by the Company from the sale of the junior subordinated debentures were used to repay in December 2006 the trust preferred securities issued in December 2001 by PEBK Capital Trust, a wholly owned Delaware statutory trust of the Company, and for general purposes. The debentures represent the sole assets of PEBK Trust II. PEBK Trust II is not included in the consolidated financial statements. The Company redeemed $5.0 million of outstanding trust preferred securities in 2019.
Prior to September 15, 2023, the trust preferred securities accrued and paid interest quarterly at a floating rate of three-month LIBOR plus 163 basis points. The three-month USD LIBOR rate ceased to be published after June 30, 2023. Effective September 15, 2023, the trust preferred securities accrue and pay interest quarterly at a floating rate of three-month Secured Overnight Financing Rate (SOFR) plus 189 basis points, including a 26 basis point credit spread adjustment.
These trust preferred securities are mandatorily redeemable upon maturity of the debentures on September 15, 2036. The Company has the right to redeem the debentures purchased by PEBK Trust II, in whole or in part, if the debentures are redeemed prior to maturity, the redemption price will be the principal amount plus any accrued but unpaid interest.
(9) Income Taxes
The provision for income taxes is summarized as follows:
(Dollars in thousands) |
|
|
|
|
|
|
|
|
|
|||
|
|
2024 |
|
|
2023 |
|
|
2022 |
|
|||
Current expense |
|
|
|
|
|
|
|
|
|
|||
Federal |
|
$ | 3,081 |
|
|
|
4,289 |
|
|
|
4,153 |
|
State |
|
|
464 |
|
|
|
541 |
|
|
|
560 |
|
|
|
|
3,545 |
|
|
|
4,830 |
|
|
|
4,713 |
|
Deferred income tax expense (benefit) |
|
|
|
|
|
|
|
|
|
|
|
|
Federal |
|
|
693 |
|
|
|
(404 |
) |
|
|
(482 |
) |
State |
|
|
338 |
|
|
|
(49 |
) |
|
|
(59 |
) |
|
|
|
1,031 |
|
|
|
(453 |
) |
|
|
(541 |
) |
|
|
|
|
|
|
|
|
|
|
|
|
|
Total income tax |
|
$ | 4,576 |
|
|
|
4,377 |
|
|
|
4,172 |
|
The differences between the provision for income taxes and the amount computed by applying the statutory federal income tax rate to earnings before income taxes are as follows:
(Dollars in thousands) |
|
|
|
|
|
|
|
|
|
|||
|
|
2024 |
|
|
2023 |
|
|
2022 |
|
|||
Tax expense at statutory rate |
|
$ | 4,398 |
|
|
|
4,184 |
|
|
|
4,262 |
|
State income tax, net of federal income tax effect |
|
|
635 |
|
|
|
395 |
|
|
|
395 |
|
Interest received related to tax positions |
|
|
(260 | ) |
|
|
- |
|
|
|
- |
|
Tax-exempt interest income |
|
|
(114 | ) |
|
|
(182 | ) |
|
|
(445 | ) |
Increase in cash surrender value of life insurance |
|
|
(164 | ) |
|
|
(91 | ) |
|
|
(71 | ) |
Tax credits |
|
|
(10 | ) |
|
|
(10 | ) |
|
|
(11 | ) |
Nondeductible interest and other expense |
|
|
24 |
|
|
|
30 |
|
|
|
24 |
|
Other |
|
|
67 |
|
|
|
51 |
|
|
|
18 |
|
Total |
|
$ | 4,576 |
|
|
|
4,377 |
|
|
|
4,172 |
|
| A-53 |
The following summarizes the tax effects of temporary differences that give rise to significant portions of the deferred tax assets and deferred tax liabilities. The net deferred tax asset is included as a component of other assets at December 31, 2024 and 2023.
(Dollars in thousands) |
|
|
|
|
|
|
||
|
|
2024 |
|
|
2023 |
|
||
Deferred tax assets: |
|
|
|
|
|
|
||
Allowance for credit losses |
|
$ | 2,485 |
|
|
|
2,944 |
|
Accrued retirement expense |
|
|
1,215 |
|
|
|
1,210 |
|
Restricted stock |
|
|
238 |
|
|
|
249 |
|
Interest income on nonaccrual loans |
|
|
4 |
|
|
|
5 |
|
Lease liability |
|
|
926 |
|
|
|
1,110 |
|
Unrealized loss on available for sale securities |
|
|
11,412 |
|
|
|
11,741 |
|
Total gross deferred tax assets |
|
|
16,280 |
|
|
|
17,259 |
|
|
|
|
|
|
|
|
|
|
Deferred tax liabilities: |
|
|
|
|
|
|
|
|
Deferred loan fees |
|
|
160 |
|
|
|
186 |
|
Accumulated depreciation |
|
|
375 |
|
|
|
375 |
|
Prepaid expenses |
|
|
296 |
|
|
|
3 |
|
ROU Asset |
|
|
899 |
|
|
|
1,087 |
|
Partnership income |
|
|
250 |
|
|
|
112 |
|
Other |
|
|
9 |
|
|
|
12 |
|
Total gross deferred tax liabilities |
|
|
1,989 |
|
|
|
1,775 |
|
|
|
|
|
|
|
|
|
|
Net deferred tax asset |
|
$ | 14,291 |
|
|
|
15,484 |
|
The Company has analyzed the tax positions taken or expected to be taken in its tax returns and has concluded that it has no liability related to uncertain tax positions.
As of December 31, 2024, the Company’s Federal income tax filings for years 2021 through 2023 are open to examination by the Internal Revenue Service. The Company’s North Carolina income tax returns for years 2021 through 2023 are open to examination by the North Carolina Department of Revenue.
(10) Related Party Transactions
The Company conducts transactions with its directors and executive officers, including companies in which they have beneficial interests, in the normal course of business. In accordance with Regulation O of the Federal Reserve, it is the policy of the Bank that loan transactions with directors and officers are made on substantially the same terms as those prevailing at the time made for comparable loans to other persons. The following is a summary of activity for related party loans for 2024 and 2023:
(Dollars in thousands) |
|
|
|
|
||||
|
|
2024 |
|
|
2023 |
|
||
Beginning balance |
|
$ | 3,569 |
|
|
|
3,381 |
|
Disbursements |
|
|
6,095 |
|
|
|
1,976 |
|
Repayments |
|
|
(4,793 | ) |
|
|
(1,788 | ) |
Ending balance |
|
$ | 4,871 |
|
|
|
3,569 |
|
At December 31, 2024 and 2023, the Company had deposit relationships with related parties of approximately $65.5 million and $52.5 million, respectively.
(11) Commitments and Contingencies
The Bank is party to financial instruments with off-balance-sheet risk in the normal course of business to meet the financing needs of its customers. These financial instruments include commitments to extend credit and standby letters of credit. Those instruments involve, to varying degrees, elements of credit risk in excess of the amount recognized in the balance sheet. The contract amounts of those instruments reflect the extent of involvement the Bank has in particular classes of financial instruments.
The exposure to credit loss in the event of nonperformance by the other party to the financial instrument for commitments to extend credit and standby letters of credit is represented by the contractual amount of those instruments. The Bank uses the same credit policies in making commitments to extend credit and standby letters of credit as it does for on-balance-sheet instruments.
| A-54 |
In most cases, the Bank requires collateral or other security to support financial instruments with credit risk.
(Dollars in thousands) |
|
|
|
|
|
|
||
|
|
Contractual Amount |
|
|||||
|
|
2024 |
|
|
2023 |
|
||
Financial instruments whose contract amount represent credit risk: |
|
|
|
|
|
|
||
|
|
|
|
|
|
|
||
Commitments to extend credit |
|
$ | 348,876 |
|
|
$ | 367,482 |
|
|
|
|
|
|
|
|
|
|
Standby letters of credit |
|
$ | 1,675 |
|
|
$ | 3,721 |
|
Commitments to extend credit are conditional agreements to lend to a customer. Commitments generally have fixed expiration dates and because they may expire without being drawn upon, the total commitment amount of $350.6 million does not necessarily represent future cash requirements.
Standby letters of credit are conditional commitments issued by the Bank to pay a third party on behalf of a customer. Those letters of credit are primarily issued to businesses in the Bank’s delineated market area. The credit risk involved in issuing letters of credit is essentially the same as that involved in extending loan facilities to customers. The Bank holds real estate, equipment, automobiles and customer deposits as collateral supporting those commitments for which collateral is deemed necessary.
The Company maintains an allowance for off-balance sheet credit exposures such as unfunded balances for existing lines of credit, commitments to extend future credit, when this extension of credit is not unconditionally cancelable. The allowance for off-balance sheet credit exposures is adjusted as a provision for credit loss expense. The estimate includes consideration of the likelihood that funding will occur, which is based on a historical funding activity and an estimate of expected credit losses on commitments expected to be funded over its estimated life, which are the same loss rates that are used in computing the allowance for credit losses on loans. The allowance for credit losses for unfunded loan commitments of $1.1 million and $1.8 million at December 31, 2024 and 2023, respectively, is separately classified on the balance sheet within Other Liabilities.
The following table presents the balance and activity in the allowance for credit losses for unfunded loan commitments for the years ended December 31, 2024 and 2023.
(dollars in thousands) |
|
For twelve months ended |
|
|||||
|
|
December 31, 2024 |
|
|
December 31, 2023 |
|
||
|
|
|
|
|
|
|
||
Beginning Balance |
|
$ | 1,770 |
|
|
$ | - |
|
Cummulative effect of change in accounting principle |
|
|
- |
|
|
|
2,278 |
|
Recovery of credit losses |
|
|
(669 | ) |
|
|
(508 | ) |
Ending balance |
|
$ | 1,101 |
|
|
$ | 1,770 |
|
(12) Employee and Director Benefit Programs
The Bank has a profit sharing and 401(k) plan for the benefit of substantially all employees subject to certain minimum age and service requirements. Under the 401(k) plan, the Bank matched employee contributions to a maximum of 4.00% of annual compensation in 2022, 2023 and 2024. The Company’s contribution pursuant to this formula was approximately $783,000, $759,000 and $719,000 for the years ended December 31, 2024, 2023 and 2022, respectively. Investments made available under the 401(k) plan are determined by a committee comprised of senior management. No investments in Company stock are available under the 401(k) plan. Contributions to the 401(k) plan are vested immediately.
In December 2001, the Company initiated a retirement benefit plan to provide retirement benefits to key officers and its Board of Directors and to provide death benefits for their designated beneficiaries. Under the postretirement benefit plan, the Company purchased life insurance policies on the lives of the key officers and each director. The increase in cash surrender value of the policies constitutes the Company’s contribution to the postretirement benefit plan each year. Postretirement benefit plan participants are to be paid annual benefits for a specified number of years commencing upon retirement. Expenses incurred for benefits relating to the postretirement benefit plan were approximately $617,000, $430,000 and $369,000 for the years ended December 31, 2024, 2023 and 2022, respectively.
| A-55 |
The following table sets forth the change in the accumulated benefit obligation for the Company’s postretirement benefit plans described above:
(Dollars in thousands) |
|
|
|
|
|
|
||
|
|
2024 |
|
|
2023 |
|
||
|
|
|
|
|
|
|
||
Benefit obligation at beginning of period |
|
$ | 5,268 |
|
|
|
5,110 |
|
Service cost |
|
|
521 |
|
|
|
363 |
|
Interest cost |
|
|
101 |
|
|
|
70 |
|
Benefits paid |
|
|
(464 | ) |
|
|
(275 | ) |
|
|
|
|
|
|
|
|
|
Benefit obligation at end of period |
|
$ | 5,426 |
|
|
|
5,268 |
|
The amounts recognized in the Company’s Consolidated Balance Sheet as of December 31, 2024 and 2023 are shown in the following two tables:
(Dollars in thousands) |
|
|
|
|
|
|
||
|
|
2024 |
|
|
2023 |
|
||
|
|
|
|
|
|
|
||
Benefit obligation |
|
$ | 5,426 |
|
|
|
5,268 |
|
Fair value of plan assets |
|
|
- |
|
|
|
- |
|
(Dollars in thousands) |
|
|
|
|
||||
|
|
2024 |
|
|
2023 |
|
||
|
|
|
|
|
|
|
||
Funded status |
|
$ | (5,426 | ) |
|
|
(5,268 | ) |
Unrecognized prior service cost/benefit |
|
|
- |
|
|
|
- |
|
Unrecognized net actuarial loss |
|
|
- |
|
|
|
- |
|
|
|
|
|
|
|
|
|
|
Net amount recognized |
|
$ | (5,426 | ) |
|
|
(5,268 | ) |
|
|
|
|
|
|
|
|
|
Unfunded accrued liability |
|
$ | (5,426 | ) |
|
|
(5,268 | ) |
Intangible assets |
|
|
- |
|
|
|
- |
|
|
|
|
|
|
|
|
|
|
Net amount recognized |
|
$ | (5,426 | ) |
|
|
(5,268 | ) |
Net periodic benefit cost of the Company’s postretirement benefit plans for the years ended December 31, 2024, 2023 and 2022 consisted of the following:
(Dollars in thousands) |
|
|
|
|
|
|
||||||
|
|
2024 |
|
|
2023 |
|
|
2022 |
|
|||
|
|
|
|
|
|
|
|
|
|
|||
Service cost |
|
$ | 521 |
|
|
|
363 |
|
|
|
325 |
|
Interest cost |
|
|
101 |
|
|
|
70 |
|
|
|
63 |
|
|
|
|
|
|
|
|
|
|
|
|
|
|
Net periodic cost |
|
$ | 622 |
|
|
|
433 |
|
|
|
388 |
|
|
|
|
|
|
|
|
|
|
|
|
|
|
Weighted average discount rate assumption used to determine benefit obligation |
|
|
5.50 | % |
|
|
5.50 | % |
|
|
5.50 | % |
| A-56 |
The Company paid postretirement plan benefits totaling $465,000, $275,000 and $289,000 during the years ended December 31, 2024, 2023 and 2022, respectively. Information about the expected benefit payments for the Company’s postretirement benefit plan is as follows:
(Dollars in thousands) |
|
|
|
|
|
|
|
|
|
Year ending December 31, |
|
|
|
|
2025 |
|
$ | 361 |
|
2026 |
|
|
455 |
|
2027 |
|
|
483 |
|
2028 |
|
|
491 |
|
2029 |
|
|
530 |
|
Thereafter |
|
|
8,666 |
|
(13) Regulatory Matters
The Company and the Bank are subject to regulatory capital requirements administered by the federal banking agencies. Failure to meet minimum capital requirements can initiate certain mandatory and possibly additional discretionary actions by regulators that, if undertaken, could have a direct material effect on the Company’s financial statements. Under capital adequacy guidelines and the regulatory framework for prompt corrective action, the Bank must meet specific capital guidelines that involve quantitative measures of the assets, liabilities and certain off-balance-sheet items as calculated under regulatory accounting practices. The capital amounts and classification are also subject to qualitative judgments by the regulators about components, risk weightings, and other factors.
Quantitative measures established by regulation to ensure capital adequacy require the Company and the Bank to maintain minimum capital ratios in relation to both on- and off-balance sheet items at various risk weights. Total capital consists of two tiers of capital. Tier 1 capital includes common shareholders’ equity and trust preferred securities less adjustments for intangible assets. Tier 2 capital consists of the allowance for credit losses, up to 1.25% of risk-weighted assets and other adjustments. Management believes, as of December 31, 2024, that the Company and the Bank meet all capital adequacy requirements to which they are subject.
As of December 31, 2024, the most recent notification from the FDIC categorized the Bank as well capitalized under the regulatory framework for prompt corrective action. To be categorized as well capitalized the Bank must maintain minimum total risk-based, Tier 1 risk-based and Tier 1 leverage ratios as set forth in the table below. There have been no conditions or events since that notification that management believes have changed the Bank’s category.
In 2013, the Federal Reserve approved its final rule on the Basel III capital standards, which implement changes to the regulatory capital framework for banking organizations. The Basel III capital standards, which became effective January 1, 2015, include new risk-based capital and leverage ratios, which were phased in from 2015 to 2019. The new minimum capital level requirements applicable to the Company and the Bank under the final rules are as follows: (i) a new common equity Tier 1 capital ratio of 4.5%; (ii) a Tier 1 capital ratio of 6% (increased from 4%); (iii) a total risk based capital ratio of 8% (unchanged from previous rules); and (iv) a Tier 1 leverage ratio of 4% (unchanged from previous rules). An additional capital conservation buffer was added to the minimum requirements for capital adequacy purposes beginning on January 1, 2016 and was phased in through 2019. This resulted in the following minimum ratios beginning in 2019: (i) a common equity Tier 1 capital ratio of 7.0%, (ii) a Tier 1 capital ratio of 8.5%, and (iii) a total capital ratio of 10.5%. Under the final rules, institutions would be subject to limitations on paying dividends, engaging in share repurchases, and paying discretionary bonuses if its capital level falls below the buffer amount. These limitations establish a maximum percentage of eligible retained earnings that could be utilized for such actions.
| A-57 |
The Company’s and the Bank’s actual capital amounts and ratios are presented below:
(Dollars in thousands) |
|
|
|
|
|
|
|
|
|
|
|
|
|
|
|
|
|
|
||||||
|
|
Actual |
|
|
Minimum Regulatory Capital Ratio |
|
|
Minimum Ratio plus Capital Conservation Buffer |
|
|||||||||||||||
|
|
Amount |
|
|
Ratio |
|
|
Amount |
|
|
Ratio |
|
|
Amount |
|
|
Ratio |
|
||||||
|
|
|
|
|
|
|
|
|
|
|
|
|
|
|
|
|
|
|
||||||
As of December 31, 2024: |
|
|
|
|
|
|
|
|
|
|
|
|
|
|
|
|
|
|
||||||
|
|
|
|
|
|
|
|
|
|
|
|
|
|
|
|
|
|
|
||||||
Total Capital (to Risk-Weighted Assets) |
|
|
|
|
|
|
|
|
|
|
|
|
|
|
|
|
|
|
||||||
Consolidated |
|
$ | 195,816 |
|
|
|
15.34 | % |
|
|
102,127 |
|
|
|
8.00 | % |
|
|
N/A |
|
|
|
N/A |
|
Bank |
|
|
194,314 |
|
|
|
15.22 | % |
|
|
102,116 |
|
|
|
8.00 | % |
|
|
134,027 |
|
|
|
10.50 | % |
Tier 1 Capital (to Risk-Weighted Assets) |
|
|
|
|
|
|
|
|
|
|
|
|
|
|
|
|
|
|
|
|
|
|
|
|
Consolidated |
|
|
184,720 |
|
|
|
14.47 | % |
|
|
76,595 |
|
|
|
6.00 | % |
|
|
N/A |
|
|
|
N/A |
|
Bank |
|
|
183,218 |
|
|
|
14.35 | % |
|
|
76,587 |
|
|
|
6.00 | % |
|
|
108,498 |
|
|
|
8.50 | % |
Tier 1 Capital (to Average Assets) |
|
|
|
|
|
|
|
|
|
|
|
|
|
|
|
|
|
|
|
|
|
|
|
|
Consolidated |
|
|
184,720 |
|
|
|
10.88 | % |
|
|
67,896 |
|
|
|
4.00 | % |
|
|
N/A |
|
|
|
N/A |
|
Bank |
|
|
183,218 |
|
|
|
10.71 | % |
|
|
68,441 |
|
|
|
4.00 | % |
|
|
68,441 |
|
|
|
4.00 | % |
Common Equity Tier 1 (to Risk-Weighted Assets) |
|
|
|
|
|
|
|
|
|
|
|
|
|
|
|
|
|
|
|
|
|
|||
Consolidated |
|
|
169,720 |
|
|
|
13.29 | % |
|
|
57,446 |
|
|
|
4.50 | % |
|
|
N/A |
|
|
|
N/A |
|
Bank |
|
|
183,218 |
|
|
|
14.35 | % |
|
|
57,440 |
|
|
|
4.50 | % |
|
|
89,351 |
|
|
|
7.00 | % |
(Dollars in thousands) |
|
|
|
|
|
|
|
|
|
|
|
|
|
|
|
|
|
|
||||||
|
|
Actual |
|
|
Minimum Regulatory Capital Ratio |
|
|
Minimum Ratio plus Capital Conservation Buffer |
|
|||||||||||||||
|
|
Amount |
|
|
Ratio |
|
|
Amount |
|
|
Ratio |
|
|
Amount |
|
|
Ratio |
|
||||||
|
|
|
|
|
|
|
|
|
|
|
|
|
|
|
|
|
|
|
||||||
As of December 31, 2023: |
|
|
|
|
|
|
|
|
|
|
|
|
|
|
|
|
|
|
||||||
|
|
|
|
|
|
|
|
|
|
|
|
|
|
|
|
|
|
|
||||||
Total Capital (to Risk-Weighted Assets) |
|
|
|
|
|
|
|
|
|
|
|
|
|
|
|
|
|
|
||||||
Consolidated |
|
$ | 188,192 |
|
|
|
14.96 | % |
|
|
100,636 |
|
|
|
8.00 | % |
|
|
N/A |
|
|
|
N/A |
|
Bank |
|
|
186,774 |
|
|
|
14.85 | % |
|
|
100,636 |
|
|
|
8.00 | % |
|
|
132,085 |
|
|
|
10.50 | % |
Tier 1 Capital (to Risk-Weighted Assets) |
|
|
|
|
|
|
|
|
|
|
|
|
|
|
|
|
|
|
|
|
|
|
|
|
Consolidated |
|
|
175,381 |
|
|
|
13.94 | % |
|
|
75,477 |
|
|
|
6.00 | % |
|
|
N/A |
|
|
|
N/A |
|
Bank |
|
|
173,963 |
|
|
|
13.83 | % |
|
|
75,477 |
|
|
|
6.00 | % |
|
|
106,926 |
|
|
|
8.50 | % |
Tier 1 Capital (to Average Assets) |
|
|
|
|
|
|
|
|
|
|
|
|
|
|
|
|
|
|
|
|
|
|
|
|
Consolidated |
|
|
175,381 |
|
|
|
10.51 | % |
|
|
66,757 |
|
|
|
4.00 | % |
|
|
N/A |
|
|
|
N/A |
|
Bank |
|
|
173,963 |
|
|
|
10.35 | % |
|
|
67,254 |
|
|
|
4.00 | % |
|
|
67,254 |
|
|
|
4.00 | % |
Common Equity Tier 1 (to Risk-Weighted Assets) |
|
|
|
|
|
|
|
|
|
|
|
|
|
|
|
|
|
|
|
|
|
|||
Consolidated |
|
|
160,381 |
|
|
|
12.75 | % |
|
|
56,608 |
|
|
|
4.50 | % |
|
|
N/A |
|
|
|
N/A |
|
Bank |
|
|
173,963 |
|
|
|
13.83 | % |
|
|
56,608 |
|
|
|
4.50 | % |
|
|
88,057 |
|
|
|
7.00 | % |
(14) Other Operating Income and Expense
Miscellaneous non-interest income for the years ended December 31, 2024, 2023 and 2022 included the following items:
(Dollars in thousands) |
|
|
|
|
|
|
|
|
|
|||
|
|
2024 |
|
|
2023 |
|
|
2022 |
|
|||
Visa debit card income |
|
$ | 4,417 |
|
|
|
4,717 |
|
|
|
4,901 |
|
Bank owned life insurance income |
|
|
783 |
|
|
|
432 |
|
|
|
458 |
|
Income on SBIC Investments |
|
|
1,186 |
|
|
|
886 |
|
|
|
1,159 |
|
Income on mutual funds held in deferred compensation trust |
|
|
555 |
|
|
|
844 |
|
|
|
183 |
|
Other |
|
|
1,394 |
|
|
|
1,324 |
|
|
|
1,048 |
|
|
|
$ | 8,335 |
|
|
|
8,203 |
|
|
|
7,749 |
|
| A-58 |
Other non-interest expense for the years ended December 31, 2024, 2023 and 2022 included the following items:
(Dollars in thousands) |
|
|
|
|
|
|
|
|
|
|||
|
|
2024 |
|
|
2023 |
|
|
2022 |
|
|||
ATM expense |
|
$ | 588 |
|
|
|
565 |
|
|
|
629 |
|
Data processing |
|
|
708 |
|
|
|
758 |
|
|
|
777 |
|
Deposit program expense |
|
|
306 |
|
|
|
362 |
|
|
|
348 |
|
Dues and subscriptions |
|
|
740 |
|
|
|
698 |
|
|
|
628 |
|
Internet banking expense |
|
|
1,067 |
|
|
|
996 |
|
|
|
949 |
|
Office supplies |
|
|
534 |
|
|
|
482 |
|
|
|
532 |
|
Telephone |
|
|
595 |
|
|
|
664 |
|
|
|
691 |
|
Deferred comp expense |
|
|
555 |
|
|
|
844 |
|
|
|
183 |
|
Other |
|
|
4,637 |
|
|
|
4,148 |
|
|
|
3,558 |
|
|
|
$ | 9,730 |
|
|
|
9,517 |
|
|
|
8,295 |
|
(15) Fair Value of Financial Instruments
The Company is required to disclose fair value information about financial instruments, whether or not recognized at fair value on the face of the balance sheet, for which it is practicable to estimate that value. The assumptions used in the estimation of the fair value of the Company’s financial instruments are detailed below. Where quoted prices are not available, fair values are based on estimates using discounted cash flows and other valuation techniques. The use of discounted cash flows can be significantly affected by the assumptions used, including the discount rate and estimates of future cash flows. The following disclosures should not be considered a surrogate of the liquidation value of the Company, but rather a good faith estimate of the increase or decrease in the value of financial instruments held by the Company since purchase, origination, or issuance.
The Company groups assets and liabilities at fair value in three levels, based on the markets in which the assets and liabilities are traded and the reliability of the assumptions used to determine fair value. These levels are:
|
· |
Level 1 – Valuation is based upon quoted prices for identical instruments traded in active markets. |
|
· |
Level 2 – Valuation is based upon quoted prices for similar instruments in active markets, quoted prices for identical or similar instruments in markets that are not active, and model-based valuation techniques for which all significant assumptions are observable in the market. |
|
· |
Level 3 – Valuation is generated from model-based techniques that use at least one significant assumption not observable in the market. These unobservable assumptions reflect estimates of assumptions that market participants would use in pricing the asset or liability. Valuation techniques include use of option pricing models, discounted cash flow models and similar techniques. |
Investment Securities Available for Sale
Fair values of investment securities available for sale are determined by obtaining quoted prices on nationally recognized securities exchanges when available. If quoted prices are not available, fair value is determined using matrix pricing, which is a mathematical technique used widely in the industry to value debt securities without relying exclusively on quoted prices for the specific securities but rather by relying on the securities’ relationship to other benchmark quoted securities. Fair values for investment securities with quoted market prices are reported in the Level 1 fair value category. Fair value measurements obtained from independent pricing services are reported in the Level 2 fair value category. All other fair value measurements are reported in the Level 3 fair value category.
Mortgage Loans Held for Sale
Mortgage loans held for sale are carried at lower of aggregate cost or market value. The cost of mortgage loans held for sale approximates the market value. Mortgage loans held for sale are reported in the Level 2 fair value category. Management determined that the valuation technique used at current period end and prior period end are more appropriately classified as Level 2 and has updated in the current period and prior period year end classifications to Level 2.
Loans
The fair value of loans, excluding previously presented individually evaluated loans measured at fair value on a non-recurring basis, is estimated using discounted cash flow analyses. The discount rates used to determine fair value use interest rate spreads that reflect factors such as liquidity, credit, and nonperformance risk of the loans. Loans are reported in the Level 3 fair value category, as the pricing of loans is more subjective than the pricing of other financial instruments.
| A-59 |
Mutual Funds
Mutual funds held in the deferred compensation trust are carried at fair value. Mutual funds held in the deferred compensation trust are included in other assets on the balance sheet and reported in the Level 1 fair value category.
FHLB Borrowings
The fair value of FHLB borrowings is estimated based upon discounted future cash flows using a discount rate comparable to the current market rate for such borrowings. FHLB borrowings are reported in the Level 2 fair value category. Management determined that the valuation technique used at current period end and prior period end are more appropriately classified as Level 2 and has updated in the current period and prior period year end classifications to Level 2.
Commitments to Extend Credit and Standby Letters of Credit
Commitments to extend credit and standby letters of credit are generally short-term in duration and made at variable interest rates. Therefore, both the carrying value and estimated fair value associated with these instruments are immaterial.
Limitations
Fair value estimates are made at a specific point in time, based on relevant market information and information about the financial instrument. These estimates do not reflect any premium or discount that could result from offering for sale at one time the Company’s entire holdings of a particular financial instrument. Because no market exists for a significant portion of the Company’s financial instruments, fair value estimates are based on many judgments. These estimates are subjective in nature and involve uncertainties and matters of significant judgment and therefore cannot be determined with precision. Changes in assumptions could significantly affect the estimates.
Fair value estimates are based on existing on and off-balance sheet financial instruments without attempting to estimate the value of anticipated future business and the value of assets and liabilities that are not considered financial instruments. Significant assets and liabilities that are not considered financial instruments include deferred income taxes and premises and equipment. In addition, the tax ramifications related to the realization of unrealized gains and losses can have a significant effect on fair value estimates and have not been considered in the estimates.
The tables below present all financial instruments measured at fair value on a recurring basis by level within the fair value hierarchy, as of December 31, 2024 and December 31, 2023.
(Dollars in thousands) |
|
|
|
|
|
|
|
|
|
|
|
|
||||
|
|
December 31, 2024 |
|
|||||||||||||
|
|
Fair Value Measurements |
|
|
Level 1 Valuation |
|
|
Level 2 Valuation |
|
|
Level 3 Valuation |
|
||||
U.S. Treasuries |
|
$ | 7,257 |
|
|
|
- |
|
|
|
7,257 |
|
|
|
- |
|
U.S. Government sponsored enterprises |
|
|
8,732 |
|
|
|
- |
|
|
|
8,732 |
|
|
|
- |
|
GSE - Mortgage-backed securities |
|
|
225,792 |
|
|
|
- |
|
|
|
225,792 |
|
|
|
- |
|
Private label mortgage-backed securities |
|
|
41,767 |
|
|
|
- |
|
|
|
41,767 |
|
|
|
- |
|
State and political subdivisions |
|
|
104,455 |
|
|
|
- |
|
|
|
104,455 |
|
|
|
- |
|
(Dollars in thousands) |
|
|
|
|
|
|
|
|
|
|
|
|
||||
|
|
December 31, 2023 |
|
|||||||||||||
|
|
Fair Value Measurements |
|
|
Level 1 Valuation |
|
|
Level 2 Valuation |
|
|
Level 3 Valuation |
|
||||
U.S. Treasuries |
|
$ | 10,144 |
|
|
|
- |
|
|
|
10,144 |
|
|
|
- |
|
U.S. Government sponsored enterprises |
|
|
10,515 |
|
|
|
- |
|
|
|
10,515 |
|
|
|
- |
|
GSE - Mortgage-backed securities |
|
|
234,902 |
|
|
|
- |
|
|
|
234,902 |
|
|
|
- |
|
Private label mortgage-backed securities |
|
|
31,270 |
|
|
|
- |
|
|
|
31,270 |
|
|
|
- |
|
State and political subdivisions |
|
|
105,093 |
|
|
|
- |
|
|
|
105,093 |
|
|
|
- |
|
The fair value measurements for individually evaluated loans on a non-recurring basis at December 31, 2024 and December 31, 2023 are presented below. The fair value measurement process uses certified appraisals and other market-based information; however, in many cases, it also requires significant input based on management’s knowledge of, and judgment about, current market conditions, specific issues relating to the collateral and other matters. As a result, all fair value measurements for individually evaluated loans and other real estate are considered Level 3.
| A-60 |
(Dollars in thousands) |
|
|
|
|
|
|
|||||||||
|
|
Fair Value December 31, 2024 |
|
|
Fair Value December 31, 2023 |
|
|
Valuation Technique |
|
Significant Unobservable Inputs |
|
General Range of Significant Unobservable Input Values |
|||
Individually evaluated loans |
|
$ | 1,646 |
|
|
$ | - |
|
|
Appraised value |
|
Discounts to reflect current market conditions and ultimate collectability |
|
0 - 50% |
|
Other real estate |
|
$ | 369 |
|
|
|
- |
|
|
Appraised value |
|
Discounts to reflect current market conditions and estimated costs to sell |
|
0 - 25% |
|
The carrying amount and estimated fair value of financial instruments at December 31, 2024 and December 31, 2023 are as follows:
(Dollars in thousands) |
|
|
|
|
|
|
|
|
|
|
|
|
|
|
|
|||||
|
|
Carrying |
|
|
Fair Value Measurements at December 31, 2024 |
|
||||||||||||||
|
|
Amount |
|
|
Level 1 |
|
|
Level 2 |
|
|
Level 3 |
|
|
Total |
|
|||||
Assets: |
|
|
|
|
|
|
|
|
|
|
|
|
|
|
|
|||||
Cash and cash equivalents |
|
$ | 59,266 |
|
|
|
59,266 |
|
|
|
- |
|
|
|
- |
|
|
|
59,266 |
|
Investment securities available for sale |
|
|
388,003 |
|
|
|
- |
|
|
|
388,003 |
|
|
|
- |
|
|
|
388,003 |
|
Other investments |
|
|
2,728 |
|
|
|
- |
|
|
|
- |
|
|
|
2,728 |
|
|
|
2,728 |
|
Mortgage loans held for sale |
|
|
1,367 |
|
|
|
- |
|
|
|
1,367 |
|
|
|
- |
|
|
|
1,367 |
|
Loans, net |
|
|
1,128,409 |
|
|
|
- |
|
|
|
- |
|
|
|
1,123,864 |
|
|
|
1,123,864 |
|
Mutual funds held in deferred compensation trust |
|
|
2,726 |
|
|
|
2,726 |
|
|
|
- |
|
|
|
- |
|
|
|
2,726 |
|
|
|
|
|
|
|
|
|
|
|
|
|
|
|
|
|
|
|
|
|
|
Liabilities: |
|
|
|
|
|
|
|
|
|
|
|
|
|
|
|
|
|
|
|
|
Deposits |
|
$ | 1,484,731 |
|
|
|
- |
|
|
|
1,487,475 |
|
|
|
- |
|
|
|
1,487,475 |
|
Junior subordinated debentures |
|
|
15,464 |
|
|
|
- |
|
|
|
15,464 |
|
|
|
- |
|
|
|
15,464 |
|
(Dollars in thousands) |
|
|
|
|
|
|
|
|
|
|
|
|
|
|
|
|||||
|
|
Carrying |
|
|
Fair Value Measurements at December 31, 2023 |
|
||||||||||||||
|
|
Amount |
|
|
Level 1 |
|
|
Level 2 |
|
|
Level 3 |
|
|
Total |
|
|||||
Assets: |
|
|
|
|
|
|
|
|
|
|
|
|
|
|
|
|||||
Cash and cash equivalents |
|
$ | 82,375 |
|
|
|
82,375 |
|
|
|
- |
|
|
|
- |
|
|
|
82,375 |
|
Investment securities available for sale |
|
|
391,924 |
|
|
|
- |
|
|
|
391,924 |
|
|
|
- |
|
|
|
391,924 |
|
Other investments |
|
|
2,874 |
|
|
|
- |
|
|
|
- |
|
|
|
2,874 |
|
|
|
2,874 |
|
Mortgage loans held for sale |
|
|
686 |
|
|
|
- |
|
|
|
686 |
|
|
|
- |
|
|
|
686 |
|
Loans, net |
|
|
1,082,025 |
|
|
|
- |
|
|
|
- |
|
|
|
1,071,178 |
|
|
|
1,071,178 |
|
Mutual funds held in deferred compensation trust |
|
|
2,171 |
|
|
|
2,171 |
|
|
|
- |
|
|
|
- |
|
|
|
2,171 |
|
|
|
|
|
|
|
|
|
|
|
|
|
|
|
|
|
|
|
|
|
|
Liabilities: |
|
|
|
|
|
|
|
|
|
|
|
|
|
|
|
|
|
|
|
|
Deposits |
|
$ | 1,392,045 |
|
|
|
- |
|
|
|
1,397,351 |
|
|
|
- |
|
|
|
1,397,351 |
|
Securities sold under agreements to repurchase |
|
|
86,715 |
|
|
|
- |
|
|
|
86,715 |
|
|
|
- |
|
|
|
86,715 |
|
Junior subordinated debentures |
|
|
15,464 |
|
|
|
- |
|
|
|
15,464 |
|
|
|
- |
|
|
|
15,464 |
|
(16) Reportable Segments
The Company has two reportable segments as described below and in Note 1:
Banking Operations – This segment reflects the consolidated Bank, excluding CBRES. The primary source of revenue for this segment is net interest income.
CBRES – A Bank subsidiary that provides appraisal management services to community banks. The primary source of revenue for this segment is appraisal management fee income.
The Bank’s executive management team, which is comprised of the Bank’s Chief Executive Officer, Chief Financial Officer and executive vice presidents, is the chief operating decision maker for the Company. The Bank’s executive management team reviews actual net income versus budgeted net income on a quarterly basis to assess segment performance.
| A-61 |
The following table presents financial information for the reportable segments. Financial results by operating segment, including significant expense categories provided to the chief operating decision maker, are detailed below. Certain prior period amounts have been reclassified to conform to the current presentation. The information provided under the caption “Other” represents the parent company, which is not considered to be a reportable segment, is included to reconcile the results of the operating segments to the consolidated financial statements prepared in conformity with GAAP.
(Dollars in thousands) |
|
|
|
|
|
|
|
|
|
|
|
|
||||
|
|
Banking |
|
|
|
|
|
|
|
|
|
|
||||
|
|
Operations |
|
|
CBRES |
|
|
Other |
|
|
Consolidated |
|
||||
As of and for the year ended December 31, 2024 |
|
|
|
|
|
|
|
|
|
|
|
|
||||
Interest income |
|
$ | 80,699 |
|
|
|
- |
|
|
|
34 |
|
|
|
80,733 |
|
Interest expense |
|
|
25,538 |
|
|
|
- |
|
|
|
1,116 |
|
|
|
26,654 |
|
Net interest income |
|
|
55,161 |
|
|
|
- |
|
|
|
(1,082 | ) |
|
|
54,079 |
|
Provision for credit losses |
|
|
(285 | ) |
|
|
- |
|
|
|
- |
|
|
|
(285 | ) |
Noninterest income |
|
|
16,024 |
|
|
|
- |
|
|
|
- |
|
|
|
16,024 |
|
Appraisal management fee income |
|
|
- |
|
|
|
11,691 |
|
|
|
- |
|
|
|
11,691 |
|
Salaries and employee benefits |
|
|
27,037 |
|
|
|
766 |
|
|
|
406 |
|
|
|
28,209 |
|
Occupancy |
|
|
8,683 |
|
|
|
3 |
|
|
|
- |
|
|
|
8,686 |
|
Appraisal management fee expense |
|
|
- |
|
|
|
9,263 |
|
|
|
- |
|
|
|
9,263 |
|
Noninterest expense |
|
|
13,908 |
|
|
|
798 |
|
|
|
286 |
|
|
|
14,992 |
|
Income tax expense (benefit) |
|
|
4,749 |
|
|
|
199 |
|
|
|
(372 | ) |
|
|
4,576 |
|
Net income (loss) |
|
$ | 17,093 |
|
|
|
662 |
|
|
|
(1,402 | ) |
|
|
16,353 |
|
Total assets |
|
$ | 1,647,020 |
|
|
|
4,340 |
|
|
|
602 |
|
|
|
1,651,962 |
|
As of and for the year ended December 31, 2023 |
|
|
|
|
|
|
|
|
|
|
|
|
|
|
|
|
Interest income |
|
$ | 71,830 |
|
|
|
- |
|
|
|
32 |
|
|
|
71,862 |
|
Interest expense |
|
|
16,066 |
|
|
|
- |
|
|
|
1,077 |
|
|
|
17,143 |
|
Net interest income |
|
|
55,764 |
|
|
|
- |
|
|
|
(1,045 | ) |
|
|
54,719 |
|
Provision for credit losses |
|
|
1,566 |
|
|
|
- |
|
|
|
- |
|
|
|
1,566 |
|
Noninterest income |
|
|
13,322 |
|
|
|
- |
|
|
|
- |
|
|
|
13,322 |
|
Appraisal management fee income |
|
|
- |
|
|
|
9,592 |
|
|
|
- |
|
|
|
9,592 |
|
Salaries and employee benefits |
|
|
25,501 |
|
|
|
758 |
|
|
|
381 |
|
|
|
26,640 |
|
Occupancy |
|
|
7,959 |
|
|
|
3 |
|
|
|
- |
|
|
|
7,962 |
|
Appraisal management fee expense |
|
|
- |
|
|
|
7,559 |
|
|
|
- |
|
|
|
7,559 |
|
Noninterest expense |
|
|
13,059 |
|
|
|
675 |
|
|
|
249 |
|
|
|
13,983 |
|
Income tax expense (benefit) |
|
|
4,591 |
|
|
|
138 |
|
|
|
(352 | ) |
|
|
4,377 |
|
Net income (loss) |
|
$ | 16,410 |
|
|
|
459 |
|
|
|
(1,323 | ) |
|
|
15,546 |
|
Total assets |
|
$ | 1,631,767 |
|
|
|
3,681 |
|
|
|
462 |
|
|
|
1,635,910 |
|
As of and for the year ended December 31, 2022 |
|
|
|
|
|
|
|
|
|
|
|
|
|
|
|
|
Interest income |
|
$ | 54,416 |
|
|
|
- |
|
|
|
15 |
|
|
|
54,431 |
|
Interest expense |
|
|
2,796 |
|
|
|
- |
|
|
|
527 |
|
|
|
3,323 |
|
Net interest income |
|
|
51,620 |
|
|
|
- |
|
|
|
(512 | ) |
|
|
51,108 |
|
Provision for credit losses |
|
|
1,472 |
|
|
|
- |
|
|
|
- |
|
|
|
1,472 |
|
Noninterest income |
|
|
15,012 |
|
|
|
14 |
|
|
|
- |
|
|
|
15,026 |
|
Appraisal management fee income |
|
|
- |
|
|
|
11,663 |
|
|
|
- |
|
|
|
11,663 |
|
Salaries and employee benefits |
|
|
24,876 |
|
|
|
917 |
|
|
|
337 |
|
|
|
26,130 |
|
Occupancy |
|
|
8,045 |
|
|
|
3 |
|
|
|
- |
|
|
|
8,048 |
|
Appraisal management fee expense |
|
|
- |
|
|
|
9,264 |
|
|
|
- |
|
|
|
9,264 |
|
Noninterest expense |
|
|
11,512 |
|
|
|
755 |
|
|
|
301 |
|
|
|
12,588 |
|
Income tax expense (benefit) |
|
|
4,248 |
|
|
|
166 |
|
|
|
(242 | ) |
|
|
4,172 |
|
Net income (loss) |
|
$ | 16,479 |
|
|
|
552 |
|
|
|
(908 | ) |
|
|
16,123 |
|
Total assets |
|
$ | 1,617,212 |
|
|
|
3,227 |
|
|
|
488 |
|
|
|
1,620,927 |
|
(17) Peoples Bancorp of North Carolina, Inc. (Parent Company Only) Condensed Financial Statements
Balance Sheets | ||||||||
|
|
|
|
|
||||
December 31, 2024 and 2023 | ||||||||
(Dollars in thousands) | ||||||||
|
|
|
|
|
||||
Assets |
|
2024 |
|
|
2023 |
|
||
|
|
|
|
|
|
|
||
Cash |
|
$ | 425 |
|
|
|
590 |
|
Interest-bearing time deposit |
|
|
1,000 |
|
|
|
1,000 |
|
Investment in subsidiaries |
|
|
144,061 |
|
|
|
134,598 |
|
Investment in PEBK Capital Trust II |
|
|
464 |
|
|
|
464 |
|
Other assets |
|
|
138 |
|
|
|
- |
|
|
|
|
|
|
|
|
|
|
Total assets |
|
$ | 146,088 |
|
|
|
136,652 |
|
|
|
|
|
|
|
|
|
|
Liabilities and Shareholders' Equity |
|
|
|
|
|
|
|
|
|
|
|
|
|
|
|
|
|
Junior subordinated debentures |
|
$ | 15,464 |
|
|
|
15,464 |
|
Other liabilities |
|
|
61 |
|
|
|
172 |
|
Shareholders' equity |
|
|
130,563 |
|
|
|
121,016 |
|
|
|
|
|
|
|
|
|
|
Total liabilities and shareholders' equity |
|
$ | 146,088 |
|
|
|
136,652 |
|
| A-62 |
Statements of Earnings | ||||||||||||
|
|
|
|
|
|
|
||||||
For the Years Ended December 31, 2024, 2023 and 2022 | ||||||||||||
(Dollars in thousands) | ||||||||||||
|
|
|
|
|
|
|
||||||
Revenues: |
|
2024 |
|
|
2023 |
|
|
2022 |
|
|||
|
|
|
|
|
|
|
|
|
|
|||
Interest and dividend from subsidiary |
|
$ | 8,534 |
|
|
|
8,531 |
|
|
|
6,240 |
|
|
|
|
|
|
|
|
|
|
|
|
|
|
Total revenues |
|
|
8,534 |
|
|
|
8,531 |
|
|
|
6,240 |
|
|
|
|
|
|
|
|
|
|
|
|
|
|
Expenses: |
|
|
|
|
|
|
|
|
|
|
|
|
|
|
|
|
|
|
|
|
|
|
|
|
|
Interest |
|
|
1,116 |
|
|
|
1,079 |
|
|
|
529 |
|
Other operating expenses |
|
|
692 |
|
|
|
630 |
|
|
|
639 |
|
|
|
|
|
|
|
|
|
|
|
|
|
|
Total expenses |
|
|
1,808 |
|
|
|
1,709 |
|
|
|
1,168 |
|
|
|
|
|
|
|
|
|
|
|
|
|
|
Income before income tax benefit and equity in undistributed earnings of subsidiaries |
|
|
6,726 |
|
|
|
6,822 |
|
|
|
5,072 |
|
|
|
|
|
|
|
|
|
|
|
|
|
|
Income tax benefit |
|
|
372 |
|
|
|
352 |
|
|
|
242 |
|
|
|
|
|
|
|
|
|
|
|
|
|
|
Income before equity in undistributed earnings of subsidiaries |
|
|
7,098 |
|
|
|
7,174 |
|
|
|
5,314 |
|
|
|
|
|
|
|
|
|
|
|
|
|
|
Equity in undistributed earnings of subsidiaries |
|
|
9,255 |
|
|
|
8,372 |
|
|
|
10,809 |
|
|
|
|
|
|
|
|
|
|
|
|
|
|
Net earnings |
|
$ | 16,353 |
|
|
|
15,546 |
|
|
|
16,123 |
|
Statements of Cash Flows | ||||||||||||
|
|
|
|
|
|
|
||||||
For the Years Ended December 31, 2024, 2023 and 2022 | ||||||||||||
(Dollars in thousands) | ||||||||||||
|
|
|
|
|
|
|
||||||
|
|
2024 |
|
|
2023 |
|
|
2022 |
|
|||
Cash flows from operating activities: |
|
|
|
|
|
|
|
|
|
|||
Net earnings |
|
$ | 16,353 |
|
|
|
15,546 |
|
|
|
16,123 |
|
Adjustments to reconcile net earnings to net cash provided by operating activities: |
|
|
|
|
|
|
|
|
|
|
|
|
Equity in undistributed earnings of subsidiaries |
|
|
(9,255 | ) |
|
|
(8,372 | ) |
|
|
(10,809 | ) |
Change in: |
|
|
|
|
|
|
|
|
|
|
|
|
Other assets |
|
|
(138 | ) |
|
|
24 |
|
|
|
81 |
|
Other liabilities |
|
|
(111 | ) |
|
|
127 |
|
|
|
32 |
|
Net cash provided by operating activities |
|
|
6,849 |
|
|
|
7,325 |
|
|
|
5,427 |
|
|
|
|
|
|
|
|
|
|
|
|
|
|
Cash flows from investing activities: |
|
|
|
|
|
|
|
|
|
|
|
|
Net cash provided by investing activities |
|
|
- |
|
|
|
- |
|
|
|
- |
|
|
|
|
|
|
|
|
|
|
|
|
|
|
Cash flows from financing activities: |
|
|
|
|
|
|
|
|
|
|
|
|
Cash dividends paid on common stock |
|
|
(5,047 | ) |
|
|
(5,108 | ) |
|
|
(4,935 | ) |
Stock repurchase |
|
|
(1,998 | ) |
|
|
(1,997 | ) |
|
|
(710 | ) |
Excise tax on stock repurchase |
|
|
(20 | ) |
|
|
(20 | ) |
|
|
- |
|
Proceeds from exercise of restricted stock units |
|
|
51 |
|
|
|
6 |
|
|
|
41 |
|
Net cash used by financing activities |
|
|
(7,014 | ) |
|
|
(7,119 | ) |
|
|
(5,604 | ) |
Net change in cash |
|
|
(165 | ) |
|
|
206 |
|
|
|
(177 | ) |
Cash at beginning of year |
|
|
590 |
|
|
|
384 |
|
|
|
561 |
|
Cash at end of year |
|
$ | 425 |
|
|
|
590 |
|
|
|
384 |
|
A-63 |
DIRECTORS AND OFFICERS OF THE COMPANY
DIRECTORS
Robert C. Abernethy, Sr. – Chairman
Chairman of the Board, Peoples Bancorp of North Carolina, Inc. and Peoples Bank
President, Secretary and Treasurer, Carolina Glove Company, Inc. (glove manufacturer)
Secretary and Assistant Treasurer, Midstate Contractors, Inc. (paving company)
James S. Abernethy – Vice Chairman
Vice President, Carolina Glove Company, Inc. (glove manufacturer)
President and Assistant Secretary, Midstate Contractors, Inc. (paving company)
Vice President, Secretary and Chairman of the Board of Directors, Alexander Railroad Company
Ashton V. Abernethy
Vice President of Sales, Medusind Behavioral Health
Robert C. Abernethy, Jr.
Executive Vice President, Carolina Glove Company, Inc. (glove manufacturer)
Douglas S. Howard
Vice President and Treasurer, Denver Equipment Company of Charlotte, Inc.
John W. Lineberger, Jr.
Vice President, Lineberger Brothers, Inc. (real estate development)
Gary E. Matthews
President and Director, Matthews Construction Company, Inc. (general contractor)
Director, Conover Metal Products
Billy L. Price, Jr. MD
Practitioner of Internal Medicine, BL Price Jr. Medical Consultants, PLLC
Larry E. Robinson
Chairman of the Board and Chief Executive Officer, The Blue Ridge Distributing Co., Inc. (beer and wine distributor)
Director, United Beverages of North Carolina, LLC (beer distributor)
William Gregory (Greg) Terry
President, Clemson Legacy Designs
President, Collegiate Legacy Designs
Director/Consultant, Drum & Willis-Reynolds Funeral Homes & Crematory
Dan Ray Timmerman, Sr.
Chairman of the Board and Chief Executive Officer, Timmerman Manufacturing, Inc. (wrought iron furniture, railings and gates manufacturer)
Dan Ray Timmerman, Jr.
President, Timmerman Manufacturing, Inc. (wrought iron furniture, railings and gates manufacturer)
Benjamin I. Zachary
President, Treasurer, General Manager and Director, Alexander Railroad Company
OFFICERS
William D. Cable, Sr.
President and Chief Executive Officer
Jeffrey N. Hooper
Executive Vice President, Chief Financial Officer, Corporate Treasurer and Assistant Corporate Secretary
| A-64 |
EXHIBIT (19)(i)
(AMENDED AND RESTATED)
INSIDER TRADING
AND
SECTION 16 REPORTING
POLICY
OF
PEOPLES BANCORP OF NORTH CAROLINA, INC.
AND ITS SUBSIDIARIES
____________________________
ADOPTED AS OF March 11, 2025
Peoples Bancorp of North Carolina, Inc. (the “Company”) is a public company, the common stock of which is traded on the Nasdaq Global Market under the symbol “PEBK” and registered under the Securities and Exchange Act of 1934, as amended (the “Exchange Act”). Pursuant to the Exchange Act, the Company files periodic reports and proxy statements with the Securities and Exchange Commission (“SEC”). Investment by executive officers and directors in the Company’s stock is generally desirable and encouraged. However, such investments should be made with caution and with recognition of the legal prohibitions against the use of nonpublic or other confidential information by “insiders” to achieve a profit or avoid a loss.
For the purpose of complying with SEC Rule 10b-5, the Board of Directors of the Company, through its approval of this Policy, defines an “insider” as (1) any director of the Company, (2) the President and Chief Executive Officer of the Company, (3) each officer of the Company or any of its subsidiaries who directly reports to the President and Chief Executive Officer and (4) any other employee of the Company or any of its subsidiaries so designated by the President and Chief Executive Officer. (It should be noted that direct and indirect beneficial ownership transactions, along with family holdings and other ownership arrangements (e.g. through a limited liability company, a partnership or a corporation) may also qualify for inclusion as an insider subject to all relevant rules and regulations, including this Policy. See “Section 16 Reporting” for additional guidance.) As an insider of a public company, you have the responsibility not to participate in the market for the Company’s stock while in possession of material, non-public information about the Company. There are harsh civil and criminal penalties if you wrongly obtain or use such material, non-public information when you are deciding whether to buy or sell securities, or if you give that information to another person who uses it in buying or selling securities. If you do buy or sell securities while in possession of material non-public information, you will not only have to pay back any money you made, but you could be found guilty of criminal charges, and face substantial fines or even prison. Additionally, the Company could be held liable for your violations of insider trading laws.
As an insider of a public company, you also have the responsibility to comply with the “short-swing profit” rule in Section 16(b) and file periodic reports regarding changes in your ownership of the Company’s stock pursuant to Section 16(a) of the Exchange Act. Violations or failure to comply with these Section 16 restrictions can also result in SEC enforcement action against you.
Peoples Bancorp of North Carolina, Inc.
Insider Trading Policy
Page 2 of 10
In order to avoid these harsh consequences, the Company has developed this Policy to briefly explain the insider trading laws, set forth the Company’s trading guidelines for insiders and describe the procedures you should follow to ensure the timely filing of your Section 16 reports with the SEC. However, it does not address all possible situations that you may face. In addition, you need to understand your obligations under the Exchange Act regarding the selective disclosure of confidential information to ensure compliance with SEC Regulation FD, which requires “fair disclosure” of material, non-public information.
Please call the Company’s Chief Operating Officer or Chief Financial Officer with any questions on insider trading or these guidelines and procedures.
INSIDER TRADING CONCEPTS
What is “Inside” Information?
Inside information includes anything you become aware of because of your “special relationship” with the Company as an insider, which has not been disclosed to the public. The information may be about the Company or any of its subsidiaries or other affiliates. Peoples Bank (the “Bank”) is the Company’s primary subsidiary. It may also include information you learn about another company, for example, companies that are current or prospective customers or suppliers to the Bank or a subsidiary or those with which the Company may be in negotiations regarding a potential transaction.
What is “Material” Information?
Information is material if a reasonable investor would consider it important in deciding whether to buy, sell or hold stock, or if it could affect the market price of the stock. Either positive or negative information may be material. If you are unsure whether the information is material, assume it is material.
Examples of material information typically include, but are not limited to:
|
| · | financial problems; |
|
| · | estimates of future earnings or losses; |
|
| · | events that could result in restating financial information; |
|
| · | a proposed acquisition or sale; |
|
| · | beginning or settling a major lawsuit; |
|
| · | changes in dividend policies; |
|
| · | changes in top management; |
|
| · | declaring a stock split; |
|
| · | a stock, bond or other debt offering; |
|
| · | winning a large new contract (or losing a large contract); or |
|
| · | the gain or loss of a significant customer. |
Peoples Bancorp of North Carolina, Inc.
Insider Trading Policy
Page 3 of 10
What is “Non-public” Information?
Non-public information is information that has not yet been made public by the Company. Information only becomes public when the Company makes an official announcement (in a publicly accessible conference call, a press release or in SEC filings, for example) and people have had an opportunity to see or hear it. Therefore, you should not buy or sell the Company’s stock or other securities before the public announcement of material information. It is usually safe to buy or sell stock after the information is officially announced, as long as you do not know of other material information that has not yet been announced. Even after the information is announced, you should generally wait a minimum of one (1) full trading day before buying or selling securities to allow the market to absorb the information.
What is a “Purchase” or a “Sale”?
This Policy prohibits purchases and sales while you are aware of material, nonpublic information. The terms “purchase,” “sell” and “sale” encompass not only traditional purchases and sales but also any arrangement by which those subject to this Policy change their economic exposure to changes in the price of the Company’s stock. For example, a “purchase” or “sale” would include a purchase of a standardized put or call option, the writing of put or call options, selling stock short, buying or selling securities convertible into other securities, or merely engaging in a private agreement where the value of the agreement varies in relation to the price of the underlying security. A disposition of stock by gift is deemed a “sale” for purposes of this Policy and the federal securities laws.
TRADING GUIDELINES
Prohibition Against Trading While In Possession of Material Non-Public Information
You may not purchase or sell stock or other securities of the Company, or of any other company, when you are aware of any material, nonpublic information about the Company or that other company no matter how you learned the information. You also must not “tip” or otherwise give material, nonpublic information to anyone, including people in your immediate family, friends or anyone acting for you (such as a stockbroker).
Policy for Trading While Not in Possession of Material Non-Public Information
As an insider, you may not purchase or sell stock or other securities of the Company during a restricted trading period or if you are in possession of material, non-public information. Ordinarily either the Company’s Chief Operating Officer or Chief Financial Officer will communicate the beginning and end of any restricted trading period to the Company’s insiders. If you are uncertain as to whether a restricted trading period is in effect, then, before trading in the Company’s stock you should contact the Company’s Chief Operating Officer or Chief Financial Officer to inquire if a restricted trading period is in effect and to obtain pre-clearance of the contemplated trade.
Peoples Bancorp of North Carolina, Inc.
Insider Trading Policy
Page 4 of 10
There are certain types of “Permitted Transactions” which are ordinarily permissible, absent a restriction discussed herein:
|
| · | acceptance or purchase of a stock option or other “option-like” awards issued or offered under one of the Company’s employee stock option plans in compliance with this Policy, including elections to acquire stock options in lieu of other compensation or the cancellation or forfeiture of options pursuant to the plans; |
|
|
|
|
|
| · | vesting of stock options of the Company or shares of restricted stock of the Company and any related stock withholding; |
|
|
|
|
|
| · | exercise of stock options issued under the Company’s stock option plan in a stock-for-stock exercise, payment of the exercise price in shares of the Company’s stock, and any related stock withholding transactions but not any sale of the Company’s stock acquired in the option exercise; |
|
|
|
|
|
| · | acceptance of shares of restricted stock, or restricted stock units under an employee benefit plan of the Company; |
|
|
|
|
|
| · | purchase of shares of the Company’s stock through a stock purchase plan allowing reinvestment of dividends, but not through optional cash purchases; |
|
|
|
|
|
| · | transferring shares of the Company’s stock to an entity that does not involve a change in the beneficial ownership of the shares, such as to an inter vivos trust of which you are the sole beneficiary during your lifetime; |
|
|
|
|
|
| · | making payroll contributions to a retirement, deferred compensation, profit sharing or similar plan (a “Stock Plan”), but not intra-plan transfers involving one of the stock funds in a Stock Plan nor a change in “investment direction” under the Stock Plan to increase or decrease your percentage investment contribution allocated to a Company’s stock fund; |
|
|
|
|
|
| · | acquisition of shares or share units in a deferred compensation plan for directors and/or executive officers, but not intra-plan transfers involving any of the stock unit accounts in such a plan; |
|
|
|
|
|
| · | acquisition or disposition of the Company’s stock in a stock split, stock dividend, or other transaction affecting all shareholders equally; |
|
|
|
|
|
| · | execution of a transaction pursuant to a contract, instruction, or plan described in Exchange Act Rule 10b5-1(c) but only if, with respect to directors and executive officers, in compliance with the Company’s Securities Law Compliance Policy; or |
|
|
|
|
|
| · | any other transaction designated by the Board of Directors of the Company or any committee thereof, with reference to this Policy, as a Permitted Transaction. |
Peoples Bancorp of North Carolina, Inc.
Insider Trading Policy
Page 5 of 10
Restricted trading periods are periods designated by the Company as times in which you may not trade in the Company’s stock regardless of your actual possession or non-possession of material, non-public information. These restricted trading periods are instituted by the Company for a variety of reasons. One such restricted trading period is instituted prior to the Company releasing its quarterly results. Because management seeks to provide the members of the Board of the Company with briefing materials well in advance of each Board meeting, this restricted period begins on the earlier of (1) the 30th business day after the earnings release for the previous quarter-end and (2) the actual day such briefing materials are received by an insider before the Board meeting of the third month of every calendar quarter (March, June, September and December) and lasts until the beginning of the third full trading day after the Company announces results for such quarter. For example:
|
| · | the earnings release for the quarter ending June 30, 2015 is issued on July 27, 2015; |
|
|
|
|
|
| · | the briefing materials for the September 16, 2015 Board meeting are received by insiders on September 10, 2015; |
|
|
|
|
|
| · | the earnings release for the quarter ending September 30, 2015 is issued on October 19, 2015; then |
|
|
|
|
|
| · | the restricted period begins on September 9, 2015 (i.e., the earlier of 30 business days after July 27, 2015, and September 10, 2015) and lasts until October 22, 2015 (i.e., the beginning of the third full trading day after October 19, 2015 – assuming that the earnings release was issued during or after the trading day on October 19, 2015). |
The Sarbanes-Oxley Act of 2002 and Regulation BTR require the Company to absolutely prohibit all purchases, sales or transfers of the Company’s securities by insiders during a retirement plan (including, but not limited to, pension plans and 401-K plans) blackout period. A retirement plan blackout period exists whenever 50% or more of the plan participants are unable to conduct transactions in their accounts for more than three consecutive days. These blackout periods typically occur when there is a change in the retirement plan’s trustee, record keeper or investment manager. You will be contacted when these or other restricted trading periods are instituted from time to time.
In addition to making sure a restricted trading period is not in effect, you may seek pre-clearance to assist you in preventing violations of the Section 16(b) short-swing profit rule. As you may know, insiders will be held liable to the Company for any “short-swing profits” resulting from a non-exempt purchase and sale or sale and purchase within a period of less than six (6) months. Similarly, any profits realized by you upon a trade during a pension blackout period are recoverable by the Company (whether or not there is a “matching” transaction in contrast to short swing trading). The Sarbanes-Oxley Act empowers the SEC to cause the Company to contribute these disgorged profits into a public fund to be used for restitution to the victims of such violations. While compliance with Section 16(b) and other restricted trading periods is your responsibility, pre-clearance of all trades will allow the Company to assist you in preventing any inadvertent violations.
Peoples Bancorp of North Carolina, Inc.
Insider Trading Policy
Page 6 of 10
If, upon requesting clearance, you are advised that the Company’s stock may be traded, you may buy or sell the stock within four (4) business days after clearance is granted, but only if you are not otherwise in possession of material, non-public information.
If, upon requesting clearance, you are advised that the Company’s stock may not be traded, you may not engage in any trade of any type under any circumstances, nor may you inform anyone (other than the Company’s insiders) of the restriction. You may reapply for pre-clearance at a later date when trading restrictions may no longer be applicable. In summary, if you are in any doubt as to whether a restricted trading period is in effect, it is critical that you seek pre-clearance of any trading to prevent both inadvertent Section 16(b) and/or insider trading violations and to avoid even the appearance of an improper transaction (which could result, for example, when an insider engages in a trade while unaware of a pending major development).
Pre-Clearance Policy for Rule 10b5-1(c) Plans
You may not adopt, modify or terminate a trading plan under SEC Rule 10b5-1(c) at any time, without prior clearance. Before entering into a trading plan you must contact the Company’s Chief Operating Officer or Chief Financial Officer to inquire if a restricted trading period is in effect and to obtain pre-clearance of the contemplated plan. You may only enter into a trading plan when you are not in possession of material, non-public information. In addition, you may not enter into, modify or terminate a trading plan during a retirement plan blackout period. Once a trading plan is pre-cleared, trades made pursuant to the plan will not require additional pre-clearance, but only if the plan specifies the dates, prices and amounts of the contemplated trades or establishes a formula for determining dates, prices and amounts and complies with all of the conditions set forth in Rule 10b5-1(c). As discussed under “Section 16 Reporting”, transactions made under a trading plan need to be promptly reported to the Filing Coordinator who will prepare the necessary Form 4.
STOCK OPTIONS AND OTHER BENEFIT PLANS
Certain of the restrictions and reporting obligations discussed above may also apply to the receipt and exercise of stock options or the sale of the underlying stock following an option exercise and/or the exercise of any stock appreciation rights that may be granted, such as reporting the grant or exercise of an option on a Form 4. If you are contemplating exercising any stock options or stock appreciation rights, or making changes to your elections under any Company’s stock purchase plan, you should contact the Company’s Chief Operating Officer or Chief Financial Officer to determine whether there are any restrictions applicable.
Peoples Bancorp of North Carolina, Inc.
Insider Trading Policy
Page 7 of 10
UNAUTHORIZED DISCLOSURE OF MATERIAL,
NONPUBLIC INFORMATION PROHIBITED
No employees, officers, directors or agents of the Company may disclose material, nonpublic information about the Company or any company with whom the Company deals to anyone outside the Company unless authorized to do so. The Company may authorize disclosure of material, nonpublic information to individuals not subject to this Policy, but may condition such authorization by requiring you to have the party to whom you are disclosing that information agree not to disclose the information or trade in the Company’s securities until the information is publicly disclosed.
Tipping
You can be held responsible not only for your own insider trading, but also for trading performed by anyone to whom you disclose material, nonpublic information. Even if those to whom you disclose such information do not trade while aware of the information, you can be responsible for the trades of persons who received material, nonpublic information indirectly from you if you are the ultimate source of their information. You may be responsible for such trades whether or not you derive any personal benefit from disclosing such information. Third parties could easily misconstrue casual remarks you make in which you recommend a purchase, sale, or hold of the Company’s or other companies’ securities as being based on material, nonpublic information. Consequently, you should exercise caution in making any such recommendations.
Authorization to Disclose Material, Nonpublic Information
The SEC has enacted Regulation FD, which explicitly bans selective disclosure of material nonpublic information. Generally, Regulation FD provides that when a public company (such as the Company) discloses material, nonpublic information, it must provide broad, non-exclusionary public access to the information. Violations of Regulation FD can result in SEC enforcement actions, potentially resulting in injunctions and severe monetary penalties. Consequently, the Company authorizes only certain employees and agents (such as senior executives and investor relations personnel) to make disclosures of material, nonpublic information. Unless you are authorized to do so by the Company, you should refrain from discussing material, nonpublic information with anyone not subject to this Policy. Even in discussions with others who are subject to this Policy, you should consider the consequences of disclosing material, nonpublic information to them. By doing so, you would cause these individuals to be prohibited from trading in the Company’s securities until the information is publicly disclosed. Accordingly, you should restrict the dissemination of material, nonpublic information to the Company’s employees and agents having a need to know the information in order to serve the Company’s interests.
Non Disclosure Agreements
The Company employees, officers, directors or agents that are involved in transactions or other negotiations with third parties that require the disclosure of material, nonpublic information concerning the Company to such third parties should have those third parties sign a non-disclosure agreement which requires that (1) the recipient of the information will not disclose the information to others and (2) the recipient may not trade on such information until the information has been publicly disclosed.
Peoples Bancorp of North Carolina, Inc.
Insider Trading Policy
Page 8 of 10
SECTION 16 REPORTING
Overview
The SEC’s rules under Section 16(a) of the Exchange Act impose reporting requirements on executive officers, directors and 10% shareholders. In addition to the obvious direct ownership transactions, the reporting requirements usually extend to include transactions relating to direct and indirect beneficial ownership and “family holdings”, among others. In general, a person is deemed to be a beneficial owner of securities, subject to the insider reporting requirements, if that person has or shares the opportunity, directly or indirectly, to profit or share in any profit derived from a transaction in the securities. Likewise, family holdings are subject to the insider reporting requirements when they share the same residence. Family holdings include, but are not limited to, holdings of: spouses; parents; children; siblings; grandparents; grandchildren; and in-laws. Additionally, there are specific rules regarding the application of the beneficial ownership definition to trust holdings and transactions. Due to the complicated nature surrounding the reporting requirements for the extended ownership structures, the Company’s Chief Operating Officer or Chief Financial Officer or his or her designee (see “Compliance Program” below) should be contacted for guidance prior to the execution of any transaction that might fall under the insider reporting requirements. If there is any change in your ownership of the Company’s securities at any time, other than through certain exempt Company benefit plans, you will be required to file a Form 4 with the SEC reporting the change. In virtually all cases, the Form 4 must be filed with and received by the SEC no later than the second business day following the execution date of the transaction. For transactions under Rule 10b5-1(c) trading plans or certain discretionary transactions within exempt Company benefit plans (for example, fund switching transactions), the Form 4 may not be due until the second business day following the date your broker or plan administrator notifies you of the execution date, but in no event more than five business days after the execution date.
You are also required to report certain exempt transactions to the SEC at year-end on a Form 5. The number and types of transactions eligible for Form 5 reporting are very limited. Coupled with the complexity of determining the time for filing reports in the situations described above, the need to pre-clear with the Company all transactions that you may contemplate is essential to our ability to assist you in making the proper filings in the required time frames.
Consequences of Delinquent Filings
The consequences of a late filing or the failure to file required Section 16 reports are significant:
|
| · | public embarrassment to you and the Company from required disclosures in the Proxy Statement and Form 10-K; |
|
| · | potential civil litigation filed against you by plaintiffs acting as permitted under Section 16(a); |
|
| · | potential SEC enforcement actions against you, such as a cease-and-desist order or injunction against further wrongdoing; and |
|
| · | for egregious or repeated violations, possible criminal penalties and SEC fines of up to $5,000 per day for each filing violation, or even imprisonment |
Peoples Bancorp of North Carolina, Inc.
Insider Trading Policy
Page 9 of 10
Compliance Program
Under SEC rules, the preparation and filing of Section 16(a) reports is your sole responsibility. However, because of the complexities of compliance with the Section 16(a) filing requirements and to help prevent inadvertent violations of the short-swing profit rules, the Company has determined that it is prudent to provide you with assistance in preparing and filing your reports. In this regard, the following compliance procedures have been implemented:
Designated Filing Coordinator
The Company’s Chief Operating Officer, Chief Financial Officer or their designee (the “Filing Coordinator”) can assist all insiders in preparing, reviewing and filing all Forms 3, 4 and 5.
Preparation and Filing
If you have any transaction or change in ownership in your Company’s stock or other equity securities (including derivative securities), please report the transaction(s) to the Filing Coordinator no later than the execution date of the transaction. This is necessary notwithstanding that you received pre-clearance of the transaction because the Company will not know whether or not you then proceeded to act upon such pre-clearance until you provide us with the exact dates, prices and other relevant information. The Filing Coordinator will contact you each January to coordinate preparation of your Form 5 (if applicable).
Upon receiving the details of the transaction(s) from you, the Filing Coordinator will prepare each Form 4 and Form 5 on your behalf. Due to the short two-day period in which to file the reports, the Filing Coordinator may have the Form executed on your behalf using the Power of Attorney that you have granted to the Company for this purpose and will file the completed Form with the SEC. As discussed above, the SEC must receive the Form 4 no later than the second business day following almost any transaction, and Form 5 must be received by February 14th each year, so time is of the essence. The Filing Coordinator will send you a copy of the Form 4 or 5 as filed with the SEC promptly following the filing. Please contact the Filing Coordinator immediately if you believe there may be any errors in the filing. If so, the Filing Coordinator will promptly amend the Form. In most cases, the filing of an amendment to correct information will not result in the initial filing being deemed a late filing; so no proxy disclosure or other penalties should apply.
Peoples Bancorp of North Carolina, Inc.
Insider Trading Policy
Page 10 of 10
The Filing Coordinator will periodically send you a reminder relating to transactions in the Company’s securities. Although such reminder will not allow us to remedy any filings that may be missed due to a failure to inform the Filing Coordinator, we believe that it will be in the best interests of both the Company and you to report such late transactions as soon as possible to mitigate any resulting damage.
Electronic Filings and Website Postings
The Sarbanes-Oxley Act requires all Forms 4 and 5 to be filed with the SEC electronically and then to be posted on the Company’s website. The Filing Coordinator has obtained an identification number to facilitate the electronic filings for all current insiders.
Forms 4 and 5 for Employee Stock Options and Other Stock Plans
Because transactions under employee and director stock option and other stock plans can (1) raise complex Section 16(a) reporting issues; and (2) if reported incorrectly can create the appearance of short-swing profit violations, the Filing Coordinator will automatically prepare the appropriate Form on your behalf whenever you acquire shares pursuant to a benefit plan.
The Ultimate Responsibility Rests on You
While the Company has decided to assist insiders with Section 16 compliance, you should recognize that it will remain your legal obligation to ensure that your filings are made timely and correctly, and that you do not engage in unlawful short-swing transactions. The Company can only facilitate your compliance to the extent you provide the Company with the information required by this Policy. The Company does not assume any legal responsibility in this regard. If you would like more detailed information regarding your Section 16 obligations please contact the Filing Coordinator.
REPORTING OF VIOLATIONS
Any individual who violates this Policy or any federal or state laws governing insider trading or tipping, or knows of any such violation by any other individual, must report the violation immediately to the Chairman of the Audit and Enterprise Risk Committee of the Company’s Board of Directors. Upon learning of any such violation, the Audit and Enterprise Risk Committee, in consultation with the Company’s legal counsel and other parties as the Audit and Enterprise Risk Committee deems appropriate, will determine whether the Company should (1) release any material nonpublic information or (2) report the violation to the SEC or other appropriate governmental authority.
EXHIBIT 19(ii)
(AMENDED AND RESTATED)
SECURITIES LAW COMPLIANCE POLICY
OF
PEOPLES BANCORP OF NORTH CAROLINA, INC.
__________________________________
ADOPTED AS OF MARCH 11, 2025
This Policy of Peoples Bancorp of North Carolina, Inc. (together with its subsidiaries, the “Company”) establishes, among other things, the handling of material, nonpublic information relating to the Company or other companies with whom we deal and with the buying and selling of stock and other securities of the Company and those other companies.
1. Limitations on Sales of Securities by Affiliates
The securities laws limit unregistered sales of securities by any “affiliate” of the Company, i.e. a person such as an executive officer, director or large shareholder (generally a greater than 10% shareholder) in a relationship of control with the Company1. Affiliates wishing to sell securities of the Company generally comply with the safe harbor conditions specified in Rule 144 promulgated under the Securities Act of 1933. This limitation applies to all Company securities held by affiliates (often referred to as “control” securities), whether acquired in private transactions, on the open market or from the exercise of stock options2. When shares of the Company’s securities are acquired by an affiliate of the Company, the Corporate Secretary of the Company will instruct the Company’s stock transfer agent to place a restrictive legend on the stock certificate(s) or mark the Company’s stock transfer books with an appropriate “stop order”, as applicable, with respect to the securities represented thereby.
Below is an example of such a restrictive legend (for “control stock”):
The shares represented by this Certificate are owned by a person or persons, who may be considered an affiliate of the Company for purposes of Rule 144 promulgated under the Securities Act of 1933; no transfer of these shares or any interest therein may be made except pursuant to Rule 144, or an effective registration statement under the Act, unless the Company has received an opinion of counsel satisfactory to it that such transfer does not require registration under the Act.
_____________________
1 Rule 405 provides that “An affiliate of, or person affiliated with, a specified person, is a person that directly, or indirectly through one or more intermediaries, controls or is controlled by, or is under common control with, the person specified”. Affiliate status may also be extended to: (1) members of the affiliate’s immediate family; (2) other persons with whom the affiliate shares a household; (3) economic dependents of the affiliate; (4) any person over whom the affiliate has control; and (5) any entity over which the affiliate has control.
2 Typically, a person who buys securities from an affiliate takes “restricted securities.” While different from “control securities”, restricted securities are also subject to limitations on sale.
| 1 |
The Company’s stock transfer agent will only remove a restrictive legend or stop order upon the receipt of a satisfactory legal opinion. Accordingly, affiliates should contact the Corporate Secretary of the Company well in advance of any proposed sale transaction (including the offer for sale or pledging of Company stock) so that the Company may investigate whether the sale may be completed pursuant to an exemption from registration; and if so, make arrangements to deliver a satisfactory legal opinion to the transfer agent and allow for the timely transfer of the stock. Otherwise, the intended sale and transfer of the Company’s securities may be temporarily or permanently delayed.
For additional information on such limitations and the removal of restrictive legends and stop orders, please contact the Corporate Secretary of the Company.
2. Insider Trading Prohibited
Except for Permitted Transactions (as defined in Section 4), no employee, officer, director or agent of the Company may purchase or sell securities of the Company or of any other company with whom the Company deals while aware of material, nonpublic information concerning the Company or the other company, as applicable. This prohibition applies to any purchase or sale transaction that is not a Permitted Transaction, including those effected to satisfy margin loans.
(a) Employees, Officers, Directors and Agents
This Policy applies to all employees, officers, directors and agents of the Company. When we refer to “you” or to “employees, officers, directors or agents” in this Policy, we also mean (1) members of your immediate family; (2) other persons with whom you share a household; (3) persons who are your economic dependents; (4) any person over whom you have control; and (5) any entity over which you have control. We will regard trades made at your direction or at the direction of those named in the preceding sentence as trades made by you.
(b) Purchase and Sale
This Policy prohibits purchases and sales while you are aware of material, nonpublic information. The terms “purchase,” “sell” and “sale” encompass not only traditional purchases and sales but also any arrangement by which any person subject to this Policy changes his or her economic exposure to changes in the price of the securities. For example, a “purchase” or “sale” would include a purchase of a standardized put or call option, the writing of put or call options, selling stock short, buying or selling securities convertible into other securities, or merely engaging in a private agreement where the value of the agreement varies in relation to the price of the underlying security. A disposition of stock by gift is deemed a “sale” for purposes of this Policy and the federal securities laws.
| 2 |
(c) Other Companies
While this Policy prohibits trading in the Company’s securities when you are aware of material, nonpublic information about the Company, it also prohibits trading in securities of any other company about whom you learn material, nonpublic information in the course of performing your duties for the Company. For example, you may be involved in a transaction in which the Company expects to acquire all or a substantial amount of the stock in another company or enter into a new venture or other relationship with the company. Even though the amount of the transaction may be immaterial to the Company, it may be material to the other company. This Policy prohibits you from trading in the securities of the other company while you are aware of this information, as long as it remains nonpublic.
(d) Material, Nonpublic Information
Information is considered “material” if (1) a reasonable investor would consider it important in making a decision on whether to buy, sell, or hold the security or (2) a reasonable investor would view the information as significantly altering the total mix of information in the marketplace about the issuer of the security. Either positive or negative information may be material. Information that is reasonably likely to affect the market price of a security is almost always material and it is important to recognize that whether the market price would be affected by the information will be determined in hindsight. In other words, if the market price changes after the information is disclosed, the information will generally be considered to have been material.
Information is considered “nonpublic” if it is not available to the general public. In order for information to be considered public, it must be widely disseminated in a manner making it generally available to investors. Examples of such public disclosure include the filing of a Form 8-K with the Securities and Exchange Commission (the “SEC”) or the issuance of a press release. In addition, even after such public disclosure of material information, a reasonable period of time must elapse in order for the market to react to the information. For purposes of this Policy, information will be deemed to be nonpublic until the end of the first full trading day (i.e., a day when the securities markets are open for trading) after the information has been publicly disclosed.
Examples of material, nonpublic information might include the following:
|
| · | financial problems; |
|
| · | information about upcoming earnings or losses; |
|
| · | events that could result in restating financial information; |
|
| · | negotiation of a merger or acquisition; |
|
| · | news of a significant acquisition or sale; |
|
| · | changes in dividend policies; |
|
| · | the declaration of a stock split; |
|
| · | the offering of additional securities; |
|
| · | changes in top management; |
|
| · | significant new products; and |
|
| · | the gain or loss of a substantial customer. |
| 3 |
(e) Margin Loans
Margin loans in the Company’s securities are prohibited.
3. Trading Blackout Periods
The following persons may not purchase or sell the Company’s securities or enter into a Trading Plan (as defined in Section 4(d)) with respect to the Company’s securities during the following blackout periods:
(a) Earnings Blackout Periods
Except for Permitted Transactions, directors, Executive Officers (as defined in this Section) and Designated Employees (as defined in this Section) may not purchase or sell the Company’s securities or enter into a Trading Plan with respect to the Company’s securities during the period beginning on the earlier of (1) the 30th business day after the earnings release for the previous quarter-end and (2) the actual day Board briefing materials are received by such person before the Board meeting of the third month of every calendar quarter (March, June, September and December) and lasting until the beginning of the third full trading day after the Company announces results for such quarter.
For purposes of this Policy, “Executive Officers” are those employees of the Company who are subject to the reporting requirements under Section 16 of the Securities Exchange Act of 1934, as amended (the “Exchange Act”). If you are not certain whether or not you are an Executive Officer, please contact the Company’s President and Chief Executive Officer, Chief Operating Officer or Chief Financial Officer (collectively, the “Plan Officers”) before you trade during a blackout period.
For purposes of this Policy, “Designated Employees” are those employees of the Company, designated from time to time by the Plan Officers, who are directly involved in the preparation of the Company’s financial statements or otherwise have access to the financial information that will be reflected in such financial statements. If you are not certain whether or not you are a Designated Employee, please contact one of the Plan Officers before you trade during an earnings blackout period.
Even if you are not subject to this Section 3(a), you are still subject to Section 2 (which prohibits transactions at any time when you are aware of material, nonpublic information). Accordingly, even if a blackout period is not in effect, you still may not trade in the Company’s securities or establish a Trading Plan at a time when you are aware of material, nonpublic information concerning the Company.
| 4 |
(b) Stock Repurchase Plan Blackout Periods
During the period beginning four (4) business days before the date the Company publicly announces a stock repurchase plan under SEC Rule 10b-18 and/or a Trading Plan, or an increase in the number of shares which may be purchased under such an existing plan, and ending four (4) business days after such date, no Executive Officer or director may purchase or sell shares of the Company’s securities (including pursuant to a Trading Plan adopted by such Executive Officer or director). All Trading Plans adopted by an Executive Officer or a director must contain a restriction having such an effect.
(c) Event-Specific Blackout Periods
Except for Permitted Transactions, employees, officers, directors and/or agents of the Company may not purchase or sell our securities or enter into a Trading Plan with respect to our securities during any period when the Company has notified such individuals that a blackout period is in effect.
The Company reserves the right to impose a trading blackout from time to time on specified groups of its employees, officers, directors or agents when, in the judgment of the Plan Officers, a blackout is warranted. Although these blackouts generally will arise because the Company is considering a material transaction that has not yet been made public, they may be declared for any reason. If the Plan Officers declare a blackout to which you are subject, they will notify you when the blackout begins and when it ends.
If the Plan Officers notify you that you are subject to an event-specific blackout period, you may not trade in the Company securities or establish a Trading Plan during the blackout period nor may you inform any other person that the blackout period is in effect.
(d) 401(k) Plan Blackout Periods
Directors and Executive Officers may not purchase or sell our securities or enter into or modify a Trading Plan with respect to the Company’s securities to the extent and during the periods required by Section 306 of the Sarbanes-Oxley Act of 2002 and Regulation BTR adopted by the SEC in connection therewith.
We have established a blackout period for directors and Executive Officers that prevents them from trading in the Company’s securities at any time when employees of the Company are blacked out from trading in any fund of a retirement, deferred compensation, profit sharing or similar plan sponsored by the Company and holding securities of the Company (a “Stock Plan”). This blackout period is meant to comply with the requirements of Section 306 of the Sarbanes-Oxley Act of 2002, and, therefore, the blackout period shall not apply to those transactions exempted by Regulation BTR.
| 5 |
4. Permitted Transactions
A transaction is a “Permitted Transaction” if it is any of the following transactions:
|
| · | acceptance of a stock option or other “option-like” awards issued or offered under one of the Company’s employee stock option plans in compliance with this Policy, including elections to acquire stock options in lieu of other compensation or the cancellation or forfeiture of options pursuant to the plans; |
|
| · | vesting of the Company stock options or shares of restricted stock of the Company and any related stock withholding; |
|
| · | exercise of stock options issued under the Company’s stock option plans in a stock-for-stock exercise, payment of the exercise price in shares of the Company’s stock, and any related stock withholding transactions but not any sale of the Company’s stock acquired in the option exercise; |
|
| · | acceptance of shares of restricted stock under an employee benefit plan of the Company; |
|
| · | purchase of shares of the Company’s stock through a stock purchase plan allowing reinvestment of dividends, but not through optional cash purchases; |
|
| · | transferring shares of the Company’s stock to an entity that does not involve a change in the beneficial ownership of the shares, such as to an inter vivos trust of which you are the sole beneficiary during your lifetime |
|
| · | making payroll contributions to a Stock Plan, but not intra-plan transfers involving one of the stock funds in a Stock Plan nor a change in “investment direction” under the plan to increase or decrease your percentage investment contribution allocated to a Company stock fund; |
|
| · | acquisition of shares or share units in a deferred compensation plan for directors and/or executive officers, but not intra-plan transfers involving any of the stock unit accounts in such a plan; |
|
| · | acquisition or disposition of the Company’s stock in a stock split, stock dividend, or other transaction affecting all shareholders equally; |
|
| · | execution of a transaction pursuant to a contract, instruction, or plan described in Exchange Act Rule 10b5-1(c) but only if, with respect to directors and Executive Officers, the plan complies with this Policy and requires the broker or other counter-party to notify you immediately upon execution of a transaction in the Company’s stock pursuant to the plan; or |
|
| · | any other transaction designated by the Board of Directors of the Company or any committee thereof or the Plan Officers, with reference to this Policy, as a Permitted Transaction. |
(a) Employee Benefit Plan Transactions
Included in the definition of Permitted Transactions are most of the ongoing transactions you might enter into under any of the Company’s equity-based benefit plans. For example, although your participation in a Stock Plan involves the regular acquisition of the Company’s common stock, either directly pursuant to your investment election or indirectly through the employer match, your participation is not prohibited by this Policy. Notice, however, that the movement of balances into or out of the Company’s stock accounts in a Stock Plan or changes in your investment direction in those accounts are not included among the Permitted Transactions. These transactions may result in a sale of the Company’s stock by the plan trustee and, therefore, are not Permitted Transactions. This means that you may not make such transfers or elections while you are aware of material, nonpublic in-formation. In addition, if you are subject to a blackout period, you may not make such transfers or elections during the blackout period.
| 6 |
Transactions in employee stock options are also considered Permitted Transactions if there is no related sale to third parties. Notice, however, that a sale of stock following or in connection with an option exercise is not a transaction with the Company and is, therefore, not a Permitted Transaction. Thus, you may engage in a cash exercise of an option as long as you retain the stock that you buy in the exercise. You can also engage in stock-for-stock exercises and elect stock withholding without violating this Policy. But, at any time that you are subject to a blackout period or are in possession of material, nonpublic information concerning the Company, you may not exercise an option through a “cashless exercise” where the Company’s stock is sold in the market in connection therewith.
(b) Transactions not Changing Beneficial Ownership
Certain transactions involve merely a change in the form in which you own securities. For example, you may transfer shares of stock to a trust if you are the only beneficiary of the trust during your lifetime. Likewise, changing the form of ownership to include a member of your immediate household as a joint owner is a Permitted Transaction since members of your household are considered the same as you for purposes of this Policy. Since directors and Executive Officers may need to report these transactions pursuant to Section 16 of the Exchange Act, if you are a director or Executive Officer you must give notice of these transactions pursuant to Section 6(a) of this Policy.
(c) Contracts, Instructions or Plans Described in Exchange Act Rule 10b5-1
The SEC has enacted Rule 10b5-1(c) that provides an affirmative defense against violations of the federal insider trading laws and regulations. In general, Rule 10b5-1(c) provides for an affirmative defense if you enter into a contract, provide instructions, or adopt a written plan for trading in securities when you are not aware of material, nonpublic information and are acting in good faith and not to evade the anti-fraud provisions of Rule 10b-5 (a “Trading Plan”). The Trading Plan must (1) specify the amount, price, and date of the securities trading transactions; (2) specify a written formula, algorithm or computer program for determining the amount, price, and date of the securities trading transactions; or (3) place the discretion for determining the amount, price, and date of the securities trading transactions with another person who is not, at the time of the transaction, aware of material, nonpublic information. You may not exercise discretion or influence over the amount, price, and date of the securities trading transactions after entering into the Trading Plan. The rules regarding Trading Plans are complex and must be complied with completely to be effective. You should consult with your legal advisor before adopting a Trading Plan.
A Trading Plan, if used at all, should avoid purchases or sales shortly before known announcements, such as earnings announcements. Even though transactions executed in accordance with a properly formulated Trading Plan are generally exempt from insider trading liability under federal law, if the trades occur at times shortly before the Company announces material news, the investing public and media may not understand the nuances of trading pursuant to a Trading Plan. This could result in negative publicity for you and the Company and is something you should consider when entering into a Trading Plan.
Finally, if you are a director or an Executive Officer, Trading Plans require special care. You can specify conditions that trigger a purchase or sale in a Trading Plan. Consequently, if a triggering condition occurs without your knowledge, you may not be aware that the transaction has taken place and you may not be able to comply with the Section 16(a) rules that require you to report transactions to the SEC within two business days after their execution. Accordingly, transactions pursuant to a Trading Plan are not Permitted Transactions unless the Trading Plan requires the broker to notify the Plan Officers immediately of the execution of a transaction in the Company’s securities.
You must advise a Plan Officer in advance of your adoption, modification or termination of a Trading Plan.
| 7 |
5. Unauthorized Disclosure of Material, Nonpublic Information Prohibited
No employees, officers, directors or agents of the Company may disclose material, nonpublic information about the Company or any company with whom the Company deals to anyone outside the Company unless authorized to do so. The Company may authorize disclosure of material, nonpublic information to individuals not subject to this Policy, but may condition such authorization by requiring you to have the party to whom you are disclosing that information agree not to disclose the information or trade in the Company’s securities until the information is publicly disclosed.
(a) Tipping
You can be held responsible not only for your own insider trading, but also for trading performed by anyone to whom you disclose material, nonpublic information. Even if those to whom you disclose such information do not trade while aware of the information, you can be responsible for the trades of persons who received material, nonpublic information indirectly from you if you are the ultimate source of their information. You may be responsible for such trades whether or not you derive any personal benefit from disclosing such information. Third parties could easily misconstrue casual remarks you make in which you recommend a purchase, sale, or hold of the Company’s or other companies’ securities as being based on material, nonpublic information. Consequently, you should exercise caution in making any such recommendations.
(b) Authorization to Disclose Material, Nonpublic Information
The SEC has enacted Regulation FD, which explicitly bans selective disclosure of material nonpublic information. Generally, Regulation FD provides that when a public company (such as the Company) discloses material, nonpublic information, it must provide broad, non-exclusionary public access to the information. Violations of Regulation FD can result in SEC enforcement actions, potentially resulting in injunctions and severe monetary penalties. Consequently, the Company authorizes only certain employees and agents (such as senior executives and investor relations personnel) to make disclosures of material, nonpublic information. Unless you are authorized to do so by the Company, you should refrain from discussing material, nonpublic information with anyone not subject to this Policy. Even in discussions with others who are subject to this Policy, you should consider the consequences of disclosing material, nonpublic information to them. By doing so, you would cause these individuals to be prohibited from trading in the Company’s securities until the information is publicly disclosed. Accordingly, you should restrict the dissemination of material, nonpublic information to the Company’s employees and agents having a need to know the information in order to serve the Company’s interests.
| 8 |
(c) Non Disclosure Agreements
The Company’s employees, officers, directors or agents that are involved in transactions or other negotiations with third parties that require the disclosure of material, nonpublic information concerning the Company to such third parties should have those third parties sign a non-disclosure agreement which requires that (1) the recipient of the information will not disclose the information to others and (2) the recipient may not trade on such information until the information has been publicly disclosed.
6. Requirement that Directors and Executive Officers Obtain Pre-Clearance and Provide Notice of Transactions
All directors and Executive Officers must notify one of the Plan Officers prior to purchasing or selling the Company’s securities or entering into, modifying or terminating a Trading Plan concerning the Company’s securities and may not effect any such transaction if the Plan Officers indicate that a blackout period is in effect. In addition, all directors and Executive Officers must notify the Plan Officers of the date, quantity, price and the nature of any transaction in the Company’s securities subsequently made on their behalf by the close of business on the date of such transaction. Any Plan Officer who desires to trade in the Company’s securities or establish a Trading Plan concerning the Company’s securities must ensure that one of the other Plan Officers is notified of the date, quantity, price and the nature of any transaction in the Company’s securities subsequently made on his behalf within the time frame set forth in this Section 6. These requirements apply to any purchase and sale transaction.
(a) Pre-Clearance (mandatory for directors and Executive Officers; optional for other employees)
Directors and Executive Officers need to pre-clear their trades with one of the Plan Officers; however, other employees generally do not need to pre-clear their trades; however, if pre-clearance is requested and if the Plan Officers deny a clearance request, the denial must be kept confidential by the person requesting such clearance.
(b) Notification of the Transaction
Section 16(a) of the Exchange Act requires that Executive Officers, directors and greater than 10% shareholders of the Company file Form 4 notices of certain transactions in the Company’s securities with the SEC within two business days following the date of the transaction. Accordingly, this Policy requires that each Executive Officer and director immediately notify the Company with the details of any transaction in the Company’s securities made on their behalf to give the Company the time it needs to prepare and file on their behalf the required Form 4 reports within the SEC’s deadline. Since the Company requires a day to prepare the Form 4 and a day to transmit the form to the SEC, Executive Officers and directors must report the details of a transaction in the Company’s securities to the Plan Officers by no later than the close of business on the date the transaction occurred. More detailed information about compliance with Section 16(a) is contained in the Company’s Insider Trading and Section 16 Reporting Policy.
| 9 |
7. Potential Civil, Criminal and Disciplinary Sanctions
(a) Civil and Criminal Penalties
The consequences of trading in violation of this Policy can be severe. Individuals that violate insider trading laws or regulations may be required to (1) disgorge the profit made or the loss avoided by the trading; (2) pay the loss suffered by the person who purchased the securities from you or sold the securities to a third party; (3) pay civil penalties up to three times the profit made or loss avoided; (4) pay a criminal penalty of up to $5,000,000; and (5) serve a jail term of up to twenty years. The Company and supervisors of an individual that violates insider trading laws or regulations may also be required to pay major civil or criminal penalties.
(b) Company Discipline
Violation of this Policy or federal or state insider trading laws or regulations by any employee, officer, director or agent of the Company (or anyone included in Section 2(a) of this Policy) may subject the employee or officer to disciplinary action by the Company, up to and including termination, and the director or agent to dismissal.
(c) Reporting of Violations
Any individual who violates this Policy or any federal or state laws governing insider trading or tipping, or knows of any such violation by any other individual, must report the violation immediately to the Plan Officers. Upon learning of any such violation, the Plan Officers, in consultation with the Company’s legal counsel and other parties as the Plan Officers deem appropriate, will determine whether the Company should (1) release any material nonpublic information or (2) report the violation to the SEC or other appropriate governmental authority.
| 10 |
8. Administration of Policy
(a) Administration by the Plan Officers
The Plan Officers are responsible for the day-to-day administration of this Policy. If you have any questions concerning the interpretation of this Policy, you should direct your questions to the Plan Officers.
(b) Confidentiality of Policy Decisions
Employees should keep information concerning the operation of this Policy in strict confidence, since knowledge of certain decisions made pursuant to this Policy could itself constitute material, nonpublic information. For example, if you are made subject to a special blackout pursuant to Section 3, you must keep that fact confidential.
(c) Amendment of the Policy
The Company reserves the right to amend and interpret this Policy from time to time.
REMEMBER, THE ULTIMATE RESPONSIBILITY FOR COMPLYING WITH THIS POLICY AND APPLICABLE LAWS AND REGULATIONS RESTS WITH YOU. YOU SHOULD USE YOUR BEST JUDGMENT AND CONSULT WITH YOUR LEGAL AND FINANCIAL ADVISORS, AS NEEDED.
| 11 |
EXHIBIT (21)
SUBSIDIARIES OF THE REGISTRANT
A list of subsidiaries is contained in Part I, Item 1 Business under the section titled “Subsidiaries” and is incorporated herein by reference.
EXHIBIT (23)(i)
CONSENT OF INDEPENDENT REGISTERED PUBLIC ACCOUNTING FIRM
We consent to the incorporation by reference in Registration Statement No. 333-43426 on Form S-3D, effective August 10, 2000 and Registration Statement No. 333-254489 on Form S-8, effective March 19, 2021 of Peoples Bancorp of North Carolina, Inc. of our report dated March 12, 2025, with respect to the consolidated financial statements of Peoples Bancorp of North Carolina, Inc. as of and for the year ended December 31, 2024, which report appears in this Annual Report on Form 10-K.
/s/ Forvis Mazars, LLP
Charlotte, North Carolina
March 12, 2025
EXHIBIT (23)(ii)
Consent of Independent Registered Public Accounting Firm
We consent to the incorporation by reference in the Registration Statement (No. 333-43426) on Form S-3D and Registration Statement (No. 333-254489) on Form S-8 of Peoples Bancorp of North Carolina, Inc. of our report dated March 7, 2024, relating to the consolidated financial statements of Peoples Bancorp of North Carolina, Inc., appearing in this Annual Report on Form 10-K of Peoples Bancorp of North Carolina, Inc. for the year ended December 31, 2024.
/s/ Elliott Davis, PLLC
Raleigh, North Carolina
March 12, 2025
EXHIBIT (31)(i)
CERTIFICATIONS
I, William D. Cable, Sr., certify that:
|
| 1. | I have reviewed this annual report on Form 10-K of Peoples Bancorp of North Carolina, Inc.; |
|
|
|
|
|
| 2. | Based on my knowledge, this report does not contain any untrue statement of a material fact or omit to state a material fact necessary to make the statements made, in light of the circumstances under which such statements were made, not misleading with respect to the period covered by this report; |
|
|
|
|
|
| 3. | Based on my knowledge, the financial statements, and other financial information included in this report, fairly present in all material respects the financial condition, results of operations and cash flows of the registrant as of, and for, the periods presented in this report; |
|
|
|
|
|
| 4. | The registrant’s other certifying officer and I are responsible for establishing and maintaining disclosure controls and procedures (as defined in Exchange Act Rules 13a-15(e) and 15d-15(e)) and internal control over financial reporting (as defined in Exchange Act Rules 13a-15(f) and 15d-15(f)) for the registrant and have: |
|
| a) | designed such disclosure controls and procedures, or caused such disclosure controls and procedures to be designed under our supervision, to ensure that material information relating to the registrant, including its consolidated subsidiaries, is made known to us by others within those entities, particularly during the period in which this report is being prepared; |
|
|
|
|
|
| b) | designed such internal control over financial reporting, or caused such internal control over financial reporting to be designed under our supervision, to provide reasonable assurance regarding the reliability of financial reporting and the preparation of financial statements for external purposes in accordance with generally accepted accounting principles; |
|
|
|
|
|
| c) | evaluated the effectiveness of the registrant’s disclosure controls and procedures and presented in this report our conclusions about the effectiveness of the disclosure controls and procedures, as of the end of the period covered by this report based on such evaluation; and |
|
|
|
|
|
| d) | disclosed in this report any change in the registrant’s internal control over financial reporting that occurred during the registrant’s most recent fiscal quarter (the registrant’s fourth fiscal quarter in the case of an annual report) that has materially affected, or is reasonably likely to materially affect the registrant’s internal control over financial reporting; and |
|
| 5. | The registrant’s other certifying officer and I have disclosed, based on our most recent evaluation of internal control over financial reporting, to the registrant’s auditors and the audit committee of registrant’s board of directors (or persons performing the equivalent functions): |
|
| a) | all significant deficiencies and material weaknesses in the design or operation of internal control over financial reporting which are reasonably likely to adversely affect the registrant’s ability to record, process, summarize and report financial information; and |
|
|
|
|
|
| b) | any fraud, whether or not material, that involves management or other employees who have a significant role in the registrant’s internal control over financial reporting. |
|
|
|
|
| March 12, 2025 | /s/ William D. Cable, Sr. |
|
|
| Date |
| William D. Cable, Sr. President and Chief Executive Officer (Principal Executive Officer) |
|
EXHIBIT (31)(ii)
CERTIFICATIONS
I, Jeffrey N. Hooper, certify that:
|
| 1. | I have reviewed this annual report on Form 10-K of Peoples Bancorp of North Carolina, Inc.; |
|
|
|
|
|
| 2. | Based on my knowledge, this report does not contain any untrue statement of a material fact or omit to state a material fact necessary to make the statements made, in light of the circumstances under which such statements were made, not misleading with respect to the period covered by this report; |
|
|
|
|
|
| 3. | Based on my knowledge, the financial statements, and other financial information included in this report, fairly present in all material respects the financial condition, results of operations and cash flows of the registrant as of, and for, the periods presented in this report; |
|
|
|
|
|
| 4. | The registrant’s other certifying officer and I are responsible for establishing and maintaining disclosure controls and procedures (as defined in Exchange Act Rules 13a-15(e) and 15d-15(e)) and internal control over financial reporting (as defined in Exchange Act Rules 13a-15(f) and 15d-15(f)) for the registrant and have: |
|
| a) | designed such disclosure controls and procedures, or caused such disclosure controls and procedures to be designed under our supervision, to ensure that material information relating to the registrant, including its consolidated subsidiaries, is made known to us by others within those entities, particularly during the period in which this report is being prepared; |
|
|
|
|
|
| b) | designed such internal control over financial reporting, or caused such internal control over financial reporting to be designed under our supervision, to provide reasonable assurance regarding the reliability of financial reporting and the preparation of financial statements for external purposes in accordance with generally accepted accounting principles; |
|
|
|
|
|
| c) | evaluated the effectiveness of the registrant’s disclosure controls and procedures and presented in this report our conclusions about the effectiveness of the disclosure controls and procedures, as of the end of the period covered by this report based on such evaluation ; and |
|
|
|
|
|
| d) | disclosed in this report any change in the registrant’s internal control over financial reporting that occurred during the registrant’s most recent fiscal quarter (the registrant’s fourth fiscal quarter in the case of an annual report) that has materially affected, or is reasonably likely to materially affect the registrant’s internal control over financial reporting; and |
|
| 5. | The registrant’s other certifying officer and I have disclosed, based on our most recent evaluation of internal control over financial reporting, to the registrant’s auditors and the audit committee of registrant’s board of directors (or persons performing the equivalent functions): |
|
| a) | all significant deficiencies and material weaknesses in the design or operation of internal control over financial reporting which are reasonably likely to adversely affect the registrant’s ability to record, process, summarize and report financial information; and |
|
|
|
|
|
| b) | any fraud, whether or not material, that involves management or other employees who have a significant role in the registrant’s internal control over financial reporting. |
| March 12, 2025 |
|
| /s/ Jeffrey N. Hooper |
|
| Date |
|
| Jeffrey N. Hooper |
|
|
|
|
| Executive Vice President and Chief Financial Officer |
|
|
|
|
| (Principal Financial and Principal Accounting Officer) |
|
EXHIBIT (32)
CERTIFICATION PURSUANT TO
18 U.S.C. § 1350,
AS ADOPTED PURSUANT TO
SECTION 906 OF THE SARBANES-OXLEY ACT OF 2002
In connection with the Annual Report of Peoples Bancorp of North Carolina, Inc. (the “Company”) on Form 10-K for the period ended December 31, 2024, as filed with the Securities and Exchange Commission on the date hereof (the “Report”), each of the undersigned certifies, pursuant to 18 U.S.C. § 1350, as adopted pursuant to Section 906 of the Sarbanes-Oxley Act of 2002, that, to the best knowledge of the undersigned:
|
| (1) | The Report fully complies with the requirements of Section 13(a) or 15(d) of the Securities Exchange Act of 1934; and |
|
|
|
|
|
| (2) | The information contained in the Report fairly presents, in all material respects, the financial condition and results of operations of the Company. |
| March 12, 2025 | /s/ William D. Cable, Sr. |
|
|
| Date | William D. Cable, Sr. Chief Executive Officer |
|
| March 12, 2025 |
| /s/ Jeffrey N. Hooper |
|
| Date |
| Jeffrey N. Hooper Chief Financial Officer |
|