UNITED STATES
SECURITIES AND EXCHANGE COMMISSION
Washington, D.C. 20549
FORM 8-K
CURRENT REPORT
Pursuant to Section 13 or 15(d) of The Securities Exchange Act of 1934
Date of Report (Date of earliest event reported) September 4, 2024
Lakeland Industries, Inc. |
(Exact name of registrant as specified in its charter) |
Delaware |
|
0-15535 |
|
13-3115216 |
(State or other jurisdiction |
|
(Commission |
|
(IRS Employer |
of incorporation) |
|
File Number) |
|
Identification No.) |
1525 Perimeter Parkway, Suite 325 Huntsville, AL 35806
(Address of principal executive offices) (Zip Code)
Registrant’s telephone number, including area code: (256) 350-3873
Check the appropriate box below if the Form 8-K filing is intended to simultaneously satisfy the filing obligation of the registrant under any of the following provisions:
☐ |
Written communications pursuant to Rule 425 under the Securities Act (17 CFR 230.425) |
|
|
☐ |
Soliciting material pursuant to Rule 14a-12 under the Exchange Act (17 CFR 240.14a-12) |
|
|
☐ |
Pre-commencement communications pursuant to Rule 14d-2(b) under the Exchange Act (17 CFR 240.14d-2(b)) |
|
|
☐ |
Pre-commencement communications pursuant to Rule 13e-4(c) under the Exchange Act (17 CFR 240.13e-4(c)) |
Securities registered pursuant to Section 12(b) of the Act:
Title of each class |
Trading Symbol(s) |
Name of each exchange on which registered |
Common Stock, $0.01 Par Value |
LAKE |
NASDAQ Market |
Indicate by check mark whether the registrant is an emerging growth company as defined in Rule 405 of the Securities Act of 1933 (§230.405 of this chapter) or Rule 12b-2 of the Securities Exchange Act of 1934 (§240.12b-2 of this chapter).
Emerging growth company ☐
If an emerging growth company, indicate by check mark if the registrant has elected not to use the extended transition period for complying with any new or revised financial accounting standards provided pursuant to Section 13(a) of the Exchange Act. ☐
Item 2.02. Results of Operations and Financial Condition.
On September 4, 2024, Lakeland Industries, Inc. (the “Company”) issued a press release announcing its financial results for the second quarter ended July 31, 2024. A copy of the press release is attached hereto as Exhibit 99.1.
Item 7.01. Regulation FD Disclosure.
Item 2.02 of this Current Report on Form 8-K is incorporated herein by reference.
In addition, a copy of the supplemental slides which will be discussed during the Company’s earnings call at 12:00 p.m. ET on Wednesday, September 5, 2024 is attached to this report as Exhibit 99.2 and incorporated herein by reference.
Item 9.01. Financial Statements and Exhibits.
(d) Exhibits.
|
||
|
Supplemental slides provided in connection with the Q2 FY2025 earnings call of the Company |
|
104 |
|
Cover Page Interactive Data File (embedded within the Inline XBRL document) |
The information included in this Current Report on Form 8-K (including Exhibits 99.1 and 99.2 hereto) is being “furnished” in accordance with Item 2.02 and Item 7.01 and shall not be deemed to be “filed” for the purposes of Section 18 of the Securities Exchange Act of 1934, as amended (the “Exchange Act”), or otherwise subject to the liabilities of such section, nor shall such information be deemed incorporated by reference in any filing under the Securities Act of 1933, as amended, or the Exchange Act, except as shall be expressly set forth by specific reference in such a filing.
2 |
SIGNATURES
Pursuant to the requirements of the Securities Exchange Act of 1934, the registrant has duly caused this report to be signed on its behalf by the undersigned hereunto duly authorized.
|
LAKELAND INDUSTRIES, INC. |
|
|
|
|
|
|
|
|
/s/ Roger D. Shannon |
|
|
|
Roger D. Shannon |
|
|
|
Chief Financial Officer |
|
|
|
|
|
|
|
Date: September 4, 2024 |
|
3 |
EXHIBIT 99.1
Lakeland Industries, Inc. Reports Fiscal 2025 Second Quarter Financial Results
Net sales of $38.5 million and gross margin of 39.6%
Continued strong growth in high-value, strategic product lines, led by a 34% increase in Fire
Rebranding and Launch of Lakeland Fire + Safety
HUNTSVILLE, AL / ACCESSWIRE / September 4, 2024 / Lakeland Industries, Inc. (NASDAQ: LAKE) (the “Company” or “Lakeland”), a leading global manufacturer of protective clothing and apparel for industry, healthcare and first responders on the federal, state and local levels, today announced financial results for its fiscal 2025 second quarter ended July 31, 2024.
Fiscal 2025 Second Quarter Financial Results Highlights
|
| · | Net sales of $38.5 million, up $5.4 million, or 16.5%, year-over-year |
|
|
|
|
|
| · | Organic revenue(1) excluding LHD, Jolly, and Pacific Helmets acquisitions, of $32.2 million, a decrease of $0.9 million, or 2.8%, year-over-year |
|
|
|
|
|
| · | Fire services business, a key strategic growth focus for the Company, grew over 33.5% versus the same period last year |
|
|
|
|
|
| · | Gross margin of 39.6% and organic gross margin of 43.4%, compared to a gross margin of 42.9% in the prior year period |
|
|
|
|
|
| · | Net loss of ($1.4 million) or ($0.19) per basic common share in Q2-FY25 versus net income of $2.5 million or $0.33 per basic common share last year |
|
|
|
|
|
| · | Adjusted earnings before interest, taxes, depreciation, amortization and excluding FX (Adjusted EBITDA excluding FX)(2) of $2.7 million in Q2-FY25, compared to $4.7 million in Q2-FY24 |
|
|
|
|
|
| · | LHD, Jolly and Pacific Helmets revenue of $1.5 million, $2.9 million and $1.9 million, respectively |
(1)Organic revenue and organic gross margin are total revenue and total gross margin, each excluding the effects of recent acquisitions, which management uses to assess the growth of its legacy business.
(2)Adjusted EBITDA and Adjusted EBITDA excluding FX are non-GAAP financial measures. Reconciliations are provided in the tables of this press release.
Management Comments
“Lakeland delivered second-quarter results below our expectations, but we believe the shortfall was due to shipment timing, and we remain confident in our full-year projections. A substantial amount of the organic revenue shortfall is related to the transition of large North American channel partner accounts to LineDrive, our new industrial market representative. LineDrive continues to build pipeline opportunities, and we believe these sales will accelerate in the second half of the year. Additionally, both Jolly and Eagle had substantial fire orders delayed to the late third and early fourth quarter. LHD, which we acquired on July 1, has resumed production in anticipation of delivering on a multi-year backorder in the fourth quarter,” said Jim Jenkins, President, Chief Executive Officer and Executive Chairman.
| 1 |
“Though the timing impact of the delayed fire orders and the slower-than-expected roll-out of the new LineDrive structure resulted in shipments pushed to the second half of fiscal 2025, we are confident in our growth strategy and our expanding market opportunities in both fire services and industrial safety products. Our new sales leadership has been in place for two months, and the energy and experience they bring to the organization is palpable. We expect our global fire services business to accelerate in the second half of our fiscal year through organic growth and strategic acquisitions, along with increased momentum in our industrial safety products. While our U.S., European and Asian sales were softer than expected in the quarter, our Latin American growth remained robust, and we are excited about the new sales leadership we have put in place in Asia and the steps we are taking to improve our industrial offerings in Europe. Sales results from our recent acquisitions, LHD, Jolly, and Pacific Helmets, were a combined $6.3 million, and we expect those to accelerate in the second half as we deliver on open orders,” continued Mr. Jenkins.
Mr. Jenkins continued, “We are pleased with the early momentum we are building with the LHD Group. Suppliers have returned to giving LHD credit terms and discounts based on Lakeland’s financial strength, fire suit manufacturing for Germany has resumed, and we are focused on working down a significant backlog in Germany by the end of our fiscal year. LHD’s Australian operations, including its services business, remain solid, and we recently learned that LHD Hong Kong secured a renewal with the Hong Kong Fire Department, with committed contract revenue increasing from $3.5M to $5.3M from September 2024 to September 2025. We continue to see significant growth opportunities with LHD”
“Finally, I am excited to introduce Lakeland Fire + Safety. This new company name and brand identity reflects our evolution as a company and reinforces our dedication to providing comprehensive, innovative solutions for the first responder and worker safety sectors. Lakeland Fire + Safety will integrate our existing brands, including Eagle, Pacific, Jolly, and LHD, creating a consolidated, head-to-toe safety solution for fire and industrial products customers,” concluded Mr. Jenkins.
Roger Shannon, Lakeland’s Chief Financial Officer, added, “Lakeland’s revenue continued to increase during the fiscal second quarter, supported by our recent fire services acquisitions. Revenue grew $5.4 million, or 16.5%, compared to the second quarter of fiscal year 2024, and our trailing twelve months revenue now stands at $137.7 million. Our second quarter gross margin decreased by 3.3 margin points versus Q2 of last year to 39.6% due primarily to a 3.8 margin points impact in Q2 from the integration of newly acquired companies, including a 0.9% margin impact from the amortization of acquired assets relating to the purchase accounting step-up of acquired inventory at Jolly and LHD and a 3.4 margin points impact of “profit in ending inventory” related to the build of stock in quarter for sales in the second half of the year. This decrease was partially offset by improved organic gross margin. We expect the profit in ending inventory to reverse and be accretive to gross margins in the second half as the inventory is shipped. While our operating expenses increased to $16.8 million for the quarter, $2.4 million was SG&A acquired from our recent acquisitions, and $2.6 million was due to acquisition, non-cash/ non-recurring expenses, and FX. For the quarter, the Company had a Net Loss of $1.4 million, or ($0.19) per basic and diluted share, and Adjusted EBITDA excluding FX was $2.7 million.
Fiscal 2025 Second Quarter Financial Results
Net sales were $38.5 million for the second quarter of fiscal year 2025, compared to $33.1 million for the second quarter of fiscal year 2024. Sales of our fire services category grew $3.0 million, or 34%, driven by sales from newly acquired companies, Pacific Helmets, Jolly and LHD. Our Industrials product lines grew $2.4 million, or 10%, over the same period last year, led by our woven products. Disposables declined 2% year-over-year, and chemical product sales were flat, due primarily to the LineDrive transition. Disposables represented 32% of revenue for the quarter, while Fire grew to 31% and Chemicals increased to 20%. The remainder of our industrial products, including FR/AR High Performance and Hi-Vis, accounted for 17% of sales.
| 2 |
On a consolidated basis, for the second quarter of fiscal year 2025, domestic sales were $12.4 million or 32% of total revenues, and international sales were $26.1 million or 68% of total revenues. This compares with domestic sales of $15.2 million or 46% of the total and international sales of $17.9 million or 54% in the second quarter of fiscal year 2024. Continued strong sales growth in Latin America during the second quarter of fiscal 2025 was partially offset by lower sales in the U.S. and Europe, with China continuing to improve.
Gross Profit for the second quarter of fiscal year 2025 increased $1.0 million, or 7%, to $15.2 million compared to $14.2 million in the second quarter of fiscal year 2024. Gross profit as a percentage of net sales was 39.6% for the second quarter of fiscal year 2025, compared to 42.9% for the second quarter of fiscal year 2024. Gross Profit was negatively affected by 3.8% from the integration of newly acquired companies, including a 0.9% impact from the amortization of acquired assets relating to the purchase accounting step-up of acquired inventory at Jolly and LHD, and 3.2% due to the impact of profit in ending inventory, partially offset by higher organic gross profit.
Operating expenses increased due to inorganic growth, acquisition expenses, Argentina-related FX expenses, non-recurring expenses, and increased organic SG&A operating expenses, primarily professional fees. Lakeland reported an operating loss of $1.6 million for the second quarter of fiscal year 2025, compared to an operating profit of $3.7 million for the second quarter of fiscal year 2024. Operating margins were (4.1%) for the second fiscal quarter of 2025, down from 11.3% for the second fiscal quarter of 2024.
The Company reported a net loss of $1.4 million, or ($0.19) per basic and diluted earnings per share, for the second quarter of fiscal year 2025, compared with a net income of $2.5 million, or $0.33 per basic and $0.32 per diluted earnings per share, for the second quarter of fiscal year 2024.
Adjusted EBITDA excluding FX for the second quarter of fiscal year 2025 was $2.7 million, a decrease of $2.1 million, or (44%), compared with $4.2 million for the second quarter of fiscal 2024. The decrease in Adjusted EBITDA excluding FX was driven by the previously mentioned profit in ending inventory, higher manufacturing costs associated with the inventory build and increased SG&A. Adjusted EBITDA from our acquisitions were lower than our expectations due to shipment slippages but are expected to improve in the second half of the year.
At the end of Q2-FY25, cash was $24.9 million, and long-term debt was $29.5 million, compared with $28.4 million in cash and $13 million in long-term debt as of April 30, 2024. The decrease in cash was due primarily to debt repayment during the quarter, and the net increase in our long-term debt was mainly related to the acquisition of LHD Group in July, partially offset by repayments on our credit facility. Inventory at the end of Q2 was $67.9 million, up from $56.1 million at the end of Q1-FY25, primarily because of LHD, Jolly, Eagle and organic sales expected to ship in the second half of FY25. Organic inventory as of Q2-FY25 decreased $5 million versus the quarter ended July 31, 2023.
The Company’s quarterly dividend of $0.03 per share was paid on August 22, 2024, to stockholders of record as of August 15, 2024.
| 3 |
FY 2025 Reaffirmed Guidance and Outlook
This reaffirmed guidance is based on our current backlog of orders and current expectations. These metrics constitute forward-looking statements and are based on current expectations. For a discussion of factors that could cause actual results to differ materially from these metrics, see “‘Safe Harbor’ Statement Under the Private Securities Litigation Reform Act of 1995” below.
|
| · | Revenue - We continue to expect FY25 Revenue in the range of $160 million to $170 million. This Revenue expectation includes the recently announced LHD, Jolly Scarpe and Pacific Helmets acquisitions. |
|
|
|
|
|
| · | Adjusted EBITDA excluding FX– We continue to expect FY25 Adjusted EBITDA, excluding any material negative impact from foreign exchange, to be in the range of $18 million to $21.5 million(1). This Adjusted EBITDA expectation includes the recently announced LHD, Jolly Scarpe and Pacific Helmets acquisitions. |
(1) Excluding revenue, the Company does not provide guidance on a GAAP basis as certain items that impact Adjusted EBITDA, such as equity compensation, foreign exchange gains or losses, acquisition expenses and employee separation expenses, which may be significant, are outside the Company’s control and/or cannot be reasonably predicted. Please see the “Reconciliation of GAAP Results to Non-GAAP Results” and the related footnotes at the end of this press release for detailed information on calculating non-GAAP measures. See the non-GAAP financial reconciliation tables in this release for a reconciliation of other non-GAAP financial measures.
Mr. Jenkins added, “We remain positive about our ability to grow our business in the second half of the year. As we have previously mentioned, revenue in the fire space can be “lumpy” due to the timing of tenders, but we have visibility to increased shipments in the second half. We expect to be less susceptible to revenue timing swings as we gain critical mass in the fire space. We also remain confident in growing our industrial business and expect growth from our LineDrive relationship and upgrades to our internal sales functions.”
“We continue to believe our SSQ acquisition strategy and the investments we are making in our sales strategies position us for growth in revenue and profitability. In the second half of the year, we will continue to drive operational improvements throughout the organization. We are laser-focused on improving productivity and expect more gross profit to be generated. In fact, we expect the increase in productivity to significantly help to offset the setbacks caused by the timing slippage of Q2 orders,” concluded Mr. Jenkins.
| 4 |
Financial Results Conference Call
The Company will host a conference call and live webcast on Thursday, September 5, 2024 at 12:00 p.m. Eastern to discuss its fiscal 2025 second quarter financial results. Investors, analysts, and members of the media interested in listening to the live presentation are encouraged to join a webcast of the call, available at:
Event URL: https://www.webcaster4.com/Webcast/Page/2237/51185
Please note that the webcast is listen-only, and webcast participants will not be able to participate in the question-and-answer portion of the conference call. Interested parties may also participate in the call by dialing (888) 506-0062 or (973) 528-0011 and entering the passcode 705386. Interested parties are asked to dial in approximately 10 to 15 minutes prior to the start time of the call.
An audio replay of the conference call will be available until Thursday, September 12, 2024. To access the replay, please dial (877) 481-4010 or (919) 882-2331. The replay passcode is 51185. An archived version of the webcast will also be available on the Lakeland Investor Relations website.
About Lakeland Industries, Inc.
We manufacture and sell a comprehensive line of industrial protective clothing and accessories for the industrial and public protective clothing market. Our products are sold globally by our in-house sales teams, our customer service group, and authorized independent sales representatives to a network of over 2,000 global safety and industrial supply distributors. Our authorized distributors supply end users, such as integrated oil, chemical/petrochemical, automobile, transportation, steel, glass, construction, smelting, cleanroom, janitorial, pharmaceutical, and high technology electronics manufacturers, as well as scientific, medical laboratories and the utilities industry. In addition, we supply federal, state and local governmental agencies and departments, such as fire and law enforcement, airport crash rescue units, the Department of Defense, the Department of Homeland Security and the Centers for Disease Control. Internationally, we sell to a mixture of end users directly and to industrial distributors, depending on the particular country and market. In addition to the United States, sales are made into more than 50 foreign countries, the majority of which were into China, the European Economic Community ("EEC"), Canada, Chile, Argentina, Russia, Kazakhstan, Colombia, Mexico, Ecuador, India, Uruguay, Middle East, Southeast Asia, Australia, Hong Kong and New Zealand.
For more information concerning Lakeland, please visit the Company online at www.lakeland.com.
Contacts
Lakeland Industries, Inc.
256-600-1390
Roger Shannon
rdshannon@lakeland.com
| 5 |
“Safe Harbor” Statement Under the Private Securities Litigation Reform Act of 1995
This press release contains estimates, predictions, opinions, goals and other “forward-looking statements” as that phrase is defined in the Private Securities Litigation Reform Act of 1995. Such statements include, without limitation, references to the Company's predictions or expectations of future business or financial performance as well as its goals and objectives for future operations, financial and business trends, business prospects, and management's expectations for earnings, revenues, expenses, inventory levels, capital levels, liquidity levels, or other future financial or business performance, strategies or expectations, including without limitation the expected benefits of the Pacific, Jolly and LHD acquisitions and our M&A strategy. All statements, other than statements of historical facts, which address Lakeland's expectations of sources or uses for capital, or which express the Company's expectation for the future with respect to financial performance or operating strategies can be identified as forward-looking statements. Forward-looking statements involve risks, uncertainties and assumptions as described from time to time in press releases and Forms 8-K, registration statements, quarterly and annual reports and other reports and filings filed with the Securities and Exchange Commission or made by management. As a result, there can be no assurance that Lakeland's future results will not be materially different from those described herein as "believed," "projected," "planned," "intended," "anticipated," "can," "estimated" or "expected," or other words which reflect the current view of the Company with respect to future events. We caution readers that these forward-looking statements speak only as of the date hereof. With respect to our guidance for revenue and Adjusted EBITDA, such metrics are subject to significant business, economic and competitive uncertainties and contingencies, many of which are beyond the control of the Company and its management; actual results will vary, and those variations may be material. The Company hereby expressly disclaims any obligation or undertaking to release publicly any updates or revisions to any such statements to reflect any change in the Company's expectations or any change in events, conditions or circumstances on which such statement is based, except as may be required by law.
Non-GAAP Financial Measures
To supplement its consolidated financial statements, which are prepared and presented in accordance with Generally Accepted Accounting Principles (GAAP), the Company uses the following non-GAAP financial measures in this press release: Adjusted EBITDA, Adjusted EBITDA margin, Adjusted EBITDA excluding FX, and Adjusted EBITDA excluding FX margin. The presentation of this financial information is not intended to be considered in isolation or as a substitute for, or superior to, the financial information prepared and presented in accordance with GAAP. The Company uses these non-GAAP financial measures for financial and operational decision-making and as a means to evaluate period-to-period comparisons. The Company believes that these measures provide useful information about operating results, enhance the overall understanding of past financial performance and future prospects, and allow for greater transparency with respect to key metrics used by management in its financial and operational decision-making. The non-GAAP financial measures used by the Company in this press release may be different from the methods used by other companies.
For more information on the non-GAAP financial measures, please see the Reconciliation of GAAP to non-GAAP Financial Measures tables in this press release. These accompanying tables include details on the GAAP financial measures that are most directly comparable to non-GAAP financial measures and the related reconciliations between these financial measures.
(Financial Tables Follow)
| 6 |
LAKELAND INDUSTRIES, INC. AND SUBSIDIARIES
CONDENSED CONSOLIDATED BALANCE SHEETS
July 31, 2024 and January 31, 2024
(UNAUDITED)
(000’s except for share information)
|
|
| July 31, |
|
| January 31, |
|
||
| ASSETS |
| 2024 |
|
| 2024 |
|
||
| Current assets |
|
|
|
|
|
|
||
| Cash and cash equivalents |
|
| 24,880 |
|
|
| 25,222 |
|
| Accounts receivable, net of allowance for doubtful accounts of $1,033 and $857 at July 31, 2024 and January 31, 2024, respectively |
|
| 22,933 |
|
|
| 19,169 |
|
| Inventories |
|
| 67,920 |
|
|
| 51,251 |
|
| Prepaid VAT and other taxes |
|
| 2,043 |
|
|
| 2,753 |
|
| Income tax receivable and other current assets |
|
| 10,513 |
|
|
| 3,111 |
|
| Total current assets |
|
| 128,289 |
|
|
| 101,506 |
|
| Property and equipment, net |
|
| 12,618 |
|
|
| 10,685 |
|
| Operating leases right-of-use assets |
|
| 11,937 |
|
|
| 10,969 |
|
| Deferred tax assets |
|
| 3,104 |
|
|
| 3,097 |
|
| Other assets |
|
| 163 |
|
|
| 110 |
|
| Goodwill |
|
| 20,298 |
|
|
| 13,669 |
|
| Intangible assets, net |
|
| 14,498 |
|
|
| 6,830 |
|
| Equity investment |
|
| 4,474 |
|
|
| 4,719 |
|
| Convertible debt instruments |
|
| 2,800 |
|
|
| 2,161 |
|
| Total assets |
|
| 198,181 |
|
|
| 153,745 |
|
| LIABILITIES AND STOCKHOLDERS’ EQUITY |
|
|
|
|
|
|
|
|
| Current liabilities |
|
|
|
|
|
|
|
|
| Accounts payable |
|
| 16,578 |
|
|
| 7,378 |
|
| Accrued compensation and benefits |
|
| 4,531 |
|
|
| 3,922 |
|
| Other accrued expenses |
|
| 6,483 |
|
|
| 2,487 |
|
| Income tax payable |
|
| - |
|
|
| 1,454 |
|
| Short-term borrowings |
|
| - |
|
|
| 298 |
|
| Accrued earnout agreement |
|
| - |
|
|
| 643 |
|
| Current portion of operating lease liability |
|
| 2,505 |
|
|
| 2,164 |
|
| Total current liabilities |
|
| 30,097 |
|
|
| 18,346 |
|
| Deferred income taxes |
|
| 2,114 |
|
|
| 2,097 |
|
| Loans payable – long term |
|
| 29,484 |
|
|
| 731 |
|
| Long-term portion of operating lease liabilities |
|
| 11,770 |
|
|
| 9,121 |
|
| Total Liabilities |
|
| 73,465 |
|
|
| 30,295 |
|
| Commitments and contingencies |
|
|
|
|
|
|
|
|
| Stockholders’ equity |
|
|
|
|
|
|
|
|
| Preferred stock, $0.01 par; authorized 1,500,000 shares (none issued) |
|
|
|
|
|
|
|
|
| Common stock, $0.01 par; authorized 20,000,000 shares |
|
| 87 |
|
|
| 87 |
|
| Issued 8,736,023 and 8,722,965; outstanding 7,396,604 and 7,364,757 at July 31, 2024 and January 31, 2024, respectively |
||||||||
| Treasury stock, at cost; 1,358,208 shares at July 31, 2024 and January 31, 2024, respectively |
|
| (19,979 | ) |
|
| (19,979 | ) |
| Additional paid-in capital |
|
| 79,743 |
|
|
| 79,420 |
|
| Retained earnings |
|
| 69,117 |
|
|
| 69,282 |
|
| Accumulated other comprehensive loss |
|
| (4,252 | ) |
|
| (5,360 | ) |
| Total stockholders' equity |
|
| 124,716 |
|
|
| 123,450 |
|
| Total liabilities and stockholders' equity |
|
| 198,181 |
|
|
| 153,745 |
|
| 7 |
LAKELAND INDUSTRIES, INC. AND SUBSIDIARIES
CONDENSED CONSOLIDATED STATEMENTS OF OPERATIONS
(UNAUDITED)
($000’s except for share and per share information)
|
|
| Three Months Ended |
|
|||||
|
|
| July 31, |
|
|||||
|
|
| 2024 |
|
| 2023 |
|
||
|
|
|
|
|
|
|
|
||
| Net sales |
|
| 38,512 |
|
|
| 33,071 |
|
| Cost of goods sold |
|
| 23,277 |
|
|
| 18,888 |
|
| Gross profit |
|
| 15,235 |
|
|
| 14,183 |
|
| Operating expenses |
|
| 16,826 |
|
|
| 10,453 |
|
| Operating profit (loss) |
|
| (1,591 | ) |
|
| 3,730 |
|
| Other income (expense), net |
|
| 165 |
|
|
| (65 | ) |
| Interest expense |
|
| (370 | ) |
|
| (1 | ) |
| Income (loss) before taxes |
|
| (1,796 | ) |
|
| 3,664 |
|
| Income tax expense |
|
| (420 | ) |
|
| 1,199 |
|
| Net income (loss) |
|
| (1,376 | ) |
|
| 2,465 |
|
| Net income (loss) per common share: |
|
|
|
|
|
|
|
|
| Basic |
|
| (0.19 | ) |
|
| 0.33 |
|
| Diluted |
|
| (0.19 | ) |
|
| 0.32 |
|
| Weighted average common shares outstanding: |
|
|
|
|
|
|
|
|
| Basic |
|
| 7,390,873 |
|
|
| 7,409,305 |
|
| Diluted |
|
| 7,390,873 |
|
|
| 7,591,786 |
|
| 8 |
LAKELAND INDUSTRIES, INC. AND SUBSIDIARIES
Operating Results ($000’s) except share information
(Unaudited)
Supplemental Information
|
|
| Three Months Ended |
|
|||||
|
|
| July 31, |
|
|||||
|
|
| 2024 |
|
| 2023 |
|
||
|
|
|
|
|
|
|
|
||
| Net sales |
|
| 38,512 |
|
|
| 33,071 |
|
| Year over Year change |
|
| 16.5 | % |
|
| 17.3 | % |
| Gross profit |
|
| 15,235 |
|
|
| 14,183 |
|
| Gross profit % |
|
| 39.6 | % |
|
| 42.9 | % |
| Operating expenses |
|
| 16,826 |
|
|
| 10,453 |
|
| Operating expenses as a percentage of sales |
|
| 43.7 | % |
|
| 31.6 | % |
| Operating profit (loss) |
|
| (1,591 | ) |
|
| 3,730 |
|
| Operating profit (loss) as a percentage of sales |
|
| -4.1 | % |
|
| 11.3 | % |
| Other income (expense), net |
|
| 165 |
|
|
| (65 | ) |
| Interest expense |
|
| (370 | ) |
|
| (1 | ) |
| Income (loss) before taxes |
|
| (1,796 | ) |
|
| 3,664 |
|
| Income tax expense |
|
| (420 | ) |
|
| 1,199 |
|
| Net income (loss) |
|
| (1,376 | ) |
|
| 2,465 |
|
| Income tax expense |
|
| (1,796 | ) |
|
| 3,664 |
|
| Interest expense |
|
| 370 |
|
|
| 1 |
|
| Depreciation and amortization |
|
| 1,145 |
|
|
| 589 |
|
| EBITDA |
|
| (281 | ) |
|
| 4,254 |
|
| Equity compensation |
|
| 428 |
|
|
| 38 |
|
| Other income (expense), net |
|
| (165 | ) |
|
| 65 |
|
| Acquisition expenses |
|
| 712 |
|
|
| - |
|
| Earnout revaluation |
|
| - |
|
|
| (685 | ) |
| Employee separation expense/restructuring |
|
| 745 |
|
|
| 352 |
|
| New Monterrey, Mexico facility start-up costs |
|
| 183 |
|
|
| 138 |
|
| PFAS Litigation |
|
| 194 |
|
|
| - |
|
| Adjusted EBITDA |
|
| 1,816 |
|
|
| 4,162 |
|
| 9 |
LAKELAND INDUSTRIES, INC. AND SUBSIDIARIES
Operating Results ($000) (Unaudited)
Reconciliation of GAAP Results to Non-GAAP Results
|
|
| Three Months Ended |
|
|||||
|
|
| July 31, |
|
|||||
|
|
| 2024 |
|
| 2023 |
|
||
| Net Income (loss) to EBITDA |
|
|
|
|
|
|
||
| Net income (loss) |
|
| (1,376 | ) |
|
| 2,465 |
|
| Interest expense |
|
| 370 |
|
|
| 1 |
|
| Taxes (1) |
|
| (420 | ) |
|
| 1,199 |
|
| Depreciation and amortization |
|
| 1,145 |
|
|
| 589 |
|
| EBITDA |
|
| (281 | ) |
|
| 4,254 |
|
|
|
|
|
|
|
|
|
|
|
| EBITDA to Adjusted EBITDA |
|
|
|
|
|
|
|
|
| (excluding non-cash expenses) |
|
|
|
|
|
|
|
|
| EBITDA |
|
| (281 | ) |
|
| 4,254 |
|
| Equity compensation (2) |
|
| 428 |
|
|
| 38 |
|
| Other income (expense) (3) |
|
| (165 | ) |
|
| 65 |
|
| Acquisition expenses (4) |
|
| 712 |
|
|
| - |
|
| Earnout revaluation (5) |
|
| - |
|
|
| (685 | ) |
| Severance and restructuring (6) |
|
| 745 |
|
|
| 352 |
|
| New Monterrey, Mexico facility start-up costs (7) |
|
| 183 |
|
|
| 138 |
|
| PFAS Litigation (8) |
|
| 194 |
|
|
| - |
|
| Adjusted EBITDA |
|
| 1,816 |
|
|
| 4,162 |
|
|
|
|
|
|
|
|
|
|
|
| Adjusted EBITDA Margin |
|
|
|
|
|
|
|
|
| Adjusted EBITDA |
|
| 1,816 |
|
|
| 4,162 |
|
| Divided by net sales |
|
| 38,512 |
|
|
| 33,071 |
|
| Adjusted EBITDA Margin |
|
| 4.7 | % |
|
| 12.6 | % |
|
|
|
|
|
|
|
|
|
|
| Adjusted EBITDA to Adjusted EBITDA excluding FX |
|
|
|
|
|
|
|
|
| Adjusted EBITDA |
|
| 1,816 |
|
|
| 4,162 |
|
| Currency Fluctuation |
|
| 843 |
|
|
| 557 |
|
| Adjusted EBITDA excluding FX |
|
| 2,659 |
|
|
| 4,719 |
|
|
|
|
|
|
|
|
|
|
|
| Adjusted EBITDA Margin to Adjusted EBITDA excluding FX Margin |
|
|
|
|
|
|
|
|
| Adjusted EBITDA excluding FX |
|
| 2,659 |
|
|
| 4,719 |
|
| Divided by net sales |
|
| 38,512 |
|
|
| 33,071 |
|
| Adjusted EBITDA excluding FX Margin |
|
| 6.9 | % |
|
| 14.3 | % |
| 10 |
The financial data above includes non-GAAP financial measures, including EBITDA, adjusted EBITDA, and adjusted EBITDA Margin. Management excludes from EBITDA and adjusted EBITDA all expenses for interest, taxes, depreciation and amortization, and Other Income, which is comprised of interest income and gains (losses) from equity method investments. For adjusted EBITDA management also excludes equity compensation, acquisition-related expenses, severance and restructuring costs, and start-up costs for our Mexican operations. This press release also discusses (i) Adjusted EBITDA margin, which is calculated by dividing Adjusted EBITDA by GAAP net sales; (ii) Adjusted EBITDA excluding FX, which is calculated by subtracting foreign currency losses from Adjusted EBITDA and (iii) Adjusted EBITDA excluding FX margin, which is calculated by dividing Adjusted EBITDA excluding FX by GAAP net sales.
Management excludes these items principally because such charges or benefits are not directly related to the Company’s ongoing core business operations. We use such non-GAAP measures in order to (1) make more meaningful period-to-period comparisons of the Company’s operations, both internally and externally, (2) guide management in assessing the performance of the business, internally allocating resources and making decisions in furtherance of the Company’s strategic plan, and (3) provide investors with a better understanding of how management plans and measures the business. The material limitations to management’s approach include the fact that the charges, benefits and expenses excluded are nonetheless charges, benefits and expenses required to be recognized under GAAP and, in some cases, consume cash which reduces the Company’s liquidity. Management compensates for these limitations primarily by reviewing GAAP results to obtain a complete picture of the Company’s performance and by including a reconciliation of non-GAAP results to GAAP results in its earnings releases. Non-GAAP financial measures are not alternatives for measures of financial performance prepared in accordance with GAAP and may be different from similarly titled non-GAAP measures presented by other companies, limiting their usefulness as comparative measures.
Additional information regarding the adjustments is provided below.
| (1) | Adjustments for Taxes, which consist of the tax effects of the various adjustments that we exclude from our non-GAAP measures, and adjustments related to deferred tax and discrete tax items. Including these adjustments permits more accurate comparisons of the Company's core results with those of its competitors. |
|
|
|
| (2) | Adjustments for Equity Compensation, which consist of non-cash expenses for the grant of equity awards. |
|
|
|
| (3) | Adjustments for Other Income, which consists of interest income and gains/(losses) from Investments accounted for under the equity method of accounting. |
|
|
|
| (4) | Adjustments for acquisition-related expenses included advisory fees, due diligence expenses and legal fees related to the Company’s acquisitions of Eagle Technical Products Limited in the first quarter of fiscal year 2024, Pacific Helmets NZ Limited in the fourth quarter of fiscal year 2024, Jolly Scarpe S.p.A. and Jolly Scarpe Romania S.R.L in the first quarter of fiscal year 2025 and LHD Group Deutschland GmbH (LHD) and its Hong Kong and Australian subsidiaries in the first quarter of fiscal year 2025. |
|
|
|
| (5) | Adjustment for the reduction of the estimated earnout payment related to the Eagle and Pacific Helmets acquisitions. |
|
|
|
| (6) | Adjustments for accrued employee severance and restructuring costs. |
|
|
|
| (7) | Adjustments for costs for our Mexican operations consist of external services and legal fees associated with a property-related dispute with the landlord of our manufacturing site in Monterrey, Mexico. |
|
|
|
| (8) | Adjustment for PFAS Litigation. |
| 11 |
EXHIBIT 99.2

Fiscal Second Quarter 2025 Financial Results Call September 5, 2024 NASDAQ: LAKE
2 Protect Your People® Safe Harbor & Non-GAAP Statements “Safe Harbor” Statement Under the Private Securities Litigation Reform Act of 1995 This presentation contains estimates, predictions, opinions, goals and other “forward-looking statements” as that phrase is defined in the Private Securities Litigation Reform Act of 1995. Such statements include, without limitation, references to the Company's predictions or expectations of future business or financial performance as well as its goals and objectives for future operations, financial and business trends, business prospects, and management's expectations for earnings, revenues, expenses, inventory levels, capital levels, liquidity levels, or other future financial or business performance, strategies or expectations, including without limitation the expected benefits of the Pacific, Jolly and LHD acquisitions and our M&A strategy. All statements, other than statements of historical facts, which address Lakeland's expectations of sources or uses for capital, or which express the Company's expectation for the future with respect to financial performance or operating strategies can be identified as forward-looking statements. Forward-looking statements involve risks, uncertainties and assumptions as described from time to time in press releases and Forms 8-K, presentations, registration statements, quarterly and annual reports and other reports and filings filed with the Securities and Exchange Commission or made by management. As a result, there can be no assurance that Lakeland's future results will not be materially different from those described herein as "believed," "projected," "planned," "intended," "anticipated," "can," "estimated" or "expected," or other words which reflect the current view of the Company with respect to future events. We caution readers that these forward-looking statements speak only as of the date hereof. With respect to our guidance for revenue and Adjusted EBITDA, such metrics are subject to significant business, economic and competitive uncertainties and contingencies, many of which are beyond the control of the Company and its management; actual results will vary, and those variations may be material. The Company hereby expressly disclaims any obligation or undertaking to release publicly any updates or revisions to any such statements to reflect any change in the Company's expectations or any change in events, conditions or circumstances on which such statement is based, except as may be required by law. Non-GAAP Financial Measures To supplement its consolidated financial statements, which are prepared and presented in accordance with Generally Accepted Accounting Principles (GAAP), the Company uses the following non-GAAP financial measures in this presentation: Adjusted EBITDA and Adjusted EBITDA margin, Adjusted EBITDA excluding FX, and Adjusted EBITDA excluding FX margin. The presentation of this financial information is not intended to be considered in isolation or as a substitute for, or superior to, the financial information prepared and presented in accordance with GAAP. The Company uses these non-GAAP financial measures for financial and operational decision-making and as a means to evaluate period-to-period comparisons. The Company believes that these measures provide useful information about operating results, enhance the overall understanding of past financial performance and future prospects, and allow for greater transparency with respect to key metrics used by management in its financial and operational decision-making. The non-GAAP financial measures used by the Company in this presentation may be different from the methods used by other companies. For more information on the non-GAAP financial measures, please see the Reconciliation of GAAP to non-GAAP Financial Measures tables in this presentation. These accompanying tables include details on the GAAP financial measures that are most directly comparable to non-GAAP financial measures and the related reconciliations between these financial measures.
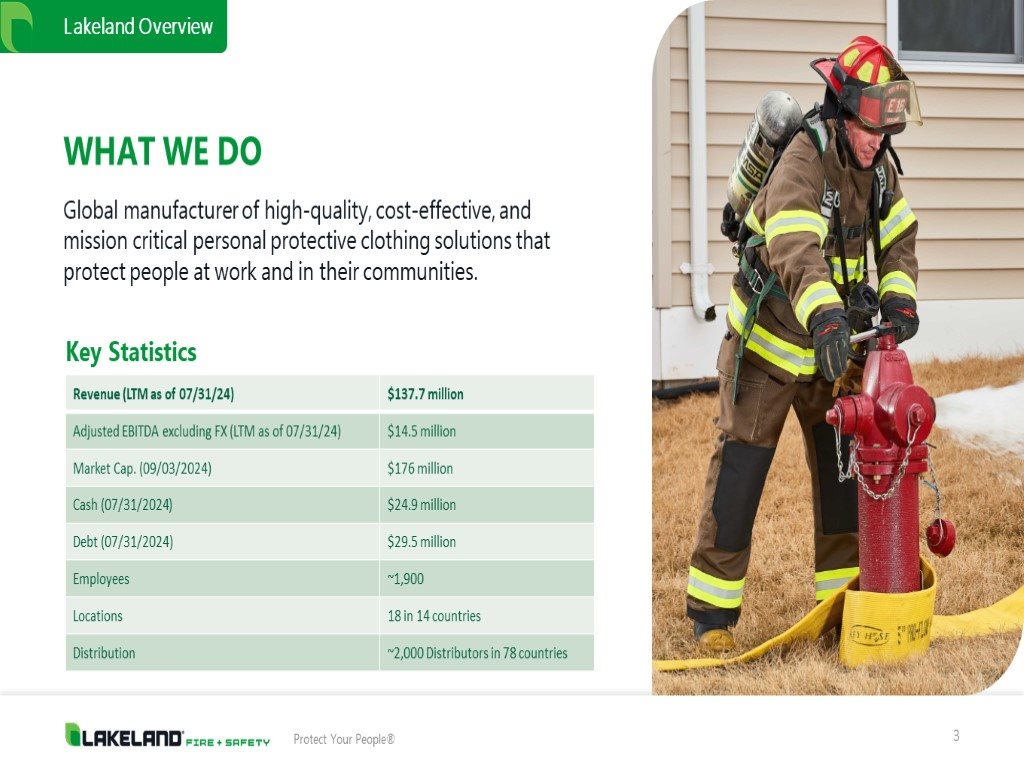
3 Protect Your People® Lakeland Overview WHAT WE DO Global manufacturer of high-quality, cost-effective, and mission critical personal protective clothing solutions that protect people at work and in their communities. Key Statistics
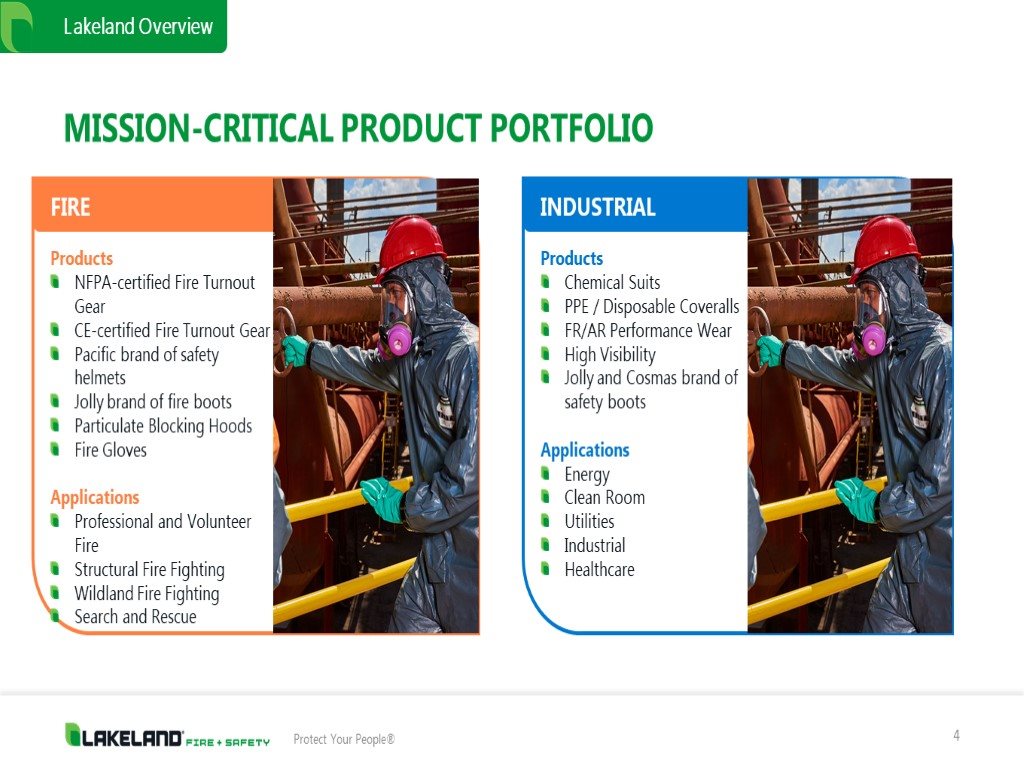
4 Protect Your People® Lakeland Overview MISSION-CRITICAL PRODUCT PORTFOLIO
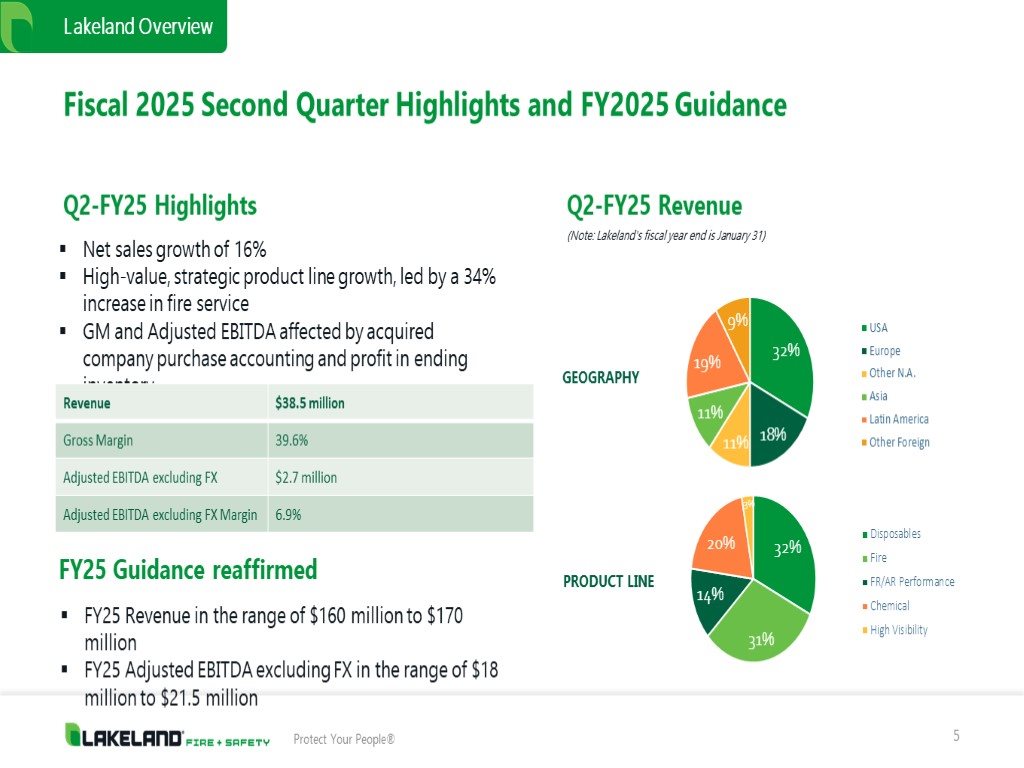
5 Protect Your People® Lakeland Overview Fiscal 2025 Second Quarter Highlights and FY2025 Guidance FY25 Revenue in the range of $160 million to $170 million FY25 Adjusted EBITDA excluding FX in the range of $18 million to $21.5 million FY25 Guidance reaffirmed Q2-FY25 Revenue (Note: Lakeland's fiscal year end is January 31) Net sales growth of 16% High-value, strategic product line growth, led by a 34% increase in fire service GM and Adjusted EBITDA affected by acquired company purchase accounting and profit in ending inventory Q2-FY25 Highlights
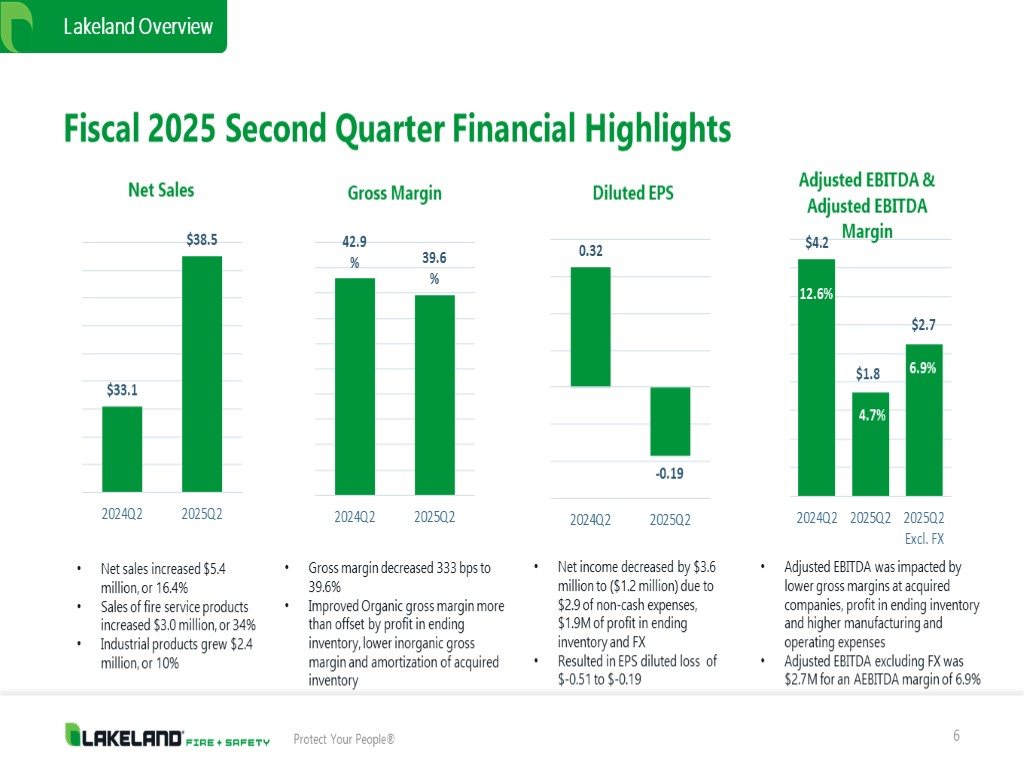
6 Protect Your People® Lakeland Overview Fiscal 2025 Second Quarter Financial Highlights Net sales increased $5.4 million, or 16.4% Sales of fire service products increased $3.0 million, or 34% Industrial products grew $2.4 million, or 10% Gross margin decreased 333 bps to 39.6% Improved Organic gross margin more than offset by profit in ending inventory, lower inorganic gross margin and amortization of acquired inventory Net income decreased by $3.6 million to ($1.2 million) due to $2.9 of non-cash expenses, $1.9M of profit in ending inventory and FX Resulted in EPS diluted loss of $-0.51 to $-0.19 Adjusted EBITDA was impacted by lower gross margins at acquired companies, profit in ending inventory and higher manufacturing and operating expenses Adjusted EBITDA excluding FX was $2.7M for an AEBITDA margin of 6.9% Net Sales Gross Margin Diluted EPS Adjusted EBITDA & Adjusted EBITDA Margin
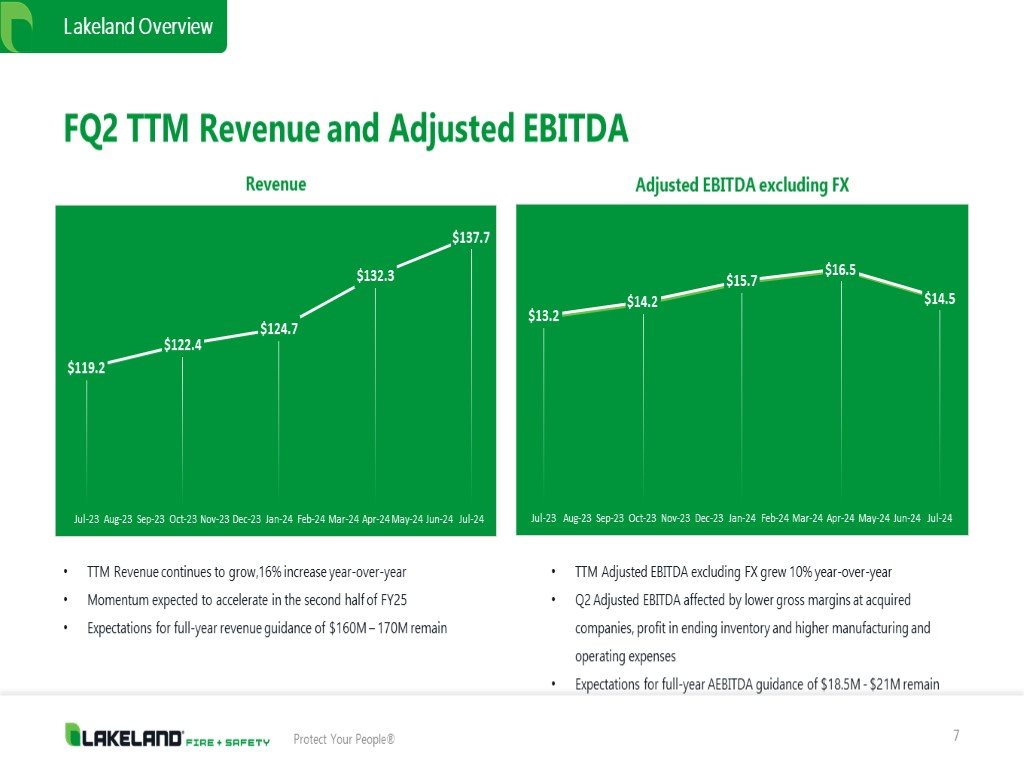
7 Protect Your People® Lakeland Overview FQ2 TTM Revenue and Adjusted EBITDA TTM Revenue continues to grow,16% increase year-over-year Momentum expected to accelerate in the second half of FY25 Expectations for full-year revenue guidance of $160M – 170M remain Revenue Adjusted EBITDA excluding FX TTM Adjusted EBITDA excluding FX grew 10% year-over-year Q2 Adjusted EBITDA affected by lower gross margins at acquired companies, profit in ending inventory and higher manufacturing and operating expenses Expectations for full-year AEBITDA guidance of $18.5M - $21M remain
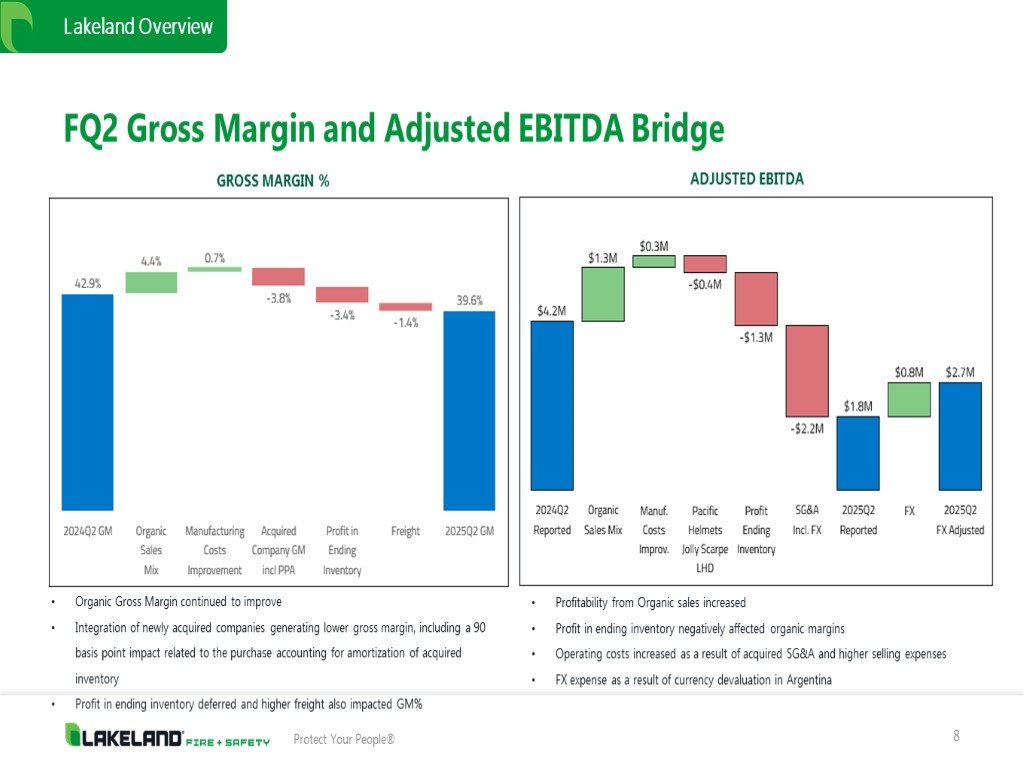
8 Protect Your People® Lakeland Overview FQ2 Gross Margin and Adjusted EBITDA Bridge GROSS MARGIN % ADJUSTED EBITDA Organic Gross Margin continued to improve Integration of newly acquired companies generating lower gross margin, including a 90 basis point impact related to the purchase accounting for amortization of acquired inventory Profit in ending inventory deferred and higher freight also impacted GM% Profitability from Organic sales increased Profit in ending inventory negatively affected organic margins Operating costs increased as a result of acquired SG&A and higher selling expenses FX expense as a result of currency devaluation in Argentina
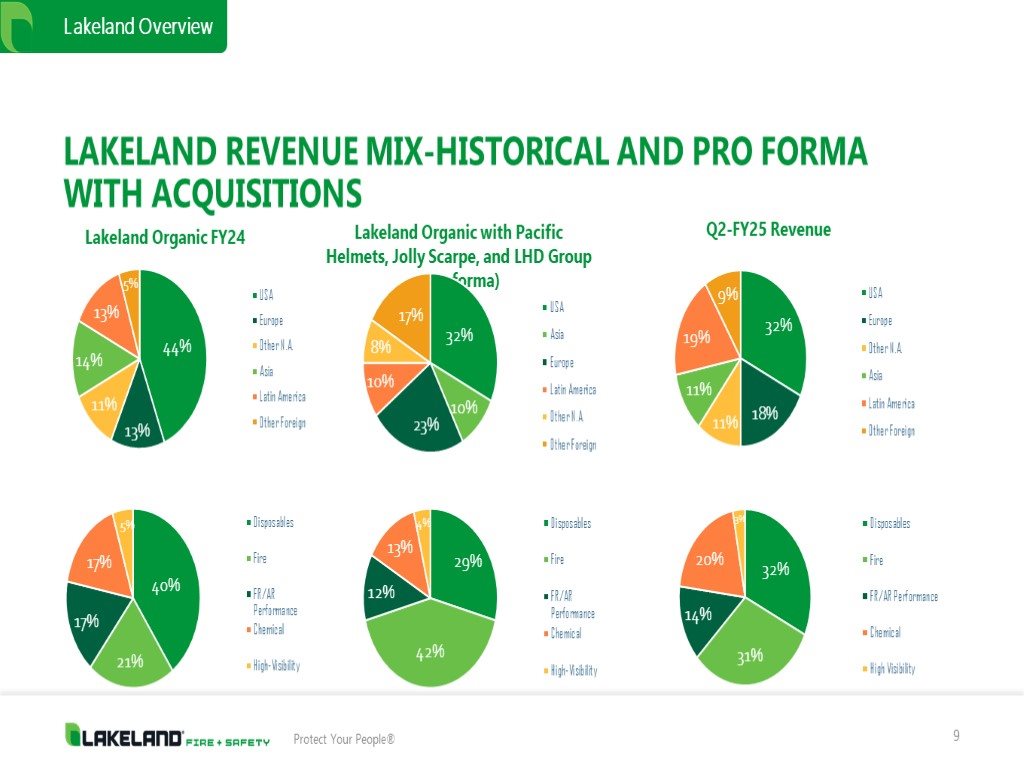
9 Protect Your People® LAKELAND REVENUE MIX-HISTORICAL AND PRO FORMA WITH ACQUISITIONS Lakeland Organic FY24 Lakeland Organic with Pacific Helmets, Jolly Scarpe, and LHD Group (pro forma) Lakeland Overview Q2-FY25 Revenue
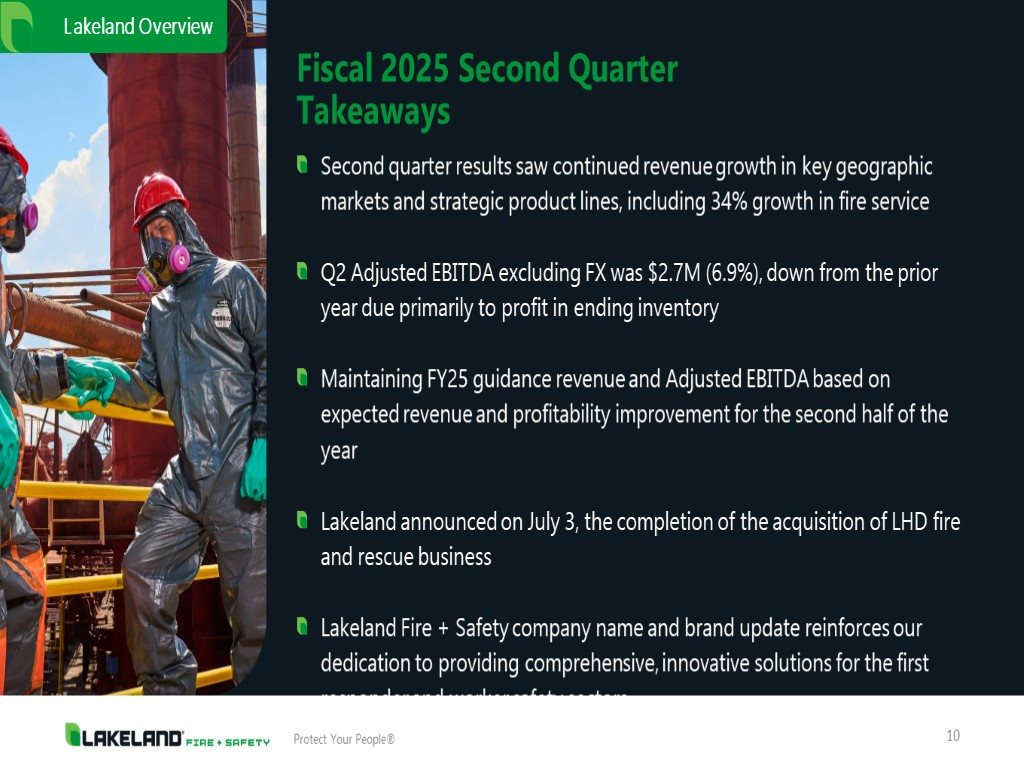
Second quarter results saw continued revenue growth in key geographic markets and strategic product lines, including 34% growth in fire service Q2 Adjusted EBITDA excluding FX was $2.7M (6.9%), down from the prior year due primarily to profit in ending inventory Maintaining FY25 guidance revenue and Adjusted EBITDA based on expected revenue and profitability improvement for the second half of the year Lakeland announced on July 3, the completion of the acquisition of LHD fire and rescue business Lakeland Fire + Safety company name and brand update reinforces our dedication to providing comprehensive, innovative solutions for the first responder and worker safety sectors 10 Protect Your People® Lakeland Overview Fiscal 2025 Second Quarter Takeaways

APPENDIX 11
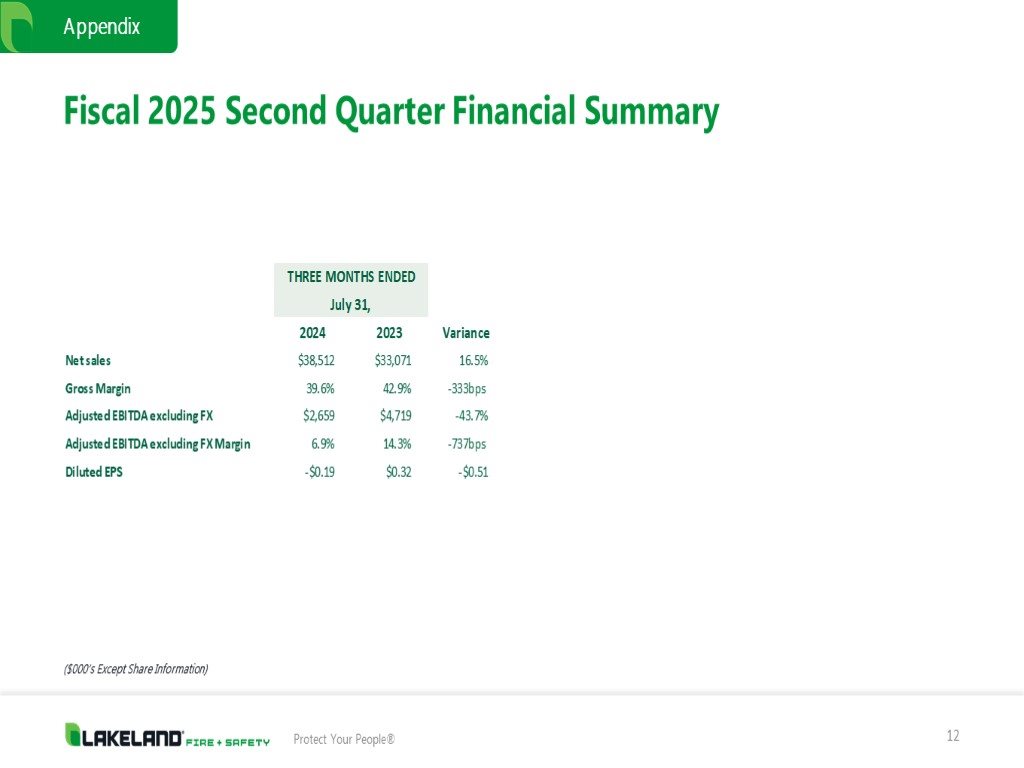
12 Protect Your People® Appendix Fiscal 2025 Second Quarter Financial Summary ($000’s Except Share Information)
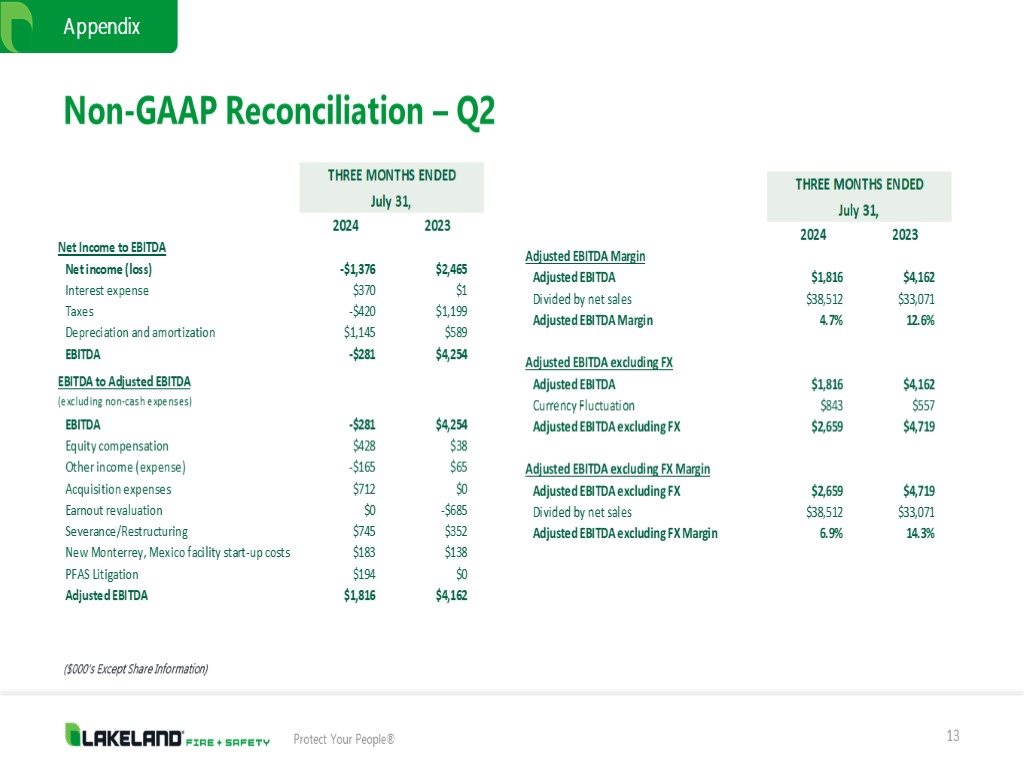
13 Protect Your People® Appendix Non-GAAP Reconciliation – Q2 ($000’s Except Share Information)
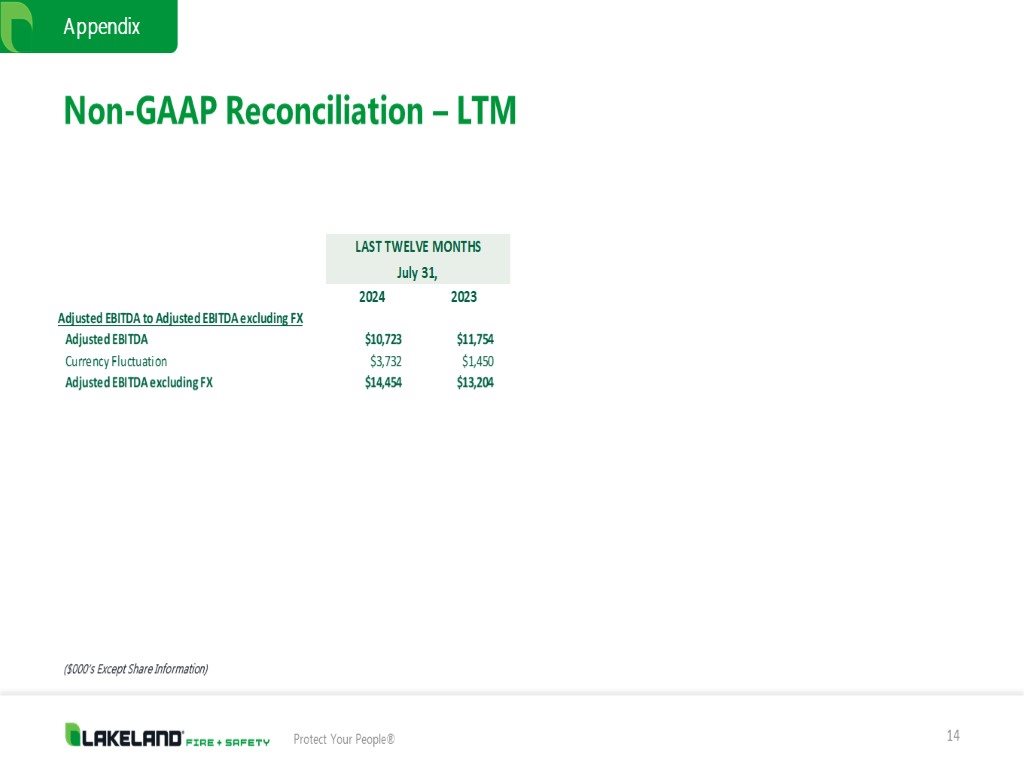
14 Protect Your People® Appendix Non-GAAP Reconciliation – LTM ($000’s Except Share Information)