UNITED STATES
SECURITIES AND EXCHANGE COMMISSION
Washington, D.C. 20549
FORM 10-K
(Mark One)
☒ ANNUAL REPORT PURSUANT TO SECTION 13 OR 15(d) OF THE SECURITIES EXCHANGE ACT OF 1934
For the fiscal year ended December 31, 2023
☐ TRANSITION REPORT PURSUANT TO SECTION 13 OR 15(d) OF THE SECURITIES EXCHANGE ACT OF 1934
For the transition period from ______ to ______
Commission file number: 001-41320
Idaho Strategic Resources, Inc. |
(Name of small business issuer in its charter) |
Idaho |
|
82-0490295 |
(State or other jurisdiction of incorporation or organization) |
|
(I.R.S. employer identification No.) |
201 N. Third Street, Coeur d’Alene, ID 83814
(Address of principal executive offices) (zip code)
(208) 625-9001
Registrant’s telephone number, including area code
SECURITIES REGISTERED PURSUANT TO SECTION 12(b) OF THE ACT:
Title of Each Class |
|
Trading Symbol(s) |
|
Name of Each Exchange on Which Registered |
Common Stock, No par value |
|
IDR |
|
NYSE American |
Indicate by check mark if the registrant is a well-known seasoned issuer, as defined in Rule 405 of the Securities Act. Yes ☐ No ☒
Indicate by check mark if the registrant is not required to file reports pursuant to Section 13 or Section 15(d) of the Act. Yes ☐ No ☒
Indicate by check mark whether the issuer (1) filed all reports required to be filed by Section 13 or 15(d) of the Securities Exchange Act of 1934 during the past 12 months (or for such shorter period that the registrant was required to file such reports), and (2) has been subject to such filing requirements for the past 90 days. Yes ☒ No ☐
Indicate by check mark whether the registrant has submitted electronically and posted on its corporate website, if any, every Interactive Data File required to be submitted and posted pursuant to Rule 405 of Regulation S-T during the preceding 12 months (or for such shorter period that the registrant was required to submit and post such files). Yes ☒ No ☐
Indicate by check mark if disclosure of delinquent filers in response to Item 405 of Regulation S-K is not contained herein, and no disclosure will be contained, to the best of registrant’s knowledge, in definitive proxy or information statements incorporated by reference in Part III of this Form 10-K or any amendment to this Form 10-K. ☒
Indicate by check mark whether the registrant is a large accelerated filer, an accelerated filer, a non-accelerated filer, or a smaller reporting company. See definitions of “large accelerated filer,” “accelerated filer” and “small reporting company” in Rule 12b-2 of the Exchange Act.
Large accelerated filer |
☐ |
Accelerated filer |
☐ |
Non-accelerated filer |
☒ |
Smaller reporting company |
☒ |
|
|
Emerging Growth Company |
☐ |
Indicate by check mark whether the registrant is a shell company as defined in Rule 12b-2 of the Exchange Act Yes ☐ No ☒
Indicate by check mark whether the registrant has filed a report on and attestation to its management’s assessment of the effectiveness of its internal control over financial reporting under Section 404(b) of the Sarbanes-Oxley Act (15 U.S.C. 7262(b)) by the registered public accounting firm that prepared or issued its audit report. Yes ☐ No ☒
Indicate by check mark whether the filings included in this filing by the registrant as defined in Rule 12b of the Exchange Act include any corrections of an error to previously issued financial statements Yes ☐ No ☒
Indicate by check mark whether any of those corrections (if any) are restatements that required a recovery analysis of incentive-based compensation received by any of the registrant’s executive officers during the relevant recovery period pursuant to §240.10D-1(b) Yes ☐ No ☒
The aggregate market value of all common stock held by non-affiliates of the registrant, based on the average of the bid and ask prices on June 30, 2023 was $57,230,152.
On March 1, 2024 there were 12,559,878 shares of the registrant’s Common Stock outstanding.
TABLE OF CONTENTS
| 2 |
| Table of Contents |
FORWARD-LOOKING STATEMENTS
This Annual Report on Form 10-K and the exhibits attached hereto contain “forward-looking statements” within the meaning of the Private Securities Litigation Reform Act of 1995, as amended. All statements other than statements of historical fact are forward-looking statements for purposes of federal and state securities laws, including statements about anticipated future operating and financial performance, financial position and liquidity, growth opportunities and growth rates, pricing plans, acquisition and divestiture opportunities, business prospects, strategic alternatives, business strategies, regulatory and competitive outlook, investment and expenditure plans, financing needs and availability and other similar forecasts and statements of expectation and statements of assumptions underlying any of the foregoing. The words “aims,” “anticipates,” “believes,” “could,” “estimates,” “expects,” “intends,” “may,” “plans,” “projects,” “seeks,” “should” and variations of these words and similar expressions are generally intended to identify these forward-looking statements. These forward-looking statements are inherently subject to significant business, economic and competitive uncertainties and contingencies, many of which are beyond Idaho Strategic Resources, Inc. (“IDR”)’s control. In addition, these forward-looking statements are subject to assumptions with respect to future business strategies and decisions that are subject to change.
Forward-looking statements by us are based on estimates, projections, beliefs and assumptions of management and are not guarantees of future performance. Such forward-looking statements may be contained in this Annual Report on Form 10-K under Item 1 Description of the Business, Item 1A Risk Factors, and Item 7 Management’s Discussion and Analysis of Financial Conditions and Results of Operations, or in our Current Reports on Form 8-K, among other places. Some of other risk factors include, but are not limited to, the following:
|
· |
adverse effects of climate changes or natural disasters; |
|
· |
adverse effects of global or regional pandemic disease spread or other crises; |
|
· |
global economic and capital market uncertainties; |
|
· |
the speculative nature of gold or mineral exploration, including risks of diminishing quantities or grades of qualified resources; |
|
· |
operational or technical difficulties in connection with exploration, processing or mining activities; |
|
· |
costs, hazards and uncertainties associated with precious metal based activities, precious metal exploration, resource development, economic feasibility assessment and cash generating mineral production; |
|
· |
contests over our title to properties; |
|
· |
potential dilution to our shareholders from our stock issuances, recapitalization and balance sheet restructuring activities; |
|
· |
potential inability to comply with applicable government regulations or law; |
|
· |
adoption of or changes in legislation or regulations adversely affecting our businesses; |
|
· |
permitting constraints or delays; |
|
· |
ability to achieve the benefits of business opportunities that may be presented to, or pursued by, us, including those involving the ability to successfully identify, finance, complete and integrate acquisitions, joint ventures, strategic alliances, business combinations, asset sales, and investments that we may be party to in the future; |
|
· |
changes in the United States or other monetary or fiscal policies or regulations; |
|
· |
interruptions in our production capabilities due to capital constraints; |
|
· |
equipment failures; |
|
· |
fluctuation of prices for gold or certain other commodities (such as rare earth elements, water, diesel, gasoline and alternative fuels and electricity); |
|
· |
changes in generally accepted accounting principles; |
|
· |
adverse effects of war, mass shooting, terrorism and geopolitical events; |
|
· |
potential inability to implement our business strategies; |
|
· |
potential inability to grow revenues; |
|
· |
potential inability to attract and retain key personnel; |
|
· |
interruptions in delivery of critical supplies, equipment and raw materials due to credit or other limitations imposed by vendors; |
|
· |
assertion of claims, lawsuits and proceedings against us; |
|
· |
potential inability to satisfy debt and lease obligations; |
|
· |
potential inability to maintain an effective system of internal controls over financial reporting; and |
|
· |
work stoppages or other labor difficulties. |
Occurrence of such events or circumstances could have a material adverse effect on our business, financial condition, results of operations or cash flows, or the market price of our securities. All subsequent written and oral forward-looking statements by or attributable to us or persons acting on our behalf are expressly qualified in their entirety by these factors. Should one or more of these risks or uncertainties materialize, or should underlying assumptions prove incorrect, actual results may vary materially from those anticipated, believed, estimated, or expected. We caution readers not to place undue reliance on any such forward-looking statements, which speak only as of the date made. Except as may be required by securities or other law, we undertake no obligation to publicly update or revise any forward-looking statements, whether as a result of new information, future events, or otherwise.
We qualify all the forward-looking statements contained in this Annual Report by the foregoing cautionary statements.
| 3 |
| Table of Contents |
GLOSSARY OF SIGNIFICANT MINING TERMS
Ag-Silver.
Au-Gold.
Alluvial-Adjectivally used to identify rocks or minerals deposited over time by moving water.
Argillites-Metamorphic rock containing clay minerals.
Arsenopyrite-An iron-arsenic sulfide. Common constituent of gold mineralization.
Ball Mill-A large rotating cylinder usually filled to about 45% of its total volume with steel grinding balls. The mill rotates and crushed rock is fed into one end and discharged through the other. The rock is pulverized into small particles by the cascading and grinding action of the balls.
Bedrock-Solid rock underlying overburden.
Cu-Copper.
CIL-A standard gold recovery process involving the leaching with cyanide in agitated tanks with activated carbon. CIL means “carbon-in-leach.”
Crosscut-A nominally horizontal mine passageway, generally driven at right angles to the strike of a vein.
Dip-Angle made by an inclined surface with the horizontal, measured perpendicular to strike.
Deposit-A mineral deposit is a mineralized body that has been intersected by sufficient closely spaced drill holes or underground sampling to support sufficient tonnage and average grade(s) of metal(s) to warrant further exploration or development activities.
Drift-A horizontal mine opening driven on the vein. Driving is a term used to describe the excavation of a mine passageway.
Exploration Stage-As defined by the United States Securities and Exchange Commission (“SEC”)-includes all issuers engaged in the search for mineral deposits (reserves), which are not in the production stage.
Fault-A fracture in the earth’s crust accompanied by a displacement of one side of the fracture with respect to the other and in a direction parallel to the fracture.
Flotation-A physiochemical process for the separation of finely divided solids from one another. Separation of these (dissimilar) discrete solids from each other is affected by the selective attachment of the particle surface to gas bubbles.
GPT-grams per metric tonne.
Galena-A lead sulfide mineral. The most important lead mineral in the Coeur d’Alene Mining District.
Grade-A term used to assign the concentration of metals per unit weight of ore. An example-ounces of gold per ton of ore (opt). One troy ounce per short ton is 34.28 parts per million or 34.28 grams per metric tonne.
Mill-A general term used to denote a mineral processing plant.
Mineralization-The presence of minerals, usually of potential economic significance, in a specific area or geologic formation.
Mineral Reserve-An estimate of tonnage and grade or quality of indicated and measured mineral resources that, in the opinion of the qualified person, can be the basis of an economically viable project. More specifically, it is the economically mineable part of a measured or indicated mineral resource, which includes diluting materials and allowances for losses that may occur when the material is mined or extracted.
Mineral Resource-A concentration or occurrence of material of economic interest in or on the Earth’s crust in such form, grade or quality, and quantity that there are reasonable prospects for economic extraction. A mineral resource is a reasonable estimate of mineralization, taking into account relevant factors such as cut-off grade, likely mining dimensions, location or continuity, that, with the assumed and justifiable technical and economic conditions, is likely to, in whole or in part, become economically extractable. It is not merely an inventory of all mineralization drilled or sampled.
| 4 |
| Table of Contents |
Net Smelter Return (“NSR”)-The Net Smelter Return from a processed ore is the value recouped from the mineral products less the costs associated with smelting, refining, and transport to the smelter. The NSR specifically does not permit the deduction of mining and milling costs.
Ore-A mineral or aggregate of minerals that can be mined and treated at a profit. A large quantity of ore that is surrounded by waste or sub-ore material is called an orebody.
Patented Claim-A mineral claim where the title has been obtained from the U.S. federal government through the patent process of the 1872 Mining Law. The owner of the patented claim is granted title to the surface and mineral rights.
Production Stage-As defined by the SEC-includes all issuers engaged in the exploitation of a mineral deposit (reserve).
Proven Reserve-The economically mineable part of a measured mineral resource and can only result from conversion of a measured mineral resource.
Pyrite-An iron sulfide mineral that usually has no commercial value but is commonly associated with mineral deposits of gold, copper, and other metals.
Quartz-Crystalline silica (SiO2). An important rock-forming and gangue material in veins or other types of mineral deposits.
Quartzites-Metamorphic rock containing significant amounts of quartz.
Raise-An underground opening driven upward, generally on the vein.
Ramp-An underground opening usually driven downward, but not always, to provide access to an orebody for rubber-tired equipment such as loaders and trucks. Typically, ramps are inclined at a slope grade of approximately 15%.
Rare Earth Elements-Comprised of 15 elements that range in atomic number from 57 (lanthanum) to 71 (lutetium) on the periodic table. Most of the rare earth elements are not as rare as the group’s name suggests. Although rare earth elements are relatively abundant in the Earth’s crust, they are rarely concentrated into mineable ore deposits. These elements are in demand because they are essential for a diverse and expanding array of high-technology applications and emerging alternative energy uses.
Royalty or NSR Royalty-A mineral royalty is a percentage of the value extracted from an ore that is paid to an interest holding party, usually a claim owner. The NSR Royalty is calculated based on the value of the processed ore after deducting the costs of smelting, refining, and transport to a smelter. However, the cost of mining and milling is not deducted. Typical NSR Royalty rates in the United States are on the order of 1–5%.
Shoot-A body of ore, usually of elongated form, extending downward or upward in a vein.
Stope-An underground void created by the mining of ore.
Strike-The bearing or azimuth of the line created by the intersection of a horizontal plane with an inclined rock strata, vein or body.
Tellurium-Relatively rare chemical element found with gold and silver that can form minerals known as tellurides.
Tetrahedrite-Sulfosalt mineral containing copper, antimony, and silver.
Vein-A zone or body of mineralized rock lying within boundaries separating it from neighboring wallrock. A mineralized zone having a more or less regular development in length, width and depth to give it a tabular form and commonly inclined at a considerable angle to the horizontal.
Unpatented Claim-A mineral claim staked on United States Public Domain (“USPD”) that is open for mineral entry. Unpatented lode claims can be no more than 1,500 feet long by 600 feet wide. The claimant owns the mineral rights, but does not own the surface, which is USPD. Any exploration or mining on the claim must first be submitted in a plan of operations for approval to the appropriate federal land management entity.
Wallrock-Usually barren rock surrounding a vein.
| 5 |
| Table of Contents |
PART I
ITEM 1. DESCRIPTION OF THE BUSINESS
History and Organization
Idaho Strategic Resources, Inc. (“the Company”, “Idaho Strategic”, “IDR”, “our”, “us”, or “we”) was incorporated under the laws of the State of Idaho on July 18, 1996. The Company’s head office and registered records office is located at 201 N. 3rd St. Coeur d’Alene, ID 83814. On December 6, 2021, the Company changed its name to Idaho Strategic Resources, Inc. (formerly New Jersey Mining Company (“NJMC”)) to better reflect its corporate focus, Idaho-based operations and being domiciled in Idaho. IDR is one of the few resource-based companies (public or private) possessing the combination of officially recognized U.S. domestic rare earth element properties (in Idaho) and Idaho-based gold production located in an established mining community.
Any Bankruptcy, Receivership or Similar Proceedings
There have been no bankruptcy, receivership, or similar proceedings.
Any Material Reclassification, Merger, Consolidation, or Purchase or Sale of a Significant Amount of Assets Not in the Ordinary Course of Business.
There have been no material reclassifications, mergers, consolidations, purchases, or sales not in the ordinary course of business for the past three years.
General Description of the Business
Idaho Strategic produces gold at the Golden Chest Mine located in the Murray Gold Belt (“MGB”) area of the world-class Coeur d’Alene Mining District, north of the prolific Silver Valley. With over 7,000 acres of patented and unpatented land, the Company has the largest private land position in the area following its consolidation of the Murray Gold Belt for the first time in over 100-years.
The Company is an established gold producer, with surface and underground mining operations at its 100-percent owned Golden Chest Mine and conducts milling operations at its majority-owned New Jersey Mill. In addition to gold and gold production, the Company maintains an important strategic presence in the U.S. Critical Minerals sector, specifically focused on the more “at-risk” rare earth elements (“REE”). The Company’s Diamond Creek and Mineral Hill REE properties are included the U.S. national REE inventory as listed in United States Geologic Survey (“USGS”), Idaho Geologic Survey (“IGS”) and Department of Energy (“DOE”) publications. Both projects are in central Idaho and participating in the USGS Earth MRI program, with the Diamond Creek Project also participating in the Idaho Department of Commerce’s Idaho Global Entrepreneurial Mission (“IGEM”) program.
The Company focuses its exploration and production efforts in historical mining districts located within the state of Idaho. Its portfolio of mineral properties includes:
|
· |
The Golden Chest Mine, a producing gold mine located in the Murray Gold Belt of North Idaho; |
|
· |
Approximately 1,500 acres of patented mineral property and over 5,000 acres of nearby and adjacent un-patented mineral property. These holdings are considered early-stage exploration properties and located within the MGB, many of which include historic gold mines and known gold mineralization; |
|
· |
REE Projects–located in the Idaho Rare Earth Element-Thorium (“REE-Th”) Belt near Salmon, Idaho. Projects include; |
|
o |
Lemhi Pass – Significant land package with high value REE potential–USGS also recognized as the #1 thorium prospect in the U.S. |
|
o |
Diamond Creek – Nationally recognized rare earth prospects in the US |
|
o |
Mineral Hill – Nationally recognized and high grade REE property in the northern portion of the Idaho REE-Th Belt |
|
· |
A significant portfolio of early-stage exploration properties in Central Idaho, primarily in the Elk City area. |
In addition to its portfolio of exploration, pre-development, and producing properties, the Company is also the manager and majority-owner of the New Jersey Mill, which currently processes ore from the Golden Chest Mine. The New Jersey Mill can process gold and silver ore through a 360-tonne per day flotation plant.
The Company has focused its efforts on expanding underground development and production at the Golden Chest Mine and assembled its extensive land holdings within the MGB area. With all debt associated with the start-up of operations behind it, the Company significantly increased its exploration and expansion activities in the Murray Gold Belt. This progress, combined with the existing infrastructure and development, has created a solid foundation of real estate holdings, and a tangible base of value regardless of market cycles.
| 6 |
| Table of Contents |
Competitive Business Conditions
While there has been a market for gold and precious metals historically, the Company competes on several different fronts within the minerals exploration industry. The Company competes with other junior mining companies for the capital necessary to sustain its exploration and development programs. IDR has focused its gold operations at and near the Golden Chest Mine, however if it chose to expand to other geographic areas it may compete with other mining companies for exploration properties and/or mining assets. The Company has been successful in resuming operations at the New Jersey Mill, consolidating 100% ownership of the Golden Chest Mine, and assembling one of the largest rare earth element landholdings in the US. In October 2016 production at the Golden Chest resumed with the Company as the sole owner and operator.
Generally, the Company is subject to economic conditions and risks inherent to the mineral industry. A primary risk of mineral exploration is the low probability of finding a major ore deposit. The Company attempts to mitigate this risk by focusing its efforts in areas known to host significant mineral deposits, and by relying on its experienced management team to drive analysis, evaluation, and acquisition of properties that it feels have a higher-than-average probability of success. In addition to deal essentials, such as cost, terms, timing, and market considerations, the Company’s process of property acquisition involves screening target properties based on geological, economic, engineering, environmental, and metallurgical factors. In all its operations the Company competes for skilled labor within the mining industry.
The risks associated with the Company’s mining and milling operations include other risks typical of the mining industry, such as: operational effectiveness in the processing plant that could result in lower recovery of the economic metals, mechanical failure of equipment that could increase costs or decrease efficacy, ability to hire and retain qualified operators, and risks that the mining operations are unable to economically extract material due to lower grade material, ground or slope failures or other development challenges that can increase costs. The Company manages these risks with engineering and geologic analysis, detailed mine planning, a preventive maintenance program, and installing experienced and technically proficient management.
Another significant risk in the mining industry is the price of metals such as gold and silver. If the prices of these metals were to fall substantially, it could lead to a loss of investor interest in the mining sector, which could make it more difficult to raise the capital necessary for the Company to move exploration and development plans forward, if needed.
Customer Dependence and Product Distribution
The Company sold all its flotation gold concentrate to H&H Metals Corporation (“H&H Metals” or “H&H”) of New York, NY which accounted for 99% of gold sales in 2023. The remaining gold sales were gold doré which was sold to a western U.S. refinery. H&H Metals is also an IDR shareholder. Although not expected, if H&H Metals could not purchase the gold concentrate, it is anticipated another customer could be found readily as the flotation gold concentrate is a high value concentrate with minor deleterious element content.
The Company ships its gold concentrate overseas to smelters in South Korea and Japan. The global shipping challenges due to Covid-19 were largely remedied in 2022 and the Company was able to ship a substantial portion of its concentrate inventory reducing the amount of inventory stored at the New Jersey Mill, returning inventory to near pre-pandemic levels.
Effect of Existing or Probable Governmental Regulations on the Business
The mining business is subject to extensive federal, state, and local laws and regulations governing development, production, labor standards, occupational health, waste disposal, the use of toxic substances, environmental regulations, mine safety and other matters. The Company is subject to potential risks and liabilities occurring as a result of mineral exploration and production. Insurance against environmental risk (including potential liability for pollution or other hazards as a result of the disposal of waste products occurring from exploration and production) is not generally available to the Company (or to other companies in the minerals industry) at a reasonable price. To the extent that the Company becomes subject to environmental liabilities, the satisfaction of any such liabilities would reduce funds otherwise available to the Company and could have a material adverse effect on the Company. Laws and regulations intended to ensure the protection of the environment are constantly changing and are generally becoming more restrictive.
All operating and exploration plans have been made in consideration of existing governmental regulations. Regulations that most affect operations are related to surface water quality and access to public lands. An approved plan of operations (“POO”) and a financial bond are usually required before exploration or mining activities can be conducted on public land that is administered by the United States Bureau of Land Management (“BLM”) or United States Forest Service (“USFS”).
| 7 |
| Table of Contents |
The New Jersey Mine, Golden Chest Mine, and other nearby properties are part of the expanded Bunker Hill Superfund Site. Current plans for expanded cleanup do not include any IDR projects. There is no known evidence that previous operations at the New Jersey Mine (prior to 1910) caused any groundwater or surface water pollution or discharged any tailings into the South Fork of the Coeur d’Alene River; however, it is possible that such evidence could surface. Should such a liability emerge for the Company, its exposure would likely be to clean up or cover old mine tailings that may have washed downstream from upstream mining operations. There are no mineral processing tailings deposits at the Golden Chest Mine. However, at least two old adits have small water discharges. The Company could conceivably be required to conduct cleanup operations at its own expense; however, the Environmental Protection Agency’s (“EPA”) Record of Decision for the Bunker Hill Mining and Metallurgical Complex Operating Unit 3 does not include any cleanup activities at the Company’s projects. Recently, the EPA has proposed a new cleanup plan that greatly increases the number of historic mine sites to be reclaimed, however, the plan has not been approved. IDR has not received any notifications that it could be liable for any environmental cleanup.
Costs and Effects of Compliance with Environmental Laws (Federal, State and Local)
No major Federal permits are required for the Golden Chest and New Jersey Mines because the operations are on private land and there are no process discharges to surface waters. However, any exploration program conducted by the Company on unpatented mining claims, usually administered by the BLM or USFS, requires a POO to be submitted. The Company’s exploration programs on public land can be delayed for significant periods of time (one to two years) because of the slow permitting process applied by the USFS. The Company believes that such permitting delays are caused by insufficient manpower, complicated regulations, competing priorities, and sympathy for environmental groups who oppose all mining projects.
The Company is also subject to the rules of the U.S. Department of Labor, Mine Safety and Health Administration (“MSHA”) for the New Jersey Mill and Golden Chest Mine operations. When an underground mine or mill is operating, MSHA performs a series of regular quarterly inspections to verify compliance with mine safety laws and can assess financial penalties for violations of MSHA regulations. A typical mine citation order for a violation that is not significant or substantial is about $200.
The New Jersey Mill has two State of Idaho permits. The first is a permit for its tailings storage facility with the Idaho Department of Water Resources (“IDWR”). The Company submitted an engineered design for the tailings storage facility and constructed a buttress and Phase 5 lift in 2022, and the Phase 6 lift in 2023. IDWR inspected and approved the tailings storage facility for tailings disposal in Phase 5 and Phase 6. The Company posted a reclamation bond of $107,000 for the tailings storage facility. An Idaho Cyanidation Permit was granted for the New Jersey Mill on October 10, 1995 [No. CN-000027]. Construction of the concentrate leach plant at the New Jersey Mill was completed in November of 2007. The Idaho Cyanidation permit requires quarterly surface water and groundwater monitoring. In 2022 the Company submitted a Closure Plan for the cyanidation permit since it no longer uses the cyanidation process. The plan is under review the by the Idaho Department of Environmental Quality (“IDEQ”). The plan calls for continued surface and groundwater monitoring for as long as tailings are deposited in the tailings storage facility and for a post-closure period of five years. IDR estimates the cost of water-monitoring associated with the concentrate leach plant to be approximately $10,000 per year. The New Jersey Mill also has an EPA general stormwater permit.
The Idaho Department of Lands (“IDL”) approved a surface mining reclamation plan for the New Jersey Mine in 1993. The plan calls for grading of steep fill slopes and planting of vegetation on the area disturbed by the open pit mine. IDR pays an annual reclamation fee of $133 to IDL for surface disturbance associated with the New Jersey Mine open pit. The Company has estimated its costs to reclaim the New Jersey Mine and Mill site to be $117,000.
The Company submitted a reclamation plan to IDL for its past open pit mining operation at the Golden Chest Mine. The plan was approved, and the Company was required to post a reclamation bond of $103,320. This plan also calls for the grading of steep fill slopes and re-vegetation of disturbed land as well as erosion control measures utilizing best practices. Surface water monitoring is also performed at the Golden Chest and results are reported to IDEQ on a quarterly basis. The Company estimates the cost of this water monitoring at $6,000 annually. The Golden Chest Mine also has an EPA general stormwater permit.
When the Company plans an exploration drilling program on public lands, it must submit a POO to either the BLM or USFS. Compilation of the plan can take as much as several months of professional time and a reclamation bond is usually required to start drilling once the plan is approved. Bond costs vary directly with surface disturbance area. As an example, IDR’s core drilling at Diamond Creek on USFS administered land required a bond of $85,800 for minimal disturbance with drill pads adjacent to an existing road. If a plan requires road building, the bond amount can increase significantly. Upon completion of site reclamation and approval by the managing agency, the bond is returned to the Company.
The Company complies with local building codes and ordinances as required by law.
| 8 |
| Table of Contents |
Number of Total Employees and Number of Full Time Employees
The Company’s total number of full-time employees is 42.
REPORTS TO SECURITY HOLDERS
The Company is not required to deliver an annual report to shareholders; however, it plans to deliver an annual report to shareholders in 2024. The annual report will contain audited financial statements. The Company may also rely on the Internet to deliver annual reports to shareholders.
The SEC maintains an Internet site (http://www.sec.gov) that contains reports, proxy and information statements, and other information regarding issuers that file electronically with the Commission and SEC.
The Company maintains a website where recent press releases and other information can be found. A link to the Company’s filings with the SEC is provided on the Company’s website www.idahostrategic.com.
ITEM 1A. RISK FACTORS
The following risks and uncertainties, together with the other information set forth in this report, should be carefully considered by those who invest in our securities. Any of the following material risk factors could adversely affect our business, financial condition or operating results and could decrease the value of our common stock. These are not all of the risks we face, and other factors not presently known to us or that we currently believe are immaterial may also affect our business if they occur.
Financial Risks
Diversity in application of accounting literature in the mining industry may impact our reported financial results.
The mining industry has limited industry-specific accounting literature and, as a result, we understand diversity in practice exists in the interpretation and application of accounting literature to mining-specific issues. As diversity in mining industry accounting is addressed, we may need to restate our reported results if the resulting interpretations differ from our current accounting practices.
Our accounting and other estimates may be imprecise.
Preparing consolidated financial statements requires management to make estimates and assumptions that affect the reported amounts and related disclosure of assets, liabilities, revenue, and expenses at the date of the consolidated financial statements and reporting periods. The more significant areas requiring the use of management assumptions and estimates relate to:
|
· |
mineral reserves, resources, and exploration targets that are the basis for future income and cash flow estimates and units-of-production depreciation, depletion and amortization calculations; |
|
· |
•future ore grades, throughput and recoveries; |
|
· |
future metals prices; |
|
· |
future capital and operating costs; |
|
· |
environmental, reclamation and closure obligations; |
|
· |
permitting and other regulatory considerations; |
|
· |
asset impairments; |
|
· |
valuation of business combinations; |
|
· |
future foreign exchange rates, inflation rates and applicable tax rates; |
|
· |
reserves for contingencies and litigation; and |
|
· |
deferred tax asset valuation allowance. |
Future estimates and actual results may differ materially from these estimates as a result of using different assumptions or conditions.
You may lose all or part of your investment.
If we are unable to effectively develop, mine, recover and sell adequate quantities of gold or generate cash flows from our other diversified precious and strategic metals properties (including, but not limited to, metals exploration, engineering, resource development, economic feasibility assessments, mineral production, metal processing and related ventures), it is unlikely that the cash generated from our internal operations will suffice as a source of the liquidity necessary for anticipated working capital requirements. There is no assurance that the Company’s initiatives to improve its liquidity and financial position will be successful. Accordingly, there is substantial risk that the Company will be unable to continue as a going concern. In the event of insolvency, liquidation, reorganization, dissolution or other winding up of the Company, the Company’s creditors would be entitled to payment in full out of the Company’s assets before holders of common stock would be entitled to any payment, and the claims on such assets may exceed the value of such assets.
| 9 |
| Table of Contents |
Because we may never earn significant revenues from our mine operations or our other diversified precious metal-based and strategic metal properties, our business may fail.
We recognize that if we are unable to generate significant revenues from the exploration and exploitation of our mineral reserves or our other diversified precious and strategic metals properties in the future, we will not be able to earn profits or continue operations. We have begun to generate positive operating income; however, there can be no assurance that this will continue. There is no history upon which to base any assumption as to the likelihood that we will prove successful, and we can provide no assurance that we will generate significant revenues or ever achieve profitability. If we are unsuccessful, our business will fail, and investors may lose all their investment in our Company.
We will not be successful unless we recover precious or strategic metals and sell them for a profit.
Our success depends on our ability to recover precious or strategic metals, process them, and successfully sell them for more than the cost of production. The success of this process depends on the market prices of metals in relation to our costs of production. We may not be able to generate a profit on the sale of gold or other minerals because we have limited control over our costs and have no ability to control the market prices. The total cash costs of production at any location are frequently subject to great variation from year to year as a result of a number of factors, such as the changing composition of the grade of the mineralized material mined for production, and metallurgy and exploration activities in response to the physical shape and location of the mineral deposit. In addition, costs are affected by the price of commodities, such as fuel and electricity. Such commodities are at times subject to volatile price movements, including increases that could make production unprofitable. A material increase in production costs or a decrease in the price of gold or other minerals could adversely affect our ability to earn a profit on the sale of gold or other minerals.
Cost estimates and timing of new projects are uncertain, which may adversely affect our expected production and profitability.
The capital expenditures and time required to acquire, develop, and explore our projects are considerable and changes in costs, construction schedules or both, can adversely affect project economics and expected production and profitability. There are a number of factors that can affect costs and construction schedules, including, among others:
|
· |
availability of labor, energy, transportation, equipment, and infrastructure; |
|
· |
changes in input commodity prices and labor costs; |
|
· |
fluctuations in currency exchange rates; |
|
· |
availability and terms of financing; |
|
· |
changes in anticipated tonnage, grade and metallurgical characteristics of the mineralized material to be mined and processed; |
|
· |
recovery rates of gold and other metals from mineralized materials; |
|
· |
difficulty of estimating construction costs over a period of a year; |
|
· |
delays in completing any environmental review or in obtaining environmental or other government permits; |
|
· |
weather and severe climate impacts; and |
|
· |
potential delays related to health, social, political and community issues. |
Our ability to execute our strategic plan depends on many factors, some of which are beyond our control.
Our strategic plan is focused on high-value, cash-generating, precious and strategic metal-based activities, including, but not limited to, precious and strategic metal exploration, resource development, economic feasibility assessments and cash-generating mineral production. Many of the factors that impact our ability to execute our strategic plan, such as the advancement of certain technologies, legal and regulatory obstacles and general economic conditions, are beyond our control. Changes in value or a lack of demand for the sale of non-core assets would negatively affect the Company’s financial condition and performance. Our inability to identify successful joint venture candidates and to complete joint ventures or strategic alliances as planned or to realize expected synergies and strategic benefits could impact our financial condition and performance. Our inability to deploy capital to maximize shareholder value could impact our financial performance. We cannot give assurance that we will be able to execute any or all of our strategic plan. Failure to execute any or all of our strategic plan could have a material adverse effect on our financial condition, results of operations, and cash flows.
| 10 |
| Table of Contents |
Risks Associated with Operations, Climate, Development, Exploration, and Acquisition Risks
Exploration activities involve a high degree of risk, and exploratory drilling activities may not be successful.
The Company’s future success will largely depend on the success of the exploration drilling programs at the Golden Chest Mine, adjacent properties, and other exploration properties. Participation in exploration drilling activities involves numerous risks, including the significant risk that no commercially marketable minerals will be discovered. The mining of minerals and the manufacture of mineral products involves numerous hazards, including:
|
· |
Ground or slope failures; |
|
· |
Pressure or irregularities in formations affecting ore or wall rock characteristics; |
|
· |
Equipment failures or accidents; |
|
· |
Adverse weather conditions; |
|
· |
Compliance with governmental requirements and laws, present and future; |
|
· |
Shortages or delays in the availability and delivery of equipment; and |
|
· |
Lack of adequate infrastructure, including access to roads, electricity and available housing. |
Poor results from the Company’s drilling activities would materially and adversely affect the Company’s future cash flows and results of operations.
Transportation and weather interruptions may affect and delay proposed mining operations and impact our business plans.
Our mining properties are accessible by road. The climate in the area is hot and dry in the summer but cold and subject to snow and other precipitation in the winter, which could at times hamper accessibility depending on the winter season precipitation levels. As a result, our exploration and mining plans could be delayed for several months each year. Such delays could affect our anticipated business operations and increase our expenses.
Moreover, extreme weather events (such as increased frequency or intensity of storms or prolonged drought, flooded or frozen terrain) have the potential to disrupt operations at our projects. Extended disruptions to supply lines due to extreme weather could result in interruption of activities at the project sites, delay or increase the cost of construction of the projects, or otherwise adversely affect our business.
Supplies and equipment needed for exploration may not always be available. If we are unable to secure raw materials and exploration supplies, we may have to delay our anticipated business operations.
Competition and unforeseen limited sources of supplies needed for our proposed exploration work could result in occasional shortages of supplies of certain products, equipment, or materials. There is no guarantee we will be able to obtain certain products, equipment and/or materials as and when needed, without interruption, or on favorable terms, if at all. Such delays could affect our anticipated business operations and increase our expenses.
The mining industry is highly competitive and there is no assurance that we will continue to be successful in acquiring mineral properties, claims, or leases. If we cannot continue to acquire properties to explore for mineral resources, we may be required to reduce or cease exploration activity and/or operations.
The mineral exploration, development, and production industry is largely un-integrated. We compete with other exploration companies looking for mineral properties and the minerals that can be produced from them. While we compete with other exploration companies in the effort to locate and license mineral properties, we do not compete with them for the removal or sales of mineral products from our claims if we should eventually discover the presence of them in quantities sufficient to make production economically feasible. Readily available markets exist worldwide for the sale of gold and other mineral products, subject to market conditions and prices. Therefore, we will likely be able to sell any gold or mineral products that we identify and produce; however, such sales are subject to market fluctuations that may materially and adversely affect the Company’s future cash flows and results of operations.
Many of our competitors have greater financial resources and technical facilities. Accordingly, we will attempt to compete primarily through the knowledge and experience of our management. This competition could adversely affect our ability to acquire suitable prospects for exploration in the future. Accordingly, there can be no assurance that we will acquire any interest in additional mineral properties that might yield reserves or result in commercial mining operations.
| 11 |
| Table of Contents |
The estimation of the ultimate recovery of gold and other metals is subjective. Actual recoveries may vary from our estimates.
We utilize a conventional flotation process to produce a bulk sulfide flotation concentrate that is sold to smelters in Asia. Ore is crushed, ground and valuable minerals are separated using the flotation process which is longstanding and well understood metallurgical process. However, our estimates of gold recovery can vary from actual gold recovery because of several factors such as oxidation, hardness of the ore, deleterious mineralogy, and gold grade estimation errors due to the nugget effect. Also, final payment is determined by sampling of the concentrate at the smelter which could lead to variations from provisional sampling at the mill facility. Sampling procedures at the mill have been modified to try to increase correlation with smelter samples such as by increasing the sample mass collected for the provisional sample at the mill. Due to the complexity of the estimation process and the number of steps involved, among other things, actual recoveries can vary from estimates, and the amount of the variation could be significant and could have a material adverse impact on our financial condition and results of operations.
Resource and other mineralized material statements are estimates only and are subject to uncertainty due to factors including metal prices, inherent variability of the mineral deposits and recoverability of metal in the mining and beneficiation processes.
Our reports of mineral resources and other mineralized material depend upon geological interpretation and statistical inferences or assumptions drawn from drilling and sampling analysis, which may prove to be unpredictable. There is a degree of uncertainty attributable to the calculation of mineral resources and corresponding grades. Until mineral resources and other mineralized materials are actually mined and processed, the quantity of mineralized material and grades must be considered as an estimate only. In addition, the quantity of mineral resources and mineral reserves may vary depending on metal prices. Any material changes in the quantity of mineral resources, mineral reserves, mineralization, grade or stripping ratio may affect the economic viability of our properties. In addition, we can provide no assurance that gold recoveries or other metal recoveries experienced in small-scale laboratory tests will be duplicated in larger scale tests under on-site conditions or during production.
Our mining and metal production depends on the availability of sufficient water supplies.
Our mining and milling operations require significant quantities of water for mining, processing, and related support facilities. Continuous production at our mines and mill is dependent on our ability to maintain our water rights and claims, and the continuing physical availability of the water.
We may experience increased costs or losses resulting from the hazards and uncertainties associated with mining.
The exploration for natural resources and the development and production of mining operations are activities that involve a high level of uncertainty. These can be difficult to predict and are often affected by risks and hazards outside of our control. These factors include, but are not limited to:
|
· |
environmental hazards, including discharge of metals, concentrates, pollutants or hazardous chemicals; |
|
· |
industrial accidents, including in connection with the operation of mining transportation equipment, milling equipment and/or conveyor systems, and accidents associated with the preparation and ignition of large-scale blasting operations, milling, processing and transportation of chemicals, explosives or other materials; |
|
· |
surface or underground fires or floods; |
|
· |
unexpected geological formations or conditions (whether in mineral or gaseous form); |
|
· |
ground and water conditions; |
|
· |
fall-of-ground accidents in underground operations; |
|
· |
failure of mining pit slopes and tailings dam walls; |
|
· |
seismic activity; and |
|
· |
other natural phenomena, such as lightning, severe rain or snowstorms, floods, or other inclement weather conditions. |
Climate Change could negatively or positively impact our operations and financial performance.
Climate change is expected to create more extreme weather patterns that can increase the frequency of droughts and increase the amount of rainfall, circumstances that require careful water management. Potential key material physical risks to the Company from climate change include but are not limited to: increased volumes of mine contact water requiring storage and treatment, increased design requirements for stormwater diversion and associated water management systems, and reduced freshwater availability due to potential drought conditions. Warmer winters may make it easier to operate mine in the winter and extend the exploration drilling season. We have identified opportunities and risks with the advent of technologies that support decarbonization and renewable energy sources, such as: electric vehicles and energy storage that may require the metals we produce seek to produce in the future. These technologies may not have the same reliability as conventional technologies and costs may increase to produce such technologies, which could negatively impact our financial performance.
| 12 |
| Table of Contents |
Our operations are subject to a range of risks related to climate change and transitioning the business to meet regulatory, societal and investor expectations for operating in a low-carbon economy.
Climate change is expected to create more extreme weather patterns that can increase the frequency or severity of forest and droughts and sudden heavy rainfall. These latter two events require careful water management. Potential key material physical risks to the Company from climate change include, but are not limited to:
|
· |
increased volumes of mine contact water requiring storage and treatment; |
|
· |
increased design requirements for stormwater diversion and associated water management systems; |
|
· |
reduced freshwater availability due to potential drought conditions; |
|
· |
damage to roads and other infrastructure at our sites due to extreme weather events, including intense rainfalls and related events such as landslides; and |
|
· |
unpermitted or otherwise non-compliant discharge of wastewater due to an increased frequency of extreme weather events exceeding the design capacity of existing tailings storage facilities and other stormwater management infrastructure. |
Such events can temporarily slow or halt operations due to physical damage to assets, reduced worker productivity for safety protocols on-site related to extreme weather events, worker aviation, and transport to or from the site, and local or global supply route disruptions that may limit the transport of essential materials and supplies. Additional financial impacts could include increased capital or operating costs to increase water storage and treatment capacity, obtain or develop maintenance and monitoring technologies, increase resiliency of facilities and establish supplier climate resiliency and contingency plans. The occurrence of weather and climate events have in the past and could in the future cause us to incur unplanned costs, which may be material, to address or prevent resulting damage.
In addition, we have identified opportunities and potential risks for the Company as we shift toward a low-carbon economy. Technologies that support decarbonization include renewable energy sources, electric vehicles, and energy storage, all of which require the metals we produce. However, renewable energies currently may not have the same reliability as conventional energy sources. Thus, as we transition toward renewable energy sources, we could experience a possible curtailment of our energy supply, and these new energy sources may cost more in the future than our current supplies, which could negatively impact our financial performance. Further, transitioning to a lower-carbon economy will require significant investment and may entail extensive policy, legal, technology, and market changes to address mitigation and adaptation requirements related to climate change. Depending on the nature, speed, focus, and jurisdiction of these changes, transition risks may pose varying levels of financial and reputational risk to our business.
Policy and regulatory risk related to actual and proposed changes in climate and water-related laws, regulations and taxes developed to regulate the transition to a low-carbon economy may result in increased costs for our operations, third-party smelters and refiners, and our suppliers, including increased energy, capital equipment, environmental monitoring and reporting and other costs to comply with such regulations. Regulatory uncertainty may cause higher costs and lower economic returns than originally estimated for new development projects and operations, including closure reclamation and remediation obligations.
The development and deployment of technological improvements or innovations will be required to support the transition to a low-carbon economy, which could result in write-offs and early retirement of existing assets, increased costs to adopt and deploy new practices and processing including planning and design for mines, development of alternative power sources, site level efficiencies and other capital investments.
A failure to meet our climate strategy commitments and/or societal or investor expectations could also result in damage to our reputation, decreased investor confidence and challenges in maintaining positive community relations, which can pose additional obstacles to our ability to conduct our operations and develop our projects, which may result in a material adverse impact on our business, financial position, results of operations and growth prospects.
| 13 |
| Table of Contents |
Risks Related to Our Company
The cost of our exploration, development and acquisition activities is substantial, and there is no assurance that the quantities of minerals and metals we discover, acquire or recover will justify commercial operations or replace reserves.
Mineral exploration, development and beneficiation, particularly for gold and other strategic metals, is highly speculative in nature and frequently is nonproductive. There can be no assurance that our exploration, development and/or acquisition activities will be commercially successful. Substantial expenditures are required to acquire existing gold properties, to establish mineral reserves through drilling and analysis, to develop metallurgical processes to extract metal from the mineralized material and, in the case of new properties, to develop the processing facilities and infrastructure at any site chosen for mineral exploration. There can be no assurance that any gold reserves or mineralized material that may be discovered or acquired in the future, if any, will be in sufficient quantities or of adequate grade to justify continued commercial operations, or that the funds required for mineral production operation can be obtained on a timely or reasonable basis, if at all. Mining companies must continually replace mineral reserves depleted by production. There can be no assurance that we will be successful in replacing any reserves or mineralized material acquired or established in the future.
The prices of gold and other strategic metals fluctuate on a regular basis and a downturn in price could negatively impact our operations and cash flow.
Our operations will be significantly affected by changes in the market price of gold. Gold prices can fluctuate widely and may be affected by numerous factors, such as expectations for inflation, levels of interest rates, currency exchange rates, purchases and sales by governments and central banks, monetary policies employed by the world’s major central banks, fiscal policies employed by the world’s major industrialized economies, forward selling or other hedging activities, demand for diversified precious and strategic metals, global or regional political and economic crises, and production costs in major gold-producing regions, such as but not limited to South Africa and the Russian Federation. The aggregate effect of these factors, all of which are beyond our control, is impossible for us to predict. If gold prices decline substantially, it could adversely affect the realizable value of our assets and, potentially, future results of operations and cash flow.
As opportunities rise, we expect to continue to acquire properties with gold and strategic metals reserves or mineralized material with exploration potential. The price that we pay to acquire these properties will be influenced, in large part, by the price of gold and other strategic metals at the time of the acquisition. We expect our potential future revenues to be derived from the production and sale of gold and strategic metals from these properties or from the sale of some of these properties. The value of any mineralized material, and the value of any potential mineral production therefrom, will vary in direct proportion to variations in those mineral prices. The price of gold and strategic metals has fluctuated widely as a result of numerous factors beyond our control. The effect of these factors on the price of gold and strategic metals, and therefore the economic viability of our projects, cannot accurately be predicted. Any drop in the price of gold or strategic metals would negatively affect our asset values, cash flows, potential revenues, and profits.
The use of hedging instruments may not prevent losses being realized on subsequent price decreases or may prevent gains being realized from subsequent price increases.
We may from time to time sell some future production of gold pursuant to hedge positions. If the gold price rises above the price at which future production has been committed under these hedge instruments, we will have an opportunity loss. If the gold price falls below that committed price, we may experience losses if a hedge counterparty defaults under a contract when the contract price exceeds the gold price.
Competition from other mineral exploration and mining companies with greater resources may impact us.
We compete with other mineral exploration and mining companies or individuals, including large, established metals and mining companies with substantial capabilities and far greater financial resources, to acquire rights to mineral properties, metal processing technology and other methods for extracting and processing precious, and other metals and minerals. There is a limited supply of desirable lands available for claim staking, lease or other acquisition. There can be no assurance that we will be able to acquire such properties when competing against competitors with substantially greater financial resources than we have. Increases in the amount of gold and associated minerals sold by competitors of the Company may also result in price reductions and/or reduced margins, and the Company may not be able to compete effectively against current and future competitors.
The construction of our mines are subject to all of the risks inherent in start-up operations.
These risks include potential delays, cost overruns, shortages of material or labor, construction defects, and injuries to persons and property. We expect to engage or hire on employees in order to continue the development of our mines. While we anticipate taking all measures that we deem reasonable and prudent in connection with the production phase, there is no assurance that the risks described above will not cause delays or cost overruns in connection with such development, production, or operation. Any delays would postpone our anticipated receipt of revenue and adversely affect our operations, which in turn may adversely affect the price of our stock.
| 14 |
| Table of Contents |
Our business requires substantial capital investment and we may be unable to raise additional funding on favorable terms.
The construction and operation of potential future projects and various exploration projects will require significant funding. Our operating cash flow and other sources of funding may become insufficient to meet all of these requirements, depending on the timing and costs of development of these and other projects. As a result, new sources of capital may be needed to meet the funding requirements of these investments and fund our ongoing business activities. Our ability to raise and service significant new sources of capital will be a function of macroeconomic conditions, future gold and strategic metal prices, our operational performance and our current cash flow and debt position, among other factors. In the event of lower gold and strategic metal prices, unanticipated operating or financial challenges, or a further dislocation in the financial markets as experienced in recent years, our ability to pursue new business opportunities, invest in existing and new projects, fund our ongoing operations and retire or service all of our outstanding debt could be significantly constrained.
Owning real estate and water rights carries inherent risks.
We are susceptible to the following real estate industry risks beyond our control:
|
· |
Changes in national, regional and local economic conditions and outlook; |
|
· |
Economic downturns in the areas where the properties are located; |
|
· |
Adverse changes in local real estate market conditions such as an oversupply of properties, reduction in demand, intense competition for buyers and/or demographic changes; |
|
· |
Changes in business or consumer preferences that reduce the attractiveness of our properties; |
|
· |
Changes in zoning, regulatory restrictions or tax laws; |
|
· |
Changes in interest rates or availability of financing. |
These conditions could adversely affect our financial position, results of operations and cash flows, or the market price of our stock.
Illiquidity of real estate investments could significantly impede our ability to respond to changes in economic and other conditions.
Our ability to sell one or more of our properties in response to changing economic, financial and investment conditions may be limited. We cannot predict whether we will be able to sell any of our properties for the price or terms set by us, or whether any price or other terms offered by a prospective buyer would be acceptable to us. We also cannot predict the length of time needed to find a willing buyer and to the close the sale of an asset. The real estate market is affected by many factors that are beyond our control.
We may undertake joint ventures, investments, joint projects and other strategic alliances and such undertakings may be unsuccessful and may have an adverse effect on our business.
We continually evaluate and explore strategic opportunities as they arise, including product, technology, business or asset transactions. Such undertakings may not be successful or may take a substantially longer period than initially expected to become successful, and we may never recover our investments or achieve desired synergies or economies from these undertakings. Nevertheless, we may in the future to seek to grow our operations in part by entering into joint ventures, or undertaking investments, joint projects or other strategic alliances with third parties in diversified precious and strategic metals production and processing industries. These activities involve challenges and risks in negotiation, execution, valuation and integration, and closing of the transactions could be delayed or prevented by regulatory approval requirements, including permitting issues, or other conditions.
Any future agreements that we may enter into also could expose us to new operational, regulatory, market, litigation and geographical risks as well as risks associated with significant capital requirements, the diversion of management and financial resources, unforeseen operating difficulties and expenditures, sharing of proprietary information, loss of control over day-to-day operations, non-performance by a counterparty, potential competition and conflicts of interest. In addition, we may not be successful in finding suitable targets on terms that are favorable to us, or at all. Even if successfully negotiated and closed, expected synergies from a joint venture, investment or other strategic alliance may not materialize, may not advance our business strategy, may fall short of expected return-on-investment targets or may not prove successful or effective for our business. We may also encounter difficulty integrating the operations, personnel, and financial and operating systems of an acquired business into our current business.
| 15 |
| Table of Contents |
We may need to raise additional debt funding or sell additional equity securities to enter into such joint ventures or make such acquisitions. However, we may not be able to obtain such debt funding or sell equity securities on terms that are favorable to us, or at all. The raising of additional debt funding by us, if required and available, would result in increased debt service obligations and could result in additional operating and financing covenants, or liens on our assets, that would restrict our operations. The sale of additional equity securities, if required and available, could result in dilution to our shareholders.
Our business depends on a limited number of key personnel, the loss of whom could negatively affect us.
Our officers and employees are important to our success. If any of them becomes unable or unwilling to continue in their respective positions, and we are unable to find suitable replacements, our business and financial results could be materially negatively affected.
Legal, Regulatory and Compliance Risks
Our ability to execute our strategic plans depends upon our success in obtaining a variety of required governmental approvals that may be opposed by third parties.
Our operations may be delayed, hindered, or prevented to the extent that we are unable to obtain the governmental permits or approvals necessary to conduct the full extent of the operations contemplated by our strategic plan in a timely fashion or at all. This inability may occur due to a variety of factors, including opposition by third parties, such as members of the public or environmental groups. We expect that future permit and approval applications and issuances will meet with similar opposition. We may encounter delays and added costs if permits and approvals are challenged.
The Company is subject to complex laws and regulations, including environmental regulations that can adversely affect the cost, manner or feasibility of doing business.
The Company’s production, development and exploratory mining operations are subject to numerous federal, state and local laws and regulations governing the operations, discharge, emission, or release of materials into the environment and the protection of the environment and human health and safety, including the Federal Clean Water Act (“CWA”), Clean Air Act (“CAA”), Endangered Species Act (“ESA”), Safe Drinking Water Act (“SDWA”), Migratory Bird Treaty Act (“MBTA”), National Environmental Policy Act (“NEPA”, Resource Conservation and Recovery Act (“RCRA”), and Comprehensive Environmental Response, Compensation and Liability Act (“CERCLA”). Federal initiatives are often also administered and enforced through state agencies operating under parallel state statutes and regulations. Failure to comply with such rules and regulations could result in substantial penalties or construction or operational delays or requirements to cease production and have an adverse effect on the Company. These laws and regulations may, among other things:
|
· |
Require that the Company obtain permits before commencing mining work and to comply with ongoing permit requirements; |
|
· |
Restrict the substances that can be released into the environment in connection with mining work and require remediation of substances that are released; |
|
· |
Impose obligations to reclaim land in order to minimize long term effects of land disturbance; and |
|
· |
Limit or prohibit mining work on protected areas. |
Under these laws and regulations, the Company could be liable for personal injury and clean-up costs and other environmental and property damages, as well as administrative, civil, and criminal penalties. The Company maintains limited insurance coverage for sudden and accidental environmental damages. Accordingly, the Company may be subject to liability, or it may be required to cease production from properties in the event of environmental damages. Compliance with environmental laws and regulations and future changes in these laws and regulations may require significant capital outlays, cause material changes or delays in the Company’s current and planned operations and future activities and reduce the profitability of operations.
At the state level, surface mining operations in Idaho are regulated by IDL. The surface mining regulations require water monitoring to protect surface and ground water and results are submitted to IDEQ. If any degradation of existing water quality is found, regulations require the Company to work with the state regulators to mitigate any impacts on water quality. In addition, we are required to hold Idaho reclamation permits required under Idaho law. These permits mandate concurrent and post-mining reclamation of mines and require the posting of reclamation bonds sufficient to guarantee the cost of mine reclamation. Other Idaho regulations govern operating and design standards for the construction and operation of any source of air contamination and landfill operations. Any changes to these laws and regulations could have a negative impact on our financial performance and results of operations by, for example, requiring changes to operating constraints, technical criteria, fees or surety requirements.
| 16 |
| Table of Contents |
It is possible that future changes in these laws or regulations could increase operating costs or require capital expenditures in order to remain in compliance. Any such changes could have an adverse effect on the Company’s business, financial condition and results of operations.
The Company is subject to the Federal Mine Safety and Health Act of 1977 and regulations promulgated thereto, which impose stringent health and safety standards on numerous aspects of their operations.
The Company’s exploration, development and mining is subject to the Federal Mine Safety and Health Act of 1977, which imposes stringent health and safety standards on numerous aspects of mineral extraction and processing operations, including the training of personnel, operating procedures, operating equipment and other matters, and the costs associated with compliance with such laws and regulations can be substantial. The Company’s failure to comply with these standards could have a material adverse effect on their business, financial condition or otherwise impose significant restrictions on their ability to conduct mining work.
Regulations and pending legislation governing issues involving climate change could result in increased operating costs which could have a material adverse effect on our business.
A number of governments or governmental bodies have introduced or are contemplating regulatory changes in response to various climate change interest groups and the potential impact of climate change. Legislation and increased regulation regarding climate change could impose significant costs on us, our partners and our suppliers, including costs related to increased energy requirements, capital equipment, environmental monitoring and reporting and other costs to comply with such regulations. Any adopted future climate change regulations could also negatively impact our ability to compete with companies situated in areas not subject to such limitations. Given the emotion, political significance, and uncertainty around the impact of climate change and how it should be dealt with, we cannot predict how legislation and regulation will affect our financial condition, operating performance and ability to compete. Furthermore, even without such regulation, increased awareness and any adverse publicity in the global marketplace about potential impacts on climate change by us or other companies in our industry could harm our reputation. The potential physical impacts of climate change on our operations are highly uncertain and would be particular to the geographic circumstances in areas in which we operate. These may include changes in rainfall and storm patterns and intensities, water shortages, changing sea levels and changing temperatures. These impacts may adversely impact the cost, production, and financial performance of our operations.
Our activities are inherently hazardous and any exposure may exceed our insurance limits or may not be insurable.
The Company’s business is subject to a number of risks and hazards generally, including adverse environmental conditions, environmental or industrial accidents, labor disputes, unusual or unexpected geological conditions, ground or slope failures, cave-ins, changes in the regulatory environment and natural phenomena, such as inclement weather conditions, floods, hurricanes and earthquakes. Such occurrences could result in damage to mineral properties or production facilities, personal injury or death, environmental damage to our properties or the property of others, delays in construction or mining, monetary losses, and possible legal liability.
The nature of these risks is such that liabilities might exceed any applicable liability insurance policy limits. It is also possible that the liabilities and hazards might not be insurable, or we could elect not to insure ourselves against such liabilities because of the high premium costs, in which event, we could incur significant costs that could have a material adverse effect on our financial condition.
| 17 |
| Table of Contents |
Our insurance and surety bonds for environmental-related issues are limited.
Our insurance and surety bonds against environmental risks are limited as to the maximum protection against potential liability for pollution or other hazards as a result of the disposal of waste products occurring from exploration and production. Further, there is no assurance that insurance carriers or surety bond providers will be able to meet their obligations under our arrangements with them. In the event that our environmental liabilities and costs exceed the coverage provided by our insurance carriers and surety bond providers, or such parties are unable to meet their obligations, we would have limited funds available to us to remedy such liabilities or costs, or for future operations. If we are unable to fund the cost of remedying an environmental problem, we also might be required to enter into an interim compliance measure pending completion of the required remedy.
We are subject to federal and state laws that require environmental assessments and the posting of bonds, which add significant costs to our operations and delays in our projects.
Mining companies must post a bond or other surety to guarantee the cost of post-mining reclamation. These requirements could add significant additional cost and delays to any mining project undertaken by us. Our mineral exploration operations are required to be covered by reclamation bonds deemed adequate by regulators to cover these risks.
We may be subject to litigation.
We may be subject to legal proceedings. Due to the nature of our business, we may be subject to a variety of regulatory investigations, claims, lawsuits and other proceedings in the ordinary course of our business. The results of these legal proceedings cannot be predicted with certainty due to the uncertainty inherent in litigation, including the effects of discovery of new evidence or advancement of new legal theories, the difficulty of predicting decisions of judges, and juries and the possibility that decisions may be reversed on appeal. There can be no assurances that these matters will not have a material adverse effect on our business.
Title claims against our properties could require us to compensate parties making such claims, if successful, and divert management’s time from operations.
There may be challenges to our title in the properties in which we hold material interests. If there are title defects with respect to any of our properties, we might be required to compensate other persons or perhaps reduce our interest in the affected property. The validity of unpatented mineral claims, which constitute most of our strategic mineral holdings in the United States, is often uncertain and may be contested by the federal government and other parties. The validity of an unpatented mineral claim, in terms of both its location and its maintenance, depends on strict compliance with a complex body of federal and state, statutory and decisional law. Although we have attempted to acquire satisfactory title to our properties, we have not obtained title opinions or title insurance with respect to the acquisition of the unpatented mineral claims. The investigation and resolution of title issues would divert management’s time from ongoing exploration programs.
We are exposed to global health, economic and market risks that are beyond our control, which could adversely affect our financial results and capital requirements.
If any of our facilities or the facilities of our suppliers, third-party service providers, or customers is affected by natural disasters, such as earthquakes, floods, fires, power shortages or outages, public health crises (such as pandemics and epidemics), political crises (such as terrorism, war, political instability or other conflict), or other events outside of our control, our operations or financial results could suffer. Any of these events could materially and adversely impact us in a number of ways, including through decreased production, increased costs, decreased demand for our products due to reduced economic activity or other factors, or the failure by counterparties to perform under contracts or similar arrangements.
For example, the outbreak of the novel strain of coronavirus, specifically identified as “COVID-19”, resulted in governments worldwide enacting emergency measures to combat the spread of the virus. These measures, including the implementation of travel bans, quarantine periods and social distancing, have caused material disruptions to global business and an economic downturn. Global equity markets have experienced significant volatility and weakness. Governments and their central banks have reacted with significant fiscal and monetary interventions designed to mitigate the impacts and stabilize economic conditions.
Attempts to mitigate global health, economic and market risks of natural disasters may result in decreased economic activity which would adversely affect the broader global economy. Pandemics or other significant public health events will most likely have a material adverse effect on our business and results of operations. It is not currently possible to reliably estimate the length and severity of the impact on the Company’s financial condition, and that of its subsidiaries and partners in future periods.
| 18 |
| Table of Contents |
Uncertainties regarding the global economic and financial environment could lead to an extended national or global economic recession. A slowdown in economic activity caused by a recession would likely reduce demand for assets that we hold for sale and result in lower commodity prices for long periods of time.
Mineral operations are subject to applicable law and government regulation. Even if we discover a mineral reserve in a commercially exploitable quantity, these laws and regulations could restrict or prohibit the exploitation of that mineral reserve. If we cannot exploit any mineral reserve that we might discover on our properties, our business may fail and you may lose your investment.
Both mineral development and extraction may require permits from various foreign, federal, state, and local governmental authorities and are governed by laws and regulations, including those with respect to prospecting, mine development, mineral production, transport, export, taxation, labor standards, occupational health, waste disposal, toxic substances, land use, environmental protection, mine safety, and other matters. There can be no assurance that we will be able to obtain or maintain any of the permits required for the continued exploration of our mineral properties or for the construction and operation of a mine on our properties at economically viable costs. If we cannot accomplish these objectives, our business could face difficulty and/or fail.
We believe that we are in compliance with all material laws and regulations that currently apply to our activities but there can be no assurance that we can continue to do so. Current laws and regulations could be amended, and we might not be able to comply with them, as amended. Further, there can be no assurance that we will be able to obtain or maintain all permits necessary for our future operations, or that we will be able to obtain them on reasonable terms. To the extent such approvals are required and are not obtained, we may be delayed or prohibited from proceeding with planned development or production of our mining activity.
Environmental hazards unknown to us, which have been caused by previous or existing owners or operators of the properties, may exist on the properties in which we hold an interest. Many of our properties in which we have ownership rights are located within the Coeur d’Alene Mining District, which is currently the site of a Federal Superfund cleanup project. It is possible that environmental cleanup or other environmental restoration procedures could remain to be completed or mandated by law, causing unpredictable and unexpected liabilities to arise. At the date of this Annual Report, the Company is not aware of any environmental issues or litigation relating to the properties.
The laws of the State of Idaho and our Articles of Incorporation may protect the Company’s directors from certain types of lawsuits.
The laws of the State of Idaho provide that the Company’s directors will not be liable to us or our shareholders for monetary damages for all but certain types of conduct as directors of the Company. The Company’s Articles of Incorporation permit the Company to indemnify its directors and officers against all damages incurred in connection with its business to the fullest extent provided or allowed by law. The exculpation provisions may have the effect of preventing shareholders from recovering damages against the Company’s directors caused by director negligence, poor judgment, or other circumstances. The indemnification provisions may require the Company to use its limited assets to defend its directors and officers against claims, including claims arising out of the Company’s negligence, poor judgment, or other circumstances.
Risks Related to Investments in Our Common Stock
The price of the Company’s common stock has and may continue to fluctuate significantly, which could negatively affect the Company and holders of its common stock.
The market price of our common shares is subject to volatility, has fluctuated, and may continue to fluctuate significantly due to, among other things, changes in market sentiment regarding our operations, financial results or business prospects, the mining, metals, or environmental remediation industries generally, coordinated trading activities, large derivative positions or the macroeconomic outlook. The price of our common stock has been, and may continue to be, highly volatile. Certain events or changes in the market or our industries generally are beyond our control.
In addition to the other risk factors contained or incorporated by reference herein, factors that could impact our trading price include:
|
· |
our actual or anticipated operating and financial results, including how those results vary from the expectations of management, securities analysts and investors; |
|
· |
changes in financial estimates or publication of research reports and recommendations by financial analysts or actions taken by rating agencies with respect to us or other industry participants; |
| 19 |
| Table of Contents |
|
· |
reports in the press or investment community generally or relating to our reputation or the financial services industry; |
|
· |
developments in our business or operations or our industry sectors generally; |
|
· |
any future offerings by us of our common stock; |
|
· |
any coordinated trading activities or large derivative positions in our common stock, for example, a “short squeeze” (a short squeeze occurs when a number of investors take a short position in a stock and have to buy the borrowed securities to close out the position at a time that other short sellers of the same security also want to close out their positions, resulting in surges in stock prices, i.e., demand is greater than supply for the stock shorted); |
|
· |
legislative or regulatory changes affecting our industry generally or our business and operations specifically; |
|
· |
the operating and stock price performance of companies that investors consider to be comparable to us; |
|
· |
announcements of strategic developments, acquisitions, restructurings, dispositions, financings and other material events by us or our competitors; |
|
· |
expectations of (or actual) equity dilution, including the actual or expected dilution to various financial measures, including earnings per share, that may be caused by equity offerings; |
|
· |
actions by our current shareholders, including future sales of common shares by existing shareholders, including our directors and executive officers; |
|
· |
proposed or final regulatory changes or developments; |
|
· |
anticipated or pending regulatory investigations, proceedings, or litigation that may involve or affect us; and |
|
· |
other changes in U.S. or global financial markets, global economies and general market conditions, such as interest or foreign exchange rates, stock, commodity prices, credit or asset valuations or volatility. |
If securities or industry analysts do not publish research, or publish inaccurate or unfavorable research about our business, our stock price and trading volume could decline.
The trading market for our common stock will depend in part on the research and reports that securities or industry analysts publish about us or our business. We have relatively little research coverage by securities and industry analysts. If no additional industry analysts commence coverage of the Company, the trading price for our common stock could be negatively impacted. If one or more of the analysts who cover us downgrades our common stock, or publishes inaccurate or unfavorable research about our business, our stock price would likely decline. If one or more of these analysts cease coverage of us or fail to publish reports on us regularly, demand for our common stock could decrease, which could cause our stock price and trading volume to decline.
We do not expect to pay any cash dividends for the foreseeable future.
We expect to retain all available funds and future earnings, if any, for use in the operation and growth of our business and do not anticipate paying any cash dividends in the foreseeable future. Any future determination to pay cash dividends will be at the discretion of our board, subject to compliance with applicable law, our organizational documents and any contractual provisions, including under agreements for indebtedness we may incur, that restrict or limit our ability to pay dividends, and will depend upon, among other factors, our results of operations, financial condition, earnings, capital requirements and other factors that our board deems relevant. Investors seeking cash dividends in the foreseeable future should not purchase our common stock.
The Company may issue additional common stock or other equity securities in the future that could dilute the ownership interest of existing shareholders.
The Company is currently authorized to issue 200,000,000 shares of common stock, of which 12,397,615 shares were issued and outstanding as of December 31, 2023, and 1,000,000 shares of preferred stock, of which no Preferred Shares are outstanding as of December 31, 2023. To maintain its capital at desired levels or to fund future growth, the board may decide from time to time to issue additional shares of common stock, or securities convertible into, exchangeable for or representing rights to acquire shares of common stock. New investors in other equity securities issued by the Company in the future may also have rights, preferences, and privileges senior to, that may adversely impact, the Company’s current shareholders.
If a large number of shares of our common stock are sold in the public market, the sales could reduce the trading price of our common stock and impede our ability to raise future capital.
We cannot predict what effect, if any, future issuances by us of our common stock or other equity will have on the market price of our common stock. Any shares that we may issue may not have any resale restrictions, and therefore could be immediately sold by the holders. The market price of our common stock could decline if certain large holders of our common stock, or recipients of our common stock, sell all or a significant portion of their shares of common stock or are perceived by the market as intending to sell these shares other than in an orderly manner. In addition, these sales could also impair our ability to raise capital through the sale of additional common stock in the capital markets.
| 20 |
| Table of Contents |
Risks Related to Cybersecurity
Our information technology systems may be vulnerable to cyber-attack or other disruption, which could place our systems at risk for data loss, operational failure, or compromise of confidential information.
We rely on various information technology systems. These systems remain vulnerable to disruption, damage, or failure from a variety of sources, including, but not limited to, errors by employees or contractors, computer viruses, cyber-attacks, including phishing, ransomware, and similar malware, misappropriation of data by outside parties, and various other threats. Techniques used to obtain unauthorized access to or sabotage our systems are under continuous and rapid evolution, and we may be unable to detect efforts to disrupt our data and systems in advance. Breaches and unauthorized access carry the potential to cause losses of assets or production, operational delays, equipment failure that could cause other risks to be realized, inaccurate recordkeeping, or disclosure of confidential information, any of which could result in financial losses and regulatory or legal exposure and could have a material adverse effect on our business, financial condition, or results of operations. We may incur material losses relating to cyber-attacks or other information security breaches in the future. Our risk and exposure to these matters cannot be fully mitigated because of, among other things, the evolving nature of these threats. As such threats continue to evolve, we may be required to expend additional resources to modify or enhance any protective measures or to investigate and remediate any security vulnerabilities.
ITEM 1B. UNRESOLVED STAFF COMMENTS
None.
ITEM 1C. CYBERSECURITY
Cybersecurity risk management is part of the Company’s overall risk management program. Management is responsible for identifying, considering, and assessing material cybersecurity risks on an ongoing basis, establishing processes to the best of their ability to ensure that such potential cybersecurity risk exposures are monitored, putting in place reasonably appropriate mitigation measures and maintaining cybersecurity programs. Our cybersecurity programs are under the direction of our Treasurer with assistance from the management team. Any significant Cyber incidents that they become aware of are reported to the board of directors.
There were no material cyber security incidents discovered in 2023.
| 21 |
| Table of Contents |
ITEM 2. DESCRIPTION OF PROPERTIES
Note on New SEC Mining Disclosure Rules
Information concerning our mining properties in this Annual Report on Form 10-K has been prepared in accordance with the requirements of subpart 1300 of Regulation S-K, which first became applicable to us for the fiscal year ended December 31, 2021. These requirements differ significantly from the previously applicable disclosure requirements of SEC Industry Guide 7. Among other differences, subpart 1300 of Regulation S-K requires us to disclose our mineral resources, in addition to our mineral reserves, as of the end of our most recently completed fiscal year both in the aggregate and for each of our individually material mining properties. Readers are cautioned that mineral resources do not have demonstrated economic value. Mineral resources are subject to further exploration and development, are subject to additional risks, and no assurance can be given that they will eventually convert to mineral reserves. Inferred resources have more uncertainty than Measured or Indicated as the estimation parameters assume mineralized continuity over greater distances which may not accurately reflect the actual mineralization.
Summary
The map below shows the locations of our operations and our exploration properties.
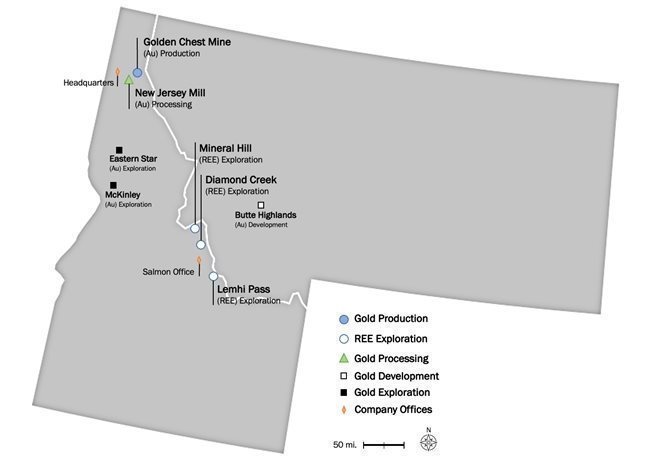
Figure 1 - Property Location Map
| 22 |
| Table of Contents |
The following table summarizes our aggregate metal quantities produced and sold, which only includes the quantities produced and sold from the Golden Chest Mine (the Company’s only producing mine) for the last three years:
|
|
|
Year Ended December 31, |
|
||||||||||
|
|
|
2023 |
|
|
2022 |
|
|
2021 |
|
||||
Gold - |
|
Ounces produced |
|
|
8,247 |
|
|
|
6,103 |
|
|
|
4,826 |
|
|
|
Payable ounces sold |
|
|
7,673 |
|
|
|
5,672 |
|
|
|
4,493 |
|
The following table summarizes the Company’s total in-situ proven and probable mineral reserves (the Golden Chest Mine is the Company’s only property with calculated reserves) as of December 31, for the last three years:
Classification |
|
Year |
|
Tonnes |
|
|
Grade (grams gold per tonne) |
|
|
Cut-off (grams gold per tonne) |
|
|
Metallurgical Recovery |
|
||||
Proven and Probable Reserves |
|
2021 |
|
|
38,700 |
|
|
|
4.87 |
|
|
|
2.0 |
|
|
|
93 | % |
Proven and Probable Reserves |
|
2022 |
|
|
53,754 |
|
|
|
4.73 |
|
|
|
2.0 |
|
|
|
93 | % |
Proven and Probable Reserves |
|
2023 |
|
|
127,477 |
|
|
|
6.74 |
|
|
|
3.2 |
|
|
|
93 | % |
The following table summarizes the Company’s total in-situ mineral resources (the Golden Chest Mine is the Company’s only property with calculated mineral resources) for the last two years as of December 31, 2023.
Classification |
|
Year |
|
Tonnes |
|
|
Gold Grade (grams gold per tonne) |
|
|
Cutoff (grams gold per tonne) |
|
|
Metallurgical Recovery |
|
||||
Measured |
|
2022 |
|
|
403,724 |
|
|
|
4.57 |
|
|
2.0 |
|
|
93.0% |
|||
Indicated |
|
2022 |
|
|
692,024 |
|
|
|
4.32 |
|
|
2.0 |
|
|
93.0% |
|||
Measured + Indicated |
|
2022 |
|
|
1,095,748 |
|
|
|
4.41 |
|
|
2.0 |
|
|
93.0% |
|||
Inferred |
|
2022 |
|
|
753,502 |
|
|
|
3.44 |
|
|
2.0 |
|
|
93.0% |
|||
Measured |
|
2023 |
|
|
406,605 |
|
|
|
4.10 |
|
|
2.0 UG & 1.4 OP |
|
|
93.0% UG 85% OP |
|
||
Indicated |
|
2023 |
|
|
665,550 |
|
|
|
4.00 |
|
|
2.0 UG & 1.4 OP |
|
|
93.0% UG 85% OP |
|
||
Measured + |
|
|
|
|
|
|
|
|
|
|
|
|
|
|
|
|
||
Indicated |
|
2023 |
|
|
1,072,155 |
|
|
|
4.04 |
|
|
2.0 UG & 1.4 OP |
|
|
93.0% UG 85% OP |
|
||
Inferred |
|
2023 |
|
|
743,793 |
|
|
|
3.23 |
|
|
2.0 UG & 1.4 OP |
|
|
93.0% UG 85% OP |
|
||
More information on the Company’s mineral reserves and resources is provided in Exhibit 96.1, the Technical Report Summary on the Golden Chest Mine, prepared by the Qualified Persons (“QP”) under Section 1300 of SEC Regulation S-K, Grant A. Brackebusch, P.E., Robert J. Morgan, PG, PLS., and Andrew A. Brackebusch, P.E.
| 23 |
| Table of Contents |
The table below summarizes the Company’s production and exploration-stage properties.
Property |
State & County |
Ownership |
Claims |
Permit Conditions |
Stage |
Mine Type |
Commodity |
Mineralization Style |
Golden Chest Mine |
Idaho, Shoshone |
100% |
86 patented claims (1,322 acres) and 217 unpatented claims (4,300 acres) |
Private land and public land administered by USFS and BLM. All permits required for production in place. |
Production |
Underground/Open Pit |
Au, Ag |
Orogenic gold, veins. |
New Jersey Mill |
Idaho, Shoshone |
Joint Venture (65% Assets, 3,000 tonnes per month) |
Private land (35 acres) and 10 unpatented claims (50 acres). |
Private land, all permits required for production in place. |
Production |
Not Applicable (N/A) |
N/A |
N/A |
Diamond Creek |
Idaho, Lemhi |
100% |
244 unpatented claims (4,900 acres). |
Public land administered by USFS, Plan of Operations in place. |
Exploration |
Underground |
Rare earth elements, Au |
Vein |
Lemhi Pass |
Idaho, Lemhi & Montana, Beaverhead |
100% |
State lease (565 acres) and 568 unpatented claims (11,425 acres). |
Public land administered by Idaho, BLM and USFS. Plan of Operations required. |
Exploration |
Underground/Open Pit |
Rare earth elements |
Vein |
Mineral Hill (formerly Roberts) |
Idaho, Lemhi |
100% |
109 unpatented claims (2,200 acres). |
Public land administered by USFS. Plan of Operations required. |
Exploration |
Underground |
Rare earth elements |
Vein |
Eastern Star |
Idaho, Idaho |
100% |
11 patented claims (220 acres) and 71 unpatented claims (1,420 acres). |
Private land and public land administered by BLM and USFS. Plan of Operations required. |
Exploration |
Underground |
Au, Ag |
Orogenic gold, veins |
Butte Highlands |
Montana, Silver Bow |
25% Joint Venture Interest |
Patented claims (135 acres) and unpatented claims. |
Private land with operating permits from Montana DEQ and USFS. |
Development |
Underground |
Au, Ag |
Orogenic gold, veins |
New Jersey Mine |
Idaho, Shoshone |
100% |
Private land (250 acres) and unpatented claims (130 acres). |
Private land and public land administered by the BLM. Surface mining permit with Idaho. |
Exploration |
Underground/Open Pit |
Au, Ag |
Orogenic gold, veins |
Murray Area |
Idaho, Shoshone |
100% |
Patented claims (590 acres) and 123 unpatented claims (2,460 acres). |
Private land and public land administered by the BLM and USFS. |
Exploration |
Underground |
Au, Ag |
Orogenic gold, veins |
McKinley |
Idaho, Idaho |
100% |
28 unpatented claims (560 acres). |
Public land administered by USFS. |
Exploration |
Underground |
Au, Ag |
Orogenic gold, veins |
Park Copper/Gold |
Idaho, Shoshone |
100% |
5 patented claims (90 acres) |
Private land |
Exploration |
Underground |
Cu, Au, Ag |
Vein |
| 24 |
| Table of Contents |
GOLDEN CHEST MINE
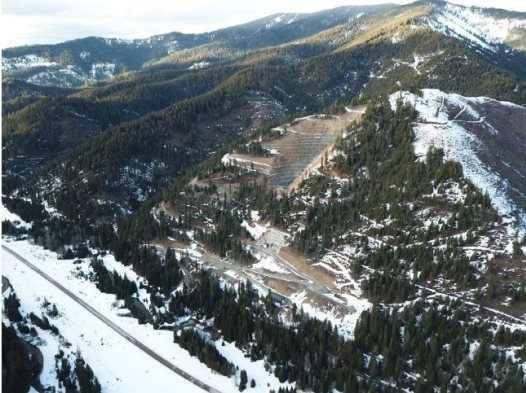
Figure 2 – Aerial Photo of Golden Chest Mine in February 2020
The Golden Chest Mine (“Golden Chest”) is the Company’s only Production Stage mine and is comprised of an underground mine, an open pit mine, and an exploration property located about 1.5 miles east of Murray, Idaho. The Golden Chest includes 86 patented mining claims (1,322 acres) and 217 unpatented claims (4,300 acres). The open pit mine is permitted with IDL and the Company has posted a reclamation bond for an approved reclamation plan. IDR is the operator and owns 100% of Golden Chest, LLC (owner of the Golden Chest). Production from the Golden Chest and an adjacent Area of Interest is subject a 2% NSR payable to Calibre Mining Corporation (“Calibre” formerly Marathon Gold Corporation). The mineralization occurs as gold-quartz veins associated with an orogenic deposit type. Ore from the Golden Chest is processed off-site at the New Jersey Mill in Kellogg, Idaho. For more information concerning the Golden Chest, please refer to the information set forth under the caption “Individual Properties-MATERIAL OPERATING PROPERTIES” and under the caption “Golden Chest Mine” in this Item 2.
NEW JERSEY MILL
Property Location
The New Jersey Mill is a fully permitted, 360-tonne per day, flotation mill and concentrate leach plant (“CLP”) located two miles east of Kellogg, Idaho, in the Coeur d’Alene Mining District. The CLP is permitted with IDEQ. The mill is located on the same property as the New Jersey Mine, adjacent to U.S. Interstate Highway 90 and easily accessed year-round by local roads. Three-phase electrical power is supplied to the New Jersey Mill by Avista Utilities.
Property Ownership and Operation
The New Jersey Mill is operated by IDR. In 2011, IDR signed a joint venture (“JV”) agreement with Crescent Silver, LLC (“Crescent”) to increase the capacity of the New Jersey Mill. Crescent funded the expansion in return for a 35% interest in JV assets plus the right to process 7,000 tonnes of its ore per month. IDR is the JV manager and retains a 65% interest in JV assets as well as the right to process its own ore at the rate of 3,000 tonnes per month and to allocate unused and excess capacity in its role as manager. The property covered by the JV agreement includes the crushing circuit, grinding circuit, gravity circuit, flotation circuit, CLP, buildings, and surface rights over the patented mill site claim. Unpatented mill site claims are also part of the JV.
| 25 |
| Table of Contents |
Present Condition of Plant & Equipment
Mill Expansion and Crescent Ore Processing
The expansion of the New Jersey Mill was completed in 2012, rendering it capable of processing 360 tonnes of sulfide ore per day to produce a single flotation concentrate. The expansion cost approximately $3.2 million, all of which was funded by Crescent under terms of the JV (Ex. 10.1). The expansion project included the installation of a new cone crusher, a new fine ore bin, new conveyors, a new 2.4-meter by 4.0-meter ball mill, additional flotation cells, a new paste thickener, associated pumps, and a new building.
Current Ore Processing Operations
In October 2016, the Company resumed operations at the New Jersey Mill, processing ore extracted from open pit and underground at the Golden Chest. In 2023, the New Jersey Mill processed 40,128 tonnes at an average head grade of 6.71 gpt gold with 92% gold recovery. Since restarting operations at the Golden Chest in October 2016, the Company has milled a total of 289,368 tonnes at the New Jersey Mill.
The New Jersey Mill recycles process water and utilizes a paste tailings disposal process patented by IDR founder Fred Brackebusch to minimize impacts to the environment. By implementing paste tailings processing methods, IDR can recycle process water and prevent the discharge of process water to surface waters. At full capacity, this method saves more than 50 million gallons of water per year. IDR was recognized as a “Pollution Prevention Champion” by IDEQ in 2014 for its efforts to reduce pollution at the New Jersey Mill. The Company submitted a permit for an expansion of its existing tailings storage facility (“TSF”) which was approved. The expansion has enough tailings storage capacity for at least two years. The Company has begun ordering long lead time items for a tailings filtration circuit at the mill as part of a paste backfill plant at the Golden Chest which would slightly extend the life of the TSF. The Company has also submitted a Closure Plan for its cyanide leach circuit which is under review by IDEQ.
As of December 31, 2023, the Company had a net capital cost of $3,524,099 associated with the New Jersey Mill.
Permit Requirements
The New Jersey Mill has all the required environmental permits to operate currently and into the foreseeable. Some permits may require modification if operating conditions change, but typically these changes can be completed without impeding the milling operation. A summary of the permits held by the Company are found in following table:
Permit Descriptions
Permit Description |
Reference |
Idaho Cyanidation Permit for New Jersey Mill |
#CN-0026-001 Idaho Department of Environmental Quality |
|
Tailings Storage Facility New Jersey Mill |
94-7509 Idaho Department of Water Resources |
|
Air Quality Exemption (Crushing) for New Jersey Mill |
Idaho Department of Environmental Quality |
RARE EARTH OVERVIEW
Idaho Strategic controls and operates three REE properties known as Diamond Creek, Mineral Hill (formerly Roberts), and Lemhi Pass. The three properties together make up approximately 19,090 acres of unpatented lode mining claims, and one State of Idaho mineral lease, within Idaho’s 70-mile long REE-Th Belt. All three of Idaho Strategic’s properties have seen substantive historic exploration conducted by the USGS in the 1950s, and more recently by the IGS. IDR has completed numerous geologic mapping programs, surface sampling programs, and has completed one drill program and one trenching program to date on its REE land holdings. While each of the three properties IDR controls are early-stage, the Company considers the properties material to its business due to qualitative factors such as the potential for the company’s properties to be advanced toward future production on an unknown timeline, and the potential importance of REE’s in low-carbon technology and national defense technologies, which could see increased demand in the future. To date, Idaho Strategic has not established any known resources or reserves on its REE properties and plans to continue to advance the projects as funding and permitting allows. For more information concerning the Diamond Creek, Mineral Hill, and Lemhi Pass REE properties, please refer to the information set forth under the caption “Individual Properties-MATERIAL EXPLORATION PROPERTIES” and under their respective caption in this Item 2.
| 26 |
| Table of Contents |
Individual Properties – MATERIAL OPERATING PROPERTIES
GOLDEN CHEST MINE
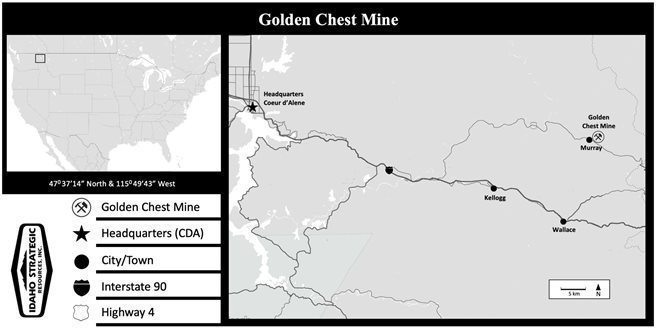
Figure 3 - Golden Chest Mine Location Map
Property and Location
The Golden Chest is a gold Production Stage property comprised of an underground mine, an open pit mine, and an exploration property located about 1.5 miles east of Murray, Idaho, and 115 km east of the city of Coeur d’Alene, Idaho at Latitude 47o37’14” North and Longitude 115o49’43” West. The Golden Chest includes 86 patented mining claims (1,322 acres) and 217 unpatented claims (4,300 acres). The surface mine is permitted with the Idaho Department of Lands and has posted a reclamation bond for an approved reclamation plan. Surface water monitoring is completed as a condition of the permit. The mine is along Forest Highway 9 and is accessible by several improved dirt roads from the paved highway. A three-phase power line was installed at the property in 2014 with power supplied by Avista Utilities.
Property Ownership
The core of the Golden Chest is a contiguous group of 26 patented claims where all modern mining has taken place to date. The Company owns the rights to both the surface and subsurface minerals on all patented claims at the Golden Chest directly and through its 100% held subsidiary Golden Chest, LLC (“GCLLC”), excluding the Joe Dandy Claim where IDR owns only the subsurface mineral rights. The total patented claim position covers 1,322 acres. As these patented claims are considered private lots, legal access is allowed. Property taxes on patented claims are assessed by Shoshone County each year and IDR has paid the taxes in full.
IDR currently maintains 217 unpatented mining claims covering 4,300 acres. The claims have been filed with the BLM agency and at the Shoshone County Courthouse. Annual maintenance fees are paid to the BLM by September 1, and the Golden Chest unpatented claim fees have been paid and are in good standing.
Production from the Golden Chest and an adjacent Area of Interest is subject a 2% NSR payable to Calibre.
Property History
The Golden Chest was developed in the late 1800’s through the early 1900’s as part of the first gold production from the Coeur d’Alene Mining District. Historical accounts vary, but the district is believed to have produced approximately 300,000 ounces of gold from placer sources. It is estimated that the historic hard rock mining at the Golden Chest (prior to IDR’s ownership) produced approximately 65,000 ounces of gold, primarily from shallow, underground, high-grade veins. The Golden Chest Mine is considered to be the largest historic lode producer of gold in northern Idaho.
Modern exploration of the Golden Chest area began in the late 1970’s with several companies, including Cominco-American and Golden Chest Inc. (“GCI”), targeting gold and massive sulfides. Drill tests by GCI included a 200-foot hole from surface that intersected a 60-foot zone containing multiple low-grade gold-bearing quartz veins.
Newmont Exploration Ltd. (“Newmont”) followed GCI’s discovery by evaluating the veins for bulk mineable potential in the late-1980’s. Newmont drilled 35 shallow reverse-circulation and five core holes. In 2010 and 2011, a JV between IDR and Calibre drilled 18,300 meters of core and published a resource report in accordance with Canadian National Instrument 43-101 Standards of Disclosure for Mineral Projects (NI 43-101).
| 27 |
| Table of Contents |
In September 2013, the Skookum Shoot portion of the Golden Chest property was leased to Juniper Mining Company (“Juniper”). Juniper began construction in Q3 2014, spending an estimated $7 to $9 million on mine development and infrastructure, building a modern gold mine that reached production in May 2015. Mining activities continued until September 2015 when Juniper ceased operations and terminated its lease, forfeiting the mine and infrastructure back to GCLLC.
Present Condition, Work Completed, and Exploration Plans
Current Underground Operations
The Golden Chest underground mine is accessed by a primary decline or main access ramp (“MAR”) with a complimentary escape-way incline ramp, and a series of ventilation raises. The primary mining method is underhand drift-and-fill utilizing cemented rock-fill (“CRF”). During 2023, IDR mined a total of 37,780 tonnes of ore at an average grade of 6.36 gpt gold. The ore came from stopes on the H-Vein and Idaho Vein in the Skookum Shoot. The MAR was extended at depth during 2023 to the 778 sublevel which required about 135 meters of ramp development and 100 meters of associated sumps, muck-bays, and raises. Additionally, 435 meters of stope access ramps were completed during the year.
Current Open-Pit Operations
In 2023, IDR finished its open pit mining operation at the Golden Chest which commenced in August of 2016. The Jumbo Pit, which was the last of three pits and was started in 2022, was completed in March 2023. A total of 4,000 tonnes of ore were mined from this pit with 2,350 tonnes mined this year. Since the Jumbo Pit was completed, the Company has focused on mining underground as its only source of ore.
Exploration Plans and Results
Modern exploration, including over 30,000 meters of drilling, reveals six NW-trending ore shoots at Golden Chest that demonstrate strong periodicity, consistent width and spacing, along the Idaho Fault. Most historic production came from the northernmost of these shoots, the Katie-Dora and the Klondike. Current underground mining occurs within the Skookum Shoot and the H-Vein. Excellent exploration potential remains in unmined portions of the northern shoots as well as in the unmined Paymaster and Joe Dandy shoots to the south. During 2022, a total of 6,353 meters of core drilling was completed with drilling at the Klondike, Paymaster, Skookum, Argus, Evans, Ida, and Badger areas. Highlights of the 2022 drilling included drillhole GC 22-212 which intersected 8.77 gpt gold over 9.2 meters in the Klondike area, and GC 22-223 which intersected 16.6 gpt gold over 1.23 meters in the Paymaster area. A majority of the drilling was intended to upgrade and further define mineral resources, however some grassroots exploration drilling also took place in the western portion of the property. A highlight of the grassroots exploration was the discovery of a shallow, broad, low-grade zone at the Argus prospect where AG 22-2 assayed 0.56 gpt gold over 24 meters. The Argus is located about 2.8 kilometers northwest of the active mining area at Golden Chest. During the summer of 2023, an exploration drift 89 meters in length was completed on the southern Jumbo Vein. No high-grade material was encountered, but long-hole drilling is planned to fully explore this area. In the fourth quarter of 2023, a total of 3,740 meters of core drilling (16 holes) were completed at the Golden Chest on the H-Vein and the primary focus was to increase drillhole density enough to upgrade the H-Vein from Mineral Resources to Mineral Reserves which was successful. A highlight of the H-Vein drilling was an intercept in hole GC-23-233 which assayed 18.7 gpt gold over 2.24 meters.
Present Condition of Plant & Equipment
The Golden Chest underground main access ramp was originally developed in 2013 at nominal 4-meter by 4.5-meter cross-section. Additional development by IDR in the MAR has been completed recently. There are several metal buildings on the mine surface constructed from 2012 through 2021 including a core shed with offices, a mine shop, and associated mine dry and warehouse. The mine electrical service is a three-phase, 500 kilo-volt-ampere installation supplied by Avista Utilities.
As of December 31, 2023, the Company had a capitalized development and investment cost of $7,005,353 associated with the Golden Chest.
Geology & Mineralization
Gold mineralization occurs in veins associated with multiple faulting and folding events in the Coeur d’Alene Mining District. The mineralization occurs as gold- quartz veins associated with an orogenic deposit type. The orogenic system at the Golden Chest appears to have an association with igneous rock activity. Hence, the vein deposits may be described as intrusion-related orogenic gold. The principal vein exploited at the Golden Chest in the recent past has been the Skookum Shoot. It is associated with the Idaho Fault and juxtaposes the quartzites of the upper Prichard Formation against finer-grained argillites which is also of the upper Prichard Formation. In mid-2023 after successful drifting on the H-Vein which is approximately 60 meters west of and in the hangingwall of the Idaho Fault, mining was shifted to this vein. The H-Vein occupies the same type of lithologic contrast as the Idaho Vein and is also associated with a fault, the Timberking Fault. The H-Vein has demonstrated significantly higher gold grades than the Skookum Shoot.
| 28 |
| Table of Contents |
Veins occur adjacent to the Idaho Fault both in its footwall, and in its hangingwall where the H-Vein is found. The mineralization occurs in two types of quartz veins, banded and massive. These veins are generally conformable to bedding in the Proterozoic age Prichard Formation. The banded veins, which occur primarily in argillite, contain, pyrite, arsenopyrite, galena, sphalerite, and visible gold. Thicker, massive veins occur in quartzite and contain pyrite, galena, chalcopyrite, sphalerite, scheelite and visible gold.
The table below summarizes the Company’s Mineral Reserves for the past three years. Note that proven and probable reserves were not reported separately for 2021.
Classification |
|
Year |
|
Tonnes |
|
|
Grade (grams gold per tonne) |
|
|
Cut-off (grams gold per tonne) |
|
|
Metallurgical Recovery |
|
||||
Proven and Probable Reserves |
|
2021 |
|
|
38,700 |
|
|
|
4.87 |
|
|
|
2.0 |
|
|
|
93 | % |
Proven Reserves |
|
2022 |
|
|
32,039 |
|
|
|
4.37 |
|
|
|
2.0 |
|
|
|
93 | % |
Probable Reserves |
|
2022 |
|
|
21,715 |
|
|
|
5.26 |
|
|
|
2.0 |
|
|
|
93 | % |
Total Proven and Probable Reserves |
|
2022 |
|
|
53,754 |
|
|
|
4.73 |
|
|
|
2.0 |
|
|
|
93 | % |
Proven Reserves |
|
2023 |
|
|
78,935 |
|
|
|
7.21 |
|
|
|
3.2 |
|
|
|
93 | % |
Probable Reserves |
|
2023 |
|
|
48,542 |
|
|
|
5.98 |
|
|
|
3.2 |
|
|
|
93 | % |
Total Proven and Probable Reserves |
|
2023 |
|
|
127,477 |
|
|
|
6.74 |
|
|
|
3.2 |
|
|
|
93 | % |
Notes:
|
1. |
Classification of Mineral Reserves is in accordance with S-K 1300 classification system. |
|
|
|
|
2. |
Mineral Reserves were estimated by Idaho Strategic Resources and reviewed and accepted by the QP’s. |
|
|
|
|
3. |
Mineral Reserves are 100% attributable to Idaho Strategic Resources |
|
|
|
|
4. |
Mineral Reserves are estimated at a cutoff of 3.2 Au PPM (grams/tonne) |
|
|
|
|
5. |
Mineral Reserves are estimated using a 3-year trailing average gold price of $1850/troy ounce. |
|
|
|
|
6. |
Mineral Reserves are contained within the H-Vein and Idaho Vein domains which are both located in the Skookum area. A majority of the Reserve is located in the H-Vein. |
|
|
|
|
7. |
An average mining width of 3 m was used for the Reserves reporting for the Idaho Vein. |
|
|
|
|
8. |
An average mining width of 2.4 m was used for the Reserves reporting for the H-Vein. |
|
|
|
|
9. |
Minimum mining width dilution is accounted for in the estimate. |
|
|
|
|
10. |
Numbers may not add due to rounding. |
|
|
|
The 2023 Mineral Reserve increased over the previous year because more drill holes were completed through the higher-grade H-Vein which resulted in the conversion from Mineral Resources to Mineral Reserves.
Two cut-off grades are used for stope planning, the go/no-go cut-off and the in-stope cut-off. The go/no-go cut-off represents any material that has the potential to be mined but does not have to be mined as part of the operational plan. The go/no-go cut-off is used for initial stope planning as any given stope or sublevel does not have to be mined and should only be mined if it is economic. The go/no-go cut-off is equation is presented in Equation 1.
Equation 1 go/no-go cut-off

| 29 |
| Table of Contents |
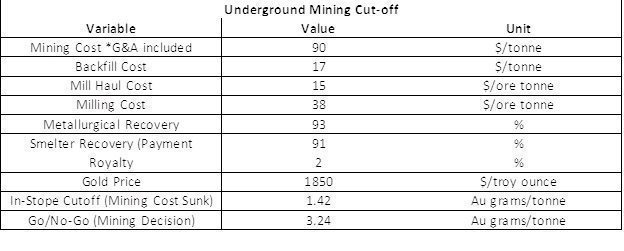
The in-stope cut-off is used when material in a defined stope must be mined to reach higher grades. In this scenario the mining cost is considered sunk and is omitted from Equation 1 as the cost was incurred regardless of the ore/waste determination at the face. Evaluating equation 1 omitting mining cost yields a value of 3.24 gpt which was rounded to 3.2 gpt for the Mineral Reserves.
The table below summarizes the Company’s mineral resources for the year ending December 31, 2023. Resources were calculated by the Company starting on December 31, 2022. An historic resource report was completed by a third party in 2012, but it was not an SK-1300 compliant resource.
Classification |
|
Year |
|
Tonnes |
|
|
Gold Grade (grams gold per tonne) |
|
|
Cutoff (grams gold per tonne) |
|
|
Metallurgical Recovery |
|
||||
Measured |
|
2022 |
|
|
403,724 |
|
|
|
4.57 |
|
|
|
2.0 |
|
|
|
93.0 | % |
Indicated |
|
2022 |
|
|
692,024 |
|
|
|
4.32 |
|
|
|
2.0 |
|
|
|
93.0 | % |
Measured + Indicated |
|
2022 |
|
|
1,095,748 |
|
|
|
4.41 |
|
|
|
2.0 |
|
|
|
93.0 | % |
Inferred |
|
2022 |
|
|
753,502 |
|
|
|
3.44 |
|
|
|
2.0 |
|
|
|
93.0 | % |
Measured |
|
2023 |
|
|
406,605 |
|
|
|
4.10 |
|
|
2.0 UG & 1.4 OP |
|
|
93.0% UG & 85% OP |
|
||
Indicated |
|
2023 |
|
|
665,550 |
|
|
|
4.00 |
|
|
2.0 UG & 1.4 OP |
|
|
93.0% UG & 85% OP |
|
||
Measured + |
|
|
|
|
|
|
|
|
|
|
|
|
|
|
|
|
||
Indicated |
|
2023 |
|
|
1,072,155 |
|
|
|
4.04 |
|
|
2.0 UG & 1.4 OP |
|
|
93.0% UG & 85% OP |
|
||
Inferred |
|
2023 |
|
|
743,793 |
|
|
|
3.23 |
|
|
2.0 UG & 1.4 OP |
|
|
93.0% UG & 85% OP |
|
||
Notes:
|
1. |
Classification of Mineral Resources is in accordance with the S-K classification system. |
|
|
|
|
2. |
Mineral Resources were estimated by IDR staff and reviewed and accepted by the QP’s. |
|
|
|
|
3. |
Mineral Resources are exclusive of Mineral Reserves in the Skookum Zone (includes H-Vein), whereas there are no Mineral Reserves currently at the Paymaster or Klondike Zones. |
|
|
|
|
4. |
Mineral Resources that are not Mineral Reserves do not have demonstrated economic viability. |
|
|
|
|
5. |
Revenues produced at the Golden Chest are subject to a 2% NSR Royalty. |
|
|
|
|
6. |
Bulk density was calculated based on laboratory testing of representative vein samples and applied to the vein shapes. |
|
|
|
|
7. |
Mineral Resources are estimated at 2 grams per tonne (gpt) for each of the underground (UG) zones. The Skookum Zone Surface Portion (OP) of the resource was optimized using Vulcan pit optimizer with historical open pit mining costs and results in a surface resource with a cut-off grade of 1.4 gpt. |
|
|
|
|
8. |
Cutoff values used were calculated using the three-year trailing average gold price of $1850 USD/Troy Oz. |
|
|
|
|
9. |
Numbers may not add due to rounding. |
| 30 |
| Table of Contents |
For more information, see Section 12 of Exhibit 96.1, the Technical Report Summary on the Golden Chest, Idaho, prepared for the Company by the Qualified Persons under Section 1300 of SEC Regulation S-K, Grant A. Brackebusch, P.E., Robert J. Morgan, PG, PLS, and Andrew A. Brackebusch, P.E.
Permit Requirements
The Golden Chest Mine has all the required environmental permits to operate currently and into the foreseeable future. Some permits may require modification if operating conditions change, but typically these changes can be completed without impeding the mining operation. A summary of the permits held by the Company are found in the following table:
Permit Descriptions
Permit Description |
Reference |
|
Idaho Surface Mine Reclamation Plan for Golden Chest |
#S312900 Idaho Department of Lands |
|
US EPA Stormwater Pollution Prevention Plan For New Jersey Mill and Golden Chest Mine |
Multi-Sector General Permit |
|
Idaho Shallow Injection Well for Golden Chest |
#S94X-0026-001 Idaho Department of Water Resources |
In 2023, MSHA did not issue any citations for Section 104 S&S violations associated with the Golden Chest Mine or New Jersey Mill. Reference is made to Exhibit 95 to this report.
| 31 |
| Table of Contents |
Individual Properties–MATERIAL EXPLORATION PROPERTIES
DIAMOND CREEK
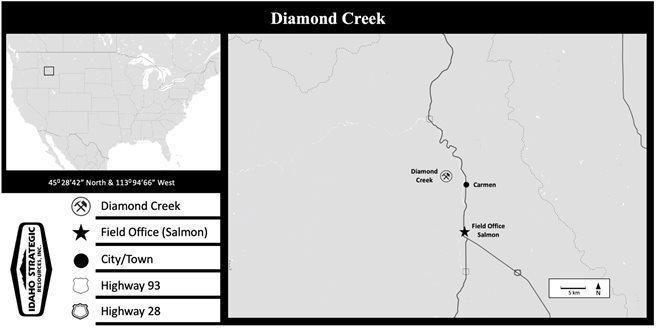
Overview & History
The Diamond Creek Project is a REE Exploration Stage property located approximately 13 kilometers (8 miles) north-northwest of the town of Salmon, Idaho. Diamond Creek is operated by IDR and consists of 244 unpatented lode mining claims situated in the Eureka Mining District Lemhi County, Idaho in Township 23N, Range 21E, Sections 2, 3, 10, 11, 14, 15, 23,25, 26, 27,34,35; Township 22N, Range 21E, Sections 1 and 2 (Boise Meridian) and makes up approximately 4,900 acres.
The Diamond Creek Project is located in the central portion of the Idaho REE-Th Belt. The Diamond Creek mineral claims are located on public lands managed by the USFS. The claims require an annual maintenance fee of $165 per claim per year which must be paid to the BLM by September 1 of each year. The claims fees necessary to obtain and hold the mineral rights at Diamond Creek as well as the investments to explore the project are expensed each year that they are paid. Therefore, Diamond Creek does not show on the Company’s books and does not qualify as a Material Property for financial purposes, rather the Company considers Diamond Creek material to its business due to qualitative factors such as the potential for the company’s projects to be advanced toward future production on an unknown timeline, and the potential importance of rare earth elements in low-carbon technology and national defense technology, which could see increased demand in the future. To date, Idaho Strategic has not established any known mineral reserves or resources on the Diamond Creek property.
Idaho Strategic initially staked the mining claims comprising the Diamond Creek Project in April 2020 and added claims to the group in January 2023. The unpatented lode claims are wholly owned by IDR and there are no underlying royalties on the unpatented lode claims.
The Diamond Creek Project was historically prospected for gold, until the 1950’s when U.S. government sponsored country-wide exploration for raw materials related to nuclear power resulted in the discovery of unique thorium and REE mineralization at Diamond Creek by the USGS and the IGS. Several other companies have undertaken minor rare earths exploration programs on the property including one stage of limited core drilling with some notable REE mineralization encountered. Diamond Creek is mentioned in numerous reports including a USGS report written in 1979 by M.H. Staatz.
Geology and Mineralization
The REE mineralization at Diamond Creek is found in two types: fracture filling and replacement veins/bodies. The replacement bodies are composed of bright and varied oxides. There are at least eight known veins, and they range in width from 0.15 m to 7.6 m in thickness. Vein widths appear best developed in the metasediments and can be traced on the surface for distances ranging from 33.5 m to 780 m. The known rare earth elements mineralization occurs along a 2-mile stretch of the Diamond Creek Fault. The Project consists of four distinct areas identified from north to south as: Contact, Lucky Gem, Simer, and Frank Burch.
| 32 |
| Table of Contents |
Samples taken by the USGS show total REE oxide contents ranging from 0.59% to 5.5%. Work by the USGS in 1979 reported that three samples cut across one of the larger veins were assayed for gold and contained 0.5, 2.4 and 11.9 grams per tonne Au. Down-dip extensions of these mineralized veins have never been sufficiently tested.
Infrastructure and Facilities
The Diamond Creek Project currently does not contain any facilities on-site. The Project is easily accessible by road for approximately 8 months out of the year by nearly any vehicle and is accessible year-round by properly equipped vehicles. There are numerous well maintained forest service roads which provide access to all four distinct areas of the Project. There is power nearby to the Project including a powerline which runs along U.S. Highway 93 approximately 3 miles from Diamond Creek. Idaho Strategic utilizes a combined shop and office building located in the town of Salmon, Idaho to stage equipment, log and process drill core, house company employees, and conduct all other rare earth exploration activities relating to Diamond Creek.
Present Condition & Recent Activities
To date, Idaho Strategic has conducted surface sampling programs and geologic mapping throughout its ownership of the mineral claims from 2020 to present. On November 3, 2022, IDR completed its inaugural 12-hole Diamond Creek drill program which targeted REE mineralization on the northern portion of the Project known as the Contact and Lucky Gem areas. The positive results of the drill program were reported, and highlights from hole DC 22-8 drilled from the Lucky Gem area in the north-central portion of the Project, were reported to include 11.3 meters (m) of 1.3% total rare earth oxide (“TREO”) from 2.9 m to 14.2 m. The drill results included intervals of 1.1 m from 13.1 m to 14.2 m which returned grades of 2.2% TREO. Also discovered in hole DC 22-8 were significant concentrations of niobium. The Company reported 0.7% niobium over 10.1 m from 2.9 m to 13.0 m including the following higher-grade interval of 1.0% niobium over 0.5 m from 9.6 m to 10.1 m. Hole DC 22-8 drilled down dip through the shallow dipping replacement body where mineralization continued for 50.3 meters before the hole was lost.
In addition to the Company’s drill program, Idaho Strategic conducted surface sampling along a 32-meter trench that exposed REE mineralization at the surface during drill pad reclamation at the Lucky Gem drill pad located in the north-central portion of the Project. Vertical channel samples were taken every 1 meter for the first 20 meters of exposure, then every 2 meters for the last 12 meters. The exposed geology displayed evidence of dynamic fluid movement along shears and fracture zones forming both replacement and fracture-filling type deposits.
The results include 32 continuous meters averaging 1.28% TREO, including high values of 2.0% TREO at 8 m and 12 m. In addition to REEs, 12 m niobium mineralization that assayed greater than 0.5% Nb was located between 5 and 16 m.
As part of the Company’s ongoing participation in the Idaho Department of Commerce’s IGEM Program, Idaho Strategic was able to provide approximately sixty 5-gallon buckets of surface material from its Diamond Creek drill pad reclamation efforts to the University of Idaho for their continued studies regarding alternative, environmentally friendly REE extraction and separation methods.
The Company previously obtained all necessary permits to drill the Diamond Creek Project in 2022. After drilling, all reclamation was completed and approved by the USFS. An additional drilling POO has been submitted to the USFS for the 2023-2024 field year. The new POO will expand on the 2022 results at Lucky Gem and Contact areas as well as additional drilling targeting REE mineralization on the southern end of the Diamond Creek Project in the area known as Simer. There is no timeline for drill permit approval or projected timing of work. To date, there has not been a technical report, feasibility study, or resource estimate conducted by Idaho Strategic. The Company has provided a summary of exploration activities in order to provide an overview of Diamond Creek and why the Company views this project favorably. Idaho Strategic has excluded exploration results from this report which either did not return the targeted mineralization, did not aid in providing a brief overview of the Project, or for which the Company has not received the results back from lab testing.
Quality Control Procedures
The procedures taken to ensure quality and reliability of the Company’s samples and assays are as follows:
Representative surface outcrop samples collected over time, in the normal course of business and reported by the company, come from geologic outcrops identified during surface reconnaissance and are mapped/recorded by on-site professional geologist. The samples are identified by a “one-of-a-kind” label and bagged for secure “chain-of-command” transport to a certified assay laboratory. Idaho Strategic geologists use the assay results to interpret geologic mapping, geophysics and geochemistry in order to make an informed decision for targeting purposes. The samples that Company geologists determined warranted further analysis were sent for assay to ALS Minerals. ALS Minerals utilized Ore Grade REE analysis (ME-MS81h).
Drill core samples at Diamond Creek were taken from the drill rig to a secure, Company-owned facility prior to logging by Company geologists. The core is then logged and samples for assay are obtained by sawing the core in half longitudinally while trying to ensure a representative sample is submitted to the laboratory for analysis. All the samples that have been publicly released were analyzed by ALS Minerals using Ore Grade REE analysis (ME-MS81h) and reported niobium results were analyzed using Fusion XRF- NB Ore Grade (Nb-XRF10).
| 33 |
| Table of Contents |
MINERAL HILL
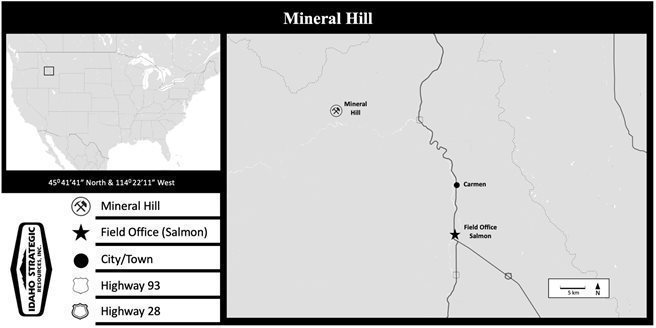
Overview & History
The Mineral Hill Project (formerly Roberts) is a REE Exploration Stage property located approximately 48 kilometers (30 miles) northwest of the town of Salmon, Idaho. Mineral Hill is operated by IDR and consists of 109 unpatented lode mining claims situated in the greater Mineral Hill district in Sections 3,4,9,10,11,13,14,15,16,22,23,24, Township 24 North, Range 19 East and makes up approximately 2,200 acres. The Project is located in the northern portion of the Idaho REE-Th Belt. The Mineral Hill mineral claims are located on USPD land, which is managed by the USFS. The claims require an annual maintenance fee of $165 per claim per year which must be paid to the BLM by September 1 of each year. The claims fees necessary to obtain and hold the mineral rights at Mineral Hill as well as the investments to explore the project are expensed each year that they are paid. Therefore, Mineral Hill does not show on the Company’s books and does not qualify as a material Property for financial purposes, rather the Company considers Mineral Hill material to its business due to qualitative factors such as the potential for the company’s projects to be advanced toward future production on an unknown timeline, and the potential importance of rare earth elements in low-carbon technology and national defense technology, which could see increased demand in the future. To date, Idaho Strategic has not established any known reserves on the Mineral Hill property.
Idaho Strategic initially staked the mining claims comprising the Mineral Hill Project in early 2020. Throughout Idaho Strategic’s ownership of the Project, the Company has staked additional claims at its discretion based upon exploration conducted to date. The unpatented lode claims are wholly owned by IDR and there are no underlying royalties.
The Mineral Hill Project and the greater Mineral Hill district was historically prospected for gold and copper in the early 1900’s. In the early 1950’s rare earth mineralization was discovered and documented by Abbott (1954) and Anderson (1958) from the Idaho Geological Survey and Kaiser (1956) with the USGS. Abbott (1954) reported cutting a 2.5-foot sample across the lode at the Robert Lode which returned 21.5% combined rare earth oxides and thoria.
Geology and Mineralization
The REE mineralization at the Mineral Hill property is associated with a unique group of igneous rocks known as carbonatites. Carbonatites are carbonate rocks sourced from magmatic origins, with primary carbonate compositions exceeding 50%. The Mineral Hill property contains two of the eight known carbonatite occurrences within the Mineral Hill District. The first carbonatite can be found in a northwest-trending seam which measures approximately 400 meters (1,300 feet) long and 90 meters (300 feet) wide; the second occurrence appears to be a smaller carbonatite plug, measuring about 200 meters in diameter.
Infrastructure and Facilities
The Mineral Hill Project currently does not contain any facilities on-site. The Project is accessible by road for approximately 8 months out of the year via National Forest Road 036 (Indian Creek Road). Idaho Strategic utilizes a combined shop and office building located in the town of Salmon, Idaho, to stage equipment, log and process samples, house company employees, and conduct all other rare earth exploration activities relating to Mineral Hill.
| 34 |
| Table of Contents |
Present Condition & Recent Activities
From 2020 to present, Idaho Strategic has conducted surface sampling, geophysical surveys and geologic mapping is select areas of its mineral claims. The Mineral Hill Project has two carbonatite prospects with REE mineralization, the “Upper Roberts” and the “Lower Roberts”, which are located about 500 meters apart. The Upper Roberts occurrence outcrops along a northwest strike for greater than 400 meters and demonstrates high-grade REE mineralization in a number of surface samples. One sample taken by Company geologists returned assays of combined rare earth elements oxide in excess of 34%, including 3% neodymium. The company’s samples show critical REEs like neodymium, praseodymium, and samarium in abundance. Similarly, as with IDR’s Diamond Creek property, REE’s are not the only valuable commodities. Gold and niobium may also be in profitable concentration as by-products. Recent samples collected from the Mineral Hill property, show assays with gold values up to 8.8 grams per ton and niobium as high as 0.50%. Exploration plans include further geologic mapping, sampling, and geophysical surveys in order to prepare the project for its inaugural drill program. The permitting process for a drill program at Mineral Hill is underway and any future drilling activities will be subject to permit approval and funding.
Moving forward, Idaho Strategic plans to advance the Mineral Hill Project by developing drill targets aimed at verifying the extent and grade of the two carbonatites that the Company’s geologists have identified and mapped from the surface. There is no timeline for drill permit approval or projected timing of work. To date, there has not been a technical report, feasibility study, or resource estimate conducted by Idaho Strategic. The Company has provided a summary of exploration activities in order to provide an overview of Mineral Hill and why the Company views this project favorably. Idaho Strategic has excluded exploration results from this report which either did not return the targeted mineralization, did not aid in providing a brief overview of the Project, or for which the Company has not received the results back from lab testing.
Quality Control Procedures
The procedures taken to ensure quality and reliability of the Company’s samples and assays are as follows:
Representative surface outcrop samples collected over time, in the normal course of business and reported by the company, come from geologic outcrops identified during surface reconnaissance and are mapped/recorded by on-site professional geologist. The samples are identified by a “one-of-a-kind” label and bagged for secure “chain-of-command” transport to a certified assay laboratory. Idaho Strategic geologists use the assay results to interpret geologic mapping, geophysics and geochemistry in order to make an informed decision for targeting purposes. The samples that Company geologists determined warranted further analysis were sent for assay to ALS Minerals. ALS Minerals utilized Ore Grade REE analysis (ME-MS81h).
| 35 |
| Table of Contents |
LEMHI PASS
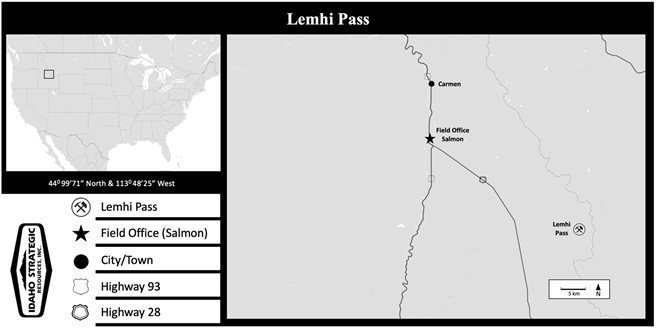
Overview & History
The Lemhi Pass Project is a REE and thorium Exploration Stage property located approximately 41 kilometers (25 miles) southeast of the town of Salmon, Idaho and stretches into Montana. Lemhi Pass is operated by IDR and consists of 568 total unpatented lode mining claims situated in the McDevitt Mining District, Lemhi County, Idaho in Township 19N, Range 24E, Sections 1, 2, 11, 12, 13, 14, 24; Township 19N, Range 25E, Sections 4, 5, 6, 7, 8, 9, 10, 15, 21, 22 (Boise Meridian) and in the Bloody Dick Mining District, Beaverhead County, Montana in Township 10S, Range 15W, Sections 20, 21, 22, 27, 28, 29, 34, 35 and Township 11S, Range 15W, Sections 10, 11, 14, 15, PB 38. Additionally, IDR has a mineral lease on 565 acres with the State of Idaho for T19N, Range 25E, Section 16. The Project is located in the southern portion of the Idaho REE-Th Belt and straddles the ID-MT border. The property package is mainly contiguous and makes up approximately 11,990 acres. Approximately 407 unpatented lode claims are situated in Idaho, while the remaining 161 unpatented lode claims are situated in Montana.
The claims fees and lease fees necessary to obtain and hold the mineral rights at Lemhi Pass as well as the investments to explore the project are expensed each year that they are paid. Therefore, Lemhi Pass does not show on the Company’s books and does not qualify as a material Property for financial purposes, rather the Company considers Lemhi Pass material to its business due to qualitative factors such as the potential for the company’s projects to be advanced toward future production on an unknown timeline, and the potential importance of rare earth elements and thorium in low-carbon technology and national defense technology, which could see increased demand in the future. To date, Idaho Strategic has not established any known reserves on the Lemhi Pass Project.
Idaho Strategic initially staked the mining claims comprising the Lemhi Pass Project in October 2021 and have added claims, based upon exploration, to the group in February 2022 and again in January 2023. The unpatented lode claims are wholly owned by IDR and there are no underlying royalties on the unpatented lode claims. The Lemhi Pass mineral claims are located on BLM land and require an annual maintenance fee of $165 per claim per year which must be paid to the BLM by September 1 of each year. The State of Idaho mineral lease has a term of 20 years with an annual rent of $1,695, increased annually by 3%. The State of Idaho mineral lease has a minimum annual royalty of $1,000 years 1 through 5; $2,500 years 6 through 20.
The Lemhi Pass Project was historically prospected for gold and copper until 1949 when its unique geologic setting was recognized by the USGS and the IGS during the U.S. government sponsored country-wide exploration for raw materials related to nuclear power. These campaigns resulted in the discovery of thorium in several areas of Lemhi County, including the REE occurrences in the Lemhi Pass area. Several other companies have undertaken minor thorium-related exploration programs on the property, including historic reports of past thorium production. Lemhi Pass is mentioned in numerous reports including the 2009 USGS Circular 1336 titled “Thorium Deposits of the United States – Energy Resources for the Future?” which features parts of the Company’s Lemhi Pass Project on its cover page.
| 36 |
| Table of Contents |
Geology and Mineralization
The Company initially staked the Lemhi Pass Project to target an area with the greatest concentration of known veins where the Lemhi Pass, Dan Patch, and Bull Moose faults intersect or approach one another. REE and thorium mineralization at Lemhi Pass is found primarily in the REE mineral monazite. Monazite is a phosphate mineral and most of the Company’s strongest REE values are associated with phosphorus. The monazite at Lemhi Pass occurs as opaque, subhedral, yellow-green to reddish-brown crystals which are mostly microscopic in size, making it hard to detect with the naked eye. Samples taken by the USGS of 31 vein samples, showed TREO contents ranging from 0.073% to 2.20% Staatz (1972a). IDR sampling in 2023 showed total rare earths assays up to 5% validating Company belief that the Lemhi Pass District is largely underexplored for REE’s; since their discovery in the district was ancillary, to the government’s search for nuclear related fuels in the 1950’s.
Infrastructure and Facilities
The Lemhi Pass Project currently does not contain any facilities on-site. Portions of the Lemhi Pass Project are accessible year-round by properly equipped vehicles. There are numerous well maintained forest service roads which provide further access to the Project; however, those roads are not well maintained during the winter months. There is power nearby to the Project including a regional powerline which runs across the Project. Idaho Strategic utilizes a combined shop and office building located in the town of Salmon, Idaho to stage equipment, log and process samples, house company employees, and conduct all other rare earth and thorium exploration activities relating to Lemhi Pass.
Present Condition & Recent Activities
To date, Idaho Strategic has conducted surface sampling, geologic mapping, and trenching programs throughout its ownership of the mineral claims from 2021 to present. Select Idaho Strategic sample and trench results have revealed rare earth grades ranging from 0.67% TREO to 5% TREO from areas of the project that had not been well tested for REE’s in the past.
Moving forward, Idaho Strategic will continue its surface exploration efforts in order to gather enough information to warrant a drill program. The land stewardship in the Lemhi Pass District has areas under both BLM, USFS and State jurisdiction. To date, there has not been a technical report, feasibility study, or resource estimate conducted by Idaho Strategic. The Company has provided a summary of exploration activities in order to provide an overview of Lemhi Pass and why the Company views this project favorably. Idaho Strategic has excluded exploration results from this report which either did not return the targeted mineralization, did not aid in providing a brief overview of the Project, or for which the Company has not received the results back from lab testing.
Quality Control Procedures
The procedures taken to ensure quality and reliability of the Company’s samples and assays are as follows:
Representative surface outcrop samples collected over time, in the normal course of business and reported by the company, come from geologic outcrops identified during surface reconnaissance and are mapped/recorded by on-site professional geologist. The samples are identified by a “one-of-a-kind” label and bagged for secure “chain-of-command” transport to a certified assay laboratory. Idaho Strategic geologists use the assay results to interpret geologic mapping, geophysics and geochemistry in order to make an informed decision for targeting purposes. The samples that Company geologists determined warranted further analysis were sent for assay to ALS Minerals. ALS Minerals utilized Ore Grade REE analysis (ME-MS81h).
Internal Controls on Exploration and Development Drilling Programs
Exploration and development drilling programs are performed using industry standard quality control methods for drilling, logging, sampling, and analytical procedures. The laboratory used by IDR for sample preparation and analyses is: American Analytical Services, Inc. (“AAS”), located at 59148 Silver Valley Rd, Osburn, ID 83849. AAS is ISO 17025 Certified for Mineral and Ore Chemical Testing. Fire assaying is the only method used to quantify gold in core samples and muck samples. Occasionally Atomic Absorption is use for multi-element analysis.
IDR’s Quality Assurance/Quality Control (“QA/QC”) program has been in place since the GCLLC JV in 2011. The QA/QC program consists of inserting blanks and commercially certified standards into the sample stream. A blank or a standard is inserted into the sample sequence at least every 10 samples. All standards are commercially certified and have been prepared in advance by accredited labs. The QP’s reviewed the results of blank assay and only 2 of 327 samples returned an assay greater than the detection limit for fire assay, 0.060 gpt gold.
For all the samples processed by AAS on behalf of GCLLC/IDR, the following methods were used to obtain a fire assay for gold. Samples received at AAS are sorted and coded. They are then placed in the sample drying room and dried at 60°C. All drill samples are collected from the rig daily by mine staff and transported to the locked and secure mine office/core shed building. Sample security has relied upon the fact that the samples were always attended or locked in appropriate sample storage areas. Samples remain within the custody of staff up to the moment the samples are delivered to the laboratory at which time AAS assumes custody. Chain of custody procedures include filling out sample submittal forms that are sent to the laboratory with sample shipments to make certain that all samples are received by the laboratory.
| 37 |
| Table of Contents |
The sampling methods meet industry standard practices and are adequate for mineral resource and mineral reserve estimation and mine planning purposes. Sampling was conducted by appropriately qualified personnel under direct supervision of appropriately qualified geologists.Sample collection procedures used meet industry best practices. Sample preparation procedures meet industry best practices. QA/QC results produce acceptable results. Security procedures are consistent with industry standards. The databases are managed in a secure area using modern, commonly used software by trained staff. The staff are experienced in the nuances of narrow vein mining and treat the model with their experience in mind.
Drillhole logs are completed using Microsoft Excel and are only accessible by mine technical staff and timestamped at the last time of change. Geologic interpretation and solid modeling are accomplished using Leapfrog. Survey volumes, block modeling, and estimation of Mineral Reserves is accomplished using Maptek’s Vulcan. Data is stored at the mine site and backed up to a separate server stored at the corporate office quarterly.
ITEM 3. LEGAL PROCEEDINGS
None.
ITEM 4. MINE SAFETY DISCLOSURES
The information concerning mine safety violations or other regulatory matters required by Section 1503(a) of the Dodd-Frank Wall Street Reform and Consumer Protection Act and Item 104 of Regulation S-K is included in Exhibit 95 to this report.
| 38 |
| Table of Contents |
PART II
ITEM 5. MARKET FOR COMMON EQUITY AND RELATED STOCKHOLDER MATTERS
Market Information
The Company’s Common Stock currently trades on the American tier of the NYSE Market under the symbol “IDR”.
As of March 1, 2024, there were approximately 1,200 shareholders of record of the Company’s Common Stock.
Dividend Policy
The Company has not declared or paid cash dividends or made distributions in the past and the Company does not anticipate that it will pay cash dividends or make distributions in the foreseeable future. The Company currently intends to retain and reinvest future earnings, if any, to finance its operations.
Transfer Agent
The transfer agent for the Company’s Common Stock is Equinity Trust Company, LLC: 48 Wall Street, Floor 23, New York, NY 10005.
Securities Authorized for Issuance Under Equity Compensation Plans
In April 2014 the Board of Directors of the Company established a stock option plan (“2014 Equity Incentive Compensation Plan”) to authorize the granting of stock options to officers and employees. Upon exercise of the options, shares are issued from the available authorized shares of the Company.
In May 2023, a new equity incentive plan (“2023 Equity Incentive Compensation Plan”) was voted on, and approved, by the shareholders of the Company. This plan allows for the issuance of up to 1,225,600 shares of the Company’s common stock in the form of stock options (which may be incentive stock options or nonqualified stock options) or other stock-based awards, such as stock appreciation rights, restricted stock, restricted stock units and performance shares. As of December 31, 2023, there have been no awards made under this new plan.
No additional fees are paid for attendance at Board of Directors’ meetings, committee membership or committee chairmanship.
Equity Compensation Plan Information
Plan Category |
|
Number of securities to be issued upon exercise of outstanding options, warrants and rights |
|
|
Weighted-average exercise price of outstanding options, warrants and rights |
|
|
Number of securities remaining available for future issuance under equity compensation plans (excluding securities reflected in column (a)) |
|
|||
|
|
(a) |
|
|
(b) |
|
|
(c) |
|
|||
2014 Equity Incentive Compensation Plan approved by the board |
|
|
477,449 |
|
|
$ | 5.47 |
|
|
|
0 |
|
2023 Equity Incentive Compensation Plan approved by the board and shareholders |
|
|
0 |
|
|
|
0 |
|
|
|
1,225,600 |
|
Equity compensation plans not approved by the board |
|
|
0 |
|
|
|
0 |
|
|
|
0 |
|
Total |
|
|
477,449 |
|
|
$ | 5.47 |
|
|
|
1,225,600 |
|
| 39 |
| Table of Contents |
Recent Sales of Unregistered Securities
In the event that the Company pays for goods and services with restricted common stock the policy is to determine the fair value of the goods or services to determine the number of corresponding shares to be issued. When applicable, an agreed upon price for our common stock is used that considers the bid/offer price as quoted by the NYSE-American.
The Company closed a private placement in February 2023. Under the private placement, the Company sold 123,365 shares at $5.50 per share and 35,088 shares at $5.70 per share for net proceeds of $878,503.
In the first quarter of 2022, 23,057 shares were issued in exchange for outstanding warrants for net proceeds of $68,006. In the second quarter of 2022, 70,919 shares were issued in exchange for outstanding warrants for net proceeds of $397,147. In the third quarter of 2022, 100,893 shares were issued in exchange for outstanding warrants for net proceeds of $565,005.
In the first quarter of 2022 the Company issued 3,572 shares of common stock at $9.05 per share for services provided for a total value of $32,326.
In 2022 the Company issued 392,866 shares of the Company’s Stock in exchange for $1,950,000 of convertible debt at $4.96 per share.
In 2022, the Company issued 67,355 shares of its common stock in exchange for 116,078 outstanding options in a cashless option exercise to non-management employees with a fair value at the time of exercise of $677,928.
ITEM 6. [RESERVED]
Not Applicable.
| 40 |
| Table of Contents |
ITEM 7. MANAGEMENT’S DISCUSSION AND ANALYSIS OF FINANCIAL CONDITION AND RESULTS OF OPERATIONS
Plan of Operation
Idaho Strategic is a gold producer and critical minerals/REE exploration company focused on a diversified asset base and cash flows from operations. Its portfolio of mineral properties are located in the historic producing silver and gold districts of the Coeur d’Alene Mining region of north Idaho and the Elk City region of north-central Idaho, as well as the historic REE-Th Belt located near the city of Salmon in central Idaho.
The Company’s plan of operation is to generate positive cash flow, increase its gold production and asset base over time while being mindful of corporate overhead. The Company’s management is focused on utilizing its in-house technical and operating skills to build a portfolio of producing mines and milling operations with a focus on gold production and exploration for REEs.
The Company’s gold properties include: the Golden Chest (currently in production), and the New Jersey Mill (majority ownership interest), as well as the Eastern Star exploration property and other less advanced properties. The Company’s primary focus as it relates to its gold properties is to continue to grow production at the Golden Chest Mine and look to reinvest the cash flow into both the Golden Chest, the New Jersey Mill, and furthering its exploration efforts near the Golden Chest, as well as at its REE properties.
In addition to its gold properties, Idaho Strategic has three REE exploration properties in Idaho known as Lemhi Pass, Diamond Creek, and Mineral Hill. The Company’s expansion into REE’s came about in an effort to diversify its holdings towards the anticipated demand for these elements in the electrification of motorized vehicles and a renewed focus on the United States’ domestic critical minerals supply chain security. To date, Idaho Strategic has conducted numerous exploration programs on its REE properties which include drilling, trenching, sampling, and mapping of certain areas within the Company’s 19,090-acre landholdings.
Idaho Strategic has been able to leverage its track record of operations and experience in mining, milling, and exploring at the Golden Chest to develop relationships with different state government agencies, universities, national labs, and other government and non-government entities to advance its REE exploration activities on multiple fronts. Idaho Strategic plans to continue to look for additional partnerships to find mutually beneficial solutions to advance the U.S.’ domestic REE supply chain.
Critical Accounting Estimates
The SEC has requested that all registrants address their most critical accounting policies. The SEC has indicated that a “critical accounting policy” is one which is both important to the representation of the registrant’s financial condition and results and requires management’s most difficult, subjective, or complex judgments, often because of the need to make estimates about the effect of matters that are inherently uncertain. We base our estimates on experience and on various other assumptions our management believes to be reasonable under the circumstances, the results of which form the basis for making judgments about carrying values of assets and liabilities that are not readily apparent from other sources. Actual results will differ and may differ materially from these estimates under different assumptions or conditions. Additionally, changes in accounting estimates could occur in the future from period to period. Our management has discussed the development and selection of our most critical financial estimates with the Audit and Finance Committee of our Board of Directors. The following paragraphs identify our most critical accounting policies:
Our concentrate sales sometimes involve variable consideration, as they can be subject to changes in metals prices between the time of shipment and their final settlement. However, we can reasonably estimate the transaction price for the concentrate sales at the time of shipment using forward prices for the estimated month of settlement, and previously recorded sales and accounts receivable are adjusted to estimated settlement metals prices until final settlement for financial reporting purposes. The embedded derivative contained in our concentrate sales is adjusted to fair value through earnings each period prior to final settlement. It is unlikely a significant reversal of revenue for any one concentrate lot will occur. As such, we use the expected value method to price the concentrate until the final settlement date occurs, at which time the final transaction price is known. At December 31, 2023, metals that had been sold but not final settled included 5,176 ounces of gold of which 3,320 ounces were sold at a predetermined price with the remaining 1,856 ounces exposed to future price changes. The Company has received provisional payments on the sale of these ounces with the remaining amount due reflected in gold sales receivable.
The asset retirement obligation and asset on our balance sheet is based on an estimate of the future cost to recover and remediate our properties as required by our permits upon cessation of our operations and may differ when we cease operations. At December 31, 2023, we made an estimate that the cost of the machine and man hours probable to be needed to put our properties in the condition required by our permits once we cease operations would be $104,000 for the Golden Chest property and $224,000 for the New Jersey Mine and Mill. For purposes of the estimate, we evaluated the expected life in years and costs that, initially, are comparable to rates that we would incur at the present. We are adding to the liability each year, and amortizing the asset over the estimated life, which decreases our net income in total each year. We make periodic reviews of the remaining life of the mine and other operations, and the estimated remediation costs upon closure, and adjust our account balances accordingly. At this time, we think that an adjustment in our asset recovery obligation is not required, and an adjustment in future periods would not have a material impact in the year of adjustment but would change the amount of the annual accretion and amortization costs charged to our expenses by an undetermined amount.
| 41 |
| Table of Contents |
Golden Chest Highlights for 2023 include:
|
· |
Produced a total of 8,247 ounces of gold contained in concentrates and doré. |
|
· |
Commenced mining of the high-grade H-Vein at the Golden Chest mine. |
|
· |
Mined 37,780 tonnes of ore from underground at the Golden Chest Mine at an average grade of 6.36 gpt gold and completed 135 meters of development to the MAR and 100 meters of associated sumps, muck-bays, and raises. Additionally, 435 meters of stope access ramps were completed during the year. |
|
· |
Mined 2,350 tonnes of ore from the Jumbo pit at an average grade of 12.40 gpt gold. |
|
· |
Processed 40,130 dry metric tonnes at the Company’s New Jersey Mill with an average gold head grade of 6.71 gpt and gold recovery of 92%. |
|
· |
Completed approximately 3,740 meters of core drilling at the Golden Chest to convert H-Vein Mineral Resources to Mineral Reserves. |
|
· |
A highlight of the core drilling was GC-22-233 which intercepted 18.7 gpt gold over 2.24 meters in the H-Vein. |
|
· |
Completed mining in the open pit and transitioned fulltime to underground production. |
REE Exploration Highlights for 2023 include:
|
· |
Trenched up to 5% total REE’s at Lemhi Pass - including magnet REE concentrations in excess of 70%. |
|
· |
Sampled 28.2% and 34.1% TREO at the Company’s Mineral Hill REE project. |
|
· |
Added to the Company’s Mineral Hill REE landholdings and expanded the strike length of known REE mineralization over 0.5 miles. |
|
· |
Provided numerous REE samples to collaborative partners from various national laboratories, universities, and government agencies. |
Corporate Highlights for 2023 include:
|
· |
Achieved the first full year of profitability from production in Company history and recorded its fifth consecutive quarter of profitability. |
|
· |
Announced the addition of Carolyn Turner to the Company’s Board of Directors. |
Results of Operations
Our financial performance for the years ended December 31, 2023, and 2022 is summarized below:
|
· |
Revenue from concentrate sales increased 42.6% to $13,656,733 for the year ending December 31, 2023, compared to $9,580,189 for the comparable period in 2022. The increase was due to 2,001 more ounces of gold sold during the year, as well as higher gold prices recognized on concentrate sales. Another contributing factor to the increase was that a majority of ore processed during the year came from underground in the H-vein, whereas in 2022, ore was sourced from a combination of open pit and underground. We anticipate ore from the H-vein to be the primary source of ore for 2024. |
|
· |
Gross profit for the year ended December 31, 2023 was $3,965,036 compared to a gross profit of $1,553,921 in 2022. This resulted in an increase in gross profit as a percentage of sales from 16.2% in 2022 to 29.0% in 2023. This increase is attributable to the higher head grade including H-Vein ore processed at the Company’s New Jersey Mill, as well as higher gold prices recognized on concentrate sales. |
|
· |
Net income for the year ended December 31, 2023 was $1,073,449 compared to a net loss for the year ended December 31, 2022 of $2,631,092. The change from net loss to net profit was primarily due to the increased gross profit during the year. |
|
· |
The consolidated net profit (loss) included non-cash charges of $1,470,563 ($1,633,492 in 2022) as follows: depreciation and amortization of $1,466,703 ($984,083 in 2022), accretion of asset retirement obligation of $15,952 ($12,691 in 2022), stock based compensation, none in 2023, ($547,275 in 2022), stock issued for services, none in 2023, ($32,326 in 2022), gain on disposal of equipment of $13,026 (loss of $68,641 in 2022), equity income on investment in Buckskin Gold and Silver, Inc. $4,517 ($1,524 in 2022), gain on forgiveness of Small Business Administration (“SBA”) loan, none in 2023, ($10,000 in 2022). |
|
· |
Net income (loss) attributable to Idaho Strategic Resources, Inc. was $1,157,746 and ($2,535,429) in the years ended December 31, 2023, and 2022, respectively. |
|
· |
Gold sales receivable increased to $1,038,867 from $909,997 at December 31, 2023 compared to 2022 as a result of increased gold sales. |
|
· |
The Company saw a decrease in exploration expenses for 2023 largely due to less drilling being done on the Company’s gold properties in 2023, as well as capitalizing a portion of the 2023 drilling that was incorporated into the Mineral Reserve. We anticipate an increase in drilling activity in 2024 over 2023, which may result in an increased exploration expense. |
|
· |
General and administrative costs decreased significantly in 2023 compared to 2022 due to no stock option awards taking place in 2023. |
|
· |
Professional services costs increased in 2023 due to acquisition activity early in the year. This was a one-time expense and is not expected to continue in 2024. |
|
· |
All in sustaining costs for gold production decreased from $1,689.24 in 2022, to $1,279.38 in 2023 as a result of increased efficiencies and improved scheduling and mine sequencing at the Golden Chest, as well as higher grade ore being processed from the H-vein. |
| 42 |
| Table of Contents |
Cash Costs and All In Sustaining Costs (“AISC”) Reconciliation to Generally Accepted Accounting Principles (“GAAP”)
Reconciliation of cost of sales and other direct production costs and depreciation, depletion, and amortization (GAAP) to cash cost per ounce and AISC per ounce (non-GAAP).
The table below presents reconciliations between the most comparable GAAP measure of cost of sales and other direct production costs and depreciation, depletion, and amortization to the non-GAAP measures of cash cost per ounce produced and all in sustaining costs per ounce produced for the Company’s gold production for the years ended December 31, 2023, and 2022. The cost per ounce calculations are based on ounces produced. Upon sale, the Company typically receives payment at an average rate of 88% of ounces produced after smelting and refining charges are deducted.
Cash cost per ounce is an important operating measure that we utilize to measure operating performance. AISC per ounce is an important measure that we utilize to assess net cash flow after costs for pre-development, exploration, reclamation, and sustaining capital. Current GAAP measures used in the mining industry, such as cost of goods sold do not capture all the expenditures incurred to discover, develop, and sustain gold production.
|
|
December 31, |
|
|||||
|
|
2023 |
|
|
2022 |
|
||
Cost of sales and other direct production costs and depreciation, depletion, and amortization |
|
$ | 9,691,697 |
|
|
$ | 8,026,268 |
|
Depreciation, depletion, and amortization |
|
|
(1,466,703 | ) |
|
|
(984,083 | ) |
Change in concentrate inventory |
|
|
(258,368 | ) |
|
|
(404,591 | ) |
Cash Cost |
|
$ | 7,966,626 |
|
|
$ | 6,637,594 |
|
Exploration |
|
|
1,523,221 |
|
|
|
2,110,137 |
|
Less REE exploration costs |
|
|
(613,883 | ) |
|
|
(536,460 | ) |
Sustaining capital |
|
|
1,048,824 |
|
|
|
1,517,984 |
|
General and administrative |
|
|
630,126 |
|
|
|
1,229,603 |
|
Less stock-based compensation and other non-cash items |
|
|
(3,860 | ) |
|
|
(649,409 | ) |
AISC |
|
$ | 10,551,054 |
|
|
$ | 10,309,449 |
|
Divided by ounces produced |
|
|
8,247 |
|
|
|
6,103 |
|
Cash cost per ounce |
|
$ | 966.00 |
|
|
$ | 1,087.60 |
|
AISC per ounce |
|
$ | 1,279.38 |
|
|
$ | 1,689.24 |
|
Financial Condition and Liquidity
|
|
For the Years Ended December 31, |
|
|||||
Net cash provided (used) by: |
|
2023 |
|
|
2022 |
|
||
Operating activities |
|
$ | 2,104,009 |
|
|
$ | (1,817,090 | ) |
Investing activities |
|
|
(2,102,235 | ) |
|
|
(2,368,225 | ) |
Financing activities |
|
|
647,194 |
|
|
|
3,846,828 |
|
Net change in cash and cash equivalents |
|
|
648,968 |
|
|
|
(338,487 | ) |
Cash and cash equivalents, beginning of period |
|
|
1,638,031 |
|
|
|
1,976,518 |
|
Cash and cash equivalents, end of period |
|
$ | 2,286,999 |
|
|
$ | 1,638,031 |
|
The Company has accumulated deficit of approximately $17.2 million at December 31, 2023 and incurred a consolidated net profit in 2023 of $1,073,449. The Company’s working capital at December 31, 2023 is $2,717,976. The Company is currently producing from underground at the Golden Chest. During 2023, production generated positive cash flow from operations of $2,104,009 compared to a negative cash flow from operations of $1,817,090 in 2022. Planned production for the next 18 months indicates a positive cash flow from operations will continue as underground mining of the H-Vein remains the primary source of ore feed for the mill. In prior years, the Company has been successful in raising required funds for ongoing operations from sale of its common stock or borrowing. Management believes it can meet its contractual obligations with continuing cash flows from operations, existing cash, and potential financings for the next 18 months.
ITEM 7A. QUANTITATIVE AND QUALITATIVE DISCLOSURES ABOUT MARKET RISK
Not required for smaller reporting companies.
ITEM 8. FINANCIAL STATEMENTS AND SUPPLEMENTARY DATA
| 43 |
| Table of Contents |
REPORT OF INDEPENDENT REGISTERED PUBLIC ACCOUNTING FIRM
To the shareholders and the board of directors of Idaho Strategic Resources, Inc.
Opinion on the Financial Statements
We have audited the accompanying consolidated balance sheets of Idaho Strategic Resources, Inc. (the “Company”) as of December 31, 2023 and 2022, the related consolidated statements of operations, changes in stockholders’ equity and cash flows for each of the years then ended, and the related notes (collectively referred to as the “financial statements”). In our opinion, the financial statements present fairly, in all material respects, the financial position of the Company as of December 31, 2023 and 2022, and the results of its operations and its cash flows for each of the years then ended, in conformity with accounting principles generally accepted in the United States of America.
Basis for Opinion
These financial statements are the responsibility of the Company’s management. Our responsibility is to express an opinion on the Company’s financial statements based on our audits. We are a public accounting firm registered with the Public Company Accounting Oversight Board (United States) (“PCAOB”) and are required to be independent with respect to the Company in accordance with the U.S. federal securities laws and the applicable rules and regulations of the Securities and Exchange Commission and the PCAOB.
We conducted our audits in accordance with the standards of the PCAOB. Those standards require that we plan and perform the audit to obtain reasonable assurance about whether the financial statements are free of material misstatement, whether due to error or fraud. The Company is not required to have, nor were we engaged to perform, an audit of its internal control over financial reporting. As part of our audits, we are required to obtain an understanding of internal control over financial reporting but not for the purpose of expressing an opinion on the effectiveness of the Company’s internal control over financial reporting. Accordingly, we express no such opinion.
Our audits included performing procedures to assess the risks of material misstatement of the financial statements, whether due to error or fraud, and performing procedures that respond to those risks. Such procedures included examining, on a test basis, evidence regarding the amounts and disclosures in the financial statements. Our audits also included evaluating the accounting principles used and significant estimates made by management, as well as evaluating the overall presentation of the financial statements. We believe that our audits provide a reasonable basis for our opinion.
Critical Audit Matter
The critical audit matter communicated below is a matter arising from the current-period audit of the financial statements that was communicated or required to be communicated to the audit committee and that (1) relates to accounts or disclosures that are material to the financial statements and (2) involved our especially challenging, subjective, or complex judgments. We determined that there are no critical audit matters.
Assure CPA, LLC

We have served as the Company’s auditor since 2003.
Spokane, Washington
March 25, 2024
Firm ID 444
Idaho Strategic Resources, Inc.
Table of Contents
| 44 |
| Table of Contents |
|
|
Page |
|
|
|
|
46 |
|
|
Consolidated Statements of Operations for the years ended December 31, 2023 and 2022 |
|
|
47 |
|
|
|
48 |
|
|
Consolidated Statements of Cash Flows for the years ended December 31, 2023 and 2022 |
|
|
49 |
|
|
50-63 |
|
||
| 45 |
| Table of Contents |
Idaho Strategic Resources, Inc.
Consolidated Balance Sheets
December 31, 2023 and 2022
|
|
2023 |
|
|
2022 |
|
||
ASSETS |
|
|
|
|
|
|
||
Current assets: |
|
|
|
|
|
|
||
Cash and cash equivalents |
|
$ | 2,286,999 |
|
|
$ | 1,638,031 |
|
Gold sales receivable |
|
|
1,038,867 |
|
|
|
909,997 |
|
Inventories |
|
|
876,681 |
|
|
|
618,313 |
|
Joint venture receivable |
|
|
2,080 |
|
|
|
1,926 |
|
Investment in equity security |
|
|
5,649 |
|
|
|
- |
|
Other current assets |
|
|
236,837 |
|
|
|
192,025 |
|
Total current assets |
|
|
4,447,113 |
|
|
|
3,360,292 |
|
|
|
|
|
|
|
|
|
|
Property, plant and equipment, net of accumulated depreciation |
|
|
10,484,457 |
|
|
|
9,923,386 |
|
Mineral properties, net of accumulated amortization |
|
|
7,648,061 |
|
|
|
6,527,561 |
|
Investment in Buckskin Gold and Silver |
|
|
338,769 |
|
|
|
334,252 |
|
Investment in joint venture |
|
|
435,000 |
|
|
|
435,000 |
|
Reclamation bonds |
|
|
251,310 |
|
|
|
327,020 |
|
Deposits |
|
|
285,079 |
|
|
|
76,110 |
|
Total assets |
|
$ | 23,889,789 |
|
|
$ | 20,983,621 |
|
|
|
|
|
|
|
|
|
|
LIABILITIES AND STOCKHOLDERS’ EQUITY |
|
|
|
|
|
|
|
|
Current liabilities: |
|
|
|
|
|
|
|
|
Accounts payable and accrued expenses |
|
$ | 484,221 |
|
|
$ | 579,541 |
|
Accrued payroll and related payroll expenses |
|
|
266,670 |
|
|
|
179,149 |
|
Notes payable related parties, current portion |
|
|
- |
|
|
|
12,226 |
|
Notes payable, current portion |
|
|
978,246 |
|
|
|
859,393 |
|
Total current liabilities |
|
|
1,729,137 |
|
|
|
1,630,309 |
|
|
|
|
|
|
|
|
|
|
Asset retirement obligations |
|
|
286,648 |
|
|
|
262,217 |
|
Notes payable related parties, long term |
|
|
- |
|
|
|
62,957 |
|
Notes payable, long term |
|
|
1,338,406 |
|
|
|
1,315,068 |
|
Total long-term liabilities |
|
|
1,625,054 |
|
|
|
1,640,242 |
|
|
|
|
|
|
|
|
|
|
Total liabilities |
|
|
3,354,191 |
|
|
|
3,270,551 |
|
|
|
|
|
|
|
|
|
|
Commitments and Contingencies (Note 5 and 12) |
|
|
- |
|
|
|
- |
|
|
|
|
|
|
|
|
|
|
Stockholders’ equity: |
|
|
|
|
|
|
|
|
Preferred stock, no par value, 1,000,000 shares authorized; no shares issued or outstanding |
|
|
- |
|
|
|
- |
|
Common stock, no par value, 200,000,000 shares authorized; 12,397,615 and 12,098,070 shares issued and outstanding, respectively |
|
|
34,963,739 |
|
|
|
33,245,622 |
|
Accumulated deficit |
|
|
(17,210,638 | ) |
|
|
(18,368,384 | ) |
Total Idaho Strategic Resources, Inc. stockholders’ equity |
|
|
17,753,101 |
|
|
|
14,877,238 |
|
Non-controlling interest |
|
|
2,782,497 |
|
|
|
2,835,832 |
|
Total stockholders’ equity |
|
|
20,535,598 |
|
|
|
17,713,070 |
|
|
|
|
|
|
|
|
|
|
Total liabilities and stockholders’ equity |
|
$ | 23,889,789 |
|
|
$ | 20,983,621 |
|
The accompanying notes are an integral part of these consolidated financial statements.
| 46 |
| Table of Contents |
Idaho Strategic Resources, Inc.
Consolidated Statements of Operations
For the Years Ended December 31, 2023 and 2022
|
|
2023 |
|
|
2022 |
|
||
|
|
|
|
|
|
|
||
Revenue-gold sales |
|
$ | 13,656,733 |
|
|
$ | 9,580,189 |
|
|
|
|
|
|
|
|
|
|
Cost of sales: |
|
|
|
|
|
|
|
|
Cost of sales and other direct production costs |
|
|
8,224,994 |
|
|
|
7,042,185 |
|
Depreciation and amortization |
|
|
1,466,703 |
|
|
|
984,083 |
|
Total cost of sales |
|
|
9,691,697 |
|
|
|
8,026,268 |
|
|
|
|
|
|
|
|
|
|
Gross profit |
|
|
3,965,036 |
|
|
|
1,553,921 |
|
|
|
|
|
|
|
|
|
|
Other operating expenses: |
|
|
|
|
|
|
|
|
Exploration |
|
|
1,523,221 |
|
|
|
2,110,137 |
|
(Gain) loss on disposal of equipment |
|
|
(13,026 | ) |
|
|
68,641 |
|
Management |
|
|
255,579 |
|
|
|
322,775 |
|
Professional services |
|
|
556,766 |
|
|
|
375,002 |
|
General and administrative |
|
|
630,126 |
|
|
|
1,229,603 |
|
Total other operating expenses |
|
|
2,952,666 |
|
|
|
4,106,158 |
|
|
|
|
|
|
|
|
|
|
Income (loss) from operations |
|
|
1,012,370 |
|
|
|
(2,552,237 | ) |
|
|
|
|
|
|
|
|
|
Other (income) expense: |
|
|
|
|
|
|
|
|
Gain on forgiveness of SBA loan |
|
|
- |
|
|
|
(10,000 | ) |
Equity income on investment in Buckskin Gold and Silver, Inc. |
|
|
(4,517 | ) |
|
|
(1,524 | ) |
Loss on investment in equity securities |
|
|
5,451 |
|
|
|
- |
|
Timber revenue |
|
|
(20,724 | ) |
|
|
- |
|
Interest income |
|
|
(85,491 | ) |
|
|
(12,453 | ) |
Interest expense |
|
|
44,202 |
|
|
|
102,832 |
|
Total other (income) expense |
|
|
(61,079 | ) |
|
|
78,855 |
|
|
|
|
|
|
|
|
|
|
Net income (loss) |
|
|
1,073,449 |
|
|
|
(2,631,092 | ) |
|
|
|
|
|
|
|
|
|
Net loss attributable to non-controlling interest |
|
|
(84,297 | ) |
|
|
(95,663 | ) |
Net income (loss) attributable to Idaho Strategic Resources, Inc. |
|
$ | 1,157,746 |
|
|
$ | (2,535,429 | ) |
|
|
|
|
|
|
|
|
|
Net income (loss) per common share-basic |
|
$ | 0.09 |
|
|
$ | (0.22 | ) |
|
|
|
|
|
|
|
|
|
Weighted average common shares outstanding-basic |
|
|
12,254,539 |
|
|
|
11,783,258 |
|
|
|
|
|
|
|
|
|
|
Net income (loss) per common share-diluted |
|
$ | 0.09 |
|
|
$ | (0.22 | ) |
|
|
|
|
|
|
|
|
|
Weighted average common shares outstanding-diluted |
|
|
12,260,539 |
|
|
|
11,783,258 |
|
The accompanying notes are an integral part of these consolidated financial statements.
| 47 |
| Table of Contents |
Idaho Strategic Resources, Inc.
Consolidated Statements of Changes in Stockholders’ Equity
For the Years Ended December 31, 2023 and 2022
|
|
Common Stock Shares |
|
|
Common Stock Amount |
|
|
Accumulated Deficit Attributable to Idaho Strategic Resources, Inc. |
|
|
Non-Controlling Interest |
|
|
Stockholders’ Equity |
|
|||||
Balance, December 31, 2021 |
|
|
10,940,969 |
|
|
$ | 26,004,756 |
|
|
$ | (15,832,955 | ) |
|
$ | 2,892,001 |
|
|
$ | 13,063,802 |
|
Contribution from non-controlling interest in New Jersey Mill Joint Venture |
|
|
- |
|
|
|
- |
|
|
|
- |
|
|
|
39,494 |
|
|
|
39,494 |
|
Issuance of common stock for cash, net of issuance costs |
|
|
498,799 |
|
|
|
3,681,107 |
|
|
|
- |
|
|
|
- |
|
|
|
3,681,107 |
|
Issuance of common stock for services |
|
|
3,572 |
|
|
|
32,326 |
|
|
|
- |
|
|
|
- |
|
|
|
32,326 |
|
Issuance of common stock for warrants exercised |
|
|
194,869 |
|
|
|
1,030,158 |
|
|
|
- |
|
|
|
- |
|
|
|
1,030,158 |
|
Issuance of common stock for cashless option exercise |
|
|
66,995 |
|
|
|
- |
|
|
|
- |
|
|
|
- |
|
|
|
- |
|
Issuance of options to management, directors, and employees |
|
|
- |
|
|
|
547,275 |
|
|
|
- |
|
|
|
- |
|
|
|
547,275 |
|
Conversion of convertible debt to common stock |
|
|
392,866 |
|
|
|
1,950,000 |
|
|
|
- |
|
|
|
- |
|
|
|
1,950,000 |
|
Net loss |
|
|
- |
|
|
|
- |
|
|
|
(2,535,429 | ) |
|
|
(95,663 | ) |
|
|
(2,631,092 | ) |
Balance, December 31, 2022 |
|
|
12,098,070 |
|
|
$ | 33,245,622 |
|
|
$ | (18,368,384 | ) |
|
$ | 2,835,832 |
|
|
$ | 17,713,070 |
|
|
|
|
|
|
|
|
|
|
|
|
|
|
|
|
|
|
|
|
|
|
Contribution from non-controlling interest in New Jersey Mill Joint Venture |
|
|
- |
|
|
|
- |
|
|
|
- |
|
|
|
30,962 |
|
|
|
30,962 |
|
Issuance of common stock for cash, net of issuance costs |
|
|
299,545 |
|
|
|
1,718,117 |
|
|
|
- |
|
|
|
- |
|
|
|
1,718,117 |
|
Net income (loss) |
|
|
- |
|
|
|
- |
|
|
|
1,157,746 |
|
|
|
(84,297 | ) |
|
|
1,073,449 |
|
Balance, December 31, 2023 |
|
|
12,397,615 |
|
|
$ | 34,963,739 |
|
|
$ | (17,210,638 | ) |
|
$ | 2,782,497 |
|
|
$ | 20,535,598 |
|
The accompanying notes are an integral part of these consolidated financial statements.
| 48 |
| Table of Contents |
Idaho Strategic Resources, Inc.
Consolidated Statements of Cash Flows
For the Years Ended December 31, 2023 and 2022
|
|
2023 |
|
|
2022 |
|
||
|
|
|
|
|
|
|
||
Cash flows from operating activities: |
|
|
|
|
|
|
||
Net income (loss) |
|
$ | 1,073,449 |
|
|
$ | (2,631,092 | ) |
Adjustments to reconcile net income (loss) to net cash provided (used) by operating activities: |
|
|
|
|
|
|
|
|
Depreciation and amortization |
|
|
1,466,703 |
|
|
|
984,083 |
|
Accretion of asset retirement obligation |
|
|
15,952 |
|
|
|
12,691 |
|
Stock based compensation |
|
|
- |
|
|
|
547,275 |
|
Stock issued for services |
|
|
- |
|
|
|
32,326 |
|
(Gain) loss on disposal of equipment |
|
|
(13,026 | ) |
|
|
68,641 |
|
Loss on investment in equity securities |
|
|
5,451 |
|
|
|
- |
|
Equity income on investment in Buckskin Gold and Silver, Inc. |
|
|
(4,517 | ) |
|
|
(1,524 | ) |
Gain on forgiveness of SBA loan |
|
|
- |
|
|
|
(10,000 | ) |
Change in operating assets and liabilities: |
|
|
|
|
|
|
|
|
Gold sales receivable |
|
|
(128,870 | ) |
|
|
(501,810 | ) |
Inventories |
|
|
(258,368 | ) |
|
|
(404,591 | ) |
Joint venture receivable |
|
|
(154 | ) |
|
|
2,516 |
|
Other current assets |
|
|
(44,812 | ) |
|
|
142,418 |
|
Accounts payable and accrued expenses |
|
|
(95,320 | ) |
|
|
(63,062 | ) |
Accrued payroll and related payroll expenses |
|
|
87,521 |
|
|
|
5,039 |
|
Net cash provided (used) by operating activities |
|
|
2,104,009 |
|
|
|
(1,817,090 | ) |
Cash flows from investing activities: |
|
|
|
|
|
|
|
|
Purchases of property, plant, and equipment |
|
|
(772,245 | ) |
|
|
(1,441,874 | ) |
Proceeds from sale of equipment |
|
|
8,500 |
|
|
|
- |
|
Deposits on equipment |
|
|
(285,079 | ) |
|
|
(76,110 | ) |
Additions to mineral properties |
|
|
(1,118,021 | ) |
|
|
(626,541 | ) |
Purchase of reclamation bonds |
|
|
- |
|
|
|
(223,700 | ) |
Refund of reclamation bonds |
|
|
75,710 |
|
|
|
- |
|
Purchase of equity securities |
|
|
(11,100 | ) |
|
|
- |
|
Net cash used by investing activities |
|
|
(2,102,235 | ) |
|
|
(2,368,225 | ) |
Cash flows from financing activities: |
|
|
|
|
|
|
|
|
Sales of common stock and warrants, net of issuance costs |
|
|
1,718,117 |
|
|
|
3,681,107 |
|
Proceeds from exercise of warrants |
|
|
- |
|
|
|
1,030,158 |
|
Principal payments on notes payable |
|
|
(1,026,702 | ) |
|
|
(862,503 | ) |
Principal payments on notes, related parties |
|
|
(75,183 | ) |
|
|
(41,428 | ) |
Contributions from non-controlling interest |
|
|
30,962 |
|
|
|
39,494 |
|
Net cash provided by financing activities |
|
|
647,194 |
|
|
|
3,846,828 |
|
Net change in cash and cash equivalents |
|
|
648,968 |
|
|
|
(338,487 | ) |
Cash and cash equivalents, beginning of year |
|
|
1,638,031 |
|
|
|
1,976,518 |
|
Cash and cash equivalents, end of year |
|
$ | 2,286,999 |
|
|
$ | 1,638,031 |
|
Supplemental disclosure of cash flow information: |
|
|
|
|
|
|
|
|
Interest paid in cash, net of amount capitalized |
|
$ | 44,202 |
|
|
$ | 98,218 |
|
Non-cash investing and financing activities: |
|
|
|
|
|
|
|
|
Deposit applied to purchase of equipment and mineral property |
|
$ | 76,110 |
|
|
$ | 11,694 |
|
Notes payable for equipment purchase |
|
|
1,168,893 |
|
|
|
1,247,237 |
|
Conversion of convertible debt to common stock |
|
|
- |
|
|
|
1,950,000 |
|
The accompanying notes are an integral part of these consolidated financial statements.
| 49 |
| Table of Contents |
Idaho Strategic Resources, Inc.
Notes to Consolidated Financial Statements
1. Description of Business
Idaho Strategic was incorporated as an Idaho corporation on July 18, 1996. The Company’s primary business is exploring for, developing, and extracting gold, and to a lesser extent, silver, and base metal mineral resources in the Greater Coeur d’Alene Mining District of North Idaho. From an operational perspective, the Company produces gold at the Golden Chest located in the Murray Gold Belt area of the world-class Coeur d’Alene Mining District, north of the prolific Silver Valley. With over 7,000 acres of patented and unpatented land, the Company has the largest private land position in the area following its consolidation of the Murray Gold Belt for the first time in over 100-years.
In addition to gold and gold production, the Company maintains an important strategic presence in the U.S. Critical Minerals sector, specifically focused on the more “at-risk” REE’s. Its business strategy is to grow its asset base and mineral production over time while advancing its REE projects. The Company’s Diamond Creek and Mineral Hill REE properties are included the U.S. national REE inventory as listed in USGS, IGS and DOE publications. Both projects are in central Idaho and participating in the USGS Earth MRI program, with the Diamond Creek Project also participating in the Idaho Department of Commerce’s IGEM program.
2. Summary of Significant Accounting Policies
Principles of Consolidation
The consolidated financial statements include the accounts of the Company and its majority-owned subsidiary, the New Jersey Mill JV (“NJMJV”). Intercompany accounts and transactions are eliminated. The portion of NJMJV partially owned by another investor is presented as non-controlling interest on the consolidated balance sheets, statements of operations, and statement of changes in stockholders’ equity.
Accounting for Investments in JVs and Equity Method Investments
Investment in JVs
For JVs where the Company holds more than 50% of the voting interest and has significant influence, the JV is consolidated with the presentation of non-controlling interest. In determining whether significant influence exists, the Company considers its participation in policy-making decisions and its representation on the venture’s management committee.
For JVs in which the Company does not have joint control or significant influence, the cost method is used. For those JVs in which there is joint control between the parties, the equity method is utilized whereby the Company’s share of the ventures’ earnings and losses is included in the statement of operations as earnings in JVs and its investments therein are adjusted by a similar amount. The Company periodically assesses its investments in JVs for impairment. If management determines that a decline in fair value is other than temporary it will write-down the investment and charge the impairment against operations.
Equity Method Investments
Investments in companies and JVs in which we have the ability to exercise significant influence, but do not control, are accounted for under the equity method of accounting. In determining whether significant influence exists, the Company considers its participation in policy-making decisions and representation on governing bodies. Under the equity method of accounting, our share of the net earnings or losses of the investee are included in net income (loss) in the consolidated statements of operations. Upon investment, the Company assesses whether a step up in basis of the investee’s net assets has occurred and, if so, adjust our share of net earnings or losses by related depreciation and amortization expense. We evaluate equity method investments whenever events or changes in circumstance indicate the carrying amounts of such investments may be impaired. If a decline in the value of an equity method investment is determined to be other than temporary, a loss is recorded in earnings in the current period. As changes in ownership percentage of our investments occur, the Company assesses whether we can exercise significant influence and account for under the equity method. If our ownership percentage of the company or venture in which we have an investment changes, we recognize a gain or loss on the investment in the period of change. At December 31, 2023, the Company’s 37% common stock holding of Buckskin Gold and Silver, Inc. (“Buckskin”) is accounted for using the equity method (Note 9).
| 50 |
| Table of Contents |
Idaho Strategic Resources, Inc.
Notes to Consolidated Financial Statements
2. Summary of Significant Accounting Policies (continued)
At December 31, 2023 and 2022, the Company’s percentage ownership and method of accounting for each JV and equity method investment is as follows:
|
|
December 31, 2023 |
|
December 31, 2022 |
|||||||||||||
JV/Equity |
|
% Ownership |
|
|
Significant Influence? |
|
Accounting Method |
|
% Ownership |
|
|
Significant Influence? |
|
Accounting Method |
|||
NJMJV |
|
|
65 | % |
|
Yes |
|
Consolidated |
|
|
65 | % |
|
Yes |
|
Consolidated |
|
Butte Highlands JV |
|
|
50 | % |
|
No |
|
Cost |
|
|
50 | % |
|
No |
|
Cost |
|
Buckskin |
|
|
37 | % |
|
Yes |
|
Equity |
|
|
37 | % |
|
Yes |
|
Equity |
|
Non-controlling Interest
Non-controlling interests in the net assets of consolidated subsidiaries are identified separately from the Company’s stockholders’ equity and its net income (loss). Non-controlling interests represent non-controlling investor’s initial contribution at the date of the original acquisition, ongoing contributions, and percentage share of earnings since inception.
Use of Estimates
The preparation of financial statements in conformity with accounting principles generally accepted in the United States requires management to make estimates and assumptions that affect the amounts reported in the financial statements and accompanying notes for items such as mineral reserves, depreciation lives and methods, potential impairment of long-lived assets and equity method investments, deferred income taxes, settlement pricing of gold sales, fair value of stock based compensation, estimation of asset retirement obligations and reclamation liabilities. Estimates are based on historical experience and various other assumptions that the Company believes to be reasonable. Actual results could differ from those estimates.
Revenue Recognition
Gold Revenue Recognition and Receivables-Sales of gold sold directly to customers are recorded as revenues and receivables upon completion of the performance obligations and transfer of control of the product to the customer. For concentrate sales, the performance obligation is met, the transaction price can be reasonably estimated, and revenue is recognized generally at the time of shipment at estimated forward prices for the anticipated month of settlement. The embedded derivative contained in our concentrate sales is adjusted to fair value through earnings each period prior to final settlement. Due to the time elapsed from shipment to the customer and the final settlement with the customer, prices at which sales of our concentrates will be settled are estimated. Previously recorded sales and accounts receivable are adjusted to estimated settlement metals prices until final settlement by the customer. For sales of doré and metals from doré, the performance obligation is met, the transaction price is known, and revenue is recognized at the time of transfer of control of the agreed-upon metal quantities to the customer by the refiner.
Sales and accounts receivable for concentrate shipments are recorded net of charges by the customer for treatment, refining, smelting losses, and other charges negotiated with the customers. Charges are estimated upon shipment of concentrates based on contractual terms, and actual charges typically do not vary materially from estimates. Costs charged by customers include fixed costs per ton of concentrate and price escalators. Refining, selling, and shipping costs related to sales of doré and metals from doré are recorded to cost of sales as incurred. See Note 13 for more information on our sales of products.
Other Revenue Recognition-Revenue from harvest of raw timber is recognized when the performance obligation under a contract and transfer of control have both been completed. Sales of timber found on the Company’s mineral properties are not a part of normal operations.
Inventories
Inventories include concentrate inventory and supplies inventory. Concentrate inventory is valued at the lower of full cost of production or estimated net realizable value based on current metal prices. Costs consist of mining, transportation, royalties, and milling costs including applicable overhead, depreciation, depletion, and amortization relating to the operations. Costs are allocated based on the stage at which the ore is in the production process. Supplies inventory is stated at the lower of first-in, first-out weighted average cost or estimated net realizable value.
| 51 |
| Table of Contents |
Idaho Strategic Resources, Inc.
Notes to Consolidated Financial Statements
2. Summary of Significant Accounting Policies (continued)
Income Taxes
Income taxes are recognized in accordance with Accounting Standards Codification 740 Income Taxes, whereby deferred income tax liabilities or assets at the end of each period are determined using the tax rate expected to be in effect when the taxes are actually paid or recovered. A valuation allowance is recognized on deferred tax assets when it is more likely than not that some or all of these deferred tax assets will not be realized.
Uncertain tax positions are evaluated in a two-step process, whereby (i) it is determined whether it is more likely than not that the tax positions will be sustained based on the technical merits of the position and (ii) for those tax positions that meet the more-likely-than-not recognition threshold, the largest amount of tax benefit that is greater than 50% likely of being realized upon ultimate settlement with the related tax authority would be recognized.
Fair Value Measurements
When required to measure assets or liabilities at fair value, the Company uses a fair value hierarchy based on the level of independent, objective evidence surrounding the inputs used. The Company determines the level within the fair value hierarchy in which the fair value measurements in their entirety fall. The categorization within the fair value hierarchy is based upon the lowest level of input that is significant to the fair value measurement. Level 1 uses quoted prices in active markets for identical assets or liabilities, Level 2 uses significant other observable inputs, and Level 3 uses significant unobservable inputs. The amount of the total gains or losses for the period are included in earnings that are attributable to the change in unrealized gains or losses relating to those assets and liabilities still held at the reporting date. At December 31, 2023 and 2022, the Company did not have any assets or liabilities that were valued at a fair value measurement other than its gold sales receivable. Due to the time elapsed from shipment to the customer and the final settlement with the customer, management must estimate the prices at which sales of gold concentrates will be settled. Previously recorded sales and accounts receivable are adjusted to estimated settlement metals prices until final settlement by the customer. See Note 13 for further information.
Financial Instruments
The carrying amounts of financial instruments including cash and cash equivalents, reclamation bond, equity method investments, notes payable to related parties, and notes payable approximate their fair values.
Net Income (Loss) Per Share
Net income (loss) per share is computed by dividing net income (loss) attributable to the Company excluding net income (loss) attributable to a non-controlling interest by the weighted average number of common shares outstanding during the year. Diluted net income (loss) per share reflects the potential dilution that could occur from common shares issuable through stock options, warrants, and other convertible securities. For the years ended December 31, 2023, and 2022, Such common stock equivalents are included or excluded from the calculation of diluted net income (loss) per share for each period as follows:
|
|
December 31, 2023 |
|
|
December 31, 2022 |
|
||
Incremental shares included in diluted net income (loss) per share |
|
|
|
|
|
|
||
Stock options |
|
|
6,000 |
|
|
|
- |
|
|
|
|
6,000 |
|
|
|
- |
|
Potentially dilutive shares excluded from diluted net income (loss) per share as inclusion would have an antidilutive effect: |
|
|
|
|
|
|
|
|
Stock options |
|
|
321,449 |
|
|
|
535,953 |
|
Stock purchase warrants |
|
|
289,294 |
|
|
|
289,294 |
|
Total |
|
|
610,743 |
|
|
|
825,247 |
|
Cash and Cash Equivalents
The Company considers cash in banks and other deposits with an original maturity of three months or less when purchased to be cash and cash equivalents. These deposit balances may at times exceed federally insured limits. No losses have been recognized because of these balances.
| 52 |
| Table of Contents |
Idaho Strategic Resources, Inc.
Notes to Consolidated Financial Statements
2. Summary of Significant Accounting Policies (continued)
Property, Plant and Equipment
Property, plant, and equipment are stated at cost. Depreciation and amortization are based on the estimated useful lives of the assets and are computed using straight-line or units-of-production methods. The expected useful lives of most of the Company’s buildings are up to 50 years and equipment life expectancy ranges between 2 and 10 years. When assets are retired or sold, the costs and related allowances for depreciation and amortization are eliminated from the accounts and any resulting gain or loss is reflected in operations.
Mineral Properties
Significant payments related to the acquisition of mineral properties, mineral rights, and mineral leases are capitalized. If a commercially mineable ore body is discovered, such costs are amortized when production begins using the units-of-production method based on estimated reserves. If no commercially mineable ore body is discovered, or such rights are otherwise determined to have no value, such costs are expensed in the period in which it is determined the property has no future economic value.
Consideration received by the Company pursuant to joint ventures or mineral interest agreements is applied against the carrying value of the related mineral interest. When and if payments received exceed the carrying value, the excess amount is recognized as a gain in the consolidated statement of operations in the period the consideration is received.
Interest Capitalization
When capital projects are funded within the reporting period for which cash is paid which could have been used for debt reduction an amount equal to a weighted average interest rate of qualifying outstanding debt of the capital project expenditure in interest expense is capitalized.
Mine Exploration and Development Costs
The Company expenses exploration costs as such in the period they occur. The mine development stage begins once the Company identifies ore reserves which is based on a determination whether an ore body can be economically developed. Expenditures incurred during the development stage are capitalized as deferred development costs and include such costs for drifts, ramps, and infrastructure. Costs to improve, alter, or rehabilitate primary development assets which appreciably extend the life, increase capacity, or improve the efficiency or safety of such assets are also capitalized. The development stage ends when the production stage of ore reserves begins. Amortization of deferred development costs is calculated using the units-of-production method over the expected life of the operation based on the estimated recoverable resources.
Claim Fees
Unpatented claim fees paid at time of staking are expensed when incurred. Recurring renewal fees which are paid annually are recorded as other current assets and expensed over the course of the year.
Impairment of Long-Lived Assets
The Company evaluates the carrying amounts of its long-lived assets for impairment whenever events and circumstances indicate the carrying value may not be recoverable from the estimated future cash flows expected to result from its use and eventual disposition. If such events and circumstances exist, estimated undiscounted future net cash flows from each mineral property are calculated using estimated future production, three-year average metals prices, operating capital and costs, and reclamations costs. If the carrying value exceeds the undiscounted future net cash flows, estimated discounted future net cash flow is calculated. An impairment loss is recognized when the estimated discounted future cash flows expected to result from the use of an asset are less than the carrying amount of the specific asset group. The Company’s estimates of future cash flows are subject to risks and uncertainties. It is reasonably possible that changes in estimates could occur which may affect the expected recoverability of the Company’s investments in mineral properties.
Asset Retirement Obligations and Remediation Costs
Mineral properties are subject to standards for mine reclamation that have been established by various governmental agencies. Asset retirement obligations are related to the retirement of the mine when a contractual obligation has been established and a reasonable estimate of fair value can be determined. These obligations are initially measured at fair value with the resulting cost recognized at the present value of estimated reclamation costs. The liability is accreted, and the asset amortized over the life of the related asset. Adjustments are made for changes resulting from either the timing or amount of the original estimate underlying the obligation. Separate from asset retirement obligations, the Company records liability for remediation costs when a reasonable estimate of fair value can be determined. Accrued remediation costs are not discounted.
| 53 |
| Table of Contents |
Idaho Strategic Resources, Inc.
Notes to Consolidated Financial Statements
2. Summary of Significant Accounting Policies (continued)
Reclamation Bonds
Various laws and permits require that financial assurances be in place for certain environmental and reclamation obligations and other potential liabilities. In 2022 the Company added additional bonds of $132,000 associated with milling operations, and an additional $91,700 in bonds for various exploration and drilling projects resulting in a balance of $327,020 at December 31, 2022. In 2023, the Company deposited $2,890 in additional bonds for trenching activities at Lemhi Pass, and a partial refund of $78,600 occurred after reclaiming the drill pads from drilling the Diamond Creek project in 2022. The remaining amount on this bond is expected to be refunded after revegetation is established. The balance of reclamation bonds at December 31, 2023 is $251,310.
Stock Based Compensation
All transactions in which goods or services are received for the issuance of shares of the Company’s common stock or options to purchase shares of common stock are measured at fair value of the equity interest issued. The fair value of common stock awards is determined based upon the closing price of the Company’s stock on the date of the award. The Company estimates the fair value of stock-based compensation of options using the Black-Scholes model, which requires the input of some subjective assumptions. These assumptions include estimating the length of time employees will retain their vested stock options before exercising them (“expected life”), the estimated volatility of the Company’s common stock price over the expected term (“volatility”), the risk-free interest rate and the dividend yield. Changes in the subjective assumptions can materially affect the estimate of the fair value of stock-based compensation. Any forfeitures of stock options are recognized as they occur.
Investments in Equity Securities
Investments in equity securities are generally measured at fair value. Unrealized gains and losses for equity securities resulting from changes in fair value are recognized in current earnings. If an equity security does not have a readily determinable fair value, we may elect to measure the security at its cost minus impairment, if any, plus or minus changes resulting from observable price changes in orderly transactions for an identical or similar investment in the same issuer. At the end of each reporting period, we reassess whether an equity investment security without a readily determinable fair value qualifies to be measured at cost less impairment, consider whether impairment indicators exist to evaluate if an equity investment security is impaired and, if so, record an impairment loss. At the end of each reporting period, unrealized gains and losses resulting from changes in fair value are recognized in current earnings. Upon sale of an equity security, the realized gain or loss is recognized in current earnings.
Going Concern
The Company is currently profitable and producing from underground at the Golden Chest. This has resulted in a positive cash flow from operations and an increase in working capital. In the past, the Company has been successful in raising required capital from sale of common stock, forward gold contracts, and debt. As a result of its planned production, equity sales and potential debt borrowings or restructurings, management believes cash flows from operations and existing cash are sufficient to conduct planned operations and meet contractual obligations for the next 12 months.
Recent Accounting Pronouncements
Accounting Standards Updates Adopted
In August 2023, the Financial Accounting Standards Board (“FASB”) issued Accounting Standards Update (“ASU”) 2023-05, Business Combinations-Joint Venture Formations (Subtopic 805-60): Recognition and Initial Measurement, which clarifies the business combination accounting for joint venture formations. The amendments in the ASU seek to reduce diversity in practice that has resulted from a lack of authoritative guidance regarding the accounting for the formation of joint ventures in separate financial statements. The amendments also seek to clarify the initial measurement of joint venture net assets, including businesses contributed to a joint venture. The guidance is applicable to all entities involved in the formation of a joint venture. The amendments are effective for all joint venture formations with a formation date on or after January 1, 2025. Early adoption and retrospective application of the amendments are permitted. We do not expect adoption of the new guidance to have a material impact on our consolidated financial statements and disclosures.
In November 2023, the FASB issued ASU 2023-07, Segment Reporting (Topic 280): Improvements to Reportable Segment Disclosures, amending reportable segment disclosure requirements to include disclosure of incremental segment information on an annual and interim basis. Among the disclosure enhancements are new disclosures regarding significant segment expenses that are regularly provided to the chief operating decision-maker and included within each reported measure of segment profit or loss, as well as other segment items bridging segment revenue to each reported measure of segment profit or loss. The amendments in ASU 2023-07 are effective for fiscal years beginning after December 15, 2023, and for interim periods within fiscal years beginning after December 15, 2024, and are applied retrospectively. Early adoption is permitted. We are currently evaluating the impact of this update on our consolidated financial statements and disclosures.
| 54 |
| Table of Contents |
Idaho Strategic Resources, Inc.
Notes to Consolidated Financial Statements
2. Summary of Significant Accounting Policies (continued)
In December 2023, the FASB issued ASU 2023-09, Income Taxes (Topic 740): Improvement to Income Tax Disclosures, amending income tax disclosure requirements for the effective tax rate reconciliation and income taxes paid. The amendments in ASU 2023-09 are effective for fiscal years beginning after December 15, 2024 and are applied prospectively. Early adoption and retrospective application of the amendments are permitted. We are currently evaluating the impact of this update on our consolidated financial statements and disclosures.
Management does not believe that any other recently issued, but not yet effective, accounting standards if currently adopted would have a material effect on the accompanying financial statements.
3. Inventories
At December 31, 2023 and 2022, inventories consisted of the following:
|
|
2023 |
|
|
2022 |
|
||
Concentrate inventory |
|
|
|
|
|
|
||
In process |
|
$ | 28,778 |
|
|
$ | 111,741 |
|
Finished goods |
|
|
239,361 |
|
|
|
111,574 |
|
Total concentrate inventory |
|
|
268,139 |
|
|
|
223,315 |
|
|
|
|
|
|
|
|
|
|
Supplies inventory |
|
|
|
|
|
|
|
|
Mine parts and supplies |
|
|
374,456 |
|
|
|
233,465 |
|
Mill parts and supplies |
|
|
158,402 |
|
|
|
83,963 |
|
Core drilling supplies and materials |
|
|
75,684 |
|
|
|
77,570 |
|
Total supplies inventory |
|
|
608,542 |
|
|
|
394,998 |
|
|
|
|
|
|
|
|
|
|
Total |
|
$ | 876,681 |
|
|
$ | 618,313 |
|
4. Property, Plant and Equipment
Property, plant and equipment at December 31, 2023 and 2022 consisted of the following:
|
|
2023 |
|
|
2022 |
|
||
Mill |
|
|
|
|
|
|
||
Land |
|
$ | 225,289 |
|
|
$ | 225,289 |
|
Building |
|
|
536,193 |
|
|
|
536,193 |
|
Equipment |
|
|
4,192,940 |
|
|
|
4,192,940 |
|
|
|
|
4,954,422 |
|
|
|
4,954,422 |
|
Less accumulated depreciation |
|
|
(1,430,323 | ) |
|
|
(1,249,445 | ) |
Total mill |
|
|
3,524,099 |
|
|
|
3,704,977 |
|
|
|
|
|
|
|
|
|
|
Buildings and equipment |
|
|
|
|
|
|
|
|
Buildings |
|
|
624,657 |
|
|
|
611,382 |
|
Equipment |
|
|
8,786,492 |
|
|
|
6,927,474 |
|
|
|
|
9,411,149 |
|
|
|
7,538,856 |
|
Less accumulated depreciation |
|
|
(3,455,023 | ) |
|
|
(2,324,679 | ) |
Total building and equipment |
|
|
5,956,126 |
|
|
|
5,214,177 |
|
Land |
|
|
|
|
|
|
|
|
Bear Creek |
|
|
266,934 |
|
|
|
266,934 |
|
BOW |
|
|
230,449 |
|
|
|
230,449 |
|
Eastern Star |
|
|
250,817 |
|
|
|
250,817 |
|
Gillig |
|
|
79,137 |
|
|
|
79,137 |
|
Highwater |
|
|
40,133 |
|
|
|
40,133 |
|
Salmon property |
|
|
136,762 |
|
|
|
136,762 |
|
Total land |
|
|
1,004,232 |
|
|
|
1,004,232 |
|
|
|
|
|
|
|
|
|
|
Total |
|
$ | 10,484,457 |
|
|
$ | 9,923,386 |
|
| 55 |
| Table of Contents |
Idaho Strategic Resources, Inc.
Notes to Consolidated Financial Statements
5. Mineral Properties
Mineral properties at December 31, 2023 and 2022 are as follows:
|
|
2023 |
|
|
2022 |
|
||
Golden Chest |
|
|
|
|
|
|
||
Mineral Property |
|
$ | 4,191,189 |
|
|
$ | 4,088,462 |
|
Infrastructure |
|
|
2,814,164 |
|
|
|
1,722,028 |
|
Total Golden Chest |
|
|
7,005,353 |
|
|
|
5,810,490 |
|
New Jersey |
|
|
256,768 |
|
|
|
248,289 |
|
McKinley-Monarch |
|
|
200,000 |
|
|
|
200,000 |
|
Butte Gulch |
|
|
124,055 |
|
|
|
124,055 |
|
Potosi |
|
|
150,385 |
|
|
|
150,385 |
|
Park Copper/Gold |
|
|
78,000 |
|
|
|
78,000 |
|
Less accumulated amortization |
|
|
(166,500 | ) |
|
|
(83,658 | ) |
Total |
|
$ | 7,648,061 |
|
|
$ | 6,527,561 |
|
For the years ended December 31, 2023 and 2022, $102,727 and $48,281, respectively, interest expense was capitalized in Golden Chest mineral property in association with core drilling and the ramp. In February 2024 purchased the surface rights to the Butte Gulch property, see note 15.
Golden Chest
The Golden Chest is an underground mine project currently producing for the Company located near Murray, Idaho consisting of 86 patented and 217 unpatented mining claims. A 2% NSR is payable on production at certain portions of the Golden Chest to a former joint venture partner. Royalty expense of $272,535 and $181,300 was recognized as costs of sales and other direct production costs in the years ended December 31, 2023, and 2022, respectively.
New Jersey
The Coleman property is located at the New Jersey Mine area of interest and consists of 62 acres of patented mining claims, mineral rights to 108 acres of fee land, 80 acres of land for which the Company owns the surface but not the mineral rights, and approximately 130 acres of unpatented mining claims.
McKinley-Monarch
The McKinley-Monarch project is located near the town of Lucille, Idaho. The project consists of 28 unpatented claims totaling 560 acres. The Company started exploring the property in 2013.
Butte Gulch
In 2018, the Company purchased the Butte Gulch property near the Golden Chest. This property consists of 177 acres of patented mining claims, some of which include both the surface and mineral rights, and some of which include only the mineral rights. There is an underlying 2% NSR on all ores mined and shipped from any lode production from the patented claims on the Butte property.
Potosi
In 2018, the Company purchased the Potosi property near the Golden Chest. This property consists of 71 acres of patented mining claims.
Park Copper/Gold
In August 2021, the Company paid $78,000 in cash for 100 acres of patented mineral property in Shoshone County referred to as Park Copper/Gold.
| 56 |
| Table of Contents |
Idaho Strategic Resources, Inc.
Notes to Consolidated Financial Statements
6. Notes Payable
At December 31, 2023 and 2022, notes payable are as follows:
|
|
2023 |
|
|
2022 |
|
||
Building in Salmon, Idaho, 60-month note payable, 7.00% interest rate payable monthly through June 2027, monthly payments of $2,500 with a balloon payment of $260,886 in July 2027 |
|
$ | 297,230 |
|
|
$ | 306,084 |
|
Resemin Muki Bolter, 36-month note payable, 7.00% interest rate payable monthly through January 2025, monthly payments of $14,821 |
|
|
186,557 |
|
|
|
345,268 |
|
Paus 2 yrd. LHD, 60-month note payable, 4.78% interest rate payable through October 2024, monthly payments of $5,181 |
|
|
50,672 |
|
|
|
108,904 |
|
Paus 2 yrd. LHD, 60-month note payable, 3.45% interest rate payable through July 2024, monthly payments of $4,847 |
|
|
33,541 |
|
|
|
89,493 |
|
Two CarryAll transports, 48-month note payable, 5.9% interest rate payable monthly through June 2027, monthly payments of $1,174 |
|
|
44,447 |
|
|
|
- |
|
CarryAll transport, 36-month note payable, 4.5% interest rate payable monthly through June 2024, monthly payments of $627 |
|
|
3,713 |
|
|
|
10,891 |
|
CarryAll transport, 36-month note payable, 4.5% interest rate payable monthly through February 2024, monthly payments of $303 |
|
|
604 |
|
|
|
4,130 |
|
Two CarryAll transports, 36-month note payable, 6.3% interest rate payable monthly through May 2025, monthly payments of $1,515 |
|
|
24,591 |
|
|
|
40,687 |
|
CarryAll transport, 36-month note payable, 6.3% interest rate payable monthly through June 2025, monthly payments of $866 |
|
|
14,843 |
|
|
|
23,987 |
|
Atlas Copco loader, 60-month note payable, 10.5% interest rate payable monthly through June 2023, monthly payments of $3,550 |
|
|
- |
|
|
|
20,660 |
|
Sandvik LH203 LHD, 36-month note payable, 4.5% interest rate payable monthly through May 2024, monthly payments of $10,352 |
|
|
51,182 |
|
|
|
170,182 |
|
Sandvik LH202 LHD, 36-month note payable, 6.9% interest rate payable monthly through August 2025, monthly payments of $4,933 |
|
|
92,948 |
|
|
|
143,812 |
|
Doosan Compressor, 36-month note payable, 6.99% interest rate payable monthly through July 2024, monthly payments of $602 |
|
|
4,126 |
|
|
|
10,820 |
|
Caterpillar 306 excavator, 48-month note payable, 4.6% interest rate payable monthly through November 2024, monthly payments of $1,512 |
|
|
16,251 |
|
|
|
33,216 |
|
Caterpillar 938 loader, 60-month note payable, 6.8% interest rate payable monthly through August 2023, monthly payments of $3,751 |
|
|
- |
|
|
|
29,256 |
|
Caterpillar R1600 LHD, 48-month note payable, 4.5% interest rate payable through January 2025, monthly payments of $17,125 |
|
|
216,880 |
|
|
|
407,909 |
|
Caterpillar AD22 haul truck, 48-month note payable, 6.45% interest rate payable monthly through June 2023, monthly payments of $12,979 |
|
|
- |
|
|
|
76,287 |
|
Caterpillar AD30 haul truck, 40-month note payable, 8.01% interest rate payable monthly through October 2026, monthly payments of $29,656 |
|
|
899,417 |
|
|
|
- |
|
Caterpillar 259D3 skid steer, 36-month note payable, 8.50% interest rate payable monthly through December 2026, monthly payments of $1,836 |
|
|
58,156 |
|
|
|
- |
|
SBA Economic Injury Disaster Loan (“EIDL”) 30 year note payable, 3.75% interest payable monthly through December 2054, monthly payments of $731 |
|
|
160,123 |
|
|
|
163,287 |
|
2022 Dodge Ram, 75-month note payable, 5.99% interest rate payable monthly through June 2028, monthly payments of $1,152 |
|
|
54,418 |
|
|
|
64,648 |
|
2016 Dodge Ram, 75-month note payable, 5.99% interest rate payable monthly through June 2028, monthly payments of $1,190 |
|
|
56,194 |
|
|
|
66,758 |
|
2020 Ford Transit Van, 72-month note payable, 9.24% interest rate payable monthly through December 2028, monthly payments of $1,060 |
|
|
50,759 |
|
|
|
58,182 |
|
Total notes payable |
|
|
2,316,652 |
|
|
|
2,174,461 |
|
Due within one year |
|
|
978,246 |
|
|
|
859,393 |
|
Due after one year |
|
$ | 1,338,406 |
|
|
$ | 1,315,068 |
|
| 57 |
| Table of Contents |
Idaho Strategic Resources, Inc.
Notes to Consolidated Financial Statements
6. Notes Payable, continued
All notes except the SBA EIDL loan are collateralized by the property or equipment purchased in connection with each note. Future principal payments of notes payable at December 31, 2023 are as follows:
2024 |
|
$ | 978,246 |
|
2025 |
|
|
480,977 |
|
2026 |
|
|
369,154 |
|
2027 |
|
|
314,161 |
|
2028 |
|
|
29,183 |
|
2029 |
|
|
3,395 |
|
thereafter |
|
|
141,536 |
|
Total |
|
$ | 2,316,652 |
|
7. Asset Retirement Obligations
The Company has established asset retirement obligations associated with the ultimate closing of its mineral properties where there has been or currently is operations. Obligations were established for the New Jersey Mill in 2014 and the Golden Chest in 2016. Activity for the years ended December 31, 2023 and 2022 is as follows:
|
|
2023 |
|
|
2022 |
|
||
|
|
|
|
|
|
|
||
Balance at January 1 |
|
$ | 262,217 |
|
|
$ | 172,348 |
|
Accretion expense |
|
|
15,952 |
|
|
|
12,691 |
|
Change in asset retirement obligation estimate |
|
|
8,479 |
|
|
|
77,178 |
|
Balance at December 31 |
|
$ | 286,648 |
|
|
$ | 262,217 |
|
The change in the asset retirement obligations estimate during the year ended December 31, 2022 related to the addition of an asset retirement obligation with our New Jersey Mill tailings expansion and a revision to the estimated start of the reclamation process to a later date at our Golden Chest property. The change in the asset retirement obligation estimate during the year ended December 31, 2023 related to revised a revision to the estimated start of the reclamation process and an updated reclamation cost estimate.
8. Joint Venture Arrangements
NJMJV Agreement
In January 2011, the Company and Crescent (formerly United Mine Services, Inc.) entered into a JV agreement relating to the New Jersey Mill. To earn a 35 percent interest in the JV, Crescent provided $3.2 million in funding to expand the processing plant to 15 tonnes/hr. The Company is the operator of the JV and charges operating costs to Crescent for milling its ore up to 7,000 tonnes/month, retain a milling capacity of 3,000 tonnes/month, and as the operator of the JV, receive a fee of $2.50/tonne milled. No ore has been milled for Crescent since 2013. As of December 31, 2023 and 2022, an account receivable existed with the NJMJV from Crescent for $2,080 and $1,926, respectively.
Butte Highlands JV
On January 29, 2016, the Company purchased a 50% interest in Butte Highlands JV, LLC (“BHJV”) for a total consideration of $435,000. Highland Mining, LLC (“Highland”) is the other 50% owner and manager of the JV. Under the operating agreement, Highland will fund all future project exploration and mine development costs. The Agreement stipulates that Highland is manager of the JV and will manage BHJV until such time as all mine development costs, less $2 million are distributed to Highland out of the proceeds from future mine production. The Company has determined that because it does not currently have significant influence over the JV’s activities and accounts, it will continue to account for its investment on a cost basis.
| 58 |
| Table of Contents |
Idaho Strategic Resources, Inc.
Notes to Consolidated Financial Statements
9. Investment in Buckskin
In August 2021, the Company exchanged 45,940 shares of the Company’s common stock for 22% of Buckskin. The Company’s closing share price on the date of the agreement (August 18, 2021) was recorded as the cost basis for the investment. In October 2021 the Company exchanged an additional 30,358 shares of the Company’s common stock for an additional 15% of Buckskin. The Company’s closing share price on the date of the exchange (October 15, 2021) was recorded as the cost basis for the investment addition. This investment in Buckskin is being accounted for using the equity method and resulted in recognition of equity income on the investment of $4,517 and $1,524 during the years ended December 31, 2023 and 2022, respectively. The Company makes an annual payment of $12,000 to Buckskin per a lease covering 218 acres of patented mining claims. As of December 31, 2023 and 2022, the Company held 37% of Buckskin’s outstanding shares.
10. Income Taxes
The Company did not recognize a provision (benefit) for income taxes for the years ended December 31, 2023 and 2022.
The significant components of net deferred tax assets at December 31, 2023 and 2022 were as follows:
|
|
2023 |
|
|
2022 |
|
||
Deferred tax assets |
|
|
|
|
|
|
||
Net operating loss carry forwards |
|
$ | 5,205,300 |
|
|
$ | 5,315,200 |
|
Mineral properties |
|
|
222,300 |
|
|
|
235,500 |
|
Asset retirement obligation |
|
|
9,100 |
|
|
|
- |
|
Stock based compensation |
|
|
629,000 |
|
|
|
629,000 |
|
Other |
|
|
24,500 |
|
|
|
25,600 |
|
Total deferred tax assets |
|
|
6,090,200 |
|
|
|
6,205,300 |
|
Valuation allowance |
|
|
(4,506,700 | ) |
|
|
(4,999,500 | ) |
|
|
|
1,583,500 |
|
|
|
1,205,800 |
|
Deferred tax liabilities |
|
|
|
|
|
|
|
|
Property, plant, and equipment |
|
|
(1,583,500 | ) |
|
|
(1,204,300 | ) |
Asset retirement obligation |
|
|
- |
|
|
|
(1,500 | ) |
Total deferred tax liabilities |
|
|
(1,583,500 | ) |
|
|
(1,205,800 | ) |
|
|
|
|
|
|
|
|
|
Net deferred tax assets |
|
$ | - |
|
|
$ | - |
|
At December 31, 2023 and 2022, the Company had net deferred tax assets principally arising from the net operating loss carryforward for income tax purposes. As management of the Company cannot determine that it is more likely than not that the Company will realize the benefit of the deferred tax assets, a valuation allowance equal to 100% of the net deferred tax asset exists at December 31, 2023 and 2022.
At December 31, 2023, the Company had net operating loss carry forwards of approximately $20,348,000 for both federal and state purposes, $10,670,000 of which expire between 2023 through 2037. The remaining balance of $9,678,000 will never expire but its utilization is limited to 80% of taxable income in any future year.
The income tax provision (benefit) for the years ended December 31, 2023 and 2022 differ from the statutory rate of 21% as follows:
|
|
2023 |
|
|
2022 |
|
||
|
|
|
|
|
|
|
||
Provision (benefit) at statutory rate for the period |
|
$ | 225,400 |
|
|
$ | (552,500 | ) |
State taxes, net of federal taxes |
|
|
49,200 |
|
|
|
(144,000 | ) |
Change in state tax rate |
|
|
- |
|
|
|
173,700 |
|
Adjustment of prior year tax estimates |
|
|
218,200 |
|
|
|
(458,900 | ) |
Increase (decrease) in valuation allowance |
|
|
(492,800 | ) |
|
|
981,700 |
|
Total provision (benefit) |
|
$ | - |
|
|
$ | - |
|
The Company is open to examination of our income tax filings in the United States and state jurisdictions for the 2021 through 2023 tax years. Tax attributes from years prior to that can be adjusted as a result of examinations. In the event that the Company is assessed penalties and or interest, penalties will be charged to other operating expense and interest will be charged to interest expense. The Company has reviewed its tax positions and believes it has not taken a position that would not be sustained under examination.
| 59 |
| Table of Contents |
Idaho Strategic Resources, Inc.
Notes to Consolidated Financial Statements
11. Equity
The Company has authorized 200,000,000 shares of no-par common stock at December 31, 2023 and 2022. In addition, the Company has authorized 1,000,000 shares of no-par preferred stock, none of which had been issued at December 31, 2023 or 2022.
Stock Purchase Warrants Outstanding
Transactions in common stock purchase warrants for the years ended December 31, 2023 and 2022 are as follows:
|
|
Number of Warrants |
|
|
Exercise Prices |
||
Balance December 31, 2021 |
|
|
669,467 |
|
|
$2.52-7.00 |
|
Expired |
|
|
(185,304 | ) |
|
$2.52-5.60 |
|
Exercised |
|
|
(194,869 | ) |
|
$2.52-5.60 |
|
Balance December 31, 2022 and 2023 |
|
|
289,294 |
|
|
$5.60-7.00 |
|
These warrants expire as follows:
Shares |
|
|
Exercise Price |
|
|
Expiration Date |
|||
|
235,722 |
|
|
$ | 5.60 |
|
|
October 15, 2024 |
|
|
53,572 |
|
|
$ | 7.00 |
|
|
November 12, 2024 |
|
|
289,294 |
|
|
|
|
|
|
|
|
On October 12, 2023, IDR amended and restated warrants issued in private placements completed in October and November of 2021. The amended and restated warrants extended the exercise period of the warrants for an additional one year.
Stock Options
In April 2014, the Board of Directors of the Company established the 2014 Equity Incentive Compensation Plan to authorize the granting of stock options to officers and employees. Upon exercise of the options, shares are issued from the available authorized shares of the Company. Options reserved to any one related person on an annual basis may not, upon exercise, exceed 5% and the aggregate number of all options outstanding will not exceed 10% of the issued outstanding common shares in total as calculated at that time.
In May 2023, the 2023 Equity Incentive Compensation Plan was voted on, and approved, by the shareholders of the Company. This plan allows for the issuance of up to 1,225,600 shares of the Company’s common stock in the form of stock options (which may be incentive stock options or nonqualified stock options) or other stock-based awards, such as stock appreciation rights, restricted stock, restricted stock units and performance shares.
There were no stock options granted under either plan in 2023.
In September 2022, the board granted 165,000 stock options to officers, board members and employees. These options vested immediately and are exercisable at $5.25 for 3 years. Total stock-based compensation recognized on these options was $505,476 and was recognized in management ($64,333), professional services ($27,571), and general and administrative ($413,572) expenses in the consolidated statement of operations. In September 2022, the board granted an additional 15,000 stock options, 7,500 each to our independent board members. These options vested immediately and are exercisable at $4.75 for 3 years. Total stock-based compensation recognized on these options was $41,799 and was recognized in management expenses in the consolidated statement of operations.
The fair value of stock option awards granted, and the key assumptions used in the Black-Scholes valuation model to calculate the fair value of the options are as follows:
|
|
September 6, 2022 |
|
|
September 28, 2022 |
|
||
Fair value |
|
$ | 505,476 |
|
|
$ | 41,799 |
|
Options issued |
|
|
165,000 |
|
|
|
15,000 |
|
Exercise price |
|
$ | 5.25 |
|
|
$ | 4.75 |
|
Expected term (in years) |
|
|
3.0 |
|
|
|
3.0 |
|
Risk-free rate |
|
|
3.55 | % |
|
|
4.12 | % |
Volatility |
|
|
89.3 | % |
|
|
89.2 | % |
| 60 |
| Table of Contents |
Idaho Strategic Resources, Inc.
Notes to Consolidated Financial Statements
11. Equity, continued
Transactions in stock options for the years ended December 31, 2023 and 2022 are as follows:
|
|
Number of Options |
|
|
Weighted Average Exercise Prices |
|
||
Balance December 31, 2021 |
|
|
507,175 |
|
|
$ | 5.25 |
|
Granted |
|
|
180,000 |
|
|
$ | 5.21 |
|
Exercised |
|
|
(116,078 | ) |
|
$ | 4.31 |
|
Expired |
|
|
(7,143 | ) |
|
$ | 1.96 |
|
Forfeited |
|
|
(28,001 | ) |
|
$ | 5.56 |
|
Balance December 31, 2022 |
|
|
535,953 |
|
|
$ | 5.47 |
|
Forfeited |
|
|
(58,504 | ) |
|
$ | 5.47 |
|
Outstanding and exercisable at December 31, 2023 |
|
|
477,449 |
|
|
$ | 5.47 |
|
At December 31, 2023 and 2022, the outstanding stock options have an intrinsic value of approximately $410,638 ($123,045 in 2022) and have a weighted average remaining term of 0.82 years (1.82 in 2022). No cashless options were exercised in the year ended December 31, 2023, however, cashless options exercised in the year ended December 31, 2022 had an intrinsic value of $677,928.
12. Related Party Transactions
At December 31, 2022 a note payable at 6% interest was held by Ophir Holdings, LLC (“Ophir”), a company owned by two officers and one former officer of the Company. The note had monthly payments of $3,777 and a balloon payment of the remaining principal due in February 2024.
At December 31, 2022, the balance due on the note to Ophir was $75,183 with $12,226 of related party debt payable in 2023 and the remaining $62,957 payable in 2024. Related party interest expense for the year ended December 31, 2022 was $3,901. No interest was accrued at the end of 2022.
On May 10, 2023 the Company paid the remaining amount due on the note payable to Ophir of $57,397.
The Company leases office locations from certain related parties on a month-to-month basis (not long term). These related parties are NP Depot, a company owned by John Swallow, the Company’s president, and Mine Systems Design, a company partially owned by Grant Brackebusch, one of the Company’s vice presidents. Payments under these month-to-month lease arrangements totaled $25,175 and $24,868 for the years ended December 31, 2023 and 2022, respectively, and are included in general and administrative expenses on the consolidated statement of operations.
| 61 |
| Table of Contents |
Idaho Strategic Resources, Inc.
Notes to Consolidated Financial Statements
13. Sales of Products
Our products consist of both gold flotation concentrates which in 2023 and 2022 we sold to a broker, H&H Metals Corp., and an unrefined gold-silver product known as doré which we sell to a precious metal refinery. Revenue is recognized upon the completion of the performance obligations and transfer of control of the product to the customer, and the transaction price can be determined or reasonably estimated.
For gold flotation concentrate sales, the performance obligation is met when the transaction price can be reasonably estimated, and revenue is recognized generally at the time when risk is transferred to H&H Metals based on contractual terms. Based on contractual terms, the Company has determined the performance obligation is met and title is transferred to H&H Metals when the Company receives its first provisional payment on the concentrate because, at that time, 1) legal title is transferred to the customer, 2) the customer has accepted the concentrate lot and obtained the ability to realize all of the benefits from the product, 3) the concentrate content specifications are known, have been communicated to H&H Metals, and H&H Metals has the significant risks and rewards of ownership to it, 4) it is very unlikely a concentrate will be rejected by H&H Metals upon physical receipt, and 5) we have the right to payment for the concentrate. Concentrates lots that have been sold are held at our mill up to 60 days, until H&H Metals provides shipping instructions.
Our concentrate sales sometimes involve variable consideration, as they can be subject to changes in metals prices between the time of shipment and their final settlement. However, we can reasonably estimate the transaction price for the concentrate sales at the time of shipment using forward prices for the estimated month of settlement, and previously recorded sales and accounts receivable are adjusted to estimated settlement metals prices until final settlement for financial reporting purposes. The embedded derivative contained in our concentrate sales is adjusted to fair value through earnings each period prior to final settlement. It is unlikely a significant reversal of revenue for any one concentrate lot will occur. As such, we use the expected value method to price the concentrate until the final settlement date occurs, at which time the final transaction price is known. At December 31, 2023, metals that had been sold but not final settled included 5,176 ounces of gold of which 3,320 ounces were sold at a predetermined price with the remaining 1,856 ounces exposed to future price changes. The Company has received provisional payments on the sale of these ounces with the remaining amount due reflected in gold sales receivable.
Sales and accounts receivable for concentrate shipments are recorded net of charges for treatment and other charges negotiated by us with H&H Metals, which represent components of the transaction price. Charges are estimated by us upon transfer of risk of the concentrates based on contractual terms, and actual charges typically do not vary materially from our estimates. Costs charged by the customer include fixed treatment, refining and costs per ton of concentrate and may include penalty charges for lead and zinc content above a negotiated baseline as well as excessive moisture.
For sales of doré and of metals from doré, the performance obligation is met, the transaction price is known, and revenue is recognized at the time of transfer of control of the agreed-upon metal quantities to the customer.
Sales of products by metal for the years ended December 31, 2023 and 2022 were as follows:
|
|
2023 |
|
|
2022 |
|
||
Gold |
|
$ | 14,308,098 |
|
|
$ | 10,173,034 |
|
Silver |
|
|
55,747 |
|
|
|
25,370 |
|
Less: Smelter and refining charges |
|
|
(707,112 | ) |
|
|
(618,215 | ) |
Total |
|
$ | 13,656,733 |
|
|
$ | 9,580,189 |
|
Sales by significant product type for the years ended December 31, 2023 and 2022 were as follows:
|
|
2023 |
|
|
2022 |
|
||
Concentrate sales to H&H Metals |
|
$ | 13,518,628 |
|
|
$ | 9,276,573 |
|
Doré sales to refineries |
|
|
138,105 |
|
|
|
303,616 |
|
Total |
|
$ | 13,656,733 |
|
|
$ | 9,580,189 |
|
In 2023, flotation concentrates sold to H&H Metals accounted for 99% of all gold sales. The remaining 1% in 2023 was doré sold to a third party. In 2022, flotation concentrates sold to H&H Metals accounted for 97% of all gold sales. The remaining 3% in 2022 was doré sold to a third party. At December 31, 2023 and 2022, our gold sales receivable balance related to contracts with customers of $1,038,867 and $909,997, respectively, consist only of amounts due from H&H Metals. There is no allowance for doubtful accounts. We have determined our contracts do not include a significant financing component. For doré sales, payment is received at the time the performance obligation is satisfied. Consideration for concentrate sales is variable, and we receive payment for a significant portion of the estimated value of concentrate parcels at the time the performance obligation is satisfied.
| 62 |
| Table of Contents |
Idaho Strategic Resources, Inc.
Notes to Consolidated Financial Statements
14. Convertible Debt
On December 31, 2021 $1,950,000 of convertible notes were outstanding. These notes were converted to 392,866 shares of the Company’s common stock in 2022. Interest expense recognized in 2022 on those notes prior to conversion was $38,521.
There was no convertible debt activity during the year ended December 31, 2023.
15. Subsequent Events
In February 2024 the Company purchased the surface rights and subsequently cancelled the NSR from the previous agreement with the seller for a 169-acre parcel known as Butte Gulch adjacent to the Golden Chest. The Company had already owned the mineral rights to this property. The sale price was $1,001,000 of which $351,000 was paid in cash and the remaining $650,000 is payable to the seller (monthly interest only payments of $2,750 at 5% interest, for three years with a balloon payment of $650,000 at the end of the term).
In the first quarter of 2024, 147,026 shares of the Company’s common stock were issued in exchange for outstanding warrants at an exercise price of $5.60 for net proceeds of $823,346.
In the first quarter of 2024, 127,152 shares of the Company’s common stock were issued at an average price of $6.87 per share for net proceeds of $847,493.
| 63 |
| Table of Contents |
ITEM 9. CHANGES IN AND DISAGREEMENTS WITH ACCOUNTANTS ON ACCOUNTING AND FINANCIAL DISCLOSURE
None.
ITEM 9A. CONTROLS AND PROCEDURES
Disclosure of Controls and Procedures
At the end of the period covered by this Annual Report on Form 10-K, our President who also serves as our Chief Accounting Officer evaluated the effectiveness of the design and operation of our disclosure controls and procedures pursuant to Rule 13a-15(e) and Rule 15d-15(e) of the Securities Exchange Act of 1934 (the “Exchange Act”). Based upon that evaluation, it was concluded that our disclosure controls were effective as of the end of the period covered by this report, to ensure that: (i) information required to be disclosed by the Company in the reports that it files under the Exchange Act is recorded, processed, summarized, and reported within required time periods specified by the SEC rules and forms, and (ii) material information required to be disclosed in reports filed under the Exchange Act is accumulated and communicated to our management, including our President and Chief Accounting Officer, as appropriate, to allow for accurate and timely decision regarding required disclosure.
Management’s Annual Report on Internal Control over Financial Reporting
The management of Idaho Strategic is responsible for establishing and maintaining adequate internal control over financial reporting. This internal control system has been designed to provide reasonable assurance to the Company’s management and Board of Directors regarding the preparation and fair presentation of the Company’s published financial statements.
All internal control systems, no matter how well designed, have inherent limitations. Therefore, even those systems determined to be effective can provide only reasonable assurance with respect to financial statement preparation and presentation.
The management of Idaho Strategic has assessed the effectiveness of the Company’s internal control over financial reporting as of December 31, 2023. To make this assessment, we used the criteria for effective internal control over financial reporting described in Internal Control-Integrated Framework (2013), issued by the Committee of Sponsoring Organizations of the Treadway Commission. Based on our assessment, we believe that, as of December 31, 2023, the Company’s internal control over financial reporting is effective.
Changes in Internal Control over Financial Reporting
There was no material change in internal control over financial reporting in the quarter ended December 31, 2023.
ITEM 9B. OTHER INFORMATION
None.
ITEM 9C. DISCLOSURE REGARDING FOREIGN JURISDICTIONS THAT PREVENT INPECTIONS
Not applicable.
| 64 |
| Table of Contents |
PART III
ITEM 10. DIRECTORS, EXECUTIVE OFFICERS, AND CORPORATE GOVERNANCE
Name & Address |
|
Age |
|
Position |
|
Term |
|
John Swallow c/o 201 N. Third Street Coeur d’Alene, ID 83814 |
|
57 |
|
Chief Executive Officer (“CEO”)/ President & Chairman of the Board |
|
8/29/2013 to 12/1/2014 and 5/2/2015 to present as President, 1/20/17 to present as CEO, 8/29/2013 to present as Director, 7/11/2019 to present as Chairman |
|
Grant Brackebusch c/o 201 N. Third Street Coeur d’Alene, ID 83814 |
|
54 |
|
Chief Financial Officer (“CFO”), Vice President, & Director |
|
7/18/1996 to present |
|
Kevin Shiell c/o 201 N. Third Street Coeur d’Alene, ID 83814 |
|
65 |
|
Director |
|
1/10/17 to present |
|
Richard Beaven c/o 201 N. Third Street Coeur d’Alene, ID 83814 |
|
56 |
|
Director |
|
1/12/2022 to present |
|
Carolyn Turner c/o 201 N. Third Street Coeur d’Alene, ID 83814 |
|
55 |
|
Director |
|
8/8/2023 to present |
|
Robert Morgan c/o 201 N. Third Street Coeur d’Alene, ID 83814 |
|
56 |
|
Vice President |
|
1/16/2018 to present |
|
Monique Hayes c/o 201 N. Third Street Coeur d’Alene, ID 83814 |
|
58 |
|
Secretary |
|
11/20/16 to present |
Directors are elected by shareholders at each annual shareholders meeting to hold office until the next annual meeting of shareholders or until their respective successors are elected and qualified.
Executive Officers and Key Employees
John Swallow was named CEO and President on January 10, 2017. Prior to being named as CEO, Mr. Swallow was appointed as the President and a Director of the Company on August 29, 2013. Mr. Swallow resigned as president in December 2014, and subsequently reappointed as President on May 5, 2015, following the resignation of Mr. Highsmith. Following Mr. Steiner’s resignation on July 11, 2019, Mr. Swallow became the Chairman of the Board. Mr. Swallow holds a B.S. in Finance from Arizona State University. Mr. Swallow was the Vice President of Timberline Drilling, Inc. from November 2011 until accepting the role of President with the Company. From September 2009, until November 2011, Mr. Swallow was self-employed. From January 2006 until September 2009, he served as chairman of Timberline Resources Corporation. He brings wide-ranging experience from within the local mineral exploration industry as well as extensive knowledge of the junior equity markets. Mr. Swallow’s extensive experience in the drilling industry, his previous roles as a Chairman of a Board and as a Vice President of a corporation qualify him to sit on the Board of the Company.
Grant Brackebusch, P.E. has served as the Vice President and a Director of the Company since 1996. He holds a B.S. in Mining Engineering from the University of Idaho. He is registered in Idaho as a Professional Engineer. He has worked for Idaho Strategic since 1996 and worked for Newmont previously. Currently, he supervises the mining operation at the Golden Chest including the operation of the New Jersey Mill. He has experience with permitting, exploration, open pit, and underground mining as well as mineral processing. Mr. Brackebusch’s extensive mining background, knowledge of the Company’s daily operations, and industry expertise qualifies him to sit on the Board of the Company.
Kevin Shiell has more than 30 years of operating and management experience in the mining and mineral processing industries. Mr. Shiell has held executive leadership positions at several public companies, including General Manager and Vice President of Mine Operations at Stillwater Mining Company, Chief Operating Officer at MGM Gold, and various mine supervisory positions at Hecla Mining Company (“Hecla”). Mr. Shiell is currently President and Director at Gold Road Mining Corporation, and serves as an Independent Director at Idaho Strategic Resources, Inc.
Richard Beaven joined the Idaho Strategic Board on January 12, 2022. Mr. Beaven is Lead Portfolio Manager and Principal at Signia Capital Management (“Signia”). Signia is a small-cap value asset manager with a largely institutional (pension fund) client base. Prior to co-founding Signia in 2002, Rich was the Assistant Director of Research and a Portfolio Manager for a $2B Pacific Northwest asset management firm. With blue-collar roots, Rich went on to get a BA in business administration from the University of Kentucky and an MBA from Gonzaga University. In addition, he is a Chartered Financial Analyst (“CFA”) charter holder and has served as President of the CFA Society of Spokane.
| 65 |
| Table of Contents |
Carolyn Turner was elected to the Company’s Board of Directors in August 2023. Ms. Turner is currently the owner and principal of Graham Peak Consulting, LLC in Kingston, ID where she specializes in accounting and finance consulting in the mining and heavy construction industries. Prior to her time at Graham Peak Consulting, Ms. Turner spent over 30 years in the mining industry with companies such as Silver Valley Resources (“ASARCO”), Coeur Mining, and Hecla Mining Corp. Ms. Turner’s experience includes mine operations, metals marketing, project development and financing. She previously served as the Treasurer for both Hecla and Coeur Mining where her roles were centered around quarterly and annual budgeting, rolling monthly forecasting, economic modeling, mergers and acquisitions, as well as numerous treasury and audit functions. Ms. Turner’s educational background consists of a Bachelor of Science degree in Business Administration Accounting from Montana State University–Billings, followed by a Master of Business Administration from Regis University, Denver. Ms. Turner is a licensed Certified Public Accountant and has served numerous years as an elected trustee on the Kellogg Idaho Joint School District Board.
Robert Morgan has served as the Vice President Exploration of the Company since January 2018. Mr. Morgan has over 22 years of exploration experience, including 20 years focused on gold exploration, of which 12 years were in Northern Idaho and Montana. Mr. Morgan has worked for some of the world’s leading gold exploration and mining companies including Newmont and ASARCO throughout the western United States, Alaska, and South America. He is practiced in designing, implementing, and managing large exploration programs for gold, silver, base metals and REEs. His technical work has included geologic mapping, logging of drill holes, compilation, and interpretation of multiple data sets for target identification. Mr. Morgan earned his Bachelor of Science degree in geology from California State University at Chico. He has an extensive environmental background with emphasis on wetlands and water management. Mr. Morgan is a registered Professional Geologist with the State of Idaho and Professional Land Surveyor registered with the State of Montana.
Monique Hayes was appointed Corporate Secretary in November 2016. She has over 10 years of investor relations corporate governance experience in the mining industry and over 10 years of communications and brand management experience. Prior to joining Idaho Strategic, Ms. Hayes worked for Hecla, Revett Mining Company and Sterling Mining. Her advertising and communications experience includes working for Publicis Dialog Direct and White Runkle Associates where she worked with national accounts including AT&T Wireless, Bell Atlantic and NordicTrack. Ms. Hayes attended City University where she studied business management, brand strategy and communications.
Legal Proceedings
No Director or Officer has been involved in any legal action involving the Company for the past five years.
Section 16(a) Beneficial Ownership Reporting Compliance
Under Section 16(a) of the Exchange Act, as amended, and the regulations thereunder, the Company’s Directors, Executive Officers and beneficial owners of more than 10% of any registered class of the Company’s equity securities are required to file reports of their ownership of the Company’s securities and any changes in that ownership with the SEC.
Based solely on our review of the copies of such forms received by us, or written representations from certain reporting persons, we believe that during fiscal year ended December 31, 2023, all filing requirements applicable to its officers, directors and greater than 10% percent beneficial owners were complied with.
Code of Ethics
The Company adopted a Code of Ethics at a Board of Directors meeting on December 9, 2003, that applies to the Company’s executive officers. The Company also adopted a Code of Ethics for all employees at the Board of Directors meeting on February 18, 2008.
Board Nomination Procedures
There have been no material changes to the procedures by which security holders may recommend nominees to the registrant’s Board of Directors.
| 66 |
| Table of Contents |
ITEM 11. EXECUTIVE COMPENSATION
Compensation of Officers
A summary of cash and other compensation for John Swallow, the Company’s President, CEO and Chairman of the Board, Grant Brackebusch, the Company’s CFO and Vice President, and Robert Morgan, the Company’s Vice President (together the “Named Executive Officers”), for the two most recent years is as follows:
Executive Officer Summary Compensation Table
Name & Principal Position |
|
Year |
|
Salary1 ($) |
|
|
Bonus ($) |
|
|
Stock Awards ($) |
|
|
Option Awards2 ($) |
|
|
Nonequity Incentive Plan Compensation ($) |
|
|
Nonqualified Deferred Compensation Earnings ($) |
|
|
All Other Compensation ($) |
|
|
Total ($) |
|
||||||||
John Swallow |
|
2023 |
|
|
167,042 |
|
|
|
- |
|
|
|
- |
|
|
|
- |
|
|
|
- |
|
|
|
- |
|
|
|
- |
|
|
|
167,042 |
|
President, CEO, & Chairman |
|
2022 |
|
|
125,000 |
|
|
|
4,728 |
|
|
|
- |
|
|
|
9,190 |
|
|
|
- |
|
|
|
- |
|
|
|
- |
|
|
|
138,918 |
|
Grant Brackebusch |
|
2023 |
|
|
175,375 |
|
|
|
- |
|
|
|
- |
|
|
|
- |
|
|
|
- |
|
|
|
- |
|
|
|
- |
|
|
|
175,375 |
|
CFO & Vice President |
|
2022 |
|
|
150,000 |
|
|
|
4,728 |
|
|
|
- |
|
|
|
9,190 |
|
|
|
- |
|
|
|
- |
|
|
|
- |
|
|
|
163,918 |
|
Robert Morgan |
|
2023 |
|
|
140,625 |
|
|
|
- |
|
|
|
- |
|
|
|
- |
|
|
|
- |
|
|
|
- |
|
|
|
- |
|
|
|
140,625 |
|
Vice President |
|
2022 |
|
|
123,958 |
|
|
|
- |
|
|
|
- |
|
|
|
9,190 |
|
|
|
- |
|
|
|
- |
|
|
|
- |
|
|
|
133,148 |
|
(1) |
Salary includes fees earned as Directors. |
|
|
(2) |
Stock Awards and Options Awards include fees earned as Directors. The Company has valued all Stock Awards granted at fair value as computed in accordance with FASB Accounting Standards Codification Topic 718. The compensation of the Named Executive Officers has been set by disinterested members of the Board of Directors to a level competitive with other mining companies of similar size with similar types of operations. The executive stock compensation is for services as directors. |
The Company does not have a retirement plan for its executive officers and there is no agreement, plan or arrangement that provides for payments to executive officers in connection with resignation, retirement, termination, or a change in control of the Company.
Outstanding Equity Awards at Fiscal Year-end
As of December 31, 2023, 69,858 Stock Options were vested and outstanding to directors Grant Brackebusch, John Swallow, Kevin Shiell, Richard Beaven, and Carolyn Turner.
Director Compensation
Director Summary Compensation Table
Name & Principal Position |
|
Year |
|
Salary ($) |
|
|
Bonus ($) |
|
|
Stock Awards ($) |
|
|
Option Awards1 ($) |
|
|
Nonequity Incentive Plan Compensation ($) |
|
|
Nonqualified Deferred Compensation Earnings ($) |
|
|
All Other Compensation ($) |
|
|
Total ($) |
|
||||||||
Kevin Shiell |
|
2023 |
|
|
9,000 |
|
|
|
- |
|
|
|
- |
|
|
|
- |
|
|
|
- |
|
|
|
- |
|
|
|
- |
|
|
|
9,000 |
|
Director |
|
2022 |
|
|
- |
|
|
|
- |
|
|
|
- |
|
|
|
30,089 |
|
|
|
- |
|
|
|
- |
|
|
|
- |
|
|
|
30,089 |
|
Richard Beaven |
|
2023 |
|
|
9,000 |
|
|
|
- |
|
|
|
- |
|
|
|
- |
|
|
|
- |
|
|
|
- |
|
|
|
- |
|
|
|
9,000 |
|
Director |
|
2022 |
|
|
- |
|
|
|
- |
|
|
|
- |
|
|
|
30,089 |
|
|
|
- |
|
|
|
- |
|
|
|
- |
|
|
|
30,089 |
|
Carolyn Turner |
|
2023 |
|
|
5,000 |
|
|
|
- |
|
|
|
- |
|
|
|
- |
|
|
|
- |
|
|
|
- |
|
|
|
- |
|
|
|
5,000 |
|
Director |
|
2022 |
|
|
- |
|
|
|
- |
|
|
|
- |
|
|
|
- |
|
|
|
- |
|
|
|
- |
|
|
|
- |
|
|
|
- |
|
No additional fees are paid for attendance at Board of Directors’ meetings, committee membership or committee chairmanship. On occasion, Directors are retained for consulting services unrelated to their duties as Directors. These consulting services are either paid in cash or with unregistered Common Stock according to the Company’s policy for share-based payment of services.
The Company does not have a retirement plan for its Directors and there is no agreement, plan or arrangement that provides for payments to Directors in connection with resignation, retirement, termination or a change in control of the Company.
| 67 |
| Table of Contents |
ITEM 12. SECURITY OWNERSHIP OF CERTAIN BENEFICIAL OWNERS AND MANAGEMENT AND RELATED STOCKHOLDER MATTERS
The following table sets forth information as of March 1, 2024 regarding the shares of Company Common Stock beneficially owned by: (i) each person known by the Company to own beneficially more than 5% of the Company’s Common Stock; (ii) each Director of the Company; (iii) Named Executive Officers; and (iv) all Directors and the Named Executive Officers of the Company as a group. Except as noted below, each holder has sole voting and investment power with respect to the shares of the Company Common Stock listed as owned by that person.
Security Ownership of Certain Beneficial Owners
Title of Class |
|
Name and Address of Beneficial Owner |
|
Amount and Nature of Beneficial Owner |
|
|
Percent of Class(1) |
|
||
Common |
|
John Swallow c/o 201 N. Third Street Coeur d’Alene, ID 83814 |
|
|
1,356,162 | (a) |
|
|
10.21 | % |
Security Ownership of Management
Title of Class |
|
Name and Address of Beneficial Owner |
|
Amount and Nature of Beneficial Owner |
|
|
Percent of Class1 |
|
||
Common |
|
John Swallow c/o 201 N. Third Street Coeur d’Alene, ID 83814 |
|
|
1,356,162 | (a) |
|
|
10.21 | % |
Common |
|
Grant Brackebusch c/o 201 N. Third Street Coeur d’Alene, ID 83814 |
|
|
142,483 | (b) |
|
|
1.07 | % |
Common |
|
Kevin Shiell c/o 201 N. Third Street Coeur d’Alene, ID 83814 |
|
|
74,787 | (c) |
|
|
0.56 | % |
Common |
|
Richard Beaven c/o 201 N. Third Street Coeur d’Alene, ID 83814 |
|
|
14,500 | (d) |
|
|
0.11 | % |
Common |
|
Carolyn Turner c/o 201 N. Third Street Coeur d’Alene, ID 83814 |
|
|
- |
|
|
|
- |
|
Common |
|
Robert Morgan c/o 201 N. Third Street Coeur d’Alene, ID 83814 |
|
|
38,358 | (e) |
|
|
0.29 | % |
Common |
|
Monique Hayes c/o 201 N. Third Street Coeur d’Alene, ID 83814 |
|
|
48,621 | (f) |
|
|
0.37 | % |
Common |
|
All Directors and Executive Officers as a group (7 individuals) |
|
|
1,674,911 |
|
|
|
12.61 | % |
(1) |
Based upon 12,559,878 outstanding shares of common stock 241,674 warrants, and 477,449 vested options at March 1, 2024. |
a) |
Consists of 1,344,233 shares of common stock, presently exercisable options to purchase 3,000 shares of common stock, and presently exercisable warrants to purchase 8,929 shares of common stock. |
b) |
Consists of 118,054 shares of common stock and presently exercisable options to purchase 24,429 shares of common stock. |
c) |
Consists of 42,858 shares of common stock and presently exercisable options to purchase 31,929 shares of common stock. |
d) |
Consists of 4,000 shares of common stock and presently exercisable options to purchase 10,500 shares of common stock. |
e) |
Consists of 13,929 shares of common stock and presently exercisable options to purchase 24,429 shares of common stock. |
f) |
Consists of 24,192 shares of common stock and presently exercisable options to purchase 24,429 shares of common stock. |
None of the Directors or Officers has the right to acquire any additional securities pursuant to options, warrants, conversion privileges or other rights. No shares are pledged as security.
Securities Authorized for Issuance under Equity Plans
In April 2014, the Company established a stock option plan to authorize the granting of stock options to officers and employees. As of December 31, 2023, there are no longer any shares available to grant under this plan. In May 2023, a new equity incentive plan was voted on and approved by shareholders to authorize the granting of stock options (or similar equity awards) to officers and employees. The Company occasionally pays for goods or services with unregistered Common Stock and uses the average bid price of the stock, as quoted on the NYSE American, at the time to determine the number of shares to be issued.
Changes in Control
None.
| 68 |
| Table of Contents |
ITEM 13. CERTAIN RELATIONSHIPS AND RELATED TRANSACTIONS, AND DIRECTOR INDEPENDENCE
Certain Relationships and Related Transactions
None.
Director Independence
The Board of Directors has determined that John Swallow and Grant Brackebusch are not independent directors. Kevin Shiell, Richard Beaven, and Carolyn Turner are independent directors.
The independent directors Kevin Shiell, Richard Beaven, and Carolyn Turner each serve as the only three members of the Board of Directors’ nominating committee, compensation committee, and audit committee.
ITEM 14. PRINCIPAL ACCOUNTANT FEES AND SERVICES
Audit Fees
The aggregate fees billed for professional services rendered by the Company’s principal accountant for the audit of the annual financial statements included in the Company’s annual report on Form 10-K for the fiscal years ended December 31, 2023 and December 31, 2022 and the review for the financial statements included in the Company’s quarterly reports on Form 10-Q during those fiscal years, were $79,500 and $69,846 respectively.
Audit Related Fees
The Company incurred no fees during the last two fiscal years for assurance and related services by the Company’s principal accountant that were reasonably related to the performance of the audit or review of the Company’s financial statements, and not reported under Audit Fees above.
Tax Fees
$7,950 in 2023 and $7,431 in 2022 was paid to the Company’s principal accountant for tax compliance, tax advice, and tax planning services.
All Other Fees
$5,894 in other fees were incurred during 2023 and $7,194 in 2022 for other services rendered by the Company’s principal accountant.
Audit Committee Pre-Approval Policies
The Board of Directors has adopted an audit committee pre-approval policy. The audit committee is required to pre-approve the audit and non-audit services performed by the independent auditor in order to assure that the provision of such services do not impair the auditor’s independence.
| 69 |
| Table of Contents |
PART IV
ITEM 15. EXHIBITS
Financial Statements
The following Consolidated Financial Statements of the Corporation are filed as a part of this report:
|
1. |
Report of Independent Registered Public Accounting Firm dated March 25, 2024. |
|
2. |
Consolidated Balance Sheets—December 31, 2023 and 2022. |
|
3. |
Consolidated Statements of Operations—Years ended December 31, 2023 and 2022. |
|
4. |
Consolidated Statements of Changes in Stockholders’ Equity—Years ended December 31, 2023 and 2022. |
|
5. |
Consolidated Statements of Cash Flows—Years ended December 31, 2023 and 2022. |
|
6. |
Notes to Consolidated Financial Statements. |
Exhibits
* |
Filed herewith. |
** |
XBRL information is furnished and not filed or a part of a registration statement or prospectus for purposes of Section 11 or 12 of the Securities Act of 1933, as amended, is deemed not filed for purposes of Section 18 of the Securities and Exchange Act of 1934, as amended, and otherwise is not subject to liability under these sections. |
ITEM 16. FORM10-K SUMMARY
None.
| 70 |
| Table of Contents |
SIGNATURES
Pursuant to the requirements of Section 13 or 15(d) of the Securities Exchange Act of 1934, the registrant has duly caused this report to be signed on its behalf by the undersigned, thereunto duly authorized.
| IDAHO STRATEGIC RESOURCES, INC. | |||
| Date: March 25, 2024 | By | /s/ JOHN SWALLOW | |
|
|
John Swallow, President, Chief Executive Officer | |
| Date: March 25, 2024 | By | /s/ GRANT A. BRACKEBUSCH | |
|
|
Grant A. Brackebusch, Vice President, Chief Financial Officer |
|
Pursuant to the requirements of the Securities Exchange Act of 1934, this report has been signed below by the following persons on behalf of the registrant and in the capacities and on the dates indicated.
| /s/ John Swallow |
|
March 25, 2024 |
| John Swallow |
|
Date |
| President, Chief Executive Officer, Director |
|
|
| (Principal Executive Officer) |
|
|
|
|
|
/s/ Grant A. Brackebusch |
|
March 25, 2024 |
Grant A. Brackebusch |
|
Date |
Vice President, Chief Financial Officer, |
|
|
Director (Principal Financial Officer and |
|
|
Principal Accounting Officer) |
|
|
|
|
|
/s/ Carolyn Turner |
|
March 25, 2024 |
Carolyn Turner |
|
Date |
Director |
|
|
|
|
|
/s/ Kevin Shiell |
|
March 25, 2024 |
Kevin Shiell |
|
Date |
Director |
|
|
|
|
|
/s/ Richard Beaven |
|
March 25, 2024 |
Richard Beaven |
|
Date |
Director |
|
|
71 |
EXHIBIT 23.1
Consent of Independent Registered Public Accounting Firm
We hereby consent to the incorporation by reference in the Registration Statement Form S-3 (Nos. 333-264647 and 333-275469) of Idaho Strategic Resources, Inc. of our report dated March 22, 2024, relating to the consolidated financial statements which appears in this Form 10-K.
| /s/ Assure CPA, LLC |
|
|
|
|
| Spokane, Washington |
|
| March 22, 2024 |
|
EXHIBIT 23.2
Consent of Qualified Person
In connection with the Idaho Strategic Resources, Inc. Annual Report on Form 10-K for the year ended December 31, 2023 and any amendments or supplements and/or exhibits thereto (collectively, the “Form 10-K”), the undersigned consents to:
(i) the filing and use of the technical report summary titled “Technical Report Summary For The Golden Chest Mine, Idaho, U.S.A.” (the “TRS”), with an effective date of December 31, 2023, as an exhibit to and referenced in the Form 10-K;
(ii) the incorporation by reference of the TRS in the Registration Statements on Form S-3, as amended (Registration No. 333-264647) (the “Registration Statement”):
(iii) the use of and references to our name, including our status as an expert or “qualified person” (as defined in Subpart 1300 of Regulation S-K promulgated by the Securities and Exchange Commission), in connection with the TRS, Form 10-K and the Registration Statement; and
(iv) any extracts or summaries of the TRS included or incorporated by reference in the Form 10-K and the Registration Statement, and the use of any information derived, summarized, quoted or referenced from the TRS, or portions thereof, that was prepared by us, that we supervised the preparation of, and/or that was reviewed and approved by us, that is included or incorporated by reference in the Form 10-K and the Registration Statement.
Dated: March 25, 2024
By: /s/ Grant Brackebusch, P.E.
Name: Grant Brackebusch
EXHIBIT 23.3
Consent of Qualified Person
In connection with the Idaho Strategic Resources, Inc. Annual Report on Form 10-K for the year ended December 31, 2023 and any amendments or supplements and/or exhibits thereto (collectively, the “Form 10-K”), the undersigned consents to:
(i) the filing and use of the technical report summary titled “Technical Report Summary For The Golden Chest Mine, Idaho, U.S.A.” (the “TRS”), with an effective date of December 31, 2023, as an exhibit to and referenced in the Form 10-K;
(ii) the incorporation by reference of the TRS in the Registration Statements on Form S-3, as amended (Registration No. 333-264647) (the “Registration Statement”):
(iii) the use of and references to our name, including our status as an expert or “qualified person” (as defined in Subpart 1300 of Regulation S-K promulgated by the Securities and Exchange Commission), in connection with the TRS, Form 10-K and the Registration Statement; and
(iv) any extracts or summaries of the TRS included or incorporated by reference in the Form 10-K and the Registration Statement, and the use of any information derived, summarized, quoted or referenced from the TRS, or portions thereof, that was prepared by us, that we supervised the preparation of, and/or that was reviewed and approved by us, that is included or incorporated by reference in the Form 10-K and the Registration Statement.
Dated: March 25, 2024
By: /s/ Robert John Morgan, PG, PLS.
Name: Robert John Morgan
EXHIBIT 23.4
Consent of Qualified Person
In connection with the Idaho Strategic Resources, Inc. Annual Report on Form 10-K for the year ended December 31, 2023 and any amendments or supplements and/or exhibits thereto (collectively, the “Form 10-K”), the undersigned consents to:
(i) the filing and use of the technical report summary titled “Technical Report Summary For The Golden Chest Mine, Idaho, U.S.A.” (the “TRS”), with an effective date of December 31, 2023, as an exhibit to and referenced in the Form 10-K;
(ii) the incorporation by reference of the TRS in the Registration Statements on Form S-3, as amended (Registration No. 333-264647) (the “Registration Statement”):
(iii) the use of and references to our name, including our status as an expert or “qualified person” (as defined in Subpart 1300 of Regulation S-K promulgated by the Securities and Exchange Commission), in connection with the TRS, Form 10-K and the Registration Statement; and
(iv) any extracts or summaries of the TRS included or incorporated by reference in the Form 10-K and the Registration Statement, and the use of any information derived, summarized, quoted or referenced from the TRS, or portions thereof, that was prepared by us, that we supervised the preparation of, and/or that was reviewed and approved by us, that is included or incorporated by reference in the Form 10-K and the Registration Statement.
Dated: March 25, 2024
By: /s/ Andrew Brackebusch, P.E.
Name: Andrew Brackebusch
EXHIBIT 31.1
Certification
I, John Swallow, certify that:
(1) I have reviewed this annual report on Form 10-K of Idaho Strategic Resources Inc.
(2) Based on my knowledge, this report does not contain any untrue statement of a material fact or omit to state a material fact necessary to make the statements made, in light of the circumstances under which such statements were made, not misleading with respect to the period covered by this report;
(3) Based on my knowledge, the financial statements, and other financial information included in this report, fairly present in all material respects the financial condition, results of operations and cash flows of the registrant as of, and for, the periods presented in this report;
(4) I am responsible for establishing and maintaining disclosure controls and procedures (as defined in Exchange Act Rules 13a-15(e) and 15d-15(e)) and internal control over financial reporting (as defined in Exchange Act Rules 13a-15(f) and 15d-15(f)) for the registrant and have:
(a) Designed such disclosure controls and procedures, or caused such disclosure controls and procedures to be designed under my supervision, to ensure that material information relating to the registrant, including its consolidated subsidiaries, is made known to me by others within those entities, particularly during the period in which this report is being prepared;
(b) Designed such internal control over financial reporting or caused such internal control over financial reporting to be designed under my supervision, to provide reasonable assurance regarding the reliability of financial reporting and the preparation of financial statements for external purposes in accordance with generally accepted accounting principles;
(c) Evaluated the effectiveness of the registrant's disclosure controls and procedures and presented in this report my conclusions about the effectiveness of the disclosure controls and procedures, as of the end of the period covered by this report based on such evaluation; and
(d) Disclosed in this report any change in the registrant's internal control over financial reporting that occurred during the registrant's most recent fiscal quarter that has materially affected, or is reasonably likely to materially affect, the registrant's internal control over financial reporting; and
(5) I have disclosed, based on my most recent evaluation of internal control over financial reporting, to the registrant's auditors and the audit committee of the registrant's board of directors (or persons performing the equivalent functions):
(a) All significant deficiencies and material weaknesses in the design or operation of internal control over financial reporting which are reasonably likely to adversely affect the registrant's ability to record, process, summarize and report financial information; and
(b) Any fraud, whether or not material, that involves management or other employees who have a significant role in the registrant's internal control over financial reporting.
Date: March 25, 2024
| By | /s/John Swallow |
|
| John Swallow |
|
|
| Chief Executive Officer |
|
|
EXHIBIT 31.2
Certification
I, Grant Brackebusch, certify that:
(1) I have reviewed this annual report on Form 10-K of Idaho Strategic Resources Inc.
(2) Based on my knowledge, this report does not contain any untrue statement of a material fact or omit to state a material fact necessary to make the statements made, in light of the circumstances under which such statements were made, not misleading with respect to the period covered by this report;
(3) Based on my knowledge, the financial statements, and other financial information included in this report, fairly present in all material respects the financial condition, results of operations and cash flows of the registrant as of, and for, the periods presented in this report;
(4) I am responsible for establishing and maintaining disclosure controls and procedures (as defined in Exchange Act Rules 13a-15(e) and 15d-15(e)) and internal control over financial reporting (as defined in Exchange Act Rules 13a-15(f) and 15d-15(f)) for the registrant and have:
(a) Designed such disclosure controls and procedures, or caused such disclosure controls and procedures to be designed under my supervision, to ensure that material information relating to the registrant, including its consolidated subsidiaries, is made known to me by others within those entities, particularly during the period in which this report is being prepared;
(b) Designed such internal control over financial reporting or caused such internal control over financial reporting to be designed under my supervision, to provide reasonable assurance regarding the reliability of financial reporting and the preparation of financial statements for external purposes in accordance with generally accepted accounting principles;
(c) Evaluated the effectiveness of the registrant's disclosure controls and procedures and presented in this report my conclusions about the effectiveness of the disclosure controls and procedures, as of the end of the period covered by this report based on such evaluation; and
(d) Disclosed in this report any change in the registrant's internal control over financial reporting that occurred during the registrant's most recent fiscal quarter that has materially affected, or is reasonably likely to materially affect, the registrant's internal control over financial reporting; and
(5) I have disclosed, based on my most recent evaluation of internal control over financial reporting, to the registrant's auditors and the audit committee of the registrant's board of directors (or persons performing the equivalent functions):
(a) All significant deficiencies and material weaknesses in the design or operation of internal control over financial reporting which are reasonably likely to adversely affect the registrant's ability to record, process, summarize and report financial information; and
(b) Any fraud, whether or not material, that involves management or other employees who have a significant role in the registrant's internal control over financial reporting.
Date: March 25, 2024
| By | /s/Grant Brackebusch |
|
Grant Brackebusch
Chief Financial Officer
EXHIBIT 32.1
CERTIFICATION PURSUANT TO
18 U.S.C. SECTION 1350,
AS ADOPTED PURSUANT TO
SECTION 906 OF THE SARBANES-OXLEY ACT OF 2002
In connection with the Annual Report of Idaho Strategic Resources Inc., (the "Company") on Form 10-K for the period ending December 31, 2023, as filed with the Securities and Exchange Commission on the date hereof (the "Report"), I, John Swallow, Chief Executive Officer of Idaho Strategic Resources Inc., certify, pursuant to 18 U.S.C. Section 1350, as adopted pursuant to Section 906 of the Sarbanes-Oxley Act of 2002, that:
| (1) | The Report fully complies with the requirements of Section 13(a) or 15(d) of the Securities Exchange Act of 1934; and |
|
|
|
| (2) | The information contained in the Report fairly presents, in all material respects, the financial condition and results of operations of the Company. |
|
|
|
Date: March 25, 2024
| By | /s/John Swallow |
|
John Swallow
Chief Executive Officer
A signed original of this written statement required by Section 906, or other document authenticating, acknowledging or otherwise adopting the signature that appears in typed form within the electronic version of this written statement required by Section 906 has been provided to Idaho Strategic Resources Inc. and will be retained by Idaho Strategic Resources Inc. and furnished to the Securities and Exchange Commission or its staff upon request.
The foregoing certification is being furnished in accordance with Securities and Exchange Commission Release No. 34-47551 and shall not be considered filed as part of the Form 10-K.
EXHIBIT 32.2
CERTIFICATION PURSUANT TO
18 U.S.C. SECTION 1350,
AS ADOPTED PURSUANT TO
SECTION 906 OF THE SARBANES-OXLEY ACT OF 2002
In connection with the Annual Report of Idaho Strategic Resources Inc., (the "Company") on Form 10-K for the period ending December 31, 2023, as filed with the Securities and Exchange Commission on the date hereof (the "Report"), I, Grant Brackebusch, Chief Financial Officer of Idaho Strategic Resources Inc., certify, pursuant to 18 U.S.C. Section 1350, as adopted pursuant to Section 906 of the Sarbanes-Oxley Act of 2002, that:
| (1) | The Report fully complies with the requirements of Section 13(a) or 15(d) of the Securities Exchange Act of 1934; and |
|
|
|
| (2) | The information contained in the Report fairly presents, in all material respects, the financial condition and results of operations of the Company. |
|
|
|
Date: March 25, 2024
| By | /s/Grant Brackebusch |
|
Grant Brackebusch
Chief Financial Officer
A signed original of this written statement required by Section 906, or other document authenticating, acknowledging or otherwise adopting the signature that appears in typed form within the electronic version of this written statement required by Section 906 has been provided to Idaho Strategic Resources Inc. and will be retained by Idaho Strategic Resources Inc. and furnished to the Securities and Exchange Commission or its staff upon request.
The foregoing certification is being furnished in accordance with Securities and Exchange Commission Release No. 34-47551 and shall not be considered filed as part of the Form 10-K.
EXHIBIT 95
Mine Safety Disclosures
Our mines are operated subject to the regulation of the Federal Mine Safety and Health Administration (“MSHA”), under the Federal Mine Safety and Health Act of 1977 (the “Mine Act”). In July 2010, the Dodd-Frank Wall Street Reform and Consumer Protection Act (the “Dodd-Frank Act”) was signed into law, and amended in December 2011. When MSHA believes a violation of the Mine Act has occurred, it may issue a citation for such violation, including a civil penalty or fine, and the mine operator must abate the alleged violation.
As required by the reporting requirements of the Dodd-Frank Act, as amended, the table below presents the following information for the year ended December 31, 2023.
| Mine |
| Section 104 S&S Violations |
|
| Section 104(b) Orders |
|
| Section 104(d) Citations and Orders |
|
| Section 110(b)(2) Violations |
|
| Section 107(a) Orders |
|
| Total Dollar Value of MSHA Assessments Proposed |
|
| Total Number of Mining Related Fatalities |
|
| Received Notice of Pattern of Violations Under Section 104(e) |
| Received Notice of Potential to have Patterns Under Section (c) |
| Legal Actions Pending as of Last Day of Period |
|
| Legal Actions Initiated During Period |
|
| Legal Actions Resolved During Period |
|
||||||||||
| Golden Chest |
|
| 0 |
|
|
| 0 |
|
|
| 0 |
|
|
| 0 |
|
|
| 0 |
|
| $ | 2,978 |
|
|
| 0 |
|
| no |
| no |
|
| 0 |
|
|
| 0 |
|
|
| 0 |
|
| New Jersey Mill |
|
| 0 |
|
|
| 0 |
|
|
| 0 |
|
|
| 0 |
|
|
| 0 |
|
| $ | 143 |
|
|
| 0 |
|
| no |
| no |
|
| 0 |
|
|
| 0 |
|
|
| 0 |
|
EXHIBIT 96.1
Idaho Strategic Resources, Inc.
Prepared By:
Grant A. Brackebusch, P.E.
Robert J. Morgan PG, PLS
Andrew A. Brackebusch, P.E.
For
Idaho Strategic Resources, Inc.
201 North 3rd St.
Coeur d’Alene, ID 83814
Effective Date: December 31, 2023
Signature Date: March 22, 2024
| Contents |
|
|
|
|
|
|
| Contents |
| 1-1 |
| Tables |
| 1-6 |
| Figures |
| 1-7 |
|
|
|
|
| 1.0 | EXECUTIVE SUMMARY | 1-0 |
| 1.1 | Summary | 1-0 |
| 1.1.1 | Conclusions | 1-0 |
| 1.1.2 | Recommendations | 1-2 |
| 1.2 | Economic Analysis | 1-3 |
| 1.2.1 | Economic Criteria | 1-3 |
| 1.2.2 | Physical Parameters | 1-3 |
| 1.2.3 | Revenue Parameters | 1-4 |
| 1.2.4 | Operating and Capital Costs | 1-4 |
| 1.2.5 | Taxes and Royalties | 1-4 |
| 1.2.6 | Cash Flow | 1-4 |
| 1.2.7 | Sensitivity | 1-4 |
| 1.3 | Technical Summary | 1-4 |
| 1.3.1 | Property Description | 1-4 |
| 1.3.2 | Land Tenure | 1-5 |
| 1.3.3 | History | 1-5 |
| 1.3.4 | Geologic Setting, Mineralization, and Deposit | 1-5 |
| 1.3.5 | Exploration | 1-5 |
| 1.3.6 | Mineral Resource Estimate | 1-5 |
| 1.3.7 | Mineral Reserve Estimate | 1-5 |
| 1.3.8 | Mining Methods | 1-5 |
| 1.3.9 | Mineral Processing | 1-5 |
| 1.3.10 | Infrastructure | 1-6 |
| 1.3.11 | Market Studies | 1-6 |
| 1.3.12 | Environmental Permitting | 1-6 |
| 2.0 | INTRODUCTION | 2-1 |
| 2.1 | Site Visit | 2-1 |
| 2.2 | Sources of Information | 2-1 |
| 2.3 | List of Abbreviations | 2-2 |
| 1-1 |
| 3.0 | PROPERTY DESCRIPTION | 3-1 |
| 3.1 | Location | 3-1 |
| 3.2 | Ownership and Holdings | 3-1 |
| 3.3 | Royalty | 3-7 |
| 3.4 | Permit Requirements | 3-7 |
| 3.5 | Encumbrances and Other Risks | 3-7 |
|
|
|
|
| 4.0 | ACCESSIBILITY, CLIMATE, LOCAL RESOURCES, INFRASTRUCTURE AND PHSYIOGRAPHY | 4-1 |
| 4.1 | Accessibility | 4-1 |
| 4.2 | Climate | 4-1 |
| 4.3 | Local Resources and Infrastructure | 4-1 |
| 4.4 | Physiography and Environment | 4-2 |
|
|
|
|
| 5.0 | HISTORY | 5-1 |
| 5.1 | Location of District | 5-1 |
| 5.2 | Historic Gold Mining | 5-1 |
| 5.3 | Historical Mineral Resource Estimates | 5-2 |
| 5.4 | New Jersey Mining Company (IDR 2003-2012) | 5-2 |
| 5.5 | Golden Chest LLC (2010-2015) | 5-2 |
| 5.6 | Micon NI 43-101 (2011 and 2012) | 5-2 |
| 5.7 | Juniper Mining Company (2013) | 5-2 |
| 5.8 | Idaho Strategic Resources (2016-Present) | 5-3 |
|
|
|
|
| 6.0 | GEOLOGICAL SETTING, MINERALIZATION, AND DEPOSIT | 6-1 |
| 6.1 | Regional Geology | 6-1 |
| 6.1.1 | Belt Supergroup | 6-1 |
| 6.2 | Local Geology | 6-2 |
| 6.2.1 | Lithology | 6-2 |
| 6.2.2 | Structure | 6-3 |
| 6.3 | Property Geology | 6-5 |
| 6.3.1 | Lithology | 6-5 |
| 6.3.2 | Structure | 6-6 |
| 6.4 | Mineralization and Alteration | 6-7 |
| 6.4.1 | Vein Types | 6-8 |
| 6.4.2 | Vein Names and Locations | 6-9 |
| 6.4.3 | Lithologic Control of Veins | 6-10 |
| 1-2 |
| 6.4.4 | Vein Mineralization | 6-11 |
| 6.4.5 | Wall Rock Alteration | 6-12 |
| 6.5 | Deposit Type | 6-13 |
| 6.5.1 | Orogenic | 6-13 |
| 6.5.2 | Age and Genesis | 6-13 |
|
|
|
|
| 7.0 | EXPLORATION | 7-15 |
| 7.1 | Drilling | 7-16 |
| 7.1.1 | Vertical Continuity | 7-16 |
| 7.1.2 | Drill Hole Surveys | 7-16 |
| 7.1.3 | Drill Hole Sampling | 7-17 |
| 7.3 | Hydrogeology Data | 7-17 |
|
|
|
|
| 8.0 | SAMPLE PREPARATION, ANALYSES, AND SECURITY | 8-18 |
| 8.1 | Laboratory Accreditation and Certification | 8-18 |
| 8.2 | Sample Quality Assurance and Quality Control (QA/QC) | 8-18 |
| 8.2.1 | Blanks | 8-18 |
| 8.2.2 | Standard – 3 gpt | 8-18 |
| 8.2.3 | Standard – 4 gpt | 8-19 |
| 8.2.4 | Standard – 8 gpt | 8-19 |
| 8.2.5 | Standard—7 gpt | 8-20 |
| 8.3 | Sample Preparation | 8-21 |
| 8.4 | Sample Analysis | 8-21 |
| 8.5 | Security | 8-21 |
| 8.6 | QP Comments on Sample Collection, Preparation, QA/QC, Analysis and Security | 8-22 |
|
|
|
|
| 9.0 | DATA VERIFICATION | 9-22 |
| 9.1 | Database Procedures | 9-22 |
| 9.2 | Validation Procedures | 9-23 |
| 9.2.1 | Micon Historic Database Validation | 9-25 |
| 9.3 | Validation Limitations and QP Comments | 9-25 |
|
|
|
|
| 10.0 | MINERAL PROCESSING AND METALLURGICAL TESTING | 10-1 |
| 10.1 | New Jersey Mill 100 TPD Metallurgical Testing | 10-1 |
| 10.2 | Resource Development Inc. Metallurgical Testing | 10-2 |
|
|
|
|
| 11.0 | MINERAL RESOURCE ESTIMATES. | 11-1 |
| 11.1 | Summary | 11-1 |
| 1-3 |
| 11.2 | Estimation of Veins at the Golden Chest | 11-2 |
| 11.2.1 | General Methodology | 11-2 |
| 11.2.2 | Resource Database | 11-4 |
| 11.2.3 | Geological Modelling | 11-4 |
| 11.2.4 | Exploratory Data Analysis | 11-5 |
| 11.2.5 | Grade Capping | 11-7 |
| 11.2.6 | Compositing | 11-9 |
| 11.2.7 | Geostatistics | 11-11 |
| 11.2.8 | Block Model Geometry | 11-12 |
| 11.2.9 | Search and Interpolation Parameters | 11-14 |
| 11.2.10 | Density | 11-17 |
| 11.2.11 | Classification | 11-17 |
| 11.2.12 | Cut-off Grade | 11-19 |
| 11.2.13 | Validation | 11-19 |
| 11.2.13.3 | Swath Plots (Drift Analysis) | 11-21 |
| 12.0 | MINERAL RESERVE ESTIMATES | 12-1 |
| 12.1 | Summary | 12-1 |
| 12.2 | Conversion to Mineral Reserves | 12-2 |
| 12.3 | Cut-Off Grade | 12-3 |
| 12.4 | Dilution | 12-3 |
| 12.5 | Extraction | 12-4 |
| 12.6 | Reconciliation | 12-4 |
|
|
|
|
| 13.0 | MINING METHODS | 13-1 |
| 13.1 | Mining Operations – Underground | 13-1 |
| 13.1.1 | Cut-and-fill Method, Skookum Shoot | 13-2 |
| 13.1.2 | Skookum Shoot Area | 13-2 |
| 13.2 | Ground Stability | 13-3 |
| 13.2.1 | Operating Practices. | 13-3 |
| 13.3 | Underground Development | 13-3 |
| 13.3.1 | Ground Support | 13-4 |
| 13.3.2 | Development Performance | 13-4 |
| 13.4 | Backfill | 13-4 |
| 13.5 | Mine Equipment | 13-4 |
| 13.6 | Mine Infrastructure |
|
| 13.7 | Open Pit Mining Operations | 13-5 |
| 1-4 |
| 14.0 | PROCESSING AND RECOVERY METHODS | 14-1 |
| 14.1 | Crushing Circuit | 14-1 |
| 14.2 | Grinding Circuit | 14-1 |
| 14.3 | Flotation Circuit | 14-1 |
| 14.4 | Tailings Circuit | 14-1 |
| 14.5 | Mill Production | 14-2 |
| 14.6 | Mill Workforce | 14-3 |
| 15.0 | INFRASTRUCTURE | 15-1 |
| 15.1 | Roads and Logistics | 15-1 |
| 15.2 | Mine Layout | 15-2 |
| 15.2.1 | Waste Rock Storage | 15-3 |
| 15.2.2 | Tailings Disposal | 15-3 |
| 15.2.3 | Power | 15-3 |
|
|
|
|
| 16.0 | MARKET STUDIES | 16-1 |
| 16.1 | Market Overview | 16-1 |
| 16.2 | Commodity Price Projections | 16-1 |
| 16.3 | Contracts | 16-1 |
|
|
|
|
| 17.0 | ENVIRONMENTAL STUDIES, PERMITTING, AND PLANS, NEGOTIATIONS, OR AGREEMENTS WITH LOCAL INDIVIDUALS OR GROUPS | 17-1 |
| 17.1 | Environmental Studies and Permitting | 17-1 |
| 17.2 | Surface Mine Permit | 17-1 |
| 17.3 | Tailings Storage Facility (TSF) Permit | 17-2 |
| 17.4 | Cyanidation Permit | 17-2 |
| 17.5 | Stormwater Permits | 17-2 |
| 17.6 | Community and Social Aspects | 17-2 |
| 17.7 | Comments on Environmental Permitting and Monitoring | 17-2 |
|
|
|
|
| 18.0 | CAPITAL AND OPERATING COSTS | 18-1 |
| 18.1 | Capital Costs | 18-1 |
| 18.2 | Operating Costs | 18-2 |
| 1-5 |
| 19.0 | ECONOMIC ANALYSIS. | 19-1 |
| 19.1 | Economic Criteria | 19-1 |
| 19.1.1 | Physicals | 19-1 |
| 19.1.2 | Estimation Parameters | 19-1 |
| 19.1.3 | Taxation and Royalties | 19-1 |
| 19.2 | Cash Flow Analysis | 19-1 |
| 19.3 | Sensitivity Analysis | 19-3 |
| 20.0 | ADJACENT PROPERTIES | 20-4 |
|
|
|
|
| 21.0 | OTHER RELEVANT DATA AND INFORMATION | 21-1 |
|
|
|
|
| 22.0 | INTERPRETATION AND CONCLUSIONS | 22-1 |
| 22.1 | Geology and Mineral Resources | 22-1 |
| 22.2 | Mining and Mineral Reserves | 22-1 |
| 22.3 | Mineral Processing | 22-2 |
| 22.4 | Infrastructure | 22-2 |
| 22.5 | Environment | 22-2 |
|
|
|
|
| 23.0 | RECOMMENDATIONS. | 23-1 |
| 23.1 | Geology and Mineral Resources | 23-1 |
| 23.2 | Mining and Mineral Reserves | 23-1 |
| 23.3 | Mineral Processing | 23-1 |
| 23.4 | Infrastructure | 23-1 |
|
|
|
|
| 24.0 | REFERENCES | 24-1 |
|
|
|
|
| 25.0 | RELIANCE ON INFORMATION PROVIDED BY THE REGISTRANT | 25-1 |
|
|
|
|
| 26.0 | DATE AND SIGNATURE PAGE | 26-1 |
|
|
|
|
| 27.0 | Appendix 1 General Statistics and Histograms for All Domains | 27-2 |
|
|
|
|
| 28.0 | Appendix 2 Variography for Golden Chest Domains | 28-6 |
|
|
|
|
| 29.0 | Appendix 3 Grade Tonnage Curves for Each Zone | 29-10 |
| Tables |
|
| Table 1‑1 Golden Chest Projected Production for One Year | 1-3 |
| Table 2‑1 - List of Abbreviations | 2-2 |
| Table 3‑1 List of patented claims at the Golden Chest Mine, as of December 31, 2023 | 3-3 |
| Table 3‑2 List of patented claims outside the core of the Golden Chest Mine, as of December 31, 2023 | 3-4 |
| Table 3‑3 List of Unpatented Claims at the Golden Chest Property | 3-6 |
| Table 3‑4 Permit Descriptions | 3-7 |
| 1-7 |
| Table 4‑1 Average Climate for Burke, ID 10km South of Golden Chest | 4-1 |
| Table 6‑1 Belt Supergroup Stratigraphy in the Mine Region (modified after Gott 1980) | 6-2 |
| Table 10‑1 RDI Flotation Test Results | 10-3 |
| Table 11‑1 2023 Golden Chest Mine Mineral Resources | 11-1 |
| Table 11‑2 Skookum Open Pit Resource (Included in the overall resource reported in table 11-1) | 11-2 |
| Table 11‑3 Golden Chest 2023 Resource Model Domains | 11-3 |
| Table 11‑4 Summary of Samples from the Golden Chest | 11-4 |
| Table 11‑5 Model Extents for each Zone in the Golden Chest Northings, Eastings, and Elevations are UTM NAD27 Z11 Coordinates | 11-13 |
| Table 11‑6 Block Model Variables and Descriptions | 11-14 |
| Table 11‑7 Search Ellipsoid parameters by zone | 11-15 |
| Table 11‑8 Estimation Parameters | 11-16 |
| Table 11‑9 Golden Chest Resource Parameters | 11-18 |
| Table 11‑10 Cutoff calculation Inputs and results | 11-19 |
| Table 12‑1 Golden Chest Underground Proven and Probable Reserves at December 31st, 2023 | 12-1 |
| Table 12‑2 H-Vein Domain Portion of the 2023 Reserve | 12-2 |
| Table 12‑3 Idaho Vein Domain Portion of the 2023 Reserve | 12-2 |
| Table 12‑4 Go/No-Go Cut-off Parameters | 12-3 |
| Table 12‑5 H-Vein Test Mining Dilution by Stope | 12-4 |
| Table 13‑2 Development by Year and Company | 13-4 |
| Table 13‑3 Underground Mine Equipment List, Idaho Strategic Resources— | 13-5 |
| Table 13‑4 Idaho Pit Summary (August 2016-June 2020) | 13-5 |
| Table 14‑1 Mill Production Summary | 14-2 |
| Table 17‑1 Environmental Permits | 17-1 |
| Table 18‑1 Development Cost Estimates Associated with Reserves | 18-1 |
| Table 18‑2 2023 Annual Costs per Tonne and Mine Planning/Reserve Costs Used | 18-2 |
| Table 19‑1 Underground Reserve Scenario Production Summary. | 19-1 |
| Table 19‑2 Table of Golden Chest Underground Reserve Cash Flows | 19-2 |
|
|
|
| Figures |
|
|
|
|
| Figure 3‑1 Golden Chest Mine and New Jersey Mill Location Map | 3-1 |
| Figure 3‑2 Patented and unpatented claim locations | 3-2 |
| Figure 6‑1 Geologic Provinces of Idaho (Idaho State University 2017) | 6-1 |
| Figure 6‑2 Prichard Formation (Green), Gem Stocks (Pink), Major Fault Lineaments (Blue) and Trout Creek Anticline (Black) | 6-3 |
| Figure 6‑3 Regional Geologic Map | 6-4 |
| Figure 6‑4 Mine Geologic Map | 6-6 |
| Figure 6‑5 Banded Vein Example | 6-8 |
| Figure 6‑6 Brecciated Vein Example | 6-9 |
| Figure 6‑7 Massive Vein Example | 6-9 |
| Figure 6‑8 Vertical Cross-Section of Vein Location | 6-10 |
| Figure 6‑9 Gold-Sphalerite-Galena-Pyrite-Quartz Vein from the 941 Level | 6-11 |
| 1-8 |
| Figure 6‑10 Intrusive Related Orogenic Model (modified after Groves et al. 1998) | 6-14 |
| Figure 7‑1 Planview of Golden Chest Drill Traces | 7-15 |
| Figure 8‑1 Drill Sampling 3 gpt Standard QA/QC Tracking | 8-18 |
| Figure 8‑2 Drill Sampling 4 gpt Standards QA/QC Tracking | 8-19 |
| Figure 8‑3 Drill Sampling 8 gpt Standards QA/QC Tracking | 8-20 |
| Figure 8‑4 Drill Sampling 7 gpt Standard QA/QC Tracking | 8-20 |
| Figure 8‑5 Mine Office/Core Shed Building | 8-22 |
| Figure 9‑1 Printout of Vulcan Geology Core Validation Checks Performed on the 2023 Drillhole Database | 9-24 |
| Figure 10‑1 Aerial View of New Jersey Mill | 10-1 |
| Figure 10‑2 New Jersey Mill 100 TPD Flowsheet | 10-2 |
| Figure 11‑1 H-Vein and Idaho Vein 2023 Wireframes Looking Northeast (H-Vein Red, IDVN Tan) | 11-5 |
| Figure 11‑2 Histogram and General Statistics of the Skookum Area Idaho Vein | 11-6 |
| Figure 11‑3 Histogram and General Statistics of the Skookum Area H-Vein | 11-6 |
| Figure 11‑4 CDF of the H Vein Composite Database | 11-7 |
| Figure 11‑5 Histogram and General Statistics of H-Vein Block Model | 11-8 |
| Figure 11‑6 CDF and General Statistics of H-Vein Chip Samples | 11-8 |
| Figure 11‑7 Cumulative Frequency Chart of Sampling Lengths in the Golden Chest Database | 11-9 |
| Figure 11‑8 Histogram of Sample Lengths for the Golden Chest Database | 11-10 |
| Figure 11‑9 Histogram of Skookum area composite lengths for the Idaho Vein | 11-11 |
| Figure 11‑10 Histogram of H-Vein composite lengths | 11-11 |
| Figure 11‑11 Skookum Zone Idaho Vein variogram model with pair counts. Major and minor axis illustrate ranges in the 55–60-meter range | 11-12 |
| Figure 11‑12 H Vein Block Model by Resource Classification (Red-Measured, Yellow-Indicated, Blue-Inferred) | 11-18 |
| Figure 11‑13 Visual Validation Slice of the 2023 Updated H-Vein Model | 11-20 |
| Figure 11‑14 Comparison of Composite Means versus Block Means by Domain | 11-20 |
| Figure 11‑15 Swath Plot of Paymaster Jumbo Vein. Composites (Dark Blue) versus Blocks (Light Blue) | 11-21 |
| Figure 11‑16 Swath Plot of Paymaster Idaho Vein. Composites (Dark Blue) versus Blocks (Light Blue) | 11-22 |
| Figure 11‑17 Swath Plot of Skookum Idaho Vein. Composites (Dark Blue) versus Blocks (Light Blue) | 11-22 |
| Figure 11‑18 Swath Plot of Skookum Jumbo Vein. Composites (Dark Blue) versus Blocks (Light Blue) | 11-23 |
| Figure 11‑19 Swath Plot of Skookum H Vein. Composites (Dark Blue) versus Blocks (Light Blue) | 11-23 |
| Figure 11‑20 Swath Plot of Skookum Footwall. Composites (Dark Blue) versus Blocks (Light Blue) | 11-24 |
| Figure 11‑21 Swath Plot of Klondike Popcorn Vein. Composites (Dark Blue) versus Blocks (Light Blue) | 11-24 |
| Figure 11‑22 Swath Plot of Klondike Popcorn Vein. Composites (Dark Blue) versus Blocks (Light Blue) | 11-25 |
| Figure 13‑1 Map Showing Golden Chest Workings Outline | 13-1 |
| Figure 14‑1 New Jersey Mill Flowsheet | 14-2 |
| Figure 15‑1 Infrastructure Layout | 15-2 |
| Figure 19‑1 Sensitivity Analysis of Golden Chest Underground Reserves | 19-3 |
| Figure 20‑1 Map of Adjacent Properties | 20-5 |
| 1-9 |
| Figure 27‑1 Skookum Area Jumbo Vein Histogram and Raw Statistics | 27-2 |
| Figure 27‑2 Skookum Area H Vein Histogram and Raw Statistics | 27-2 |
| Figure 27‑3 Skookum Area Footwall Quartzite Histogram and Raw Statistics | 27-3 |
| Figure 27‑4 Paymaster Area Idaho Vein Histogram and Raw Statistics | 27-3 |
| Figure 27‑5 Paymaster Area Jumbo Vein Histogram and Raw Statistics | 27-4 |
| Figure 27‑6 Klondike Area Popcorn Vein Histogram and Raw Statistics | 27-4 |
| Figure 27‑7 Klondike Area Hangingwall Histogram and Raw Statistics | 27-5 |
| Figure 28‑1 Skookum Area Jumbo Vein Experimental Variogram with Modeled Variogram | 28-6 |
| Figure 28‑2 Skookum Area H Vein Experimental Variogram with Modeled Variogram | 28-6 |
| Figure 28‑3 Skookum Zone Footwall Domain Experimental Variogram and Modeled Variogram | 28-7 |
| Figure 28‑4 Paymaster Area Idaho Vein Experimental Variogram with Modeled Variogrom | 28-7 |
| Figure 28‑5 Paymaster Area Jumbo Vein Experimental Variogram with Modeled Variogram | 28-8 |
| Figure 28‑6 Klondike Hangingwall Experimental Variogram with Modeled Variogram | 28-8 |
| Figure 28‑7 Klondike Zone Popcorn Vein Experimental Variogram with Modeled Variogram | 28-9 |
| Figure 29‑1 Grade Tonne Curve for the Skookum Zone Resource and Reserve Combined | 29-10 |
| Figure 29‑2 Grade Tonne Curve for the Paymaster Zone Resource | 29-11 |
| Figure 29‑3 Grade Tonne Curve for the Klondike Zone Resource | 29-11 |
| 1-10 |
1.0 EXECUTIVE SUMMARY
1.1 Summary
This Technical Report Summary (TRS) on the Golden Chest Mine, Idaho (Golden Chest, property, or mine) has been prepared for Idaho Strategic Resources, Inc. (IDR) by the Qualified Persons (QP’s) Grant A. Brackebusch, P.E., Robert J. Morgan, PG, PLS, and Andrew A. Brackebusch, P.E. All three are employees of IDR. Grant Brackebusch is the Vice President of Operations, Rob Morgan is the Vice President of Exploration, and Andrew Brackebusch is the Mine Engineer.
The purpose of this report is to disclose Mineral Reserves and Mineral Resources at the Golden Chest Mine as of December 31, 2023.
IDR is listed on the NYSE and currently reports Mineral Reserves in its Annual Report on Form 10K with the United States Securities and Exchange Commission (SEC). This TRS conforms to SEC’s Modernized Property Disclosure Requirements for Mining Registrants as described in Subpart 229.1300 of Regulation S-K, Disclosure by Registrants Engaged in Mining Operations (S-K 1300) and Item 601 (b)(96) Technical Report Summary.
The Golden Chest mine is narrow vein underground gold mine located in Murray, Idaho, which produces approximately 40,000 tonnes of ore annually to feed the New Jersey Mill in Kellogg, Idaho. The Golden Chest has operated continually since 2016. The New Jersey Mill produces a bulk sulfide flotation concentrate which is shipped to overseas smelters.
1.1.1 Conclusions
The QP’s offer the following interpretations and conclusions by area.
Geology and Mineral Resources
|
| · | The Company has completed a Mineral Resource Estimate for the year ending December 31, 2022, which has been reviewed and accepted by the QP’s. Measured and Indicated Resources at the Golden Chest Mine total 1,072,155 tonnes at a grade of 4.10 grams per tonne (gpt) gold with Inferred Resources totaling 743,793 tonnes at a grade of 3.23 gpt gold. The Mineral Resources are exclusive of Mineral Reserves. |
|
|
|
|
|
| · | Core sampling is supervised by professional geologist and sampling procedures meet industry best practices. |
|
|
|
|
|
| · | The sample preparation, security, and analytical procedures for core samples were consistent with generally accepted industry best practices. |
|
|
|
|
|
| · | The QA/QC procedures for core samples are consistent with generally accepted industry standards. However, a persistent, low bias in assay results was found in the 3 gpt standard. |
|
|
|
|
|
| · | Blanks and standards are not currently included with round samples from the stope rounds. Blanks and standards should be included with round samples on a weekly basis. |
|
|
|
|
|
| · | The QP’s review of database validation yielded no deficient procedures or data. The sample database is valid for reserve and resource calculations. |
| 1-0 |
Mining and Mineral Reserves
|
| · | The Mineral Reserve estimate of has been reviewed by the QP’s and found to be in accordance with the definitions for Mineral Reserves in S-K 1300. Mineral Reserves at December 31, 2023, are 127,477 tonnes at an average grade of 6.74 gpt gold using a gold price of $1,850 per troy ounce. |
|
|
|
|
|
| · | The majority of the Mineral Reserves are from the H-Vein (75%) and the remainder are from the Idaho Vein, which are both near existing infrastructure and previously mined areas where sample data is dense enough for the Proven and Probable classifications. |
|
|
|
|
|
| · | Mineral Reserves are prepared by qualified personnel with appropriate supervision using industry-standard mining software. |
|
|
|
|
|
| · | The QP’s believe the use of a trailing three-year average gold price is appropriate and consistent with generally accepted practices within the mining industry. |
|
|
|
|
|
| · | The mining methods in the stopes at the Golden Chest are underhand cut-and-fill utilizing cemented rock fill (CRF), and overhand cut-and-fill utilizing uncemented gob fill. |
|
|
|
|
|
| · | The mining methods are appropriate for this type of vein deposit and the ground conditions with average minimum widths of 2.5 m in the H-Vein Stopes and an average stope width of 3.0 m in the Idaho Vein Stopes. |
|
|
|
|
|
| · | The Mineral Reserve is based on underhand cut-and-fill and overhand cut-and-fill where appropriate. |
|
|
|
|
|
| · | Block model planned stope grades in the H-Vein agree with mill grades observed during the 2023 H-Vein mining campaign. A reconciliation of the block model and mine versus the mill feed should completed once a full year of H-Vein ore has been the singular source of mill feed. |
|
|
|
|
|
| · | Dilution is accounted for in the Mineral Reserve estimate and extraction is assumed to be 100%. |
|
|
|
|
|
| · | The ground support plan with the use of Swellex-bolts in conjunction with cemented rock fill (CRF) has improved geotechnical stope stability of the Idaho Vein. The H-Vein ground conditions are considerably better than the Idaho Vein and require less support. |
|
|
|
|
|
| · | The mine uses 1.5 m3 rubber-tired LHDs along with diesel-hydraulic drill jumbos and a two underground dump trucks (22 tonne capacity and 30 tonne capacity). |
|
|
|
|
|
| · | Life-of-Mine (LOM) plans should be completed once an updated Mineral Resource estimate is completed. Mining equipment, infrastructure, and mineral processing requirements could be determined once a LOM plan is completed. |
| 1-1 |
Mineral Processing
|
| · | Material is shipped from the Golden Chest Mine in Murray, Idaho to the New Jersey Mill in Kellogg, Idaho for processing using highway dump trucks with pups. |
|
|
|
|
|
| · | The New Jersey Mill operates as a bulk flotation plant at a rate of approximately 40,000 tonnes per year to produce a bulk-sulfide concentrate for sale to copper smelters in Asia. |
|
|
|
|
|
| · | The mill has processed nearly 289,370 tonnes of material from the Golden Chest open pit and underground and achieved gold recovery of 88.9% with an average concentrate grade of 262 gpt gold. |
|
|
|
|
|
| · | The mill has achieved higher gold recovery of 93% for straight underground material. This is appropriate gold recovery to use for underground Mineral Reserve estimates. |
|
|
|
|
|
| · | Previous campaigns of processing material from the Golden Chest at the 100 tpd New Jersey Mill from 2005 to 2009 provided metallurgical testing information at a bulk-sample scale. |
|
|
|
|
|
| · | RDI performed metallurgical testing evaluating gravity, flotation, and cyanidation processes using core samples from the Skookum Shoot. |
|
|
|
|
|
| · | The New Jersey Mill utilizes the novel process of paste tailings disposal and recycles process water to minimize its impact on the environment. |
Infrastructure
|
| · | The Golden Chest Mine is accessible all year round via a paved highway known as Forest Highway 9 and has all the necessary infrastructure to mine at the current rate. |
|
|
|
|
|
| · | An increase in the current mining rate would require an upgrade to the electrical power line to the mine. |
Environment
|
| · | The Golden Chest Mine and New Jersey Mill have all the necessary environmental permits to operate. |
|
|
|
|
|
| · | The Company has posted bonds to cover the cost of reclamation at both the Golden Chest and New Jersey Mill. |
|
|
|
|
|
| · | The Company promotes a “We Live Here” philosophy which encourages a commitment to the environment because employees and management all live and recreate in the local area. Local hiring and buying are also encouraged under this philosophy. |
1.1.2 Recommendations
The QP’s offer the following recommendations by area.
Geology and Mineral Resources
|
| 1. | The 3 gpt standard assays should be investigated to determine if a cause for the low bias can be found. |
|
|
|
|
|
| 2. | Blanks and standards should be included with the round samples on a weekly basis. |
|
|
|
|
|
| 3. | Follow-up or closeout assays around a vein intercept should be checked on a regular basis to ensure that they have been added to the sample database to avoid inaccuracies in compositing. |
| 1-2 |
Mining and Mineral Reserves
|
| 1. | Complete the reconciliation of mill tonnes and grade to the block model once a full year of processing only H-Vein ore has been completed. |
|
|
|
|
|
| 2. | Evaluate other geostatistical methods such as Kriging and try to optimize grade estimation. |
|
|
|
|
|
| 3. | Complete the construction of a paste backfill system for the potential to reduce operating costs. |
|
|
|
|
|
| 4. | Attempt to expand Mineral Resources and Reserves with more core drilling targeting the H-Vein and Klondike. |
Mineral Processing
|
| 1. | Hire a metallurgical consultant to perform a plant audit of the mill to help optimize operational parameters to maximize net smelter return. |
|
|
|
|
|
| 2. | Complete a laboratory flotation testing program using H-Vein ore to optimize metallurgical performance at the New Jersey Mill. |
Infrastructure
|
| 1. | Complete the electrical power expansion from 500 kVA to 1,000 kVA at the Golden Chest Mine so sufficient power is available for paste plant operation and mine expansion. |
Environment
|
| 1. | Consider hiring a full-time environmental professional or environmental contractor as the scope of operations has increased. |
|
|
|
|
|
| 2. | Make plans to drill three groundwater monitoring wells at the Golden Chest Mine. |
1.2 Economic Analysis
1.2.1 Economic Criteria
IDR completed a three-year cash flow analysis for the Mineral Reserve estimation as it prefers to use sample information from mining previous levels to increase the confidence in grade estimation which produces a more accurate estimate in a narrow vein gold deposit.
1.2.2 Physical Parameters
|
| · | Total mill feed processed: 127,477 tonnes |
|
|
|
|
|
| · | Average processing rate: 185 metric tonnes per shift |
Table 1‑1 Golden Chest Projected Production for One Year
| Commodity | Head Grade | Mill % Recovery | Mill Recovered Au (Grams) | Mill Recovered Au (Troy oz) |
| Au | 6.74 | 93 | 799,171 | 25,700 |
| 1-3 |
1.2.3 Revenue Parameters
|
| · | Gold price used in the economic analysis is a constant $1,850 per troy ounce representing a 3-year trailing average (2021, 2022, 2023). |
|
|
|
|
|
| · | Constant smelter payment factor of 91% |
|
|
|
|
|
| · | Constant Net of Smelter Royalty (NSR) of 2% |
1.2.4 Operating and Capital Costs
|
| · | Constant Net of Smelter Royalty (NSR) of 2% |
|
|
|
|
|
| · | Constant Ore haulage cost of $15.00per tonne |
|
|
|
|
|
| · | Constant milling cost of $38.00 per tonne |
|
|
|
|
|
| · | Constant ore mining with fill of $92.00 per tonne |
|
|
|
|
|
| · | Constant development cost of $52.00 per tonne |
|
|
|
|
|
| · | Sustaining capital of $2,400,000for mine equipment and $2,400,000 for mill infrastructure |
|
|
|
|
|
| · | Mine life of three years |
1.2.5 Taxes and Royalties
Idaho Strategic Resources pays property tax in Shoshone County and occasionally a Net Profit Tax to Shoshone county. No income tax is anticipated to be payable in the next year as IDR has a substantial corporate tax loss carryforward.
The current production zone is subject to a 2% NSR royalty payable to Calibre Mining which is included in the estimate. Property taxes and net profit tax paid to Shoshone County are minor compared to the 2% NSR and are negligible in this analysis.
1.2.6 Cash Flow
The results of this analysis indicate a positive cash flow of approximately $14,215,000at the base case. Capital requirements are paid within the year and the positive cash flow indicates economic viability at the base case $1,850 per troy ounce gold price. See Table 19-2 for more detail.
1.2.7 Sensitivity
The sensitivity analysis found that gold mill recovery, smelter payment factor, gold grade, and gold price are the most sensitive variables in the estimate.
1.3 Technical Summary
1.3.1 Property Description
The Golden Chest Mine’s production operations are located 2.4 km east of Murray, Idaho along Forest Highway 9. The mine is an underground cut-and-fill gold property exploiting a narrow, quartz vein system. The Golden Chest produces about 40,000 tonnes of ore annually utilizing underhand cut-and-fill and overhand cut-and-fill mining methods. The ore is processed at the New Jersey Mill in Kellogg, Idaho to produce a bulk-sulfide concentrate for sale to smelters in Asia. The rest of the project lies immediately northwest, north, and northeast of the town of Murray, ID.
| 1-4 |
1.3.2 Land Tenure
The Company owns 100% of the Golden Chest mine and the core land position is comprised of both patented 182 hectares (449 acres) and unpatented claims 563 hectares (1,390 acres) subject to a 2% Net Smelter Royalty (NSR). The Company owns an additional 353 hectares (873 acres) of patented land and 1,178 hectares (2,910 acres) of unpatented claims, immediately north and west of Murray, that are not subject to any NSR.
1.3.3 History
The Golden Chest Mine is the oldest lode gold mine in the Coeur d’Alene District. Historic reports peg the estimated production of the Golden Chest at 65,000 ounces of gold produced before 1940. Since 1940 gold production is estimated to be approximately 45,000 ounces with this production occurring after 2004.
1.3.4 Geologic Setting, Mineralization, and Deposit
The Golden Chest property is dominated by lithologies of the Prichard Formation representing the base of the Mesoproterozoic Belt Supergroup. The Prichard is made up of a series of metamorphosed marine basin sediments consisting of siltite, argillite, and quartzite. The Golden Chest is an orogenic gold deposit with mineralization hosted in quartz-gold veins near a major local fault. The primary geological controls to mineralization at the Golden Chest are the Idaho Fault and the Timber King Fault with gold mineralization occurring within 50 meters of fault structures.
1.3.5 Exploration
Currently IDR is conducting exploratory core drilling on the property with the aim to increase the Mineral Resource and help define the Mineral Reserve.
1.3.6 Mineral Resource Estimate
The Company has completed a Mineral Resource Estimate for the year ending December 31, 2023. Measured and Indicated Resources at the Golden Chest Mine total 1,072,155 tonnes at a grade of 4.04 gpt gold with Inferred resources totaling 743,793 tonnes at a grade of 3.23 gpt gold. Mineral Resources are exclusive of the Mineral Reserves.
1.3.7 Mineral Reserve Estimate
Mineral Reserve estimates, prepared by IDR and reviewed and accepted by the QP’s, have been classified in accordance with the definitions for Mineral Reserves in S-K 1300 and are estimated to be 127,477 tonnes at a grade of 6.74 gpt gold.
1.3.8 Mining Methods
The Golden Chest Mine is accessed by a decline ramp 4.5 m by 4.0 m in cross-section. A northern ramp provides for an escapeway and secondary escape. The vein is mined by underhand cut-and-fill utilizing cemented rock fill (CRF) as backfill and overhand cut-and-fill utilizing uncemented gob fill. Ore and waste are transported to the surface via the main ramp with 30-tonne and 22-tonne haul trucks.
1.3.9 Mineral Processing
The New Jersey Mill located 3 km east of Kellogg, Idaho has processed material from the Golden Chest since 2016 from both open pit and underground sources at a rate of about 300 tpd for 3.5 days per week. The New Jersey Mill uses a conventional bulk sulfide flotation flowsheet utilizing crushing, grinding, flotation, and paste tailings disposal. Concentrate is shipped to copper smelters in Asia.
| 1-5 |
1.3.10 Infrastructure
The Golden Chest mining operations have been ongoing since 2012 and infrastructure at the site includes 1,750 meters of underground ramp, electrical service, a core shed, a mine dry, and a shop building. Year-round access to the mine is provided by Forest Highway 9 which is maintained by Shoshone County.
1.3.11 Market Studies
The Golden Chest produces a bulk sulfide concentrate sold to copper smelters in Asia through a concentrate broker and has sold concentrate in this fashion since 2016.
1.3.12 Environmental Permitting
The Golden Chest Mine and New Jersey Mill have all the necessary environmental permits to operate. The New Jersey Mill utilizes a unique tailings disposal method known as paste tailings disposal that allows process water recycling and prevents the discharge of process water to surface waters of the US.
| 1-6 |
2.0 INTRODUCTION
This Technical Report Summary (TRS) on the Golden Chest Mine (Golden Chest, property, or mine) has been prepared for Idaho Strategic Resources, Inc. (IDR) by the Qualified Persons (QP’s) Grant A. Brackebusch, P.E. and Robert J. Morgan, PG, PLS. Both are employees of IDR. Brackebusch is the Vice President of Operations and Morgan is the Vice President of Exploration.
The purpose of this report is to disclose Mineral Reserves and Resources at the Golden Chest Mine as of December 31, 2023.
Idaho Strategic Resources, Inc. (IDR) is listed on the NYSE and currently reports Mineral Reserves and Resources in its Annual Report on Form 10K with the United States Securities and Exchange Commission (SEC). This TRS conforms to SEC’s Modernized Property Disclosure Requirements for Mining Registrants as described in Subpart 229.1300 of Regulation S-K, Disclosure by Registrants Engaged in Mining Operations (S-K 1300) and Item 601 (b)(96) Technical Report Summary.
2.1 Site Visit
The three QP’s are employees of IDR and spend a significant portion of their time at the mine and the mill so a site visit is unnecessary.
2.2 Sources of Information
During the preparation of this report discussions were held with the following personnel.
| Rick Alexander | Mill Lead Operator, IDR |
| John Etienne | Chief Geologist, IDR |
| John Ferguson | Company Accountant, IDR |
| Rebecca Goddard | Exploration Geologist, IDR |
| Matt Williams | Golden Chest Mine Foreman, IDR |
| Jared Williams | Golden Chest Mine Foreman, IDR |
| Mike Leeling | Golden Chest Mine Foreman, IDR |
| Steve Elliott | Golden Chest Maintenance Foreman, IDR |
Other sources of information can be found in Section 24.0 References.
| 2-1 |
2.3 List of Abbreviations
Table 2‑1 - List of Abbreviations
| Term | Abbreviation |
| Acres | ac |
| Ammonium Nitrate/Fuel Oil | ANFO |
| Bureau of Land Management | BLM |
| Canadian National Instrument 43-101 | NI 43-101 |
| Centimeter | cm |
| Concentrate Leach Plant | CLP |
| Cemented Rock Fill | CRF |
| Cubic meter(s) | m3 |
| Cubic meters per hour | m3/hr |
| Cyanide | CN |
| Meters | m |
| Degrees Celsius | oC |
| Direct Current | DC |
| Environmental Protection Agency | EPA |
| Fire assay | FA |
| Diameter | dia. |
| Global positioning system | GPS |
| Gram(s) | g |
| Grams per tonne | gpt, g/t |
| Grams per tonne of gold | g/t Au |
| Gold | Au |
| Golden Chest Limited Liability Company | GCLLC |
| Golden Chest Mine | “The Mine” |
| Hectare(s) | ha |
| Hour | hr |
| Idaho Department of Environmental Quality | IDEQ |
| Idaho Strategic Resources, Inc. | IDR |
| Juniper Mining Company | JMC |
| Kilogram | kg |
| Kilograms per tonne | kg/tonne |
| Kilometer(s) | km |
| Kilowatt | kW |
| Kilowatt Hour | kWh |
| Kilo-Volt-Ampere | kVa |
| Load-Haul-Dump loader | LHD |
| Main Access Ramp | MAR |
| Meter(s) | m |
| Meters above sea level | masl |
| Micron(s) | μm |
| Millimetre(s) | mm |
| Million | M |
| Million years old | Ma |
| Minute(s) | min |
| 2-2 |
| Term | Abbreviation |
| Net Smelter Royalty | NSR |
| New Jersey Mill | “The Mill” |
| North American Datum | NAD |
| Ounces per tonne | opt |
| Parts per million | ppm |
| Professional Geologist | PG |
| Professional Land Surveyor | PLS |
| Professional Engineer | PE |
| Quality Assurance | QA |
| Quality Assurance/Quality Control | QA/QC |
| Quality Control | QC |
| Qualified Person | QP |
| Reduced Intrusion-Related Gold System | RIRGS |
| Rock Storage Site | RSS |
| Second | s |
| Small Mine Development | SMD |
| Sodium cyanide | NaCN |
| Tailings Storage Facility | TSF |
| Tonne(s) | t |
| Tonnes per Day | tpd |
| Tonnes per hour | t/h |
| United States | US |
| United States Dollars | USD$ |
| Universal Transverse Mercator | UTM |
| 2-3 |
3.0 PROPERTY DESCRIPTION
3.1 Location
The Golden Chest Mine (Mine) has an area of 2,275 hectares (ha) (5,622acres) and is located in Shoshone County, Idaho, United States. The mine is approximately centered at Latitude 47o37’14” North and Longitude 115o49’43” West (Figure 3-1). The mine is approximately 2.4 kilometers (km) east of the small town of Murray, Idaho and 115 km east of the city of Coeur d’ Alene, Idaho.
The New Jersey Mill (Mill) is located in Shoshone County, Idaho, United States approximately at Latitude 47o31’50” North and Longitude 116o04’38” West (Figure 3-1). The Mill is located approximately 21 km south of the town of Murray, Idaho and 3 km east of the city of Kellogg, Idaho.
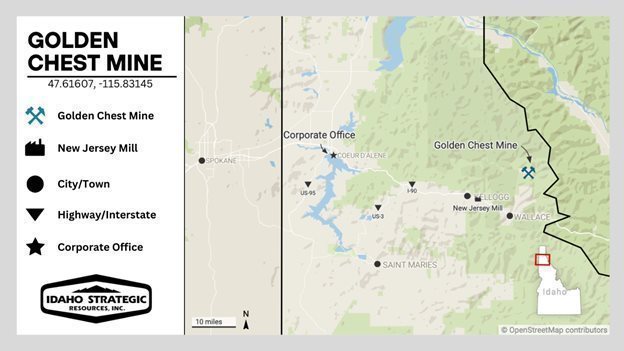
Figure 3‑1 Golden Chest Mine and New Jersey Mill Location Map
3.2 Ownership and Holdings
The Golden Chest Mine is composed of patented and unpatented claims (Figure 3-2). The land position consists of 86 patented mining claims (Table 3-1) covering approximately 535 hectares (ha) (1,322 acres) and 217 unpatented claims covering a total of approximately 1,740 ha (3,360 acres).
| 3-1 |

Figure 3‑2 Patented and unpatented claim locations
The core of the Golden Chest Mine is a contiguous group of 34 patented claims where all modern mining has taken place to date. The Company owns the rights to both the surface and subsurface mineral on all patented claims directly and through it’s 100% held subsidiary Golden Chest LLC (GCLLC), excluding the Joe Dandy Claim where IDR owns only the subsurface mineral rights. As these patented claims are considered private lots, legal access is allowed. Property taxes on patented claims are assessed by Shoshone County each year and IDR has paid the taxes in full. Table 3-1 below lists the patented claims that form the core of the Golden Chest Mine. Table 3-2 lists the patented claims outside of the core of the Golden Chest Site.
| 3-2 |
Table 3‑1 List of patented claims at the Golden Chest Mine, as of December 31, 2023

| 3-3 |
Table 3‑2 List of patented claims outside the core of the Golden Chest Mine, as of December 31, 2023
| Claim Name | Mineral Survey # | Hectares | Acres |
| Dream Gulch | 1196 | 8.16 | 20.2 |
| Niagara | 1306 | 2.61 | 6.4 |
| Grandchamp | 1772 | 7.67 | 18.9 |
| Hornet | 1772 | 5.55 | 13.7 |
| Golden King | 18 | 4.75 | 11.7 |
| Skookum | 19 | 3.84 | 9.5 |
| Grouse | 20 | 6.86 | 17.0 |
| Chas Long | 778 | 1.59 | 3.9 |
| Dixie | 778 | 1.80 | 4.5 |
| Nelson | 1027 | 1.66 | 4.1 |
| Kennedy | 1027 | 0.96 | 2.4 |
| Accident #2 | 1744 | 7.34 | 18.1 |
| Accident #3 | 1744 | 7.85 | 19.4 |
| No. 1 | 1744 | 7.77 | 19.2 |
| Gilbert | 1744 | 7.00 | 17.3 |
| Shields Fraction | 1744 | 6.83 | 16.9 |
| Confidence | 1744 | 7.98 | 19.7 |
| Highland | 1762 | 39.77 | 98.3 |
| Highland Extension | 1762 | 15.75 | 38.9 |
| New Era | 778 | 0.51 | 1.3 |
| Lots 3,4,5,6 | Former Gov't lot | 1.76 | 4.3 |
| Complete | 1786 | 26.87 | 66.4 |
| Deep Rim | 1157 | 2.61 | 6.4 |
| Wedge | 1157 | 5.97 | 14.7 |
| Minnie Lee | 1157 | 3.02 | 7.5 |
| Ninety-Five | 1157 | 2.47 | 6.1 |
| Summit | 1157 | 3.09 | 7.6 |
| Gold Dust | 1744 | 5.69 | 14.1 |
| Bed Rock | 1157 | 5.99 | 14.8 |
| Wolf | 9 | 3.09 | 7.6 |
| Snow Bird | 1738 | 7.68 | 19.0 |
| McCormick | 1772 | 6.74 | 16.7 |
| Davison Tax Parcel MC0637 | 0.78 | 1.9 |
|
| LeFaivre | 1772 | 5.41 | 13.4 |
| 4th of July | 1739 | 28.19 | 69.7 |
| Dandy | 1739 | 7.52 | 18.6 |
| Burr, Stokes & Bidwell | 1739 | 6.45 | 15.9 |
| Park | 1739 | 6.44 | 15.9 |
| Cora Amended | 1064 | 1.46 | 3.6 |
| 3-4 |
| Alder No. 1 | 1769 | 5.41 | 13.4 |
| Big Ledge | 2252 | 6.62 | 16.3 |
| Lady Elgin | 1769 | 3.77 | 9.3 |
| Lucky Dog | 1769 | 7.17 | 17.7 |
| Kentucky | 1769 | 6.82 | 16.9 |
| Blue Bird | 1769 | 2.51 | 6.2 |
| small wedge N of BlueBird | Former Gov't lot | 0.21 | 0.5 |
| Lots 10,11,12 | Former Gov't lots | 15.82 | 39.1 |
| Evans | 1769 | 7.56 | 18.7 |
| Ida | 1769 | 5.86 | 14.5 |
| Vivian | 549 | 6.14 | 15.2 |
| Cahan | 1772 | 3.88 | 9.6 |
| Badger | 894 | 4.05 | 10.0 |
| Total |
| 353.28 | 872.98 |
IDR currently maintains 217 unpatented mining claims covering 1,740 ha (4,300 acres). The claims have been filed with the United States Bureau of Land Management (BLM) agency and at the Shoshone County Courthouse. Annual maintenance fees are paid to the BLM by September 1, and the Golden Chest unpatented claim fees have been paid and are in good standing. The unpatented mining claims are located on parcels of public land from which the claimant owns the mineral rights, however, no surface land ownership is conveyed.
| 3-5 |
Table 3‑3 List of Unpatented Claims at the Golden Chest Property
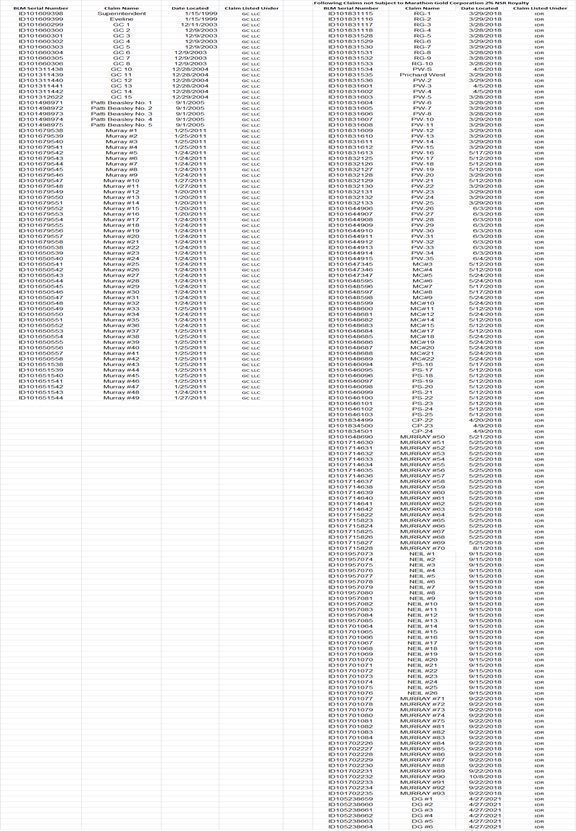
| 3-6 |
3.3 Royalty
The Company owns 100% of the Golden Chest mine and the core land position is comprised of both patented (181.7 hectares [449 acres]) and unpatented claims (563 hectares [1,390 acres]) subject to a 2% Net Smelter Royalty (NSR) payable to Calibre Mining on a quarterly basis.
3.4 Permit Requirements
The Golden Chest Mine and New Jersey Mill have all the required environmental permits to operate currently and into the foreseeable future. Some permits may require modification if operating conditions change, but typically these changes can be completed without impeding the mining operation. A summary of the permits held by the Company are found in Table 3-4.
Table 3‑4 Permit Descriptions
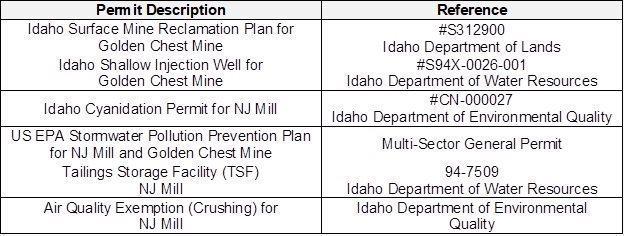
3.5 Encumbrances and Other Risks
As mentioned earlier, IDR does not own the surface of the Joe Dandy claim, however the deed for the claim contains language granting the owner of the mineral rights the ability to work and operate on the claim to mine the quartz lode. The Company is not aware of any significant factors or risks that may affect access, title, or the right or ability to perform work on the property.
| 3-7 |
4.0 ACCESSIBILITY, CLIMATE, LOCAL RESOURCES, INFRASTRUCTURE AND PHSYIOGRAPHY
4.1 Accessibility
The Golden Chest Mine is accessible year-round via a paved road known as Forest Highway 9 - a distance of 56 kilometers (35 miles) from Kingston, Idaho. At Kingston, Forest Highway 9 merges with US Interstate 90 for easy access to the local communities of Kellogg, Wallace, and Coeur d’Alene.
4.2 Climate
The Golden Chest is located in northern Idaho, which has a mountain climate typical for temperate regions in the mid-latitudes that are influenced by both polar and tropical air masses typified by wet, cold winters and short, dry summers.
The nearest climate records are found from Burke, Idaho (1907-1967) which is located approximately 10 km south of the mine at a slightly higher elevation.
Table 4‑1 Average Climate for Burke, ID 10km South of Golden Chest
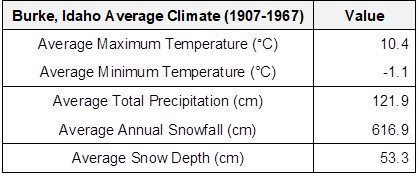
Average annual precipitation is 121.9 cm, falling mainly in winter. Average annual snowfall is 616.9 cm and may occur in spring and fall as well as in winter.
During the winter, IDR is able to operate all season by plowing snow from the mine roads and utilizing tire chains on equipment when necessary. Forest Highway 9 is maintained all winter by Shoshone County.
4.3 Local Resources and Infrastructure
The Golden Chest Mine benefits from local human resources and services in the towns of Murray, Wallace, and Kellogg, Idaho which are located 2.4 km west, 18 km south, and 24 km southwest respectively of the mine. Wallace, with a population of 1076 people at the 2020 census, is the county seat of Shoshone County.
The area has a long mining heritage as gold was discovered in Murray in 1882 and mining has continued to the present – mostly south of the Golden Chest in the Silver Valley. Current underground mining in the area is conducted by Hecla at the Lucky Friday Mine and Americas Gold and Silver Corporation at the Galena Mine. These historic and modern mining operations have resulted in an area that is familiar with and is equipped to support the mining industry. Experienced mining personnel and small business support are available.
| 4-1 |
4.4 Physiography and Environment
The topography of the mine area consists mainly of steep, mountainous terrain, which is primarily covered in mixed coniferous forest, except where recently burned. The mine is characterized by high relief, with elevations ranging from 880 meters above sea level (masl) at the Prichard Creek valley bottom to 1,220 masl on the ridges at the north end of the mine’s patented claim group.
The drainage pattern around the mine consists of dendritic perennial and intermittent watercourses that drain generally southwest. The dominant watercourses of the area are the North Fork of the Coeur d’ Alene River and Prichard Creek. The area is characterized by incised streams bounded by long steep ridges.
Timber consists mostly of pine, fir, cedar, and hemlock. Elk, deer and moose are the most common large mammals in the area. Other reported mammals in the surrounding area are black bear, wolf, and mountain lion. There are no known protected species within the mine area.
| 4-2 |
5.0 HISTORY
5.1 Location of District
The Golden Chest Mine is the oldest lode gold mine in the Coeur d’Alene District. The area commonly known as the Coeur d'Alene Mining District, has been subdivided for purposes of record and administration into a number of local mining districts. All of these subdivided local mining districts are in Shoshone County, Idaho. The Golden Chest Mine is more specifically located in the Summit Mining District within the Murray Gold Belt region of the greater Coeur d’Alene Mining District.
5.2 Historic Gold Mining
The first discovery of gold in the Coeur d’Alene District was made along the South Fork of the Coeur d’Alene River by Thomas Irwin in 1879. A.J. Prichard initiated the first active mining in 1882 when he staked out a number of placer claims for himself and his friends near the present site of Murray. The first lode claim in the district, the Paymaster, was located in September of 1883 and is now part of the Golden Chest.
By the end of 1883 and early in 1884, several mines were developed along Prichard Creek; the Mother Lode, Daddy, and Treasure Box mines on the creek’s south side, and the Golden Chest on the north side. By 1885, Murray had a population of about 1,500 with the Golden Chest and its 20-stamp mill employing 25 to 30 men. However, by 1886, with the discovery of the enormous lead-silver deposits at Bunker Hill, the scene of most mining activity had shifted to the South Fork of the Coeur d’Alene River near Kellogg. The Buckskin and King mines, on the Company’s land package northwest of Murray, were also active in the 1890’s. No gold production records from these two properties are known. The mining of lode quartz-gold veins had essentially ceased by 1900.
Prior to 1910, the Katie-Dora and Klondike Ore Shoots were accessed from the Katie #2, Katie #3, Martin, and Pettit Levels. After consolidation of the properties in 1910, the Idaho #3 level was completed at a lower elevation to access the deeper levels of the Katie-Dora and Klondike zones. Starting in late 1915, the Golden Chest was reopened as a source of tungsten (scheelite) for high-speed steels used in cutting tools designed for armament production in the First World War. The Anchor Mine, on Company ground north of Murray, was actively producing lead, silver, and zinc during the same time period.
During the Depression, placer mining was considerably revived, and in 1933 and 1934 the Golden Chest was again active. Only a small amount of work was in progress and most of the historic underground gold mining was complete when P. Shenon, of the Idaho Bureau of Mines and Geology, visited the Golden Chest in 1935. Shenon reported that underground maps displayed over 4,000 m of drifts and crosscuts.
Historic reports peg the estimated production of the Golden Chest at 65,000 ounces of gold produced before 1940. The first documented drilling program on the Golden Chest Mine was conducted between 1969 and 1973 by Golden Chest Incorporated (GCI). Drill tests by GCI included four underground holes and one surface diamond drill hole totaling 385 m. The surface hole intersected an 18 m zone containing multiple, low-grade gold-bearing quartz veins.
Newmont Exploration Limited (NEL) conducted exploration activities including mapping, sampling and drilling between 1987 and 1990. In 1987 and 1988, Newmont completed six core drill holes with depths to 175 m. In 1988 and 1989, an additional 29 reverse-circulation holes, with depths up to 130 m, were completed on the property. Newmont dropped the property in 1990, due to the property not fulfilling their requirements for an open pit resource.
| 5-1 |
5.3 Historical Mineral Resource Estimates
Newmont Exploration Limited (NEL) evaluated the Golden Chest for bulk mineable potential between 1987 and 1990. Newmont drilled six core holes totaling 734 total meters; and 29 reverse-circulation holes totaling 2,659 total meters. This work resulted in a mineral resource estimate as follows:
| · | Potential Open Pit Resource: 4,758,852 short tons grading 0.049 ounces per ton (opt) Au for 230,278 ounces of gold at cut-off grade of 0.02 opt Au. |
Since these “resources” are historical in nature, they cannot be relied upon. It is unlikely that these resource numbers conform to current SK 1300 criteria or to Society of Mining Metallurgy and Exploration (SME) standards, and most importantly they have not been verified to determine their relevance or reliability. However, they have been included into this section for illustrative purposes only and should not be disclosed out of context.
5.4 New Jersey Mining Company (IDR 2003-2012)
IDR leased the Golden Chest in 2003 and began a core drilling program to confirm several of Newmont’s favorable drill intercepts. Confirmatory core drilling results led to enough validation to begin a new portal (North Portal) in late 2004. Between 2004 and 2008, a 440 m spiral ramp was developed from the surface down to the historic Idaho #3 Level.
Between 2004 and 2012, small-scale mining by IDR from the North Portal access extracted a total of 8,400 tonnes of material grading 6.90 gpt Au, with a total of 1,705 ounces (oz) of gold recovered.
5.5 Golden Chest LLC (2010-2015)
The Golden Chest Limited Liability Company (GCLLC) was formed in December 2010 by a joint venture agreement between IDR and Marathon Gold USA. GCLLC began an intense surface drilling program; drilling 106 core holes in 2011 and 45 core holes in 2012 totaling over 18,000 meters.
5.6 Micon NI 43-101 (2011 and 2012)
Marathon Gold Corporation, a Canadian company and parent company to Marathon Gold USA required an independent NI 43-101 Technical Report in order to support regulatory disclosures leading to the “Micon Technical Report on the Initial Resource Estimate at the Golden Chest Property, Idaho, United States, effective date December 31, 2011”. Continued work the next year led to the development of an updated, second technical report by Micon in 2012. The updated 2012 NI 43-101 technical report included an overall mineral resource 254,000 oz gold in the Measured and Indicated categories and 223,000 oz gold in the Inferred category @ 0.4 gpt gold cut-off. The Micon 2012 report also included an open pit resource estimate with 4.63-million tonnes grading 1.71 grams per ton (gpt) gold and totaling 223,000 ounces (oz) of gold in the “Measured” and “Indicated” categories.
| 5-2 |
5.7 Juniper Mining Company (2013)
In September of 2013, Juniper Mining Company leased from GCLLC a section along the Idaho Fault known as the Skookum Shoot. Juniper conducted confirmation drilling, consisting of 16 surface core holes, to verify previous drilling results and by 2014 started construction of the South Portal and associated access ramp. Underground mining, using underhand cut-and-fill method was conducted from November 2014 through September 2015. Juniper accomplished about 1,000 meters of underground development after investing approximately $7 to $9 million. Other work included 889 face chip samples, 729 round samples, and 734 jackleg probe hole cuttings samples. IDR processed the Golden Chest material at its New Jersey Mill during the Juniper Lease, earning cash from milling fees and its share of a 2% net smelter return (NSR) royalty on gold production. Juniper mined 40,840 dry metric tonnes of ore at an average grade of 6.70 gpt gold, resulting in production of approximately 8,000 oz of gold.
In September 2015, Juniper ceased operations and terminated their lease, forfeiting the remaining mineralized material and mine infrastructure returning the property to GCLLC.
5.8 Idaho Strategic Resources (2016-Present)
In August 2016, Idaho Strategic Resources (IDR), formerly known as New Jersey Mining Company, began to re-open the mine, starting with open pit mining on the Idaho Vein (Idaho Pit) and de-watering of the underground workings. Through March 2023, open pit mining was coincident with underground mining.
| 5-3 |
6.0 GEOLOGICAL SETTING, MINERALIZATION, AND DEPOSIT
6.1 Regional Geology
The Golden Chest Mine lies within the Northern Thrust Belt geologic province of Idaho (Figure 6-1). The Northern Thrust Belt is characterized by a set of north-west trending thrust faults which cut through the Mesoproterozoic metamorphic and sedimentary rocks of the Belt Supergroup.
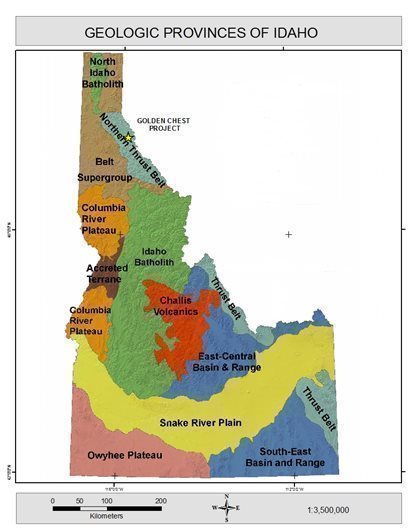
Figure 6‑1 Geologic Provinces of Idaho (Idaho State University 2017)
6.1.1 Belt Supergroup
The Belt Supergroup consists of a thick sequence of marine basin sediments that were deposited 1470-1400 million years ago (Ma). In the mine region, the Belt Supergroup is comprised of four major groups, from oldest to youngest:
1) The Lower Belt Group, which is composed of a single formation (Prichard) with eight members, and is composed of thin to thick bedded argillite, siltite, and quartzite.
2) The Ravalli Group, which is composed of three formations and is dominated by quartzite lithologies.
| 6-1 |
3) The Middle Belt Carbonate Group (in the mine area, consists of the Wallace Formation) which is dominated by limestone and dolomitic quartzites.
4) The Missoula Group which consisting of interbedded quartzite and argillite (Table 6-1).
Table 6‑1 Belt Supergroup Stratigraphy in the Mine Region (modified after Gott 1980)
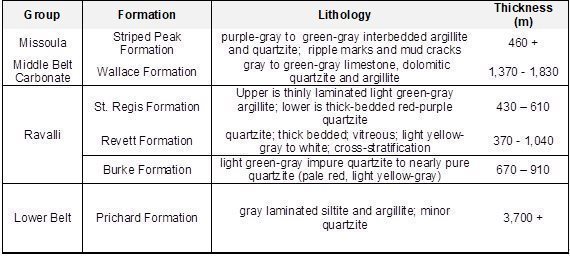
Most of historic production in the Coeur d’Alene Mining District has been from the Ravalli and Lower Belt Groups. The host rock lithology at the Golden Chest is the Prichard Formation of the Lower Belt Group.
6.2 Local Geology
6.2.1 Lithology
Prichard Formation
The area surrounding Murray, Idaho is dominated by the lithologies of the Prichard Formation (Figure 6-3) which comprises the Lower Belt Group of the Belt Supergroup. The Prichard Formation is made up of a series of weakly metamorphosed, marine basin sediments consisting of siltite, argillite and quartzite. The sediments were deposited by underwater landslides in an active shelf environment creating turbidite sequences. The turbidites are composed of graded couplets consisting of a dark argillite layer and a light siltite layer. The quartzite beds are often discontinuous lenses that suggest deposition in narrow sub-marine channels. In the Murray area, the total thickness of the Prichard Formation is greater than 2740 m (Hosterman 1956). The entire Prichard Formation has been weakly metamorphosed to lower greenschist facies, which is manifested by the presence of low temperature minerals such as chlorite and a weak schistose texture.
Gem Stocks
Locally, the largest group of named igneous intrusives is called the Gem Stocks (Figure 6-3). The Murray Stocks, discussed in Section 6.3, are a smaller associated subset of the Gem Stocks. The Gem Stocks are zoned, monzonitic to syenitic intrusions. Base and precious metals were mined from veins at stock margins in the late 1800’s to mid-1900. The intrusions are small in areal extent but are known from mining to become larger with depth. Age dates for the Gem Stocks vary, but most range in age between 94 to 118 Ma, with a suggested emplacement age of 100 Ma.
| 6-2 |
The Gem and Murray stocks precede the emplacement of the Idaho Batholith and represent numerous intrusive events along their northeast-southwest trend. This is evidenced by the most mafic portion of the stocks being at the southwestern end of the string of intrusions, while the most felsic portion is at the northeastern end near Murray. The Bitterroot lobe of the Idaho Batholith was intruded during regional compression in Cretaceous time; (95 to 70 Ma).
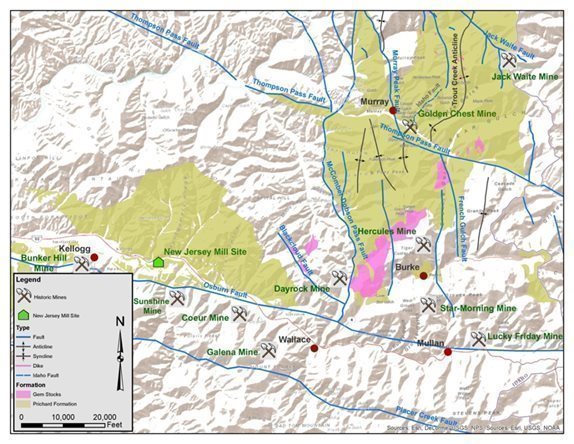
Figure 6‑2 Prichard Formation (Green), Gem Stocks (Pink), Major Fault Lineaments (Blue) and Trout Creek Anticline (Black).
6.2.2 Structure
Thompson Pass Fault
The Thompson Pass Fault is the largest geologic structure in the Murray area (Figure 6-3). This fault is considered the northern boundary that defines the Lewis and Clark Line in the region. The Lewis and Clark Line is a zone of nearly vertical normal, reverse and strike-slip faults that represents a fundamental break in the crust along which intermittent movement has occurred from Proterozoic time (2,500 Ma) to the present. The Lewis and Clark Line includes the Thompson Pass Fault as the north boundary, the Osburn Fault in the center, and the Placer Creek Fault as the south boundary. Near the mine, the Thompson Pass Fault strikes northwesterly, has a near vertical dip and strong right-lateral, strike-slip displacement.
| 6-3 |
Trout Creek Anticline
The Trout Creek Anticline is the next largest structural feature in the Murray area after the Thompson Pass Fault. The northerly-trending Trout Creek Anticline is truncated on its southern end by the Thompson Pass Fault. The Trout Creek Anticline is an asymmetric upright fold, with the eastern limb dipping more steeply than the western limb. The western limb dips west at about 45 degrees. The Golden Chest mine is located on the western limb of the Trout Creek Anticline (Figure 6.4). The Idaho Fault is the major fault in the mine workings and is conformable to the western limb and has the same dip.
Murray Peak Fault
Another major structural feature in the local area is the Murray Peak Fault (Figure 6.4). This fault is a northerly trending, high-angle reverse fault which primarily dips steeply to the west at 70° to 85°. Like the Trout Creek Anticline, the Murray Peak Fault is truncated at its southern end by the Thompson Pass Fault. The Murray Peak Fault is the dominant feature in the Alder Gulch area of The Project.
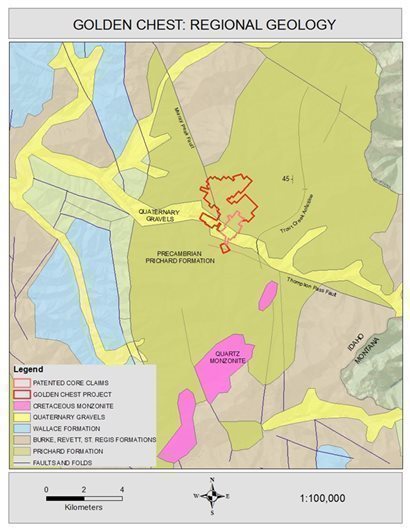
Figure 6‑3 Regional Geologic Map
| 6-4 |
6.3 Property Geology
6.3.1 Lithology
The Golden Chest mine has five fundamental rock types; three are sedimentary in origin and two are igneous. The sedimentary rocks are composed of siltite, argillite and quartzite; or any combination of these three rock types. The two types of igneous rocks are both intrusive; quartz monzonite and lamprophyre.
Siltite, Argillite and Quartzite
The mine host rocks are composed of siltite, argillite and quartzite, which belong to the Prichard Formation in the Lower Belt Group. The nomenclature for the Prichard Formation as used by IDR has been adapted from Cressman (1989). This adaptation of the Prichard describes and divides the rock units into informal members of the formation starting from older to younger, and these members are identified with nomenclatures of A through H (eight members in total). At the mine, the two youngest members of the Prichard are represented, Members G and H (Figure 6-5).
Member G is characterized by lenses of quartzite interbedded with siltite and argillite. This rock unit forms the footwall of the Idaho Fault. The thickness of Member G can range in thickness from 10 to more than 1000 m.
Member H, which lies stratigraphically above Member G, is dominated by dark gray argillites and light gray siltites with minor quartzites. This rock unit forms the hanging wall of the Idaho Fault. Bedding is dominantly planar. The thickness of Member H is from 600 to 750 m.
Quartz Monzonite
The intrusive rocks at the mine are dominantly quartz monzonite, which are related to the Murray Stocks. The Murray Stocks are a subset to the Gem Stocks and share the same Cretaceous age. Surface exposures of quartz monzonite are limited to the southern end of the mine, and in one prospect on the west side of Buckskin Gulch, immediately northwest of Murray. The quartz monzonite is more often seen in drill core as either a sill occupying the Idaho Fault or as a dike in its hanging wall.
The quartz monzonite is composed of approximately 40% quartz, 40% potassium feldspar and 20% plagioclase. It is mostly observed as grey-colored and equigranular, although porphyritic phases are also found in drill core at the southern end of the mine. When porphyritic, the quartz monzonite contains abundant, light pink potassium feldspar phenocrysts. Minor purple fluorite in thin quartz veinlets has been observed in some drill core. Some occurrences of the monzonite contain xenolithic clasts of granitic-looking rock, altered sediments, or fragments of vein quartz.
Lamprophyres
There are several generations of lamprophyre dikes and sills. The lamprophyre dikes or sills are usually narrow with widths less than 1 m and are composed of a fine-grained groundmass with visible phenocrysts of black hornblende, biotite, or pyroxene. The lamprophyres commonly occur both above and below the Idaho Fault and may cut across the Idaho Vein, particularly in the Skookum ore shoot.
| 6-5 |
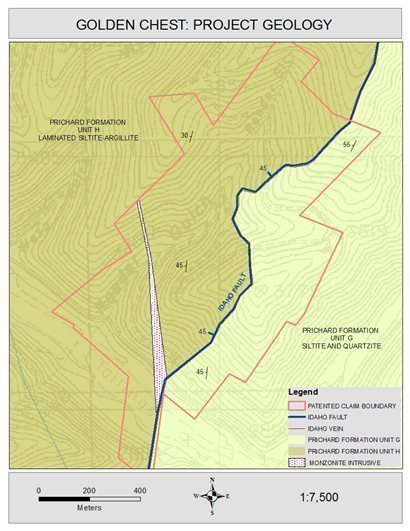
Figure 6‑4 Mine Geologic Map
Lamprophyre dikes can contain xenoliths of gold-bearing quartz vein material, indicating that at least some of these dikes and sills postdate mineralization. Marvin et al (1984) indicate ages of 68.8 ± 2.0 Ma to 58.8 ± 1.5 Ma for lamprophyre dikes in the area.
6.3.2 Structure
The mine lies at or near the intersection of several structural features including the Thompson Pass Fault, Trout Creek Anticline, Murray Peak Fault and the Idaho Fault. This complexity forms a structural knot that has prepared the ground by providing channels for the hydrothermal fluids required to form the quartz-gold veins.
Idaho Fault
The primary structure at the Golden Chest Mine is the Idaho Fault. The Idaho Fault is interpreted as a moderate-angle, reverse fault that has exploited a lithologic boundary in the Prichard Formation.
| 6-6 |
The Idaho Fault occurs in the west limb of the Trout Creek Anticline, on a smaller scale secondary (parasitic) fold that plunges to the north-northwest. The strike of the Idaho Fault and the fold axis of the Trout Creek Anticline are sub-parallel (Figure 6-3). Bedding above and below the Idaho Fault may be parallel to it or intersecting at angles, dependent on location along the secondary fold.
Locally the Idaho Fault displays both cataclastic and mylonitic textures, indicating the fault has been active more than once. Multiple parallel gouge zones may occur across a relatively narrow cross-section. Fault slickensides can show dip-slip, strike-slip and oblique-slip movement.
Timber King Fault
A fault of secondary importance (compared to the Idaho Fault), the Timber King Fault appears in the hangingwall of the Idaho Fault, with a north-south strike and moderate to steep westerly dip. Bedding above the fault is typically a quartzite member of the Unit H Prichard Formation, with near vertical dips to the west. The footwall of the Timber King Fault is typically occupied by Unit H Prichard argillites and siltites, with dips sub-parallel to the fault plane. The Timber King Fault typical appearance is a thin 1-2 cm thick gray gouge seam, with fault slickensides indicating that at least some movement along the fault has been dip slip. The fault seems to have exploited the lithologic boundary between the quartzites and argillite/siltites of the Prichard Formation.
Murray Peak Fault
In the west-central part of the project, the Murray Peak Fault is the primary structure cutting across the geology. This Fault has been described as a north-northwest striking, steeply west-dipping, reverse fault. Relative offset appears to increase to the north of Murray. A persistent, weakly mineralized structure of unknown origin appears to parallel the Murray Peak Fault a short distance to the west.
Northwest Striking Minor Faults
Since IDR re-started the mine in 2016, a series of northwest striking, steeply south dipping faults have been identified in both the hanging and footwalls of the Idaho Fault. Relative movement along these faults has been difficult to determine as there are no readily identifiable marker units in the Prichard Formation. These faults have been noted to offset or terminate veins.
East-West Striking Minor Faults
In the west-central part of the project, East-West striking faults have been noted in old prospect adits and trenches. These faults are near vertical in dip and can have numerous gouge seams within a broader zone of parallel structures. Relative movement along these faults has been difficult to determine as there are no readily identifiable marker units in the Prichard Formation.
6.4 Mineralization and Alteration
The primary geological control to mineralization at the Golden Chest is the Idaho Fault. The Idaho Fault separates the hanging wall (Prichard Formation-Member H) from its footwall (Prichard Formation-Member G). Another geologic control is the Timber King Fault, which in many respects, is similar to the Idaho Fault in how it influenced mineralization.
| 6-7 |
The Idaho Fault acted as the conduit for the mineralizing fluids that produced most of the veins at the Golden Chest Mine. The veins are generally stratiform and conformable to the Idaho Fault and are centered along the Idaho Fault to form a sub-parallel, stacked vein set. The H-Vein is conformable with the Timber King Fault, occurring on both sides of the fault plane. The alteration is generally weak and mostly occurs immediately adjacent to the veins. Silica, chlorite, pyrite, carbonates, and minor sericite are the primary alteration components seen. The Northwest Striking Minor Faults have been seen to influence grade and tonnage in individual veins as they have been mined. The exact mechanism of control has yet to be determined. The East-West Striking Minor Faults seem to be associated with numerous small quartz veins and igneous sills and dikes.
6.4.1 Vein Types
There are three main types of quartz-gold veins found at the mine; banded, brecciated and massive. Most of the gold production and best grades come from the banded quartz veins. The banded veins consist of thin, sub-parallel shear surfaces that result from compression. The bands are composed of quartz, fine sulfides and phyllosilicate septa (derived from wall rock). A banded vein example is shown in Figure 6-6 with visible gold grains circled in red.

Figure 6‑5 Banded Vein Example
Many of the veins at the mine are brecciated. Both the breccia clasts and matrix can be mineralized in this vein type. Brecciation events have modified or destroyed the textures of both the banded and massive vein types. A brecciated vein example is shown in Figure 6-7.
| 6-8 |
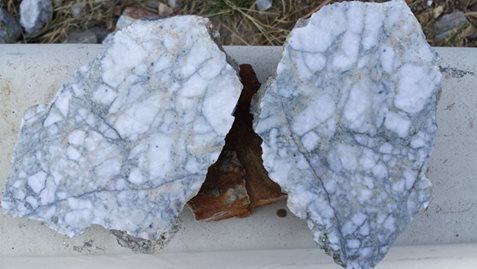
Figure 6‑6 Brecciated Vein Example
Massive quartz veins are characterized by a lack of banding or brecciation. They are also distinguished by a general lack of sulfides. The massive veins can have good gold values, but usually not as rich as the banded or brecciated veins. A massive vein example is shown in Figure 6-8.
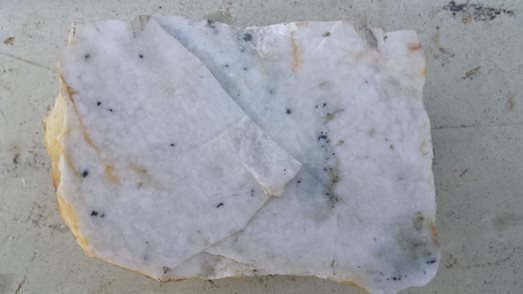
Figure 6‑7 Massive Vein Example
6.4.2 Vein Names and Locations
Most of the veins recognized at the mine are along or near the Idaho Fault. Both the veins and fault dip moderately to the west at approximately 45 degrees, except for the H-Vein, which typically dips 65-75 degrees west. An example vertical cross-section is shown in Figure 6-9 below.
Veins are found in both the hanging wall and the footwall of the Idaho Fault, and they are concentrated within 100 meters of the fault. Vein density increases with proximity to the Idaho Fault with the most abundant veining occurring within 50 meters of the fault. The historical workings at the mine appear to target veins that are generally within 25 meters of the Idaho Fault.
| 6-9 |
The “Idaho Vein” is the name given to the quartz vein found in the immediate footwall of the Idaho Fault. The “H-Vein” is the name given to the quartz vein found immediately next to the Timber King Fault.
There have been discrepancies in identifying the different veins throughout the years, because the veins pinch, swell, and split along strike. Because of this, the correlating of veins between mining levels or even along strike is difficult.
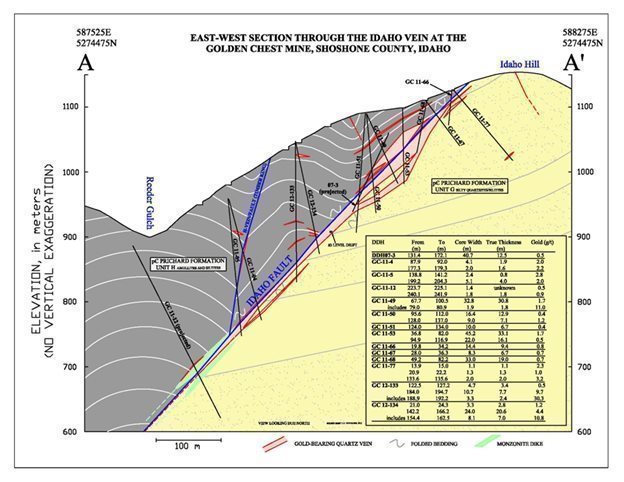
Figure 6‑8 Vertical Cross-Section of Vein Location
6.4.3 Lithologic Control of Veins
The two main lithological controls for veining at the Golden Chest are:
| · | Rheological: brittle-ductile contrast |
|
|
|
| · | Permeability and porosity |
| 6-10 |
Most of the veins at the mine are preferentially found in areas of rheological contrast. Vein development is at its strongest when brittle units, like quartzite and blocky siltite, are in contact with the more ductile laminated siltite-argillite beds.
The permeability and porosity of the lithologic units at the Golden Chest is largely related to grain size. The fine-grained units act as aquitards to hydrothermal fluids while the coarse, more permeable units accommodate and hold the hydrothermal fluids. The quartzite units of the Prichard Formation are more permeable and porous than the surrounding siltite-argillites and are more susceptible to hosting widespread silica-flooding and silicification.
At the mine, the hanging wall to the Idaho Fault is mainly composed of thinly laminated siltite-argillite, with almost no quartzite beds, and these rocks are not as susceptible to silicification. However, the footwall lithologies of the Idaho Fault are primarily light grey, fine-grained quartzites and blocky siltites and these units are very susceptible to pervasive silicification.
6.4.4 Vein Mineralization
Gold mineralization at the Golden Chest is mostly associated with the sulfide minerals pyrite, galena, sphalerite, and chalcopyrite. Less commonly, gold can be found adjacent to arsenopyrite or scheelite. Both the mineralogy of ore and gangue are shown below.
| · | Ore mineralogy: pyrite, galena, chalcopyrite, sphalerite, arsenopyrite, gold, scheelite, minor covellite, tetrahedrite |
|
|
|
| · | Gangue mineralogy: quartz, chlorite, carbonates, sericite, muscovite, minor feldspar |
Commonly, native gold is seen as intergrowths associated with pyrite, galena, sphalerite, and chalcopyrite. Gold mineralization occurs along the grain boundaries or inside clusters of these sulfides (Figure 6-10).
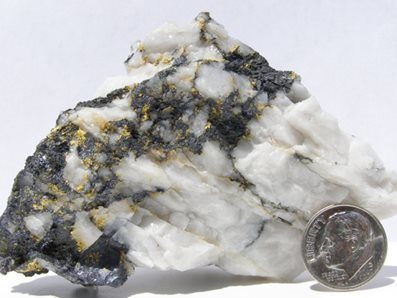
Figure 6‑9 Gold-Sphalerite-Galena-Pyrite-Quartz Vein from the 941 Level
| 6-11 |
Five petrographic studies have been conducted on vein samples from the Golden Chest Mine. The vein samples in each study were from different locations and do not show the same features. Hausen (1987) was contracted by Newmont to examine some samples of banded quartz vein material. He concluded the sulfides and quartz were epigenetic, or the mineralization is of a later age than the enclosing rocks.
Twenty-two years later, Gammons (2009) concluded the gold mineralization was late and associated with galena and chalcopyrite, but not sphalerite. Gammons determined the ore minerals as pyrite, galena, sphalerite (with chalcopyrite rims), chalcopyrite, and gold, in order of decreasing abundance. Additionally, he noted that most of the gold grains are in the 50-micron size range, and should be easy to mill or leach since they mostly occur on cracks in pyrite.
A petrographic analysis done by Ross (2010) determined the vein material at the Golden Chest is well-banded due to a combination of multi-phase mineralogical and tectonic layering. She described the banded vein quartz mineralogy as consisting of white to pale grey semi-translucent quartz, with dark septa of altered wall rock and thin sulfide-rich bands. The tectonic layering was described as hairline slip surfaces and stylolitic bands of pyrite and phyllosilicates.
Juniper Mining Company also conducted a mineralogical investigation as part of their metallurgical testing. The study showed the gold to be mostly found in association with pyrite and galena and the majority of gold grain sizes are in the 2-to-10-micron range.
Brown (2019) noted that the gold grains vary in size (< 1 to 100 µm), but typically were easy to identify in polished sections (Brown, 2019). He also saw gold having a strong correlation with galena, with the galena and gold often found along fractures and cracks cutting pyrite and milky quartz. Brown also noted gold occurring in grains by itself or with chalcopyrite.
Scheelite
Scheelite is found in many areas of the mine and the Golden Chest was a producer of tungsten during World War I. Frequently scheelite can be found with gold as a common subordinate mineral in orogenic gold systems. At the Golden Chest, scheelite is typically found in relatively pure masses within quartz veins.
6.4.5 Wall Rock Alteration
The wall rocks at the Golden Chest display weak alteration, which is usually confined to the area proximal to the gold-quartz veins. The alteration is in part dictated by the permeability/porosity of the lithologies. Adjacent to the gold-bearing quartz veins, chlorite/biotite, ankerite, sericite, potassium feldspar and silicic hydrothermal alteration minerals were the alteration minerals noted by Brown (2019). Barren pyrite also occurs in this alteration package. Earthy hematite has also been observed.
Generally, the hanging wall rocks of the Idaho Fault display a lack of widespread alteration, due to the tight impermeable mineralogy of the siltite-argillite units. In most cases, hanging wall alteration is chloritic and is localized within 10 meters (33 feet) of Idaho Fault or the veins. Near the Timber King Fault, silicification has been noted.
Footwall rocks, on the other hand, can display three types of alteration: sericitic, chloritic and silicification. Alteration within the footwall can be widespread and is related to rock permeability and porosity. Areas containing quartzite lithologies are particularly susceptible, and are often subject to pervasive, passive silica flooding.
The intrusive rocks may show substantial argillic and sericite alteration, especially near faults. Some propylitic alteration has been noted, characterized by veinlets of epidote in the monzonite.
| 6-12 |
6.5 Deposit Type
The Golden Chest deposit is recognized as an “intrusive related” orogenic gold-quartz vein system by IDR geologists. However, recently there has been the suggestion that the Golden Chest deposit type could be a Reduced Intrusion-Related Gold System (RIRGS). The RIRGS deposit classification is already mired in confusion over nomenclature. It should be remembered that each ore deposit has its own specific and unique characteristics and not all deposits exhibit all characteristics of any particular classification. Deposit models are sets of guidelines, not absolute parameters. No one model will describe multiple deposits, one model describes one deposit. That being said, there is considerable overlap between the two deposit model types and the Golden Chest deposit has characteristics of both orogenic and RIRGS model types. This report will continue to use the orogenic deposit classification for the Golden Chest.
6.5.1 Orogenic
Before 1998, the term mesothermal was used for orogenic gold-quartz vein systems. Other synonyms for this type of vein are shear-hosted lode gold, low-sulfide gold-quartz veins and California Mother Lode veins. These “mesothermal” or orogenic deposits are associated with regionally metamorphosed terranes of all ages. Some of the largest gold deposits in the world are associated with orogenic vein systems. World class orebodies are generally 2 to 10 kilometers (km) long, 1 km wide, and are mined down-dip to depths of 2 to 3 km. This deposit type is responsible for a significant portion of the world’s gold production.
Orogenic vein deposits usually form within fault systems produced by regional compression or transpression (strike-slip movement). These compressional events are often associated with the collision, docking and subduction of exotic terranes. The majority of orogenic gold deposits are located within second- and third-order structures near first-order, deep-crustal fault zones. Ore forms as vein fill along second- and third-order shears and fault structures. Fluid migration along these fault structures is driven by episodes of major pressure fluctuations during seismic events. Gold is usually deposited at crustal levels within and near the brittle-ductile transition zone at depths of 6-12 kilometers, pressures between 1 to 3 kilobars and temperatures from 200° to 400° Celsius.
6.5.2 Age and Genesis
The genesis of the gold mineralization at the Golden Chest is interpreted to be related to the movement of mineralizing fluids, derived from cooling plutons, up shear zones. Hershey (1916) also believed that gold mineralization was related to the intrusive events, while the Ag-Pb-Zn mineralization was remobilized and leached from the Prichard Formation.
The North America Cordillera gold veins are often post-Middle Jurassic and appear to form immediately after accretion of oceanic terranes to the continental margin. The Golden Chest may be related to similar gold vein systems in British Columbia where deposits are mainly Middle Jurassic, ~ 165-170 Ma and Late Cretaceous ~ 95 Ma.
| 6-13 |
Mineralization age estimates are debatable, but it is possible that there was more than one gold mineralizing event. This Report suggests an age of 94 Ma for the gold mineralizing event at the Golden Chest. This age estimate is based on cross-cutting relationships with the quartz monzonite intrusive and coincides with the end of the Murray Stock emplacement and predates the Idaho Batholith activity.
Intrusive-related orogenic systems are characterized by intrusive rocks emplaced along a fault structure. Figure 6-11 below, displays the position of the Golden Chest Mine in relation to the intrusive and the Idaho Fault. In the case of the Golden Chest, the gold mineralization is interpreted to be primary mineralization resulting from the felsic igneous intrusive. The Thompson Pass Fault is considered to represent the first-order deep crustal fault with the Idaho Fault being a second-order fault. This association is indicative of intrusive related orogenic systems because the first-order fault provides the deep plumbing, and the second-order faults provide the extensional setting.
Other similarities between intrusive related orogenic deposits and the Golden Chest Mine:
| 1) | Precambrian turbidite host rocks |
|
|
|
| 2) | compressional geologic environments with reverse fault movement; |
|
|
|
| 3) | strong structural control |
|
|
|
| 4) | epigenetic banded veins |
|
|
|
| 5) | quartz-dominant vein system with ≤ 3-5% sulfide minerals |
|
|
|
| 6) | a general lack of widespread alteration |
|
|
|
| 7) | continuity at depth |
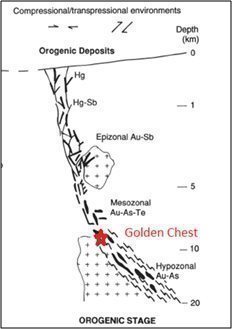
Figure 6‑10 Intrusive Related Orogenic Model (modified after Groves et al. 1998)
| 6-14 |
7.0 EXPLORATION
For the year 2023, the primary form of exploration work completed on the property was diamond core drilling.
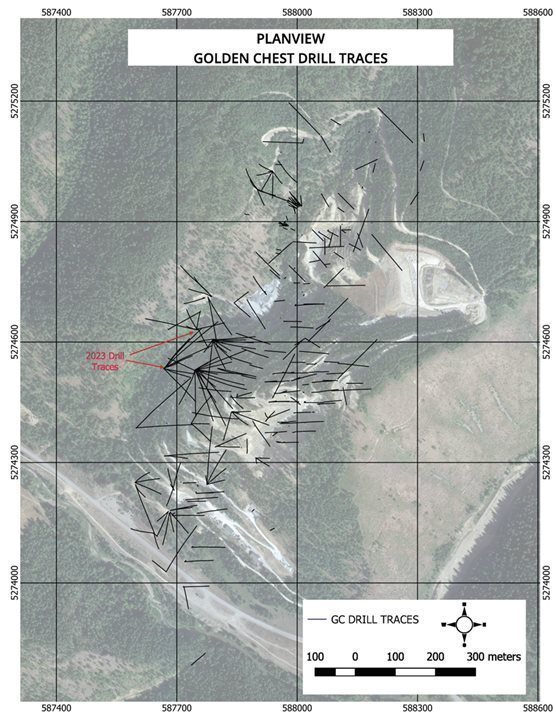
Figure 7‑1 Planview of Golden Chest Drill Traces
| 7-1 |
7.1 Drilling
7.1.1 Vertical Continuity
In 2023, 16 core holes, totaling 3,739 m, were drilled from the surface. The geologic target for the drilling was the H-Vein portion of the Skookum Shoot at the Golden Chest Mine. Mineral Resources have been updated for the H-Vein and Idaho Vein portions of the Skookum Shoot. Mineral Reserves have been updated for the H-Vein and Idaho Vein portions of the Skookum Shoot as well. More information on Resources and Reserves can be found in sections 11 and 12.
The drilling was carried out by a contractor, Ruen Drilling, of Clark Fork, Idaho, using a Christensen CS1000 drill. The core size drilled was NQ2 (5.08 cm). Drilling was fanned from prepared drill pads.
All holes are cemented from the bottom of the hole to 30 m above any important mineralized zones. Above the cement, the holes are grouted.
The drillers place the core in waxed cardboard boxes which are then stacked on pallets and strapped down prior to transport, then taken by either drillers or geologic staff, to the logging facility, which is located near the mine offices.
Upon receipt of the core at the logging facility, the boxes are laid out in order on the benches. They are then examined to ensure correct block meterages and core orientation. Zones of core loss are noted, and geotechnical logging is conducted. This includes measurement of recovery and rock quality designation (RQD).
Logging is conducted by IDR geologists. Data is digitally captured on notebook computers using Microsoft Excel.
The core is then logged for lithology and mineralogy, as well as sedimentary structures, veins, faults, and other structural features. Following this, a third logging pass is made noting type, style, and intensity of alteration. During the logging process, features of note are marked with colored pencil so as to be visible in the core photos.
The core is then wetted and photographed using a camera and lighting which provides uniform digital images. In addition to the notations on the core for geological information, the sample boundaries and numbers are also marked to allow for easier validation of the assay results using the core photos.
7.1.2 Drill Hole Surveys
Hole locations and orientations are marked for the drillers by the supervising geologist. Once the drill is on site and ready to begin drilling, a double check of the rig orientation is made by the supervising geologist. The hole is surveyed using a Flexit Single-Shot downhole survey tool. The first measurement is made at 30 m depth and every 30 m increment in depth as the hole is drilled.
The Flexit Single-shot azimuth measurements are based on magnetics, and susceptible to interference from steel objects. Taking a reading 30 m down the hole reduces the chance that the instrument will be influenced by any iron objects on or near surface at the drill site. The Single-shot instrument also records the magnetic field strength which is used to derive average field strength for help in assessing individual orientation readings. If an obviously spurious measurement is recorded, it is discarded and replaced with a second instrument survey reading collected at the same depth.
| 7-2 |
The survey data is recorded on paper and forwarded to the supervising geologist for entry into Microsoft Excel software. The azimuth readings are adjusted to true degrees by using the calculated Magnetic Declination at the Golden Chest Mine. The surveyed holes are checked on screen using Seequent Leapfrog or Maptek Vulcan software to confirm that they were oriented as planned and in the correct location.
The hole collar locations are picked up by the mine surveyors using a RTK iGAGE-8 base and rover GPS. This is to provide a means for gauging the accuracy of the downhole surveys, and to note any general trends in hole deviation.
7.1.3 Drill Hole Sampling
On completion of the logging, the core is marked for sampling. Samples range in length from a minimum of 0.1 m to a maximum of 1.6 m with breaks made based on changes in estimated grade or mineralization style or lithological changes. Tags are placed in the boxes for each sample.
The core marked for sampling is cut in half longitudinally with a standard wet tile saw. The cut pieces are placed back in the core box in their original location and orientation.
Sample tag books are filled out with hole ID, location, from and to information, and a tag is placed in the sample bag. The sampled intervals are recorded in the Microsoft Excel core log and then checked using a validation routine in Seequent Leapfrog or Maptek Vulcan software to confirm that there are no overlaps or accidental gaps. Approximately 540 drill core samples were collected.
Assay Quality Assurance/Quality Control (QA/QC) samples consisting of either a blank or standard inserted into the sample sequence every 10 samples. These are also recorded in the database. The lab, American Analytical Services, Inc., Osburn, Idaho, also conducts internal QA/QC involving duplicate pulps and rejects.
Samples are collected by taking one half of the cut core and placing it into polyester bags which are then put into a vehicle and driven by an IDR employee to American Analytical Services, Inc., Osburn, Idaho. The shipping list is generated in Microsoft Excel and placed with the shipment along with a lab-required Chain of Custody form.
In the QP’s opinion, the drilling, core handling, logging, and sampling at Golden Chest is being conducted according to common industry practice, in a manner appropriate for the deposit type and mineralization style.
7.3 Hydrogeology Data
Hydrogeology data is not currently collected from the Golden Chest drill holes.
| 7-3 |
8.0 SAMPLE PREPARATION, ANALYSES, AND SECURITY
8.1 Laboratory Accreditation and Certification
The laboratory used by IDR for sample preparation and analyses is:
American Analytical Services, Inc.,
59148 Silver Valley Rd,
Osburn, ID 83849
+1 (208) 752-1034
American Analytical is ISO 17025 Certified for Mineral and Ore Chemical Testing. Fire assaying is the only method used to quantify gold in core samples and round samples. Occasionally, Inductively Coupled Plasma (ICP) is used for multi-element analysis.
American Analytical (AAS) is independent of the parties involved in the Golden Chest Mine.
8.2 Sample Quality Assurance and Quality Control (QA/QC)
IDR’s QA/QC program has been in place since the GCLCC joint venture in 2011. The QA/QC program consists of inserting blanks and commercially certified standards into the sample stream. A blank or a standard is inserted into the sample sequence at least every 10 samples. All standards are commercially certified and have been prepared in advance by accredited labs.
8.2.1 Blanks
The QP’s reviewed the results of blank assay and only 2 of 327 samples returned an assay greater than the detection limit for fire assay, < 0.060 gpt gold. These are acceptable results.
8.2.2 Standard – 3 gpt
A review of the assay results from the 3 gpt gold standard was conducted by the QP’s. The results are presented below in Figure 8-1.
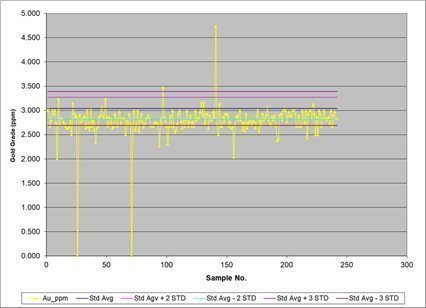
Figure 8‑1 Drill Sampling 3 gpt Standard QA/QC Tracking
| 8-1 |
A review of the 3 gpt standard assay results show an assay bias to the low side as 27.5% of the assays are below three standard deviations (2.69 gpt) and only 0.92% of the assays exceed three standard deviations (3.39 gpt). The average assay for the 3 gpt standard is 2.81 gpt. This shows a bias to underestimate grade as the distribution is shifted downward.
8.2.3 Standard – 4 gpt
A 4 gpt standard was purchased to replace the 3 gpt standard material as the 3 gpt sample material was no longer available. A total of thirty, 4 gpt standard, samples were assayed in 2022 and 2023, and the results are displayed below in the accompanying figure.
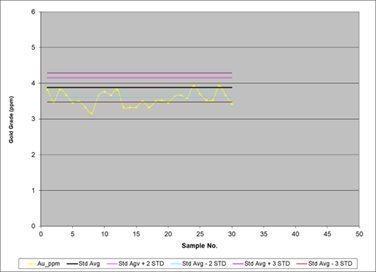
Figure 8‑2 Drill Sampling 4 gpt Standards QA/QC Tracking
As shown in the figure above, the assay results rarely exceed the average and 23% of the standard samples are three deviations less than the average revealing a low bias similar to the 3 gpt standard dataset. The data for the 4 gpt standard is limited to only 30 assays, but the data should be monitored to see if the low bias persists.
8.2.4 Standard – 8 gpt
A review of the assay results from the 8 gpt gold standard was conducted by the QP’s. The results are presented below.
| 8-2 |
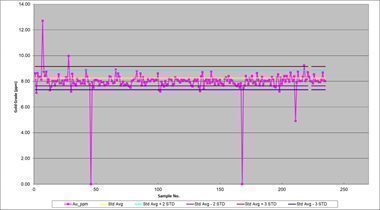
Figure 8‑3 Drill Sampling 8 gpt Standards QA/QC Tracking
The assay results for the 8 gpt standard show good dispersion around the mean with only 13 of 236 results (4.72%) outside of three standard deviations. These are acceptable results.
8.2.5 Standard—7 gpt
The QP’s reviewed the data for the new 7 gpt standard which replaced the 8 gpt standard in 2022 because the 8 gpt standards were consumed and unavailable. Figure 8-4 displays the assay results of the 7 gpt standard.
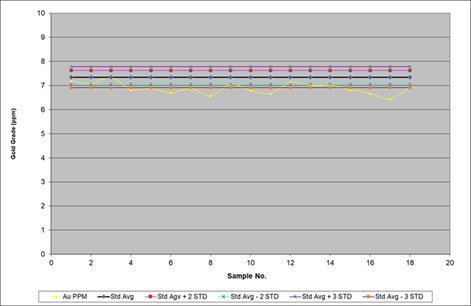
Figure 8‑4 Drill Sampling 7 gpt Standard QA/QC Tracking
As figure 8-4 illustrates, the assay results trend below the standard average and only reach the average once. Again, it appears there is a low bias in the 7 gpt standard. The number of samples is rather limited at 18. This is another trend that should be monitored as the number of samples increases.
| 8-3 |
8.3 Sample Preparation
Once the geologist has completed their detailed logging they delineate sample intervals, and the core technicians saw the core longitudinally in half with a diamond blade saw, cleaning the blade between sample intervals. The right half of the core is placed in a sample bag. A tag with a unique sample identification (ID) number is placed inside each sample bag before it is sealed. This sample ID number is also written on the outside of the sample bag. This same sample ID is tagged into the core box at the respective interval and the remaining core half is reserved in the core box for future reference. Generally, samples of 1 m in length are taken; however, in areas of particular interest, sample size can be reduced as low as 0.1 m. In zones with anticipated weak mineralization the sample interval can be extended to the maximum distance between run blocks (1.6m). In some cases of poor core recovery, the distance between run blocks can be greater than 1.6 meters. This is a special case and evaluated in areas of known poor recovery on a case-by-case basis, whether or not to sample the material recovered.
8.4 Sample Analysis
For all the samples processed by AAS on behalf of GCLLC/IDR, the following methods were used to obtain a fire assay for gold. Samples received at the American Analytical are sorted and coded. They are then placed in the sample drying room and dried at 60°C. After drying, samples are crushed and split in the sample preparation room. After splitting, samples (30 grams each) are sent to the fire assay area and numbered in order. The sample is carefully mixed with the necessary reagents, dominantly litharge, in a fire clay crucible. The mixture is then heated to 760°C for 20 minutes, and finished at temperature 1,038°C, with the entire fusion process lasting sixty minutes. The crucibles are then removed from the assay furnace and the molten slag (lighter material) is carefully poured from the crucible into a mold, leaving a lead button at the base of the mold. The lead button is then placed in a preheated cupel which absorbs the lead when cupelled at 950°C to recover the doré bead containing both gold and silver. The entire doré bead is placed in nitric acid where the silver goes into solution and the gold remains in the bottom of the cup. The gold bead is then weighed to the thousandth of milligram accuracy on a micro-balance.
8.5 Security
All drill samples are collected from the rig daily by Mine staff and transported to the locked and secure Mine Office/Core Shed building. Sample security has relied upon the fact that the samples were always attended or locked in appropriate sample storage areas. Samples remain within the custody of staff up to the moment the samples are delivered to the laboratory at which time AAS assumes custody. Chain of custody procedures include filling out sample submittal forms that are sent to the laboratory with sample shipments to make certain that all samples are received by the laboratory.
All drill core is stored in locked and secure facilities, either the Mine Office/Core Shed building (Figure 8-3) or in locked Connex containers.
| 8-4 |
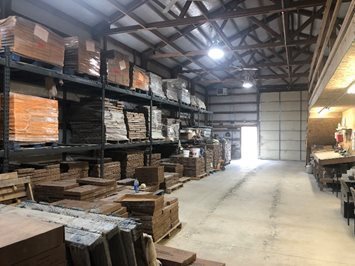
Figure 8‑5 Mine Office/Core Shed Building
8.6 QP Comments on Sample Collection, Preparation, QA/QC, Analysis and Security
The sampling methods are acceptable, meet industry standard practices, and are adequate for mineral resource and mineral reserve estimation and mine planning purposes, based on the following:
|
| · | Sampling was conducted by appropriately qualified personnel under direct supervision of appropriately qualified geologists. |
|
| · | Sample collection procedures used meet industry best practices. |
|
| · | Sample preparation procedures meet industry best practices. |
|
| · | QA/QC results produce acceptable results. However, the low bias in the 3 gpt standard would tend to underestimate gold content. The 3 gpt data was re-evaluated and a 4 gpt standard was added as a check. The 4 gpt standard showed the same general trend of a bias toward the bottom of the range. The 4 gpt standard analysis will be continued through 2024. |
|
| · | There appears to be a low bias in the new 7 gpt standard, however, the number of assay results for this standard is low. The trends for the assays of all the standards should continue to be monitored closely. |
|
| · | Security procedures are consistent with industry standards. |
| 8-5 |
9.0 DATA VERIFICATION
9.1 Database Procedures
Drilling, chip sampling, and round sampling data are captured and stored using Maptek’s Vulcan software. Photographic information is stored in drillhole specific folders on the IDR’s mine server which is backed up with a physical copy and stored at a secure location periodically. Drillhole logs are completed using Microsoft Excel and are only accessible by mine technical staff and timestamped at the last time of change. Geologic interpretation and solid modeling are accomplished using Leapfrog or Vulcan’s Geology Core application. Survey volumes, block modeling, and estimation of Mineral Reserves is accomplished using Maptek’s Vulcan.
On completion of a downhole survey, the data is input into Maptek’s Vulcan and reviewed in 3D on screen to check for major inconsistencies. On the fly dip and azimuth information is available to the exploration geologists at the drill rig to compare to previous surveys. If a dip and azimuth measurement is in question the survey at the prescribed hole depth will be taken again.
Core assay results are sent from the lab as PDF and comma-delimited (CSV) files. These values are input into the master drill log completed by each core logging geologist and checked by engineering staff before input into the drill hole database.
As the Golden Chest is an orogenic gold system there is a visual difference between the mineralized quartz and wall rock. The core photos are checked against assays that are suspect to verify mineralized zones. The Idaho and H-Vein intercepts can usually be planned to within one to two meters using three-dimensional vein solids.
Once data are checked against core photos and input into Vulcan’s Maptek, a readout of missing and overlapping intervals can be checked for inconsistencies in the drill hole data input by core logging geologists.
Data is stored at the mine site and backed up to a separate server stored at the corporate office quarterly.
9.2 Validation Procedures
For the preparation of this report 20% of the drill hole logs completed in 2021 were checked for inaccuracies. Assay values in the Vulcan database were checked against the geologist’s core logs and then again against the assay sheets from the lab. No issues were found comparing the Vulcan database to geologist’s logs, and then again to laboratory forms. Of the 6 holes (21-183,185,193,197,202, and 205) totaling 302 assays 13 non-detect close out samples were found to be unentered into the Vulcan database. These samples verify that the sampled interval is “closed out” by an assayed non-detect gold value, but do not influence composite evaluation, as a missing or unsampled length is characterized as zero grade when compositing. These were corrected prior to the writing of this report. No issues with assay entry were found in 2023 holes.
| 9-1 |
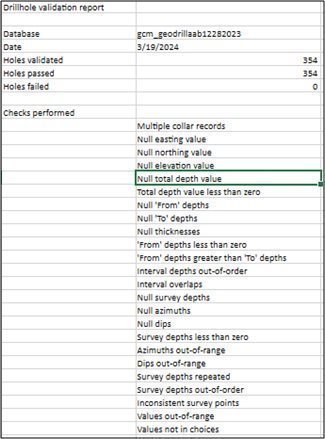
Figure 9‑1 Printout of Vulcan Geology Core Validation Checks Performed on the 2023 Drillhole Database
Checking Vulcan for overlapping sample intervals yielded no overlapping portions of the drill hole database along with the other tests performed shown in the figure above.
The visual inspection of vein wireframes and drill hole in three-dimensions yielded similar results. Surveyed mining voids were captured by drill hole traces. Some drill holes have been surveyed by the underground surveying crew in the stopes. The drill hole trace and underground survey points usually align within one to two meters. One note is that data taken by Juniper Mining Company (JMC) in the form of round samples had to be corrected for an inappropriate coordinate system. JMC created a local mine grid inadvertently by truncating Northings and Eastings to exclude the ten-thousands place. This created a mine grid not comparable to the UTM coordinates used by IDR and caused a twisting effect around the arbitrary origin. A correction was applied to JMC data to account for the inappropriate flattening of a UTM zone by truncation.
After evaluating the sampling database for length distributions a few outliers were evaluated for further investigation. A 10 m sample interval was found in a 2011 hole. This was evaluated and found that it was a mis-typed number. The interval was in a long section of continuous sampling and was outside the vein solids and had no impact on resource or reserve grade. The next 4 largest sample intervals were evaluated for validity and it was found that they were in regions with poor recovery and the only option the geology team had was to sample between run blocks. These were relatively short sections of approximately 4 meters. They were areas outside of the vein shapes and did not impact the estimation. Small sampling lengths were evaluated for validity as well. The current standard at IDR is to sample no less than 0.1 m. The majority of the samples that were less than 0.1 m were taken prior to this standard. One sample from the 2023 database was smaller than the 0.1 m standard, but was a distinct bed of interest and was sampled as such.
| 9-2 |
9.2.1 Micon Historic Database Validation
Micon carried out data verification as a part of its 2012 NI 43-101 resource estimation at the Golden Chest. Micon re-analyzed sample pulps from 6 historical holes. New assays showed 99% correlation with previous assays. Micon’s database validation consisted of the following steps:
|
| · | Checking for any non-conforming assay information such as duplicate samples and missing sample numbers. |
|
| · | Verifying collar elevations against survey information for each drill hole. |
|
| · | Verifying collar coordinates against survey information for each drill hole. |
|
| · | Verifying the dip and azimuth against survey information for each drill hole. |
|
| · | Comparing the database assays and intervals against the original assay certificates and drill logs. |
Micon’s comments were, “On the whole the database was found to be in good shape. A few minor adjustments to drill hole collar elevations were made where road cuttings had reduced the elevations by about 2 to 3 m.” Micon’s drillhole database validation exercise covered holes drilled from 2004 through 2012. These holes are a part of the current reserve. Micon’s validation is taken as another indicator that the drill hole database is well managed and validated acceptably.”
9.3 Validation Limitations and QP Comments
In the opinion of the QP’s, the validation exercises undertaken are sufficient to justify the current Resources and Reserves at the Golden Chest by IDR. There is no evidence to date that suggests an issue with the practices in database management at the Golden Chest. The databases are managed in a secure area using modern, commonly used software by trained staff. The staff are experienced in the nuances of narrow vein mining and treat the model with their experience in mind. In the opinion of the QP’s the database is properly maintained and appropriate for use in the estimation of Resources and Reserves.
| 9-3 |
10.0 MINERAL PROCESSING AND METALLURGICAL TESTING
The New Jersey Mill located 3 km east of Kellogg, Idaho has processed material from the Golden Chest since 2017 from both open pit and underground sources. See Figure 10-1. The New Jersey Mill originally started as 100 tonnes per day (tpd) flotation plant but was expanded to a nameplate capacity of 360 tpd in 2012. For the purposes of this section, the processing of Golden Chest material during the 100 tpd era will be treated as metallurgical testing. A laboratory test program using drill core from the Golden Chest to evaluate gravity, flotation, and cyanidation methods for the recovery of gold is also discussed.
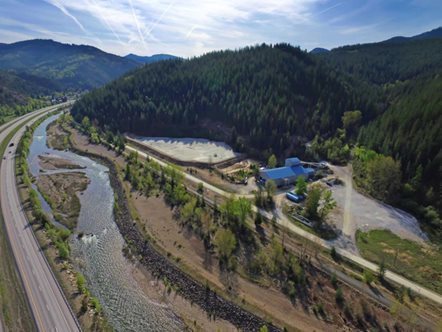
Figure 10‑1 Aerial View of New Jersey Mill
10.1 New Jersey Mill 100 TPD Metallurgical Testing
During the period from 2005 through 2009, IDR processed just over 8,300 tonnes of material grading 6.9 gpt gold and achieved a gold recovery of 94%. A flowsheet of the 100 tpd mill is shown below in Figure 10-2.
In general, the process included a crushing circuit, a grinding circuit, a flotation circuit, and a tailings disposal circuit. A bulk sulfide concentrate was made using rougher flotation cells followed by a single stage of cleaner cells. A neutral pH was maintained in the flotation circuit. Concentrate grades ranged from 100 gpt to 400 gpt gold depending upon the gold grade of the feed. Concentrates were sold to smelters through a broker and sold directly to Nevada Gold Mines Goldstrike facility in Carlin, Nevada.
| 10-1 |

Figure 10‑2 New Jersey Mill 100 TPD Flowsheet
The Golden Chest material processed during this time was sourced from underground mining of veins in the Klondike Shoot area, located in the northern portion of the mine. Gold mineralization was associated with structurally controlled faults, quartz veins and silica-flooding. Visible gold was relatively rare and gold mineralization was associated with pyrite, galena, chalcopyrite, and sphalerite. The mineralization had relatively low levels of sulfides, approximately 1% to 5%, and the ore processed was reasonably representative of the mineral deposit.
Deleterious elements in the concentrate were below smelter penalty levels, with arsenic quantities at 1,000 ppm, while lead and zinc were 2,000 ppm each. Iron and sulfur were the primary components of the concentrate at 33% and 38%, respectively. The concentrate is amenable to cyanide leaching.
The Company operated a Concentrate Leach Plant (CLP) and leached total of 78 tonnes (t) of Golden Chest flotation concentrates using an agitated tank leach followed by electrowinning. The head grade of the concentrate was 122 gpt Au and a gold recovery of 86.6% was achieved in the CLP. Low recovery and long leaching times were due to poor agitation in the leach tanks during this testing period. The Company completed a 6-tonne batch test leaching Golden Chest concentrate in 2016 with increased agitation power which resulted in 95% gold recovery in 72 hours.
10.2 Resource Development Inc. Metallurgical Testing
Resource Development Inc. (RDI) of Wheat Ridge, Colorado conducted preliminary metallurgical test work on core sample splits from the confirmation drilling in the Skookum Shoot in 2014. The mineralogy of the material from the Skookum Shoot is representative of the typical mineralized material at the Golden Chest. RDI’s program consisted of gravity, flotation, and cyanidation tests.
| 10-2 |
RDI completed three gravity concentration tests, using 1 kg of material per test. Each test consisted of a different grind size: 48 mesh, 65 mesh and 100 mesh. Overall gold recovery ranged from 31% to 37% with final concentrate grades ranging from 277 to 323 gpt Au.
RDI completed seven flotation tests, using 1 kg of material per test. The tests consisted of rougher flotation only with no cleaner flotation tests. The samples were ground in a rod mill at 50% solids to produce three different grind sizes (P80): 65, 100 and 150 mesh. Flotation reagents and retention times were also varied as part of the testing. Results of the flotation tests are presented in the table below.
Table 10‑1 RDI Flotation Test Results
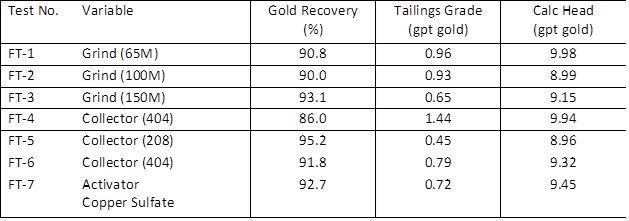
The highest recovery test consisted of a 9-minute flotation time, the finest grind (150 mesh) and used the reagent Aeroflot 208.
RDI also completed three cyanide bottle roll tests on whole ore, using 1 kg of whole ore from core sample rejects. Each sample was ground in a laboratory rod mill at 40% solids and the target grind size was varied in each test. The three grind sizes (P80) were 65 mesh, 100 mesh and 200 mesh. The leach time was fixed at 72 hours and solution samples were taken for gold assay at 6, 24, 48 and 72 hours.
Gold recovery ranged from 85.9% to 94.4% in the three tests with the 100-mesh test achieving the best recovery in 48 hours and the lowest recovery was the 200-mesh grind. Cyanide consumption ranged from 0.30 kg/tonne to 1.57 kg/tonne with the finest grind of 200 mesh consuming the most cyanide. RDI reported the Golden Chest material was, “very amenable to cyanide leaching” and that a nominal 100 mesh grind was ideal.
| 10-3 |
11.0 MINERAL RESOURCE ESTIMATES
11.1 Summary
Table 11-1 lists the Mineral Resource estimate for the Golden Chest mine. Mineral Resources have been classified in accordance with the definitions for Mineral Resources in S-K 1300. Open pit optimization was carried out for the area of the Skookum Zone where mineralization is near surface and the open pit resources are reported in Table 11-2. The Skookum Zone open pit resources are included in the summary table 11-1 and are split out in 11-2 to illustrate this potential surface resource on its own.
Table 11‑1 2023 Golden Chest Mine Mineral Resources
| Measured |
||||
| Zone | Tonnage | Au Grams | Au gpt | Au Troy Oz. |
| Paymaster | 40,569 | 193,928 | 4.78 | 6,235 |
| Skookum | 284,631 | 1,136,459 | 3.99 | 36,538 |
| Klondike | 81,405 | 336,099 | 4.13 | 10,806 |
| Combined | 406,605 | 1,666,485 | 4.10 | 53,579 |
| Indicated |
||||
| Zone | Tonnage | Au Grams | Au gpt | Au Troy Oz. |
| Paymaster | 190,398 | 898,911 | 4.72 | 28,901 |
| Skookum | 323,726 | 1,126,039 | 3.48 | 36,203 |
| Klondike | 151,426 | 635,249 | 4.20 | 20,424 |
| Combined | 665,550 | 2,660,198 | 4.00 | 85,527 |
| Total Measured + Indicated |
||||
| Zone | Tonnage | Au Grams | Au gpt | Au Troy Oz. |
| M+I | 1,072,155 | 4,326,684 | 4.04 | 139,106 |
| Inferred |
||||
| Zone | Tonnage | Au Grams | Au gpt | Au Troy Oz. |
| Paymaster | 322,352 | 1,211,701 | 3.76 | 38,957 |
| Skookum | 153,839 | 472,982 | 3.07 | 15,207 |
| Klondike | 267,602 | 718,667 | 2.69 | 23,106 |
| Combined | 743,793 | 2,403,350 | 3.23 | 77,269 |
| Skookum OP Resource |
||||
|
| Tonnes | Au Grams | Au gpt | Au Troy Oz |
| Measured | 70,477 | 245,779 | 3.49 | 7,902 |
| Indicated | 29,121 | 98,190 | 3.37 | 3,157 |
| Inferred | 18,102 | 71,907 | 3.97 | 2,312 |
| M+I | 99,598 | 343,969 | 3.45 | 11,059 |
| Total | 117,700 | 415,876 | 3.53 | 13,371 |
Table 11‑2 Skookum Open Pit Resource (Included in the overall resource reported in table 11-1)
Notes:
|
| 1. | Classification of Mineral Resources is in accordance with the S-K classification system. |
|
| 2. | Mineral Resources were estimated by IDR staff and reviewed and accepted by the QP. |
|
| 3. | Mineral Resources are exclusive of Mineral Reserves in the Skookum Zone (H-Vein and Idaho Vein), whereas there are no Mineral Reserves currently in the Paymaster or Klondike Zones. |
|
| 4. | Mineral Resources are not Mineral Reserves, and do not have demonstrated economic viability. |
|
| 5. | Revenues produced at the Golden Chest are subject to a 2% NSR Royalty. |
|
| 6. | Bulk density was calculated based on laboratory testing of representative vein samples and applied to the vein shapes. |
|
| 7. | Mineral Resources are estimated at 2 grams per tonne (gpt) for each of the zones underground. The Skookum Zone Surface Portion of the resource was optimized using Vulcan pit optimizer with open pit mining costs from the operation and results in a surface resource with a cut-off grade of 1.4 gpt. |
|
| 8. | Cutoff values used were calculated using the three-year trailing average gold price of $1850 USD/Troy Oz. |
|
| 9. | Numbers may not add due to rounding. |
The QP’s are of the opinion that with consideration of the recommendations summarized in Sections 1.0 and 23.0 of this TRS, any issues relating to all relevant technical and economic factors likely to influence the prospect of economic extraction can be resolved with further work.
11.2 Estimation of Veins at the Golden Chest
11.2.1 General Methodology
Three areas of the Golden Chest property were modelled for resources. These areas from north to south on the property are the Klondike, Skookum, and Paymaster areas. Individual models were created for each area to aid with vein solid creation and to honor interpretation of geologic vein continuity along strike across the property. Six individual veins were modeled and two other domains, not associated with veins were modelled. Each of these individual domains are listed below in table 11-3.
| 11-2 |
Table 11‑3 Golden Chest 2023 Resource Model Domains
| Domains included in the Golden Chest 2023 Resource Model |
|
| Domain Name | Block Model/Area |
| Jumbo Vein | Paymaster |
| Idaho Vein | Paymaster |
| H Vein | Skookum |
| Jumbo Vein | Skookum |
| Idaho Vein | Skookum |
| Idaho Vein Footwall (Unit G Quartzite) | Skookum |
| Popcorn Vein | Klondike |
| Klondike Hangingwall | Klondike |
The Paymaster Zone Domains, Klondike Zone Domains, Jumbo Vein Domain, and Skookum open pit resource domains were not re-estimated during this 2023 update. No drilling or mining of these zones provided additional information, or depleted them. Updates were only made to the H-Vein domain, and Idaho Vein underground domain as this is where the new drilling and mining information was collected.
Grades were assigned to blocks in each individual model by inverse distance squared (ID2) weighting. Blocks within the vein domains were constrained by vein wireframe solids. Vein solids were forced to a 3-meter minimum horizontal width and compositing was completed within this shape using a run-length compositing method except for the H-Vein domain. This method accounts for mining widths and dilution associated with a minimum width by including minimum projected mining widths as the basis for compositing, and appropriately diluting smaller intervals to projected mining widths.
Because of the extremely narrow and high-grade nature of the H-Vein (observed 0.2 m to 0.8 m) compositing was constrained to the H-Vein shape. This method was chosen to limit geostatistical influences from other domains that would not be representative of the H-Vein. This necessitated thinner blocks to accurately represent the H-Vein volume. A sub-blocked model was created for the H vein with 20 m x 20 m x 10 m parent blocks, and 0.2 m x 0.2 m x 0.1 m sub-blocks. This sub blocking scheme allowed strike and dip changes to be accurately modeled as well as areas where the vein necked down to its observed minimum of 0.2 m. All sub-block grades were assigned by the estimation of the parent block to honor the resolution of the drillhole spacing. The dilution added to the H-Vein resource and reserve was accomplished by utilizing the Vulcan add-on of the Alford Mining Systems (AMS) Stope Optimiser. By allowing the stope optimization to add zero grade value material to the minimum mining widths achievable, a diluted grade for the H-Vein Resource and Reserve was attained.
Wireframes were completed using Leapfrog Geo and Vulcan’s Geology Core. Idaho Strategic geologists coded each vein intercept in the drillhole database and solids were created using the coded database. Wireframes were then exported to Vulcan for grade estimation. Leapfrog and Vulcan are both off-the-shelf mining software packages that are common to the mining industry.
Composite values for models other than the H-Vein are diluted to mining widths by the 3 m minimum horizontal width vein envelope. The result is a diluted block model of 3 m by 3 m blocks that honors minimum mining widths. The H-Vein was composited strictly by wireframe. The expected mining dilution of the H-Vein was added by using the AMS stope optimization. The minimum mining width observed in H vein mining during 2023 test mining was 2.4 m, which was used as the stope optimization minimum width.
| 11-3 |
The Mineral Resources reported here are derived from block model estimates as of December 31, 2023. Mineral Resources are reported exclusive of Mineral Reserves. Cutoff grade versus tonnage curves for each zone can be found in Appendix 3.
11.2.2 Resource Database
The Golden Chest drill-hole database consists of 354 diamond and RC drill holes. Of the 338 total holes 29 are RC and 325 are core holes. All IDR collected round samples from mining were included in the resource estimate for the Idaho Vein. There are 1,257 round samples in the IDR resource for the Idaho Vein representing all mining completed from 2018 through 2023 by IDR in the Idaho Vein. The round samples represent a diluted to mining width sample just as the composites from the drill hole database do. Round samples are placed in space by using the surveyed stopes to create a centerline beginning at the surveyed stope intersection. They are then composited to 3-meter lengths for input into the resource estimate. The cut-off date for the resource database was all core holes drilled in 2023 and round or chip samples through December 31, 2023.
Because the H-Vein model is constrained by the wireframe muck samples were not used in its estimation. It was also found through mining and milling experience during 2023 that by calculating the expected grade of a given round, a more accurate estimate of the mill feed grade could be achieved. The sampling database used in estimation included 197 chip samples that were taken by company geologists. The chip samples were placed in space by the distance recorded by the geologist of the face the sample was taken from. A horizontal line was placed at the appropriate face distance and this was the representation of the vein chip sample in space. This results in a composite value representing the grade of the vein wireframe at the appropriate location. This width information was also used to inform the vein wireframe along with drillhole intercepts.
Table 11‑4 Summary of Samples from the Golden Chest
| Sample Type | Number of Samples | Average Sample Length (m) | Total Length (m) |
| Core Holes | 14,220 | 1.3 | 43,000 |
| RC Holes | 1,743 | 1.6 | 2,660 |
| Idaho Vein Round Samples | 1,257 | 2.7 | 2,840 |
| H vein Chip Samples | 197 | 0.59 | 109 |
11.2.3 Geological Modelling
There are four distinct veins modelled at the Golden Chest. They are narrow structures generally striking between 5 degrees NNE and 30 degrees NNE. The dips are generally 45 degrees to the west with the exception being the H-Vein in the hangingwall of the Idaho Fault which dips 72-75 degrees to the west. Mineral Resources are reported for each of the four veins and two non-vein domains. Mineral Reserves are reported for the Idaho Vein and H-Vein in the Skookum area of the Golden Chest Mine.
| 11-4 |
A solid model for each of these veins was created using Leapfrog Geo and Vulcan was used for block modelling. The block model extents were selected to aid in modelling veins by their distance into the hangingwall or footwall of the Idaho Fault. The vein models for the Klondike and Paymaster areas were unchanged from the 2022 estimate. The figure below shows the H-Vein and Idaho Vein models which were updated with the 2023 drilling information.
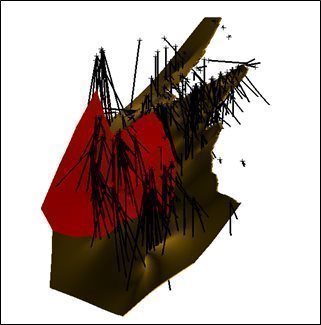
Figure 11‑1 H-Vein and Idaho Vein 2023 Wireframes Looking Northeast (H-Vein Red, IDVN Tan)
11.2.4 Exploratory Data Analysis
Core, RC, round samples, and chip samples from the Skookum were used for estimation. In the Klondike and Paymaster areas there is no production data, therefore RVC and core drilling samples were used exclusively in the Paymaster and Klondike areas.
The figure below shows raw statistics and histogram for the Skookum area H-Vein and Idaho vein domains. Statistics and graphs for the other domains can be found in Appendix 1.
| 11-5 |

Figure 11‑2 Histogram and General Statistics of the Skookum Area Idaho Vein
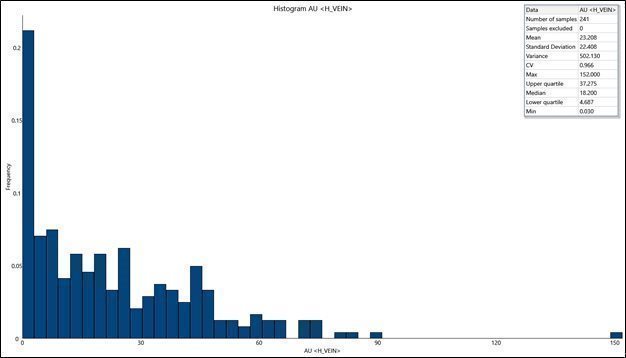
Figure 11‑3 Histogram and General Statistics of the Skookum Area H-Vein
| 11-6 |
Statistical analysis of each of the domains shows the typical lognormal, positively skewed distribution found with most precious metal deposits. The Idaho Vein in the Skookum area shows the smoothest of the vein distributions as it is the most heavily sampled.
11.2.5 Grade Capping
Grade capping for the Idaho Vein was left unchanged from 2022 at 40 gpt after estimation. Evaluating the cumulative frequency plot for the H-Vein showed a definitive flattening after a 60 gpt grade. This higher capping number is reasonable given that the H-Vein was modeled as the vein domain only, and external dilution when mining was accounted for using the stope optimizer. A capping value of 60 gpt was chosen for all estimated blocks which is also supported by vein chip sampling where approximately 92% of sampled vein chips fall below 60 gpt.
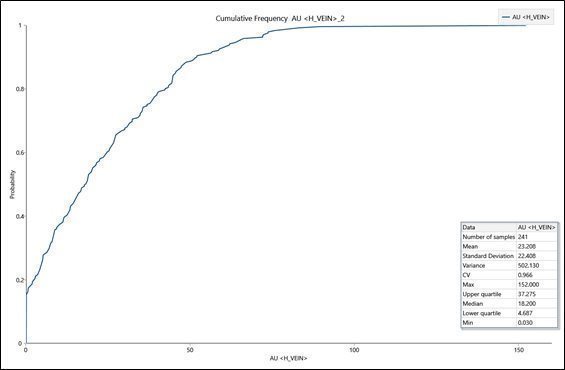
Figure 11‑4 CDF of the H Vein Composite Database
| 11-7 |
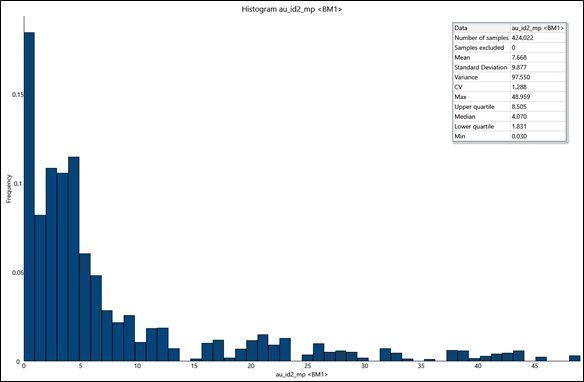
Figure 11‑5 Histogram and General Statistics of H-Vein Block Model
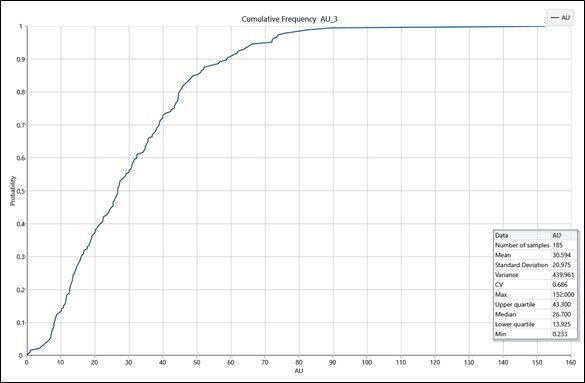
Figure 11‑6 CDF and General Statistics of H-Vein Chip Samples
| 11-8 |
11.2.6 Compositing
Compositing is necessary to place all of the sampling information on the same level of support, i.e. lengths. Sample lengths in the Golden Chest database ranged from 0.03 to 3.9 meters. Although a minimum sample size protocol of 3 m below contacts of interest is in place, core loggers may break the 3 m of continuous sampling around areas of interest into smaller sections if different zones of interest are identified. The cumulative frequency chart below shows that approximately 99% of the samples fall between 0.1 m and 2 m as 0.1 m is the minimum length sample after minimum sampling protocols were established.
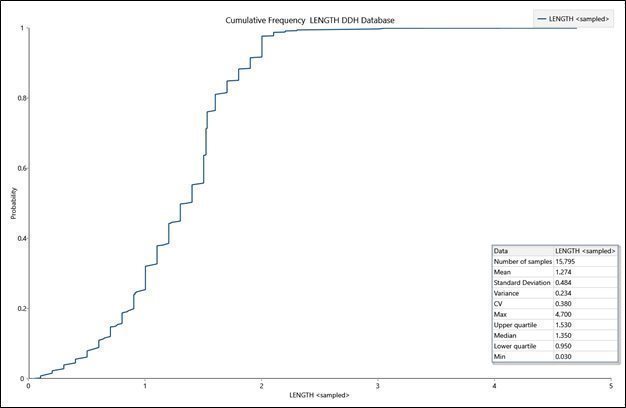
Figure 11‑7 Cumulative Frequency Chart of Sampling Lengths in the Golden Chest Database
| 11-9 |
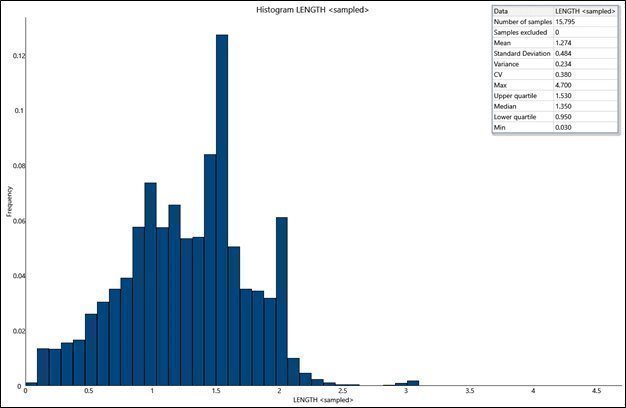
Figure 11‑8 Histogram of Sample Lengths for the Golden Chest Database
Veins at the Golden Chest are relatively narrow and vary in width along the dip and strike of the vein. Compositing for domains that were not the H-Vein was carried out using Vulcan’s geologic break function which breaks a run length composite along the hangingwall of the defined feature and a 3 m composite is formed below that plane. If the angle between the structure and the drill hole creates a run length longer than 3 m, composites less than 1.5 m are appended onto the 3 m composite. Run lengths greater than 1.5 m and adjacent to a 3 m composite are added as an individual composite. If the shape and the drill hole intersect such that the run length is less than 3 m the entire width is taken as a composite. Narrow high-grade intercepts are avoided by forcing the vein shape to a 3 m minimum horizontal width and applying zero grade to all unsampled or zero recovery sections within the minimum width vein shape. Below is a histogram of the compositing lengths showing composite lengths generated. The resulting composites range in length from 0.001 m to 7.5 m with approximately 94% falling between 2.0 m and 3.0 m.
The H-Vein domain was composited within the boundaries of the vein wireframe. This was done to more accurately model the narrow vein and exclude sample intervals outside the vein. Expected mining dilution was accounted for by using the stope optimizer tool to add zero grade material to the planned mining dimensions.
| 11-10 |
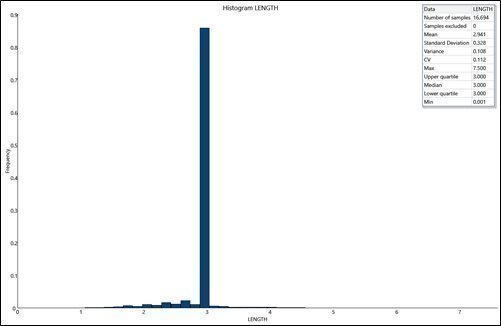
Figure 11‑9 Histogram of Skookum area composite lengths for the Idaho Vein
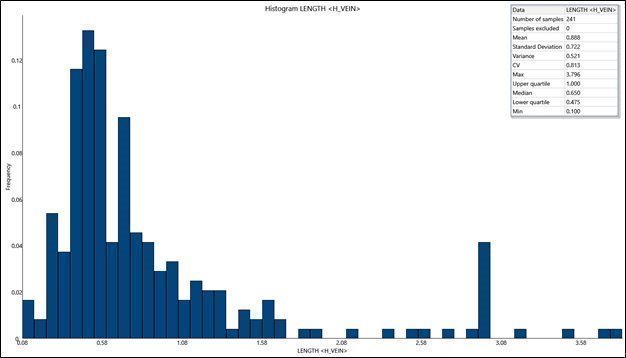
Figure 11‑10 Histogram of H-Vein composite lengths
11.2.7 Geostatistics
Search parameters for the estimation were derived through variogram analyses of each domain. It was generally found that at a range of 55 m to 60 m in each of the domains that the sill was reached. It was therefore decided to estimate the blocks in two passes which essentially resulted in estimating what would become Measured and Indicated resources first, and then to leave those blocks out of a second estimation pass with increased search radius to estimate inferred blocks. Each of the variograms showed generally the same ranges up-dip and along strike for each of the domains investigated. The width of the search ellipse was set at 6 m, or approximately two times the horizontal mining width to include samples in areas where the vein changed dip or strike significantly for a short period and then resumed the average dip and strike. The Nugget was estimated from downhole variograms. The results for the Idaho Vein experimental and model variograms are shown below. The remaining domain variograms can be found in Appendix 2. Each of the variograms is oriented in the plane of the vein and rotated to the plane of least variability within the domain along that plane. It was noted that in the majority of the vein domains the ellipsoid could be reasonably considered valid as a 50 m range around a given data point in the plane of the vein.
| 11-11 |
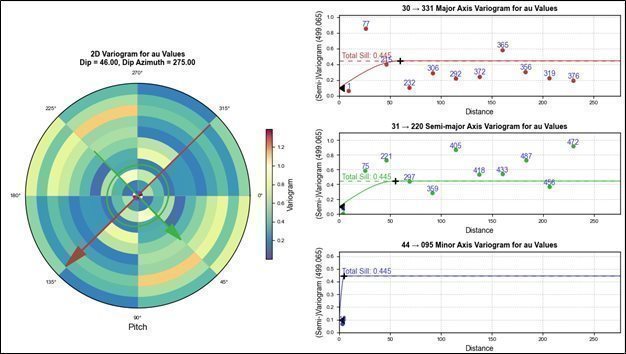
Figure 11‑11 Skookum Zone Idaho Vein variogram model with pair counts. Major and minor axis illustrate ranges in the 55–60-meter range
11.2.8 Block Model Geometry
The Golden Chest Block Models were created in Maptek’s Vulcan software which is an off-the-shelf mining software. Only the H-Vein model was rotated, and three contiguous models were created to model each of the sub-parallel veins in the areas where the data was the densest and it was clear which structures were related to each other. The H-Vein Model was rotated to align with the wireframe and decrease computing time for the potentially large number of blocks created by sub-blocking. H-Vein sub blocks were estimated by the parent block grade to avoid unrealistic resolution created by the estimate.
| 11-12 |
Table 11‑5 Model Extents for each Zone in the Golden Chest Northings, Eastings, and Elevations are UTM NAD27 Z11 Coordinates
| Paymaster Zone Model Extents |
|
| Start N | End N |
| 5,274,351 | 5,274,870 |
| Start E | End E |
| 587,500 | 588,352 |
| Start Z | End Z |
| 525 | 1152 |
| Skookum Zone Model Extents |
|
| Start N | End N |
| 5,274,351 | 5,274,870 |
| Start E | End E |
| 587,500 | 588,352 |
| Start Z | End Z |
| 525 | 1152 |
| Klondike Zone Model Extents |
|
| Start N | End N |
| 5,274,870 | 5,275,212 |
| Start E | End E |
| 587,500 | 588,352 |
| Start Z | End Z |
| 525 | 1152 |
| 11-13 |
Table 11‑6 Block Model Variables and Descriptions
| Block Model Variables |
|
| Variable | Description |
| air | Value of 1 for blocks above topography, used in pit optimization |
| aniavgdist | Anisotropic average distance to samples used to estimate a block |
| anidist | Anisotropic distance to the closest sample used to estimate a block |
| auid2 | ID2 estimated Gold Grade |
| awtavgdist | Anisotropic weighted average distance to samples |
| cartavgdist | Cartesian average distance to samples |
| cwtavgdist | Cartesian weighted average distance to samples |
| density | Rock density |
| dhnum | Number of drill holes used to estimate a block |
| indicated | indicated category |
| inferred | inferred category |
| klgg0-5 | processing scenarios for open pit optimization |
| measured | measured category |
| pass1 | Estimated on the first pass |
| pass2 | Estimated on the second pass |
| passcount | number of passes |
| pit22 | Optimal pit at 2022 inputs |
| pit220-225 | Nested pits at varying revenue factors (gold prices) |
| sampdist | Distance to the nearest sample |
| sampgrade | Grade of the nearest sample |
| volume | Volume of a block |
| xcentre | Easting of the block centroid |
| xlength | Length of a block in the Easting direction |
| xworld | Easting in world coordinates |
| ycentre | Northing of the block centroid |
| ylength | Length of a block in the Northing direction |
| yworld | Northing in world coordinates |
| zcentre | Elevation of the block centroid |
| zlength | Length of a block in the vertical direction |
| zworld | Elevation in world coordinates |
11.2.9 Search and Interpolation Parameters
Gold grades are estimated into blocks using the Inverse Distance Squared weighting method (ID2). The grade interpolation was carried out in two passes of increasing search radius. Search ellipsoids are oriented in a best-fit method in the plane of each vein domain. In the footwall quartzite domain where broad zones of low-grade mineralization are more prevalent an isotropic search range was used with ranges taken from the variogram analysis. Search ellipsoid information can be found in Table 11-7. To mitigate the potential bias of high-grade distant samples in the H-Vein, a restriction was placed on the H-Vein model to exclude high grade samples (>80 gpt) and limit their effect to a 12.5 m radius.
| 11-14 |
Table 11‑7 Search Ellipsoid parameters by zone.
| Zone and Domain | Pass 1 Search Radius | Pass 2 Search Radius | Geometry |
| Skookum Idaho Vein | 50m x 50m x 6m | 150m x 150m x 6m | Best Fit in Vein Plane |
| Skookum Jumbo Vein | 50m x 50m x 6m | 150m x 150m x 6m | Best Fit in Vein Plane |
| Skookum H Vein | 50m x 50m x 6m | 150m x 150m x 6m | Best Fit in Vein Plane |
| Skookum Footwall | 50m x 50m x 50m | N/A | Isotropic |
| Paymaster Idaho Vein | 50m x 50m x 6m | 150m x 150m x 6m | Best Fit in Vein Plane |
| Paymaster Jumbo Vein | 50m x 50m x 6m | 150m x 150m x 6m | Best Fit in Vein Plane |
| Klondike Popcorn Vein | 50m x 50m x 6m | 150m x 150m x 6m | Best Fit in Vein Plane |
| Klondike Hanginwall | 25m x 25x x 3m | N/A | Best Fit in Stockwork Plane |
For all vein domains the search parameters remained the same as supported by geostatistical analysis. Company engineers felt that this was a prudent approach by limiting the first pass to 50m radius and shortening the search radius in the Klondike Hangingwall where the drill spacing is not dense enough and more step-out drilling is necessary to evaluate the potential of the Klondike Hangingwall. The quartzite zone was modeled isotropically. Geologically the Skookum Zone quartzite seems to have been a permeable host for depositional fluids and wider low-grade zones can be seen “bleeding” into the footwall of the Skookum zone.
| 11-15 |
Table 11‑8 Estimation Parameters
| Zone and Domain | Pass | Min Samples | Max Samples | Max. Samples per Drillhole | Min. Drillhole | Max. Drillhole |
| Skookum Idaho Vein | 1 | 2 | 5 | 2 | 2 | 10 |
| Skookum Idaho Vein | 2 | 2 | 6 | 2 | 2 | 10 |
| Skookum Jumbo Vein | 1 | 2 | 5 | 2 | 2 | 10 |
| Skookum Jumbo Vein | 2 | 2 | 6 | 2 | 2 | 10 |
| Skookum H Vein | 1 | 2 | 5 | 2 | 2 | 10 |
| Skookum H Vein | 2 | 2 | 6 | 2 | 2 | 10 |
| Skookum Footwall | 1 | 2 | 5 | 2 | 2 | 10 |
| Paymaster Idaho Vein | 1 | 2 | 5 | 2 | 2 | 10 |
| Paymaster Idaho Vein | 2 | 2 | 6 | 2 | 2 | 10 |
| Paymaster Jumbo Vein | 1 | 2 | 5 | 2 | 2 | 10 |
| Paymaster Jumbo Vein | 2 | 2 | 6 | 2 | 2 | 10 |
| Klondike Popcorn Vein | 1 | 2 | 5 | 2 | 2 | 10 |
| Klondike Popcorn Vein | 2 | 2 | 6 | 2 | 2 | 10 |
| Klondike Hanginwall | 1 | 2 | 5 | 2 | 2 | 10 |
The minimum number of drillholes constraint was used to estimate only those blocks which would fall into the Inferred category as the lowest confidence blocks. A majority of the Inferred blocks were estimated in Pass 2 while the vast majority of Measured and Indicated blocks were estimated in Pass 1. Only blocks whose centroid was in the wireframe of the domain were estimated. This resulted in some areas where the block model alignment and vein orientations didn’t line up having un-estimated blocks which were mostly in the volume but with centroids outside the boundary. This was relatively rare as the strike of the veins is generally near North.
To address this issue in the narrow H vein, the model was rotated to align with the dip of the vein. This was necessary because of the narrow nature of the vein and the large portion of the vein that would be un-estimated because the block centroids did not fall within the wireframe.
| 11-16 |
11.2.10 Density
A rock density of 2.65 tonnes per meter cubed was used for the entire block model which was derived from samples taken over the life of the project by various geotechnical and geochemical laboratories.
11.2.11 Classification
SK-1300 Mineral Resources and Mineral Reserves must be classified according to the definitions of the Committee for Mineral Reserves International Reporting Standards (CRIRSCO). The definitions for Mineral Resources, Reserves, and their respective classifications are as follows.
|
| 1. | Mineral Resource- A Mineral Resource is a concentration or occurrence of solid material of economic interest in or on the Earth’s crust in such form, grade or quality and quantity that there are reasonable prospects for eventual economic extraction. The location, quantity, grade or quality, continuity and other geological characteristics of a Mineral Resource are known, estimated or interpreted from specific geological evidence and knowledge, including sampling. |
|
| 2. | Measured Mineral Resource- A Measured Mineral Resource is that part of a Mineral Resource for which quantity, grade or quality, densities, shape, and physical characteristics are estimated with confidence sufficient to allow the application of Modifying Factors to support detailed mine planning and final evaluation of the economic viability of the deposit. Geological evidence is derived from detailed and reliable exploration, sampling and testing and is sufficient to confirm geological and grade or quality continuity between points of observation. A Measured Mineral Resource has a higher level of confidence than that applying to either an Indicated Mineral Resource or an Inferred Mineral Resource. It may be converted to a Proved Mineral Reserve or to a Probable Mineral Reserve. |
|
| 3. | Indicated Mineral Resource- An Indicated Mineral Resource is that part of a Mineral Resource for which quantity, grade or quality, densities, shape and physical characteristics are estimated with sufficient confidence to allow the application of Modifying Factors in sufficient detail to support mine planning and evaluation of the economic viability of the deposit. Geological evidence is derived from adequately detailed and reliable exploration, sampling and testing and is sufficient to assume geological and grade or quality continuity between points of observation. An Indicated Mineral Resource has a lower level of confidence than that applying to a Measured Mineral Resource and may only be converted to a Probable Mineral Reserve. |
|
| 4. | Inferred Mineral Resource- An Inferred Mineral Resource is that part of a Mineral Resource for which quantity and grade or quality are estimated on the basis of limited geological evidence and sampling. Geological evidence is sufficient to imply but not verify geological and grade or quality continuity. An Inferred Resource has a lower level of confidence than that applying to an Indicated Mineral Resource and must not be converted to a Mineral Reserve. It is reasonably expected that the majority of Inferred Mineral Resources could be upgraded to Indicated Mineral Resources with continued exploration. |
Idaho Strategic personnel believe that by limiting the first pass radius to 50 m, which is based on the variogram range, and only estimating blocks where two drill holes are within the search radius, combined with limiting blocks to the created vein wireframes, the Golden Chest resource represents a conservative model which utilizes modern industry best practices to reach a reasonable estimate of resources at the Golden Chest. Golden Chest Resources are classified in the table below.
| 11-17 |
| Golden Chest Resource Classification |
|
| Measured | 3 drillholes within 25 meters of the block used in the estimation |
| Indicated | 2 drillholes within 50 meters of the block used in the estimation |
| Inferred | 2 drillholes used in the estimation, distance to drill holes up to 150 meters |
Table 11‑9 Golden Chest Resource Parameters
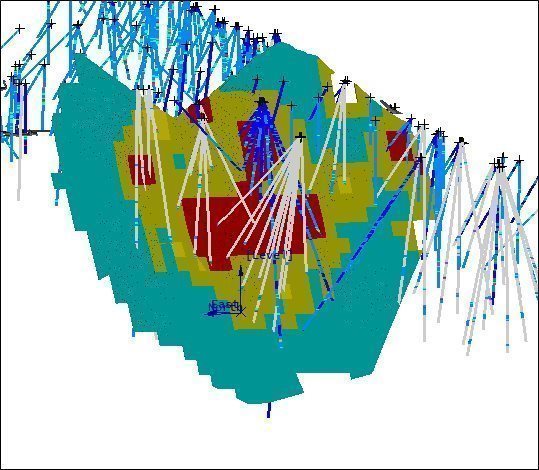
Figure 11‑12 H Vein Block Model by Resource Classification (Red-Measured, Yellow-Indicated, Blue-Inferred)
The resource classification is in line with historic classifications completed at the Golden Chest and is considered reasonable based on Idaho Strategic Resources mining experience. Isolated Islands of the resource that are Measured or Indicated were evaluated for downgrading. After a grade shell review, it was found that these islands fell below the 2 gram per tonne cutoff and were already excluded from the reported resource model.
| 11-18 |
11.2.12 Cut-off Grade
Cut-off grades for the Golden Chest Resource were calculated using the 2023 mining costs at the Golden Chest and first principle estimates for operations moving forward for both underground and surface operations during the year 2023. The major difference in the 2022 and 2023 analysis was the reduction of the backfilling cost due to increased flexibility to use uncemented fill during 2023 and the planned addition of a paste backfill plant in the mine plan.
| Surface Mining Cut-off |
||
| Variable | Value | Unit |
| Waste Mining | 3.25 | $/tonne |
| Ore Mining | 4.15 | $/tonne |
| Mill Haul Cost | 15.0 | $/ore tonne |
| Milling Cost | 38 | $/ore tonne |
| G&A | 6 | $/tonne |
| Metallurgical Recovery | 85 | % |
| Smelter Recovery (Payment) | 89 | % |
| Royalty | 2 | % |
| Gold Price | 1850 | $/troy ounce |
| In-Pit Cutoff (Mining Cost Sunk) | 1.43 | Au grams/tonne |
| PushBack Cutoff (Mining Decision) | 2.02 | Au grams/tonne |
| Underground Mining Cut-off |
||
| Variable | Value | Unit |
| Mining Cost *G&A included | 90 | $/tonne |
| Backfill Cost | 17 | $/tonne |
| Mill Haul Cost | 15 | $/ore tonne |
| Milling Cost | 38 | $/ore tonne |
| Metallurgical Recovery | 93 | % |
| Smelter Recovery (Payment | 91 | % |
| Royalty | 2 | % |
| Gold Price | 1850 | $/troy ounce |
| In-Stope Cutoff (Mining Cost Sunk) | 1.42 | Au grams/tonne |
| Go/No-Go (Mining Decision) | 3.24 | Au grams/tonne |
Table 11‑10 Cutoff calculation Inputs and results
11.2.13 Validation
Block models were validated using the following methods:
|
| · | Visual inspection of block model versus composites as a section view |
|
| · | Comparison of composite and block means and Q-Q plots |
|
| · | Swath plots (Drift Analysis) |
11.2.13.1 Visual Inspection of Block Model vs. Composites
Visual inspection of the block model was carried out by cutting sections of the finalized model and geologic shapes and comparing block grades near to composite values and their respective values using a color scale. An example section is shown in the figure below.
| 11-19 |
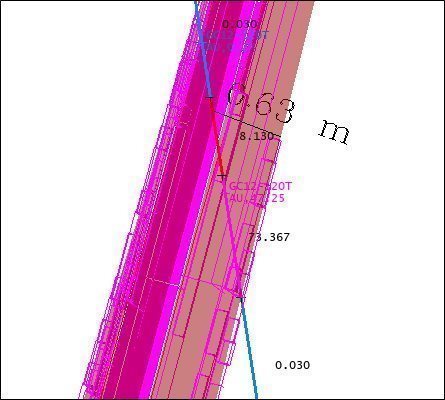
Figure 11‑13 Visual Validation Slice of the 2023 Updated H-Vein Model
Visual validation showed reasonable agreement between composite values and blocks where the data was dense enough to project blocks.
11.2.13.2 Comparison of Composite and Block Means
The comparison of the block mean grades versus composite mean grades showed the anticipated smoothing effect that is common to an inverse distance estimation method. The Skookum H model which showed the block average grade was higher than the composite average grade in 2022 flipped in the 2023 comparison with composite grades being higher than block grades in the 2023 estimate. This is the typical case and is seen as a conservative factor of the inverse distance method. An area of future work would be to evaluate the usefulness of other geostatistical estimation methods such as kriging.
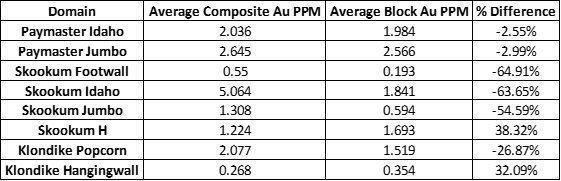
Figure 11‑14 Comparison of Composite Means versus Block Means by Domain
| 11-20 |
11.2.13.3 Swath Plots (Drift Analysis)
Swath plots were created for each of the model domains to compare block model grades by location to composite grades. The ID2 estimation tends to “smooth” or potentially underestimate grade in some areas of the deposit. In other areas the block model smooths the lower composite grades at a location to slightly higher grades. The underestimation of block grades compared to composite values is viewed to be more prominent as the average distance that the block model curve is below the composite peaks is larger than the distance the block model curve is above the composite lows, see figure 11-14 below. This is supported generally by comparison of mean grades of composites and blocks. This is considered an area of further work and presents an opportunity for fine tuning the model.
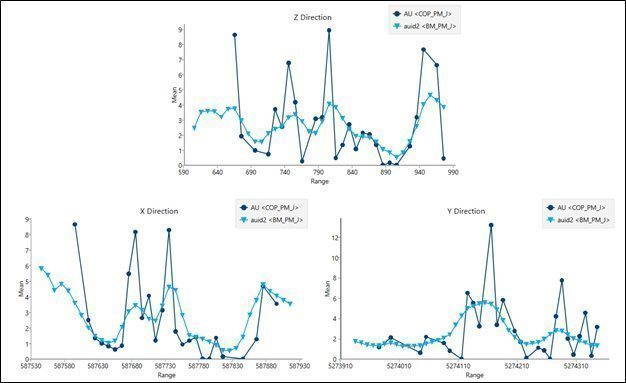
Figure 11‑15 Swath Plot of Paymaster Jumbo Vein. Composites (Dark Blue) versus Blocks (Light Blue)
| 11-21 |
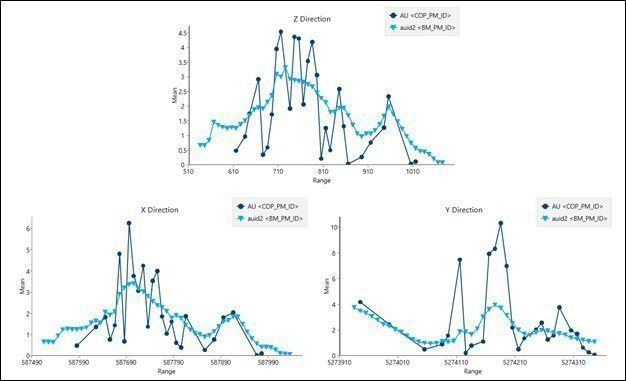
Figure 11‑16 Swath Plot of Paymaster Idaho Vein. Composites (Dark Blue) versus Blocks (Light Blue)
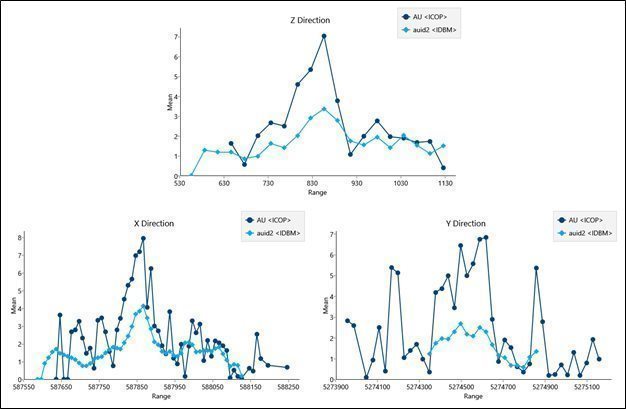
Figure 11‑17 Swath Plot of Skookum Idaho Vein. Composites (Dark Blue) versus Blocks (Light Blue)
| 11-22 |
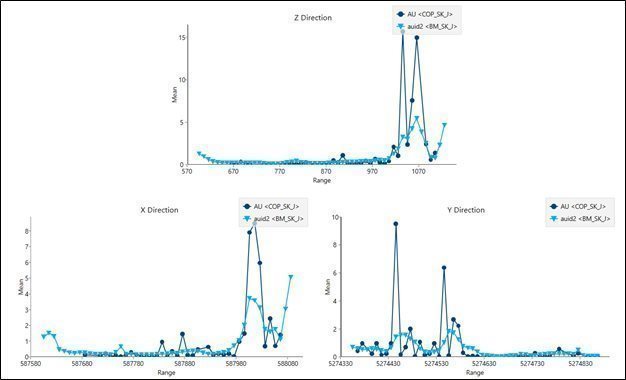
Figure 11‑18 Swath Plot of Skookum Jumbo Vein. Composites (Dark Blue) versus Blocks (Light Blue)
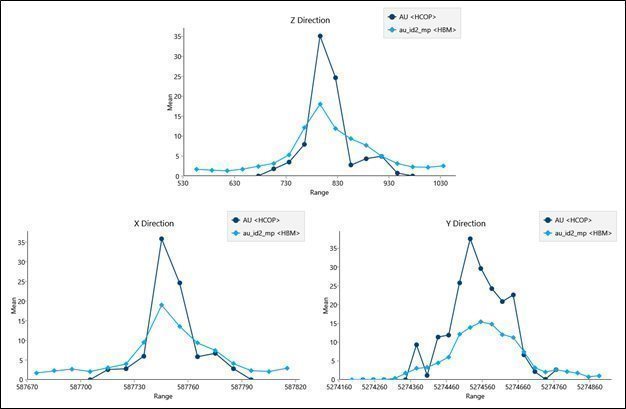
Figure 11‑19 Swath Plot of Skookum H Vein. Composites (Dark Blue) versus Blocks (Light Blue)
| 11-23 |
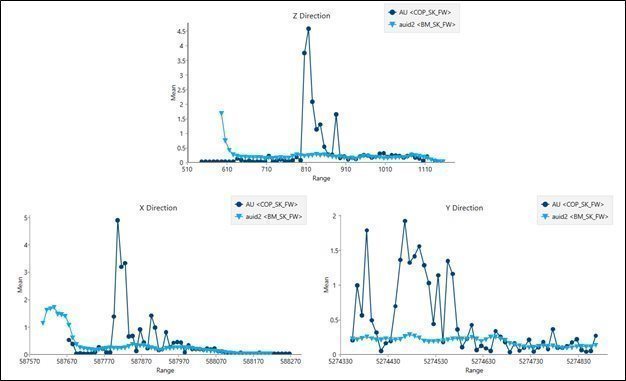
Figure 11‑20 Swath Plot of Skookum Footwall. Composites (Dark Blue) versus Blocks (Light Blue)
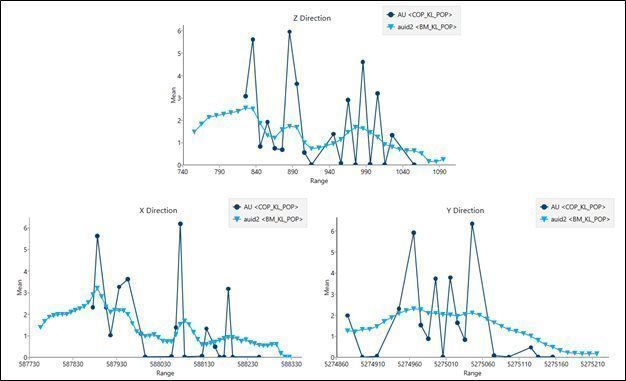
Figure 11‑21 Swath Plot of Klondike Popcorn Vein. Composites (Dark Blue) versus Blocks (Light Blue)
| 11-24 |
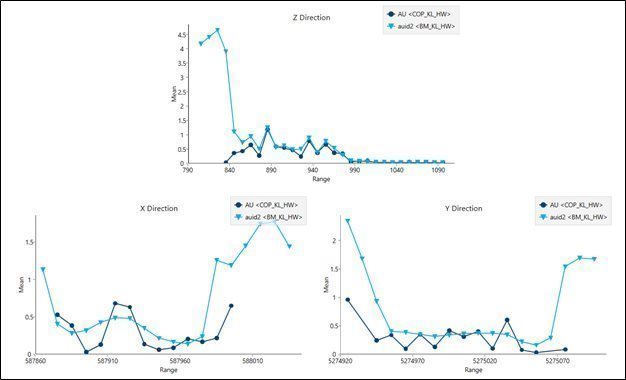
Figure 11‑22 Swath Plot of Klondike Popcorn Vein. Composites (Dark Blue) versus Blocks (Light Blue)
The QP’s have reviewed the methodology used to calculate Mineral Resources and believe the Company’s estimate of Mineral Resources is acceptable and complies with SK-1300.
| 11-25 |
12.0 MINERAL RESERVE ESTIMATES
12.1 Summary
The current Mineral Reserve estimates prepared by Idaho Strategic personnel and reviewed by the QP’s are reported as of December 31, 2023. Reserves are reported only for the Skookum area in the Idaho Vein domain. Tables below show the combined H-Vein and Idaho Vein Reserve, and then each vein domain independently. Exploration and pre-production studies will be carried out to evaluate the potential inclusion of other areas in the Mineral Reserve. The QP’s have reviewed the Mineral Reserve calculation methodology and believe the Company’s estimates are in accordance with industry-standard practices and comply with SK-1300.
Table 12‑1 Golden Chest Underground Proven and Probable Reserves at December 31st, 2023
| Golden Chest Reserves (H and Idaho Veins Combined) |
||||
| Proven |
||||
| Area | Tonnes | Au gpt | Au Grams | Au Troy Oz |
| Skookum | 78,935 | 7.21 | 568,996 | 18,294 |
| Probable |
||||
| Area | Tonnes | Au gpt | Au Grams | Au Troy Oz |
| Skookum | 48,542 | 5.98 | 290,328 | 9,334 |
| Totals Proven and Probable | 127,477 | 6.74 | 859,324 | 27,628 |
Notes:
|
| 1. | Classification of Mineral Reserves is in accordance with S-K 1300 classification system. |
|
| 2. | Mineral Reserves were estimated by Idaho Strategic Resources and reviewed and accepted by the QP’s. |
|
| 3. | Mineral Reserves are 100% attributable to Idaho Strategic Resources. |
|
| 4. | Mineral Reserves are estimated at a cutoff of 3.2 Au PPM (grams/tonne). |
|
| 5. | Mineral Reserves are estimated using a 3-year trailing average gold price of $1850/troy ounce. |
|
| 6. | Mineral Reserves are contained within the H-Vein and Idaho Vein domains which are both located in the Skookum area. A majority of the Mineral Reserve is located in the H-Vein. |
|
| 7. | An average mining width of 3 m was used for the Reserves reporting for the Idaho Vein |
|
| 8. | H-Vein Reserves were diluted to a 2.4m minimum mining width. |
|
| 9. | Minimum mining width dilution is accounted for in the estimate. |
|
| 10. | Numbers may not add due to rounding. |
Table 12‑2 H-Vein Domain Portion of the 2023 Reserve
| H Vein Reserves |
||||
| Proven |
||||
| Levels | Tonnes | Au gpt | Au Grams | Au Troy Oz |
| 898H thru 718H | 62,126 | 8.13 | 504,794 | 16,230 |
| Probable |
||||
| Levels | Tonnes | Au gpt | Au Grams | Au Troy Oz |
| 898H thru 718H | 40,824 | 5.99 | 244,637 | 7,865 |
| Totals Proven and Probable | 102,950 | 7.28 | 749,432 | 24,095 |
Table 12‑3 Idaho Vein Domain Portion of the 2023 Reserve
| Idaho Vein Reserve |
||||
| Proven |
||||
| Levels | Tonnes | Au gpt | Au Grams | Au Troy Oz |
| 800ID thru 773 ID | 5,603 | 2.56 | 14,352 | 461 |
| 888ID Sublevel | 7,150 | 3.92 | 28,028 | 901 |
| Blowout Zone | 4,056 | 5.38 | 21,821 | 702 |
| Probable |
||||
| Levels | Tonnes | Au gpt | Au Grams | Au Troy Oz |
| 800ID thru 773 ID | 7,718 | 5.92 | 45,691 | 1,469 |
| Totals Proven and Probable | 24,528 | 4.48 | 109,892 | 3,533 |
12.2 Conversion to Mineral Reserves
The mining method evaluated in this estimate is the Underhand Cut-and-fill method. Minimum dimensions vary by stope and are discussed in more detail in Section 13.
To evaluate the conversion of Mineral Resources to Mineral Reserves, grade shells are made around potentially economic extraction areas. In the Idaho Vein area this is done on the block basis as the blocks are fully diluted and composited on a three-meter minimum mining width. In the H-Vein domain, blocks were created that were much narrower than the H-Vein minimum mining width of 2.4 meters in some areas. This issue was handled by using a stope optimizer to create prospective stopes that met the 3.2 gpt go/no-go cutoff for the 2023 Mineral Reserve while adhering to the expected dilution of the minimum mining width.
After grade shells were created mining engineering staff at Idaho Strategic Resources designed individual stopes making the decision whether to cross areas of the vein defined as waste to reach higher grade areas defined by the shells/optimizer. All of the designed stopes had to conform to the 3.2 gpt go/no-go cutoff.
| 12-2 |
When the stope design was completed development accesses, muck bays, escape ways, and all other necessary development were designed for the defined stoping blocks. An economic analysis was undertaken considering the necessary development and the stopes that showed a positive addition of cash flow to the mine plan were accepted into the Mineral Reserve.
12.3 Cut-Off Grade
Two cut-off grades are used for stope planning, the go/no-go cut-off and the in-stope cut-off. The go/no-go cut-off represents any material that has the potential to be mined but does not have to be mined as part of the operational plan. The go/no-go cut-off is used for initial stope planning as any given stope or sublevel does not have to be mined and should only be mined if it is economic. The go/no-go cut-off is equation is presented in Equation 1.
Equation 1 Go/No-Go Cut-off

| Underground Mining Cut-off |
||
| Variable | Value | Unit |
| Mining Cost *G&A included | 90 | $/tonne |
| Backfill Cost | 17 | $/tonne |
| Mill Haul Cost | 15 | $/ore tonne |
| Milling Cost | 38 | $/ore tonne |
| Metallurgical Recovery | 93 | % |
| Smelter Recovery (Payment | 91 | % |
| Royalty | 2 | % |
| Gold Price | 1850 | $/troy ounce |
| In-Stope Cutoff (Mining Cost Sunk) | 1.42 | Au grams/tonne |
| Go/No-Go (Mining Decision) | 3.24 | Au grams/tonne |
Table 12‑4 Go/No-Go Cut-off Parameters
The General and Administrative (G&A) costs are included in the mining cost in Table 12-2. This formula yields a value of 3.24 gpt for the cut-off and was rounded down to 3.2 gpt for a more natural break.
The in-stope cut-off is used when material in a defined stope must be mined to reach higher grades. In this scenario the mining cost is considered sunk and is omitted from Equation 1 as the cost was incurred regardless of the ore/waste determination at the face. Evaluating equation 1 omitting mining cost yields a value of 1.42 gpt which was rounded to 1.4 gpt.
12.4 Dilution
Dilution is accounted for in the Idaho Vein reserve blocks by compositing drill holes to 3 m run-lengths and including all round sampling in the reserve model. This method takes into account the minimum mining width and allows for an acceptable estimate of mining performance. Dilution is also checked operationally by periodically channel sampling only the vein in a heading and comparing it to the corresponding round sample. Theoretical dilution and round sample grades for the Idaho Vein generally show good agreement. In the H-Vein domain it was found that calculating the expected grade of each round by diluting the vein thickness by the measured heading width allowed for a better comparison to milled head grades. This experience also helped validate the block model as the calculated Reserve grade agreed with the past mining experience in the H-Vein
| 12-3 |
Table 12‑5 H-Vein Test Mining Dilution by Stope
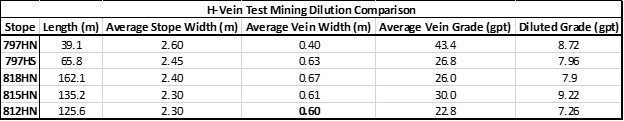
H-Vein dilution is accounted for by adding zero grade material to the stope shapes around the estimated vein domain. This method provides a reasonable estimation of the stope dilution to be expected. Minimum mining widths were chosen from the test mining data available from the H-Vein during 2023.
12.5 Extraction
The extraction rate for this mining method assumes 100% based on the fully diluted model, and the cutting of each planned stope to its design dimensions. This has shown reasonable correlation from modeled to mined results and is a common value for the underhand cut-and-fill mining method.
12.6 Reconciliation
Mining during 2023 was a transition year that had feed from a variety of sources. The H-Vein test mining made up a plurality of the tonnage. No ball mill cleanout was completed during 2023. Because of the mixed feeds and lack of cleanout, it was decided to complete a reconciliation at the end of 2024 so that the reconciliation would represent H-Vein tonnes only and provide a more accurate picture of the performance of the block model, grade control, and mill.
| 12-4 |
13.0 MINING METHODS
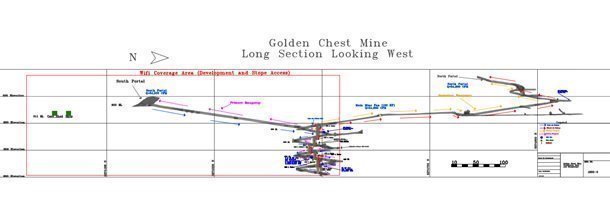
Figure 13‑1 Map Showing Golden Chest Workings Outline
13.1 Mining Operations – Underground
The entirety of modern mining at the Golden Chest has taken place in the Skookum Shoot. The Idaho Vein, within the Skookum Shoot, has been mined successfully using the Underhand Cut-and-fill method since 2015 when Juniper Mining Company leased the property. Juniper Mining Company contracted Small Mines Development (SMD) to drive the main access ramp (MAR) and to mine during the lease period.
The Golden Chest is a ramp access mine that was developed as a modern rubber-tire operation. All material is transported to the surface via two underground haul trucks and occasionally a 4.6 m3 load-haul-dump underground loader (LHD). Stope rounds are transported to bays using 1.5 m3 LHD’s. Drilling advance of stope rounds is accomplished with two Tamrock Quasar single boom jumbo drills. An electric over hydraulic twin boom jumbo drill and small section (2.7 m by 2.7 m) bolting machine are in operation to further increase operational efficiencies. The main ramp has a width and height of 4 m by 4.6 m respectively. All ventilation/secondary escape raises are mined 3 m by 3 m. Stope dimensions vary between and Idaho Vein and the H-Vein. Idaho Vein planned dimensions are 3 m high by 3 m wide, H-Vein planned dimensions are 3m high by 2.4 m wide. In some cases, portions of veins can be mined narrower. Average H-Vein stopes are 2.4 m wide.
As of December 2023, the majority of the planned underground tonnage will be mined from the H-Vein Reserve. This is the most significant change to the mine plan for this update of the report. H-Vein test mining during 2023 showed improved grades compared to the 2022 plan, and a core drilling campaign was undertaken during 2023 to provide enough detail for a mine plan to move forward. H-Vein tonnage and grade parameters can be found in the Reserve Estimates section of this report. General mine design parameters are as follows:
|
| · | Minimum stope cut-off grade to make a mining decision (go/no-go cut-off) is 3.2 gpt. |
|
| · | In-stope cut-off is 1.4 gpt. |
|
| · | Underground Yearly Production Target 2023: 40,000 ore tonnes. |
|
| · | 2 Underground crews work 7 days on and 7 days off 11 hours per day 365 days per year. |
|
| · | Mill crews work two twelve hour shifts 4 days per week year-round. |
|
| · | Attack ramp access to the orebody is a 30 m minimum distance into the Idaho Fault footwall. |
|
| · | MAR dimensions: 4 m wide by 4.6 m tall. |
|
| · | Sublevel spacing: 12 m. |
|
| · | Stope dimensions: 3 m height by (2.4m to 3m) width |
|
| · | Minimum mining width: 2.4 m |
|
| · | Ventilation drift/raise dimensions: 3 m by 3 m. |
The current reserves at the Golden Chest represent a mine life approximately 3 years of milling throughput. The H-Vein bulk sampling opportunity mentioned in the 2022 TRS report was the largest change to the mine plan in this update. Bulk sampling and core drilling of the H-Vein allowed for the increased Reserve tonnage in this report. The H-Vein still represents the closest near-term opportunity to increase overall Golden Chest Reserves. Drilling to expand the H-Vein Reserve in the near-term should be undertaken.
The Jumbo Vein structure has future potential near-surface which is part of the Open Pit Resource in the Skookum area. There is potential that some of these areas in the Jumbo vein area are economic as small underground projects as well.
13.1.1 Cut-and-fill Method, Skookum Shoot
The cut-and-fill method is the dominant mining method at the Golden Chest. Sublevels are accessed from the MAR which is designed to be at least 30 m from the Idaho Fault. Each sublevel consists of 4 stopes that are generally 3 m wide and 3 m high that are accessed via attack ramps that are oriented perpendicular to the strike of the vein being mined. The primary cut on a sublevel starts with the highest in elevation and proceeds underhand until the sublevel is mined out. To maintain stope vertical spacing an overhand cut, or pillar cut, is occasionally taken between cement rock filled (CRF) stopes (i.e., CRF above and below). The stope accesses are designed to split the strike length of the reserve block in half as nearly as possible given ramp design constraints. After a level is mined out, CRF is placed in the mined-out stope via LHD and truck and allowed to cure until sufficient strength is achieved to resume mining beneath. Each round taken has a round sample taken by miners and H-Vein faces are systematically sampled by ore control geologists. The round sample is taken by digging into the muck pile with a 2-yard mucker and sampling periodically up the muck pile face in three separate portions. Face chip samples are taken by company ore control geologists. Material routing decisions in the Idaho Vein are made by muck samples. Material routing decisions in the H-Vein are made by diluting face chip samples by the heading width.
13.1.2 Skookum Shoot Area
The entirety of the Mineral Reserve at the Golden Chest is contained within the Skookum Shoot which includes the H-Vein and Idaho Vein where mining experience and core hole sample density are high enough to define a Reserve within the Golden Chest Resource. The Idaho Vein varies in width from 1 m to 6 m in select locations. Average vein width is approximately 1.5 m. The Idaho Vein strikes 15 degrees northeast and dips 45 degrees to the west. The H-Vein varies in width from 0.3 meters to 2 meters. The average H-Vein width is approximately 0.6 m from mining experience. The strike of the H-Vein is 0-5 degrees north/northeast and dips 72-65 degrees to the west. Cut-and-fill stopes progress underhand. In areas where the vein exceeds 3.5 m in width, a second drift-and-fill cut is mined adjacent to the first cut. The first cut is jammed tight with CRF to aide in hangingwall stability.
| 13-2 |
13.2 Ground Stability
The Idaho Vein is directly associated with the Idaho Fault that bounds Units G and H of the Prichard formation at the Golden Chest. The Idaho Vein lies directly below the Idaho Fault which varies in thickness from 0.1 m to 0.5 m. The Idaho Fault and the adjacent faulted zone are a driving parameter in ground support design. Idaho Strategic Resources plans stope support standards and design considerations based on known fault thicknesses and mining experience. Each stope is designated a type and supported accordingly utilizing Swellex and Split-Set bolts of varying lengths according to ground conditions. Welded wire mesh, 2.7 m support mats, and CRF are also utilized as primary and secondary ground support depending on stope design. Bolt QA/QC consists of regular bolt pull testing to confirm manufacturer specifications and installation practice adherence. As a progressive approach to mechanize the installation of ground supports a mechanized bolter designed for openings as small as 2.7 m was purchased. This should increase employee safety and improve support installation efficiency.
The H-Vein has a competent quartzite hangingwall in most places and the steeper dip is advantageous in ground support design. The Golden Chest stope bolting standard considers the H-Vein a “Type 3” ground which is currently the most competent classification of a stope. The H-Vein is supported by Split-Set bolts and 2.7 m support mats, and welded wire mesh where necessary. Swellex bolts are used at discretion where they are deemed appropriate by the mining and technical staff.
The MAR is excavated in the competent quartzite of Prichard Unit G and effectively supported with the use of Split-Set bolts of varying lengths and Swellex inflatable bolts where necessary. The MAR utilizes welded wire mesh to increase safety on the skin of the opening. The bolter mentioned previously is also available for use in the MAR to improve employee safety and increase bolt installation efficiency.
13.2.1 Operating Practices
Idaho Strategic Resources implements the following practices to ensure that its support practices are in line with industry practices and practical knowledge gained from historic mining:
|
| · | Minimize stope mining time and fill time. |
|
| · | Maintaining a minimum distance of 30 m for the MAR for long term stability. |
|
| · | Utilize CRF and underhand method wherever possible to improve stability of individual cuts. |
|
| · | Utilization of Swellex bolts in hangingwall of stopes where bond strength is a critical parameter. |
|
| · | Proactive long Swellex support in areas with long spans to ensure long-term stability. |
|
| · | Minimize Idaho Fault exposure by leaving an ore remnant along the hangingwall in stopes. |
|
| · | Minimize Idaho Fault exposure by adherence to stope height and level design. |
The Golden Chest ground support measures are the result of extensive experience at the Golden Chest and careful planning of stope design requirements. The typical stope sizes and the utilization of underhand cut-and-fill reflect conservative, commonly accepted design principles that take into account the nature of the specific ground at the Golden Chest.
13.3 Underground Development
The Golden Chest has two portals to access underground workings. The main haulage for material out of the mine is the South Portal. The South Portal also serves as the ventilation intake. It was driven in 2015. The North Portal was driven in 2004 and serves as the mine’s ventilation exhaust.
| 13-3 |
Development openings are designed to meet equipment and ventilation requirements with potential future production in mind. All main haulage ramps have dimensions of 4 m wide by 4.6 m tall. The North Ramp is the secondary escape/ventilation exhaust and is 3 m wide by 3 m tall. It is accessible to secondary equipment via the North Portal.
13.3.1 Ground Support
Both the North and South Ramps are driven in Unit G of the Prichard formation which is a massive quartzite with favorable tunneling conditions. Ground support is carried out using Split-Set bolts and welded wire mesh. Proactive, extra-length support in the form of single run or connectable Swellex bolts is carried out at intersections and in other larger span areas to promote long-term stability.
13.3.2 Development Performance
Initial mining by IDR took advantage of completed development done by Juniper Mining Company. IDR has hired the necessary development crews and acquired the necessary equipment to complete the needed development during 2023. IDR is on track to complete development in the planned time frame for 2023.
Table 13‑2 Development by Year and Company
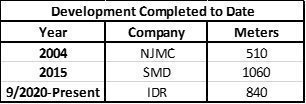
13.4 Backfill
IDR has utilized Cemented Rock Fill (CRF) at the Golden Chest to provide geotechnical stability and enable efficient extraction of the orebody. The CRF is mixed at the company’s on-site surface plant and placed underground with underground trucks and LHD’s. QA/QC of the CRF is completed on at least a daily basis and more regularly if weather conditions change. QA/QC consists of cement grout pulp density determinations by the operator using a Marcy Scale, slump cone tests, and CRF unconfined compressive strength (UCS) testing is done on site as well. The automated CRF plant allows for a consistent product with QA/QC oversight from plant operators. The UCS results of specific days are tested at 7 and 28 days and tracked to ensure long term quality for backfill. Independent UCS testing results of Golden Chest CRF have yielded similar strength results to the on-site UCS testing.
13.5 Mine Equipment
The mine equipment fleet has been expanded in the previous years to allow for expanded production. At this time there is a sufficient fleet of equipment on-site and the necessary maintenance crews to care for it. Major equipment is summarized below.
| 13-4 |
Table 13‑3 Underground Mine Equipment List, Idaho Strategic Resources—
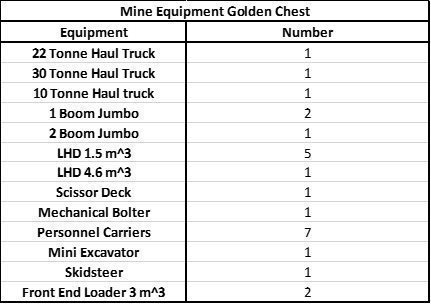
13.6 Mine Infrastructure
Mine Infrastructure is contained entirely on IDR patented mining claims at the Golden Chest. The majority of the infrastructure is immediately below the South Portal entrance to the mine. The mine infrastructure includes 500 kVA 3-phase electrical service, North and South ramps, ore bin, backfill plant, mine offices, and a mine shop. All milling infrastructure is located offsite at the New Jersey Mill in Kellogg, Idaho. An improvement to the electrical service of an additional 500 kVA to bring the total site available load to 1,000 kVA is in the planning stages and should be carried out to aid with efficient paste plant operations.
13.7 Open Pit Mining Operations
Three small open pits have been mined at the Golden Chest. There are no open pit Reserves at the Golden Chest. The largest of the mined pits was the Idaho Pit. The Idaho Pit was mined in 34 months from August 2016 to June 2020. All the material from this campaign of Golden Chest mining was shipped to the New Jersey mill in Kellogg, Idaho for processing using primarily flotation to produce a bulk sulfide concentrate that was marketed to Japan and South Korea. Occasional gold dore’ was produced from cleanouts of the ball mill liners where gold tends to collect. Mill statistics for this Idaho Pit campaign are summarized below.
Table 13‑4 Idaho Pit Summary (August 2016-June 2020)
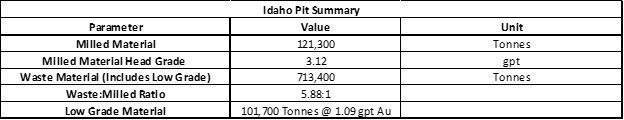
| 13-5 |
14.0 PROCESSING AND RECOVERY METHODS
The New Jersey Mill located 3 km east of Kellogg, Idaho has processed material from the Golden Chest since 2017 from both open pit and underground sources. The New Jersey Mill uses a conventional bulk sulfide flotation flowsheet utilizing crushing, grinding, flotation, and paste tailings disposal. The flowsheet is depicted below in Figure 14-1.
14.1 Crushing Circuit
Ore is delivered from the Golden Chest to the stockpile pad at the New Jersey Mill by truck and pup trailers with an average payload of 30 dry metric tonnes. The ore is stockpiled with a 3 m3 front-end loader and fed to belt feeder that conveys the material to a jaw crusher where it’s crushed to pass about 10 cm. The material is then fed to a screen equipped with 1.25 cm openings. The fine material passes into the fine ore bin and the oversize material is conveyed back to a Metso HP 100 cone crusher for further crushing. Discharge from the cone crusher is fed back onto the screen feed belt so all material discharged into the fine ore bin must pass 1.25 cm.
14.2 Grinding Circuit
Ore is discharged from the fine ore bin at a rate of about 12 tonnes per hour by a conveyor that feeds a 2.5 m by 4.0 m ball mill. Lime is added on the ball mill feed conveyor to increase the pH to 10.0 in the flotation circuit. Water and a flotation collector reagent are added to the ball mill feed. The ball mill discharges into a sump where more water is added before the slurry is pumped to a hydro-cyclone that controls the grind achieved by the ball mill. Cyclone overflow is delivered to the flotation circuit and coarse particles report to the cyclone underflow which is routed back to the ball mill for regrinding.
14.3 Flotation Circuit
Cyclone overflow is piped to a trash screen at the head end of the rougher flotation circuit. Flotation reagents including Aerofloat 208, potassium amyl xanthate, and MIBC are introduced into the rougher feed. Rougher flotation consists of a single Wemco 144 cell followed by in series by the scavenger cells which are bank of five Wemco 66D cells. All rougher concentrate and scavenger concentrate reports to the cleaner circuit which consists of two banks of three Wemco 40 cells operated in series. Concentrate from the second bank of cleaner cells is the final concentrate. The concentrate is thickened and pumped to a plate-and-frame filter where it’s dried to about 6% moisture and dropped into 2-tonne supersacks ready for delivery to copper smelters in Asia.
14.4 Tailings Circuit
Tailings from the scavenger circuit is pumped to two 4-meter diameter deep cone thickeners (DCT) operated in parallel. Flocculant is added to the feed to promote settlement of solids. The pulp density of the feed is approximately 32% solids and the underflow from the DCT’s ranges from 60% to 66% solids. Underflow is pumped using peristaltic hose pumps into the hopper of a positive displacement piston pump which generates enough pressure to deliver the paste tailings to the tailings storage facility (TSF). Clear overflow water is piped to a storage tank and recycled back through the process. Makeup water for the process is sourced from a groundwater well adjacent to the mill. The Company received a “Pollution Prevention Champion” award from the Idaho Department of Environmental Quality for its paste tailings process because of the water savings compared to conventional tailings disposal. Water is not discharged from the TSF to surface waters of the USA, but land applied to the TSF footprint.

Figure 14‑1 New Jersey Mill Flowsheet
14.5 Mill Production
Mill production and recovery for the period from 2016 through December 31, 2023, are summarized in the table below. During this period only material from the Golden Chest was processed. The material was mined from a combination of open pits and the underground mine. Approximately 67% of the mill feed was from the open pit source and the remainder from the underground.
Table 14‑1 Mill Production Summary
| Parameter | Value |
| Tonnes Processed (dry metric tonnes) | 289,370 |
| Head Grade (gpt Au) | 3.99 |
| Tailings Grade | 0.45 |
| Concentrate Grade | 262 |
| Tonnes Concentrate (dry metric tonnes) | 3,880 |
| Gold Recovery | 88.9% |
Gold recovery was lower for open pit material because the sulfides were partially oxidized which reduces recovery in the flotation circuit. The QP’s have observed that unoxidized, underground material has exhibited an average gold recovery of 93% and believe this is an appropriate recovery to use for resource and reserve calculations for underground mining.
| 14-2 |
14.6 Mill Workforce
The mill workforce is comprised of two crusher operators and six flotation operators for a total workforce of 8 individuals. The mill currently operates on a four-day week so milling capacity could be increased by adding personnel to get to a seven-day week.
| 14-3 |
15.0 INFRASTRUCTURE
The Golden Chest mining operations have been ongoing since 2012 and infrastructure at the site has been well developed to this point. Infrastructure includes a core shed, mine dry, and a shop building situated on the dump of the Old No. 3 Level. See Figure 15-1. Year-round access to the mine is provided by Forest Highway 9 which is maintained by Shoshone County. Mine water supply is provided from historic underground workings and power is provided by an overhead transmission line from Wallace.
15.1 Roads and Logistics
The Golden Chest is approximately 64 km (40 mi) from Kellogg, Idaho via paved roads maintained by the State of Idaho and Shoshone County. On site access to the mine is provided by a network of dirt and gravel roads that IDR maintains. The on-site roads are graded yearly or as necessary and designed for year-round use. Snow maintenance on site is completed by IDR staff.
15.2 Mine Layout

Figure 15‑1 Infrastructure Layout.
| 15-2 |
15.2.1 Waste Rock Storage
The Golden Chest has two areas for development rock storage. The backfill aggregate stockpile and the Rock Storage Site (RSS). The Rock Storage Site was designed for Idaho Pit waste rock and has been undergoing concurrent reclamation. Reclamation includes regrading to a 2:1 slope and revegetation with natural flora. Approximately 3,000 trees were planted on the RSS in 2022.
The backfill aggregate storage consists of underground development rock that is screened to backfilling requirements and then placed underground as CRF.
15.2.2 Tailings Disposal
Paste tailings facilities are located at the New Jersey Mill in Kellogg, Idaho. The Golden Chest was recognized in 2015 by the Idaho Department of Environmental Quality as a Pollution Prevention Champion with an associated award for the paste tailings technology. Associated details about tailings infrastructure can be found in Section 14 of this report.
15.2.3 Power
The Golden Chest is serviced by Avista grid power in an amount not to exceed 500 kVA. This supply is sufficient for current operations and some mining expansion but would need to be increased to expand production if future reserves justified an on-site milling operation. The addition of another 500 kVA available load is in the planning stage.
| 15-3 |
16.0 MARKET STUDIES
16.1 Market Overview
The Golden Chest ore is milled at the New Jersey Mill in Kellogg, Idaho to produce a bulk-sulfide flotation concentrate which is primarily composed of iron sulfide (pyrite). The flotation concentrate usually contains about 250 gpt gold and 80 gpt silver, and the Company is paid for both metals, though silver is a minor component of sales. On occasion the ball mill will be cleaned out and a gold-gravity concentrate will be reduced to a dore’ bullion and sold to a US-based gold refinery.
The annual global gold supply is about 160 million ounces, so the Company is a minor producer of gold. The Company’s flotation concentrate is typically shipped to copper smelters in Asia where the pyrite helps fuel the smelting process and is also desirable because of its high gold content. Most marketing effort is spent finding a smelter that finds the concentrate suitable for its process and will buy it. The Company has contracted with a concentrate broker, H&H Metals Corp., to facilitate the marketing of its flotation concentrate since 2016.
16.2 Commodity Price Projections
The Company uses a trailing three-year average gold price to calculate Mineral Reserves and Resources. For the Mineral Reserves and Resources at the year ending December 31, 2023, the Company used a gold price of $1,850 per troy ounce. Silver is ignored in the reserve calculations. The Company’s QP’s believe the use of a three-year trailing average gold price is reasonable for the 2023 Mineral Reserves and Resources given current world economic trends and gold market fundamentals.
16.3 Contracts
As mentioned above, a concentrate broker, H&H Metals Corp. (H&H), is contracted with the Company to facilitate concentrate sales to smelters in Asia, primarily. H&H is an unaffiliated party and provides a provisional payment equal to 90% of the expected net smelter return once 10 wet metric tonnes of concentrate are produced and sampled. A final settlement is made once the concentrate has been delivered to the smelter, sampled, and assays have been traded between the parties. The H&H contract deducts fees for treatment charges, refining fees, transportation, and sampling costs. Additionally, penalties may be assessed for lead and zinc over 2% individually, and excessive moisture greater than 10%.
On occasion, the Company may enter hedging contracts to lock in the gold price on flotation concentrate produced and for which it has received a provisional payment. H&H provides the hedging as part of their service to the Company.
IDR employees perform the mining and mill duties, but the Company also contracts with a local general contractor for ore haulage to the New Jersey mill, and other associated earthwork. This contracted work is usually performed for an hourly rate competitive with local market conditions.
17.0 ENVIRONMENTAL STUDIES, PERMITTING, AND PLANS, NEGOTIATIONS, OR AGREEMENTS WITH LOCAL INDIVIDUALS OR GROUPS
17.1 Environmental Studies and Permitting
The Golden Chest Mine and New Jersey Mill are both located on private land and although no comprehensive baseline environmental impact study has been completed, all the required permits to operate have been obtained and are detailed below. Each permit application addresses the potential environmental impact of the operation, has plans for monitoring, and presents a reclamation or closure plan. A summary of the permits held by the Company for mining at the Golden Chest are summarized in the table below.
Table 17‑1 Environmental Permits
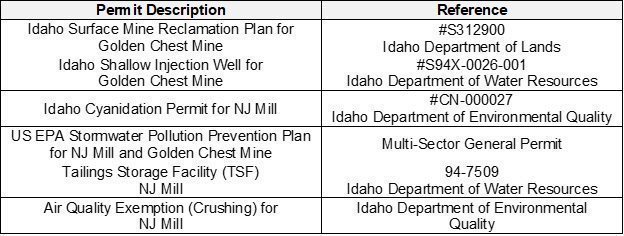
17.2 Surface Mine Permit
The Golden Chest has a surface mining permit and reclamation plan from the Idaho Department of Lands (IDL) to allow operating an open pit mine. The plan presents a design for a rock storage site, addresses open pit slope stability, water monitoring activity, and Best Management Practices (BMP’s) to control runoff and mitigate the impact of the surface mining operation. The reclamation plan includes re-sloping the waste rock site to a 2 to 1 slope, placing a topsoil cover and reseeding. Mitigation plans for potential acid rock drainage are also included and a post-closure monitoring period of five years is part of the plan. A cash bond of $103,000 which is the estimated reclamation cost was posted with IDL. Water is monitored for pH and metals at five different surface monitoring sites on a quarterly basis under a Quality Assurance Project Plan (QAPP) and results are submitted to the Idaho Department of Environmental Quality (IDEQ).
Surface disturbance associated with the underground mine is permitted under the surface mining plan and discharge water from the underground is land applied under an exemption from permitting by the IDEQ or pumped to the shallow injection well site permitted with the Idaho Department of Water Resources (IDWR).
17.3 Tailings Storage Facility (TSF) Permit
The New Jersey Mill utilizes a unique tailings disposal technique known as paste tailing disposal which recycles process water and minimizes water stored in the TSF by thickening tailings and discharging to the TSF at high pulp densities. This greatly simplifies the permitting as there is no discharge of water to surface waters of the US.
An engineered plan for the expansion of the existing New Jersey Mill TSF was completed by a third-party engineering firm and submitted to the Idaho Department of Water Resources (IDWR) in 2021. IDWR approved the plans for construction in 2022. The TSF expansion plan has a downstream buttress to increase post-earthquake stability and creates enough storage volume for at least two more years of operations. A cash bond of $117,000 was posted with the IDWR which is the estimated reclamation cost. A post closure plan calls for capping the tailings with clean fill and seeding with grass and conifer trees. A five-year post closure monitoring period is part of the TSF expansion plan.
17.4 Cyanidation Permit
The New Jersey Mill holds an Idaho cyanidation permit from the IDEQ that was originally planned for a concentrate leach circuit. Approximately 130 tonnes of concentrate were leached before the Company decided to submit a closure plan to the IDEQ since the process was deemed unnecessary. Estimated closure costs related to the cyanidation plan are $25,000 which was posted with the IDEQ in the form of a certificate of deposit. The closure plan is currently under review by the IDEQ and a water monitoring program that includes monitoring three groundwater wells and three surface water sites will continue for five years past the closure date of the TSF.
17.5 Stormwater Permits
Both the mine and the mill hold US EPA Multi-Sector General Stormwater Permits. A series of BMP’s such as straw wattles, silt fences, sumps, and ditches are used to mitigate erosion and the impact of stormwater runoff from the mine and mill. BMP’s are monitored quarterly concurrent with water sampling.
17.6 Community and Social Aspects
As stated on the Company’s website, “Idaho Strategic Resources’ corporate philosophy is a direct reflection of the personal motivations and individual belief systems of our employees and preferred contractors. We live, work, and raise families in the extended communities where we operate, thus we have a deep-seated desire to protect our neighborhoods and environment for future generations. We are committed to preserving the best elements of our history while remaining open to opportunities to restore and protect our environment. Idaho Strategic Resources promotes a policy of “We Live Here” when it comes to relationships with the community.” The Company’s hiring practice of employing local employees where a low turnover rate is observed and procuring supplies and services from local vendors demonstrates the Company’s commitment to the local community in the opinion of the QP.
17.7 Comments on Environmental Permitting and Monitoring
The QP’s believe the Company’s operations are adequate and in compliance with the appropriate environmental regulations. Current permitting and monitoring tasks are handled by the engineering and geology staff. The scope of operations has increased enough that hiring an environmental professional is recommended. Another QP recommendation would be to drill at least three groundwater monitoring wells at the Golden Chest so that the mine’s potential impact on groundwater can be monitored.
| 17-2 |
18.0 CAPITAL AND OPERATING COSTS
18.1 Capital Costs
Capital costs for the Golden Chest are comprised of development costs for the Main Access Ramp (MAR), capital for mining equipment, and mill capital. All dollar amounts are presented in U.S. dollars (USD).
This development consists of MAR meterage/tonnage, attack ramp meterage/tonnage, ventilation raise meterage/tonnage, and ancillary development meterage/tonnage (sumps, muck bays, laydown cut outs and other ancillary excavations). If specific equipment or infrastructure is required to reach a stope block, then it is included in the capital for that specific block. Development costs for the 2023 Reserve are shown below, they are organized by the year that they are scheduled to take place. Attack ramp costs are included in the table below although only the MAR costs are capitalized. Development costs shown below are used to evaluate the cash flow of each Reserve block
Table 18‑1 Development Cost Estimates Associated with Reserves
2023 Golden Chest Reserve Development Costs
|
| Total | Unit | Year 1 | Year 2 | Year 3 |
| MAR Tonnes | 28,389 | Tonnes | 13,626 | 14,762 | 0 |
| Attack Ramp Tonnes | 71,655 | Tonnes | 16,302 | 24,995 | 30,358 |
| MAR Cost | $1,476,210 | USD | $708,561 | $767,649 | $0 |
| Attack Ramp Cost | $3,726,049 | USD | $847,709 | $1,299,742 | $1,578,598 |
Capital costs are estimated based on the long-range design necessary to develop the entire 2023 Reserve. The development costs are derived from actual costs from mining and are considered to be within plus or minus (+/-) 15%.
Some development may have already occurred, and some levels may be left idle depending on management’s mining decisions. The purpose of attributing development costs to the reserve block is to illustrate the economic prospects of the reserve block to pay back its attributable development.
Mine capital costs are estimated at $100,000 per month based on current equipment demands for the first two years of the schedule. The required equipment to develop the 2023 Reserve is in place and the $100,000 per month represents sustaining capital. This approach is conservative in that it assumes that no new reserve tonnes are identified, although new reserves have been identified in prior years.
Mill capital costs are estimated to be $100,000 per month for this plan.
The final year of the schedule does not include any sustaining capital. The 2023 Reserve block will have been fully developed and the remainder of the mining would be the remnants of the Idaho Vein and the remainder of the H-Vein reserve, if new reserves are not identified.
18.2 Operating Costs
Operating costs used for the definition of reserves at year end 2023 are based on the previous year’s calculated costs per tonne with adjustments for the projected year’s mill feed source. Operating costs for the Golden Chest are based on actual cost information from the mining operation and represent accuracies of +/-15%. A table of operating costs is shown below.
Table 18‑2 2023 Annual Costs per Tonne and Mine Planning/Reserve Costs Used.
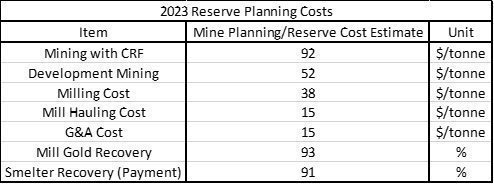
| 18-2 |
19.0 ECONOMIC ANALYSIS
19.1 Economic Criteria
Underground Mineral Reserves represent approximately 3 years of mill feed at the New Jersey Mill. Idaho Strategic Resources prefers this conservative approach to reserve estimation due to the nature of narrow vein mining. Additional Reserves may or may not be defined by future mining and drilling operations. For the purpose of this economic analysis only the currently defined Reserves are included. The 2023 Reserve was evaluated on a yearly basis including estimated capital costs for economic viability.
19.1.1 Physicals
|
| · | Total mill feed processed: 127,477 tonnes |
|
| · | Average processing rate: 185 tonnes per shift |
Table 19‑1 Underground Reserve Scenario Production Summary
| Commodity | Head Grade (gpt) | Mill % Recovery | Mill Recovered Au Troy Oz. |
| Au | 6.74 | 93 | 25,690 |
19.1.2 Estimation Parameters
|
| · | Gold price used in the economic analysis is a constant $1850 per troy ounce representing a 3-year trailing average (2023,2022,2021). |
|
| · | Constant smelter payment factor of 91% |
|
| · | Constant Net of Smelter Royalty (NSR) of 2% |
|
| · | Constant Ore haulage cost of $15.00 per tonne |
|
| · | Constant milling cost of $38.00 per tonne |
|
| · | Constant ore mining with fill of $92.00 per tonne |
|
| · | Constant G&A cost of $15.00 per tonne |
|
| · | Constant development cost of $52.00 per tonne |
|
| · | Reserve life of three years |
|
| · | Capital costs of $6,276,000 for the three-year period including ramp development, and sustaining capital. |
19.1.3 Taxation and Royalties
Idaho Strategic Resources pays property tax in Shoshone County and occasionally a Net Profit Tax to Shoshone County. No income tax is anticipated to be payable in the next year. Idaho Strategic will use existing net operating loss carry forwards to generate zero annual taxable income through the next three years.
The current production zone is subject to a 2% NSR royalty payable to Calibre Mining Corp. which is included in the estimate. Property taxes and net profit taxes paid to Shoshone County are minor compared to the 2% NSR and are neglected in this analysis.
19.2 Cash Flow Analysis
Cash flow analysis of the Golden Chest Mineral Reserves is presented below. The cash flow considers mill feed, grade, and tonnes, as well as associated operating and capital costs discussed in previous sections. A 10% discount rate was applied for a net present value (NPV) analysis. A 10% discount rate was chosen as the company feels that this is an appropriate discount rate given the inherent uncertainty of any underground mining operation.
The results of this analysis indicate a positive cash flow of approximately $14,200,000 over 3 years at the base case. Capital requirements are paid within the year and the positive cash flow indicates economic viability at the base case $1850 per troy ounce gold price. The NPV at a 10% discount rate is approximately $12,300,000 over the three-year project period.
Table 19‑2 Table of Golden Chest Underground Reserve Cash Flows
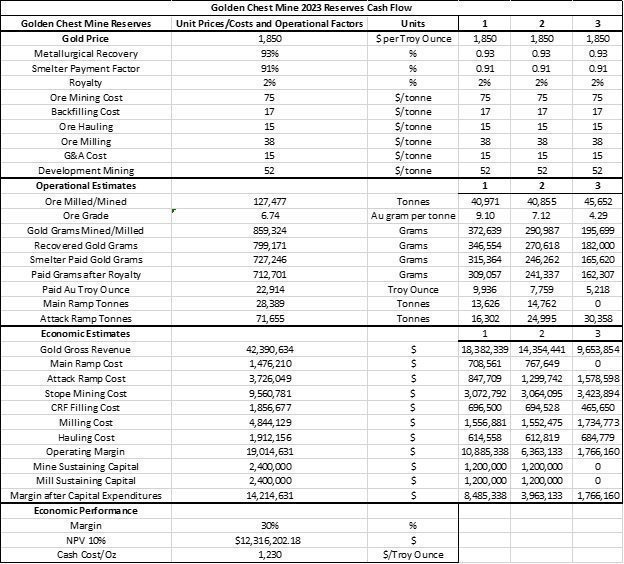
| 19-2 |
19.3 Sensitivity Analysis
The Golden Chest underground reserve’s annual cash flow was evaluated for its sensitivity to the following variables.
|
| · | Metal grade |
|
| · | Metal recovery |
|
| · | Metal price |
|
| · | Operating costs |
|
| · | Capital costs |
Figure 19‑1 Sensitivity Analysis of Golden Chest Underground Reserves
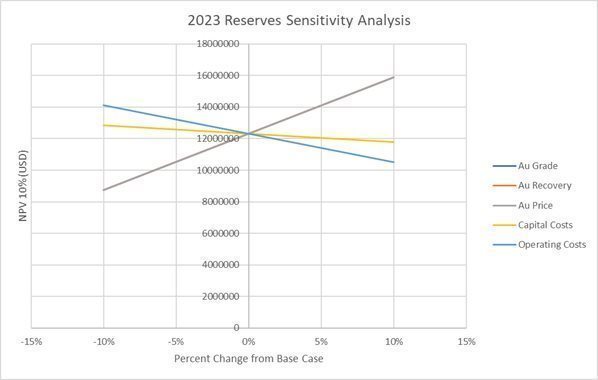
All relationships between a single variable and the cash flow are linear and can be interpolated further to estimate further variances from the base case.
The sensitivity analysis illustrates a commonly found sensitivity to metal prices and recoveries. Milling recovery, smelter payment, grade, and gold price show an exact relationship with each other, and are the most sensitive variables in the estimate. The operating costs are the second most sensitive variable.
| 19-3 |
20.0 ADJACENT PROPERTIES
Like other long lived mining districts, there are abundant patented and unpatented claims in the area. Two notable, large claim groups; the Mother Lode and Butte Gulch, are immediately adjacent to the mine. IDR patented and unpatented land, adjacent patented land and historic mining prospects are shown in Figure 20-1.
The Mother Lode claim block consists of 6 patented claims and 26 unpatented claims. The claim block is currently owned by Mother Lode Gold Mines, Inc. (William Campbell, Spokane, Washington, USA). The Mother Lode claim block lies on the south side of Prichard Creek, and to the southwest of the mine. When Newmont Exploration Limited was exploring at the Golden Chest (1987-1990), they had extended their mine boundary to include the Mother Lode property due to it containing similar geology. Some drilling was completed before the Mother Lode was returned to its owner. Total historical gold production from the Mother Lode mine is unknown, but is probably greater than 25,000 oz (Shenon, 1938). Most of this production occurred before 1917.
The Butte Gulch patented claim group adjoins the east side of the mine. The Butte Gulch property was part of the Golden Chest land package until the early 1990’s, when it was divided. In 2019, IDR purchased the mineral rights to the Butte Gulch patented claim group. The surface rights of the Butte Gulch property are owned by Bell Run Properties LLC (Thomas Lanager, Curwensville, PA, USA). Butte Gulch was placer mined during the original Murray gold rush and has been reworked several times since, with the latest work occurring in the 2020’s.
| 20-4 |
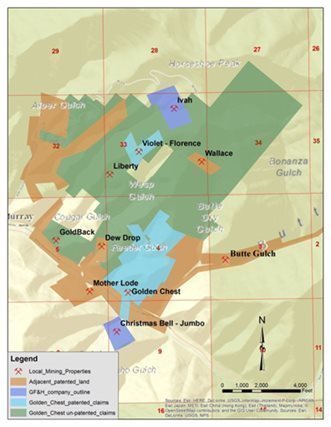
Figure 20‑1 Map of Adjacent Properties
| 20-5 |
21.0 OTHER RELEVANT DATA AND INFORMATION
No additional information or explanation is necessary to make this TRS understandable and not misleading.
22.0 INTERPRETATION AND CONCLUSIONS
The QP’s offer the following interpretations and conclusions by area.
22.1 Geology and Mineral Resources
|
| · | The Company has completed a Mineral Resource Estimate for the year ending December 31, 2023 and the QP’s have reviewed the estimate and find it to be consistent SK-1300. Measured and Indicated Resources at the Golden Chest Mine total 1,072,155 tonnes at a grade of 4.04 gpt gold with Inferred resources totaling 743,793 tonnes at a grade of 3.23 gpt gold. The Mineral Resources are exclusive of the Mineral Reserves. |
|
| · | Core sampling is supervised by professional geologist and sampling procedures meet industry best practices. |
|
| · | The sample preparation, security, and analytical procedures for core samples were consistent with generally accepted industry best practices. |
|
| · | The QA/QC procedures for core samples are consistent with generally accepted industry standards. However, a persistent, low bias in assay results was found in the 3 gpt standard. |
|
| · | Blanks and standards are not currently included with round samples from the stope rounds. Blanks and standards should be included with round samples on a weekly basis. |
|
| · | The QP’s review of database validation yielded no deficient procedures or data. The sample database is valid for reserve and resource calculations. |
22.2 Mining and Mineral Reserves
|
| · | The Mineral Reserve estimate of has been reviewed by the QP’s and found to be in accordance with the definitions for Mineral Reserves in S-K 1300. Mineral Reserves at December 31, 2023 are 127,477 tonnes at an average grade of 6.74 gpt gold using a gold price of $1,850 per troy ounce. |
|
| · | The Mineral Reserves are all within the Skookum Shoot area on the H-Vein and the Idaho Vein near existing infrastructure and near previously mined areas where sample data is dense enough for Proven and Probable classification. The H-Vein makes up the majority of the Mineral Reserves. |
|
| · | Mineral Reserves are prepared by qualified personnel with appropriate supervision using industry-standard mining software. |
|
| · | The QP’s believe the use of a trailing three-year average gold price is appropriate and consistent with generally accepted practices within the mining industry. |
|
| · | The mining methods at the Golden Chest are underhand cut-and-fill utilizing cemented rock fill (CRF) and overhand cut-and-fill using gob (waste) fill where appropriate in the stopes. |
|
| · | The mining method is appropriate for this type of vein deposit and the ground conditions with minimum widths of 2.5 m and an average stope width of 3.0 m. |
|
| · | The Mineral Reserve is based on the underhand cut-and-fill, and the overhand cut-and-fill mining methods. |
|
| · | Block model versus round sample reconciliation shows the block model accurately predicts gold grade within 2%. Another reconciliation of the block model versus the mill feed should completed once mill feed is straight H-Vein ore. |
|
| · | Dilution is accounted for in the Mineral Reserve estimate and extraction is assumed to be 100%. |
|
| · | The ground support plan with the use of Swellex-bolts in conjunction with CRF has improved geotechnical stope stability. |
|
| · | The mine uses 1.5 m3 rubber-tired LHDs along with diesel-hydraulic drill jumbos and a 22-tonne underground dump truck. |
|
| · | Life-of-mine (LOM) plans should be completed. Mining equipment, infrastructure, and mineral processing requirements could be determined once an LOM plan is completed. |
22.3 Mineral Processing
|
| · | Material is shipped from the Golden Chest Mine in Murray, Idaho to the New Jersey Mill in Kellogg, Idaho for processing using highway dump trucks with pups. |
|
| · | The New Jersey Mill operates as a bulk flotation plant at a rate of approximately 40,000 tonnes per year to produce a bulk-sulfide concentrate for sale to copper smelters in Asia. |
|
| · | The mill has processed nearly 289,370 tonnes of material from the Golden Chest open pit and underground and achieved gold recovery of 88.9% with an average concentrate grade of 262 gpt gold. |
|
| · | The mill has achieved higher gold recovery of 93% for straight underground material, the Idaho and H-Veins. This is an appropriate gold recovery to use for underground Mineral Reserve estimates. |
|
| · | Previous campaigns of processing material from the Golden Chest at the 100 tpd New Jersey Milling from 2005 to 2009 provided metallurgical testing information at a bulk-sample scale. |
|
| · | RDI performed metallurgical testing evaluating gravity, flotation, and cyanidation processes using core samples from the Skookum Shoot. |
|
| · | The New Jersey Mill utilizes the novel process of paste tailings disposal and recycles process water to minimize its impact on the environment. |
22.4 Infrastructure
|
| · | The Golden Chest Mine is accessible all year round via a paved highway known as Forest Highway 9 and has all the necessary infrastructure to mine at the current rate. |
|
| · | An increase in the current mining rate would require an upgrade to the electrical power line to the mine. |
22.5 Environment
|
| · | The Golden Chest Mine and New Jersey Mill have all the necessary environmental permits to operate. |
|
| · | The Company has posted bonds to cover the cost of reclamation at both the Golden Chest and New Jersey Mill. |
|
| · | The Company promotes a “We Live Here” philosophy which encourages a commitment to the environment because employees and management all live and recreate in the local area. Local hiring and buying are also encouraged under this philosophy. |
| 22-2 |
23.0 RECOMMENDATIONS
The QP’s offer the following recommendations by area.
23.1 Geology and Mineral Resources
|
| 1. | The 3 gpt standard assays should be investigated to determine if a cause for the low bias can be found. |
|
| 2. | Blanks and standards should be included with the round samples on a weekly basis. |
|
| 3. | Follow-up or closeout assays around a vein intercept should be checked on a regular basis that they have been added to the sample database to avoid inaccuracies in compositing. |
23.2 Mining and Mineral Reserves
|
| 1. | Complete a reconciliation of mill tonnes and grade to the block model once a full year of H-Vein processing only H-Vein ore has been completed. |
|
| 2. | Evaluate other geostatistical methods such as Kriging and try to optimize grade estimation. |
|
| 3. | Complete the construction of a paste backfill system for the potential to reduce operating costs. |
|
| 4. | Attempt to expand Mineral Resources and Reserves with more core drilling targeting the H-Vein and Klondike. |
23.3 Mineral Processing
|
| 1. | Hire a metallurgical consultant to perform a plant audit of the mill to help optimize operational parameters to maximize net smelter return. |
|
| 2. | Complete a laboratory flotation testing program using H-Vein ore to optimize metallurgical performance at the New Jersey Mill. |
23.4 Infrastructure
|
| 1. | Complete the electrical power expansion from 500 kVA to 1,000 kVA at the Golden Chest Mine so sufficient power is available for paste plant operation and mine expansion. |
24.0 REFERENCES
Ash, C., and Alldrick, D., 1996: Au-quartz Veins, in Selected British Columbia Mineral Deposit Profiles, Volume 2 - Metallic Deposits, Lefebure, D.V. and Hõy, T, Editors, British Columbia Ministry of Employment and Investment, Open File 1996-13, pages 53-56.
Brown, Alexander, 2019, The Geology and Geochemistry of the Golden Chest Gold Deposit, Murray, Idaho: unpublished Master Thesis, Montana Tech, Butte, MT, 135 p
Chavez, J., 1990, Newmont Exploration Limited, Golden Chest Mine: Exploration Summary.
Cressman, E.R., 1989, Reconnaissance Stratigraphy of Prichard Formation (Middle Proterozoic) and the Early Development of the Belt Basin, Washington, Idaho, and Montana. U.S. Geological Survey Professional Paper 1490, 80 p.
Gammons, C., 2009. Professor, Dept. of Geological Engineering. Montana Tech of The University of Montana. E-mail communication.
Goldbarb, R.J., Baker, Timothy, Dubé, Benoît, Groves, D.I., Hart, C.J.R., and Gosselin, Patrice, 2005, Distribution, Character, and Genesis of Gold Deposits in Metamorphic Terrances: Economic Geology 100th Anniversary Volume, pp. 407-450
Gott, G.B., and Cathrall, J.B., 1980, Geochemical-Exploration Studies in the Coeur d’Alene District, Idaho and Montana: U.S. Geological Survey Professional Paper 1116, 63 p.
Groves, D.I., Goldfarb, R.J., Gebre-Mariam, M., Hagemann, S.G., and Robert, F., 1998, Orogenic gold deposits: A proposed classification in the context of their crustal distribution and relationship to other gold deposit types: Ore Geology Reviews 13, p.7-27, published by Elsevier Science B.V.
Hart, C.J.R., 2005, Classifying, Distinguishing and Exploring for Intrusion‐Related Gold Systems. Canadian Institute of Mining – Geological Society “The Gangue” Issue 87, October 2005.
Hausen, 1987, Newmont Golden Chest petrographic work, private report.
Hershey, O. H., 1916, Origin and distribution of ore in the Coeur d’Alene: Mineral Science Press, book 21, shelf, 7.
Hobbs, S.W., Griggs, A.B., Wallace, R.E., and Campbell, A.B., 1965, Geology of the Coeur d’ Alene district, Shoshone County, Idaho: U.S. Geological Survey Professional Paper 478, 139 p.
Hosterman, J.W., 1956, Geology of the Murray Area, Shoshone County, Idaho: U.S. Geological Survey Bulletin 1027-P, p. 725-748.
Idaho State University, 2017, Digital Geology of Idaho: http://geology.isu.edu/Digital_Geology_Idaho/
Keenan, Chester, J., 1916, Preliminary Report, May 5, 1916. unpublished report.
Lewis, R.S., T.H. Kiilsgaard, E.H. Bennett, and W.E. Hall, 1987, Lithologic and chemical characteristics of the central and southeastern part of the southern lobe of the Idaho Batholith, in T.B. Vallier and H.C. Brooks, editors, Geology of the Blue Mountains Region of Oregon, Idaho, and Washington: The Idaho Batholith and its Border Zone: US Geological Survey Professional Paper 1436, p. 151-196.
Lindgren, W., 1933. Mineral Deposits. McGraw Hill, New York and London, 930 p.
Marvin, R.F., Zartman, R.E., Obradovich, J.D., and Harrison, J.E., 1984, Geochronometric and lead isotope data on samples from the Wallace 1 x 2 quadrangle, Montana and Idaho: U.S. Geological Survey Miscellaneous Field Studies Map MF-1354-G, 1 plate.
McLachin, R., 2016, Geological Society of America (GSA) poster at 68th annual meeting, GSA Rocky Mountain Section, Moscow, Idaho, May, 2016. https://gsa.confex.com/gsa/2016RM/webprogram/Paper276190.html.
Mitchell, V.E., Reed, S.L., and Larsen, J, 2021, Digital Geology of Idaho website, https://digitalgeology.aws.cose.isu.edu/Digital_Geology_Idaho/Module7/mod7.htm
Mulholland, P., 2015, Juniper Mining Company, , final Mine report.
Murahwi, C., San Martin, A. J., and Gowans, R., 2011: Technical Report on the Initial Resource Estimate for the Golden Chest Property, Idaho, United States, effective date December 31, 2011.
Murahwi, C., San Martin, A. J., and Gowans, R., 2012: Golden Chest Property, Idaho, United States 43-101F1 Technical Report, effective date December 31, 2012.
Pertzel, B., 2017, Intrusion-related Gold Systems. Pertzel, Tahan & Associates PTY http://www.mrt.tas.gov.au/mrtdoc/tasxplor/download/14_6803/EL402008_201312_03_Appendix.pdf.
Randall, T., 2014, Metallurgical Testing of Juniper Samples, Golden Chest Mine-Idaho. Resource Development Incorporated (RDI), Wheat Ridge, CO.
Ross, Katherina, 2010, in Rhys, David, 2010, Review of structural setting and potential of gold prospects on the Toboggan Mine, Idaho. Newmont Exploration private report
Rowe, J.E., 1908, The Coeur d’Alene Mining District, Idaho, The Mining World, December 5, 1908.
Ransome, Frederick L. and Calkins, Frank C., 1908, Geology and Ore Deposits of the Coeur d ’Alene District, Idaho, USGS Professional Paper 62.
Schalck, D.K., 1989, The geology and alteration of the Gem stocks, Shoshone County, Idaho, in V.E. Chamberlain, R.M. Breckenridge, and Bill Bonichsen, editors, Guidebook to the Geology of Northern and Western Idaho and Surrounding Area: Idaho Geological Survey Bulletin 28, p. 125-135.
Shenon, P.J., 1938, Geology and Ore Deposits Near Murray, Idaho. Idaho Bureau of Mines and Geology Pamphlet 47, 44 p.
Sillitoe, R.H. 1991, Intrusion-related gold deposits. In: Foster, R.P. (ed.), Metallogeny and Exploration of Gold. Blackie and Sons, Glasgow, p. 165-209.
| 24-2 |
25.0 RELIANCE ON INFORMATION PROVIDED BY THE REGISTRANT
This TRS has been prepared by the QP’s for IDR. The QP’s are employees of IDR, and they are Grant A. Brackebusch, P.E. (Vice President – Operations), Robert J. Morgan, PG PLS (Vice President – Exploration), and Andrew A. Brackebusch, P.E. (Mine Engineer).
The information, conclusions, opinions, and estimates contained herein are based on
|
| · | Information available to the QP’s at the time of the writing of this TRS, |
|
| · | Assumptions, conditions, and qualifications as set forth in this TRS, |
|
| · | And data, reports provided by IDR and third-party sources. |
The QP’s relied on information provided by IDR’s legal counsel regarding the mineral rights on the Joe Dandy patented claim. The QP’s consider this reasonable as the legal counsel is an attorney with experience with mining law.
The QP’s relied on tax information from the Company’s tax accountant regarding the size of a tax loss carryover for the Company so that taxes can be ignored on the economic analysis of Mineral Reserves. The QP’s consider this reasonable at the tax accountant has experience in tax preparation.
The QP’s believe they have taken the steps, in their professional opinion, to assure the information used to prepare this report is valid.
26.0 DATE AND SIGNATURE PAGE
This report titled “Technical Report Summary on the Golden Chest Mine, Idaho” with an effective date of December 31, 2023, was prepared and signed by:
Grant A. Brackebusch, P.E.
Vice President - Operations, Idaho Strategic Resources, Inc.
Dated: March 22, 2024
Robert J. Morgan, PG, PLS
Vice President – Exploration, Idaho Strategic Resources, Inc.
Dated: March 22, 2024
Andrew A. Brackebusch, P.E.
Mine Engineer—Golden Chest Mine, Idaho Strategic Resources, Inc.
Dated: March 22, 2024

27.0 Appendix 1 General Statistics and Histograms for All Domains
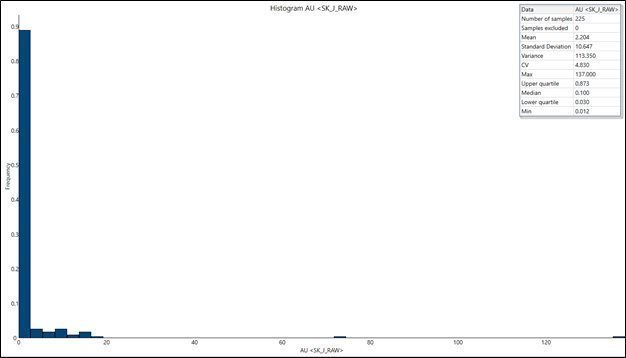
Figure 27‑1 Skookum Area Jumbo Vein Histogram and Raw Statistics

Figure 27‑2 Skookum Area H Vein Histogram and Raw Statistics
| 27-2 |
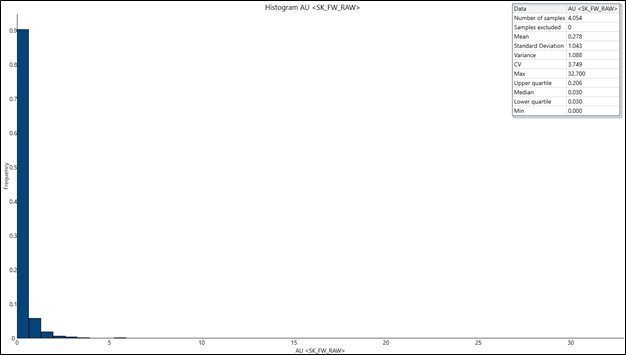
Figure 27‑3 Skookum Area Footwall Quartzite Histogram and Raw Statistics
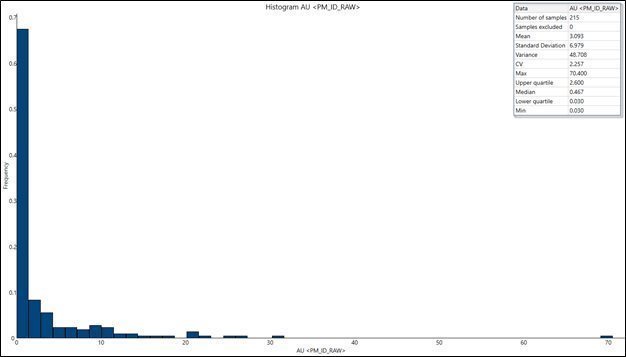
Figure 27‑4 Paymaster Area Idaho Vein Histogram and Raw Statistics
| 27-3 |
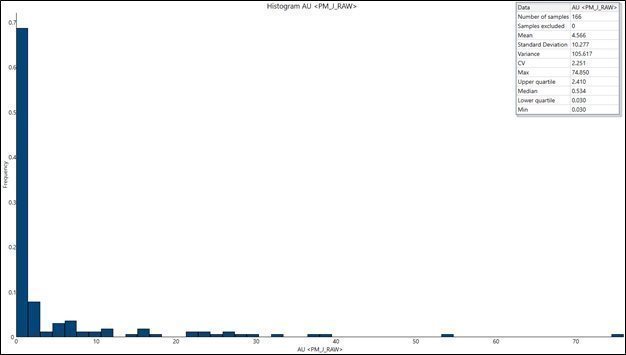
Figure 27‑5 Paymaster Area Jumbo Vein Histogram and Raw Statistics
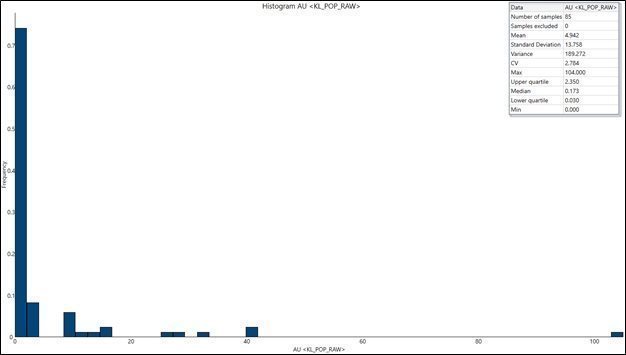
Figure 27‑6 Klondike Area Popcorn Vein Histogram and Raw Statistics
| 27-4 |
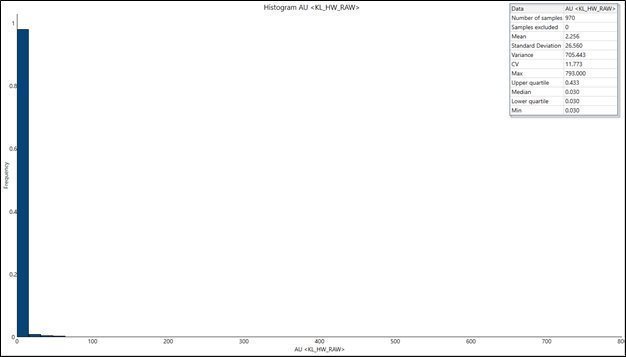
Figure 27‑7 Klondike Area Hangingwall Histogram and Raw Statistics
| 27-5 |
28.0 Appendix 2 Variography for Golden Chest Domains
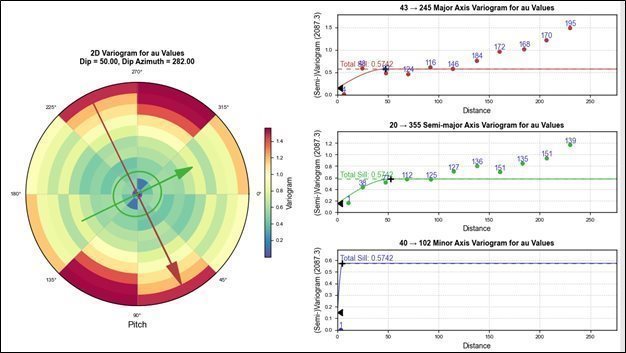
Figure 28‑1 Skookum Area Jumbo Vein Experimental Variogram with Modeled Variogram
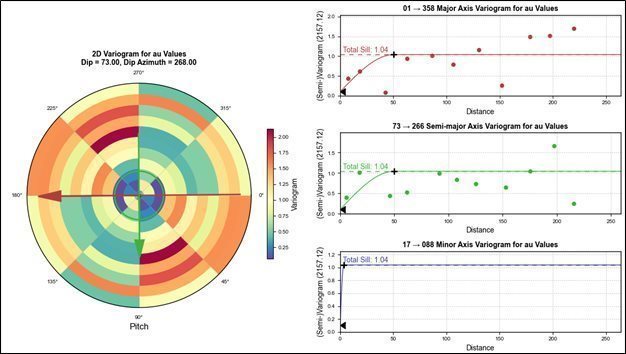
Figure 28‑2 Skookum Area H Vein Experimental Variogram with Modeled Variogram
| 28-6 |
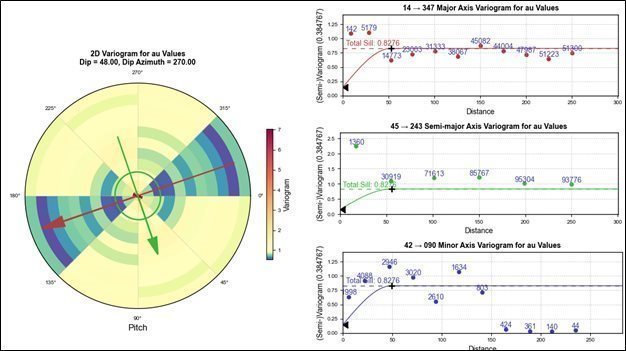
Figure 28‑3 Skookum Zone Footwall Domain Experimental Variogram and Modeled Variogram
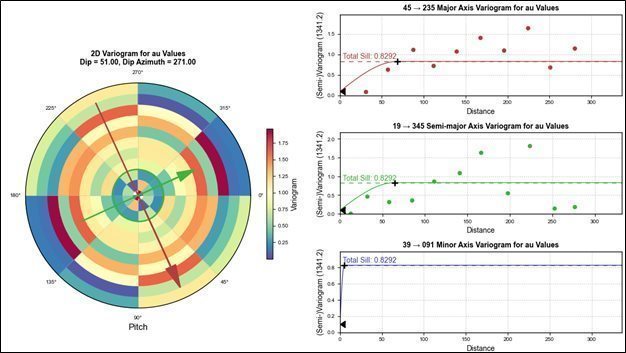
Figure 28‑4 Paymaster Area Idaho Vein Experimental Variogram with Modeled Variogrom
| 28-7 |
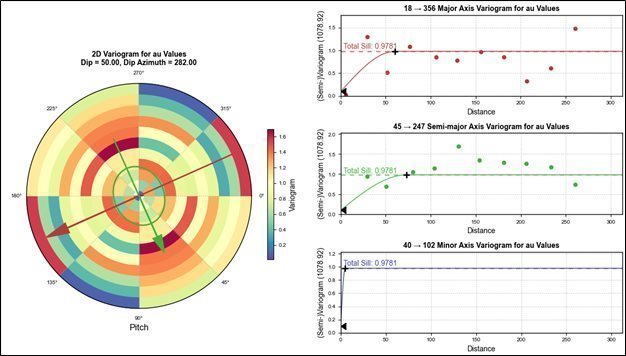
Figure 28‑5 Paymaster Area Jumbo Vein Experimental Variogram with Modeled Variogram
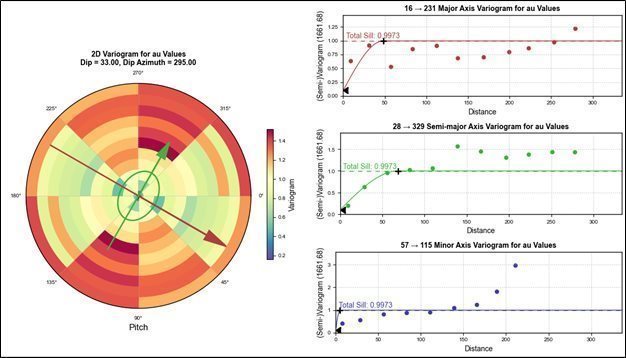
Figure 28‑6 Klondike Hangingwall Experimental Variogram with Modeled Variogram
| 28-8 |
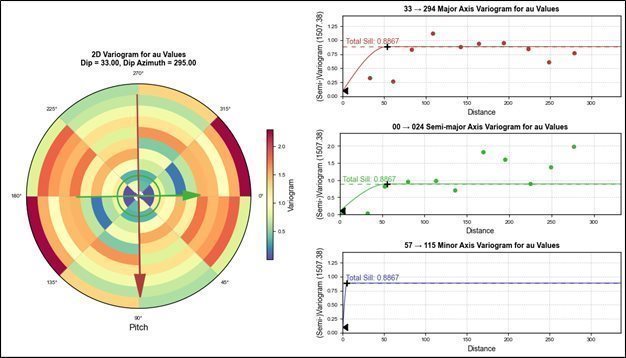
Figure 28‑7 Klondike Zone Popcorn Vein Experimental Variogram with Modeled Variogram
| 28-9 |
29.0 Appendix 3 Grade Tonnage Curves for Each Zone
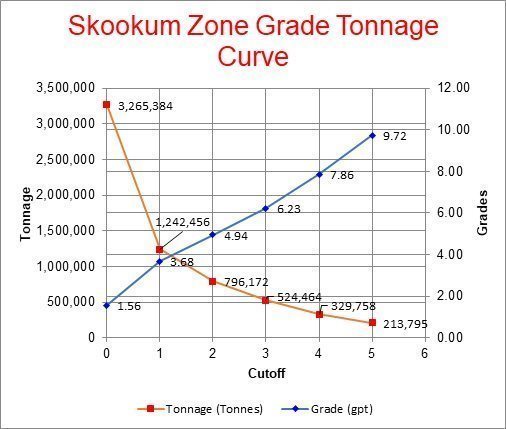
Figure 29‑1 Grade Tonne Curve for the Skookum Zone Resource and Reserve Combined
Note: Only Mined areas excluded from the shape. The cutoffs on this curve do not correlate to Reserve or Resource cutoffs. These cutoffs represent the total material available in the remaining vein shapes above a certain cutoff value. The Reserve and Resource use various cutoffs based on mining method and location. The H-Vein tonnes above a given cutoff in this curve are not diluted to a minimum mining width and represent only H-Vein tonnes above a certain cutoff.
| 29-10 |
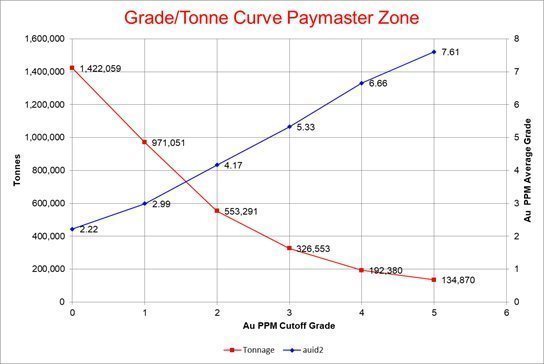
Figure 29‑2 Grade Tonne Curve for the Paymaster Zone Resource
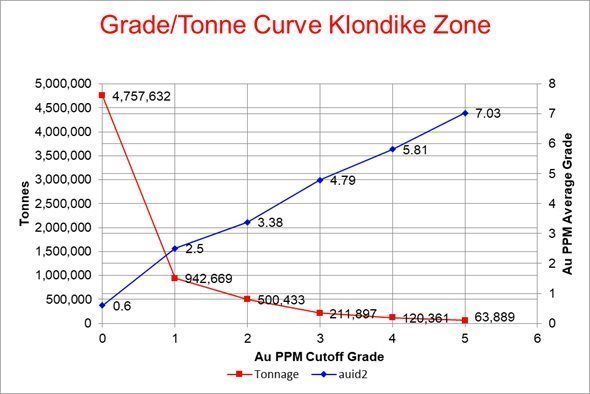
Figure 29‑3 Grade Tonne Curve for the Klondike Zone Resource
| 29-11 |
EXHIBIT 97.1
IDAHO STRATEGIC RESOURCES, INC.
POLICY FOR THE
RECOVERY OF ERRONEOUSLY AWARDED COMPENSATION
_______________________________________________________
A. OVERVIEW
In accordance with the applicable rules of The New York Stock Exchange Listed Company Manual (the “NYSE Rules”), Section 10D and Rule 10D-1 of the Securities Exchange Act of 1934, as amended (the “Exchange Act”) (“Rule 10D-1”), the Board of Directors (the “Board”) of Idaho Strategic Resources, Inc. (the “Company”) has adopted this Policy (the “Policy”) to provide for the recovery of erroneously awarded Incentive-based Compensation from Executive Officers. All capitalized terms used and not otherwise defined herein shall have the meanings set forth in Section H, below.
B. RECOVERY OF ERRONEOUSLY AWARDED COMPENSATION
(1) In the event of an Accounting Restatement, the Company will reasonably promptly recover the Erroneously Awarded Compensation Received in accordance with NYSE Rules and Rule 10D-1 as follows:
|
| (i) | After an Accounting Restatement, the Compensation Committee (if composed entirely of independent directors, or in the absence of such a committee, a majority of independent directors serving on the Board) (the “Committee”) shall determine the amount of any Erroneously Awarded Compensation Received by each Executive Officer and shall promptly notify each Executive Officer with a written notice containing the amount of any Erroneously Awarded Compensation and a demand for repayment or return of such compensation, as applicable. |
|
| (a) | For Incentive-based Compensation based on (or derived from) the Company’s stock price or total shareholder return, where the amount of Erroneously Awarded Compensation is not subject to mathematical recalculation directly from the information in the applicable Accounting Restatement: |
|
| i. | The amount to be repaid or returned shall be determined by the Committee based on a reasonable estimate of the effect of the Accounting Restatement on the Company’s stock price or total shareholder return upon which the Incentive-based Compensation was Received; and |
|
|
|
|
|
| ii. | The Company shall maintain documentation of the determination of such reasonable estimate and provide the relevant documentation as required to the NYSE. |
|
| (ii) | The Committee shall have discretion to determine the appropriate means of recovering Erroneously Awarded Compensation based on the particular facts and circumstances. Notwithstanding the foregoing, except as set forth in Section B(2) below, in no event may the Company accept an amount that is less than the amount of Erroneously Awarded Compensation in satisfaction of an Executive Officer’s obligations hereunder. |
|
|
|
|
|
| (iii) | To the extent that the Executive Officer has already reimbursed the Company for any Erroneously Awarded Compensation Received under any duplicative recovery obligations established by the Company or applicable law, it shall be appropriate for any such reimbursed amount to be credited to the amount of Erroneously Awarded Compensation that is subject to recovery under this Policy. |
|
|
|
|
|
| (iv) | To the extent that an Executive Officer fails to repay all Erroneously Awarded Compensation to the Company when due, the Company shall take all actions reasonable and appropriate to recover such Erroneously Awarded Compensation from the applicable Executive Officer. The applicable Executive Officer shall be required to reimburse the Company for any and all expenses reasonably incurred (including legal fees) by the Company in recovering such Erroneously Awarded Compensation in accordance with the immediately preceding sentence. |
| 1 |
(2) Notwithstanding anything herein to the contrary, the Company shall not be required to take the actions contemplated by Section B(1) above if the Committee (which, as specified above, is composed entirely of independent directors or in the absence of such a committee, a majority of the independent directors serving on the Board) determines that recovery would be impracticable and any of the following [two][three] conditions are met:
|
| (i) | The Committee has determined that the direct expenses paid to a third party to assist in enforcing the Policy would exceed the amount to be recovered. Before making this determination, the Company must make a reasonable attempt to recover the Erroneously Awarded Compensation, documented such attempt(s) and provided such documentation to the NYSE; |
|
|
|
|
|
| (ii) | Recovery would violate home country law where that law was adopted prior to November 28, 2022, provided that, before determining that it would be impracticable to recover any amount of Erroneously Awarded Compensation based on violation of home country law, the Company has obtained an opinion of home country counsel, acceptable to the NYSE, that recovery would result in such a violation and a copy of the opinion is provided to NYSE; or |
|
|
|
|
|
| (iii) | Recovery would likely cause an otherwise tax-qualified retirement plan, under which benefits are broadly available to employees of the Company, to fail to meet the requirements of Section 401(a)(13) or Section 411(a) of the Internal Revenue Code of 1986, as amended, and regulations thereunder. |
C. DISCLOSURE REQUIREMENTS
The Company shall file all disclosures with respect to this Policy required by applicable U.S. Securities and Exchange Commission (“SEC”) filings and rules.
D. PROHIBITION OF INDEMNIFICATION
The Company shall not be permitted to insure or indemnify any Executive Officer against (i) the loss of any Erroneously Awarded Compensation that is repaid, returned or recovered pursuant to the terms of this Policy, or (ii) any claims relating to the Company’s enforcement of its rights under this Policy. Further, the Company shall not enter into any agreement that exempts any Incentive-based Compensation that is granted, paid or awarded to an Executive Officer from the application of this Policy or that waives the Company’s right to recovery of any Erroneously Awarded Compensation, and this Policy shall supersede any such agreement (whether entered into before, on or after the Effective Date of this Policy).
E. ADMINISTRATION AND INTERPRETATION
This Policy shall be administered by the Committee, and any determinations made by the Committee shall be final and binding on all affected individuals.
The Committee is authorized to interpret and construe this Policy and to make all determinations necessary, appropriate, or advisable for the administration of this Policy and for the Company’s compliance with NYSE Rules, Section 10D, Rule 10D-1, and any other applicable law, regulation, rule or interpretation of the SEC or NYSE promulgated or issued in connection therewith.
| 2 |
F. AMENDMENT; TERMINATION
The Committee may amend this Policy from time to time in its discretion and shall amend this Policy as it deems necessary. Notwithstanding anything in this Section F to the contrary, no amendment or termination of this Policy shall be effective if such amendment or termination would (after taking into account any actions taken by the Company contemporaneously with such amendment or termination) cause the Company to violate any federal securities laws, SEC rule or NYSE rule.
G. OTHER RECOVERY RIGHTS
This Policy shall be binding and enforceable against all Executive Officers and, to the extent required by applicable law or guidance from the SEC or NYSE, their beneficiaries, heirs, executors, administrators or other legal representatives. The Committee intends that this Policy will be applied to the fullest extent required by applicable law. Any employment agreement, equity award agreement, compensatory plan or any other agreement or arrangement with an Executive Officer shall be deemed to include, as a condition to the grant of any benefit thereunder, an agreement by the Executive Officer to abide by the terms of this Policy. Any right of recovery under this Policy is in addition to, and not in lieu of, any other remedies or rights of recovery that may be available to the Company under applicable law, regulation or rule or pursuant to the terms of any policy of the Company or any provision in any employment agreement, equity award agreement, compensatory plan, agreement or other arrangement.
H. DEFINITIONS
For purposes of this Policy, the following capitalized terms shall have the meanings set forth below.
(1) “Accounting Restatement” means an accounting restatement due to the material noncompliance of the Company with any financial reporting requirement under the securities laws, including any required accounting restatement to correct an error in previously issued financial statements that is material to the previously issued financial statements (a “Big R” restatement), or that would result in a material misstatement if the error were corrected in the current period or left uncorrected in the current period (a “little r” restatement).
(2) “Clawback Eligible Incentive Compensation” means all Incentive-based Compensation Received by an Executive Officer (i) on or after the effective date of the applicable NYSE rules, (ii) after beginning service as an Executive Officer, (iii) who served as an Executive Officer at any time during the applicable performance period relating to any Incentive-based Compensation (whether or not such Executive Officer is serving at the time the Erroneously Awarded Compensation is required to be repaid to the Company), (iv) while the Company has a class of securities listed on a national securities exchange or a national securities association, and (v) during the applicable Clawback Period (as defined below).
(3) “Clawback Period” means, with respect to any Accounting Restatement, the three completed fiscal years of the Company immediately preceding the Restatement Date (as defined below), and if the Company changes its fiscal year, any transition period of less than nine months within or immediately following those three completed fiscal years.
| 3 |
(4) “Erroneously Awarded Compensation” means, with respect to each Executive Officer in connection with an Accounting Restatement, the amount of Clawback Eligible Incentive Compensation that exceeds the amount of Incentive-based Compensation that otherwise would have been Received had it been determined based on the restated amounts, computed without regard to any taxes paid.
(5) “Executive Officer” means each individual who is currently or was previously designated as an “officer” of the Company as defined in Rule 16a-1(f) under the Exchange Act. For the avoidance of doubt, the identification of an executive officer for purposes of this Policy shall include each executive officer who is or was identified pursuant to Item 401(b) of Regulation S-K or Item 6.A of Form 20-F, as applicable, as well as the principal financial officer and principal accounting officer (or, if there is no principal accounting officer, the controller).
(6) “Financial Reporting Measures” means measures that are determined and presented in accordance with the accounting principles used in preparing the Company’s financial statements, and all other measures that are derived wholly or in part from such measures. Stock price and total shareholder return (and any measures that are derived wholly or in part from stock price or total shareholder return) shall, for purposes of this Policy, be considered Financial Reporting Measures. For the avoidance of doubt, a Financial Reporting Measure need not be presented in the Company’s financial statements or included in a filing with the SEC.
(7) “Incentive-based Compensation” means any compensation that is granted, earned or vested based wholly or in part upon the attainment of a Financial Reporting Measure.
(8) “NYSE” means the New York Stock Exchange.
(9) “Received” means, with respect to any Incentive-based Compensation, actual or deemed receipt, and Incentive-based Compensation shall be deemed received in the Company’s fiscal period during which the Financial Reporting Measure specified in the Incentive-based Compensation award is attained, even if the payment or grant of the Incentive-based Compensation to the Executive Officer occurs after the end of that period.
(10) “Restatement Date” means the earlier to occur of (i) the date the Board, a committee of the Board or the officers of the Company authorized to take such action if Board action is not required, concludes, or reasonably should have concluded, that the Company is required to prepare an Accounting Restatement, or (ii) the date a court, regulator or other legally authorized body directs the Company to prepare an Accounting Restatement.
Effective as of December 1, 2023
| 4 |