|
|
|
|
|
|
|
|
|
|
|
|
|
DENISON MINES
CORP.
|
||
|
|
|
|
||||
|
|
|
|
|
/s/ Amanda Willett
|
||
|
Date:
November 8, 2023
|
|
|
|
Amanda
Willett
|
||
|
|
|
|
|
Vice
President Legal and Corporate Secretary
|
||
|
Exhibit Number
|
|
Description
|
|
|
|
|
|
99.1
|
|
|
|
99.2
|
|
|
|
99.3
|
|
|
|
99.4
|
|
|
|
|
|
|
|
|
|
|
|
|
|
|
|
|
|
|
|
Exhibit 99.1

INTERIM CONSOLIDATED FINANCIAL STATEMENTS
|
|
CONDENSED INTERIM CONSOLIDATED STATEMENTS OF FINANCIAL
POSITION
(Unaudited -
Expressed in thousands of Canadian dollars (“CAD”)
except for share amounts)
|
||||||
|
|
|
|
|
At September
30
2023
|
|
At December
31
2022
|
|
ASSETS
|
|
|
|
|
|
|
|
Current
|
|
|
|
|
|
|
|
Cash and cash
equivalents (note 4)
|
|
|
$
|
60,839
|
$
|
50,915
|
|
Trade and other
receivables (note 5)
|
|
|
|
5,648
|
|
4,143
|
|
Inventories (note
6)
|
|
|
|
3,296
|
|
2,713
|
|
Investments-equity
instruments (note 7)
|
|
|
|
12,935
|
|
8,022
|
|
Investments-uranium
(note 7)
|
|
|
|
9,938
|
|
-
|
|
Prepaid expenses
and other
|
|
|
|
756
|
|
1,367
|
|
|
|
|
|
93,412
|
|
67,160
|
|
Non-Current
|
|
|
|
|
|
|
|
Inventories-ore
in stockpiles (note 6)
|
|
|
|
2,098
|
|
2,098
|
|
Investments-equity
instruments (note 7)
|
|
|
|
236
|
|
87
|
|
Investments-uranium
(note 7)
|
|
|
|
238,507
|
|
162,536
|
|
Investments-joint
venture (note 8)
|
|
|
|
17,470
|
|
19,305
|
|
Restricted cash
and investments (note 9)
|
|
|
11,374
|
|
11,105
|
|
|
Property, plant
and equipment (note 10)
|
|
|
|
250,914
|
|
253,505
|
|
Total
assets
|
|
|
$
|
614,011
|
$
|
515,796
|
|
LIABILITIES
|
|
|
|
|
|
|
|
Current
|
|
|
|
|
|
|
|
Accounts payable
and accrued liabilities (note 11)
|
|
|
$
|
10,991
|
$
|
10,299
|
|
Current portion
of long-term liabilities:
|
|
|
|
|
|
|
|
Deferred revenue
(note 12)
|
|
|
|
4,914
|
|
4,915
|
|
Post-employment
benefits (note 13)
|
|
|
|
120
|
|
120
|
|
Reclamation
obligations (note 14)
|
|
|
|
1,420
|
|
2,865
|
|
Other liabilities
(note 16)
|
|
|
|
221
|
|
216
|
|
|
|
|
|
17,666
|
|
18,415
|
|
Non-Current
|
|
|
|
|
|
|
|
Deferred revenue
(note 12)
|
|
|
|
30,344
|
|
28,380
|
|
Post-employment
benefits (note 13)
|
|
|
|
1,028
|
|
1,081
|
|
Reclamation
obligations (note 14)
|
|
|
|
27,261
|
|
26,594
|
|
Other liabilities
(note 16)
|
|
|
|
245
|
|
360
|
|
Deferred income
tax liability
|
|
|
|
3,255
|
|
4,950
|
|
Total
liabilities
|
|
|
|
79,799
|
|
79,780
|
|
EQUITY
|
|
|
|
|
|
|
|
Share capital
(note 17)
|
|
|
|
1,581,562
|
|
1,539,209
|
|
Contributed
surplus (note 18)
|
|
|
|
70,211
|
|
70,281
|
|
Deficit
|
|
|
|
(1,119,358)
|
|
(1,175,256)
|
|
Accumulated other
comprehensive income (note 19)
|
|
|
|
1,797
|
|
1,782
|
|
Total
equity
|
|
|
|
534,212
|
|
436,016
|
|
Total
liabilities and equity
|
|
|
$
|
614,011
|
$
|
515,796
|
|
Issued and
outstanding common shares (note 17)
|
|
|
851,532,538
|
|
826,325,592
|
|
|
Commitments
and contingencies (note 24)
Subsequent
events (note 25)
|
||||||
|
The accompanying
notes are an integral part of the condensed interim consolidated
financial statements
|
||||||
|
|
INTERIM
CONSOLIDATED FINANCIAL STATEMENTS
|
|
CONDENSED INTERIM
CONSOLIDATED STATEMENTS OF INCOME (LOSS) AND COMPREHENSIVE INCOME
(LOSS)
(Unaudited -
Expressed in thousands of CAD dollars except for share and per
share amounts)
|
||||||||
|
|
|
Three
Months Ended
September
30
|
|
Nine
Months Ended
September
30
|
||||
|
|
|
2023
|
|
2022
|
|
2023
|
|
2022
|
|
|
|
|
|
|
|
|
|
|
|
|
|
|
|
|
|
|
|
|
|
REVENUES (note 21)
|
$
|
2,770
|
$
|
3,043
|
$
|
7,345
|
$
|
13,968
|
|
|
|
|
|
|
|
|
|
|
|
EXPENSES
|
|
|
|
|
|
|
|
|
|
Operating
expenses (note 20 and 21)
|
|
(2,491)
|
|
(2,546)
|
|
(8,058)
|
|
(8,598)
|
|
Exploration (note
21)
|
|
(2,052)
|
|
(1,549)
|
|
(7,833)
|
|
(5,175)
|
|
Evaluation (note
21)
|
|
(5,217)
|
|
(6,730)
|
|
(12,601)
|
|
(17,811)
|
|
General and
administrative (note 21)
|
|
(2,999)
|
|
(2,652)
|
|
(9,462)
|
|
(9,475)
|
|
Other income
(note 20)
|
|
68,086
|
|
4,646
|
|
90,332
|
|
49,810
|
|
|
|
55,327
|
|
(8,831)
|
|
52,378
|
|
8,751
|
|
Income
(loss) before net finance expense, equity accounting
|
|
58,097
|
|
(5,788)
|
|
59,723
|
|
22,719
|
|
|
|
|
|
|
|
|
|
|
|
Finance expense,
net (note 20)
|
|
(418)
|
|
(668)
|
|
(1,706)
|
|
(2,242)
|
|
Equity share of
loss of joint venture (note 8)
|
|
(459)
|
|
(945)
|
|
(3,814)
|
|
(2,249)
|
|
Income (loss)
before taxes
|
|
57,220
|
|
(7,401)
|
|
54,203
|
|
18,228
|
|
Income tax
recovery:
|
|
|
|
|
|
|
|
|
|
Deferred
|
|
1,017
|
|
1,018
|
|
1,695
|
|
1,865
|
|
Net income (loss)
for the period
|
$
|
58,237
|
$
|
(6,383)
|
$
|
55,898
|
$
|
20,093
|
|
|
|
|
|
|
|
|
|
|
|
Other
comprehensive income (loss) (note 19):
|
|
|
|
|
|
|
|
|
|
Items that are or
may be subsequently reclassified to income (loss):
|
|
|
|
|
|
|
|
|
|
Foreign currency
translation change
|
|
(114)
|
|
(8)
|
|
15
|
|
(11)
|
|
Comprehensive
income (loss) for the period
|
$
|
58,123
|
$
|
(6,391)
|
$
|
55,913
|
$
|
20,082
|
|
|
|
|
|
|
|
|
|
|
|
|
|
|
|
|
|
|
|
|
|
Basic and diluted
net income (loss) per share:
|
|
|
|
|
|
|
|
|
|
Basic
|
$
|
0.07
|
$
|
(0.01)
|
$
|
0.07
|
$
|
0.02
|
|
Diluted
|
$
|
0.07
|
$
|
(0.01)
|
$
|
0.07
|
$
|
0.02
|
|
|
|
|
|
|
|
|
||
|
|
|
|
|
|
|
|
||
|
Weighted-average
number of shares outstanding
(in
thousands):
|
|
|
|
|
|
|
|
|
|
Basic
|
|
840,036
|
|
819,228
|
|
836,174
|
|
817,317
|
|
Diluted
|
|
847,684
|
|
819,228
|
|
843,306
|
|
827,555
|
|
|
|
|
|
|
|
|
|
|
|
The accompanying
notes are an integral part of the condensed interim consolidated
financial statements
|
||||||||
|
|
INTERIM
CONSOLIDATED FINANCIAL STATEMENTS
|
|
CONDENSED INTERIM CONSOLIDATED STATEMENTS OF CHANGES IN
EQUITY
(Unaudited -
Expressed in thousands of CAD dollars)
|
||||||||
|
|
|
|
|
Nine
Months Ended
September
30
|
||||
|
|
|
|
|
|
|
2023
|
|
2022
|
|
|
|
|
|
|
|
|
|
|
|
Share capital (note 17)
|
|
|
|
|
|
|
|
|
|
Balance-beginning
of period
|
|
|
|
|
$
|
1,539,209
|
$
|
1,517,029
|
|
Shares issued for
cash, net of issue costs
|
|
|
|
|
|
37,042
|
|
14,853
|
|
Other shares
issued, net of issue costs
|
|
|
|
|
|
193
|
|
169
|
|
Share options
exercised-cash
|
|
|
|
|
|
2,362
|
|
827
|
|
Share options
exercised-transfer from contributed surplus
|
|
|
|
981
|
|
316
|
||
|
Share units
exercised-transfer from contributed surplus
|
|
|
|
1,775
|
|
351
|
||
|
Balance-end of
period
|
|
|
|
|
|
1,581,562
|
|
1,533,545
|
|
|
|
|
|
|
|
|
|
|
|
Contributed surplus
|
|
|
|
|
|
|
|
|
|
Balance-beginning
of period
|
|
|
|
|
|
70,281
|
|
67,496
|
|
Share-based
compensation expense (note 18)
|
|
|
|
|
|
2,686
|
|
2,934
|
|
Share options
exercised-transfer to share capital
|
|
|
|
|
|
(981)
|
|
(316)
|
|
Share units
exercised-transfer to share capital
|
|
|
|
|
|
(1,775)
|
|
(351)
|
|
Balance-end of
period
|
|
|
|
|
|
70,211
|
|
69,763
|
|
|
|
|
|
|
|
|
|
|
|
Deficit
|
|
|
|
|
|
|
|
|
|
Balance-beginning
of period
|
|
|
|
|
|
(1,175,256)
|
|
(1,189,610)
|
|
Net
income
|
|
|
|
|
|
55,898
|
|
20,093
|
|
Balance-end of
period
|
|
|
|
|
|
(1,119,358)
|
|
(1,169,517)
|
|
|
|
|
|
|
|
|
|
|
|
Accumulated
other comprehensive income (note 19)
|
|
|
|
|
|
|
||
|
Balance-beginning
of period
|
|
|
|
|
|
1,782
|
|
1,776
|
|
Foreign currency
translation
|
|
|
|
|
|
15
|
|
(11)
|
|
Balance-end of
period
|
|
|
|
|
|
1,797
|
|
1,765
|
|
|
|
|
|
|
|
|
|
|
|
Total Equity
|
|
|
|
|
|
|
|
|
|
Balance-beginning
of period
|
|
|
|
|
$
|
436,016
|
$
|
396,691
|
|
Balance-end of
period
|
|
|
|
|
$
|
534,212
|
$
|
435,556
|
|
|
|
|
|
|
|
|
|
|
|
The accompanying
notes are an integral part of the condensed interim consolidated
financial statements
|
||||||||
|
|
INTERIM
CONSOLIDATED FINANCIAL STATEMENTS
|
|
CONDENSED INTERIM CONSOLIDATED STATEMENTS OF CASH FLOW
(Unaudited -
Expressed in thousands of CAD dollars)
|
||||||||
|
|
|
|
|
Nine
Months Ended
September
30
|
||||
|
|
|
|
|
2023
|
|
2022
|
||
|
CASH PROVIDED BY (USED IN):
|
|
|
|
|
|
|
||
|
OPERATING ACTIVITIES
|
|
|
|
|
|
|
||
|
Net income (loss)
for the period
|
|
|
$
|
55,898
|
$
|
20,093
|
||
|
Adjustments and
items not affecting cash and cash equivalents:
|
|
|
|
|
|
|
||
|
Depletion,
depreciation, amortization and accretion
|
|
|
|
6,934
|
|
6,124
|
||
|
Fair value change
losses (gains):
|
|
|
|
|
|
|
||
|
Investments-equity
instruments (notes 7 and 20)
|
|
|
|
(2,645)
|
|
4,181
|
||
|
Investments-uranium
(notes 7 and 20)
|
|
|
|
(85,910)
|
|
(32,216)
|
||
|
Warrants
on investment (notes 7 and 20)
|
|
|
|
-
|
|
(1,592)
|
||
|
Share
purchase warrants liabilities (note 20)
|
|
|
|
-
|
|
(16,923)
|
||
|
Joint
venture-equity share of loss (note 8)
|
|
|
|
3,814
|
|
2,249
|
||
|
Recognition of
deferred revenue (note 12)
|
|
|
|
(763)
|
|
(4,971)
|
||
|
Loss (gain) on
property, plant and equipment disposals
|
|
|
|
(1,299)
|
|
28
|
||
|
Post-employment
benefit payments (note 13)
|
|
|
|
(68)
|
|
(78)
|
||
|
Reclamation
obligation expenditures (note 14)
|
|
|
|
(2,138)
|
|
(1,129)
|
||
|
Reclamation
liability deposit from joint venture partner (note 14)
|
|
|
|
99
|
|
-
|
||
|
Share-based
compensation (note 18)
|
|
|
|
2,686
|
|
2,934
|
||
|
Foreign exchange
gain (note 20)
|
|
|
|
(150)
|
|
(902)
|
||
|
Deferred income
tax recovery
|
|
|
|
(1,695)
|
|
(1,865)
|
||
|
Change in
non-cash operating working capital items (note 20)
|
|
|
|
(571)
|
|
3,806
|
||
|
Net
cash used in operating activities
|
|
|
|
(25,808)
|
|
(20,261)
|
||
|
|
|
|
|
|
|
|
||
|
INVESTING ACTIVITIES
|
|
|
|
|
|
|
||
|
(Decrease)/Increase
in restricted cash and investments (note 9)
|
|
|
|
(269)
|
|
705
|
||
|
Purchase of
investment in joint venture (note 8)
|
|
|
|
(1,979)
|
|
-
|
||
|
Additions of
property, plant and equipment (note 10)
|
|
|
|
(1,525)
|
|
(6,093)
|
||
|
Proceeds on
disposal of property, plant and equipment
|
|
|
|
125
|
|
8
|
||
|
Net
cash used in investing activities
|
|
|
|
(3,648)
|
|
(5,380)
|
||
|
|
|
|
|
|
|
|
||
|
FINANCING ACTIVITIES
|
|
|
|
|
|
|
||
|
Issuance of debt
obligations (note 16)
|
|
|
|
-
|
|
141
|
||
|
Repayment
of debt obligations (note 16)
|
|
|
|
(164)
|
|
(154)
|
||
|
Proceeds
from share issues, net of issue costs (note 17)
|
|
|
|
37,022
|
|
14,803
|
||
|
Proceeds
from share options exercised (note 17)
|
|
|
|
2,362
|
|
827
|
||
|
Net
cash provided by financing activities
|
|
|
|
39,220
|
|
15,617
|
||
|
|
|
|
|
|
|
|
||
|
Increase/(Decrease)
in cash and cash equivalents
|
|
|
|
9,764
|
|
(10,024)
|
||
|
Foreign
exchange effect on cash and cash equivalents
|
|
|
|
160
|
|
928
|
||
|
Cash
and cash equivalents, beginning of period
|
|
|
|
50,915
|
|
63,998
|
||
|
Cash
and cash equivalents, end of period
|
|
|
$
|
60,839
|
$
|
54,902
|
||
|
|
||||||||
|
|
||||||||
|
The accompanying
notes are an integral part of the condensed interim consolidated
financial statements
|
||||||||
|
|
INTERIM
CONSOLIDATED FINANCIAL STATEMENTS
|
|
NOTES TO THE CONDENSED INTERIM CONSOLIDATED FINANCIAL STATEMENTS
FOR THE NINE MONTHS ENDED SEPTEMBER 30, 2023
|
|
|
(Unaudited -
Expressed in CAD dollars except for shares and per share
amounts)
|
|
|
|
|
|
|
At September
30
|
|
At December
31
|
|
(in
thousands)
|
|
|
|
2023
|
|
2022
|
|
|
|
|
|
|
|
|
|
Cash
|
|
|
$
|
1,659
|
$
|
1,801
|
|
Cash in MLJV and
MWJV
|
|
|
|
660
|
|
1,263
|
|
Cash
equivalents
|
|
|
|
58,520
|
|
47,851
|
|
|
|
|
$
|
60,839
|
$
|
50,915
|
|
|
INTERIM
CONSOLIDATED FINANCIAL STATEMENTS
|
|
|
|
|
|
At September
30
|
|
At December
31
|
|
(in
thousands)
|
|
|
|
2023
|
|
2022
|
|
|
|
|
|
|
|
|
|
Trade
receivables
|
|
|
$
|
4,711
|
$
|
3,184
|
|
Receivables in
MLJV and MWJV
|
|
|
|
645
|
|
508
|
|
Sales tax
receivables
|
|
|
|
266
|
|
428
|
|
Sundry
receivables
|
|
|
|
26
|
|
23
|
|
|
|
|
$
|
5,648
|
$
|
4,143
|
|
|
|
|
|
At September
30
|
|
At December
31
|
|
(in
thousands)
|
|
|
|
2023
|
|
2022
|
|
|
|
|
|
|
|
|
|
Inventory of ore
in stockpiles
|
|
|
$
|
2,098
|
$
|
2,098
|
|
Mine and mill
supplies in MLJV
|
|
|
|
3,296
|
|
2,713
|
|
|
|
|
$
|
5,394
|
$
|
4,811
|
|
|
|
|
|
|
|
|
|
Inventories-by
balance sheet presentation:
|
|
|
|
|
|
|
|
Current
|
|
|
$
|
3,296
|
$
|
2,713
|
|
Long term-ore in
stockpiles
|
|
|
|
2,098
|
|
2,098
|
|
|
|
|
$
|
5,394
|
$
|
4,811
|
|
|
|
|
|
At September
30
|
|
At December
31
|
|
(in
thousands)
|
|
|
|
2023
|
|
2022
|
|
|
|
|
|
|
|
|
|
Investments:
|
|
|
|
|
|
|
|
Equity
instruments
|
|
|
|
|
|
|
|
Shares
|
|
|
$
|
12,866
|
$
|
8,022
|
|
Warrants
|
|
|
|
304
|
|
87
|
|
Physical
Uranium
|
|
|
|
248,446
|
|
162,536
|
|
|
|
|
$
|
261,616
|
$
|
170,645
|
|
|
|
|
|
|
|
|
|
Investments-by
balance sheet presentation:
|
|
|
|
|
|
|
|
Current
|
|
|
$
|
22,873
|
$
|
8,022
|
|
Long-term
|
|
|
|
238,743
|
|
162,623
|
|
|
|
|
$
|
261,616
|
$
|
170,645
|
|
|
INTERIM
CONSOLIDATED FINANCIAL STATEMENTS
|
|
(in
thousands)
|
|
Equity
Instruments
|
|
Physical
Uranium
|
|
Total
Investments
|
|
|
|
|
|
|
|
|
|
Balance-December
31, 2022
|
$
|
8,109
|
$
|
162,536
|
$
|
170,645
|
|
Acquired
investments (note 10)
|
|
2,416
|
|
-
|
|
2,416
|
|
Change in fair
value gain to profit (note 20)
|
|
2,645
|
|
85,910
|
|
88,555
|
|
Balance-September
30, 2023
|
$
|
13,170
|
$
|
248,446
|
$
|
261,616
|
|
|
|
|
|
At September
30
|
|
At December
31
|
|
(in
thousands)
|
|
|
|
2023
|
|
2022
|
|
|
|
|
|
|
|
|
|
Investment in
joint venture:
|
|
|
|
|
|
|
|
JCU
|
|
|
$
|
17,470
|
$
|
19,305
|
|
|
|
|
$
|
17,470
|
$
|
19,305
|
|
(in
thousands)
|
|
|
|
|
|
|
|
|
|
|
|
|
|
|
|
Balance-December
31, 2022
|
|
|
|
|
$
|
19,305
|
|
Investment at
cost:
|
|
|
|
|
|
|
|
Equity
share of loss
|
|
|
|
|
|
(3,814)
|
|
Additional
investment in JCU
|
|
|
|
|
|
1,979
|
|
Balance-September
30, 2023
|
|
|
|
|
$
|
17,470
|
|
|
INTERIM
CONSOLIDATED FINANCIAL STATEMENTS
|
|
|
|
|
|
At September
30
|
|
At December
31
|
|
(in
thousands)
|
|
|
|
2023
|
|
2022
|
|
|
|
|
|
|
|
|
|
Total current
assets(1)
|
|
|
$
|
1,166
|
$
|
2,273
|
|
Total non-current
assets
|
|
|
|
38,459
|
|
38,371
|
|
Total current
liabilities
|
|
|
|
(887)
|
|
(1,949)
|
|
Total non-current
liabilities
|
|
|
|
(3,798)
|
|
(86)
|
|
Total net
assets
|
|
|
$
|
34,940
|
$
|
38,609
|
|
|
|
|
|
|
|
|
|
|
|
|
|
|
Nine Months
Ended
|
|
|
|
|
|
|
|
August 31,
2023(2)
|
|
|
|
|
|
|
|
|
|
|
Revenue
|
|
|
|
|
$
|
-
|
|
Net
loss
|
|
|
|
|
|
(7,628)
|
|
Other
comprehensive income
|
|
|
|
|
$
|
-
|
|
|
|
|
|
|
|
|
|
|
|
|
|
|
|
|
|
Reconciliation of
JCU net assets to Denison investment carrying value:
|
|
|
||||
|
Adjusted net assets of
JCU–at December 31, 2022
|
|
|
$
|
38,609
|
||
|
Net
loss
|
|
|
|
|
|
(7,628)
|
|
Investment from
owners
|
|
|
|
|
|
3,959
|
|
Net assets of
JCU–at August 31, 2023
|
|
|
|
|
$
|
34,940
|
|
Denison ownership
interest
|
|
|
|
|
|
50.00%
|
|
Investment in
JCU
|
|
|
|
|
$
|
17,470
|
|
|
|
|
|
At September
30
|
|
At December
31
|
|
(in
thousands)
|
|
|
|
2023
|
|
2022
|
|
|
|
|
|
|
|
|
|
Cash and cash
equivalents
|
|
|
$
|
3,402
|
$
|
3,133
|
|
Investments
|
|
|
|
7,972
|
|
7,972
|
|
|
|
|
$
|
11,374
|
$
|
11,105
|
|
|
|
|
|
|
|
|
|
Restricted cash
and investments-by item:
|
|
|
|
|
|
|
|
Elliot Lake
reclamation trust fund
|
|
|
$
|
3,402
|
$
|
3,133
|
|
Letters of credit
facility pledged assets
|
|
|
|
7,972
|
|
7,972
|
|
|
|
|
$
|
11,374
|
$
|
11,105
|
|
|
INTERIM
CONSOLIDATED FINANCIAL STATEMENTS
|
|
|
|
Plant
and Equipment
|
|
Mineral
|
|
Total
|
||
|
(in
thousands)
|
|
Owned
|
|
Right-of-Use
|
|
Properties
|
|
PP&E
|
|
|
|
|
|
|
|
|
|
|
|
Cost:
|
|
|
|
|
|
|
|
|
|
Balance-December
31, 2022
|
$
|
108,068
|
$
|
763
|
$
|
180,219
|
$
|
289,050
|
|
Additions (note
21)
|
|
1,145
|
|
34
|
|
380
|
|
1,559
|
|
Disposals
|
|
(260)
|
|
(28)
|
|
(1,242)
|
|
(1,530)
|
|
Balance-September
30, 2023
|
$
|
108,953
|
$
|
769
|
$
|
179,357
|
$
|
289,079
|
|
|
|
|
|
|
|
|
|
|
|
Accumulated
amortization, depreciation:
|
|
|
|
|
|
|
|
|
|
Balance-December
31, 2022
|
$
|
(35,150)
|
$
|
(395)
|
$
|
-
|
$
|
(35,545)
|
|
Amortization
|
|
(141)
|
|
-
|
|
-
|
|
(141)
|
|
Depreciation
(note 20)
|
|
(2,661)
|
|
(105)
|
|
-
|
|
(2,766)
|
|
Disposals
|
|
260
|
|
27
|
|
-
|
|
287
|
|
Balance-September
30, 2023
|
$
|
(37,692)
|
$
|
(473)
|
$
|
-
|
$
|
(38,165)
|
|
|
|
|
|
|
|
|
|
|
|
Carrying
value:
|
|
|
|
|
|
|
|
|
|
Balance-December
31, 2022
|
$
|
72,918
|
$
|
368
|
$
|
180,219
|
$
|
253,505
|
|
Balance-September
30, 2023
|
$
|
71,261
|
$
|
296
|
$
|
179,357
|
$
|
250,914
|
|
|
INTERIM
CONSOLIDATED FINANCIAL STATEMENTS
|
|
|
|
|
|
At September
30
|
|
At December
31
|
|
(in
thousands)
|
|
|
|
2023
|
|
2022
|
|
|
|
|
|
|
|
|
|
Trade
payables
|
|
|
$
|
5,607
|
$
|
5,434
|
|
Payables in MLJV
and MWJV
|
|
|
|
4,866
|
|
4,036
|
|
Other
payables
|
|
|
|
518
|
|
829
|
|
|
|
|
$
|
10,991
|
$
|
10,299
|
|
|
|
|
|
At September
30
|
|
At December
31
|
|
(in
thousands)
|
|
|
|
2023
|
|
2022
|
|
|
|
|
|
|
|
|
|
Deferred
revenue-pre-sold toll milling:
|
|
|
|
|
|
|
|
CLJV Toll
Milling-Ecora
|
|
|
$
|
35,258
|
$
|
33,295
|
|
|
|
|
$
|
35,258
|
$
|
33,295
|
|
Deferred
revenue-by balance sheet presentation:
|
|
|
|
|
||
|
Current
|
|
|
$
|
4,914
|
$
|
4,915
|
|
Non-current
|
|
|
|
30,344
|
|
28,380
|
|
|
|
|
$
|
35,258
|
$
|
33,295
|
|
(in
thousands)
|
|
|
|
|
|
|
Deferred
Revenue
|
|
|
|
|
|
|
|
|
|
|
Balance-December
31, 2022
|
|
|
|
|
$
|
33,295
|
|
|
Revenue
recognized during the period (note 21)
|
|
|
|
|
|
(763)
|
|
|
Accretion (note
20)
|
|
|
|
|
|
2,726
|
|
|
Balance-September
30, 2023
|
|
|
|
|
$
|
35,258
|
|
|
|
INTERIM
CONSOLIDATED FINANCIAL STATEMENTS
|
|
|
|
|
|
At September
30
|
|
At December
31
|
|
(in
thousands)
|
|
|
|
2023
|
|
2022
|
|
|
|
|
|
|
|
|
|
Accrued benefit
obligation
|
|
|
$
|
1,148
|
$
|
1,201
|
|
|
|
|
$
|
1,148
|
$
|
1,201
|
|
|
|
|
|
|
|
|
|
Post-employment
benefits-by balance sheet presentation:
|
|
|
|
|
||
|
Current
|
|
|
$
|
120
|
$
|
120
|
|
Non-current
|
|
|
|
1,028
|
|
1,081
|
|
|
|
|
$
|
1,148
|
$
|
1,201
|
|
(in
thousands)
|
|
|
|
|
|
Post-Employment
Benefits
|
|
|
|
|
|
|
|
|
|
Balance-December
31, 2022
|
|
|
|
|
$
|
1,201
|
|
Accretion (note
20)
|
|
|
|
|
|
15
|
|
Benefits
paid
|
|
|
|
|
|
(68)
|
|
Balance-September
30, 2023
|
|
|
|
|
$
|
1,148
|
|
|
INTERIM
CONSOLIDATED FINANCIAL STATEMENTS
|
|
|
|
|
|
At September
30
|
|
At December
31
|
|
(in
thousands)
|
|
|
|
2023
|
|
2022
|
|
|
|
|
|
|
|
|
|
Reclamation
obligations-by item:
|
|
|
|
|
|
|
|
Elliot
Lake
|
|
|
$
|
16,673
|
$
|
16,634
|
|
MLJV and
MWJV
|
|
|
|
10,480
|
|
10,069
|
|
Wheeler River and
other
|
|
|
|
1,528
|
|
2,756
|
|
|
|
|
$
|
28,681
|
$
|
29,459
|
|
|
|
|
|
|
|
|
|
Reclamation
obligations-by balance sheet presentation:
|
|
|
|
|
||
|
Current
|
|
|
$
|
1,420
|
$
|
2,865
|
|
Non-current
|
|
|
|
27,261
|
|
26,594
|
|
|
|
|
$
|
28,681
|
$
|
29,459
|
|
(in
thousands)
|
|
|
|
|
|
Reclamation
Obligations
|
|
|
|
|
|
|
|
|
|
Balance-December
31, 2022
|
|
|
|
|
$
|
29,459
|
|
Reclamation
liability deposit from joint venture partner
|
|
|
|
|
|
99
|
|
Accretion (note
20)
|
|
|
|
|
|
1,261
|
|
Expenditures
incurred
|
|
|
|
|
|
(2,138)
|
|
Balance-September
30, 2023
|
|
|
|
|
$
|
28,681
|
|
|
INTERIM
CONSOLIDATED FINANCIAL STATEMENTS
|
|
|
Number
of
|
|
Warrant
|
|
(in thousands
except warrant amounts)
|
Warrants
|
|
Liability
|
|
|
|
|
|
|
Balance-December
31, 2022
|
55,006,475
|
$
|
-
|
|
Expiry of share
purchase warrants
|
(55,006,475)
|
|
-
|
|
Balance-September
30, 2023
|
-
|
$
|
-
|
|
|
|
|
|
At September
30
|
|
At December
31
|
|
(in
thousands)
|
|
|
|
2023
|
|
2022
|
|
|
|
|
|
|
|
|
|
Other
liabilities:
|
|
|
|
|
|
|
|
Lease
obligations
|
|
|
$
|
323
|
$
|
396
|
|
Loan
obligations
|
|
|
|
143
|
|
180
|
|
|
|
|
$
|
466
|
$
|
576
|
|
|
|
|
|
|
|
|
|
Other
liabilities-by balance sheet presentation:
|
|
|
|
|
|
|
|
Current
|
|
|
$
|
221
|
$
|
216
|
|
Non-current
|
|
|
|
245
|
|
360
|
|
|
|
|
$
|
466
|
$
|
576
|
|
|
INTERIM
CONSOLIDATED FINANCIAL STATEMENTS
|
|
|
|
|
Lease
|
|
Loan
|
|
Total
Debt
|
||
|
(in
thousands)
|
|
|
|
Liabilities
|
|
Liabilities
|
|
Obligations
|
|
|
|
|
|
|
|
|
|
|
|
|
|
Balance-December
31, 2022
|
|
|
$
|
396
|
$
|
180
|
$
|
576
|
|
|
Accretion (note
20)
|
|
|
|
21
|
|
-
|
|
21
|
|
|
Additions (note
10)
|
|
|
|
34
|
|
-
|
|
34
|
|
|
Repayments
|
|
|
|
(127)
|
|
(37)
|
|
(164)
|
|
|
Liability
adjustment gain
|
|
|
|
(1)
|
|
-
|
|
(1)
|
|
|
Balance-September
30, 2023
|
|
|
$
|
323
|
|
143
|
$
|
466
|
|
|
|
|
|
Lease
|
|
Loan
|
|
Total
Debt
|
||
|
(in
thousands)
|
|
|
|
Liabilities
|
|
Liabilities
|
|
Obligations
|
|
|
|
|
|
|
|
|
|
|
|
|
|
Maturity
analysis-contractual undiscounted cash flows:
|
|
|
|
|
|
|
|||
|
Next 12
months
|
|
|
$
|
166
|
|
55
|
$
|
221
|
|
|
One to five
years
|
|
|
|
187
|
|
95
|
|
282
|
|
|
More than five
years
|
|
|
|
-
|
|
-
|
|
-
|
|
|
Total
obligation-end of period-undiscounted
|
|
|
|
353
|
|
150
|
|
503
|
|
|
Present value
discount adjustment
|
|
|
|
(30)
|
|
(7)
|
|
(37)
|
|
|
Total
obligation-end of period-discounted
|
|
|
$
|
323
|
|
143
|
$
|
466
|
|
|
|
INTERIM
CONSOLIDATED FINANCIAL STATEMENTS
|
|
|
Number
of
|
|
|
|
|
Common
|
|
Share
|
|
(in thousands
except share amounts)
|
Shares
|
|
Capital
|
|
|
|
|
|
|
Balance-December
31, 2022
|
826,325,592
|
$
|
1,539,209
|
|
Issued for
cash:
|
|
|
|
|
Shares issued
proceeds-total
|
19,786,160
|
|
37,887
|
|
Less: share issue
costs
|
-
|
|
(845)
|
|
Other share issue
proceeds-total
|
153,237
|
|
213
|
|
Less: other share
issue costs
|
-
|
|
(20)
|
|
Share option
exercises
|
2,970,381
|
|
2,362
|
|
Share option
exercises-transfer from contributed surplus
|
-
|
|
981
|
|
Share unit
exercises-transfer from contributed surplus
|
2,297,168
|
|
1,775
|
|
|
25,206,946
|
|
42,353
|
|
Balance-September
30, 2023
|
851,532,538
|
$
|
1,581,562
|
|
|
INTERIM
CONSOLIDATED FINANCIAL STATEMENTS
|
|
|
|
Three
Months Ended
September
30
|
|
Nine
Months Ended
September
30
|
||||
|
(in
thousands)
|
|
2023
|
|
2022
|
|
2023
|
|
2022
|
|
|
|
|
|
|
|
|
|
|
|
Share based
compensation expense for:
|
|
|
|
|
|
|
|
|
|
Share
options
|
$
|
(261)
|
$
|
(360)
|
$
|
(958)
|
$
|
(1,119)
|
|
RSUs
|
|
(488)
|
|
(552)
|
|
(1,642)
|
|
(1,612)
|
|
PSUs
|
|
-
|
|
(70)
|
|
(86)
|
|
(203)
|
|
Share
based compensation expense
|
$
|
(749)
|
$
|
(982)
|
$
|
(2,686)
|
$
|
(2,934)
|
|
|
|
|
|
2023
|
||||
|
|
|
|
|
|
|
|
|
Weighted
|
|
|
|
|
|
|
|
|
|
Average
|
|
|
|
|
|
|
|
|
|
Exercise
|
|
|
|
|
|
|
|
Number
of
Common
|
|
Price
per
Share
|
|
|
|
|
|
|
|
Shares
|
|
(CAD)
|
|
|
|
|
|
|
|
|
|
|
|
Share options
outstanding-December 31, 2022
|
|
|
|
|
|
8,539,214
|
$
|
1.09
|
|
Grants
|
|
|
|
|
|
1,785,000
|
|
1.49
|
|
Exercises
(1)
|
|
|
|
|
|
(2,970,381)
|
|
0.80
|
|
Expiries
|
|
|
|
|
|
(24,000)
|
|
0.60
|
|
Forfeitures
|
|
|
|
|
|
(437,333)
|
|
1.40
|
|
Share options
outstanding-September 30, 2023
|
|
|
|
|
|
6,892,500
|
$
|
1.30
|
|
Share
options exercisable-September 30, 2023
|
|
|
|
|
|
4,170,336
|
$
|
1.09
|
|
|
|
|
|
|
Weighted
|
|
|
|
Weighted-
|
|
|
|
|
|
|
Average
|
|
|
|
Average
|
|
|
|
|
|
|
Remaining
|
|
|
|
Exercise
|
|
Range of
Exercise
|
|
|
|
|
Contractual
|
|
Number
of
|
|
Price
per
|
|
Prices per
Share
|
|
|
|
|
Life
|
|
Common
|
|
Share
|
|
(CAD)
|
|
|
|
|
(Years)
|
|
Shares
|
|
(CAD)
|
|
|
|
|
|
|
|
|
|
|
|
|
Share options
outstanding
|
|
|
|
|
|
|
|||
|
$ 0.25 to $
0.49
|
|
1.44
|
|
977,500
|
$
|
0.46
|
|||
|
$ 0.50 to $
0.74
|
|
|
|
|
0.59
|
|
488,000
|
|
0.68
|
|
$ 0.75 to $
0.99
|
|
|
|
|
-
|
|
-
|
|
-
|
|
$ 1.00 to $
1.49
|
|
|
|
|
3.33
|
|
3,929,000
|
|
1.37
|
|
$ 1.50 to $
1.99
|
|
|
|
|
3.47
|
|
1,417,000
|
|
1.83
|
|
$ 2.00 to $
2.49
|
|
|
|
|
3.18
|
|
81,000
|
|
2.21
|
|
Share options
outstanding-September 30, 2023
|
|
2.89
|
|
6,892,500
|
$
|
1.30
|
|||
|
|
INTERIM
CONSOLIDATED FINANCIAL STATEMENTS
|
|
|
|
|
|
Nine Months
Ended
|
|
|
|
|
|
September 30,
2023
|
|
|
|
|
|
|
|
Risk-free
interest rate
|
|
|
|
3.68% to
4.70%
|
|
Expected stock
price volatility
|
|
|
|
71.57 % to
73.41%
|
|
Expected
life
|
|
|
|
3.41 to
3.43
|
|
Expected dividend
yield
|
|
|
|
-
|
|
Fair value
per options granted
|
|
|
0.79 to
0.98
|
|
|
|
|
RSUs
|
|
PSUs
|
||||
|
|
|
|
|
Weighted
|
|
|
|
Weighted
|
|
|
|
|
|
Average
|
|
|
|
Average
|
|
|
|
Number
of
|
|
Fair
Value
|
|
Number
of
|
|
Fair
Value
|
|
|
|
Common
|
|
Per
RSU
|
|
Common
|
|
Per
PSU
|
|
|
|
Shares
|
|
(CAD)
|
|
Shares
|
|
(CAD)
|
|
|
|
|
|
|
|
|
|
|
|
Units
outstanding–December 31, 2022
|
|
6,416,089
|
$
|
1.04
|
|
1,470,000
|
$
|
0.77
|
|
Grants
|
|
1,456,000
|
|
1.50
|
|
-
|
|
-
|
|
Exercises
(1)
|
|
(1,737,168)
|
|
0.76
|
|
(560,000)
|
|
0.80
|
|
Forfeitures
|
|
(153,334)
|
|
1.67
|
|
-
|
|
-
|
|
Units
outstanding–September 30, 2023
|
|
5,981,587
|
$
|
1.22
|
|
910,000
|
$
|
0.74
|
|
Units
vested–September 30, 2023
|
|
3,253,255
|
$
|
0.85
|
|
910,000
|
$
|
0.74
|
|
|
|
|
|
At September
30
|
|
At December
31
|
|
(in
thousands)
|
|
|
|
2023
|
|
2022
|
|
|
|
|
|
|
|
|
|
Cumulative
foreign currency translation
|
|
|
$
|
435
|
$
|
420
|
|
Experience
gains-post employment liability
|
|
|
|
|
||
|
Gross
|
|
|
|
1,847
|
|
1,847
|
|
Tax
effect
|
|
|
|
(485)
|
|
(485)
|
|
|
|
|
$
|
1,797
|
$
|
1,782
|
|
|
INTERIM
CONSOLIDATED FINANCIAL STATEMENTS
|
|
|
|
Three
Months Ended
September
30
|
|
Nine
Months Ended
September
30
|
||||
|
(in
thousands)
|
|
2023
|
|
2022
|
|
2023
|
|
2022
|
|
|
|
|
|
|
|
|
|
|
|
Cost of goods and
services sold:
|
|
|
|
|
|
|
|
|
|
Cost
of goods sold-mineral concentrates
|
$
|
-
|
$
|
-
|
$
|
-
|
$
|
(444)
|
|
Operating
overheads:
|
|
|
|
|
|
|
|
|
|
Mining, other
development expense
|
|
(85)
|
|
(215)
|
|
(203)
|
|
(405)
|
|
Milling,
conversion expense
|
|
(422)
|
|
(616)
|
|
(1,689)
|
|
(2,171)
|
|
Less
absorption:
|
|
|
|
|
|
|
|
|
|
-Mineral
properties
|
|
-
|
|
8
|
|
-
|
|
29
|
|
-Milling
|
|
-
|
|
-
|
|
-
|
|
(11)
|
|
Cost of
services-Closed Mines Services
|
|
(1,937)
|
|
(1,662)
|
|
(6,025)
|
|
(5,193)
|
|
Cost of goods and
services sold
|
|
(2,444)
|
|
(2,485)
|
|
(7,917)
|
|
(8,195)
|
|
Selling
expenses
|
|
-
|
|
(14)
|
|
-
|
|
(48)
|
|
Sales
royalties
|
|
-
|
|
-
|
|
-
|
|
(216)
|
|
Reclamation asset
amortization
|
|
(47)
|
|
(47)
|
|
(141)
|
|
(139)
|
|
Operating
expenses
|
$
|
(2,491)
|
$
|
(2,546)
|
$
|
(8,058)
|
$
|
(8,598)
|
|
|
|
Three
Months Ended
September
30
|
|
Nine
Months Ended
September
30
|
||||
|
(in
thousands)
|
|
2023
|
|
2022
|
|
2023
|
|
2022
|
|
|
|
|
|
|
|
|
|
|
|
Gains (losses)
on:
|
|
|
|
|
|
|
|
|
|
Foreign
exchange
|
$
|
341
|
$
|
615
|
$
|
150
|
$
|
902
|
|
Disposal of
property, plant and equipment
|
|
-
|
|
8
|
|
1,299
|
|
(28)
|
|
Fair value
changes:
|
|
|
|
|
|
|
|
|
|
Investments-equity
instruments (note 7)
|
|
4,530
|
|
805
|
|
2,645
|
|
(4,181)
|
|
Investments-uranium (note
7)
|
|
63,089
|
|
2,637
|
|
85,910
|
|
32,216
|
|
Warrants on
investment (note 7)
|
|
-
|
|
422
|
|
-
|
|
1,592
|
|
Share purchase
warrant liabilities (note 15)
|
|
-
|
|
190
|
|
-
|
|
16,923
|
|
Gain
on recognition of proceeds–UI
Repayment Agreement
|
|
267
|
|
131
|
|
802
|
|
2,844
|
|
Uranium
investment carrying charges
|
|
(95)
|
|
(88)
|
|
(286)
|
|
(259)
|
|
Other
|
|
(46)
|
|
(74)
|
|
(188)
|
|
(199)
|
|
Other
income
|
$
|
68,086
|
$
|
4,646
|
$
|
90,332
|
$
|
49,810
|
|
|
|
Three
Months Ended
September
30
|
|
Nine
Months Ended
September
30
|
||||
|
(in
thousands)
|
|
2023
|
|
2022
|
|
2023
|
|
2022
|
|
|
|
|
|
|
|
|
|
|
|
Interest
income
|
$
|
741
|
$
|
439
|
$
|
2,321
|
$
|
791
|
|
Interest
expense
|
|
(2)
|
|
(1)
|
|
(4)
|
|
(5)
|
|
Accretion
expense
|
|
-
|
|
|
|
|
|
|
|
Deferred
revenue (note 12)
|
|
(725)
|
|
(738)
|
|
(2,726)
|
|
(1,919)
|
|
Post-employment
benefits (note 13)
|
|
(5)
|
|
(5)
|
|
(15)
|
|
(16)
|
|
Reclamation
obligations (note 14)
|
|
(421)
|
|
(356)
|
|
(1,261)
|
|
(1,069)
|
|
Debt
obligations (note 16)
|
|
(6)
|
|
(7)
|
|
(21)
|
|
(24)
|
|
Finance
expense
|
$
|
(418)
|
$
|
(668)
|
$
|
(1,706)
|
$
|
(2,242)
|
|
|
INTERIM
CONSOLIDATED FINANCIAL STATEMENTS
|
|
|
|
Three
Month Ended
September
30
|
|
Nine
Months Ended
September
30
|
||||
|
(in
thousands)
|
|
2023
|
|
2022
|
|
2023
|
|
2022
|
|
|
|
|
|
|
|
|
|
|
|
Operating
expenses:
|
|
|
|
|
|
|
|
|
|
Mining, other
development expense
|
$
|
-
|
$
|
-
|
$
|
(1)
|
$
|
(1)
|
|
Milling,
conversion expense
|
|
(422)
|
|
(613)
|
|
(1,690)
|
|
(2,166)
|
|
Cost of
services
|
|
(53)
|
|
(47)
|
|
(159)
|
|
(135)
|
|
Evaluation
|
|
(144)
|
|
(67)
|
|
(433)
|
|
(130)
|
|
Exploration
|
|
(174)
|
|
(33)
|
|
(368)
|
|
(82)
|
|
General and
administrative
|
|
(38)
|
|
(78)
|
|
(115)
|
|
(196)
|
|
Depreciation
expense-gross
|
$
|
(831)
|
$
|
(838)
|
$
|
(2,766)
|
$
|
(2,710)
|
|
|
|
Three
Months Ended
September
30
|
|
Nine
Months Ended
September
30
|
||||
|
(in
thousands)
|
|
2023
|
|
2022
|
|
2023
|
|
2022
|
|
|
|
|
|
|
|
|
|
|
|
Salaries and
short-term employee benefits
|
$
|
(3,161)
|
$
|
(2,528)
|
$
|
(9,144)
|
$
|
(8,860)
|
|
Share-based
compensation (note 18)
|
|
(749)
|
|
(982)
|
|
(2,686)
|
|
(2,934)
|
|
Termination
benefits
|
|
(7)
|
|
-
|
|
(107)
|
|
(2)
|
|
Employee
benefits expense
|
$
|
(3,917)
|
$
|
(3,510)
|
$
|
(11,937)
|
$
|
(11,796)
|
|
|
|
|
|
Nine
Months Ended
September
30
|
||||
|
(in
thousands)
|
|
|
|
|
|
2023
|
|
2022
|
|
|
|
|
|
|
|
|
|
|
|
Change in
non-cash working capital items:
|
|
|
|
|
|
|
|
|
|
Trade and other
receivables
|
|
|
|
|
$
|
(1,505)
|
$
|
(1,250)
|
|
Inventories
|
|
|
|
|
|
(582)
|
|
656
|
|
Prepaid expenses
and other assets
|
|
|
|
|
|
592
|
|
637
|
|
Accounts payable
and accrued liabilities
|
|
|
|
|
|
924
|
|
3,763
|
|
Change
in non-cash working capital items
|
|
|
|
|
$
|
(571)
|
$
|
3,806
|
|
|
INTERIM
CONSOLIDATED FINANCIAL STATEMENTS
|
|
(in
thousands)
|
|
|
Mining
|
Closed
Mines
Services
|
Corporate
and
Other
|
Total
|
|
|
|
|
|
|
|
|
|
Statement of Operations:
|
|
|
|
|
|
|
|
Revenues
|
|
$
|
763
|
6,582
|
-
|
7,345
|
|
|
|
|
|
|
|
|
|
Expenses:
|
|
|
|
|
|
|
|
Operating
expenses
|
|
$
|
(2,033)
|
(6,025)
|
-
|
(8,058)
|
|
Exploration
|
|
|
(7,833)
|
-
|
-
|
(7,833)
|
|
Evaluation
|
|
|
(12,601)
|
-
|
-
|
(12,601)
|
|
General and
administrative
|
|
|
(19)
|
-
|
(9,443)
|
(9,462)
|
|
|
|
|
(22,486)
|
(6,025)
|
(9,443)
|
(37,954)
|
|
Segment income
(loss)
|
|
$
|
(21,723)
|
557
|
(9,443)
|
(30,609)
|
|
|
|
|
|
|
|
|
|
Revenues-supplemental:
|
|
|
|
|
|
|
|
Environmental
services
|
|
$
|
-
|
6,582
|
-
|
6,582
|
|
Toll milling
services-deferred revenue (note 12)
|
|
763
|
-
|
-
|
763
|
|
|
|
|
$
|
763
|
6,582
|
-
|
7,345
|
|
|
|
|
|
|
|
|
|
Capital additions:
|
|
|
|
|
|
|
|
Property,
plant and equipment (note 10)
|
$
|
447
|
113
|
999
|
1,559
|
|
|
|
|
|
|
|
|
|
|
Long-lived assets:
|
|
|
|
|
|
|
|
Plant and
equipment
|
|
|
|
|
|
|
|
Cost
|
|
$
|
98,925
|
4,342
|
6,455
|
109,722
|
|
Accumulated
depreciation
|
|
|
(34,167)
|
(2,985)
|
(1,013)
|
(38,165)
|
|
Mineral
properties
|
|
|
179,357
|
-
|
-
|
179,357
|
|
|
|
$
|
244,115
|
1,357
|
5,442
|
250,914
|
|
(in
thousands)
|
|
|
Mining
|
Closed
Mines
Services
|
Corporate
and
Other
|
Total
|
|
|
|
|
|
|
|
|
|
Statement of Operations:
|
|
|
|
|
|
|
|
Revenues
|
|
$
|
777
|
1,993
|
-
|
2,770
|
|
|
|
|
|
|
|
|
|
Expenses:
|
|
|
|
|
|
|
|
Operating
expenses
|
|
$
|
(554)
|
(1,937)
|
-
|
(2,491)
|
|
Exploration
|
|
|
(2,052)
|
-
|
-
|
(2,052)
|
|
Evaluation
|
|
|
(5,217)
|
-
|
-
|
(5,217)
|
|
General and
administrative
|
|
|
-
|
-
|
(2,999)
|
(2,999)
|
|
|
|
|
(7,823)
|
(1,937)
|
(2,999)
|
(12,759)
|
|
Segment income
(loss)
|
|
$
|
(7,046)
|
56
|
(2,999)
|
(9,989)
|
|
|
|
|
|
|
|
|
|
Revenues-supplemental:
|
|
|
|
|
|
|
|
Environmental
services
|
|
$
|
-
|
1,993
|
-
|
1,993
|
|
Toll milling
services-deferred revenue (note 12)
|
|
777
|
-
|
-
|
777
|
|
|
|
|
$
|
777
|
1,993
|
-
|
2,770
|
|
|
INTERIM
CONSOLIDATED FINANCIAL STATEMENTS
|
|
(in
thousands)
|
|
|
Mining
|
Closed
Mine
Services
|
Corporate
and
Other
|
Total
|
|
|
|
|
|
|
|
|
|
Statement of Operations:
|
|
|
|
|
|
|
|
Revenues
|
|
$
|
7,957
|
6,011
|
-
|
13,968
|
|
|
|
|
|
|
|
|
|
Expenses:
|
|
|
|
|
|
|
|
Operating
expenses
|
|
$
|
(3,405)
|
(5,193)
|
-
|
(8,598)
|
|
Evaluation
|
|
|
(17,811)
|
-
|
-
|
(17,811)
|
|
Exploration
|
|
|
(5,175)
|
-
|
-
|
(5,175)
|
|
General and
administrative
|
|
|
(21)
|
-
|
(9,454)
|
(9,475)
|
|
|
|
|
(26,412)
|
(5,193)
|
(9,454)
|
(41,059)
|
|
Segment income
(loss)
|
|
$
|
(18,455)
|
818
|
(9,454)
|
(27,091)
|
|
|
|
|
|
|
|
|
|
Revenues–supplemental:
|
|
|
|
|
|
|
|
Environmental
services
|
|
$
|
-
|
6,011
|
-
|
6,011
|
|
Toll milling
services–deferred revenue (note 12)
|
|
4,971
|
-
|
-
|
4,971
|
|
|
Uranium
concentrate sale
|
|
2,986
|
-
|
-
|
2,986
|
|
|
|
|
$
|
7,957
|
6,011
|
-
|
13,968
|
|
Capital additions:
|
|
|
|
|
|
|
|
Property, plant
and equipment
|
|
$
|
1,934
|
293
|
3,941
|
6,168
|
|
|
|
|
|
|
|
|
|
Long-lived assets:
|
|
|
|
|
|
|
|
Plant and
equipment
|
|
|
|
|
|
|
|
Cost
|
|
$
|
94,116
|
4,366
|
11,718
|
110,200
|
|
Accumulated
depreciation
|
|
|
(28,604)
|
(2,932)
|
(2,858)
|
(34,394)
|
|
Mineral
properties
|
|
|
179,900
|
-
|
-
|
179,900
|
|
|
|
$
|
245,412
|
1,434
|
8,860
|
255,706
|
|
(in
thousands)
|
|
|
Mining
|
Closed
Mine
Services
|
Corporate
and
Other
|
Total
|
|
|
|
|
|
|
|
|
|
Statement of Operations:
|
|
|
|
|
|
|
|
Revenues
|
|
$
|
995
|
2,048
|
-
|
3,043
|
|
|
|
|
|
|
|
|
|
Expenses:
|
|
|
|
|
|
|
|
Operating
expenses
|
|
$
|
(884)
|
(1,662)
|
-
|
(2,546)
|
|
Evaluation
|
|
|
(6,730)
|
-
|
-
|
(6,730)
|
|
Exploration
|
|
|
(1,549)
|
-
|
-
|
(1,549)
|
|
General and
administrative
|
|
|
(1)
|
-
|
(2,651)
|
(2,652)
|
|
|
|
|
(9,164)
|
(1,662)
|
(2,651)
|
(13,477)
|
|
Segment income
(loss)
|
|
$
|
(8,169)
|
386
|
(2,651)
|
(10,434)
|
|
|
|
|
|
|
|
|
|
Revenues–supplemental:
|
|
|
|
|
|
|
|
Environmental
services
|
|
$
|
-
|
2,048
|
-
|
2,048
|
|
Toll milling
services–deferred revenue (note 12)
|
|
995
|
-
|
-
|
995
|
|
|
|
|
$
|
995
|
2,048
|
-
|
3,043
|
|
|
INTERIM
CONSOLIDATED FINANCIAL STATEMENTS
|
|
|
|
Three
Months Ended
September
30
|
|
Nine
Months Ended
September
30
|
||||
|
(in
thousands)
|
|
2023
|
|
2022
|
|
2023
|
|
2022
|
|
|
|
|
|
|
|
|
|
|
|
Salaries and
short-term employee benefits
|
$
|
(512)
|
$
|
(543)
|
$
|
(2,156)
|
$
|
(2,711)
|
|
Share-based
compensation
|
|
(544)
|
|
(774)
|
|
(2,017)
|
|
(2,422)
|
|
Key
management personnel compensation
|
$
|
(1,056)
|
$
|
(1,317)
|
$
|
(4,173)
|
$
|
(5,133)
|
|
|
INTERIM
CONSOLIDATED FINANCIAL STATEMENTS
|
|
|
|
Financial
|
|
Fair
|
|
September
30,
|
|
December
31,
|
|
|
|
Instrument
|
|
Value
|
|
2023
|
|
2022
|
|
(in
thousands)
|
|
Category(1)
|
|
Hierarchy
|
|
Fair
Value
|
|
Fair
Value
|
|
|
|
|
|
|
|
|
|
|
|
Financial
Assets:
|
|
|
|
|
|
|
|
|
|
Cash and
equivalents
|
|
Category
B
|
|
|
$
|
60,839
|
$
|
50,915
|
|
Trade and other
receivables
|
|
Category
B
|
|
|
|
5,648
|
|
4,143
|
|
Investments
|
|
|
|
|
|
|
|
|
|
Equity
instruments-shares
|
|
Category
A
|
|
Level
1
|
|
12,866
|
|
8,022
|
|
Equity
instruments-warrants
|
|
Category
A
|
|
Level
2
|
|
304
|
|
87
|
|
Restricted
cash and equivalents
|
|
|
|
|
|
|
|
|
|
Elliot Lake
reclamation trust fund
|
|
Category
B
|
|
|
|
3,402
|
|
3,133
|
|
Credit
facility pledged assets
|
|
Category
B
|
|
|
|
7,972
|
|
7,972
|
|
|
|
|
|
|
$
|
91,031
|
$
|
74,272
|
|
|
|
|
|
|
|
|
|
|
|
Financial
Liabilities:
|
|
|
|
|
|
|
|
|
|
Account
payable and accrued liabilities
|
|
Category
C
|
|
|
|
10,991
|
|
10,299
|
|
Debt
obligations
|
|
Category
C
|
|
|
|
466
|
|
576
|
|
|
|
|
|
|
$
|
11,457
|
$
|
10,875
|

|
TABLE
OF CONTENTS
|
|
|
Q3 2023 PERFORMANCE
HIGHLIGHTS
|
2
|
|
ABOUT
DENISON
|
3
|
|
RESULTS OF
OPERATIONS
|
5
|
|
Wheeler River Uranium
Project
|
7
|
|
Evaluation Pipeline
Properties
|
16
|
|
Community Engagement
Activities
|
17
|
|
LIQUIDITY AND CAPITAL
RESOURCES
|
24
|
|
OUTLOOK FOR
2023
|
26
|
|
ADDITIONAL
INFORMATION
|
27
|
|
CAUTIONARY STATEMENT
REGARDING FORWARD-LOOKING STATEMENTS
|
28
|
|
|
MANAGEMENT’S
DISCUSSION & ANALYSIS
|
|
|
MANAGEMENT’S
DISCUSSION & ANALYSIS
|
|
|
MANAGEMENT’S
DISCUSSION & ANALYSIS
|
|
(in
thousands)
|
|
As at
September 30,
2023
|
|
As at
December 31,
2022
|
|
|
|
|
|
|
|
Financial Position:
|
|
|
|
|
|
Cash and cash
equivalents
|
$
|
60,839
|
$
|
50,915
|
|
Working
capital(1)
|
$
|
80,660
|
$
|
53,660
|
|
Investments in
uranium(2)
|
$
|
248,445
|
$
|
162,536
|
|
Property, plant
and equipment
|
$
|
250,914
|
$
|
253,505
|
|
Total
assets
|
$
|
614,011
|
$
|
515,796
|
|
Total long-term
liabilities(3)
|
$
|
62,133
|
$
|
61,365
|
|
|
|
|
|
2023
|
|
2023
|
|
2023
|
|
2022
|
|
(in
thousands, except for per share amounts)
|
|
Q3
|
|
Q2
|
|
Q1
|
|
Q4
|
||
|
|
|
|
|
|
|
|
|
|
|
|
|
Total
revenues
|
$
|
2,770
|
$
|
3,491
|
$
|
1,084
|
$
|
2,977
|
||
|
Net earnings
(loss)
|
$
|
58,237
|
$
|
61
|
$
|
(2,400)
|
$
|
(5,739)
|
||
|
Basic and diluted
earnings (loss) per share
|
$
|
0.07
|
$
|
0.00
|
$
|
(0.00)
|
$
|
(0.00)
|
||
|
|
|
|
|
2022
|
|
2022
|
|
2022
|
|
2021
|
|
(in
thousands, except for per share amounts)
|
|
Q3
|
|
Q2
|
|
Q1
|
|
Q4
|
||
|
|
|
|
|
|
|
|
|
|
|
|
|
Total
revenues
|
$
|
3,043
|
$
|
6,800
|
$
|
4,125
|
$
|
3,337
|
||
|
Net earnings
(loss)
|
$
|
(6,383)
|
$
|
(16,147)
|
$
|
42,623
|
$
|
(2,648)
|
||
|
Basic and diluted
earnings (loss) per share
|
$
|
(0.01)
|
$
|
(0.02)
|
$
|
0.05
|
$
|
(0.01)
|
||
|
|
|
|
|
|
|
|
|
|
||
|
|
MANAGEMENT’S
DISCUSSION & ANALYSIS
|
|
|
MANAGEMENT’S
DISCUSSION & ANALYSIS
|
|
PROJECT EVALUATION ACTIVITIES
|
|||||
|
Property
|
Denison’s
ownership
|
Evaluation
activities
|
|||
|
Wheeler
River
|
95%(1)
|
Engineering, FS,
metallurgical testing, FFT care and maintenance and Phase 3
operations, environmental and sustainability activities, EIS
regulatory reviews, construction license application
submission.
|
|
||
|
Waterbury
Lake
|
67.41%(2)
|
Field activities
including drilling and development of six HQ wells, 2 PQ wells,
pump and injection testing, metallurgical sampling, tracer testing
and baseline environmental activities.
|
|
||
|
|
MANAGEMENT’S
DISCUSSION & ANALYSIS
|
|
Property
|
Denison’s
ownership
|
Evaluation activities
|
|
||
|
Midwest
|
25.17%
|
Field activities
including permeameter testing, hydrogeological characterization of
cores, metallurgical testing and desktop work including engineering
studies and evaluations.
|
|
||
|
|
|
|
|
||
|
Summary of Economic Results (100% Basis) – Base
Case
|
|
|
Uranium selling
price
|
UxC Spot Price(1)
(~US$66 to
US$70/lb U3O8)
|
|
Exchange Rate
(US$:CAD$)
|
1.35
|
|
Discount
Rate
|
8%
|
|
Operating profit
margin(2)
|
90.9%
|
|
|
|
|
Pre-tax
NPV8%(3) (Change from 2018 PFS)(4)
|
$2.34 billion
(+150%)
|
|
Pre-tax
IRR(3)
|
105.9%
|
|
Pre-tax payback
period(5)
|
~10
months
|
|
|
|
|
Post-tax
NPV8%(3)
|
$1.43
billion
|
|
Post-tax
IRR(3)
|
82.3%
|
|
Post-tax payback
period(5)
|
~11
months
|
|
|
|
|
Adjusted Post-tax
NPV8%(3)(6)
|
$1.56
billion
|
|
Adjusted Post-tax
IRR(3)(6)
|
90.0%
|
|
Adjusted Post-tax
payback period(3)(6)
|
~10
months
|
|
|
MANAGEMENT’S
DISCUSSION & ANALYSIS
|
|
Summary of Key Phoenix Operational Parameters (100%
basis)
|
|
|
Mine
life
|
10
years
|
|
Proven &
Probable reserves(1)
|
56.7 million lbs
U3O8 (219,000 tonnes
at 11.7% U3O8)
|
|
First 5 years of
reserves(2)
|
41.9 million lbs
U3O8 (Average 8.4
million lbs U3O8 /
year)
|
|
Remaining years
of reserves
|
14.8 million lbs
U3O8 (Average 3.0
million lbs U3O8 /
year)
|
|
Initial capital
costs(3)
|
$419.4
million
|
|
Average cash
operating costs
|
$8.51 (US$6.28)
per lb U3O8
|
|
All-in
cost(4)
|
$21.73 (US$16.04)
per lb U3O8
|
|
Summary of Economic Results (100% Basis) – Base
Case
|
|
|
Uranium selling
price
|
US$75/lb U3O8(1)
(Fixed selling
price)
|
|
Exchange Rate
(US$:CAD$)
|
1.35
|
|
Discount
Rate
|
8%
|
|
Operating profit
margin(3)
|
83.0%
|
|
|
|
|
Pre-tax
NPV8%(3) (Change from 2018 PFS)(4)
|
$1.43 billion
(+148%)
|
|
Pre-tax
IRR(3)
|
41.4%
|
|
Pre-tax payback
period(5)
|
~ 20
months
|
|
|
|
|
Post-tax
NPV8%(3)(6)
|
$864.2
million
|
|
Post-tax
IRR(3)(6)
|
37.6%
|
|
Post-tax payback
period(5)(6)
|
~ 22
months
|
|
Summary of Key Gryphon Operational Parameters (100%
basis)
|
|
|
Mine
life
|
6.5
years
|
|
Probable
reserves(1)
|
49.7 million lbs
U3O8 (1,257,000 tonnes
at 1.8% U3O8)
|
|
Average annual
production
|
7.6 million lbs
U3O8
|
|
Initial capital
costs(2)
|
$737.4
million
|
|
Average cash
operating costs
|
$17.27 (US$12.75)
per lb U3O8
|
|
All-in
cost(3)
|
$34.50 (US$25.47)
per lb U3O8
|
|
|
MANAGEMENT’S
DISCUSSION & ANALYSIS
|

|
|
MANAGEMENT’S
DISCUSSION & ANALYSIS
|
|
|
MANAGEMENT’S
DISCUSSION & ANALYSIS
|
|
|
MANAGEMENT’S
DISCUSSION & ANALYSIS
|
|
Phoenix Capital Costs ($ millions)
|
|||
|
|
Initial
|
Sustaining
|
Total
|
|
Wellfield
|
$63.0
|
$177.1
|
$240.1
|
|
ISR
processing plant
|
$102.6
|
$-
|
$102.6
|
|
Surface
facilities
|
$14.7
|
$2.1
|
$16.8
|
|
Utilities
|
$34.8
|
$-
|
$34.8
|
|
Electrical
|
$19.1
|
$-
|
$19.1
|
|
Civil
and earthworks
|
$39.6
|
$-
|
$39.6
|
|
Decommissioning
|
$-
|
$88.8
|
$88.8
|
|
Subtotal – Direct Costs
|
$273.8
|
$268.0
|
$541.8
|
|
Indirect
costs
|
$70.5
|
$31.6
|
$102.1
|
|
Other
(owner’s) costs
|
$32.7
|
$-
|
$32.7
|
|
Contingency
|
$42.6
|
$23.3
|
$65.9
|
|
Total Capital Costs
|
$419.4
|
$322.9
|
742.3
|
|
Wellfield
+$141.0
million
|
The increase
includes the adoption of a phased “freeze wall” design
to replace the novel “freeze dome” concept included in
2018 PFS. The freeze dome introduced significant technical risk to
the ISR mining process and added complexity from an environmental
protection standpoint. The cost of the freeze dome was included in
initial capital costs, whereas the cost of the freeze wall is
spread over the life of mine, thus significantly reducing the
impact to the NPV from the overall increase in capital costs.
Materials and installation costs for the ISR injection and
extraction wells are now based on the Company’s actual
experience in installing both large and small-diameter test wells
during the de-risking process, providing a much more accurate
estimate of costs compared to the 2018 PFS.
|
|
Processing
plant
+$47.1
million
|
The increase
reflects a variety of design adjustments to the processing plant,
including those which enable an increase in the planned production
rate by 43% during the first 5 years, which has a positive impact
on the NPV.
|
|
Decommissioning
+$60.2
million
|
The increase
reflects the incorporation of costs associated with ore zone
groundwater remediation to achieve targets proposed in the EA; more
detailed management and regulatory cost requirements, improved
accuracy in well decommissioning activities, process plant
decontamination and demolition including transport and disposal of
waste materials, additional costs for decommissioning larger
industrial water treatment facilities, and environmental monitoring
labour and analytical costs. As these increased capital costs are
primarily expected to occur at the end of the mine life, the impact
to the NPV from the increased capital costs is
minimized.
|
|
|
MANAGEMENT’S
DISCUSSION & ANALYSIS
|
|
|
MANAGEMENT’S
DISCUSSION & ANALYSIS
|
|
|
MANAGEMENT’S
DISCUSSION & ANALYSIS
|
|
|
MANAGEMENT’S
DISCUSSION & ANALYSIS
|
|
EXPLORATION ACTIVITIES
|
|||
|
Property
|
Denison’s ownership
|
Drilling in metres
(m)(1)
|
Other activities
|
|
Bell
Lake
|
100.00%
|
-
|
Geophysical
Survey
|
|
Johnston
Lake
|
100.00%
|
6,202 (8
holes)
|
Geophysical
Survey
|
|
Moon
Lake
|
100.00%
|
627 (1
hole)
|
-
|
|
Moon Lake
South
|
75.00%
|
8,098 (14
holes)
|
-
|
|
Waterfound
|
24.68%(2)
|
9,789 (17
holes)
|
-
|
|
Wheeler
River
|
95.00%(3)
|
4,368 (7
holes)
|
Geophysical
Survey
|
|
|
|
|
|
|
Total
|
|
29,084 (47 holes)
|
|
|
|
MANAGEMENT’S
DISCUSSION & ANALYSIS
|
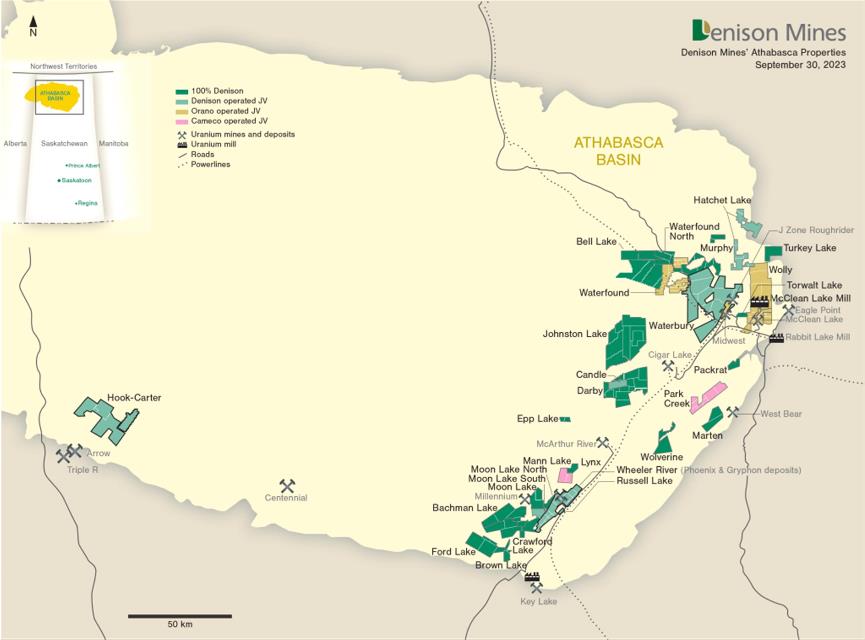
|
|
MANAGEMENT’S
DISCUSSION & ANALYSIS
|
|
MINERALIZED DRILL RESULTS FOR 2023 FALL DRILLING
PROGRAM
|
|||||
|
Hole Number
|
Orientation
(azi./dip)
|
From
(m)
|
To
(m)
|
Length(1)
(m)
|
Grade
(% eU3O8)(2)
|
|
WR-812(3,5)
|
292°/-73.8°
|
550.1
|
550.5
|
0.4
|
0.18
|
|
-
|
-
|
551.0
|
552.7
|
1.7
|
0.48
|
|
WR-813(4,6)
|
272°/-73.0°
|
585.0
|
585.3
|
0.3
|
0.06
|
|
|
MANAGEMENT’S
DISCUSSION & ANALYSIS
|
|
|
MANAGEMENT’S
DISCUSSION & ANALYSIS
|
|
|
MANAGEMENT’S
DISCUSSION & ANALYSIS
|
|
|
MANAGEMENT’S
DISCUSSION & ANALYSIS
|
|
|
MANAGEMENT’S
DISCUSSION & ANALYSIS
|
|
|
MANAGEMENT’S
DISCUSSION & ANALYSIS
|
|
|
|
Three Months Ended
|
|
Nine Months Ended
|
||||
|
|
|
September 30,
|
|
September 30,
|
|
September 30,
|
|
September 30,
|
|
(in
thousands)
|
|
2023
|
|
2022
|
|
2023
|
|
2022
|
|
|
|
|
|
|
|
|
|
|
|
Salaries and
short-term employee benefits
|
$
|
(512)
|
$
|
(543)
|
$
|
(2,156)
|
$
|
(2,711)
|
|
Share-based
compensation
|
|
(544)
|
|
(774)
|
|
(2,017)
|
|
(2,422)
|
|
|
$
|
(1,056)
|
$
|
(1,317)
|
$
|
(4,173)
|
$
|
(5,133)
|
|
|
MANAGEMENT’S
DISCUSSION & ANALYSIS
|
|
(in
thousands)
|
|
PREVIOUS 2023 BUDGET
|
CURRENT 2023 OUTLOOK
|
Actual to
September, 2023(2)
|
|
Mining Segment
|
|
|
|
|
|
Development &
Operations
|
|
(1,695)
|
(1,695)
|
(1,058)
|
|
Exploration
|
|
(8,748)
|
(8,748)
|
(7,390)
|
|
Evaluation
|
|
(27,260)
|
(23,772)
|
(14,860)
|
|
JCU Cash
Contributions
|
|
(3,146)
|
(3,146)
|
(1,979)
|
|
|
|
(40,849)
|
(37,361)
|
(25,287)
|
|
Closed Mines Segment
|
|
|
|
|
|
Closed Mines
Environmental Services
|
|
873
|
287
|
655
|
|
|
|
873
|
287
|
655
|
|
Corporate and Other Segment
|
|
|
|
|
|
Corporate
Administration & Other
|
|
(4,476)
|
(3,127)
|
(5,378)
|
|
|
|
(4,476)
|
(3,127)
|
(5,378)
|
|
Total(1)
|
|
$ (44,452)
|
$ (40,201)
|
$ (30,010)
|
|
|
MANAGEMENT’S
DISCUSSION & ANALYSIS
|
|
|
MANAGEMENT’S
DISCUSSION & ANALYSIS
|