UNITED STATES
SECURITIES AND EXCHANGE COMMISSION
Washington, D.C. 20549
FORM 6-K
REPORT OF FOREIGN PRIVATE ISSUER PURSUANT TO RULE 13a-16 OR 15d-16
UNDER THE SECURITIES EXCHANGE ACT OF 1934
For the month of September 2023
Commission File Number: 001-32210

| NORTHERN DYNASTY MINERALS LTD. |
| (Translation of registrant’s name into English) |
14th Floor - 1040 W Georgia St., Vancouver, BC, V6E 4H1
(Address of principal executive offices)
Indicate by check mark whether the registrant files or will file annual reports under cover Form 20-F or Form 40-F.
☐ Form 20-F ☒ Form 40-F
Indicate by check mark if the registrant is submitting the Form 6-K in paper as permitted by Regulation S-T Rule 101(b)(1): ☐
Indicate by check mark if the registrant is submitting the Form 6-K in paper as permitted by Regulation S-T Rule 101(b)(7): ☐
SUBMITTED HEREWITH
| Exhibits |
| Description |
| 2 |
SIGNATURES
Pursuant to the requirements of the Securities Exchange Act of 1934, the registrant has duly caused this report to be signed on its behalf by the undersigned, thereunto duly authorized.
|
| Northern Dynasty Minerals Ltd. |
|
|
|
| (Registrant) |
|
|
|
|
|
|
|
| Date: September 21, 2023 | By: | /s/ Trevor Thomas |
|
|
| By: | Trevor Thomas |
|
|
| Title: | Secretary and General Counsel |
|
| 3 |
EXHIBIT 99.1
|
|
|
|
|
|
|
|
|
|
| Pebble Project
NI 43-101 Technical Report Update and Preliminary Economic Assessment
Alaska, United States of America
Effective Date: August 21, 2023 Amended & Restated Report Date: September 18, 2023
Prepared for: Northern Dynasty Minerals Ltd.
1040 W Georgia St. Vancouver, BC, V6E 4H1, Canada
Prepared by: Ausenco Engineering Canada Inc.
1050 West Pender, Suite 1200 Vancouver, BC, Canada
List of Qualified Persons: Robin Kalanchey, P.Eng., Ausenco Engineering Canada Inc. Scott Weston, P. Geo., Ausenco Sustainability Inc. Graeme Roper, P. Geo., Tetra Tech Canada Inc. Greg Z. Mosher, P. Geo., Tetra Tech Canada Inc. Hassan Ghaffari, P.Eng., Tetra Tech Canada Inc. Sabry Abdel Hafez, PhD, P.Eng., Worley Canada Services Ltd. Les Galbraith, P.Eng., P.E., Knight Piésold Ltd. Stuart J. Parks, P.E., NANA Worley James Wescott Bott, P.E., HDR Alaska Inc. Steven R. Rowland, P.E., RECON LLC |
|||
|
|
|||

CERTIFICATE OF QUALIFIED PERSON
Robin Kalanchey, P.Eng.
I, Robin Kalanchey, P.Eng., do hereby certify that:
| 1. | I am a Professional Engineer, employed as Vice President, Asset Optimization with Ausenco Engineering Canada Inc., with an office at 4515 Central Boulevard, Burnaby, BC, Canada. |
|
|
|
| 2. | This certificate applies to the technical report titled “Pebble Project, NI 43-101 Technical Report Update Preliminary Economic Assessment, Alaska, USA” (the “Technical Report”), prepared for Northern Dynasty Minerals Ltd. (the “Issuer”), that has an effective date of August 21, 2023 (the “Effective Date”), and an amended and restated report date of September 18, 2023. |
|
|
|
| 3. | I am a graduate of University of British Columbia with a Bachelor of Applied Science degree in Metals and Materials Engineering,1996. |
|
|
|
| 4. | I am a Professional Engineer registered with Engineers and Geoscientists British Columbia, registrant identification 223314. |
|
|
|
| 5. | I have practiced my profession continuously since 1996 and as a metallurgical engineer have been involved multiple projects for the recovery of base and precious metals, in numerous countries and jurisdictions including the United States of America. I have recognized expertise in mineral processing and metallurgical testing, process plant design and engineering, and mining project evaluation for copper, gold, silver, and bulk metal sulphide deposits. I have specific experience in the design, start up and initial operation of mineral processing plants in northern climates, including for Sherritt, Kazakhmys and China Western Mining, amongst others. As part of a consulting design team, I have led or contributed to the design and commercialization of several projects with similar metallurgy and processing schemes to that identified for Pebble including the Arctic Project in Alaska, the Skouries Project in Greece, the Eva Project in Australia and the Josemaria Project in Argentina. In a previous role, as Vice President of Ausenco’s Transportation and Logistics group, I oversaw the design and estimation of a number of bulk terminals and transshipping facilities such as that included in the Pebble Project. |
|
|
|
| 6. | I have read the definition of “qualified person” set out in National Instrument 43-101 Standards of Disclosure for Mineral Projects (“NI 43-101”) and certify that by virtue of my education, affiliation to a professional association and past relevant work experience, I fulfill the requirements to be a “qualified person” for the purposes of NI 43-101. |
|
|
|
| 7. | I have not made a site visit to the Pebble Project as of the Effective Date of the Technical Report. |
|
|
|
| 8. | I am responsible for sections 1.1-1.4, 1.13, 1.14, 1.16-1.19, 1.20.1.3, 1.20.1.7, 1.20.2.3, 1.21.1, 1.21.5, 2.1, 2.2, 2.4, 2.5, 3.3, 4.1, 4.7, 12.1, 17, 18.1, 18.3, 18.7.2.2-18.7.2.5, 18.7.3-18.7.7, 18.9, 18.10, 19, 21.1, 21.2.1-21.2.3, 21.2.5, 21.2.7.1, 21.2.7.3, 21.2.8.2, 21.2.8.3, 21.2.9-21.2.11, 21.2.12.1, 21.2.13.1, 21.3.1, 21.3.2, 21.3.5, 21.3.8, 21.3.9, 22, 24, 25.1, 25.8, 25.9, 25.11-25.14, 25.15.1.3, 25.15.1.7, 25.15.2.3, 26.1, 26.5.1, and 27 of the Technical Report. |
|
|
|
| 9. | I am independent of the Issuer as defined in Section 1.5 of NI 43-101. |
|
|
|
| 10. | I have had prior involvement with the subject property as a QP for the report “Preliminary Economic Assessment NI 43-101 Technical Report, Pebble Project, Alaska, USA”, effective date September 9, 2021” and QP of the report “Preliminary Economic Assessment NI 43-101 Technical Report Update, Pebble Project, Alaska USA, effective date October 1, 2022”. |
|
|
|
| 11. | I have read NI 43-101 and the sections of the Technical Report for which I am responsible have been prepared in compliance with that Instrument. As of the effective date of the Technical Report, to the best of my knowledge, information and belief, the sections of the Technical Report for which I am responsible contain all scientific and technical information that is required to be disclosed to make those sections of the Technical Report not misleading. |
|
|
|
Dated: September 18, 2023.
“Signed and sealed”
Robin Kalanchey, P. Eng.
Permit to Practice No. 1001905, Engineers and Geoscientists British Columbia.
|
|
|
|
CERTIFICATE OF QUALIFIED PERSON
Scott Weston, P. Geo.
I, Scott Weston, P. Geo., certify that:
| 1. | I am currently employed as Vice President, Business Development and Strategy of Ausenco Sustainability Inc., with an office at 4515 Central Boulevard, Burnaby, BC, Canada. |
|
|
|
| 2. | This certificate applies to the technical report titled “Pebble Project, NI 43-101 Technical Report Update Preliminary Economic Assessment, Alaska, USA” (the “Technical Report”), prepared for Northern Dynasty Minerals Ltd. (the “Issuer”), that has an effective date of August 21, 2023 (the “Effective Date”), and an amended and restated report date of September 18, 2023. |
|
|
|
| 3. | I graduated from University of British Columbia, Vancouver, BC, Canada in 1995 with a BSC. in Physical Geography, and from Royal Roads University, Victoria, BC, Canada, in 2003 with a Master of Science, Environmental and Management. |
|
|
|
| 4. | I am a professional Geoscientist of Engineers and Geoscientists, British Columbia (license no.124888). |
|
|
|
| 5. | I worked as a geoscientist continuously for 25 years, leading or working on teams advancing multidisciplinary environmental projects related to natural resource development. Examples of projects I’ve been involved with include Wasamac Project FS, Eskay Creek Mine PFS, Las Chispas Mine FS, and Casino Project FS. |
|
|
|
| 6. | I have read the definition of “Qualified Person” set out in the National Instrument 43-101 Standards of Disclosure for Mineral Projects (“NI 43-101”) and certify that by virtue of my education, affiliation to a professional association and past relevant work experience, I fulfill the requirements to be a “Qualified Person” for those sections of the Technical Report that I am responsible for preparing. |
|
|
|
| 7. | I have not made a site visit to the Pebble Project as of the Effective Date of the Technical Report. |
|
|
|
| 8. | I am responsible for Sections 1.15.1, 1.15.3, 1.20.1.6, 1.20.2.5, 3.2, 4.5, 4.7, 12.2, 20, 25.10, 25.15.1.6, 25.15.2.5, and 27 of the Technical Report. |
|
|
|
| 9. | I am independent of Northern Dynasty Minerals Ltd. as independence is described by Section 1.5 of the NI 43-101. |
|
|
|
| 10. | I have had no previous involvement with the Pebble Project. |
|
|
|
| 11. | I have read NI 43-101 and the sections of the Technical Report for which I am responsible have been prepared in compliance with that Instrument. As of the effective date of the Technical Report, to the best of my knowledge, information and belief, the sections of the Technical Report for which I am responsible contain all scientific and technical information that is required to be disclosed to make those sections of the Technical Report not misleading. |
Dated: September 18, 2023.
“Signed and sealed”
Scott Weston, P. Geo.
Permit to Practice No. 1003471, Engineers and Geoscientists British Columbia.
|
|
|
|
CERTIFICATE OF QUALIFIED PERSON
Graeme Roper, P. Geo.
I, Graeme Roper, P. Geo., certify that:
| 1. | I am employed as Senior Resource Geologist with Tetra Tech, with an office address of 1000-10th FL 885 Dunsmuir St, Vancouver, British Columbia, Canada, V6C 1N5. |
|
|
|
| 2. | This certificate applies to the technical report “Pebble Project, NI 43-101 Technical Report Update Preliminary Economic Assessment, Alaska, USA” (the “Technical Report”), prepared for Northern Dynasty Minerals Ltd. (the “Issuer”), that has an effective date of August 21, 2023 (the “Effective Date”), and an amended and restated report date of September 18, 2023. |
|
|
|
| 3. | I graduated from The University of Guelph in 2009 with a Bachelor of Science in Earth Surface Science. |
|
|
|
| 4. | I am a member in good standing of Engineers and Geoscientists British Columbia, License no.# 45027. |
|
|
|
| 5. | I have practiced my profession for 15 years. I have a relevant 10.5 years of experience with respect evaluation of porphyry deposits in exploration, resource estimation and mine production settings working as a senior geologist which included reviewing exploration data and resource estimates. This experience is drawn from and applied to the work completed on the Pebble Project. |
|
|
|
| 6. | I have read the definition of “Qualified Person” set out in the National Instrument 43-101 Standards of Disclosure for Mineral Projects (“NI 43-101”) and certify that by virtue of my education, affiliation to a professional association and past relevant work experience, I fulfill the requirements to be a “Qualified Person” for those sections of the Technical Report that I am responsible for preparing. |
|
|
|
| 7. | I visited the Pebble Project on February 2, 2023, to complete data verification checks on the drill core and review core storage facilities. |
|
|
|
| 8. | I am responsible for Sections 1.5, 2.3.1, 3.1, 4.2-4.4, 4.6, 5, 6, 11, 12.10, 23, 25.2-25.4, and 27 of the Technical Report. |
|
|
|
| 9. | I am independent of Northern Dynasty Minerals Ltd. as independence is described by Section 1.5 of the NI 43-101. |
|
|
|
| 10. | I have had no previous involvement with the Pebble Project. |
|
|
|
| 11. | I have read NI 43-101 and the sections of the Technical Report for which I am responsible have been prepared in compliance with that Instrument. As of the effective date of the Technical Report, to the best of my knowledge, information and belief, the sections of the Technical Report for which I am responsible contain all scientific and technical information that is required to be disclosed to make those sections of the Technical Report not misleading. |
Dated: September 18, 2023.
“Signed and sealed”
Graeme Roper, P. Geo.
Permit to Practice No. 1001972, Engineers and Geoscientists British Columbia.
|
|
|
|
CERTIFICATE OF QUALIFIED PERSON
Greg Z. Mosher, P. Geo.
I, Greg Z Mosher, P. Geo., certify that:
| 1. | I am employed as Senior Geologist with Tetra Tech Canada, with an office address of 1000 – 885 Dunsmuir Street, Vancouver, BC, V6C 1N5. |
|
|
|
| 2. | This certificate applies to the technical report titled “Pebble Project, NI 43-101 Technical Report Update Preliminary Economic Assessment, Alaska, USA” (the “Technical Report”), prepared for Northern Dynasty Minerals Ltd. (the “Issuer”), that has an effective date of August 21, 2023 (the “Effective Date”), and an amended and restated report date of September 18, 2023. |
|
|
|
| 3. | I am a graduate of Dalhousie University (B.Sc. Hons., 1970) and McGill University (M.Sc. Applied, 1973). I am a member in good standing of the Engineers and Geoscientists BC, License #19267. |
|
|
|
| 4. | My relevant experience with respect to exploration for porphyry deposits includes over 30 years of exploration for and evaluation of such deposits. Additionally, I have been conducting mineral resource estimates of porphyry deposits since 2005. |
|
|
|
| 5. | I have read the definition of “Qualified Person” set out in the National Instrument 43-101 Standards of Disclosure for Mineral Projects (“NI 43-101”) and certify that by virtue of my education, affiliation to a professional association and past relevant work experience, I fulfill the requirements to be a “Qualified Person” for those sections of the Technical Report that I am responsible for preparing. |
|
|
|
| 6. | I conducted an audit of the mineral resource estimate for the Pebble Project for this Technical Report but did not make a site visit. |
|
|
|
| 7. | I am responsible for Sections 1.6-1.9, 1.11, 1.20.1.1, 1.20.2.1, 1.22.3, 2.3.2, 7, 8, 9, 10, 12.9, 14, 25.6, 25.15.1.1, 25.15.2.1, 26.3, and 27 of the Technical Report. |
|
|
|
| 8. | I am independent of Northern Dynasty Minerals Ltd. as independence is described by Section 1.5 of the NI 43-101. |
|
|
|
| 9. | In 2013 I conducted an audit of a mineral resource estimate for the Pebble Project and a site visit in December 2013. |
|
|
|
| 10. | I have read NI 43-101 and the sections of the Technical Report for which I am responsible have been prepared in compliance with that Instrument. As of the effective date of the Technical Report, to the best of my knowledge, information and belief, the sections of the Technical Report for which I am responsible contain all scientific and technical information that is required to be disclosed to make those sections of the Technical Report not misleading. |
Dated: September 18, 2023.
“Signed and sealed”
Greg Z Mosher, P. Geo.
Permit to Practice No. 1001972, Engineers and Geoscientists British Columbia.
|
|
|
|
CERTIFICATE OF QUALIFIED PERSON
Hassan Ghaffari, P.Eng., M.A.Sc.
I, Hassan Ghaffari, P.Eng., M.A.Sc., certify that:
| 1. | I am employed as a Director of Metallurgy with Tetra Tech Canada Inc., with an office address of 1000 – 885 Dunsmuir Street, Vancouver, BC, V6C 1N5. |
|
|
|
| 2. | This certificate applies to the technical report titled “Pebble Project, NI 43-101 Technical Report Update Preliminary Economic Assessment, Alaska, USA” (the “Technical Report”), prepared for Northern Dynasty Minerals Ltd. (the “Issuer”), that has an effective date of August 21, 2023 (the “Effective Date”), and an amended and restated report date of September 18, 2023. |
|
|
|
| 3. | I am a graduate of the University of Tehran (M.A.Sc., Mining Engineering, 1990) and the University of British Columbia (M.A.Sc., Mineral Process Engineering, 2004). |
|
|
|
| 4. | I am a member in good standing of the Engineers and Geoscientists BC, License no. #30408. |
|
|
|
| 5. | My relevant experience includes 30 years of experience in mining and mineral processing plant operation, engineering, project studies and management of various types of mineral processing, including hydrometallurgy, mineral processing particularly for large porphyry copper deposits such as Copper Fox Schaft Creek, Seabridge KSM, KGHM Ajax, Mount Milligan and Pebble. |
|
|
|
| 6. | I have read the definition of “Qualified Person” set out in the National Instrument 43-101 Standards of Disclosure for Mineral Projects (“NI 43-101”) and certify that by virtue of my education, affiliation to a professional association and past relevant work experience, I fulfill the requirements to be a “Qualified Person” for those sections of the Technical Report that I am responsible for preparing. |
|
|
|
| 7. | I visited the Pebble Project on September 1 and 2, 2010 to conduct a personal inspection of the Pebble property. |
|
|
|
| 8. | I am responsible for Sections 1.10, 1.21.2, 2.3.3, 12.3, 13, 25.5, 26.2, and 27 of the Technical Report. |
|
|
|
| 9. | I am independent of Northern Dynasty Minerals Ltd. as independence is described by Section 1.5 of the NI 43-101. |
|
|
|
| 10. | I have had previous involvement with the Pebble property that is the subject of the Technical Report, in acting as a Qualified Person for the “Preliminary Assessment of the Pebble Project, Southwest Alaska” with an effective date of February 15, 2011, and 2021 Technical Report on the Pebble Project, Southwest Alaska, USA, with an effective date of February 24, 2021. |
|
|
|
| 11. | I have read NI 43-101 and the sections of the Technical Report for which I am responsible have been prepared in compliance with that Instrument. As of the effective date of the Technical Report, to the best of my knowledge, information and belief, the sections of the Technical Report for which I am responsible contain all scientific and technical information that is required to be disclosed to make those sections of the Technical Report not misleading. |
Dated: September 18, 2023.
“Signed and sealed”
Hassan Ghaffari, P.Eng., M.A.Sc
Permit to Practice No. 1001972, Engineers and Geoscientists British Columbia.
|
|
|
|
CERTIFICATE OF QUALIFIED PERSON
Sabry Abdel Hafez, PhD, P.Eng.
I, Sabry Abdel Hafez, PhD, P.Eng., certify that:
| 1. | I am employed as Principal Mining Engineer with NANA Worley, LLC’s parent company Worley Canada Services Ltd., with an office address of 49 Quarry Park Blvd SE Calgary, Alberta T2C 5H9 Canada. |
|
|
|
| 2. | This certificate applies to the technical report titled “Pebble Project, NI 43-101 Technical Report Update Preliminary Economic Assessment, Alaska, USA” (the “Technical Report”), prepared for Northern Dynasty Minerals Ltd. (the “Issuer”), that has an effective date of August 21, 2023 (the “Effective Date”), and an amended and restated report date of September 18, 2023. |
|
|
|
| 3. | I graduated from Assiut University (B.Sc. Mining Engineering, 1991; M.Sc. in Mining Engineering, 1996; Ph.D. in Mineral Economics, 2000). |
|
|
|
| 4. | I am a member in good standing of Association of Professional Engineers and Geoscientists of Alberta (APEGA), License no.# 251988. |
|
|
|
| 5. | I have practiced my profession for 25 years. My relevant experience includes evaluation of mining projects, advanced financial analysis, and mine planning and optimization. I have been involved in the technical studies of several base metals, gold, silver, and aggregate mining projects in Canada and abroad such as Arctic project copper/lead/zinc/gold/silver PEA, KSM project copper/gold/moly PFS and Schaft Creek project copper/gold/moly PEA and FS. |
|
|
|
| 6. | I have read the definition of “Qualified Person” set out in the National Instrument 43-101 Standards of Disclosure for Mineral Projects (“NI 43-101”) and certify that by virtue of my education, affiliation to a professional association and past relevant work experience, I fulfill the requirements to be a “Qualified Person” for those sections of the Technical Report that I am responsible for preparing. |
|
|
|
| 7. | I visited the Pebble Project on December 10, 2013. |
|
|
|
| 8. | I am responsible for Sections 1.12, 1.20.1.2, 1.20.2.2, 1.21.4, 2.3.4, 12.4, 15, 16, 18.7.1, 18.7.2.1, 21.2.4, 21.2.12.2, 21.3.4, 25.7, 25.15.1.2, 25.15.2.2, 26.4, and 27 of the Technical Report. |
|
|
|
| 9. | I am independent of Northern Dynasty Minerals Ltd. as independence is described by Section 1.5 of the NI 43-101. |
|
|
|
| 10. | I have had prior involvement with the Pebble property that is the subject of the Technical Report in multiple internal studies since 2012, and as QP for the report “Preliminary Economic Assessment NI 43-101 Technical Report, Pebble Project, Alaska, USA”, effective date September 9, 2021, and the report “Preliminary Economic Assessment NI 43-101 Technical Report Update, Pebble Project, Alaska, USA”, effective date October 1, 2022. All involvements prior to the 2023 work happened when I was employed by Tetra Tech Canada Inc. |
|
|
|
| 11. | I have read NI 43-101 and the sections of the Technical Report for which I am responsible have been prepared in compliance with that Instrument. As of the effective date of the Technical Report, to the best of my knowledge, information and belief, the sections of the Technical Report for which I am responsible contain all scientific and technical information that is required to be disclosed to make those sections of the Technical Report not misleading. |
Dated: September 18, 2023.
“Signed and sealed”
Sabry Abdel Hafez, PhD, P.Eng.
Permit to Practice No. P725, Engineers and Geoscientists British Columbia.
|
|
|
|
CERTIFICATE OF QUALIFIED PERSON
Les Galbraith, P.Eng., P.E.
I, Les Galbraith, P.Eng., P.E., of Vancouver, British Columbia certify that:
| 1. | I am a Specialist Engineer | Associate with Knight Piésold Ltd. with a business address at Suite 1400 – 750 West Pender Street, Vancouver. B.C. V6C 2T8. |
|
|
|
| 2. | This certificate applies to the technical report titled “Pebble Project, NI 43-101 Technical Report Update Preliminary Economic Assessment, Alaska, USA” (the “Technical Report”), prepared for Northern Dynasty Minerals Ltd. (the “Issuer”), that has an effective date of August 21, 2023 (the “Effective Date”), and an amended and restated report date of September 18, 2023. |
|
|
|
| 3. | I graduated from the University of British Columbia in 1995 with a B.A.Sc. (Civil Engineering). I am a member in good standing of the Engineers and Geoscientists of British Columbia (license no. #25493) and the State of Alaska Board of Registration for Architects, Engineers and Land Surveyors (license no. #129941). |
|
|
|
| 4. | I have practiced my profession continuously since graduation. I have over 27 years of relevant experience in providing waste and water management engineering support to mining projects, primarily in British Columbia and Alaska. My experience includes geotechnical investigations, tailings dam design (from PEA studies to detailed design), and construction supervision of tailings embankments. I am the Engineer of Record for six tailings dams in British Columbia. |
|
|
|
| 5. | I have read the definition of “Qualified Person” set out in the National Instrument 43-101 Standards of Disclosure for Mineral Projects (“NI 43-101”) and certify that by virtue of my education, affiliation to a professional association and past relevant work experience, I fulfill the requirements to be a “Qualified Person” for those sections of the Technical Report that I am responsible for preparing. |
|
|
|
| 6. | I visited the Pebble Project in June 2013. |
|
|
|
| 7. | I am responsible for Sections 1.15.2, 1.20.1.4, 1.21.6, 2.3.5, 12.5, 18.4, 18.5.1.1-18.5.1.6, 18.5.2, 21.2.6, 21.2.12.3, 21.2.13.2, 21.2.13.3, 21.3.6, 25.15.1.4, 26.6, and 27 of the Technical Report. |
|
|
|
| 8. | I am independent of Northern Dynasty Minerals Ltd. as independence is described by Section 1.5 of the NI 43-101. |
|
|
|
| 9. | I have been involved with the Pebble Project since 2004, most recently as co-QP of the “Preliminary Economic Assessment NI 43-101 Technical Report, Pebble Project, Alaska, USA”, effective date October 1, 2022.I have read the NI 43-101, and the sections of the Technical Report for which I am responsible have been prepared in compliance with that Instrument. |
|
|
|
| 10. | As of the effective date of the Technical Report, to the best of my knowledge, information and belief, the sections of the Technical Report for which I am responsible contain all scientific and technical information that is required to be disclosed to make those sections of the Technical Report not misleading. |
Dated: September 18, 2023.
“Signed and sealed”
Les Galbraith, P.Eng., P.E.
Permit to Practice No. 1001011, Engineers and Geoscientists British Columbia.
|
|
|
|
CERTIFICATE OF QUALIFIED PERSON
Stuart J. Parks, P.E.
I, Stuart J. Parks, P.E., certify that:
| 1. | I am employed as a Vice President of Operations with NANA Worley, LLC, with an office address of 3700 Centerpoint Drive, 7th Floor, Anchorage, Alaska 99503. |
|
|
|
| 2. | This certificate applies to the technical report titled “Pebble Project, NI 43-101 Technical Report Update Preliminary Economic Assessment, Alaska, USA” (the “Technical Report”), prepared for Northern Dynasty Minerals Ltd. (the “Issuer”), that has an effective date of August 21, 2023 (the “Effective Date”), and an amended and restated report date of September 18, 2023. |
|
|
|
| 3. | I graduated from New Mexico State University (B.S., Electrical Engineering, 1985) and Arizona State University M.S., Civil Engineering, 1995). I am a member in good standing of Alaska State Board of Registration for Architects, Engineers, and Land Surveyors, as a Professional Engineer in Electrical Engineering (license no. #AELE10174) and of Montana State Board of Professional Engineers and Land Surveyors, as a Professional Engineer in Electrical Engineer (PEL-PE-LIC-17650). |
|
|
|
| 4. | I have practiced my profession for over 35 years. I have relevant experience in electrical, power, and control system engineering and project management for many projects in remote areas of Alaska. This experience spans a wide range of brownfield and greenfield projects for the hydrocarbons, power, mining and telecommunication industries, from front-end studies and conceptual designs to detailed design and construction support. |
|
|
|
| 5. | I have read the definition of “Qualified Person” set out in the National Instrument 43-101 Standards of Disclosure for Mineral Projects (“NI 43-101”) and certify that by virtue of my education, affiliation to a professional association and past relevant work experience, I fulfill the requirements to be a “Qualified Person” for those sections of the Technical Report that I am responsible for preparing. |
|
|
|
| 6. | I have not made a site visit to the Pebble Project as of the Effective Date of the Technical Report. |
|
|
|
| 7. | I am responsible for Sections 1.20.1.5, 12.6, 18.8, 21.2.8.1, 21.3.3, 25.15.1.5, and 27 of the Technical Report. |
|
|
|
| 8. | I am independent of Northern Dynasty Minerals Ltd. as independence is described by Section 1.5 of the NI 43-101. |
|
|
|
| 9. | I have had previous involvement with the Pebble Project, specifically with the power generation and natural gas pipeline components of the project. This scoping level engineering work has been performed by NANA Worley and our parent company affiliate offices since 2007, specifically under my staff’s and my oversight. |
|
|
|
| 10. | I have read NI 43-101 and the sections of the Technical Report for which I am responsible have been prepared in compliance with that Instrument. As of the effective date of the Technical Report, to the best of my knowledge, information and belief, the sections of the Technical Report for which I am responsible contain all scientific and technical information that is required to be disclosed to make those sections of the Technical Report not misleading. |
Dated: September 18, 2023.
“Signed and sealed”
Stuart J. Parks, P.E.
|
|
|
|
CERTIFICATE OF QUALIFIED PERSON
James Wescott Bott, P.E.
I, James Wescott Bott, P.E., certify that:
| 1. | I am employed as Civil Engineer | Associate Vice President with HDR Alaska, Inc., with an office address of 582 E 36th Avenue, Suite 500, Anchorage, Alaska 99503-4169. |
|
|
|
| 2. | This certificate applies to the technical report “Pebble Project, NI 43-101 Technical Report Update Preliminary Economic Assessment, Alaska, USA” (the “Technical Report”), prepared for Northern Dynasty Minerals Ltd. (the “Issuer”), that has an effective date of August 21, 2023 (the “Effective Date”), and an amended and restated report date of September 18, 2023. |
|
|
|
| 3. | I graduated from Virginia Military Institute in 1999 with a Bachelor of Science degree in Civil & Environmental Engineering and I graduated from Virginia Tech in 2005 with a Master of Science degree in Civil Engineering. I am a member in good standing of the Alaska State Board of Registration for Architects, Engineers, and Land Surveyors, as a Professional Engineer in both Civil Engineering (license no. #AELC11521) and Environmental Engineering (license no. #AELV14371). |
|
|
|
| 4. | I have practiced my profession for 19 years. I have relevant experience in water and wastewater engineering in Alaska for seven mining (or proposed mine) projects. My experience includes mine water management, mine water disposal permitting, and mine water treatment system planning, design, and operational support. |
|
|
|
| 5. | I have read the definition of “Qualified Person” set out in the National Instrument 43-101 Standards of Disclosure for Mineral Projects (“NI 43-101”) and certify that by virtue of my education, affiliation to a professional association and past relevant work experience, I fulfill the requirements to be a “Qualified Person” for those sections of the Technical Report that I am responsible for preparing. |
|
|
|
| 6. | I visited the Pebble Project in December 2006 for a duration of approximately 6 days. |
|
|
|
| 7. | I am responsible for Sections 1.20.2.4, 2.3.6, 12.7, 18.5.1.7, 18.6, 21.2.7.2, 21.2.13.4, 21.3.7, 25.15.2.4, and 27 of the Technical Report. |
|
|
|
| 8. | I am independent of Northern Dynasty Minerals Ltd. as independence is described by Section 1.5 of the NI 43-101. |
|
|
|
| 9. | I have had previous involvement with the Pebble Project. I was involved with environmental baseline data collection in 2006, preliminary engineering of water treatment systems from 2011 to 2013, preliminary engineering of mine access road bridges and culverts from 2017 to 2018, and preliminary engineering of water treatment systems from 2017 to present. |
|
|
|
| 10. | I have read NI 43-101 and the sections of the Technical Report for which I am responsible have been prepared in compliance with that Instrument. As of the effective date of the Technical Report, to the best of my knowledge, information and belief, the sections of the Technical Report for which I am responsible contain all scientific and technical information that is required to be disclosed to make those sections of the Technical Report not misleading. |
Dated: September 18, 2023.
“Signed and sealed”
James Wescott Bott, P.E.
|
|
|
|
CERTIFICATE OF QUALIFIED PERSON
Steven R. Rowland, P.E.
I, Steven R. Rowland, P.E. certify that:
| 1. | I am employed as Principal Engineer with RECON LLC, with an office address of 565 W Recon Cir., Palmer, Alaska 99645. |
|
|
|
| 2. | This certificate applies to the technical report titled “Pebble Project, NI 43-101 Technical Report Update Preliminary Economic Assessment, Alaska, USA” (the “Technical Report”), prepared for Northern Dynasty Minerals Ltd. (the “Issuer”), that has an effective date of August 21, 2023 (the “Effective Date”), and an amended and restated report date of September 18, 2023. |
|
|
|
| 3. | I graduated from the University of Alaska in 1980 with a B.Sc. Geological Engineering]. I am duly qualified and registered as a Professional Engineer and entitled to practice Civil Engineering in the State of Alaska. |
|
|
|
| 4. | I am a member in good standing of American Society of Civil Engineers. |
|
|
|
| 5. | I have practiced my profession for 43 years. I have provided engineering consulting services to numerous resource exploration, development, and mining companies with projects in Alaska. The range of services provided includes access infrastructure route selection, geotechnical investigations, road and airfield design, mine site development recommendations, cost estimates and construction management. |
|
|
|
| 6. | I have read the definition of “Qualified Person” set out in the National Instrument 43-101 Standards of Disclosure for Mineral Projects (“NI 43-101”) and certify that by virtue of my education, affiliation to a professional association and past relevant work experience, I fulfill the requirements to be a “Qualified Person” for those sections of the Technical Report that I am responsible for preparing. |
|
|
|
| 7. | I worked at the Pebble Project location on numerous occasions beginning with an initial reconnaissance trip in 2005. Subsequent site work has included on the ground traverse of the proposed access road routes, pipeline routes and numerous alternative routes. Proposed port sites have been visited and all identified material sources have been visited and mapped. |
|
|
|
| 8. | I am responsible for Sections 2.3.7, 12.8, 18.2, 21.2.8.4, 21.2.12.4, 21.3.10, 26.5.2, and 27 of the Technical Report. |
|
|
|
| 9. | I am independent of Northern Dynasty Minerals Ltd. as independence is described by Section 1.5 of the NI 43-101. |
|
|
|
| 10. | I have had prior involvement with the project as the engineer responsible for providing access road alignments, material source locations, and construction cost estimates that have been used in permit applications and prior Prefeasibility Studies. |
|
|
|
| 11. | I have read NI 43-101 and the sections of the Technical Report for which I am responsible have been prepared in compliance with that Instrument. As of the effective date of the Technical Report, to the best of my knowledge, information and belief, the sections of the Technical Report for which I am responsible contain all scientific and technical information that is required to be disclosed to make those sections of the Technical Report not misleading. |
Dated: September 18, 2023.
“Signed and sealed”
Steven R. Rowland, P.E.
|
|
|
|
|
|
|
|
Important Notice
This report was prepared as National Instrument 43-101 Technical Report for Northern Dynasty Minerals Ltd. (NDM) by Ausenco Engineering Canada Inc. and Ausenco Sustainability Inc. (collectively, Ausenco), Tetra Tech Canada Inc. (Tetra Tech), NANA Worley Inc. (NANA Worley), Worley Canada Services Ltd. (Worley Canada), Knight Piésold Ltd. (Knight Piésold) and RECON LLC (RECON), and HDR Alaska Inc. (HDR), collectively the “Report Authors.” The quality of information, conclusions, and estimates contained herein is consistent with the level of effort involved in the Report Authors’ services, based on i) information available at the time of preparation, ii) data supplied by outside sources, and iii) the assumptions, conditions, and qualifications set forth in this report. This report is intended for use by NDM subject to the terms and conditions of its contracts with each of the Report Authors. Except for the purposes legislated under Canadian provincial and territorial securities law, any other uses of this report by any third party are at that party’s sole risk.
Notice to Reader:
This report replaces the “Pebble Project NI 43-101 Technical Report and Preliminary Economic Assessment” filed on September 05, 2023, and reflects certain housekeeping and clarifying amendments along with conforming changes to the certificates of the qualified professionals who have authored the report.
|
|
|
|
Table of Contents
| 1 | SUMMARY |
| 1 |
|
|
| 1.1 | Introduction |
| 1 |
|
|
| 1.2 | Project Location |
| 2 |
|
|
| 1.3 | Property Description |
| 2 |
|
|
| 1.4 | Project Description |
| 3 |
|
|
| 1.5 | Mineral Tenure, Surface Rights, Water Rights, Royalties and Agreements |
| 6 |
|
|
| 1.6 | Geological Setting and Mineralization |
| 7 |
|
|
| 1.7 | History |
| 8 |
|
|
| 1.8 | Exploration |
| 10 |
|
|
| 1.9 | Drilling and Sampling |
| 11 |
|
|
| 1.10 | Metallurgical Testwork |
| 11 |
|
|
| 1.11 | Mineral Resource Estimation |
| 13 |
|
|
| 1.12 | Mining Methods |
| 13 |
|
|
| 1.13 | Recovery Methods |
| 14 |
|
|
| 1.14 | Project Infrastructure |
| 17 |
|
|
| 1.15 | Environmental, Permitting and Social Considerations |
| 17 |
|
|
|
| 1.15.1 | Environmental Considerations |
| 17 |
|
|
| 1.15.2 | Closure and Reclamation Considerations |
| 19 |
|
|
| 1.15.3 | Permitting Considerations |
| 19 |
|
| 1.16 | Forward-Looking Information |
| 23 |
|
|
| 1.17 | Capital and Operating Cost Estimates |
| 24 |
|
|
|
| 1.17.1 | Capital Cost Estimates |
| 24 |
|
|
| 1.17.2 | Operating Cost Estimates |
| 25 |
|
| 1.18 | Economic Analysis |
| 26 |
|
|
|
| 1.18.1 | Economic Analysis |
| 26 |
|
|
| 1.18.2 | Sensitivity Analysis |
| 28 |
|
| 1.19 | Conclusion and Interpretation |
| 32 |
|
|
| 1.20 | Risks and Opportunities |
| 32 |
|
|
|
| 1.20.1 | Risks |
| 32 |
|
|
| 1.20.2 | Opportunities |
| 35 |
|
| 1.21 | Recommendations |
| 36 |
|
|
|
| 1.21.1 | Introduction |
| 36 |
|
|
| 1.21.2 | Metallurgical Testwork |
| 37 |
|
|
| 1.21.3 | Mineral Resource Estimate |
| 37 |
|
|
| 1.21.4 | Mining Methods |
| 38 |
|
|
| 1.21.5 | Process and Infrastructure Engineering |
| 38 |
|
|
| 1.21.6 | Tailings and Waste Management |
| 39 |
|
| Pebble Project | Page i |
| NI 43-101 Technical Report Update and Preliminary Economic Assessment | August 21, 2023 |
|
|
|
|
| 2 | INTRODUCTION |
| 41 |
|
|
| 2.1 | Terms of Reference |
| 41 |
|
|
| 2.2 | Qualified Persons |
| 42 |
|
|
| 2.3 | Site Visits and Scope of Personal Inspection |
| 43 |
|
|
|
| 2.3.1 | Site inspection by Graeme Roper, P. Geo. |
| 43 |
|
|
| 2.3.2 | Site inspection by Greg Mosher, P. Eng. |
| 43 |
|
|
| 2.3.3 | Site inspection by Hassan Ghaffari, P.Eng. |
| 43 |
|
|
| 2.3.4 | Site inspection by Sabry Abdel Hafez, P. Eng. |
| 44 |
|
|
| 2.3.5 | Site inspection by Les Galbraith, P.Eng. P.E. |
| 44 |
|
|
| 2.3.6 | Site inspection by James Wescott Bott, P.E. |
| 44 |
|
|
| 2.3.7 | Site inspection by Steven Rowland, P.E. |
| 44 |
|
| 2.4 | Effective Dates |
| 44 |
|
|
| 2.5 | Sources of Information and Data |
| 44 |
|
|
|
| 2.5.1 | Definitions |
| 45 |
|
| 3 | RELIANCE ON OTHER EXPERTS |
| 51 |
|
|
| 3.1 | Mineral Tenure |
| 51 |
|
|
| 3.2 | Environmental, Permitting, Closure, and Social and Community Impacts |
| 51 |
|
|
| 3.3 | Taxation |
| 51 |
|
|
| 4 | PROPERTY DESCRIPTION AND LOCATION |
| 52 |
|
|
| 4.1 | Property Location |
| 52 |
|
|
| 4.2 | Mineral Tenure |
| 53 |
|
|
| 4.3 | Royalty and Other Agreements |
| 53 |
|
|
| 4.4 | Surface Rights |
| 55 |
|
|
| 4.5 | Environmental Liabilities |
| 55 |
|
|
| 4.6 | Permits |
| 55 |
|
|
| 4.7 | Comments |
| 55 |
|
|
| 5 | ACESSIBILITY, CLIMATE, LOCAL RESOURCES, INFRASTRUCTURE AND PHYSIOGRAPHY |
| 57 |
|
|
| 5.1 | Accessibility |
| 57 |
|
|
| 5.2 | Climate |
| 58 |
|
|
| 5.3 | Infrastructure |
| 58 |
|
|
| 5.4 | Local Resources |
| 59 |
|
|
| 5.5 | Physiography |
| 59 |
|
|
| 6 | HISTORY |
| 60 |
|
|
| 6.1 | Overview |
| 60 |
|
|
| 6.2 | Historical Sample Preparation and Analysis |
| 62 |
|
|
|
| 6.2.1 | Sample Preparation |
| 62 |
|
|
| 6.2.2 | Sample Analysis |
| 62 |
|
| 6.3 | Historical Resource Estimates |
| 63 |
|
|
| 6.4 | Study History |
| 63 |
|
|
|
| 6.4.1 | Property Ownership |
| 64 |
|
| Pebble Project | Page ii |
| NI 43-101 Technical Report Update and Preliminary Economic Assessment | August 21, 2023 |
|
|
|
|
| 6.5 | Historical Production |
| 65 |
|
|
| 7 | GEOLOGICAL SETTING AND MINERALIZATION |
| 66 |
|
|
| 7.1 | Introduction |
| 66 |
|
|
| 7.2 | Regional Geology |
| 66 |
|
|
| 7.3 | Project Geology |
| 69 |
|
|
|
| 7.3.1 | Kahiltna Flysch |
| 69 |
|
| 7.3.2 | Diorite and Granodiorite Sills |
| 69 |
|
|
| 7.3.3 | Alkalic Intrusions and Associated Breccias |
| 69 |
|
|
| 7.3.4 | Hornblende Granodiorite Intrusions |
| 70 |
|
|
| 7.3.5 | Volcanic Sedimentary cover Sequence |
| 70 |
|
|
| 7.3.6 | Hornblende Monzonite Porphyry Intrusions |
| 70 |
|
|
| 7.3.7 | Eocene Volcanic Rocks and Intrusions |
| 70 |
|
|
| 7.3.8 | Glacial Sediments |
| 71 |
|
|
| 7.3.9 | District Structure |
| 71 |
|
|
| 7.4 | Deposit Geology |
| 71 |
|
|
| 7.4.1 | Rock Types |
| 75 |
|
|
| 7.4.2 | Structure |
| 75 |
|
|
| 7.4.3 | Deposit Alteration Styles |
| 76 |
|
|
| 7.4.4 | Mineralization Styles |
| 81 |
|
|
| 8 | DEPOSIT TYPES |
| 85 |
|
|
| 9 | EXPLORATION |
| 86 |
|
|
| 9.1 | Introduction |
| 86 |
|
|
| 9.2 | Overview |
| 86 |
|
|
| 9.3 | Geological Mapping |
| 86 |
|
|
| 9.4 | Geophysical Surveys |
| 86 |
|
|
| 9.5 | Geochemical Surveys |
| 87 |
|
|
| 10 | DRILLING |
| 88 |
|
|
| 10.1 | Introduction |
| 88 |
|
|
| 10.2 | Drill Hole Locations |
| 88 |
|
|
| 10.3 | Summary of Drilling, 2001–2019 |
| 89 |
|
|
| 10.3.1 | Northern Dynasty Drilling, 2002–2006 |
| 94 |
|
|
| 10.3.2 | Northern Dynasty and Pebble Partnership Drilling, 2007 |
| 94 |
|
|
| 10.3.3 | Pebble Partnership Drilling, 2008–2014 |
| 94 |
|
|
| 10.3.4 | Pebble Partnership Drilling, 2018–2019 |
| 95 |
|
|
| 10.4 | Drill Sections |
| 95 |
|
|
| 10.5 | Bulk Density Results |
| 100 |
|
|
| 10.6 | Conclusions |
| 100 |
|
|
| 11 | SAMPLE PREPARATION, ANALYSES AND SECURITY |
| 101 |
|
|
| 11.1 | Sampling Method and Approach |
| 101 |
|
|
| 11.1.1 | Northern Dynasty Sampling, 2002–2006 |
| 101 |
|
|
| Pebble Project | Page iii |
| NI 43-101 Technical Report Update and Preliminary Economic Assessment | August 21, 2023 |
|
|
|
|
|
| 11.1.2 | Northern Dynasty and Pebble Partnership Sampling, 2007 |
| 102 |
|
|
| 11.1.3 | Pebble Partnership Sampling, 2008–2014 |
| 102 |
|
| 11.2 | Sample Preparation |
| 103 |
|
|
|
| 11.2.1 | Northern Dynasty Sample Preparation, 2002 |
| 103 |
|
|
| 11.2.2 | Northern Dynasty Sample Preparation, 2003 |
| 103 |
|
|
| 11.2.3 | Northern Dynasty and Pebble Partnership Sample Preparation, 2004–2013 and 2018 |
| 103 |
|
| 11.3 | Sample Analysis |
| 103 |
|
|
|
| 11.3.1 | Northern Dynasty Sample Analysis, 2002 |
| 103 |
|
|
| 11.3.2 | Bulk Density Determinations |
| 111 |
|
| 11.4 | Quality Control/Quality Assurance |
| 111 |
|
|
|
| 11.4.1 | Quality Assurance and Quality Control |
| 111 |
|
|
| 11.4.2 | Standards |
| 113 |
|
|
| 11.4.3 | Duplicates |
| 113 |
|
|
| 11.4.4 | Blanks |
| 114 |
|
|
| 11.4.5 | QA/QC on Other Elements |
| 115 |
|
|
| 11.4.6 | Rhenium Study |
| 115 |
|
| 11.5 | Bulk Density Validation |
| 118 |
|
|
| 11.6 | Survey Validation |
| 118 |
|
|
| 11.7 | Data Environment |
| 119 |
|
|
|
| 11.7.1 | Error Detection Processes |
| 119 |
|
|
| 11.7.2 | Analysis Hierarchies |
| 120 |
|
|
| 11.7.3 | Wedges |
| 120 |
|
| 11.8 | Verification of Drilling Data |
| 120 |
|
|
| 11.9 | Conclusions |
| 122 |
|
|
| 12 | DATA VERIFICATION |
| 123 |
|
|
| 12.1 | Data Verification by Robin Kalanchey |
| 123 |
|
|
| 12.2 | Data Verification by Scott Weston |
| 123 |
|
|
| 12.3 | Data Verification by Hassan Ghaffari |
| 123 |
|
|
| 12.4 | Data Verification by Sabry Abdel Hafez |
| 124 |
|
|
| 12.5 | Data Verification by Les Galbraith |
| 124 |
|
|
| 12.6 | Data Verification by Stuart Parks |
| 124 |
|
|
| 12.7 | Data Verification by James Wescott Bott |
| 124 |
|
|
| 12.8 | Data Verification by Steven Rowland |
| 124 |
|
|
| 12.9 | Data Verification by Greg Mosher |
| 125 |
|
|
| 12.10 | Data Verification by Graeme Roper |
| 125 |
|
|
| 13 | MINERAL PROCESSING AND METALLURGICAL TESTING |
| 129 |
|
|
| 13.1 | Test Programs Summary |
| 129 |
|
|
|
| 13.1.1 | 2003 to 2005 Testwork |
| 129 |
|
|
| 13.1.2 | 2006 to 2010 Testwork |
| 129 |
|
|
| 13.1.3 | 2011 to 2014 Testwork |
| 131 |
|
| 13.2 | Comminution Tests |
| 132 |
|
|
| Pebble Project | Page iv |
| NI 43-101 Technical Report Update and Preliminary Economic Assessment | August 21, 2023 |
|
|
|
|
| 13.2.1 | Bond Grindability Tests |
| 132 |
|
|
| 13.2.2 | Bond Low Energy Impact Tests |
| 133 |
|
|
| 13.2.3 | SMC Tests |
| 134 |
|
|
| 13.2.4 | MacPherson Autogenous Grindability Tests |
| 134 |
|
|
| 13.3 | Flotation Concentration Tests |
| 135 |
|
|
| 13.3.1 | Recovery of Bulk Flotation Concentrate |
| 135 |
|
|
| 13.3.2 | Separation of Molybdenum and Copper |
| 140 |
|
|
| 13.3.3 | Rhenium Recovery into Molybdenum Concentrate |
| 144 |
|
|
| 13.3.4 | Pyrite Flotation |
| 145 |
|
|
| 13.4 | Gold Recovery Tests |
| 146 |
|
|
| 13.4.1 | Gravity Recoverable Gold Tests |
| 146 |
|
|
| 13.4.2 | Gold Recovered from Leaching |
| 147 |
|
|
| 13.5 | SART Process (Sulphidization, Acidification, Recycling, Thickening) |
| 148 |
|
|
| 13.6 | Cyanide Destruction |
| 148 |
|
|
| 13.7 | Auxiliary Tests – Concentrate Filtration |
| 149 |
|
|
| 13.8 | Quality of Concentrates |
| 149 |
|
|
| 13.9 | Geometallurgy |
| 150 |
|
|
| 13.9.1 | Introduction |
| 150 |
|
|
| 13.9.2 | Description of Geometallurgical Domains |
| 151 |
|
|
| 13.10 | Metal Recovery Projection |
| 153 |
|
|
| 13.10.1 | Metal Projections of Copper, Gold Silver, and Molybdenum, 2014 and 2018 |
| 153 |
|
|
| 13.10.2 | Metal Recovery Projection Results |
| 158 |
|
|
| 14 | MINERAL RESOURCE ESTIMATES |
| 159 |
|
|
| 14.1 | Introduction |
| 159 |
|
|
| 14.2 | Summary |
| 159 |
|
|
| 14.3 | Geological Interpretation for Estimation |
| 160 |
|
|
| 14.4 | Inclusion of Rhenium in the Project Database |
| 162 |
|
|
| 14.4.1 | Grade Capping/Outlier Restrictions |
| 163 |
|
|
| 14.4.2 | Data Used to Develop the Regression Equation |
| 164 |
|
|
| 14.4.3 | Data Analysis |
| 165 |
|
|
| 14.4.4 | Validation |
| 166 |
|
|
| 14.5 | Exploratory Data Analysis |
| 168 |
|
|
| 14.5.1 | Assays |
| 168 |
|
|
| 14.5.2 | Capping |
| 176 |
|
|
| 14.5.3 | Composites |
| 177 |
|
|
| 14.6 | Bulk Density |
| 177 |
|
|
| 14.7 | Spatial Analysis |
| 178 |
|
|
| 14.8 | Resource Block Model |
| 179 |
|
|
| 14.9 | Interpolation Plan |
| 180 |
|
|
| 14.10 | Reasonable Prospects of Eventual Economic Extraction |
| 181 |
|
|
| 14.11 | Mineral Resource Classification |
| 182 |
|
|
| 14.12 | Copper Equivalency |
| 182 |
|
|
| Pebble Project | Page v |
| NI 43-101 Technical Report Update and Preliminary Economic Assessment | August 21, 2023 |
|
|
|
|
| 14.13 | Cutoff Grade |
| 184 |
|
|
| 14.14 | Block Model Validation |
| 184 |
|
|
| 14.15 | Factors That May Affect the Mineral Resource Estimates |
| 188 |
|
|
| 15 | MINERAL RESERVE ESTIMATES |
| 189 |
|
|
| 16 | MINING METHODS |
| 190 |
|
|
| 16.1 | Introduction |
| 190 |
|
|
| 16.2 | Mine Plan Inputs |
| 190 |
|
|
|
| 16.2.1 | Block Model |
| 190 |
|
|
| 16.2.2 | Pit Slope Angle |
| 190 |
|
|
| 16.2.3 | Surface Topography |
| 190 |
|
|
| 16.2.4 | Pit Optimization parameters |
| 190 |
|
| 16.3 | Mine Design |
| 193 |
|
|
| 16.4 | Minimum Working Area |
| 195 |
|
|
|
| 16.4.1 | Haul Road |
| 196 |
|
|
| 16.4.2 | Pit Hydrology/Dewatering |
| 196 |
|
|
| 16.4.3 | Pit Design Results |
| 196 |
|
| 16.5 | Mine Plan |
| 197 |
|
|
| 16.6 | Blasting |
| 200 |
|
|
| 16.7 | Mine Waste Rock Management |
| 200 |
|
|
| 16.8 | Mining Equipment |
| 201 |
|
|
|
| 16.8.1 | Mine Equipment Fleet |
| 201 |
|
|
| 16.8.2 | Operating Hours |
| 201 |
|
|
| 16.8.3 | Primary Equipment |
| 202 |
|
|
| 16.8.4 | Support and Ancillary Equipment |
| 203 |
|
| 16.9 | Mining Labour |
| 204 |
|
|
| 17 | RECOVERY METHODS |
| 206 |
|
|
| 17.1 | Summary |
| 206 |
|
|
| 17.2 | Simplified Process Flowsheet |
| 206 |
|
|
| 17.3 | Process Design Criteria |
| 208 |
|
|
| 17.4 | Process Plant Description |
| 209 |
|
|
|
| 17.4.1 | Primary Crushing |
| 209 |
|
|
| 17.4.2 | Stockpile |
| 209 |
|
|
| 17.4.3 | Primary Grinding |
| 210 |
|
|
| 17.4.4 | Secondary Grinding |
| 210 |
|
|
| 17.4.5 | Bulk Rougher Flotation |
| 210 |
|
|
| 17.4.6 | Bulk Concentrate Re-grind |
| 210 |
|
|
| 17.4.7 | Bulk Concentrate-Cleaner Flotation |
| 211 |
|
|
| 17.4.8 | Molybdenum Flotation |
| 211 |
|
|
| 17.4.9 | Concentrate Dewatering and Filtration |
| 212 |
|
|
| 17.4.10 | Tailings Management |
| 212 |
|
|
| 17.4.11 | Reagents Handling and Storage |
| 212 |
|
| Pebble Project | Page vi |
| NI 43-101 Technical Report Update and Preliminary Economic Assessment | August 21, 2023 |
|
|
|
|
|
| 17.4.12 | Assay and Metallurgical Laboratories |
| 213 |
|
|
| 17.4.13 | Power Supply |
| 213 |
|
|
| 17.4.14 | Water Supply |
| 213 |
|
|
| 17.4.15 | Air Supply |
| 214 |
|
| 17.5 | Process Control Philosophy |
| 214 |
|
|
| 18 | PROJECT INFRASTRUCTURE |
| 215 |
|
|
| 18.1 | Introduction |
| 215 |
|
|
| 18.2 | Access Road |
| 217 |
|
|
| 18.2.1 | Main Access Road |
| 218 |
|
|
| 18.3 | Site Roads |
| 222 |
|
|
| 18.3.1 | Haul Roads |
| 222 |
|
|
| 18.3.2 | Service Roads |
| 222 |
|
|
| 18.4 | Tailings Storage Facilities |
| 223 |
|
|
| 18.4.1 | Introduction |
| 223 |
|
|
|
| 18.4.2 | Tailings Overview |
| 223 |
|
|
| 18.4.3 | Site Selection |
| 223 |
|
|
| 18.4.4 | Design Criteria |
| 224 |
|
|
| 18.4.5 | Tailings Storage Facility Design |
| 225 |
|
| 18.5 | Water Management |
| 227 |
|
|
|
| 18.5.1 | Water Management Systems |
| 227 |
|
|
| 18.5.2 | Site-Wide Water Balance |
| 228 |
|
| 18.6 | Water Treatment |
| 230 |
|
|
|
| 18.6.1 | Influent Stream Characteristics |
| 231 |
|
|
| 18.6.2 | WTP Processes |
| 232 |
|
|
| 18.6.3 | WTP Buildings and Appurtenances |
| 233 |
|
| 18.7 | Mine Site Facilities |
| 234 |
|
|
| 18.7.1 | Mine Site Conditions and Design Criteria |
| 234 |
|
|
| 18.7.2 | Mine Service Facilities |
| 235 |
|
|
| 18.7.3 | Water Systems |
| 236 |
|
|
| 18.7.4 | Medical and First Aid |
| 237 |
|
|
| 18.7.5 | Camp |
| 237 |
|
|
| 18.7.6 | Cold Storage Building |
| 237 |
|
|
| 18.7.7 | Utilities and Services |
| 238 |
|
|
| 18.8 | Natural Gas Line and Power Supply |
| 239 |
|
|
| 18.8.1 | Power Supply |
| 239 |
|
|
| 18.8.2 | Natural Gas Supply |
| 241 |
|
|
| 18.9 | Marine Infrastructure |
| 243 |
|
|
| 18.9.1 | Marine Barge Handling Facility |
| 245 |
|
|
| 18.9.2 | Onshore Terminal Facilities – Amakdedori Port, North and South Ferry Terminals |
| 247 |
|
|
| 18.9.3 | Fuel Supply |
| 249 |
|
|
| 18.10 | Ferry |
| 249 |
|
|
| Pebble Project | Page vii |
| NI 43-101 Technical Report Update and Preliminary Economic Assessment | August 21, 2023 |
|
|
|
|
| 19 | MARKET STUDIES AND CONTRACTS |
| 252 |
|
|
| 19.1 | Introduction |
| 252 |
|
|
| 19.2 | Metal Prices |
| 252 |
|
|
| 19.3 | Smelter Terms |
| 253 |
|
|
| 19.4 | Concentrate Logistics |
| 255 |
|
|
| 19.5 | Contracts |
| 256 |
|
|
|
| 19.5.1 | Existing Contracts |
| 256 |
|
|
| 19.5.2 | Royalties |
| 256 |
|
| 20 | ENVIRONMENTAL STUDIES, PERMITTING, AND SOCIAL OR COMMUNITY IMPACT |
| 257 |
|
|
| 20.1 | Project Setting |
| 257 |
|
|
| 20.1.1 | Jurisdictional Setting |
| 257 |
|
|
| 20.1.2 | Environmental and Social Setting |
| 257 |
|
|
| 20.2 | Baseline Studies – Existing Environment |
| 259 |
|
|
| 20.2.1 | Climate and Meteorology |
| 260 |
|
|
| 20.2.2 | Surface Water Hydrology and Quality |
| 261 |
|
|
| 20.2.3 | Groundwater Hydrology and Quality |
| 263 |
|
|
| 20.2.4 | Geochemical Characterization |
| 264 |
|
|
| 20.2.5 | Wetlands |
| 265 |
|
|
| 20.2.6 | Fish, Fish Habitat and Aquatic Invertebrates |
| 265 |
|
|
| 20.2.7 | Marine Habitats |
| 266 |
|
|
| 20.3 | Marine Mammals |
| 267 |
|
|
| 20.4 | Economy and Social Conditions |
| 267 |
|
|
| 20.5 | Community Consultation and Stakeholder Relations |
| 269 |
|
|
| 20.6 | Permitting |
| 270 |
|
|
| 20.6.1 | Clean Water Act Section 404 |
| 270 |
|
|
| 20.6.2 | Other Federal and State Permits and Approvals |
| 273 |
|
|
| 20.7 | Closure |
| 276 |
|
|
| 21 | CAPITAL AND OPERATING COSTS |
| 278 |
|
|
| 21.1 | Introduction |
| 278 |
|
|
| 21.2 | Capital Cost Estimate |
| 278 |
|
|
| 21.2.1 | Estimate Responsibility |
| 278 |
|
|
| 21.2.2 | Capital Cost Summary |
| 278 |
|
|
| 21.2.3 | Direct Costs |
| 279 |
|
|
| 21.2.4 | Area 1000 – Mine Capital Cost |
| 280 |
|
|
| 21.2.5 | Area 2000 – Process Capital Costs |
| 280 |
|
|
| 21.2.6 | Area 3000 – Tailings and Water Management |
| 281 |
|
|
| 21.2.7 | Area 4000 – On-Site Infrastructure |
| 281 |
|
|
| 21.2.8 | Area 5000 – Off-Site Infrastructure |
| 283 |
|
|
| 21.2.9 | Area 6000 – Indirect Costs |
| 285 |
|
|
| 21.2.10 | Area 7000 – Owners Costs |
| 286 |
|
|
| 21.2.11 | Area 8000 – Contingency |
| 286 |
|
|
| Pebble Project | Page viii |
| NI 43-101 Technical Report Update and Preliminary Economic Assessment | August 21, 2023 |
|
|
|
|
|
| 21.2.12 | Sustaining Costs |
| 286 |
|
|
| 21.2.13 | Closure Costs |
| 287 |
|
| 21.3 | Operating Costs |
| 290 |
|
|
| 21.3.1 | Summary |
| 290 |
|
|
| 21.3.2 | General & Administrative |
| 290 |
|
|
| 21.3.3 | Power Supply Costs |
| 291 |
|
|
| 21.3.4 | Open Pit Mining |
| 291 |
|
|
| 21.3.5 | Processing Costs |
| 292 |
|
|
| 21.3.6 | Tailings Operation & Maintenance |
| 293 |
|
|
| 21.3.7 | Water Treatment Plants |
| 293 |
|
|
| 21.3.8 | Marine Terminal Facilities |
| 294 |
|
|
| 21.3.9 | Ferry |
| 294 |
|
|
| 21.3.10 | Access Roads |
| 295 |
|
|
| 22 | ECONOMIC ANALYSIS |
| 296 |
|
|
| 22.1 | Forward-Looking Information |
| 296 |
|
|
| 22.2 | Summary |
| 297 |
|
|
| 22.3 | Methodology |
| 299 |
|
|
| 22.4 | Inputs to the Cash Flow Models |
| 299 |
|
|
| 22.5 | Pre-Tax Financial Evaluation |
| 308 |
|
|
| 22.5.1 | Pre-Tax Evaluation Basis |
| 308 |
|
|
| 22.5.2 | Pre-Tax Financial Results |
| 308 |
|
|
| 22.6 | Post-Tax Financial Analysis |
| 310 |
|
|
| 22.6.1 | Overview |
| 310 |
|
|
| 22.6.2 | U.S. Federal and Alaska State Corporate Income Tax |
| 310 |
|
|
| 22.6.3 | Lake and Peninsula Borough Severance Tax |
| 310 |
|
|
| 22.6.4 | Alaska State Royalty Tax |
| 311 |
|
|
| 22.6.5 | Alaska Mining License Tax |
| 311 |
|
|
| 22.6.6 | Post-Tax Financial Results |
| 311 |
|
|
| 22.7 | Cash Flow |
| 311 |
|
|
| 22.8 | Sensitivity Analysis |
| 313 |
|
|
| 22.8.1 | Copper and Gold Price Sensitivity Analysis |
| 315 |
|
|
| 22.8.2 | Sensitivity Analysis to Changes in Capital Costs |
| 315 |
|
|
| 22.8.3 | Potential Expansions |
| 318 |
|
|
| 23 | ADJACENT PROPERTIES |
| 323 |
|
|
| 24 | OTHER RELEVANT DATA AND INFORMATION |
| 324 |
|
|
| 25 | INTERPRETATION AND CONCLUSIONS |
| 325 |
|
|
| 25.1 | Introduction |
| 325 |
|
|
| 25.2 | Mineral Tenure, Surface Rights, Water Rights, Royalties and Agreements |
| 325 |
|
|
| 25.3 | Geology and Mineralization |
| 326 |
|
|
| 25.4 | Exploration, Drilling, and Analytical Data Collection in Support of Mineral Resource Estimation |
| 326 |
|
|
| Pebble Project | Page ix |
| NI 43-101 Technical Report Update and Preliminary Economic Assessment | August 21, 2023 |
|
|
|
|
| 25.5 | Metallurgical Testwork |
| 327 |
|
|
| 25.6 | Mineral Resource Estimates |
| 327 |
|
|
| 25.7 | Mining Methods |
| 328 |
|
|
| 25.8 | Recovery Methods |
| 328 |
|
|
| 25.9 | Infrastructure |
| 329 |
|
|
| 25.10 | Environmental, Permitting, Closure and Social |
| 329 |
|
|
| 25.11 | Markets and Contracts |
| 331 |
|
|
| 25.12 | Capital and Operating Costs |
| 332 |
|
|
| 25.13 | Economic Analysis |
| 332 |
|
|
| 25.14 | Potential Expansions |
| 332 |
|
|
| 25.15 | Risks and Opportunities |
| 333 |
|
|
| 25.15.1 | Risks |
| 333 |
|
|
| 25.15.2 | Opportunities |
| 335 |
|
|
| 26 | RECOMMENDATIONS |
| 337 |
|
|
| 26.1 | Introduction |
| 337 |
|
|
| 26.2 | Metallurgical Testwork |
| 337 |
|
|
| 26.2.1 | Metallurgy Testwork |
| 337 |
|
|
| 26.2.2 | Grinding Circuit SAG Mill Size |
| 337 |
|
|
| 26.2.3 | Flotation Circuit Optimization |
| 337 |
|
|
| 26.2.4 | Estimated Metallurgical Program Cost |
| 338 |
|
|
| 26.3 | Mineral Resource Estimate |
| 338 |
|
|
| 26.3.1 | Update of Inferred Resource |
| 338 |
|
|
| 26.3.2 | Block Model Update |
| 338 |
|
|
| 26.3.3 | Additional Metals |
| 338 |
|
|
| 26.3.4 | Estimated Resource Update Cost |
| 338 |
|
|
| 26.4 | Mining Methods |
| 338 |
|
|
| 26.5 | Process and Infrastructure Engineering |
| 339 |
|
|
| 26.5.1 | Process Plant and Infrastructure |
| 339 |
|
|
| 26.5.2 | Access Road |
| 339 |
|
|
| 26.6 | Tailings and Waste Management |
| 340 |
|
|
| 27 | REFERENCES |
| 341 |
|
|
List of Tables
| Table 1‑1: | Projected Metallurgical Recoveries |
| 12 |
|
| Table 1‑2: | Pebble Deposit Mineral Resource Estimate at 0.3% Copper Equivalent Cut-off June 1, 2023 |
| 13 |
|
| Table 1‑3: | Proposed Project Production Summary |
| 16 |
|
| Table 1‑4: | Pebble Proposed Project – Capital Cost Estimate |
| 25 |
|
| Pebble Project | Page x |
| NI 43-101 Technical Report Update and Preliminary Economic Assessment | August 21, 2023 |
|
|
|
|
| Table 1‑5: | Summary of Annual Operating Cost Estimate |
| 26 |
|
| Table 1‑6: | Forecast Metal Price |
| 27 |
|
| Table 1‑7: | Proposed Project Cost and Tax Summary |
| 27 |
|
| Table 1‑8: | Forecast Financial Results for the Proposed Project - Base Case (Post Tax) |
| 28 |
|
| Table 1‑9: | Proposed Project Full Capital Case Financial Results |
| 29 |
|
| Table 1‑10: | Potential Expansions Metrics Information |
| 30 |
|
| Table 1‑11: | Potential Expansions Financial Results1 |
| 31 |
|
| Table 1‑12: | Summary Sensitivities of Adding a Gold Plant in Year 5 to Proposed Expansions |
| 31 |
|
| Table 1‑13: | Gold Plant Expansions Financial Results |
| 32 |
|
| Table 1‑14: | Cost Summary for the Recommended Future Work |
| 36 |
|
| Table 2‑1: | Report Contributors |
| 42 |
|
| Table 2‑2: | Units and Abbreviations |
| 45 |
|
| Table 2‑3: | Unit Abbreviations |
| 48 |
|
| Table 6‑1: | Teck Drilling on the Sill Prospect to the End of 1997 |
| 61 |
|
| Table 6‑2: | Teck Drilling on the Pebble Deposit to the End of 1997 |
| 61 |
|
| Table 6‑3: | Total Teck Drilling on the Property to the End of 1997 |
| 61 |
|
| Table 6‑4: | Teck Resource Estimates |
| 63 |
|
| Table 10‑1: | Summary of Drilling to December 2019 |
| 90 |
|
| Table 10‑2: | Summary of All Bulk Density (g/cm3) Results |
| 100 |
|
| Table 11‑1: | ALS Aqua Regia Digestion Multi-Element Analytical Method ME-ICP41 |
| 104 |
|
| Table 11‑2: | ALS Additional Analytical Procedures |
| 104 |
|
| Table 11‑3: | ALS Precious Metal Fire Assay Analytical Methods |
| 105 |
|
| Table 11‑4: | SGS Copper Analytical Method ICAY50 |
| 105 |
|
| Table 11‑5: | SGS Gold Fire Assay Analytical Methods |
| 105 |
|
| Table 11‑6: | SGS Aqua Regia Digestion Multi-Element Analytical Method ICP70 |
| 106 |
|
| Table 11‑7: | ALS Four Acid Digestion Multi-Element Analytical Method ME-ICP61a |
| 107 |
|
| Table 11‑8: | ALS Four Acid Digestion Multi-Element Analytical Method ME-MS61 |
| 108 |
|
| Table 11‑9: | ALS Mercury Aqua Regia Digestion Analytical Methods |
| 108 |
|
| Table 11‑10: | ALS Copper Speciation Analytical Methods |
| 109 |
|
| Table 11‑11: | BVCCL Four Acid Digestion Multi-Element Analytical Method MA270 |
| 109 |
|
| Table 11‑12: | BVCCL Precious Metal Fire Assay Analytical Method |
| 110 |
|
| Table 11‑13: | QA/QC Sample Types Used |
| 111 |
|
| Table 12‑1: | Holes Inspected for Spot Checks Against Core Logging and Assay Intervals |
| 125 |
|
| Table 13‑1: | Testwork Programs and Reports 2006 to 2010 |
| 130 |
|
| Table 13‑2: | Subsequent Testwork Programs and Reports, 2011 to 2014 |
| 132 |
|
| Table 13‑3: | Pebble West Rod Mill Data Comparison, SGS January 20122 |
| 133 |
|
| Table 13‑4: | Pebble West Ball Mill Data Comparison, SGS January 20122 |
| 133 |
|
| Table 13‑5: | Bond Low-Energy Impact Test Results, SGS January 2012 |
| 133 |
|
| Table 13‑6: | Major SMC Data Comparison on Pebble West Samples |
| 134 |
|
| Table 13‑7: | Major SMC Data Comparison on Pebble East Samples |
| 134 |
|
| Table 13‑8: | MacPherson Autogenous Grindability Test Results, SGS, January 2012 |
| 135 |
|
| Table 13‑9: | Summary of Locked-Cycle Test Variability Test Results |
| 138 |
|
| Pebble Project | Page xi |
| NI 43-101 Technical Report Update and Preliminary Economic Assessment | August 21, 2023 |
|
|
|
|
| Table 13‑10: | Locked-Cycle Test Results on Pebble Variability Samples, SGS Lakefield, 2014 |
| 138 |
|
| Table 13‑11: | Locked-Cycle Test Results of Bulk Samples, SGS Lakefield, 2012 |
| 139 |
|
| Table 13‑12: | Locked-Cycle Test Results of Molybdenum Flotation |
| 143 |
|
| Table 13‑13: | Molybdenum Recovery |
| 143 |
|
| Table 13‑14: | Open Cycle Cleaner Flotation Test Results (Mo-F13, SGS Lakefield, 2012) |
| 144 |
|
| Table 13‑15: | LCT Cu-Mo Concentrate Major Elements Analysis Results – SGS Lakefield, 2014 |
| 149 |
|
| Table 13‑16: | LCT Cu Concentrate Major Elements Analysis Results – SGS Lakefield, 2014 |
| 149 |
|
| Table 13‑17: | LCT Mo Concentrate Major Elements Analysis Results – SGS 2014 |
| 150 |
|
| Table 13‑18: | Summary of Batch Recovery Change per 10 µm Primary Grind Size Reduction |
| 157 |
|
| Table 13‑19: | Change in Metal Recovery for 101µm Primary Grind Size Reduction, P80 150 µm to 300 µm |
| 157 |
|
| Table 13‑20: | Projected Metallurgical Recoveries Tetra Tech, 2021 |
| 158 |
|
| Table 14‑1: | Pebble Deposit Mineral Resource Estimate at 0.3% Copper Equivalent Cut-off June 1, 2023 |
| 160 |
|
| Table 14‑2: | Pebble Deposit Metal Domains |
| 161 |
|
| Table 14‑3: | Correlation Coefficients Between Rhenium and Other Elements |
| 165 |
|
| Table 14‑4: | Predicted and Actual Rhenium for 50 Withheld Validation Samples, at 10 ft Scale and at 50 ft Scale |
| 167 |
|
| Table 14‑5: | Pebble Deposit Assay Database Descriptive Global Statistics |
| 169 |
|
| Table 14‑6: | Pebble Deposit Capping Values |
| 176 |
|
| Table 14‑7: | Pebble Deposit Composite Mean Values |
| 177 |
|
| Table 14‑8: | Pebble Deposit Variogram Parameters |
| 178 |
|
| Table 14‑9: | Pebble Deposit Search Ellipse Parameters |
| 179 |
|
| Table 14‑10: | Pebble Deposit 2020 Block Model Parameters |
| 180 |
|
| Table 14‑11: | Pebble Deposit Domain Interpolation Data Sources |
| 180 |
|
| Table 14‑12: | Pebble Deposit Conceptual Pit Parameters |
| 182 |
|
| Table 16‑1: | Pit Optimization Parameters |
| 192 |
|
| Table 16‑2: | Haul Road Width |
| 196 |
|
| Table 16‑3: | Open Pit Design Results |
| 197 |
|
| Table 16‑4: | Mined Material – Preproduction Phase |
| 198 |
|
| Table 16‑5: | Mined Material – Production Phase |
| 198 |
|
| Table 16‑6: | Production Forecast |
| 198 |
|
| Table 16‑7: | Overburden and Waste Rock Mined Over the LOM |
| 200 |
|
| Table 16‑8: | Operational Delays per Shift |
| 202 |
|
| Table 16‑9: | Primary Equipment Requirements |
| 202 |
|
| Table 16‑10: | Support Equipment Requirements |
| 203 |
|
| Table 16‑11: | Ancillary Equipment Requirements |
| 204 |
|
| Table 16‑12: | Operator and Maintenance Staff on Payroll |
| 204 |
|
| Table 16‑13: | Maximum Number of Employees over the Life of Mine |
| 205 |
|
| Table 17‑1: | Major Process Design Criteria |
| 208 |
|
| Table 17‑2: | Reagent and Comminution Consumables Consumptions |
| 212 |
|
| Table 18‑1: | Overview of Pebble WTPs during Operations, Closure, and Post-Closure |
| 231 |
|
| Table 18‑2: | Site Parameters and Design Operating Conditions for Proposed Project Power Plant |
| 240 |
|
| Table 19‑1: | Metal Prices |
| 252 |
|
| Table 19‑2: | Average Metal Prices (Data from S&P Market Intelligence, July 2023) |
| 252 |
|
| Pebble Project | Page xii |
| NI 43-101 Technical Report Update and Preliminary Economic Assessment | August 21, 2023 |
|
|
|
|
| Table 19‑3: | Smelter and Refinery Terms |
| 254 |
|
| Table 20‑1: | Permits Required for the Pebble Project |
| 274 |
|
| Table 21‑1: | Summary of Capital Cost Estimate |
| 279 |
|
| Table 21‑2: | Mining Direct Capital Cost Estimate |
| 280 |
|
| Table 21‑3: | Feed Material Handling and Process Plant Capital Cost Summary |
| 281 |
|
| Table 21‑4: | Tailings and Water Management Direct Capital Cost Estimate |
| 281 |
|
| Table 21‑5: | Site General Capital |
| 282 |
|
| Table 21‑6: | Water Treatment Plants Direct Capital Cost Estimate |
| 282 |
|
| Table 21‑7: | On-Site Infrastructure Direct Capital Cost Estimate |
| 283 |
|
| Table 21‑8: | Power Generation and Natural Gas Pipeline Capital Cost Summary |
| 284 |
|
| Table 21‑9: | Marine Terminal Facilities Direct Capital Costs |
| 284 |
|
| Table 21‑10: | Iliamna Lake Ferry Capital Cost |
| 285 |
|
| Table 21‑11: | External Access Roads Direct Capital Cost Estimate |
| 285 |
|
| Table 21‑12: | Distribution of Indirect Costs |
| 286 |
|
| Table 21‑13: | Earthworks and Reclamation Closure Costs |
| 288 |
|
| Table 21‑14: | Closure Water Handling Systems |
| 289 |
|
| Table 21‑15: | Closure Water Treatment Plant Reconfiguration Costs |
| 289 |
|
| Table 21‑16: | Closure Water Treatment Plant Sustaining Costs |
| 289 |
|
| Table 21‑17: | Summary of Annual Average Operating Cost Estimate |
| 290 |
|
| Table 21‑18: | Summary of Annual G&A Operating Cost Estimate |
| 291 |
|
| Table 21‑19: | Pit Mine Operating Costs |
| 291 |
|
| Table 21‑20: | Mining Consumable Consumptions |
| 292 |
|
| Table 21‑21: | Processing Costs |
| 292 |
|
| Table 21‑22: | Operating Consumable Costs |
| 293 |
|
| Table 21‑23: | Labor Costs |
| 293 |
|
| Table 21‑24: | WTP Annual Operating Cost Summary |
| 294 |
|
| Table 21‑25: | Marine Terminal Facilities Operating Costs |
| 294 |
|
| Table 21‑26: | Ferry Operating Cost |
| 295 |
|
| Table 22‑1: | Summary of Proposed Project Results, including the Royalty arrangement and Long-Term Metal Prices |
| 298 |
|
| Table 22‑2: | Summary of the Proposed Project Results |
| 298 |
|
| Table 22‑3: | Long-Term Metal Price Assumptions |
| 299 |
|
| Table 22‑4: | Proposed Project Production Summary - Life of Mine |
| 300 |
|
| Table 22‑5: | Proposed Project LOM Material Tonnages and Payable Metal Production, 10% Gold / 30% Silver Royalty |
| 301 |
|
| Table 22‑6: | Proposed Project Copper-Gold Concentrate Statistics |
| 302 |
|
| Table 22‑7: | Proposed Project Molybdenum-Rhenium Concentrate Statistics |
| 302 |
|
| Table 22‑8: | Proposed Project Cost and Tax Summary |
| 304 |
|
| Table 22‑9: | Pebble Project – Initial Capital |
| 305 |
|
| Table 22‑10: | Proposed Project Base Case Operating Costs – per Ton and Total Life of Mine |
| 306 |
|
| Table 22‑11: | Key Smelter Terms and Off-Site Costs |
| 307 |
|
| Table 22‑12: | Proposed Project Base Case Pre-Tax Financial Results |
| 309 |
|
| Pebble Project | Page xiii |
| NI 43-101 Technical Report Update and Preliminary Economic Assessment | August 21, 2023 |
|
|
|
|
| Table 22‑13: | Proposed Project Base Case Post-Tax Financial Results |
| 311 |
|
| Table 22‑14: | Base Case Annual Production Schedule and Estimated Cash Flow, 10% Gold / 30% Silver Royalty |
| 312 |
|
| Table 22‑15: | Metal Price Scenarios, Proposed Project Base Case, 10% Gold / 30% Silver Royalty |
| 315 |
|
| Table 22‑16: | Proposed Project Full Capital Case Pre-Tax Financial Results |
| 316 |
|
| Table 22‑17: | Potential Expansion Scenario Metrics |
| 319 |
|
| Table 22‑18: | Potential Expansion Scenario Financial Results |
| 320 |
|
| Table 22‑19: | Summary of Gold Plant Scenarios Production Information |
| 321 |
|
| Table 22‑20: | Gold Plant Scenarios Financial Results |
| 322 |
|
| Table 26‑1: | Cost Summary for the Recommended Future Work |
| 337 |
|
List of Figures
| Figure 1‑1: | Project Location Map |
| 2 |
|
| Figure 1‑2: | Proposed Infrastructure |
| 4 |
|
| Figure 1‑3: | Mine Site Layout |
| 5 |
|
| Figure 1‑4: | Simplified Process Flowsheet |
| 15 |
|
| Figure 4‑1: | Property Location Plan |
| 52 |
|
| Figure 4‑2: | Mineral Claim Map with Exploration Lands and Resource Lands |
| 54 |
|
| Figure 5‑1: | Property Location and Access Map |
| 57 |
|
| Figure 7‑1: | Location of the Pebble Deposit & Regional Geological Setting of Southwest Alaska |
| 67 |
|
| Figure 7‑2: | Rock Types in the Pebble District |
| 68 |
|
| Figure 7‑3: | Geology of the Pebble Deposit Showing Section Locations |
| 72 |
|
| Figure 7‑4: | Plan View of Alteration and Metal Distribution in the Pebble Deposit |
| 73 |
|
| Figure 7‑5: | Geology, Alteration and Distribution of Metals, Section A-A′ |
| 74 |
|
| Figure 7‑6: | Geology, Alteration and Metal Distribution, Section B-B′ |
| 74 |
|
| Figure 7‑7: | Geology, Alteration and Metal Distribution, Section C-C′ |
| 74 |
|
| Figure 7‑8: | Drill Core Photograph Showing Chalcopyrite Mineralization |
| 82 |
|
| Figure 7‑9: | Drill Core Photograph Showing Chalcopyrite and Bornite Mineralization |
| 83 |
|
| Figure 10‑1: | Project Drill Hole Location Map |
| 88 |
|
| Figure 10‑2: | Location of Drill Holes – Pebble Deposit Area |
| 89 |
|
| Figure 10‑3: | Location of Drill Holes and Representative Sections - Pebble Deposit Area |
| 96 |
|
| Figure 10‑4: | Cross-Section 1401500E |
| 97 |
|
| Figure 10‑5: | Cross-Section 1407900E |
| 98 |
|
| Figure 10‑6: | Longitudinal Section 2156000N |
| 99 |
|
| Figure 10‑7: | Longitudinal Section 2157500N |
| 99 |
|
| Figure 11‑1: | Pebble Project 2010 to 2013 Drill Core Sampling and Analytical Flow Chart |
| 110 |
|
| Figure 11‑2: | Performance of the Copper Standard CGS-16 in 2008 |
| 112 |
|
| Figure 11‑3: | Performance of the Gold Standard CGS-16 in 2008 |
| 112 |
|
| Figure 11‑4: | Comparison of Gold Duplicate Assay Results for 2004 to 2010 |
| 114 |
|
| Pebble Project | Page xiv |
| NI 43-101 Technical Report Update and Preliminary Economic Assessment | August 21, 2023 |
|
|
|
|
| Figure 11‑5: | Comparison of Copper Duplicate Assay Results for 2004 to 2010 |
| 114 |
|
| Figure 11‑6: | Performance of Standard PLP-1 for Rhenium |
| 116 |
|
| Figure 11‑7: | Performance of Control Sample PLP-2 for Rhenium |
| 117 |
|
| Figure 11‑8: | Scatterplots in Log Format of Original vs. 2020 Re-Analysis for Copper and Molybdenum |
| 118 |
|
| Figure 12‑1: | Pebble Iliamna, AK Core Storage Facility, February 2, 2023 |
| 126 |
|
| Figure 12‑2: | XY Scatterplot Comparison for Au (top left), Ag (top right), Cu (bottom left), Mo (bottom left) |
| 127 |
|
| Figure 13‑1: | Basic Testwork Flowsheet |
| 137 |
|
| Figure 13‑2: | Basic Testwork Flowsheet |
| 142 |
|
| Figure 13‑3: | Rhenium Grade and Recovery Relationship |
| 145 |
|
| Figure 13‑4: | Pyrite Flotation Kinetics Test Results |
| 146 |
|
| Figure 13‑5: | Bulk Cyanidation Silver Extraction Kinetics |
| 148 |
|
| Figure 13‑6: | Effect of Primary Grind Fineness of Copper Recovery to Rougher Concentrate |
| 154 |
|
| Figure 13‑7: | Effect of Primary Grind Size on Cu, Au, and Mo Recovery to Batch Copper-gold Concentrate |
| 155 |
|
| Figure 13‑8: | Cu, Au, and Mo Recovery into a 26% Batch Cu Concentrate |
| 156 |
|
| Figure 14‑1: | Pebble Deposit Plan View of Drill Holes and Block Model Extent (red rectangle) |
| 162 |
|
| Figure 14‑2: | Growth in the Percentage of Drill Hole Sample Intervals with Rhenium Assays |
| 163 |
|
| Figure 14‑3: | Block Model (red line); DDH Collars and Re Analyses; Lacking (grey), Existing (yellow), 2020 Pulps (red) |
| 164 |
|
| Figure 14‑4: | Rhenium vs. Molybdenum |
| 165 |
|
| Figure 14‑5: | Rhenium Predications vs. Actual Rhenium Assays for Withheld Validation Samples |
| 166 |
|
| Figure 14‑6: | Pebble Deposit Copper Assay Domain Box-and-Whisker Plots |
| 170 |
|
| Figure 14‑7: | Pebble Deposit Gold Assay Domain Box-and-Whisker Plots |
| 171 |
|
| Figure 14‑8: | Pebble Deposit Molybdenum Assay Box-and-Whisker Plots |
| 172 |
|
| Figure 14‑9: | Pebble Deposit Silver Assay Box-and-Whisker Plots |
| 173 |
|
| Figure 14‑10: | Pebble Deposit Rhenium Assay Box-and-Whisker Plots |
| 174 |
|
| Figure 14‑11: | Pebble Deposit Copper Grade Domains |
| 175 |
|
| Figure 14‑12: | Pebble Deposit Vertical Section Showing Block and Composite Copper Grades; Section Line 2158700N |
| 185 |
|
| Figure 14‑13: | Copper Swath Plot at 2157000N |
| 186 |
|
| Figure 14‑14: | Gold Swath Plot at 2157000N |
| 186 |
|
| Figure 14‑15: | Molybdenum Swath Plot at 2157000N |
| 187 |
|
| Figure 14‑16: | Rhenium Swath Plot at 2157000N |
| 187 |
|
| Figure 16‑1: | Proposed Open Pit |
| 191 |
|
| Figure 16‑2: | Pit Wall Slope for Cretaceous North West Sector |
| 194 |
|
| Figure 16‑3: | Pit Wall Slope for Cretaceous North Sector |
| 195 |
|
| Figure 16‑4: | Two-Way Haul Road |
| 196 |
|
| Figure 16‑5: | Final Open Pit |
| 197 |
|
| Figure 16‑6: | Production Forecast |
| 199 |
|
| Figure 17‑1: | Simplified Process Flowsheet |
| 207 |
|
| Figure 18‑1: | Mine Site Infrastructure |
| 216 |
|
| Figure 18‑2: | Proposed Infrastructure |
| 217 |
|
| Figure 18‑3: | Overview of Road Alignment from Amakdedori to Mine Site |
| 219 |
|
| Figure 18‑4: | Modeled Annual Precipitation Series |
| 229 |
|
| Pebble Project | Page xv |
| NI 43-101 Technical Report Update and Preliminary Economic Assessment | August 21, 2023 |
|
|
|
|
| Figure 18‑5: | Proposed Marine Terminal Facilities Site Plan |
| 244 |
|
| Figure 18‑6: | Rendering of the Marine Facilities, Amakdedori |
| 245 |
|
| Figure 18‑7: | Rendering of Concentrate Transshipment to Bulk Vessel Moored Offshore |
| 247 |
|
| Figure 18‑8: | Rendering of the North Ferry Terminal at Eagle Bay, Lake Iliamna |
| 248 |
|
| Figure 18‑9: | Rendering of the South Ferry Terminal at Lake Iliamna, with Ferry Construction Area |
| 248 |
|
| Figure 18‑10: | Ice-Breaking Ferry |
| 250 |
|
| Figure 18‑11: | Ferry Assembly Facility at South Ferry Terminal |
| 251 |
|
| Figure 19‑1: | Copper Concentrate Production |
| 255 |
|
| Figure 19‑2: | Molybdenum Concentrate Production |
| 256 |
|
| Figure 20‑1: | Bristol Bay Watersheds |
| 258 |
|
| Figure 20‑2: | Local Watershed Boundaries |
| 262 |
|
| Figure 22‑1: | Copper-Gold Concentrate Production |
| 301 |
|
| Figure 22‑2: | Molybdenum-Rhenium Concentrate Production |
| 302 |
|
| Figure 22‑3: | Pebble Project – Initial and Sustaining Capital Phasing |
| 306 |
|
| Figure 22‑4: | C1 Cash Costs, Base Case |
| 307 |
|
| Figure 22‑5: | Post-Tax Sensitivity Analysis, Base Case, 10% Gold and 30% Silver Royalty |
| 313 |
|
| Figure 22‑6: | Post-Tax IRR, Base Case, 10% Gold and 30% Silver Royalty |
| 314 |
|
| Figure 22‑7: | Post-Tax Sensitivity Analysis, Full Capital Case, 10% Gold and 30% Silver Royalty |
| 317 |
|
| Figure 22‑8: | Post-Tax IRR, Full Capital Case, 10% Gold and 30% Silver Royalty |
| 317 |
|
Appendices
Appendix A – MINERAL CLAIMS
| Pebble Project | Page xvi |
| NI 43-101 Technical Report Update and Preliminary Economic Assessment | August 21, 2023 |
|
|
|
|
1 SUMMARY
1.1 Introduction
Northern Dynasty Minerals Ltd. (Northern Dynasty) is a Canadian company that is focused on developing the Pebble Project, a large copper-gold-molybdenum-silver-rhenium deposit in southwest Alaska. The company is listed on the TSX (NDM) and NYSE American (NAK). The company commissioned Ausenco Engineering Canada Inc. and Ausenco Sustainability Inc. (Ausenco) to compile this preliminary economic assessment (2023 PEA) of the Pebble Project. The 2023 PEA was prepared in accordance with the Canadian disclosure requirements of national instrument 43 101 (NI 43-101) and in accordance with the requirements of Form 43-101 F1. The responsibilities of the engineering companies who were contracted by Northern Dynasty to prepare this report are as follows:
| · | Ausenco managed and coordinated the work related to the report and developed PEA-level design, including capital and operating cost estimates for the process plant, general site infrastructure, environment and permitting, economic analysis and completed a review of the environmental studies. They also completed the work related to property description, accessibility, local resources, data verification and ferry. |
|
|
|
| · | Tetra Tech Inc. (Tetra Tech) audited the mineral resource estimate for the Pebble Project, including reviewing the site exploration, drilling, resource data base, and resource estimate. They also reviewed the metallurgical testwork. |
|
|
|
| · | NANA Worley, LLC (NANA Worley) designed the mine site and marine terminal power plants and natural gas pipeline, including the capital and operating cost estimates associated with it. NANA Worley also engaged Worley (Worley) to update the previously designed open pits, mine production forecasts, and mine capital and operating cost estimates from the 2022 PEA for the 2023 PEA. |
|
|
|
| · | Knight Piésold Ltd. (Knight Piésold) developed the tailings and waste management storage facilities, site water management and closure plan. |
|
|
|
| · | RECON LLC (RECON) completed the designs for the access road and developed the associated capital and operating costs. |
|
|
|
| · | HDR Alaska Inc. (HDR) designed the water treatment plants and developed the capital and operating cost for them. |
The Pebble deposit was originally discovered in 1989 and was acquired by Northern Dynasty in 2001, and subsequently the Pebble Limited Partnership (“Pebble Partnership”), in which Northern Dynasty currently owns a 100% interest, has completed significant mineral exploration, environmental baseline data collection, and engineering studies to advance the Pebble Project. The Pebble deposit contains considerable amounts of copper, gold, molybdenum, silver, and rhenium.
Since the acquisition by Northern Dynasty, exploration led to an overall expansion of the Pebble deposit, as well as the discovery of several other mineralized occurrences along an extensive northeast-trending mineralized system underlying the property. Over 1 million feet of drilling has been completed on the property, a large proportion of which has been focused on the Pebble deposit.
Comprehensive deposit delineation, environmental, socioeconomic, and engineering studies of the Pebble deposit began in 2004 and continued through 2013.
| Pebble Project | Page 1 |
| NI 43-101 Technical Report Update and Preliminary Economic Assessment | August 21, 2023 |
|
|
|
|
1.2 Project Location
The Pebble deposit is located in southwest Alaska, 200 mi southwest of Anchorage, 17 mi northwest of the village of Iliamna, 100 mi northeast of Bristol Bay, and 60 mi west of Cook Inlet (see Figure 1-1).
Figure 1‑1: Project Location Map
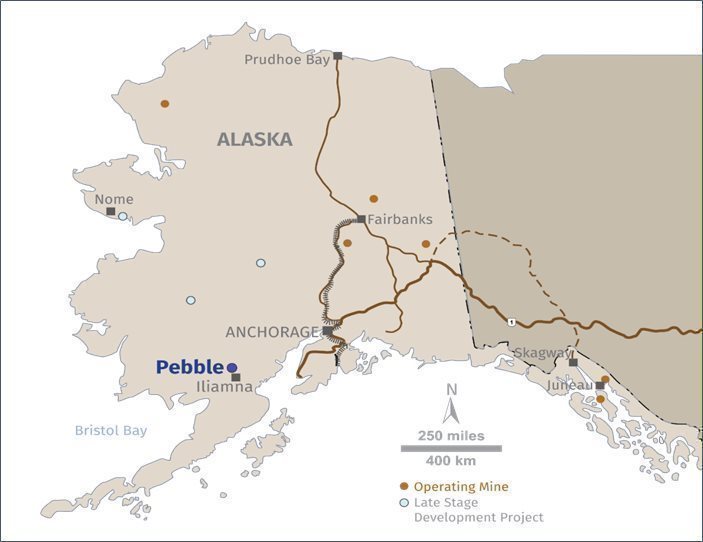
Note: Prepared by NDM, 2021.
1.3 Property Description
Northern Dynasty holds, indirectly through Pebble East Claims Corporation and Pebble West Claims Corporation, (both of which are wholly owned subsidiaries of the Pebble Partnership), a 100% interest in a contiguous block of 1,840 mining claims and leasehold locations covering 274 square miles, which includes the Pebble deposit.
| Pebble Project | Page 2 |
| NI 43-101 Technical Report Update and Preliminary Economic Assessment | August 21, 2023 |
|
|
|
|
1.4 Project Description
On December 22, 2017, the Pebble Partnership submitted its permit application under the Clean Water Act (CWA) and the Rivers and Harbors Act (RHA). The project description in the permit application envisaged the Pebble deposit would be developed as an open pit mine with associated on and off-site infrastructure. Over the course of the subsequent 30 months, additional engineering work completed to support the environmental assessment process, as well as recommendations from the US Army Corps of Engineers (USACE) in the final EIS (FEIS), resulted in modifications to the plan and the project description was updated accordingly. The proposed project as described in the 2023 PEA corresponds to the project description issued with the June 2020 Revised Project Application, which is attached to the FEIS. Project infrastructure includes the following:
| · | 270 MW power plant located at the mine site, |
|
|
|
| · | 6 MW power plant located at the marine terminal, |
|
|
|
| · | 187 mi natural gas pipeline connecting existing supply on the Kenai Peninsula to the power plants at the marine terminal and mine sites, respectively. The pipeline routing will include crossing Cook Inlet and crossing Lake Iliamna, |
|
|
|
| · | 97 mi transportation corridor from the mine site to the marine terminal, located near Amakdedori in Kamishak Bay on Cook Inlet, which includes the following: |
|
| o | 25-mile lake crossing via ferry, |
|
|
|
|
|
| o | private two-lane unpaved road that also connects to the existing Iliamna/Newhalen road system, |
|
|
|
|
|
| o | onshore portion of the natural gas pipeline, buried adjacent to the road, |
| · | a marine terminal incorporating the following: |
|
| o | storage and handling, |
|
|
|
|
|
| o | fuel and supply storage, and |
|
|
|
|
|
| o | barge docks for receiving supplies and to facilitate bulk transshipment of concentrate to offshore locations near Amakdedori for loading onto bulk carriers. |
The project and relating offsite infrastructure are presented in Figure 1-2, and the mine site layout is shown in Figure 1-3.
| Pebble Project | Page 3 |
| NI 43-101 Technical Report Update and Preliminary Economic Assessment | August 21, 2023 |
|
|
|
|
Figure 1‑2: Proposed Infrastructure

Note: Figure prepared by NDM, 2023.
| Pebble Project | Page 4 |
| NI 43-101 Technical Report Update and Preliminary Economic Assessment | August 21, 2023 |
|
|
|
|
Figure 1‑3: Mine Site Layout

Note: Figure prepared by Knight Piésold, 2020.
| Pebble Project | Page 5 |
| NI 43-101 Technical Report Update and Preliminary Economic Assessment | August 21, 2023 |
|
|
|
|
Following an estimated 4.5 years of construction activity, the proposed project would operate for 20 years, with conventional drill-and-blast shovel-¬truck operations in an open pit feeding a conventional copper porphyry flotation process plant. The mining rate would average 70 million tons per year, with 66 million tons of mineralized material processed through the process plant each year (180,000 tons per day), for a low life-of-mine strip ratio of waste to mineralized material of 0.12:1.
The development proposed in Pebble Limited Partnership’s project description is substantially smaller than that envisioned in a 2011 Technical Report (Ghaffari et al, 2011), and presents significant new environmental safeguards, including the following:
| · | a development footprint less than half the size previously envisaged; |
|
|
|
| · | the consolidation of most major mine site infrastructure in a single drainage (the North Fork Koktuli River) and the absence of any primary mine operations in the Upper Talarik Creek drainage; |
|
|
|
| · | more conservative tailings storage facility (TSF) designs, including enhanced buttresses, flatter slope angles, and improved factors of safety; |
|
|
|
| · | separation of pyritic tailings, which are potentially acid generating (PAG), from the non-potentially acid-generating (non-PAG) bulk tailings, with the pyritic tailings stored in a fully-lined TSF; |
|
|
|
| · | a comprehensive tailings and water management plan including a flowthrough design for the bulk TSF main embankment; |
|
|
|
| · | no permanent waste rock piles; and |
|
|
|
| · | no secondary gold recovery plant. |
The development plan outlined in the proposed project uses a portion of the currently estimated Pebble mineral resources. This does not preclude future development of additional resources, but such development would require additional evaluation and would be subject to separate permitting processes.
The Pebble Project consists of a number of components at the mine site, including the open pit mine, process plant, tailings and water management facilities, and other support facilities, and transportation and power supply infrastructure. These components as described in the 2023 PEA collectively constitute the project submitted by Pebble Partnership for CWA permitting in 2017 and subsequently amended during the process and are thus entitled the Proposed Project. This Proposed Project is described in the amended Project Description dated December 12, 2019. Capital and operating costs are estimated in the 2023 PEA for the Proposed Project. It is common in Alaska and elsewhere for third parties to participate in the development of the project through provision of infrastructure for which the project pays lease or usage fees. For example, the transportation infrastructure for the Red Dog Mine in Alaska is owned by the Alaska Industrial Development and Export Authority (AIDEA). AIDEA is also the proponent for a major transportation route in northern Alaska which would support the Arctic project. Such a scenario was developed for the Pebble Project and because it is the likely route to development, it is the Base Case.
1.5 Mineral Tenure, Surface Rights, Water Rights, Royalties and Agreements
Northern Dynasty does not own any surface rights associated with the Pebble property mineral claims. All mineral claims are on lands held by the State of Alaska and surface rights may be acquired from the state once areas required for mine development have been determined and permits awarded.
| Pebble Project | Page 6 |
| NI 43-101 Technical Report Update and Preliminary Economic Assessment | August 21, 2023 |
|
|
|
|
Both the access corridor north of Iliamna Lake as defined by the least environmentally destructive practicable alternative (LEDPA) in the FEIS and the originally proposed corridor crossing Iliamna Lake are owned by a number of landowners, including the State of Alaska, Alaska Native village corporations, and private individuals. Pebble Partnership has completed access agreements with two Native village corporations and a private individual. Under the terms of these agreements, the Native village corporations could receive significant sums over the life of the mine. Negotiations have advanced with other Native village corporations and individuals, but no agreements are in place. In June 2021, Pedro Bay Corporation (PBC) announced they had signed an agreement whereby a fund has obtained an option to buy portions of their land to create a conservation easement. PBC and the fund announced the exercise of the option in December 2022. While the Pebble Partnership has not explored the full range of options available to it with this announcement, its current assumption is the route defined in the June 2020 FEIS is no longer practicable and thus does not qualify as the LEDPA. Accordingly, the Pebble Partnership is analysing the amended version of the southern alternative originally proposed for the transportation route.
A portion of the mineral claims are subject to a net profits interest (NPI) royalty payable to Teck Resources Limited (Teck). However, the portion of the deposit to be mined by the proposed project lies outside the portion subject to the NPI and is therefore not subject to the Teck royalty. The project is subject to a State of Alaska royalty.
In July 2022, the Pebble Partnership entered into a Royalty Agreement whereby the royalty holder has the right to receive a portion of the gold and silver production from the proposed Pebble Project for the life of the mine. The royalty holder has the option to acquire up to 10% of the payable gold production and up to 30% of the payable silver production, in five separate tranches of $12 M, each. The payment for the first tranche has been received by the Pebble Partnership with the royalty holder having the option to increase its interest over the next two years. Each tranche entitles the royalty holder to 2% of the payable gold production and 6% of the payable silver production, after accounting for a notional payment by the royalty holder of $1,500 per ounce of gold and $10 per ounce of silver, respectively, for the life of the mine. The Pebble Partnership will share in 20% of excess prices above $4,000 per ounce for gold and $50 per ounce for silver and will retain a portion of the metal produced for recovery rates in excess of 60% for gold and 65% for silver. Both the currently paid first tranche and all five tranches are shown in the report to demonstrate the impact of the royalty at the current and full payment levels.
The Pebble Performance Dividend LLP will distribute a 3% net profits royalty interest in the project to adult residents of Bristol Bay villages that have subscribed as participants. The Pebble Performance Dividend will distribute a guaranteed minimum annual payment of US$3 M each year the Pebble mine operates beginning at the outset of construction. Total life-of-mine payments for the proposed project could total $190 M and could range as high as almost $3.9 B for the life of mine estimated in selected potential expansion scenarios which include a gold plant.
The Pebble property is within the Lake and Peninsula Borough and is subject to a 1.5% severance tax. The life-of-mine severance tax payments for the proposed project could total $530 M and range as high as $5.1 B for the life of mine estimated in selected potential expansion scenarios which include a gold plant.
Accordingly, the project could potentially provide more than $9.1 B to the Southwest Alaska region through the Pebble Performance Dividend and the Lake and Peninsula Borough severance tax over the life of mine that may be achieved in some of the potential expansion scenarios. This is in addition to the other significant benefits that could flow from the existing and possible future agreements with Alaska Native village corporations.
1.6 Geological Setting and Mineralization
Pebble is a porphyry-style copper-gold-molybdenum-silver-rhenium deposit that comprises the Pebble East and Pebble West zones of equal size, with slightly lower-grade mineralization in the center of the deposit where the two zones merge. The Pebble deposit is located at the intersection of crustal-scale structures that are oriented both parallel and obliquely to a magmatic arc which was active in the mid-Cretaceous and which developed in response to the northward subduction of the Pacific Plate beneath the Wrangellia Superterrane.
| Pebble Project | Page 7 |
| NI 43-101 Technical Report Update and Preliminary Economic Assessment | August 21, 2023 |
|
|
|
|
The oldest rock within the Pebble district is the Jurassic-Cretaceous age Kahiltna flysch, composed of turbiditic clastic sedimentary rocks, interbedded basalt flows and associated gabbro intrusions. During the mid-Cretaceous (99 to 96 Ma), the Kahiltna assemblage was intruded first by coeval granodiorite and diorite sills and slightly later by alkalic monzonite intrusions. At 90 Ma, hornblende diorite porphyry plutons of the Kaskanak batholith were emplaced. Copper-gold-molybdenum-silver-rhenium mineralization is related to smaller granodiorite plutons and dykes that are similar in composition to, and emplaced near and above the margins of, the Kaskanak batholith.
The Pebble East and Pebble West zones are coeval hydrothermal centers within a single magmatic-hydrothermal system. The movement of mineralizing fluids was constrained by a broadly vertical fracture system acting in conjunction with a hornfels aquitard that induced extensive lateral fluid migration. The large size of the deposit, as well as variations in metal grade and ratios, may be the result of multiple stages of metal introduction and redistribution.
Mineralization in the Pebble West zone extends from surface to 3,000 ft deep and is centered on four small granodiorite plutons. Mineralization is hosted by flysch, diorite and granodiorite sills, and alkalic intrusions and breccias. The Pebble East zone is of higher grade and extends to a depth of at least 5,810 ft; mineralization on the eastern side of the zone was later dropped 1,970 to 2,950 ft by normal faults which bound the northeast-trending East Graben. The Pebble East zone mineralization is hosted by granodiorite plutons and dykes, and by adjacent granodiorite sills and flysch. The Pebble East and West zone granodiorite plutons merge at depth.
Mineralization at Pebble is predominantly hypogene, although the Pebble West zone contains a thin zone of variably developed supergene mineralization overlain by a thin leached cap. Disseminated and vein-hosted copper-gold-molybdenum-silver-rhenium mineralization, dominated by chalcopyrite and locally accompanied by bornite, is associated with early potassic alteration in the shallow part of the Pebble East zone and with early sodic-potassic alteration in the Pebble West zone and deeper portions of the Pebble East zone. Rhenium occurs in molybdenite and high rhenium concentrations are present in molybdenite concentrates. Elevated palladium concentrations occur in many parts of the deposit but are highest in rocks affected by advanced argillic alteration. High-grade copper-gold mineralization also is associated with younger advanced argillic alteration that overprinted potassic and sodic-potassic alteration and was controlled by a syn-hydrothermal, brittle-ductile fault zone located near the eastern margin of the Pebble East zone. Late quartz veins introduced additional molybdenum into several parts of the deposit.
1.7 History
Cominco Alaska, a division of Cominco Ltd. (now Teck), began reconnaissance exploration in the Pebble region in the mid-1980s, and in 1984 discovered the Sharp Mountain gold prospect near the southern margin of the current property. Teck staked their first mineral claims on the property during reconnaissance mapping and sampling programs in the Cone and Sharp Mountain areas in August and September 1984. In November 1987, Teck staked claims on the newly discovered Sill and Pebble prospects and added claims to these two areas in July 1988. This staking, along with additional claims added in the 1990s, led to the formation of a large continuous claim group. Teck completed a two-part purchase option with Hunter Dickinson Group Inc. (HDGI), which in turn assigned 80% of that option to Northern Dynasty in October 2001.
The first part of the option agreement covered that portion of the property which had previously been drilled and on which the majority of the then known copper mineralization occurred (the Resource Lands Option) and the remaining area outside the Resource Lands (the Exploration Lands). In November 2004, Northern Dynasty exercised the Resource Lands Option and acquired 80% of the resource lands. In February 2005, Teck elected to sell its residual 50% interest in the Exploration Lands to Northern Dynasty for US$4 million. Teck still retains a 4% pre-payback advance net profits royalty interest (after debt service) and 5% after-payback net profits interest royalty in any mine production from the Exploration Lands portion of the Pebble property.
| Pebble Project | Page 8 |
| NI 43-101 Technical Report Update and Preliminary Economic Assessment | August 21, 2023 |
|
|
|
|
In June 2006, Northern Dynasty acquired, through its Alaska subsidiaries, the remaining HDGI 20% interest in the Resource Lands and Exploration Lands by acquiring HDGI from its shareholders and through its various subsidiaries had thereby acquired an aggregate 100% interest in the Pebble property, subject only to the Teck net-profits royalties on the Exploration Lands.
In July 2007, the Pebble Partnership was created and an indirectly wholly owned subsidiary of Anglo-American plc (Anglo American) subscribed for 50% of the Pebble Partnership's equity effective July 31, 2007. In December 2013, Northern Dynasty exercised its right to acquire Anglo American’s interest in the Pebble Partnership and now holds a 100% interest.
On June 29, 2010, Northern Dynasty entered into an agreement with Liberty Star Uranium and Metals Corp. and its subsidiary, Big Chunk Corp. (together, Liberty Star), pursuant to which Liberty Star sold 23.8 square miles of claims (the 95 purchased claims) to a U.S. subsidiary of Northern Dynasty in consideration for both a $1 M cash payment and a secured convertible loan from Northern Dynasty in the amount of $3 M. Northern Dynasty later agreed to accept transfer of 199 claims (the Settlement Claims) located north of the ground held 100% by the Pebble Partnership in settlement of the loan, and subsequently both the Purchased Claims and the Settlement Claims were transferred to a Northern Dynasty subsidiary and ultimately to Pebble West Claims Corporation, a subsidiary of the Pebble Partnership.
On January 31, 2012, the Pebble Partnership entered into a Limited Liability Company Agreement with Full Metal Minerals (USA) Inc. (FMMUSA), a wholly owned subsidiary of Full Metal Minerals Corp., to form Kaskanak Copper LLC. On May 8, 2013, the Pebble Partnership purchased FMMUSA’s ownership interest in the LLC for a cash consideration of $750,000. As a result, the Pebble Partnership gained a 100% ownership interest in the LLC, the indirect owner of a 100% interest in a group of 464 claims located south and west of other ground held by the Pebble Partnership. In 2014 the LLC was merged into Pebble East Claims Corporation, a subsidiary of the Pebble Partnership, which now holds title to these claims.
On December 15, 2017, Northern Dynasty entered into a framework agreement with First Quantum Minerals Ltd. (First Quantum) which contemplated that an affiliate of First Quantum would subsequently execute an option agreement with Northern Dynasty with an option payment of US$150 M staged over four years. This option would entitle First Quantum to acquire the right to earn a 50% interest in the Pebble Partnership for US$1.35 B. First Quantum made an early option payment of US$37.5 M to Northern Dynasty, applied solely for the purposes of progressing the permitting of the proposed project, but withdrew from the project in 2018.
In December 2017, Pebble Partnership filed an application for permits under the CWA and RHA, triggering the requirement for an environmental impact statement (EIS) under the National Environmental Policy Act (NEPA). The EIS was prepared by the US Army Corps of Engineers (USACE) with the final EIS (FEIS) published in July 2020. In November 2020, USACE issued its Record of Decision (ROD) denying Pebble Partnership’s application. The Pebble Partnership submitted a request for appeal (RFA), which was accepted by USACE in February 2021 and on April 25, 2023, the USACE Pacific Ocean Division remanded the decision back to the USACE Alaska District to re-evaluate specific issues. The USACE Alaska District was instructed to review the appeal decision and to notify the parties how it plans to proceed within 45 days. The USACE Alaska District requested four extensions to that deadline, with the most recent deadline extended to September 26, 2023. Even if the appeal is successful, there is no assurance that a positive ROD will ultimately be obtained by the Pebble Partnership or that the required environmental permit for the proposed project will be obtained.
In September 2020, Northern Dynasty published a technical report on the project to document recent studies of the occurrence of rhenium and to estimate the rhenium mineral resources in the deposit. Previous work indicated palladium is also present, at least in parts of the deposit; however, it was determined insufficient analyses have been completed to undertake a resource estimate for that metal. The report also updated the proposed plan for the project as documented in the FEIS. Several technical reports have been completed since that time, the most recent on June 1, 2023, to update the status of permitting and other aspects of the project.
| Pebble Project | Page 9 |
| NI 43-101 Technical Report Update and Preliminary Economic Assessment | August 21, 2023 |
|
|
|
|
On January 30, 2023, the US Environmental Protection Agency (EPA) issued a Final Determination under Section 404(c) of the CWA imposing limitations on the use of certain waters in the Bristol Bay watershed. The company and Pebble Partnership plan to seek judicial review of the Final Determination but there is no assurance that its challenge will be successful. The inability to successfully challenge the EPA’s Final Determination may ultimately mean that the company will be unable to proceed with the development of the Pebble Project as currently envisioned or at all.
In September 2021, Northern Dynasty published a preliminary economic assessment technical report (2021 PEA) to present the projected economics of the production plan and a corresponding project configuration which aligns with the June 2020 Revised Project Application. The 2021 PEA also explored potential expansion scenarios for the project. The 2021 PEA was based on the estimates of copper, gold, molybdenum, silver, and rhenium resources as presented in the September 2020 Technical Report.
In July 2022, Northern Dynasty announced the purchase of a royalty for the Pebble Project, giving the royalty holder the right to a portion of the gold and silver production from the mine. A PEA published in 2022 also provided an update on the status of project permitting and disclosed a change in the claim holdings for the project.
1.8 Exploration
Geological, geochemical, and geophysical surveys were conducted in the project area from 2001 to 2007 by Northern Dynasty and since mid-2007 by the Pebble Partnership.
Geological mapping for rock type, structure, and alteration was carried out between 2001 and 2006 over the entire project area. This work provided an important geological framework for interpretation of other exploration data and drilling programs.
Geophysical surveys were completed between 2001 and 2010. In 2001, dipole-dipole IP surveys totaling 19.3 line-mi were completed by Zonge Geosciences for Northern Dynasty, following up on and augmenting similar surveys completed by Teck. During 2002, a ground magnetometer survey totaling 11.6 line-mi was completed at Pebble. The principal objective of this survey was to obtain a higher resolution map of magnetic patterns than was available from existing regional government magnetic maps. During 2007, a limited magnetotelluric survey was completed by GSY-USA Inc., under the supervision of Northern Dynasty geologists. The survey focused on the area of drilling in the Pebble East zone and comprised 196 stations on nine east-west lines and one north-south line, at a nominal station spacing of 656 ft. In July 2009, Spectrem Air Limited completed an airborne electromagnetic, magnetic and radiometric survey over the Pebble area. The objectives of this work included providing geophysical constraints for structural and geological interpretation in areas with significant glacial cover. Between the second half of 2009 and mid-2010, 120.5 line-mi of IP chargeability and resistivity data were collected by Zonge Engineering and Research Organization Inc. The objective of this survey was to extend the area of IP coverage completed prior to 2001 by Teck and during 2001 by Northern Dynasty. During 2010, an airborne electromagnetic (EM) and magnetometer geophysical survey was completed on the Pebble property totaling 4,009 line-mi.
Geochemical surveys were completed between 2001 and 2012. Between 2001 and 2003, Northern Dynasty collected 1,026 soil samples (Rebagliati and Lang, 2009). Samples were more widely spaced near the north, west, and southwest margins of the grid. Three very limited surficial geochemical surveys were completed by the Pebble Partnership in 2010 and 2011; no significant geochemical anomalies were identified. A total of 126 samples, comprising 113 till and 13 soil samples, were collected on the KAS claims located in the southern end of the property; samples were on lines spaced 8,000 ft apart with a sample spacing of 1,300 ft. Additional surveys were completed between 2007 and 2012 by researchers from the USGS and the University of Alaska Anchorage. The results of these surveys were largely consistent with the results obtained by earlier soil sampling programs.
| Pebble Project | Page 10 |
| NI 43-101 Technical Report Update and Preliminary Economic Assessment | August 21, 2023 |
|
|
|
|
1.9 Drilling and Sampling
Samples from the 2002 through 2012 core drilling programs completed by Northern Dynasty and the Pebble Partnership provide 91% of the assays used in the mineral resource estimate. These drilling and sampling programs were carried out in a proficient manner consistent with industry standard practices at the time of the programs. Core recovery was typically very good and averaged over 98%; two-thirds of all measured intervals have 100% core recovery. No significant factors of drilling, sampling, or recovery that impact the accuracy and reliability of the results were observed.
The remaining 9% of assays used in the mineral resource estimate derive from historical 1988 to 1992 and 1997 Teck core drill programs. Northern Dynasty expended considerable effort to assess the veracity of the Teck drilling over several years. This included re-surveying drill hole locations, reviewing remaining half core, extensive re-drilling of areas targeted by Teck, and plotting and comparison of Teck drill holes with nearby Northern Dynasty drill holes. No significant factors related to drilling, sampling, or recovery were observed that impact the accuracy and reliability of the results obtained from the Teck drilling program.
1.10 Metallurgical Testwork
Metallurgical testwork for the project was initiated by Northern Dynasty in 2003 and continued under the direction of Northern Dynasty until 2008. From 2008 to 2013, metallurgical testwork progressed under the direction of the Pebble Partnership.
Geometallurgical studies were initiated by the Pebble Partnership in 2008 and continued through 2012. The principal objective of this work was to quantify significant differences in metal deportment that may result in variations in metal recoveries during mineral processing. The results of the geometallurgical studies indicate that the deposit comprises several geometallurgical (or material type) domains. These domains are defined by distinct, internally consistent copper and gold deportment characteristics that correspond spatially with changes in silicate and sulphide alteration mineralogy.
Metallurgical testwork and associated analytical procedures were performed by recognized testing facilities with extensive experience with these tests and analyses, with this type of deposit, and with the project. The samples selected for the comminution, copper-gold-molybdenum bulk flotation, and copper-molybdenum separation testing were considered to be representative of the various types and styles of mineralization at the Pebble deposit.
A conventional flotation process is proposed to produce saleable copper-gold and molybdenum concentrates. The flotation test results on variability samples derived from the 103 locked cycle flotation and the subsequent copper-molybdenum separation flotation tests indicate that marketable copper and molybdenum concentrates can be produced. The copper-gold concentrate will also contain gold and silver contents that meet or exceed payable levels in representative smelter contracts; the molybdenum concentrate will contain significant rhenium (Re), with a reported grade range from 791 to 832 g/t Re observed in the locked cycle test (LCT) results of the copper-molybdenum separation.
Gravity gold recovery tests were completed on three composite samples in 2010 and on four composite samples from the continuous testwork program. These demonstrated gold was recoverable by gravity and accordingly treatment of a side stream from the regrind circuit, with 1% overall gold recovery to a gravity concentrate. In the flowsheet for the proposed project, the gravity concentrate would be bagged and shipped off-site to a refinery. In the potential expansion scenarios with a secondary gold plant, the gravity concentrate would comprise a portion of the secondary gold plant feed.
| Pebble Project | Page 11 |
| NI 43-101 Technical Report Update and Preliminary Economic Assessment | August 21, 2023 |
|
|
|
|
A preliminary hydrometallurgical test program was performed on rougher and cleaner molybdenum concentrates to investigate the production of the marketable products of molybdenum trioxide (MoO3) and ammonium perrhenate (NH4ReO4). The test program included pressure oxidation leach, a series of metal extractions/purifications from the pregnant leach solution, and a calcination process. The tested methods were found technically feasible. Satisfactory dissolution rates of molybdenum and rhenium were obtained from the rougher molybdenum concentrate samples while additional alkaline leach is required on the pressure oxidation leach residues for the cleaner molybdenum concentrate samples.
The overall metal recovery projections of copper, gold, silver and molybdenum to concentrate in the 2023 PEA are identical to those reported in previous technical reports. Those values were adjusted to an increased primary grind size (from 125 µm to 135 µm) from those published in the 2018 technical report. A rhenium recovery estimate at a high level has been completed and included. Table 1-1 provides projected metals recoveries via flotation concentration. The recovery estimate bases are summarized as follows:
| · | The initial metal recovery projections of copper, gold, silver and molybdenum were published in 2014 based on a combined flotation and cyanide leach method. A total of 111 LCTs on the 103 samples representing eight geometallurgical domains across the east and west of Pebble deposit were reviewed to establish the copper, gold and molybdenum distributions to the bulk copper-molybdenum concentrate. Ten of the 111 LCTs with silver assay results were utilized to estimate the silver recovery to the bulk flotation concentrate. |
|
|
|
| · | The 2018 metal recoveries were updated to reflect the changes of the proposed processing methods. This included excluding the cyanide leach process and implementing a coarser primary grind particle size. |
|
|
|
| · | The 2020 metal recovery projections were further updated to include rhenium recovery from the molybdenum concentrate. The estimated rhenium recovery was 70.8%, based on the 10 LCT results of the rhenium recovery to the bulk concentrate, a one LCT stage recovery result in the subsequent separation of copper and molybdenum, as well as a recovery adjustment due to the change of primary grind size. |
Table 1‑1: Projected Metallurgical Recoveries
| Domain | Flotation Recovery % |
||||
| Cu Concentrate 26% Cu | Mo Concentrate, 50% Mo |
||||
| Cu | Au | Ag | Mo | Re |
|
| Supergene |
|||||
| Sodic Potassic | 74.7 | 60.4 | 64.1 | 51.2 | 70.8 |
| Illite Pyrite | 68.1 | 43.9 | 64.1 | 62.6 | 70.8 |
| Hypogene |
|||||
| Illite Pyrite | 91.0 | 46.2 | 67.5 | 77.1 | 70.8 |
| Sodic Potassic | 91.0 | 63.8 | 67.7 | 80.9 | 70.8 |
| Potassic | 93.0 | 63.1 | 66.0 | 84.8 | 70.8 |
| Quartz Pyrophyllite | 95.0 | 65.5 | 64.6 | 80.7 | 70.8 |
| Sericite | 91.0 | 41.3 | 67.5 | 77.1 | 70.8 |
| Quartz Sericite Pyrite | 90.5 | 33.3 | 67.5 | 86.8 | 70.8 |
| LOM Average | 87 | 60 | 67 | 75 | 71 |
Note: Prepared by Tetra Tech, 2021. An additional 1% Au recovery to the gravity concentrate is expected. LOM average per financial model.
| Pebble Project | Page 12 |
| NI 43-101 Technical Report Update and Preliminary Economic Assessment | August 21, 2023 |
|
|
|
1.11 Mineral Resource Estimation
The current resource estimate is based on 59,000 assays obtained from 699 drill holes. The resource was estimated by ordinary kriging and is presented in Table 1-2. The tabulation is based on copper equivalency (CuEq) that incorporates the contribution of copper, gold, and molybdenum. Although the estimate includes silver and rhenium, neither were used as part of the copper equivalency calculation in order to facilitate comparison with previous estimates which did not consider the minor economic contribution of either of these metals. Mineral resources that are not mineral reserves do not have demonstrated economic viability.
Table 1‑2: Pebble Deposit Mineral Resource Estimate at 0.3% Copper Equivalent Cut-off June 1, 2023
| Classification | Tonnes (Mt) | Grades | Recoverable Metal |
|||||||||
| CuEq (%) | Cu (%) | Au (g/t) | Ag (g/t) | Mo (ppm) | Re (ppm) | Cu (Blb) | Au (Moz) | Ag (Moz) | Mo (Blb) | Re (kg) |
||
| Measured | 527 | 0.65 | 0.33 | 0.35 | 1.7 | 178 | 0.32 | 3.35 | 4.58 | 20.4 | 0.15 | 118,000 |
| Indicated | 5,929 | 0.77 | 0.41 | 0.34 | 1.7 | 246 | 0.41 | 49.64 | 49.24 | 228.9 | 2.62 | 1,731,000 |
| M+I | 6,456 | 0.76 | 0.40 | 0.34 | 1.7 | 240 | 0.40 | 52.99 | 53.82 | 249.3 | 2.78 | 1,849,000 |
| Inferred | 4,454 | 0.55 | 0.25 | 0.25 | 1.2 | 226 | 0.36 | 22.66 | 28.11 | 121.7 | 1.81 | 1,025,000 |
Notes:
| 1. | David Gaunt, P. Geo., estimated the resource which has been audited by Greg Z. Mosher, P. Geo., a Qualified Person who is independent of Northern Dynasty and who assumes responsibility for this estimate. |
| 2. | Copper equivalent (CuEq) calculations use the following metal prices: US$1.85 /lb for Cu, US$902 /oz for Au and US$12.50 /lb for Mo, and recoveries: 85% Cu, 69.6% Au, and 77.8% Mo (Pebble West zone) and 89.3% Cu, 76.8% Au, 83.7% Mo (Pebble East zone). |
| 3. | Recovered metal based on recoveries in Table 1-1 and Table 13-20. |
| 4. | The mineral resource estimate is constrained by a conceptual pit shell that was developed using a Lerchs-Grossmann algorithm and is based in the following parameters: 42 degree pit slope; metal prices and recoveries for gold of US$1,540.00/oz and 61% Au, for copper of US$3.63/lb and 91% Cu, for silver of US$20.00/oz and 67% Ag and for molybdenum of US$12.36/lb and 81% Mo, respectively; a mining cost of US$1.01/ton with a US$0.03/ton/bench increment and other costs (including processing, G&A and transport) of US$6.74/ton. |
| 5. | Per the calculation outlined in Section 14.12, recent company work has demonstrated that using appropriate and likely inputs for commodity prices, concentrate grades, payable copper, and realization charges results in a cutoff grade of 0.22% CuEq. The QP believes that the use of a 0.3% CuEq cutoff grade to express the Pebble resources is conservative and provides continuity with previous estimates. |
| 6. | The QP has reviewed the technical information, and other factors that may affect the estimate including permitting and external legal counsel's letter regarding the ROD appeal and Final Determination and believes that there are reasonable prospects of eventual economic extraction. |
The 2023 PEA is preliminary in nature and includes inferred mineral resources that are considered too speculative geologically to have the economic considerations applied to them that would enable them to be categorized as mineral reserves. There is no certainty that the 2023 PEA results will be realized. Mineral resources that are not mineral reserves do not have demonstrated economic viability.
1.12 Mining Methods
The mining operations would use conventional open pit mining methods and equipment. The proposed Pebble mine would be a conventional drill, blast, truck, and shovel operation with an average mining rate of 70 M tons per year and an overall strip ratio of 0.12 tons of waste per ton of mineralized material.
The open pit would be developed in stages, with each stage expanding the area and deepening the previous stage. The final dimensions of the open pit would be 6,800 ft long and 5,600 ft wide, with depths to 1,950 ft.
| Pebble Project | Page 13 |
| NI 43-101 Technical Report Update and Preliminary Economic Assessment | August 21, 2023 |
|
|
|
The projected mining schedule was generated using five pushbacks and was based on a maximum processing capacity of 180,000 tons per day. Based on the selected ultimate pit, final pit design and the generated production schedule, the mining period of 21 years, including one year of pre-stripping followed by 20 years of production.
1.13 Recovery Methods
The proposed processing plant is designed to process mineralized feed material at a rate of 180,000 tons per day. The designed process to treat feed material contemplates methods that are conventional and well-proven in the industry. The comminution and recovery processes proposed are used widely in commercial practice, with no significant elements of technological innovation.
The following unit operations would be employed to produce three final products: a copper-gold flotation concentrate, a molybdenum flotation concentrate and a gravity gold concentrate:
| · | primary crushing; |
|
|
|
| · | grinding with semi-autogenous grinding (SAG) and ball mills; |
|
|
|
| · | bulk copper-gold-molybdenum flotation; |
|
|
|
| · | molybdenum flotation to separate a copper-gold flotation concentrate and a molybdenum flotation concentrate; and |
|
|
|
| · | gravity concentration to produce a gravity gold concentrate. |
Figure 1-4 shows a simplified process flow diagram of the entire process route.
| Pebble Project | Page 14 |
| NI 43-101 Technical Report Update and Preliminary Economic Assessment | August 21, 2023 |
|
|
|
Figure 1‑4: Simplified Process Flowsheet

Note: Figure prepared by Ausenco, 2021.
| Pebble Project | Page 15 |
| NI 43-101 Technical Report Update and Preliminary Economic Assessment | August 21, 2023 |
|
|
|
The process plant flowsheet design was based on testwork results, previous study designs and industry standard practices. Further, the testwork results support the recovery projections used in the economic analysis.
The production summary for the proposed project is shown in Table 1-3. Production data includes all production whether payable in the spot market, under the Royalty Agreement, to third party metal stream partners or payable as a smelter deduction.
Table 1‑3: Proposed Project Production Summary
| Proposed Project | Units | Values |
| Mineralized Material | billion tons | 1.3 |
| Copper Equivalent1 | % | 0.58 |
| Copper | % | 0.29 |
| Gold | oz/ton | 0.009 |
| Molybdenum | ppm | 154 |
| Silver | oz/ton | 0.042 |
| Rhenium | ppm | 0.28 |
| Waste | billion tons | 0.2 |
| Open Pit Strip Ratio | - | 0.12 |
| Life of Mine | years | 20 |
| Metal Production (Life of Mine) |
|
|
| Copper | Mlb | 6,400 |
| Gold (in Cu Concentrate) | koz | 7,300 |
| Silver (in Cu Concentrate) | koz | 37,000 |
| Gold (in Gravity Concentrate) | koz | 110 |
| Molybdenum | Mlb | 300 |
| Rhenium | 1000 kgs | 230 |
| Metal Production (Annual2) |
|
|
| Copper | Mlb | 320 |
| Copper-gold concentrate | ktons | 559 |
| Gold (in Cu Concentrate) | koz | 363 |
| Silver (in Cu Concentrate) | koz | 1,800 |
| Molybdenum | Mlb | 15 |
| Molybdenum Concentrate | ktons | 14 |
| Rhenium | 1000 kgs | 12 |
Notes:
| 1. | Copper equivalent (CuEq) calculations use metal prices: US$1.85/lb for Cu, US$902/oz for Au and US$12.50/lb for Mo, and recoveries of 85% Cu, 69.6% Au, and 77.8% Mo (Pebble West zone) and 89.3% Cu, 76.8% Au, 83.7% Mo (Pebble East zone). |
| 2. | Life-of-mine volumes ÷ life of mine years. |
| Pebble Project | Page 16 |
| NI 43-101 Technical Report Update and Preliminary Economic Assessment | August 21, 2023 |
|
|
|
1.14 Project Infrastructure
The project is located in an area of Alaska that has minimal development and would require construction of both on-site and off-site infrastructure to support construction and operations of the proposed project.
The primary off-site infrastructure would incorporate a natural gas pipeline, marine terminal, ferry crossing of Iliamna Lake, and access roads from the marine terminal to Iliamna Lake, and from Iliamna Lake to the mine site. The marine terminal facility would include facilities capable of handling barges for concentrate transshipment as well as large ocean barges (400 x 100 ft) for transport of construction materials and operating supplies by container. The access road and ice-breaking ferry would provide year-round access between the marine terminal and the mine site for construction and operations. The natural gas for the power plants would be provided by local supply on the east side of Cook Inlet and would require a compressor station. The natural gas for power generation would be delivered by a pipeline extending across Cook Inlet to the marine terminal, then along the roadway corridor to the south shore of Iliamna Lake, across Iliamna Lake to Newhalen, cross-country to the Newhalen River bridge, and finally along the roadway corridor to the mine site.
The on-site facilities would provide all necessary support for construction and operation. These include temporary and permanent worker accommodations, power reticulation, site roads, administration buildings, truck shop, warehouse, maintenance facilities.
The proposed project site would also include tailings storage facilities, water management ponds, and water treatment plants (WTPs). Waste and water management at the project would be an integrated system designed to safely contain these materials, to facilitate water treatment and discharge, and to provide adequate process water to support the operations. The design of these facilities would incorporate data from a significant period of climate records, extensive site investigation, and several features intended to ensure safe operation.
The proposed project would incorporate a sophisticated water management plan with water collection, treatment, and discharge. That plan is based on the annual and seasonal variability of the incoming and receiving flows and achieving very specific water quality standards for the released water. Temporary water treatment facilities would be in place during construction, followed by three WTPs during the operations and closure phases.
Natural gas-fired power plants would be constructed at both the mine site and the marine terminal.
1.15 Environmental, Permitting and Social Considerations
1.15.1 Environmental Considerations
The Pebble deposit is located on state land that has been specifically designated for mineral exploration and development. The Pebble area has been the subject of two comprehensive land-use planning exercises conducted by the Alaska Department of Natural Resources (ADNR): the first in the 1980s and the second in 2005 (subsequently revised in 2013). ADNR identified five land parcels (including Pebble) within the Bristol Bay planning area as having “significant mineral potential,” and where the planning intent is to accommodate mineral exploration and development. These parcels total 2.7% of the total planning area (ADNR, 2013).
Northern Dynasty began a field study program in 2004 to characterize the existing physical, chemical, biological, and social environments in the Bristol Bay and Cook Inlet areas where the project might occur. The Pebble Partnership compiled the data for the 2004-2008 study period into a multi-volume Environmental Baseline Document (EBD, PLP, 2012).
| Pebble Project | Page 17 |
| NI 43-101 Technical Report Update and Preliminary Economic Assessment | August 21, 2023 |
|
|
|
These studies were designed to:
| · | fully characterize the existing biophysical and socioeconomic environment; |
|
|
|
| · | support environmental analyses required for effective input into project design; |
|
|
|
| · | provide a strong foundation for internal environmental and social impact assessment to support corporate decision-making; |
|
|
|
| · | provide the information required for stakeholder consultation and eventual mine permitting in Alaska; and |
|
|
|
| · | provide a baseline for long-term monitoring of potential changes associated with mine development. |
Additional data collected from the 2009-2013 period was compiled into the Supplemental EBD (PLP, 2018) and transmitted to USACE. In 2017, select environmental baseline studies were re-initiated and expanded. Monitoring data collected through 2019 has been provided to USACE.
The baseline study program includes:
| · | surface water hydrology |
|
|
|
| · | groundwater hydrology |
|
|
|
| · | surface and groundwater quality |
|
|
|
| · | geochemistry |
|
|
|
| · | snow surveys |
|
|
|
| · | fish and aquatic resources |
|
|
|
| · | noise |
|
|
|
| · | wetlands |
|
|
|
| · | trace elements |
|
|
|
| · | fish habitat – stream flow modeling |
|
|
|
| · | marine |
|
|
|
| · | wildlife |
|
|
|
| · | air quality |
|
|
|
| · | cultural resources |
|
|
|
| · | subsistence |
|
|
|
| · | land use |
|
|
|
| · | recreation |
|
|
|
| · | socioeconomics |
|
|
|
| · | visual aesthetics |
|
|
|
| · | climate and meteorology |
|
|
|
| · | Iliamna Lake |
| Pebble Project | Page 18 |
| NI 43-101 Technical Report Update and Preliminary Economic Assessment | August 21, 2023 |
|
|
|
1.15.2 Closure and Reclamation Considerations
The Pebble Partnership’s core operating principles are governed by a commitment to conduct all mining operations, including reclamation and closure, in a manner that adheres to socially and environmentally responsible stewardship while maximizing benefits to state and local stakeholders.
Reclamation and closure of the proposed project falls under the jurisdiction of the ADNR Division of Mining, Land, and Water, and the ADEC. A miner may not engage in a mining operation until the ADNR has approved a reclamation plan for the operation. The Pebble Partnership submitted a preliminary closure plan to USACE in support of the EIS analysis. Four phases of closure are envisioned for the proposed project.
1.15.3 Permitting Considerations
To prepare its CWA permit application, the Pebble Partnership developed a mine plan of smaller scale and footprint and shorter mine life than had been included in previous analyses. The application under Section 404 of the CWA and Section 10 of the RHA was submitted to USACE on December 22, 2017. On January 8, 2018, USACE deemed the permit application complete and confirmed that an environmental impact statement (EIS) level of analysis was required to comply with its review of the proposed project according to the National Environmental Policy Act (NEPA). The EIS process progressed through the scoping phase in 2018. USACE delivered the draft EIS in the first quarter (Q1) 2019 and completed a public comment period from March to July 2019. In the latter part of 2019 and early 2020, USACE advanced toward a final EIS (FEIS). The preliminary FEIS was circulated to cooperating agencies for review in February 2020. As part of the EIS preparation process, USACE had undertaken a comprehensive alternatives assessment to consider a broad range of development alternatives and announced the conclusions of the draft least environmentally damaging practicable alternative (LEDPA) in May 2020. USACE published the FEIS on July 24, 2020.
The Pebble EIS process also involved eight federal cooperating agencies (including the US Environmental Protection Agency and US Fish and Wildlife Service), three State cooperating agencies (including the Alaska Department of Natural Resources and the Alaska Department of Environmental Conservation), the Lake and Peninsula Borough, and two federally recognized tribes.
During this permitting process, the Pebble Partnership was actively engaged with USACE on evaluating the proposed project. There were numerous meetings between representatives of USACE and the Pebble Partnership regarding, among other things, compensatory mitigation for the proposed project. The Pebble Partnership submitted several draft compensatory mitigation plans to the USACE, each refined to address comments from the USACE.
The FEIS concluded that impacts to fish and wildlife would not be expected to affect subsistence harvest levels, that there would be no measurable change to the commercial fishing industry including prices, and that there would be a number of positive socioeconomic impacts on local communities.
In late June 2020, USACE verbally identified a preliminary finding of “significant degradation” of certain aquatic resources, with the requirement of new compensatory mitigation. The Pebble Partnership understood from these discussions that the new compensatory mitigation plan for the proposed project would include in-kind, in-watershed mitigation and continued its work to meet these new USACE requirements. USACE formally advised the Pebble Partnership by letter dated August 20, 2020, that it had made preliminary factual determinations under Section 404(b)(1) of the CWA that the proposed project would result in significant degradation to aquatic resources. In connection with this preliminary finding of significant degradation, USACE formally informed the Pebble Partnership that in-kind compensatory mitigation within the Koktuli River watershed would be required to compensate for all direct and indirect impacts caused by discharges into aquatic resources at the mine site. USACE requested the submission of a new compensatory mitigation plan to address this finding within 90 days of its letter.
| Pebble Project | Page 19 |
| NI 43-101 Technical Report Update and Preliminary Economic Assessment | August 21, 2023 |
|
|
|
In response, the Pebble Partnership developed a compensatory mitigation plan (CMP) to align with the requirements outlined by the USACE. This plan envisioned the creation of a 112,445 ac Koktuli Conservation Area on land belonging to the State of Alaska in the Koktuli River Watershed downstream of the project. The plan was submitted to the USACE on November 4, 2020.
On November 25, 2020, USACE issued a ROD rejecting the Pebble Partnership’s permit application, finding concerns with the proposed CMP and determining that the proposed project would cause significant degradation and be contrary to the public interest. USACE concluded the proposed CMP was not compliant with USACE regulations.
The Pebble Partnership submitted its request for appeal of the ROD to USACE Pacific Ocean Division on January 19, 2021. The request for appeal reflects the Pebble Partnership’s position that USACE's ROD and permitting decision— including its “significant degradation” finding, its “public interest review” findings, and its rejection of the Pebble Partnership's CMP—are contrary to law, unprecedented in Alaska, and fundamentally unsupported by the administrative record, including the proposed project FEIS. In a letter dated February 24, 2021, USACE confirmed the Pebble Partnership’s RFA was "complete and meets the criteria for appeal." While federal guidelines suggested the appeal should conclude within 90 days, USACE indicated that the complexity of issues and volume of materials associated with Pebble’s case means the review would likely take additional time.
The USACE appointed a review officer to oversee the administrative appeal process. The appeal was reviewed by the USACE based on the administrative record and any clarifying information provided. The appeal was governed by the policies and procedures of the USACE administrative appeal regulations. On April 25, 2023, the USACE Pacific Ocean Division issued an Administrative Appeal Decision that remanded the permit decision back to the USACE – Alaska District to re-evaluate specific issues. Key elements of the decision included the following conclusions reached by the review officer:
| · | The review officer generally concluded that the Pebble Partnership’s arguments that the finding of "significant degradation" by the Alaska District is contrary to law and unsupported by the record did not have merit but agreed with the Pebble Partnership that the Alaska District’s use of a certain watershed scale for analysis was not supported by the record and remanded this portion of the decision to the Alaska district engineer for reconsideration, additional evaluation, and documentation sufficient to support the decision. |
|
|
|
| · | The review officer concluded that the argument that the CMP was improperly rejected without providing the Pebble Partnership an opportunity to correct the alleged deficiencies did have merit. As a result, the review officer remanded the decision to the Alaska district engineer for reconsideration, additional evaluation, and documentation sufficient to support the decision with the specific directions that: |
|
| o | the Alaska District provide complete and detailed comments to the Pebble Partnership on the CMP and that the Pebble Partnership is to have sufficient time to address those comments prior to finalizing a revised CMP for review; and |
|
|
|
|
|
| o | if a CMP is determined to be acceptable and adequately offsets direct and indirect impacts, a new public interest review (PIR) and Section 404(b)(1) analysis may be required. |
| · | The review officer concluded that certain elements of the Pebble Partnership’s arguments regarding the public interest review had merit and remanded those portions to the Alaska District engineer for reconsideration, additional evaluation and documentation sufficient to support the decision., |
|
|
|
| · | The review officer concluded that the Pebble Partnership’s arguments that the record decision failed to adequately consider the State of Alaska’s interest as the landowner and its designation of the land for mineral development did not have merit. |
| Pebble Project | Page 20 |
| NI 43-101 Technical Report Update and Preliminary Economic Assessment | August 21, 2023 |
|
|
|
As a result of the remand decision, and in light of the EPA’s Final Determination, the Alaska District was instructed to review the appeal decision and to notify the parties how it plans to proceed within 45 days of the date of the remand. The Alaska District requested four extensions to that deadline, with the latest extension to September 26, 2023.
The timing for the final decision remains uncertain. There is no assurance that the company’s appeal of the ROD will be successful on remand or that the required permits for the Pebble Project will ultimately be issued.
On January 22, 2021, the State of Alaska, acting in its role as owner of the Pebble deposit, also submitted a request for appeal. The state appeal was rejected on the basis that the state did not have standing to pursue an administrative appeal with USACE.
On September 9, 2021, the EPA announced it planned to reinitiate the process of making a CWA Section 404(c) determination for the waters of Bristol Bay. This would set aside the 2019 withdrawal of that action, which was based on a 2017 settlement agreement between the EPA and the Pebble Partnership and supported by the results of the 2020 FEIS. On May 25, 2022, the EPA issued its revised proposed determination for public comment. The public comment period on the revised proposed determination was subsequently extended through September 6, 2022. The EPA issued its Final Determination on January 30, 2023. This Final Determination is the concluding step in the administrative process set forth in 40 C.F.R. Part 231, which governs EPA’s authority under Section 404(c) to veto permit decisions. The EPA’s administrative determination can be challenged by filing a lawsuit in U.S. federal district court seeking reversal of that decision.
The Final Determination includes the determinations of the EPA as follows:
| · | The discharges of dredged or fill material for the construction and routine operation of the mine identified in the 2020 Mine Plan at the Pebble deposit will have unacceptable adverse effects on anadromous fishery areas in the South Fork Koktuli River (SFK) and North Fork Koktuli River (NFK) watersheds. |
|
|
|
| · | Discharges of dredged or fill material associated with developing the Pebble deposit anywhere in the mine site area within the SFK and NFK watersheds that would result in the same or greater levels of loss or streamflow changes as the 2020 Mine Plan also will have unacceptable adverse effects on anadromous fishery areas in these watersheds because such discharges would involve the same aquatic resources characterized as part of the evaluation of the 2020 Mine Plan. |
|
|
|
| · | Discharges of dredged or fill material for the construction and routine operation of a mine at the Pebble deposit anywhere in the SFK, NFK, and Upper Talarik Creek (UTC) watersheds will have unacceptable adverse effects on anadromous fishery areas if the effects of such discharges are similar or greater in nature and magnitude to the adverse effects of the 2020 Mine Plan. |
| Pebble Project | Page 21 |
| NI 43-101 Technical Report Update and Preliminary Economic Assessment | August 21, 2023 |
|
|
|
Based on the above, the Final Determination achieves the following:
| · | Prohibits the specification of waters of the United States within the defined area of prohibition, as defined in the Final Determination, as disposal sites for the discharge of dredged or fill material for the construction and routine operation of the 2020 Mine Plan. This includes future proposals to construct and operate a mine to develop the Pebble deposit that result in any of the same aquatic resource loss or streamflow changes as the 2020 Mine Plan. Moreover, dredged or fill material need not originate within the boundary of the Pebble deposit to be associated with developing the Pebble deposit and, thus, subject to the prohibition. For purposes of the prohibition, the “2020 Mine Plan” is (i) the mine plan described in Pebble Partnership’s June 8, 2020 CWA Section 404 permit application and the FEIS; and (ii) future proposals to construct and operate a mine to develop the Pebble deposit with discharges of dredged or fill material into waters of the United States within the Defined Area for Prohibition that would result in the same or greater levels of loss or streamflow changes as the mine plan described in Pebble Partnership’s June 8, 2020 CWA Section 404 permit application. The Defined Area for Prohibition covers 24.7 square miles (63.9 km2) and includes the area covered by the mine footprint of the 2020 Mine Plan. |
|
|
|
| · | Restricts the use of waters of the United States within the defined area for restriction, as defined in the Final Determination, for specification as disposal sites for the discharge of dredged or fill material associated with future proposals to construct and operate a mine to develop the Pebble deposit that would either individually or cumulatively result in adverse effects similar or greater in nature and magnitude to the adverse effects of the 2020 Mine Plan. The defined area for restriction encompasses certain headwaters for the SFK, NFK and UTC watersheds and covers an area of 309 square miles (800 km2). |
On July 26, 2023, the State of Alaska filed a Motion for Leave to File a Bill of Complaint against the United States and Michael S. Regan, Administrator of the EPA, in the U.S. Supreme Court. The State’s Motion requests that the Supreme Court exercise its original jurisdiction to hear its dispute. The Complaint asserts three causes of action, seeking an order that the Final Determination be vacated or declared unenforceable, or in the alternative, seeking damages for breach of contract and just compensation for the taking of the State’s property.
Depending on the outcome of the above, the company and the Pebble Partnership may seek judicial review of the Final Determination in an appropriate United States federal district court. While the Final Determination concludes EPA’s administrative process, it is only the initial trigger in the judicial review process. If successful in overturning the agency action, Pebble Partnership could continue to pursue any state or federal permits necessary to develop the resource. The Pebble Partnership will continue to assert the following arguments, among others, in any judicial proceedings:
| · | The EPA’s Final Determination is premature and not authorized by the CWA and, accordingly, is contrary to law and precedent. |
|
|
|
| · | The EPA erred when it did not exhaust the Section 404(q) elevation procedures prior to initiating its Section 404(c) procedures as the EPA’s authority under Section 404(c) is narrowly prescribed by the CWA and is only to be used as a last resort. |
|
|
|
| · | The EPA’s decision to restrict development of 309-square-miles of land is legally and technically unsupportable. |
|
|
|
| · | The EPA has not demonstrated that the development of the Pebble deposit will have unacceptable adverse effects under Section 404(c). |
|
|
|
| · | The EPA has not demonstrated any impacts to Bristol Bay fisheries that would justify the extreme measures in the Final Determination and, further, the Final Determination contradicts the conclusion in the FEIS that the Pebble Project was “not expected to have a measurable impact on fish populations.” |
|
|
|
| · | The EPA’s Final Determination violates the rights of the State of Alaska established under the Alaska Statehood Act, and related laws, and would undermine the State’s legally protected interests in the development of lands it acquired and intended for mineral development. |
|
|
|
| · | The EPA must consider the benefits of the Pebble Project in light of the critical need for minerals essential to the renewable energy transition, as well as the environmental and social costs that would result from not developing the project. |
| Pebble Project | Page 22 |
| NI 43-101 Technical Report Update and Preliminary Economic Assessment | August 21, 2023 |
|
|
|
There is no assurance that any judicial review would be successful in overturning the Final Determination or that the USACE’s remand of the negative ROD will result in issuance of a positive ROD. If not withdrawn or overturned, the Final Determination would prevent the company from developing the Pebble deposit as set out in the 2020 Mine Plan or in any other mine plan that the EPA would consider as resulting in “adverse effects similar or greater in nature and magnitude to the adverse effects of the 2020 Mine Plan.”
The project will require additional federal permits, in addition to those issued under the CWA and RHA permits, as well as a range of permits issued by the State of Alaska.
1.16 Forward-Looking Information
Certain information and statements contained in this section are forward-looking in nature and are subject to known and unknown risks, uncertainties, and other factors, many of which cannot be controlled or predicted and may cause actual results to differ materially from those presented here. Forward-looking statements include, but are not limited to, statements with respect to the following:
| · | mineral resource estimates; |
|
|
|
| · | the mine plan for the Pebble Project; |
|
|
|
| · | the projected LOM and other expected attributes of the Pebble Project; |
|
|
|
| · | projected metallurgical recovery rates; |
|
|
|
| · | processing method and production rates; |
|
|
|
| · | infrastructure requirements; |
|
|
|
| · | the cost and timing of any development of the Pebble Project; |
|
|
|
| · | capital, operating and sustaining cost estimates; |
|
|
|
| · | requirements for additional capital to proceed with the development of the Pebble Project; |
|
|
|
| · | the economic and study parameters of the Pebble Project; |
|
|
|
| · | copper-gold concentrate marketability and commercial terms; |
|
|
|
| · | future metals prices and currency exchange rates including any stream financing and infrastructure outsourcing; |
|
|
|
| · | the net present value (NPV), internal rate of return (IRR) and payback period of capital; |
|
|
|
| · | the ability to secure the issuance of a positive ROD following the USACE’s remand and the ability of the Pebble Project to secure all required Federal and State permits; |
|
|
|
| · | environmental risks; |
|
|
|
| · | the ability of the Pebble Limited Partnership to challenge the Final Determination process initiated by the EPA under Section 404(c) of the Clean Water Act; |
|
|
|
| · | government regulations and permitting timelines, including the ability to successfully obtain federal and state permits required for the Pebble Project; |
| Pebble Project | Page 23 |
| NI 43-101 Technical Report Update and Preliminary Economic Assessment | August 21, 2023 |
|
|
|
| · | estimates of reclamation obligations; |
|
|
|
| · | the right-sizing and de-risking of the project, including any determination to pursue any of the expansion scenarios for the Pebble Project or to incorporate a gold plant; |
|
|
|
| · | the social integration of the project into the Bristol Bay region and benefits for Alaska; |
|
|
|
| · | the political and public support for the permitting process; |
|
|
|
| · | general business and economic conditions; and |
|
|
|
| · | natural gas availability and pricing rates. |
The project is also subject to the specific risks inherent in the mining business as well as general economic and business conditions as well as technical risks included in Section 25 of the 2023 PEA.
1.17 Capital and Operating Cost Estimates
1.17.1 Capital Cost Estimates
The total initial capital cost for the design, construction, installation, and commissioning of the proposed project is estimated to be $6.77 B, which includes all direct, indirect, and Owner’s costs, as well as a contingency.
In order to reduce capital costs for Northern Dynasty, if approved, the proposed project would be developed with partners who will provide the primary infrastructure (marine terminal, access road, natural gas pipeline, mine site power plant) in return for lease payments or tolls at rates which would generate a return on investment to the providers of the infrastructure. The capital cost of infrastructure which may be provided by third parties is estimated at $2.64 B, which could reduce the initial capital required by Northern Dynasty for construction.
In addition, precious metal streaming is considered a project financing alternative and the 2023 PEA assumes $1.25 B could be available to the proposed project in the form of various streaming agreements.
The combination of third-party infrastructure financing and precious metal streaming would reduce the required capital investment from Northern Dynasty for the proposed project to $3.12 B; this scenario was evaluated in the economic model as the Base Case. A Full Capital Case, without the benefit of the precious metal stream financing and third-party infrastructure participation, was also evaluated as a sensitivity analysis.
Sustaining capital investment in the proposed project over the 20-year mine life is limited to TSF improvements, replacement of mobile equipment for mining, and road maintenance. These life-cycle costs are applied in the financial model on a year-by-year basis, with a cumulative total of $1.29 B including indirect and Owner’s costs as well a contingency. Sustaining capital investments in primary infrastructure developed with partners are factored into infrastructure lease payments.
Initial reclamation trust funding and letter of credit premiums during construction would total $208 M. The remaining mine closure and reclamation costs are not included in the capital or operating costs but are factored into the financial model to account for long-term closure and water treatment plant requirements. A reclamation fund of $1.62 B would be accumulated over the mine life comprising $966 M in contributions and $657 M in accrued interest.
Table 1-4 provides the initial and sustaining capital cost estimates for the full capital case.
| Pebble Project | Page 24 |
| NI 43-101 Technical Report Update and Preliminary Economic Assessment | August 21, 2023 |
|
|
|
Table 1‑4: Pebble Proposed Project – Capital Cost Estimate
| WBS | Description | Initial Capital | Sustaining Capital | Total |
| 1000 | Open Pit Mining | 415.2 | 192.7 | 607.9 |
| 2000 | Process Plant | 910.6 | n/a | 910.6 |
| 3000 | Earthworks, Tailings and Water Management | 651.3 | 842.9 | 1,494.2 |
| 4000 | On-Site Infrastructure |
|
|
|
|
| Site General | 127.6 | n/a | 127.6 |
|
| Water Treatment Plants | 315.5 | n/a | 315.5 |
|
| On-Site Infrastructure | 251.7 | n/a | 251.7 |
| 5000 | Off-Site Infrastructure |
|
|
|
|
| Power Supply | 702.6 | n/a | 702.6 |
|
| Natural Gas Line | 505.3 | n/a | 505.3 |
|
| Marine Terminal Site | 253.5 | n/a | 253.5 |
|
| Ferry | 54.3 | n/a | 54.3 |
|
| External Access Roads | 507.4 | 18.4 | 525.8 |
| Total Directs | 4,694.9 | 1,054.1 | 5,749.0 |
|
| 6000 | Indirect Costs | 917.9 | 99.9 | 1,017.8 |
| 7000 | Owner's Costs | 353.0 | 10.0 | 363.0 |
| 8000 | Contingency | 806.8 | 129.1 | 936.0 |
| Total | 6,772.6 | 1,293.1 | 8,065.6 |
|
| Closure Costs1 | - | 2,755.7 | 2,755.7 |
|
Note:
| 1. | Closure costs does not include the $18.1 M/a WTP perpetuity costs. |
1.17.2 Operating Cost Estimates
The average life-of-mine operating costs for the proposed project base case, in which operating costs for selected off site infrastructure is paid by third parties and recoverable through payments from the Project’s operations, based on the 180,000 ton/day plant capacity, are as shown in Table 1-5. Costs associated with transportation right of way agreements have been excluded from Table 1-5 but are included in the financial model.
| Pebble Project | Page 25 |
| NI 43-101 Technical Report Update and Preliminary Economic Assessment | August 21, 2023 |
|
|
|
Table 1‑5: Summary of Annual Operating Cost Estimate
| Operating Area | Annual Cost (US$M) | LOM Average Cost (US$/ton milled) |
| General & Administrative | 62.5 | 0.97 |
| Open Pit Mining | 127.2 | 1.97 |
| Mineralized Material Handling & Process Plant | 321.7 | 4.99 |
| Tailings Operation & Maintenance | 14.4 | 0.22 |
| Water Treatment Plant | 24.6 | 0.38 |
| Marine Facilities | 33.3 | 0.52 |
| Ferry | 13.9 | 0.22 |
| Access Road1 | 16.3 | 0.25 |
| Infrastructure Lease | 286.5 | 4.44 |
| Total | 900.3 | 13.95 |
Note:
| 1. | Excludes the right of way agreement fees. |
1.18 Economic Analysis
1.18.1 Economic Analysis
An economic model was developed to estimate annual pre-tax and post-tax cash flows and sensitivities of the proposed project based on a 7% discount rate. By convention, a discount rate of 8% is typically applied to copper and other base metal projects, while 5% is applied to gold and other precious metal projects. Given the polymetallic nature of the Pebble deposit and the large contribution of gold to total revenues, a 7% blended discount rate was selected and is considered appropriate for the purposes of discounted cash flow analyses. The net present value (NPV) is calculated by discounting cash flows to start of construction.
The 2023 PEA assesses the proposed project under a scenario in which the effective investment capital by Northern Dynasty is reduced by engaging partners to provide primary infrastructure, with the Pebble Project utilizing these facilities under lease. Given this scenario is the more likely route to development, it is defined as the Base Case. A Full Capital Case, in which no third parties participate in the infrastructure, was also tested as a sensitivity case.
Calendar years used in the economic analysis are provided for conceptual purposes only. Permits still must be obtained in support of development and operations, and various approvals to proceed are still required, including those from Northern Dynasty and any future partners in development.
The project described in this technical report, including the potential expansions outlined in Section 1.18.2.1, is preliminary in nature and include inferred mineral resources that are considered too speculative geologically to have the economic considerations applied to them that would enable them to be categorized as mineral reserves. There is no certainty that the 2023 PEA results will be realized. Mineral resources that are not mineral reserves do not have demonstrated economic viability.
The financial results reported here were estimated with the forecast metals prices shown in Table 1-6. The cost and taxes summary for the Base Case under the full royalty subscription is shown in Table 1-7. The results of the economic analyses for the Base Case, under the full royalty subscription, are shown in Table 1-8.
| Pebble Project | Page 26 |
| NI 43-101 Technical Report Update and Preliminary Economic Assessment | August 21, 2023 |
|
|
|
Table 1‑6: Forecast Metal Price
| Metal | Unit | Forecast Price ($/unit) |
| Copper | lb | 3.90 |
| Gold | oz | 1,700 |
| Molybdenum | lb | 12.50 |
| Silver | oz | 22.5 |
| Rhenium | kg | 1,500 |
Table 1‑7: Proposed Project Cost and Tax Summary
| Description | Unit | Base Case, 10% Gold / 30% Silver Royalty |
| Total Initial Capital Cost | $B | 6.77 |
| Less: Infrastructure Capital Lease | $B | 2.64 |
| Net Initial Capital Cost | $B | 4.13 |
| Sustaining Capital Cost | $B | 1.27 |
| Life of Mine Operating Cost1 | $/ton | 14.17 |
| Copper C1 Cost2 | $/lb CuEq | 2.09 |
| AISC (Co-Product Basis) | $/lb CuEq | 2.32 |
| Gold C1 Cost | $/oz AuEq | 911 |
| Annual Reclamation Fund Contribution | $M/yr | 39 |
| Life of Mine Reclamation Fund Contribution | $B | 0.97 |
| Life of Mine Reclamation Bond Premium | $B | 0.18 |
| Closure Fund3 | $B | 1.6 |
| LOM Alaska Mining License | $B | 0.66 |
| LOM Alaska Royalty | $B | 0.29 |
| LOM Alaska Income Tax | $B | 0.68 |
| LOM Borough Severance & Tax | $B | 0.53 |
| LOM Federal Income Tax | $B | 1.25 |
| Annual average Alaska Mining License | $M | 33 |
| Annual average Alaska Royalty | $M | 15 |
| Annual average Alaska Income Tax | $M | 34 |
| Annual average Borough Severance & Tax | $M | 27 |
| Annual average Federal Income Tax | $M | 62 |
Note:
| 1. | Includes cost of infrastructure lease - $4.44/ton milled. |
| 2. | C1 costs calculated on co product basis. |
| 3. | Maximum value of closure fund during life of mine based on 4% compound interest. |
| Pebble Project | Page 27 |
| NI 43-101 Technical Report Update and Preliminary Economic Assessment | August 21, 2023 |
|
|
|
Table 1‑8: Forecast Financial Results for the Proposed Project - Base Case (Post Tax)
| Description | Units | Base Case, 10% Gold / 30% Silver Royalty |
| Mining Taxes & Government Royalties | $M | 1,487 |
| Corporate Income Tax | $M | 1,931 |
| Post – Tax Undiscounted Cash Flow | $M | 7,681 |
| Post – Tax NPV at 7% | $M | 2,233 |
| Post – Tax IRR | % | 16.2 |
| Post – Tax Payback Period | years | 4.6 |
1.18.2 Sensitivity Analysis
The sensitivity of the proposed project’s pre-tax NPV, and IRR were evaluated relative to several project variables, including:
| · | copper price; |
|
|
|
| · | gold price; |
|
|
|
| · | molybdenum price; |
|
|
|
| · | initial capital cost; |
|
|
|
| · | operating cost; |
|
|
|
| · | sustaining capital costs; and |
|
|
|
| · | head grade. |
With the exception of head grade, each variable was tested in increments of 10%, between -30% to +30% while holding all other variables constant. Head grade was tested over a range of ±10%, while holding the other all other variables constant, as variation beyond that range over the life of mine and on an annualized basis is unlikely, given the extent of the drilling defining the mineral resource and the methodology used to estimate the mineral resource.
The proposed project’s NPV (7% discount rate) is most sensitive to changes in head grade, copper price, initial capital cost, operating costs, gold price, molybdenum price, and sustaining capital cost.
1.18.2.1 Sensitivity analysis to changes in Capital Cost
The Full capital cost excludes the assumptions regarding infrastructure development partners and precious metal streaming partners. The economic results for the Full Capital with consideration of only the partial royalty arrangement are not materially different than for the full royalty subscription, therefore only results for the full royalty subscription are presented below. A summary of the pre-tax and post-tax financial results for the Full Capital, which exclude the assumptions regarding infrastructure development partners and precious metal streaming partners, is provided in
Table 1-9.
| Pebble Project | Page 28 |
| NI 43-101 Technical Report Update and Preliminary Economic Assessment | August 21, 2023 |
|
|
|
Table 1‑9: Proposed Project Full Capital Case Financial Results
| Description | Units | Full Capital, 10% Gold / 30% Silver Royalty |
| Recovered Metal Value |
||
| Copper | $M | 23,998 |
| Gold | $M | 11,521 |
| Molybdenum | $M | 3,744 |
| Silver | $M | 575 |
| Rhenium | $M | 312 |
| Total Recovered Metal Value | $M | 40,150 |
| Off-Site Operating Costs |
||
| Refining and treatment Charges, Penalties, Insurance, Marketing and Representation & Concentrate Transportation | $M | 2,927 |
| On-Site Operating Costs |
||
| Open Pit | $/ton milled | 1.97 |
| Process | $/ton milled | 4.99 |
| Transportation | $/ton milled | 1.35 |
| Environmental | $/ton milled | 0.60 |
| G&A | $/ton milled | 0.97 |
| Infrastructure Lease | $/ton milled | - |
| Total Operating Cost | $/ton milled | 9.88 |
| Capital Expenditure |
||
| Initial Capital | $M | 6,773 |
| Add: Pre-production Reclamation Funding | $M | 230 |
| Less: Outsourced Infrastructure | $M | - |
| Less: Pre-production proceeds from gold stream partner | $M | - |
| Initial Capital Investment during Construction | $M | 7,002 |
| Sustaining Capital | $M | 1,293 |
| Financial Summary |
||
| Pre – Tax Undiscounted Cash Flow | $M | 15,257 |
| Pre – Tax NPV at 7% | $M | 3,290 |
| Pre – Tax IRR | % | 12.3 |
| Pre – Tax Payback Period | Years | 6.0 |
| Cash Cost (Co-Product Basis) | $/lb CuEq | 1.56 |
| All-in Sustaining Cost (Co-Product Basis) | $/lb CuEq | 1.79 |
| Mining Taxes & Government Royalties | $M | 1,690 |
| Corporate Income Tax | $M | 2,495 |
| Post – Tax Undiscounted Cash Flow | $M | 11,072 |
| Post – Tax NPV at 7% | $M | 1,831 |
| Post – Tax IRR | % | 10.3% |
| Post – Tax Payback Period | years | 6.3 |
| Pebble Project | Page 29 |
| NI 43-101 Technical Report Update and Preliminary Economic Assessment | August 21, 2023 |
|
|
|
1.18.2.2 Potential Alternate Expansions Scenarios
The proposed project would extract only a small portion of the total mineral resources estimated at Pebble. To evaluate opportunities for potential expansion or extension of the project, selected scenarios were identified and included in the financial sensitivity analysis.
| · | Three expansions contemplate an extension of the open pit mine and increased mill throughput over a significantly longer mine life. These extensions were modelled as expansion cases in a response to a request for information from USACE during the EIS process and which is incorporated in the EIS administrative record. |
|
|
|
| · | An additional expansion considers the addition of an on-site gold plant to the base case and the three potential expansions, without changes to throughput or mine life. |
Each of the potential expansions identified here would require additional permitting and environmental regulatory review, and there is no certainty that any of the potential expansions could be pursued. The potential expansions are designated by the year in which the contemplated expanded process plant would commence operation. They utilize the same life-of-mine open pit design, with variations based on the year of the expansion and the expanded throughput rate. The Year 21 case is based on the scenario outlined in the EIS, with the plant expanded to 250,000 t/d. The throughput in the other two expansions is 270,000 t/d.
Table 1-10 compares the production information from the potential expansions to the proposed project. The LOM values and financial results for the individual potential expansions are shown in Table 1-10. Table 1-11 shows only the results assuming full subscription of the five royalty tranches, infrastructure leases, and metal streaming.
Table 1‑10: Potential Expansions Metrics Information
| Description | Unit | Proposed Project | Potential Expansion |
| Mineralized Material | Btons | 1.3 | 8.6 |
| CuEq1 | % | 0.57 | 0.72 |
| Copper | % | 0.29 | 0.39 |
| Gold | oz/ton | 0.009 | 0.01 |
| Molybdenum | ppm | 154 | 208 |
| Silver | oz/ton | 0.042 | 0.046 |
| Rhenium | ppm | 0.28 | 0.36 |
| Waste | Btons | 0.2 | 14.4 |
| Open Pit Strip Ratio |
| 0.12 | 1.67 |
| Metal Production (LOM) |
|||
| Copper | Mlb | 6,400 | 60,400 |
| Gold (in Cu Concentrate) | koz | 7,300 | 50,500 |
| Silver (in Cu Concentrate) | koz | 37,000 | 267,000 |
| Gold (in Gravity Concentrate) | koz | 110 | 782 |
| Molybdenum | Mlb | 300 | 2,900 |
| Rhenium | 1000 kg | 200 | 2,000 |
Notes:
| 1. | CuEq calculations use metal prices: US$1.85/lb for Cu, US$902/oz for Au and US$12.50/lb for Mo, and recoveries: 85% Cu, 69.6% Au, and 77.8% Mo (Pebble West zone) and 89.3% Cu, 76.8% Au, 83.7% Mo (Pebble East zone). |
| Pebble Project | Page 30 |
| NI 43-101 Technical Report Update and Preliminary Economic Assessment | August 21, 2023 |
|
|
|
Table 1‑11: Potential Expansions Financial Results1
| Description | Units | Year 5 Expansion | Year 10 Expansion | Year 21 Expansion |
| Net Smelter Return | $M | 312,780 | 312,360 | 312,570 |
| Operating Costs | $M | 125,110 | 119,470 | 124,050 |
| Capital Costs | $M | 26,850 | 26,830 | 27,430 |
| Post – Tax Undiscounted Cash Flow | $M | 110,770 | 114,970 | 111,800 |
| Post – Tax NPV at 7% | $M | 8,570 | 7,520 | 5,500 |
| Post – Tax IRR | % | 22.0 | 20.0 | 18.1 |
Notes:
| 1. | Includes infrastructure partners and precious metal streaming. |
The gold plant included in the potential expansions was based of metallurgical testwork results for a specific gold recovery technology. However, other technologies may be applicable for the Pebble deposit. Further, the addition of a gold plant under any expansions will require additional testwork and engineering and will require the receipt of pertinent federal and state permits prior to implementation.
The on-site gold plant would process the pyrite concentrate in conjunction with the gravity concentrate to produce a precious metal doré. The gold plant would commence operation in Year 5. In all but the Year 5 expansion scenario, the gold plant capacity would initially match the 180,000 tons per day process plant capacity and would be expanded concurrently and in line with the process plant expansions to 270,000 or 250,000 t/d in Year 10 or 21, respectively. In the Year 5 scenario, the gold plant capacity would match the expanded plant capacity of 270,000 t/d from the initial implementation of the circuit.
Table 1-12 provides the total metal production from the expansions with addition of the gold plant and Table 1-13 provides the financial results for the expansions when the gold plant is included.
Table 1‑12: Summary Sensitivities of Adding a Gold Plant in Year 5 to Proposed Expansions
| Description | Unit | Proposed Project | Proposed Project + Gold Plant | Potential Expansions |
||
| Year 5 | Year 10 | Year 21 |
||||
| Concentrate (LOM) |
||||||
| Copper | Mlb | 6,400 | 6,500 | 61,200 | 61,200 | 61,200 |
| Gold (in Cu Concentrate) | koz | 7,300 | 7,300 | 50,500 | 50,500 | 50,400 |
| Silver (in Cu Concentrate) | koz | 37,000 | 37,000 | 267,000 | 267,000 | 267,000 |
| Molybdenum | Mlb | 300 | 300 | 2,900 | 2,900 | 2,900 |
| Rhenium | kg | 200 | 200 | 2,000 | 2,000 | 2,000 |
| Gold Plant (LOM) |
||||||
| Gold (as Doré) | koz | - | 2,000 | 14,400 | 14,500 | 14,500 |
| Silver (as Doré) | koz | - | 2,900 | 22,500 | 22,600 | 22,600 |
| Total Production (LOM) |
||||||
| Gold | koz | 7,000 | 9,300 | 64,900 | 65,100 | 65,000 |
| Silver | koz | 37,000 | 39,500 | 289,000 | 289,000 | 289,000 |
| Pebble Project | Page 31 |
| NI 43-101 Technical Report Update and Preliminary Economic Assessment | August 21, 2023 |
|
|
|
Table 1‑13: Gold Plant Expansions Financial Results
| Description | Units | Proposed Project + Gold Plant | Year 5 Expansion | Year 10 Expansion | Year 21 Expansion |
| Net Smelter Return | $M | 38,190 | 338,260 | 337,820 | 338,010 |
| Operating Costs | $M | 19,740 | 136,320 | 130,600 | 135,340 |
| Capital Costs | $M | 5,640 | 27,100 | 27,170 | 27,750 |
| Post – Tax Undiscounted Cash Flow | $M | 9,020 | 120,770 | 124,830 | 121,480 |
| Post – Tax NPV at 7% | $M | 2,740 | 10,030 | 8,660 | 6,460 |
| Post – Tax IRR | % | 17.5 | 24.2 | 21.4 | 19.6 |
Note: Proposed project and potential expansions include infrastructure partners and precious metal streaming.
1.19 Conclusion and Interpretation
The Pebble property hosts a large copper-gold-molybdenum-silver-rhenium deposit. The exploration and drilling programs completed thus far are appropriate to the type of the deposit. The exploration, drilling, and geological modelling work support the interpreted genesis of the mineralization and the domaining employed in the resource estimation.
The drill database for the Pebble deposit is reliable and sufficient to support the mineral resource estimate.
Estimations of mineral resources for the project conform to industry best practices and are reported using the 2014 CIM Definition Standards.
Products from mining this deposit, including rhenium, could support development of power infrastructure, alternative energy supply and other purposes of strategic national significance. The project could have regional economic importance for southwest Alaska and potentially the entire state through the creation of jobs and training opportunities, supply and service contracts for local businesses, and government revenue.
The results of the 2023 PEA indicate the Pebble project could provide a positive economic return on investment. Further, evaluation of scenarios featuring potential expansion of the mine, and inclusion of a gold plant, indicate economic upside through the increase of processing capacity over an extended mine life. Based on the work carried out, this study should be followed by further technical and economic studies, and potentially to further project development.
1.20 Risks and Opportunities
1.20.1 Risks
1.20.1.1 Mineral Resource
| · | The 2023 PEA includes the use of inferred mineral resources that are considered too speculative geologically to have the economic considerations applied to them that would enable them to be categorized as mineral reserves. There is no certainty that the inferred mineral resources can be upgraded to indicated. |
| Pebble Project | Page 32 |
| NI 43-101 Technical Report Update and Preliminary Economic Assessment | August 21, 2023 |
|
|
|
| · | The mineral resources estimates may ultimately be affected by a broad range of environmental, permitting, legal, title, socio-economic, marketing and political factors pertaining to the specific characteristics of the Pebble deposit (including its scale, location, orientation and polymetallic nature) as well as its setting (from a natural, social, jurisdictional and political perspective). |
|
|
|
| · | Factors that may affect the mineral resource estimate include: |
|
| o | changes to the geological, geotechnical and geometallurgical models as a result of additional drilling or new studies |
|
|
|
|
|
| o | the discovery of extensions to known mineralization as a result of additional drilling |
|
|
|
|
|
| o | changes to the rhenium: molybdenum correlation coefficients and resultant regression equation due to additional drilling |
|
|
|
|
|
| o | changes to commodity prices resulting in changes to the test for reasonable prospects for eventual economic extraction. |
|
|
|
|
|
| o | changes to the metallurgical recoveries resulting in changes to the test for reasonable prospects for eventual economic extraction. |
| · | Mineral resources that are not mineral reserves do not have demonstrated economic viability. |
|
|
|
| · | The risk is the inferred resources are not realized and thus the PEA economics will be affected. |
|
|
|
| · | The mineral resource estimates contained have not been adjusted for any risk that the required environmental permits may not be obtained for the project. The uncertainty associated with the ability of the project to obtain required environmental permits is a risk to the reasonable prospects for Eventual Economic Extraction of the mineralization and the classification of the estimate as a mineral resource. |
1.20.1.2 Mining Methods
The pit wall slope assessments were completed to a prefeasibility level of confidence. Additional field work and analysis are required to confirm these designs for operations. The pit wall slopes may flatten and impact the tonnes moved if further geotechnical investigation reveals less competent ground conditions.
1.20.1.3 Recovery Methods
| · | The metallurgical testwork completed on the Pebble deposit has been extensive but additional work is required to confirm process recoveries and reagent requirements in order to complete a feasibility study and detailed design. The projected process recoveries may not be achieved. If the recoveries identified in the PEA are not demonstrated, the project economics will be negatively impacted. If required, additional reagents will increase operating costs. |
|
|
|
| · | The metallurgical testwork highlighted the low levels of impurity elements in the project feed materials and correspondingly low deportment to saleable products, and likewise the process plant design incorporated no special treatment steps to manage impurities in the feed. There is a risk that pockets of the Pebble deposit will contain elevated levels of deleterious elements that could report to the concentrate products at levels which could incur penalty charges or adversely influence the saleability of the products. Operational controls could avoid these potential impacts. |
| Pebble Project | Page 33 |
| NI 43-101 Technical Report Update and Preliminary Economic Assessment | August 21, 2023 |
|
|
|
1.20.1.4 Tailings and Water Management
| · | The tailings and water management pond structures designs have been completed to a preliminary level. Significant additional field data and design are required to prepare these structures for construction. |
|
|
|
| · | The tailings and water management structures will be subject to an extensive design review and permitting process in Alaska. The process may result in changes to the designs. |
|
|
|
| · | Additional field work and analysis are required to confirm specific design criteria relating to the groundwater for open pit wall and tailings structures. |
1.20.1.5 Natural Gas Supply
| · | Natural gas has provided heating and electrical energy in southcentral Alaska for more than five decades. While there are indications of additional natural gas resources to be defined in the area, exploration must be completed to confirm these resources and to bring them into production. If this work does not proceed within an adequate timeframe to meet the Pebble development schedule or the efforts are not successful at developing new resources, the project would have to rely on the import of liquified natural gas (LNG). There are significant global sources of LNG and while its import is technically feasible, the price of LNG and the cost of installing and operating re-gas facilities could increase the capital and operating cost and project timelines. |
1.20.1.6 Environmental and Permitting
| · | The project is the subject of significant public opposition in Alaska and elsewhere in the United States. The ability for the Pebble Project to gain necessary regulatory approvals may be negatively impacted by this opposition. |
|
|
|
| · | Northern Dynasty is party to several class action legal complaints and Pebble Partnership is subject to a government investigation regarding public statements made regarding the project. While these matters do not directly affect the development of the project, they could negatively impact Northern Dynasty’s and the Pebble Partnership’s ability to finance the development of the project or the ability to obtain required permitting. |
|
|
|
| · | On January 30, 2023, the EPA issued the Final Determination under Section 404(c) of the CWA, imposing limitations on the use of certain waters in the Bristol Bay watershed as disposal sites for certain discharges of dredged or fill material associated with development of a mine at the Pebble deposit. This Final Determination establishes a “defined area for prohibition” coextensive with the current mine plan footprint in which the EPA would prohibit the disposal of dredged or fill material for the Pebble Project. The Final Determination also establishes a 309-square-mile “defined area for restriction” that encompasses the area of the Pebble Project. The Final Determination may be challenged in an appropriate U.S. federal district court. The Pebble Partnership believes that there are numerous legal and factual flaws in the Final Determination. Even if the appeal of the 2020 Record of Decision is successful, there is no assurance that any challenge by the Pebble Partnership to the EPA’s Final Determination will be successful. |
|
|
|
| · | In November 2020, USACE denied Pebble Partnership’s permit application. That decision was appealed. On April 25, 2023, the USACE Pacific Ocean Division issued its Administrative Appeal Decision and remanded the permit decision back to the USACE – Alaska District to re-evaluate specific issues raised in the appeal. As a result of the remand decision, and in light of the EPA’s Final Determination, the District was instructed to review the appeal decision and to notify the parties how it planned to proceed within 45 days of the remand issuance. The Alaska District has requested and received four extensions to this deadline. The current deadline is September 26, 2023. The proposed project cannot proceed unless and until the ROD is overturned and all necessary permits, including the CWA 404 Permit, are obtained. There is no certainty that these permits will be obtained. |
|
|
|
| · | Bristol Bay Forever was a public initiative approved by Alaskan voters in November 2014. Based on that initiative, development of the proposed project requires legislative approval upon securing all other permits and authorizations. The Project will not be able to proceed if it fails to receive this approval. |
| Pebble Project | Page 34 |
| NI 43-101 Technical Report Update and Preliminary Economic Assessment | August 21, 2023 |
|
|
|
1.20.1.7 Financial Results
| · | The cost estimates contained in the 2023 PEA are completed to a PEA level. Additional analysis and engineering are required to confirm these results. There is a risk that actual costs incurred vary from those estimated herein. |
|
|
|
| · | Metal prices and realization costs are subject to significant fluctuation, particularly over the periods identified for the proposed project and potential expansion scenarios. These fluctuations could have a significant impact on the financial results of future studies and the actual results achieved by an operating mine. |
|
|
|
| · | The proposed project is subject to taxation at three government levels (local, state, and federal). These tax regimes may change over time, resulting in different results than those identified in the 2023 PEA. |
1.20.2 Opportunities
1.20.2.1 Mineral Resource
| · | The Pebble property includes a number of opportunities to expand the mineral resource estimate through future exploration. The most significant opportunity is obtained in drill hole 6348 which intersected 949 ft with an average grade of 1.24% copper, 0.74 g/t gold and 0.042% molybdenum, or 1.92% CuEq. This drill hole lies east of the ZG1 Fault and follow up drilling of the Cretaceous host rocks to this mineralization has not yet been completed, thereby leaving the extent of this high-grade mineralization unknown. |
|
|
|
| · | Geophysical and geochemical surveys and reconnaissance exploration drilling have identified several targets located well outside the current Pebble resource estimate area that warrant future exploration. |
Elevated levels of palladium, vanadium, titanium, and tellurium have been noted in raw analytical data and in metallurgical studies and represent opportunities to further benefit the economics of the Pebble deposit.
1.20.2.2 Mining Methods
The proposed project mine plan was developed using conventional mining technology. Three areas which could improve the mining results are:
| · | Trolley-assist has been shown to improve cycle times and improve engine life at other mines, both of which would reduce operating costs. To accomplish this, additional capacity would likely be required for the power plant. |
|
|
|
| · | In-pit crushing for the proposed project as well as extending the in-pit crushing envisioned for the potential expansion scenarios may prove beneficial. |
|
|
|
| · | Mine operations are increasingly moving to autonomous equipment with remote operations centres. These have seen real benefits, particularly in a remote operation such as envisioned at Pebble. |
1.20.2.3 Recovery Methods
| · | A number of measures have been developed recently which could improve flotation performance at Pebble, including advances in coarse particle flotation. Further analysis of these advances could benefit Pebble. |
| Pebble Project | Page 35 |
| NI 43-101 Technical Report Update and Preliminary Economic Assessment | August 21, 2023 |
|
|
|
| · | The supergene domains at Pebble would contribute a significant portion of the process plant feed during the first several years of operation. Additional testwork and analysis could determine if alternate strategies could be employed to improve recoveries in these zones. |
|
|
|
| · | Pre-sorting techniques have become accepted components of many new process plants. A study is warranted to determine if pre-sorting could enhance Pebble outcomes. |
|
|
|
| · | Analysis of alternate secondary gold recovery technologies could improve the financial results and enhance the permitting process. |
|
|
|
| · | The molybdenum concentrate production creates the opportunity to add a molybdenum concentrate refinery to produce a value-added product in Alaska and reduce overall carbon footprint by reduced shipping. |
1.20.2.4 Infrastructure
| · | Further detailed analysis of the influent water quality and water treatment schemes could see reductions in complexity and cost of the required water treatment facilities on site. |
|
|
|
| · | The facilities at the mine site have currently been estimated on the basis of being “stick-built” on-site. The access road has been designed to accommodate modules weighing up to 2,000 tons. Further detailed analysis should be completed to determine if cost and/or schedule efficiencies can be realized by modularizing the mine site power plant, the water treatment plants, and components of the process plant and tailings facilities. |
1.20.2.5 Environment
| · | Evaluation of carbon dioxide capture and sequestration opportunities could reveal an opportunity to reduce the project’s carbon emissions. |
1.21 Recommendations
1.21.1 Introduction
The Pebble Project demonstrates positive economics, as shown by the results presented in this technical report.
Subject to receiving the appropriate approvals to advance development of the project, it is recommended to continue developing the project through the prefeasibility study stage. Table 1-14 summarizes the estimated cost for the recommended future work on the project, exclusive of the cost relating to permitting and approvals.
Table 1‑14: Cost Summary for the Recommended Future Work
| Item | Budget ($M) |
| Metallurgical Testwork | 8.5 |
| Mineral Resource Estimate | 10.2 |
| Mining Method | 8.1 |
| Process and Infrastructure Engineering | 1.0 |
| Access Road | 6.5 |
| Tailings and Waste Management | 18.0 |
| Total | 52.3 |
| Pebble Project | Page 36 |
| NI 43-101 Technical Report Update and Preliminary Economic Assessment | August 21, 2023 |
|
|
|
1.21.2 Metallurgical Testwork
1.21.2.1 Metallurgy Testwork
Future testwork is required to provide additional data to define silver recovery to the copper-gold concentrate, rhenium recovery to the molybdenum concentrate, and precious metals to the gravity concentrate.
Additional analysis and circuit optimization are recommended for treatment of supergene material. This should include collection of additional metallurgical samples from drilling these specific metallurgical domains.
An initial assessment of potential treatment methods of molybdenum concentrates should be completed to optimize the value of molybdenum and rhenium.
1.21.2.2 Grinding Circuit SAG Mill Size
Continued analysis is recommended to determine the optimum grinding circuit configuration.
1.21.2.3 Flotation Circuit Optimization
Coarse particle and column or other means of flotation should be evaluated.
1.21.2.4 Estimated Metallurgical Program Cost
The estimated cost to complete the recommended metallurgical program, including sample collection, is $8.5 M.
1.21.3 Mineral Resource Estimate
1.21.3.1 Update of Inferred Resource
A mineral resource used as the basis for a prefeasibility or feasibility study, as defined by NI 43-101, must be classified as measured or indicated. A small portion of the mineral resource within the proposed project is classified as inferred and this should be upgraded by infill drilling in order to prepare for a future prefeasibility study.
The estimated cost of the drilling program is $10 M.
1.21.3.2 Block Model Update
The model should be updated as additional data are acquired from drilling to convert inferred resource to measured and indicated.
The estimated cost of the block model update is $0.1 M.
| Pebble Project | Page 37 |
| NI 43-101 Technical Report Update and Preliminary Economic Assessment | August 21, 2023 |
|
|
|
1.21.3.3 Additional Metals
Elevated levels of palladium, vanadium, titanium, and tellurium have been noted in raw analytical data and in metallurgical studies. A scoping level program is recommended to determine their potential for inclusion in future resource estimates. Such a study would focus on the deportment and distribution of these metals, as well as the best approach to their quantification.
The estimated cost of the block model update is $0.1 M.
1.21.3.4 Estimated Resource Update Cost
The estimated cost of the recommended program, including drilling, is $10.2 M.
1.21.4 Mining Methods
The following recommendations for future mining work include the following:
| · | Detailed mining production schedule and designs should be developed with all mining activities to understand potential bottlenecks and assess possible cost reduction from technologies such as in-pit crushing and conveying, autonomous trucking, and blast hole drilling. |
|
|
|
| · | Detailed geotechnical studies should be conducted to better define the appropriate pit slope angles and design parameters for the pit, stockpiles, and overburden stockpiles. |
The estimated cost to complete the recommended work is $8.1 M, including drilling additional geotechnical investigation holes.
1.21.5 Process and Infrastructure Engineering
1.21.5.1 Process Plant and Infrastructure
The estimated cost for process and infrastructure engineering for a PFS is $ 1.0 M. Engineering deliverables would include:
| · | Process trade-off studies; |
|
|
|
| · | Flow diagrams (comminution, recovery processes, tails); |
|
|
|
| · | Detailed equipment list; |
|
|
|
| · | Power listing and consumption estimate; |
|
|
|
| · | Architectural (building sizes) to estimate steel and concrete quantities; |
|
|
|
| · | Details material and water balance; |
|
|
|
| · | Detailed process design criteria; |
|
|
|
| · | General arrangements (GA) and elevation drawings; |
|
|
|
| · | Electrical single line drawing; |
| Pebble Project | Page 38 |
| NI 43-101 Technical Report Update and Preliminary Economic Assessment | August 21, 2023 |
|
|
|
| · | Equipment and supply quotations updated and sources determined; |
|
|
|
| · | Estimate of equipment and materials freight quantities; |
|
|
|
| · | Capital and operating cost estimate; |
|
|
|
| · | Major equipment spares and warehouse inventory cost estimate; |
|
|
|
| · | Construction workhours estimate; and |
|
|
|
| · | Construction schedule. |
Additional studies are necessary to finalize the location of the process plant and related infrastructure. An investigation of the soil conditions should be performed in order to simplify the design of the mill building and major equipment foundations.
1.21.5.2 Access Road
Further alignment information, geotechnical detail and aggregate sourcing data will be required to support access road design.
The main access and secondary road alignments and designs need to be refined to better determine issues and costs. Considerations include the following:
| · | right of way and other permit constraints, if any; |
|
|
|
| · | optimizing the road corridor; |
|
|
|
| · | road horizontal and vertical alignments, cross-section designs and corresponding earth quantities; |
|
|
|
| · | design requirements for frost-susceptible, wet rock areas; |
|
|
|
| · | concept level bridge general arrangement and profile designs taking into account geotechnical information; |
|
|
|
| · | geotechnical investigations along the road alignment and at all bridge sites; |
|
|
|
| · | hydrology and hydraulics studies for stream crossing design; and |
|
|
|
| · | drilling and sampling of proposed material borrow sources to define material characteristics and suitability. |
The estimated cost to complete this work is $6.5 M.
1.21.6 Tailings and Waste Management
Recommendations require the following be completed to support the advancement of the Pebble Project permitting case tailings and water management:
| · | prepare a detailed material balance that includes quantities and timing for construction and closure materials (overburden/growth medium, quarried rock, PAG rock). |
|
|
|
| · | Prepare a detailed construction execution plan to support the initial construction planning; complete additional geotechnical investigations to support prefeasibility level TSF and water management designs, such as: |
|
| o | geotechnical infill drilling and sampling in overburden soils and rock; |
|
|
|
|
|
| o | hydrogeological testing of soil and rock; |
| Pebble Project | Page 39 |
| NI 43-101 Technical Report Update and Preliminary Economic Assessment | August 21, 2023 |
|
|
|
|
| o | test pitting to characterize the surficial geology; |
|
|
|
|
|
| o | delineation of construction materials and local borrow areas; |
|
|
|
|
|
| o | additional investigations to confirm the bedrock surface below embankment structures; |
|
|
|
|
|
| o | laboratory testing of samples collected in the field; |
| · | carry out tailings testwork and tailings consolidation modelling for both TSFs; |
|
|
|
| · | revise and update the mine plan, watershed, and groundwater models as appropriate during future studies, and |
|
|
|
| · | initiate an Alaska Dam Safety Program and engage the Independent Review Panel. |
The estimated cost to complete this program, including sample collection, is $18 M.
| Pebble Project | Page 40 |
| NI 43-101 Technical Report Update and Preliminary Economic Assessment | August 21, 2023 |
|
|
|
2 INTRODUCTION
2.1 Introduction
Northern Dynasty Minerals Ltd. (Northern Dynasty) is a Canadian company focused on developing the Pebble Project, a significant copper-gold-molybdenum-silver-rhenium deposit in southwest Alaska. The company is listed on the TSX (NDM) and NYSE American (NAK). The company commissioned Ausenco Engineering Canada Inc. and Ausenco Sustainability Inc. (collectively, Ausenco) to compile this preliminary economic assessment (PEA) of the Pebble Project (the 2023 PEA). The 2023 PEA was prepared in accordance with the Canadian disclosure requirements of national instrument 43101 (NI 43-101) and in accordance with the requirements of Form 43-101 F1.
The responsibilities of the engineering companies who were contracted by Northern Dynasty to prepare this report are as follows:
| · | Ausenco managed and coordinated the work related to the report and developed PEA-level design, including capital and operating cost estimates for the process plant, general site infrastructure, environment and permitting, economic analysis and completed a review of the environmental studies. They also completed the work related to property description, accessibility, local resources, and ferry. |
|
|
|
| · | Tetra Tech Inc. (Tetra Tech) audited the mineral resource estimate for the Pebble project, including reviewing the site exploration, drilling, resource data base, and resource estimate. They also reviewed the metallurgical testwork. |
|
|
|
| · | NANA Worley, LLC (NANA Worley) designed the mine site and marine terminal power plants, and the natural gas pipeline, including preparation of the capital and operating cost estimates associated with those facilities. NANA Worley also engaged Worley (Worley) to update the previously designed open pits, mine production forecasts, and mine capital and operating cost estimates from the 2022 PEA for the 2023 PEA. |
|
|
|
| · | Knight Piésold Ltd. (Knight Piésold) developed the tailings and waste management storage facilities, site water management details, and closure plan. |
|
|
|
| · | RECON LLC (RECON) completed the designs for the access road and developed the associated capital and operating costs. |
|
|
|
| · | HDR Alaska, Inc. (HDR) designed the water treatment plants and developed the capital and operating cost for them. |
2.1.1 Terms of Reference
This 2023 PEA report is the latest in a series of reports providing analysis of the Pebble Project. The 2023 PEA discloses the current status of the permitting project for the Pebble Project, including the process to appeal the negative Record of Decision issued by the U.S. Army Corps of Engineers (USACE) under the National Environmental Policy Act (NEPA) and the decision by the US Environmental Protection Agency (EPA) to issue a Final Determination, which unless overturned would prohibit development of the Pebble Project.
The 2023 PEA also provides updated cost estimates and financial analysis for the Pebble Project as well as the effect of a Royalty Agreement signed by Northern Dynasty on July 26, 2022, and described in a news release dated July 27, 2022 (available at sedar.com). The Pebble Partnership dropped a number of claims in late 2021 and the 2023 PEA incorporates the revised claim boundary, claim area, and annual fees.
| Pebble Project | Page 41 |
| NI 43-101 Technical Report Update and Preliminary Economic Assessment | August 21, 2023 |
|
|
|
During the NEPA process, the Pebble Partnership received a request for information (RFI) from USACE for a description of a concept for an expanded project. The response to this RFI is included in the EIS Administrative Record. No engineering was done at the time, but the 2023 PEA does contain a sensitivity analysis of this potential expansion scenario, along with indicative costs and financial results. The sensitivity analysis also assesses two additional potential expansion scenarios, with different expansion timing and expanded throughput rates. The sensitivity of installing a secondary gold recovery plant in Year 5 is also tested for all the scenarios.
The 2023 PEA currency is the United States (US) dollar (US$ or $). The report uses US customary units unless otherwise specified. The Pebble Partnership uses the US State Plane Coordinate System (as Alaska 5005) as the preferred grid, measured in feet (ft).
Mineral resources are reported in accordance with the Canadian Institute of Mining, Metallurgy and Petroleum (CIM) Definition Standards for Mineral Resources and Mineral Reserves (May 2014; the 2014 CIM Definition Standards). Mineral Resources were estimated in accordance with the 2019 CIM Estimation of Mineral Resources & Mineral Reserves Best Practice Guidelines (November 2019; the 2019 Best Practice Guidelines).
2.2 Qualified Persons
Table 2-1 lists the qualified persons (QPs) for the 2023 PEA as defined in National Instrument 43-101, Standards of Disclosure for Mineral Projects. Each QP is independent of Northern Dynasty.
Table 2‑1: Report Contributors
| Qualified Person | Professional Designation | Position | Employer | Independent of Northern Dynasty Minerals Ltd. | Report Sections |
| Robin Kalanchey | P.Eng. | Vice President, Asset Optimization | Ausenco Engineering Canada Inc. | Yes | 1.1-1.4, 1.13, 1.14, 1.16-1.19, 1.20.1.3, 1.20.1.7, 1.20.2.3, 1.21.1, 1.21.5, 2.1, 2.2, 2.4, 2.5, 3.3, 4.1, 12.1, 17, 18.1, 18.3, 18.7.2.2-18.7.2.5, 18.7.3-18.7.7, 18.9, 18.10, 19, 21.1, 21.2.1-21.2.3, 21.2.5, 21.2.7.1, 21.2.7.3, 21.2.8.2, 21.2.8.3, 21.2.9-21.2.11, 21.2.12.1, 21.2.13.1, 21.3.1, 21.3.2, 21.3.5, 21.3.8, 21.3.9, 22, 24, 25.1, 25.8, 25.9, 25.11-25.14, 25.15.1.3, 25.15.1.7, 25.15.2.3, 26.1, 26.5.1, 27 |
| Scott Weston | P. Geo. | Vice President, Business Development and Strategy | Ausenco Sustainability Inc. | Yes | 1.15.1, 1.15.3, 1.20.1.6, 1.20.2.5, 3.2, 4.5, 4.7, 12.2, 20, 25.10, 25.15.1.6, 25.15.2.5, 27 |
| Graeme Roper | P. Geo. | Senior Resource Geologist | Tetra Tech Canada Inc. | Yes | 1.5, 2.3.1, 3.1, 4.2-4.4, 4.6, 5, 6, 11, 12.10, 23, 25.2-25.4, 27 |
| Greg Mosher | P. Geo. | Senior Geologist | Tetra Tech Canada Inc. | Yes | 1.6-1.9, 1.11, 1.20.1.1, 1.20.2.1, 1.21.3, 2.3.2, 7, 8, 9, 10, 12.9, 14, 25.6, 25.15.1.1, 25.15.2.1, 26.3, 27 |
| Hassan Ghaffari | P.Eng. | Director of Metallurgy | Tetra Tech Canada Inc. | Yes | 1.10, 1.21.2, 2.3.3, 12.3, 13, 25.5, 26.2, 27 |
| Pebble Project | Page 42 |
| NI 43-101 Technical Report Update and Preliminary Economic Assessment | August 21, 2023 |
|
|
|
| Qualified Person | Professional Designation | Position | Employer | Independent of Northern Dynasty Minerals Ltd. | Report Sections |
| Sabry Abdel Hafez, PhD. | P.Eng. | Principal Mining Engineer | Worley Canada Services Ltd. (subcontracted through NANA Worley, LLC.) | Yes | 1.12, 1.20.1.2, 1.20.2.2, 1.21.4, 2.3.4, 12.4, 15, 16, 18.7.1, 18.7.2.1, 21.2.4, 21.2.12.2, 21.3.4, 25.7, 25.15.1.2, 25.15.2.2, 26.4, 27 |
| Les Galbraith | P.Eng., P.E. | Specialist Engineer/ Associate | Knight Piésold Ltd. | Yes | 1.15.2, 1.20.1.4, 1.21.6, 2.3.5, 12.5, 18.4, 18.5.1.1-18.5.1.6, 18.5.2, 21.2.6, 21.2.12.3, 21.2.13.2, 21.2.13.3, 21.3.6, 25.15.1.4, 26.6, 27 |
| Stuart J. Parks | P.E. | Electrical Engineer/ Vice President | NANA Worley LLC. | Yes | 1.20.1.5, 12.6, 18.8, 21.2.8.1, 21.3.3, 25.15.1.5, 27 |
| James Wescott Bott | P.E. | Civil Engineer/ Associate Vice President | HDR Alaska, Inc. | Yes | 1.20.2.4, 2.3.6, 12.7, 18.5.1.7, 18.6, 21.2.7.2, 21.2.13.4, 21.3.7, 25.15.2.4, 27 |
| Steven R. Rowland | P.E. | Civil Engineer/ Owner/ Principal Engineer | RECON, LLC | Yes | 2.3.7, 12.8, 18.2, 21.2.8.4, 21.2.12.4, 21.3.10, 26.5.2, 27 |
2.3 Site Visits and Scope of Personal Inspection
2.3.1 Site inspection by Graeme Roper, P. Geo.
QP Graeme Roper, P. Geo. visited the site on Feb 2, 2023. QP Roper was accompanied by James Fueg, Senior Vice President of Pebble Partnership. No active exploration was being conducted at the time of the site visit. The site visit occurred in winter conditions which limited the visit to the project core logging and storage facilities located at Iliamna, AK. QP Roper was not able to set foot at the deposit site, however, a flyover by plane of the deposit site was completed. Visibility was poor, the deposit was snow covered and only geographic characteristics could be identified due to the conditions. During the site visit QP Roper completed data verification checks in support of the Pebble MRE, reviewed standard operating procedure documentation for core logging, density measurements, and core handling, and inspected the quality of the drill core logging and storage facilities.
2.3.2 Site inspection by Greg Mosher, P. Eng.
QP Greg Mosher, P.Eng. visited the site on December 10, 2013, to inspect drillhole locations, and core processing and storage facilities.
2.3.3 Site inspection by Hassan Ghaffari, P.Eng.
QP Hassan Ghaffari, P.Eng. visited the Pebble site on September 1 and 2, 2010. The reasons for that visit were to witness the drilling program, then underway, to collect metallurgical samples, inspect core storage, and observe the Project site, including the proposed areas for the crushers and processing plant. The site visit included investigation of the possible infrastructure locations at the proposed mine and marine terminal sites and interacting with the site geology team.
| Pebble Project | Page 43 |
| NI 43-101 Technical Report Update and Preliminary Economic Assessment | August 21, 2023 |
|
|
|
2.3.4 Site inspection by Sabry Abdel Hafez, P. Eng.
QP Sabry Abdel Hafez, P.Eng. visited the site on December 10, 2013, to inspect potential open pit, waste dump, stockpile, and pit access road locations.
2.3.5 Site inspection by Les Galbraith, P.Eng. P.E.
QP Les Galbraith, P.Eng., P.E., most recently visited the site on June 26, 2013, to witness the geotechnical site investigation program being completed by Knight Piésold at this time and complete a visual reconnaissance of potential infrastructure locations. Previous site visits by Les Galbraith were completed in 2012, 2009, and 2006 to witness geotechnical site investigations being completed by Knight Piésold. Additional geotechnical drilling was completed in 2018 to support the tailings and water management design.
2.3.6 Site inspection by James Wescott Bott, P.E.
QP James Wescott Bott, P.E. visited the Pebble Project site in December 2006 for a duration of 6 days. The reason for the visits was to assist with baseline water quality and hydrological data collection for the proposed mine site. The visits also provided an opportunity to gain familiarity with the topography, location, and watersheds of the area. The topography, location, and watersheds of the project area have not changed since 2006 and would not appreciably affect the water treatment engineering, so there was no need for QP Bott to inspect the site again.
2.3.7 Site inspection by Steven Rowland, P.E.
QP Steven Rowland, P.E. first visited the project in 2005 to assess route alternatives and provide recommendations. Over subsequent years through 2021, QP Rowland has provided engineering services related to access road corridor selection, design, and cost estimates. QP Rowland also managed the reconnaissance geotechnical assessment of the road corridors and personally traversed the primary corridors on foot to complete evaluation of terrain, ground conditions and water body crossings. Site visits and field work have been completed during all seasons with several overland traversed completed during the winter.
2.4 Effective Dates
The effective date for this technical report is August 21, 2023, and an amended and restated report date of September 18, 2023.
2.5 Sources of Information and Data
The sources of information include historical data and reports compiled by previous consultants and researchers of the project and supplied by Northern Dynasty personnel, as well as other documents cited throughout the report and referenced in Section 3 and 27. The QPs have relied on various email exchanges with Northern Dynasty representatives, spreadsheets and previously completed reports filed on System for Electronic Document Analysis and Retrieval (SEDAR).
The QP’s opinions contained herein are based on information provided to the QPs by Northern Dynasty throughout the course of the investigations.
| Pebble Project | Page 44 |
| NI 43-101 Technical Report Update and Preliminary Economic Assessment | August 21, 2023 |
|
|
|
The QPs used their experience to determine if the information from previous reports was suitable for inclusion in this technical report and adjusted information that required amending. This report includes technical information that required subsequent calculations to derive subtotals, totals, and weighted averages. Such calculations inherently involve a degree of rounding and consequently, introduce a margin of error. Where these occur, the QPs do not consider them to be material.
2.5.1 Definitions
Table 2‑2: Units and Abbreviations
| Abbreviation or Acronym | Description |
| amsl | Above mean sea level |
| AP | Acid Potential |
| ARD | Acid Rock Drainage |
| AVR | Acidification, volatilization, and re-neutralization |
| Acme | Acme Analytical Laboratories |
| ADEC | Alaska Department of Environmental Conservation |
| ADFG | Alaska Department of Fish and Game |
| ADL | Alaska Department of Lands |
| ADNR | Alaska Department of Natural Resources |
| ADPS | Alaska Department of Public Safety |
| ADOT & PF | Alaska Department of Transport & Public Facilities |
| APC | Alaska Peninsula Corporation |
| ALS Fairbanks | ALS Minerals in Fairbanks |
| ALS Vancouver | ALS Minerals in North Vancouver |
| (NH4)2 MoO4 | Ammonium molybdate |
| AWC | Anadromous Waters Catalog |
| ALC | Analytical Laboratory Consultants |
| AR | Aqua Regia (HNO3-HCl) |
| AAS | Atomic absorption spectrometry |
| BWi | Ball Mill Work Index |
| Ba | Billion years |
| BDF | Brittle-ductile fault |
| BSEE | Bureau of Safety and Environmental Enforcement |
| BVCCL | Bureau Veritas Commodities Canada Ltd. |
| CIM | Canadian Institute of Mining Metallurgy and Petroleum |
| CIL | Carbon-In-Leach |
| CWA | Clean Water Act |
| CERL | Cominco Exploration Research Laboratory |
| CMP | Compensatory Mitigation Plan |
| Cu | Copper |
| Pebble Project | Page 45 |
| NI 43-101 Technical Report Update and Preliminary Economic Assessment | August 21, 2023 |
|
|
|
| Abbreviation or Acronym | Description |
| DGPS | Differential global positioning system |
| DEM | Digital Elevation Model |
| DWi | Drop weight index |
| EM | Electromagnetic |
| EBD | Environmental Baseline Document |
| EIS | Environmental Impact Statement |
| FAA | Federal Aviation Administration |
| FCC | Federal Communications Commission |
| FERC | Federal Energy Regulatory Commission |
| FEIS | Final Environmental Impact Statement |
| FA | Fire Assay |
| GMMUSA | Full Metal Minerals USA Inc. |
| G&T | G&T Metallurgical Services Ltd. |
| GPS | Global Positioning System |
| Au | Gold |
| GRG | Gravity recoverable gold |
| HAZOP | Hazard and Operability Analysis |
| HSE | Health, safety and environment |
| HSEC | Health, Safety, Environment, and Community |
| INL | Iliamna Natives Limited |
| IP | Induced Polarization geophysics |
| ICP-AES | Inductively coupled plasma atomic emission spectrometry |
| ICP-MS | Inductively coupled plasma mass spectrometry |
| ISO | International Organization for Standardization |
| IX | Ion Exchange |
| The LLC | Kaskanak Copper Limited Liability Company |
| KC | Kaskanak Creek |
| L&PB | Lake and Peninsula Borough |
| LEDPA | Least Environmentally Destructive Practicable Alternative |
| MA | Mass in air |
| MPA | Maximum potential acidity |
| ML | Metal Leaching |
| MIBC | Methyl Isobutyl Carbinol |
| Ma | Millions of years |
| Mo | Molybdenum |
| MAP | Molybdenum Autoclave Process |
| MoO3 | Molybdenum Trioxide |
| Pebble Project | Page 46 |
| NI 43-101 Technical Report Update and Preliminary Economic Assessment | August 21, 2023 |
|
|
|
| Abbreviation or Acronym | Description |
| MRE | Mineral Resource Estimate |
| NEPA | National Environmental Policy Act |
| NI 43-101 | National Instrument 43-101 |
| NMFS | National Marine Fisheries Service |
| NPR | Neutralization potential ratio |
| NP | Neutralizing Potential |
| NAC | Nicholson Analytical Consultants |
| NFK | North Fork Koktuli |
| NQV and SQV | Northern and Southern quartz vein domains |
| PEX | Potassium Ethyl Xanthate |
| PAG | Potentially acid generating |
| PLS | Pregnant Leach Solution |
| PEA | Preliminary Economic Assessment |
| PRA | Process Research Associates Ltd. |
| PEP | Project Execution Plan |
| QP | Qualified Person |
| QA/QC | Quality Control/Quality Assurance |
| QEMSCAN | Quantitative evaluation of materials by scanning electron microscopy |
| QSP | Quartz Sericite Pyrite |
| RTK | Real Time Kinematic |
| ROD | Record of Decision |
| RFA | Request for Appeal |
| RFI | Request for Information |
| RCRA | Resource Conservation and Recovery Act |
| Re | Rhenium |
| RHA | Rivers and Harbors Act |
| RWi | Rod Mill Work Index |
| ROM | Run of Mine |
| SMC | SAG Mill Comminution |
| SAG | Semi-autogenous grinding |
| SGS | SGS Mineral Services |
| Ag | Silver |
| SEX | Sodium Ethyl Xanthate |
| NaHS | Sodium Hydrosulfide |
| SX | Solvent Extraction |
| SFK | South Fork Koktuli |
| SHPO | State Historic Preservation Officer |
| Pebble Project | Page 47 |
| NI 43-101 Technical Report Update and Preliminary Economic Assessment | August 21, 2023 |
|
|
|
| Abbreviation or Acronym | Description |
| SART | Sulphidize, acidify, recycle and thicken |
| SEBD | Supplemental environmental baseline |
| TSF | Tailings Storage Facility |
| Teck | Teck Resources Limited |
| 3D | Three dimensional |
| 3DM | Three-Dimensional Model |
| TDS | Total dissolved solids |
| USACE | U.S. Army Corps of Engineers |
| BATF | U.S. Bureau of Alcohol, Tobacco, and Firearms |
| USCG | U.S. Coast Guard |
| DHS | U.S. Department of Homeland Security |
| USDOT | U.S. Department of Transportation |
| EPA | U.S. Environmental Protection Agency |
| USFWS | U.S. Fish and Wildlife Service |
| MSHA | U.S. Mine Safety and Health Administration |
| USGS | United States Geological Survey |
| UTC | Upper Talarik Creek |
| VWP | Vibrating wire piezometer |
| WMP | Water Management Pond |
| WTP | Water Treatment Plant |
| XRF | X-ray Fluorescence |
| Zonge Engineering | Zonge Engineering and Research Organization Inc. |
Table 2‑3: Unit Abbreviations
| Unit of Measurement | Description |
| % | percent |
| (‘) | minute (plane angle) |
| “ | second (plane angle) |
| < | less than |
| > | greater than |
| ° | degree |
| °C | degrees Celsius |
| °F | degrees Fahrenheit |
| µm | micron |
| A | ampere |
| a | annum (year) |
| ac | acre |
| B | Billion |
| Pebble Project | Page 48 |
| NI 43-101 Technical Report Update and Preliminary Economic Assessment | August 21, 2023 |
|
|
|
| Unit of Measurement | Description |
| CFM | cubic feet per minute |
| cm | centimeter |
| cm2 | square centimeter |
| cm3 | cubic centimeter |
| d | day |
| d/a | days per year (annum) |
| d/wk | days per week |
| ft | feet |
| ft2 | square foot |
| ft3 | cubic foot |
| ft3/s | cubic feet per second |
| g | gram |
| g/cm3 | grams per cubic centimeter |
| g/L | grams per litre |
| g/t | grams per tonne |
| GPM | US gallons per minute |
| h | hour |
| h/a | hours per year |
| h/d | hours per day |
| h/w | hours per week |
| ha | hectare (10,000 m2) |
| hp | horsepower |
| in | Inch |
| in2 | square inch |
| in3 | cubic inch |
| k | one thousand |
| k kg | one thousand kilograms |
| kg | kilogram |
| kg/h | kilograms per hour |
| kg/m2 | kilograms per square meter |
| km | kilometer |
| km/h | kilometers per hour |
| km2 | square kilometer |
| kPa | Kilopascal |
| kt | thousand metric tonnes |
| kV | kilovolt |
| kW | kilowatt |
| kWh | kilowatt hour |
| Pebble Project | Page 49 |
| NI 43-101 Technical Report Update and Preliminary Economic Assessment | August 21, 2023 |
|
|
|
| Unit of Measurement | Description |
| kWh/a | kilowatt hours per year |
| kWh/t | kilowatt hours per tonne (metric tonne) |
| L | litres |
| L/m | litres per minute |
| lb | pounds |
| lb/ton | pounds per short ton |
| m | meters |
| M | million |
| m2 | square meter |
| m3 | cubic meter |
| masl | meters above sea level |
| mg | milligram |
| mg/l | milligrams per litre |
| mi | mile |
| min | minute (time) |
| mL | millilitre |
| mm | millimetre |
| mo. | month |
| Mt | Million metric tonnes |
| MW | megawatt |
| MWh | megawatt hour |
| oz | ounce |
| ppb | parts per billion |
| ppm | parts per million |
| psi | pounds per square inch |
| rpm | revolutions per minute |
| s | second (time) |
| t | metric tonnes (1,000 kg) |
| ton | short tons (2,000 lb) |
| USG | US gallons |
| V | volt |
| wk | week |
| Pebble Project | Page 50 |
| NI 43-101 Technical Report Update and Preliminary Economic Assessment | August 21, 2023 |
|
|
|
3 RELIANCE ON OTHER EXPERTS
3.1 Mineral Tenure
The QPs have not independently reviewed ownership of the project area and any underlying property agreements, mineral tenure, surface rights, or royalties. The QPs have fully relied upon, and disclaim responsibility for, information derived from Northern Dynasty for this information through the following document:
| · | Thomas, T., 2023: Letter to Stephen Hodgson “Re: NI 43-101 Technical Report on Preliminary Economic Assessment, Pebble Project, Southwest Alaska, USA” dated August 17, 2023, that provides the reliance; prepared for Stephen Hodgson, P.Eng. |
This information is used in Section 1 and 4 of this report. It is also used in Section 14 in support of the mineral resource estimates and in Section 22 in support of the economic analysis that supports the 2023 PEA.
3.2 Environmental, Permitting, Closure, and Social and Community Impacts
In disclosing environmental and permitting risks in Chapters 1, 14, 20, 22 and 25 related to the EPA Final Determination and the negative ROD issued by USACE and the opportunity to challenge these decisions by the Pebble Partnership, the QPs have relied on the following letter of Steptoe & Johnson, legal counsel to the Company in respect of certain U.S. regulatory matters:
| · | Barba, Thomas M. of Steptoe & Johnson LLP, counsel to the Company, 2023, Letter to Trevor Thomas “Availability of Legal Challenge to EPA’s Final Determination”, dated August 17, 2023, and provides the above-described reliance. |
3.3 Taxation
The QPs have fully relied upon, and disclaim responsibility for, information supplied by staff and experts retained by Northern Dynasty for information related to taxation as applied to the financial model as follows:
| · | Denson, Joe, 2023: Email to Mark Peters, NDM Chief Financial Officer, “Review of Northern Dynasty tax model”, dated June 21, 2021. |
This information is used in Sections 1 and 22 of this report.
| Pebble Project | Page 51 |
| NI 43-101 Technical Report Update and Preliminary Economic Assessment | August 21, 2023 |
|
|
|
4 PROPERTY DESCRIPTION AND LOCATION
4.1 Property Location
The Pebble Project is located in southwest Alaska, 200 mi southwest of Anchorage, 17 mi northwest of the village of Iliamna, 100 mi northeast of Bristol Bay, and 60 mi west of Cook Inlet.
The project is centered, at latitude 59°53′54" N and longitude 155°17′44" W and is located on the United States Geological Survey (USGS) topographic maps Iliamna D6 and D7, in Townships 2–5 South, Ranges 33–38 West, Seward Meridian (see Figure 4-1).
Figure 4‑1: Property Location Plan

Note: Figure prepared by Northern Dynasty, 2021.
| Pebble Project | Page 52 |
| NI 43-101 Technical Report Update and Preliminary Economic Assessment | August 21, 2023 |
|
|
|
4.2 Mineral Tenure
Northern Dynasty holds indirectly through Pebble East Claims Corporation and Pebble West Claims Corporation, wholly owned subsidiaries of the wholly owned Pebble Partnership, a 100% interest in a contiguous block of 1,840 administratively active mining claims and leasehold locations covering 274 square miles (which includes the Pebble deposit).
State mineral claims in Alaska are kept in good standing by performing annual assessment work or in lieu of assessment work by paying $100 per year per 40 acre (0.06 square miles) mineral claim, and by paying annual escalating State rental fees each year. Assessment work is due annually by noon of September 1. However, credit for excess assessment work can be banked for a maximum of four years after the work is performed and can be applied as necessary to continue to hold the claims in good standing. Annual assessment work obligations for the 1,840 project claims total $442,900 and are due each year on September 1. The 2022 annual Affidavit of Labor on the claims was registered with the Alaska Department of Natural Resources (ADNR) on August 18, 2022. Annual State rentals for 2023 are $912,880 and are payable no later than 90 days after the assessment work is due (December 1). Annual State Rental Payments for 2022 were made in November 2022.
The details of the administratively active mining claims and leasehold locations are provided in Appendix A (ADL refers to the Alaska Department of Lands).
The claim boundaries have not been surveyed.
4.3 Royalty and Other Agreements
On July 27, 2022, Northern Dynasty announced that the Pebble Partnership, together with certain other wholly-owned subsidiaries of the Pebble Partnership, had entered into an agreement (Royalty Agreement) with an investor (the “royalty holder”) to receive up to US$60 M over the next two years, in return for the right to receive a portion of the future gold and silver production from the proposed Pebble Project for the life of the mine. The Pebble Partnership received an initial payment of US$12 M from the royalty holder concurrently with execution of the Royalty Agreement and granted the option to the royalty holder to increase its investment to $60 M, in aggregate. The Pebble Partnership retained the right to 100% of the copper production from the Pebble Project.
Per the terms of the Royalty Agreement, the royalty holder made the initial payment of US$12 M in exchange for the right to receive 2% of the payable gold production and 6% of the payable silver production from the Pebble Project, in each case after accounting for a notional payment by the royalty holder of US$1,500 per ounce of gold and US$10 per ounce of silver, respectively, for the life of the mine. If, in the future, spot prices exceed US$4,000 per ounce of gold or US$50 per ounce of silver, then the Pebble Partnership will share in 20% of the excess price for either metal. Additionally, the Pebble Partnership will retain a portion of the metal produced for recovery rates in excess of 60% for gold and 65% for silver, and so is incentivized to continually improve operations over the life of the mine. Within two years of the date of the Royalty Agreement, the royalty holder has the right to invest additional funds, in US$12 M increments for the right to receive additional increments of 2% of gold production and 6% silver production, to an aggregate total of US$60 M, in return for the right to receive 10% of the payable gold and 30% of the payable silver (in each case, in the aggregate) on the same terms as the first tranche of the investment. The royalty holder is under no obligation to invest additional amounts to increase its interest in the gold and silver production in the Pebble Project.
The Pebble Partnership has also granted to the royalty holder a right of first refusal in respect of the sale of any gold or silver production from the Pebble Project pursuant to a streaming, royalty, or other similar transaction in exchange for an upfront payment. The royalty holder has granted the Pebble Partnership a right of first refusal should it propose to sell any of its rights under the Royalty Agreement.
| Pebble Project | Page 53 |
| NI 43-101 Technical Report Update and Preliminary Economic Assessment | August 21, 2023 |
|
|
|
Subject to certain conditions, the Royalty Agreement does not restrict Northern Dynasty’s ability to form partnerships to assist in the development of the proposed project, for example (but not restricted to) other mining companies or Alaska Native Corporations.
Teck Resources Limited (Teck) holds a 4% pre-payback net profits interest (after debt service), followed by a 5% after-payback net profits interest in any mine production from the Exploration Lands, which are shown in Figure 4-2 and further described in Section 6, History.
Figure 4‑2: Mineral Claim Map with Exploration Lands and Resource Lands

Note: Figure prepared by Northern Dynasty, 2021.
| Pebble Project | Page 54 |
| NI 43-101 Technical Report Update and Preliminary Economic Assessment | August 21, 2023 |
|
|
|
In June 2020, the Pebble Partnership established the Pebble Performance Dividend LLP to distribute a 3% net profits royalty interest in the Pebble Project to adult residents of Bristol Bay villages that have subscribed as participants. The Pebble Performance Dividend will distribute a guaranteed minimum annual payment of US$3 M each year the Pebble mine operates, beginning at the outset of project construction.
4.4 Surface Rights
Northern Dynasty currently does not own any surface rights associated with the mineral claims that comprise the Pebble property. All lands are held by the State of Alaska, and surface rights may be acquired from the State government once areas required for mine development have been determined and permits awarded.
The access corridor that had been defined in the FEIS paralleled the north shore of Iliamna Lake and extended to tide water on Iliamna Bay on Cook Inlet. That access corridor crossed land owned by a number of landowners, including the State of Alaska, Alaska Native Village Corporations, and private individuals. In June 2021, one of the Native Village Corporations announced they had signed an agreement whereby a fund has obtained an option to buy portions of their land to create a conservation easement. The fund exercised its option by the end of 2022. While the Pebble Partnership has not confirmed the impact of that agreement, the 2023 PEA is based on an alternate route that Pebble Partnership had previously defined. That access corridor would include a ferry across Iliamna Lake and extend to port site at Amekdedori on Cook Inlet. The corridor crosses land belonging to the State of Alaska and to two Native Village Corporations, with whom Pebble Partnership has completed access agreements.
4.5 Environmental Liabilities
The Pebble Partnership currently maintains 471 monitoring wells that are periodically used to collect piezometric and water quality data across the project area. The Pebble Partnership did retain a small year-round field facility and two satellite facilities at the deposit site to store materials and equipment used to support maintenance activities. However, most of these facilities were destroyed in a regional tundra fire that swept through the deposit area during the summer of 2022. The Pebble Partnership removed most of the damaged material from the fire aftermath in September 2022 and will revisit the site in 2024 to complete collection any remaining minor debris such as bolts and screws with magnetic rollers. The environmental liabilities associated with the Pebble Project include completion of the fire cleanup, removal of any additional remaining temporary structures and field equipment, closure of monitoring wells, and removal of piezometers. The State of Alaska holds a $2 M reclamation security associated with removal and reclamation of these liabilities.
4.6 Permits
Permits necessary for exploration drilling and other field programs associated with pre-development assessment of the Pebble Project are applied for as required each year. Additional information on permitting is provided in Section 20.6 Permitting Considerations. Of note in Section 20.6 is the Record of Decision (ROD) by USACE to deny Pebble Partnership’s CWA 404 permit application. That denial is currently under appeal.
4.7 Comments
On September 9, 2021, the EPA announced it planned to re-initiate the process of making a CWA Section 404(c) determination for the waters of Bristol Bay. The EPA published a Final Determination on January 30, 2023, that establishes a “defined area for prohibition” coextensive with the current mine plan footprint in which the disposal of dredged or fill material would be prohibited for the Pebble Project. The Final Determination also establishes a 309-square-mile “defined area for restriction” that encompasses the area of the Pebble Project. Under the terms of the Final Determination, the proposed project could not proceed. The Pebble Partnership plans to challenge the Final Determination but there is no assurance that its challenge will be successful.
| Pebble Project | Page 55 |
| NI 43-101 Technical Report Update and Preliminary Economic Assessment | August 21, 2023 |
|
|
|
On July 26, 2023, the State of Alaska filed a Motion for Leave to file a Complaint against the United States and Michael S. Regan, Administrator of the EPA, in the U.S. Supreme Court. The State’s Motion requests that the Supreme Court exercise its original jurisdiction to hear its dispute. The Complaint asserts three causes of action, seeking an order that the Final Determination be vacated or declared unenforceable, or in the alternative, seeking damages for breach of contract and just compensation for the taking of the State’s property.
To the extent known to the QP, there are no other known significant factors and risks that may affect access, title, or the right or ability to perform work on the project that have not been discussed in the 2023 PEA.
| Pebble Project | Page 56 |
| NI 43-101 Technical Report Update and Preliminary Economic Assessment | August 21, 2023 |
|
|
|
5 ACESSIBILITY, CLIMATE, LOCAL RESOURCES, INFRASTRUCTURE and PHYSIOGRAPHY
5.1 Accessibility
The Pebble property is located in southwest Alaska (see Figure 5-1), 200 miles (mi) southwest of Anchorage, 65 mi west of Cook Inlet, and 16 mi northwest of the airport serving the villages of Iliamna and Newhalen. The map shows the proposed infrastructure corridor for the project.
Figure 5‑1: Property Location and Access Map

Note: Figure prepared by Northern Dynasty, 2023.
| Pebble Project | Page 57 |
| NI 43-101 Technical Report Update and Preliminary Economic Assessment | August 21, 2023 |
|
|
|
Access to the project is typically via air from the city of Anchorage to the airport serving the villages of Iliamna and Newhalen. With 292,000 residents, Anchorage is the largest city in Alaska. It is situated at the northeastern end of Cook Inlet and is connected to the national road network via Interstate Highway 1 through Canada to the USA. Anchorage is serviced daily by numerous regularly scheduled flights to major airport hubs in the USA.
From Anchorage, there are regular flights to Iliamna through Iliamna Air Taxi and other operators. Charter flights may also be arranged from Anchorage. From Iliamna, current access to the Pebble Site is by helicopter.
5.2 Climate
The climate of the project area is transitional; it is more continental in winter because of frozen water bodies and more maritime in summer because of the influence of the open water of Iliamna Lake and, to a lesser extent, the Bering Sea and Cook Inlet. Mean monthly temperatures in the deposit area range from 11.4°F in January to 50.8°F in July (at the Pebble 1 meteorological station). The mean annual precipitation in the deposit area is estimated to be 54.6 inches (at the Pebble 1 meteorological station). One-third of this precipitation falls as snow. The wettest months are August through October.
The climate is sufficiently moderate to allow a well-planned mineral exploration program could be conducted year-round (Rebagliati, C.M., and Haslinger, R.J., 2003) at Pebble, although the programs were typically restricted over the winter because of the shorter daylight and weather conditions. The Pebble Project will operate year-round, although transportation operations may experience short-term weather-related delays.
5.3 Infrastructure
There is a modern airfield at Iliamna, with two paved 4,920 ft airstrips, that services the communities of Iliamna and Newhalen. The runways are suitable for DC-6 and Hercules cargo aircraft and for commercial jet aircraft.
There are paved roads that connect the villages of Iliamna and Newhalen to the airport and to each other and a partly paved, partly gravel road that extends to a proposed Newhalen River crossing near Nondalton. The Pebble Site is currently not connected to any of these local communities by road; a road would be planned as part of the project design.
There is no access road that connects the communities nearest the Pebble Site to the coast on Cook Inlet. From the coast, at Williamsport on Iliamna Bay, there is an 18.6-mile state-maintained road that terminates at the east end of Iliamna Lake, where watercraft and transport barges may be used to access Iliamna. The route from Williamsport, over land to Pile Bay on Iliamna Lake, is currently used to transport bulk fuel, equipment and supplies to communities around the lake during the summer months.
Also, during summer, supplies have been barged up the Kvichak River, 43.4 mi southwest of Iliamna, from Kvichak Bay on the North Pacific Ocean.
A small run-of-river hydroelectric installation on the nearby Tazamina River provides power for the three communities in the summer months. Supplemental power generation using diesel generators is required during winter months.
| Pebble Project | Page 58 |
| NI 43-101 Technical Report Update and Preliminary Economic Assessment | August 21, 2023 |
|
|
|
5.4 Local Resources
Iliamna and surrounding communities have a combined population of just over 400 people. As such, there is limited local commercial infrastructure except that which services seasonal sports fishing and hunting.
Section 18 discusses the availability of power, water, mining personnel, and planned locations for key infrastructure for the project that is envisaged in the 2023 PEA.
5.5 Physiography
The Pebble site area is located in the Nushagak-Big River Hills physiographic region. The area consists of low, rolling hills separated by wide, shallow valleys. Elevations range from 775 ft in the South Fork Koktuli (SFK) valley up to 2,760 ft on Kaskanak Mountain. Glacial and fluvial sediment of varying thickness covers most of the study area at elevations below 1,400 ft, whereas the ridges and hills above 1,400 ft generally exhibit exposed bedrock or have thin veneers of surficial material. The hills tend to be moderately sloped with rounded tops. The valley bottoms are generally flat. No permafrost has been identified to date in the project area.
| Pebble Project | Page 59 |
| NI 43-101 Technical Report Update and Preliminary Economic Assessment | August 21, 2023 |
|
|
|
6 HISTORY
6.1 Overview
Cominco Alaska, a division of Cominco Ltd., now Teck, began reconnaissance exploration in the Pebble region in the mid-1980s and in 1984 discovered the Sharp Mountain gold prospect near the southern margin of the current property. Gold was discovered in drusy quartz veins of probable Tertiary age near the peak of Sharp Mountain (anonymous Teck report, 1984). Grab samples of veins in talus ranged from 0.045 oz/ton Au to 9.32 oz/ton Au and 3.0 oz/ton Ag. No record of further work is available, but similar quartz veins were encountered in 2004 during surface mapping of the project area conducted by Northern Dynasty. Most of these veins trend north-south and dip steeply.
Teck staked their first mineral claims on the Property during reconnaissance mapping and sampling programs in the Cone and Sharp Mountain areas in August and September 1984. In November 1987, Teck staked claims on the newly discovered Sill and Pebble prospects and added claims to these two areas in July 1988. Further staking by Teck took place in the Pebble deposit area in July 1989 and in the broader Pebble site area in January and June through September 1991 (St. George et al, 1992). This staking, along with additional claims added in the 1990s, led to the formation of a large continuous claim group. Teck held these claims until the transactions in October 2001 when Northern Dynasty acquired its interest in the property.
In 1987, examination and sampling of several prominent limonitic and hematitic alteration zones yielded anomalous gold concentrations from the Sill prospect, which was recognized as a precious-metal, epithermal-vein occurrence, and from outcrops over and surrounding what later became the Pebble area, but which at that time was of uncertain affinity. These discoveries were followed by several years of exploration including soil sampling, geophysical surveys and core drilling.
Teck conducted geophysical surveys on the Pebble Site between 1988 and 1997. The surveys were dipole-dipole induced polarization (IP) surveys for a total of 122 line-km and were completed by Zonge Geosciences. This work defined a chargeability anomaly 31.1 square miles in extent within Cretaceous age rocks which surround the eastern to southern margins of the Kaskanak batholith. The anomaly measures 13 mi north-south and up to 6.3 mi east-west; the western margin of the anomaly overlaps the contact of the Kaskanak batholith, whereas to the east the anomaly is masked by Late Cretaceous to Eocene cover sequences. The broader anomaly was found to contain 11 distinct centers with stronger chargeability, many of which were later demonstrated to be coincident with extensive copper, gold and molybdenum soil geochemical anomalies. All known zones of mineralization of Cretaceous age on the Pebble property occur within the broad IP anomaly.
Diamond drilling was first conducted on the property during the 1988 exploration program which included 24 core drill holes at the Sill epithermal gold prospect, soil sampling, geological mapping, two core drill holes at the Pebble target and three holes totaling 893 ft on a target (later named the 25 Gold Zone by Northern Dynasty) located 3.7 mi south of the Pebble deposit.
Drilling at the Sill prospect intersected mineralization with gold grades that justified further exploration, but the initial Pebble drill holes yielded only modest encouragement (Table 6-1). In 1989, an expanded soil sampling program, the initial stages of the IP surveys described above, and nine core drill holes were completed at the Pebble target, 15 core drill holes were completed at the Sill prospect, and three core drill holes were completed elsewhere on the property (Table 6-2). Although limited in scope, the IP survey at Pebble displayed response characteristics of a large porphyry copper system. Subsequent drilling by Teck intersected significant intervals of porphyry-style gold, copper, and molybdenum mineralization, validating this interpretation.
| Pebble Project | Page 60 |
| NI 43-101 Technical Report Update and Preliminary Economic Assessment | August 21, 2023 |
|
|
|
Table 6‑1: Teck Drilling on the Sill Prospect to the End of 1997
| Year | No. of Drill Holes | Feet | Meters |
| 1988 | 24 | 7,048 | 2,148 |
| 1989 | 15 | 3,398 | 1,036 |
| Total | 39 | 10,446 | 3,184 |
Table 6‑2: Teck Drilling on the Pebble Deposit to the End of 1997
| Year | No. of Drill Holes | Feet | Meters |
| 1988 | 2 | 554 | 169 |
| 1989 | 9 | 3,131 | 954 |
| 1990 | 25 | 10,021 | 3,054 |
| 1991 | 48 | 28,129 | 8,574 |
| 1992 | 14 | 6,609 | 2,014 |
| 1997 | 20 | 14,696 | 4,479 |
| Total | 118 | 63,140 | 19,245 |
Exploration was accelerated when it became apparent that a significant porphyry copper-gold deposit had been discovered at Pebble. In 1990 and 1991, 25 and 48 core drill holes, respectively, were completed (Table 6-3). In 1991, baseline environmental and engineering studies were initiated, and weather stations were established. A preliminary economic evaluation was undertaken by Teck in 1991 and was updated in 1992 on the basis of 14 new core drill holes. In 1993, an IP survey and a four-hole core drill program were completed at the target that was later named the 25 Gold Zone. In 1997, Teck completed an IP survey, geochemical sampling, geological mapping and 20 core drill holes within and near the Pebble deposit.
From 1988 to 1995, Teck undertook several soil geochemical surveys on the property and collected a total of 7,337 samples (Bouley et al., 1995).
Teck drilled 125 holes in the Pebble area between 1988 and 1997 for a total of 65,295.5 ft. These holes include 118 holes drilled in what later became known as Pebble West and seven holes drilled elsewhere on the property. Of the Pebble West holes, 94 were drilled vertically and 20 were inclined from −45° to −70° at various orientations. Two holes drilled by Teck in 1997 in Pebble West were abandoned before reaching the bedrock target. Teck also completed 39 drill holes on the Sill prospect for a total of 10,445.5 ft in 1988 and 1989.
Table 6‑3: Total Teck Drilling on the Property to the End of 1997
| Year | No. of Drill Holes | Feet | Meters |
| 1988 | 26 | 7,602 | 2,317 |
| 1989 | 27 | 7,422 | 2,262 |
| 1990 | 25 | 10,021 | 3,054 |
| 1991 | 48 | 28,129 | 8,574 |
| 1992 | 14 | 6,609 | 2,014 |
| 1993 | 4 | 1,263 | 385 |
| 1997 | 20 | 14,696 | 4,479 |
| Total | 164 | 75,741 | 23,086 |
| Pebble Project | Page 61 |
| NI 43-101 Technical Report Update and Preliminary Economic Assessment | August 21, 2023 |
|
|
|
6.2 Historical Sample Preparation and Analysis
6.2.1 Sample Preparation
Teck drill core was transported from the drill site by helicopter to a logging and sampling site in the village of Iliamna. The core from within the Pebble deposit was typically sampled on 10 ft intervals and most core from Cretaceous age units was sampled. Samples from the Sill and other areas were typically 5 ft in length, with shorter samples in areas of vein mineralization. Samples consisted of mechanically-split drill core. The samples were transported by air charter to Anchorage and by air freight to Vancouver, BC. All coarse rejects from 1988 through 1997 and all pulps from 1988 and most from 1989 have been discarded. The remaining pulps were later shipped by Northern Dynasty to a secure warehouse at Surrey, BC, for long-term storage.
Teck samples collected in the 1988 and 1989 drill programs were prepared and analyzed by Cominco Exploration and Research Laboratory (CERL) in Vancouver, BC., including all samples from the Sill Deposit, 568 samples from the first 11 holes in the Pebble West deposit, and 178 samples from the three holes in the 25 Zone. In 1990, 1991 and 1992, Teck drilled 87 holes comprising 4,224 samples in the Pebble West deposit and added four holes and 100 samples in an area southeast of the 25 Zone in 1993. Samples from these programs were prepared and analyzed by ALS Minerals (ALS) Laboratories in North Vancouver, BC (formerly Chemex Labs Inc.). During the 1997 program, Teck drilled 20 holes and took 1,214 core samples that were prepared by ALS Laboratories in Anchorage. Core samples processed at the ALS facilities were by drying, weighing, crushing to 70% passing 10 mesh and then splitting to a 250 g sub-sample; the 250 g sub-sample was pulverized to 85% passing 200 mesh.
6.2.2 Sample Analysis
Teck systematically assayed for gold in the Cretaceous intersections from all drill holes completed on the property from 1988 through 1997. Copper analysis was added when the Pebble porphyry discovery hole was drilled in 1989, and single element copper analysis continued for all Cretaceous intersections in 1989. Selective single element molybdenum assays and single element silver analyses were added to some holes in 1989. These methods were by AR digestion with an AAS finish. In 1990, Teck added multi-element analysis to the analytical protocol, which included the determination of copper, molybdenum, silver and 29 additional elements by AR digestion with an ICP-AES finish. In 1991 and 1992, some sections of core were analyzed using AR digestion the multi-element ICP-AES analysis method that included copper, molybdenum, and silver, and 29 additional elements, and some were analyzed using single element copper analysis by AR digestion with an AAS finish. Gold was determined in 1991 and 1992 at ALS by FA fusion of a 10 g sub-sample followed by and AAS finish. Only four holes were drilled by Teck in 1993, on targets south of the Pebble West deposit, and these were only assayed for gold by FA-fusion and for copper by a single element AR digestion AAS method.
No drilling was completed from 1994 to 1996.
In the 1997 Teck program, a 250 g pulp sample was shipped from ALS Anchorage to CERL in Vancouver, BC, for copper analysis using an aqua regia (AR) digestion with inductively coupled plasma atomic emission spectroscopy (ICP-AES) finish. Gold was analyzed using fire assay (FA) on a one assay-ton sample with atomic absorption spectroscopy (AAS) finish. Trace elements also were analyzed by AR digestion and ICP-AES finish. One blind standard was inserted for every 20 samples analyzed. One duplicate sample was taken for every 10 samples analyzed.
Teck analyzed a total of 6,987 core samples from 164 drill holes, including 676 samples analyzed from 39 drill holes on the Sill prospect.
QP Graeme Roper has reviewed Teck sampling and analytical procedures and has determined they are of an acceptable standard.
| Pebble Project | Page 62 |
| NI 43-101 Technical Report Update and Preliminary Economic Assessment | August 21, 2023 |
|
|
|
6.3 Historical Resource Estimates
Teck prepared several resource estimates on the Pebble deposit during the 1990s, employing block models estimated with either kriging or inverse distance (ID) weighting. The cut-off grade used was 0.3% CuEq based on metal prices of $1.00/lb of copper and $375/oz of gold. These estimates are summarized in Table 6-4.
Table 6‑4: Teck Resource Estimates
| Year | Tonnage (M) | Cu (%) | Au (oz/ton) |
| 1990 | 200 | 0.35 | 0.01 |
| 1991 | 500 | 0.35 | 0.01 |
| 1992 | 460 | 0.40 | 0.01 |
| 2000 | 1,000 | 0.30 | 0.01 |
These historical estimates are considered both relevant and reliable, as the methodology was consistent with industry standards at the time of estimation. The historical estimates are classified as inferred. However, no QP has done sufficient work to evaluate these historical estimates and Northern Dynasty is not treating the historical estimates as current mineral resources.
6.4 Study History
The Pebble Project has been the subject of a number of studies, both published and internal, since Teck identified the deposit’s potential. Northern Dynasty’s initial Preliminary Assessment was published in 2004, prior to the discovery of the deeper, higher grade zone initially entitled Pebble East. The 2004 report evaluated an open pit to exploit the then-known resource. The Pebble East discovery led to extensive analysis of the means of mining that zone, which in turn led to the Northern Dynasty 2011 PEA. The 2011 PEA again evaluated the entire known resource, with three phases of open pit development. It also discussed the opportunity to mine the deeper, eastern portion of the resource by underground means. Additional internal analysis was conducted but most of that work went into hiatus with the departure of Anglo American from the Pebble Partnership in 2013.
In 2017, Northern Dynasty and Pebble Partnership developed a development plan to initiate the Federal permitting process under NEPA. Pebble Partnership submitted that plan to USACE in December 2017 and its updated version is presented in the FEIS. With the permitting submission, the development plans examined in the 2011 PEA were no longer current and Northern Dynasty announced that report should no longer be relied upon.
Subsequent PEAs were completed in 2021 and 2022. The 2021 PEA disclosed the results of the financial analysis of the plan contained in the FEIS. Additional details for the plan will be required if and when the project proceeds through State permitting. The 2021 PEA also assessed future potential expansion scenarios for the project, utilizing additional mineral resource and recognizing that any future development would require Federal and State permitting. The 2022 PEA updated the 2021 PEA to incorporate the effect of then recently announced Royalty and the status of the project permitting. The 2022 PEA was superseded by the 2023 Amended Technical Report, effective date May 19, 2023, that updates the status of the project and its permitting, which is superseded by this independent technical report on the current PEA.
| Pebble Project | Page 63 |
| NI 43-101 Technical Report Update and Preliminary Economic Assessment | August 21, 2023 |
|
|
|
6.4.1 Property Ownership
In October 2001, Northern Dynasty acquired, through its Alaskan subsidiary, a two-part Pebble property purchase option previously secured by Hunter Dickinson Group Inc. (HDGI) from an Alaskan subsidiary of Teck Cominco Limited, now Teck Resources Limited (Teck). In particular, HDGI assigned this two-part option (the Teck Option) as 80% to Northern Dynasty while retaining 20% thereof. The first part of the Teck Option permitted Northern Dynasty to purchase (through its Alaskan subsidiary) 80% of the previously drilled portions of the Pebble Property on which the majority of the then known copper mineralization occurred (the “Resource Lands Option”). Northern Dynasty could exercise the Resource Lands Option through the payment of cash and shares aggregating US$10 M prior to November 30, 2004. The second part of the Teck Option permitted Northern Dynasty to earn a 50% interest in the exploration area outside of the Resource Lands (the “Exploration Lands Option”). Northern Dynasty could exercise the Explorations Lands Option by doing some 18,288 m (60,000 ft) of exploration drilling by November 30, 2004, which it completed on time. The HDGI assignment of the Teck Option also allowed Northern Dynasty to purchase the other 20% of the Teck Option retained by HDGI for its fair value.
In November 2004, Northern Dynasty exercised the Resource Lands Option and acquired 80% of the Resource Lands. In February 2005, Teck elected to sell its residual 50% interest in the Exploration Lands to Northern Dynasty for US$4 M. Teck still retains a 4% pre-payback advance net profits royalty interest (after debt service) and 5% after-payback net profits interest royalty in any mine production from the Exploration Lands portion of the Pebble property.
In June 2006, Northern Dynasty acquired, through its Alaska subsidiaries, the remaining HDGI 20% interest in the Resource Lands and Exploration Lands by acquiring HDGI from its shareholders and through its various subsidiaries had thereby acquired an aggregate 100% interest in the Pebble Property, subject only to the Teck net-profits royalties on the Exploration Lands. At that time, Northern Dynasty operated the Pebble Project through a general Alaskan partnership with one of its subsidiaries.
In July 2007, the Pebble Partnership was created and an indirectly wholly-owned subsidiary of Anglo American plc (Anglo American) subscribed for 50% of the Pebble Partnership's equity effective July 31, 2007. Over the next six years, Anglo American spent US$573 M on exploration, resource estimation, environmental data collection and technical studies, with a significant portion spent on engineering of possible mine development models, as well as related infrastructure, power, and transportation systems prior to withdrawing from the project. In December 2013, Northern Dynasty exercised its right to acquire Anglo American’s interest in the Pebble Partnership and now holds a 100% interest in the Pebble Partnership.
On June 29, 2010, Northern Dynasty entered into an agreement with Liberty Star Uranium and Metals Corp. and its subsidiary, Big Chunk Corp. (together Liberty Star), pursuant to which Liberty Star sold 23.8 square miles of claims (the 95 Purchased Claims) to a U.S. subsidiary of Northern Dynasty in consideration for both a $1 M cash payment and a secured convertible loan from Northern Dynasty in the amount of US$3 M. The parties agreed, through various amendments to the original agreement, to increase the principal amount of the loan by $730,174. Northern Dynasty later agreed to accept transfer of 199 claims (the Settlement Claims) located north of the ground held 100% by the Pebble Partnership in settlement of the loan, and subsequently both the Purchased Claims and the Settlement Claims were transferred to a Northern Dynasty subsidiary and ultimately to Pebble West Claims Corporation, a subsidiary of the Pebble Partnership.
On January 31, 2012, the Pebble Partnership entered into a Limited Liability Company Agreement with Full Metal Minerals (USA) Inc. (FMMUSA), a wholly-owned subsidiary of Full Metal Minerals Corp., to form Kaskanak Copper LLC (the LLC). Under the agreement, the Pebble Partnership could earn a 60% interest in the LLC, which indirectly owned 100% of the Kaskanak claims, by incurring exploration expenditures of at least US$3 M and making annual payments of US$50,000 to FMMUSA over a period ending on December 31, 2013. On May 8, 2013, the Pebble Partnership purchased FMMUSA’s entire ownership interest in the LLC for a cash consideration of US$750,000. As a result, the Pebble Partnership gained a 100% ownership interest in the LLC, the indirect owner of a 100% interest in a group of 464 claims located south and west of other ground held by the Pebble Partnership. In 2014, the LLC was merged into Pebble East Claims Corporation, a subsidiary of the Pebble Partnership, which now holds title to these claims.
| Pebble Project | Page 64 |
| NI 43-101 Technical Report Update and Preliminary Economic Assessment | August 21, 2023 |
|
|
|
On December 15, 2017, Northern Dynasty entered into a Framework Agreement with First Quantum Minerals Ltd. (First Quantum) that contemplated that an affiliate of First Quantum would subsequently execute an option agreement with Northern Dynasty with an option payment of US$150 M staged over four years. This option would entitle First Quantum to acquire the right to earn a 50% interest in the Pebble Partnership for US$1.35 B. First Quantum made an early option payment of US$37.5 M to Northern Dynasty, applied solely for the purposes of progressing the permitting of the Pebble Project but withdrew from the project in 2018.
6.5 Historical Production
There has been no production from the Pebble Project.
| Pebble Project | Page 65 |
| NI 43-101 Technical Report Update and Preliminary Economic Assessment | August 21, 2023 |
|
|
|
7 GEOLOGICAL SETTING AND MINERALIZATION
7.1 Introduction
This section has been reviewed by Tetra Tech and summarized from the 2023. Amended Technical Report on the Pebble Project, with an effective date of May 19, 2023.
7.2 Regional Geology
The tectonic and magmatic history of southwest Alaska is complex (Decker et al., 1994; Plafker and Berg, 1994). It includes formation of foreland sedimentary basins between tectonostratigraphic terranes, amalgamation of these terranes and their translation along crustal-scale strike-slip faults, and episodic magmatism and formation of related mineral occurrences. The overview presented here is based largely on Goldfarb et al. (2013) and its contained references.
The allochthonous Wrangellia superterrane comprises the amalgamated Wrangellia, Alexander and Peninsular oceanic arc terranes that approached North America from the southwest in the early Mesozoic. West-dipping subduction beneath the superterrane formed the Late Triassic to Early Jurassic Talkeetna oceanic arc, which is now preserved in the Peninsular terrane east of the Pebble deposit (see Figure 7-1). Several foreland sedimentary basins dominated by Jurassic to Cretaceous flysch, including the Kahiltna basin that hosts the Pebble deposit (Kalbas et al., 2007), formed between Wrangellia and pericratonic terranes and previously amalgamated allochthonous terranes of the Intermontane belt (Wallace et al., 1989; McClelland et al., 1992). Basin closure occurred as Wrangellia accreted to North America by the late Early Cretaceous (Detterman and Reed, 1980; Hampton et al., 2010). Between 115 to 110 Ma and 97 to 90 Ma, the strata in the foreland basins were folded, complexly faulted, and subjected to low-grade regional metamorphism (Bouley et al., 1995; Goldfarb et al., 2013). Intrusions at Pebble are undeformed (Goldfarb et al., 2013) and were emplaced during a period when at least local extension occurred across southwest Alaska in the mid-Cretaceous (e.g., Pavlis et al., 1993). The relative importance of extensional versus compressional structures to the formation of the Pebble deposit is not well constrained, although an important syn-hydrothermal transpressional fault occurs in the eastern part of the deposit.
Since the early Late Cretaceous, deformation in southwest Alaska has occurred mostly on major dextral strike-slip faults that broadly parallel to the continental margin (Figure 7-1). The major Denali Fault in central Alaska forms the contact between the Intermontane Belt and the collapsed flysch basins. Subparallel faults with less substantial displacement are located south of the Denali Fault, and the Pebble district is located between what are terminal strands of the dextral Lake Clark fault zone (Figure 7-1); Shah et al., 2009). The Lake Clark fault zone marks the poorly defined boundary between the Peninsular terrane to the southeast and the Kahiltna terrane, which hosts the Pebble deposit, to the northwest (Figure 7-1). Haeussler and Saltus (2005) propose 16.1 mi of dextral offset along the Lake Clark fault zone, most of which is interpreted to have occurred prior to 38 to 36 M years ago (Ma). Recent field studies of geomorphology along the Lake Clark fault indicate that this structure has not experienced seismic activity for at least the last 10,000 years (Haeussler and Saltus, 2005, 2011; Koehler, 2010; Koehler and Reger, 2011). Other sub-parallel strike-slip faults also form terrane boundaries in the region, including the Mulchatna and Bruin Bay Faults (Figure 7-1). Goldfarb et al. (2013) propose that most or all movement on these smaller structures occurred during oroclinal bending in the Tertiary, after formation of the Pebble deposit.
| Pebble Project | Page 66 |
| NI 43-101 Technical Report Update and Preliminary Economic Assessment | August 21, 2023 |
|
|
|
Figure 7‑1: Location of the Pebble Deposit & Regional Geological Setting of Southwest Alaska
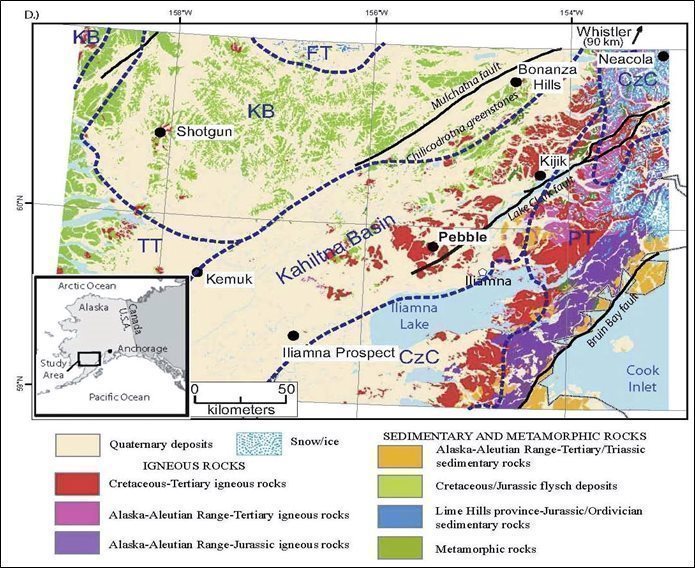
Note: Figure prepared by Lang and modified by Anderson, 2013.
The initiation of magmatism and metallogenesis in the Pebble district coincides with the onset of dextral transpression during basin collapse (Goldfarb et al., 2013). Alkalic to subalkalic intrusions were emplaced between 100 and 88 Ma (Bouley et al., 1995; Amato et al., 2007; Hart et al., 2010; Lang et al., 2013; Olson et al., 2017, 2020). Alaska-type ultramafic complexes were emplaced at Kemuk, which is enriched in platinum group elements (Iriondo et al., 2003; Foley et al., 1997), and a mineralogically-similar alkalic ultramafic body, albeit emplaced at shallow depths and without known enrichment in platinum group elements, occurs at Pebble (Bouley et al., 1995). Porphyry Cu-Mo±Au±Ag mineralization in the region is associated dominantly with subalkalic, felsic to intermediate intrusions formed between 97 and 90 Ma, and includes deposits at Pebble, Neacola (Reed and Lanphere, 1973; Young et al., 1997) and possibly the undated Iliamna prospect (see Figure 7-2A).
| Pebble Project | Page 67 |
| NI 43-101 Technical Report Update and Preliminary Economic Assessment | August 21, 2023 |
|
|
|
Figure 7‑2: Rock Types in the Pebble District
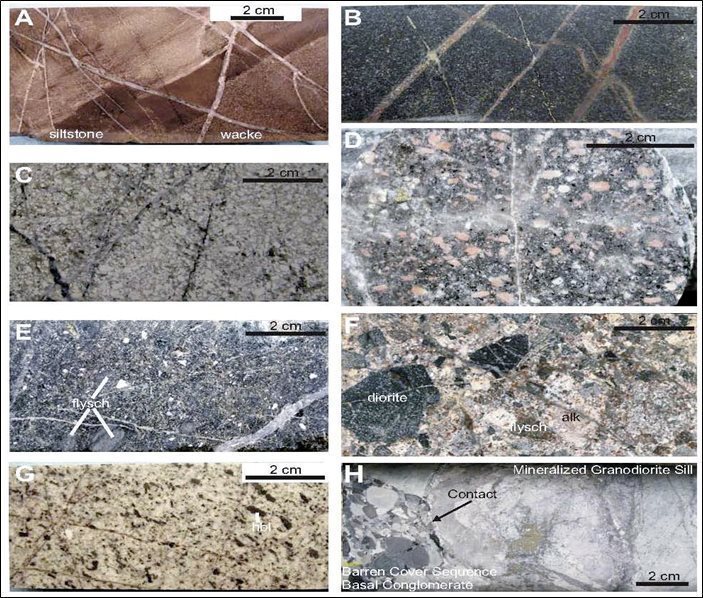
Note: Figure prepared by Lang, 2013.
Late Cretaceous intermediate to felsic intrusions is subalkalic and were emplaced between 75 and 60 Ma (e.g., Couture and Siddorn, 2007; Goldfarb et al., 2013). Porphyry Cu-Au±Mo and/or reduced intrusion-related gold mineralization associated with these rocks (Figure 7-2A) formed at the Whistler deposit (Hames and Roberts, 2020), located 93.2 mi northeast of Pebble, at Kijik River (Kreiner et al., 2020), the Bonanza Hills (Anderson et al., 2013) and Shotgun (Rombach and Newberry, 2001). Late Cretaceous to Eocene intrusions are common in the Kahiltna terrane and widespread, voluminous Eocene volcanic rocks cover much of the Kahiltna terrane and are associated with epithermal precious metal mineralization (Bundtzen and Miller, 1997). Igneous rocks of the mid-Cretaceous, Late Cretaceous, and Eocene magmatic suites are present within the Pebble district.
| Pebble Project | Page 68 |
| NI 43-101 Technical Report Update and Preliminary Economic Assessment | August 21, 2023 |
|
|
|
7.3 Project Geology
7.3.1 Kahiltna Flysch
The oldest rock type in the Pebble district is the Kahiltna flysch, which comprises basinal turbidites, interbedded basalt flows and lesser breccias, and minor gabbroid intrusions. The Kahiltna flysch forms a northeast-trending belt 250 mi. long, which has experienced multiple stages of igneous and hydrothermal activity (Figure 7-1; Goldfarb, 1997; Young et al., 1997). The flysch in the vicinity of Pebble is at least 99 to 96 M years old, based on the maximum age of cross-cutting intrusions. Sediments were predominately derived from intermediate igneous source rocks and consist of siltstone, mudstone, subordinate wacke and rare, thin, lensoidal beds of matrix-supported pebble conglomerate (Figure 7-1). Bedding ranges from laminar to thick and is commonly poorly defined. Bouma sequences (Bouley et al., 1995), graded beds and load casts demonstrate that the stratigraphy is right-way-up.
The flysch locally contains thick layers of basalt flows, lesser breccias and minor mafic volcaniclastic rocks located mostly in the southwest and northern parts of the district. Undated gabbros cut the flysch and volcanic rocks in several areas and are interpreted to be related either to the basaltic volcanic rocks within the flysch or to younger diorite sills.
7.3.2 Diorite and Granodiorite Sills
Diorite and granodiorite sills intruded the Kahiltna flysch (Figure 7-2A) at 96 Ma. These two rock types are interpreted to be coeval, based on the similarity in their distribution and style of occurrence; they are only well documented within the Pebble deposit.
Diorite sills are laterally extensive and range from less than 10 ft to greater than 300 ft in thickness. They are most common as stacked sheets in the western part of the Pebble deposit. The sills are medium grained and weakly porphyritic, with common plagioclase and hornblende and minor pyroxene set in a very fine-grained groundmass of plagioclase and hornblende (Figure 7-2B).
Three laterally continuous granodiorite sills occur within the Pebble deposit. They are up to 1,000 ft thick, with the thickest portions in the northeast part of the deposit. The sills range from fine to medium grained, with common plagioclase and hornblende as well as minor amounts of apatite, in a very fine-grained groundmass of potassium feldspar and quartz with minor to accessory magnetite, apatite and zircon (Figure 7-2C).
7.3.3 Alkalic Intrusions and Associated Breccias
A complex suite of alkalic porphyry intrusions, which range from biotite pyroxenite, monzodiorite, monzonite to syenomonzonite, monzonite and monzodiorite in composition, and associated breccias, occur in the southwest quadrant of the Pebble deposit and extend several miles to the south (Schrader, 2001; Hart et al., 2010; Goldfarb et al., 2013). Isotopic dates on diorite and granodiorite sills, biotite pyroxenite and alkalic intrusions indicate that they are coeval and were emplaced between 99 and 96 Ma (Schrader, 2001; Olson, 2015). Early intrusions are medium-grained, biotite monzonite porphyries (Figure 7-2D) that commonly contain scattered potassium feldspar megacrysts up to a few centimeters in size. Later intrusions are fine-grained porphyritic biotite monzodiorite (Figure 7-2E). All intrusive phases contain angular to subrounded xenoliths of flysch, diorite and, in the younger monzodiorite phase, xenoliths of older alkalic intrusions. Many of the intrusions grade laterally into breccias.
| Pebble Project | Page 69 |
| NI 43-101 Technical Report Update and Preliminary Economic Assessment | August 21, 2023 |
|
|
|
Breccias in the alkalic complex are complicated. Subordinate intrusion breccias have angular to subangular fragments in a cement of a relatively younger porphyritic biotite monzodiorite intrusion. Fragments of diorite sills, early alkalic biotite monzonite porphyry intrusions and flysch are most common xenoliths. In the common breccias, the matrices dominantly consist of a rock flour composed of subangular to subrounded fragments of these same rock types (Figure 7-2F). Hydrothermal cement is absent, and fragments range from a few millimeters to tens of meters in size. Locally, intersections of diorite and granodiorite sills within the breccia bodies may correlate laterally with undisturbed sills. Due to the internal complexity of the alkalic rocks and breccias within the deposit, the complex is modelled as a single unit, loosely interpreted as a megabreccia.
7.3.4 Hornblende Granodiorite Intrusions
Granodiorite intrusions include the Kaskanak batholith and numerous smaller bodies, mostly within or proximal to zones of porphyry-style mineralization around the margins of the batholith. All isotopic dates on these rocks are 90 Ma (Bouley et al., 1995; Lang et al., 2013). The Kaskanak batholith is dominantly a medium-grained hornblende granodiorite porphyry, with minor equigranular hornblende quartz monzonite. Granodiorite intrusions spatially associated with porphyry-style mineralization throughout the Pebble district are all mineralogically and texturally similar to the main phase of the Kaskanak batholith (Figure 7-2G). All of these intrusions are characterized by common hornblende, plagioclase and minor quartz and titanite, set in a fine-grained groundmass of quartz, plagioclase, potassium feldspar, apatite, zircon and magnetite. Megacrysts of potassium feldspar are up to 0.6 in in size, increase in both size and concentration with depth (from less than 2% to greater than 5%) and poikilitically enclose plagioclase and hornblende phenocrysts.
7.3.5 Volcanic Sedimentary cover Sequence
Cretaceous rock types 90 Ma or older are unconformably overlain by well-bedded sedimentary and volcanic rocks (Figure 7-2H), informally called the cover sequence. The cover sequence is up to 2,200 ft thick over the eastern edge of the Pebble deposit, and basalt flows with lesser interbeds of clastic sedimentary rocks are up to at least 6,400 ft thick within the East Graben. The sequence occurs mostly on, and thickens toward, the east side of the district, and is widespread to the southwest, south and north of Pebble. Sedimentary rock types are facing right-way-up but have been tilted 20º east in the deposit area, and include pebble to boulder conglomerate, wacke, siltstone, and mudstone. Plant fossils are common in wacke, and coal-bearing seams up to 1.5 ft thick have been intersected by drilling. Volcanic to sub-volcanic rocks include basalt flows and mafic dykes and sills. Volcaniclastic rocks are abundant and contain angular fragments ranging from basalt to rhyolite within a matrix of comminuted volcanic material. The cover sequence is cut by minor narrow, dykes, and sills of felsic to intermediate composition. Lang et al., (2013) report that basalts in the East Graben are cut by 65 Ma hornblende monzonite porphyry intrusions, and Olson et al., (2017) assign sedimentary and volcanic rocks that overlie the eastern part of the deposit to the late Paleocene to Eocene Talarik Formation, which may correlate with the widespread Copper Lake Formation of Detterman and Reed (1980).
7.3.6 Hornblende Monzonite Porphyry Intrusions
Two porphyry intrusions of hornblende monzonite, up to 820 ft thick, cut basalts within the East Graben and have been dated at 65 Ma (Lang et al., 2013). They are medium-grained and porphyritic, with common plagioclase and lesser hornblende set in a fine-grained groundmass of potassium feldspar, plagioclase, and minor magnetite. These intrusions are not hydrothermally altered.
7.3.7 Eocene Volcanic Rocks and Intrusions
Volcanic and sub-volcanic intrusive rocks on the east side of the district are dated at 46 to 48 Ma (Bouley et al., 1995; Lang et al., 2013). These rocks are mostly exposed on Koktuli Mountain east of the deposit and in the East Graben; reconnaissance drill intersections suggest they are also common in the southeast part of the district beneath glacial cover. Rock types include felsic dykes, brecciated rhyolite flows, fine-grained, equigranular to porphyritic biotite-bearing hornblende latite intrusions and coarse-grained hornblende monzonite porphyry.
| Pebble Project | Page 70 |
| NI 43-101 Technical Report Update and Preliminary Economic Assessment | August 21, 2023 |
|
|
|
7.3.8 Glacial Sediments
Unconsolidated glacial sediments of Pleistocene to recent age cover the valley floors and the flanks of the higher hills (Detterman and Reed, 1973; Hamilton and Klieforth, 2010). The sediments are typically less than 100 ft thick, but drill intersections range up to 525 ft in the wide valley in the southeast part of the district. Ice flow directions over the deposit were to the south-southwest, and the glaciers had retreated by 11 ka (Detterman and Reed, 1973; Hamilton and Klieforth, 2010).
7.3.9 District Structure
The structural history of the district outside of the Pebble deposit is poorly understood due to a paucity of outcrop and marker horizons. The Kahiltna flysch exhibits shallow to moderate dips to the east, south and southeast, which may reflect doming around the margins of the Kaskanak batholith. Folds in the flysch are open, and most inter-limb angles are less than 20°. Folding and related deformation predate hydrothermal activity at Pebble (Bouley et al., 1995; Goldfarb et al., 2013).
Faults are abundant throughout the Pebble district. A metallogenically-significant northeast-trending, syn-hydrothermal brittle-ductile fault zone (BDF) is described later in this section. Most faults are brittle normal or normal-oblique structures that cut and displace all rock types in the district and, in many cases, have been inferred from discontinuities in airborne magnetic and electromagnetic data. The most prominent faults strike north-northeast and northwest, with fewer striking east. The most important of these faults bound the northeast-trending East Graben, which is believed to be a negative flower structure that down-drops high-grade mineralization on the east side of the Pebble deposit. Brittle faults cut Eocene rock types, but precursor structures may have been periodically active since the mid-Cretaceous. There is no geological evidence to suggest that these faults have been recently active.
7.4 Deposit Geology
The characteristics of the Pebble deposit are shown in the plan view in Figure 7-3 and Figure 7-4, and in cross-section in Figure 7-5 to Figure 7-7. Geological interpretation of the Pebble deposit is based almost entirely on core drill intersections. Greater detail on the geology of the Pebble deposit is available in Lang et al. (2013), Olson (2015), and Olson et al. (2017, 2020).
| Pebble Project | Page 71 |
| NI 43-101 Technical Report Update and Preliminary Economic Assessment | August 21, 2023 |
|
|
|
Figure7‑3: Geology of the Pebble Deposit Showing Section Locations
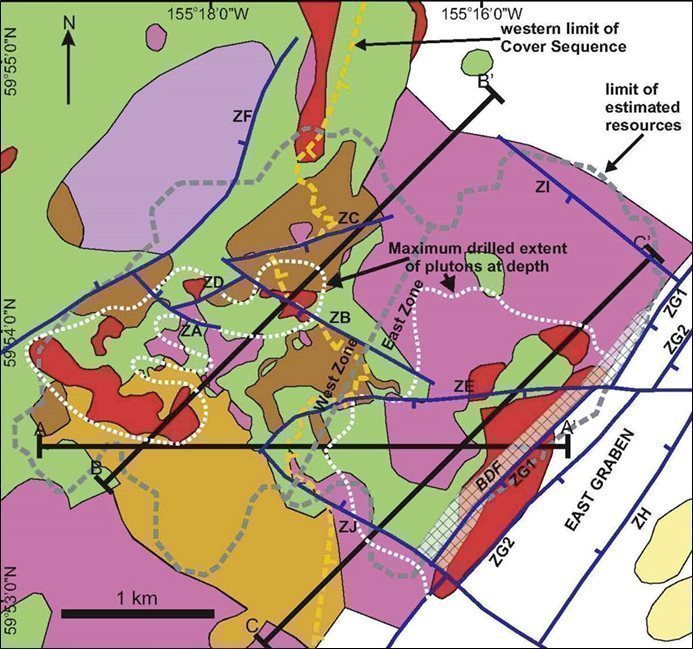
Note: Figure prepared by Lang, 2013.
| Pebble Project | Page 72 |
| NI 43-101 Technical Report Update and Preliminary Economic Assessment | August 21, 2023 |
|
|
|
Figure7‑4: Plan View of Alteration and Metal Distribution in the Pebble Deposit

Note: Figure prepared by Lang, 2013.
| Pebble Project | Page 73 |
| NI 43-101 Technical Report Update and Preliminary Economic Assessment | August 21, 2023 |
|
|
|
| Figure 7‑5: Geology, Alteration and Distribution of Metals, Section A-A′
Note: Figure prepared by Lang, 2013. | Figure 7‑6: Geology, Alteration and Metal Distribution, Section B-B′
Note: Figure prepared by Lang, 2013. | Figure7‑7: Geology, Alteration and Metal Distribution, Section C-C′
Note: Figure prepared by Lang, 2013. |
| Pebble Project | Page 74 |
| NI 43-101 Technical Report Update and Preliminary Economic Assessment | August 21, 2023 |
|
|
|
7.4.1 Rock Types
The deposit is hosted by Kahiltna flysch, diorite, and granodiorite sills, alkalic intrusions and breccias, granodiorite stocks, and granodiorite to granite dykes Figure 7-3 and Figure 7-5. Within the deposit, the Kahiltna flysch is a well-bedded siltstone with less than 10% coarser-grained wacke interbeds; basalt and gabbro are absent. Bedding within the flysch typically dips less than 25º to the east. The flysch was intruded by diorite sills, granodiorite sills and rocks of the alkalic suite prior to hydrothermal activity. The diorite sills are found only in the western half of the deposit.
(Figure 7-5), whereas some granodiorite sills extend across the entire deposit. Intrusions and breccias of the alkalic suite occupy the southwest quadrant of the deposit (Figure 7-3).
The deposit is centered on a group of Kaskanak suite intrusions. Olson (2015) describes the sequence and composition of the intrusions within the Pebble deposit as: (1) earliest, voluminous equigranular granodiorite equivalent to the Kaskanak batholith; (2) transitionally porphyritic granodiorite stocks; (3) early mineral granodiorite porphyry; (4) inter-mineral quartz granite porphyry; and (5) minor late-mineral high-silica quartz granite porphyry. Due to scale, the Kaskanak intrusions are simplified on Figure 7-3 and are shown as the larger Pebble East zone pluton and four smaller bodies in the Pebble West zone. The north contact of the Pebble East zone pluton is close to vertical, and its upper contact dips shallowly to the west; it remains undelineated to the south and has been dropped into the East Graben by the ZG1 normal fault to the east. Contacts of stocks in the Pebble West zone dip steeply to moderately outward. Drill intersections of equigranular granodiorite at depths more than ~3,300 ft below the deposit support the hypothesis that the observed porphyry dikes and stocks in the upper part of the deposit emanate and were derived from a deeper reservoir of granodiorite at depth that is part of the main mass of the Kaskanak batholith.
The Pebble East zone is entirely concealed by the east-thickening cover sequence. The contact between the flysch and the cover sequence ranges from sharp and undisturbed to structurally disrupted with slippage along the contact. The lower half of the sequence comprises a thick basal conglomerate with well-rounded cobbles and boulders of intrusive and volcanic rock types of unknown provenance, overlain by complex, interlayered, discontinuous lenses of pebble conglomerate, wacke, siltstone, and mudstone. The upper half of the sequence comprises volcanic and volcaniclastic rocks (Figure 7-5) dominated by basalt or andesite and intruded by minor felsic to intermediate sills and/or dykes.
The East Graben is filled by basalt flows and lesser sedimentary rocks that have an uncertain relationship to the cover sequence. The graben fill ranges from 4,265 ft thick north of the ZE fault to a thickness of up to at least 6,400 ft to the south. Basalts in the lower half of the graben are cut by two ~65 Ma monzonite porphyry intrusions, which makes them older than the rocks that cover the Pebble East zone. The age of the upper part of the graben fill is unknown but similarities of the sedimentary layers to some rock types in the cover sequence suggests that they may be coeval.
Eocene rocks are rare within and proximal to the Pebble deposit. Where thus far encountered, they comprise narrow felsic dykes, a pink hornblende monzonite intrusion intersected at depth in the central part of the East Graben, and a rhyolite flow breccia at the top of the East Graben, south of the ZE fault.
7.4.2 Structure
Within the western part of the Pebble deposit, the Kahiltna flysch occurs as an open, M-shaped anticline with axes that plunge shallowly to the east-southeast (Rebagliati and Payne, 2006). The folding predates intrusive activity at Pebble and diorite sills are commonly thicker where they exploited the hinges of the folds. Folding did not affect the cover sequence.
| Pebble Project | Page 75 |
| NI 43-101 Technical Report Update and Preliminary Economic Assessment | August 21, 2023 |
|
|
|
A BDF zone was identified on the east side of the Pebble deposit (Figure 7-3) where it manifests a zone of deformation defined by distributed cataclastic seams and healed breccias. It strikes north-northeast, extends at least 1.86 mi along strike, is up to 650 ft wide and is vertical to steeply west-dipping. The BDF is truncated on the east by the ZG1 fault (Figure 7-5) and does not affect the cover sequence. Displacement was dextral-oblique/reverse (S. Goodman, pers. comm., 2008), and correlation of alteration domains across the fault limits post-hydrothermal lateral displacement to less than 1,310 ft. The BDF was active before, during and after hydrothermal activity. Deformation is most intense in flysch north of the Pebble East zone pluton but is weaker within the intrusion, suggesting that the BDF was more active before or during emplacement of the stock. Syn-hydrothermal control on mineralization by the BDF is indicated by the much higher grades of copper and gold and higher vein density within the structural zone compared to adjacent, undeformed host rocks. The characteristics of deformation along the BDF, and its timing relative to hydrothermal activity at Pebble, support at least a local compressional to transpressional environment during the formation of the deposit. Local deformation of veins indicates some post-hydrothermal movement on the BDF.
Brittle faults within the Pebble deposit conform to the district-scale patterns described in Section 7.3.9 (Figure 7-3). The ZB, ZC and ZD faults occur in the Pebble West zone and exhibit normal offset of diorite and granodiorite sills of between 50 ft and 300 ft. Normal displacement on the ZJ and ZI faults is not well constrained. The ZA fault has 100 ft of apparent reverse movement. A minimum of 820 ft of normal displacement occurred across the steeply west-dipping ZF fault, juxtaposing mineralized sodic-potassic alteration in the east against poorly mineralized, propylitic and quartz-sericite-pyrite alteration to the west. Scissors-style, south-side-down normal displacement on the ZE fault increases from around 100 ft on its western end to 980 ft on the east side of the deposit. The ZG1 fault forms the western boundary of the East Graben and has a well-defined normal displacement of 2,100 ft in the north and 2,900 ft in the south, based on offset of the contact between the deposit and the cover sequence (Figure 7-5). The ZG2 fault, which is parallel to the ZG1 fault, has between 880 ft and 1,800 ft of normal displacement. The ZH fault and possible parallel structures farther east mark the eastern margin of the East Graben but remain undelineated. Many of these brittle faults localized intermediate to mafic dykes and a date of 84 Ma for an andesite dyke by Schrader (2001) indicates that brittle faults were active at least from that time and likely continued at least until the Eocene (Olson, 2015).
7.4.3 Deposit Alteration Styles
Alteration styles are summarized below in the order of their interpreted relative ages.
7.4.3.1 Pre-hydrothermal Hornfels
Hornfels related to intrusion of the Kaskanak batholith pre-dates hydrothermal activity and is found in all Cretaceous rock types, except granodiorite plutons and dykes. The hornfels aureole to the batholith is narrow south of Pebble but extends well east of the batholith in the vicinity of the deposit, which suggests that the batholith underlies the deposit, a concept supported by magnetic data (Shah et al., 2009; Anderson et al., 2013). Hornfels-altered flysch is massive but highly susceptible to brittle fracture, although the narrow alteration envelopes around veins indicate that permeability between fractures was low. Hornfels in flysch outside the deposit comprises biotite, K-feldspar, albite, plagioclase and quartz with minor pyrite and other accessory minerals.
7.4.3.2 Hydrothermal Alteration
Numerous stages of hydrothermal alteration are present, including potassic (also sometimes called K- or potassium-silicate alteration), sodic-potassic, illite ± kaolinite, pyrophyllite and sericite advanced argillic, quartz-illite-pyrite, propylitic, and quartz-sericite-pyrite associations, as well as a variety of vein types. Sericite is defined herein as fine-grained, crystalline white mica, whereas illite is very fine-grained, non-crystalline white mica (Harraden et al., 2013). Advanced argillic alteration follows the naming convention of Meyer and Hemley (1967), although there are some differences noted in Pebble alteration. Most metals were introduced during early potassic and sodic-potassic alteration, with significant enhancement of grade in areas overprinted by younger advanced argillic alteration.
| Pebble Project | Page 76 |
| NI 43-101 Technical Report Update and Preliminary Economic Assessment | August 21, 2023 |
|
|
|
7.4.3.3 Early Potassic and Sodic-Potassic Alteration
Most copper-gold-molybdenum-silver-rhenium mineralization coincides with early potassic and sodic-potassic alteration. Potassic alteration occurs mostly in the upper part of the Pebble East zone, whereas sodic-potassic alteration occurs in the Pebble West zone and below potassic alteration in the Pebble East zone. Sodic-potassic alteration is distinguished from potassic primarily by the presence of albite and a higher concentration of carbonate minerals (Gregory and Lang, 2011, 2012; Gregory, 2017). Associated vein types are described below.
Potassic alteration occurs in all rock types and is most intense in flysch and granodiorite sills near the Pebble East zone pluton, within the Pebble East zone pluton and in small areas of the Pebble West zone (Gregory and Lang, 2009). It is weakest in the area between the Pebble East and Pebble West zone centers. The assemblage includes potassium feldspar, quartz, and biotite with trace to minor ankerite or ferroan dolomite, apatite, and rutile. Sulphides include disseminated chalcopyrite and pyrite with minor molybdenite and bornite (Gregory and Lang, 2009). The proportion of biotite to potassium feldspar correlates with the original Fe-Mg concentration of host rocks and, thus, is highest in flysch and diorite sills.
Intrusive rocks in the Pebble West zone are affected by early sodic-potassic alteration which comprises albite, biotite, potassium feldspar and quartz, accompanied by ankerite, ferroan dolomite, trace apatite, magnetite and, locally, siderite. The concentration of carbonate minerals increases with depth. Sulphides include pyrite and chalcopyrite that both generally decrease in concentration with depth. Sodic-potassic alteration of sedimentary rocks is mineralogically similar to that in the intrusions and is typically pervasive.
In the Pebble East zone, sodic-potassic alteration occurs below potassic alteration and is distinguished from similar alteration in the Pebble West zone by the presence of epidote and calcite and by lower metal grades. The potassic to sodic-potassic transition occurs over vertical distances of less than 330 ft. In the Pebble East zone pluton, cores and rims of zoned plagioclase phenocrysts are replaced by calcite-epidote and albite, respectively. Hornblende phenocrysts were replaced by biotite and then by chlorite. Hematitized igneous magnetite is also present. The igneous groundmass was replaced by fine-grained quartz, potassium feldspar, and variable albite. Mineralization is weak in this alteration and decreases with depth, and commonly comprises 2% pyrite and trace to minor chalcopyrite and molybdenite. This alteration is difficult to distinguish from peripheral propylitic alteration and its potential equivalence to well-mineralized sodic-potassic alteration in the Pebble West zone remains unclear.
Potassic alteration overprints sodic-potassic alteration, but the two alteration types are interpreted to be coeval and therefore are treated as a single alteration event. The apparent relative timing is likely a consequence of telescoping and/or changing fluid chemistry during cooling. The paragenetic and spatial relationship between sodic-potassic alteration in the Pebble East and Pebble West zones and peripheral propylitic alteration is not established.
1.4.3.4 Vein Types Associated with Early Potassic and Sodic-Potassic Alteration
Four major quartz-sulphide vein types, comprising 80% of all veins in the deposit, are associated with early potassic and sodic-potassic alteration and are classified as types A, B, M and C. Each type includes varieties that broadly correlate with lateral and/or vertical position in the deposit. The naming conventions, while similar to common porphyry vein nomenclature, are not exact equivalents similarly named to vein types described from other deposits (e.g., Gustafson and Hunt, 1975; Clark, 1993; Gustafson and Quiroga, 1995). For clarity in the sections that follow, the term selvage is used to denote minerals lining the interior walls of a dilatant vein, whereas envelope refers to alteration in the host rock to a vein.
Total density of vein types A, B and C across most of the Pebble deposit is between 5 and 15 vol % (using the criteria of Haynes and Titley (1980) and excluding alteration envelopes). Lower concentrations occur near the margins of the deposit and at depth below the 0.3% CuEq resource boundary. Higher concentrations occur within or proximal to the Pebble East zone pluton and locally proximal to the smaller granodiorite plutons in the Pebble West zone. Vein density does not correlate consistently with rock type, and in most cases, patterns extend smoothly across lithological contacts. Measurements in oriented drill core do not reveal any significant or consistent preferred vein orientations.
| Pebble Project | Page77 |
| NI 43-101 Technical Report Update and Preliminary Economic Assessment | August 21, 2023 |
|
|
|
On the east side of the Pebble East zone there are two domains characterized by 50 to 90% quartz veins. These two zones are surrounded by and gradational with a larger zone that contains greater than 20% quartz veins of either the A1 or B1 vein subtypes (see below). These zones of high vein density reflect repeated refracturing and dilation that accommodated repeated vein precipitation events. The first domain is located north of the ZE fault in a broadly cylindrical zone 330 to 1,640 ft wide and extending up to 1,970 ft below the cover sequence. Veins in this first zone are not deformed and controlling faults have not been identified. The second area forms a north-northeast-trending, nearly vertical, tabular zone that lies within the zone of brittle-ductile deformation. This second area is truncated to the east by the ZG1 fault, continues into the East Graben and is open below depths of 4,920 ft. Veins in this zone are commonly deformed, locally brecciated, and formed during syn-hydrothermal deformation along the BDF or a precursor structure.
7.4.3.4.1 Type A Veins
Type A veins are the oldest of the four types and include subtypes A1, A2 and A3. The A1 subtype is the most common and occurs mostly within the upper 2,300 ft of the Pebble East zone pluton. These veins are sinuous to anastomosing, discontinuous, and typically have diffuse contacts. They contain quartz, trace to minor potassium feldspar, less than 1 to 2% pyrite, lesser chalcopyrite, and rare molybdenite. Potassium feldspar alteration envelopes are commonly narrow, diffuse, and a few millimeters wide. They occur within zones of pervasive, weakly mineralized potassic alteration.
The A2 veins occur below 3,300 ft in the Pebble East zone pluton and have characteristics transitional between quartz veins and pegmatites. They are characterized by potassium feldspar selvages and coarse-grained cores of euhedral to subhedral quartz. Coarse clots of biotite are locally present along with trace chalcopyrite, molybdenite and/or pyrite. The A2 veins are sinuous, discontinuous, irregular, have diffuse contacts and lack alteration envelopes.
A3 veins are transitional between vein types A1 and B1 and are most common below 2,500 ft in the Pebble East zone pluton. The A3 veins are typically anastomosing, sinuous to irregular and have diffuse contacts with prominent potassium feldspar envelopes. They contain quartz with trace to minor potassium feldspar and biotite, and locally contain up to 3% pyrite, minor chalcopyrite and rare molybdenite.
7.4.3.4.2 Type B Veins
Type B veins cut type A veins and include subtypes B1, B2 and B3. These are spatially coincident with potassic and sodic-potassic alteration, are the most widespread veins at Pebble and are most abundant within and proximal to the Pebble East zone pluton.
B1 veins are the most common subtype and are planar, continuous, have sharp contacts, and are typically 0.1 to 1.2 in wide. They are dominated by quartz with trace to minor biotite, potassium feldspar, apatite and/or rutile. The veins typically contain 2 to 5% of both pyrite and chalcopyrite with minor molybdenite and local bornite. Potassium feldspar (±biotite) alteration envelopes are ubiquitous, highly variable in width and contain disseminated chalcopyrite, pyrite and molybdenite.
B2 veins occur below 2,600 ft depth in the Pebble East zone and broadly coincide with sodic-potassic alteration. They contain quartz and minor K-feldspar and have narrow, weak potassium feldspar or biotite alteration envelopes. B2 veins transition upward into B1 veins and are distinguished from B1 veins by green chlorite pseudomorphs after coarse aggregates of locally preserved hydrothermal biotite and by minor calcite and epidote. The veins typically contain less than 2% pyrite, and minor chalcopyrite, and molybdenite.
| Pebble Project | Page 78 |
| NI 43-101 Technical Report Update and Preliminary Economic Assessment | August 21, 2023 |
|
|
|
B3 veins are most common in the north-central and south-central part of the Pebble East zone, and below 5,600 ft depth in the lower grade domain between the Pebble East and Pebble West zones. These veins are similar to B1 veins but contain molybdenite as the dominant sulphide and have only sporadic, weak, potassium feldspar alteration envelopes. B3 veins are planar and can be greater than 3.3 ft in width. B3 veins cut vein types A, B1, B2 and, locally, C veins; B3 veins are interpreted to represent a late substage of early alteration which locally introduced significant molybdenum to the Pebble deposit.
7.4.3.4.3 Type M Veins
Type M veins are associated with magnetite-bearing sodic-potassic alteration within and proximal to diorite sills in the Pebble West zone. Paragenetically, M veins formed between vein types B1 and C. They are planar to irregular and are typically 0.4 to 2 inches wide. These veins comprise mostly magnetite and quartz with lesser ankerite and potassium feldspar as well as greater than 10% chalcopyrite and pyrite with minor molybdenite. The M veins have narrow potassium feldspar alteration envelopes.
7.4.3.4.4 Type C Veins
Type C veins are the most abundant veins in the western half of the deposit. The C veins cut A and B veins (except possibly the B3 subtype) and are contemporaneous with or slightly younger than M veins. C veins at Pebble are defined according to their relative timing and do not resemble the C veins defined by Gustafson and Quiroga (1995). The veins contain mostly quartz, locally abundant ankerite or ferroan dolomite, minor to trace potassium feldspar, magnetite, and biotite, and 10% (locally up to 50%) sulphides. Sulphides include pyrite and chalcopyrite, variable molybdenite, trace arsenopyrite and rare bornite. The veins are planar, have sharp contacts, range from less than 0.4 in to 2 in wide and commonly contain vugs along their central axis. Alteration envelopes are prominent with similar mineralogy to the veins and can be up to 10 times the width of the vein in the more permeable intrusive host rocks. Where the alteration envelopes to several C veins overlap, drill intersections up to 15 ft in length can grade up to several percent copper.
7.4.3.5 Intermediate Illite ± Kaolinite Alteration
Illite ± kaolinite alteration is coincident with and overprints early potassic and sodic-potassic alteration. Alteration intensity is highest at moderate depths within the Pebble East zone pluton. In these rocks, illite replaces phenocrysts of plagioclase previously altered to potassium feldspar and locally replaces the potassically-altered igneous matrix. This alteration style is weakest in flysch in the Pebble West zone. Minor pyrite co-precipitated with illite but is likely a local reconstitution of older sulphides. Fracture or fault control is rarely apparent. Kaolinite accompanies illite in alteration of previously sodic-potassic altered areas where it replaces albite.
7.4.3.6 Late Advanced Argillic Alteration
Advanced argillic alteration occurs only in the East Zone, where it is associated with the highest grades of copper and gold in the deposit. Advanced argillic alteration occurs within and adjacent to the BDF. This alteration comprises a pyrophyllite-quartz-sericite-chalcopyrite-pyrite zone within the BDF that is bounded to the west by an upwardly flaring envelope of sericite-quartz-pyrite-bornite-digenite-chalcopyrite alteration to the west (cf., Khashgerel et al., 2009). Advanced argillic alteration is truncated on the east by the ZG1 fault but deep intersections in hole 6348 demonstrate that this alteration and its associated high-grade mineralization continues eastward into the graben. Both the sericite and the pyrophyllite alteration types replace potassic and sodic alteration. The sericite alteration is locally replaced by younger quartz-sericite-pyrite alteration.
| Pebble Project | Page 79 |
| NI 43-101 Technical Report Update and Preliminary Economic Assessment | August 21, 2023 |
|
|
|
Pyrophyllite alteration is accompanied by quartz, sericite, pyrite and chalcopyrite. Pyrite concentration is commonly greater than 5% and is much higher than in adjacent early potassic alteration. Pyrophyllite alteration is coincident with but overprints the southern zone of high quartz vein density; quartz-sulphide veins within this zone are commonly deformed. Veins associated with pyrophyllite alteration are irregular, narrow, contain pyrite ± chalcopyrite in massive to semi-massive concentrations, contain variable quartz, and lack visible alteration envelopes. Pyrophyllite alteration has not been identified in the northern zone of high quartz vein density.
Pervasive sericite alteration forms an upward-flaring envelope west of the pyrophyllite alteration. Sericite alteration occurs in the upper 1,000 ft of the deposit on the downthrown southern side of the ZE fault. This alteration is pervasive and dominated by white sericite that replaces feldspars previously affected by potassic and illite alteration. Pyrite concentration is intermediate between pyrophyllite alteration and early potassic alteration and decreases with depth. Sericite alteration is distinguished by high-sulphidation hypogene copper minerals represented by various combinations of bornite, covellite, digenite, tennantite-tetrahedrite, and locally trace enargite. These minerals commonly replace the rims of chalcopyrite and pyrite precipitated during early potassic alteration. Minor quartz-rich veins with pyrite are related to this alteration, are narrow and irregular, and locally have well-developed envelopes with quartz, sericite, pyrite and high sulphidation copper minerals.
7.4.3.7 Propylitic Alteration
Propylitic alteration extends at least 3 mi south of the deposit and to the limit of drilling 1.4 mi to the north. Weak propylitic alteration also occurs throughout the eastern half of the Kaskanak batholith. This alteration comprises chlorite, epidote, calcite, quartz, magnetite and pyrite, minor albite and hematite, and trace chalcopyrite. Sulphide concentration is less than 3% and is mostly pyrite.
Type H veins occur locally and at low vein density throughout propylitic alteration. They contain calcite, hematized magnetite, quartz, albite, epidote, pyrite and trace to minor chalcopyrite. H veins are planar, less than 0.4 in wide and have alteration envelopes similar in mineralogy and width to the veins.
Polymetallic type E veins occur locally south of the deposit, in areas of propylitic and quartz-sericite-pyrite alteration. Rarely, E veins cut sodic-potassic alteration in the Pebble West zone. The E veins are planar, can be up to two ft in width, have sharp contacts with host rocks and locally have weak sericite alteration envelopes. These veins contain various combinations of quartz, calcite, pyrite (locally arsenian), sericite, sphalerite, galena, minor chalcopyrite, and trace arsenopyrite, tennantite-tetrahedrite, freibergite, argentite and native gold.
7.4.3.8 Quartz-Sericite-Pyrite and Quartz-Illite-Pyrite Alteration
The quartz-sericite-pyrite (QSP) alteration occurs closer to the center of the deposit than does the propylitic alteration, but where these two alteration types overlap the QSP alteration is younger. QSP alteration, which is equivalent to classic phyllic alteration, is commonly texture-destructive and forms a halo around the deposit with inner and outer alteration fronts that dip steeply away from the core of the deposit. This halo extends at least 2.6 mi south of the deposit and 0.9 mi north; it is weakly developed west of the ZF fault where it partially overprints propylitic alteration. It occurs at depth in the north part of the East Graben but its full distribution east of the ZG1 fault is not established. In the Pebble East zone, the transition from potassic or advanced argillic alteration to intense, pervasive QSP alteration typically occurs over 50 to 60 ft. Weak QSP alteration occurs sporadically throughout the Pebble West zone with a more gradual outward transition than in the Pebble East zone.
The mineralogy of the QSP alteration type includes quartz, sericite, 8 to 20% pyrite, minor to trace ankerite, rutile and apatite, and rare pyrrhotite. Zones are cut by up to 10% pyrite-rich type D veins (Gustafson and Hunt, 1975) with variable amounts of quartz and trace rutile, chalcopyrite and ankerite. D veins are planar, have sharp contacts with host rocks and range from less than 1 in to 5 ft in width. Alteration envelopes are typically wider than the veins and form intense pervasive QSP alteration where they coalesce.
| Pebble Project | Page 80 |
| NI 43-101 Technical Report Update and Preliminary Economic Assessment | August 21, 2023 |
|
|
|
Quartz-illite-pyrite (QIP) alteration partially replaces potassic and/or sodic-potassic alteration in the upper, central part of the deposit. QIP alteration is interpreted as a zone of former weak to moderate, grade-destructive QSP alteration, located at the transition between sodic-potassic and potassic alteration, that was later overprinted by low-temperature illite alteration as the hydrothermal system waned. QIP alteration is texturally and mineralogically similar to QSP alteration, except that illite is the main phyllosilicate phase rather than sericite (Harraden et al., 2012). The pyrite concentration in QIP alteration is typically 5 to 10%, which occurs mostly in type D veins and their alteration envelopes. Domains between the QIP alteration envelopes preserve relict sodic-potassic alteration that host most of the copper mineralization that remains in this zone.
7.4.3.9 Post-Hydrothermal Alteration
The youngest alteration at Pebble is clay alteration, which is common within 50 ft of the contact between the cover sequence and underlying Cretaceous rocks. Young, brittle faults that cut the deposit, in particular the ZG1 fault, host or are closely associated with basalt dikes related to volcanic rocks in the cover sequence. The faults and dikes are surrounded by narrow alteration zones of epidote, calcite, chlorite, and pyrite. An extremely small proportion of mineralization in the deposit is affected by this alteration.
7.4.4 Mineralization Styles
Mineralization in the Pebble West zone is mostly hypogene, with a thin zone of mostly weak supergene overprint beneath a thin leached cap. Mineralization in the Pebble East zone is entirely hypogene with no preservation of leaching or paleo-supergene below the unconformity with the cover sequence.
7.4.4.1 Supergene Mineralization and Leached Cap
A thin leached cap occurs at the top of the Pebble West zone. Strong leaching is rarely more than 33 ft thick but is highly variable, and weak oxidation along fractures locally extends to depths of up to 500 ft along or near brittle faults. Hypogene pyrite is commonly preserved in the leached zone, and minor malachite, chrysocolla and native copper are present locally.
Supergene mineralization occurs only in the Pebble West zone where the cover sequence is absent. Similar to the overlying leached cap, the thickness of supergene mineralization is highly variable. It locally extends to a depth of 560 ft in strongly fractured zones, but on average is closer to 200 ft in average thickness and tapers toward the margins of the resource. In the supergene zone, pyrite is typically rimmed by chalcocite, covellite and minor bornite, and complete replacement of pyrite is rare (Gregory and Lang, 2009; Gregory et al., 2012). The transition to hypogene mineralization with depth is gradational over vertical intervals of up to 100 ft. Supergene processes increased copper grade up to 50% across narrow intervals but the upgrading is typically much less.
7.4.4.2 Hypogene Mineralization
Patterns of metal grades and ratios at Pebble correspond closely to alteration styles, with only weak or local relationships to host rock. The preserved deposit has a flat tabular geometry when the 20° post-hydrothermal tilt is removed. Copper and gold grades diminish below 1,300 ft depth in the Pebble West zone but extend much deeper in the Pebble East zone, particularly within and proximal to the BDF. Laterally, grades decrease gradually toward the north and south margins of the deposit, where mineralization terminates over short distances due to the overprint by intense, grade-destructive QSP alteration. Moderate grades with the shortest vertical extent are observed in the middle of the deposit between the Pebble East and Pebble West zones. There is a general correspondence between copper and gold grades outside of the Pebble East zone pluton; within the Pebble East zone pluton, there is a closer correspondence between copper and molybdenum at low grades of gold, except where gold-rich advanced argillic alteration is present. On the west side of the deposit, mineralization extends to the normal/oblique ZF fault, but drilling has been too shallow to determine if the deposit continues to the west at depth. On the east side, the deposit was down-dropped by the ZG1 fault and continuation of high-grade mineralization into the East Graben has been confirmed by drilling. Molybdenum exhibits a more diffuse pattern, is open at depth and, in some areas, domains with strongly elevated grade corresponds with higher densities of molybdenite-rich type B3 veins.
| Pebble Project | Page 81 |
| NI 43-101 Technical Report Update and Preliminary Economic Assessment | August 21, 2023 |
|
|
|
Mineralization was primarily introduced during early potassic and sodic-potassic alteration. Copper is hosted primarily by chalcopyrite (Figure 7-8) that is locally accompanied by minor bornite (Figure 7-9) and trace tennantite-tetrahedrite. The pyrite to chalcopyrite ratio is typically close to one in potassic alteration in the Pebble East zone but is commonly much higher in the Pebble West zone where sulphide-rich type C and, locally, type D veins are present. Gold occurs primarily as electrum inclusions in chalcopyrite with minor amounts hosted by silicate alteration minerals and pyrite, and rarely as gold telluride inclusions in pyrite (Gregory et al., 2013). Diorite sills with magnetite-rich alteration and type M veins have relatively high gold concentrations. Molybdenite occurs in quartz veins and as intergrowths with disseminated chalcopyrite.
Figure 7‑8: Drill Core Photograph Showing Chalcopyrite Mineralization
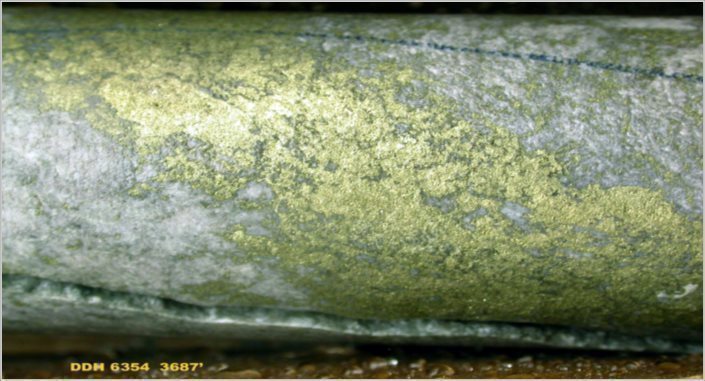
Source: Northern Dynasty, 2006.
| Pebble Project | Page 82 |
| NI 43-101 Technical Report Update and Preliminary Economic Assessment | August 21, 2023 |
|
|
|
Figure 7‑9: Drill Core Photograph Showing Chalcopyrite and Bornite Mineralization

Source: Northern Dynasty, 2006.
Incipient to weak illite ± kaolinite alteration had little effect on grade, whereas strong alteration reduced the grade of copper and gold but left molybdenum largely undisturbed. Gold liberated during illite ± kaolinite alteration was reconstituted as high-fineness inclusions (gold grains with less than 10 wt% Ag) in newly formed pyrite (Gregory and Lang 2009; Gregory et al., 2013). These patterns are consistent with the effects of illite alteration on grade in many porphyry deposits (e.g., Seedorf et al., 2005; Sillitoe, 2010).
Advanced argillic alteration zones have much higher grades of copper and gold, but similar molybdenum compared to adjacent early potassic alteration. Pyrophyllite alteration precipitated high concentrations of pyrite and chalcopyrite and both minerals contain inclusions of high-fineness gold (Gregory et al., 2013). During sericite alteration, bornite, covellite, digenite and trace enargite or tennantite replaced chalcopyrite formed during early potassic alteration, and also precipitated minor additional pyrite (Gregory and Lang, 2009). In general, gold occurs as high-fineness inclusions in later pyrite and high-sulphidation copper minerals, whereas electrum predominates in relict early chalcopyrite (Gregory et al., 2013).
The zone of high quartz vein density along the BDF is typically well-mineralized where it has been overprinted by pyrophyllite alteration. The northern zone of high quartz vein density has average to low grades of copper and gold except in small areas where higher grades reflect the presence of the sericite subtype of advanced argillic alteration.
The late QSP alteration is invariably destructive of both copper and molybdenum mineralization. Gold concentrations, however, remain consistent at 0.15 to 0.5 g/t, but locally exceed 1 g/t (Lang et al., 2008). The QIP alteration has a similar effect on copper, molybdenum and gold but is not completely pervasive, such that copper and molybdenum grades are reduced and some of the gold now occurs as high-fineness inclusions in pyrite formed by breakdown of older sulphides (Gregory et al., 2013).
| Pebble Project | Page 83 |
| NI 43-101 Technical Report Update and Preliminary Economic Assessment | August 21, 2023 |
|
|
|
Grade variation within the cores of the Pebble East and Pebble West zones shows a weak, local relationship to rock type. Higher than average copper and gold grades are spatially related to highly reactive, iron-rich diorite sills, a relationship common in porphyry deposits (e.g., Ray, Arizona; Phillips et al., 1974). On the margins of the deposit and in the lower grade area between the Pebble East and Pebble West Zones, relatively impermeable flysch affected by pre-hydrothermal hornfels has lower grades than adjacent, more permeable granodiorite sills.
7.4.4.3 Rhenium
The Pebble deposit is remarkable for its very large endowment in rhenium, for which a resource is estimated in Section 14 that compares favourably with the largest known global resources of rhenium (Sinclair et al., 2009). Rhenium is one of the lesser known metals and is one of the rarest elements on earth, with a crustal abundance of less than one part per billion (John et al., 2017). The United States, under Executive Order 13817, has caused rhenium to be placed on its list of critical minerals, stating that it “is essential to the economic and national security of the United States that has a supply chain vulnerable to disruption.” (US Department of the Interior news release, May 18, 2018). Rhenium typically does not form discrete minerals in nature, but because of its valence and atomic radius instead almost exclusively substitutes for molybdenum in the lattice of molybdenite (e.g., McCandless et al., 1993; Barton et al., 2019). Globally most rhenium is recovered from flue dust created during the roasting of molybdenite concentrates, most of which come from porphyry-style deposits like Pebble (John et al., 2017). Elevated concentrations of rhenium occur throughout the Pebble deposit and as expected, the concentrations of rhenium and molybdenum are very closely correlated. Molybdenite concentrates produced during metallurgical testwork on the Pebble deposit contain up to 960 ppm rhenium, which places Pebble in the upper echelon of porphyry deposits (e.g., McCandless et al., 1993; Barton et al., 2019). Detailed rhenium deportment studies have not yet been completed to determine if the concentration of rhenium in molybdenite varies spatially across the Pebble deposit or in paragenetically distinct stages of molybdenite precipitation, e.g., molybdenite in late B3 veins compared to molybdenite in earlier potassic or sodic-potassic alteration. Visual inspection of the 3D distribution of molybdenum to rhenium ratios in assay results across the Pebble deposit, however, suggests a general consistency with limited variation.
7.4.4.4 Palladium
The Pebble deposit also contains elevated concentrations of the platinum group metal palladium, which is also considered a critical mineral by the Department of the Interior. This places Pebble among a very small minority of porphyry deposits known to contain significant palladium concentrations (e.g., McFall et al., 2018; Hanley et al., 2020). The highest concentrations of palladium at Pebble occur in or proximal to areas affected by advanced argillic alteration, but elevated palladium also occurs in many other parts of the deposit including within the proposed open pit. The deportment of palladium remains essentially unstudied at Pebble. A single sample of pyrite from the pyrophyllite alteration zone was analyzed by in-situ laser ablation inductively coupled plasma mass spectrometry (LA-ICP-MS) and found to contain elevated palladium in undetermined form (Gregory et al. (2013). The deportment of palladium in porphyry deposits can be complex (e.g., Hanley et al., 2020) and a more detailed study of palladium deportment at Pebble is warranted to determine the degree to which this metal can be recovered to a chalcopyrite and/or pyrite concentrate.
| Pebble Project | Page 84 |
| NI 43-101 Technical Report Update and Preliminary Economic Assessment | August 21, 2023 |
|
|
|
8 DEPOSIT TYPES
This section has been reviewed by Tetra Tech and summarized from the 2023 Amended Technical Report on the Pebble Project, with an effective date of May 19, 2023.
The Pebble deposit is classified as a porphyry copper-gold-molybdenum deposit. The principal features of porphyry copper deposits, as summarized recently by John et al. (2010), include:
| · | mineralization defined by copper and other minerals which occur as disseminations and in veins and breccias which are relatively evenly distributed throughout their host rocks, |
|
|
|
| · | large tonnage amenable to bulk mining methods, |
|
|
|
| · | low to moderate copper grades, typically between 0.3% and 2.0%, |
|
|
|
| · | a genetic relationship to porphyritic intrusions of intermediate composition that typically formed in convergent-margin tectonic settings, |
|
|
|
| · | a metal assemblage dominated by various combinations of copper, gold, molybdenum, and silver, but commonly with other associated metals of low concentration, and |
|
|
|
| · | a spatial association with other styles of intrusion-related mineralization, including skarns, polymetallic replacements and veins, distal disseminated gold-silver deposits, and intermediate to high-sulphidation epithermal deposits. |
These characteristics correspond closely to the principal features of the Pebble deposit as described in Section 7. This Report focuses exclusively on the Pebble porphyry deposit; other deposits of intrusion-related skarn-, vein- and porphyry-style mineralization have been encountered elsewhere within the Pebble Project area but have not been the subject of detailed exploration or delineation.
The Pebble deposit has many characteristics typical of porphyry deposits as a group, but it is unusual in terms of its size and the variety and scale of its contained metal. Pebble has one of the largest metal endowments of any gold-bearing porphyry deposit currently known. Comparison of the current Pebble mineral resource estimate to other major copper and precious metal deposits shows that it ranks at or near the top in terms of both contained copper and contained precious metals (gold and silver). Pebble currently is both the largest known undeveloped copper resource and the largest known undeveloped gold resource in the world. Pebble also has a very large endowment in molybdenum and rhenium. The presence of palladium further highlights its unusual character. The bases for these estimations of metal endowment in the Pebble deposit are described in Section 14.
| Pebble Project | Page 85 |
| NI 43-101 Technical Report Update and Preliminary Economic Assessment | August 21, 2023 |
|
|
|
9 EXPLORATION
9.1 Introduction
This section has been reviewed by Tetra Tech and summarized from the 2023 Amended Technical Report on the Pebble Project, with an effective date of May 19, 2023.
9.2 Overview
Geological, geochemical, and geophysical surveys were conducted in the Pebble Project site area from 2001 to 2007 by Northern Dynasty and since mid-2007 by the Pebble Partnership. The types of historical surveys and their results are summarized in the following sub-sections. More detailed descriptions of historical exploration programs and results may be found in Rebagliati and Haslinger (2003), Haslinger et al. (2004), Rebagliati and Payne (2006 and 2007), Rebagliati and Lang (2009) and Rebagliati et al. (2005, 2008, 2009 and 2010).
9.3 Geological Mapping
Between 2001 and 2006, the entire Pebble Project site area was mapped for rock type, structure, and alteration at a scale of 1:10,000. This work provided an important geological framework for interpretation of other exploration data and drilling programs. A geological map of the Pebble deposit was also constructed but, due to a paucity of outcrop, was based solely on drill hole information. The content and interpretation of district and deposit scale geological maps have not changed materially from the information presented by Rebagliati et al. (2009 and 2010).
9.4 Geophysical Surveys
In 2001, dipole-dipole IP surveys totaling 19.3 line-mi were completed by Zonge Geosciences for Northern Dynasty, following up on and augmenting similar surveys completed by Teck.
During 2002, a ground magnetometer survey totaling 11.6 line-mi was completed at Pebble. The survey was conducted by MPX Geophysics Ltd., based in Richmond Hill, Ontario. The principal objective of this survey was to obtain a higher resolution map of magnetic patterns than was available from existing regional government magnetic maps. The focus of this work was the area surrounding mineralization in the 37 Skarn zone in the southern part of the Pebble district. A helicopter-based airborne magnetic survey was flown over the entire project area in 2007. A total of 1,456.5 line-mi was flown at 656 ft line spacing, covering an area of 164.5 square miles. The survey lines were flown at a mean terrain clearance of 196.8 ft along flight lines oriented 135° at a line spacing of 656 ft, with tie lines oriented 045° at a spacing of 1.24 mi Immediately over and surrounding the Pebble deposit, an area of 214.4 square miles was surveyed at a 1,328 ft line spacing for a total of 212.5 line-mi, without additional tie lines.
During 2007, a limited magnetotelluric survey was completed by GSY-USA Inc., the U.S. subsidiary of Geosystem SRL of Milan, Italy, under the supervision of Northern Dynasty geologists. The survey focused on the area of drilling in the Pebble East zone and comprised 196 stations on nine east-west lines and one north-south line, at a nominal station spacing of 656 ft. Interpretation, including 3D inversion, was completed by Mr. Donald Hinks of Rio Tinto Zinc.
| Pebble Project | Page 86 |
| NI 43-101 Technical Report Update and Preliminary Economic Assessment | August 21, 2023 |
|
|
|
In July 2009, Spectrem Air Limited, an Anglo American-affiliated company based in South Africa, completed an airborne electromagnetic, magnetic, and radiometric survey over the Pebble area. A total of 2,386 line-mi was surveyed in two flight block configurations:
| · | regional block covering an area of 18.6 x 7.5 mi at a line spacing of 0.95 mi. |
|
|
|
| · | more detailed block which covered the Pebble Project area using a line spacing of 820 ft. |
The orientation of flight lines was 135° for both surveys, with additional tie-lines flown orthogonally. The objectives of this work included provision of geophysical constraints for structural and geological interpretation in areas with significant glacial cover.
Between the second half of 2009 and mid-2010, a total of 120.5 line-mi of IP chargeability and resistivity data were collected by Zonge Engineering and Research Organization Inc. (Zonge Engineering) for the Pebble Partnership. This survey was conducted in the southern and northern parts of the project area and used a line spacing of 0.5 mi. The objective of this survey was to extend the area of IP coverage completed prior to 2001 by Teck and during 2001 by Northern Dynasty.
During 2010, an airborne electromagnetic (EM) and magnetometer geophysical survey was completed on the Pebble Project totaling 4,009 line-mi. This survey was conducted by Geotech Ltd. of Aurora, Ontario.
The USGS collected gravity data from 136 stations distributed over an area of 2,317 square miles during 2008 and 2009.
9.5 Geochemical Surveys
Between 2001 and 2003, Northern Dynasty collected 1,026 soil samples (Rebagliati and Lang, 2009). Typical sample spacing in the central part of the large geochemical grid was 100 ft to 250 ft along lines spaced 122 to 400 ft to 750 ft apart; samples were more widely spaced near the north, west and southwest margins of the grid.
These sampling programs outlined high-contrast, coincident anomalies in copper, gold, molybdenum, and other metals in an area that measures at least 5.6 mi north-south by up to 2.5 mi east-west, with strong but smaller anomalies in several outlying zones. All soil geochemical anomalies lie within the IP chargeability anomaly described above. Three very limited surficial geochemical surveys were completed by the Pebble Partnership in 2010 and 2011; no significant geochemical anomalies were identified. A total of 126 samples, comprising 113 till and 13 soil samples, were collected on the KAS claims located in the southern end of the property; samples were on lines spaced 8,000 ft apart with a sample spacing of 1,300 ft. A total of 109 soil samples were collected from two small areas located 11 mi to the west-northwest and 15 mi west of the Pebble deposit; samples were spaced 330 ft apart on lines that were irregularly spaced to accommodate terrain features.
Additional surveys were completed between 2007 and 2012 by researchers from the USGS and the University of Alaska Anchorage. The types of surveys that were completed by these groups include: (1) hydrogeochemical surveys in several parts of the Pebble property which obtained multi-element inductively coupled plasma mass spectrometry (ICP-MS) data from samples of surface waters; (2) determination of copper isotope ratios in surface waters; (3) heavy indicator mineral analyses of glacial till; and (4) orientation surveys which utilized a variety of weak extraction geochemical techniques. The results of these surveys were largely consistent with the results obtained by earlier soil sampling programs.
| Pebble Project | Page 87 |
| NI 43-101 Technical Report Update and Preliminary Economic Assessment | August 21, 2023 |
|
|
|
10 DRILLING
10.1 Introduction
This section has been reviewed by Tetra Tech and summarized from the 2023 Amended Technical Report on the Pebble Project, with an effective date of May 19, 2023.
10.2 Drill Hole Locations
Extensive drilling totaling 1,048,509.8 ft was completed in 1,389 holes on the Pebble Project. These drill campaigns took place during 19 of the 26 years between 1988 and 2013 and in 2018 and 2019. The most recent hole drilled on the project was completed on October 13, 2019. The spatial distribution and type of holes drilled is illustrated in Figure 10-1. A detail of the drilling in the “deposit area” is shown in Figure 10-2.
Figure 10‑1: Project Drill Hole Location Map
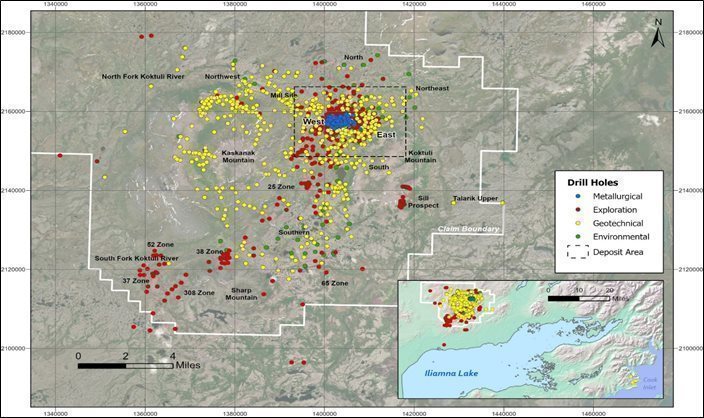
Note: Figure prepared by Northern Dynasty, 2021.
| Pebble Project | Page 88 |
| NI 43-101 Technical Report Update and Preliminary Economic Assessment | August 21, 2023 |
|
|
|
Figure 10‑2: Location of Drill Holes – Pebble Deposit Area
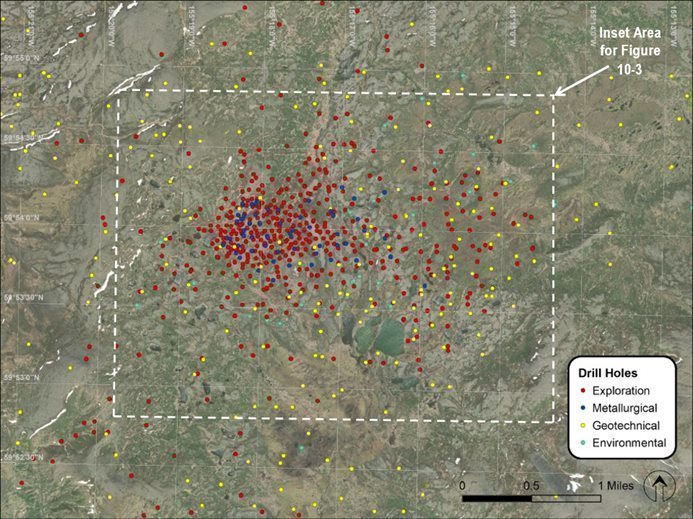
Note: Figure prepared by Northern Dynasty, 2021.
Drilling completed by Teck (1988 to 1997) is summarized in Section 6.1.
All drill hole collars were surveyed using a differential global positioning system (DGPS) instrument. All holes were resurveyed in 2008 and 2009, with the exception of the Sill holes. A digital terrain model for the site was generated by photogrammetric methods in 2004. All post- Teck drill holes were surveyed downhole, typically using a single shot magnetic gravimetric tool. A total of 989 holes were drilled vertically (-90°) and 192 were inclined from -42° to -85° at various azimuths.
10.3 Summary of Drilling, 2001–2019
The Pebble deposit was extensively drilled (Figure 10- 2). Drilling statistics and a summary of drilling by various categories to the end of the 2013 exploration program are compiled in Table 10-1. This includes seven drill holes completed by FMMUSA, drilled by Peak Exploration (USA) Corp. in the area in 2008; these holes were drilled on claims that are now part of the Pebble Project area and have been added to the Pebble dataset.
| Pebble Project | Page 89 |
| NI 43-101 Technical Report Update and Preliminary Economic Assessment | August 21, 2023 |
|
|
|
Table 10‑1: Summary of Drilling to December 2019
| Description | No. of Holes | Feet | Meters |
| By Operator |
|||
| Teck 1 | 164 | 75,741.0 | 23,086 |
| Northern Dynasty | 578 | 495,069.5 | 150,897 |
| Pebble Partnership 2 | 640 | 472,249.3 | 143,942 |
| FMMUSA | 7 | 5,450.0 | 1,661 |
| Total | 1,389 | 1,048,509.8 | 319,586 |
| By Type |
|||
| Core 1,5 | 1,160 | 1,027,671.9 | 313,234 |
| Percussion 6 | 229 | 20,838.0 | 6,351 |
| Total | 1,389 | 1,048,509.8 | 319,586 |
| By Year |
|
|
|
| 1988 1 | 26 | 7,601.5 | 2,317 |
| 1989 1 | 27 | 7,422.0 | 2,262 |
| 1990 | 25 | 10,021.0 | 3,054 |
| 1991 | 48 | 28,129.0 | 8,574 |
| 1992 | 14 | 6,609.0 | 2,014 |
| 1993 | 4 | 1,263.0 | 385 |
| 1997 | 20 | 14,695.5 | 4,479 |
| 2002 | 68 | 37,236.8 | 11,350 |
| 2003 | 67 | 71,226.6 | 21,710 |
| 2004 | 267 | 165,567.7 | 50,465 |
| 2005 | 114 | 81,978.5 | 24,987 |
| 2006 3 | 48 | 72,826.9 | 22,198 |
| 2007 4 | 92 | 167,666.9 | 51,105 |
| 2008 5 | 241 | 184,726.4 | 56,305 |
| 2009 | 33 | 34,947.5 | 10,652 |
| 2010 | 66 | 57,582.0 | 17,551 |
| 2011 | 85 | 50,767.7 | 15,474 |
| 2012 | 81 | 35,760.2 | 10,900 |
| 2013 | 29 | 6,190.0 | 1,887 |
| 2018 | 28 | 4,374.2 | 1,333 |
| 2019 | 6 | 1,917.4 | 584 |
| Total | 1,389 | 1,048,509.8 | 319,586 |
| By Area |
|||
| East | 149 | 450,047.3 | 137,174 |
| Pebble Project | Page 90 |
| NI 43-101 Technical Report Update and Preliminary Economic Assessment | August 21, 2023 |
|
|
|
| Description | No. of Holes | Feet | Meters |
| West | 447 | 349,128.7 | 106,414 |
| Main | 83 | 9,629.8 | 2,935 |
| NW | 215 | 49,951.1 | 15,225 |
| North | 84 | 30,927.0 | 9,427 |
| NE | 15 | 1,495.0 | 456 |
| South | 117 | 48,387.8 | 14,749 |
| 25 Zone | 8 | 4,047.0 | 1,234 |
| 37 Zone | 7 | 4,252.0 | 1,296 |
| 38 Zone | 20 | 14,221.5 | 4,335 |
| 52 Zone | 5 | 2,534.0 | 772 |
| 308 Zone | 1 | 879.0 | 268 |
| Eastern | 5 | 621.5 | 189 |
| Southern | 147 | 64,374.4 | 19,621 |
| SW | 39 | 6,658.8 | 2,030 |
| Sill | 39 | 10,445.5 | 3,184 |
| Cook Inlet | 8 | 909.5 | 277 |
| Total | 1,389 | 1,048,509.8 | 319,586 |
Notes:
| 1. | Includes holes drilled on the Sill prospect.2. Holes started by Northern Dynasty and finished by the Pebble Partnership are included as the Pebble Partnership. |
|
|
|
| 2. | Drill holes counted in the year in which they were completed. |
|
|
|
| 3. | Wedged holes are counted as a single hole including full length of all wedges drilled. |
|
|
|
| 4. | Includes FMMUSA drill holes; data acquired in 2010. |
|
|
|
| 5. | Percussion holes were drilled for engineering and environmental purposes. Shallow (<15 ft) auger holes not included. |
|
|
|
| 6. | Comprises holes drilled entirely in Tertiary cover rocks within the Pebble West and Pebble East areas. 8. Some numbers may not sum exactly due to rounding. |
Most of the footage on the Pebble Project was drilled using core drills. Only 18,716 ft was percussion-drilled from 229 rotary drill holes. Many of the cored holes were advanced through overburden, using a tricone bit with no core recovery. These overburden lengths are included in the core drilling total.
From early 2004 through 2013, all Pebble drill core was geotechnically logged on a drill run basis. Almost 70,000 measurements were made for a variety of geotechnical parameters on 737,000 ft of core drilling. Recovery is generally very good and averages 98.2% overall; two-thirds of all measured intervals have 100% core recovery. Detailed (domain-based) geotechnical logging and downhole surveys were also conducted between 2007 and 2012. Proper domain selection is the basis for rock mass classification and domain-based data is used extensively in open pit and underground mine design. In order to maximize the information from the 2007-2012 drill programs, several tools and techniques were added to a number of holes including: triple tube drilling, core orientation, acoustic televiewer probe and comprehensive point load testing complemented by laboratory UCS testing. Additionally, all Pebble drill core from the 2002 through 2013 and 2018 drill programs and the chip trays from the 2019 percussion program were photographed in a digital format.
The drill hole database includes drill holes completed up until 2019; the drilling completed after 2012 is outside the area of the mineral resource estimate. Highlights of drilling completed by Northern Dynasty and the Pebble Partnership between 2001 and 2019 include:
| Pebble Project | Page 91 |
| NI 43-101 Technical Report Update and Preliminary Economic Assessment | August 21, 2023 |
|
|
|
| · | Northern Dynasty drilled 68 holes for a total of 37,237 ft during 2002. The objective of this work was to test the strongest IP chargeability and multi-element geochemical anomalies outside of the Pebble deposit, as known at that time, but within the larger and broader IP chargeability anomaly described above. This program discovered the 38 Zone porphyry copper-gold-molybdenum deposit, the 52 Zone porphyry copper occurrence, the 37 Zone gold-copper skarn deposit, the 25 Zone gold deposit, and several small occurrences in which gold values exceeded 3.0 g/t. |
|
|
|
| · | In 2003, Northern Dynasty drilled 67 holes for a total of 71,227 ft, mainly within and adjacent to the Pebble West zone to determine continuity of mineralization and to identify and extend higher grade zones. Most holes were drilled to the 0 ft elevation above mean sea level and were 900 to 1,200 ft in length. Eight holes for a total of 5,804 ft were drilled outside the Pebble deposit to test for extensions and new mineralization at four other zones on the property, including the 38 Zone porphyry copper-gold-molybdenum deposit and the 37 Zone gold-copper skarn deposit. |
|
|
|
| · | Drilling by Northern Dynasty in 2004 totalled 165,481 ft in 266 holes. Of this total, 131,211 ft were drilled in 147 exploration holes in the Pebble deposit; one exploration hole 879 ft in length was completed in the southern part of the property that discovered the 308 Zone porphyry copper-gold-molybdenum deposit. Additional drilling included 21,335 ft in 26 metallurgical holes in Pebble West zone, 9,127 ft in 54 geotechnical holes and 3,334 ft in 39 water monitoring holes, of which 33 holes for a total of 2,638 ft were percussion holes. During the 2004 drilling program, Northern Dynasty identified a significant new porphyry center on the eastern side of the Pebble deposit (the Pebble East zone) beneath the cover sequence (as described in Section 7). |
|
|
|
| · | In 2005, Northern Dynasty drilled 81,979 ft in 114 holes. Of these drill holes, 13 for a total of 12,198 ft were drilled mainly for engineering and metallurgical purposes in the Pebble West zone. Seventeen drill holes for a total of 60,696 ft were drilled in the Pebble East zone. The results confirmed the presence of the Pebble East zone and further demonstrated that it was of large size and contained higher grades of copper, gold and molybdenum than the Pebble West zone. The Pebble East zone remained completely open at the end of 2005. A further 13 holes for a total of 2,986 ft were cored for engineering purposes outside the Pebble deposit area. An additional 6,099 ft of drilling was completed in 71 non-core water monitoring wells. |
|
|
|
| · | Drilling during 2006 focused on further expansion of the Pebble East zone. Drilling comprised 72,827 ft in 48 holes. Twenty of these holes were drilled in the Pebble East zone, including 17 exploration holes and three engineering holes for a total of 68,504 ft. The Pebble East zone again remained fully open at the conclusion of the 2006 drilling program. In addition, 2,710 ft were drilled in 14 engineering core holes and 1,612 ft were drilled in 14 monitoring well percussion holes elsewhere on the property. |
|
|
|
| · | Drilling in 2007 continued to focus on the Pebble East zone. A total of 151,306 ft of delineation drilling in 34 holes extended Pebble East to the northeast, northwest, south and southeast; the zone nonetheless remained open in these directions, as well as to the east in the East Graben. Additional drilling included 10,167 ft in nine metallurgical holes in Pebble West, along with 4,367 ft in 26 engineering holes and 1,824 ft in 23 percussion holes for monitoring wells across the property. |
|
|
|
| · | In 2008, 234 holes were drilled totaling 184,726 ft, the most extensive drilling on the project in any year to date. A total of 136,266 ft of delineation and infill drilling, including six oriented holes, was completed in 31 holes in the Pebble East zone. This drilling further expanded the Pebble East zone. Fifteen metallurgical holes for a total of 14,511 ft were drilled in the Pebble West zone. Three 2,949 ft infill/geotechnical holes totaling 3,133 ft were drilled in the Pebble West zone. Geotechnical drilling elsewhere on the property included 103 core holes for a total of 18,806 ft. Hydrogeology and geotechnical drilling outside of the Pebble deposit accounted for 82 percussion holes for a total of 6,745 ft. In 2010, the Pebble Partnership acquired the data for seven holes totaling 5,450 ft drilled by FMMUSA in 2008. These drill holes are located on land that is now controlled by the Pebble Partnership and provided information on the regional geology. |
|
|
|
| · | The Pebble Partnership drilled 34,948 ft in 33 core drill holes in 2009. Five delineation holes were completed for 6,076 ft around the margins of the Pebble West zone and 21 exploration holes for a total of 22,018 ft were drilled elsewhere on the property. In addition, seven geotechnical core holes were drilled for a total of 6,854 ft. |
|
|
|
| · | In 2010, the Pebble Partnership drilled 57,582 ft in 66 core holes. Forty-eight exploration holes totaling 54,208 ft were drilled over a broad area of the property outside the Pebble deposit. An additional 3,374 ft were drilled in 18 geotechnical holes within the deposit area and to the west. |
|
|
|
| · | In 2011, the Pebble Partnership drilled 50,768 ft in 85 core holes. Eleven holes were drilled in the deposit area totaling 33,978 ft. Of these, two holes were drilled in the Pebble East zone for metallurgical and hydrogeological purposes. The other nine holes in the deposit area were drilled for further delineation of the Pebble West zone and the area immediately to the south. These results indicated the potential for resource expansion to depth in the Pebble West zone. Six holes totaling 8,780 ft were also drilled outside the Pebble deposit area to the west and south. In addition, 8,010.2 ft was drilled in 68 geotechnical holes within and to the north, west and south of the deposit. |
| Pebble Project | Page 92 |
| NI 43-101 Technical Report Update and Preliminary Economic Assessment | August 21, 2023 |
|
|
|
| · | The Pebble Partnership drilled 35,760 ft in 81 core holes in 2012. Eleven holes totaling 13,754 ft were drilled in the southern and western parts of the Pebble West zone. The results show potential for lateral resource expansion in this area and further delineation drilling is warranted. Six holes totaling 6,585 ft. were drilled to test exploration targets to the south on the Kaskanak claim block, to the northwest and south of Pebble, and on the KAS claim block further south. An additional 64 geotechnical and hydrogeological holes were drilled totaling 15,422 ft. Of this drilling, 41 holes were within the deposit area and 15 geotechnical holes were drilled at sites near the deposit, and eight geotechnical holes were completed near Cook Inlet. |
|
|
|
| · | The Pebble Partnership drilled 6,190 ft in 29 core holes for geotechnical purposes in 2013 at sites west, south and southwest of the deposit area. |
|
|
|
| · | The Pebble Partnership drilled 4,374.2 ft in 28 core holes for geotechnical purposes in 2018 to test tailings and water storage facilities in areas remote from the Pebble deposit. |
|
|
|
| · | The Pebble Partnership drilled 1,917.4 ft in six percussion holes adjacent to the Pebble deposit to enable hydrological testing in 2019. |
|
|
|
| · | No holes were drilled in 2014, 2015, 2016, 2017, 2020 or 2021. |
A re-survey program of holes drilled at Pebble from 1988 to 2009 was conducted during the 2008 and 2009 field seasons. For consistency throughout the project, the resurvey program referenced the control network established by R&M Consultants in the U.S. State Plane Coordinate System Alaska Zone 5 NAVD88 Geoid99. The resurvey information was applied to the drill collar coordinates in the database in late 2009.
In 2009 and 2013, the survey locations, hole lengths, naming conventions and numbering designations of the Pebble drill holes were reviewed. This exercise confirmed that several shallow, non-cored, overburden drill holes described in some engineering and environmental reports were essentially the near-surface pre-collars of existing bedrock core drill holes. As these pre-collar and bedrock holes have redundant traces, the geologic information was combined into a single trace in the same manner as the wedged holes. In addition, a number of very shallow (less than 15 ft), small diameter, water-monitoring auger holes were removed from the exploration drill hole database, as they did not provide any geological or geochemical information.
Drill core from the 2002 to 2013 and 2018 programs was boxed at the rig and transported daily by helicopter to the secure logging facility in the village of Iliamna, as were the chip trays from the 2019 percussion drill program.
| Pebble Project | Page 93 |
| NI 43-101 Technical Report Update and Preliminary Economic Assessment | August 21, 2023 |
|
|
|
10.3.1 Northern Dynasty Drilling, 2002–2006
The 2002 and 2003 holes were drilled for Northern Dynasty by Quest America Drilling Inc. (Quest) using NQ2 diameter (2 inches) core size.
Most of the 2004 drilling was also completed by Quest, with some footage drilled by Boart Longyear Company (Boart Longyear) and Midnight Sun Drilling Co. Ltd. Core diameters included NQ2, HQ (2.5 in) and PQ (3.3 in). Thirty-three rotary percussion water well, engineering, and environmental holes were also completed. The 2004 drilling program included 26 larger diameter (PQ and HQ) holes for metallurgical testing. The average core recovery for all samples taken in 2004 was 97.6%.
Quest completed the 2005 drilling. Core diameters included NQ2, HQ and PQ core. The average core recovery for all 2005 core holes was 98.4%. In addition to the core drilling, a total of 6,100 ft was drilled in 71 rotary percussion holes by Foundex Pacific Inc. (Foundex) for water monitoring purposes.
The drilling contractors in 2006 were American Recon Inc. (American Recon) and Boart Longyear. Drill holes were NQ2 and HQ in diameter. A total of 13 shallow rotary percussion holes were also completed for environmental purposes by Foundex. Average core recovery in 2006 was 98.7%.
10.3.2 Northern Dynasty and Pebble Partnership Drilling, 2007
The drilling contractors used in 2007 were American Recon, Quest, and Boart Longyear. Drill holes were NQ2 and HQ in diameter and were drilled for geological and metallurgical purposes. Additional drilling was completed by Foundex to establish monitoring wells, but core was not recovered from these holes. Several holes included wedges; in cases where the wedged hole successfully extended beyond the total depth of the parent hole, they were treated as extensions of their parent holes and overlapping information was ignored. The average core recovery for 2007 drill holes was 99.7%.
10.3.3 Pebble Partnership Drilling, 2008–2014
The drilling contractors used in 2008 were American Recon, Boart Longyear and Foundex. Drill holes were NQ, HQ and PQ in diameter, and were drilled for delineation, geotechnical and metallurgical purposes. The drilling contractor used for 2009 drilling was American Recon. Drill holes were NQ, HQ and PQ in diameter. Drilling contractors used for 2010 drilling were American Recon and Foundex. Drill holes were NQ and HQ in diameter. Drill contractors American Recon, Quest and Foundex completed 85 holes in 2011. The hole numbering sequences for 2011 are 11526 through 11542 for 17 district exploration holes and GH11-229 through GH11-296 for 68 geotechnical holes. Most of these holes were drilled vertically except for 11526, 11528, 11530, 11532, 11533 and 11539, which were inclined at -80°, and 11529, drilled at -75°. Among 68 geotechnical holes, 43 were sonic drilling. The average core recovery for the 2008 holes in 95.7%.
Drill contractors Quest and Foundex completed 81 holes in 2012. The hole numbering sequences are 12543 through 12562 for 20 exploration, delineation, and hydrological holes, and GH12-297 through GH12-357S for 61 geotechnical holes. Most of 12-series holes were drilled with dips of -65° to -80°, and azimuths of 90° to 270° except for 12546, 12554, 12558, 12559, 12561 and 12562, which were drilled vertically. All GH-series holes were drilled vertically. Among 61 geotechnical holes, 31 were completed by sonic drilling. Of the 81 holes, 14 holes were drilled in the southern and western parts of the Pebble West zone; 6 holes were drilled in the broader claim area to test exploration targets to the south on the Kaskanak claim block to the northwest and south and the KAS claim block further south; and the 61 geotechnical and hydrogeological holes were drilled in the deposit area (45 holes), in Site A (8 holes) and in the area 50 mi to the southeast near Cook Inlet (8 holes).
| Pebble Project | Page 94 |
| NI 43-101 Technical Report Update and Preliminary Economic Assessment | August 21, 2023 |
|
|
|
Drill contractor Foundex completed vertical drilling in 37 holes at sites near the deposit in 2013. These holes numbered GH13-358 through GH13-383 were drilled PQ and HQ size for geotechnical and hydrogeological purposes.
In 2010, the Pebble Partnership acquired the data for seven holes with 414 samples drilled by FMMUSA in 2008. These drill holes are located near the project on land that is now controlled by the Pebble Partnership and provided information on the regional geology. Seven NQ size vertical holes numbered PS08-01 to PS08-07 drilled by Peak Exploration (USA) Corp averaged 780 ft in length.
10.3.4 Pebble Partnership Drilling, 2018–2019
In 2018, 28 vertical geotechnical holes numbered GH18-387S to GH18-414S were drilled to by contractors Foundex and AES to test proposed tailings storage facility (TSF), quarry and water management facility locations.
Six reverse circulation (RC) percussion holes were drilled by T&J Enterprises for hydrogeological site investigation in 2019 in support of the ongoing EIS process. The work consisted of drilling vertically through overburden and bedrock, followed by the installation of pumping wells, monitoring wells, and grouted-in vibrating wire piezometers (VWPs). All these holes are located outside the area of the mineral resource estimate and therefore are not material to the estimate.
10.4 Drill Sections
The locations of drill holes and four representative sections through the Pebble deposit are shown on Figure 10-3. The extent of the area in Figure 10-3 is shown in Figure 10-2. The sections illustrate drill hole traces, topographic and overburden surfaces along with colour-coded block model CuEq grades from the mineral resource estimate in Section 14. CuEq calculations use metal prices: US$1.85/lb for Cu, US$902/oz for Au and US$12.50/lb for Mo, and recoveries: 85% Cu, 69.6% Au, and 77.8% Mo (Pebble West zone) and 89.3% Cu, 76.8% Au, 83.7% Mo (Pebble East zone).
Figure 10-4 and Figure 10-5 are looking west. Figure 10-6 and Figure 10-7 are looking north.
| Pebble Project | Page 95 |
| NI 43-101 Technical Report Update and Preliminary Economic Assessment | August 21, 2023 |
|
|
|
Figure 10‑3: Location of Drill Holes and Representative Sections - Pebble Deposit Area

Source: 2023 Amended Pebble Technical Report May 19, 2023.
| Pebble Project | Page 96 |
| NI 43-101 Technical Report Update and Preliminary Economic Assessment | August 21, 2023 |
|
|
|
Figure 10‑4: Cross-Section 1401500E
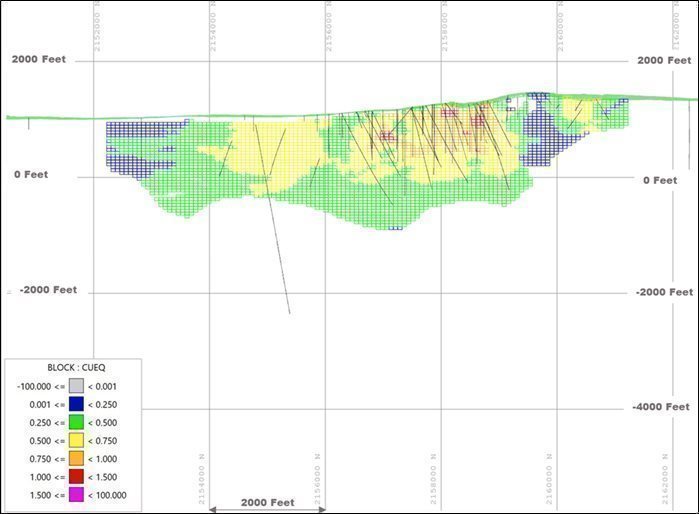
Source: 2023 Amended Pebble Technical Report May 19, 2023.
| Pebble Project | Page 97 |
| NI 43-101 Technical Report Update and Preliminary Economic Assessment | August 21, 2023 |
|
|
|
Figure 10‑5: Cross-Section 1407900E
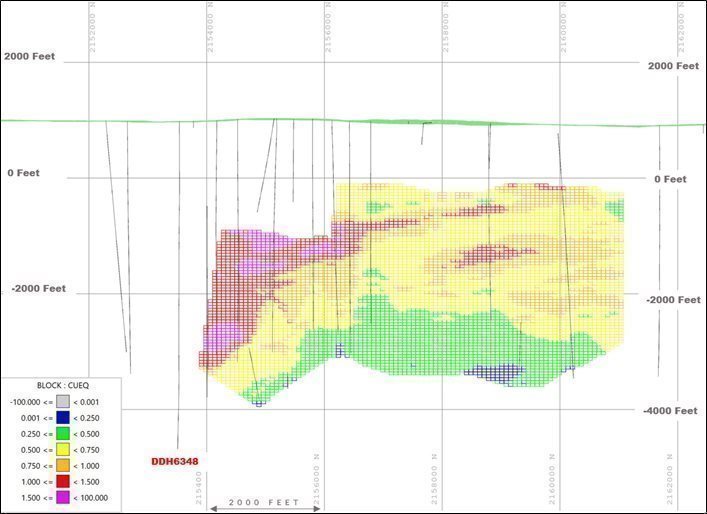
Source: 2023 Amended Pebble Technical Report, May 19, 2023.
| Pebble Project | Page 98 |
| NI 43-101 Technical Report Update and Preliminary Economic Assessment | August 21, 2023 |
|
|
|
Figure 10‑6: Longitudinal Section 2156000N

Source: 2023 Amended Pebble Technical Report, May 19, 2023.
Figure 10‑7: Longitudinal Section 2157500N

Source: 2023 Amended Pebble Technical Report, May 19, 2023.
| Pebble Project | Page 99 |
| NI 43-101 Technical Report Update and Preliminary Economic Assessment | August 21, 2023 |
|
|
|
10.5 Bulk Density Results
Bulk density measurements were collected from drill core samples, as described in Section 11.3.4. A summary of all bulk density results (see Table 10-2) shows a summary of bulk density drill holes used in the current mineral resource estimate.
Table 10‑2: Summary of All Bulk Density (g/cm3) Results
| Age | No. of Measurements | Density Mean | Density Median |
| Quaternary | 34 | 2.60 | 2.61 |
| Tertiary | 2,703 | 2.57 | 2.57 |
| Cretaceous | 8,671 | 2.66 | 2.64 |
| All | 11,775 | 2.63 | 2.62 |
10.6 Conclusions
Samples from the 2002 through 2012 core drilling of Northern Dynasty provide 91% of the assays used in the mineral resource estimate. These drilling and sampling programs were carried out in a proficient manner consistent with industry standard practices at the time the programs were completed. Core recovery was typically very good and averaged over 98%; two-thirds of all measured intervals have 100% core recovery. No significant factors of drilling, sampling, or recovery that impact the accuracy and reliability of the results were observed.
The remaining 9% of assays used in the mineral resource estimate derive from historical 1988 to 1992 and 1997 Teck core drill programs. Northern Dynasty expended considerable effort to assess the veracity of the Teck drilling over several years. This included re-surveying drill hole locations, reviewing remaining half core, extensive re-drilling of areas targeted by Teck, and plotting and comparison of Teck drill holes with nearby Northern Dynasty drill holes. No significant factors of the drilling, sampling or recovery of the Teck program that impact the accuracy and reliability of the results were observed.
| Pebble Project | Page 100 |
| NI 43-101 Technical Report Update and Preliminary Economic Assessment | August 21, 2023 |
|
|
|
11 SAMPLE PREPARATION, ANALYSES AND SECURITY
11.1 Sampling Method and Approach
The Pebble deposit has been explored by extensive core drilling, with 81,188 samples taken from drill core for assay analysis. Nearly all potentially mineralized Cretaceous core drilled and recovered has been sampled by halving in 10 ft lengths. Similarly, all core recovered from the Late Cretaceous to Early Tertiary cover sequence (referred to as Tertiary here and in Section 13 has also been sampled, typically on 20 ft sample lengths, with some shorter sample intervals in areas of geologic interest. Unconsolidated overburden material, where it exists, is generally not recovered by core drilling and therefore not usually sampled.
Rock chips from the 229 rotary percussion holes were generally not sampled for assay analysis, as the holes were drilled for monitoring wells and environmental purposes. Only 35 samples were taken from the drill chips of 26 rotary percussion holes outside the Pebble deposit area, which were drilled for condemnation purposes.
For details of the main rock units in the Pebble deposit and mineralization, see Section 7.
Half cores remaining after sampling were replaced in the original core boxes and stored at Iliamna in a secure compound. Later geological, metallurgical, and environmental sampling took place on a small portion of this remaining core. Crushed reject samples from the 2006 through 2013 and the 2018 analytical programs are stored in locked containers at Delta Junction, AK. Drill core assay pulps from the 1989 through 2013 and the 2018 programs are stored at a secure warehouse in Surrey, BC.
11.1.1 Northern Dynasty Sampling, 2002–2006
All drill core was sampled at a secure core logging facility in the village of Iliamna. NQ2 core samples, averaging 10 ft long, were collected by Northern Dynasty personnel by mechanically splitting the core in half lengthwise. In 2002 a total of 2,467 core samples were taken.
A total of 12,865 Cretaceous (syn-mineralization) samples averaging 10 ft long were taken in 2004; 10,893 samples were mechanically split half-core samples, and 1,972 samples were of the metallurgical type. The metallurgical samples were taken by sawing an off-center slice representing 20% of the core volume, which was submitted for assay analysis. The remaining 80% was used for metallurgical purposes. No intact drill core remains after this type of metallurgical sampling, only assay reject and pulp samples. In addition, 904 Tertiary (post-mineralization) samples averaging 15 ft long were taken for trace element analysis. Tertiary samples were collected by mechanically splitting the core in half lengthwise. A total of 4,378 Cretaceous samples and 1,435 Tertiary samples were collected in 2005. Of the Cretaceous samples, 3,541 were taken by sawing the core in half lengthwise. The remaining 837 Cretaceous samples were from metallurgical holes that were split using the 20% off-center saw method. Tertiary samples were also sampled using this method. Cretaceous samples averaged 10 ft long and Tertiary samples averaged 20 ft long. No samples were collected or analyzed from the 71 rotary percussion holes drilled in 2005.
In 2006, the 2,759 Cretaceous samples collected averaged 10 ft in length and the 1,847 Tertiary samples averaged 20 ft in length. The Cretaceous samples were collected by sawing the core in half lengthwise, and the Tertiary samples were collected by the 20% off-center saw method described for the 2004 metallurgical holes.
| Pebble Project NI 43-101 Technical Report Update and Preliminary Economic Assessment | Page 101 August 21, 2023 |
|
|
|
11.1.2 Northern Dynasty and Pebble Partnership Sampling, 2007
A total of 12,664 samples were taken from the 72 drill holes in 2007. The 9,485 Cretaceous samples averaged 10 ft long, and the 3,179 Tertiary samples averaged 20 ft long. The Cretaceous samples were collected by sawing the core in half lengthwise, and the Tertiary samples were collected by the 20% off-center saw method.
11.1.3 Pebble Partnership Sampling, 2008–2014
A total of 12,701 samples were taken in 2008 by the Pebble Partnership. The 9,312 Cretaceous samples averaged 10 ft long and the 3,389 Tertiary samples averaged 20 ft long. The Cretaceous samples were collected by sawing the core in half lengthwise. The Tertiary samples and assay samples from metallurgical holes were collected using the 20% off-center saw method described for the 2004 metallurgical holes. The remaining 80% of the core from the Cretaceous portions of the metallurgical holes were used for metallurgical testing. A total of 2,835 mainstream samples were collected in 2009. The 2,555 Cretaceous samples averaged 10 ft long and the 280 Tertiary samples averaged 20 ft long. The Cretaceous samples were collected by sawing the core in half lengthwise. Tertiary samples were collected using the 20% off-center saw method.
A total of 4,714 mainstream samples were taken in 2010. The 4,463 Cretaceous samples and the 251 Tertiary samples averaged 10 ft long. All samples were taken by sawing the core in half lengthwise.
A total of 4,281 mainstream samples were taken in 2011. The 3,674 Cretaceous samples averaged 10 ft in length and the 607 Tertiary samples averaged 20 ft in length. Cretaceous samples were taken by sawing the core in half lengthwise. Tertiary samples were taken by the 20% off-center saw-cut method described above.
A total of 2,681 core samples (2,537 Cretaceous samples and the 144 Tertiary samples) were taken in 2012. The Cretaceous samples averaged 10 ft in length and were taken by sawing the core in half lengthwise. Tertiary samples averaged 20 ft in length and were taken by the 20% off-center cut method.
A total of 523 samples were taken in 2013: 1 from Quaternary, 124 from Tertiary and 398 from Cretaceous strata. The Cretaceous and Quaternary samples average 10 ft in length and were taken by sawing the core in half lengthwise. The Tertiary samples average 15 ft in length and were taken by the 20% off-center cut method.
In 2018, 329 samples averaging 10 ft in length were taken by sawing the core in half lengthwise.
The six RC holes drilled in 2019 were not sampled for assay.
The large 1.7 to 2.2 lb Cretaceous rock assay pulps and the 0.5 lb Tertiary waste rock pulps from these years are stored in a secure warehouse at Surrey, BC.
Essentially, all potentially mineralized Cretaceous rock recovered by drilling on the Pebble Project is subject to sample preparation and assay analysis for copper, gold, molybdenum, and several other elements. Similarly, all Late Cretaceous to Early Tertiary cover sequence (Tertiary) rock cored and recovered during the drill program is also subject to sample preparation and geochemical analysis by multi-element methods. Since 2007, all sampling at Pebble has been undertaken by employees or contractors under the supervision of senior staff members.
| Pebble Project NI 43-101 Technical Report Update and Preliminary Economic Assessment | Page 102 August 21, 2023 |
|
|
|
11.2 Sample Preparation
11.2.1 Northern Dynasty Sample Preparation, 2002
In 2002, the samples were prepared at the ALS Fairbanks sample preparation laboratory (ALS Fairbanks) and analyzed at the ALS Vancouver Laboratory. ALS is independent of Northern Dynasty and received its certification under an International Organization for Standardization (ISO) 9001 accreditation in 1999 and has been ISO/IEC 17025 certified since 2022. The sample bags were verified against the numbers listed on the shipment notice. In 2002, the entire sample of half-core was dried, weighed and crushed to 70% passing 10 mesh (2 mm), then a 250 g split was taken and pulverized to 85% passing 200 mesh (75 µm). The pulp was split, and 125 g were shipped by commercial airfreight for analysis at the ALS Vancouver laboratory. The remaining pulps were shipped to a secure warehouse at Surrey, BC for long-term storage. The coarse rejects were held for several months at ALS Fairbanks until QA/QC measures were completed and were then discarded.
11.2.2 Northern Dynasty Sample Preparation, 2003
The 2003 samples were prepared and analyzed at the SGS Mineral Services (SGS) sample preparation laboratory in Fairbanks (SGS Fairbanks). SGS is independent of Northern Dynasty and in 2003 was certified under an International Organization for Standardization (ISO) 9002 registration. After verification of the sample bag numbers against the shipment notice, the entire sample of half-core was dried, weighed and crushed to 75% passing 10 mesh (2 mm). A 400 g split was taken and pulverized to 95% passing 200 mesh (75 µm), and pulps were shipped by commercial airfreight to the SGS laboratories in either Toronto, ON, or Rouyn, QC. The assay pulps were returned for storage at the Surrey warehouse. Coarse rejects were held for several months at SGS Fairbanks until all QA/QC measures were completed and were then discarded.
11.2.3 Northern Dynasty and Pebble Partnership Sample Preparation, 2004–2013 and 2018
For the 2004 through 2013 and 2018 drill programs, samples were prepared and analyzed independently. ALS Fairbanks performed the sample preparation work. The laboratory received the half-core Cretaceous samples and the off-center saw splits from the Tertiary samples and metallurgical holes, verified the sample numbers against the sample shipment notice and performed the sample drying, weighing, crushing, and splitting. ALS Vancouver pulverized the samples from 2004 through 2006 (as described for 2002 samples), and ALS Fairbanks pulverized the samples from 2007 through 2013 and 2018. Assay pulps were returned for long-term storage at the Surrey warehouse. Crushed reject samples from the 2006 through 2013 and 2018 analytical programs are stored in locked containers at Delta Junction, AK. No samples were taken from the 2019 percussion drill program.
11.3 Sample Analysis
11.3.1 Northern Dynasty Sample Analysis, 2002
Analytical work for the 2002 drilling program was completed by ALS Vancouver, an ISO 9002 certified laboratory. All samples were analyzed for copper, silver, molybdenum, and additional elements by multi-element analysis and for gold by fire assay.
Multi-element analysis for 34 elements, including copper, silver, and molybdenum, was by AR digestion of a 0.5 g sample with an ICP-AES finish (ALS code ME-ICP41 shown in Table 11-1).
| Pebble Project NI 43-101 Technical Report Update and Preliminary Economic Assessment | Page 103 August 21, 2023 |
|
|
|
Table 11‑1: ALS Aqua Regia Digestion Multi-Element Analytical Method ME-ICP41
| Element | Symbol | Units | Lower Limit | Upper Limit | Element | Symbol | Units | Lower Limit | Upper Limit |
|
| Silver | Ag | ppm | 0.2 | 100 | Magnesium | Mg | % | 0.01 | 15 |
|
| Aluminium | Al | % | 0.01 | 15 | Manganese | Mn | ppm | 5 | 10,000 |
|
| Arsenic | As | ppm | 2 | 10,000 | Molybdenum | Mo | ppm | 1 | 10,000 |
|
| Boron | B | ppm | 10 | 10,000 | Sodium | Na | % | 0.01 | 10% |
|
| Barium | Ba | ppm | 10 | 10,000 | Nickel | Ni | ppm | 1 | 10,000 |
|
| Beryllium | Be | ppm | 0.5 | 100 | Phosphorus | P | ppm | 10 | 10,000 |
|
| Bismuth | Bi | ppm | 2 | 10,000 | Lead | Pb | ppm | 2 | 10,000 |
|
| Calcium | Ca | % | 0.01 | 15 | Sulfur | S | % | 0.01 | 10 |
|
| Cadmium | Cd | ppm | 0.5 | 500 | Antimony | Sb | ppm | 2 | 10,000 |
|
| Cobalt | Co | ppm | 1 | 10,000 | Scandium | Sc | ppm | 1 | 10,000 |
|
| Chromium | Cr | ppm | 1 | 10,000 | Strontium | Sr | ppm | 1 | 10,000 |
|
| Copper | Cu | ppm | 1 | 10,000 | Titanium | Ti | % | 0.01 | 10 |
|
| Iron | Fe | % | 0.01 | 15 | Thallium | Tl | ppm | 10 | 10,000 |
|
| Gallium | Ga | ppm | 10 | 10,000 | Uranium | U | ppm | 10 | 10,000 |
|
| Mercury | Hg | ppm | 1 | 10,000 | Vanadium | V | ppm | 1 | 10,000 |
|
| Potassium | K | % | 0.01 | 10 | Tungsten | W | ppm | 10 | 10,000 |
|
| Lanthanum | La | ppm | 10 | 10,000 | Zinc | Zn | ppm | 2 | 10,000 |
A total of 1,715 samples from 26 drill holes exhibiting porphyry-style copper-gold mineralization was assayed for copper by AR digestion with an AAS finish to the ppm level (ALS code Cu-AA46 shown in Table 11-2). Five copper assays greater than 10,000 ppm in hole 2037 were also assayed by this method. A further 271 samples from 5 drill holes were assayed for copper by four-acid (HNO3-HClO4-HF-HCl) digestion AAS (ALS code Cu-AA61 in Table 11-2) and 62 samples from drill hole 2034 were assayed for molybdenum by four-acid digestion with an AAS finish (ALS code Mo-AA61 shown in Table 11-2). Two samples with Pb and Zn concentrations >10,000 ppm by method ME-ICP41 were reanalysed by four-acid digestion AAS (ALS codes Pb-AA46 and Zn-AA46 respectively, these methods are also shown in Table 11-2).
Table 11‑2: ALS Additional Analytical Procedures
| Element | Symbol | Method Code | Digestion | Instrument | Sample Mass (g) | Units | Lower Limit | Upper Limit |
| Copper | Cu | Cu-AA46 | Aqua regia | AAS | 0.4 | % | 0.01 | 50 |
| Lead | Pb | Pb-AA46 | Aqua regia | AAS | 0.4 | % | 0.01 | 50 |
| Zinc | Zn | Zn-AA46 | Aqua regia | AAS | 0.4 | % | 0.01 | 50 |
| Copper | Cu | Cu-AA61 | Four-acid | AAS | 0.4 | ppm | 1 | 10,000 |
| Copper | Cu | Cu-AA62 | Four-acid | AAS | 0.4 | % | 0.01 | 50 |
| Copper | Cu | Cu-OG62 | Four-acid | ICP-AES | 0.4 | % | 0.01 | 40 |
Gold concentrations were determined by 30 g FA fusion with lead as a collector and an AAS finish (ALS code Au-AA23 in Table 11-3). Four samples that returned gold results greater than 10,000 ppb (10 g/t), were re-analyzed by one assay-ton FA fusion with a gravimetric finish (ALS code Au-GRAV21 in Table 11-3). Seven samples from drill hole 2013 were analyzed for gold, platinum, and palladium by 30 g FA fusion with ICP finish (ALS code PGM-ICP23 in Table 11-3). In 2007, and additional 459 samples from 11 other 2002 holes were analyzed by this method.
| Pebble Project NI 43-101 Technical Report Update and Preliminary Economic Assessment | Page 104 August 21, 2023 |
|
|
|
Table 11‑3: ALS Precious Metal Fire Assay Analytical Methods
| Element | Symbol | Method Code | Instrument | Sample Mass (g) | Units | Lower Limit | Upper Limit |
| Gold | Au | Au-AA23 | AAS | 30 | ppm | 0.005 | 10 |
| Gold | Au | Au-GRA21 | Gravimetric | 30 | ppm | 0.05 | 1,000 |
| Gold | Au | PGM-ICP23 | ICP-AES | 30 | ppm | 0.001 | 10 |
| Platinum | Pt | PGM-ICP23 | ICP-AES | 30 | ppm | 0.005 | 10 |
| Palladium | Pd | PGM-ICP23 | ICP-AES | 30 | ppm | 0.001 | 10 |
Northern Dynasty Sample Analysis, 2003
Analytical work for the 2003 drilling program was completed by SGS Canada Inc. of Toronto, ON, an ISO 9002 registered, ISO 17025 accredited laboratory. All samples were assayed for copper by a total digestion ICP-AES method and for gold by FA. An AR digestion multi-element geochemical package was used for 33 additional elements including copper, silver, and molybdenum.
Copper assays were completed at SGS Toronto. Samples were fused with sodium peroxide, digested in dilute nitric acid and the solution analyzed by ICP-AES, with results in percent on SGS method ICAY50 as detailed in Table 11-4.
Table 11‑4: SGS Copper Analytical Method ICAY50
| Element | Symbol | Digestion | Instrument | Sample Mass (g) | Units | Lower Limit | Upper Limit |
| Copper | Cu | Sodium Peroxide Fusion | ICP-AES | 0.2 | % | 0.01 | 10 |
Gold analyses were completed at SGS Rouyn, QC, by one assay-ton (30 g) lead-collection FA fusion with AAS finish, with results reported in ppb. Ten samples that returned gold results greater than 2,000 ppb (2 g/t) were re-analyzed by 30 g FA fusion with a gravimetric finish, with results reported in g/t. The SGS analytical methods for gold are listed in
Table 11-5.
Table 11‑5: SGS Gold Fire Assay Analytical Methods
| Element | Symbol | Method Code | Instrument | Sample Mass (g) | Units | Lower Limit | Upper Limit |
| Gold | Au | FA305 | AAS | 30 | ppb | 5 | 2,000 |
| Gold | Au | FA30G | Gravimetric | 30 | g/t | 0.03 | 1,000 |
All samples were subject to multi-element analysis for 33 elements including copper, molybdenum, and sulphur by AR digestion with an ICP-AES finish at SGS Toronto by SGS method ICP70. The elements reported, units and detection limits are listed in Table 11-6.
| Pebble Project NI 43-101 Technical Report Update and Preliminary Economic Assessment | Page 105 August 21, 2023 |
|
|
|
Table 11‑6: SGS Aqua Regia Digestion Multi-Element Analytical Method ICP70
| Element | Symbol | Units | Lower Limit | Upper Limit |
| Element | Symbol | Units | Lower Limit | Upper Limit |
| Silver | Ag | ppm | 0.2 | 10 |
| Molybdenum | Mo | ppm | 1 | 10,000 |
| Aluminium | Al | % | 0.01 | 15 |
| Sodium | Na | % | 0.01 | 15 |
| Arsenic | As | ppm | 3 | 10,000 |
| Nickel | Ni | ppm | 1 | 10,000 |
| Barium | Ba | ppm | 1 | 10,000 |
| Phosphorus | P | % | 0.01 | 1 |
| Beryllium | Be | ppm | 0.5 | 2,500 |
| Lead | Pb | ppm | 2 | 10,000 |
| Bismuth | Bi | ppm | 5 | 10,000 |
| Sulphur | S | % | 0.01 | 10 |
| Calcium | Ca | % | 0.01 | 15 |
| Antimony | Sb | ppm | 5 | 10,000 |
| Cadmium | Cd | ppm | 1 | 10,000 |
| Scandium | Sc | ppm | 0.5 | 10,000 |
| Cobalt | Co | ppm | 1 | 10,000 |
| Tin | Sn | ppm | 10 | 10,000 |
| Chromium | Cr | ppm | 1 | 10,000 |
| Strontium | Sr | ppm | 0.5 | 5,000 |
| Copper | Cu | ppm | 0.5 | 10,000 |
| Titanium | Ti | % | 0.01 | 15 |
| Iron | Fe | % | 0.01 | 15 |
| Vanadium | V | ppm | 2 | 10,000 |
| Potassium | K | % | 0.01 | 15 |
| Tungsten | W | ppm | 10 | 10,000 |
| Lanthanum | La | ppm | 0.5 | 10,000 |
| Yttrium | Y | ppm | 0.5 | 10,000 |
| Lithium | Li | ppm | 1 | 10,000 |
| Zinc | Zn | ppm | 0.5 | 10,000 |
| Magnesium | Mg | % | 0.01 | 15 |
| Zirconium | Zr | ppm | 0.5 | 10,000 |
| Manganese | Mn | ppm | 2 | 10,000 |
|
|
|
|
|
|
In addition, 30 samples were analyzed for whole-rock geochemical analysis by lithium metaborate fusion with an x-ray fluorescence (XRF) finish. All duplicates were analyzed at ALS Vancouver.
Northern Dynasty and Pebble Partnership Sample Analysis, 2004-2013 and 2018
Analytical work from 2004 to 2013 and 2018 was completed by ALS Vancouver. ALS Vancouver has been ISO/IEC 17025 accredited since 2005. Total copper and molybdenum concentrations were determined by an intermediate-grade multi-element analytical method. A four-acid digestion was followed by ICP-AES finish (ALS code ME-ICP61a). This multi-element method was also used to determine 31 additional elements including sulphur. The elements reported, units and detection limits are listed in Table 11-7.
| Pebble Project NI 43-101 Technical Report Update and Preliminary Economic Assessment | Page 106 August 21, 2023 |
|
|
|
Table 11‑7: ALS Four Acid Digestion Multi-Element Analytical Method ME-ICP61a
| Element | Symbol | Units | Lower Limit | Upper Limit |
| Element | Symbol | Units | Lower Limit | Upper Limit |
| Silver | Ag | ppm | 1 | 200 |
| Molybdenum | Mo | ppm | 10 | 50,000 |
| Aluminium | Al | % | 0.05 | 50 |
| Sodium | Na | % | 0.05 | 30 |
| Arsenic | As | ppm | 50 | 100,000 |
| Nickel | Ni | ppm | 10 | 100,000 |
| Barium | Ba | ppm | 50 | 50,000 |
| Phosphorus | P | ppm | 50 | 100,000 |
| Beryllium | Be | ppm | 10 | 10,000 |
| Lead | Pb | ppm | 20 | 100,000 |
| Bismuth | Bi | ppm | 20 | 500,00 |
| Sulphur | S | % | 0.05 | 10 |
| Calcium | Ca | % | 0.05 | 50 |
| Antimony | Sb | ppm | 50 | 50,000 |
| Cadmium | Cd | ppm | 10 | 10,000 |
| Scandium | Sc | ppm | 50 | 50,000 |
| Cobalt | Co | ppm | 10 | 50,000 |
| Strontium | Sr | ppm | 10 | 100,000 |
| Chromium | Cr | ppm | 10 | 100,000 |
| Thorium | Th | ppm | 50 | 50,000 |
| Copper | Cu | ppm | 10 | 100,000 |
| Titanium | Ti | % | 0.05 | 30 |
| Iron | Fe | % | 0.05 | 50 |
| Thallium | Tl | ppm | 50 | 50,000 |
| Gallium | Ga | ppm | 50 | 50,000 |
| Uranium | U | ppm | 50 | 50,000 |
| Potassium | K | % | 0.1 | 30 |
| Vanadium | V | ppm | 10 | 100,000 |
| Lanthanum | La | ppm | 50 | 50,000 |
| Tungsten | W | ppm | 50 | 50,000 |
| Magnesium | Mg | % | 0.05 | 50 |
| Zinc | Zn | ppm | 20 | 100,000 |
| Manganese | Mn | ppm | 10 | 100,000 |
|
|
|
|
|
|
In 2004 and 2005, one sample in 10 was also analyzed for copper by a high-grade, four-acid digestion method with AAS finish (ALS code Cu-AA62). Details on this and other copper check assay and overlimit methods employed are in Table 11-2.
Gold content was determined by 30 g lead collection FA fusion with AAS finish (ALS code Au-AA23). A total of 14 samples from this period returned gold values greater than 10 ppm; they were re-analyzed by 30 g FA fusion with a gravimetric finish (ALS code Au-GRA21), with results reported in ppm. From drill hole number 7371 onward, gold, platinum and palladium concentrations were determined by 30 g FA fusion with ICP-AES finish (ALS code PGM-ICP23). In 2002, 464 samples from 12 holes in the 25 Zone, 37 Zone and nearby were also analyzed by method PGM-ICP23. Table 11-3 provides further details on the sample size and detection limits of the ALS precious metal fire assay methods used. A single silver value >200 ppm was re-analyzed by AR digestion AAS (Method Ag-AA62 on Table 11-2). Beginning in 2004 for Tertiary rocks and 2007 for Cretaceous rocks, samples were analyzed for 48 elements including copper, silver, molybdenum, and rhenium by four-acid digestion followed by ICP-AES and inductively coupled plasma–mass spectroscopy finish (ICP-MS). Information on this method (ALS code ME-MS61) is listed in Table 11-8.
| Pebble Project NI 43-101 Technical Report Update and Preliminary Economic Assessment | Page 107 August 21, 2023 |
|
|
|
Table 11‑8: ALS Four Acid Digestion Multi-Element Analytical Method ME-MS61
| Element | Symbol | Unit | Lower Limit | Upper Limit |
| Element | Symbol | Units | Lower Limit | Upper Limit |
| Silver | Ag | ppm | 0.01 | 100 |
| Sodium | Na | % | 0.01 | 10 |
| Aluminium | Al | % | 0.01 | 50 |
| Niobium | Nb | ppm | 0.1 | 500 |
| Arsenic | As | ppm | 0.2 | 10,000 |
| Nickel | Ni | ppm | 0.2 | 10,000 |
| Barium | Ba | ppm | 10 | 10,000 |
| Phosphorous | P | ppm | 10 | 10,000 |
| Beryllium | Be | ppm | 0.05 | 1,000 |
| Lead | Pb | ppm | 0.5 | 10,000 |
| Bismuth | Bi | ppm | 0.01 | 10,000 |
| Rubidium | Rb | ppm | 0.1 | 500 |
| Calcium | Ca | % | 0.01 | 50 |
| Rhenium | Re | ppm | 0.002 | 50 |
| Cadmium | Cd | ppm | 0.02 | 500 |
| Sulphur | S | % | 0.01 | 10 |
| Cerium | Ce | ppm | 0.01 | 500 |
| Antimony | Sb | ppm | 0.05 | 1,000 |
| Cobalt | Co | ppm | 0.1 | 10,000 |
| Scandium | Sc | ppm | 0.1 | 250 |
| Chromium | Cr | ppm | 1 | 10,000 |
| Selenium | Se | ppm | 1 | 1,000 |
| Caesium | Cs | ppm | 0.05 | 500 |
| Tin | Sn | ppm | 0.2 | 500 |
| Copper | Cu | ppm | 0.2 | 10,000 |
| Strontium | Sr | ppm | 0.2 | 10,000 |
| Iron | Fe | % | 0.01 | 50 |
| Tantalum | Ta | ppm | 0.05 | 100 |
| Gallium | Ga | ppm | 0.05 | 500 |
| Tellurium | Te | ppm | 0.05 | 500 |
| Germanium | Ge | ppm | 0.05 | 500 |
| Thorium | Th | ppm | 0.01 | 500 |
| Hafnium | Hf | ppm | 0.1 | 500 |
| Titanium | Ti | % | 0.005 | 10 |
| Indium | In | ppm | 0.005 | 500 |
| Thallium | Tl | ppm | 0.02 | 500 |
| Potassium | K | % | 0.01 | 10 |
| Uranium | U | ppm | 0.1 | 500 |
| Lanthanum | La | ppm | 0.5 | 500 |
| Vanadium | V | ppm | 1 | 10,000 |
| Lithium | Li | ppm | 0.2 | 500 |
| Tungsten | W | ppm | 0.1 | 10,000 |
| Magnesium | Mg | % | 0.01 | 50 |
| Yttrium | Y | ppm | 0.1 | 500 |
| Manganese | Mn | ppm | 5 | 100,000 |
| Zinc | Zn | ppm | 2 | 10,000 |
| Molybdenum | Mo | ppm | 0.05 | 10,000 |
| Zirconium | Zr | ppm | 0.5 | 500 |
As adjuncts to ALS methods ME-ICP61 and ME-MS61, mercury was determined by AR digestion with cold vapour AAS finish (ALS method Hg-CV41) and AR digestion ICP-MS (ALS method Hg-MS42) on samples where method ME-ICP61a is not performed. Table 11-9 provides further details on these methods.
Table 11‑9: ALS Mercury Aqua Regia Digestion Analytical Methods
| Element | Symbol | Method Code | Sample Mass (g) | Units | Lower Limit | Upper Limit |
| Mercury | Hg | Hg-CV41 | 0.5 | ppm | 0.01 | 100 |
| Mercury | Hg | Hg-MS42 | 0.5 | ppm | 0.005 | 100 |
A total of 13,371 samples were subject to sequential copper speciation analyses that included: oxide copper analysis by citric acid leach AAS finish; non-sulphide copper analysis by 5% sulphuric acid leach AAS finish and cyanide leachable copper on the sample residue of the sulphuric acid leach by cyanide leach AAS finish (ALS codes Cu-AA04, Cu-AA05 and Cu-AA17). These methods and the database codes associated with them are outlined in Table 11-10.
| Pebble Project NI 43-101 Technical Report Update and Preliminary Economic Assessment | Page 108 August 21, 2023 |
|
|
|
Table 11‑10: ALS Copper Speciation Analytical Methods
| Database Code | Method Code | Leach | Sample Mass (g) | Units | Lower Limit | Upper Limit |
| CuOx | Cu-AA04 | Citric acid | 0.25 | % | 0.01 | 10 |
| CuS | Cu-AA05 | 5% Sulphuric acid | 0.5 | % | 0.01 | 10 |
| CuCN | Cu-AA17 | Cyanide | 2 | % | 0.01 | 10 |
A total of 222 samples from a drill hole in Pebble East were analyzed for precious metals (ALS code Au-SCR21 modified to include platinum and palladium). A 1,000 g pulp sample was screened at 100 µm (Tyler 150 mesh) and the entire plus fraction was weighed and analyzed by FA ICP finish and two 30 g minus fractions.
All duplicates since 2004 have been analyzed at Acme Analytical Laboratories (Acme), now Bureau Veritas Commodities Canada Ltd. (BVCCL) in Vancouver, BC, using similar methods to those at ALS. Acme (BVCCL) code MA270, a four-acid digestion with ICP-AES finish, was used to determine total concentrations for copper, molybdenum and 38 additional elements. Table 11-11 lists the elements analyzed and the detection limits of this method.
Table 11‑11: BVCCL Four Acid Digestion Multi-Element Analytical Method MA270
| Element | Symbol | Units | Lower Limit |
| Element | Symbol | Units | Lower Limit |
| Silver | Ag | ppm | 0.5 |
| Sodium | Na | % | 0.01 |
| Aluminium | Al | % | 0.01 |
| Niobium | Nb | ppm | 0.5 |
| Arsenic | As | ppm | 5 |
| Nickel | Ni | ppm | 0.5 |
| Barium | Ba | ppm | 5 |
| Phosphorus | P | % | 0.01 |
| Beryllium | Be | ppm | 5 |
| Lead | Pb | ppm | 0.5 |
| Bismuth | Bi | ppm | 0.5 |
| Rubidium | Rb | ppm | 0.5 |
| Calcium | Ca | % | 0.01 |
| Sulphur | S | % | 0.05 |
| Cadmium | Cd | ppm | 0.5 |
| Antimony | Sb | ppm | 0.5 |
| Cerium | Ce | ppm | 5 |
| Scandium | Sc | ppm | 1 |
| Cobalt | Co | ppm | 1 |
| Tin | Sn | ppm | 0.5 |
| Chromium | Cr | ppm | 1 |
| Strontium | Sr | ppm | 5 |
| Copper | Cu | ppm | 0.5 |
| Tantalum | Ta | ppm | 0.5 |
| Iron | Fe | % | 0.01 |
| Thorium | Th | ppm | 0.5 |
| Hafnium | Hf | ppm | 0.5 |
| Titanium | Ti | % | 0.001 |
| Potassium | K | % | 0.01 |
| Uranium | U | ppm | 0.5 |
| Lanthanum | La | ppm | 0.5 |
| Vanadium | V | ppm | 10 |
| Lithium | Li | ppm | 0.5 |
| Tungsten | W | ppm | 0.5 |
| Magnesium | Mg | % | 0.01 |
| Yttrium | Y | ppm | 0.5 |
| Manganese | Mn | ppm | 5 |
| Zinc | Zn | ppm | 5 |
| Molybdenum | Mo | ppm | 0.5 |
| Zirconium | Zr | ppm | 0.5 |
Check assays for gold were determined by Acme (BVCCL) code FA330, a 30 g FA fusion with ICP-AES finish. Table 11-12 lists the details for this method.
| Pebble Project NI 43-101 Technical Report Update and Preliminary Economic Assessment | Page 109 August 21, 2023 |
|
|
|
Table 11‑12: BVCCL Precious Metal Fire Assay Analytical Method
| Element | Symbol | Method Code | Instrument | Units | Sample Mass (g) | Lower Limit |
| Gold | Au | FA330 | ICP-AES | ppb | 30 | 2 |
In 2010, 115 till samples were also analyzed at BVCCL. The samples were dried and sieved to 230 mesh (63 µm), and a 15 g sub-sample was digested in AR and analyzed by ICP-MS (BVCCL code 1F05).
Figure 11-1 illustrates the sampling and analytical flowchart for the 2010 through 2013 drill programs.
Figure 11‑1: Pebble Project 2010 to 2013 Drill Core Sampling and Analytical Flow Chart

Note: Modified after Gaunt, 2014.
| Pebble Project NI 43-101 Technical Report Update and Preliminary Economic Assessment | Page 110 August 21, 2023 |
|
|
|
11.3.2 Bulk Density Determinations
Density measurements were made at 100 ft intervals within continuous rock units, and at least once in each rock unit less than 100 ft wide. Rocks chosen for analysis were typical of the surrounding rock. Where the sample interval occurred in a section of missing core, or poorly-consolidated material unsuitable for measurement, the nearest intact piece of core was measured instead.
Core samples free of visible moisture were selected; they ranged from 3 to 12 in long, and averaged 11.8 in. The samples were dried, weighed in air on a digital scale (capacity 4.4 lb.) and the mass in air (MA) recorded to the nearest 0.1 g. The sample was suspended in water below the scale and its weight in water (Mw) entered. Calculation of the density was conducted using the following formula:
Density = MA / (MA - Mw)
Core-sized pieces of aluminium were used as density standards at site starting in 2008. A total of 9,951 density measurements of Tertiary and Cretaceous rocks were taken using a water immersion method on whole and half drill core samples at the Iliamna core logging facility.
11.4 Quality Control/Quality Assurance
11.4.1 Quality Assurance and Quality Control
Northern Dynasty maintained an effective QA/QC program consistent with industry best practices, which was continued from 2007 to 2013 under the Pebble Partnership. This program is in addition to the QA/QC procedures used internally by the analytical laboratories. The QA/QC program was independently reviewed by Analytical Laboratory Consultants Ltd (ALC, 2004 to 2007) and Nicholson Analytical Consulting (NAC, 2008 to 2012). The analytical consultants provided ongoing monitoring, including facility inspection and timely reporting of the performance of standards, blanks, and duplicates in the sampling and analytical program. The results of this program indicate that analytical results are of a high quality, suitable for use in detailed modeling and resource evaluation studies.
Table 11-13 describes the QA/QC sample types used in the program.
Table 11‑13: QA/QC Sample Types Used
| QC Code | Sample Type |
| Description | Percent of Total |
| MS | Regular Mainstream | • | Regular samples submitted for preparation and analysis at the primary laboratory. | 89% |
| ST | Standard (Certified Reference Material) | • | Mineralized material in pulverized form with a known concentration and distribution of element(s) of interest. | 4.5% or 9 in 200 |
|
|
| • | Randomly inserted using pre-numbered sample tags. |
|
| DP | Duplicate or Replicate | • | An additional split taken from the remaining pulp reject, coarse reject, ¼ core or ½ core remainder. | 4.5% or 9 in 200 |
|
|
| • | Random selection using pre-numbered sample tags. |
|
| SD | Standard Duplicate | • | Standard reference sample submitted with duplicates and replicates to the check laboratory. | <1% |
| BL | Blank | • | Sample containing negligible or background amounts of elements of interest, to test for contamination. | 2% 1 in 50 |
| Pebble Project NI 43-101 Technical Report Update and Preliminary Economic Assessment | Page 111 August 21, 2023 |
|
|
|
The performance of the copper-gold standard CGS-16 is illustrated in Figure 11-2 and Figure 11-3.
Figure 11‑2: Performance of the Copper Standard CGS-16 in 2008
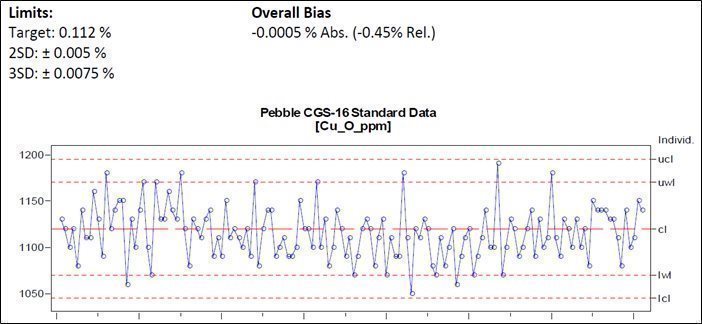
Note: Figure prepared by NAC, Oct. 19, 2009.
Figure 11‑3: Performance of the Gold Standard CGS-16 in 2008
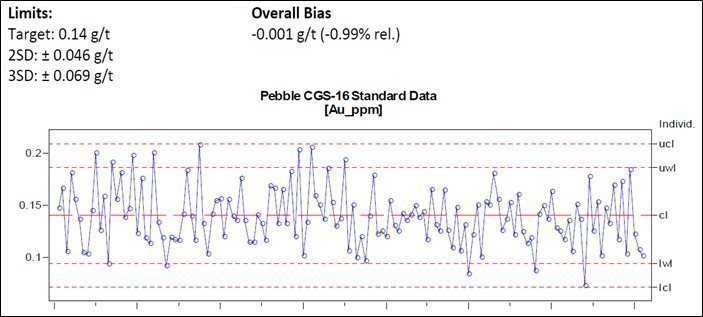
Note: Figure prepared by NAC, Oct. 19, 2009.
| Pebble Project NI 43-101 Technical Report Update and Preliminary Economic Assessment | Page 112 August 21, 2023 |
|
|
|
11.4.2 Standards
Standard reference materials (standards) were inserted into the Cretaceous sample stream (9 samples for every 200 samples) after sample preparation as anonymous (blind), consecutively numbered pulps. These standards are in addition to internal standards routinely analyzed by the analytical laboratories. Standards were inserted in the field by the use of sample tags, on which the "ST" designation for "Standard" was pre-marked. For the Tertiary waste rock analytical program, coarse blanks were inserted at the sample tags positions marked as ST until late 2008 and, since then a commercial pulp blank has been used.
Standard performance was monitored by charting the analytical results over time against the concentration of the control elements. The results are compared with the expected value and range, as determined by round-robin analysis. A total of 32 different standard reference materials were used to monitor the assay results from 1997 through 2018 and 2020 rhenium analysis programs. Copper and gold standards were inserted during the 1997 through 2020 programs. Molybdenum standards were added in September 2008.
In December 2007, several tons of coarse reject samples from Pebble East and Pebble West were pulled from storage and shipped to Ore Research & Exploration Pty Ltd in Victoria, Australia, for the production of ten matrix-matched certified reference materials. These standards (PLP-1 through PLP-10) became available in late 2009 and have been used to monitor the Pebble analytical results since that time. Nine of the standards from mineralized Cretaceous rocks are certified for copper, gold, silver, molybdenum, and arsenic. One low- grade standard (PLP-2) is from Tertiary rock and is certified for copper, silver, molybdenum, arsenic, and mercury.
A standard determination outside the control limits indicates a control failure. The control limits used are as follows:
| · | warning limits: ±2 standard deviations |
|
|
|
| · | control limits: ±3 standard deviations. |
When a control failure occurred, the laboratory was notified, and the affected range of samples re-analyzed. By the end of the program, no sample intervals had outstanding QA/QC issues. The standard monitoring program provides a good indication of the overall accuracy of the analytical results.
11.4.3 Duplicates
Random duplicate samples were selected and tagged in the field by the use of sample tags on which the “DP” designation for “duplicate” was pre-marked. From 2004 onward, samples to be duplicated were split by ALS Fairbanks and submitted to Acme (BVCCL) in Vancouver for pulverization.
The original samples were assayed by ALS of North Vancouver and the corresponding duplicate samples were assayed by BVCCL. The 2,000 coarse reject, inter-laboratory duplicate assay results from 2004 to 2010 match well; the correlation coefficients are 0.96 for gold, 0.98 for copper and 0.98 for molybdenum. In 2011 and 2013, the duplicate analyses rate of 9 in 200 samples was continued and the number of duplicate samples analyzed was doubled. The protocol was modified so that after every 20th mainstream sample analyzed within the regular sample stream an in-line, intra-laboratory coarse reject duplicate (a “prep-rep” duplicate) was analyzed. In addition to this, the original pulp of this sample was sent to BVCCL for inter-laboratory check assaying when final QA/QC on the original samples was completed.
Figure 11-4 and Figure 11-5 provide a comparison of the matched-pair duplicate assay results of ALS Vancouver and BVCCL for 2004 through 2010.
| Pebble Project NI 43-101 Technical Report Update and Preliminary Economic Assessment | Page 113 August 21, 2023 |
|
|
|
| Figure 11‑4: Comparison of Gold Duplicate Assay Results for 2004 to 2010 |
| Figure 11‑5: Comparison of Copper Duplicate Assay Results for 2004 to 2010 |
|
|
|
|
| Source: Ghaffari, 2011. |
| Source: Ghaffari, 2011 |
11.4.4 Blanks
A total of 1,362 field blanks have been inserted since 2004 to test for contamination. This is in addition to the analytical blanks routinely inserted with the samples by the assay laboratories as a part of their internal quality control procedures. In 2004, coarse landscape dolomite was inserted as a blank material. This material was replaced by gravel landscape material between 2005 and late 2008. In late 2008, the gravel blank was replaced by a quarried grey granitic landscape rock. This material has a lithological matrix similar to the Pebble Cretaceous host rocks.
1 lb of the blank was placed in a sample bag, given a sequential sample number in the sequence and randomly inserted one to six times per drill hole after the regular core samples were split at Iliamna. These blank samples were processed in sample number order along with the regular samples.
Of the blanks inserted, 444 were included in the Tertiary waste rock sample program in the position marked for the standard. In late 2008, a commercial precious metals pulp blank was inserted with the Tertiary waste rock samples. In late 2009, the use of matrix-matched low-grade Tertiary standard PLP-2 was initiated.
The majority of assay results for the blanks report at or below the detection limit. The maximum values reported in the current results are gold (0.028 g/t) and copper (0.057%). No significant contamination occurred during sample preparation, with a few minor exceptions, possibly due to cross-sample mixing errors during crushing.
| Pebble Project NI 43-101 Technical Report Update and Preliminary Economic Assessment | Page 114 August 21, 2023 |
|
|
|
11.4.5 QA/QC on Other Elements
The four-acid digestion ICP-AES 33 multi-element analytical method employed from 2004 through 2013 (ALS method ME-ICP61) is optimized for copper and molybdenum analysis. The copper and molybdenum assays were monitored by internal laboratory and external standards.
Parallel to this method, an ICP-MS 48 multi-element method (ALS Method ME-MS61) was also used to determine the same 25 elements above and 23 additional elements. The ICP-MS method gives lower detection limits for most of the elements.
11.4.6 Rhenium Study
In July 2020, the original assay pulps from 938 sample intervals cored in years 1991, 2003, 2004 and 2005 Pebble deposit drilling were retrieved from a company warehouse for a study on the relationship between rhenium and molybdenum concentrations. The selected samples were originally analyzed for copper, molybdenum, and other elements, but had not been analyzed for rhenium. Samples were submitted to ALS Vancouver for multi-element analysis by four acid digestion ICP-MS finish (ALS method ME-MS61), along with 52 Pebble project-based standards, 17 nominal blanks and 48 duplicates. In addition to rhenium and molybdenum, the concentrations of copper, silver and 44 other elements were also determined in this study. The performance of standard PLP-1 for rhenium is illustrated in Figure 11-6. The pre-2020 results and 2020 results from ALS are highlighted by lighter and darker shaded lines, respectively. The performance of the nominal (low element concentration) blank PLP-2 for rhenium is similarly presented in Figure 11-7. As the control samples used had not originally been subject to round-robin analysis for rhenium, results of several hundred analyses at ALS Vancouver were used to establish reasonable concentration levels for them. These levels were corroborated with results obtained by other analytical laboratories using similar analytical methods.
| Pebble Project NI 43-101 Technical Report Update and Preliminary Economic Assessment | Page 115 August 21, 2023 |
|
|
|
Figure 11‑6: Performance of Standard PLP-1 for Rhenium
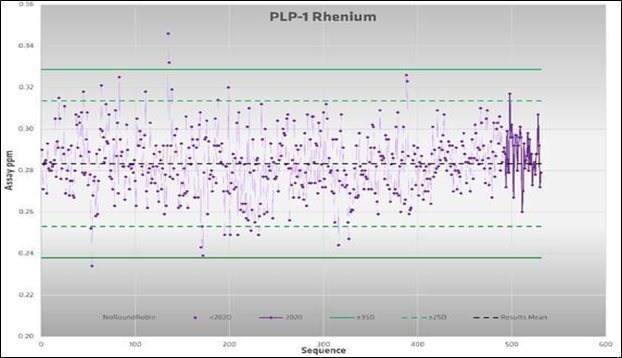

Source: Gaunt, 2020.
| Pebble Project NI 43-101 Technical Report Update and Preliminary Economic Assessment | Page 116 August 21, 2023 |
|
|
|
Figure 11‑7: Performance of Control Sample PLP-2 for Rhenium

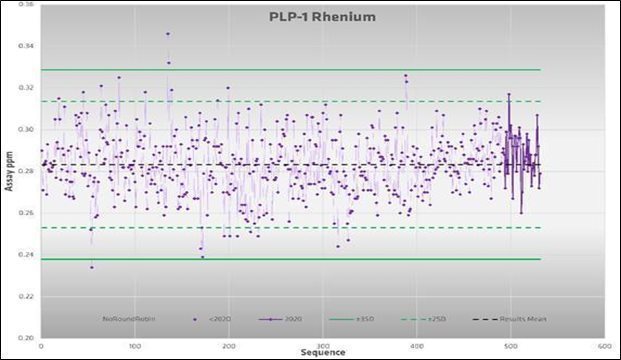
Source: Gaunt, 2020.
| Pebble Project NI 43-101 Technical Report Update and Preliminary Economic Assessment | Page 117 August 21, 2023 |
|
|
|
Based on the findings derived from this study, the QP Graeme Roper holds the opinion that the rhenium outcomes acquired are appropriate for inclusion within this technical report.
As part of the 2020 rhenium study, additional elements including copper and molybdenum were analyzed by the multi-element method employed. The copper and molybdenum results obtained in 2020 were compared with the original assay results. These comparisons are presented in Figure 11-8 as scatterplots in log format of the original results versus the new results. A reasonable level of correspondence in concentrations of the matched pairs was obtained for each element.
Figure 11‑8: Scatterplots in Log Format of Original vs. 2020 Re-Analysis for Copper and Molybdenum
|
|
|
Source: Gaunt, 2020.
11.5 Bulk Density Validation
The bulk density data were reviewed prior to the resource estimate. The following types of errors were noted: entry errors, standards labelled as regular samples, incorrectly calculated density values based on the mass in air and mass in water values entered and extremely high or low-density values without appropriate explanation. These errors were investigated and corrected prior to including the data for resource estimation.
Two other possible sources of error in the measurements were identified: the presence of moisture in the mass in air measurement for some samples, and the presence of porosity and permeability of the bulk rock mass not determinable by the method. The former will result in measurements that are somewhat overstated, and the latter in measurements that are understated in terms of the dry in-situ bulk density.
11.6 Survey Validation
In 1988, Teck established a survey control network including the Pebble Beach base monument in the deposit area using U.S. State Plane Coordinate System Alaska Zone 5. This monument was tied to the NGS State Monuments Koktuli, PIG and RAP at Iliamna and formed the base for subsequent drill collar surveys. In 2004, air photo panels and a control network were established using NAD 83 US State Plane Coordinate System Alaska Zone 5 with elevations corrected to NAVD88 based on Geoid99.
| Pebble Project NI 43-101 Technical Report Update and Preliminary Economic Assessment | Page 118 August 21, 2023 |
|
|
|
In 2005, differences between the elevations of surveyed drill collars in the deposit area and the digital elevation model (DEM) topography were observed. In early 2008, a re-survey program was initiated to investigate and resolve these discrepancies. A consistent error was identified in the collar coordinates from some years, and questions arose as to whether drill collars had been surveyed to the top of the drill casing or to ground level. In September 2008, two new control points - Pebble 1 and Pebble 2 - were established by R&M Consultants Inc. of Anchorage in the deposit area; they tied these two points and the Pebble Beach monument into the 2004 control network and an x, y, z linear coordinate correction was applied to resolve previously observed drill hole elevation discrepancies.
Subsequently, during the 2008 and 2009 field seasons, all holes drilled at the Pebble Project since inception in 1988 were re-surveyed using a real time kinematic (RTK) GPS, referencing the coordinates of the Pebble Beach monument as established by the 2008 re-survey to gain a complete set of consistently acquired collar survey data. The majority of the drill holes were marked with a wooden post and an aluminium tag. In cases where the post was missing, the original coordinates were used to find evidence of the drill hole. Any hole missing a drill post was re-marked, and this was noted in the database. The resurveys were taken to the top of tundra over the center of the drill hole. Where a drill hole could not be located, the resurveyed coordinate was taken at the original drill collar coordinates and the elevation re-established in the new system.
All post Teck holes were down-hole surveyed by single shot magnetic methods. In 2008, several angle holes were also surveyed by a non-magnetic gyroscopic tool.
11.7 Data Environment
All drill logs collected on the Pebble Project were compiled in a SQL Server database. Drill hole logs were entered into notebook computers running a digital data entry module for the Pebble Project at the core shack in Iliamna prior to 2018. During the pre-2018 drilling programs, the core logging computers were synchronized on a daily basis with the site master database on the file server in the Iliamna geology office. In 2018 and 2019, data entry was to a cloud-based server. Core photographs are also transferred to the file server in the Iliamna geology office on a daily basis. In the geology office, the logs were reviewed and validated, and initial corrections made.
Prior to 2018, site data were transmitted on a weekly basis to the Vancouver office, where the logging data were imported into the project master database and merged with digital assay results provided by the analytical laboratories. After importing, a further printing, validation and verification step followed. In 2018 and 2019, a cloud-based application was used. Any errors noted are submitted to the Iliamna office for correction. If analytical re-runs are required, the relevant laboratories are notified, and corrections are made to the corresponding results within the project master database. Parallel to this, an independent QA/QC consultant compiled the sample log data from the site with assay data received directly from the laboratories for the 2004 through 2012 programs as part of an ongoing monitoring process. Compiled data are exported to the site database, to resource estimators, and to other users as required.
11.7.1 Error Detection Processes
Error detection within the data entry modules is used in the core shack and the Iliamna geology office as part of the data verification process. This process standardizes and documents the data entry, restricts data which can be entered and processed, and enables corrections to be made at an early stage. Users are prompted to make selections from ‘pick-lists,’ when appropriate, and other entries are restricted to reasonable ranges of input. In other instances, information must be entered, and certain steps completed prior to advancing to the next step. After the logs have been entered, they are reviewed and validated by the logger and printed.
Site data were transmitted to the Pebble database compilation group on a regular basis. The compiled data from the header, survey, assay, geology, and geotechnical tables were validated for missing, overlapping, or duplicated intervals or sample numbers, and for matching drill hole lengths in each table. Drill hole collars and traces were viewed on plan view and in section by a geologist as a visual check on the validity of the collar and survey information.
| Pebble Project NI 43-101 Technical Report Update and Preliminary Economic Assessment | Page 119 August 21, 2023 |
|
|
|
As the analytical data returned from the laboratory, they were merged with the site sampling data, and the gold, copper, silver and molybdenum values of the regular samples and QA/QC samples reviewed. Particular attention was paid to standards that failed QA/QC; they were targeted for immediate review and re-runs were requested from the analytical laboratory if necessary.
11.7.2 Analysis Hierarchies
The first valid QA/QC-passed analytical result received from the primary laboratory has the highest priority in the analytical hierarchy. If the same analytical method is used more than once, no averaging is done. If different analytical methods are employed on the same sample, the most appropriate combination of digestion and analytical method is selected and used.
For gold analysis, FA determined by gravimetric finish supersedes results by AAS or ICP finish, particularly where the AAS or ICP results are designated as over limits. For copper analysis done on Cretaceous rocks after 2004, ALS intermediate grade multi-element analytical method (ALS method ME-ICP61) supersedes copper by low grade multi-element method (ALS method ME-MS61).
In the case of all other elements, including molybdenum, silver, and sulphur analyses from 2007 through 2013, the multi-element method (ALS method ME-MS61) supersedes the intermediate grade multi-element method (ALS method ME-ICP61), unless the low-grade method results are greater than the upper detection limit. In that case, the intermediate grade method result prevails. All rhenium results are by ALS method ME-MS61. Infrequent extremely high results for copper, molybdenum, silver, lead, or zinc were reanalysed by single element over limit analytical methods that supersede the original result.
11.7.3 Wedges
Some long holes, particularly in Pebble East, were intentionally wedged. This was undertaken when drilling conditions in the parent hole deteriorated to such an extent that continuation to target depth was impractical. For consistency of sample support for geological and resource modeling, mother hole/wedge hole combinations are represented by singular linear traces in the database. In treating the wedged portion of a hole that successfully extends beyond its parent hole, the following approach was used. The wedged portion of the hole was treated as a continuation of the mother hole from the point where the wedge starts. The information from the mother hole and the wedge was blended onto a string that follows the mother hole to the wedge point, and then follows the wedge (and the wedge surveys) to the end of the hole. The ‘best available’ information from the two hole strings was combined to produce one linear drill hole trace.
11.8 Verification of Drilling Data
The 1997 and prior Teck data were validated by Northern Dynasty in 2003 using the following:
| · | digital data and printed information obtained from Teck |
| · | digital assay results obtained directly from ALS and Cominco Exploration Research laboratories, where available |
| · | selected re-analysis of original assay pulps obtained from Teck. |
| Pebble Project NI 43-101 Technical Report Update and Preliminary Economic Assessment | Page 120 August 21, 2023 |
|
|
|
Most of the pre-2002 data in the current database is derived from a digital compilation created by Teck in 1999. Twenty-eight gold results from 1988 and 1989 holes, which existed only on hand-written drill logs, were added to the database. A complete set of original information, including original drill logs, does not exist for all historical holes, particularly for those drilled in the Sill zone in 1988 and 1989. Assay data for the 1988 and 1989 holes drilled in Pebble West and 25 zone is from a combination of CERL assay certificates, the Teck digital compilation file and the original drill logs. The data compiled by Teck appears to be of good quality and matches the digital analytical data received directly from the CERL and ALS laboratories, with few exceptions. Most differences appear to be due to separately reported over-limits and re-runs. The small number of errors identified in the Teck data, including mismatched assay data, conversion errors, unapplied over-limits and typographical errors were corrected.
The 2002 analytical data were also verified and validated. A few errors were identified and corrected. When the 2003 digital data were verified against the assay certificates, some differences with the printed certificates were identified. In 2003, the analytical results were provided by SGS in a digital format that included SGS internal standards, duplicates and blanks. These digital results differed from the values on the corresponding printed certificates in two ways: digits in excess of three significant figures were recorded, and results were not trimmed to the upper detection limit value. As a result, sixteen 2003 gold assays over 2,000 ppb had incorrect values assigned to them in the database. This was corrected by applying the correct FA over-limit re-run result to these samples in the database. No over-limits existed in the 2003 copper results so there were no errors with this element. The lone over-limit molybdenum value was left untrimmed because this result was substantiated by an ALS check assay. Results from 2003 for elements other than gold, copper and molybdenum were left untrimmed in the database.
Norwest Corporation reported on additional data verification done in conjunction with the resource estimate in a technical report dated the February 20, 2004. “Norwest received, from Northern Dynasty, the initial Pebble drill hole database in the form of an assay, collar, downhole survey and geology file. An audit was undertaken of 5% of the data within these files. Digital files were compared to original assay certificates and survey records. It was determined that the downhole survey file had an unacceptable number of errors. The assay file had an error rate of 1.2%. This was considered acceptable for this level of study.” These errors were investigated and subsequently corrected by Northern Dynasty.
The ongoing error-trapping and verification process for drill hole data collected from 2004 to 2019 is described in
Section 11.1.3. Typically, validation and verification work was completed within a few months of completion of a drill hole, although some QA/QC issues took longer to resolve. Work at the Iliamna office consisted mostly of validating the site data entry and resolving errors that were identified. Additional validation and verification work was performed in the Vancouver office. This consisted of checking the site data tables for missing, overlapping, unacceptable and mismatching entries, and reviewing the analytical QA/QC results. During verification of the data, a low number of errors were found. Erroneously labelled standards in the sample log were the main source of error. Digital values not matching the analytical certificates were the next area of concern. In this case, the digital data were usually correct, as the certificates had been superseded by new results from QA/QC re-runs.
In addition to typical database validation procedures, the copper, gold, and molybdenum data included in Northern Dynasty news releases prior to 2009 were manually verified against the results on the ALS analytical certificates.
A significant amount of due diligence and analytical QA/QC for copper, gold and molybdenum has been completed on the samples that were used in the current mineral resource estimate. This verification and validation work performed on the digital database provides confidence that it is of good quality and acceptable for use in geological modeling, mineral estimation and preliminary mine planning.
| Pebble Project NI 43-101 Technical Report Update and Preliminary Economic Assessment | Page 121 August 21, 2023 |
|
|
|
11.9 Conclusions
QP Graeme Roper, P. Geo., has reviewed the sample preparation, security and analytical procedures conducted on the Pebble Project and concludes the procedures used align with industry best practices and are deemed suitable for the purposes outlined in this technical report.
| Pebble Project NI 43-101 Technical Report Update and Preliminary Economic Assessment | Page 122 August 21, 2023 |
|
|
|
12 DATA VERIFICATION
12.1 Data Verification by Robin Kalanchey
QP Robin Kalanchey was involved in multiple aspects of the 2021 PEA, and worked directly with engineers, designers, estimators, and analysts in the development of the process facility and infrastructure engineering, cost estimates and the financial evaluation for the Proposed Project and potential expansion scenarios. Similarly, Mr. Kalanchey worked directly with engineers and analysis in the development of the updated financial evaluation for the Proposed Project, as presented in this 2023 PEA. In his QP capacity, Mr. Kalanchey reviewed the relevant mineral processing and metallurgical test reports, as completed by others, the engineering design documentation, as well as consolidated capital and operating cost estimates, and the corresponding economic models. QP Kalanchey has validated the data used as the basis of the engineering design, cost estimates and inputs to the economic models against Ausenco’s internal standards and industry benchmarks, available metallurgical testwork reports for the Pebble deposit, and preferred practices for base metal deposits.
QP Kalanchey has not visited the Pebble site but has relied on the information provided in site visit reports as produced by Mr. Paul Staples, P.Eng., of Ausenco, who visited the site previously and during such visit observed the mine site, the port site and the data collection activities taking place at the time of the visit. Given his involvement in the Project and his interactions with the design and project teams, QP Kalanchey is of the opinion that the data used as the basis of the engineering designs, cost estimates and financial evaluations, as presented herein, are appropriate and adequate for the purposes of this 2023 PEA.
12.2 Data Verification by Scott Weston
QP Scott Weston was involved in the review of environmental, socioeconomic, permitting and closure information for the Project as presented in Chapter 20 of this 2023 PEA. QP Weston has reviewed the data and information and is of the opinion that the data used as the basis of Chapter 20 are appropriate and adequate for the purposes of this technical report.
12.3 Data Verification by Hassan Ghaffari
QP Hassan Ghaffari was involved in the metallurgical testwork review, metal recovery projections, and processing design since 2012 when Tetra Tech was retained by Northern Dynasty to conduct an internal engineering study for the Pebble Project. He also supervised Ting Lu, P.Eng. during the preparation of Section 13, Mineral Processing and Metallurgical Testing, of the 2014, 2018 and 2020 Technical Reports for Northern Dynasty.
In his QP capacity, QP Ghaffari reviewed the relevant mineral processing and metallurgical test reports that were completed by reputational commercial laboratories and leading processing equipment manufacturers. QP Ghaffari has conducted due diligence by reviewing the background, procedures, and results of the testing programs. He also analyzed original test data and communication documents to verify the test results for metal recovery projections. All aspects of these programs were deemed to be of suitable standard.
In the months immediately prior to the completion of this Report, QP Ghaffari extensively reviewed all aspects of the test results regarding rhenium distributions and recovery methods, as well as projected rhenium recovery based on the results of the conventional flotation tests.
| Pebble Project NI 43-101 Technical Report Update and Preliminary Economic Assessment | Page 123 August 21, 2023 |
|
|
|
In QP Ghaffari’s opinion, the verification work conducted for the testwork review and metal projections is adequate for the purposes used in this Report.
12.4 Data Verification by Sabry Abdel Hafez
QP Sabry Abdel Hafez was involved in the pit optimizations, pit designs, mine plan and mine costing since 2012 when Tetra Tech was retained by Northern Dynasty to conduct an internal engineering study for the Pebble Project.
In his QP’s capacity, QP Abdel Hafez has reviewed the relevant pit optimization and mine costing data. There have been no limitations placed on the ability of QP Abdel Hafez to verify the data used. In the QP’s opinion the data are adequate.
12.5 Data Verification by Les Galbraith
QP Les Galbraith has been involved with Pebble Project waste and water management studies, including site investigation programs at the locations of the TSFs and the water management ponds since 2004. He has visited the site many times, with the last visit being in June 2013. Site geotechnical data, including geophysical surveys calibrated with drillhole data, were reviewed, and are considered to be adequate to support this technical report.
12.6 Data Verification by Stuart Parks
QP Stuart Parks has been involved with the leadership, oversight, planning, conceptual engineering, and cost estimating of the Pebble mine infrastructure, specifically the power generation plants and the natural gas pipeline. In addition to his technical expertise, QP Parks has relied on project teams consisting of subject matter experts that contributed to the engineering designs and cost estimates for the power plants and natural gas pipeline. Given his involvement with the project as described, QP Parks is of the opinion that the data used as the basis of the power plants and natural gas pipeline engineering designs and cost estimates, as presented herein, are appropriate and adequate for the purposes of this technical report.
12.7 Data Verification by James Wescott Bott
QP James Wescott Bott has been involved with planning and preliminary engineering of Pebble infrastructure, including water treatment plants, since 2011. QP Bott also assisted with baseline water quality and hydrological data collection at the Pebble Project site in 2006. QP Bott’s opinion is that the data used as the basis of the water treatment engineering designs and cost estimates, as presented herein, are appropriate and adequate for the purposes of this technical report.
12.8 Data Verification by Steven Rowland
QP Steven Rowland was involved in the project access road preliminary route selection, engineering, and cost estimate as presented in this 2023 PEA. QP Rowland has validated the data used as a basis of access road engineering design, cost estimates and inputs to the economic model. QP Rowland’s opinion is that the data used as the basis of the project access, as presented herein, are appropriate and adequate for the purposes of this technical report.
| Pebble Project NI 43-101 Technical Report Update and Preliminary Economic Assessment | Page 124 August 21, 2023 |
|
|
|
12.9 Data Verification by Greg Mosher
QP Greg Mosher reviewed the Mineral Resource Estimate described in Section 14 of this Report. Prior to the review, Mosher held discussions with Gaunt regarding the Mineral Resource Estimate assumptions, parameters, and procedures, and with Eric Titley regarding the QA/QC protocols and procedures. In the QP’s opinion the data are adequate for the purposes used in this technical report.
12.10 Data Verification by Graeme Roper
QP Graeme Roper completed several data verification checks in support of the Pebble Mineral Resource estimate. The verification process included a one-day site visit to the project to check geological procedures, drill core facility review, and a drill core storage inspection. Other data verification included selection of pulp samples for metal verification, a review of QA/QC performance for drilling completed between 2004-2018, and spot check comparisons of Au and Cu assays from the drill hole database against original assay records (lab certificates) with higher attention given to data reported from ALS laboratories from 2004 onward.
A site visit of the project was carried out by Graeme Roper, P. Geo., Feb 2, 2023. Mr. Roper was accompanied by James Fueg, Senior Vice President of PLP. No active exploration was being conducted at the time of the site visit. The site visit occurred in winter conditions which limited the visit to the project core logging and storage facilities located at Iliamna, Ak. The QP was not able to set foot at the deposit site, however, a fly over by plane of the deposit site was completed. Visibility was poor, the deposit was snow covered and only geographic characteristics could be identified due to the conditions.
The site visit included confirmation review of core logging against reported drill logs, inspection of assay sample tags against reported intervals in the data base, review of core handling procedures and an inspection of the core storage facility. The QP performed spot checks on geology and sample locations using previously selected drill holes stored in the core logging facility. Holes were selected previously by Northern Dynasty to be used as a review of various alteration, mineralization, and geology for the deposit. The spot checks were completed on six holes from the Pebble East Zone and two holes from Pebble West Zone (Table 12-1). For all holes, drill logs were found to match the observed core and no issues were identified during spot checks against reported assay intervals. Standard operating procedures for core logging, density measurements and core handling were reviewed, all were well documented and within industry standards. The QP visited the secure locked fenced core storage, the core is in good condition and well identified by metal tags. The core is cross stacked on pallets outside, fastened with lids and bundled by individual hole. Newer holes are wrapped with protective UV resistant material for added protection and holes are identified by spray paint (Figure 12-1).
Table 12‑1: Holes Inspected for Spot Checks Against Core Logging and Assay Intervals
| Pebble East Drill Hole ID | Pebble West Drill Hole ID |
| 8410 | 11531 |
| 7375 | 11529 |
| 8415 | - |
| 8413 | - |
| 8412 | - |
| 7386 | - |
| Pebble Project NI 43-101 Technical Report Update and Preliminary Economic Assessment | Page 125 August 21, 2023 |
|
|
|
Figure 12‑1: Pebble Iliamna, AK Core Storage Facility, February 2, 2023

Source: Roper, Feb 2, 2023.
QP Graeme Roper selected 10 pulp sample intervals from 5 drill holes within the resource database. Samples were selected from a range of Cu grades within in the deposits, prioritized around years of high exploitation activity, (2004, 2007, 2008, 2011) and were spatially selected to get a distribution across the deposit in various lithology and alteration.
The selected pulps were pulled by Northern Dynasty employees from their Surrey warehouse. Once pulled they were sent by Northern Dynasty on behalf of the QP to ALS Geochemistry Laboratory in North Vancouver, BC. The QP chose the same analytical method as completed by Northern Dynasty to compare Au, Ag, Co and Mo results. Au was analyzed by fire assay using method ALS_PGM-ICP23, Ag, Cu, Mo using four acid ICP methods. Ag,Mo were analyzed using ALS_ME-ICP61 and Cu was analyzed using ALS_ME-ICP61a. Figure 12-2 provides a graphical comparison of the QP verification and Northern Dynasty assays for Au, Ag, Cu, and Mo respectively. All elements compare very well. The QP did not identify any material bias in the sample data, and the comparison results were found to be reasonable given the nature of the mineralization in the deposit.
| Pebble Project NI 43-101 Technical Report Update and Preliminary Economic Assessment | Page 126 August 21, 2023 |
|
|
|
Figure 12‑2: XY Scatterplot Comparison for Au (top left), Ag (top right), Cu (bottom left), Mo (bottom left)
|
|
|
|
|
|
Source: Roper, 2023.
QP Graeme Roper independently reviewed the QA/QC data provided by Northern Dynasty for the reported resource. Northern Dynasty has employed an on-site QA/QC process including the insertion of standards, blanks and duplicate samples and regular intervals in the sample stream as documented in Section 11.
The QA/QC data consisted of assay values for Certified Reference Material (CRM). The assay results were analyzed for the 3 most used CRMs for years 2004 to 2012; CRM PLP-1, CRM CGS-16, and CRM CGS-3. In addition to CRM checks, assay results for blank and duplicate performance were reviewed for the entire dataset. The CRM review displayed no outstanding record of hard failures. Duplicate and blank performance were in line with expectation. Results were equivalent to what was reported by Northern Dynasty in section 11.4.3., and 11.4.4 respectively.
A total of 811 samples (1% of total database) were chosen for database verification, to be compared to original laboratory certificates. These samples were randomly selected from the Northern Dynasty database with higher attention given to assay data processed at ALS laboratories from 2004 – 2018. Twelve of the 811 samples selected were processed at SGS laboratories in 2003. No errors were found during the review.
QP Graeme Roper also reviewed and calculated bulk density data against Northern Dynasty procedures as documented in Section 11.5 for each sample. No issues were found with the process.
| Pebble Project NI 43-101 Technical Report Update and Preliminary Economic Assessment | Page 127 August 21, 2023 |
|
|
|
On completion of the data verification for Pebble, it is the opinion of the QP that the geological data collection, analytical methods, and QA/QC procedures used by Northern Dynasty are consistent with CIM Mineral Exploration Best Practice Guidelines.
QP Graeme Roper conducted independent verification sampling and results indicate no significant bias in the data. Northern Dynasty monitors the QA/QC samples within the sampling process and results of the CRM review showed no hard failures. Cross reference of original certificates against the database showed active monitoring and re-assaying was completed with a high standard of scrutiny. QP Graeme Roper, has reviewed the sample preparation, security and analytical procedures conducted on the Pebble Project and concludes the procedures used align with industry best practices and are deemed suitable for the purposes outlined in this technical report. It is of QP Graeme Roper’s opinion that the data and observations from the various drill programs completed on the Pebble project have been suitably verified for the purpose of estimating mineral resources and preparing an NI 43-101 compliant mineral resource estimate.
| Pebble Project NI 43-101 Technical Report Update and Preliminary Economic Assessment | Page 128 August 21, 2023 |
|
|
|
13 MINERAL PROCESSING AND METALLURGICAL TESTING
This section summarizes the relevant results from all metallurgical testwork programs for the Pebble Project that was initiated by Northern Dynasty in 2003 and continued under the direction of Northern Dynasty until 2008. From 2008 to 2013, metallurgical testwork progressed under the direction of the Pebble Partnership. During the same period, geometallurgy studies were conducted by the Pebble Partnership and continued until 2014. This section includes testwork review with a focus on tests completed from 2011 to 2014, geometallurgical studies, and an updated metal recovery projection.
13.1 Test Programs Summary
Metallurgical testwork between 2005 and 2014 can be divided into three stages. The first stage was conducted from 2003 to 2005 to understand the metallurgical response of the mineralized materials and to develop a baseline process flowsheet. The objectives of the second stage, conducted between 2006 and 2010, were to optimize the baseline flowsheet on variability samples and to investigate appropriate processing methods to improve metal recoveries. The third stage from 2011 to 2014 focused on metallurgical verification tests on samples representing each metallurgical domain at the property in batch, pilot, and locked cycle tests. Additional testwork conducted during the third stage included evaluations of the performance of a secondary gold recovery plant and pressure oxidation of molybdenum concentrates to recover molybdenum and rhenium, and the subsequent metal extractions.
13.1.1 2003 to 2005 Testwork
The first stage metallurgical testwork was performed by different laboratories. The testwork conducted by Vancouver-based Process Research Associates Ltd (PRA) was preliminary in nature and was followed by testwork completed by G&T Metallurgical Services Ltd. (G&T) in Kamloops, BC. Based on their test results, a comprehensive metallurgy test program was carried out at the SGS Lakefield laboratories located in Lakefield, ON (SGS Lakefield). The basic flowsheet from PRA was optimized by testing primary grind size, regrind size, flotation and gold leaching. In addition, comminution data were obtained from samples covering the bulk of the lithology and alteration combinations in the mineral resource. A few miscellaneous tests were also performed including settling and filtration and concentrates properties. The SGS Lakefield test results demonstrated that marketable concentrate over 26% copper could be obtained along with separate molybdenum concentrate. The test results also showed doré can be obtained using leaching. All these laboratory facilities are well recognized in the mining industry.
13.1.2 2006 to 2010 Testwork
The second stage metallurgical testwork, conducted between 2006 and 2010, covered comminution, gravity separation, flotation, leaching, settling tests and other miscellaneous test work as listed in Table 13-1.
| Pebble Project | Page 129 |
| NI 43-101 Technical Report Update and Preliminary Economic Assessment | August 21, 2023 |
|
|
|
Table 13‑1: Testwork Programs and Reports 2006 to 2010
| Test Program | Laboratory | Report Date |
| Metal Recoveries Related Programs: Comminution/Flotation/Leaching Tests |
||
| Screen Analysis Data on Rod Mill Feed | Phillips Enterprises, LLC | Apr 17, 2008 |
| Rod Mill Grindability Test Data | Phillips Enterprises, LLC | Apr 18, 2008 |
| Screen Analysis Data on Rod Mill Product | Phillips Enterprises, LLC | May 13, 2008 |
| Bond Abrasion Test Data | Phillips Enterprises, LLC | Apr 22, 2008 |
| Ball Mill Grindability Test Data | Phillips Enterprises, LLC | Jun 6, 2008 |
| Screen Analysis Data on Ball Mill Feed | Phillips Enterprises, LLC | Jun 10, 2008 |
| Screen Analysis Data on Ball Mil Product | Phillips Enterprises, LLC | Jun 24, 2008 |
| Mail to the Pebble Partnership c/o Mr. Alex Doll, Final Report of Comminution QA/QC Testing | Phillips Enterprises, LLC | Jul 18, 2008 |
| Technical Memorandum to Steve Moult of Pebble Partnership, Grinding Throughput Calculation Procedure for Mine Production Schedules | DJB Consultants Inc (DJB) | Sep 30, 2008 |
| E-Mail Transmission, Compare JK SimMet SABC-A and SABC-B Throughput Prediction to Morrell Total Power Calculation for Selected 2010 SMC Samples; Also, Morrell HPGR Predictions | Contract Support Services | Jan 21, 2010 |
| E-Mail Transmission, Final Report, Pebble LOM Simulations, Years 1 to 13: SABC-A vs. SABC-B Circuit Options | Contract Support Services | Apr 7, 2010 |
| E-Mail Transmission, Final Report, Pebble LOM Simulations, Years 1 to 25: SABC-A vs. SABC-B Circuit Options | Contract Support Services | Apr 29, 2010 |
| E-Mail Transmission, Summary of Results, Pebble LOM Simulations: Years 1–45: SABC-A Revision B, Correct Year 8 Throughput | Contract Support Services | Dec 30, 2010 |
| E-Mail Transmission, Summary of Results, Pebble LOM Simulations, Years 1–45: SABC-B Circuit Option, |
|
|
| Comparison with SABC-A | Contract Support Services | Dec 30, 2010 |
| An Investigation into the Recovery of Copper, Gold, and |
|
|
| Molybdenum by Laboratory Flotation from Pebble Samples. |
|
|
| Project 10926-008 Report #1 | SGS Lakefield | Jul 6, 2006 |
| An Investigation into Copper, Gold, and Molybdenum Recovery from Pebble East Phase I Composites.
Project 11486-003 Report #1
| SGS Lakefield
| Jun 30, 2009
|
| An Investigation into Bulk Flotation of Pebble East and |
|
|
| West Composites, Project 11486-003 Report #2 | SGS Lakefield | Jun 26, 2009 |
| An Investigation into Aging of Pebble East Phase I Samples. Project 11486-003 Report #3 | SGS Lakefield | Jun 30, 2009 |
| Tank Cell e500 Mechanical Testwork | Outotec | Mar 11, 2010 |
| Copper Sulphide Jar Mill Testing Test Plant Report #20002007 | Metso | Apr 12, 2010 |
| An Investigation into the Recovery of Copper, Gold, and Moly from Pebble East and West zones. Project 12072-002 Report #2 | SGS Lakefield | Dec 21, 2009, Jan 24, 2010 |
| Determination of GRG Content Final Report Revised # T1144 | COREM | May 27, 2010 |
| Pebble Project | Page 130 |
| NI 43-101 Technical Report Update and Preliminary Economic Assessment | August 21, 2023 |
|
|
|
| Test Program | Laboratory | Report Date |
| Gravity Modeling Report Project # KRTS 20587 | Knelson Research & Technology Center | Aug 17, 2010 |
| Settling Tests |
|
|
| Summary of High-Rate Thickening Test Results Tailings Samples | Outotec | Apr 2, 2010 |
| Outotec Thickener Interpretation and Recommendations for Test Data Report TH-0493 | Outotec | Apr 9, 2010 |
| Thickener Test Data Report # TH-0493 | Outotec | Apr 9, 2010 |
| Thickener Test Data Report # TH-0493_R1 | Outotec | Apr 16, 2010 |
| Thickener Test Data Report # TH-0497 | Outotec | Jun 2, 2010 |
| Outotec Thickener Interpretation and Recommendations for Test Data Report TH-0497 | Outotec | Jun 17, 2010 |
| Filtration Tests |
|
|
| Test Report 12875T1 Pebble Partnership | Larox | Mar 8, 2010, |
| Apr 7, 2010 |
|
|
| Rheology Tests |
|
|
| Report of Investigation into The Response of the Pebble Project Rougher Tailings to Sedimentation and Rheology Testing | FL Smith | Mar 2010 |
The main purpose of the testwork was to optimize the process flowsheet to incorporate supergene mineralization from the western portion of the Pebble deposit, and to explore the performance variability of composite samples from Pebble West zone and Pebble East zone mineralization. The major observations from the second testwork campaign are summarized as follows:
| · | Bulk flotation testwork was intended to optimize the flowsheet to treat the supergene and transition zones in Pebble West. Most samples achieved the 26% copper-gold concentrate target, in the variability tests and the locked cycle tests. |
|
|
|
| · | Copper-molybdenum locked cycle separation tests demonstrated more than 99% of the copper contained in the circuit feed was recovered to copper-gold concentrate and 92.6 to 98.4% of the molybdenum was recovered to molybdenum concentrate. |
|
|
|
| · | The molybdenum concentrate, obtained from the last cleaner stage of the open circuit tests, was found to contain significant rhenium, with grades ranging up to 960 g/t, and the copper content observed was between 1.8% and 5.9%. |
|
|
|
| · | Gravity recoverable gold (GRG) was determined to optimize gravity gold recovery. The obtained recovery was similar to previous testwork. |
|
|
|
| · | Pyrite flotation was conducted with pyrite concentrate subjected to gold leaching tests. The average gold extraction was 55% by leaching for 48 hours. |
|
|
|
| · | Other metallurgical testwork conducted in this period included tailings thickening, regrinding jar tests, and copper-gold concentrate thickening and filtration. |
13.1.3 2011 to 2014 Testwork
The Pebble Partnership continued metallurgical testwork during 2011 and 2014. The major goals of the 2011 and 2014 testwork program were as follows:
| · | Complete QEMSCAN® analysis of the variability sample inventory to support geometallurgical studies. |
| Pebble Project | Page 131 |
| NI 43-101 Technical Report Update and Preliminary Economic Assessment | August 21, 2023 |
|
|
|
| · | Conduct additional flotation variability tests to ensure samples of each metallurgical domain type are represented. |
|
|
|
| · | Conduct continuous flotation testwork to generate product for downstream testwork. |
|
|
|
| · | Conduct testwork related with the design of the secondary recovery gold plant. |
|
|
|
| · | Perform an initial program to test a molybdenum autoclave process (MAP) on Pebble concentrates for molybdenum and rhenium recovery. |
Results are discussed in the following subsections.
Table 13‑2: Subsequent Testwork Programs and Reports, 2011 to 2014
| Test Program | Laboratory | Report Date |
| Metal Recoveries – Comminution/Flotation/Leaching |
||
| An Investigation into Ultrafine Grinding of Pilot Plant Concentrates from the Pebble Deposit | SGS Lakefield | Feb 9, 2011 |
| An Investigation into the Grindability Characteristics of a Single Sample W-214-215 from the Pebble West Zone | SGS Lakefield | Apr 6, 2011 |
| Continuous Flotation of Five Composites from the Pebble Deposit | SGS Lakefield | Jun 21, 2011 |
| Copper Molybdenum Separation Testing on a Pebble Bulk Concentrate | G&T Metallurgical Services Ltd. | Sep 22, 2011 |
| An Investigation into the Recovery of Copper, Gold, and Molybdenum from the Pebble Deposit; Incomplete; Progress Report, Project 12072-003 and -007 | SGS Lakefield | Jan 24, 2012 |
| Concentrate Quality |
||
| An Investigation by High-Definition Mineralogy into the Mineralogy Characteristics of Five Concentrate Samples from Five Different Composites | SGS Lakefield | Mar 23, 2011 |
| Eight Samples from the Pebble Gold zone | SGS Lakefield | Jun 17, 2011 |
| An Investigation by High-Definition Mineralogy into the Mineralogy Characteristics of Eight Products of Three Pilot Plant Samples | SGS Lakefield | Jun 23, 2011 |
| Filtration |
||
| Filtration Test Report | Outotec | Jun 17, 2011 |
| Rheology Tests |
||
| Grinding Transfer Stream Rheology Testwork Report, Report # PBL-5172 R02 Rev 0 & Rev 1 | Paterson & Cooke | Sep 2011,
Oct 2011 |
| Bulk Tailings Rheology Testwork Report. Report # 4303207-25-RP-002 | Paterson & Cooke | Nov 2011 |
| An Investigation into the Recovery of Copper, Gold, and Molybdenum from the Pebble Deposit; Incomplete; Final Report, Project 12072-003 and -007 | SGS Lakefield | Sep 24, 2014 |
13.2 Comminution Tests
13.2.1 Bond Grindability Tests
The Bond rod mill work index (RWi) and Bond ball mill work index (BWi) are listed in Table 13-3 and Table 13-4, respectively.
| Pebble Project | Page 132 |
| NI 43-101 Technical Report Update and Preliminary Economic Assessment | August 21, 2023 |
|
|
|
Table 13‑3: Pebble West Rod Mill Data Comparison, SGS January 20122
| Description | BWi (kWh/t) |
|||
| Core Year | 2004 | 2005, 2006 | 2008 | 2011 |
| Composites | - | W1 to W177 | W178 to W394 | W395 to W445 |
| Year Tested | 2005 | 2008, 2010, 2011 | 2009, 2010, 2011 | 2011 |
| Results Available | 295 | 47 | 19 | 3 |
| Average | 15.6 | 14.4 | 13.0 | 15.3 |
| Minimum1 | 9.7 | 10.1 | 11.0 | 11.6 |
| Median | 15.3 | 14.0 | 12.8 | 12.6 |
| Maximum1 | 24.3 | 20.4 | 19.5 | 21.7 |
Notes:
| 1. | Minimum and maximum refer to softest and hardest values for the grindability test. |
| 2. | Drilled samples are from the Pebble West zone at a grind particle size of 1.4 mm or 14 mesh. |
Table 13‑4: Pebble West Ball Mill Data Comparison, SGS January 20122
| Description | BWi (kWh/t) |
|||
| Core Year | 2004 | 2005, 2006 | 2008 | 2011 |
| Composites | - | W1 to W177 | W178 to W394 | W395 to W445 |
| Year Tested | 2005 | 2008, 2010, 2011 | 2009, 2010, 2011 | 2011 |
| Results Available | 295 | 57 | 72 | 2 |
| Average | 14.2 | 14.0 | 13.4 | 11.7 |
| Minimum1 | 7.7 | 8.4 | 8.0 | 11.4 |
| Median | 14.0 | 13.7 | 12.7 | 11.7 |
| Maximum1 | 22.1 | 21.7 | 20.4 | 12.1 |
Notes:
| 1. | Minimum and maximum refer to softest and hardest values for the grindability test. |
| 2. | Drilled samples are from the Pebble West zone, at a grind particle size of 0.147 mm or 100 mesh for the 2005 tests, and 0.204 mm/65 mesh for the remaining tests. |
13.2.2 Bond Low Energy Impact Tests
Comminution testwork was carried out on samples collected between 2004 and 2010 summarized in the tables below. The testwork completed is considered to be representative of the deposit. Table 13-5 shows the Bond low-energy impact test results on Pebble West zone samples. The tests were completed by Philips Enterprises, LLC under the supervision of SGS Lakefield.
Table 13‑5: Bond Low-Energy Impact Test Results, SGS January 2012
| Energy Impacts | CWi (kWh/t) | Rock Density |
||
| Average | Minimum | Maximum | g/cm3 |
|
| Average | 9.9 | 5.3 | 17.8 | 2.52 |
| Minimum | 3.7 | 1.6 | 8.1 | 2.38 |
| Median | 10.0 | 5.3 | 17.7 | 2.54 |
| Maximum | 15.6 | 10.5 | 33.9 | 2.68 |
| Pebble Project | Page 133 |
| NI 43-101 Technical Report Update and Preliminary Economic Assessment | August 21, 2023 |
|
|
|
13.2.3 SMC Tests
The SAG mill comminution (SMC) test is to provide impact breakage parameters in a cost-effective means when a full drop weight test JK drop-weight test is not available due to the limited sample quantities. Additional SMC tests were conducted on Pebble West and Pebble East drill core samples in 2012. The major test results including the direct measurements of sample densities, JK drop-weight test index (DWi), the calculated JK drop weight test rock breakage parameters A x b, and the t10 values are summarized in Table 13-6 for Pebble West zone and Table 13-7 for Pebble East samples. The tested samples represent the relevant rock types for the west and east zones of the project. Test results since 2004 are also presented.
Table 13‑6: Major SMC Data Comparison on Pebble West Samples
| Core Years | DWi (kWh/m3) | A x b | t10@1kWh/t | Density (g/cm3) |
||||||||||
| 2005, 2006 | 2008 | 2011 | 2004 | 2005, 2006 | 2008 | 2011 | 2005, 2006 | 2008 | 2011 | 2004 | 2005, 2006 | 2008 | 2011 |
|
| Comp | W1 to W177 | W178 to W394 | W395 to W445 | - | W1 to W177 | W178 to W394 | W395 to W445 | W1 to W177 | W178 to W394 | W395 to W445 | - | W1 to W177 | W178 to W394 | W395 to W445 |
| Years Tested | 2008, 2010, 2011 | 2009, 2010, 2011 | 2011 | 2005 | 2008, 2010, 2011 | 2009, 2010, 2011 | 2011 | 2008, 2010, 2011 | 2009, 2010, 2011 | 2011 | 2005 | 2008, 2010, 2011 | 2009, 2010, 2011 | 2011 |
| Results Available | 53 | 64 | 15 | 47 | 53 | 64 | 15 | 53 | 64 | 15 | 47 | 53 | 64 | 15 |
| Average | 6.46 | 6.12 | 6.94 | 45.7 | 44.0 | 50.1 | 43.6 | 31.8 | 34.8 | 31.3 | 2.59 | 2.60 | 2.60 | 2.62 |
| Minimum | 2.74 | 1.79 | 2.61 | 98.3 | 89.4 | 135.2 | 98.9 | 46.5 | 62.3 | 48.1 | 2.49 | 2.43 | 2.38 | 2.44 |
| Median | 5.93 | 5.78 | 7.47 | 43.1 | 43.2 | 45.6 | 35.9 | 31.7 | 33.6 | 29.7 | 2.59 | 2.62 | 2.59 | 2.64 |
| Maximum* | 11.5 | 10.9 | 11.1 | 26.0 | 24.0 | 26.1 | 24.5 | 21.3 | 22.8 | 21.5 | 2.89 | 2.76 | 2.90 | 2.74 |
Notes: *Minimum and maximum refer to softest and hardest values for the grindability test.
Table 13‑7: Major SMC Data Comparison on Pebble East Samples
| Phase | DWi (kWh/m3) | A x b | t10@1kWh/t | Density (g/cm3) |
||||||||
| I | II | III | I | II | III | I | II | III | I | II | III |
|
| Results Available | 134 | 182 | 44 | 134 | 182 | 44 | 134 | 182 | 44 | 134 | 182 | 44 |
| Average | 4.93 | 6.16 | 3.88 | 57.9 | 45.7 | 75.3 | 40.1 | 33.1 | 46.2 | 2.61 | 2.59 | 2.59 |
| Minimum* | 1.69 | 2.59 | 1.61 | 150 | 98.3 | 158.8 | 68.8 | 51.2 | 70.6 | 2.50 | 2.49 | 2.53 |
| Median | 4.85 | 6.04 | 3.79 | 54.3 | 43.1 | 68.1 | 39.5 | 32.3 | 45.0 | 2.61 | 2.59 | 2.58 |
| Maximum* | 8.81 | 10.3 | 6.3 | 30.0 | 26.0 | 41.5 | 25.9 | 22.7 | 31.6 | 2.87 | 2.89 | 2.69 |
Notes: * Minimum and maximum refer to softest and hardest values for the grindability test. Source SGS Summary Report, 2014.
13.2.4 MacPherson Autogenous Grindability Tests
Two variable samples from the Pebble West zone were blended to represent the global average for this zone and sent to SGS Lakefield for MacPherson autogenous grindability tests. The test results are shown in Table 13-8. The composite sample was categorized as medium with respect to the throughput rate, the specific energy input, and the final grind. The composite sample is near the median of the Pebble West distribution for A x b, DWi and BWi.
| Pebble Project | Page 134 |
| NI 43-101 Technical Report Update and Preliminary Economic Assessment | August 21, 2023 |
|
|
|
Table 13‑8: MacPherson Autogenous Grindability Test Results, SGS, January 2012
| Sample | Feed Rate (kg/h) | F80 (µm) | P80 (µm) | Gross Work Index (kWh/t) | Correlated Work Index (kWh/t) | Gross Energy Input (kWh/t) | Hardness Percentile |
| W214/215 | 12.4 | 22,176 | 331 | 13.6 | 12.6 | 6.5 | 31 |
13.3 Flotation Concentration Tests
Focusing on the on-site production of three final products, namely copper-gold concentrate, molybdenum concentrate, and gold gravity concentrate, flotation tests conducted on Pebble materials since 2011 primarily consisted of the following:
| · | bulk flotation to produce a copper-molybdenum flotation concentrate with associated gold and rhenium; |
|
|
|
| · | molybdenum flotation to produce the final copper-gold concentrate and molybdenum concentrate; and |
|
|
|
| · | pyrite flotation with the concentrate being subjected to cyanide leaching; Other separation techniques were also tested at a preliminary level to optimize metal recoveries and concentrate grades, including: |
|
| o | GRG tests (refer to Section 13.4) |
|
|
|
|
|
| o | sulphidization, acidification, recycling, and thickening (SART) process tests to recover copper from leaching circuit residue (SART test results are not included due to removing cyanide applications in the process design) |
|
|
|
|
|
| o | pressure oxidation tests conducted on molybdenum flotation concentrates to recover molybdenum and rhenium (refer to Section13.5). |
13.3.1 Recovery of Bulk Flotation Concentrate
13.3.1.1 Flotation Kinetics and Preliminary Optimization
In 2011 and 2012 test programs, SGS Lakefield investigated flotation kinetic properties. Both rougher flotation and first cleaner flotation were tested on various samples, with pH value, reagent type/dosage/addition points and pulp density factors varied in order to determine optimized conditions for subsequent batch cleaner and locked-cycle tests.
The 2011 program focused on bulk rougher kinetics tests on composite samples representing supergene and hypogene rock types. The 2012 program included rougher flotation kinetics on the individual variability sample W182, representing supergene, and four domain composite samples, namely K-silicate, supergene, sodic potassic and illite-pyrite. Additional first cleaner kinetics was also investigated on the four domain samples.
The observations from the two programs are summarized as follows:
| · | Rougher pH level (SGS Lakefield, 2011) |
|
| o | By increasing pH values of the rougher flotation stage to 8.5, metal recoveries to rougher concentrate can be significantly increased. |
|
|
|
|
|
| o | This was attributed to the low average natural pH value of the four sample types (i.e., 5.8, 5.7, 7.2 and 6.2). |
| Pebble Project | Page 135 |
| NI 43-101 Technical Report Update and Preliminary Economic Assessment | August 21, 2023 |
|
|
|
| · | Rougher reagent dosage and addition points (SGS Lakefield, 2011) |
|
| o | A rougher flotation collector comparison was made between using only potassium ethyl xanthate (PEX) as the collector versus PEX with the promoter (AERO 3894) added. It was observed that metal recoveries increased for supergene with the addition of AERO 3894; however, metal recovery increases were not demonstrated for other samples. |
|
|
|
|
|
| o | Collector dosages for PEX and AERO 3894 were tested at 27.5 g/t and 45 g/t, respectively. The results indicated that adding 27.5 g/t PEX was sufficient for the first two rougher stages. The optimized retention time is 12 minutes for the rougher stage. |
| · | Rougher sulphidization (SGS Lakefield, 2012) |
|
| o | Tests on sample W182 were performed to investigate the effect in the rougher stage of using sodium hydrosulphide (NaHS) to achieve a target of a reduction potential (-140 mV measured with silver/silver cleaner) electrode. There were no observed effects on metal recoveries to the rougher concentrate. |
| · | Rougher pulp density (SGS Lakefield, 2011-2012) |
|
| o | Tests on one composite sample indicated that reducing pulp density from 30 to 25% improved gold and molybdenum recovery significantly, while copper recovery was unaffected. |
| · | Flotation rate (SGS Lakefield, 2011-2012) |
|
| o | The supergene sample was found to be the slowest to recover copper, gold and molybdenum in the rougher flotation stage and the K-silicate sample the fastest. The indicated retention time for rougher flotation is 12 minutes. At the first cleaner stage, all samples presented similar flotation rates in terms of copper recovery, with the molybdenum recovery rate being the slowest. The retention time indicated by the tests for first cleaner flotation is six minutes. |
13.3.1.2 Flotation Tests on Variability Samples
SGS Lakefield conducted significant flotation testwork since mid-2009 on both the Pebble West and Pebble East zones. The baseline flowsheet is shown in Figure 13-1. The target pH value for the rougher flotation stage was set at 8.5, and the P80 feed particle size was 200 µm. The regrind size, reagent dosage and types and pH levels in the cleaner flotation stage were varied across the testwork in order to determine the optimal copper grade of the bulk concentrate.
| Pebble Project | Page 136 |
| NI 43-101 Technical Report Update and Preliminary Economic Assessment | August 21, 2023 |
|
|
|
Figure 13‑1: Basic Testwork Flowsheet

Note: Figure prepared by SGS Lakefield, 2011.
SGS Lakefield conducted batch cleaner tests on 146 variability samples from the Pebble West and Pebble East zones. The variability samples represented the flotation geometallurgical domains as described in Section 13.9.2 and should be considered representative of the mineralized material. Five of the variable batch cleaner tests were performed on the low copper grade samples. At an average feed grade of 0.16% copper, a bulk concentrate containing 29.3% copper can be recovered at a 68.1% recovery. This indicates that a saleable concentrate can be produced from low-grade mineralized material.
SGS Lakefield also performed locked-cycle tests on 107 variability samples from the Pebble West and Pebble East zones, the results of which are summarized in Table 13-9. The average metal recoveries were higher than with the batch tests, while the metal grades of the concentrates were slightly lower. Three duplicate locked-cycle tests were performed, with results in a similar range to those obtained from the variable locked-cycle tests.
| Pebble Project | Page 137 |
| NI 43-101 Technical Report Update and Preliminary Economic Assessment | August 21, 2023 |
|
|
|
Table 13‑9: Summary of Locked-Cycle Test Variability Test Results
| Domain | Feed Properties | 3rd Cl Average Grade | 3rd Cl Average Rec |
|||||||||
| Py(%) | Cpy (%) | Py: Cpy | Cu (%) | Au (g/t) | Mo (%) | Cu (%) | Au (g/t) | Mo (%) | Cu (%) | Au (%) | Mo (%) |
|
| Supergene Illite Pyrite | 6.8 | 0.8 | 7.0 | 0.33 | 0.4 | 0.011 | 24.1 | 37.7 | 0.8 | 64.3 | 36.0 | 61.0 |
| Supergene Sodic Potassic | 3.3 | 1.0 | 4.0 | 0.48 | 0.42 | 0.016 | 30.7 | 19.6 | 0.8 | 75.4 | 53.8 | 54.7 |
| Hypogene Illite Pyrite | 6.4 | 1.0 | 6.3 | 0.36 | 0.43 | 0.015 | 27.2 | 18.3 | 1.1 | 83.8 | 44.2 | 77.3 |
| Hypogene Sodic Potassic | 3.7 | 1.0 | 4.8 | 0.35 | 0.38 | 0.024 | 27.5 | 19.5 | 1.8 | 84.6 | 55.6 | 79.8 |
| Hypogene K-Silicate | 3.1 | 2.3 | 1.9 | 0.63 | 0.62 | 0.024 | 27.6 | 21.4 | 1.2 | 90.8 | 59.6 | 88.4 |
| Hypogene Sericite | 8.3 | 1.9 | 6.1 | 0.66 | 0.36 | 0.031 | 25.1 | 7.6 | 1.3 | 82.5 | 41.9 | 82.0 |
| Hypogene Quartz-Sericite-pyrite | 11.8 | 2.2 | 6.9 | 0.58 | 0.33 | 0.036 | 25.7 | 5.7 | 1.6 | 86.0 | 33.0 | 85.6 |
| Hypogene Quartz Pyrophyllite | 18.1 | 5.0 | 3.7 | 1.51 | 0.83 | 0.027 | 30.5 | 11 | 0.5 | 93.6 | 60.9 | 84.5 |
Definitions: cleaner (Cl), pyrite (Py), chalcopyrite (Cpy), pyrite to chalcopyrite ratio (Py: Cpy), Recovery (Rec)
Samples from 10 locked cycle tests were submitted for rhenium and silver assays to complete a mass balance. The recoveries of rhenium and silver to the 3rd cleaner concentrate was calculated as 73.4% and 62.7%, respectively, as shown in Table 13-10. A linear relationship between the recovery of molybdenum and rhenium can be observed on the ten sets of data. This can be attributed to the rhenium occurrence as a solid substitution for molybdenite atoms on the molybdenite lattice structure (SME, 2018).
Table 13‑10: Locked-Cycle Test Results on Pebble Variability Samples, SGS Lakefield, 2014
| Test #/Composite | Cu/Mo Concentrate Grade, %, g/t | Cu/Mo Concentrate Recovery % |
||||||||
| Cu | Au | Mo | Ag | Re | Cu | Au | Mo | Ag | Re |
|
| LCT1/W182 | 28.8 | 12.3 | 0.38 | 69 | 9.7 | 67.2 | 41.4 | 43.8 | 29.6 | 42.0 |
| LCT4/W265 | 30.5 | 33.9 | 0.67 | 76 | 10.0 | 82.2 | 68.6 | 68.6 | 48.9 | 58.5 |
| LCT7/W223 | 27.3 | 21.7 | 0.7 | 60 | 18.4 | 72.7 | 67.8 | 74.7 | 62.9 | 76.3 |
| LCT41/W181 | 31.9 | 24.6 | 0.31 | 90 | 6.0 | 73.0 | 56.5 | 51.5 | 62.9 | 45.9 |
| LCT62/V101 | 31.2 | 11.4 | 0.45 | 74 | 5.3 | 93.0 | 64.9 | 82.2 | 80.8 | 83.2 |
| LCT63/V102 | 29.5 | 10.6 | 0.51 | 81 | 8.2 | 94.2 | 56.9 | 86.7 | 81.4 | 87.8 |
| LCT64/V130 | 24.2 | 18.0 | 1.80 | 104 | 32.8 | 89.3 | 61.1 | 96.4 | 74.7 | 96.3 |
| LCT66/V222 | 24.8 | 3.8 | 2.07 | 82 | 33.1 | 83.9 | 29.1 | 89.9 | 73.0 | 91.0 |
| LCT69/V263 | 24.3 | 6.0 | 1.40 | 65 | 26.3 | 84.2 | 35.7 | 67.0 | 63.1 | 71.0 |
| LCT89/W312 | 18.0 | 11.6 | 1.05 | 99 | 22.1 | 56.2 | 37.7 | 77.5 | 49.6 | 82.4 |
| Pebble Project | Page 138 |
| NI 43-101 Technical Report Update and Preliminary Economic Assessment | August 21, 2023 |
|
|
|
13.3.1.3 Flotation Tests Optimization
SGS Lakefield made a few attempts to improve the copper grade in the obtained bulk concentrate for samples with high clay and/or pyrite/chalcopyrite content. SGS Lakefield observed that:
| · | Adding sodium silicate did not appear to have a beneficial impact on the selectivity of metal recovered to rougher flotation concentrate. |
|
|
|
| · | Reducing pulp density from 35% to 28% solids improved metal recoveries, especially with molybdenum. |
|
|
|
| · | For samples high in pyrite, adding dextrin helped to achieve the desired 26% copper of bulk concentrate copper-gold-molybdenum; however, it was also noted that extra fuel oil will be required when adding dextrin. SGS Lakefield also recommended considering a ratio of sulphur to copper of greater than 10 to identify if dextrin addition is required. |
|
|
|
| · | The effects of regrind size, and pulp temperature were further investigated in batch cleaner flotation tests and in the locked-cycle tests. The testwork was performed by SGS Lakefield in both 2011 and 2012, resulting in the following major conclusions: the investigated regrind size P80 of 15 to 58 µm had little impact on copper recovery or grades, while a finer regrind size benefitted both gold and molybdenum recovery. |
|
|
|
| · | There was no observed impact from changing the pulp temperature from 5°C to 25°C on flotation recoveries. |
SGS Lakefield also compared two other frothers (HP700 and W22 C) with the primary frother, methyl isobutyl carbinol (MIBC). SGS Lakefield found that the HP700 froth bed was less stable than that of the MIBC; W22 C showed better molybdenum recovery, and a lower dosage produced similar metal recoveries. SGS Lakefield also compared the lower cost collector sodium ethyl xanthate (SEX) with PEX and concluded that interchanging SEX and PEX had no effect on metal recoveries.
13.3.1.4 Flotation Tests on Bulk Composites
As part of SGS Lakefield’s 2011 test program, bulk flotation tests on a locked-cycle scale were conducted on illite-pyrite, carbonate and supergene composites. The purpose of this testwork was to produce large quantities of products that could be used for vendor testwork. It should be noted that the carbonate composite sample was an early geometallurgical domain type classification and was redefined as sodic potassic in later geometallurgical studies. The locked-cycle test results are shown in Table 13-11. SGS Lakefield observed that the illite-pyrite composite did not reach the target copper grade of 26%. SGS suspected this may be caused by a low head grade and the presence of high levels of pyrite and clay minerals.
Table 13‑11: Locked-Cycle Test Results of Bulk Samples, SGS Lakefield, 2012
| Composite | Regrind Size P80 µm | Cu/Mo Concentrate Grade | Cu/Mo Concentrate Recovery |
|||||
| Cu (%) | Au | Mo (%) | Cu (%) | Au (%) | Mo (%) |
|||
| (g/t) | (oz/ton) |
|||||||
| Illite-Pyrite | 28 | 10.4 | 11.2 | 0.327 | 0.20 | 77.0 | 40.3 | 34.9 |
| Carbonate | 37 | 28.4 | 10.7 | 0.312 | 1.25 | 79.4 | 43.5 | 59.8 |
| Supergene | 38 | 27.1 | 16.0 | 0.467 | 1.64 | 70.6 | 47.3 | 70.0 |
13.3.1.5 Continuous Flotation Tests on Composites
A continuous flotation plant was utilized on five composite samples from the Pebble deposit to generate additional quantities of sample for vendor testwork. The five composites ranged in head grade from 0.28 to 0.57% Cu, from 0.30 to 0.46 g/t Au, and from 0.010 to 0.028% Mo. The main purpose of this continuous flotation testwork was to generate product for downstream testwork and to evaluate the implementation of a gravity circuit on a portion of the feed to the regrind mill. A continuous flotation plant was utilized on five composite samples from the Pebble deposit to generate additional quantities of sample for vendor testwork. The five composites ranged in head grade from 0.28 to 0.57% Cu, from 0.30 to 0.46 g/t Au, and from 0.010 to 0.028% Mo.
| Pebble Project | Page 139 |
| NI 43-101 Technical Report Update and Preliminary Economic Assessment | August 21, 2023 |
|
|
|
The pilot plant was completed over a series of day shifts and continuous runs. Overall, 28 runs were completed: 17 on the commissioning composite representing first years of operation, 3 on the sodic potassic, 2 on the K-silicate, 3 on the supergene, and 3 on the illite pyrite composites. The additional water generated by incorporation of the Knelson concentrator (gravity circuit) was managed by using a thickener to treat the gravity tailings stream. Any further continuous testwork would ideally be completed on a higher feed rate and a sufficient amount of operation time reserved for reagent optimization.
The continuous flotation results for the K-Silicate composite were close to the locked cycle test results, with the exception that molybdenum recoveries were slightly lower. The continuous flotation copper recovery for the supergene composite was higher compared to the locked cycle test result. For the remaining three composites, copper and gold recoveries were 7% lower, on average. Except for the supergene composite, molybdenum losses to the rougher tail were almost twice as high as in the locked cycle test. Final concentrate molybdenum recoveries were almost half the LCT recoveries. The molybdenum recovery to the final concentrate would likely improve with longer retention times in the 2nd and 3rd cleaning stages.
One of the main purposes of the pilot plant was to determine the amount of gold that could be recovered by adding a Knelson concentrator in the regrind circuit. The Knelson concentrator treated a 33% bleed stream from the regrind cyclone underflow. The average gold recovery to the Knelson concentrate ranged from 2.6% for the Supergene composite to 7.5% for the K-silicate composite. A comparison of metallurgical performance with and without the Knelson concentrator indicated similar overall gold recoveries to a 26% copper-gold concentrate.
13.3.2 Separation of Molybdenum and Copper
Separation of molybdenum from copper in the bulk flotation concentrate was tested by SGS Lakefield in the 2011 and 2012 programs. In addition, G&T also performed separation tests on one sample in 2011.
13.3.2.1 SGS Lakefield Separation Work, 2011 and 2012
Preliminary separation tests for molybdenum and copper were performed on three composite samples, including illite-pyrite, carbonate, and supergene (SGS Lakefield, 2011). The locked-cycle tests in the 2011 program employed a basic flowsheet, as shown in Figure 13-2. The cycle numbers were varied in order to achieve the target grade of a final molybdenum concentrate.
The 2011 program results outlined in Figure 13-2 show that only the carbonate composite achieved a molybdenum grade of 50%, while the other two composite samples were unable to produce a marketable molybdenum product. Increasing the locked cycles from 3 to 6 for the illite-pyrite composite produced only a marginal increase in molybdenum grade.
As part of the 2012 testing program, further tests to improve the molybdenum separation were conducted on four domain samples. The commissioning sample, which represented the sodic potassic domain, was used to optimize the flotation conditions required for copper-molybdenum separation. A series of open cycle and kinetic tests were conducted to establish the conditions for the commissioning composite locked cycle test. Results of the locked cycle tests are provided also in Table 13-12.
| Pebble Project | Page 140 |
| NI 43-101 Technical Report Update and Preliminary Economic Assessment | August 21, 2023 |
|
|
|
Locked cycle test results for the latter three composites were found to be below expectations. It should be noted that the locked cycle tests conducted on the illite pyrite, sodic potassic and supergene composites were carried out without the open cycle tests to confirm conditions (due to their smaller mass compared to the commissioning composite), and by a different flotation operator than previous. Molybdenum head grades of the bulk cleaner concentrates from the three problematic domain samples were also below typical values achieved in locked cycle tests which may have contributed to the poor results. Further investigation confirmed that major molybdenum loss occurred in the rougher circuit.
| Pebble Project | Page 141 |
| NI 43-101 Technical Report Update and Preliminary Economic Assessment | August 21, 2023 |
|
|
|
Figure 13‑2: Basic Testwork Flowsheet
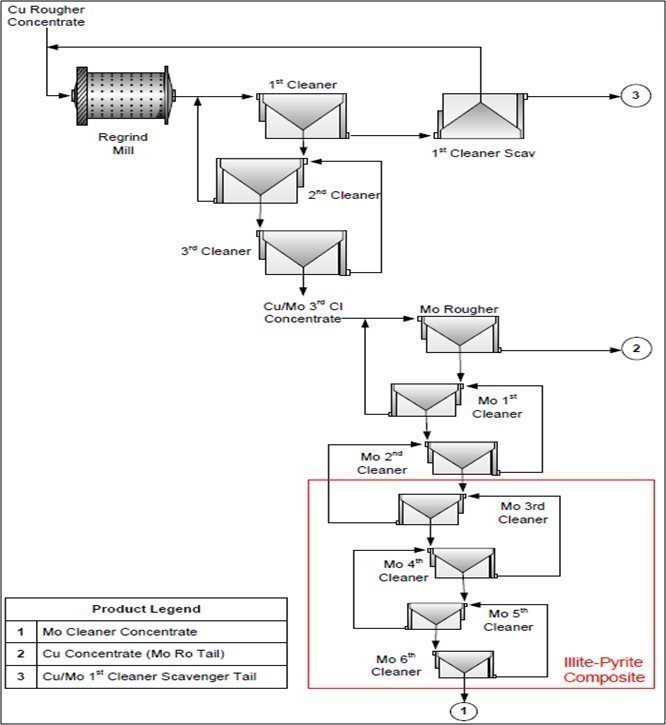
Note: Figure prepared by SGS Lakefield, 2011.
| Pebble Project | Page 142 |
| NI 43-101 Technical Report Update and Preliminary Economic Assessment | August 21, 2023 |
|
|
|
Table 13‑12: Locked-Cycle Test Results of Molybdenum Flotation
| Composite | Regrind Size P80 µm | Mo Concentrate | Cu Concentrate |
||||||||||
| Grade | Recovery % | Grade | Recovery % |
||||||||||
| Cu % | Au g/t | Mo % | Cu | Au | Mo | Cu % | Au g/t | Mo% | Cu | Au | Mo |
||
| SGS 2011 |
|||||||||||||
| Illite-Pyrite | 28 | 5.93 | 15.4 | 11.6 | 0.7 | 0.9 | 32.3 | 10.5 | 11.1 | 0.015 | 76.3 | 39.4 | 2.6 |
| Carbonate | 37 | 1.81 | 3.96 | 49.7 | 0.1 | 0.4 | 55.5 | 29.0 | 10.9 | 0.091 | 79.3 | 43.1 | 4.2 |
| Supergene | 38 | 3.46 | 3.84 | 38.7 | 0.4 | 0.5 | 68.9 | 28.1 | 16.5 | 0.027 | 70.2 | 46.8 | 1.1 |
| SGS 2012 |
|||||||||||||
| Commission | - | 1.86 | 2.12 | 48.2 | 0.2 | 0.3 | 92.7 | 21.8 | 11.2 | 0.068 | 99.8 | 99.7 | 7.3 |
| Sodic Potassic | - | 3.01 | N/A | 41.1 | 0.1 | N/A | 83.6 | 23.3 | N/A | 0.074 | 99.9 | N/A | 16.4 |
| Illite-Pyrite | - | 3.19 | N/A | 43.5 | 0.02 | N/A | 79.8 | 23.8 | N/A | 0.14 | 99.8 | N/A | 20.2 |
| Supergene | - | 2.42 | N/A | 43.8 | 0.1 | N/A | 86.9 | 29.8 | N/A | 0.078 | 99.9 | N/A | 13.1 |
Note: Prepared by SGS Lakefield, 2011-2012.
Addition of the flotation reagent sodium hydrosulfide (NaHS) in the rougher stage was found to be too high, resulting in unacceptable molybdenum depression. Adding a scavenger stage to the rougher flotation resulted in significant improvements in molybdenum recovery of 15% for the sodic potassic composite, and over 30% for the illite pyrite composite. The scavenger tests were not conducted for the supergene composite due to lack of sample.
13.3.2.2 G&T Separation Work
G&T tested molybdenum recovery from bulk flotation concentrate, using one sample of copper-molybdenum bulk concentrate (G&T 2011). The head analysis indicated that the bulk concentrate had high levels of pyrite (13.2%) and galena (0.5%). Due to the limited sample size, only two batch cleaner tests were performed on the bulk concentrate sample. A regrind stage was used in Test 1, while no regrinding was performed in Test 2. The test results are summarized in Table 13-13.
Test 1 and Test 2 results were 50.6% and 47.6% for molybdenum grades in the final molybdenum concentrates, and recoveries were 76.2% and 74.7% molybdenum, respectively. G&T recommended further testing be considered, including locked-cycle tests and other potential reagent schedules.
Table 13‑13: Molybdenum Recovery
| Description | Regrind Size P80 µm | Grade | Recovery |
|||||
| Cu (%) | Au | Mo (%) | Cu (%) | Au (%) | Mo (%) |
|||
| (g/t) | (oz/ton) |
|||||||
| Test 1 | 33 | - | - | - | - | - | - | - |
| Molybdenum Concentrate | - | 1.45 | 2.36 | 0.0689 | 50.6 | 0.1 | 0.2 | 76.2 |
| Molybdenum 3rd Cl Tail | - | 12.9 | 18.9 | 0.552 | 12.1 | 0.1 | 0.2 | 3.0 |
| Molybdenum 2nd Cl Tail | - | 24.2 | 35.4 | 1.034 | 3.89 | 1.2 | 3.1 | 6.9 |
| Molybdenum 1st Cl Tail | - | 24.3 | 27.7 | 0.809 | 1.47 | 5.3 | 10.4 | 11.3 |
| Molybdenum Ro Tail | - | 26.3 | 14.2 | 0.415 | 0.02 | 93.3 | 86.2 | 2.6 |
| Pebble Project | Page 143 |
| NI 43-101 Technical Report Update and Preliminary Economic Assessment | August 21, 2023 |
|
|
|
| Description | Regrind Size | Grade | Recovery |
|||||
|
Cu (%) | Au | Mo (%) | Cu (%) | Au (%) | Mo (%) |
|||
| P80 µm | (g/t) | (oz/ton) |
||||||
| Test 2 | 49 | - | - | - | - | - | - | - |
| Molybdenum Concentrate | - | 2.74 | 3.92 | 0.114 | 47.6 | 0.1 | 0.3 | 74.7 |
| Molybdenum 3rd Cl Tail | - | 14.8 | 21.2 | 0.619 | 8.18 | 0.1 | 0.2 | 1.4 |
| Molybdenum 2nd Cl Tail | - | 21.3 | 38.4 | 1.12 | 5.51 | 0.5 | 1.5 | 4.3 |
| Molybdenum 1st Cl Tail | - | 27.9 | 28.4 | 0.829 | 0.80 | 3.6 | 6.5 | 3.6 |
| Molybdenum Ro Tail | - | 26.0 | 13.9 | 0.406 | 0.12 | 95.8 | 91.5 | 16.0 |
Source: G&T, 2011.
13.3.3 Rhenium Recovery into Molybdenum Concentrate
Rhenium was shown to report to the molybdenum concentrate in molybdenum flotation process. A rhenium mass balance was reported by SGS Lakefield in 2012 with the test results of an open circuit batch molybdenum cleaner flotation test (Mo-F13), as shown in Table 13-3. Figure 13-3 presents the rhenium recovery and grade data. Rhenium grade of over 900 g/t was observed in the 5th and 6th cleaner molybdenum concentrates. A linear relationship is also noticed between molybdenum recovery and rhenium recovery.
Table 13‑14: Open Cycle Cleaner Flotation Test Results (Mo-F13, SGS Lakefield, 2012)
| Products | Weight | Assays | Distributions |
|||||||
| (g) | (%) | Cu (%) | Mo(%) | Au (g/t) | Re (g/t) | Cu (%) | Mo (%) | Au (%) | Re (%) |
|
| Mo 6th Cl Conc | 42.9 | 1.21 | 1.59 | 49.0 | 1.75 | 926 | 0.1 | 69.2 | 0.2 | 71.4 |
| Mo 6th Cl Tail | 2.5 | 0.07 | 3.69 | 40.8 | 2.17 | 759 | 0 | 3.4 | 0 | 3.4 |
| Mo 5th Cl Tail | 5.1 | 0.14 | 5.76 | 33.9 | 3.79 | 651 | 0 | 5.7 | 0.1 | 6 |
| Mo 4th Cl Tail | 3.2 | 0.09 | 11 | 18.1 | 7.82 | 341 | 0 | 1.9 | 0.1 | 2 |
| Mo 3rd Cl Tail | 6.5 | 0.18 | 18.6 | 8.29 | 14.3 | 163 | 0.2 | 1.8 | 0.2 | 1.9 |
| Mo 2nd Cl Tail | 17.4 | 0.49 | 30.1 | 2.85 | 17.6 | 47.6 | 0.7 | 1.6 | 0.8 | 1.5 |
| Mo 1st Cl Scav Conc | 7.9 | 0.22 | 14.7 | 18.6 | 12.9 | 364 | 0.2 | 4.8 | 0.3 | 5.2 |
| Mo 1st Cl Scav Tail | 104.3 | 2.94 | 25 | 0.58 | 15.2 | 13.1 | 3.6 | 2 | 4.2 | 2.5 |
| Rougher Sc Conc | 116.9 | 3.3 | 23.8 | 1.24 | 13.3 | 24 | 3.9 | 4.8 | 4.2 | 5 |
| Rougher Scav Tail | 3235.5 | 91.3 | 20.2 | 0.046 | 10.4 | <0.2 | 91.2 | 4.9 | 89.9 | 1.2 |
| Head (calc.) | 3542.2 | 100 | 20.2 | 0.86 | 10.6 | 15.7 | 100 | 100 | 100 | 100 |
| Pebble Project | Page 144 |
| NI 43-101 Technical Report Update and Preliminary Economic Assessment | August 21, 2023 |
|
|
|
Figure 13‑3: Rhenium Grade and Recovery Relationship
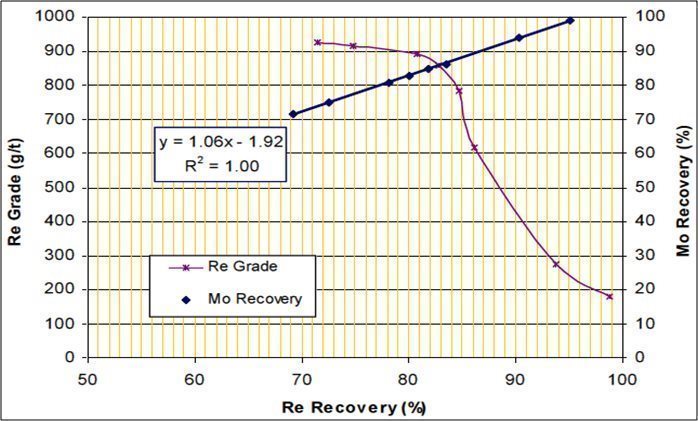
Note: Figure prepared by SGS Lakefield, 2012.
13.3.4 Pyrite Flotation
The purpose of a pyrite flotation is to concentrate gold-bearing sulphide minerals prior to a subsequent leach process to recover additional precious metals.
A pyrite flotation step was included as part of the locked cycle variability tests. The pyrite flotation stage gold recoveries from the initial samples were found to be highly variable in a four-minute laboratory flotation process. In order to optimize the pyrite flotation metallurgy, SGS Lakefield performed a series of kinetics tests on the first scavenger tailings samples generated from four domain composite samples. Results of the tests are summarized in Figure 13-4 which shows the optimum laboratory flotation time occurs at eight minutes.
| Pebble Project | Page 145 |
| NI 43-101 Technical Report Update and Preliminary Economic Assessment | August 21, 2023 |
|
|
|
Figure 13‑4: Pyrite Flotation Kinetics Test Results

Note: Figure prepared by SGS Lakefield, 2012.
13.4 Gold Recovery Tests
Both gravity concentration and cyanide leaching methods were investigated as part of metallurgical test program to recover gold from the mineralized samples.
13.4.1 Gravity Recoverable Gold Tests
Three composite samples, representing illite-pyrite, carbonate and supergene mineralization types, were tested for GRG potential in COREM’s facility (COREM, 2010). GRG tests were carried out on the variable samples reground to a target particle size P80 of 25 µm. Using a modified GRG test, the supergene sample had the highest GRG content of 33%, followed by illite-pyrite with 29% GRG and carbonate at 23%.
In 2011, four composite samples from the continuous testwork program were tested for gravity recoverable gold. K-silicate sample had the highest GRG potential at 49%, followed by sodic potassic (41%), supergene (33%), commissioning (26%), and illite pyrite (25%).
| Pebble Project | Page 146 |
| NI 43-101 Technical Report Update and Preliminary Economic Assessment | August 21, 2023 |
|
|
|
13.4.2 Gold Recovered from Leaching
Cyanide leaching testwork was carried out on the pyrite concentrates of various samples. Initial tests indicated that gold recovery can be significantly increased by an average of 15% when the pyrite concentrate particle size was reduced to a P80 of 10 µm (SGS Lakefield, 2011).
The pyrite concentrate regrind test was conducted showed the average power consumption as 48.7 kWh/t at a target P80 of 10 µm, and the average media consumption was 22.2 g/kWh.
Further cyanide leaching tests were carried out on the reground pyrite concentrate on variable samples (SGS 2012). The optimized leaching test conditions that gave the best gold, copper and silver extraction rates are summarized below:
| · | pre-oxidation with oxygen addition to 20 ppm before leaching |
|
|
|
| · | leaching pulp density of 33% solids |
|
|
|
| · | leaching pH 10.5 to 11.0 |
|
|
|
| · | cyanide concentration of 2 g/L. |
Variable sample cyanide leaching tests were performed under the optimized condition. The average extraction rates were 72.9% for gold, 72.8% for silver and 75.5% for copper with a 48-hour leaching period.
Bulk leaching test CN-51 was conducted under the same conditions with varied composite samples. The leaching kinetic properties are shown in Figure 13-5.
Carbon adsorption tests were carried out on commission composite samples as well as K-silicate composite samples. The observations are summarized as follows:
| · | Most leaching can be completed after 12 hours, but some concentrates benefited from a longer leach time of 24 to 48 hours, |
|
|
|
| · | The copper loading rate on carbon was higher than with gold or silver, 20 lb/ton from solution containing 4 to 4.5 g/L copper, 8 lb/ton from a 1.5 to 2.5 g/L copper solution. |
Leaching circuit simulations were performed by SGS, as described in their 2012 report. The simulations were based on 3,300 US GPM slurry feed of low-copper commissioning composite samples, high-copper commissioning samples, and K-silicate composite samples. From the simulation results, it was noticed that:
| · | A total of 24 hours should be allowed for leaching and carbon adsorption, |
|
|
|
| · | At least 6 to 10 hours of leaching is required before the first carbon adsorption for optimum carbon adsorption; this results in a hybrid leaching plant of carbon-in-pulp (CIP) + CIL arrangement, |
|
|
|
| · | A minimum of six adsorption tanks are required due to the slow carbon adsorption kinetics of gold and silver. Additional tanks will be required if targeting less than 0.01 ppm gold in barren solution, |
|
|
|
| · | The carbon adsorption tanks will require a relatively high carbon inventory of 38.5 ton per stage, and |
|
|
|
| · | The efficiency of the gold stripping plant should be maintained at over 95% to prevent gold loss when recycling back to the leaching circuit. |
| Pebble Project | Page 147 |
| NI 43-101 Technical Report Update and Preliminary Economic Assessment | August 21, 2023 |
|
|
|
Figure 13‑5: Bulk Cyanidation Silver Extraction Kinetics
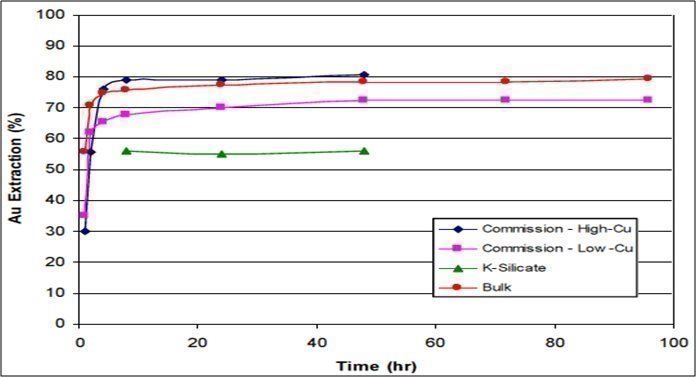
Note: Figure prepared by SGS Lakefield, 2012.
13.5 SART Process (Sulphidization, Acidification, Recycling, Thickening)
SGS tested SART potential to recover the dissolved copper in the leaching circuit. SART lab tests were performed on both high- and low-copper pyrite concentrates. For the high-copper sample, the lowest copper concentration in the final solution was lower than 10 ppm from the original 3,130 ppm. With the low-copper sample, the concentration of copper dropped from 1,810 ppm to 3 ppm.
The test conditions for the two optimized results within this test range were as follows:
| · | addition of sulphuric acid (H2SO4) to reach a pH value of 4.0, and |
|
|
|
| · | addition of the reagent NaHS at 130% of the stoichiometric ratio. |
13.6 Cyanide Destruction
SGS tested cyanide destruction with the Inco sulphur dioxide (SO2/air) destruction process on various composite samples. It was observed that, when the sample had a high concentration of weak acid dissociable cyanide (CNWAD) of 1,680 mg/L, a long retention time of six hours was required to achieve a CNWAD of 1.0 mg/L in the treated solution. However, when the CNWAD concentration in the feed sample was reduced to 400 ppm, the required retention time fell to two hours to achieve a CNWAD of less than 0.1 mg/L in the treated solution.
| Pebble Project | Page 148 |
| NI 43-101 Technical Report Update and Preliminary Economic Assessment | August 21, 2023 |
|
|
|
13.7 Auxiliary Tests – Concentrate Filtration
Outotec tested the filtration rates and cake moisture on a copper-gold concentrate sample (Outotec, 2011). Three tests with varied pumping times were performed at Outotec’s laboratory. With a feed solids density of 58 to 60% by weight, the cake moisture for all three tests was less than 9%. The measured filtration rate was between 569 and 663 kg/ m2/h.
13.8 Quality of Concentrates
The results of the detailed assays obtained on all the variability locked cycle test copper/molybdenum 3rd cleaner concentrates were completed and reported in the 2014 SGS Lakefield report. Table 13-14 shows the major elements distributions. The median concentrations of the potentially payable elements in the final copper/molybdenum concentrates are 27.5% Cu, 15.5 g/t Au, 1.07% Mo, 20.2 g/t Re and 71 g/t Ag.
Table 13‑15: LCT Cu-Mo Concentrate Major Elements Analysis Results – SGS Lakefield, 2014
| Variability Samples | Cu (%) | Au (g/t) | Mo (%) | S (%) | Fe (%) | Re (g/t) | Ag (g/t) |
| Average | 27.1 | 16.9 | 1.26 | 34.6 | 29.9 | 23.7 | 75 |
| Minimum | 17.6 | 1.2 | 0.07 | 23.5 | 23.5 | 1.3 | 20 |
| Median | 27.5 | 15.5 | 1.07 | 34.4 | 29.9 | 20.2 | 71 |
| Maximum | 39.0 | 52.7 | 4.82 | 40.7 | 34.5 | 122.0 | 151 |
Note: Prepared by Lakefield, 2014.
The detailed elemental analysis was also completed on the copper-molybdenum concentrate samples of the variability locked cycle tests as reported in the 2014 SGS Lakefield report. The results indicate that the Pebble bulk concentrate will not be problematic in terms of deleterious elements. The assays showed that more than 90% of the 103 variability samples were below the penalty triggers for mercury, antimony, arsenic, and zinc, with the exception of 10 samples from illite pyrite and sodic potassic zones.
The elemental analysis of copper-gold concentrates and molybdenum concentrates from the copper/molybdenum separation testwork are listed in Table 13-15 and Table 13-16. The reported rhenium grade in the LCT molybdenum concentrate ranged from 791 to 832 g/t Re.
Table 13‑16: LCT Cu Concentrate Major Elements Analysis Results – SGS Lakefield, 2014
| Element | Cu (%) | Au (g/t) | Mo (%) | S (%) | Fe (%) | Re (g/t) | Ag (g/t) |
| Illite Pyrite | 23.0 | 10.2 | 0.026 | 36.1 | 31.8 | 0.4 | 91 |
| Supergene | 29.3 | 11.4 | 0.065 | 33.0 | 28.9 | 1.5 | 104 |
| Sodic Potassic | 24.0 | 8.54 | 0.011 | 36.2 | 33.1 | <0.2 | 37 |
| K-Silicate | 24.0 | 8.41 | 0.021 | 36.6 | 32.9 | 0.3 | 39 |
| Commission | 21.2 | 10.6 | 0.032 | 35.0 | 32.1 | 0.5 | 80 |
| Pebble Project | Page 149 |
| NI 43-101 Technical Report Update and Preliminary Economic Assessment | August 21, 2023 |
|
|
|
Table 13‑17: LCT Mo Concentrate Major Elements Analysis Results – SGS 2014
| Element | Cu (%) | Au (g/t) | Mo (%) | S (%) | Fe (%) | Re (g/t) | Ag (g/t) |
| Illite Pyrite | 3.94 | 3.42 | 42.6 | 38.5 | 5.33 | 791 | 31.6 |
| Supergene | 2.45 | 3.87 | 43.7 | 34.0 | 3.84 | 832 | 23.2 |
| Sodic Potassic | 3.71 | 3.60 | 43.0 | 34.9 | 5.31 | 830 | 22.9 |
| K-Silicate | 2.53 | 1.34 | 50.9 | 36.7 | 3.34 | n/a | 11.1 |
| Commission | 1.94 | 2.12 | 47.8 | 35.9 | 3.37 | 812 | <40 |
13.9 Geometallurgy
13.9.1 Introduction
Geometallurgical studies were initiated by the Pebble Partnership in 2008 and continued through 2012. The principal objective of this work was to quantify significant differences in metal deportment, meaning the mineralogical association of a given metal that may result in variations in metal recoveries during mineral processing.
Characterization of the respective geometallurgical domains within the deposit was based on the acquisition of detailed mineralogical data determined using QEMSCAN® mineral mapping technology.
QEMSCAN® was used to form the basis for definition of the geometallurgical domains as follows:
| · | to determine the mineralogy of samples |
|
|
|
| · | to classify them by alteration assemblage |
|
|
|
| · | to assess variations in copper mineral speciation |
|
|
|
| · | to locate gold inclusions down to 1 µm in diameter and characterize their size, shape, composition and host mineralogy. |
The results of the geometallurgical studies indicate that the deposit comprises numerous geometallurgical domains. These domains are defined by distinct, internally consistent copper and gold deportment characteristics that correspond spatially with changes in silicate alteration mineralogy. Overall metal deportment reflects characteristics developed during both the initial stage of metal introduction that occurred during specific stages of alteration and subsequent redistribution by overprinting alteration types.
Chalcopyrite is the dominant copper mineral in most of the deposit. Bornite is a greatly subordinate component that is most abundant in advanced argillic alteration. Supergene mineralization, in the form of chalcocite and lesser bornite and covellite, forms rims on and partially replaces hypogene chalcopyrite in the near surface portion of the western half of the deposit, where mineralization was exposed subsequent to glaciation (there is no evidence for paleo-supergene effects in the eastern part of the deposit that is located beneath the post-hypogene rocks of the cover sequence). Hypogene pyrite is present in much of the supergene zone where it typically has been partially replaced by the supergene copper minerals. Molybdenum deportment does not vary appreciably across the deposit, and this metal occurs exclusively in the mineral molybdenite. The deportment of silver and palladium has not been studied in detail. Rhenium occurs as a substitution for molybdenum in the matrix of molybdenite, but the potential for spatial and temporal variations in the degree of substitution has not been studied.
| Pebble Project | Page 150 |
| NI 43-101 Technical Report Update and Preliminary Economic Assessment | August 21, 2023 |
|
|
|
Gold has a more variable deportment across the deposit than the other primary metals of economic interest, and this behaviour can be related directly to variations in predicted gold recoveries to different metallurgical products, as determined by metallurgical testwork. Gold occurs mostly as inclusions in chalcopyrite, pyrite, and to a much lesser extent, in silicate alteration minerals. The proportion of gold hosted by chalcopyrite, pyrite, and the silicate alteration minerals varies significantly between volumetric domains that were affected by different types or combinations of hydrothermal alteration (Gregory et al., 2013). The consequence of these differences in gold deportment is that different alteration domains exhibit different degrees of recovery to different processing materials, such as copper-gold concentrates versus pyrite concentrates versus silicate tailings. It is this knowledge of the relationship between hydrothermal alteration, as defined in a three-dimensional alteration model for the Pebble deposit, and the specific deportment of gold micro-inclusions that allows the spatial variations in gold recovery across the deposit to be modeled.
13.9.2 Description of Geometallurgical Domains
Hypogene mineralization in the Pebble deposit has been divided into seven geometallurgical domains, the boundaries of which correspond to the distribution of specific alteration types and their combination within the three-dimensional alteration model. The most volumetrically significant geometallurgical domains are the potassic (in some places referred to as K-silicate or potassium silicate) and sodic-potassic domains, whereas the illite-pyrite, QSP, quartz-pyrophyllite, sericite, and 8431M (see Section 13.9.2.7 for definition of this domain) domains are smaller. Two additional domains occur in the western part of the Pebble deposit where the sodic-potassic and illite-pyrite domains are overprinted by supergene alteration. These domains are being used to constrain the geometallurgical parameters in the resource block model. Specific metallurgical recoveries have been applied to each geometallurgical domain (see Section13.10).
13.9.2.1 Potassic Domain
The potassic domain is concentrated near the top of the main granodiorite pluton and its immediate host rocks in the eastern part of the deposit. Material in this domain is dominated by K-feldspar, quartz, and minor biotite, and has been variably overprinted by illite. The copper sulphide minerals are dominated by chalcopyrite, accompanied by a subequal concentration of pyrite and, more rarely, traces of sphalerite. Gold occurs dominantly as inclusions in chalcopyrite. This material type is volumetrically most important in the Pebble East zone and is predicted to have the best metallurgical response due to low clay and pyrite concentrations and a close association of gold with chalcopyrite.
13.9.2.2 Sodic-Potassic Domain
Material in the sodic-potassic domain is dominated by K-feldspar, quartz, albite, and biotite, accompanied by low concentrations of subequal illite and kaolinite. Chalcopyrite is the main copper sulphide mineral and the ratio of pyrite to chalcopyrite is moderate and a bit higher than in the potassic domain. The carbonates siderite and ferroan dolomite are also commonly present. Gold occurs as inclusions in both chalcopyrite and pyrite. It is the dominant geometallurgical domain in the western part of the deposit and extends to depth to the east, below the potassic domain. Supergene mineralization is present in the uppermost part of this domain in the western part of the deposit.
13.9.2.3 Illite-Pyrite Domain
The mineralogical characteristics of the illite-pyrite domain reflect successive, partial overprints of quartz-sericite-pyrite and later illite alteration on an early stage of well-mineralized sodic-potassic and/or potassic alteration. Illite-pyrite material is dominated by K-feldspar, quartz, illite and biotite. The illite-pyrite domain has a high concentration of pyrite and a high ratio of pyrite to chalcopyrite. This assemblage occurs in the shallow part of the eastern portion of the Pebble West zone and also extends to the east where it replaces potassic alteration below the cover sequence. Supergene mineralization affects the upper part of the illite-pyrite domain in the western part of the deposit that is not concealed by the younger cover sequence. Gold deports as inclusions both within early chalcopyrite that is part of the early sodic-potassic and potassic alteration, and to a greater extent in pyrite that formed during the later alteration overprints. The high clay and pyrite concentrations are expected to lead to processing challenges that could include the increase of reagent consumptions and/or the decrease of a flotation selectivity between copper minerals and pyrite. Additionally, the gold-pyrite association will result in a lower gold recovery to the final copper flotation concentrate compared to the sodic-potassic and potassic geometallurgical domains.
| Pebble Project | Page 151 |
| NI 43-101 Technical Report Update and Preliminary Economic Assessment | August 21, 2023 |
|
|
|
13.9.2.4 Quartz-Sericite-Pyrite Domain
The QSP domain occurs on the north and south margins of the alteration model. This alteration is a late-stage overprint around the margins of the deposit and is strongly grade destructive for copper, molybdenum, and gold that originally formed during earlier alteration types. This material is dominated by quartz and sericite, has a very high pyrite concentration, and contains very little chalcopyrite. As a consequence, both grade and recovery of this domain are very low, and it would form a part of the normal processing stream.
13.9.2.5 Quartz-Pyrophyllite Domain
The quartz-pyrophyllite domain is coincident with the distribution of quartz pyrophyllite alteration. It occurs in the easternmost part of the deposit where it has typically overprinted an older zone of potassic alteration with a very high concentration of quartz veins. This material is composed mostly of quartz, sericite, and pyrophyllite. -pyrophyllite assemblage. This domain has high concentrations of both pyrite (average 9.7 wt%) and chalcopyrite (average 3.8 wt%), along with very low concentrations of bornite. Gold mostly occurs as inclusions in chalcopyrite, with lesser amounts in pyrite and silicate alteration minerals. This is the highest-grade material in the deposit and has favourable gold deportment, but also has higher clay and pyrite concentrations.
13.9.2.6 Sericite Domain
The high-grade sericite domain is different to the very low-grade quartz-sericite-pyrite domain. The sericite domain is characterized by quartz, sericite, minor pyrophyllite, and variable concentrations of K-feldspar. This material occurs in two areas within the Pebble East zone. The main and most intense volume of sericite domain occurs south of the ZE fault and forms an envelope to the western side of the quartz-pyrophyllite domain. A second, much weaker and smaller area of sericite domains occurs in the Pebble East zone, just north of the ZE fault. The copper minerals are dominated by chalcopyrite accompanied by trace to minor bornite, digenite and covellite, traces of the arsenic-bearing sulphosalts enargite and tennantite, and trace sphalerite. The pyrite concentration is high but the pyrite to chalcopyrite ratio is moderate due to high copper grade. Gold inclusions occur in both chalcopyrite and pyrite, and to a much lesser extent in bornite and digenite. The domain has high concentrations of both clay and pyrite and variable gold deportment; this may have implications for mineral processing, but the high-tenor copper sulphides may yield a higher concentrate grade.
13.9.2.7 8431M Domain
The 8431M domain is a variant on the potassic domain. It occurs as a small volume of rock in the vicinity of drill holes 8431M and 11527 in the western part of the deposit and is surrounded by the sodic-potassic domain. The material contains abundant biotite and K-feldspar, lesser quartz and illite, and also contains a relatively higher concentration of magnetite similar to that found in altered diorite sills. The copper minerals are dominated by chalcopyrite and the concentration of pyrite is relatively low, yielding a lower-than-average pyrite to chalcopyrite ratio. The concentration of molybdenite is also very high. Metallurgical tests from hole 8431M have the highest gold recoveries in the western part of the deposit. This is unusual because most of the gold occurs as inclusions in pyrite, but it is believed that the larger grain size of the gold inclusions results in liberation and therefore higher than expected recovery. Because the 8431M geometallurgical domain is so small, it has been included with the surrounding sodic-potassic geometallurgical domain for modeling purposes.
| Pebble Project | Page 152 |
| NI 43-101 Technical Report Update and Preliminary Economic Assessment | August 21, 2023 |
|
|
|
13.9.2.8 Supergene Domains
A thin, irregular zone of supergene mineralization of variable thickness extends across the near-surface part of much of the western part of the deposit. The zone is characterized by weak enrichment of copper that manifests partial replacement of hypogene chalcopyrite and rimming of hypogene pyrite by supergene chalcocite and lesser bornite and covellite. Geometallurgically, supergene mineralization is defined as all material with cyanide soluble copper above 20%. Supergene effects overprint the near surface parts of the sodic-potassic and illite-pyrite domains in the western part of the deposit and require consideration as two additional geometallurgical domains.
13.10 Metal Recovery Projection
Metal recovery projections of copper, gold, silver, and molybdenum were completed in 2014 based on the review of 111 variability locked cycle test results on 103 samples. The projections were updated in 2018 to reflect the changes of the proposed processing methods for Pebble deposit, including the exclusion of a cyanide leach process and the implementation of a finer primary grind particle size to improve metal recoveries. The 2018 projections remain the same in this technical report, while a high-level recovery estimate of rhenium has been completed and is included.
13.10.1 Metal Projections of Copper, Gold Silver, and Molybdenum, 2014 and 2018
In 2014, a metal recovery projection was completed by Tetra Tech based on the variability locked-cycle flotation tests, variability cyanidation tests, and cyanide recovery (SART) tests on two commissioning samples. The overall metal recoveries of copper, gold, and silver consist of two parts with the majority via flotation concentration and a small portion from the gold plant, i.e., the cyanide leaching and SART processes. In 2018, as secondary gold recovery using cyanide was excluded from the proposed processing methods, the 2014 metal recovery projections were adjusted accordingly.
13.10.1.1 Metal Recovery Projection Basis, 2014-2018
The adjusted analysis to predict metal recoveries is summarized below, starting from the changes made in the analysis followed by the original analysis basis that is still applicable.
The following considerations were made in adjusting the metal recoveries:
| · | reducing the primary grind size P80 from 200 µm to 125 µm with corresponding improved metal recoveries, |
|
|
|
| · | adjusting the copper recovery by applying an average recovery increase of 0.5% per 10 µm reduction of primary grind size, |
|
|
|
| · | applying a similar same recovery change factor for gold, silver, and molybdenum, |
|
|
|
| · | a review of the 103 available samples, eight were excluded from the analysis – 5 of 8 because they were below the 0.20% Cu cut-off grade, and 3 of 8 because they were contaminated by drilling fluid, |
|
|
|
| · | the remaining 95 samples were used to determine copper, gold, and molybdenum recoveries, |
|
|
|
| · | silver recovery was based on a dataset of 10 samples due to incomplete silver assay data for the testwork, |
| Pebble Project | Page 153 |
| NI 43-101 Technical Report Update and Preliminary Economic Assessment | August 21, 2023 |
|
|
|
| · | locked cycle test recovery distributions were reviewed for each geometallurgical domain type to determine if domains could be grouped into similar recovery domains, |
|
|
|
| · | the outcome of this analysis established seven recovery domains for copper, six for gold, and seven for molybdenum, |
|
|
|
| · | recoveries were determined using the median value of each dataset, |
|
|
|
| · | copper-molybdenum separation efficiency was assumed to be 92.7% molybdenum recovery to the molybdenum concentrate, and |
|
|
|
| · | gold recovery included an incremental 1.0% for the gravity circuit. |
13.10.1.2 Effects of Primary Grind Size on Metal Recoveries
Four testwork programs were conducted in 2005 and 2006 by SGS Lakefield to investigate the impacts of the primary grind size on metal recoveries with different composite samples in rougher flotation, batch cleaner flotation and locked-cycle flotation tests. A general observation was made that higher metal recoveries can be obtained with a finer primary grinding size, with just a few exceptions that mainly resulted from the inconsistent test conditions. The primary size effect testing results are plotted and connected with trendline by SGS Lakefield as presented in Figure 13-6 to Figure 13-8.
Figure 13‑6: Effect of Primary Grind Fineness of Copper Recovery to Rougher Concentrate

Note: Figure prepared by SGS Lakefield, 2006.
| Pebble Project | Page 154 |
| NI 43-101 Technical Report Update and Preliminary Economic Assessment | August 21, 2023 |
|
|
|
Figure 13‑7: Effect of Primary Grind Size on Cu, Au, and Mo Recovery to Batch Copper-gold Concentrate

Source: SGS Lakefield, 2006.
| Pebble Project | Page 155 |
| NI 43-101 Technical Report Update and Preliminary Economic Assessment | August 21, 2023 |
|
|
|
Figure 13‑8: Cu, Au, and Mo Recovery into a 26% Batch Cu Concentrate

Source: SGS Lakefield, 2006.
| Pebble Project | Page 156 |
| NI 43-101 Technical Report Update and Preliminary Economic Assessment | August 21, 2023 |
|
|
|
The observed linear relationship between the primary grind size and metal recovery change was mathematically summarized by SGS Lakefield, in 2005 and 2006, as follows:
“Linear trendlines that were fitted to the data sets suggested that in only 4 cases the metal recovery improved with coarser grinds compared with 20 cases that produced inferior recoveries at a coarse grind. Metal losses of Cu, Au, and Mo typically ranged between 0.5% to 1.0% per 10 microns increase in grind size.”
Similar observations were obtained from the batch cleaner and locked cycle flotation tests as shown in Table 13-17 to Table 13-18. It can be noted that the metal recovery increase in the locked cycle flotation tests is lower as compared with the batch cleaner flotation tests. The average metal increase per 10 µm reduction of primary grind size from the locked cycle tests are 0.48% for copper, 0.15% for gold, and 0.34% for molybdenum.
Table 13‑18: Summary of Batch Recovery Change per 10 µm Primary Grind Size Reduction
| Composite | Product | Change per 10 µm Size Reduction (% Recovery) |
||
| Cu | Au | Mo |
||
| 2005G | Ro+Scav Concentrate | 0.62 | 0.24 | 0.53 |
| 2005Y | Ro+Scav Concentrate | 0.70 | 0.37 | 0.53 |
| 2006G | Ro+Scav Concentrate | 0.28 | 0.23 | 0.24 |
| 2006Y | Ro+Scav Concentrate | 0.50 | 0.22 | 0.40 |
| 2005G | Cu/Mo Concentrate | 0.62 | NA | 0.44 |
| 2005Y | Cu/Mo Concentrate | 0.86 | NA | 0.59 |
| 2006G | Cu/Mo Concentrate | 0.33 | NA | 0.51 |
| 2006Y | Cu/Mo Concentrate | 0.49 | NA | 0.44 |
Table 13‑19: Change in Metal Recovery for 101µm Primary Grind Size Reduction, P80 150 µm to 300 µm
| Composite | Product | Cu % | Au % | Mo % |
| PBA | Cu/Mo Concentrate | 0.38 | -0.46 | 0.59 |
| PBB | Cu/Mo Concentrate | 0.57 | 0.15 | 1.46 |
| PBC | Cu/Mo Concentrate | 0.54 | 0.68 | 0.31 |
| PBD | Cu/Mo Concentrate | 0.45 | -0.43 | 0.58 |
| PBE | Cu/Mo Concentrate | 0.34 | 0.01 | -0.1 |
| PBF | Cu/Mo Concentrate | 0.54 | 0.38 | 0.57 |
| PBA | Ro+Scav Concentrate | 0.84 | -1.05 | 0.84 |
| PBB | Ro+Scav Concentrate | 0.29 | 0.50 | 1.61 |
| PBC | Ro+Scav Concentrate | 0.41 | 0.34 | -0.01 |
| PBD | Ro+Scav Concentrate | 0.40 | 0.01 | 0.72 |
| PBE | Ro+Scav Concentrate | 0.79 | 0.31 | 0.70 |
| PBF | Ro+Scav Concentrate | 0.51 | 0.46 | 0.64 |
| Pebble Project | Page 157 |
| NI 43-101 Technical Report Update and Preliminary Economic Assessment | August 21, 2023 |
|
|
|
13.10.2 Metal Recovery Projection Results
The adjusted metal recoveries are presented in Table 13-20 excluding any incremental recovery of gold, silver and copper realized from the leaching circuit and SART process. The flotation recoveries are adjusted based on the previous projection but at a primary grind P80 of 135 µm.
Table 13‑20: Projected Metallurgical Recoveries Tetra Tech, 2021
| Domain | Flotation Recovery % |
|||||
| Cu Con, 26% Cu | Mo Con, 50% Mo |
|||||
| Cu | Au | Ag | Mo | Re |
||
| Supergene |
||||||
| Sodic Potassic | 74.7 | 60.4 | 64.1 | 51.2 | 70.8 |
|
| Illite Pyrite | 68.1 | 43.9 | 64.1 | 62.6 | 70.8 |
|
| Hypogene |
||||||
| Illite Pyrite | 91.0 | 46.2 | 67.5 | 77.1 | 70.8 |
|
| Sodic Potassic | 91.0 | 63.8 | 67.7 | 80.9 | 70.8 |
|
| Potassic | 93.0 | 63.1 | 66.0 | 84.8 | 70.8 |
|
| Quartz Pyrophyllite | 95.0 | 65.5 | 64.6 | 80.7 | 70.8 |
|
| Sericite | 91.0 | 41.3 | 67.5 | 77.1 | 70.8 |
|
| Quartz Sericite Pyrite | 90.5 | 33.3 | 67.5 | 86.8 | 70.8 |
|
| LOM Average | 87 | 60 | 67 | 75 | 71 |
|
Note: An additional 1% Au recovery to the gravity concentrate is expected.
The metallurgical testwork from 2011 to 2013 on the Pebble deposit indicates that significant rhenium can be recovered to the bulk copper-molybdenum flotation concentrate and further concentrated into the final molybdenum flotation concentrate. The overall rhenium recovery is determined by the rhenium recovery to the bulk copper-molybdenum concentrate and the separation efficiency of the rhenium into the molybdenum concentrate in the subsequent copper-molybdenum separation stages. The estimated rhenium recovery is 70.8% on average for all the domains based on the following considerations:
| · | The available rhenium distributions to the bulk copper/molybdenum concentrates are based on the 10 of the 111 LCT tests on variability samples. The average recovery was calculated as 73.4% representing five of the eight geometallurgical domains. |
|
|
|
| · | The application of a similar separation efficiency of molybdenum as of 92.7% in the copper-molybdenum separation to estimate the rhenium stage recovery, considering the significant linear relationship between the molybdenum and rhenium bulk and circuit recovery test data. |
The adjustment of the overall rhenium recovery by applying a similar factor for an average recovery increase of 0.5% per 10 µm reduction of primary grind size.
| Pebble Project | Page 158 |
| NI 43-101 Technical Report Update and Preliminary Economic Assessment | August 21, 2023 |
|
|
|
14 MINERAL RESOURCE ESTIMATES
14.1 Introduction
The Pebble deposit 2023 mineral resource estimate (2023 MRE) as described in this section was prepared by David Gaunt, P. Geo., who is not independent of Northern Dynasty. The mineral resource estimate is included in the “2023 Amended Technical Report on the Pebble Project Southwest Alaska, USA” with an effective date of May 19, 2023. The 2023 MRE has been audited by Greg Z. Mosher, P. Geo., a Qualified Person who is independent of Northern Dynasty and who assumes responsibility for this estimate. The various tests applied to the 2023 MRE, and their outcomes, are described at the end of the relevant subsections that follow.
14.2 Summary
The 2023 MRE presented in this section is unchanged from the resource estimate disclosed in 2023 (David Gaunt, 2023). No core drilling has taken place in the vicinity of the area since 2013, nor have any additional analyses have been obtained since that time for copper, gold, molybdenum, or silver.
The current estimate is based on all core holes in the vicinity of the block model extents, completed to the end of 2013. Wireframe domains for the estimated metals, as well as bulk density, were interpreted using geological, structural and alteration data. Descriptive statistics, unique search strategies and geostatistical parameters for block interpolation and resource classification were then developed for each of the modelled domains.
The 2023 MRE is presented in Table 14-1. The effective date of the 2023 MRE is June 1, 2023. Mineral resources that are not mineral reserves do not have demonstrated economic viability.
Tonnes were rounded to the nearest million. The highlighted 0.3% CuEq cut off is appropriate for a large scale, open pit deposit of this type in Alaska. Of the total mineral resource, the measured category represents 5%, the indicated category represents 54%, and the inferred category represents 41%. The QP is relying on the letter from Steptoe and Johnson LLP, dated August 17, 2023, per Section 3.2, that provides an avenue to resolving the current permitting challenges. Accordingly, in the opinion of the QP, there are reasonable prospects for Eventual Economic Extraction of the resource.
| Pebble Project | Page 159 |
| NI 43-101 Technical Report Update and Preliminary Economic Assessment | August 21, 2023 |
|
|
|
Table 14‑1: Pebble Deposit Mineral Resource Estimate at 0.3% Copper Equivalent Cut-off June 1, 2023
| Classification | Tonnes (Mt) | Grades | Recoverable Metal |
|||||||||
| CuEq (%) | Cu (%) | Au (g/t) | Ag (g/t) | Mo (ppm) | Re (ppm) | Cu (Blb) | Au (Moz) | Ag (Moz) | Mo (Blb) | Re (kg) |
||
| Measured | 527 | 0.65 | 0.33 | 0.35 | 1.7 | 178 | 0.32 | 3.35 | 4.58 | 20.4 | 0.15 | 118,000 |
| Indicated | 5,929 | 0.77 | 0.41 | 0.34 | 1.7 | 246 | 0.41 | 49.64 | 49.24 | 228.9 | 2.62 | 1,731,000 |
| M+I | 6,456 | 0.76 | 0.40 | 0.34 | 1.7 | 240 | 0.40 | 52.99 | 53.82 | 249.3 | 2.78 | 1,849,000 |
| Inferred | 4,454 | 0.55 | 0.25 | 0.25 | 1.2 | 226 | 0.36 | 22.66 | 28.11 | 121.7 | 1.81 | 1,025,000 |
Notes:
| 1. | David Gaunt, P. Geo., estimated the resource which has been audited by Greg Z. Mosher, P. Geo., a Qualified Person who is independent of Northern Dynasty and who assumes responsibility for this estimate. |
| 2. | Copper equivalent (CuEq) calculations use the following metal prices: US$1.85 /lb for Cu, US$902 /oz for Au and US$12.50 /lb for Mo, and recoveries: 85% Cu, 69.6% Au, and 77.8% Mo (Pebble West zone) and 89.3% Cu, 76.8% Au, 83.7% Mo (Pebble East zone). |
| 3. | Recovered metal based on recoveries in Table 1-1 and Table 13-20. |
| 4. | The mineral resource estimate is constrained by a conceptual pit shell that was developed using a Lerchs-Grossmann algorithm and is based in the following parameters: 42 degree pit slope; metal prices and recoveries for gold of US$1,540.00/oz and 61% Au, for copper of US$3.63/lb and 91% Cu, for silver of US$20.00/oz and 67% Ag and for molybdenum of US$12.36/lb and 81% Mo, respectively; a mining cost of US$1.01/ton with a US$0.03/ton/bench increment and other costs (including processing, G&A and transport) of US$6.74/ton. |
| 5. | Per the calculation outlined in Section 14.12, recent company work has demonstrated that using appropriate and likely inputs for commodity prices, concentrate grades, payable copper, and realization charges results in a cutoff grade of 0.22% CuEq. The QP believes that the use of a 0.3% CuEq cutoff grade to express the Pebble resources is conservative and provides continuity with previous estimates. |
| 6. | The QP has reviewed the technical information, and other factors that may affect the estimate including permitting and external legal counsel's letter regarding the ROD appeal and Final Determination and believes that there are reasonable prospects of eventual economic extraction. |
14.3 Geological Interpretation for Estimation
The Pebble deposit extends for a strike length of 13,000 ft, a width of 7,700 ft, and to a depth of at least 5,810 ft. Metal distribution within the Pebble deposit is affected by lithology, alteration, weathering, and structure such that the distribution cannot be constrained on the basis of a single attribute. Further, the distribution of each of the metals differs in accordance with the differing response of those metals to the thermal and chemical environments prevailing at the time of deposition. Therefore, for the purpose of resource estimation domains were developed for each of the five metals.
These domains are defined by deposit orientation, geology, alteration, and grade. Three boundaries are common to all metals: (1) the north-south divide that bisects the deposit and separates it into east and west portions and marks a change in the dip of the stratigraphy from flat lying to gently east dipping, (2) the east-trending ZE Fault that divides the eastern portion of the deposit into two zones, and (3) the north-northeast trending ZG Fault which constrains the deposit to the east. The shape and location of the domain boundaries differ amongst the metals but in general a gently east-dipping surface separates an upper higher-grade zone (copper, gold, and silver) from a lower grade zone, this surface spans both western and eastern parts of the deposit. East of the east-west divide the higher-grade zone is divided into a north and a south domain by the ZE Fault. In the case of molybdenum, in contrast to the other metals, the upper, western zone is lower- grade and the underlying zone is higher grade. The domaining developed for molybdenum was used for rhenium estimation given the very high statistical and spatial correlation between these two metals.
There are two additional domains for copper: leached and supergene; both are in the near-surface western portion of the deposit, and both have been interpreted based on copper speciation data. Copper grade distribution is further constrained by two lower-grade domains that overlie portions of the east and west halves of the deposit. The gold domains also contain a very small low-grade domain immediately above the western higher-grade domain. The bulk density domains are described in Section 14.6.
| Pebble Project | Page 160 |
| NI 43-101 Technical Report Update and Preliminary Economic Assessment | August 21, 2023 |
|
|
|
The domains are tabulated in Table 14-2.
As a general statement domain code 40 will identify lower-grade portions of the deposit, domain code 41 will identify upper, higher-grade portions in the western half of the deposit, whereas domain codes 42 and 43 will identify the northern and southern quadrants respectively in the eastern half of the deposit.
Table 14‑2: Pebble Deposit Metal Domains
| Domain | Code | Description |
| Ag low grade | 40 | Hypogene at depth |
| Ag moderate grade | 41 | West part near surface |
| Ag Northeast | 42 | East part, north of ZE fault |
| Ag Southeast | 43 | East part, south of ZE fault |
| Au low grade | 40 | Hypogene at depth |
| Au moderate grade | 41 | West part near surface |
| Au Northeast | 42 | East part north of ZE fault |
| Au Southeast | 43 | East part south of ZE fault |
| Cu Leach | 1 | Cu/leach |
| Cu Supergene | 2 | Cu/supergene |
| Cu low grade | 40 | Hypogene at depth |
| Cu moderate grade | 41 | Hypogene West near surface |
| Cu Hypogene Northeast | 42 | East part north of ZE fault |
| Cu Hypogene Southeast | 43 | East part south of ZE fault |
| Mo/Re low grade | 40 | Above 70 ppm cap |
| Mo/Re high grade | 41 | Below 70 ppm cap west |
| Mo/Re high grade Northeast | 42 | Above 70 ppm cap, east part north of ZE fault |
| Mo/Re high grade Southeast | 43 | Above 70 ppm cap, east part south of ZE fault |
Separate variables were set up in the block model for each of the metals, each metal domain and for bulk density (noted as SG0 to SG3 and SG10 in Section 14.6). This approach allowed for the application of a unique suite of search strategies and kriging parameters to each metal domain based on that domain’s geostatistical characteristics.
The distribution of drill holes relative to the extent of the block model is shown in Figure 14-1.
| Pebble Project | Page 161 |
| NI 43-101 Technical Report Update and Preliminary Economic Assessment | August 21, 2023 |
|
|
|
Figure 14‑1: Pebble Deposit Plan View of Drill Holes and Block Model Extent (red rectangle)
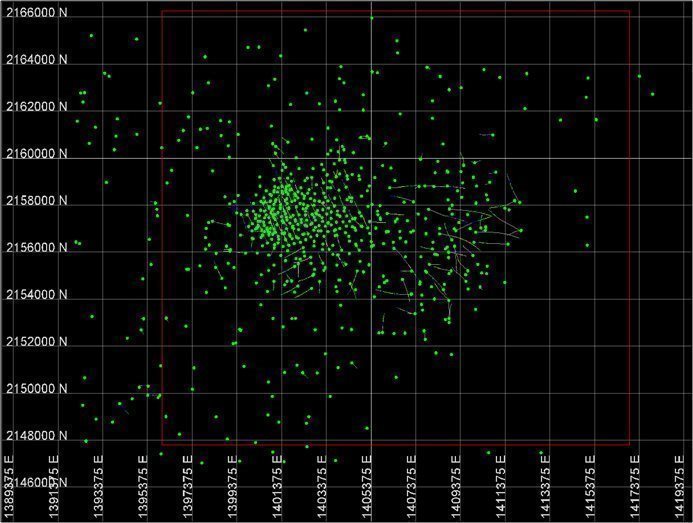
Note: Figure prepared by NDM, 2020.
14.4 Inclusion of Rhenium in the Project Database
As shown in Figure 14-2 and 14-3, rhenium assays did not become a standard part of the drill hole assay program until 2008. This leaves slightly less than half (45%) of the drill-hole data base with no direct measurement of rhenium in the Pebble Project area. Spatially, the area deficient in rhenium analyses is located primarily in the western portion of the Pebble deposit.
| Pebble Project | Page 162 |
| NI 43-101 Technical Report Update and Preliminary Economic Assessment | August 21, 2023 |
|
|
|
Figure 14‑2: Growth in the Percentage of Drill Hole Sample Intervals with Rhenium Assays

Source: Amended Pebble Technical Report, May 19, 2023.
14.4.1 Grade Capping/Outlier Restrictions
Rhenium is recognized as a critical mineral in several industrialized countries throughout the world, including Australia, Japan and India1 and formerly in the United States2,3. Given its importance to modern transportation because of its key role in the aerospace and petrochemical sectors and limited options for effective substitutes4 it is important that rhenium be included in the list of revenue-generating metals at Pebble and that the resource incorporates a reliable prediction of rhenium grade for every potential resource block.
The problem of missing rhenium analyses can be overcome by assigning reliable predictions of grades to any drill hole interval that is missing a direct measurement of rhenium. Such predictions can be made by developing a regression equation based on a correlated variable. In the case of Pebble, this approach is possible due to the extraordinary strong correlation between rhenium and molybdenum, with the latter having been assayed in 99% of the drill hole sample intervals. This approach is not new, in the mining industry there are numerous examples of grade prediction by regression for base metals, and it is also very often employed to predict uranium grades from gamma logs, as described in the CIM’s Best Practice Guideline (CIM, 2003).
| Pebble Project | Page 163 |
| NI 43-101 Technical Report Update and Preliminary Economic Assessment | August 21, 2023 |
|
|
|
14.4.2 Data Used to Develop the Regression Equation
The database used for this study includes assays for 72,873 drill hole sample intervals from the Pebble Project, dating back to 1988, 39,936 of which have rhenium assays. To ensure that the rhenium predictions are most accurate for material above the resource threshold of 0.3% CuEq, the data used for the regression study did not include any drill hole sample intervals where CuEq < 0.3%. This reduces the number of sample intervals to 18,554.
A few of the multi-element ICP assays were done using an aqua regia digestion to put the metals into solution. For some elements, aqua regia results in only a partial digestion. A four-acid digestion with nitric, perchloric, hydrofluoric and hydrochloric acids break down most silicate and oxide minerals, allowing for near-total analyses of most elements. Since over 99.9% of the CuEq >0.3% intervals were analyzed use a four-acid digestion, the very few that were done with an aqua regia digestion were dropped, leaving 18,536 sample intervals for the regression study.
In 2020, to better inform the regression analysis, 1000 additional sample pulps were retrieved and analyzed for rhenium. These additional samples were selected based on a range of molybdenum grades and to provide spatial coverage in areas lacking rhenium data, specifically in the western part of the Pebble deposit area (Figure 14-3). Of the 1000 additional rhenium analyses, 50 were intentionally excluded from the data base so that they could be used to check the reliability of the regression equation after it had been developed (Srivastava, 2020).
Figure14‑3: Block Model (red line); DDH Collars and Re Analyses; Lacking (grey), Existing (yellow), 2020 Pulps (red)

Note: Figure prepared by NDM, 2020
| Pebble Project | Page 164 |
| NI 43-101 Technical Report Update and Preliminary Economic Assessment | August 21, 2023 |
|
|
|
14.4.3 Data Analysis
Table 14-3 shows the correlation coefficients between Re and each of 21 possible predictors. The only strong correlation is with molybdenum: +0.87. The correlations between Re and several of the other elements (barium, potassium, lead, strontium, zinc) are not significantly different from zero; and for the others, their correlations with rhenium are very weak at best.
Table14‑3: Correlation Coefficients Between Rhenium and Other Elements
| Ag | Al | As | Ba | Ca | Cd | Co |
| +0.02 | +0.02 | +0.02 | 0.00 | −0.09 | −0.02 | −0.07 |
| Cr | Cu | Fe | K | Mg | Mn | Mo |
| −0.04 | +0.16 | −0.14 | 0.00 | −0.12 | −0.13 | +0.87 |
| Na | Ni | Pb | Sb | Sr | V | Zn |
| −0.08 | −0.07 | −0.01 | −0.02 | 0.00 | −0.10 | 0.00 |
Figure 14-4 shows a scatterplot of rhenium versus molybdenum on a log-log scale. The linear relationship between the logarithms of the two elements results in the regression equation having the following form when expressed in terms of the raw, untransformed variables (with both measured in units of parts-per-million):
Re = 0.002269 ·〖Mo〗^0.951
Figure 14‑4: Rhenium vs. Molybdenum

Source: Srivastava, 2020.
| Pebble Project | Page 165 |
| NI 43-101 Technical Report Update and Preliminary Economic Assessment | August 21, 2023 |
|
|
|
14.4.4 Validation
Subsequent to the development of the regression formula, rhenium assays for the 50 withheld samples were provided so that the reliability of the prediction could be assessed using data that had not played any role in the development of the regression equation (Srivastava, 2020).
Figure 14-5 shows the rhenium grades predicted by the regression equation versus the rhenium assays actually reported by the lab.
Figure 14‑5: Rhenium Predications vs. Actual Rhenium Assays for Withheld Validation Samples
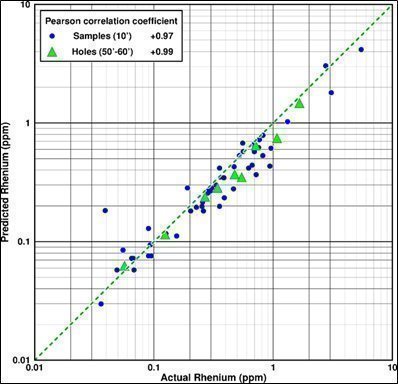
Source: Srivastava, 2020.
The blue dots in Figure 14-5 are the 50 withheld validation sample assays from the initial data base. For these 50 samples, there is a small bias, with the predicted rhenium values being slightly conservative at 15% lower than the actual assays. The correlation between the actual assays and the predictions is an excellent +0.97.
For the purpose of grade estimation into the block model, the reliability of the rhenium predictions is actually better than the blue dots in Figure 14-5 suggest. Each of the blue dots corresponds to an assay from a 10’ interval in a drill hole, a volume much smaller than the 75 ft x 75 ft x 50 ft blocks used in the resource block model. Predictions for small volumes are always more uncertain than predictions made for larger volumes. In order to test the reliability of the rhenium predictions for larger volumes, the 50 validation samples were intentionally chosen in consecutive runs that were 50 ft to 60 ft in length.
| Pebble Project | Page 166 |
| NI 43-101 Technical Report Update and Preliminary Economic Assessment | August 21, 2023 |
|
|
|
Table 14-4 shows the 50 validation samples and their grouping into nine consecutive runs. The green triangles on Figure 14-5 show the comparison between predicted and actual rhenium at the 50 ft to 60 ft scale, the height of resource blocks. The correlation coefficient, which was excellent at the 10 ft scale, is an even stronger +0.99 at the scale closer to the size of resource blocks.
Table 14‑4: Predicted and Actual Rhenium for 50 Withheld Validation Samples, at 10 ft Scale and at 50 ft Scale
| Hole ID | From (feet) | To (feet) | Length (feet) | Re-actual (ppm) | Re-predicted (ppm) | Re-actual (ppm) | Re-predicted (ppm) |
| 5319M | 312 | 322 | 10 | 0.253 | 0.198 | 0.124 | 0.114 |
| 5319M | 322 | 332 | 10 | 0.093 | 0.094 |
|
|
| 5319M | 332 | 342 | 10 | 0.095 | 0.076 |
|
|
| 5319M | 342 | 352 | 10 | 0.090 | 0.076 |
|
|
| 5319M | 352 | 362 | 10 | 0.090 | 0.129 |
|
|
| 4257 | 299 | 309 | 10 | 0.355 | 0.198 | 0.341 | 0.283 |
| 4257 | 309 | 319 | 10 | 0.260 | 0.181 |
|
|
| 4257 | 319 | 329 | 10 | 0.691 | 0.661 |
|
|
| 4257 | 329 | 339 | 10 | 0.305 | 0.283 |
|
|
| 4257 | 339 | 349 | 10 | 0.155 | 0.111 |
|
|
| 4257 | 349 | 359 | 10 | 0.282 | 0.266 |
|
|
| 4217 | 199 | 209 | 10 | 0.958 | 0.612 | 0.475 | 0.368 |
| 4217 | 209 | 219 | 10 | 0.256 | 0.215 |
|
|
| 4217 | 219 | 229 | 10 | 0.191 | 0.283 |
|
|
| 4217 | 229 | 239 | 10 | 0.332 | 0.300 |
|
|
| 4217 | 239 | 249 | 10 | 0.818 | 0.531 |
|
|
| 4217 | 249 | 259 | 10 | 0.296 | 0.266 |
|
|
| 4203 | 268 | 278 | 10 | 0.360 | 0.350 | 1.662 | 1.470 |
| 4203 | 278 | 288 | 10 | 5.470 | 4.160 |
|
|
| 4203 | 288 | 298 | 10 | 0.555 | 0.677 |
|
|
| 4203 | 298 | 308 | 10 | 0.203 | 0.181 |
|
|
| 4203 | 308 | 318 | 10 | 0.622 | 0.416 |
|
|
| 4203 | 318 | 328 | 10 | 2.760 | 3.038 |
|
|
| 4195 | 99 | 117 | 18 | 0.720 | 0.367 | 1.076 | 0.745 |
| 4195 | 117 | 129 | 12 | 3.070 | 1.802 |
|
|
| 4195 | 129 | 139 | 10 | 1.320 | 1.027 |
|
|
| 4195 | 139 | 149 | 10 | 0.521 | 0.531 |
|
|
| 4195 | 149 | 169 | 20 | 0.355 | 0.416 |
|
|
| 3135 | 448 | 458 | 10 | 0.065 | 0.072 | 0.057 | 0.062 |
| 3135 | 458 | 468 | 10 | 0.068 | 0.058 |
|
|
| 3135 | 468 | 478 | 10 | 0.049 | 0.058 |
|
|
| 3135 | 478 | 488 | 10 | 0.067 | 0.072 |
|
|
| 3135 | 488 | 498 | 10 | 0.036 | 0.030 |
|
|
| Pebble Project | Page 167 |
| NI 43-101 Technical Report Update and Preliminary Economic Assessment | August 21, 2023 |
|
|
|
| Hole ID | From (feet) | To (feet) | Length (feet) | Re-actual (ppm) | Re-predicted (ppm) | Re-actual (ppm) | Re-predicted (ppm) |
| 3135 | 498 | 508 | 10 | 0.055 | 0.085 |
|
|
| 3104 | 128 | 138 | 10 | 0.039 | 0.183 | 0.268 | 0.238 |
| 3104 | 138 | 148 | 10 | 0.227 | 0.195 |
|
|
| 3104 | 148 | 158 | 10 | 0.283 | 0.256 |
|
|
| 3104 | 158 | 168 | 10 | 0.126 | 0.117 |
|
|
| 3104 | 168 | 178 | 10 | 0.667 | 0.441 |
|
|
| 3104 | 468 | 479.5 | 11.5 | 0.938 | 0.433 | 0.544 | 0.348 |
| 3104 | 479.5 | 488 | 8.5 | 0.465 | 0.278 |
|
|
| 3104 | 488 | 498 | 10 | 0.389 | 0.234 |
|
|
| 3104 | 498 | 508 | 10 | 0.470 | 0.428 |
|
|
| 3104 | 508 | 518 | 10 | 0.386 | 0.345 |
|
|
| 3082 | 349 | 359 | 10 | 0.821 | 0.787 | 0.714 | 0.644 |
| 3082 | 359 | 369 | 10 | 0.561 | 0.575 |
|
|
| 3082 | 369 | 379 | 10 | 0.703 | 0.638 |
|
|
| 3082 | 379 | 389 | 10 | 0.695 | 0.573 |
|
|
| 3082 | 389 | 401.9 | 12.9 | 0.754 | 0.622 |
|
|
The results of the blind, hindsight validation study confirm that the following regression equation:
Re=0.002269 · Mo0.951
Produces excellent predictions of rhenium at the scale of the sample interval and even better predictions at the scale of the resource blocks. Even though there is a small bias in the predictions for the 50 samples chosen for the validation study, it is slight and is considered to be conservative.
The regression equation was used to populate missing rhenium analyses into the drill database and these values along with the existing rhenium results were used to estimate rhenium into the Pebble block model.
QP Comment: The QP tested the log correlation between molybdenum and rhenium and obtained a correlation coefficient of 0.98 which compares favorably with the 0.99 coefficient previously obtained in the 2023 Amended Pebble Technical Report with an effective date of May 19, 2023.
14.5 Exploratory Data Analysis
14.5.1 Assays
Global descriptive statistics for all non-zero copper, gold, silver, molybdenum, and rhenium assays are presented in Table 14-5.
| Pebble Project | Page 168 |
| NI 43-101 Technical Report Update and Preliminary Economic Assessment | August 21, 2023 |
|
|
|
Table 14‑5: Pebble Deposit Assay Database Descriptive Global Statistics
| Statistic (Non-zero) | Length (ft) | Ag (ppm) | Au (g/t) | Cu (%) | Mo (ppm) | Re (ppm) |
| Mean | 9.97 | 1.57 | 0.32 | 0.33 | 191.3 | 0.33 |
| Median | 10.00 | 1.00 | 0.23 | 0.26 | 130 | 0.22 |
| Standard Deviation | 1.86 | 5.02 | 1.50 | 0.31 | 298.26 | 0.49 |
| Coefficient of Variation | 0.19 | 3.20 | 4.63 | 0.94 | 1.56 | 1.49 |
| Kurtosis | 23.31 | 30,529 | 41,613 | 28.36 | 2,455 | 1,285 |
| Skewness | 2.1 | 155.3 | 189.9 | 2.9 | 29.00 | 20.26 |
| Minimum | 0.001 | 0.1 | 0.001 | 0.001 | 0.20 | 0.001 |
| Maximum | 55 | 1030 | 334.8 | 9.29 | 32,200 | 43.93 |
| Count | 59,105 | 58,876 | 59,114 | 58,912 | 59,114 | 58,093 |
QP Comment: The QP generated a set of comparable descriptive statistics, and the results compare closely with those in the 2023 Amended Pebble Technical Report with an effective date of May 19, 2023.
Descriptive statistics were generated for each of the metal domains and these are summarized graphically as box-and-whisker plots in Figure 14-6 to Figure 14-10.
| Pebble Project | Page 169 |
| NI 43-101 Technical Report Update and Preliminary Economic Assessment | August 21, 2023 |
|
|
|
Figure 14‑6: Pebble Deposit Copper Assay Domain Box-and-Whisker Plots

Note: Figure prepared by NDM, 2020.
| Pebble Project | Page 170 |
| NI 43-101 Technical Report Update and Preliminary Economic Assessment | August 21, 2023 |
|
|
|
Figure 14‑7: Pebble Deposit Gold Assay Domain Box-and-Whisker Plots
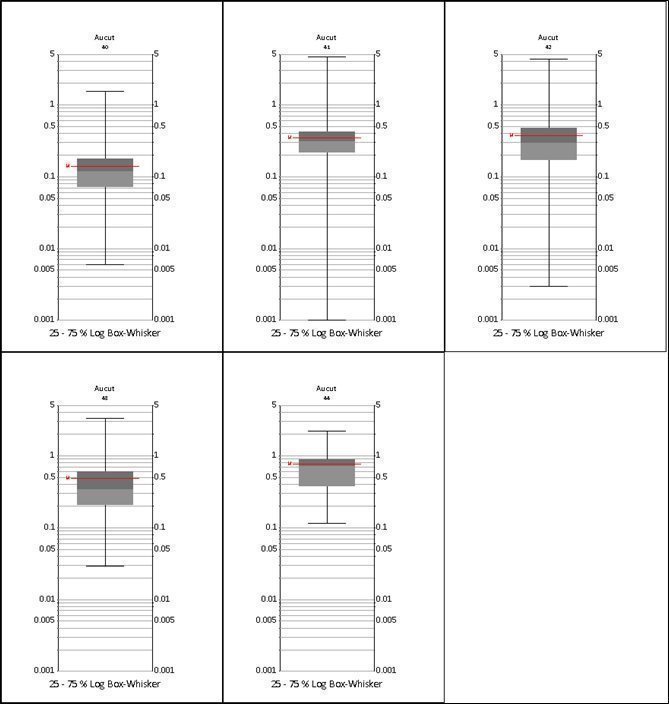
Note: Figure prepared by NDM, 2020.
| Pebble Project | Page 171 |
| NI 43-101 Technical Report Update and Preliminary Economic Assessment | August 21, 2023 |
|
|
|
Figure 14‑8: Pebble Deposit Molybdenum Assay Box-and-Whisker Plots
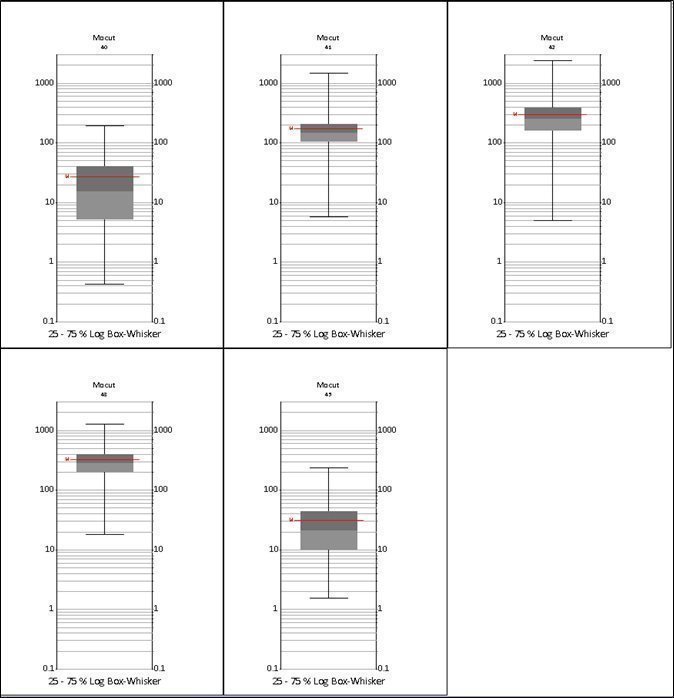
Note: Figure prepared by NDM, 2020.
| Pebble Project | Page 172 |
| NI 43-101 Technical Report Update and Preliminary Economic Assessment | August 21, 2023 |
|
|
|
Figure 14‑9: Pebble Deposit Silver Assay Box-and-Whisker Plots
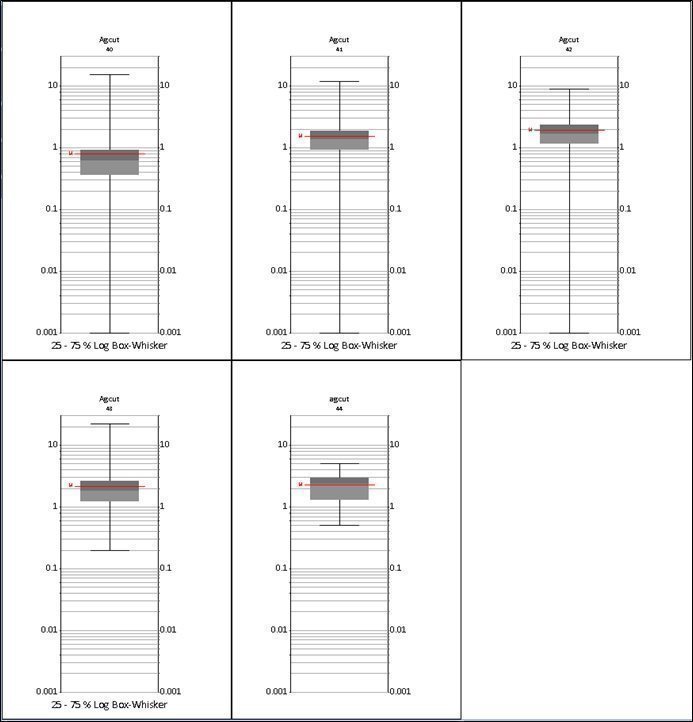
Note: Figure prepared by NDM, 2020
| Pebble Project | Page 173 |
| NI 43-101 Technical Report Update and Preliminary Economic Assessment | August 21, 2023 |
|
|
|
Figure 14‑10: Pebble Deposit Rhenium Assay Box-and-Whisker Plots
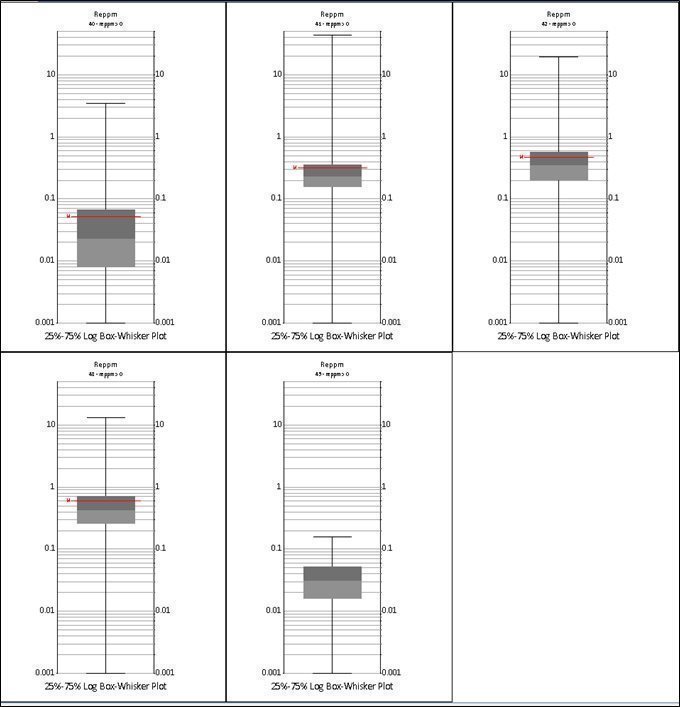
Note: Figure prepared by NDM, 2020.
| Pebble Project | Page 174 |
| NI 43-101 Technical Report Update and Preliminary Economic Assessment | August 21, 2023 |
|
|
|
As described in Section 14.3, there are four basic domains for copper, gold, molybdenum, silver and rhenium, plus additional leach and supergene domains for copper. A north-south soft boundary separates the flat-lying western portion of the deposit from the gently east-dipping eastern portion of the deposit, and it is for this reason that the deposit is broadly divided into east and west halves. The eastern portion of the deposit is divided into northern and southern quadrants by an east-west fault (the ZE fault) which is always treated as a hard boundary between these two zones.
For copper, gold, and silver the western half of the deposit has a flat lying, near surface high-grade domain (41) which is underlain by a low-grade domain (40). As indicated on the box-and-whisker plots there is a marked difference in mean grades for these zones and, as such, these domains are separated by a planar, gently east-dipping hard boundary that extends into the eastern portion of the deposit beneath the northeast and southeast hypogene domains.
For molybdenum and rhenium, the west half of the deposit has a thin, flat-lying near-surface low-grade domain (40) that is underlain by a higher-grade domain (41) as shown by the grades in the box-and-whisker plots. These domains are separated by a planar, flat-lying hard boundary that extends into the eastern portion of the deposit into the upper reaches of the northeast and southeast hypogene domains.
The box-and-whisker plots also indicate that the fault-bounded domains (42, 43) have similar average grades for all metals; however, their separation into domains by a hard boundary is required due the displacement along the ZE fault plane. The copper leach zone is also clearly distinguishable although the supergene zone is not markedly different from the other high-grade domains. Five of the six domains are shown in Figure 14-11. This east-west section is located north of the east west trending ZE fault so zone 43 is not visible. The east-west divide is clearly visible between zones 41 in the west and 42 in the east.
Figure 14‑11: Pebble Deposit Copper Grade Domains

Note: Figure prepared by NDM, 2020.
| Pebble Project | Page 175 |
| NI 43-101 Technical Report Update and Preliminary Economic Assessment | August 21, 2023 |
|
|
|
QP Comment: The QP reviewed the grade characteristics of copper, molybdenum, gold and silver in each of the domains and found that the partitioning of the deposit is consistent with those grade distributions in the 2023 Amended Pebble Technical Report with an effective date of May 19, 2023.
14.5.2 Capping
Capping is the process of reducing statistically anomalous high values (outliers) within a sample population in order to avoid the disproportionate influence these values could have on block estimation. The determination of appropriate capping levels is subjective but is commonly established by reference to cumulative frequency plots of the metal assays. Prominent breaks in the plot line, particularly at the upper end, infer a sub-population of values separate from the main population. The break in the trend defines the capping value and all assays above that point are reduced to the capping value.
Capping values applied to the Pebble assays were determined for each domain and are shown in Table 14-6.
Table 14‑6: Pebble Deposit Capping Values
| Code | Explanation | Units | Cap |
| 40 | Ag - Hypogene at depth | g/t | 35 |
| 41 | Ag - Hypogene West near surface | g/t | 19 |
| 42 | Ag - North of ZE fault | g/t | 13 |
| 43 | Ag - South of ZE fault | g/t | 70 |
| 40 | Au - Hypogene at depth | g/t | 2.8 |
| 41 | Au - Hypogene West near surface | g/t | 7.0 |
| 42 | Au - North of ZE fault | g/t | 7.7 |
| 43 | Au - South of ZE fault | g/t | 4.3 |
| 1 | Cu - Leach | % | 0.25 |
| 2 | Cu - Supergene | % | 2.2 |
| 40 | Cu - Hypogene at depth | % | 0.8 |
| 41 | Cu - Hypogene West near surface | % | 2.0 |
| 42 | Cu - North of ZE fault | % | 2.4 |
| 43 | Cu - South of ZE fault | % | 2.4 |
| 40 | Mo - Below 70 ppm cap | ppm | 300 |
| 41 | Mo - Above 70 ppm cap west | ppm | 2100 |
| 42 | Mo - Above 7 0ppm cap, north of ZE fault | ppm | 2800 |
| 43 | Mo - Above 70 ppm cap, south of ZE fault | ppm | 2800 |
| 40 | Re - Below 70 ppm cap | ppm | 0.7 |
| 41 | Re - Above 70 ppm cap west | ppm | 3.0 |
| 42 | Re - Above 70ppm cap, north of ZE fault | ppm | 3.9 |
| 43 | Re - Above 70 ppm cap, south of ZE fault | ppm | 5.8 |
QP Comment: The QP generated cumulative frequency plots for each of the metals by domain and compared the impact of capping on the aggregate value of the assays in each domain relative to the same impact based on capping levels presented in the 2023 Amended Pebble Technical Report with an effective date of May 19, 2023. In all cases except one, the differences in impact ranged from zero to one percent. The one exception was the Rhenium 40 domain in which the previously generated capping level reduced the aggregate value of the contained rhenium values by 16.7% and the Tetra Tech capping level reduced the rhenium values by 0.5%. The reason for the difference is not self-evident but the impact is not material to the mineral resource estimate as it applies to the lowest level of rhenium values, most of which fall outside the limits of the conceptual pit shell used to define the resource.
| Pebble Project | Page 176 |
| NI 43-101 Technical Report Update and Preliminary Economic Assessment | August 21, 2023 |
|
|
|
14.5.3 Composites
Compositing to a common length overcomes the influence of sample length on grade weighting within the resource estimate. Samples were composited to 50 ft lengths to match the anticipated bench height during mining. Although the compositing is not intended to ensure the composite intervals will coincide with the benches, the composite length results in grades that match the resolution of those that can be expected from bench-scale sampling. The number of composites and their mean values are given in Table 14-7.
Table 14‑7: Pebble Deposit Composite Mean Values
| Metal | Composites | Mean |
| Ag (g/t) | 16,210 | 1.17 |
| Au (g/t) | 12,254 | 0.31 |
| Cu (%) | 16,184 | 0.24 |
| Mo (ppm) | 16,170 | 140 |
| Re (ppm) | 11.914 | 0.32 |
| Bulk Density (g/cm3) | 9,830 | 2.62 |
QP Comment: The QP obtained similar numbers of composites and mean composite values.
14.6 Bulk Density
The database contains values for 9,830 bulk density measurements. These measurements were made on 0.1 m samples of drill core selected from locations throughout the Pebble deposit so as to reasonably reflect deposit-wide variations in rock mass. These values were not composited because they are spatially isolated and not appropriate for compositing; hence were employed directly in the interpolation process. Five separate bulk density domains were identified:
| · | pyrite cap within the western portion of the deposit (SGZ1) |
|
|
|
| · | pyrite cap within the eastern portion of the deposit (SGZ2) |
|
|
|
| · | cretaceous hanging wall (SGZ3) |
|
|
|
| · | tertiary unmineralized rock east of the ZG1 Fault (SGZ10) |
|
|
|
| · | tertiary unmineralized rock west of the ZG1 Fault (SGZ11). |
Bulk density measurements within these domains were interpolated into the block model using ordinary kriging (OK) and then used to estimate tonnages.
| Pebble Project | Page 177 |
| NI 43-101 Technical Report Update and Preliminary Economic Assessment | August 21, 2023 |
|
|
|
14.7 Spatial Analysis
Variography was completed on composited drill results on a per metal, per domain basis. The Pebble variography and search ellipse parameters are presented in Table 14-8 and Table 14-9, respectively.
Table 14‑8: Pebble Deposit Variogram Parameters
| Domain | Variogram Weights | S1 Axis Range (ft) | S2 Axis Range (ft) |
||||||
| S0 | S1 | S2 | Major | Semi-Major | Minor | Major | Semi-Major | Minor |
|
| Ag40 | 0.52 | 0.41 | 0.00 | 750 | 475 | 1,500 | 0 | 0 | 0 |
| Ag41 | 0.30 | 0.33 | 0.00 | 450 | 360 | 475 | 0 | 0 | 0 |
| Ag42 | 0.08 | 0.34 | 0.26 | 600 | 600 | 600 | 700 | 2,250 | 1,500 |
| Ag43 | 0.13 | 0.49 | 0.00 | 1,300 | 800 | 1,200 | 0 | 0 | 0 |
| Au40 | 0.46 | 0.54 | 0.00 | 700 | 700 | 350 | 0 | 0 | 0 |
| Au41 | 0.16 | 0.26 | 0.29 | 250 | 250 | 200 | 1,200 | 850 | 800 |
| Au42 | 0.43 | 0.57 | 0.00 | 1,100 | 1,500 | 800 | 0 | 0 | 0 |
| Au43 | 0.20 | 0.70 | 0.00 | 900 | 600 | 450 | 0 | 0 | 0 |
| Cu1 | 0.31 | 0.48 | 0.21 | 700 | 700 | 350 | 700 | 700 | 350 |
| Cu2 | 0.40 | 0.60 | 0.00 | 900 | 520 | 520 | 0 | 0 | 0 |
| Cu40 | 0.15 | 0.60 | 0.00 | 1,400 | 1,300 | 550 | 0 | 0 | 0 |
| Cu41 | 0.11 | 0.25 | 0.30 | 450 | 700 | 450 | 4,000 | 1,300 | 1,300 |
| Cu42 | 0.13 | 0.12 | 0.30 | 370 | 500 | 700 | 1,400 | 1,100 | 700 |
| Cu43 | 0.12 | 0.49 | 0.00 | 1,500 | 1,300 | 500 | 0 | 0 | 0 |
| Mo40 | 0.28 | 0.72 | 0.00 | 900 | 200 | 450 | 0 | 0 | 0 |
| Mo41 | 0.19 | 0.16 | 0.30 | 600 | 1,000 | 500 | 1,700 | 1,000 | 1,600 |
| Mo42 | 0.38 | 0.19 | 0.35 | 1,200 | 1,200 | 1,200 | 1,200 | 1,200 | 1,200 |
| Mo43 | 0.47 | 0.23 | 0.30 | 1,300 | 1,900 | 900 | 1,900 | 2,000 | 1,000 |
| Re40 | 0.20 | 0.07 | 0.73 | 150 | 150 | 120 | 1500 | 900 | 700 |
| Re41 | 0.27 | 0.31 | 0.42 | 160 | 260 | 325 | 900 | 700 | 575 |
| Re42 | 0.29 | 0.20 | 0.51 | 400 | 400 | 400 | 1200 | 1200 | 1100 |
| Re43 | 0.38 | 0.05 | 0.57 | 300 | 300 | 300 | 1700 | 1700 | 850 |
| SG0 | 0.44 | 0.56 | 0.00 | 1,350 | 1,350 | 800 | 0 | 0 | 0 |
| SG10 | 0.34 | 0.41 | 0.00 | 1,350 | 850 | 950 | 0 | 0 | 0 |
| SG1 | 0.46 | 0.54 | 0.00 | 640 | 485 | 450 | 0 | 0 | 0 |
| SG2 | 0.37 | 0.63 | 0.00 | 1,700 | 1,280 | 500 | 0 | 0 | 0 |
| SG3 | 0.42 | 0.40 | 0.00 | 1,825 | 1,610 | 900 | 0 | 0 | 0 |
| Pebble Project | Page 178 |
| NI 43-101 Technical Report Update and Preliminary Economic Assessment | August 21, 2023 |
|
|
|
Table 14‑9: Pebble Deposit Search Ellipse Parameters
| Domain | Ellipse Orientation (°) | Ellipse Dimensions (ft) | Ellipse Orientation (°) | Ellipse Dimensions (ft) | Ellipse Orientation (°) | Ellipse Dimensions (ft) |
| Plunge | Dip | Plunge | Dip | Plunge | Dip |
|
| Ag40 | 120.0 | 0.0 | 60.0 | 565 | 355 | 1,125 |
| Ag41 | 180.0 | 0.0 | 0.0 | 340 | 270 | 355 |
| Ag42 | 130.0 | 0.0 | -60.0 | 525 | 1,690 | 1,125 |
| Ag43 | 20.0 | 40.0 | 0.0 | 975 | 600 | 900 |
| Au40 | 0.0 | -0.5 | 0.0 | 510 | 510 | 260 |
| Au41 | 70.0 | 0.0 | -0.5 | 800 | 600 | 560 |
| Au42 | 290.0 | 20.0 | 0.0 | 825 | 1,110 | 600 |
| Au43 | 79.0 | -17.0 | -10.0 | 715 | 460 | 350 |
| Cu1 | 40.0 | 0.0 | 0.0 | 550 | 530 | 270 |
| Cu2 | 30.0 | 0.0 | -0.5 | 675 | 390 | 400 |
| Cu40 | 72.0 | -30.0 | -28.0 | 1,100 | 1,020 | 425 |
| Cu41 | 53.0 | -20.0 | -79.0 | 2,900 | 950 | 950 |
| Cu42 | 290.0 | 40.0 | -0.5 | 1,023 | 830 | 540 |
| Cu43 | 310.0 | 58.0 | -17.0 | 1,180 | 1,030 | 400 |
| Mo40 | 160.0 | 0.0 | 90.0 | 720 | 155 | 350 |
| Mo41 | 180.0 | 0.0 | -90.0 | 1,200 | 800 | 1,200 |
| Mo42 | 130.0 | 0.5 | -90.0 | 900 | 890 | 900 |
| Mo43 | 143.0 | -68.0 | -26.0 | 1,230 | 1,430 | 710 |
| Re40 | 79.0 | -7.0 | -19 | 1500 | 900 | 700 |
| Re41 | 340 | 0 | 0 | 900 | 700 | 575 |
| Re42 | 324 | 29 | -78 | 1200 | 1200 | 1100 |
| Re43 | 60 | 0 | -80 | 1700 | 1700 | 850 |
| SG0 | 30.0 | 0.0 | 0.0 | 1,000 | 1,000 | 600 |
| SG10 | 40.0 | 0.0 | -90.0 | 1,050 | 450 | 550 |
| SG1 | 88.0 | 6.0 | 40.0 | 450 | 350 | 325 |
| SG2 | 117.0 | -34.0 | 22.0 | 1,300 | 1,000 | 370 |
| SG3 | 80.0 | 0.0 | 0.0 | 1,300 | 1,200 | 660 |
QP Comment: The QP generated variograms for the Copper and Gold 40 and 41 domains and obtained variograms of similar range and orientations. Slight differences are attributable to differences in software and slight differences in geostatistical parameters.
14.8 Resource Block Model
The block model parameters are set out in Table 14-10.
| Pebble Project | Page 179 |
| NI 43-101 Technical Report Update and Preliminary Economic Assessment | August 21, 2023 |
|
|
|
Table 14‑10: Pebble Deposit 2020 Block Model Parameters
| Origin | Coordinates | Dimensions | Number | Size (ft) | Rotation (°) |
| X | 1396025 | Columns | 279 | 75 | 0 |
| Y | 2147800 | Rows | 246 | 75 | - |
| Z | -5500 | Levels | 150 | 50 | - |
14.9 Interpolation Plan
Grade interpolation using OK was carried out in three passes: the search ellipse used for the first pass had axes dimensions that corresponded to 95% of the variance, the second pass used search ellipse axes equal to 150% of the first pass and the third pass used search ellipse dimensions equal to 300% of the first pass.
The first and second passes were limited to a minimum of eight and a maximum of 24 composites, with a maximum of three composites from any one drill hole. For the third pass the minimum number of composites was set to five.
Domain boundaries were ‘hard’ (interpolation using composites only from within a given domain) with the exception of the east-west divide. The domain restrictions are set out in Table 14-11.
QP Comment: The QP evaluated the block model by independently estimating the resources contained in the copper and gold domains on the assumption that if these outcomes were similar, it would be reasonable to assume that the molybdenum and silver estimates would be comparable. The copper and gold estimates generated by the QP were not conducted in a manner identical to the Gaunt estimate because of differences in estimation software. The estimate completed by Gaunt was carried out using Vulcan software and the mineral domains were defined using surfaces and Boolean logic to establish the limits of each domain. The QP used SGS Genesis software which uses wireframe volumes and cannot accommodate the definition of estimation volumes using surfaces. Therefore, to facilitate the comparison, Northern Dynasty provided the QP with wireframe volumes of the estimation domains as constrained by the surfaces used by Gaunt. The QP then extracted the relevant composite populations from those wireframes and carried out the estimates using the same variographic and search ellipse parameters as used by Gaunt. Despite the differences in software and estimation domains, the outcomes for total copper tonnes and grades were similar to within several percent and for gold within ten percent or less for most cutoff grades which is considered a reasonable outcome given the differences in software and methodology.
Table 14‑11: Pebble Deposit Domain Interpolation Data Sources
| Domain Estimated | Domains Sourced |
| Ag40 | Ag zone 40 |
| Ag41 | Ag zone 41, 42, 43 |
| Ag42 | Ag zone 42, 41 |
| Ag43 | Ag zone 43, 41 |
| Au40 | Ag zone 40 |
| Au41 | Au zone 41, 42, 43 |
| Au42 | Au zone 42, 41 |
| Au43 | Au zone 43, 41 |
| Cu1 | Cu zone 1 |
| Cu2 | Cu zone 2 |
| Pebble Project | Page 180 |
| NI 43-101 Technical Report Update and Preliminary Economic Assessment | August 21, 2023 |
|
|
|
| Domain Estimated | Domains Sourced |
| Cu40 | Cu zone 40 |
| Cu41 | Cu zone 41, 42, 43 |
| Cu42 | Cu zone 42, 41 |
| Cu43 | Cu zone 43, 41 |
| Mo40 | Mo zone 40 |
| Mo41 | Mo zone 41, 42, 43 |
| Mo42 | Mo zone 42, 41 |
| Mo43 | Mo zone 43, 41 |
| Re40 | Mo zone 40 |
| Re41 | Mo zone 41, 42, 43 |
| Re42 | Mo zone 42, 41 |
| Re43 | Mo zone 43, 41 |
14.10 Reasonable Prospects of Eventual Economic Extraction
The resource estimate is constrained by a conceptual pit that was developed using a Lerchs-Grossmann algorithm and is based on the parameters set out in Table 14-12.
QP Comment: The QP used the conceptual pit parameters as used by Gaunt. This is necessary to assess the outcomes obtained by Gaunt.
| Pebble Project | Page 181 |
| NI 43-101 Technical Report Update and Preliminary Economic Assessment | August 21, 2023 |
|
|
|
Table 14‑12: Pebble Deposit Conceptual Pit Parameters
| Parameter | Description | Units | Cost ($) | Value |
| Metal Price | Gold | $/oz | - | 1,540.00 |
| Copper | $/lb | - | 3.63 |
|
| Molybdenum | $/lb | - | 12.36 |
|
| Silver | $/oz |
| 20.00 |
|
| Metal Recovery | Copper | % | - | 91 |
| Gold | % | - | 61 |
|
| Molybdenum | % | - | 81 |
|
| Silver | % | - | 67 |
|
| Operating Cost | Mining (Mineralized Material or Waste) | $/ton mined | 1.01 | - |
| Added Haul Lift from Depth | $/ton/bench | 0.03 | - |
|
| Process |
|
|
|
|
| Process Cost Adjusted by Total Crushing Energy | $/ton milled | 4.40 | - |
|
| Transportation | $/ton milled | 0.46 | - |
|
| Environmental | $/ton milled | 0.70 | - |
|
| G&A | $/ton milled | 1.18 | - |
|
| Block Model | Current Block Model | ft | - | 75 x 75 x 50 |
| Density | Mineralized Material and Waste Rock | - | - | Block model |
| Pit Slope Angles | - | degrees | - | 42 |
14.11 Mineral Resource Classification
Mineral resources are classified as measured, indicated, and inferred. For a block to qualify as “measured,” the average distance to the nearest three drill holes must be 250 ft or less of the block centroid. For a block to qualify as “indicated,” the average distance from the block centroid to the nearest three holes must be 500 ft or less. For a block to qualify as “inferred,” it will generally be within 600 ft laterally and 300 ft vertically of a single drill hole. Blocks were plotted according to the above criteria and then individual 3D solids were created encompassing the block extents while eliminating outliers. These solids were then used to assign the final block classification.
QP Comment: The QP independently classified the estimated copper and gold resources. In the 2023 Amended Pebble Technical Report (effective date May 19, 2023), resources were classified in two steps: first using the classification schema described in the previous paragraph, and then by building classification domains that captured the majority of the blocks within each classification category but eliminated minor included or excluded pockets of differently classified blocks that if left as estimated would have resulted in a classical “spotted dog” pattern. The QP followed the same procedure, by first confirming the reasonableness of the classification criteria and then by constraining the classification categories using the wireframe classification domains. The comparison of estimation outcomes for copper and gold resources discussed in Section 14.10 was based on classified resources.
14.12 Copper Equivalency
The 2023 MRE was tabulated on the basis of CuEq; gold and molybdenum are converted to equivalent copper grade and those equivalencies are added to the copper grade. Neither silver nor rhenium grades were estimated prior to 2014 and 2020 respectively; therefore, to permit a direct comparison between previous resource estimates, the minor economic contribution of these metals was not included in the current CuEq calculation. To further maintain the comparison between the previous and current estimates, the CuEq formula is predicated upon the metal prices and metal recoveries used in the 2011 estimate. This does not affect the actual metal grades reported, only their equivalent copper grades when calculating the copper equivalent value.
| Pebble Project | Page 182 |
| NI 43-101 Technical Report Update and Preliminary Economic Assessment | August 21, 2023 |
|
|
|
Metallurgical testing determined that metal recoveries in the eastern portion of the deposit (west of State plane easting 1405600) can be expected to be higher than those for the western portion of the deposit. Therefore, separate equivalency estimates were made for the western and eastern portions of the deposit. The formulae used for the conversion are given as follows:

Where:
| · | Pebble West Au recovery = 69.6% |
|
|
|
| · | Pebble East Au recovery = 76.8% |
|
|
|
| · | Pebble West Cu recovery = 85% |
|
|
|
| · | Pebble East Cu recovery = 89.3% |
|
|
|
| · | Pebble West Mo recovery = 77.8% |
|
|
|
| · | Pebble East Mo recovery = 83.7% |
|
|
|
| · | Cu price = $1.85/lb |
|
|
|
| · | Au price = $902/oz |
|
|
|
| · | Mo price = $12.50/lb |
|
|
|
| · | all metal prices are based on the estimate in the 2011 PEA |
|
|
|
| · | g/oz = 31.10348 |
|
|
|
| · | lb/% = 22.046. |
QP Comment: The QP did not use the copper equivalency formula because only copper and gold resources were estimated and the copper equivalency formula is based on copper, gold, silver and molybdenum. However, the QP made several calculations of copper equivalent grades and compared those with the stated equivalent grades in the 2023 MRE. No discrepancies were found.
| Pebble Project | Page 183 |
| NI 43-101 Technical Report Update and Preliminary Economic Assessment | August 21, 2023 |
|
|
|
14.13 Cutoff Grade
Previous resource estimates for the Pebble deposit used a 0.3% CuEq cutoff grade and the QP believes maintaining that cutoff for consistency is important for eliminating the volatility which a different cut-off would incur. To confirm the 0.3% CuEq cutoff is still valid, the following calculation was completed using recent data.
| · | Copper price – $3.50 /lb |
|
|
|
| · | Copper-gold concentrate – 26% Cu |
|
|
|
| · | Payable copper – 82% of mined copper (with metallurgical recovery and smelter deductions) |
|
|
|
| · | Realization charges: |
|
| o | Copper treatment charges – $70 /dmt |
|
|
|
|
|
| o | Copper refining charges – $0.07 /lb |
|
|
|
|
|
| o | Copper-gold concentrate ocean shipping – $50 /wmt (assume 7% moisture) |
| · | Realization charges per pound of mined copper: |
·
| o | Copper treatment charges – $0.15 /lb of mined copper | |
| o | Copper refining charges – $0.09 /lb of mined copper | |
| o | Copper-gold concentrate ocean shipping – $0.11 /lb of mined copper | |
| o | Total realization charges – $0.35 /lb of mined copper |
| · | Unit net revenue – $2.52 /lb of mined copper |
|
|
|
| · | Operating costs – $10.96 /ton |
|
|
|
| · | Cutoff grade calculation: |
|
| o | Mined copper with value equal to operating costs – 4.35 lb |
|
|
|
|
|
| o | Equivalent grade – 0.22% CuEq. |
Given this calculation, it is evident the 0.3% CuEq cutoff grade is conservative and understates the size of the resource. Furthermore, the cutoff is consistent with previous Pebble resource estimates, offering the advantage of direct comparison with those tallies.
14.14 Block Model Validation
The block model was inspected visually for correspondence between composite grades and block grades. This inspection was carried out on vertical sections at 100-foot intervals both east-west and north-south. There is close agreement between composite and block grades. By way of example, Figure 14-12 shows the correlation between block and composite copper grades for vertical section 2158700 N.
| Pebble Project NI 43-101 Technical Report Update and Preliminary Economic Assessment | Page 184 August 21, 2023 |
|
|
|
Figure 14‑12: Pebble Deposit Vertical Section Showing Block and Composite Copper Grades; Section Line 2158700N
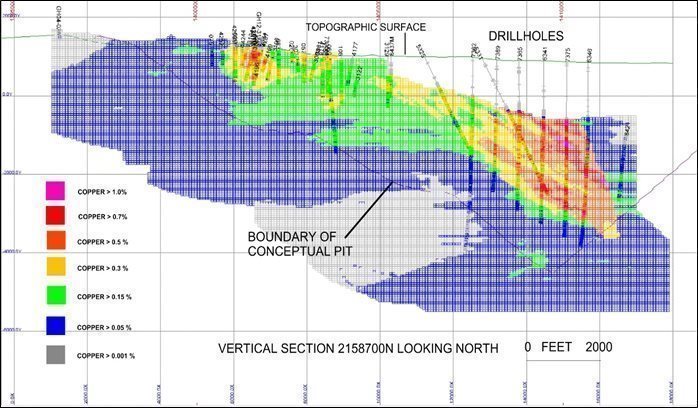
Note: Figures prepared by NDM, 2020.
The second type of validation consisted of swath plot analysis in which the variation in metal grade for both estimated blocks and informing samples is compared along a nominated section. The comparison for copper, gold, molybdenum and rhenium presented in Figure 14-13 to Figure 14-16 shows that there is reasonable agreement between the metal grades and the informing samples.
QP Comment: The swath plots generated by Gaunt are delimited by a specific section through the model whereas the swath plots generated by the QP represent an average of all values in a certain orientation, e.g., north-south or east-west or vertical. Regardless, the generated swath plots by the QP for copper for several domains and obtained good correlations between composite and block model grades.
| Pebble Project NI 43-101 Technical Report Update and Preliminary Economic Assessment | Page 185 August 21, 2023 |
|
|
|
Figure 14‑13: Copper Swath Plot at 2157000N

Note: Figure prepared by NDM, 2020.
Figure 14‑14: Gold Swath Plot at 2157000N
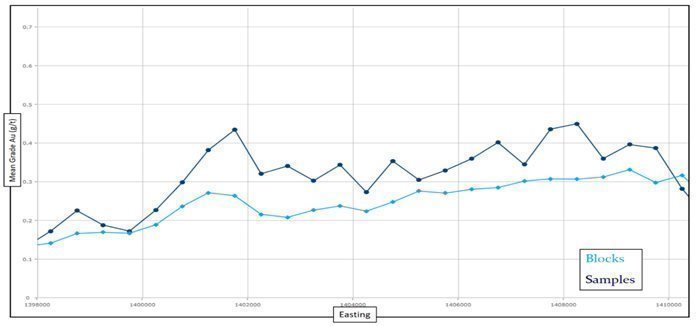
Note: Figure prepared by NDM, 2020
| Pebble Project NI 43-101 Technical Report Update and Preliminary Economic Assessment | Page 186 August 21, 2023 |
|
|
|
Figure 14‑15: Molybdenum Swath Plot at 2157000N
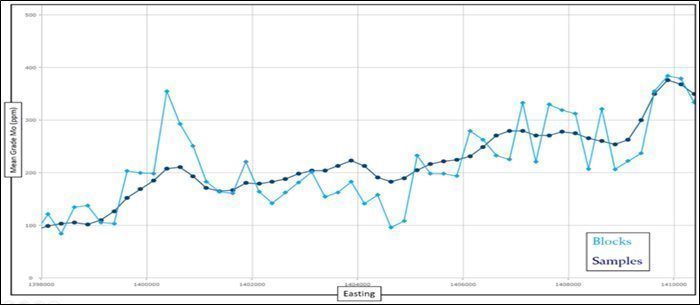
Note: Figure prepared by NDM, 2020
Figure 14‑16: Rhenium Swath Plot at 2157000N

Note: Figure prepared by NDM, 2020.
| Pebble Project NI 43-101 Technical Report Update and Preliminary Economic Assessment | Page 187 August 21, 2023 |
|
|
|
14.15 Factors That May Affect the Mineral Resource Estimates
Mineral resource estimates may ultimately be affected by a broad range of environmental, permitting, legal, title, socio-economic, marketing, and political factors pertaining to the specific characteristics of the Pebble deposit (including its scale, location, orientation and polymetallic nature) as well as its setting (from a natural, social, jurisdictional and political perspective).
The 2023 MRE contained herein have not been adjusted for any risk that the required environmental permits may not be obtained for the Pebble Project. The QP has reviewed the technical information and other factors that may affect the estimate including permitting and the letter from Steptoe and Johnson LLP dated August 17, 2023, regarding the remand of the negative ROD and Final Determination and believes that there are reasonable prospects of eventual economic extraction.
Other relevant factors which may affect the 2023 MRE include changes to the geological, geotechnical and geometallurgical models, infill drilling to convert mineral resources to a higher classification, drilling to test for extensions to known resources, collection of additional bulk density data and significant changes to commodity prices. It should be noted that all factors pose potential risks and opportunities, of greater or lesser degree, to the current mineral resource.
The QP notes that the mineral resource estimate in the 2023 Amended Pebble Technical Report (effective date May 19, 2023), has not taken into consideration the risk represented by the potential failure of Northern Dynasty to obtain necessary permits to advance the project but considers them to represent a risk to “reasonable prospects to eventual economic extraction”. The QP considers that, on the basis of the definition of “reasonable prospects for eventual economic extraction (reasonable prospects)” as set out in the CIM 2020 Guidance on Commodity Prices and Other Issues Related to Mineral Resource and Mineral Reserve Estimation (Adopted by CIM Council August 28, 2020), “reasonable prospects” are based solely on technical and economic considerations, and that permitting or other legal aspects of the project, while representing a risk to the completion or otherwise of the development of the Property, do not directly impact the evaluation of “reasonable prospects”. On that basis, the QP considers the Pebble deposit to exhibit reasonable prospects of eventual economic extraction and the 2023 MRE, disclosed herein, to be valid and to have been carried out in an acceptable manner and to reasonably represent the resources contained within the volume of rock that has been tested by drill holes. Permitting and other legal aspects that may affect the outcome of the project are legal matters of which the QP is not qualified to judge.
| Pebble Project NI 43-101 Technical Report Update and Preliminary Economic Assessment | Page 188 August 21, 2023 |
|
|
|
15 MINERAL RESERVE ESTIMATES
This section is not relevant to this report.
| Pebble Project | Page 189 |
| NI 43-101 Technical Report Update and Preliminary Economic Assessment | August 21, 2023 |
|
|
|
16 MINING METHODS
16.1 Introduction
The 2023 PEA is preliminary in nature and includes inferred mineral resources that are considered too speculative to have the economic considerations applied to them that would enable them to be categorized as mineral reserves. There is no certainty that the 2024 PEA results will be realized. Mineral resources that are not mineral reserves do not have demonstrated economic viability.
16.2 Mine Plan Inputs
16.2.1 Block Model
The mining team was provided with a 75 x 75 x 50 ft block model.
16.2.2 Pit Slope Angle
Pit slope angles are based on work completed by SRK in 2012 (SRK, 2012) report and outlined in Section 16.3.
16.2.3 Surface Topography
Northern Dynasty provided digital topographical drawings, as shown in Figure 16-1, which also shows the Upper Talarik limits and proposed open pit outlines.
16.2.4 Pit Optimization parameters
The conceptual economic, technical, and operational parameters used for open pit and mining schedule optimizations are provided in Table 16-1. Given the size of the resource and the fact that block model attributes are reported for the full blocks not the mineralized portions only, mining dilution is assumed to be 0.5% and mining recovery is assumed to be 99%.
| Pebble Project | Page 190 |
| NI 43-101 Technical Report Update and Preliminary Economic Assessment | August 21, 2023 |
|
|
|
Figure 16‑1: Proposed Open Pit
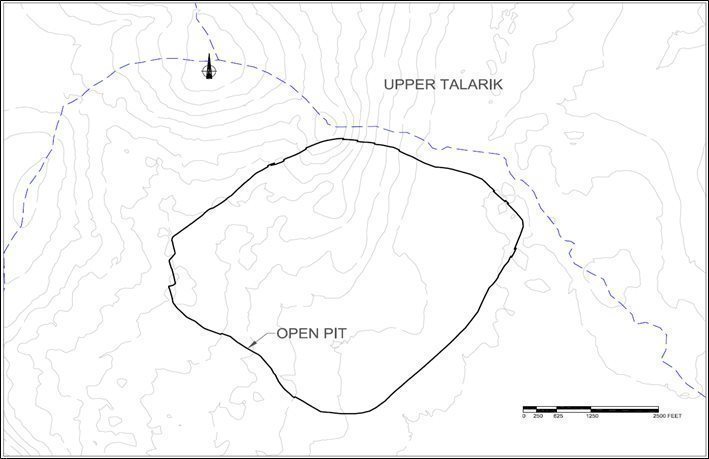
Note: Figure prepared by Tetra Tech Canada Inc., 2021.
| Pebble Project | Page 191 |
| NI 43-101 Technical Report Update and Preliminary Economic Assessment | August 21, 2023 |
|
|
|
Table 16‑1: Pit Optimization Parameters
| Item | Description | Units | Value |
| Mill Production Rate |
| ton/d | 180,000 |
| Metal Price | Gold | $/oz | 1,600 |
| Copper | $/lb | 3.00 |
|
| Molybdenum | $/lb | 9.00 |
|
| Silver | $/oz | 18.00 |
|
| Metal Recovery | Copper | % | Variable |
| Gold | % | Variable |
|
| Molybdenum | % | Variable |
|
| Silver | % | Variable |
|
| Concentrates | Copper-gold concentrate Grade | % Cu | 26.0 |
| Moisture Content – Cu Concentrate | % | 8.0 |
|
| Gold in Cu Concentrate | g/ton | Variable |
|
| Silver in Cu Concentrate | g/ton | Variable |
|
| Molybdenum Concentrate Grade | % Mo | 50.0 |
|
| Moisture Content – Mo Concentrate | % | 8.0 |
|
| Transportation | Cu Concentrate |
|
|
| - Pumping from Mine Site to Marine Terminal | $/wet ton | 5.72 |
|
| - Ocean transportation costs | $/wmt | 45.35 |
|
| - Doré | $/oz | 1.00 |
|
| Mo Concentrate |
|
|
|
| - Trucking from Mine Site to Marine Terminal | $/wet ton | 0.00 (Using returning traffic) |
|
| - Ocean Transportation Costs | $/wet ton | 75.28 |
|
| Metal Payable | Copper in Cu Concentrate | % | 96.15 |
| Gold in Cu Concentrate | % | 97.00 |
|
| Silver in Cu Concentrate | % | 90.00 |
|
| Gold in Doré | % | 99.85 |
|
| Silver in Doré | % | 99.50 |
|
| Mo in Mo Concentrate | % | 98.50 |
|
| Marketing | Concentration Losses | % | 0.15 |
| Insurance | % of value | 0.10 |
|
| Representation | $/wet ton of concentrate | 2.27 |
| Pebble Project | Page 192 |
| NI 43-101 Technical Report Update and Preliminary Economic Assessment | August 21, 2023 |
|
|
|
| Item | Description | Units | Value |
| Treatment, Smelting and Refining Terms |
|
|
|
| Treatment of Cu Concentrate | $/dry ton of concentrate | 77.11 |
|
| Refining of Cu in Cu Concentrate | $/payable lb | 0.085 |
|
| Refining of Au in Cu Concentrate | $/payable oz | 7.00 |
|
| Refining of Ag in Cu Concentrate | $/payable oz | 0.50 |
|
| Refining of Au/Ag Doré | $/payable oz | 1.00 |
|
| Roasting of Mo in Mo Concentrate | $/payable lb | 3.00 |
|
| Operating Cost | Mining (Ore or Waste) at 950 ft elevation | $/ton mined | 1.01 |
| Added Mining Cost by Depth | $/ton mined/bench | 0.03 |
|
| Process Cost Adjusted by Crushing Energy | $/ton milled | Variable |
|
| Site facilities | $/ton milled | 0.59 |
|
| Environmental | $/ton milled | 0.56 |
|
| Road maintenance | $/ton milled | 0.02 |
|
| Port & logistics | $/ton milled | 0.68 |
|
| Tailings | $/ton milled | 0.02 |
|
| Water Treatment | $/ton milled | 0.64 |
|
| G&A | $/ton milled | 0.61 |
|
| Block Model | Block Dimension | ft x ft x ft | 75 x 75 x 50 |
| Specific Gravity | - | Variable |
|
| Mining Dilution |
| % | 0.50 |
| Mining Recovery |
| % | 99.00 |
| Pit Slope Inputs |
|
| See Section 16.3 |
16.3 Mine Design
Slope design recommendations are provided in SRK (2012) and summarized as follows:
| · | A maximum stack height (MSH) of 400 ft is recommended. |
|
|
|
| · | At a minimum, a geotechnical berm of 65 ft should be used separate the various stacks. |
|
|
|
| · | Inter-ramp angle (IRA) = variable, depending on kinematics and rock mass stability, ranging from 40° to 55°. |
|
|
|
| · | Bench face angle (BFA) = variable, kinematically controlled, expected break-back angles in the range of 75° to 55°. |
|
|
|
| · | Double-benching (100 ft) is recommended in all sectors, with the exception of the YGs-weak rocks which should be single-benched (50 ft). Fault-zones are considered ‘weak’ and need to be single-benched at a rate of one below and three above, and should be further investigated and applied at the feasibility level. |
|
|
|
| · | Bench width (BW) should be scaled according to the rock mass condition, typically in the range of 30 to 50 ft for the 25-year pit. |
| Pebble Project | Page 193 |
| NI 43-101 Technical Report Update and Preliminary Economic Assessment | August 21, 2023 |
|
|
|
Recommended slope designs are shown in Figure 16-2 and Figure 16-3.
Figure 16‑2: Pit Wall Slope for Cretaceous North West Sector

Note: Figure prepared by SRK, 2012.
| Pebble Project | Page 194 |
| NI 43-101 Technical Report Update and Preliminary Economic Assessment | August 21, 2023 |
|
|
|
Figure 16‑3: Pit Wall Slope for Cretaceous North Sector
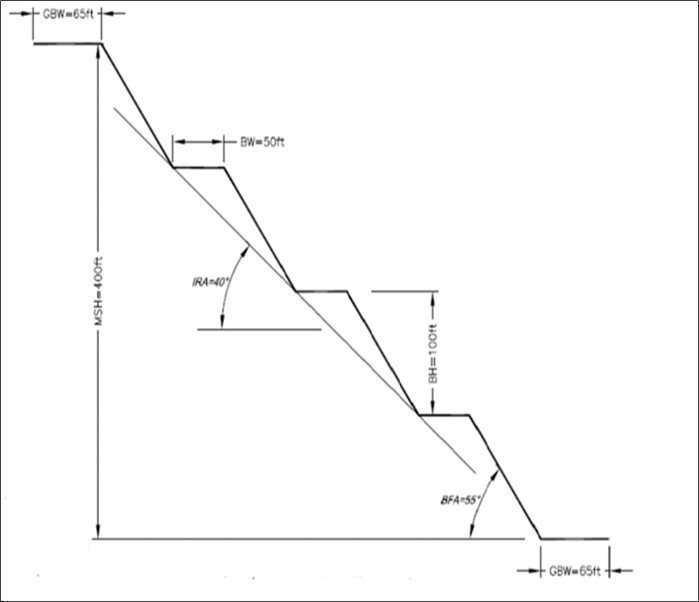
Note: Figure prepared by SRK, 2012.
16.4 Minimum Working Area
Benches were designed to accommodate 80 yd3 electric cable shovels and 400-ton haulage trucks. In narrow areas and at the pit bottom, where mining widths are reduced, QP Abdel Hafez recommends the use of a 53 yd3 wheel loader.
| Pebble Project | Page 195 |
| NI 43-101 Technical Report Update and Preliminary Economic Assessment | August 21, 2023 |
|
|
|
16.4.1 Haul Road
Main haul roads for the Pebble Project were designed to accommodate 400-ton haulage trucks with two-way traffic. Haul road design details are provided in Table 16-2 and Figure 16-4. Ramps were designed with a maximum grade of 10%.
Table 16-2: Haul Road Width
| Traffic | Two-way (ft) |
| Running Surface | 112.0 |
| Safety Berm | 18.0 |
| Total | 130.0 |
Figure 16-4: Two-Way Haul Road
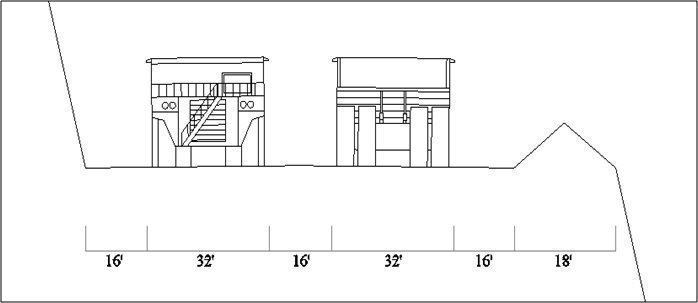
Note: Figure prepared by Tetra Tech Canada Inc., 2021.
16.4.2 Pit Hydrology/Dewatering
QP Abdel Hafez has not performed any pit hydrology/dewatering study for this PEA. However, an allowance has been included in the mining operating cost to account for pit dewatering costs.
16.4.3 Pit Design Results
Based on the annual production forecasts presented in Table 16-6, a material summary from the final pit is provided in Table 16 3 and the final pit is shown in Figure 16-5. The LOM strip ratio of the final pit is 0.12:1. Details of the annual production forecasts are in Table 16-6 Production Forecasts.
| Pebble Project | Page 196 |
| NI 43-101 Technical Report Update and Preliminary Economic Assessment | August 21, 2023 |
|
|
|
Table 16-3: Open Pit Design Results
| Material | Mass (Mton) | Cu (%) | Au (oz/ton) | Mo (ppm) | Ag (oz/ton) | Re (ppm) |
| Mineralized Material | 1,291 | 0.29 | 0.01 | 154 | 0.04 | 0.28 |
| Overburden | 60 | - | - | - | - | - |
| Waste rock | 93 | - | - | - | - | - |
Figure 16-5: Final Open Pit

Note: Figure prepared by Tetra Tech Canada Inc., 2021.
16.5 Mine Plan
The open pit mine for the proposed project would be a conventional drill, blast, truck, and shovel operation with an average mining rate of 70 Mtons per year and an overall stripping ratio of 0.12 ton of waste per ton of mineralized material.
The open pit would be developed in stages, with each stage expanding the area and deepening the previous stage. The final dimensions of the open pit would be 6,800 ft long and 5,600 ft wide, with the depth to 1,950 ft.
| Pebble Project | Page 197 |
| NI 43-101 Technical Report Update and Preliminary Economic Assessment | August 21, 2023 |
|
|
|
Mining would occur in two phases – preproduction and production.
The mine operation would commence during the last year of the preproduction phase and extend for 20 years during the production phase.
The preproduction phase would consist of dewatering the pit area and mining of non-economic materials overlying the mineralized material from the initial stage of the open pit. Dewatering would begin one year before the start of preproduction mining. 33 million tons of material would be mined during this phase (Table 16-4).
Table 16-4: Mined Material – Preproduction Phase
| Material Type | Quantity (M tons) |
| Overburden | 22 |
| Waste rock | 11 |
The production phase encompasses the period during which economic-grade mineralized material would be fed to the process plant to produce concentrates for shipment and sale. The production phase is planned to last for 20 years. Mineralized material would be mined and be fed through the process plant at a rate of 180,000 tons/day. The open pit would be mined in a sequence of increasingly larger and deeper stages. 1.4 B tons of material are planned to be mined during the production phase (Table 16-5).
Table 16-5: Mined Material – Production Phase
| Material Type | Quantity (M tons) |
| Overburden | 38 |
| Mineralized material process plant feed | 1,291 |
| Waste rock | 82 |
A detailed annual production forecast is shown in Table 16-6 and Figure 16-6. The mining forecast was generated using five pushbacks and was based on a maximum processing capacity of 180,000 tons per day. Based on the selected ultimate pit, final pit design and the generated production schedule, the Pebble Project’s total LOM is 21 years, including 1 year of preproduction stripping followed by 20 years of production. Over the 21-year LOM, the pit would produce 1,291 Mtons of mineralized material and 153 Mtons of overburden and waste rock. The LOM stripping ratio (defined as waste material mined, in tons, divided by mineralized material mined, in tons) is 0.12:1.
Table 16-6: Production Forecast
| Year | Total Material Mined (Mtons) | Plant Feed (Mtons) | Waste (Mtons) | Strip Ratio | Copper (%) | Gold (oz/ton) | Molybdenum (ppm) | Silver (oz/ton) | Rhenium (ppm) |
| -1 | 33.07 | - | 33.07 |
|
|
|
|
|
|
| 1 | 62.75 | 43.81 | 18.93 | 0.43 | 0.35 | 0.01 | 168 | 0.04 | 0.29 |
| 2 | 70.55 | 65.72 | 4.83 | 0.07 | 0.38 | 0.01 | 197 | 0.04 | 0.35 |
| 3 | 70.55 | 65.72 | 4.83 | 0.07 | 0.33 | 0.01 | 235 | 0.04 | 0.42 |
| 4 | 70.55 | 65.72 | 4.83 | 0.07 | 0.31 | 0.01 | 147 | 0.04 | 0.26 |
| 5 | 70.53 | 65.72 | 4.81 | 0.07 | 0.29 | 0.01 | 132 | 0.05 | 0.23 |
| 6 | 70.52 | 65.72 | 4.80 | 0.07 | 0.28 | 0.01 | 192 | 0.04 | 0.34 |
| Pebble Project | Page 198 |
| NI 43-101 Technical Report Update and Preliminary Economic Assessment | August 21, 2023 |
|
|
|
| Year | Total Material Mined (Mtons) | Plant Feed (Mtons) | Waste (Mtons) | Strip Ratio | Copper (%) | Gold (oz/ton) | Molybdenum (ppm) | Silver (oz/ton) | Rhenium (ppm) |
| 7 | 70.55 | 65.72 | 4.83 | 0.07 | 0.33 | 0.01 | 165 | 0.05 | 0.30 |
| 8 | 70.54 | 65.72 | 4.82 | 0.07 | 0.32 | 0.01 | 180 | 0.04 | 0.34 |
| 9 | 72.75 | 65.70 | 7.06 | 0.11 | 0.27 | 0.01 | 100 | 0.04 | 0.19 |
| 10 | 71.66 | 65.72 | 5.94 | 0.09 | 0.29 | 0.01 | 126 | 0.04 | 0.23 |
| 11 | 70.72 | 65.72 | 5.00 | 0.08 | 0.27 | 0.01 | 144 | 0.04 | 0.26 |
| 12 | 72.32 | 65.72 | 6.61 | 0.10 | 0.29 | 0.01 | 154 | 0.04 | 0.28 |
| 13 | 72.74 | 65.72 | 7.02 | 0.11 | 0.31 | 0.01 | 169 | 0.04 | 0.30 |
| 14 | 72.75 | 65.70 | 7.05 | 0.11 | 0.33 | 0.01 | 159 | 0.05 | 0.29 |
| 15 | 72.69 | 65.72 | 6.97 | 0.11 | 0.22 | 0.01 | 89 | 0.05 | 0.16 |
| 16 | 72.75 | 65.65 | 7.10 | 0.11 | 0.25 | 0.01 | 127 | 0.04 | 0.23 |
| 17 | 72.73 | 65.72 | 7.01 | 0.11 | 0.25 | 0.01 | 166 | 0.04 | 0.30 |
| 18 | 72.75 | 65.62 | 7.13 | 0.11 | 0.19 | 0.01 | 74 | 0.04 | 0.13 |
| 19 | 65.72 | 65.72 | 0.00 | 0.00 | 0.25 | 0.01 | 182 | 0.04 | 0.32 |
| 20 | 64.06 | 64.06 | 0.00 | 0.00 | 0.20 | 0.00 | 184 | 0.03 | 0.32 |
| Total/Avg. | 1,443.23 | 1,290.60 | 152.63 | 0.12 | 0.29 | 0.01 | 154 | 0.04 | 0.28 |
Figure 16-6: Production Forecast
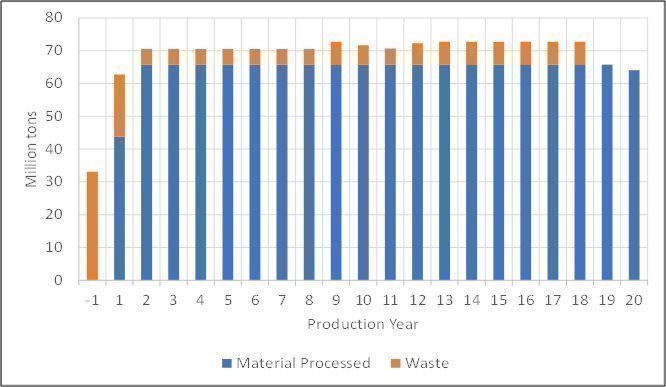
Note: Figure prepared by Tetra Tech Canada Inc., 2021.
| Pebble Project | Page 199 |
| NI 43-101 Technical Report Update and Preliminary Economic Assessment | August 21, 2023 |
|
|
|
16.6 Blasting
Open pit blasting would be conducted using either emulsion blasting agents manufactured on site or, in dry conditions, a blend of ammonium nitrate and fuel oil (ANFO). The preference would be to use the emulsion blasting agent because of its higher density and superior water resistance. Initial operations during the preproduction phase may use pre-packed emulsion blasting agents or a mobile bulk emulsion manufacturing plant until the permanent explosives plant is completed.
Ammonium nitrate prill would be shipped to the site in containers and stored separately as a safety precaution. All explosive magazines would be constructed and operated to meet mine safety and health regulations. The ammonium nitrate prill would be converted to solution in the explosives plant and transported to the blasting site in a mobile mixing unit. There it would be mixed with diesel fuel and emulsifying agents as it is discharged into the blast holes. The emulsion would become a blasting agent only once it is sensitized using the sensitizing agent while in the drill hole.
Based on knowledge of the rock types in the Pebble deposit, blasting would require an average powder factor of 0.5 pounds per ton of rock. Blasting events during the preproduction phase would occur once per day. The frequency would increase during the production phase, with events occurring as often as twice per day.
16.7 Mine Waste Rock Management
Waste rock material with a mineral content below an economically recoverable level that is removed from the open pit, exposing the higher-grade production material. Waste rock would be segregated by its potential to generate acid. NPAG and non-metal leaching (ML) waste rock may be used for embankment construction. PAG and ML waste rock would be stored in the pyritic TSF until mine closure, when it would be back hauled into the open pit.
Quantities of waste material mined are outlined in Table 16-7. During the preproduction phase, 33 Mtons of non-mineralized and mineralized material would be removed from the open pit. Non-mineralized waste and overburden would be stockpiled or used in construction, mineralized waste would be stockpiled and relocated to the pyritic TSF once complete, or if grades are sufficient, stockpiled for milling once the mill is complete. Material would be stockpiled within the pit footprint, or in designated stockpiles as appropriate.
Overburden is the unconsolidated material lying at the surface. At the Pebble deposit, the overburden depth ranges from 0 to 140 ft. Overburden removal would commence during the preproduction phase and would recur periodically during the production phase at the start of each pit stage. The overburden would be segregated and stockpiled in a dedicated location southwest of the open pit. A berm built of non-mineralized rock would surround the overburden to contain the material and increase stability. Overburden materials deemed suitable would be used for construction. Fine- and coarse-grained soils suitable for plant growth would be stockpiled for later use as growth medium during reclamation. Growth medium stockpiles would be stored at various locations around the mine site and stabilized to minimize erosion potential. Details on how the PAG material would be reclaimed are provided in Section 18.
Table 16-7: Overburden and Waste Rock Mined Over the LOM
| Material | Preproduction | Production | Total |
| Overburden (Mtons) | 22 | 38 | 60 |
| Waste Rock (Mtons) | 11 | 82 | 93 |
| Total (Mtons) | 33 | 110 | 153 |
| Pebble Project | Page 200 |
| NI 43-101 Technical Report Update and Preliminary Economic Assessment | August 21, 2023 |
|
|
|
16.8 Mining Equipment
16.8.1 Mine Equipment Fleet
The project production fleet would use the most efficient mining equipment available to minimize fuel consumption per ton of rock moved. Most mining equipment would be diesel-powered. This production fleet would be supported by a fleet of smaller equipment for overburden removal and other specific tasks for which the larger units are not well-suited. Equipment requirements would increase over the life of the mine to reflect increased production volumes and longer cycle times for haul trucks as the pit is lowered. All fleet equipment would be routinely maintained to ensure optimal performance and minimize the potential for spills and failures. Mobile equipment (haulage trucks and wheel loaders) would be serviced in the truck shop; track-bound equipment (shovels, excavators, drills, and dozers) would be serviced in the field under appropriate spill prevention protocols. Track-mounted electric shovels would be the primary equipment unit used to load blasted rock into haulage trucks. Each electric shovel is capable of mining at a sustained rate of 30 million tons per year.
Wheel loaders are highly mobile, can be rapidly deployed to specific mining conditions, and are highly flexible in their application.
Diesel off-highway haulage trucks would be used to transport the fragmented mineralized material to the crusher.
Track-mounted drill rigs are used to drill blast holes into the waste rock and mineralized material prior to blasting. Hole diameters would vary between 6 and 12 in. Drill rigs may be either electrically powered, as is the case for the larger units, or diesel powered.
This equipment would be supported by a large fleet of ancillary equipment, including track and wheel dozers for surface preparation, graders for construction and road maintenance, water trucks for dust suppression, maintenance equipment, and light vehicles for personnel transport. Other equipment, such as lighting plants, would be used to improve operational safety and efficiency.
The equipment selection, sizing, and fleet requirements were based on anticipated site operating conditions, haulage profiles, cycle times and overall equipment utilization. Large mining equipment have been selected to match the production schedule. In determining the number of units for the major equipment such as drills, shovels and trucks annual operating hours have been calculated and compared to the available hours for the equipment. Mine support equipment such as track dozers, motor graders, water trucks and snow and sanding trucks have been matched with major mining equipment. Equipment additions and replacements have been determined for each piece of major and support equipment.
16.8.2 Operating Hours
Mining is assumed to operate 365 days per year, with 2 shifts per day and 12 hours per shift. As shown in Table 16-8, the expected delays per shift are 177 minutes.
| Pebble Project | Page 201 |
| NI 43-101 Technical Report Update and Preliminary Economic Assessment | August 21, 2023 |
|
|
|
Table 16-8: Operational Delays per Shift
| Delay | Time (min) |
| Weather | 24 |
| Breaks | 60 |
| Shift Change | 30 |
| Blasting | 30 |
| Communication | 2 |
| Training | 1 |
| Fuel, Equipment Moves, Other | 30 |
| Total | 177 |
16.8.3 Primary Equipment
Loading would be performed using the 80 yd3 cable shovels and hauling would be performed using the 400-ton haulage trucks.
Blasthole drilling would be performed using 12.25 in. electric rotary drills as primary drilling equipment, and smaller 6.5 in. rigs would be used for wall control. Blasting would be performed using ANFO and emulsion with mix proportions of 0.85 and 0.15, respectively.
The primary equipment requirements for the LOM are summarized in Table 16-9. Mining equipment will be used to support initial construction and subsequent raising of the tailing dams. Therefore, Table 16-10 includes the equipment requirements for mining and tailings dam construction. The initial and sustaining purchase costs of the equipment required to construct and raise the tailing dams are embedded in the mining initial and sustaining capital costs.
Table 16-9: Primary Equipment Requirements
| Year | Electric Drills 12.25" | Electric Cable Shovels 80 yd3 | Wheel Loader 53 yd3 | Wheel Loader 25 yd3 | Haulage Trucks 400 ton | Haulage Trucks 150 ton |
| -3 | 3 | 0 | 2 | 2 | 11 | 8 |
| -2 | 3 | 0 | 2 | 2 | 11 | 8 |
| -1 | 4 | 1 | 3 | 2 | 15 | 9 |
| 1 | 4 | 2 | 3 | 2 | 15 | 9 |
| 2 | 4 | 2 | 3 | 2 | 15 | 9 |
| 3 | 4 | 2 | 3 | 2 | 15 | 9 |
| 4 | 4 | 2 | 3 | 2 | 15 | 9 |
| 5 | 4 | 2 | 3 | 2 | 15 | 9 |
| 6 | 4 | 2 | 3 | 2 | 16 | 9 |
| 7 | 4 | 2 | 3 | 2 | 16 | 9 |
| 8 | 4 | 2 | 3 | 2 | 18 | 9 |
| 9 | 4 | 2 | 3 | 2 | 18 | 9 |
| 10 | 4 | 2 | 3 | 2 | 18 | 9 |
| 11 | 4 | 2 | 3 | 2 | 18 | 9 |
| Pebble Project | Page 202 |
| NI 43-101 Technical Report Update and Preliminary Economic Assessment | August 21, 2023 |
|
|
|
| Year | Electric Drills 12.25" | Electric Cable Shovels 80 yd3 | Wheel Loader 53 yd3 | Wheel Loader 25 yd3 | Haulage Trucks 400 ton | Haulage Trucks 150 ton |
| 12 | 4 | 2 | 3 | 2 | 18 | 9 |
| 13 | 4 | 2 | 2 | 2 | 19 | 9 |
| 14 | 4 | 2 | 2 | 2 | 19 | 9 |
| 15 | 4 | 2 | 2 | 2 | 19 | 9 |
| 16 | 4 | 2 | 2 | 1 | 19 | 9 |
| 17 | 4 | 2 | 2 | 1 | 19 | 9 |
| 18 | 3 | 2 | 2 | 1 | 17 | 9 |
| 19 | 3 | 2 | 2 | 1 | 17 | 9 |
| 20 | 3 | 2 | 2 | 1 | 16 | 9 |
16.8.4 Support and Ancillary Equipment
The selection of support equipment takes into account the size and type of the main fleet for loading and hauling, the geometry and size of the pit and the number of roads and WDs that would operate at the same time. It reflects experience at operations of similar size and also considers the specific characteristics of the Pebble Project.
The support equipment requirements and the mine ancillary equipment fleet requirements for the life of mine are summarized in Table 16-10 and Table 16-11, respectively.
Table 16-10: Support Equipment Requirements
| Equipment | Maximum Fleet Size |
| Track Dozer 850 hp | 3 |
| Track Dozer 600 hp | 7 |
| Wheel Dozer 684 hp | 2 |
| Grader 24 ft | 2 |
| Water Truck 52,000 gal | 2 |
| Wall Control Drill (6.5") | 1 |
| Blasthole Stemmer | 2 |
| Pebble Project | Page 203 |
| NI 43-101 Technical Report Update and Preliminary Economic Assessment | August 21, 2023 |
|
|
|
Table 16-11: Ancillary Equipment Requirements
| Equipment | Maximum Fleet Size |
| Vibratory Compactor | 4 |
| Integrated Tool Carrier | 1 |
| Excavator | 1 |
| Motivator | 1 |
| Flatbed Truck | 1 |
| Fuel/Lube Truck | 3 |
| Mechanics Service Truck | 2 |
| Welder Truck | 2 |
| Tire Service Truck | 2 |
| Snow/Sand Truck | 2 |
| Pickup Truck | 10 |
| Mobile Crane | 2 |
| Rough Terrain Forklift | 2 |
| Shop Forklift | 2 |
| Light Plant | 8 |
| Dispatch System | 1 |
| Mobile Radios | 100 |
| Cable Reeler | 1 |
16.9 Mining Labour
Salaried and hourly labour requirements for the mine were determined for each labour category. The machine operator and maintenance labour complement reflect employees on payroll (as opposed to on-site) and aligns with a two-week-on/one-week-off shift schedule. Each shift would be 12 hours long.
The average ratio of maintenance labour complement to operator labour complement was estimated at 0.63:1. The maintenance labour estimate is based on historical ratios between equipment operators and maintenance mechanics and electricians. All other labour and staff numbers were estimated from experience with existing mines and anticipated operating conditions for the project.
A benefit package of 40% was applied to both salaried staff and the hourly labour base rates. The labour burden consists of vacation, statutory holidays, medical and health insurance, employment insurance, long-term disability insurance, overtime, shift differential and other factors.
The hourly mining operator and maintenance labour on payroll is shown in Table 16-12. Table 16-13 shows the maximum salaried staff requirements during the life of mine.
| Pebble Project | Page 204 |
| NI 43-101 Technical Report Update and Preliminary Economic Assessment | August 21, 2023 |
|
|
|
Table 16-12: Operator and Maintenance Staff on Payroll
| Year | Operators | Maintenance | Total |
| -1 | 62 | 58 | 120 |
| 1 | 82 | 68 | 150 |
| 2 | 88 | 71 | 159 |
| 3 | 90 | 72 | 162 |
| 4 | 89 | 72 | 161 |
| 5 | 91 | 72 | 163 |
| 6 | 95 | 74 | 169 |
| 7 | 96 | 75 | 171 |
| 8 | 101 | 77 | 178 |
| 9 | 90 | 72 | 162 |
| 10 | 93 | 73 | 166 |
| 11 | 95 | 74 | 169 |
| 12 | 100 | 77 | 177 |
| 13 | 105 | 79 | 184 |
| 14 | 107 | 80 | 187 |
| 15 | 95 | 74 | 169 |
| 16 | 97 | 75 | 172 |
| 17 | 102 | 78 | 180 |
| 18 | 98 | 76 | 174 |
| 19 | 102 | 78 | 180 |
| 20 | 108 | 80 | 188 |
Table 16-13: Maximum Number of Employees over the Life of Mine
| Position | Maximum Number of Employees |
| Mine Management | 1 |
| Technical Services Staff | 21 |
| Operations Staff | 12 |
| Maintenance Staff | 9 |
| Total | 43 |
| Pebble Project | Page 205 |
| NI 43-101 Technical Report Update and Preliminary Economic Assessment | August 21, 2023 |
|
|
|
17 RECOVERY METHODS
17.1 Summary
The processing plant is designed with a feed rate of 180,000 tons per day. The feed material will be processed to produce two principal products, a copper-gold flotation concentrate, and a molybdenum flotation concentrate, as well as a tertiary gravity gold concentrate, through the following unit processes:
| · | primary crushing, |
|
|
|
| · | grinding with SAG and ball mills, |
|
|
|
| · | bulk copper-gold-molybdenum flotation, |
|
|
|
| · | gravity concentration in the regrind circuit of the bulk rougher concentrate, and |
|
|
|
| · | molybdenum flotation to separate a copper-gold flotation concentrate and a molybdenum flotation concentrate. |
Figure 17-1 shows a simplified process flowsheet of the entire process route.
Run-of-mine material is delivered to one of two primary gyratory crushers to reduce the material to a nominal particle size P80 of 145 mm. The crushed material from both crushers is delivered via a single overland conveyor to a covered stockpile.
Coarse material is reclaimed from the stockpile onto two SAG mill feed conveyors and into the SAG/ball milling/pebble crushing (SABC) circuit. The SAG mills grind the mill feed material and discharge the slurry onto the associated SAG mill discharge screen where the oversize pebbles are conveyed to the pebble crushing building. Crushed pebbles are sent to the pebble crushing screen. SAG mill discharge screen and pebble crushing screen undersize is pumped with the ball mill discharge to cyclones that produces an overflow fraction P80 of 135 µm for the downstream flotation processes.
Bulk rougher scavenger flotation is carried out through two trains of eight 630 m3 flotation cells. The bulk (copper-gold-molybdenum) concentrate is reground to a P80 of 25 µm prior to cleaner flotation. Cyclone underflow from the regrind circuit is treated with a gravity concentrator to produce a gravity gold concentrate that would be pumped to geotextile dewatering bags for dewatering.
Regrind cyclone overflow is treated by three stages of cleaner flotation with the final bulk concentrate to be thickened prior to molybdenum separation. The molybdenum rougher product is reground with a high intensity grinding (HIG) mill producing a P80 of 25 µm product. By selective molybdenum flotation and four stages of cleaning, final molybdenum, and copper-gold concentrates is produced. Molybdenum and copper-gold concentrates are individually thickened, filtered, (and in the case of the molybdenum concentrate, dried) and containerized at mine site for shipment to the marine terminal.
17.2 Simplified Process Flowsheet
Figure 17-1 shows a simplified process flowsheet of the entire process route.
| Pebble Project NI 43-101 Technical Report Update and Preliminary Economic Assessment | Page 206 August 21, 2023 |
|
|
|
Figure 17‑1: Simplified Process Flowsheet
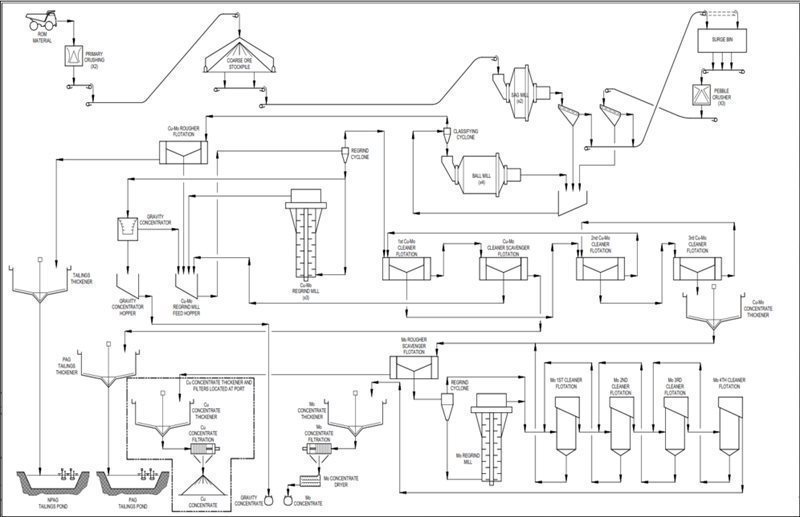
Note: Figure prepared by Ausenco, 2021.
| Pebble Project NI 43-101 Technical Report Update and Preliminary Economic Assessment | Page 207 August 21, 2023 |
|
|
|
17.3 Process Design Criteria
The process design criteria are summarized in Table 17-1.
Table 17‑1: Major Process Design Criteria
| Criteria | Units | Value |
| Daily Process Rate | tons/d | 180,000 |
| Operating Days per Year | d/a | 365 |
| Life of Mine | y | 20 |
| Feed Grades |
||
| Copper | % Cu | 0.46 |
| Gold | g/t Au | 0.47 |
| Molybdenum | % Mo | 0.03 |
| Concentrate Grades |
||
| Copper-gold Concentrate Grade | %Cu | 26 |
| g/t Au | 16 |
|
| Molybdenum Concentrate Grade | %Mo | 50 |
| Gravity Gold Concentrate Grade | g/t Au | 44 |
| Comminution Characteristics |
||
| JK A x b | - | 46.0 |
| Bond Ball Mill Work Index, BWi | kWh/t | 13.0 |
| Bond Abrasion Index Ai, Average | g | 0.297 |
| Primary Crushing |
||
| Availability | % | 75 |
| Primary Crushing Rate | tons/h | 10,000 |
| Circuit Arrangement | - | gyratory |
| Primary Crushing Product Particle Size, P80 | mm | 145 |
| Grinding |
||
| Availability | % | 92 |
| Grinding Process Rate | tons/h | 8,152 |
| Circuit Arrangement | - | SABC |
| Primary Grind Product Size, P80 | µm | 135 |
| Flotation/Regrind/Gravity |
||
| Availability | % | 92 |
| Flotation Circuit Feed Rate | tons/h | 8,152 |
| Pebble Project NI 43-101 Technical Report Update and Preliminary Economic Assessment | Page 208 August 21, 2023 |
|
|
|
| Criteria | Units | Value |
| Cu-Mo Bulk Flotation Circuit Arrangement | - | rougher/regrind/3-stage cleaner |
| Cu-Mo Bulk Rougher Concentrate Regrind Size, P80 | µm | 25 |
| Proportion of Cyclone Underflow to Gravity (by Weight) | % | 35 |
| Mo Flotation Circuit Arrangement | - | rougher/regrind/4-stage cleaner |
| Mo Rougher Concentrate Regrind Size, P80 | µm | 25 |
| Concentrate Dewatering |
||
| Cu concentrate Filter Cake Moisture Content | % | 8.5 |
| Gravity Concentrate Moisture | % | 15 |
| Molybdenum Concentrate Dryer Product Moisture | % | 5 |
Note: The PDC was developed in metric units and then converted into US units in the process description write-up.
17.4 Process Plant Description
17.4.1 Primary Crushing
Mineralized material is delivered by haulage trucks to each of the two 60 ft x 110 ft fixed primary gyratory crushers. The crushers are set to produce a product P80 of 145 mm. Located underneath each primary crusher are the crusher discharge vaults and apron feeders that control the rate of discharge onto the sacrificial conveyor belt below.
The crushing plant is designed for an operating availability of 75%. Each crusher has a typical operating range of 5,000-6,000 tons/h depending on the ROM material size distribution. Each crusher discharges onto a common main overland conveyor via a respective transfer conveyor. Each primary crushing station is equipped with a rock breaker, dust control equipment and sumps for surface run-off collection.
The major primary crushing equipment is as follows:
| · | two 60 ft x 110 ft primary gyratory crushers; each fitted with a 1,500-kW drive. |
|
|
|
| · | discharge vault apron feeders and sacrificial belt conveyors. |
17.4.2 Stockpile
Primary crusher product is conveyed by the overland conveyor to the stockpile located adjacent to the grinding and flotation building. The covered stockpile has a live capacity of 90,000 tons or 12 hours of mill operating time.
Under normal operation, mill feed material is reclaimed by two lines of three apron feeders onto two reclaim conveyor belts to the two grinding lines.
| Pebble Project NI 43-101 Technical Report Update and Preliminary Economic Assessment | Page 209 August 21, 2023 |
|
|
|
17.4.3 Primary Grinding
Two identical trains of SAG mill, followed by a conventional ball mill and pebble crusher (collectively SABC circuit) receive reclaimed mill feed material from the coarse material stockpile (COS). Each train has an average throughput of 90,000 short tons per day. The equipment for the two primary grinding lines would comprise:
| · | two 42 ft diameter x 27 ft effective grinding length (EGL) SAG mills each with 30 MW gearless drive |
|
|
|
| · | screens, conveyors and feeders |
|
|
|
| · | one pebble crusher surge bin |
|
|
|
| · | three 933 kW pebble crushers. |
The reclaimed material is fed to each SAG mill feed chute at which point process water and lime are also added. An automatic ball charging system delivers SAG mill balls when required. Each SAG mill product discharges onto a pair of SAG mill discharge screens. For each SAG mill, the screen undersize gravitates to the cyclone feed pump-box, while the screen oversize pebbles are conveyed to a common pebble crushing plant equipped with a trio of crushers. Crushed pebbles are conveyed to a surge-bin from where they are split to one screen for each SAG mill. Similar to the SAG discharge screens, the crushed pebble screen undersize discharges into the cyclone feed pump-box, while the screen oversize returns to the pebble crushers with the SAG screen oversize.
17.4.4 Secondary Grinding
Each SAG mill feeds a pair of ball mills via dedicated cyclone packs. Each pair of mills share a common cyclone feed pump-box, which splits the slurry to one cyclone feed pump for each cyclone pack. The ball milling circuits are designed to operate with a 300% circulating load. The major process equipment in the secondary grinding circuit comprises:
| · | four 26 ft diameter x 40 ft long (EGL) ball mills, each driven by a 16 MW twin pinion drive, and |
|
|
|
| · | pumps and hydrocyclone clusters for each ball mill. |
Process water and lime are added to each grinding circuit cyclone feed pump-box to maintain cyclone feed density and cyclone overflow pH. The hydrocyclone underflow gravitates to each ball mill feed chute where additional water would be added to maintain a ball mill solids density of 75%. The overflow from the quartet of hydrocyclone clusters are transferred to the flotation feed conditioning tank using a common launder. The conditioning tank also acts as a distributor for the pair of eight-cell rougher-scavenger flotation tank cell lines as shown in Figure 17-1. The grinding circuit product has a P80 of 135 µm.
17.4.5 Bulk Rougher Flotation
The flow from the conditioning tank is split between the two parallel banks of bulk rougher flotation cells. Each bank consists of eight 824 yd3 tank cells, totalling sixteen cells in all. The reagents that are added include lime, fuel oil emulsion (molybdenum collector), sodium ethyl xanthate (SEX) and methyl isobutyl carbinol (MIBC). The copper-gold/molybdenum concentrate collected in the bulk roughing cells is delivered to a set of HIG regrind mills. The tailings from each bank gravitates to the twin tailings thickeners for dewatering prior to being pumped to the bulk TSF.
17.4.6 Bulk Concentrate Re-grind
The bulk rougher concentrate flows to the bulk regrind mill pump-box which delivers slurry to the regrind hydrocyclone cluster. The regrind mills grind the bulk rougher concentrate to a P80 of 25 µm.
| Pebble Project NI 43-101 Technical Report Update and Preliminary Economic Assessment | Page 210 August 21, 2023 |
|
|
|
The overflow from the hydrocyclone cluster flows by gravity to the bulk cleaner circuit, while the underflow of the hydrocyclones flows to the regrind mill feed distributor. 35% of the underflow is directed to three gravity concentrators for pyrite/gold recovery, with the non-pyrite portion returning to the cyclone feed pump box. The balance of the underflow is directed to the HIG mills for regrinding. Gravity concentrate is pumped to geotextile dewatering bags in a dewatering area. All the effluent released from the geotextile bags in the dewatering process is collected and reused.
The major equipment consists of the following items:
| · | three 5,000 kW HIG mills |
|
|
|
| · | pump box and hydrocyclone cluster |
|
|
|
| · | three centrifugal gravity concentrators. |
17.4.7 Bulk Concentrate-Cleaner Flotation
The reground rougher concentrate is further upgraded in a three-stage cleaner flotation circuit. The 1st cleaner flotation is by cleaner-scavenger flotation. The first cleaner concentrate advances to the 2nd cleaner stage, whilst the cleaner scavenger concentrate returns to the bulk regrind pump box. Cleaner scavenger tailings reports to the potentially acid generating (PAG) thickener for thickening prior to pumping to the pyritic TSF.
Concentrate from the 2nd cleaner feeds the 3rd cleaner flotation stage, whilst the 2nd cleaner tailings are returned to the 1st cleaner. The 3rd cleaner concentrate reports to the bulk thickener, whilst 3rd cleaner tailings are returned to the 2nd cleaner.
The same reagents used in the rougher flotation circuit is applied in the cleaner circuit, with the addition of carboxymethyl cellulose (CMC).
17.4.8 Molybdenum Flotation
Bulk copper-molybdenum concentrate thickener underflow reports to a molybdenum flotation circuit to separate the bulk concentrate into a copper-gold concentrate and a molybdenum concentrate. To allow selective flotation of the molybdenite, copper-gold bearing minerals are depressed through the addition of dilute sodium hydrosulphide (NaHS). The circuit involves rougher flotation in tank cells followed by open-circuit regrinding in a small HIG mill to a nominal product P80 of 25 µm. Regrind cyclone overflow is refloated in a 4-stage column flotation cleaning process. The concentrate of each column feeds the next stage column, while each column tail returns to the previous stage. The 4th cleaner column concentrate reports to the molybdenum concentrate thickener, while the 1st cleaner column tailing returns to the molybdenum rougher flotation stage. The rougher flotation tailing (final copper-gold concentrate) is pumped to the copper-gold concentrate thickening and filtration plant located at the port facility. To minimize consumption of NaHS, all molybdenum flotation cells use nitrogen instead of air. Other flotation reagents used in the molybdenum flotation circuit include fuel oil emulsion and MIBC.
The major equipment consists of the following items:
| · | one 130 kW HIG mill |
|
|
|
| · | one copper-molybdenum concentrate thickener of 108 ft diameter. |
| Pebble Project NI 43-101 Technical Report Update and Preliminary Economic Assessment | Page 211 August 21, 2023 |
|
|
|
17.4.9 Concentrate Dewatering and Filtration
The copper-gold concentrate is thickened to 65% solids by weight in a high-rate thickener, with the thickener underflow feeding a pair of copper-gold concentrate pressure filters. The filtered concentrate at maximum 8.5% moisture is loaded onto specialized bulk material handling containers trucked to nearside of Lake Illamina. A shuttling ferry will transport the containers These barges are towed to the ships and the containers discharged into the vessels. The empty containers are trucked back to the mine site and discharged into a concentrate storage shed and subsequently into barges for transshipment. The thickener overflow and filtrate would be combined and pumped back to the main process plant via return pipeline and would be used as part of the plant process water.
The molybdenum concentrate is thickened in a high-rate thickener to 55% solids by weight at the plant site. The thickener underflow feeds the molybdenum concentrate filter press, where the moisture content is reduced to 12%. The filtered concentrate is further dewatered by a dryer to 5% moisture before being bagged, containerized, and shipped to smelters.
The major equipment consists of the following items:
| · | copper concentrate thickener sized 108 ft diameter (at marine terminal) |
|
|
|
| · | two copper concentrate filters with a cloth size of 6 ft width x 489 ft length (at marine terminal) |
|
|
|
| · | molybdenum concentrate thickener sized 16 ft diameter (plant site) |
|
|
|
| · | one molybdenum concentrate filter with a cloth size of 3 ft width x 72 ft length (plant site). |
17.4.10 Tailings Management
Two types of tailings are generated by the recovery process, namely the bulk tailings, and the pyritic tailings. Each tailings stream is thickened and pumped to separate TSFs. The diameters of the tailing’s thickeners are 325 ft and 207 ft for the bulk and pyritic tailings, respectively.
17.4.11 Reagents Handling and Storage
Table 17-2 shows the reagents consumed throughout the life of mine.
Table 17‑2: Reagent and Comminution Consumables Consumptions
| Reagent | Unit | Consumption |
| Primary Crusher Liners | sets/unit/a | 1 |
| Pebble Crusher Liners | sets/unit/a | 2 |
| Sag Mill Media | tons/a | 23,463 |
| Sag Mill Liners | sets/unit/a | 2 |
| Ball Mill Media | tons/a | 30,156 |
| Ball Mill Liners | sets/unit/a | 1 |
| HIG Mill Media | tons/a | 1,387 |
| HIG Mill Liners | sets/unit/a | 1.5 |
| Lime | tons/a | 62,103 |
| Fuel Oil | tons/a | 1,643 |
| SEX | tons/a | 2,300 |
| PAX | tons/a | 986 |
| MIBC | tons/a | 3,614 |
| CMC | tons/a | 657 |
| Flocculant | tons/a | 1,117 |
| Pebble Project NI 43-101 Technical Report Update and Preliminary Economic Assessment | Page 212 August 21, 2023 |
|
|
|
All reagent solutions are prepared in a containment area surrounded by a berm. The reagent storage tanks are equipped with level indicators and instrumentation to ensure that spills do not occur during preparation or operation. Appropriate ventilation, fire and safety protections is provided at the facilities.
The liquid reagents (including fuel oil emulsion, CMC, MIBC and antiscalant) is added in undiluted form to various process circuits via individual metering pumps. The solid reagents, including SEX and NaHS, is mixed with fresh water to 10% and 25% solution strengths, respectively, in separate mixing tanks and stored in holding tanks before being added into the process circuits at various points using metering pumps. Quicklime is slaked on site from bulk pebble quicklime, diluted to a 20% strength milk of lime and distributed to various addition points from a circulating loop.
Flocculant and dispersant are dissolved, diluted to the appropriate strength, and added to various thickener feeds using metering pumps.
Liquid nitrogen is used in the molybdenum flotation circuit to help maintain a reducing environment for copper sulphide depression.
17.4.12 Assay and Metallurgical Laboratories
The assay laboratory is equipped with the necessary analytical instruments to provide routine assays for the mine, process, and environmental departments.
The metallurgical laboratory id set-up with all equipment and instruments required for routine test-work in support of plant optimization.
17.4.13 Power Supply
The estimated electrical demand of the process facilities is 159 MW. This electricity will be provided by the power supply system described in Section 18.8.1.
17.4.14 Water Supply
Treated water will be supplied from the water treatment plant for the following applications:
| · | fire water for emergency use; |
|
|
|
| · | cooling water for mill motors and mill lubrication systems; |
|
|
|
| · | reagent preparation; |
|
|
|
| · | gland seal water; and |
|
|
|
| · | gravity circuit. |
| Pebble Project NI 43-101 Technical Report Update and Preliminary Economic Assessment | Page 213 August 21, 2023 |
|
|
|
17.4.15 Air Supply
Air systems for the milling operation will be as follows:
| · | a high-pressure air compressor will be located at each of the two primary crushing areas to provide air for dust collection systems |
|
|
|
| · | high pressure air for various plant services will be supplied by three dedicated air compressors |
|
|
|
| · | high pressure air for filter pressing and drying of copper-gold and molybdenum concentrates would be supplied by dedicated air compressors |
|
|
|
| · | low pressure air for flotation cells would be supplied by blowers |
|
|
|
| · | instrument air would be dried and stored for use at the main process plant site. |
17.5 Process Control Philosophy
The process plant site process control systems will be based upon a distributed control system with PC-based operator interface stations. These stations will be staffed 24 hours per day and are located in the following four control rooms:
| · | main process plant grinding and flotation control room |
|
|
|
| · | primary crusher #1 control room |
|
|
|
| · | primary crusher #2 control room |
|
|
|
| · | copper concentrate filtration plant. |
Process control will be enhanced by the installation of an automatic sampling system. The system will collect samples from various streams for online analysis and daily metallurgical accounting.
For the protection of operating staff, a monitor and alarm system will monitor the level of hydrogen sulphide in and around the molybdenum flotation circuit.
The fire protection system will be designed to provide a water flow of 2,000 US GPM at 100 psi for two hours.
The total estimated amount of water required at the plant is 22,890 US GPM, including 1,346 US GPM of treated water from the water treatment plant. This water will be used for gland water or for reagent preparation and will undergo filtration and be stored in a separate tank. The make-up water required at the process plant will be recycled or treated in the water treatment plant. No fresh water is required.
| Pebble Project NI 43-101 Technical Report Update and Preliminary Economic Assessment | Page 214 August 21, 2023 |
|
|
|
18 PROJECT INFRASTRUCTURE
18.1 Introduction
The Pebble Project is located in an area of Alaska with minimal development and requires construction of infrastructure at the mine site as well as power generation and transportation facilities.
The mine site infrastructure includes truck shop, maintenance facilities, offices, service roads, utilities, and worker accommodations. Figure 18-1 provides an overview of mine site infrastructure for the Pebble Project, including tailings and water management facilities.
Natural gas-fired power plants are constructed at both the mine and the marine terminal. The natural gas for power generation is delivered by a pipeline extending across Cook Inlet to the marine terminal, then along the roadway corridor to the south shore of Iliamna Lake, across Iliamna Lake to Newhalen, cross-country to the Newhalen River bridge, and finally along the roadway corridor to the mine site.
The transportation infrastructure consists of a marine terminal facility located near Amakdedori on Kamishak Bay and a permanent access road with a ferry crossing of Iliamna Lake.
The marine terminal facility includes marine infrastructure capable of handling barges for concentrate bulk transshipment, fuel barges, as well as large ocean barges (400 x 100 ft) for transport of construction materials and operating supplies by container. Barge access from Cook Inlet to the marine terminal site would include a dredged channel and turning basin in front of the dock structures with a minimum 15 ft draft limit. Separate onshore facilities would include diesel fuel bulk storage, power generation, maintenance facilities, offices, and worker accommodations.
An all-weather 72-mile gravel road would connect the marine terminal facility with the mine site. This road would access a ferry landing on the south side of Iliamna Lake and then continue to the mine from a ferry landing on the north of side of the Lake at Eagle Bay. It would be designed to facilitate the transport of modules during construction and to enable access for truck haulage of equipment and supplies from the terminal and ferry landing facilities to the mine site during operation.
The transportation corridor from Amakdedori to south ferry terminal and from the Newhalen bridge to the mine site would also include a buried natural gas pipeline to supply the natural gas-fired generating plant at the mine site. This same trench would be used to locate the fiber optic cable installed with the natural gas pipeline. Figure 18-2 illustrates the general plan of the proposed infrastructure for the Pebble Project.
| Pebble Project | Page 215 |
| NI 43-101 Technical Report Update and Preliminary Economic Assessment | August 21, 2023 |
|
|
|
Figure 18‑1: Mine Site Infrastructure
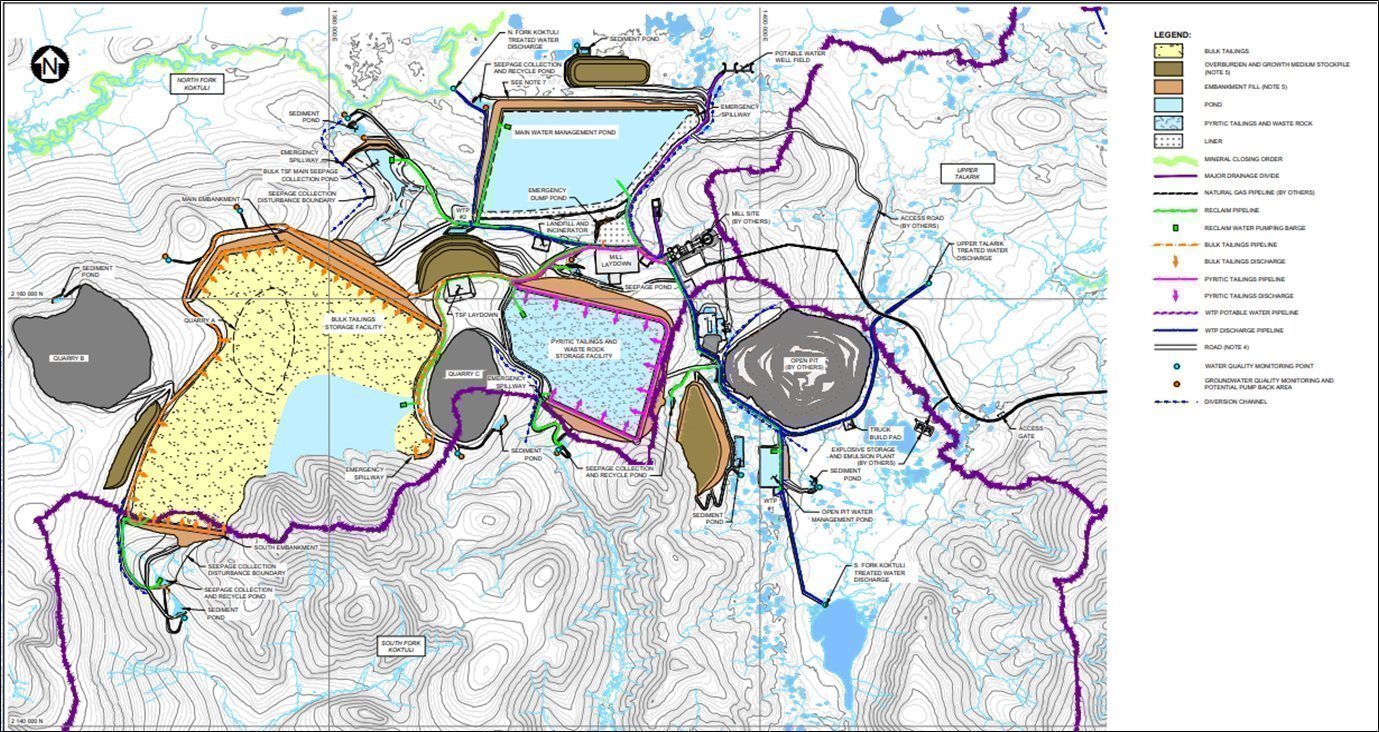
Note: Figure prepared by Piésold, 2020.
| Pebble Project | Page 216 |
| NI 43-101 Technical Report Update and Preliminary Economic Assessment | August 21, 2023 |
|
|
|
Figure 18‑2: Proposed Infrastructure
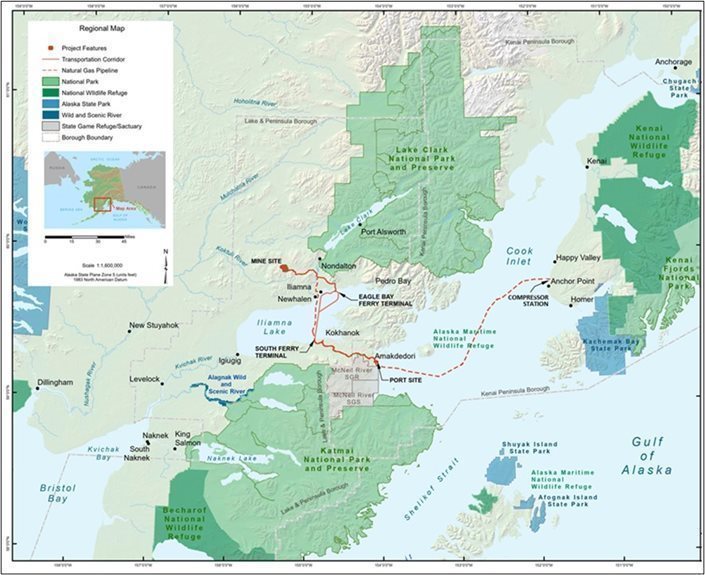
Note: Figure prepared by NDM, 2023.
18.2 Access Road
There is currently no road infrastructure connecting the planned marine terminal site to the mine site. The proposed access infrastructure is classified into four categories:
| Pebble Project | Page 217 |
| NI 43-101 Technical Report Update and Preliminary Economic Assessment | August 21, 2023 |
|
|
|
|
| · | The main access road from the marine terminal site to Iliamna Lake and from Iliamna Lake to the mine site would be used to supply equipment and materials to the mine site from the marine facilities. The vehicle types to use these roads would be low-beds, B-trains, semi-trailer combinations and light/medium duty trucks. During mine construction, modules weighing up to 2,000 tons could be transported over the road. The main access road intersects the existing road north of the villages of Newhalen and Iliamna. This road would connect the mine site to those communities and to the Iliamna airport for crew and air freight transport. The main access road would pass near the village of Kokhanok and a 2-mile-long spur road would be constructed to connect to the village road system and access the airfield. |
|
|
|
|
|
| · | The ferry route across Iliamna Lake is 26 miles and would require construction of ferry landings for transshipment of all equipment and materials being transported over the road. |
18.2.1 Main Access Road
The Pebble Access Road would be constructed as the primary support link for the proposed Pebble Mine. The road would be 72 miles in length, with a 35-mile segment from the mine site to a ferry landing at Eagle Bay on the north side of Iliamna Lake and a 37-mile segment on the south side of Iliamna Lake that extends from a ferry landing located 5 miles west of Kokhanok to a saltwater port at Amakdedori on Kamishak Bay. The ferry crossing of Iliamna Lake would be 26 miles. Most of the alignment is on land owned and managed by the State of Alaska. The remainder is on private land held by the village corporations of Iliamna Natives Limited and Alaska Peninsula Corporation. The road alignment is shown in
Figure 18-3.
Nearly the entire route would be over terrain lacking significant existing infrastructure. Design would be for a two-lane road (nominal 30 ft surface) capable of supporting all anticipated development and operational activities. The access road will be the only means of overland support and will provide the link between the mine and port facilities at Kamishak Bay. The road will also provide the only transportation link from the mine facilities to the existing Iliamna airfield and lake landing facilities. Current seasonally available access points to the proposed road corridor include Kokhanok and Iliamna. Ten conventional bridges would be constructed over the length of the route with spans varying from 50 to 500 ft.
The primary consideration for current design is the inclusion of the requirement for potential heavy module transport and inclusion of the natural gas pipeline pad development in the construction material quantities and cost estimate.
A 2-mile spur road would be constructed to access the road system and airfield serving the Village of Kokhanok.
| Pebble Project | Page 218 |
| NI 43-101 Technical Report Update and Preliminary Economic Assessment | August 21, 2023 |
|
|
|
Figure 18‑3: Overview of Road Alignment from Amakdedori to Mine Site
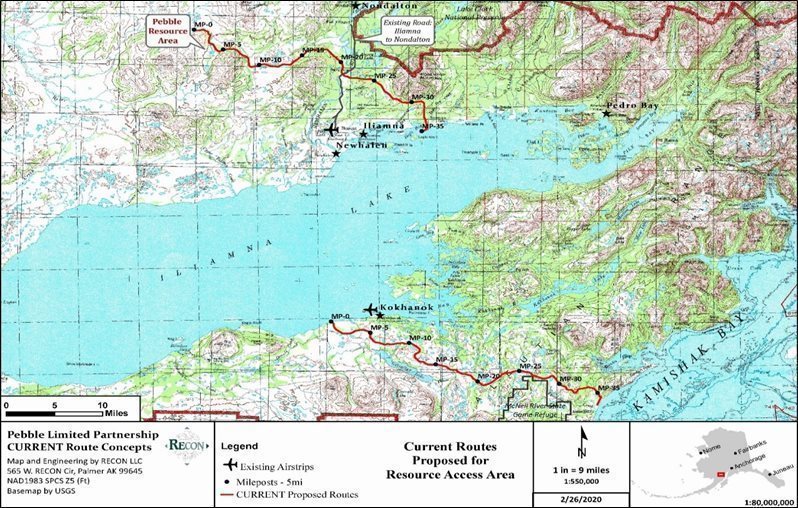
Note: Figure prepared by Recon, 2021.
| Pebble Project | Page 219 |
| NI 43-101 Technical Report Update and Preliminary Economic Assessment | August 21, 2023 |
|
|
|
The mine access road will traverse highly variable terrain as it progresses generally eastward from the mine site in the mountains north of Iliamna Lake to the ferry landing at Eagle Bay on Iliamna Lake. From the ferry landing on the south side of the Iliamna Lake, the road would continue easterly over varied terrain to the marine terminal on Kamishak Bay. From the mine site to the port site, the road alignment passes through three climatic zones with widely varied weather and environmental conditions.
The mine site is located at the headwaters of the Koktuli River and Upper Talarik Creek at an elevation of 1100 ft amsl. In general, the access route extends eastward through upland terrain to a crossing of the Newhalen River at a location seven miles north of Iliamna Lake. From the Newhalen River, the route continues over upland tundra terrain to the base of Roadhouse Mountain. Elevation along this road interval varies from 250 to 1100 ft amsl. This western 26 miles of road alignment can be considered as typically “interior” climate. For construction purposes, this region experiences climatic conditions like western interior Alaska. Most of this western section of the alignment is dry open tundra with some areas of open or scattered scrub spruce and occasional birch. Being open terrain with commonly windy conditions, snow drifting is a significant factor. Long fetches exist in this area which allow for massive accumulations of drifted snow. Whiteout conditions during winter windstorms or poor light/visibility periods can have a significant impact on construction activities and transportation. Given that most of this portion of the alignment is through open terrain and avoids steep slopes, avalanches or rockslides are not an issue. Crossing the Newhalen River would require a 500 ft multi-span bridge.
From Roadhouse Mountain, the alignment continues eastward for several miles then turns south over moderate terrain to Eagle Bay on Iliamna Lake. This interval is more typical of a “transitional” environment with conditions similar to that found at low elevations in upper Cook Inlet. The elevation along this section of the alignment varies from 70 to 600 ft amsl. Ground conditions, as they relate to road development, are typically excellent to fair. Access to gravel or rock for road construction is good. This road segment varies from dense forest with mature birch and spruce to thinly forested.
From the south Iliamna Lake ferry landing, the access road alignment continues east for 37 miles over a low plateau to Amakdedori on Kamishak Bay. Over this road segment, environmental conditions transition to those typical of a “maritime” environment. The elevation along this section of the alignment varies from sea level to 800 ft amsl. Snow cover has been observed to increase toward the coast. Snowpack accumulation of 4–10 ft is probable for the area. Vegetation cover is minimal and varies from open tundra with occasional dense alder thickets and few trees to alpine and barren coastal. Most of the east 26 miles of this road segment is over very irregular bedrock terrain with mostly rock and rubble crop exposed at the surface. Small ponds and minor streams are common. A 300-foot bridge is anticipated for crossing of Gibraltar River. Materials for road construction are readily available and will include gravel and rock. High winds are common in this area of open terrain and snow drifting will be a significant maintenance issue.
In developing the subject access road alignment and supporting facilities plans, it is considered that naturally occurring events in the project area can include high-magnitude earthquakes and associated tsunami, volcanic activity resulting in significant ash fall, and periodic high-intensity storms. Permafrost has not been noted as a significant occurrence at any location along the alignment.
The proposed road route traverse’s terrain generally amenable to road development. Soils are good to excellent; where rock is encountered, it is competent and useable for construction material. The numerous stream crossings appear to have favourable conditions for abutment foundations. There are no significant occurrences of permafrost or areas of extensive wetlands. Where the terrain is challenging, the rock or soil conditions are generally favourable.
There are 91 waterbody crossings on the alignment. There are currently 10 conventional bridges proposed to be constructed over the length of the route with bridges varying in length from 60 to 500 ft. The remaining crossings will typically be addressed with CMP culverts and fish passage features as required.
| Pebble Project | Page 220 |
| NI 43-101 Technical Report Update and Preliminary Economic Assessment | August 21, 2023 |
|
|
|
Construction would require development of temporary construction camps, one with an airfield at Amakdedori. Following construction, the camps would be removed except for facilities to needed for road operations and maintenance.
The design of the Pebble Mine access road was predominantly dictated by the sizes and weights of vehicles and loads to be transported over the road, the majority of which would be conventional highway tractors and trailers. However, the principal controlling factor for much of the road design is the transport of large and heavy modules for mine construction.
The Performance Criteria used to develop the alignment and design criteria are as follows:
| · | resource/industrial classification, |
|
|
|
| · | all-season use, |
|
|
|
| · | 50-year design life, |
|
|
|
| · | support 190-ton haul truck travel on road surface (CAT 785C empty or CAT 777 loaded), |
|
|
|
| · | support module transport up to 2000 short tons, |
|
|
|
| · | provide joint corridor with buried natural gas line, and fiber-optic cable, |
|
|
|
| · | location and routing to minimize impacts and provide for efficient long-term transport from port site to mine, |
|
|
|
| · | connect with nearby communities, |
|
|
|
| · | minimize areas of disturbances, as far as practicable, |
|
|
|
| · | minimize specialty construction requirements, as far as practicable, |
|
|
|
| · | minimize stream crossings and avoid anadromous streams, as far as practicable, |
|
|
|
| · | route over lands with favourable ownership/management, as far as practicable, |
|
|
|
| · | route to avoid potential geologic hazards, as far as practicable, and |
|
|
|
| · | optimize alignment for the best surface and subsurface soils and geotechnical conditions. |
The design criteria consider the primary purpose of the road, which is to transport freight by mostly conventional highway tractors and trailers. However, critical elements of the design were dictated by specific oversize and overweight loads associated with mine facility construction. As such, the principal controlling factor for much of the road design is the transport of large and heavy modules.
| · | Road Grades: 6% preferred and 7% max. |
|
|
|
| · | Road Surface Width: 30 ft min. |
|
|
|
| · | Design Speed: 35–45 mph for moderate terrain & 15 mph in mountainous |
|
|
|
| · | Curves (Horizontal & Vertical): as required for large module carrier |
|
|
|
| · | Clearing Width: top of cut to toe of fill (60–200 ft typical) |
|
|
|
| · | Ditches: 3 ft typical min. (rock-lined and/or flat bottom at +5%) |
|
|
|
| · | Cut or Fill Slopes: 0.25:1 to 4:1, depending on rock and soil type |
|
|
|
| · | Minimum Embankment: 3.0–6.0 ft (varies with quality of subgrade) |
|
|
|
| · | Culverts: CMP, min. 2 ft dia. with thaw pipes (fish passage design) |
|
|
|
| · | Guardrail: Per criteria for industrial/resource roads |
|
|
|
| · | Bridges: Two lanes with 30 ft between rails and rated for heavy transport. |
| Pebble Project | Page 221 |
| NI 43-101 Technical Report Update and Preliminary Economic Assessment | August 21, 2023 |
|
|
|
The proposed road alignment traverses highly varied terrain types, thus, there would be several different construction methods employed throughout the project. In general, the western three-quarters of the road would be built by conventional cut/fill techniques using any suitable native subgrade material for development of the road prism. Typically, a subbase and final surfacing layer would be applied consisting of a crushed and/or screened material suitable for structural fill and surface maintenance and wear-course. At intervals not appropriate for cut/fill construction, an elevated fill section would be employed, particularly where snow drifting, or poor soils, are a concern. The road segment from Kamishak Bay to Gibraltar River would include significant rock excavation with an equipment fleet suitable for the terrain and volumes of rock to be excavated and placed. Road culverts at stream crossings are divided into categories based on whether the streams are fish-bearing. Culverts at streams without fish would be designed and sized for drainage only, in accordance with Alaska Department of Transport & Public Facilities (ADOT&PF) standards. Culverts at streams with fish would be designed and sized for fish passage in accordance with U.S. Fish and Wildlife Service standards.
The natural gas pipeline and fiber optic cable would be buried in a corridor adjacent to the access road or within the road prism. For bridged river crossings, the pipeline and fiber optic cable would be attached to the bridge structures.
Stream crossings requiring bridge construction would typically incorporate use of temporary bridges for construction access. Early mine site access would include a use of a ferry for crossing of the Newhalen River and Iliamna Lake. Temporary infrastructure related to ferry operations would include short access roads and landing area pads.
18.3 Site Roads
Haul roads would be located at the mine site and would connect the infrastructure network such as the open pit, process plant and TSFs. These roads would be used by large haul vehicles for hauling mineralized material or waste material. Service roads would provide on-site access to mine infrastructure: the emulsion plant, explosives magazine, WTPs and conveyor systems. The vehicles anticipated to use these roads would be light/medium-duty trucks and service vehicles.
18.3.1 Haul Roads
The project requires a network of haul roads to connect the mine infrastructure such as the open pit, mill plant site and TSFs. The haul road network was designed to separate haul traffic from access traffic.
The anticipated haulage trucks would have up to 400-ton payloads and an operating width of 32 ft. The haul roads would be 110 ft wide to allow for two-way traffic. For improved safety, fills greater than 10 ft high would be constructed with earth berms or concrete barriers. The haul roads would also be used by service vehicles accessing certain mine site infrastructure, such as the truck shop and process plant.
18.3.2 Service Roads
Three miles of service roads would be constructed to provide service vehicles (i.e., light/medium-duty trucks and service vehicles) with access to mine infrastructure such as the emulsion plant, explosives magazine, TSFs and WTPs.
| Pebble Project | Page 222 |
| NI 43-101 Technical Report Update and Preliminary Economic Assessment | August 21, 2023 |
|
|
|
18.4 Tailings Storage Facilities
18.4.1 Introduction
Waste and water management at the project would be an integrated system designed to safely contain these materials, to facilitate water treatment and discharge, and to provide adequate process water to support the operations. The system is planned to begin operation prior to start up and to continue operations through closure and post closure. The system would manage:
| · | bulk tailings; |
|
|
|
| · | pyritic tailings; |
|
|
|
| · | PAG waste rock; |
|
|
|
| · | process water; |
|
|
|
| · | non-contact water for direct discharge; and |
|
|
|
| · | contact water to be treated and discharged to the environment. |
The design of these facilities incorporates a significant climate record, extensive site investigation, and a number of features intended to ensure safe operation.
18.4.2 Tailings Overview
The bulk NAG and pyritic PAG tailings would be stored in separate TSFs constructed primarily within the North Fork Koktuli (NFK) Watershed (Figure 18-1). The principal objective of the design and operation of the TSFs is to provide secure containment for all tailings solids and PAG waste rock. Decant water from the tailings as they settle and precipitation falling onto or draining into the TSFs would be contained prior to transfer to the main water management pond (WMP). The design and operation of the TSFs are integrated with the overall water management objectives for the entire mine development, in that surface contact runoff from disturbed catchment areas is controlled, collected and either contained on site for use in the milling process, or treated and discharged to the environment. An additional requirement for the design and operation of the TSF is to allow for effective reclamation of the tailings impoundment and associated disturbed areas so that post closure land use objectives can be met at the end of mine operations. The bulk TSF would be closed and reclaimed at the end of operations. The pyritic tailings and the PAG waste rock would be re-located to the pit at the end of mining and the pyritic TSF decommissioned and reclaimed.
18.4.3 Site Selection
A multi-year, multi-disciplinary evaluation was completed to select the preferred TSF locations that meet all engineering and environmental goals while allowing for cost-effective integration into the site waste and water management plans. More than 35 tailings disposal options were evaluated against a range of siting criteria during this evaluation, including:
| · | minimizing potential impacts to environmental resources, |
|
|
|
| · | providing adequate storage capacity. The sites would accommodate the total volume of tailings and PAG waste rock for the 20-year life of the project, |
|
|
|
| · | proximity to the process plant and the open pit. The sites are near the process plant and the open pit which reduces power consumption, hauling distance, and the overall project footprint, and |
|
|
|
| · | facilitating closure. Segregating the pyritic tailings and PAG waste in a separate TSF facilitates placement of these materials in the pit at the end of the mine life, thus eliminating the pyritic TSF from the long-term closure plan. |
| Pebble Project | Page 223 |
| NI 43-101 Technical Report Update and Preliminary Economic Assessment | August 21, 2023 |
|
|
|
18.4.4 Design Criteria
The TSFs would be designed to meet or exceed the standards of the current 2005 Guidelines for Cooperation with the Alaska Dam Safety Program (ADSP) and the draft 2017 version, as prepared by Alaska Department of Natural Resources (ADNR). The TSFs would be designed to the standards of a Class I hazard potential dam (the highest classification).
The TSF design criteria include:
| · | Providing storage for the 20-year mine life proposed project case resource – 1.3 B tons of tailings plus 93 million tons of PAG waste rock: |
|
| o | The bulk TSF would store 1.1 B tons. |
|
|
|
|
|
| o | The pyritic TSF would store 157 million tons plus 93 million tons of PAG waste rock. |
| · | The mill throughout is planned at 180,000 tons/d: |
|
| o | The bulk tailings output is 155,000 tons/d. |
|
|
|
|
|
| o | The pyritic tailings output is 25,000 tons/d. |
| · | providing storage for full containment of the probable maximum flood (PMF) event plus a freeboard allowance, |
|
|
|
| · | founding the TSF embankments on bedrock, with the overburden materials within the embankment footprints removed prior to construction, |
|
|
|
| · | designing the TSFs to safely withstand the earthquake loading conditions from the maximum credible earthquake, |
|
|
|
| · | thickened tailings disposal in the bulk and pyritic TSFs, |
|
|
|
| · | a permeable bulk TSF main embankment to promote a depressed phreatic surface in the embankment and in the tailings mass in proximity to the embankment, |
|
|
|
| · | a fully-lined pyritic TSF to maintain the pyritic tails and PAG waste in a sub-aqueous state to prevent oxidation, |
|
|
|
| · | limiting the volume of stored water within the bulk TSF under normal operating conditions and keeping the operating pond away from the dam face, with TSF reclaim water transferred to the main WMP, |
|
|
|
| · | the inclusion of basin underdrains to provide preferred drainage paths for seepage flows, |
|
|
|
| · | providing seepage collection systems downstream of the TSF structures to minimize adverse downstream water quality impacts, |
|
|
|
| · | consideration of long-term-term closure at all stages of the TSF design process: |
|
| o | bulk TSF main embankment seepage collection pond (SCP) collects seepage and runoff and transfers it to the main WMP, |
|
|
|
|
|
| o | bulk TSF south embankment and the pyritic TSF seepage collection ponds collect seepage and runoff and transfers it to back into the TSFs, |
| · | inclusion of monitoring instrumentation for all aspects of the facility during operations and after closure, and |
|
|
|
| · | flattening of the downstream slopes to achieve a minimum factor of safety under static loading conditions of 1.8. |
| Pebble Project | Page 224 |
| NI 43-101 Technical Report Update and Preliminary Economic Assessment | August 21, 2023 |
|
|
|
18.4.5 Tailings Storage Facility Design
The TSF embankments would be zoned, earthfill/rockfill embankments constructed using select overburden and rockfill obtained from open pit stripping or local quarries. The starter embankments for both facilities would be constructed as part of the initial site construction works and would provide storage capacity for two years of operations. The TSF embankments would be expanded in stages throughout the mine life with each stage providing the required capacity for the period until the next stage of construction is completed. The bulk and pyritic TSF designs are summarized below.
18.4.5.1 Seismicity Analyses
Site-specific peak ground accelerations were determined for the mine site using the seismic database of the USGS probabilistic seismic hazard program for Alaska (Wesson et al., 2007). The deterministic seismic hazard analysis considered all known seismic sources and fault systems in the region of southern Alaska and applying a maximum earthquake magnitude to each potential source. The maximum design earthquake (MDE) events which were considered were as follows:
| · | M9.2 interface subduction earthquake associated with the Alaska-Aleutian Megathrust, peak ground acceleration = 0.16 g. |
|
|
|
| · | M8.0 deep intraslab (in-slab) subduction earthquake, peak ground acceleration = 0.61 g. |
|
|
|
| · | M7.5 shallow crustal earthquake on the mapped Lake Clark fault, peak ground acceleration = 0.32 g. |
|
|
|
| · | M6.5 maximum background earthquake (shallow crustal event assumed to occur directly beneath potential mine site facilities), peak ground acceleration = 0.56 g. |
Differences in ground motion characteristics for each of these MDEs were modelled to determine estimates of deformation in the downstream direction, with the analysis estimates of minimal deformation (<0.08 ft) of the bulk TSF Main Embankment.
18.4.5.2 Bulk TSF
The bulk TSF would store 1.1 B tons of bulk tailings. The TSF would consist of a main (north) embankment and a south embankment.
Initial construction of the earthfill/rockfill bulk TSF main embankment would include a cofferdam located upstream of the main starter embankment. The embankment foundation would be prepared by removing overburden materials prior to placement of embankment fill materials. The starter embankment would be constructed to a height of 265 ft (elevation 1,450 ft above sea level) and would provide the storage capacity for two years of bulk tailings production. The main embankment would be progressively raised during operations using the centerline construction method. The main embankment does not include a low permeability zone and would operate as a permeable structure to facilitate in the drainage of the tailings mass adjacent to the dam. The main embankment would include a sequence of engineered filter zones to provide the necessary filter requirements between adjacent fill materials and to control drainage and the phreatic surface. The overall downstream embankment slopes would be maintained at 2.6H:1V (horizontal: vertical). The TSF basin would include an underdrain system constructed at various locations to provide preferred drainage paths for seepage flows.
The south embankment would be constructed in year three of operations and would be progressively constructed using the downstream construction method to facilitate the installation of a synthetic liner on the upstream face. The upstream face would be constructed at 3H:1V, and the downstream slope would be constructed at 2H:1V. Overburden materials would be removed below the embankment footprint. The earthfill/rockfill embankment would include engineered filter zones and a grout curtain to reduce seepage below the embankment. Tailings would be discharged from around the perimeter of the TSF to maintain the large tailings beaches and to promote surface drainage towards the east, away from the embankments, and towards the location of the closure spillway.
| Pebble Project | Page 225 |
| NI 43-101 Technical Report Update and Preliminary Economic Assessment | August 21, 2023 |
|
|
|
The bulk tailings would be discharged via spigots spaced at regular intervals along the interior perimeter of the bulk tailings cell, promoting beach development and allowing the supernatant pond to be maintained away from the main embankment. The bulk TSF would include a reclaim pumping system to manage the supernatant pond and limit the volume of water stored within the facility.
The final crest elevation for the bulk TSF embankments is 1,730 ft above sea level. Embankment heights, as measured from lowest downstream slope elevation, would be 545 ft (main) and 300 ft (south).
18.4.5.3 Pyritic TSF
The pyritic TSF would store 157 million tons of pyritic tailings and 93 million tons of PAG waste rock. The PAG waste rock would be placed around the perimeter of the basin with the pyritic tailings being discharged into the center of the facility at sub-aqueous discharge points with the level maintained just below the upper bench level for the PAG waste being stored. This placement methodology would result in PAG materials being exposed for less than two years before inundation with tailings and the water cover. The pyritic TSF would maintain a full water cover throughout operations to minimize the potential for oxidation of the pyritic tailings. The operating level of the supernatant pond would be managed via a floating reclaim system.
The pyritic TSF design would include a fully-lined basin with an underdrain system installed below the liner. The pyritic TSF would include three embankments, the north, south, and east, which would be progressively constructed using the downstream method. Upstream slopes would be 3H:1V to facilitate liner installation and the downstream slopes would be maintained at 2.6H:1V. The final crest elevation would be 1,620 ft above sea level. The final north embankment height would be 335 ft, the south embankment height would be 215 ft, and the east embankment height would be 225 ft.
18.4.5.4 TSF Closure
Closure of the bulk TSF would include a spillway located at the east side of the facility with the flows directed towards the north. Late in the operating phase, tailings discharge into the bulk TSF would be managed to allow for surface drainage toward the closure spillway to the maximum extent practical. As milling operations cease, free water would be pumped from the surface of the bulk tailings, and the tailings would be allowed to consolidate until the surface is suitable for equipment traffic on the surface. The tailings surface would then be re-graded as needed to facilitate drainage towards the closure spillway. A capillary break and growth medium would be placed over the surface of the tails prior to seeding for revegetation. Growth medium would also be placed on the bulk TSF embankments prior to seeding for revegetation.
Seepage water from the bulk TSF embankment seepage collection systems would be collected and directed to the main water management pond, or the pit lake throughout closure.
The pyritic tailings and PAG waste rock stored within the pyritic TSF would be transferred to the open pit during closure. The TSF embankments would be breached and contoured to prior to reclamation, which would include placement of growth medium and reseeding.
| Pebble Project | Page 226 |
| NI 43-101 Technical Report Update and Preliminary Economic Assessment | August 21, 2023 |
|
|
|
18.5 Water Management
18.5.1 Water Management Systems
The water management strategy for the project uses water from within the project area to the maximum practical extent. Contact water (mine drainage and process water) from the mine site would be collected and managed using various water management facilities. Mine drainage is defined as groundwater or surface runoff that has come into direct contact with mining infrastructure and requires treatment at the water treatment plants to meet discharge water quality standards prior to discharge to the environment. The primary water management systems and components include:
| · | diversion channels; |
|
|
|
| · | sediment ponds; |
|
|
|
| · | seepage collection and recycle ponds; |
|
|
|
| · | main water management pond; |
|
|
|
| · | open pit water management pond; |
|
|
|
| · | bulk and pyritic TSF reclaim systems; and |
|
|
|
| · | water treatment plants. |
18.5.1.1 Diversion Channels
Diversion channels would direct non-contact water around the project’s on-site infrastructure, where possible, and directly discharge it to the downstream environment. This would reduce the amount of water collected within the mine site footprint for both operations and closure.
18.5.1.2 Sediment Ponds
Sediment ponds are included at various locations around the project area to manage stormwater runoff. Sediment ponds will be located downstream from the overburden stockpiles, the growth medium stockpiles, and the quarries during operations, and downstream of the major earthworks locations (TSF embankments, water management ponds, etc.) during the construction period. Storm water would be collected and treated locally at the sediment ponds prior to release to the environment.
18.5.1.3 Seepage Collection and Recycle Ponds
Seepage collection and recycle ponds would be constructed downstream of the TSFs to collect and recycle seepage from the facilities. These include seepage recycle ponds would include grout curtains and low-permeability core zones, and downstream monitoring wells. Embankment runoff and TSF seepage collecting in the downstream seepage collection ponds would ultimately be transferred to the main WMP to be used in mining operations or treated for discharge.
18.5.1.4 Main Water Management Pond
The main WMP would be the primary water management structure at the mine site. It would be a fully-lined facility and constructed using quarried rockfill materials founded on bedrock. The main WMP embankment design is 190 ft high with an overall downstream slope of 2H:1V and an upstream slope of 3H:1V to accommodate the liner. It would be constructed to its final height during the initial construction period. In addition to the geomembrane liner the embankment would include a filter/transition zone. The basin and upstream embankment face would include a layer of materials above the liner to provide ice protection during freezing conditions. The operating capacity of the main WMP was sized to manage surplus water from the mine site and to supply water to the mining process over the full range of historic climate conditions.
| Pebble Project | Page 227 |
| NI 43-101 Technical Report Update and Preliminary Economic Assessment | August 21, 2023 |
|
|
|
18.5.1.5 Open Pit Water Management Pond
Groundwater and surface runoff collected in the open pit and from the surrounding area during operations would be directed to the open pit water management pond, prior to being treated at WTP #1. The open pit water management pond would be constructed using cut-and-fill methods and would be fully lined. The maximum height of the pond would be 100 ft tall.
18.5.1.6 Bulk and Pyritic TSF Reclaim Systems
The bulk TSF would be operated with a minimum supernatant pond and the pyritic TSF would be operated with a minimum depth of 5 ft in the supernatant pond to minimize the potential for oxidation of the pyritic tailings and waste rock. This would be achieved by pumping excess water to the main WMP to minimize the volume of water stored within these facilities.
18.5.1.7 Water Treatment Plants
Contact water would be treated using water treatment plants and then would be released to the environment. WTP#1, which would be located near the open pit, and WTP#2, to be located near the main WMP, would be operational during the operations period, while WTP#3, located near the open pit, would be operational during the closure period and for the long-term. WTP#1 would be decommissioned at the end of operations; WTP#2 would be decommissioned at the end of closure phase 1; and WTP#3 would be operational from closure phase 1, during phase 3, and during post closure. The detailed description of these facilities is presented in Section 18.6.
18.5.2 Site-Wide Water Balance
The Pebble water balance consists of three primary models: the watershed model, the groundwater model, and the mine plan model. These three models collectively provide the means of quantifying the numerous water flows in the streams, in the ground, and in the various pipes, ponds, and mine structures associated with the mine development. The watershed model focuses on water flows throughout the NFK, SFK, and Upper Talarik Creek (UTC) drainages. The groundwater model focuses on the detailed simulation and understanding of groundwater flows within those drainages, and serves to inform the watershed model, and vice versa. The mine plan model focuses on mine site water inflows and uses.
18.5.2.1 Watershed Model
The watershed model for the NFK, SFK, and UTC drainages considers both surface and groundwater. This model incorporates all key components of the hydrologic cycle, including precipitation as rain and snow, evaporation, sublimation, runoff, surface storage, and groundwater recharge, discharge, and storage. The primary input is monthly precipitation and temperature data collected at the Iliamna Airport from 1942 through 2017. Records from the other three regional stations (Port Alsworth, King Salmon, and Intricate Bay) were used to infill gaps in the Iliamna Airport temperature and precipitation records, as required.
| Pebble Project | Page 228 |
| NI 43-101 Technical Report Update and Preliminary Economic Assessment | August 21, 2023 |
|
|
|
The modelled annual precipitation series for the 76-year period of record is presented in Figure 18-4. The model was calibrated to measure site flow data collected at various locations in all three drainages over a nine-year period. The watershed model also provided input for the instream fish habitat-flow model, as well as the initial boundary parameters associated with groundwater recharge and runoff conditions for the groundwater model.
Figure 18‑4: Modeled Annual Precipitation Series
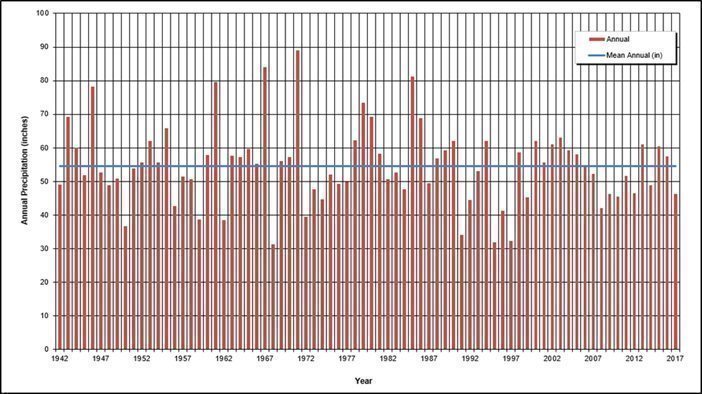
Source: Knight Piésold, 2020.
18.5.2.2 Groundwater Model
The groundwater model focuses on the sub-surface movement of water within the NFK, SFK, and UTC drainages. It models hydrogeological conditions in a more sophisticated and detailed manner than the watershed model, and its outputs provide a check of reasonableness for the watershed model. In addition, the groundwater model simulates groundwater flow rates and groundwater-surface water interactions throughout the study area, whereas the watershed model considers surface and groundwater flow rates only at the streamflow gaging stations.
18.5.2.3 Mine Plan Model
The mine plan model focuses on water movement within the Pebble Project footprint area. The Mine Plan Model is a site-wide water balance and considers all mine facilities including the bulk TSF, pyritic TSF, open pit, process plant, and the WMPs. This model tracks water movement throughout the Pebble Project footprint area including runoff from the mine facilities, water contained in the deposit, groundwater inflows, evaporation and water stored in the tailings voids. The mine plan model was also the base model for the water quality model and is used to predict the flow regime on the mine site and whether there is a water surplus or deficit. It is also used to estimate the water storage capacity requirements for the mine under normal operating conditions and the amount of surplus water available for treatment and release to the surrounding environment.
| Pebble Project | Page 229 |
| NI 43-101 Technical Report Update and Preliminary Economic Assessment | August 21, 2023 |
|
|
|
The mine plan model uses inputs from the watershed model and the groundwater model that have been developed for the project. Inputs from the watershed model were used to define the hydrologic parameters at the mine site and were used to determine groundwater recharge and surface water runoff. Inputs from the groundwater model were used to define the groundwater and seepage flow rates and directions in the project area.
The mine plan model was developed using a monthly time step, using mean monthly temperature and total monthly precipitation inputs, allowing for the water management strategies to be assessed on a long-term scale. The mine plan model addresses the possible range of wet and dry conditions at the mine by incorporating climate variability, which is used to define the operating storage requirements for the water management facilities. The storm storage and freeboard requirements are considered in addition to the maximum operating pond storage requirements determined with the mine plan model.
The mine plan model indicates that there is sufficient water to satisfy the mill requirements without additional make-up water even under the driest climate conditions. The site-wide water balance demonstrates that the mine site is estimated to have an annual surplus while the volume of water requiring treatment is expected to vary based on the climatic conditions and the amount of water in the water management ponds. Operating rules would be used to limit the maximum amount of water that must be stored while maintaining a sufficient water supply during extended dry periods to maintain mill operations. The amount of water stored within the water management ponds during drier climate conditions would generally decrease, while during wetter climate conditions, the amount of water stored within the water management ponds would generally increase.
18.6 Water Treatment
The Pebble site receives an average of 54 in. of precipitation per year. A portion of the resulting runoff would be consumed in the process, primarily locked up in the tailing’s deposits, but the remainder, 30 ft3/s on average, must be released back to the environment. To accomplish this, the proposed project incorporates a sophisticated water management plan with water collection, treatment, and discharge. That plan requires attention to the annual and seasonal variability of the incoming flows and achieving very specific water quality standards for the released water.
Temporary water treatment facilities would be in place during construction followed by three WTPs during the operations and closure phases of the project (Table 18-1). The table correlates the water WTP number with the phase of mine life (in cases when a WTP serves in more than one phase), and influent stream treated (in cases when there is more than one influent stream to a WTP) and thus defines the WTP naming convention.
| Pebble Project | Page 230 |
| NI 43-101 Technical Report Update and Preliminary Economic Assessment | August 21, 2023 |
|
|
|
Table 18‑1: Overview of Pebble WTPs during Operations, Closure, and Post-Closure
| WTP Name | Phase of Mine Life | Influent Stream Treated | Notes |
| WTP #1 | Operations Phase | Open Pit Water Management Pond | |
| WTP #2 | Operations Phase | Main Water Management Pond | |
| Closure Phase 1 | Main Water Management Pond | ||
| WTP #3 | Closure Phase 1 | Open Pit | |
| Closure Phase 2 | N/A | No surplus water to treat in Closure Phase 2 |
|
| Closure Phase 3 | Bulk Tailings Storage Facility - Main Seepage Collection Pond | ||
| Closure Phase 4 (Post-Closure) | Open Pit | ||
| Bulk Tailings Storage Facility - Main Seepage Collection Pond | |||
| Open Pit |
18.6.1 Influent Stream Characteristics
18.6.1.1 Influent Water Quality
Predicted influent water quality varies based on the phase of mine life and the stream being treated. Influent water quality was predicted through a sequence of geochemistry test work and modelling to determine source terms, modelling of hydrologic processes, and modelling of mineral processing. The resulting water quality predictions were then iterated with water treatment modelling to verify the long-term impact of WTP residuals returned to the mine water management system.
In general, there are two categories of water quality to be treated by the WTPs: a) water quality in which only specific metals, metalloids, and nonmetals exceed anticipated discharge limits; and b) water quality in which specific metals, metalloids, nonmetals, total dissolved solids (TDS), and sulfate exceed anticipated discharge limits. The metals, metalloids, and nonmetals that exceed anticipated discharge limits generally include antimony, arsenic, beryllium, boron, cadmium, chromium, cobalt, copper, iron, lead, manganese, mercury, molybdenum, nickel, selenium, silver, and zinc.
18.6.1.2 Influent Flow Rate
Predicted Influent flow rates to the WTPs vary greatly based on the phase of mine life, the stream being treated, and the time of year. Predicted influent flow rates were developed through a sequence of hydrologic and mine water balance modeling. Predicted influent flows range from as little as 3,591 gallons per minute (gpm) (WTP#1 – average flow) to 20,646 gpm (WTP#2 – maximum flow).
A standardized treatment train with a capacity of 4,000 gpm was designed to enable standardization of equipment, parts, and operational practices. To accommodate the wide range in flow while avoiding water treatment equipment of varying size and capacity, WTPs were designed with multiple treatment trains installed in parallel to treat the influent flow, with the number of operating trains adjusted depending on seasonal and annual variations in flow.
| Pebble Project | Page 231 |
| NI 43-101 Technical Report Update and Preliminary Economic Assessment | August 21, 2023 |
|
|
|
18.6.2 WTP Processes
18.6.2.1 Base Treatment Train Processes
The base 4,000 gpm treatment train used in all WTPs would include the following treatment steps:
| 1. | Dissolved metals would be oxidized with potassium permanganate in a reaction tank, followed by co-precipitation with a ferric iron salt in a second reaction tank. Hydrochloric acid or lime would be added as needed to maintain the water pH for optimal precipitation. |
|
|
|
| 2. | A ballasted high-rate flocculator/clarifier would be used to separate out the co-precipitated solids. Most of the solids from the clarifier would be recycled back to the oxidation reaction tank. The balance of clarifier solids would be thickened and transferred to disposal. |
|
|
|
| 3. | Clarified water would then be treated with sodium hydrogen sulfide, lime, and a ferrous iron salt to further precipitate remaining metals, metalloids, and nonmetals under reducing conditions. |
|
|
|
| 4. | Water from the sulfide reaction tanks would be filtered with sand filters and ultrafiltration membranes to remove precipitated solids. Backwash from the sand filters and ultrafiltration membranes would be thickened and transferred to disposal. |
Each base treatment train would include the necessary pumps, heat exchangers, instrumentation, chemical feed systems, control systems, and other appurtenances. Ultrafiltration membrane permeate would either be discharged to the environment or further treated by additional WTP-specific processes as described below:
18.6.2.1.1 WTP #1
A portion of the ultrafiltration membrane permeate from WTP #1 base treatment trains would be further treated with four stages of reverse-osmosis membranes to further remove TDS. Permeate from the fourth stage of reverse-osmosis membranes would be recombined with the main effluent stream for discharge to the environment. Brine from the fourth stage of reverse-osmosis membranes would be transferred to disposal.
18.6.2.1.2 WTP #2
Ultrafiltration membrane permeate from the WTP #2 base treatment trains would be further treated with full-stream reverse-osmosis membranes for additional metals and metalloids removal as well as removal of TDS and sulfate. Permeate from the reverse-osmosis membranes would be discharged to the environment. Brine from the reverse-osmosis membranes would be concentrated with three stages of a brine concentration system consisting of calcium sulfate precipitation with lime softening, clarification, ultrafiltration membranes, and reverse-osmosis membranes. Permeate from the reverse-osmosis membranes of each stage of brine concentration would be discharged to the environment. Brine from the third stage of brine concentration would be transferred to disposal.
18.6.2.1.3 WTP #3
WTP #3 would be constructed for use during closure and post-closure and would treat two influent streams separately within the same facility.
| Pebble Project | Page 232 |
| NI 43-101 Technical Report Update and Preliminary Economic Assessment | August 21, 2023 |
|
|
|
The portion of WTP #3 treating water from the open pit during closure phase 1 would be treated by base treatment trains followed by nanofiltration (NF) membranes. Permeate from the NF membranes would be discharged to the environment. Brine from the NF membranes would be concentrated with three stages of a brine concentration system consisting of calcium sulfate precipitation with lime softening, clarification, ultrafiltration membranes, and reverse-osmosis membranes. Permeate from the reverse-osmosis membranes of each stage of brine concentration would be discharged to the environment. Depending on the volume and concentration, brine from the third stage of brine concentration would either be transferred to disposal or sent to brine evaporation and crystallization systems to be converted into solid salt crystals.
The portion of WTP #3 treating water from the open pit during closure phase 1 is repurposed to treat water from the SCP during closure phase 3 and post closure with all of the same processes employed except the brine evaporation and crystallization system.
The portion of WTP #3 treating water from the open pit during closure phase 3 and post-closure would use only base treatment trains.
18.6.2.2 WTP Residuals Disposal
WTP residuals would include thickened sludge, thickened filter backwash, and reverse-osmosis brine in the case of WTPs that have reverse-osmosis membranes. During operations all WTP residuals would be disposed of in the pyritic TSF. During closure and post-closure all WTP residuals would be disposed of in the open pit. Solid salt crystals from the brine evaporation and crystallization systems of WTP #3 during closure phase 1 would be sent to an approved facility for disposal.
18.6.2.3 WTP Process Water Heating
WTPs would use waste heat from the mine site power plant for heating the water to be treated as well as for heating the building. WTPs would include a system of heat exchangers to add power plant waste heat to the process water prior to treatment. Heating the water even just several degrees Celsius would have a significant impact on treatment efficiency and could be especially critical during winter operation.
The WTPs would include a second set of heat exchangers to remove heat from treated water and recycle this heat back into the colder inlet water. This second set of heat exchangers would also help reduce treated water temperature to be better meet environmental conditions at the point of discharge.
18.6.3 WTP Buildings and Appurtenances
WTP buildings are envisioned to have pre-insulated metal panel wall and roof systems, concrete foundations, and concrete slab-on-grade floors.
WTPs would include treatment residuals processing equipment; treatment reagent storage, mixing, and dosing systems; a laboratory; spare parts storage; a workshop; backup electricity generation; and electrical and mechanical systems.
| Pebble Project | Page 233 |
| NI 43-101 Technical Report Update and Preliminary Economic Assessment | August 21, 2023 |
|
|
|
18.7 Mine Site Facilities
18.7.1 Mine Site Conditions and Design Criteria
The proposed mine site is located at an elevation of 1,000 ft above sea level. Terrain in the mine site area features rolling hills and low mountains, separated by wide shallow valleys blanketed with glacial deposits and numerous streams and small, shallow lakes.
The deposit is located at the head of three drainages: SFK, NFK and UTC. The SFK and NFK meet in a confluence several miles downstream of the mine site to form the Koktuli River, which in turn drains southwest to the Mulchatna River and then into the Nushagak River. The UTC, which drains the eastern portion of the deposit area, flows directly into Iliamna Lake.
The following key design criteria were applied for development of the mine site layout, and engineering design for supporting infrastructure:
| · | minimize footprint |
|
|
|
| · | site runoff and drainage would be contained by perimeter ditches and directed to sedimentation ponds, then to either the TSF or the WTPs for reuse or release |
|
|
|
| · | minimize the difference in elevation and the horizontal distances between the open pit, mill site, crusher and TSF, with the intent of minimizing the capital cost and operating cost of the truck haul, conveyor haul and pipelines between these sites |
|
|
|
| · | snow loads: |
|
| o | ground snow load at the mine site = 130 lb/ft2 |
|
|
|
|
|
| o | ground snow load at the port = 160 lb/ft2 |
| · | wind loads: |
|
| o | design wind speed at the mine site = 90 mi/h |
|
|
|
|
|
| o | design wind speed at the marine terminal = 104 mi/h |
| · | seismic loads: |
|
| o | for the mine/mill site, the following design parameters will apply: S =0.559 g; S1 =0.206 g |
|
|
|
|
|
| o | for the marine terminal, the following design parameters apply: Ss =1.191 g; S1 =0.372 g. |
The mine site would be developed in discrete areas: the open pit area, the process plant site, the mine services area, the two TSFs, and the three water collection ponds and two water treatment plants. A network of on-site roads and utilities would connect these sites.
The process plant and associated facilities would be located 1,000 ft north of the open pit on level to rolling ground at the edge of the knoll which marks the north edge of the deposit. The site is covered with overburden, generally sand and gravel, and frost shattered bedrock. Site preparation would consist of leveling the site with cut to fill. The major components, such as the grinding mills, would be founded on bedrock. The current design includes a significant surplus of excavated rock, which offers an opportunity to reduce costs by utilizing this material as fill for haul roads or tailings embankment construction.
| Pebble Project | Page 234 |
| NI 43-101 Technical Report Update and Preliminary Economic Assessment | August 21, 2023 |
|
|
|
18.7.2 Mine Service Facilities
18.7.2.1 Truck Shop
The truck shop complex at the mine site would consist of a 700 ft long x 330 ft wide structural steel, pre-engineered building designed to accommodate facilities for repair, maintenance and rebuilding of both open pit mining equipment and light vehicles. The facility would house storage space for spare parts and consumables and offices for the mine supervisors, mine engineers and planning staff. Change facilities for mine personnel would also be provided.
The building would be covered with insulated profiled steel and founded on spread footings on rock.
The service bays of the truck shop complex would consist of:
| · | twelve heavy vehicle repair bays |
|
|
|
| · | two heavy vehicle tire repair bays |
|
|
|
| · | two light vehicle service bays |
|
|
|
| · | one welding bay. |
The truck shop would be equipped with two 50-ton overhead cranes that would provide service to both the heavy and light vehicle repair bays. The drive-through bays would be 55 ft wide x 75 ft long and provide for the full dump height of a 400-ton capacity haul truck. One of the bays would serve as a wash bay.
Other support facilities and shops for maintenance and repair would include the following:
| · | lubricant storage building (including distribution system and used oil collection) |
|
|
|
| · | machine shop/plate shop |
|
|
|
| · | electrical/instrument repair facilities |
|
|
|
| · | compressor room to supply mill and instrument air to the facilities within the truck shop. |
The parts warehouse integrated into the truck shop would house materials, service parts and supplies for mine mobile equipment maintenance. The warehouse would have a ground floor area of 15,000 ft2 and an additional 2,000 ft2 of mezzanine space.
Men’s and women’s change facilities, complete with lockers, showers, and washroom facilities, would be provided for the pit and truck shop crews and would be located on the ground floor.
Offices occupying an area of 16,000 ft2 would be located on the third floor of the truck shop complex for the pit supervisors as well as mine engineering and planning staff. A lunchroom equipped with fridge, stove, microwave, dishwasher, and cupboards would also be on the ground floor.
18.7.2.2 Main Warehouse
The warehouse would be a rectangular, single-storey, pre-engineered building, 100 ft wide x 150 ft long x 23.5 ft high with a gross floor area of 15,000 ft2. An 80 x 80 ft mezzanine floor would be used for three offices, a filing/storage area, a washroom, and an entrance corridor. A fenced yard, 150 x 200 ft, with two truck gates and one-person gate would be provided on the north side of the process building.
| Pebble Project | Page 235 |
| NI 43-101 Technical Report Update and Preliminary Economic Assessment | August 21, 2023 |
|
|
|
18.7.2.3 Administration Building
The administration building at the mine site would be a two-storey, pre-engineered building, 150 ft wide x 200 ft long. It would be located adjacent to and connected with the permanent camp complex via an Arctic-type access corridor. A total of 166 offices and cubicles would be provided for mine management and supervisory staff, as well as for human resources, accounting, procurement, information technology (IT) and safety staff. The ground floor would include a lunch room, training room and 64 offices, including 10 open cubicles and 44 closed offices. The second floor would include 51 offices, including 36 open cubicles and 44 closed offices. The building would be clad with insulated profiled steel and founded on spread footings on soil.
18.7.2.4 Process Administration
Administration offices for the process plant would be located within the process building and would occupy two floors totalling 25 ft wide x 232 ft long. The space would include 23 offices, 2 conference rooms, a lunchroom, laboratory facilities, open working areas, and washroom facilities.
18.7.2.5 Gatehouse Security
The gatehouse would be a rectangular, single storey, pre-engineered building, 26 ft wide x 50 ft long x 10 ft high, with a gross floor area of 1,300 ft2 and would provide a security checkpoint for all incoming and outgoing traffic to the process and mill site.
18.7.3 Water Systems
18.7.3.1 Fresh Water
Fresh water from groundwater wells would be pumped to sand filters located on the north side of the process plant building. Water from the sand filters would be added to the filtered water tank. From the filtered water tank, most of the water would be pumped to the clean service/firewater tank located in the same area and the balance would be used as cooling water for the grinding mills. From the clean service/firewater tank the fresh/filtered water would be distributed via underground pipelines to the process plant and the primary crusher raw water tank for use as process water.
18.7.3.2 Fire Water
The clean service/firewater tank would have a reserve in the lower portion of the tank that would be drawn from below the primary water nozzles. The fire-fighting reserve in each tank would meet a two-hour demand at 2,000 US gpm at 100 psi boost. Firewater pump skids complete with diesel-driven fire pump, jockey pump and controls would be installed. Dedicated fire mains complete with hydrants would be provided at the process plant and ancillary buildings, the camp, truck shop and the primary crushers. Fire extinguishers would also be provided throughout the facilities. Fire hose reels and cabinets would be installed throughout the process plant building and truck shop. Sprinkler systems would be installed in the warehouse, the main office and the truck shop.
Fire alarm systems at the warehouse and truck shop would report to the plant control room or to the main gatehouse, both of which would be monitored 24 hours per day.
| Pebble Project | Page 236 |
| NI 43-101 Technical Report Update and Preliminary Economic Assessment | August 21, 2023 |
|
|
|
18.7.3.3 Potable Water
Potable water at the mine site would be supplied from wells. The water would be pumped to the potable WTP, potable water tank and potable water pump house at the mill and then distributed to the various facilities, including the camp, administration building, warehouse, gatehouse, truck shop and process buildings.
18.7.3.4 Process Water Distribution
Process water would be a combination of surface water catchments and tailings reclaim water. Process water would be pumped from the tailings pond and various collection sumps to the process water ponds located on the west side of the process plant. Process water would be pumped from the process water pond and distributed via pipelines to the various areas of the process plant. In addition, fresh water added to the system via the clean service/firewater tank would be distributed via underground pipelines to the process plant as described in Section 18.7.3.1.
18.7.4 Medical and First Aid
First aid posts would be provided at the accommodations camp, truck, shop, process plant and the port. A full-time physician assistant would be available at the first aid station at the camp and roaming first aid attendants/security staff would patrol the Pebble Project.
One ambulance and a fire truck would be located at each of the mine site and at the port. A tensioned fabric structure three-bay garage for the emergency vehicles would be located near the respective gatehouses. Patients requiring evacuation would be driven by ambulance to the clinic at Iliamna or flown from Iliamna to hospitals in Anchorage.
18.7.5 Camp
The first camp to be constructed at the mine site would be a 250-person fabric-type camp to support early site construction activities and throughout the pre-production phase as required for seasonal peak overflows. The main construction camp would be built in a double occupancy configuration to accommodate 1,700 workers. This facility would later be refurbished for 850 permanent single occupancy rooms for the operations phase.
The camp would include dormitories, kitchen and dining facilities, incinerator, recreation facilities, check-in and check-out areas, administrative offices and first aid facilities. The dormitory modules would be connected with field constructed or prefabricated, fire-rated egress corridors and would comply with all building and fire code requirements.
The mine would operate on a fly-in, fly-out basis, except for those personnel residing in the communities connected to the access road corridor. Non-resident personnel would be flown in and out of the Iliamna Airport and transported to the site by road. Workers would remain on site throughout their work period. Site rules would prohibit hunting, fishing, or gathering while on site to minimize impacts to local subsistence resources.
18.7.6 Cold Storage Building
Cold storage buildings are required for short- and long-term storage of supplies requiring protection from the elements, but not heated storage. Two buildings are required: one adjacent to the truck shop and one near the process plant maintenance facility. Both buildings would be unheated single-storey, fabric-clad structures, 75 ft wide x 150 ft long x 23.5 ft high.
| Pebble Project | Page 237 |
| NI 43-101 Technical Report Update and Preliminary Economic Assessment | August 21, 2023 |
|
|
|
18.7.7 Utilities and Services
18.7.7.1 Power Distribution
Power would be distributed throughout the mine site via 34.5 kV wood-pole overhead electrical power lines. A similar distribution arrangement would be used at the marine terminal, though at a significantly lower voltage of 4.16 kV. At both sites, power would be routed from the electrical substations to the distribution systems connecting the equipment, facilities, and buildings.
18.7.7.2 Communications
The mine site would be connected to external networks via the fibre-optic line contained in the natural gas pipeline trench and the sub-sea natural gas pipeline to the Kenai Peninsula. A backup satellite system rated to handle the full communications bandwidth would also be installed.
A communications network would be established utilizing fibre-optic technology and wireless communication for voice, internet, and intranet traffic. The communications and IT infrastructure would include an internet gateway, telephone private branch exchange system, Ethernet local area network, IT servers, desktop computers, a backup power system, copper and fibre cabling and site very high frequency (VHF) radio system.
Voice communications would be based on voice over internet protocol technology, using wide area network links. A VHF radio system would be installed with provision for handheld units, mobile units, and base stations. A mobile phone cellular service would be included in the system.
18.7.7.3 Heating, Ventilation and Dust Control
18.7.7.3.1 Heating
Heating for buildings and facilities at the mine site would be provided primarily by heat recovery from a combined cycle gas turbine power plant. Waste heat from the power plant would be transferred by transfer pumps through a glycol circulating system throughout the plant site and truck shop areas. A boiler adjacent to the process plant building would be used as a supplemental heat source when required.
Remote buildings that are relatively small, such as small warehouses and gatehouses, would be heated with indirect fired gas heaters, or electric heaters if gas lines cannot be run to those locations.
18.7.7.3.2 Ventilation
Continuous ventilation would be provided for all personnel occupied and selected unoccupied spaces.
Ventilation systems would include make-up air units for continuous supply of tempered air, general exhaust fans for contaminant removal and, where appropriate, localized exhaust fans to remove contaminants directly. Glycol supply to the make-up air units would be the primary heat supply source.
| Pebble Project | Page 238 |
| NI 43-101 Technical Report Update and Preliminary Economic Assessment | August 21, 2023 |
|
|
|
18.7.7.3.3 Dust and Fume Control
Dust control systems would include hoods, ductwork, dry bag house-style dust collectors and/or wet scrubbers and enclosures designed to capture fugitive dust or fume emissions at the source. These systems would be designed and selected to reduce particulate emissions to meet applicable air quality regulations.
Dust collection within the process buildings, such as the coarse material storage reclaim area and pebble crushers, would use wet scrubbers to collect airborne dust. The collected dust slurry would be pumped back to the process.
18.7.7.4 Solid Waste Disposal
18.7.7.4.1 Hazardous Waste
As part of the overall plant design, all hazardous wastes outside of tailings and waste rock would be segregated at the point of generation, placed into appropriate storage containers, and shipped off-site to an appropriate recycling or disposal facility. A lined storage facility would be constructed within or near the site fuel storage facilities to store the hazardous waste held in segregation, pending periodic off-site shipment.
18.7.7.4.2 Non-Hazardous Waste
Non-hazardous waste would be segregated into the following two streams:
| · | Putrescible kitchen wastes, organic food wastes from kitchen facilities, would be segregated and burned daily in on-site incinerators (or a closed-circuit digester system) to help limit wildlife attraction associated with disposal of food wastes. |
|
|
|
| · | Non-putrescible waste, all other non-hazardous, inorganic garbage, would be collected and disposed of within an on-site landfill to be located in a suitable area that drains by gravity into the tailing’s impoundment. Non-hazardous garbage placed within this landfill would be periodically buried under a layer of soil or non-acid generating waste rock to prevent loss of garbage through wind action and to control drainage. |
Construction, operation, and closure wastes would likely be managed under one waste management permit.
18.8 Natural Gas Line and Power Supply
18.8.1 Power Supply
A combined cycle natural gas turbine plant would supply power to the mine site. Power at the marine terminal would be provided by natural gas fired reciprocating engine-based power generators.
18.8.1.1 Power Plant Configuration and Design Details
The power plant design is based on the following criteria:
| Pebble Project | Page 239 |
| NI 43-101 Technical Report Update and Preliminary Economic Assessment | August 21, 2023 |
|
|
|
| · | The power plant design includes multiple gas turbines, heat-recovery steam generators (HRSG), steam turbines operating in parallel completely with balance of plant equipment and systems. The power plant would be built in two phases. The first phase of the power plant was designed with N+1 redundancy to meet the initial mine site load demand of 270 MW net during the warmer summer period. The gross capacity of the power plant as installed would be 318 MW at the summer ambient. The gross capacity would be somewhat higher at lower ambient. The plant is designed to support 270 MW net mine demand with any one gas turbine generator (GTG) or steam turbine generator (STG) outage scenario in degraded condition within the site specified ambient operating temperature range. |
|
|
|
| · | All gas turbines would be dry, low NOx, single fuel, designed for low emissions while firing pipeline-quality natural gas. The gas turbines would be provided with spray assisted inter-stage cooling (SPRINT) systems to augment power production during moderate to high ambient temperature conditions. |
|
|
|
| · | Fuel gas is assumed to be delivered by the pipeline system at 725 psig, eliminating the need for additional, on-site gas compression to increase the minimum inlet pressure to the units. |
|
|
|
| · | Natural gas is assumed to be of pipeline quality with a higher heating value/lower heating value ratio of 1.108. |
|
|
|
| · | A degradation factor of 2% is assumed for the life of the power plant output in all cases for normal equipment degradation. |
The site parameters and fuel assumptions are summarized in Table 18-2.
Table 18‑2: Site Parameters and Design Operating Conditions for Proposed Project Power Plant
| Parameter | Basis |
| Elevation | 1,500 ft amsl |
| Primary Fuel | Natural Gas |
| Design Basis Temperature/Relative Humidity | Summer 74°F/40%, Average 32°F/72% RH |
| Plant Net Installed Capacity at Summer Ambient | 318 MW |
| Fuel consumption at normal 270 MW net output | 55 MMSCFD(3) |
| Redundancy Requirements | N + 1 (2) |
Note:
| 1. | Includes a margin for degradation impacts and allowances. |
| 2. | N+1 redundancy means that the power plant is capable of delivering the guaranteed Net output even when One (1) Prime Mover – that is either the gas turbine (or) steam turbine is out of operation (planned maintenance or un-planned trip conditions). The use of the N+1 rating is a compromise from usual standard of N+2 due to the average temperature conditions at site, which are significantly lower than the based temperature used for the N+2 calculation. Power generation is anticipated to be more efficient at site than industry standards because of the low ambient temperatures. |
| 3. | MSCFD – M standard cubic feet per day. |
18.8.1.2 Mine Site Power Plant Selection Process
The combined natural gas-fired turbine power plant was selected because:
| · | it provides the lowest fuel consumption and life-cycle costs over the plant life, as compared to other options. |
|
|
|
| · | it is a proven, readily available technology with high reliability ratings; the light weight of the units reduces shipping costs and transportation constraint. |
|
|
|
| · | it is the cleanest and least carbon intensive solution for fossil-based generation to provide power for the scale of the project. |
| Pebble Project | Page 240 |
| NI 43-101 Technical Report Update and Preliminary Economic Assessment | August 21, 2023 |
|
|
|
18.8.1.3 Plant Efficiency and Electrical Performance
The power plant operating capacity and performance are based on the mine and processing plant configuration as defined at initial start-up.
18.8.1.4 Dispatch Scenarios and Fuel Usage
Five GE LM6000 PF+ SPRINT gas turbines along with two condensing steam turbines would be required for mine operation. All units would be operating during normal operation (when available) to maintain the N+1 scenario. This mode of operation would have minimum impact on the electrical system when one prime mover – that is one GTG unit or one STG unit trips during operation to support the full load demand of the mining operation.
In the event of a unit trip, system frequency is expected to be maintained by a ramping up the load of the remaining operating gas turbines and steam turbines. If the gas turbines are maxed out on the load, additional duct firing in the HRSGs would increase the STG output to stabilize the frequency until the standby GT/ST unit is brought online.
18.8.1.5 Power Plant at Marine Terminal
The marine terminal power plant, which would consist of three 2 MW natural gas-fired engine generators in (N+1) configuration with heat recovery, would be located in close proximity to the substation.
Natural gas would be supplied to the marine terminal plant by an off-take from the pipeline that transports natural gas to the mine site.
18.8.2 Natural Gas Supply
18.8.2.1 Source and Pipeline Routing
The natural gas pipeline to supply the project’s mine site and port site power plants would originate from the existing Cook Inlet Gas Gathering System (CIGGS) natural gas pipeline on the west side of the Kenai Peninsula near Anchor Point. The supply gas would be available at 500 psig. To meet the required gas volumes to the proposed mine and meet the required delivery pressure, a compressor station would be required and sited near the tie-in point with the existing natural gas pipeline at a location on the east side of Cook Inlet 3 miles north of Anchor Point. This compressor station would have a gas turbine driven centrifugal gas compressor capable of providing the required gas at the required 725 psig mine site delivery pressure. The selected pipe would be a nominal 12 in., 12.75 in. outside diameter (OD) pipeline with varying wall thicknesses depending on the pipeline section.
The natural gas pipeline would transition to a subsea pipeline from the compressor station, crossing Cook Inlet from east to west to a landfall at Amakdedori Bay, then overland, buried parallel to the new access road to the south shore of Iliamna Lake. From there, the pipeline will transit Iliamna Lake (on the bottom) south to north and come ashore at Newhalen. The subsurface lake pipeline segment will be buried where it enters and exits the lake such that it is protected from ice movement. North of Iliamna Lake, the pipeline will be buried parallel but offset to portions of an existing road system up to the Newhalen River crossing. The pipeline will cross the Newhalen River via the mine access road bridge, and then will be buried parallel to the mine access road to the mine site.
The approximate lengths of the pipeline segments are provided below. The Anchor Point direct pipe shore crossing length assumes direct pipe exiting the offshore trench in the 50 ft water depth contour. The Amakdedori Bay shore crossing assumes the shore crossing trench starts at the 20 ft water depth.
| Pebble Project | Page 241 |
| NI 43-101 Technical Report Update and Preliminary Economic Assessment | August 21, 2023 |
|
|
|
The natural gas pipeline segments would consist of the following:
| · | hot tap connection on the existing CIGGS natural gas pipeline on the east side of Cook Inlet; |
|
|
|
| · | hot tap on existing east side natural gas pipeline to Anchor Point located compressor plant is 1,300 ft, 12.75 in. outside diameter x 0.375 in. wall thickness (w.t.) API Spec 5L grade X 52 pipeline (via trench installation); |
|
|
|
| · | Anchor Point located compressor plant to horizontally directional drilled (HDD) onshore starting point (via trench installation) is 800 ft, 12.75 in. outside diameter x 0.375 in. w.t. API Spec 5L grade X 52 pipeline; |
|
|
|
| · | Anchor Point onshore HDD starting point to east side Cook Inlet offshore direct pipe exit point (HDD shore crossing segment) is 7,334 ft, 12.75 in. outside diameter x 0.812 in. w.t. API Spec 5L grade X 52 pipeline; |
|
|
|
| · | east side Cook Inlet direct pipe exit point (HDD) to Amakdedori Bay shore crossing trench (offshore segment) is 98.6 miles (520,585 ft); |
|
|
|
| · | Amakdedori Bay shore crossing trench is 1,5000 ft; |
|
|
|
| · | Amakdedori Bay onshore surfacing point to Iliamna Lake south side shore parallel to the planned road (via surface buried and/or trench installation) is 187,650 ft, (straight line distance is 154,500 ft), 12.75 in. outside diameter x 0.375 in. w.t. API Spec 5L grade X 52 pipeline; |
|
|
|
| · | Iliamna Lake south side shore crossing trench is 1,000 ft; 12.75 in. outside diameter x 0.812 in. w.t. API Spec 5L grade X 52 pipeline; |
|
|
|
| · | Iliamna Lake crossing (offshore segment) is 110,200 ft; 12.75 in. outside diameter x 0.812 in. w.t. API Spec 5L grade X 52 pipeline; |
|
|
|
| · | Iliamna Lake north shore (Newhalen) crossing trench is 1,000 ft 12.75 in. outside diameter x 0.812 in. w.t. API Spec 5L grade X 52 pipeline; |
|
|
|
| · | Newhalen onshore surfacing point to Newhalen River Bridge (via trench installation) is 52,100 ft., 12.75 in. outside diameter x 0.375 in. w.t. API Spec 5L grade X 52 pipeline; and |
|
|
|
| · | Newhalen River Bridge to Mine Site parallel to the planned road (via trench installation) is 100,900 ft 12.75 in. outside diameter x 0.375 in. w.t. API Spec 5L grade X 52 pipeline. |
The proposed route is shown in Figure 18-2.
The Cook Inlet and Iliamna Lake crossing portions of the Pebble Mine gas supply line would be a 12.75 in. OD x 0.812 in. API Spec 5L grade X52 pipeline. The heavy-wall pipe would ensure negative buoyancy and increase resistance against physical damage from external forces. The pipeline would have a 16-22 mils external anti-corrosion coating of fusion bonded epoxy (FBE) along the entire length of the offshore segments, except for the direct pipe shore crossing segment north of Anchor Point, which would have an abrasion resistant overcoating (ARO) consisting of 8-10 mils FBE anti-corrosion coating plus 40 mils of dual-layer FBE ARO top coating. The entire length would also have an internal liquid epoxy flow coating with a thickness of 2 mils.
Cathodic protection of the Cook Inlet and Iliamna Lake crossing portions of the pipeline would be provided by aluminium-zinc bracelet anodes. The anticipated life expectancy of the anodes would exceed the design life of the pipeline. Preliminary estimates indicate up to 200 tonnes of anode material may be required.
On the west side of Cook Inlet, the Pebble Mine gas onshore supply line would be a 12.75 in. outside diameter x 0.375 in. API Spec 5L grade X 52 pipeline. The onshore portion of the pipeline would have an external anti-corrosion coating consisting of 8 - 20 mils FBE. Cathodic protection for the pipeline would be in the form of two magnesium ribbons installed in the pipe trench such that they have “visibility” of the pipeline. The pipeline would come ashore at Amakdedori Bay and then transit that portion of land between Amakdedori Bay and Iliamna Lake Bay 29 mi. The pipeline will be placed on the bottom of Lake Iliamna for the bulk of the lake crossing. The natural gas pipeline would then be routed north of the lake 28 mi with the pipeline buried adjacent and parallel to the road route to the power plant at the mine site.
| Pebble Project | Page 242 |
| NI 43-101 Technical Report Update and Preliminary Economic Assessment | August 21, 2023 |
|
|
|
An armoured 24 strand, 1 in. diameter fiber optic cable for communications is also required to be installed along the natural gas pipeline route. The design life for the pipeline and fiber optic cable is 50 years.
Where buried, the pipeline would have a minimum 30 in. of cover. Common resources would be used for construction.
18.8.2.2 Water Crossings
At minor stream crossings, when and where in stream construction would not affect downstream water quality, the pipeline would be installed under the water body. At larger stream crossings, the pipeline would be brought above ground and supported on vehicle bridges.
18.8.2.3 Leak Detection System
Appropriate leak detection methods would be selected during front end engineering and design and could include combination of a reliable computational pipeline monitoring system and a periodic (passive) system such as intelligent internal pipeline inspection (smart-pigging).
18.9 Marine Infrastructure
The Pebble Project requires three main marine infrastructure facilities.
A new marine terminal facility would be constructed at Amakdedori on the west side of Kamishak Bay. This greenfield site would receive, stage, and transship equipment and supplies to the Pebble Project for construction, and during operations facilitate the export of concentrate and receipt of consumables (both containerized and break bulk) and diesel. All cargo types are to arrive at Amakdedori by barges and fuel barges. Additional purpose-dedicated barges would act as transshipment links between the port and ocean-going vessels moored offshore, 12 mi to the east in Kamishak Bay.
For crossing of Lake Iliamna, a pair of ferry terminals, one each on the north and south shores of Lake Iliamna provide the termina of a ferry that would transport the aforementioned goods across the lake in both directions. Each terminal would have a ferry receiving ramp and adequate storage area for staging of cargo.
Figure 18-5 illustrates the marine terminal facilities site location at Amakdedori, and the transshipment location options for mooring of bulk vessels.
| Pebble Project | Page 243 |
| NI 43-101 Technical Report Update and Preliminary Economic Assessment | August 21, 2023 |
|
|
|
Figure 18‑5: Proposed Marine Terminal Facilities Site Plan
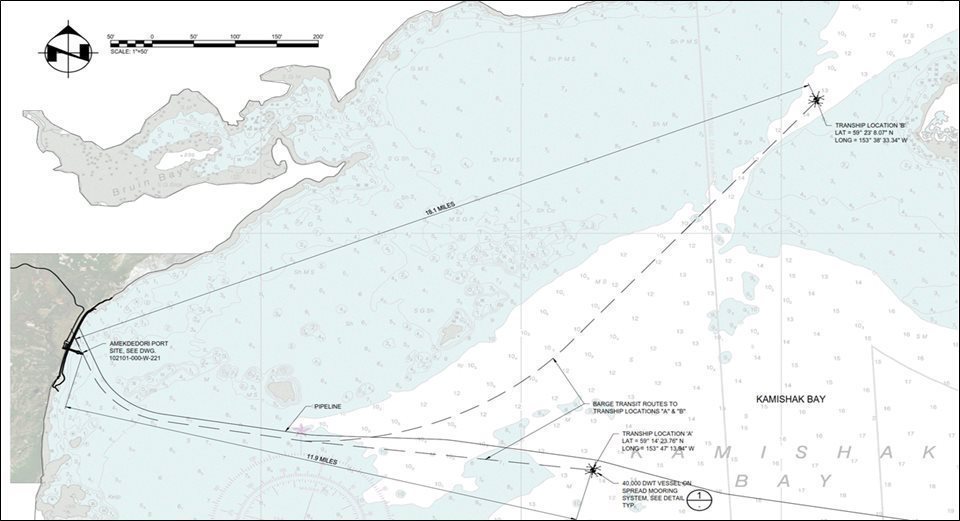
Source: NDM, 2023.
| Pebble Project | Page 244 |
| NI 43-101 Technical Report Update and Preliminary Economic Assessment | August 21, 2023 |
|
|
|
18.9.1 Marine Barge Handling Facility
Marine terminal infrastructure at Amakdedori would include a longitudinal jetty, with twin barge ramps capable of handling barges for concentrate bulk transshipment, fuel barges, as well as large ocean barges (400 x 100 ft) for transport of construction materials and operating supplies by container. Barge access from Cook Inlet to the Amakdedori port site would include a dredged channel and turning basin in front of the dock structures with a minimum 15 ft draft limit, Figure 18-6 is a rendering showing the proposed layout of the marine facilities.
Figure 18‑6: Rendering of the Marine Facilities, Amakdedori
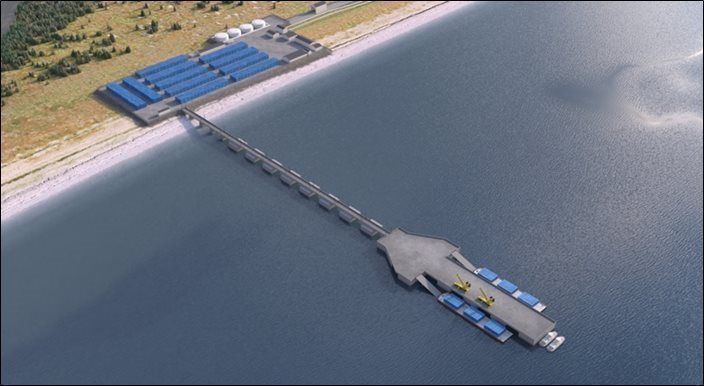
Source: NDM, 2023.
The marine structures would include a main wharf area that would be constructed with 120 x 60 ft pre-cast concrete caissons. The main wharf area, 720 x 120 ft, would be connected to the shore via a causeway. The caissons would be placed 60 ft apart to allow water to flow around them and would be topped with pre-cast concrete beams and a concrete deck. The wharf structure would be designed to accommodate the movement of heavy construction modules and mine equipment. At the sides of the main wharf are a pair of floating barge ramps where roll-on-roll off (ro-ro) barges can be moored and where a forklift or truck can carry the cargo onto the dock and onto shore, and vice versa. The wharf’s sides would be equipped with marine fenders and mooring bollards to safely berth a range of barge sizes.
| Pebble Project | Page 245 |
| NI 43-101 Technical Report Update and Preliminary Economic Assessment | August 21, 2023 |
|
|
|
To prepare for caisson placement, the basin footprint under the caissons would be excavated and levelled to a depth of 5 ft below the dredged basin or seabed using a barge mounted excavator. The 58 ft high caissons would then be floated into place using a tug for guidance at high tide and seated on the levelled seabed on the falling tide or slowly lowered by pumping water into the caisson. Once placed, the caissons would be filled with coarse material from the dredging and additional quarried material of a size that would achieve proper compaction when filled to avoid settlement over time. The additional fill material would be sourced from onshore material sites. The construction sequence would have a narrow channel dredged to the jetty location for movement of the caissons, which would be followed by the completion of the dredged turning basin, and the balance of the access channel.
Draft requirements for the concentrate and supply barges and tugs used during construction and operations are 15 ft. The dredged depth for the access channel and turning basin is 18 ft below mean lower low water to provide access to the jetty under all tidal conditions. This allows an additional 3 ft to accommodate for accumulated sedimentation between forecast maintenance dredging (estimated at 20 in. over 5 years) and over depth excavation. The channel would be 2.9 mi in length and 300 ft wide (3 times the maximum expected barge width), while the turning basin would incorporate an area of 1,100 ft by 800 ft. The total volume of dredged material for the initial dredging is estimated at 1,100,000 yd3. Maintenance dredging is expected to total 700,000 yd3 over twenty years (four times).
Handysize bulk carriers would be secured at a mooring point located in Kamishak Bay, which would include a spread mooring system using floating points attached to gravity anchors in 45 ft deep water. Bulk concentrate, in specialized bulk material handling containers fitting a standard TEU container envelope, would be transported in 2,800 tonnes parcels (80 containers) on barges from the Amakdedori facility to the moored carrier (see Figure 18-7). A crane barge dispatched from Amakdedori and moored with the ship would lift each container, rotate and dump concentrate in bulk into the ship. Empty containers would be returned to shore in reverse. Two concentrate tug and barge units would provide this transshipment service. Depending on the size of the shipment, eight to nine total trips by the tug and barge units would be required to load a bulk carrier, which would be anchored for three to four days at the designated transshipment location.
25 Handysize bulk carrier vessels would be required annually to transport concentrate to offshore markets. In addition to the outbound concentrate movement, up to 15 barge loads of supplies and consumables would be required annually to service the mine, as well as fuel barges delivering diesel 5 times a year, scheduled away from winter months. The marine facility operations would be subject to periodic ice build-up in the winter months, but two ice-breaking tugboats would be used to support year-round availability.
| Pebble Project | Page 246 |
| NI 43-101 Technical Report Update and Preliminary Economic Assessment | August 21, 2023 |
|
|
|
Figure 18‑7: Rendering of Concentrate Transshipment to Bulk Vessel Moored Offshore

Source: NDM, 2023.
18.9.2 Onshore Terminal Facilities – Amakdedori Port, North and South Ferry Terminals
Onshore terminal facilities at Amakdedori Port would include facilities to receive and store bulk concentrate containers, general mine consumable cargoes and fuel, as well as natural gas-powered generators, maintenance facilities, employee accommodations, and offices.
The North and South ferry terminals on Lake Iliamna each include prepared yard staging areas for the receipt, storage and transloading of all cargos aforementioned. This is supported by a small office building and maintenance workshop at each terminal location. The North Ferry terminal will include a second barge ramp for winter use, in additional to the primary summer-only ramp. The South Ferry terminal will include an attached construction area for the final assembly of the lake ferry arriving in prefabricated modules, and for its subsequent launching into the lake. A rendering showing the proposed North and South ferry terminals is provided in Figure 18-8 and Figure 18-9.
| Pebble Project | Page 247 |
| NI 43-101 Technical Report Update and Preliminary Economic Assessment | August 21, 2023 |
|
|
|
Figure 18‑8: Rendering of the North Ferry Terminal at Eagle Bay, Lake Iliamna
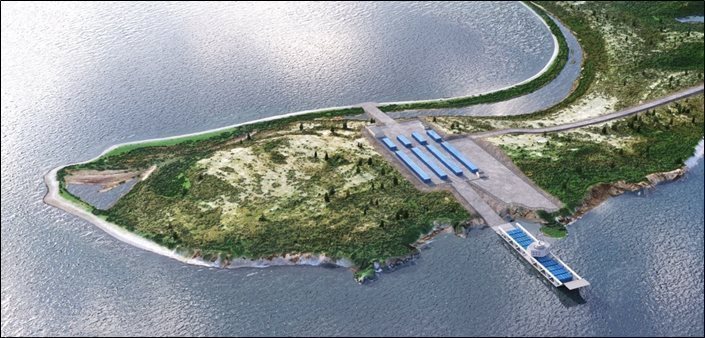
Source: NDM, 2023.
Figure 18‑9: Rendering of the South Ferry Terminal at Lake Iliamna, with Ferry Construction Area
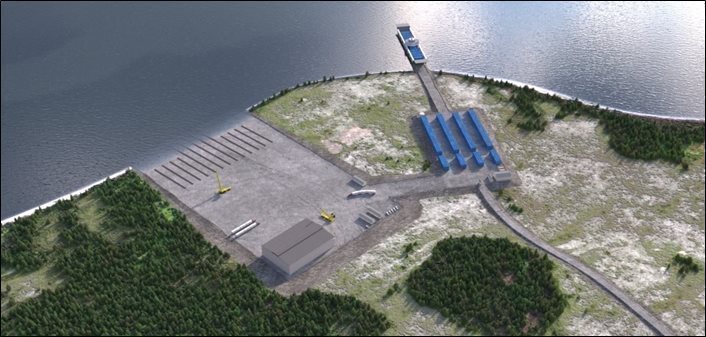
Source: NDM, 2023.
| Pebble Project | Page 248 |
| NI 43-101 Technical Report Update and Preliminary Economic Assessment | August 21, 2023 |
|
|
|
Specific features of the Amakdedori onshore facilities include the following:
| · | an open area material laydown yard for equipment and container storage for 2,000 twenty-foot equivalent units (TEU); |
|
|
|
| · | a fuel storage depot with four 1,325,000 US Gallons (US Gal) vertical storage tanks providing 5.3 million US gallon capacity; |
|
|
|
| · | a truck shop combined with an emergency vehicle building (ambulance, fire truck); |
|
|
|
| · | two 2 MW natural gas fired generators (plus backup) with heat recovery system plus and emergency diesel generator; |
|
|
|
| · | an administration building with permanent camp facilities for up to 40 local site employees; |
|
|
|
| · | warehouse and cold storage buildings; |
|
|
|
| · | domestic water storage and treatment facilities; |
|
|
|
| · | refrigerated container storage racks; and |
|
|
|
| · | a spill response container complete with spill response booms, pads etc. |
18.9.3 Fuel Supply
Diesel fuel to support the mining operation and logistics systems would be imported to the Amakdedori terminal using marine fuel barges and pumped to the 5.3 M US Gal capacity onshore storage facility. The expected maximum parcel size per delivery is 4 M US Gal, which would allow for one month of buffer for variations in barge arrivals in winter months.
Diesel fuel would be transferred from Amakdedori to the mine site using ISO tank containers, which have a capacity of 6,350 US Gal per tank. These units would be loaded at the port and transported by tractor trailer trucks three at a time to the mine site. Containers are envisaged as primarily transport vessels only. Mine area fuel reserves in the event of a supply disruption. would be contained in bulk tanks at the mine with additional capacity.
The main mine site fuel storage area would contain fuel tanks in a dual-lined and bermed area designed to meet regulatory requirements. Sump and truck pump out facilities would be installed to handle any spills. There would also be pump systems for delivering fuel to the rest of the mine site. Dispensing lines would have automatic shutoff devices, and spill response supplies would be stored and maintained on site wherever fuel would be dispensed. Mine area fuel reserves in the event of a supply disruption are accommodated by additional capacity in these tanks.
Fuel would be dispensed to a pump house located in a fuel storage area for fuelling light vehicles. It would also be dispensed to the fuel tanks in the truck shop complex, which are used for fuelling of heavy mining equipment. These tanks would also be in a lined secondary containment area.
18.10 Ferry
A 5,000-ton carrying capacity icebreaking ferry will connect the access road sections north and south of Iliamna Lake. The route across the lake is 20 miles. The vessel will be designed to travel through ice as thick as 2 ft. Studies conducted by the Pebble Partnership indicated in some years the route has been free of ice through the winter, with a median ice cover duration of 110 days.
| Pebble Project | Page 249 |
| NI 43-101 Technical Report Update and Preliminary Economic Assessment | August 21, 2023 |
|
|
|
The vessel design concept is based on a similar vessel, which has been operating on Lake Williston in northern British Columbia for 30 years. The concept is of a symmetrical forward-aft roll-on-roll-off (RORO) type vessel with a single heavy vehicle deck, with ramps at both ends (see Figure 18-10). The symmetry will allow the vessel to travel in either direction without having to turn. Propulsion is of a diesel-electric (DE) type, comprising four generators each rated at 1,000 kW, and four azimuthing thrusters providing thrust in 360° range. The DE plant provides flexibility of operation, with only as many generators online as needed at any given time. In winter, all four may be running providing power needed to break ice. In ice free waters, only two will be required and while manoeuvring and docking, only one. This arrangement provides fuel efficiency and near silent operation.
Figure 18‑10: Ice-Breaking Ferry
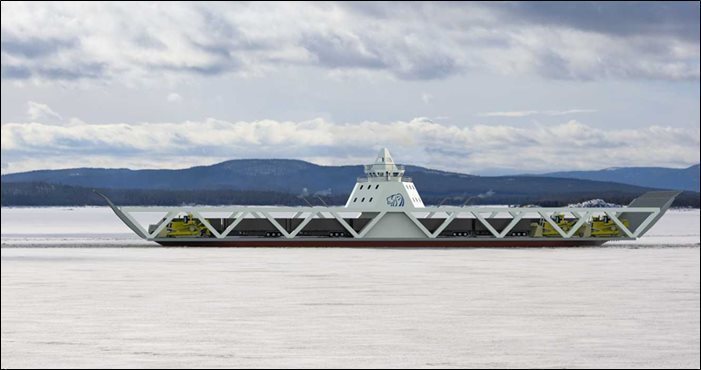
Source: NDM, 2023.
Accommodation will be provided with eight single crew cabins, a galley and all facilities necessary to make the ferry operation independent from shore services. It will also provide shelter for the vehicle drivers as required.
The vessel would be assembled from modules, with the modules constructed in a separate yard and transported by barge and truck to the south ferry terminal. The facilities here would enable the module assembly, vessel launch, and vessel dry-dock maintenance (see Figure 18-11).
| Pebble Project | Page 250 |
| NI 43-101 Technical Report Update and Preliminary Economic Assessment | August 21, 2023 |
|
|
|
Figure 18‑11: Ferry Assembly Facility at South Ferry Terminal

Source: NDM 2023.
| Pebble Project | Page 251 |
| NI 43-101 Technical Report Update and Preliminary Economic Assessment | August 21, 2023 |
|
|
|
19 MARKET STUDIES AND CONTRACTS
19.1 Introduction
The project would produce copper-gold and molybdenum flotation concentrates and a precious metals gravity concentrate. The copper-gold concentrate would be trucked in purpose-built containers to the marine terminal and from there transshipped to ocean-going freighters for shipment to smelter customers likely in Asia and Europe. The molybdenum concentrate would be filtered at the mine site and placed in large sacks which are in turn placed in conventional shipping containers. The containers would be trucked to the port and shipped to refineries located outside Alaska. Other economically valuable minerals (gold and silver in the copper-gold concentrate and rhenium in the molybdenum concentrate) would be present and likely payable in the concentrates. The gravity concentrate would be treated in a manner similar to the molybdenum concentrate but shipped to precious metal specific refineries.
A marketing plan and more precise terms of sale of the final products would be prepared during the next phase of study of the Pebble Project.
19.2 Metal Prices
The long-term metal prices used in the 2023 PEA economic analysis are shown in Table 19-1. These prices are based on a review of public information including industry consensus forecasts and trailing average metal prices. The above noted information has been reviewed by the QP and the results supports the assumptions in the technical report.
Table 19‑1: Metal Prices
| Metal Type | Unit | Long-Term Value ($) |
| Copper | lb | 3.90 |
| Gold | oz | 1,700 |
| Molybdenum | lb | 12.50 |
| Silver | oz | 22.50 |
| Rhenium | kg | 1,500 |
Metal price projections used in the 2023 PEA were guided by trailing average commodity prices and long-term price forecasts from analyst consensus as of July 31, 2023, as summarized in Table 19-2.
Table 19‑2: Average Metal Prices (Data from S&P Market Intelligence, July 2023)
| Average | Copper ($/lb) | Gold ($/oz) | Molybdenum ($/lb) | Silver ($/oz) |
| 1-Year Trailing | 3.79 | 1,962 | - | 23.88 |
| 2-Year Trailing | 4.05 | 1,838 | - | 22.62 |
| 3-Year Trailing | 3.94 | 1,842 | - | 23.70 |
| Long-Term Analyst Consensus, Average | 3.73 | 1,707 | 13.64 | 22.42 |
| Report Economic Analysis | 3.90 | 1,700 | 12.50 | 22.50 |
| Pebble Project | Page 252 |
| NI 43-101 Technical Report Update and Preliminary Economic Assessment | August 21, 2023 |
|
|
|
Copper is a widely-used metal, key to electrification and power distribution. China, Europe, and the USA are the main global consumers of copper. Recent analyst consensus shows the average of the estimates of the long-term copper price to be $3.73 /lb as of July 31, 2023, while the two-year trailing copper price as of July 31, 2023, is $4.05 /lb, supporting a $3.90 /lb study copper price.
Recent analyst consensus shows the average of the estimates of the long-term gold price to be $1,707 /oz as of July 31, 2023, while the two-year trailing gold price as of July 31, 2023, is $1,838 /oz, both of which support a $1,700/ oz study price.
Silver price trends have generally followed gold. Recent analyst consensus shows the average of the estimates of the long-term silver price to be $22.42 /oz as of July 31, 2023, while the two-year trailing silver price as of July 31, 2023, is $22.62/oz, supporting a $22.50 /oz study price.
Recent analyst consensus shows the average of the estimates of the long-term molybdenum price to be $13.64 /lb as of July 31, 2023, supporting a $12.50 /oz study price.
Rhenium is a relatively rare element, whose primary uses are in superalloys for turbine engine components and as a catalyst in oil reforming for the production of high-octane hydrocarbons, important for lead-free gasoline. Due to the low metal prices and low demand for rhenium during the global COVID-19 pandemic, many primary producers of rhenium are now focusing on secondary products. Based on USGS data, the price of the metal has decreased from $4,500 /kg in 2011 to $2,000 /kg in 2016 to $1,000 /kg in 2020 (USGS, 2022). The ask rhenium price on kitco.com on August 17, 2023, was $1,551/kg with a bid price of $1,240.80 /kg.
19.3 Smelter Terms
The assumed smelter/refinery terms in the 2023 PEA are shown in Table 19-3.
For copper concentrate, ocean transportation costs are assumed to be $50.00 /wet tonne and concentrate moisture content was assumed to be 8%. For molybdenum concentrate, ocean transportation costs are assumed to be $171.12/wet tonne and concentrate moisture content was assumed to be 5%.
| Pebble Project | Page 253 |
| NI 43-101 Technical Report Update and Preliminary Economic Assessment | August 21, 2023 |
|
|
|
Table 19‑3: Smelter and Refinery Terms
| Item | Units | Value |
|
| Metal Payable | Copper in Copper Concentrate | % | 96.15 |
| Gold in Copper Concentrate | % | 97.00 |
|
| Silver in Copper Concentrate | % | 90.00 |
|
| Molybdenum in Molybdenum Concentrate | % | 100 |
|
| Marketing | Copper Concentrate Losses | % | 0.15 |
| Molybdenum Concentrate Losses | % | 0.10 |
|
| Insurance | % of value | 0.15 |
|
| Representation | $/wet tonne of concentrate | 2.50 |
|
| Treatment Smelting and Refining Terms | Treatment of Cu Concentrate | US$/dry tonne of concentrate | 70 |
| Refining of Cu in Cu Concentrate | US$/payable lb | 0.07 |
|
| Refining of Au in Cu Concentrate | US$/payable oz | 7.00 |
|
| Refining of Ag in Cu Concentrate | US$/payable oz | 0.60 |
|
| Refining of Au/Ag Doré | US$/payable oz | 1.00 |
|
| Roasting of Mo in Mo Concentrate | US$/payable lb | 3.00 |
|
The copper concentrate market has seen significant structural imbalances in the recent past between a shortage in mine concentrate production and excesses in smelting capacity. Since 2000, there has been a significant expansion of smelting and refining capacity, particularly in China and India, resulting in benchmark treatment and refining levels being sub-economic, benefiting the miners. With increased smelter and refinery operating costs and copper concentrate surplus forecast in the near term from mine production, smelter terms moved upwards from the 2019 benchmark levels of $63.50 /dmt and $6.35/lb to $70 /dmt and $0.07/lb for 2021.
Smelter terms for copper are 96.15% payable with a minimum deduction of 1 unit (amount deducted has to equate to a minimum of 1% of the agreed concentrate copper assay). As the Pebble Project is expected to have an average copper concentrate grade of 26%, the one-unit threshold should apply and has been assumed in the financial evaluation.
Payable gold and silver in the copper concentrate would depend on the ultimate smelter location. In Japan, Korea, and India, for the Pebble Project’s expected concentrate specifications of 20 g/dmt for gold and 102 g/dmt for silver, gold is expected to be 97% payable and silver 90% payable. There is some variance in terms between Asia and Europe.
It is unlikely that any materially significant penalties would be applicable for the Pebble copper concentrate, particularly given the projected production volume and the relatively low content of deleterious elements anticipated.
Molybdenum concentrates are generally sold at a percentage discount to the quoted price for the equivalent MoO3 value contained. This would depend on supply and demand fundamentals as well as on the quality of the particular concentrate. Discounts, for standard quality molybdenum concentrates, which normally capture all off-site costs, would typically range between 10-13% depending on grade and impurity levels with 12% assumed as an average. In addition, there has been a trend towards minimum and maximum dollar levels to be applied to the percentage deduction. The molybdenum deduction and discount are included in the $3 /lb of payable molybdenum treatment charge. The copper content in the molybdenum concentrate is subject to a penalty that is normally applied on a dollar scale, depending on the level. In theory, for example, at the indicated copper grade in the molybdenum concentrates, one dollar in penalties would be added over and above the other charges. Therefore, if Northern Dynasty was able to sell molybdenum concentrate with a projected copper content of 1.8%, it should expect a discount of at least 5% greater, or up to 17% of the molybdenum oxide price. In practice, at the anticipated amount of copper in the molybdenum concentrate, there is a high probability that the concentrate would have to be pretreated (likely by leaching) to reduce the copper content to around 0.45% prior to roasting to produce MoO3.
| Pebble Project | Page 254 |
| NI 43-101 Technical Report Update and Preliminary Economic Assessment | August 21, 2023 |
|
|
|
The molybdenum concentrate is expected to contain significant rhenium, estimated at 861 ppm. Rhenium is included in the resource estimate, and therefore is estimated in the production forecast and used in the financial model. Not all of the major custom roasting operations can effectively recover rhenium, and thus it is likely that the rhenium content would be subject to a deduction. The rhenium value has been based on smelter terms of 90% payable with no treatment or refining charges.
19.4 Concentrate Logistics
The average annual copper-gold concentrate output is estimated to be 559,000 tonnes (dry concentrate). Figure 19-1 illustrates the estimated copper-gold concentrate production over the 20-year project life.
Figure 19‑1: Copper Concentrate Production

Note: Figure prepared by NDM, 2022.
The primary market for the copper concentrate will be Asia (China, Japan, Korea, and India) with a small amount sold to European smelters.
The average annual molybdenum concentration production (dry concentrate) is estimated at 14,000 tonnes. Figure 19-2 illustrates the estimated molybdenum concentrate output over the project life. The containerized molybdenum concentrate would be trucked to the port and shipped to refineries located outside Alaska.
| Pebble Project | Page 255 |
| NI 43-101 Technical Report Update and Preliminary Economic Assessment | August 21, 2023 |
|
|
|
Figure 19‑2: Molybdenum Concentrate Production

Note: Figure prepared by NDM, 2022.
19.5 Contracts
19.5.1 Existing Contracts
No contracts for transportation or off-take of the concentrates are currently in place, but if and when they are negotiated, they are expected to be within norms for Alaska. Similarly, there are no contracts currently in place for supply of reagents, utilities, or other bulk commodities required to construct and operate the project.
19.5.2 Royalties
The Pebble Partnership has signed a Royalty Agreement, whereby the royalty holder has the right to receive a portion of the future gold and silver production from the proposed Pebble Project for the life of the mine. The right can be exercised through five tranches, with each tranche providing the royalty holder with the right to 2% of the gold production and 6% of the silver production after accounting for notional payments of $1,500 /oz of gold and $10 /oz for silver. The Pebble Partnership will retain a portion of the gold when the spot price exceeds $4,000 /oz or when the recovery rate exceeds 60%. The Pebble Partnership will also retain a portion of the silver when the spot price exceeds $50 /oz or when the recovery rate exceeds 65%. To date, the royalty holder has purchased the first tranche.
| Pebble Project | Page 256 |
| NI 43-101 Technical Report Update and Preliminary Economic Assessment | August 21, 2023 |
|
|
|
20 ENVIRONMENTAL STUDIES, PERMITTING, AND SOCIAL OR COMMUNITY IMPACT
20.1 Project Setting
20.1.1 Jurisdictional Setting
The Pebble deposit is located on State land that has been specifically designated for mineral exploration and development. The project area has been the subject of two comprehensive land-use planning exercises conducted by the Alaska Department of Natural Resources (ADNR); the first in the 1980s and the second completed in 2005 and subsequently revised in 2013. ADNR identified five land parcels (including Pebble) within the Bristol Bay planning area as having “significant mineral potential,” and where the planning intent is to accommodate mineral exploration and development. These parcels total 2.7% of the total planning area (ADNR, 2013).
20.1.2 Environmental and Social Setting
The surface elevation over the deposit ranges from 800 to 1,200 ft amsl, although mountains in the region reach 3,000 to 4,000 ft amsl. Vegetation generally consists of wetland and scrub communities with some coniferous and deciduous forested areas that become more common eastward toward the Aleutian Range.
The deposit area lies at a drainage divide between the Nushagak River and Kvichak River systems (see Figure 20-1). The Nushagak River system drains to Bristol Bay at Dillingham, 220 river miles southwest of the deposit area. The Kvichak River system drains into Bristol Bay via the Kvichak River 140 river/lake miles to the southwest.
In the deposit area, the tributaries of Nushagak River are the NFK, SFK, while the tributary of the Kvichak River is the UTC. The deposit area is within the uppermost reaches of these streams. The NFK and SFK streams merge to form the main Koktuli River, 17 mi from the deposit area. Koktuli River is a tributary to the lower Mulchatna River, which drains via the lower Nushagak River to Bristol Bay at Dillingham. The UTC flows into Iliamna Lake, which in turn drains into Bristol Bay via Kvichak River (Figure 20-1).
| Pebble Project | Page 257 |
| NI 43-101 Technical Report Update and Preliminary Economic Assessment | August 21, 2023 |
|
|
|
Figure 20‑1: Bristol Bay Watersheds
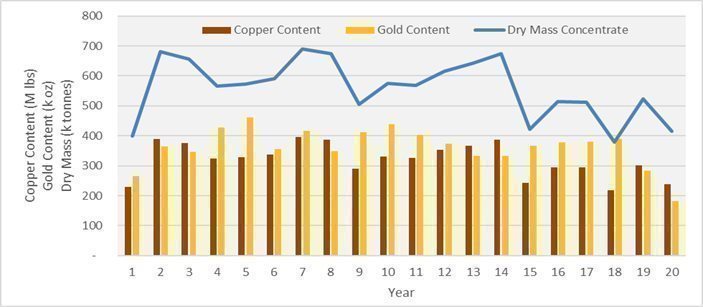
Note: Figure prepared by NDM, 2021.
The Kvichak and Nushagak River systems are two of nine major systems that drain to Bristol Bay and support Pacific salmon runs, most notably sockeye salmon (Jones et al., 2013). The Kvichak and Nushagak Watersheds total 22,965 mi2, of which the NFK, SFK and UTC Watersheds comprise 355 mi2, or 0.8% of the total Bristol Bay Watershed of 45,246 mi2 (USGS, 2013). Government data indicate that, over the past decades, the combined Kvichak and Nushagak river systems have contributed 20% to 30% of total Bristol Bay sockeye salmon escapement. In 2019, these systems accounted for 23% of sockeye returns (ADFG, 2020). Thus, 70% to 80% of Bristol Bay sockeye production is hydrologically isolated from any potential effects of the Pebble Project.
Based on field studies conducted by the Pebble Partnership over 10 years, along with other government studies, e.g., ADFG, (2009), the NFK, SFK and UTC Watersheds generally produce less than 0.5% of the total Bristol Bay sockeye run (harvest plus escapement). The NFK and SFK Watersheds, within which all major mine site infrastructure is located, produces less than 0.1% of all Bristol Bay sockeye (ADFG, 2009).
| Pebble Project | Page 258 |
| NI 43-101 Technical Report Update and Preliminary Economic Assessment | August 21, 2023 |
|
|
|
Wildlife using the deposit area includes various species of raptors and upland birds, brown bear, caribou, and moose. Although no listed species are known to use the deposit area, several species listed under the Endangered Species Act—Steller’s eider, northern sea otter, Steller sea lion, humpback whale, and the Cook Inlet beluga whale—as well as harbour seals protected under the Marine Mammal Protection Act, are known to be present in Cook Inlet and some western Cook Inlet shoreline communities.
The deposit area and transportation corridor are isolated and sparsely populated (Figure 5-1). The Pebble deposit is located within the Lake and Peninsula Borough, which has a population of approximately 1,600 persons in 18 communities. The closest villages – Iliamna, Newhalen and Nondalton – lie approximately 17-19 miles from the deposit site. There are three other villages on Lake Iliamna. Kokhanok lies on the south shore of Iliamna Lake, adjacent to the southern leg of the transportation corridor. The other two villages are Pedro Bay, 43 mi east of the deposit on the north shore of Iliamna Lake, and Igiugig at the west end of Iliamna Lake at its outlet to the Kvichak River. The population of Newhalen, the largest village, is 215 full-time residents. A road connects the villages of Newhalen and Iliamna and extends to a proposed crossing of Newhalen River just south of Nondalton. Another road connects Williamsport on Iliamna Bay in Cook Inlet with Pile Bay at the east end of Iliamna Lake. Otherwise, there are only local roads in the villages. Summer barges up the Kvichak River and on Iliamna Lake provide some freight service into the communities on Iliamna Lake. All of the communities are serviced by an airport or airstrip to provide year-round access. The airport serving Iliamna and Newhalen is a substantial facility that is available to a wide range of aircraft.
The total population within the Bristol Bay region is 7,000. The largest population center of the region is Dillingham. It has a population size of 2,300, or 30% of the region.
20.2 Baseline Studies – Existing Environment
Northern Dynasty began an extensive field study program in 2004 to characterize the existing physical, chemical, biological, and social environments in the Bristol Bay and Cook Inlet areas where the Pebble Project might occur. Many consulting firms, bringing a wide range of specialized knowledge, were enlisted to support this program. The Pebble Partnership compiled the data for the 2004 to 2008 study period into a multi-volume Environmental Baseline Document (EBD) (PLP, 2012). Supplemental environmental baseline reports (SEBD) incorporated data collected from the period 2009 to 2012. Additional monitoring data collected through 2019 was provided to USACE in support of the ongoing permitting process. These studies were designed to:
| · | fully characterize the existing biophysical and socioeconomic environment; |
|
|
|
| · | support environmental analyses required for effective input into the Pebble Project design; |
|
|
|
| · | provide a strong foundation for internal environmental and social impact assessment to support corporate decision-making; |
|
|
|
| · | provide the information required for stakeholder consultation and mine permitting in Alaska; and |
|
|
|
| · | establish a baseline for long- term monitoring to assess potential changes associated with future mine development. |
| Pebble Project | Page 259 |
| NI 43-101 Technical Report Update and Preliminary Economic Assessment | August 21, 2023 |
|
|
|
The baseline study program includes:
| · | surface water hydrology |
|
|
|
| · | groundwater hydrology |
|
|
|
| · | surface and groundwater quality |
|
|
|
| · | geochemistry |
|
|
|
| · | snow surveys |
|
|
|
| · | fish and aquatic resources |
|
|
|
| · | noise |
|
|
|
| · | wetlands |
|
|
|
| · | trace elements |
|
|
|
| · | fish habitat – stream flow modelling |
|
|
|
| · | marine |
|
|
|
| · | wildlife; |
|
|
|
| · | air quality |
|
|
|
| · | cultural resources |
|
|
|
| · | subsistence |
|
|
|
| · | land use |
|
|
|
| · | recreation |
|
|
|
| · | socioeconomics |
|
|
|
| · | visual aesthetics |
|
|
|
| · | climate and meteorology |
|
|
|
| · | Iliamna Lake |
The following sections highlight key environmental topics referenced from the EBD and SEBC. More detail is available in these two documents and the project FEIS. The EBD is available online at https://pebbleresearch.com. Information from other sources is identified as appropriate.
20.2.1 Climate and Meteorology
Meteorological monitoring data were collected from six meteorological stations located in the Bristol Bay drainage study area and three stations located in the Cook Inlet study area near Iliamna Bay (PLP, 2012). Meteorological monitoring in the area near the deposit occurs at an elevation between 800 to 2,300 ft amsl. Monitoring in the Cook Inlet study area occurs near sea level.
| Pebble Project | Page 260 |
| NI 43-101 Technical Report Update and Preliminary Economic Assessment | August 21, 2023 |
|
|
|
Data collected at all stations included wind speed and direction, wind direction standard deviation and air temperature. Collected data at stations where instrumentation has been installed include differential temperature, solar radiation, barometric pressure, relative humidity, precipitation and, in summer, evaporation. Meteorological monitoring was suspended at the Pebble 1 station in 2014, restarted in 2017, and the station shutdown and removed in 2022. A new monitoring station was installed near the proposed Amakdedori marine terminal in 2017. The Amakdedori station was removed in 2022. Monitoring at the remaining stations was suspended in 2013 after sufficient baseline data was collected.
Mean monthly temperatures in the deposit area range from 50.8°F in July to 11.4°F in January. The mean annual precipitation is estimated to be 54.6 in. per year, one-third of which falls as snow. The wettest months are August through October.
20.2.2 Surface Water Hydrology and Quality
20.2.2.1 Surface Water Hydrology
The Bristol Bay drainage basin encompasses 45,246 m2 in southwest Alaska. Figure 20-2 shows the study area, which is principally defined as the 355 mi2 within the SFK, NFK and UTC drainages. The Nushagak and Kvichak Watersheds constitute 51% of the Bristol Bay basin area (USGS 2013). The deposit location straddles the watershed boundary between the SFK and UTC and lies close to the headwaters of the NFK. The area studied near the deposit encompasses the drainages of these three watercourses as well as the headwaters of Kaskanak Creek. While the deposit area and potential mine footprint does not affect the Kaskanak Creek headwaters, it was included in the study design to allow for comprehensive long-term monitoring of mine operations.
| Pebble Project | Page 261 |
| NI 43-101 Technical Report Update and Preliminary Economic Assessment | August 21, 2023 |
|
|
|
Figure 20‑2: Local Watershed Boundaries

Note: Figure prepared by NDM, 2021.
Annual stream flow patterns in the study area are generally characterized by a bi-modal hydrograph with high flows in spring resulting from snowmelt and low flows in early to mid-summer resulting from dry conditions and depleting snowpacks. Frequent rainstorms in late summer and early autumn contribute to another high-flow period. The lowest flows occur in winter when most precipitation falls as snow and remains frozen until spring. Loss and gain of surface flow to groundwater plays a prominent role in the flow patterns of all study area creeks and rivers, causing some upstream sites to run dry seasonally while causing others to be dominated by baseflow due to gains.
| Pebble Project | Page 262 |
| NI 43-101 Technical Report Update and Preliminary Economic Assessment | August 21, 2023 |
|
|
|
During winter and summer low-flow periods, stream flows are primarily fed by groundwater discharge. Observed baseflows were higher during summers than winters due to snowmelt recharge of aquifers and intermittent rainstorms. Baseflows were lowest in late winter after several months without surface runoff. Low-flow conditions are also influenced by fluctuations in surface storage features such as lakes, ponds and wetlands; however, changes in surface storage are minimized during the late winter freeze.
20.2.2.2 Surface Water Quality
Surface water quality sampling within the study area occurred between 2004 and 2014 at numerous locations in the NFK, SFK, UTC and KC drainages. Stream samples were collected from 44 locations during 50 sampling events from April 2004 through December 2008. Lake and pond samples were collected from 19 lakes once or twice per year during 2006 and 2007. Seep samples were collected from 11 to 127 sample locations, depending on the year, two to five times per year. Altogether, over 1,000 samples were collected from streams, more than 600 samples from seeps, and 50 samples from lakes.
Surface water in the study area is characterized by cool, clear waters with near-neutral pH that are well-oxygenated, low in alkalinity, and generally low in nutrients and other trace elements. Water types ranged from calcium-magnesium-sodium-bicarbonate to calcium-magnesium-sodium-sulphate. Water quality occasionally exceeded Alaska water quality criteria for trace elements such as copper and iron, likely due to mineralized rock in the area. Additionally, naturally occurring cyanide was present in detectable concentrations; there were consistently detectable concentrations of dissolved organic carbon; and no detectable concentrations of petroleum hydrocarbons, polychlorinated biphenyls (PCBs), or pesticides were found.
20.2.3 Groundwater Hydrology and Quality
20.2.3.1 Groundwater Hydrology
Beginning in 2004, Northern Dynasty established an extensive groundwater monitoring network across the study area. The Pebble Partnership expanded the monitoring network to refine the understanding of the groundwater flow regime; between 2004 and 2019 groundwater monitoring data were collected over variable periods of time at more than 500 monitoring locations.
The hydrostratigraphy of the project area includes three main units: unconsolidated sediments, weathered bedrock, and competent bedrock. The unconsolidated sediments, deposited during multiple episodes of glaciation, have variable hydrogeologic properties ranging from highly permeable sands and gravels to very low permeability clays. The weathered bedrock unit, which outcrops along ridges and hilltops, tends to be more permeable than the underlying competent bedrock. No permafrost has been identified in the study area.
In 2019 six boreholes were drilled and instrumented to the northeast of the proposed open pit. The stratigraphy encountered in these holes was broadly similar, consisting of 90 to 100 ft of Quaternary glacial sediments overlying Tertiary conglomerate and Cretaceous granodiorite. Two 6 in. nominal diameter pumping wells were installed to target zones interpreted to be more permeable (i.e., weathered bedrock and Tertiary-Cretaceous contact). Monitoring wells were installed in the weathered bedrock and vibrating wire piezometers were installed in both bedrock units and unconsolidated sediments. Slug tests conducted in the two monitoring wells yielded hydraulic conductivity estimates for the weathered bedrock at this location ranging from the order of 10-3 to 10-5 ft/s.
| Pebble Project | Page 263 |
| NI 43-101 Technical Report Update and Preliminary Economic Assessment | August 21, 2023 |
|
|
|
In addition, a 72-hour pumping test was conducted in a previously installed pumping well in the bulk TSF SPC area. The pumping test was conducted at a rate of 4 gpm, and drawdown was observed in the pumping well and at instruments located 30 ft away. Hydraulic conductivity estimates from this test for the interpreted bedrock aquifer were on the order of 10-6 ft/s, comparable to values for weathered bedrock from previous studies at the site.
Throughout the study area the water table mimics surface topography in a subdued fashion; it is generally located near or at ground surface in low-lying areas, and at greater depths near ridges and ridge tops. Flowing artesian conditions, where groundwater levels are above ground surface, are observed in some low-lying discharge areas. Groundwater elevations are typically observed to be lowest during the spring prior to snowmelt, and highest immediately following freshet and/or autumn rains. Groundwater-surface water interactions within the study area are complex due to the heterogeneous nature of the surficial geology and variable topography.
20.2.3.2 Groundwater Quality
Groundwater wells were located within the Pebble deposit resource area (10 wells at seven locations), and along the three surface water drainage basins identified as reflective of groundwater flow from the Pebble deposit resource area. Sample analysis shows high dissolved oxygen levels at most locations, with most median pH values ranging from 5.3 to 8.5. Sites with elevated trace metal concentrations were generally in the vicinity of the deposit. The EBD and SEBD compared the results of groundwater quality sampling with the most stringent benchmark water quality criteria derived from Title 18 of the Alaska Administrative Code, Section 75 (18AAC75), and Alaska Water Quality Criteria (ADEC, 2008).
20.2.4 Geochemical Characterization
Northern Dynasty and the Pebble Partnership conducted a comprehensive geochemical characterization program to understand the ML and acid rock drainage (ARD) potential associated with the rock types present in the general deposit area within the Pebble Project study area. The ML/ARD study was designed to characterize the materials that could be produced from the mining and milling process at the Pebble deposit, including both waste rock and tailings material (PLP, 2012). Classification of acid generating potential is based on Mine Environment Neutral Drainage (MEND, 1991) guidelines that classify rock as PAG, uncertain or non-PAG based on the neutralization potential ratio (NPR), defined as the neutralization potential (NP) divided by maximum potential acidity (MPA). Detailed characterization and classification of PAG and non-PAG materials enable engineers to design appropriate materials handling, sorting and storage strategies to ensure the long-term protection of water quality.
Acid-base accounting results indicate that the Tertiary units are dominantly non-PAG. Minor components of the Tertiary volcanic rocks (less than 1% based on testing) contain pyrite mineralization and have been found to be PAG and some generated acid in laboratory tests. The pre-Tertiary samples from the porphyry-mineralized rock from the deposit area have variable acid generation potential. Pre-Tertiary rock was found to be dominantly PAG due to elevated acid potential (AP) values resulting from increased sulphur concentrations and the low levels of carbonate minerals. In the pre-Tertiary samples, acidic conditions occur quickly in core with low NP. Field data suggest that the onset to acidic conditions is 20 years, while laboratory kinetic tests show that the delay to the onset of acidic conditions is expected to be between a decade and several decades for PAG rock.
The majority of the overburden samples analyzed have been classified as non-PAG, with very low total sulphur content dominated by sulphide. For pre-Tertiary material, metal mobility tests identified copper as the main contaminant in the leachate. Subaqueous conditions also produced the dissolution of gypsum and iron carbonate, as well as arsenic leaching. Weathering of the mineralized pre-Tertiary material under oxidizing conditions produced an acidic leachate dominated by sulphate and calcium. Non-PAG tests indicated that the oxidation of pyrite resulted in low pH conditions, which increased metal mobility.
| Pebble Project | Page 264 |
| NI 43-101 Technical Report Update and Preliminary Economic Assessment | August 21, 2023 |
|
|
|
20.2.5 Wetlands
Section 404 of the CWA governs the discharge of dredged or fill materials into waters of the U.S., including wetlands. USACE issues Section 404 permits with oversight by the U.S. Environmental Protection Agency (EPA). Given the Pebble Project’s location and scope, the information required to support the Pebble Partnership’s Department of the Army permit application is significant. Accordingly, Northern Dynasty and the Pebble Partnership conducted an extensive, multi-year wetlands study program at Pebble in both the Bristol Bay and Cook Inlet drainages.
The study area is much larger than the deposit area. This entire study area has been mapped to determine the occurrence of wetlands and to characterize baseline conditions. Overall, water bodies, wetlands and transitional wetlands represent 9,826 acres, or 33.4%, of the study area. Of the 375 water features evaluated in the overall study area, 308 (82.1%) were classified as lakes or perennial ponds, the vast majority of which were open water. The remaining 67 water features (17.9%) were classified as seasonal ponds or the drawdown areas of perennial ponds, which were evenly encountered as open water or partially vegetated/barren ground.
All wetlands delineation in the field for the transportation corridor has been completed.
On May 25, 2023, the U.S. Supreme Court published its decision on Sackett v. EPA in which the court identified a number of issues with the basis on which the EPA and USACE had defined jurisdictional wetlands. While a full assessment of the implications of the U.S. Supreme Court decision has not been made, it is possible the area of jurisdictional wetlands within the study will be reduced.
20.2.6 Fish, Fish Habitat and Aquatic Invertebrates
Extensive aquatic habitat studies, initiated in 2004, were conducted from 2004 to 2013. Additional fish habitat studies were conducted on the NFK in 2018. They have varied in scope, study area and level of effort, as the information base has grown, and specific data needs have become more defined. The aquatic habitat study program encompassed the three main deposit area drainages (NFK, SFK and UTC) and the Koktuli River, and in and around Iliamna Lake. Completed studies include:
| · | fish population and density estimates using various field methods (dip netting, electrofishing, snorkelling and aerial surveys); |
|
|
|
| · | fish habitat studies (main-channel and off-channel transects and habitat preferences); |
|
|
|
| · | fish habitats/assemblages above Frying Pan Lake; |
|
|
|
| · | salmon escapement estimates; |
|
|
|
| · | spring spawning counts and radio telemetry for rainbow trout; |
|
|
|
| · | radio telemetry of arctic grayling to assess stream fidelity; |
|
|
|
| · | overwintering studies for salmon, trout and grayling; |
|
|
|
| · | Frying Pan Lake northern pike population estimate; |
|
|
|
| · | geo-referenced video aquatic habitat mapping; |
|
|
|
| · | intermittent flow reach, habitat and fish use; and |
|
|
|
| · | fish tissue measurements for trace metals. |
| Pebble Project | Page 265 |
| NI 43-101 Technical Report Update and Preliminary Economic Assessment | August 21, 2023 |
|
|
|
20.2.6.1 Fish and Fish Habitat
20.2.6.1.1 Project Site
The deposit area is characterized by small headwater streams of poor-quality habitat and low fish density. Fish production is naturally limited by physical and chemical factors in these reaches, most notably intermittent flow with extreme low flow hydrology and oligotrophic conditions that constrain aquatic productivity. The lowest reaches of the three study area streams outside the deposit area have more stable hydrologic conditions and support numerous salmon and resident species.
The macro-invertebrate and periphyton studies near the Pebble deposit are part of the overall program of baseline investigations to describe the current aquatic conditions in the study area. Baseline information on macro-invertebrate and periphyton community assemblages is valued because the biota are essential components of the aquatic food web, and their community structure, particularly with respect to the more sensitive taxa, are an indicator of habitat and water quality.
The main objective of the macro-invertebrate and periphyton field and laboratory program was to characterize the diversity, abundance, and density of macro-invertebrates and periphyton within freshwater habitats in the study area. Macro-invertebrates and periphyton were sampled in the study area in 2004, 2005 and 2007 as part of the environmental baseline studies for the Pebble Project. In 2004, 20 sites in the study area were sampled and of these, eight sites (five in the immediate vicinity of the deposit) were selected for continued sampling in 2005, and 10 were sampled in 2007.
20.2.6.1.2 Transportation Corridor
Data from the AWC and field observations by independent experts indicate that many, but not all, waters in the area support anadromous fish populations, including all five Pacific salmon species (Chinook, sockeye, coho, pink, and chum) plus rainbow trout, Dolly Varden, and Arctic char. Population densities vary based on stream size and morphology, which can restrict population sizes or limit access to upstream habitats.
20.2.7 Marine Habitats
20.2.7.1 Marine Nearshore Habitats
The nearshore marine habitat study area focused on areas in the lower Cook Inlet region. The western shorelines from Kameshak Bay north to Knoll Head are composed of a diversity of habitats, including steep rocky cliffs, cobble or pebble beaches and extensive sand/mud flats. Eelgrass is found at a number of locations and habitats; eelgrass, along with macro-algae, is an important substrate for spawning Pacific herring. Overall, the habitats in the study area provide a wide range of habitat types, resulting in a wide range of biological assemblages.
20.2.7.2 Marine Benthos
The littoral and subtidal habitats in lower Cook Inlet support diverse communities of marine and anadromous species of ecological and economic importance. The marine benthos study’s intent was to characterize benthic assemblages in marine habitats in the lower Cook Inlet region.
| Pebble Project | Page 266 |
| NI 43-101 Technical Report Update and Preliminary Economic Assessment | August 21, 2023 |
|
|
|
The marine investigations were undertaken over a five-year period from 2004 to 2008, and included several habitat sampling events, mostly in mid to late summer. Each intertidal habitat type provides feeding areas for different pelagic and demersal fish and invertebrates that forage over the intertidal zone during high tides. The estuarine and nearshore rearing habitats of juvenile salmonids are an important component of the intertidal zone, especially for pink and chum salmon that out-migrate from streams along the shoreline and elsewhere in Cook Inlet. Another important component of the intertidal zone is the substrate used for spawning by Pacific herring.
20.2.7.3 Nearshore Fish and Invertebrates
The study of nearshore fish and macroinvertebrates has been undertaken to collect baseline data on the abundance, distribution, and seasonality of major aquatic species on the western side of Cook Inlet. Principal marine investigations were undertaken between 2004 and 2008. Additional herring spawn surveys were conducted in 2018. The study area is a complex marine ecosystem with numerous fish and macro-invertebrate species that use the area for juvenile rearing, refuge, adult residence, migration, foraging, staging and reproduction.
The study area also functions as a rearing area for juvenile Pacific herring. Herring was the dominant fish species, and young-of-the-year and one-year-olds were the dominant life stages found from March through November in the several sampling years, with peak occurrences noted during the summer.
The nearshore area is also a rearing area for juvenile salmon, which, as a group, were second to herring in abundance. Juvenile pink and chum salmon were the most abundant salmonid species and showed a typical spring and summer outmigration as young-of-the-year fish. Juvenile chum displayed a short outmigration period during May and June, while juvenile pink salmon remained in the area into August. Both species were largely gone by September.
20.3 Marine Mammals
Multiyear baseline surveys were conducted to assess the presence and number of marine mammals in Kamishak Bay in the vicinity of the port lightering area, and shipping lanes. Identified species of significance with habitat in the project area and/or shipping lanes include whales, porpoises, sea lions, seals, and sea otters.
20.4 Economy and Social Conditions
The Alaska economy is dependent on natural resources for both employment and government revenue. Oil and natural gas, mining, transportation, forestry, fishing, and seafood processing, as well as tourism, represent a significant proportion of the overall private sector economy, with oil and gas contributing a significant majority of State government revenues on an annual basis.
Of the 733,000 people living in Alaska on a full-time basis, more than half live in the greater Anchorage area. 15% of Alaska’s population is of Native ancestry.
The Pebble deposit is located in southwest Alaska’s Lake and Peninsula Borough, home to an estimated 1,500 people in 18 local villages. At almost 33,000 mi2, the Lake and Peninsula Borough is among the least densely populated boroughs or counties in the country. There are no roads into the borough, and few roads within it, contributing to an extremely high cost of living and limited job and other economic opportunities for local residents. A subsistence lifestyle is practiced by the vast majority of residents of Bristol Bay communities, including fishing for salmon and other species, hunting of terrestrial mammals and birds, and gathering berries. Salmon, in particular, are considered a critically important resource for the region, from a cultural, economic and environmental perspective.
| Pebble Project | Page 267 |
| NI 43-101 Technical Report Update and Preliminary Economic Assessment | August 21, 2023 |
|
|
|
The communities in closest proximity to Pebble are Nondalton, Iliamna, and Newhalen. Pedro Bay lies on the northern shore of Iliamna Lake, 43 mi east of Iliamna. and Kokhanok, on the south shore of Iliamna Lake, lies adjacent to the southern leg of the proposed transportation corridor. Igiugig is the other village located on Iliamna Lake, at its western outlet to the Kvichak River. Northern Dynasty and the Pebble Partnership have generated employment for residents of villages through the Lake and Peninsula Borough and broader Bristol Bay region since Northern Dynasty acquired the Pebble Project in 2001. Those communities surrounding Iliamna Lake have provided the greatest proportion of the local workforce.
With project infrastructure planned to connect the proposed mine site to the villages of Iliamna, Newhalen and Pedro Bay, these and other communities are expected to continue to be important sources of project labour in future.
The Bristol Bay Borough is the only other organized borough in the Bristol Bay region, with 844 full-time residents in three villages. A significant portion of the Bristol Bay region is not contained within an organized borough; the Dillingham Census Area comprises 11 different communities. 7,000 people call the Bristol Bay region home, with the largest population center in Dillingham.
Most Bristol Bay villages have fewer than 150 - 200 full-time residents. A majority of the population is of Alaska Native descent and Yup’ik or Dena’ina heritage. Virtually all the region’s residents participate to some degree in subsistence fishing, hunting, and gathering activities. Subsistence is considered to be central to Alaska Native culture and provides an important food source for local residents.
There are 13 incorporated first- and second-class cities in the Bristol Bay region and 31 tribal entities as recognized by the US Bureau of Indian Affairs. There are also 24 Alaska Native Village Corporations created under the Alaska Native Claims Settlement Act, two which – Alaska Peninsula Corporation and Iliamna Natives Limited – hold surface rights for significant areas of land near the Pebble Project and along its proposed transportation infrastructure corridor. Separate Native Village Corporations are also centered in Pedro Bay (Pedro Bay Corporation), Igiugig (Igiugig Native Corporation), and Nondalton (Kijik Corporation).
The private sector economy of the Bristol Bay region is dominated by commercial salmon fishing. Although the resource upon which the industry is based remains healthy, the economics of the fishery have declined significantly over the past several decades due to the rise of global salmon aquaculture and various domestic policy and market factors. Ex-vessel prices for sockeye salmon, the dominant species in the Bristol Bay fishery, have fallen from an inflation-adjusted peak of $3.75/lb in 1988 to a 10-year average of just under $1.00/lb in the 1990s and $0.60/lb in the 2000s. During the period 2018 to 2021, prices rebounded somewhat, with ex-vessel prices (before incentives and post-season adjustments) generally in the $1.30/lb range except 2020 when the price was $0.70/lb.
As a result of these declines, the percentage of Bristol Bay fishing licenses and related employment held by residents of the region has decreased, as has the region’s overall economic health. Recently Bristol Bay’s economy has characterized by a high proportion of non-resident labour and business ownership. Private-sector industries are highly seasonal, such that unemployment among year-round residents is particularly high.
Bristol Bay communities also face among the highest costs of living in the US, due to the requirement to fly in many of the goods and commodities required for daily life, including fuel for heating homes and operating vehicles. Energy costs, in particular, are a significant deterrent to economic development.
| Pebble Project | Page 268 |
| NI 43-101 Technical Report Update and Preliminary Economic Assessment | August 21, 2023 |
|
|
|
As a result of a lack of jobs and economic opportunity in the region, Bristol Bay communities are slowly losing population as residents seek opportunities in other parts of the State. For example, between 2000 and 2010 the population of the Lake and Peninsula Borough declined 17%, while the Bristol Bay Borough lost more than 23% of its population. These population outflows have continued through the most recent census period (2010-2020), with population losses of 9.5% in the Lake and Peninsula Borough and 15% in the Bristol Bay Borough. In several communities, schools have closed or are threatened with closure as a result of diminishing enrolment.
20.5 Community Consultation and Stakeholder Relations
Pebble Project technical programs are supported by stakeholder engagement activities in Alaska. The objective of stakeholder outreach programs undertaken by the Pebble Partnership are to:
| · | advise residents of nearby communities and other regional interests Pebble work programs and other activities being undertaken in the field; |
|
|
|
| · | provide information the proposed development plan for the Pebble Project, including potential environmental, social and operational effects, proposed mitigation and environmental safeguards; |
|
|
|
| · | allow the Pebble Partnership to better understand and address stakeholder priorities and concerns with respect to development of the Pebble Project; |
|
|
|
| · | encourage stakeholder and public participation in the EIS permitting process for Pebble; and |
|
|
|
| · | facilitate economic and other opportunities associated with advancement and development of the Pebble Project for local residents, communities and companies. |
|
|
|
| · | In addition to meeting with stakeholder groups and individuals, and providing project briefings in communities throughout Bristol Bay and the State of Alaska, the Pebble Partnership’s outreach and engagement program includes: |
|
|
|
| · | workforce and business development initiatives intended to enhance economic opportunities for regional residents and Alaska Native corporations; |
|
|
|
| · | initiatives to develop partnerships with Alaska Native corporations, commercial fishing interests and other in-region groups and individuals; |
|
|
|
| · | outreach to elected officials and political staff at the national, State and local levels; and |
|
|
|
| · | outreach to third-party organizations and special interest groups with an interest in the Pebble Project, including business organizations, community groups, outdoor recreation interests, Alaska Native entities, commercial and sport fishery interests, conservation organizations, among others. |
Through these various stakeholder initiatives, the Pebble Partnership seeks to advance a science-based project design that is responsive to stakeholder priorities and concerns; provides meaningful benefits and opportunities to local residents, businesses and Alaska Native corporations; and positively impacts the economy of Southwest Alaska.
| Pebble Project | Page 269 |
| NI 43-101 Technical Report Update and Preliminary Economic Assessment | August 21, 2023 |
|
|
|
20.6 Permitting
20.6.1 Clean Water Act Section 404
20.6.1.1 EIS Permitting Process
On December 22, 2017, the Pebble Partnership submitted a Department of the Army permit application to USACE for authorization to discharge fill material and conduct work in navigable waters, which requires approval under Section 404 of the CWA and Section 10 of the RHA. USACE confirmed that the permit application was complete on January 8, 2018, and an EIS was required to comply with its NEPA review of the Pebble Project. As the lead federal agency for the EIS, USACE identified other federal actions that would be required for the project and invited those agencies to participate in the EIS process. Other Federal, State, tribal, and local entities with jurisdiction or special expertise were also invited to participate as cooperating agencies to assist with EIS development. The NEPA EIS process included a comprehensive alternatives assessment that considered a broad range of development alternatives. The scoping phase of the EIS commenced on April 1, 2018, including 90 days for public comment. USACE issued the scoping report on August 31, 2018. The report outlined the numerous environmental, social, and cultural issues that would be carried forward for analysis in the EIS. In addition, the report identified a range of development alternatives that would be considered in addition to the initial proposal by the Pebble Partnership. The Project design and operating parameters for the Pebble Project and associated infrastructure described as follows are derived from the Project Description submitted in June 2020 with the Revised Permit Application. This project description is the basis for USACE’s LEDPA determination and is attached to the FEIS published by USACE in July 2020.
The draft EIS was published on February 20, 2019. USACE initiated a public comment period, which included public hearings in affected communities and in Anchorage and was completed on July 2, 2019. More than 300,000 comments were received by USACE and were considered in the preparation of the FEIS. A preliminary FEIS was provided to cooperating agencies in February 2020.
On March 17, 2020, USACE informed the Pebble Partnership that its draft LEDPA would be the option which used a transportation route north of Iliamna Lake, versus the Pebble Partnership’s proposed project of a ferry crossing of Iliamna Lake to a port southeast of the lake. After consideration, the Pebble Partnership changed its proposed project to the LEDPA. The revised proposal eliminated the ferry crossing of Iliamna Lake and replaced it with an 82-mile road, concentrate pipeline, and water return pipeline paralleling the north shore of Iliamna Lake to a new marine terminal in Iliamna Bay. The alignment of the natural gas pipeline was also revised to come ashore at the proposed marine terminal and to follow the revised road route. These revisions required collection of additional environmental and engineering data. The revised project description was submitted to USACE on June 8, 2020, as part of the Revised Permit Application.
The Pebble Partnership was actively engaged with USACE through the permitting process, including numerous meetings regarding, among other things, compensatory mitigation. The Pebble Partnership submitted several draft compensatory mitigation plans (CMPs) to USACE, each refined to address comments from USACE and that the Pebble Partnership believed were consistent with mitigation proposed and approved for other major development projects in Alaska.
In June 2020, USACE verbally identified a preliminary finding of significant degradation of certain aquatic resources, with the requirement of new compensatory mitigation. The Pebble Partnership understood from these discussions that the new compensatory mitigation plan for the Pebble Project would include in-kind, in-watershed mitigation and continued its work to meet these new USACE requirements.
| Pebble Project | Page 270 |
| NI 43-101 Technical Report Update and Preliminary Economic Assessment | August 21, 2023 |
|
|
|
The FEIS was published on July 24, 2020. The FEIS concluded that impacts to fish and wildlife would not be expected to affect subsistence harvest levels; that there would be no measurable change to the commercial fishing industry including prices; and that there would be a number of positive socioeconomic impacts on local communities.
USACE formally advised the Pebble Partnership by letter dated August 20, 2020, that it had made preliminary factual determinations under Section 404(b)(1) of the CWA that the Pebble Project as proposed would result in significant degradation to aquatic resources. In connection with this preliminary finding of significant degradation, USACE formally informed the Pebble Partnership that in-kind compensatory mitigation within the Koktuli River Watershed would be required to compensate for all direct and indirect impacts caused by discharges into aquatic resources at the mine site. USACE requested the submission of a new CMP to address this finding within 90 days of its letter.
In response, the Pebble Partnership developed a CMP to align with the requirements outlined by USACE. This plan envisioned creation of a 112,445-acre Koktuli Conservation Area on land belonging to the State of Alaska in the Koktuli River Watershed downstream of the Pebble Project. The objective of the preservation of the Koktuli Conservation Area was to allow the long-term protection of a large and contiguous ecosystem that contains valuable aquatic and upland habitats. If adopted, the Koktuli Conservation Area would preserve 31,026 acres of aquatic resources within the Koktuli River Watershed, which has been designated as an aquatic resource of national importance. The proposed conservation area was selected to protect and preserve physical, chemical, and biological functions found to be important during the project review. Preservation of the Koktuli Conservation Area was designed to minimize the threat to, and minimize the potential decline of, aquatic resources in the Koktuli River Watershed potentially resulting from potential future actions, with the objective of ensuring the sustainability of fish and wildlife species that depend on these aquatic resources and ensuring the subsistence lifestyle of the residents of Bristol Bay and commercial and recreational sport fisheries. The revised CMP was submitted to USACE on November 4, 2020.
On November 25, 2020, USACE issued a ROD rejecting Pebble Partnership’s permit application. USACE determined the CMP to be “non-compliant” and the project would cause “Significant Degradation” and be contrary to the public interest.
The Pebble Partnership submitted its request for appeal of the ROD on January 19, 2021. The request for appeal reflects the Pebble Partnership’s position that USACE's ROD and permitting decision, including its significant degradation finding, its public interest review findings, and its rejection of Pebble's CMP, are contrary to law, unprecedented in Alaska, and unsupported by the administrative record, in particular the Pebble Project FEIS. The specific reasons for appeal asserted by the Pebble Partnership include: (i) the finding of “Significant Degradation” by USACE is contrary to law and unsupported by the record; (ii) USACE’s rejection of the CMP is contrary to USACE regulations and guidance, including the failure to provide the Pebble Partnership with an opportunity to correct the alleged deficiencies; and, (iii) the determination by USACE that the Pebble Project is not in the public interest is contrary to law and unsupported by the public record.
In a letter dated February 24, 2021, USACE confirmed the Pebble Partnership’s RFA is "complete and meets the criteria for appeal." USACE appointed a Review Officer to oversee the administrative appeal process.
On April 25, 2023, the USACE Pacific Ocean Division issued its Administrative Appeal Decision and remanded the permit decision back to the USACE – Alaska District to re-evaluate specific issues. Key elements of the decision included the following conclusions:
| · | The Review Officer generally concluded that the Pebble Partnership’s arguments that the finding of "significant degradation" by the Alaska District is contrary to law and unsupported by the record did not have merit, but agreed with the Pebble Partnership that the Alaska District’s use of a certain watershed scale for analysis was not supported by the record and remanded this portion of the decision to the Alaska District Engineer for reconsideration, additional evaluation and documentation sufficient to support the decision. |
| Pebble Project | Page 271 |
| NI 43-101 Technical Report Update and Preliminary Economic Assessment | August 21, 2023 |
|
|
|
| · | The Review Officer concluded that the argument that the CMP was improperly rejected without providing the Pebble Partnership an opportunity to correct the alleged deficiencies did have merit. As a result, the Review Officer remanded the decision to the Alaska District Engineer for reconsideration, additional evaluation, and documentation sufficient to support the decision with the specific directions that: |
|
| o | the Alaska District should provide complete and detailed comments to the Pebble Partnership on the CMP and that the Pebble Partnership is to have sufficient time to address those comments prior to finalizing a revised CMP for review; and |
|
|
|
|
|
| o | if a CMP is determined to be acceptable and adequately offsets direct and indirect impacts, a new public interest review and Section 404(b)(1) analysis may be required. |
| · | The Review Officer concluded that certain elements of the Pebble Partnership’s arguments regarding the public interest review had merit and remanded those portions to the Alaska District Engineer for reconsideration, additional evaluation, and documentation sufficient to support the decision. |
The Review Officer concluded that the Pebble Partnership’s arguments that the Record Decision failed to adequately consider the State of Alaska’s interest as the landownership and its designation of the land for mineral development did not have merit.
As a result of the remand decision, and in light of the EPA’s Final Determination, the Alaska District was instructed to review the appeal decision and to notify the parties of its plans to proceed within 45 days of the date of the Administrative Appeal Decision. The Alaska District has requested four extensions to the original deadline, with the latest extension to September 26, 2023.
On May 25, 2023, the United States Supreme Court issued its ruling on Sackett v. Environmental Protection Agency, in which they identified substantial changes to the interpretation of jurisdictional wetlands as currently defined by USACE and the EPA. The precise implications of the Sackett decision for jurisdictional wetlands delineation in Alaska are difficult to define at this time, with a broad range of opinions as to the effect. If so, this would reduce the requirements and complexity associated with compensatory mitigation.
In addition to USACE permits, the project will require Federal permits from the US Coast Guard and the Bureau of Safety and Environmental Enforcement, as well as authorizations from National Oceanic and Atmospheric Administration (NOAA) Fisheries and the US Fish and Wildlife Service. Several other federal approvals will also be required. There is no certainty that these federal permits and authorizations will be granted There is no certainty that these federal permits and authorizations will be granted.
Numerous environmental permits and plans will also be required by various State and local agencies. The Pebble Partnership will work with applicable permitting agencies and the State of Alaska’s large mine permitting team to provide complete permit applications in an orderly manner. There is no certainty that these Federal and State permits and authorizations will be granted.
20.6.1.1.1 EPA Determination
On September 9, 2021, the EPA announced it planned to reinitiate the process of making a CWA Section 404(c) determination for the waters of Bristol Bay, which would set aside the 2019 withdrawal of that action that was based on a 2017 settlement agreement between the EPA and Pebble Partnership. On May 25, 2022, the EPA issued its Revised Proposed Determination (PD) for public comment. The public comment period on the PD was subsequently extended through September 6, 2022.
| Pebble Project | Page 272 |
| NI 43-101 Technical Report Update and Preliminary Economic Assessment | August 21, 2023 |
|
|
|
On January 30, 2023, the (EPA issued a Final Determination under Section 404(c) of the Clean Water Act to limit the use of certain waters in the Bristol Bay watershed as disposal sites for discharges of dredged or fill material associated with development of the proposed project. The EPA determined that certain discharges associated with developing the project would have “unacceptable adverse effects” on the salmon fishery in the Bristol Bay watershed. This Final Determination, unless overturned on judicial review, precludes development of the project as designed and presented during the EIS and permitting process.
On July 26, 2023, the State of Alaska filed a Motion for Leave to File a Bill of Complaint against the United States and Michael S. Regan, Administrator of the EPA, in the U.S. Supreme Court. The State’s Motion requests that the Supreme Court exercise its original jurisdiction to hear its dispute. The Complaint asserts three causes of action, seeking an order that the Final Determination be vacated or declared unenforceable, or in the alternative, seeking damages for breach of contract and just compensation for the taking of the State’s property.
The Company and the Pebble Partnership plan to seek judicial review of the Final Determination in an appropriate United States federal district court. While the Final Determination concludes EPA’s administrative process, it is only the initial trigger in the judicial review process. If successful in overturning the agency action, Pebble Partnership could continue to pursue any state or federal permits necessary to develop the resource. The Pebble Partnership will continue to assert the following arguments, among others, in any judicial proceedings:
| · | the EPA’s Final Determination is premature and not authorized by the CWA and, accordingly, is contrary to law and precedent; |
|
|
|
| · | the EPA erred when it did not exhaust the Section 404(q) elevation procedures prior to initiating its Section 404(c) procedures as the EPA’s authority under Section 404(c) is narrowly prescribed by the CWA and is only to be used as a last resort; |
|
|
|
| · | the EPA’s decision to restrict development of 309-square-miles of land is legally and technically unsupportable; |
|
|
|
| · | the EPA has not demonstrated that the development of the Pebble deposit will have unacceptable adverse effects under Section 404(c); |
|
|
|
| · | the EPA has not demonstrated any impacts to Bristol Bay fisheries that would justify the extreme measures in the Final Determination and, further, the Final Determination contradicts the conclusion in the FEIS that the Pebble Project was “not expected to have a measurable impact on fish populations; |
|
|
|
| · | the EPA’s Final Determination violates the rights of the State of Alaska established under the Alaska Statehood Act, and related laws, and would undermine the State’s legally protected interests in the development of lands it acquired and intended for mineral development; and |
|
|
|
| · | the EPA must consider the benefits of the Pebble Project in light of the critical need for minerals essential to the renewable energy transition, as well as the environmental and social costs that would result from not developing the project. |
20.6.2 Other Federal and State Permits and Approvals
In addition to the permits issued by USACE, the Pebble Project must receive an array of additional Federal permits from the US Coast Guard, the Bureau of Safety and Environmental Enforcement, as well as authorizations from NOAA Fisheries, the US Fish and Wildlife Service, and several other federal agencies.
| Pebble Project | Page 273 |
| NI 43-101 Technical Report Update and Preliminary Economic Assessment | August 21, 2023 |
|
|
|
Numerous environmental permits and plans will also be required by various State and local agencies. The State of Alaska utilizes a process for permitting mines through its large mine permitting team, with involvement from all State agencies required to issue permits for mine construction and operation. The Pebble Partnership will work with applicable permitting agencies and the large mine permitting team to provide complete permit applications in an orderly manner. Table 20-1 lists the types of permits that are expected to be required for the Pebble Project. Multiple permits of certain types may have to be applied for to accommodate the full scope of facilities.
In November 2014, Alaskan voters approved the Bristol Bay Forever public initiative. Based on that initiative, development of the Pebble Project requires legislative approval upon securing all other permits and authorizations.
Table 20‑1: Permits Required for the Pebble Project
| Agency | Approval Type | Project-related Examples |
| Federal |
||
| BATF | License to Transport Explosives | Construction explosives acquisition and use |
| Permit and License for Use of Explosives | Construction explosives acquisition and use |
|
| BSEE | Right-of-Way Authorization for Natural Gas Pipeline | Subsea natural gas pipeline in OCS waters |
| DHS | Airport Security Operations Plan | Iliamna Airport |
| Port Facility Security Coordinator Certification | Marine terminal |
|
| Port Security Operations Plan | Marine terminal |
|
| EPA | Facility Response Plan (required to be submitted to EPA, however EPA does not provide plan approvals) | Fuel storage facilities, fuel transport on the mine roadway |
| RCRA Registration for Identification Number | Storage and disposal of hazardous wastes |
|
| Spill Prevention, Control, and Countermeasure (SPCC) Plan (SPCC plans are not required to be submitted or approved by EPA. The plan will be reviewed and certified by a Professional Engineer licensed in Alaska) | Fuel storage facilities |
|
| FAA | Notice of Controlled Firing Area for Blasting | Construction and mining blasting activity |
| FCC | Radio License | Radios |
| MSHA | Mine Identification Number | Mine site |
| Notification of Legal Identity | Mine site |
|
| NMFS | Magnuson-Stevens Fishery Conservation and Management Act Consultation documentation | Necessary in areas where mine, road, or marine terminal activity affect essential fish habitat |
| USACE | Clean Water Act Section 404 permit for Discharge of Dredge or Fill Material into Waters of the U.S. | Fill into wetlands for a variety of facilities at the mine, road, pipelines, marine terminal |
| Rivers and Harbors Act Section 10 Construction of any structure in or over any Navigable Waters of the U.S. | Road bridges and causeway; marine terminal docking and ship-loading facilities and maintenance dredging. |
|
| USCG | Facility Response Plan | Fuel storage facilities |
| Fuel Offloading Plan; Person in Charge Certification | Offloading fuel from barges at the port |
|
| Hazardous Cargo Offloading Plan; Port Operations Manual Approval | Offloading hazardous cargo from ships |
|
| Navigation Lighting and Marking Aids Permit | Port facilities |
|
| Rivers and Harbors Act Section 9 Construction Permit for a Bridge or Causeway across Navigable Waters | Bridge along road |
|
| Pebble Project | Page 274 |
| NI 43-101 Technical Report Update and Preliminary Economic Assessment | August 21, 2023 |
|
|
|
| Agency | Approval Type | Project-related Examples |
| USDOT | Registration for Identification Number to Transport Hazardous Wastes | Transport of hazardous wastes to approved disposal site |
| USFWS | Bald and Golden Eagle Protection Act Programmatic Take Permit | May be necessary in areas where mine, road, or marine terminal activity may disturb eagles |
| Migratory Bird Treaty Act Consultation documentation | May be necessary in areas where mine, road, or marine terminal activity may disturb migratory birds |
|
| USFWS/NMFS | Endangered Species Act Incidental Take Authorization | May be necessary at the marine terminal and for sub-sea pipeline construction where activities could disturb northern sea otter, Beluga whale, Steller sea lion, Steller’s eider |
| Marine Mammal Protection Act Incidental Take Authorization; Letter of Authorization | May be necessary at marine terminal where activities could disturb northern sea otter, Beluga whale, Steller sea lion, harbor seal, Dall’s porpoise |
|
| State |
||
| ADEC | Alaska Solid Waste Program Integrated Waste Management Permit/Plan Approval | Tailings disposal, waste rock disposal, landfills |
| Reclamation Plan Approval and Bonding | Required prior to construction. |
|
| Alaska Solid Waste Program Solid Waste Disposal Permit; Open Burn Permit | Construction waste material disposal |
|
| Clean Water Act Section 402 Alaska Pollutant Discharge Elimination System Water Discharge Permit | Water discharges from water treatment plans at the mine site. |
|
| Approval to Construct and Operate a Public Water Supply System | Mine and port, and construction camps |
|
| Clean Air Act Air Quality Control Permit to Construct and Operate – Prevention of Significant Deterioration | Power plant and other non-mobile air emissions; fugitive dust; applicable to mine, road, and port |
|
| Clean Air Act Title V Operating Permit | Power plant and other non-mobile air emissions; fugitive dust; applicable to mine and road |
|
| Clean Air Act Title I Operating Permit | Non-mobile air emissions; stationary sources, fugitive dust; applicable to port and Kenai compressor station |
|
| Clean Water Act Section 401 Certification | Certification of the Section 404 Permit. |
|
| Clean Water Act Section 402 Stormwater Construction and Multi-Sector General Permit; |
|
|
| Surface water runoff discharges at mine, road, and marine terminal Stormwater Discharge Pollution Prevention Plan |
|
|
| Food Sanitation Permit | Mine and port, and construction camps |
|
| Oil Discharge Prevention and Contingency Plan (ODPCP or “C” Plan) | Fuel storage and transfer facilities, port and mine |
|
| ADF&G | Fish collection permits for monitoring | Required for construction and monitoring |
| Fish Habitat Permit | Required for most work in anadromous streams and for most work in resident fish streams that might affect fish passage. |
|
| Pebble Project | Page 275 |
| NI 43-101 Technical Report Update and Preliminary Economic Assessment | August 21, 2023 |
|
|
|
| Agency | Approval Type | Project-related Examples |
| ADNR | Alaska Dam Safety Program Certificate of Approval to Construct a Dam | Tailings dam, seepage control dams |
| Alaska Dam Safety Program Certificate of Approval to Operate a Dam | Tailings dam, seepage control dams |
|
| Reclamation Plan Approval and Bonding | Required prior to construction. |
|
| Lease of other State Lands | Any miscellaneous other state lands to be used by the Pebble Project – none identified at this time |
|
| Material Sale on State Land | Materials removed from quarry sites for construction |
|
| Mill Site Permit | All facilities on State lands |
|
| Mining license | All facilities on State lands |
|
| Miscellaneous Land Use Permit | All facilities on State lands |
|
| National Historic Preservation Act Section 106 Review | Area of Potential Effect |
|
| Pipeline Rights-of-Way Lease | Natural gas pipeline on State lands and natural gas pipeline in State waters |
|
| Fiber Optic Cable Right-of-Way Lease | Fiber Optic Cable on State lands and in State waters |
|
| Powerline Right-of-Way Lease | Power lines to support electric power distribution |
|
| Road Right-of-Way Lease | Road between mine and marine terminal |
|
| Temporary Water Use Permit; Permit to Appropriate Water | Surface and groundwater flow reductions |
|
| Tidelands Lease | Port structures below high tide line |
|
| Upland Mining Lease | All facilities on State lands |
|
| ADOL | Certificate of Inspection for Fired and Unfired Pressure Vessels |
|
| ADOT&PF | Driveway Permit | Road |
| Utility Permit on Right-of-Way | Natural gas pipeline on the Kenai Peninsula |
|
| ADPS | Approval to Transport Hazardous Materials | Transport of hazardous materials along the road |
| Life and Fire Safety Plan Check | Mine and port |
|
| State Fire Marshall Plan Review Certificate of Approval | For each individual building |
|
| Local |
||
| KPB | Conditional Use Permit |
|
| Floodplain Development Permit |
|
|
| Multi-Agency Permit Application |
|
|
| L&PB | Lake and Peninsula Borough Development Permit | Mine and road area within the Lake and Peninsula Borough |
20.7 Closure
The Pebble Partnership is committed to conducting all mining operations, including reclamation and closure, in a manner that adheres to socially and environmentally responsible stewardship while maximizing benefits to State and local stakeholders. The Pebble Partnership has adopted a philosophy of “design for closure” in the development of the project that incorporates closure and long-term post-closure water management considerations into all aspects of the project design to ensure that all regulatory requirements, as well as landowner obligations, are met at closure.
| Pebble Project | Page 276 |
| NI 43-101 Technical Report Update and Preliminary Economic Assessment | August 21, 2023 |
|
|
|
Reclamation and closure of the project falls under the jurisdiction of the ADNR Division of Mining, Land, and Water, and the ADEC. A miner may not engage in a mining operation until the ADNR has approved a reclamation plan for the operation. The Pebble Partnership submitted a preliminary closure plan to USACE in support of the EIS analysis. Four phases of closure are envisioned for the project. This plan would be subject to analysis and review during the State’s permitting processes.
| · | Phase 1 – Most of the structures required to support the mine operation would be removed during this phase. The key closure component of this phase is the decommissioning of the pyritic TSF. The co-disposed PAG waste rock and pyritic tailings would be relocated to the bottom of the open pit, thus preventing acid generation and providing safe long-term storage. Reclamation of the bulk TSF would also commence during this phase. After allowing for consolidation of the bulk tailings, reclamation of that facility would commence with covering the tailings with a capillary break and growth medium. WTP #1 would be reconfigured for long term closure requirements. Water collection, treatment and discharge would continue per the operations phase. |
|
|
|
| · | Phase 2 – Phase 2 would commence with completion of the relocation of the pyritic tailings and PAG waste rock at which point the site of the pyritic tailings storage facility would be reclaimed. The main Water Management Pond would be decommissioned at this point and the site reclaimed. At this point, all water from the bulk TSF would be diverted to the open pit, which would be allowed to fill to a defined control level, at which point Phase 3 would commence. |
|
|
|
| · | Phase 3 – The primary activity during Phase 3 would be to collect contact water, divert it to the open pit, and treat the surplus for discharge. The quality of the surface runoff water from the bulk TSF would be monitored during this phase and once it reaches discharge water quality, the next phase would commence. |
|
|
|
| · | Phase 4 – Phase 4 would consist of long-term water treatment and monitoring. The surface runoff from the bulk TSF would be allowed to discharge directly, while seepage from the facility and open pit runoff would be collected in the open pit, treated and discharged. |
Additional information regarding reclamation, closure, and bonding costs is presented in Sections 1, 22 and 24.
| Pebble Project | Page 277 |
| NI 43-101 Technical Report Update and Preliminary Economic Assessment | August 21, 2023 |
|
|
|
21 CAPITAL AND OPERATING COSTS
21.1 Introduction
The following basic information pertains to the estimate of both capital and operating costs:
| · | Base date for these estimates is Q2 – 2023. |
|
|
|
| · | All costs are expressed in United States dollars ($ or US$). |
|
|
|
| · | United States to Canadian (C$) currency exchange rate used is US$0.75 = C$1.00. |
|
|
|
| · | Cost escalation to 2023 when historical pricing is considered. |
|
|
|
| · | Estimate accuracy is reflective of the stage of project development at ±50%. |
|
|
|
| · | All estimates are based on design production rate of 180,000 tons/d milled. |
|
|
|
| · | Operating and sustaining capital costs are based on 20 years of production. |
|
|
|
| · | Capital cost estimate is based on an engineering, procurement, and construction management (EPCM) implementation approach, with selected scope areas being developed under discrete engineer, procure and construct (EPC) packages. |
21.2 Capital Cost Estimate
21.2.1 Estimate Responsibility
The overall capital cost estimate was assembled by Ausenco with contributions from the following companies:
| · | Ausenco: process plant, site infrastructure, marine facilities |
|
|
|
| · | NANA Worley (via subcontract to Worley): mining |
|
|
|
| · | Knight Piésold: site earthworks, site roads, TSF and water management facilities |
|
|
|
| · | HDR: water treatment plant facilities |
|
|
|
| · | NANA Worley: natural gas pipeline and power generation |
|
|
|
| · | RECON: access road. |
21.2.2 Capital Cost Summary
The total estimated initial capital cost for the design, construction, installation, and commissioning of the Pebble Project is $6.77 B, which includes all direct, indirect, Owner’s, growth, and contingency costs.
Sustaining capital investment in the proposed project is limited to incremental TSF expansions and replacement of mobile equipment for mining and road maintenance, over the life of mine. These life cycle costs are applied in the financial model on a year-by-year basis, with a cumulative total of $1.29 B including indirect, Owner’s and contingency costs. Sustaining capital investments in primary infrastructure expected to be developed with partners are factored into infrastructure lease payments.
| Pebble Project | Page 278 |
| NI 43-101 Technical Report Update and Preliminary Economic Assessment | August 21, 2023 |
|
|
|
Mine closure costs are not included in the capital or operating costs but are factored into the financial model to account for reclamation and long-term water treatment plant requirements.
A breakdown of capital cost figures by major work area is presented in Table 21-1.
Table 21‑1: Summary of Capital Cost Estimate
| WBS | WBS Description | Initial Capital (US$ M) | Sustaining Capital (US$ M) | Total (US$ M) |
| 1000 | Open Pit Mining | 415.2 | 192.7 | 607.9 |
| 2000 | Process Plant | 910.6 | n/a | 910.6 |
| 3000 | Earthworks, Tailings and Water Mgmt. | 651.3 | 842.9 | 1,494.2 |
| 4000 | On Site Infrastructure |
|||
| Site General | 127.6 | n/a | 127.6 |
|
| Water Treatment Plants | 315.5 | n/a | 315.5 |
|
| On-site Infrastructure | 251.7 | n/a | 251.7 |
|
| 5000 | Off-Site Infrastructure |
|||
| Power Supply | 702.6 | n/a | 702.6 |
|
| Natural Gas Line | 505.3 | n/a | 505.3 |
|
| Marine Terminal Site | 253.5 | n/a | 253.5 |
|
| Ferry | 54.3 | n/a | 54.3 |
|
| Access Road | 507.4 | 18.4 | 525.8 |
|
| Subtotal |
| 4,694.9 | 1,054.1 | 5,749.0 |
| 6000 | Indirect Costs | 917.9 | 99.9 | 1,017.8 |
| 7000 | Owner's Costs | 353.0 | 10.0 | 363.0 |
| 8000 | Contingency & Growth | 806.8 | 129.1 | 936.0 |
| Total |
| 6,772.6 | 1,293.1 | 8,065.6 |
| Closure Costs * |
| N/A | 2,755.7 | 2,755.7 |
Note: Values may not add up due to rounding
* Closure costs does not include the $18.1 M WTP perpetuity costs
21.2.3 Direct Costs
Direct capital costs are those directly attributed to a specific scope of work for the project, and would typically be inclusive of installed equipment, material, labour, and supervision directly or immediately involved in the physical construction of the permanent facility.
Each of the contributing parties noted in Section 21.2 have provided the direct costs associated with the works in their respective areas following a traditional engineering, procurement and construction management (EPCM) execution strategy, with indirect costs, Owner’s costs and contingency to be applied separately. The exceptions to this are the scopes for power generation and the natural gas pipelines across Cook Inlet and Iliamna Lake which have been priced to reflect the intent to construct these as separate EPC packages that do not have indirect costs applied. Supplemental information and breakdown of costs for specific work areas are provided in the following sub-sections to provide clarity where certain costs have been allocated.
| Pebble Project | Page 279 |
| NI 43-101 Technical Report Update and Preliminary Economic Assessment | August 21, 2023 |
|
|
|
21.2.4 Area 1000 – Mine Capital Cost
The estimate of initial capital cost for the development of the open pit mine area includes all mobile equipment purchase, and miscellaneous mining infrastructure, as well as pre-production stripping costs expected prior to the process plant going into production.
The sustaining capital costs include all equipment purchases necessary to manage the growth in the pit from the first year of production onward as well as fleet replacements. The cost breakdown has been shown in Table 21-2.
Table 21‑2: Mining Direct Capital Cost Estimate
| Capital Category | Initial Cost (US$M) | Sustaining Cost (US$M) | Total Capital Cost (US$M) |
| Pre-production stripping | 74.7 | n/a | 74.7 |
| Mine equipment capital | 340.5 | 192.7 | 533.3 |
| Total Mining Direct Cost | 415.2 | 192.7 | 607.9 |
21.2.5 Area 2000 – Process Capital Costs
The capital cost estimates for these areas were developed by Ausenco using the conceptual design layout, design criteria, and flow sheet developed for this project. Process and major mechanical equipment costs were derived using recent similar copper projects, and historical budget quotes on file from vendors. Delivery and installation of process equipment was a factored cost relative to the total purchase price of equipment.
Earthworks and excavation costs for site preparation were included in the site general costs; there are no sustaining capital items associated with this area, as mill liner replacements are part of regular maintenance and included in the operating cost estimate. A summary of the direct capital costs is shown in Table 21-3.
| Pebble Project | Page 280 |
| NI 43-101 Technical Report Update and Preliminary Economic Assessment | August 21, 2023 |
|
|
|
Table 21‑3: Feed Material Handling and Process Plant Capital Cost Summary
| Capital Category | Initial Cost (US$M) |
| Primary Crushing to Stockpile Feed | 100.7 |
| Stockpile, Grinding, Pebble-Crushing | 476.3 |
| Cu-Mo Flotation, Regrind, Bulk & Pyritic Tailings Thickeners | 209.8 |
| Molybdenum Flotation | 38.0 |
| Thickening & Mo Concentrate Filtration | 42.9 |
| Process Plant Services | 19.3 |
| Reagents storage and preparation | 23.8 |
| Total Feed Material Handling and Process Direct Cost | 910.6 |
21.2.6Area 3000 – Tailings and Water Management
The estimate of capital costs for the TSF and general water management on the site was prepared by Knight Piésold using nominal unit rates for construction of work areas and quantities developed from their preliminary design of the facilities. The initial capital was broken out into earthworks and mechanical systems for the tailings and water management categories. Initial construction and subsequent embankment lifts would be completed by the mine operating crew and procurement of the required mobile equipment is included in the mine initial and sustaining capital costs. The tailings and water management capital cost breakdown are shown in Table 21-4.
Table 21‑4: Tailings and Water Management Direct Capital Cost Estimate
| Capital Category | Initial Cost (US$M) | Sustaining Cost (US$M) | Total Capital Cost (US$M) |
| Earthworks | 521.8 | 713.2 | 1,235.0 |
| Mechanical equipment | 129.5 | 129.7 | 259.2 |
| Total Tailings and Water Management Direct Cost | 651.3 | 842.9 | 1,494.2 |
21.2.7 Area 4000 – On-Site Infrastructure
21.2.7.1 Site General Capital
The estimate of capital costs for the site general development is predominantly driven by the costs of site preparation, earthworks, and on-site access roads. These were estimated by Knight Piésold as part of their effort on tailings and water management, making use of the same equipment, and includes sustaining costs for the roads as the mine site grows over time. The balance of site general capital is for the establishment of power distribution, site-wide controls and communications systems, the cost of which was factored by Ausenco from a previous estimate provided by Northern Dynasty. The cost breakdown has been shown in Table 21-5.
| Pebble Project | Page 281 |
| NI 43-101 Technical Report Update and Preliminary Economic Assessment | August 21, 2023 |
|
|
|
Table 21‑5: Site General Capital
| Capital Category | Initial Cost (US$M) |
| Site earthworks general construction | 71.4 |
| Access and haul roads | 42.2 |
| Electrical power distribution, site-wide controls and communications | 14.0 |
| Total Site General Cost | 127.6 |
21.2.7.2 Water Treatment Plants
HDR developed the capital cost estimate for the WTPs through the entire mine life based on the assumptions shown in Table 21-6 using reference data developed for a mine WTP designed by HDR that used many of the same water treatment processes and a similar parallel treatment train approach. The costs for the benchmark WTP were developed using manufacturer quotes for major equipment and detailed material take-off and unit prices for the divisions of construction.
Capital costs for each WTP were developed by factoring the differences in flow and water quality from the benchmark WTP, escalating costs to Q2 2023, and adding costs for the additional processes for the project. Factoring was based on installed capacity and maximum flows.
Table 21‑6: Water Treatment Plants Direct Capital Cost Estimate
| WTP # | Phase of Mine Life | Influent Stream Treated | Direct Costs (US$M) |
| WTP #1 | Operations | Open Pit WMP | 75.6 |
| WTP #2 | Operations | Main WMP | 239.9 |
| Total Water Treatment Plants Direct Cost | 315.5 |
||
21.2.7.3 On-site Infrastructure
The cost of on-site general infrastructure and temporary facilities required during construction was factored by Ausenco from a previous estimate for site development provided by Northern Dynasty.
The provision of a 2,300-person construction camp is based on 50/50 permanent and temporary facilities with the full cost of $126.5 M being carried in the temporary construction area.
The cost breakdown is shown in Table 21-7.
| Pebble Project | Page 282 |
| NI 43-101 Technical Report Update and Preliminary Economic Assessment | August 21, 2023 |
|
|
|
Table 21‑7: On-Site Infrastructure Direct Capital Cost Estimate
| Capital Category | Initial Cost (US$M) |
| Site buildings | 80.9 |
| Site services and utilities | 16.5 |
| Plant mobile fleet (not including mining equipment) | 9.9 |
| Temporary facilities for construction | 144.4 |
| Total On-Site Infrastructure Direct Cost | 251.7 |
21.2.8 Area 5000 – Off-Site Infrastructure
21.2.8.1 Power Generation and Natural Gas Pipeline
The capital cost estimates for the supply and installation of the power generation equipment at both the mine site and marine terminal site, along with the installation of a compressed natural gas pipeline across Cook Inlet to the mine site have been provided by NANA Worley with support from their parent company Worley’s affiliated staff. These estimates are based on scoping level designs and historical information for both combined cycle gas power plants and natural gas pipelines.
The onshore portion of the natural gas pipeline from Amakdedori to Iliamna Lake South Ferry Terminal is assumed to be buried in the proposed roadway corridor and this cost is included in the off-site access road estimate. From Newhalen to the mine site, the pipeline would be buried in a trench following the road alignment and this cost is included in the natural gas pipeline estimate. All sections of the pipeline would be installed with a fiber optic cable running from East Cook Inlet to the mine site.
The mine site power plant estimate was generated using Peace Model software and is assumed it will be stick-built due to shipping constraints to the mine site. The overall design basis has not changed since 2020. This 2023 cost estimate has been extrapolated from the previous 2020 estimate by using market analysis indices for various commodities and labour.
The port site power plant estimate was generated utilizing vendor quotes that specialize in turnkey small natural gas driven generation plants. The overall design basis has not changed since 2020. This 2023 cost estimate has been extrapolated from the previous 2020 estimate by using market analysis indices for various commodities and labour.
A breakdown of the costs by work area is provided in Table 21-8.
| Pebble Project | Page 283 |
| NI 43-101 Technical Report Update and Preliminary Economic Assessment | August 21, 2023 |
|
|
|
Table 21‑8: Power Generation and Natural Gas Pipeline Capital Cost Summary
| Capital Category | Initial Cost ($M) |
| Mine Site Power Generation Plant | 688.2 |
| Marine Terminal Site Power Generation Plant | 14.3 |
| Cook Inlet East Side Compression Plant, East Side Onshore Natural Gas Pipeline | 25.9 |
| Cook Inlet Crossing Natural Gas Pipeline | 281.7 |
| Iliamna Lake Crossing Natural Gas Pipeline | 120.8 |
| Onshore Natural Gas Pipelines from Amakdedori to Iliamna Lake South Ferry Terminal and from Newhalen River Bridge to Mine Site (along Roadway Corridors), from Newhalen to Newhalen River Bridge (Cross-Country Routing) and Related Metering/Pigging | 76.8 |
| Total Power Generation and Natural Gas Pipeline Direct Cost | 1,207.8 |
21.2.8.2 Marine Terminal Site
The capital cost estimate for the marine terminal site was developed by Ausenco using the conceptual design developed for this project, along with unit rates for construction established from similar projects and historical budget quotes on file from vendors.
A summary of the direct costs for this area is presented in Table 21-9.
Table 21‑9: Marine Terminal Facilities Direct Capital Costs
| Capital Category | Initial Cost (US$M) |
| Site civil works and utilities | 22.1 |
| Auxiliary buildings | 12.2 |
| Fuel receiving and storage system | 12.7 |
| Mobile equipment | 49.3 |
| Concentrate handling | 0.3 |
| Power distribution, lighting, and controls system | 5.7 |
| Marine infrastructure (incl. dredging and tug purchase) | 151.1 |
| Total Marine Terminal Facilities Direct Cost | 253.5 |
21.2.8.3 Ferry
The capital cost of the ferry includes pre-construction of components of the vessel at a Gulf Coast shipyard, transport to Alaska via heavy lift ship, transport to the assembly site on Iliamna Lake by road, and final assembly at the south ferry terminal. A summary of the direct costs for this area is presented in Table 21-10.
| Pebble Project | Page 284 |
| NI 43-101 Technical Report Update and Preliminary Economic Assessment | August 21, 2023 |
|
|
|
Table 21‑10: Iliamna Lake Ferry Capital Cost
| Capital Category | Initial Cost (US$M) |
| Pre-construction | 42.5 |
| Transport to Alaska | 6.5 |
| Transport to Iliamna Lake | 0.8 |
| Assembly and launch | 4.5 |
| Total Iliamna Lake Ferry Direct Cost | 54.3 |
21.2.8.4 Access Road
The capital cost estimate for the access road was developed by Alaska-based road consultant, RECON, which has been involved with the project for years and had previously prepared a design for this route. Costs were based on typical unit rates of construction for the region with locally sourced materials from borrow pits along the route. Mobile equipment acquired for the construction of the roadway would be retained for maintenance, with the replacement of this equipment included in sustaining capital. For the base case, sustaining capital costs for external access roads were assumed to be provided by third party infrastructure partners and were reflected in annual lease payments.
A summary of the initial and sustaining capital costs for this area are presented in Table 21-11.
Table 21‑11: External Access Roads Direct Capital Cost Estimate
| Capital Category | Initial Cost (US$M) | Sustaining Cost (US$M) | Total Capital Cost (US$M) |
| Access road construction | 500.3 | n/a | 500.3 |
| Mobile equipment purchase | 7.1 | 18.4 | 25.5 |
| Total External Access Roads Direct Cost | 507.4 | 18.4 | 525.8 |
21.2.9 Area 6000 – Indirect Costs
Indirect costs are those that are required during the project delivery period to enable and support the construction activities. A total of $917.9 M has been estimated for indirect costs, representing an average of 19.6% of the total direct costs, which was built up from a distribution of the following elements and rates against the applicable construction activities as shown in Table 21-12.
| Pebble Project | Page 285 |
| NI 43-101 Technical Report Update and Preliminary Economic Assessment | August 21, 2023 |
|
|
|
Table 21‑12: Distribution of Indirect Costs
| Indirect Cost Category | Initial Cost ($M) | % of Direct Costs | Applied to Direct Costs |
| Natural Gas pipelines | 62.5 | - | Engineering and Project support cost supplied by NANA Worley |
| Engineering and Procurement (EP) | 166.1 | 8.0 | All - excluding EPC, mining equipment & 75% of TSF |
| Construction Management (CM) | 119.7 | 4.0 | All - excluding EPC packages and mining |
| Construction Indirect costs | 311.9 | 10.0 | All - excluding EPC, mining, marine infrastructure |
| Freight and Logistics | 150.9 | 7.7 | All – excluding EPC, mining, TSF, marine & roads |
| First fills | 15.8 | 1.0 | Mill feed material handling + process + p/l stations + con handling |
| Spares | 15.8 | 1.0 | Mill feed material handling + process + p/l stations + con handling |
| Start up and commissioning | 11.9 | 0.75 | Mill feed material handling + process + p/l stations + con handling |
| Vendor representation at site | 6.3 | 0.40 | Mill feed material handling + process + p/l stations + con handling |
| External Access Roads | 57.0 | - | Design Phase + Project Management and Owner’s engineering oversight cost supplied by RECON |
| Total Indirect Cost | 917.9 |
|
|
21.2.10 Area 7000 – Owners Costs
Owner’s costs are costs borne by the Owner in support and execution of the project.
The project general execution strategy involves an EPCM organization supervising one or more general contractors. Some components, such as the marine portions of the natural gas pipelines, are assumed to be constructed under EPC arrangements. The estimate includes $353 M for Owner’s costs, which equates to 8% of direct costs. Some of the items included are home office staffing, home office travel, home office general expenses, field staffing, field travel, general field expenses, environmental baseline monitoring and Owner’s contingency.
21.2.11 Area 8000 – Contingency
The total contingency amount of $806.8 M is equal to an average of 17.2% of total direct costs and is reflective of a range between 15% and 20% being applied to the individual work areas based on the level of detail and construction cost risk associate with each area.
21.2.12 Sustaining Costs
21.2.12.1 Overview
The life-of-mine sustaining cost for the project is estimated at $1,293 M, which includes direct and indirect costs for mining, tailings management and access roads.
21.2.12.2 Mining
Purchases for the mine equipment fleet scheduled throughout the life of mine are capitalized through the sustaining periods of the project.
| Pebble Project | Page 286 |
| NI 43-101 Technical Report Update and Preliminary Economic Assessment | August 21, 2023 |
|
|
|
The sustaining costs for mining also include the cost for expanding the open pit mining operation infrastructure, such as explosive storage, pit electrification and distribution, maintenance tooling, radio communications, geotechnical instrumentation, and the mobile fleet spare parts inventory. A fleet management and dispatch system is also added in the sustaining capital period of the project. The mining sustaining capital cost for the Pebble PEA project is $192.7 M.
21.2.12.3 Tailings and Water Management
Sustaining costs for the tailings and water management infrastructure consider the ongoing construction of the associated management facilities. This includes TSF embankment expansion earthworks, pyritic TSF liner installation and continued development and management of seepage collection systems. Progressive construction of the embankments includes foundation preparation activities, fill placement and compaction, and development of quarries. Replacement, maintenance, and expansion of the tailings and reclaim mechanical systems is also completed during the sustaining period, as required. The sustaining costs for the tailings and water management are $842.9 M.
21.2.12.4 External Access Roads
The sustaining costs for the external access roads are $18.4 M.
21.2.13 Closure Costs
21.2.13.1 Overview
Closure of the site will commence after mining and processing operations ceases in Year 20. This will be accomplished over four phases with two primary categories of work – earthworks and water management:
| · | Structure removal, earthworks and reclamation; |
|
|
|
| · | Water management operations; |
|
|
|
| · | Water handling systems; and |
|
|
|
| · | Water treatment plants. |
This section describes the costs for these activities over the four closure phases.
21.2.13.2 Earthworks and Reclamation
As described in Section 20.7, the closure earthworks and reclamation include:
| · | Removal of redundant structures at the mine site and reclamation of these sites; |
|
|
|
| · | Closure of the bulk TSF: |
|
|
|
| · | Construction of a closure spillway for the TSF; and |
|
|
|
| · | Regrading and covering the facility with growth medium; |
|
|
|
| · | Removal of the pyritic TSF: |
|
|
|
| · | Relocating the impounded pyritic tailings and PAG waste rock to the open pit; |
| Pebble Project | Page 287 |
| NI 43-101 Technical Report Update and Preliminary Economic Assessment | August 21, 2023 |
|
|
|
| · | Removal of the TSF and seepage collection structures; and |
|
|
|
| · | Reclamation of the site; |
|
|
|
| · | Removal of the Main Water Management Pond: |
|
|
|
| · | Removal of the pond structures; and |
|
|
|
| · | Reclamation of the site; |
|
|
|
| · | Removal of the Open Pit Water Management Pond: |
|
|
|
| · | Removal of the pond structures; and |
|
|
|
| · | Reclamation of the site; and |
|
|
|
| · | Reclamation of the quarry and stockpile sites. |
Table 21-13 summarizes these costs over the four phases of the closure period.
Table 21‑13: Earthworks and Reclamation Closure Costs
| Earthworks Closure Summary | Phase 1 | Phase 2 | Phase 3 | Phase 4 | Total |
| US$ M | US$ M | US$ M | US$ M | US$ M |
|
| Structure removal (WTP #2) | - | 12.3 | - | - | 12.3 |
| Bulk TSF | 154.2 | - | - | - | 154.2 |
| Pyritic TSF | 163.0 | 40.7 | - | - | 203.8 |
| Main WMP | - | 37.1 | - | - | 37.1 |
| Open Pit WMP | 1.9 | - | - | - | 1.9 |
| Quarry & S/P | 13.4 | 2.2 | - | - | 15.6 |
| General Site Reclamation | 112.8 | 6.9 | 1.2 | - | 120.9 |
| Other Closure Costs | 41.3 | 9.6 | 19.3 | 0.5 | 70.7 |
| Total | 486.6 | 109.0 | 20.5 | 0.5 | 616.6 |
21.2.13.3 Water Handling Systems
The water handling system work includes both decommissioning of systems as they become redundant and installing new systems as required by the closure plan. These systems include pumping stations, associated piping, and required electrical supply. The costs are summarised in Table 21-14.
| Pebble Project | Page 288 |
| NI 43-101 Technical Report Update and Preliminary Economic Assessment | August 21, 2023 |
|
|
|
Table 21‑14: Closure Water Handling Systems
| Water Handling Closure Summary | Phase 1 | Phase 2 | Phase 3 | Phase 4 | Total |
| $ M | $ M | $ M | $ M | $ M |
|
| Bulk TSF | 81.2 | 77.8 | 89.8 | 1.2 | 249.9 |
| Pyritic TSF | - | - | - | - | - |
| Main WMP | 25.7 | - | - | - | 25.7 |
| Open Pit | 81.4 | - | 120.1 | 1.4 | 202.8 |
| WTPs | 17.6 | - | 13.9 | 0.4 | 31.9 |
| Total | 205.9 | 77.8 | 223.8 | 2.9 | 510.4 |
21.2.13.4 Water Treatment Plants
The closure water treatment plant components include:
| · | Continued operation of WTP #2 during Phase 1. |
|
|
|
| · | Reconfiguring WTP #1 to WTP #3 during Phase 1. |
|
|
|
| · | Decommissioning WTP #2 during Phase 2. |
|
|
|
| · | Expanding the capacity of WTP #3 during Phase 3 to treat water from both the bulk TSF and open pit; and |
|
|
|
| · | Operation of WTP #3 through Phase 4 (post-closure). |
The cost to reconfigure WTP #1 to WTP #3 and to expand WTP #3 is shown in Table 21-15.
Table 21‑15: Closure Water Treatment Plant Reconfiguration Costs
| Water Treatment Plant Closure | Phase | Closure cost (US$ M) |
| Reconfigure WTP #1 to WTP #3 | 1 | 126.0 |
| Expand WTP #3 | 3 | 120.6 |
| Total | 246.6 |
|
The annual sustaining closure costs of the WTPs by phase is shown in Table 21-16.
Table 21‑16: Closure Water Treatment Plant Sustaining Costs
| WTP # | Phase 1 (Yr 21-35) ($ M/yr) | Phase 2 (Yr 36-42) ($ M/yr) | Phase 3 (Yr 43-70) ($ M/yr) | Phase 4 (Yr 70+) ($ M/yr) |
| WTP #2 | 34.7 |
|
|
|
| WTP #3 | 11.2 | 0.2 | 24.8 | 14.7 |
| Total | 45.9 | 0.2 | 24.8 | 14.7 |
| Pebble Project | Page 289 |
| NI 43-101 Technical Report Update and Preliminary Economic Assessment | August 21, 2023 |
|
|
|
21.3 Operating Costs
21.3.1 Summary
A summary of the individual components that make up the estimated operating costs is presented in Table 21-17 and is based on a combination of first-principal calculations, experience and historical pricing, reference projects and factors as appropriate for a PEA. Costs associated with transportation right of way agreements with Alaska Native Village Corporation, as identified in Section 4.4, have been excluded from Table 21-17 but are included in the financial model.
Table 21‑17: Summary of Annual Average Operating Cost Estimate
| Operating Area | Average Annual Cost (US$M) | LOM Average Cost (US$/ton milled) |
| General & Administrative | 62.5 | 0.97 |
| Open Pit Mining | 127.3 | 1.97 |
| Mineralized Material Handling & Process Plant | 321.7 | 4.99 |
| Tailings Operation & Maintenance | 14.4 | 0.22 |
| Water Treatment Plant | 24.6 | 0.38 |
| Marine Facilities | 33.3 | 0.52 |
| Ferry | 13.9 | 0.22 |
| Access Road1 | 16.3 | 0.25 |
| Infrastructure Lease | 286.5 | 4.44 |
| Total2 | 900.3 | 13.95 |
Note: 1. Excludes the right of way agreement fees
Note 2: values may not add up due to rounding
21.3.2 General & Administrative
The estimate of general and administrative (G&A) costs for operation of the project is based on previously developed information provided by Northern Dynasty for this project and factored to suit the milling rate considered in the present PEA with labour and expenses updated for the current market. These cost estimates have been reviewed and confirmed to be appropriate as the basis of the 2023 PEA estimate.
The labour costs are inclusive of base salaries and overhead burdens at 30%. Head office salaries are based on a normal 40-hour week in Anchorage, while site-based costs include for remote work with a 2 & 1 rotation (2 weeks on – 1 week off) for both salaries and headcount.
While this summary includes the mine site, any G&A labour cost and headcount associated with the marine terminal is included in the operations summary for that area.
A summary of the individual cost areas is presented in Table 21-18.
| Pebble Project | Page 290 |
| NI 43-101 Technical Report Update and Preliminary Economic Assessment | August 21, 2023 |
|
|
|
Table 21‑18: Summary of Annual G&A Operating Cost Estimate
| Operating Area | Head Count | Average Annual Cost (US$M) | LOM Average Cost (US$/ton milled) |
| Administration Office | 27 | 3.7 | 0.06 |
| Mine Site Services | 40 | 6.1 | 0.09 |
| Materials & Other Directs | n/a | 8.3 | 0.13 |
| Overheads | n/a | 31.7 | 0.49 |
| Labour Transportation | n/a | 12.6 | 0.20 |
| Total | 67 | 62.5 | 0.97 |
Note: values may not add up due to roundup
21.3.3 Power Supply Costs
The capital costs for installation of natural gas line and power generation equipment have been included in the overall project development, and the combined operating costs of these assets are charged to the individual operating areas at the rate of $0.091/kWh for power consumption. This is based on annual fuel consumption needs of the mine site and marine site power plants, with an estimated 2023 local contract price of natural gas of $9.50 /mmscf. Non-fuel related O&M costs were also calculated on an annual rate. These two costs totalled annually, were divided by the annual electricity generation to derive the unit cost $0.091 /kWh.
21.3.4 Open Pit Mining
Open Pit Mining costs were estimated by Tetra Tech from historical equipment productivity calculations and, more generally. Annual equipment utilization hours were derived from calculated available hours less estimated operating delays and then applied to the hourly equipment costs to estimate the direct mining operating costs.
Pre-production stripping costs of $74.7 M are included in the initial capital cost estimates for mining and are not included in these average operating costs and production rates. Open pit mining costs are summarized in Table 21-19.
Table 21‑19: Pit Mine Operating Costs
| Open Pit Category | Unit Rate ($/ton mined) | Life-of-Mine Cost ($M) | Average Annual Cost ($M/year) | Average Rate ($/ton milled) |
| Drilling | 0.04 | 50.2 | 2.5 | 0.04 |
| Blasting | 0.22 | 305.4 | 15.3 | 0.24 |
| Loading | 0.15 | 214.5 | 10.7 | 0.17 |
| Hauling | 0.56 | 791.2 | 39.6 | 0.61 |
| Dewatering | 0.06 | 89.8 | 4.5 | 0.07 |
| Support | 0.18 | 256.3 | 12.8 | 0.20 |
| Ancillary | 0.03 | 47.5 | 2.4 | 0.04 |
| Labour | 0.53 | 748.9 | 37.4 | 0.58 |
| Other | 0.03 | 42.5 | 2.1 | 0.03 |
| Total | 1.81 | 2,546.3 | 127.3 | 1.97 |
| Pebble Project | Page 291 |
| NI 43-101 Technical Report Update and Preliminary Economic Assessment | August 21, 2023 |
|
|
|
A summary of the average annual consumable usage is included in the mine operating costs are presented in Table 21-20.
Table 21‑20: Mining Consumable Consumptions
| Mining Cost item | Units | Annual Usage |
| Electricity | MWh | 50,050 |
| Diesel fuel | USG 1,000’s | 7,250 |
| Lubricants | USG 1,000’s | 490 |
| Tires | EA | 185 |
| ANFO | Short Ton | 13,830 |
| Emulsion | Short Ton | 2,590 |
21.3.5 Processing Costs
Ausenco developed the estimate of operating costs for the mill feed material handling system and process plant based on historical costs from similar projects in a remote location. Processing costs for power, consumables, maintenance consumables and labour are summarized in Table 21-21.
Table 21‑21: Processing Costs
| Processing Cost item | Average Annual Cost ($M) | LOM Average Cost ($/ton milled) |
| Power | 127.4 | 1.97 |
| Operating consumables | 153.5 | 2.38 |
| Maintenance consumables | 13.8 | 0.21 |
| Labor | 27.1 | 0.42 |
| Total | 321.7 | 4.99 |
21.3.5.1 Power
Power consumption was derived from calculated power draw of major mechanical equipment required for the process, plus an allowance for the remainder of the plant, based on typical flotation plants. The average on-line power draw is estimated at 160 MW.
Annual energy consumption is estimated at 1,400 GWh, or $127.4 M at $0.091/kWh.
1.142.5.2 Consumables
Processing reagents and consumables costs were estimated based on the design throughput with rates from the process design criteria. Costs for process reagents, mill media, mill liners, and other plant consumables were estimated based on vendor information and benchmarking against other designed or operating facilities at similar plants in North America. A breakdown of these costs is summarized in Table 21-22.
| Pebble Project | Page 292 |
| NI 43-101 Technical Report Update and Preliminary Economic Assessment | August 21, 2023 |
|
|
|
Table 21‑22: Operating Consumable Costs
| Consumable Cost item | Average Annual Cost ($M) | LOM Average Cost ($/ton Milled) |
| Reagents | 58.5 | 0.91 |
| Mill media | 71.2 | 1.10 |
| Liners | 19.5 | 0.30 |
| Filters, laboratory and miscellaneous. | 4.3 | 0.07 |
| Total | 153.5 | 2.38 |
21.3.5.2 Maintenance Consumables
Annual maintenance spares and consumable costs were estimated at 13.8 M per year, equivalent to 2% of the $910.6 M total installed capital costs for mechanical equipment, plate work, support steel and electrics$.
21.3.5.3 Labor
The labor costs, as show in Table 21-23 include all management, processing, maintenance, and support personnel required for normal operations. Costs were based on an expected 158 staffed positions, with average wages for each position.
Table 21‑23: Labor Costs
| Cost Center | Number | Average Annual Cost ($M) |
| Operations staff and supervision | 18 | 4.1 |
| Crushing, grinding & flotation crews | 56 | 8.7 |
| Metallurgical laboratory | 26 | 4.1 |
| Maintenance staff | 10 | 2.1 |
| Maintenance personnel | 48 | 8.1 |
| Total | 158 | 27.1 |
21.3.6 Tailings Operation & Maintenance
The operating and maintenance costs for the TSF facilities were estimated by Knight Piésold based on their preliminary design development and unit rates for similar operations. The average annual cost of $14.4 M includes labour, power, and consumables for the operation and maintenance of the water management mechanical systems but does not include WTP costs.
21.3.7 Water Treatment Plants
HDR developed the water treatment plant operating cost estimate based on similar WTP facilities designed by HDR and was developed using mass balance-derived estimates for chemical reagents, a detailed electrical load analysis, and detailed estimates of operational manpower, consumables, and replacement parts.
Costs for each WTP were developed by factoring based on differences in flow and water quality from the similar WTP facilities designed by HDR, escalating costs to 2023 US dollars, and by adding costs for the additional processes that the current case has based on average flows.
| Pebble Project | Page 293 |
| NI 43-101 Technical Report Update and Preliminary Economic Assessment | August 21, 2023 |
|
|
|
A summary of the estimated annual WTP operating costs during mine production are presented in Table 21-24.
Table 21‑24: WTP Annual Operating Cost Summary
| WTP # | Phase of Mine Life | Influent Stream Treated | Annual Costs ($M) |
| WTP #1 | Operations | Open Pit WMP | 3.5 |
| WTP #2 | Operations | Main WMP | 21.1 |
| Total | 24.6 |
||
21.3.8 Marine Terminal Facilities
The operating and maintenance costs for the marine terminal facilities including two ferry terminals and Amakdedori Port (excluding the Ferry service) were developed on the basis of nominal staff and crew requirements, fuel and power consumption costs, maintenance materials, the intake and offload of mine area consumables and the barging operation to transship copper-gold concentrate from transfer barges to ocean going bulk carriers anchored at deep water in Iliamna Bay.
A summary of the operating costs for the marine terminal facilities is presented in Table 21-25.
Table 21‑25: Marine Terminal Facilities Operating Costs
| Cost Item | Annual Cost ($M) | LOM Average Cost ($/ton milled) |
| Energy (Diesel Fuel and Electricity) | 4.5 | 0.07 |
| Fixed and Variable Maintenance | 4.2 | 0.07 |
| Labour | 24.6 | 0.38 |
| Total | 33.3 | 0.52 |
Diesel fuel consumption costs are based on an average annual consumption of 3.84 M litters for all mechanical equipment used at the three marine terminal facilities. Haul trucks with diesel consumption of 60 L/100km are used for concentrate transport to the port. Transshipment tugboats fuel consumption rate is estimated at 750 L/hr. The price of diesel used is $1.10/L. An allowance for lighting, heating and general services is also included.
Annual marine terminal fixed maintenance costs are estimated at 1-2% of the initial capital costs of the infrastructure and equipment, plus variable electrical and mechanical maintenance costs estimated at 1% for every 1,000 hours of equipment operation.
Site labour includes management, port operations, maintenance, and transshipment crews for the marine terminal facilities. A total of 56 site personnel is assigned to the marine terminal facilities dispersed across three locations.
21.3.9 Ferry
The ferry operating cost estimate assumes the vessel will be operated on a charter basis and includes the cost of operation, inspection every four years, debt service and operator profit. Fuel and consumable consumption during winter will be higher than summer due to the ice-breaking requirement. The estimate assumes icebreaking will be required for 6 months per year. A summary of the operating costs for the ferry is presented in Table 21-26.
| Pebble Project | Page 294 |
| NI 43-101 Technical Report Update and Preliminary Economic Assessment | August 21, 2023 |
|
|
|
Table 21‑26: Ferry Operating Cost
| Cost Item | Annual Cost ($M) |
| Fuel | 4.2 |
| Consumables and spares | 1.1 |
| Personnel | 1.4 |
| Insurance | 0.6 |
| Docking and inspection | 0.5 |
| Debt service | 3.3 |
| Subtotal | 11.1 |
| Charter profit | 2.8 |
| Total | 13.9 |
21.3.10 Access Roads
The operating cost estimate for the access roads has been prepared by RECON, and is based on typical requirements for fuel, labour, and materials usage to maintain the road surface and bridges for all-season traffic between the marine terminal and the mine site. The cost of mobile equipment is included in the initial capital cost, and replacement equipment in sustaining costs. Transportation rights and toll payments based on anticipated future commitments are not included in the cost tabulation but have also been included in the financial model. The annual operating cost for the external access road is $16.3 M or $0.25 /ton.
| Pebble Project | Page 295 |
| NI 43-101 Technical Report Update and Preliminary Economic Assessment | August 21, 2023 |
|
|
|
22 ECONOMIC ANALYSIS
22.1 Forward-Looking Information
Certain information and statements contained in this section are forward-looking in nature and are subject to known and unknown risks, uncertainties, and other factors, many of which cannot be controlled or predicted and may cause actual results to differ materially from those presented here. Forward-looking statements include, but are not limited to, statements with respect to:
| · | mineral resource estimates; |
|
|
|
| · | the mine plan for the Pebble Project; |
|
|
|
| · | the projected life of mine and other expected attributes of the Pebble Project; |
|
|
|
| · | projected metallurgical recovery rates; |
|
|
|
| · | processing method and rates and production rates; |
|
|
|
| · | infrastructure requirements; |
|
|
|
| · | the cost and timing of any development of the Pebble Project; |
|
|
|
| · | capital, operating and sustaining cost estimates; |
|
|
|
| · | requirements for additional capital to proceed with the development of the Pebble Project; |
|
|
|
| · | the economic and study parameters of the Pebble Project; |
|
|
|
| · | copper-gold concentrate marketability and commercial terms; |
|
|
|
| · | future metals prices and currency exchange rates including any stream financing and infrastructure outsourcing; |
|
|
|
| · | the net present value (NPV), internal rate of return (IRR) and payback period of capital; |
|
|
|
| · | the ability to secure the issuance of a positive ROD following the USACE’s remand and the ability of the Pebble Project to secure all required federal and state permits; |
|
|
|
| · | environmental risks; |
|
|
|
| · | the ability of the Pebble Partnership to challenge the Final Determination process initiated by the EPA under Section 404(c) of the Clean Water Act; |
|
|
|
| · | government regulations and permitting timelines, including the ability to successfully obtain federal and state permits required for the Pebble Project; |
|
|
|
| · | estimates of reclamation obligations; |
|
|
|
| · | the right-sizing and de-risking of the project, including any determination to pursue any of the expansion scenarios for the Pebble Project or to incorporate a gold plant; |
|
|
|
| · | the social integration of the project into the Bristol Bay region and benefits for Alaska; |
|
|
|
| · | the political and public support for the permitting process; |
|
|
|
| · | general business and economic conditions; and |
|
|
|
| · | natural gas availability and pricing rates. |
| Pebble Project | Page 296 |
| NI 43-101 Technical Report Update and Preliminary Economic Assessment | August 21, 2023 |
|
|
|
The project is also subject to the specific risks inherent in the mining business as well as general economic and business conditions in addition to technical risks included in Section 25 of the 2023 PEA.
The 2023 PEA is preliminary in nature. The mine plan in the 2023 PEA is partly based on inferred mineral resources that are considered too speculative geologically to have the economic considerations applied to them that would enable them to be categorized as mineral reserves, and there is no certainty that the 2023 PEA will be realized. Mineral resources that are not mineral reserves do not have demonstrated economic viability.
22.2 Summary
The Project was assessed under a scenario in which the effective capital cost is reduced by engaging partners to provide primary infrastructure (access road, marine facility, natural gas pipeline, and mine site power plant) with the Pebble Project utilizing these facilities under lease. Given the latter scenario is the more likely route to development, it is defined as the Base Case. Using long-term metal price assumptions and a 20-year LOM, the Base Case has an 18.6% pre-tax internal rate of return (IRR), a 4.3-year pre-tax payback on $4.1 B initial capital, and a $3.4 B pre-tax net present value (NPV) at a 7% discount rate. For post tax, the values are 16.2% IRR, a 4.6-year payback on $4.1 B initial capital, and $2.2 B NPV at a 7% discount rate. As a sensitivity, a Full Capital Case, in which there are no infrastructure partners, was also tested and shown in Section 22.8.2.
A summary of results for the Base Case is set out in Table 22-1 and Table 22-2.
As noted in Section 4.3, the Pebble Partnership has signed a Royalty Agreement, whereby the Royalty Holder has the right to receive a portion of the future gold and silver production from the proposed Pebble Project for the life of the mine. The right can be exercised through five tranches, with each tranche providing the Royalty Holder with the right to 2% of the gold production and 6% of the silver production after accounting for notional payments of $1,500 per ounce of gold and $10 per ounce for silver. The Pebble Partnership will retain a portion of the gold when the spot price exceeds $4,000 /oz or when the recovery rate exceeds 60%. The Pebble Partnership will also retain a portion of the silver when the spot price exceeds $50 /oz or when the recovery rates exceed 65%. To date, the Royalty Holder has purchased the first tranche. The financial analysis assesses the results under the existing first tranche and under the possible full five tranches to provide the range of possible outcomes; in the Base Case analysis, the full royalty subscription is assumed.
The Proposed Project would extract a small portion of the Pebble mineral resource and the 2023 PEA tests the sensitivity of extracting a greater portion of that mineral resource. An expanded open pit design was developed, and three potential expansion scenarios were defined using this expanded open pit, with the expansions defined by the year in which the expanded process would commence operation – Years 5, 10 or 21. The Year 21 case was modelled on a response to the USACE during the CWA process, in which they requested an analysis of an expanded project. The response to that request envisioned the process plant expanded from 180,000 tons per day for the Proposed Project to 250,000 tons per day. The process plant would expand to 270,000 tons per day in the Years 5 and 10 potential expansion scenarios. The 2023 PEA also tests the sensitivity of adding a secondary gold recovery plant in Year 5 to the Base Case and the potential expansion scenarios. The gold plant capacity for the Year 5 scenario would match the expansion, while for the Base Case and the other two potential expansion scenarios, the secondary gold recovery plant would be expanded with the expanded process plant. These scenarios all show enhanced financial results with the IRR ranging from 18.1% to 24.2% and the NPV from $5.5 B to $10 B.
| Pebble Project | Page 297 |
| NI 43-101 Technical Report Update and Preliminary Economic Assessment | August 21, 2023 |
|
|
|
Table 22‑1: Summary of Proposed Project Results, including the Royalty arrangement and Long-Term Metal Prices
| Description | Units | Base Case, 10% Gold/30% Silver Royalty |
| Mine Life | years | 20 |
| Mining Method | - | Open pit |
| Pre-Tax NPV at 7% | US$M | 3,373 |
| Pre-Tax IRR | % | 18.6% |
| Pre-Tax Payback | years | 4.3 |
| Initial Capital | US$M | 4,131 |
| NSR per Ton Milled | $/ton | 26.88 |
| Operating Cost Per Ton | $/ton | 14.17 |
| C1 Copper Cost (co-product basis) | $/lb CuEq | 2.09 |
| Production Rate | Mton/year | 66 |
| Post-Tax NPV at 7% | US$M | 2,233 |
| Post-Tax IRR | % | 16.2 |
| Post-Tax Payback | years | 4.6 |
| Strip Ratio | waste: mineralized rock | 0.12 |
| Total Processed | Mton | 1,291 |
| Copper Equivalent Grade1 | % | 0.57 |
| Copper Grade | % | 0.29 |
| Gold Grade | oz/ton | 0.009 |
| Molybdenum Grade | ppm | 154 |
| Silver Grade | Oz/ton | 0.04 |
Note:
| 1. | Copper equivalent (CuEq) calculations use the following metal prices: US$1.85 /lb for Cu, US$902 /oz for Au and US$12.50 /lb for Mo, and recoveries: 85% Cu, 69.6% Au, and 77.8% Mo (Pebble West zone) and 89.3% Cu, 76.8% Au, 83.7% Mo (Pebble East zone). |
Table 22‑2: Summary of the Proposed Project Results
| Description | Units | Base Case, 10% Gold/30% Silver Royalty |
| Pre-Tax NPV at 0% | $M | 11,099 |
| Pre-Tax NPV at 5% | $M | 4,778 |
| Pre-Tax NPV at 8% | $M | 2,816 |
| Pre-Tax NPV at 10% | $M | 1,923 |
| Post-Tax NPV at 0% | $M | 7,681 |
| Post-Tax NPV at 5% | $M | 3,242 |
| Post-Tax NPV at 8% | $M | 1,829 |
| Post-Tax NPV at 10% | $M | 1,176 |
| Pebble Project | Page 298 |
| NI 43-101 Technical Report Update and Preliminary Economic Assessment | August 21, 2023 |
|
|
|
22.3 Methodology
An economic model was developed to estimate annual pre-tax and post-tax cash flows of the project. The NPV was calculated based on a 7% discount rate. By convention, a discount rate of 8% is typically applied to copper and other base metal projects, while 5% is applied to gold and other precious metal projects. Given the polymetallic nature of the Pebble deposit and the large contribution of gold to total project revenues, a 7% blended discount rate was selected and considered appropriate for the purposes of discounted cash flow analyses.
Production data includes all production, whether payable in the spot market, under the Royalty Agreement, to third party metal stream partners, or payable as a smelter deduction (see Section 4.3).
All amounts expressed are in US dollars in real terms unless otherwise stated. NPV is calculated by discounting cash flows to the start of construction using a mid-year convention. The commencement of project construction is the valuation date on which the NPV, IRR, and other financial results are calculated.
Calendar years used in the economic analysis are provided for conceptual purposes only. Permits still must be obtained in support of operations and approval to proceed is still required from Northern Dynasty’s Board of Directors and any potential future partners in the development.
22.4 Inputs to the Cash Flow Models
The project would consist of an estimated 4.5-year construction period, followed by 20 years of production as outlined in the mine plan set out in Section 16. The NPV and IRR were calculated at the beginning of the construction period in
Year-4.5.
The cost and revenue estimates were assembled using real dollars, treating Year -4.5 as the base year. No escalation was applied to any of the estimates beyond this date.
The projected long-term consensus metal price assumptions included in Section 19.2 are provided for reference in Table 22-3.
Table 22‑3: Long-Term Metal Price Assumptions
| Metal Type | Unit | Value ($) |
| Copper | lb | 3.90 |
| Gold | oz | 1,700 |
| Molybdenum | lb | 12.50 |
| Silver | oz | 22.50 |
| Rhenium | kg | 1,500 |
The financial results of the 2023 PEA were prepared based on a nominal 180,000 t/d milling capacity. Forecast life-of-mine production results are summarized in Table 22-4.
| Pebble Project | Page 299 |
| NI 43-101 Technical Report Update and Preliminary Economic Assessment | August 21, 2023 |
|
|
|
Table 22‑4: Proposed Project Production Summary - Life of Mine
| Description | Units | Values |
| Production Rate | Mton/year | 66 |
| Strip Ratio | waste: mineralized rock | 0.12 |
| Total Processed | Mton | 1,291 |
| Copper Equivalent Grade | % | 0.57 |
| Copper Grade | % | 0.29 |
| Gold Grade | oz/ton | 0.009 |
| Molybdenum Grade | ppm | 154 |
| Silver Grade | oz/ton | 0.04 |
| Copper Recovery | % | 86.9 |
| Gold Recovery | % | 59.9 |
| Molybdenum Recovery | % | 75.3 |
| Silver Recovery | % | 66.9 |
| Copper Recovered | Blb | 6.41 |
| Gold Recovered | koz | 7,367 |
| Molybdenum Recovered | Mlb | 300 |
| Silver Recovered | k oz | 36,611 |
| Avg Annual Copper Recovered | Mlb | 320 |
| Avg Annual Gold Recovered | koz | 368 |
| Avg Annual Molybdenum Recovered | Mlb | 15 |
| Avg Annual Silver Recovered | k oz/a | 1,831 |
The predicted life-of-mine material tonnages and payable metal production used in the cash flow model are shown in Table 22-5 which account for the full royalty subscription.
| Pebble Project | Page 300 |
| NI 43-101 Technical Report Update and Preliminary Economic Assessment | August 21, 2023 |
|
|
|
Table 22‑5: Proposed Project LOM Material Tonnages and Payable Metal Production, 10% Gold / 30% Silver Royalty
| Description | Units | Values, 100% Basis | Payable Under Royalty | Values Net of Royalty |
| Total Tons Mined | M ton | 1,443 | - | 1,443 |
| Mill Feed | M ton | 1,291 | - | 1,291 |
| Concentrate |
||||
| Cu-Au Concentrate (dmt) | kt | 11,181 | - | 11,181 |
| Cu Content | Mlb | 6,409 |
| 6,409 |
| Au Content | koz | 7,257 |
| 7,257 |
| Ag Content | koz | 36,611 |
| 36,611 |
| Mo Concentrate (dmt) | kt | 272 | - | 272 |
| Mo Content | Mlb | 300 | - | 300 |
| Payable Metal |
||||
| Payable Cu | Mlb | 6,153 | - | 6,153 |
| Payable Au | koz | 7,127 | 350 | 6,777 |
| Payable Mo | Mlb | 300 | - | 300 |
| Payable Ag | koz | 32,901 | 7,342 | 25,558 |
| Payable Re | t | 208 | - | 208 |
Copper-gold concentrate production, including contained copper and gold metal over the proposed 20-year production period, is illustrated in Figure 22-1.
Figure 22‑1: Copper-Gold Concentrate Production
Note: Prepared by NDM, 2023.
| Pebble Project | Page 301 |
| NI 43-101 Technical Report Update and Preliminary Economic Assessment | August 21, 2023 |
|
|
|
Projected copper, gold, and silver grades within the copper-gold concentrate are shown in Table 22-6.
Table 22‑6: Proposed Project Copper-Gold Concentrate Statistics
| Description | Units | Values |
| Cu-Au Concentrate Produced | k dmt | 11,181 |
| Copper Grade | % Cu | 26.0 |
| Gold Grade | g/dmt | 20.2 |
| Silver Grade | g/dmt | 101.8 |
| Moisture Content | % | 8.0 |
Anticipated molybdenum-rhenium concentrate production, including contained molybdenum and rhenium metal over the 20-year production period, is illustrated in Figure 22-2.
Figure 22‑2: Molybdenum-Rhenium Concentrate Production
Note: Prepared by NDM, 2023.
Predicted molybdenum and rhenium grades within the concentrate are shown in Table 22-7.
Table 22‑7: Proposed Project Molybdenum-Rhenium Concentrate Statistics
| Description | Units | Values |
| Molybdenum-Rhenium Concentrate Produced | k dmt | 272 |
| Molybdenum Grade | % Mo | 50.0 |
| Rhenium Grade | ppm | 861 |
| Moisture Content | % | 5.0 |
The initial capital investment by Northern Dynasty assumed in the Base Case, net of pre-production proceeds from future gold streaming partners (approximately $1.2 B) and third-party infrastructure investment, is $3.1 B. The estimate includes direct costs for executing the project; indirect costs associated with design, construction and commissioning; Owner’s costs for permitting, environmental, and corporate support; all capital costs to completion of construction and commissioning between Years -4.5 and -1, as well as contingencies. The estimate also reflects assumptions regarding infrastructure development partners for the port, road and power plant, pre-production proceeds from gold stream partners, reclamation trust funding and surety requirements during construction. Proceeds from the first tranche of the Royalty Agreement, $12 M received on July 26, 2022, as well as proceeds from subsequent tranches of the Royalty Agreement, up to $60 M in total, are assumed prior to the start of construction and thus are not included in the 2023 PEA.
| Pebble Project | Page 302 |
| NI 43-101 Technical Report Update and Preliminary Economic Assessment | August 21, 2023 |
|
|
|
The initial capital investment is $6.77 B without the assumptions regarding infrastructure development partners for the port, road, and power plant and without the assumptions regarding gold stream partners.
The methodology for the capital and operating cost estimates, including accuracy and contingency basis are included in Section 21.
The Base Case financial evaluation assumes that strategic industry partners would develop, finance, own and operate a number of infrastructure assets including the transportation corridor (marine facility and access road) and the power infrastructure (natural gas pipeline and mine site power plant) and lease these assets back to the project through toll charges or lease payments. This assumption is based on historical experience with mining project infrastructure in Alaska. These partners could include utility and construction companies, independent power producers, special purpose financing vehicles or strategic financial investors. The discounted cash flow analysis assumes that these long-term infrastructure assets are repaid over the proposed 20-year operating period with ownership reverting back to the project at maturity with a 7% return on capital to the third party built into the $286 M annual lease payments. Pebble’s existing relationships and commitments to Alaska Native Village Corporations in the project area have been assumed in this financial analysis as well as assumptions to foster on-going business-partnering initiatives.
The terms and conditions of the Royalty Agreement as set out in Section 4.3 are reflected in the financial analysis. These include the estimated portion of metal retained by Northern Dynasty at recovery rates in excess of 60% for gold and 65% for silver as well as the estimated portion of metal retained by Northern Dynasty if, in the future, spot prices exceed $4,000 (nominal) per ounce of gold or $50 (nominal) per ounce of silver. In calculating the estimated portion of metal retained by Northern Dynasty if spot prices exceed these nominal values, annual gold and silver price inflation of 3% was assumed as well as a 5 ‑year period before the start of construction.
With total gold production estimated at 7.4 million oz over 20 years, gold is projected to be a significant component of gross revenues and net smelter return (NSR) with 24% of gross revenues attributable to gold (64% attributable to copper, 10% to molybdenum, 2% to silver and 1% to rhenium). In addition, the Pebble deposit resource estimate contains more than 70 million oz gold in the measured and indicated categories and 36 million ounces in the inferred category. As such, a potential gold stream partner is a material consideration in the economic evaluation of the project. This assumption is based on historical precious metal stream transactions and market data. Based on current market conditions and the assumptions noted in this report, estimated proceeds during construction of $1.2 B from potential gold streaming partners have been included in the Base Case.
The 2023 PEA financial analysis assumes that sufficient financial surety is provided to cover closure costs if the proposed mine should close prematurely as required by the ADNR and the ADEC. Closure costs and obligations are reviewed by the State of Alaska every five years and updated accordingly.
The financial model includes annual contributions to a reclamation trust and assumes that any shortfall between the accumulated value of the reclamation trust and the reclamation liability would be covered with financial assurances in the form of a letter of credit. The reclamation trust assumptions include a 4% real rate of return.
There is no salvage value included in the financial analysis.
| Pebble Project | Page 303 |
| NI 43-101 Technical Report Update and Preliminary Economic Assessment | August 21, 2023 |
|
|
|
The proposed project reclamation trust value at cessation of operations is estimated to be $1.6 B. The total estimated closure costs for the proposed project are $2.76 B, which is scheduled for completion after the cessation of operations. In addition, the estimated post-closure water treatment costs are $18.1 M per year, requiring a residual reclamation trust balance of $452 M. The on-going return in the reclamation trust accounts for the difference in value at cessation of operations and that required for closure and post-closure.
Table 22-8 contains a summary of costs, closure funding, and taxes. The estimated initial capital cost breakdown is shown in Table 22-9. Table 22-9 also included the impact of precious metals streaming on the net capital cost.
Table 22‑8: Proposed Project Cost and Tax Summary
| Description | Unit | Base Case,10% Gold / 30% Silver Royalty |
| Costs |
||
| Total Initial Capital Cost | $B | 6.77 |
| Infrastructure Lease | $B | 2.64 |
| Net Initial Capital Cost | $B | 4.13 |
| Sustaining Capital Cost | $B | 1.27 |
| Life of Mine Operating Cost1 | $/ton | 14.17 |
| Copper C1 Cost2 | $/lb CuEq | 2.09 |
| AISC (Co-Product Basis) | $/lb CuEq | 2.32 |
| Gold C1 Cost | $/oz AuEq | 911 |
| Closure Funding |
||
| Annual Contribution | $M/a | 39 |
| Life of Mine Contribution | $B | 0.97 |
| Life of Mine Bond Premium | $B | 0.18 |
| Closure Fund3 | $B | 1.6 |
| Life of Mine Taxes4 |
||
| Alaska Mining License | $B | 0.66 |
| Alaska Royalty | $B | 0.29 |
| Alaska Income Tax | $B | 0.68 |
| Borough Severance & Tax | $B | 0.53 |
| Federal Income Tax | $B | 1.25 |
| Annual Taxes5 |
||
| Alaska Mining License | $M | 33 |
| Alaska Royalty | $M | 15 |
| Alaska Income Tax | $M | 34 |
| Borough Severance & Tax | $M | 27 |
| Federal Income Tax | $M | 62 |
Note:
1. Includes cost of infrastructure lease - $4.44/ton milled.
2. C1 costs calculated on co product basis.
3. Maximum value of closure fund during life of mine based on 4% compound interest.
4. Estimated based on current Alaskan statutes.
5. Life-of-mine taxes ÷ life-of-mine years.
| Pebble Project | Page 304 |
| NI 43-101 Technical Report Update and Preliminary Economic Assessment | August 21, 2023 |
|
|
|
Table 22‑9: Pebble Project – Initial Capital
| Description | Cost ($M) |
| Open Pit Mining | 415.2 |
| Process Plant | 910.6 |
| Tailings and Water Management | 651.3 |
| On Site Infrastructure |
|
| Site General | 127.6 |
| Water Treatment Plants | 315.5 |
| On-Site Infrastructure | 251.7 |
| Off-Site Infrastructure |
|
| Power Supply | 702.6 |
| Natural Gas Line | 505.3 |
| Marine Terminal Site | 253.5 |
| Ferry | 54.3 |
| Access Road | 507.4 |
| Indirect Costs | 917.9 |
| Owner’ Cost | 353.0 |
| Contingency | 806.8 |
| Total Initial Capital Cost Estimate | 6,772.6 |
| Add: Reclamation Funding During Construction | 229.8 |
| Initial Capital Investment – Full Capital Case | 7,002.4 |
| Less: Outsourced Infrastructure | (2,641.1) |
| Less: Pre-production Proceeds from Gold Stream Partner | (1,245.3) |
| Initial Capital Investment – Base Case | 3,116.0 |
The phasing of initial capital expenditures and sustaining capital expenditures are illustrated in Figure 22-3. Figure 22-3 shows the sustaining capital expenditure over the 20-year operating period which is estimated at $1.3 B including
$193 M for open pit mining equipment and $843 M for TSF and WTP costs.
| Pebble Project | Page 305 |
| NI 43-101 Technical Report Update and Preliminary Economic Assessment | August 21, 2023 |
|
|
|
Figure 22‑3: Pebble Project – Initial and Sustaining Capital Phasing
Note: Prepared by NDM, 2023.
An allowance for working capital was made in the financial model on the basis of 45 days debtor and creditor terms with an annual inventory investment equal to 5% of costs. Total working capital at the end of Year 20 is estimated to be $87 M.
The on-site operating cost assumptions included in Section 21.3 are provided for reference in Table 22-10.
Table 22‑10: Proposed Project Base Case Operating Costs – per Ton and Total Life of Mine
| Description | 10% Gold / 30% Silver Royalty |
|
| $/ton | Life of Mine ($M) |
|
| Total Operating Costs | 14.17 | 18,290 |
| Open Pit | 1.97 | 2,544 |
| Process | 4.99 | 6,434 |
| Transportation | 1.20 | 1,554 |
| Environmental | 0.60 | 779 |
| G&A | 0.97 | 1,250 |
| Infrastructure | 4.44 | 5,730 |
For comparison, the operating costs for the Full Capital case, which exclude the assumptions regarding infrastructure development partners, are $12,751 M for the life of mine and $9.88/ton milled, assuming a 10% gold and 30% silver royalty.
| Pebble Project | Page 306 |
| NI 43-101 Technical Report Update and Preliminary Economic Assessment | August 21, 2023 |
|
|
|
Key smelter terms and off-site operating cost assumptions included in Section 19.3. and Section 21.3, respectively, are provided for reference in Table 22-11.
Table 22‑11: Key Smelter Terms and Off-Site Costs
| Description | Units | Terms |
| Copper Treatment Charges | $/dmt | 70.00 |
| Copper Refining Charges | $/lb | 0.07 |
| Copper Deduction | concentrate % | 1.0 |
| Gold Refining Charges | $/oz | 7.00 |
| Gold Deduction | % of production | 3.0 |
| Silver Refining Charges | $/oz | 0.60 |
| Silver Deduction | % of production | 10.0 |
| Copper Concentrate Ocean Freight | $/wmt | 50.0 |
| Molybdenum Concentrate Ocean Freight | $/wmt | 171.1 |
| Insurance | % invoice value | 0.15 |
| Representation and Marketing Costs | $/wmt | 2.50 |
Projected total operating costs as well as C1 copper cash costs (on both a co-product and by-product basis) are illustrated in Figure 22-4 over the proposed 20-year operating period. C1 Cash Cost (US$/lb) is a non-IFRS measure and is calculated as the sum of production costs, off-site costs (treatment, refining and transportation) costs, and royalties divided by the copper pounds produced. C1 cash cost is widely reported in the mining industry but does not have a standardized meaning and is disclosed in addition to IFRS measures.
Figure 22‑4: C1 Cash Costs, Base Case
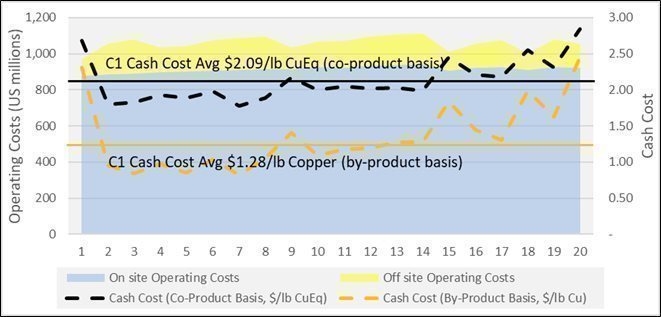
Note: Prepared by NDM, 2023.
| Pebble Project | Page 307 |
| NI 43-101 Technical Report Update and Preliminary Economic Assessment | August 21, 2023 |
|
|
|
22.5 Pre-Tax Financial Evaluation
22.5.1 Pre-Tax Evaluation Basis
The pre-tax financial model incorporated the production schedule and smelter term assumptions to produce annual recovered payable metal and gross revenue, in each concentrate stream, by year. Off-site costs, including the applicable refining and treatment costs, penalties, concentrate transportation charges, marketing and representation fees, and royalties were then deducted from gross revenue to determine the NSR. Further details of the smelter terms used to calculate the recovered metal value and off-site operating costs can be found in Section 19.3.
The parcel of the Pebble property within the Exploration Lands is subject to a NPI royalty payable to Teck. The terms include a 4% pre-payback net profits interest (after all costs including debt services and taxes) which increases to a 5% net profits interest after payback. However, the portion of the deposit to be mined by the proposed project lies outside the parcel subject to the NPI and is therefore not subject to the Teck royalty. The project is subject to a State of Alaska royalty as described with other state taxes in Section 22.6.4 and subject to the Royalty Agreement as described in
Section 19.5.2.
The operating cash flow was calculated by deducting annual mining, processing, transportation, environmental, infrastructure lease (Base Case only) and G&A costs from the NSR.
Initial, sustaining, and working capital as well as reclamation funding were deducted from, and assumed proceeds from potential precious metal streaming partners (Base Case only) were added to the operating cash flow in years they are projected to occur, to determine the net cash flow before taxes.
Initial capital cost included all estimated expenditures in the construction period, from Year -4.5 to Year -1 inclusive. First production would occur at the beginning of Year 1. Sustaining capital expenditure includes all capital expenditures purchased after first production.
The financial analysis for the Base Case was carried out on a 100% ownership basis, with the exclusion of the power, port and road infrastructure assets which were assumed to be owned by third-party partners.
22.5.2 Pre-Tax Financial Results
A summary of the pre-tax financial results for the Base Case is provided in Table 22-12.
| Pebble Project | Page 308 |
| NI 43-101 Technical Report Update and Preliminary Economic Assessment | August 21, 2023 |
|
|
|
Table 22‑12: Proposed Project Base Case Pre-Tax Financial Results
| Description | Units | 10% Gold / 30% Silver Royalty |
| Recovered Metal Value |
||
| Copper | $M | 23,998 |
| Gold | $M | 8,991 |
| Molybdenum | $M | 3,744 |
| Silver | $M | 575 |
| Rhenium | $M | 312 |
| Total Recovered Metal Value | $M | 37,620 |
| Off-Site Operating Costs |
||
| Refining and treatment Charges, Penalties, Insurance, Marketing and Representation & Concentrate Transportation | $M | 2,923 |
| On-Site Operating Costs |
||
| Open Pit | $/ton milled | 1.97 |
| Process | $/ton milled | 4.99 |
| Transportation | $/ton milled | 1.20 |
| Environmental | $/ton milled | 0.60 |
| G&A | $/ton milled | 0.97 |
| Infrastructure Lease | $/ton milled | 4.44 |
| Total Operating Cost | $/ton milled | 14.17 |
| Capital Expenditure |
||
| Initial Capital | $M | 6,773 |
| Add: Pre-production Reclamation Funding | $M | 230 |
| Less: Outsourced Infrastructure | $M | (2,641) |
| Less: Pre-production proceeds from gold stream partner | $M | (1,245) |
| Initial Capital Investment during Construction | $M | 3,116 |
| Sustaining Capital | $M | 1,272 |
| Financial Summary |
||
| Pre – Tax Undiscounted Cash Flow | $M | 11,099 |
| Pre – Tax NPV at 7% | $M | 3,373 |
| Pre – Tax IRR | % | 18.6 |
| Pre – Tax Payback Period | Years | 4.3 |
| Cash Cost (Co-Product Basis) | $/lb CuEq | 2.09 |
| All-in Sustaining Cost (Co-Product Basis) | $/lb CuEq | 2.32 |
| Pebble Project | Page 309 |
| NI 43-101 Technical Report Update and Preliminary Economic Assessment | August 21, 2023 |
|
|
|
22.6 Post-Tax Financial Analysis
22.6.1 Overview
The Pebble Project is 100% owned by the Pebble Partnership. As a partnership is not a taxable entity for U.S. tax purposes, tax liabilities generally accrue to each partner based on its proportionate share of the income from the project in a fiscal period.
The economic analysis assumed that the project would be subject to tax as if it were held 100% by a U.S. corporate resident entity. This approach has been taken to facilitate comparison to other mining projects that are owned on a 100% basis.
Taxable income from sales of concentrate produced from the project will be subject to taxation by multiple levels of government. Given that the Pebble Project is one of the world’s most significant copper-gold deposits, tax revenues derived from mining would contribute significantly to U.S. Federal, State, and local governments. The following tax regimes were incorporated in the post-tax analysis: U.S. Federal Income Tax, Alaska State Income Tax, Alaska Severance Tax, Alaska State Royalty Tax, and Alaska Mining License Tax. Taxes were calculated based on currently-enacted United States and State of Alaska tax laws and regulations under the Internal Revenue Code (IRC).
Using long-term metal prices, assuming 10% Gold Royalty and 30% Silver Royalty, the total taxes payable for the Base Case over the 20-year operating period are estimated to be $3.4 B, including $1.2 B in federal income tax, $1.6 B in State income taxes, royalty and mining license taxes, and $0.5 B in municipal severance and property taxes.
22.6.2 U.S. Federal and Alaska State Corporate Income Tax
The statutory federal income tax rate is 21%. The Alaska State income tax rate is 9.4%. As state taxes are deductible for federal purposes, the combined statutory income tax rate for the Pebble Project is expected to be 28.4% of taxable income for the Base Case.
Taxable losses generated in a given year may be carried forward indefinitely and applied to taxable income when it arises, subject to certain limitations based on a percentage of taxable income. The IRC also provides certain deductions to incentivize investment by mining companies, including depletion and resource development expenditure pools.
The benefits of depletion and other deductions under the IRC for the project reduces the average mine life effective income tax rate from the combined statutory tax rate of 28.4% to the effective income tax rate of 17.4% for the Base Case.
Combined with State production taxes and the borough severance tax, the total effective income tax rate on the Pebble Project is 30.8% for the Base Case.
22.6.3 Lake and Peninsula Borough Severance Tax
Municipal and borough governments in the State of Alaska assess property, sales, and use and/or severance taxes. The Lake and Peninsula Borough, where the project is located, has enacted a municipal severance tax of 1.5% of the gross production value, and this tax has been applied in the financial model. There is no provision in the legislation to carry losses forward to offset future profits in the State severance tax calculation.
| Pebble Project | Page 310 |
| NI 43-101 Technical Report Update and Preliminary Economic Assessment | August 21, 2023 |
|
|
|
22.6.4 Alaska State Royalty Tax
The Alaska State royalty is calculated at 3% of net income from mining operations on Alaska state lands.
22.6.5 Alaska Mining License Tax
The Alaska mining licence tax is assessed on net income from mining operations. Legislation allows for a 3.5-year hiatus from the mining licence tax after the commencement of initial production. The maximum mining licence rate is 7% on net income over $100,000.
22.6.6 Post-Tax Financial Results
The forecast total corporate income tax payable on the Pebble Project profits is $1,931 M for the Base Case over the 20-year mine life at long-term metal prices assuming a 10% gold and 30% silver royalty.
The post-tax financial results are summarized in Table 22-13 for the Base Case.
Table 22‑13: Proposed Project Base Case Post-Tax Financial Results
| Description | Units | Base Case 10% Gold / 30% Silver Royalty |
| Mining Taxes & Government Royalties | $M | 1,487 |
| Corporate Income Tax | $M | 1,931 |
| Post – Tax Undiscounted Cash Flow | $M | 7,681 |
| Post – Tax NPV at 7% | $M | 2,233 |
| Post – Tax IRR | % | 16.2 |
| Post – Tax Payback Period | years | 4.6 |
22.7 Cash Flow
The annual production schedule and estimated cash flow forecast for the Pebble Project as envisaged in the 2023 PEA Base Case can be found in assuming a 10% gold and 30% silver royalty. A detailed cash flow showing the base case with 10% Gold/ 30% Silver royalty is shown in Table 22-14.
| Pebble Project | Page 311 |
| NI 43-101 Technical Report Update and Preliminary Economic Assessment | August 21, 2023 |
|
|
|
|
|
|
Table 22‑14: Base Case Annual Production Schedule and Estimated Cash Flow, 10% Gold / 30% Silver Royalty
|
| $/t milled | TOTAL | NPV 7% | -Year 4.5 | -Year 4 | -Year 3 | -Year 2 | -Year 1 | Year 1 | Year 2 | Year 3 | Year 4 | Year 5 | Year 6 | Year 7 | Year 8 | Year 9 | Year 10 | Year 11 | Year 12 | Year 13 | Year 14 | Year 15 | Year 16 | Year 17 | Year 18 | Year 19 | Year 20 | Year 21 |
|
| Mining Volume | 1,443 | - | - | - | - | 33.1 | 62.7 | 70.5 | 70.5 | 70.5 | 70.5 | 70.5 | 70.5 | 70.5 | 72.8 | 71.7 | 70.7 | 72.3 | 72.7 | 72.8 | 72.7 | 72.8 | 72.7 | 72.8 | 65.7 | 64.1 | - |
|||
| Milling Volume | 1,291 | - | - | - | - | - | 43.8 | 65.7 | 65.7 | 65.7 | 65.7 | 65.7 | 65.7 | 65.7 | 65.7 | 65.7 | 65.7 | 65.7 | 65.7 | 65.7 | 65.7 | 65.6 | 65.7 | 65.6 | 65.7 | 64.1 | - |
|||
| Strip Ratio | 0.12 |
| na | na | na | na | 0.4 | 0.1 | 0.1 | 0.1 | 0.1 | 0.1 | 0.1 | 0.1 | 0.1 | 0.1 | 0.1 | 0.1 | 0.1 | 0.1 | 0.1 | 0.1 | 0.1 | 0.1 | 0.0 | 0.0 | na |
|||
| REVENUE | 100% | 29.15 | 37,620 | 15,477 | - | - | - | - | - | 1,321 | 2,156 | 2,187 | 1,951 | 2,013 | 2,013 | 2,268 | 2,171 | 1,748 | 1,981 | 1,946 | 2,033 | 2,060 | 2,112 | 1,502 | 1,771 | 1,826 | 1,416 | 1,756 | 1,389 | - |
| Copper ($US 3.9 per lb) | 64% | 18.59 | 23,998 | 9,911 | - | - | - | - | - | 857 | 1,461 | 1,410 | 1,215 | 1,232 | 1,267 | 1,483 | 1,450 | 1,085 | 1,236 | 1,219 | 1,320 | 1,378 | 1,445 | 905 | 1,105 | 1,100 | 814 | 1,126 | 891 | - |
| Gold ($US 1700 per oz) | 24% | 6.97 | 8,991 | 3,697 | - | - | - | - | - | 336 | 459 | 437 | 536 | 578 | 444 | 518 | 432 | 511 | 544 | 497 | 461 | 411 | 408 | 452 | 462 | 464 | 476 | 344 | 222 | - |
| Molybdenum ($US 12.5 per lb) | 10% | 2.90 | 3,744 | 1,507 | - | - | - | - | - | 97 | 187 | 288 | 154 | 158 | 253 | 217 | 238 | 111 | 158 | 189 | 205 | 224 | 210 | 105 | 161 | 218 | 92 | 241 | 238 | - |
| Silver ($US 22.5 per oz) | 2% | 0.45 | 575 | 233 | - | - | - | - | - | 20 | 28 | 28 | 31 | 32 | 30 | 33 | 31 | 30 | 29 | 27 | 30 | 31 | 33 | 31 | 29 | 27 | 26 | 27 | 21 | - |
| Rhenium ($US 1500 per kg) | 1% | 0.24 | 312 | 129 | - | - | - | - | - | 11 | 20 | 24 | 15 | 13 | 20 | 17 | 20 | 11 | 13 | 15 | 16 | 17 | 16 | 9 | 13 | 17 | 8 | 19 | 18 | - |
| Realization charges | 2.26 | 2,923 | 1,197 | - | - | - | - | - | 95 | 167 | 188 | 140 | 142 | 168 | 177 | 179 | 118 | 142 | 148 | 160 | 169 | 171 | 102 | 132 | 146 | 92 | 153 | 133 | - |
|
| NET SMELTER RETURN | 26.88 | 34,697 | 14,280 | - | - | - | - | - | 1,226 | 1,989 | 1,999 | 1,811 | 1,871 | 1,845 | 2,091 | 1,992 | 1,629 | 1,839 | 1,798 | 1,873 | 1,891 | 1,941 | 1,400 | 1,638 | 1,680 | 1,324 | 1,603 | 1,256 | - |
|
| OPERATING COSTS | 14.17 | 18,290 | 7,358 | 4 | 4 | 4 | 4 | 4 | 877 | 887 | 891 | 896 | 901 | 906 | 908 | 914 | 915 | 925 | 922 | 933 | 939 | 941 | 906 | 923 | 927 | 911 | 926 | 921 | - |
|
| Open Pit | 1.97 | 2,544 | 1,005 | - | - | - | - | - | 106.5 | 116.1 | 120.0 | 118.1 | 120.0 | 125.1 | 127.3 | 133.4 | 120.2 | 122.8 | 125.8 | 133.1 | 139.6 | 141.1 | 126.0 | 128.9 | 134.7 | 130.5 | 134.0 | 140.4 | - |
|
| Process | 4.99 | 6,434 | 2,600 | - | - | - | - | - | 322 | 322 | 322 | 322 | 322 | 322 | 322 | 322 | 322 | 322 | 322 | 322 | 322 | 322 | 322 | 322 | 322 | 322 | 322 | 322 | - |
|
| Transportation | 1.21 | 1,556 | 621 | 4 | 4 | 4 | 4 | 4 | 62 | 63 | 63 | 71 | 71 | 71 | 71 | 71 | 86 | 92 | 87 | 89 | 89 | 89 | 70 | 84 | 82 | 70 | 82 | 70 | - |
|
| Environmental | 0.60 | 779 | 312 | - | - | - | - | - | 37 | 37 | 37 | 37 | 39 | 39 | 39 | 39 | 39 | 39 | 39 | 39 | 39 | 39 | 39 | 39 | 39 | 39 | 39 | 39 | - |
|
| G&A | 0.97 | 1,250 | 505 | - | - | - | - | - | 62 | 62 | 62 | 62 | 62 | 62 | 62 | 62 | 62 | 62 | 62 | 62 | 62 | 62 | 62 | 62 | 62 | 62 | 62 | 62 | - |
|
| Infrastructure Lease | 4.44 | 5,730 | 2,315 | - | - | - | - | - | 286 | 286 | 286 | 286 | 286 | 286 | 286 | 286 | 286 | 286 | 286 | 286 | 286 | 286 | 286 | 286 | 286 | 286 | 286 | 286 | - |
|
| OPERATING PROFIT (EBITDA) | 12.71 | 16,407 | 6,922 | -4 | -4 | -4 | -4 | -4 | 349 | 1,102 | 1,108 | 915 | 970 | 940 | 1,183 | 1,078 | 714 | 913 | 875 | 940 | 952 | 1,000 | 493 | 716 | 753 | 413 | 677 | 335 | - |
|
| CAPITAL COSTS | -3.20 | -4,131 | -3,408 | -81 | -349 | -797 | -1,735 | -1,134 | -36 | - | - | - | - | - | - | - | - | - | - | - | - | - | - | - | - | - | - | - | - |
|
| Capital Costs - Leased Infrastructure (FYI only) | -2.06 | -2,662 | -2,315 | - | -630 | -1,529 | -302 | -180 | - | - | - | -5 | - | - | - | - | - | -1 | -1 | -1 | -1 | -2 | -2 | -2 | -2 | -2 | -2 | -2 | - |
|
| Sustaining Mining Capital | -0.15 | -193 | -81 | - | - | - | - | - | -36 | -0 | - | - | - | -9 | -22 | -19 | -7 | - | - | -12 | -17 | -39 | -9 | - | -22 | - | - | - | - |
|
| Sustaining Expansion Capital | 0.00 | - | - | - | - | - | - | - | - | - | - | - | - | - | - | - | - | - | - | - | - | - | - | - | - | - | - | - | - |
|
| Sustaining TSF and Other Capital | -0.84 | -1,079 | -461 | - | - | - | - | - | -4 | -53 | -48 | -186 | -48 | -41 | -77 | -41 | -50 | -116 | -41 | -47 | -48 | -62 | -44 | -41 | -48 | -43 | -41 | -1 | - |
|
| Reclamation Funding | -0.89 | -1,150 | -563 | -27 | -46 | -46 | -45 | -45 | -48 | -48 | -47 | -47 | -46 | -50 | -49 | -48 | -48 | -47 | -50 | -50 | -49 | -48 | -47 | -46 | -45 | -44 | -43 | -42 | - |
|
| Pre-production Proceeds of Metal Stream | 0.96 | 1,245 | 1,040 | 28 | 122 | 278 | 606 | 211 | - | - | - | - | - | - | - | - | - | - | - | - | - | - | - | - | - | - | - | - | ||
| Working Capital | 0.00 | - | -76 | - | - | - | - | - | -82 | -92 | -2 | 41 | -24 | 4 | -24 | 8 | 45 | -18 | -4 | -6 | -1 | -2 | 58 | -30 | -1 | 39 | -33 | 37 | 87 |
|
| PRE-TAX PROJECT CASH FLOW | 8.60 | 11,099 | 3,373 | -83.8 | -277 | -568 | -1,178 | -971 | 143 | 910 | 1,011 | 723 | 852 | 844 | 1,011 | 977 | 654 | 732 | 780 | 826 | 838 | 850 | 451 | 599 | 636 | 366 | 559 | 330 | 87 |
|
| Cumulative Pre-tax Project Cash Flow | -84 | -361 | -930 | -2,108 | -3,079 | -2,937 | -2,027 | -1,015 | -293 | 559 | 1,403 | 2,414 | 3,392 | 4,045 | 4,778 | 5,558 | 6,384 | 7,221 | 8,071 | 8,522 | 9,121 | 9,757 | 10,123 | 10,682 | 11,011 | 11,099 |
||||
| PV Factor | 0.98 | 0.93 | 0.87 | 0.82 | 0.76 | 0.71 | 0.67 | 0.62 | 0.58 | 0.54 | 0.51 | 0.48 | 0.44 | 0.41 | 0.39 | 0.36 | 0.34 | 0.32 | 0.30 | 0.28 | 0.26 | 0.24 | 0.23 | 0.21 | 0.20 | 0.18 |
||||
| PRE-TAX PROJECT NPV 7 | 3,373 |
|
|
|
|
|
|
|
|
|
|
|
|
|
|
|
|
|
|
|
|
|
|
|
|
|
|
|||
| IRR | 18.6% |
|
|
|
|
|
|
|
|
|
|
|
|
|
|
|
|
|
|
|
|
|
|
|
|
|
|
|||
| Pre-tax Project Payback (yrs) | 4.3 |
|
|
|
|
|
|
|
|
|
|
|
|
|
|
|
|
|
|
|
|
|
|
|
|
|
|
|||
| Alaska Mining License | -660 | - | - | - | - | - | - | - | -4 | -10 | -20 | -18 | -31 | -43 | -42 | -55 | -52 | -56 | -57 | -60 | -32 | -46 | -49 | -31 | -45 | -9 | - |
|||
| Alaska State Royalty Taxes | -292 | - | - | - | - | - | - | - | -2 | -4 | -9 | -8 | -14 | -19 | -19 | -24 | -23 | -25 | -25 | -26 | -14 | -20 | -22 | -14 | -20 | -4 | - |
|||
| Borough Severance & Property Taxes | -534 | - | - | - | - | - | -19 | -31 | -31 | -28 | -29 | -28 | -32 | -31 | -25 | -28 | -28 | -29 | -29 | -30 | -22 | -25 | -26 | -21 | -25 | -20 | - |
|||
| Total Mining Taxes and Royalties | -1.15 | -1,487 | -545 | - | - | - | - | - | -19 | -31 | -37 | -42 | -57 | -54 | -77 | -92 | -86 | -108 | -103 | -110 | -111 | -116 | -68 | -92 | -97 | -66 | -90 | -33 | - |
|
| Total Corporate Income Tax Payable | -1.50 | -1,931 | -595 | - | - | - | - | - | - | - | -2 | -7 | -15 | -13 | -22 | -30 | -49 | -201 | -191 | -205 | -206 | -217 | -116 | -168 | -179 | -113 | -164 | -33 | - |
|
| POST-TAX PROJECT CASH FLOW | 5.95 | 7,681 | 2,233 | -84 | -277 | -568 | -1,178 | -971 | 124 | 879 | 972 | 675 | 780 | 777 | 912 | 855 | 519 | 424 | 486 | 511 | 521 | 517 | 267 | 339 | 360 | 187 | 305 | 264 | 87 |
|
| Cumulative Post-tax Project Cash Flow | -84 | -361 | -930 | -2,108 | -3,079 | -2,956 | -2,076 | -1,105 | -430 | 350 | 1,127 | 2,039 | 2,894 | 3,413 | 3,837 | 4,323 | 4,834 | 5,355 | 5,872 | 6,139 | 6,478 | 6,838 | 7,025 | 7,330 | 7,594 | 7,681 |
||||
| POST-TAX PROJECT NPV 7 | 2,233 |
|
|
|
|
|
|
|
|
|
|
|
|
|
|
|
|
|
|
|
|
|
|
|
|
|
|
|||
| IRR | 16.2% |
|
|
|
|
|
|
|
|
|
|
|
|
|
|
|
|
|
|
|
|
|
|
|
|
|
|
|||
| Post-tax Project Payback (yrs) | 4.6 |
|
|
|
|
|
|
|
|
|
|
|
|
|
|
|
|
|
|
|
|
|
|
|
|
|
|
|||
| Pebble Project | Page 312 |
| NI 43-101 Technical Report Update and Preliminary Economic Assessment | August 21, 2023 |
|
|
|
|
|
|
22.8 Sensitivity Analysis
The financial analysis included testing the sensitivity of the project’s NPV, and IRR to several project variables. The following variables were included in this analysis:
| · | copper price |
|
|
|
| · | gold price |
|
|
|
| · | molybdenum price |
|
|
|
| · | initial capital cost |
|
|
|
| · | on-site operating cost |
|
|
|
| · | sustaining capital cost |
|
|
|
| · | head grade. |
With the exception of head grade, each variable was tested in increments of 10%, between -30% to +30% while holding all other variables constant. Head grade was tested over a range of ±10%, while holding the other all other variables constant, as variation beyond that range over the life of mine and on an annualized basis is unlikely, given the extent of the drilling defining the mineral resource and the methodology used to estimate the mineral resource. Figure 22-5 and Figure 22-6 show the results of the post-tax sensitivity analysis on the NPV and IRR. As shown in Figure 22-5, the project’s NPV at a 7% discount rate is, from most to least, sensitive to changes in head grade, copper price, initial capital costs, on-site operating costs, gold price, molybdenum price, and sustaining capital costs.
Figure 22‑5: Post-Tax Sensitivity Analysis, Base Case, 10% Gold and 30% Silver Royalty

Note: Prepared by NDM, 2023.
| Pebble Project | Page 313 |
| NI 43-101 Technical Report Update and Preliminary Economic Assessment | August 21, 2023 |
|
|
|
|
|
|
As shown in Figure 22-6, the project’s IRR is most sensitive to changes in, from most to least sensitive, head grade, initial capital costs, copper price, on-site operating costs, gold price, molybdenum prices, and sustaining capital costs.
Figure 22‑6: Post-Tax IRR, Base Case, 10% Gold and 30% Silver Royalty
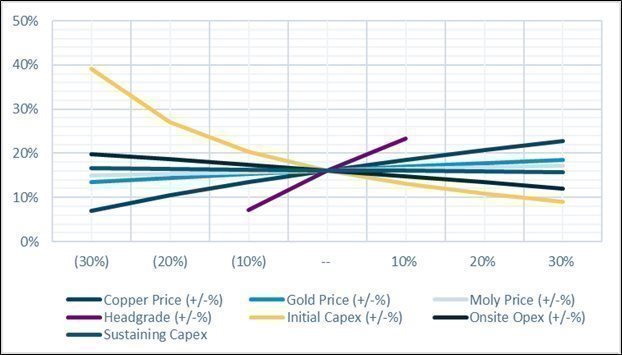
Note: Prepared by NDM, 2023.
| Pebble Project | Page 314 |
| NI 43-101 Technical Report Update and Preliminary Economic Assessment | August 21, 2023 |
|
|
|
|
|
|
22.8.1 Copper and Gold Price Sensitivity Analysis
Metal price sensitivity analysis was completed to determine the effects of copper and gold price on the Base Case project IRR and NPV at a 7% discount rate. The copper price was varied from $2.90/lb to $4.90/lb and the gold price was varied from $1,300/oz to $2,100/oz, while holding all other variables constant. The results of this scenario can be found in Table 22-15. The long-term metal prices are bolded in Table 22-17.
Table 22‑15: Metal Price Scenarios, Proposed Project Base Case, 10% Gold / 30% Silver Royalty
| IRR, Post-Tax % | Copper Price ($/lb) |
|||||||||
| 2.90 | 3.15 | 3.40 | 3.65 | 3.90 | 4.15 | 4.40 | 4.65 | 4.90 |
||
| Gold Price ($/oz) | 1,300 | 5.1 | 7.4 | 9.3 | 11.1 | 12.8 | 14.4 | 15.8 | 17.2 | 18.5 |
| 1,400 | 6.6 | 8.8 | 10.8 | 12.6 | 14.3 | 15.9 | 17.3 | 18.7 | 20.1 |
|
| 1,700 | 8.6 | 10.7 | 12.7 | 14.5 | 16.2 | 17.7 | 19.2 | 20.6 | 21.9 |
|
| 1,900 | 10.7 | 12.8 | 14.7 | 16.5 | 18.2 | 19.7 | 21.2 | 22.6 | 24.0 |
|
| 2,100 | 12.9 | 14.9 | 16.9 | 18.7 | 20.4 | 22.0 | 23.5 | 24.9 | 26.3 |
|
| NPV7, Post-Tax $Billions | Copper Price ($/lb) |
|||||||||
| 2.90 | 3.15 | 3.40 | 3.65 | 3.90 | 4.15 | 4.40 | 4.65 | 4.90 |
||
| Gold Price ($/oz) | 1,300 | (0.4) | 0.1 | 0.6 | 1.1 | 1.5 | 2.0 | 2.5 | 2.9 | 3.4 |
| 1,500 | (0.1) | 0.4 | 0.9 | 1.4 | 1.8 | 2.3 | 2.8 | 3.2 | 3.7 |
|
| 1,700 | 0.3 | 0.8 | 1.3 | 1.8 | 2.2 | 2.7 | 3.1 | 3.6 | 4.0 |
|
| 1,900 | 0.7 | 1.2 | 1.7 | 2.2 | 2.6 | 3.1 | 3.5 | 4.0 | 4.4 |
|
| 2,100 | 1.2 | 1.6 | 2.1 | 2.5 | 3.0 | 3.5 | 3.9 | 4.3 | 4.8 |
|
22.8.2 Sensitivity Analysis to Changes in Capital Costs
The full capital cost excludes the assumptions regarding infrastructure development partners and precious metal streaming partners. The economic results for the Full Capital with consideration of only the partial royalty arrangement are not materially different than for the full royalty subscription, therefore only results for the full royalty subscription are presented below. A summary of the pre-tax and post-tax financial results for the Full Capital, which exclude the assumptions regarding infrastructure development partners and precious metal streaming partners, is provided in
Table 22-16, Figure 22-7 and Figure 22-8.
| Pebble Project | Page 315 |
| NI 43-101 Technical Report Update and Preliminary Economic Assessment | August 21, 2023 |
|
|
|
|
|
|
Table 22‑16: Proposed Project Full Capital Case Pre-Tax Financial Results
| Description | Units | Full Capital, 10% Gold / 30% Silver Royalty |
| Recovered Metal Value |
||
| Copper | $M | 23,998 |
| Gold | $M | 11,521 |
| Molybdenum | $M | 3,744 |
| Silver | $M | 575 |
| Rhenium | $M | 312 |
| Total Recovered Metal Value | $ M | 40,150 |
| Off-Site Operating Costs |
||
| Refining and treatment Charges, Penalties, Insurance, Marketing and Representation & Concentrate Transportation | $M | 2,927 |
| On-Site Operating Costs |
||
| Open Pit | $/ton milled | 1.97 |
| Process | $/ton milled | 4.99 |
| Transportation | $/ton milled | 1.35 |
| Environmental | $/ton milled | 0.60 |
| G&A | $/ton milled | 0.97 |
| Infrastructure Lease | $/ton milled | - |
| Total Operating Cost | $/ton milled | 9.88 |
| Capital Expenditure |
||
| Initial Capital | $M | 6,773 |
| Add: Pre-production Reclamation Funding | $M | 230 |
| Less: Outsourced Infrastructure | $M | - |
| Less: Pre-production proceeds from gold stream partner | $M | - |
| Initial Capital Investment during Construction | $M | 7,002 |
| Sustaining Capital | $M | 1,293 |
| Financial Summary |
||
| Pre – Tax Undiscounted Cash Flow | $M | 15,257 |
| Pre – Tax NPV at 7% | $M | 3,290 |
| Pre – Tax IRR | % | 12.3 |
| Pre – Tax Payback Period | Years | 6.0 |
| Cash Cost (Co-Product Basis) | $/lb CuEq | 1.56 |
| All-in Sustaining Cost (Co-Product Basis) | $/lb CuEq | 1.79 |
| Mining Taxes & Government Royalties | $M | 1,690 |
| Corporate Income Tax | $M | 2,495 |
| Post – Tax Undiscounted Cash Flow | $M | 11,072 |
| Post – Tax NPV at 7% | $M | 1,831 |
|
Post – Tax IRR | % | 10.3 |
| Post – Tax Payback Period | years | 6.3 |
| Pebble Project | Page 316 |
| NI 43-101 Technical Report Update and Preliminary Economic Assessment | August 21, 2023 |
|
|
|
|
|
|
Figure 22‑7: Post-Tax Sensitivity Analysis, Full Capital Case, 10% Gold and 30% Silver Royalty
 \
\
Note: Prepared by NDM, 2023.
Figure 22‑8: Post-Tax IRR, Full Capital Case, 10% Gold and 30% Silver Royalty
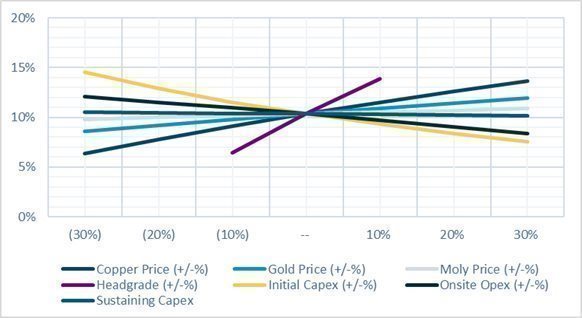
Note: Prepared by NDM, 2023.
| Pebble Project | Page 317 |
| NI 43-101 Technical Report Update and Preliminary Economic Assessment | August 21, 2023 |
|
|
|
|
|
|
22.8.3 Potential Expansions
22.8.3.1 Introduction
The proposed project would extract slightly more than 10% of the Pebble mineral resource. During the NEPA process, the USACE issued a request for information (RFI) to Pebble Partnership to provide an evaluation of a possible expanded project. Pebble Partnership’s response to the RFI described a case that would expand to 250,000 tons per day in Year 21.
The 2023 PEA tests the sensitivity of the project to such an expansion by evaluating three potential expansions based on the RFI response. One of these expansions was that envisioned in the RFI response, the other two would see the project expand to 270,000 tons per day in Year 5 and in Year 10. All three potential expansions incorporate an open pit extracting 8.6 B tons of mineralized material.
Prior to preparation of the permit submission in December 2017, evaluation of the Pebble Project had incorporated a process plant component designed for secondary gold recovery from the pyritic tails. Such a plant demonstrated gold recovery could be increased but it was not included in the permit submission. The 2023 PEA also tests the sensitivity of the Project to adding a secondary gold recovery plant in Year 5 to the Base Case and the three potential expansions.
Potential extension of the mine life and expanded production capacity is predicated on measured, indicated, and inferred mineral resources that have been identified and defined by the drilling programs to date. Any potential expansion would require additional analysis, engineering, and environmental assessment prior to it moving forward and any expansion would be required to undergo federal and state permitting prior to its implementation.
The potential expansions assess extraction of a portion of the overall deposit. Additional resource and deeper high-grade intersections outside the resource boundary create a potential opportunity for future development of an underground mine. Furthermore, replacing the expanded open pit, or a portion of it, with an underground mine may demonstrate acceptable financial results with a reduced project footprint. Additional assessment of this option is warranted to confirm the relative economics of an underground mine and define its environmental footprint. However, no underground option has been included as an alternative scenario.
The expansions envisioned in the 2023 PEA are preliminary in nature and include inferred mineral resources that are considered too speculative geologically to have the economic considerations applied to them that would enable them to be categorized as mineral reserves. There is no certainty that the 2023 PEA results, including the potential expansions, will be realized. Mineral resources that are not mineral reserves do not have demonstrated economic viability.
22.8.3.2 Potential Expansions
Mining and recovery methods for the throughput expansions are similar to those presented for the proposed project as described in Sections 16 and 17. An expanded open pit design was developed with parameters similar to those used to design the open pit for the proposed project. The same open pit design was used for all three expansion scenarios, with the differences in forecast and mine life dependent on the timing of the expansion. The volume of mineralized material, the grades of that material, and the volume of waste rock for the expanded open pit, along with a comparison to the proposed project open pit, are shown in Table 22-17.
Production data includes all production, whether payable in the spot market under the Royalty Agreement to third party metal stream partners, or payable as a smelter deduction.
| Pebble Project | Page 318 |
| NI 43-101 Technical Report Update and Preliminary Economic Assessment | August 21, 2023 |
|
|
|
|
|
|
Table 22‑17: Potential Expansion Scenario Metrics
| Description | Unit | Proposed Project | Potential Expansions |
| Mineralized Material | B tons | 1.3 | 8.6 |
| CuEq1 | % | 0.57 | 0.72 |
| Copper | % | 0.29 | 0.39 |
| Gold | oz/ton | 0.009 | 0.01 |
| Molybdenum | ppm | 154 | 208 |
| Silver | oz/ton | 0.042 | 0.046 |
| Rhenium | ppm | 0.28 | 0.36 |
| Waste | B tons | 0.2 | 14.4 |
| Open Pit Strip Ratio |
| 0.12 | 1.67 |
| Metal Production (LOM) |
|||
| Copper | Mlb | 6,400 | 60,400 |
| Gold (in Cu Concentrate) | koz | 7,300 | 50,500 |
| Silver (in Cu Concentrate) | koz | 37,000 | 267,000 |
| Gold (in Gravity Concentrate) | koz | 110 | 782 |
| Molybdenum | Mlb | 300 | 2,900 |
| Rhenium | 1000 kg | 200 | 2,000 |
The expansions would use an elevated cut-off grade while the open pit is mined, with lower-grade material to be stockpiled and fed to the plant after the open pit has been exhausted. Lower-grade stockpiles and waste rock facilities could be located northeast and south of the open pit, together with additional water management and treatment facilities.
The year in which the expanded process plant begins operation provides the designation for each potential expansion. Expanded open pit mining would occur several years in advance of this to prepare for the expanded process plant capacity. The mining rate would increase to accommodate the increased throughput and higher strip ratio, thus requiring additional mining equipment. The expanded open pit mine would also utilize in-pit crushing and conveying to reduce costs.
The same design criteria as were applied to the proposed project were utilized to develop a plan for the expanded process plant. All expansions would utilize increased mineralized material handling capacity and a third processing line with similar equipment as employed in the proposed project.
The expansions would also require additional infrastructure components. The accommodations complex and related facilities would be expanded to house the increased workforce. The site footprint would expand, necessitating additional water management facilities. The basis of the water management requirements was similar to that envisioned for the proposed project. Additional tailing’s facilities locations would be selected to handle the additional volumes. As with the proposed project, the bulk and pyritic tailings would be stored in separate facilities. Tailings would be directed to the open pit during the stockpile reclaim phase and the accumulated pyritic tailings would be returned to the open pit, as is the case with the proposed project.
The water management plan for each expansion was developed based on the same data used to determine water quality and quantities for the proposed project and adapted to suit the expanded footprint and timing of the expansions. Similar criteria for water handling and treatment were applied and the same water discharge criteria formed the basis of the water treatment scenarios.
| Pebble Project | Page 319 |
| NI 43-101 Technical Report Update and Preliminary Economic Assessment | August 21, 2023 |
|
|
|
|
|
|
The estimated power demand would increase to 404 MW, necessitating an increase in the mine site power plant size. The capacity of the natural gas line would be increased through minor pipeline expansions on the Kenai Peninsula and installation of a second compressor station at the marine terminal.
Since all potential expansions assume the designs and permitting would follow the construction and initial operation of the proposed project, the initial capital for all would be the same. The sustaining capital and operating costs were developed for each scenario. The methodology for estimating the capital and operating costs for the potential expansion scenarios are the same as described in Section 21. The variations in both capital and operating costs for each expansion scenario are driven primarily by the timing of the implementation, and to a lesser extent by amount of pre-stripping, waste disposal, and water management activities for both the open pit mine as well as the TSFs.
The economic analysis methodology, inputs to cash flow model and tax considerations are as described in Section 22; however, in this section only the assumptions regarding third-party ownership of key transportation and power infrastructure and gold streaming were applied.
The closure concepts for the potential expansion scenarios are similar to those envisioned in the proposed project, with the exception that reclamation of the initial bulk TSF commences when that facility reaches capacity and a second bulk TSF is put into use. In addition, in all the potential expansion scenarios, the process plant is fed from stockpiles after mining ceases, during which period the reclamation of the second bulk TSF and pyritic TSF commences. The estimated closure costs for the potential expansion scenarios, including water treatment associated with the closed bulk TSF, range between $6.0 B and $6.2 B, depending on the potential expansion scenario. Approximately 70% of these closure costs are scheduled for completion prior to the cessation of operations. At cessation of operations, the reclamation trust value is estimated to be $1.7 to $2.0 B. Subsequent closure costs after cessation of operations are estimated to range between $1.6 B and $2.1 B. The estimated post-closure water treatment costs range between $53 M and $67 M per year, requiring a residual reclamation trust balance of $1.3 B to $1.7 B.
The financial results for the potential expansion scenarios are shown in Table 22-18. Table 22-18 shows only the results assuming full subscription of the five royalty tranches.
Table 22‑18: Potential Expansion Scenario Financial Results
| Description | Units | Year 5 Expansion | Year 10 Expansion | Year 21 Expansion |
| Net Smelter Return | $M | 312,780 | 312,360 | 312,570 |
| Operating Costs | $M | 125,110 | 119,470 | 124,050 |
| Total Capital Costs1 | $M | 26,850 | 26,830 | 27,430 |
| Initial Capital Costs | $M | 4,132 | 4,132 | 4,132 |
| Expansion Costs | $M | 4,404 | 4,324 | 4,974 |
| Sustaining Costs | $M | 18,314 | 18,377 | 18,332 |
| Post – Tax Undiscounted Cash Flow | $M | 110,770 | 114,970 | 111,800 |
| Post – Tax NPV at 7% | $M | 8,570 | 7,520 | 5,500 |
| Post – Tax IRR | % | 22.0 | 20.0 | 18.1 |
Note:
1. Capital cost includes the initial development cost (base case) plus the cost of the expansions.
2. Values are rounded to zero decimal place.
| Pebble Project | Page 320 |
| NI 43-101 Technical Report Update and Preliminary Economic Assessment | August 21, 2023 |
|
|
|
|
|
|
22.8.3.3 Gold Plant Addition
An on-site gold production plant was evaluated to add value to the proposed project and the potential expansions. Relevant mineral processing and metallurgical testing results are presented and discussed in Section 13 of this report.
While the gold plant additions utilize the metallurgical testwork results for a specific gold recovery technology, other technologies may be applicable for the Pebble deposit. Further, the addition of a gold plant under any case will require additional testwork and engineering and will require the receipt of pertinent federal and state permits prior to implementation.
The on-site gold plant is designed to process a pyrite concentrate in conjunction with the gravity concentrate to produce a precious metal doré. The production forecasts for the proposed project and three potential expansions with the gold plant are shown in Table 20-19. The financial results are shown in Table 20-20.
Table 22‑19: Summary of Gold Plant Scenarios Production Information
| Description | Unit | Proposed Project | Proposed Project + Gold Plant | Expansion Scenarios |
|||
| Year 5 | Year 10 | Year 21 |
|||||
| Concentrate (LOM) |
|||||||
| Copper | Mlb | 6,400 | 6,500 | 61,200 | 61,200 | 61,200 |
|
| Gold (in Cu Concentrate) | koz | 7,300 | 7,300 | 50,500 | 50,500 | 50,400 |
|
| Silver (in Cu Concentrate) | koz | 37,000 | 37,000 | 267,000 | 267,000 | 267,000 |
|
| Molybdenum | Mlb | 300 | 300 | 2,900 | 2,900 | 2,900 |
|
| Rhenium | 1000 kg | 200 | 200 | 2,000 | 2,000 | 2,000 |
|
| Gold Plant (LOM) |
|||||||
| Gold (as Doré) | koz | - | 2,000 | 14,400 | 14,500 | 14,500 |
|
| Silver (as Doré) | koz | - | 2,900 | 22,500 | 22,600 | 22,600 |
|
| Total Production (LOM) |
|||||||
| Gold | koz | 7,400 | 9,300 | 64,900 | 65,100 | 65,000 |
|
| Silver | koz | 37,000 | 39,500 | 289,000 | 289,000 | 289,000 |
|
| Pebble Project | Page 321 |
| NI 43-101 Technical Report Update and Preliminary Economic Assessment | August 21, 2023 |
|
|
|
|
|
|
Table 22‑20: Gold Plant Scenarios Financial Results
| Description | Units | Proposed Project + Gold Plant | Year 5 Expansion | Year 10 Expansion | Year 21 Expansion |
| Net Smelter Return | $M | 38,190 | 338,260 | 337,820 | 338,010 |
| Operating Costs | $M | 19,740 | 136,320 | 130,600 | 135,340 |
| Total Capital Costs1 | $M | 5,640 | 27,100 | 27,170 | 27,750 |
| Initial Capital Costs | $M | 4,150 | 4,150 | 4,150 | 4,150 |
| Expansion Costs | $M | 219 | 4,633 | 4,640 | 5,280 |
| Sustaining Costs | $M | 1,272 | 18,314 | 18,378 | 18,322 |
| Post – Tax Undiscounted Cash Flow | $M | 9,020 | 120,770 | 124,830 | 121,480 |
| Post – Tax NPV at 7% | $M | 2,740 | 10,030 | 8,660 | 6,460 |
| Post – Tax IRR | % | 17.5 | 24.2 | 21.4 | 19.6 |
Note:
1. Capital cost includes the initial development cost (base case) plus the cost of the expansions.
2: Values are rounded to zero decimal place.
| Pebble Project | Page 322 |
| NI 43-101 Technical Report Update and Preliminary Economic Assessment | August 21, 2023 |
|
|
|
|
|
|
23 ADJACENT PROPERTIES
There are no properties adjacent to the project relevant to this report.
|
|
|
| Pebble Project | Page 323 |
| NI 43-101 Technical Report Update and Preliminary Economic Assessment | August 21, 2023 |
|
|
|
|
|
|
|
|
|
24 OTHER RELEVANT DATA AND INFORMATION
This section is not relevant to this report.
| Pebble Project | Page 324 |
| NI 43-101 Technical Report Update and Preliminary Economic Assessment | August 21, 2023 |
|
|
|
25 INTERPRETATION AND CONCLUSIONS
25.1 Introduction
The QPs note the following interpretations and conclusions in their respective areas of expertise, based on the review of data available for this Report.
25.2 Mineral Tenure, Surface Rights, Water Rights, Royalties and Agreements
Information obtained from Northern Dynasty experts supports that the mineral tenure held is valid and is sufficient to support a declaration of mineral resources.
Northern Dynasty currently does not own any surface rights associated with the mineral claims that comprise the Pebble property. All lands are held by the State of Alaska, and surface rights may be acquired from the State government if areas required for mine development have been determined and permits awarded.
Teck holds a 4% pre-payback net profits interest (after debt service), followed by a 5% after-payback net profits interest in any mine production from the Exploration Lands.
The Pebble Partnership has signed an agreement, whereby the royalty holder has the right to receive a portion of the future gold and silver production from the proposed Pebble Project for the life of the mine. The right can be exercised through five tranches, with each tranche providing the royalty holder with the right to 2% of the gold production and 6% of the silver production after accounting for notional payments of $1,500 per ounce of gold and $10 per ounce for silver. The Pebble Partnership will retain a portion of the gold when spot prices exceed $4,000 per ounce of gold or recovery rates exceed 60%. The Pebble Partnership will also retain a portion of the silver when spot prices exceed $50 per ounce of silver and recovery rates 65%. To date, the royalty holder has purchased the first tranche.
The Pebble property is within the Lake and Peninsula Borough and is subject to a 1.5% severance tax. The life-of-mine severance tax payments for the proposed project could total $530 M and range as high as $5.1 B for the life of the Potential Expansion Scenarios with a gold plant.
The Pebble Performance Dividend LLP would distribute a 3% net profits royalty interest in the Pebble Project to adult residents of Bristol Bay villages that have subscribed as participants. The Pebble Performance Dividend would distribute a guaranteed minimum annual payment of US$3 M each year the Pebble mine operates beginning at the outset of project construction. Total life-of-mine payments for the proposed project could total $176 M to $217 M and could range as high as almost $7.0 B for the life of the Potential Expansion Scenarios with a gold plant.
The access corridor is owned by the State of Alaska and two Alaska Native village corporations, with whom Pebble Partnership has completed access agreements.
As summarized in Section 20.6 Pebble Partnership has two ongoing issues related to project permitting.
USACE issued a negative ROD in November 2020, thus denying the project a permit under the CWA. Pebble Partnership appealed that decision and in April 2023, the Review Officer remanded that decision back to the USACE – Alaska District to re-evaluate specific issues. The current deadline is September 26, 2023, for the USACE – Alaska Division to consider the appeal in the context of the EPA’s Final Determination and notify the Pebble Partnership as to how it plans to proceed on remand.
| Pebble Project | Page 325 |
| NI 43-101 Technical Report Update and Preliminary Economic Assessment | August 21, 2023 |
|
|
|
On January 30, 2023, the EPA issued a Final Determination under Section 404(c) of the Clean Water Act to limit the use of certain waters in the Bristol Bay watershed as disposal sites for discharges of dredged or fill material associated with development of the proposed project. Under the Final Determination, the Pebble Project could not be constructed.
The Pebble Partnership has stated it plans to challenge the Final Determination. On July 26, 2023, the State of Alaska filed a Motion for Leave to File a Bill of Complaint against the United States and Michael S. Regan, Administrator of the EPA, in the U.S. Supreme Court. Development of the Pebble Project will require the successful challenge of both the negative ROD and the Final Determination.
25.3 Geology and Mineralization
The Pebble property hosts a significant copper-gold-molybdenum-silver-rhenium deposit. The exploration and drilling programs completed thus far are appropriate to the type of the deposit. The exploration, drilling, geological modeling and research work support the interpreted genesis of mineralization. Mineralization at Pebble is open in several directions and offers the opportunity, with additional drilling, to expand the resource base.
The geological understanding of the settings, lithologies, and structural and alteration controls on mineralization in the different zones is sufficient to support estimation of mineral resources. The geological knowledge of the area is also considered sufficiently acceptable to reliably inform mine planning.
The Pebble property includes a number of opportunities to expand the mineral resource estimate through future exploration. Drill hole 6348 (see Figure 10-3 and Figure 10-5 for location) is a significant drill intersection in the Pebble deposit. It intersected 949 ft of mineralization with an average grade of 1.24% copper, 0.74 g/t gold and 0.042% molybdenum, or 1.92% CuEq, before the hole was lost at a depth of 5,663 ft in the ZG1 Fault. This drill hole and the intersected mineralization lie east of the ZG1 Fault and follow up drilling of the Cretaceous host rocks to this mineralization has not yet been completed, leaving the extent of this high-grade mineralization unknown. This area represents a significant exploration target. Geophysical and geochemical surveys and reconnaissance exploration drilling have identified several targets located well outside the current Pebble resource estimate area that warrant future exploration.
25.4 Exploration, Drilling, and Analytical Data Collection in Support of Mineral Resource Estimation
Extensive core drilling, sampling, and assaying have taken place on the Pebble Project in support of exploration and delineation of the current 2023 MRE. Drill holes are spatially well-distributed and oriented to test the geological and geotechnical conditions, dimensions and grade of the Pebble deposit and mineralization as it is currently known. Several other mineral exploration targets encountered on the property have received less focus and attention and require further investigation to satisfactorily assess their potential. The reliability of the topographic base maps, surveyed drill locations, down-hole positional measurements, and percentage of core recovered by drilling in the Pebble deposit area is deemed acceptable. The proficiency of the density measurements, core logging, sampling, and sub-surface geological interpretation in this area is also considered to be adequate and appropriate for use in support of this report.
A significant amount of due diligence, verification, validation, and QA/QC has been completed on the copper, gold, molybdenum, silver, and rhenium analyses of the Pebble drill core samples. Assaying and check assaying was conducted by well-recognized, independent analytical laboratories. The drilling and sampling programs typically included blanks, duplicates, and standard samples that were submitted at rates that met or exceeded industry-accepted norms. Independent analytical laboratory consultants were engaged, over significant portions of the Pebble deposit area drill programs, to make recommendations and provide timely monitoring and review of the processes, procedures, and results of the sample preparation and analytical laboratories used. These consultants also assessed the effectiveness and outcome of the sampling and analytical QA/QC programs implemented by the project proponents. The extent and coverage of these programs adequately addressed issues of precision, accuracy, and contamination.
| Pebble Project | Page 326 |
| NI 43-101 Technical Report Update and Preliminary Economic Assessment | August 21, 2023 |
|
|
|
Significant due diligence, verification, validation, and QA/QA programs were performed on the Pebble drill hole database and supporting information that attest to its veracity. This work was done to a reasonable and acceptable level in accordance with exploration best practices and industry standards at the time the programs were conducted. In consideration of these factors, the exploration, drilling, sampling, and analytical methods employed are deemed appropriate and acceptable to support the current 2023 MRE.
25.5 Metallurgical Testwork
Metallurgical testwork and associated analytical procedures were appropriate to the mineralization type, appropriate to establish the optimal processing routes, and were performed using samples that are typical of the mineralization styles found within the Pebble deposit.
Samples selected for testing were representative of the various types and styles of mineralization. Samples were selected from a range of depths within the deposits. Sufficient samples were taken so that tests were performed on sufficient sample mass.
Metallurgical testwork from 2011 to 2013 on the Pebble deposit indicates that significant rhenium can be recovered to the bulk copper-molybdenum flotation concentrate and further concentrated into the final molybdenum flotation concentrate. The overall rhenium recovery is determined by the rhenium recovery to the bulk copper-molybdenum concentrate and the separation efficiency of the rhenium into the molybdenum concentrate in the subsequent copper-molybdenum separation stage. The estimated rhenium recovery is 70.8% on average for all the domains.
The testwork results were used for the recovery projections of the mine production plan followed by economic analysis for the life of mine. There are no deleterious elements that have been reported within the copper-gold concentrate.
25.6 Mineral Resource Estimates
The Pebble property hosts a large copper-gold-molybdenum-silver-rhenium deposit. The exploration and drilling programs completed thus far are appropriate to the type of the deposit. The exploration, drilling, geological modeling, and research work support the interpreted genesis of the mineralization and the domaining employed in the resource estimation.
It is the opinion of the QP of this report that the drill database for the Pebble deposit is reliable and sufficient to support the current 2023 MRE.
In the opinion of the QP, the estimates of mineral resources for the Pebble Project conform to industry best practices and meet requirements of the Canadian Institute of Mining and Metallurgy.
Technical factors which may affect the 2023 MRE include changes to the geological, geotechnical and geometallurgical models, infill drilling to convert mineral resources to a higher classification, drilling to test for extensions to known resources, and significant changes to commodity prices. It should be noted that all factors pose potential risks and opportunities, of greater or lesser degree, to the current mineral resource.
| Pebble Project | Page 327 |
| NI 43-101 Technical Report Update and Preliminary Economic Assessment | August 21, 2023 |
|
|
|
Furthermore, the 2023 MRE may ultimately be affected by a broad range of environmental, permitting, legal, title, socio-economic, marketing, and political factors pertaining to the specific characteristics of the Pebble deposit. The QP has reviewed the technical information and other factors that may affect the estimate including permitting and external legal counsel's letter regarding the remand of the negative ROD and Final Determination and believes that there are reasonable prospects of economic extraction.
The current Pebble resource differs from the previously reported resource estimate in that recoverable metal is now reported in the resource table.
Elevated levels of palladium, vanadium, titanium, and tellurium have been noted in raw analytical data and in metallurgical studies. The potential economic contribution of these metals should be assessed.
Currently, 41% of the estimated resource is classified as inferred. The resource used as the basis for a prefeasibility or feasibility study, as defined by NI 43-101, must be classified as measured or indicated. There may be a future requirement to upgrade some portion of the inferred resource to measured or indicated categories through additional drilling. It is likely not necessary or desirable to upgrade all of the inferred resource in the immediate future, but the prioritization of areas to be upgraded should involve an integrated study of future mining and metallurgical objectives.
25.7 Mining Methods
The 2023 PEA is preliminary in nature and included inferred mineral resources that are considered too speculative geologically to have the economic considerations applied to them that would enable them to be categorized as mineral reserves. There is no certainty that the 2023 PEA results will be realized. Mineral resources that are not mineral reserves do not have demonstrated economic viability.
The mining operations are planned to use conventional open pit mining methods and equipment. The open pit mine envisioned for the proposed Pebble Project would be a conventional drill, blast, truck, and shovel operation with an average mining rate of 70 million tons per year and an overall strip ratio of 0.12 tons of waste per ton of mineralized material.
The open pit would be developed in stages, with each stage expanding the area and deepening the previous stage. The final dimensions of the open pit would be 6,800 ft long and 5,600 ft wide, with depths to 1,950 ft.
The mining schedule was generated using five pushbacks and was based on a maximum processing capacity of 180,000 ton/d. Based on the selected ultimate pit, final pit design, and the generated production schedule, the Pebble Project’s total life of mine is 21 years, including one year of pre-stripping followed by 20 years of production.
25.8 Recovery Methods
The designed process to treat mineralized feeds from the project contemplates methods that are conventional and well-proven in the industry. The comminution and recovery processes are used widely in commercial practice, with no significant elements of technological innovation.
The process plant flowsheet design was based on testwork results, previous study designs, and industry standard practices. Furthermore, the testwork results support the recovery projections used in the economic analysis.
| Pebble Project | Page 328 |
| NI 43-101 Technical Report Update and Preliminary Economic Assessment | August 21, 2023 |
|
|
|
The mineralized material would be processed to produce three saleable products: a copper-gold flotation concentrate, a molybdenum flotation concentrate, and a precious metals gravity concentrate, all of which are expected to contain low levels of impurity elements and as such, readily marketable to several third-party refiners.
25.9 Infrastructure
The project is located in an area of Alaska that has minimal development and would require construction of both on-site and off-site infrastructure to support construction and operations. Principal off-site infrastructure would include a marine terminal facility, along with corresponding power generation and shop facilities, a natural gas pipeline supplying both port and mine sites, all-weather access road to site including multiple water crossings and a ferry crossing of Iliamna Lake. Major on-site infrastructure would include, power generation facilities, power reticulation, site roads, process and administration buildings, truck shop, warehouse, and change houses. The project site would also include tailings and waste rock storage facilities, water ponds, water management structures, and water treatment facilities. Both temporary and permanent worker accommodations would also be established at the project.
Natural gas-fired power plants would be constructed at both the mine site and the marine terminals. The natural gas for power generation would be provided by local supply on the east side of Cook Inlet and would require a compressor station. The pipeline would originate near Anchor Point, cross Cook Inlet to a location near Amakdedori, then be buried in the access road to the south ferry terminal on Iliamna Lake, then cross Iliamna Lake to Newhalen. From Newhalen, it would be buried parallel to existing roadways to the intersection with the access road alignment and from there buried parallel to the access road to the mine site.
The transportation infrastructure would consist of a marine terminal facility located in Kamishak Bay near Amakdedori, and a ferry crossing of Iliamna Lake, and a permanent access road from the mine to Iliamna Lake and from Iliamna Lake near Kokhanok to the marine terminal.
Waste and water management at the Pebble Project would be an integrated system designed to safely contain these materials, to facilitate water treatment and discharge, and to provide adequate process water to support the operations. The design of these facilities incorporates a significant climate record, extensive site investigation, and a number of features intended to ensure safe operation.
The water management strategy for the project uses water from within the project area to the maximum practical extent. Contact water (mine drainage and process water) from the mine site would be collected and managed using various water management facilities. Mine drainage is defined as groundwater or surface runoff that has come into direct contact with mining infrastructure and requires treatment at the water treatment plants to meet discharge water quality standards prior to discharge to the environment.
The proposed project incorporates a sophisticated water management plan with water collection, treatment, and discharge. That plan requires attention to the annual and seasonal variability of the incoming and receiving flows and achieving very specific water quality standards for the released water. Temporary water treatment facilities would be in place during construction, followed by three WTPs during the operations and closure phases of the project.
25.10 Environmental, Permitting, Closure and Social
Northern Dynasty began a field study program in 2004 to characterize the existing physical, chemical, biological and social environments in the Bristol Bay and Cook Inlet areas where the Pebble Project might occur. The Pebble Partnership compiled the data for the 2004 to 2008 study period into a multi-volume EBD. SEBD reports incorporated data collected from the period from 2009 to 2012. Additional monitoring data collected through 2019 was provided to USACE in support of the ongoing permitting process.
| Pebble Project | Page 329 |
| NI 43-101 Technical Report Update and Preliminary Economic Assessment | August 21, 2023 |
|
|
|
The major environmental pathways include air, water, and terrestrial resources. During the preliminary stages of the Pebble Project, Northern Dynasty identified key environmental issues and design drivers that have formed the basis of baseline data collection, environmental and social analysis and continuing stakeholder consultations influencing the Pebble Project design. The effects assessment has confirmed these as important issues and design drivers and has identified mitigation measures for each.
Pebble Partnership filed a CWA 404 permitting application with USACE on December 22, 2017. USACE confirmed that Pebble’s permitting application was complete in January 2018 and an Environmental Impact Statement (EIS) is required to comply with its review of the Pebble Project according to the National Environmental Policy Act (NEPA). The NEPA EIS process included a comprehensive ‘alternatives assessment’ that considered a broad range of development alternatives. The project design and operating parameters for the Pebble Project and associated infrastructure reflects the LEDPA in the FEIS published by USACE in July 2020. The FEIS concluded that there would be no measurable change to the commercial fishing industry including prices and that there would be a number of positive socioeconomic impacts on local communities.
USACE formally advised the Pebble Partnership by letter dated August 20, 2020, that it had made preliminary factual determinations under Section 404(b)(1) of the CWA that the Pebble Project as proposed would result in significant degradation to aquatic resources. In connection with this preliminary finding of significant degradation, USACE formally informed the Pebble Partnership that in-kind compensatory mitigation within the Koktuli River watershed would be required to compensate for all direct and indirect impacts caused by discharges into aquatic resources at the mine site. USACE requested the submission of a new compensatory mitigation plan to address this finding within 90 days of its letter.
In response, the Pebble Partnership developed a compensatory mitigation plan (CMP) to align with the requirements outlined by USACE. This plan envisioned creation of a 112,445-acre Koktuli Conservation Area on land belonging to the State of Alaska in the Koktuli River watershed downstream of the project. The objective of the preservation of the Koktuli Conservation Area was to allow the long-term protection of a large and contiguous ecosystem that contains valuable aquatic and upland habitats. If adopted, the Koktuli Conservation Area would preserve 31,026 acres of aquatic resources within the ‘aquatic resource of national importance’-designated Koktuli River watershed. The proposed conservation area was selected to protect and preserve physical, chemical, and biological functions found to be important during the project review. Preservation of the Koktuli Conservation Area was designed to minimize the threat to, and prevent the decline of, aquatic resources in the Koktuli River watershed resulting from potential future actions, with the objective of ensuring the sustainability of fish and wildlife species that depend on these aquatic resources, while protecting the subsistence lifestyle of the residents of Bristol Bay and commercial and recreational sport fisheries. The plan was submitted to USACE on November 4, 2020.
On November 25, 2020, USACE issued a ROD rejecting Pebble Partnership’s permit application. The ROD rejected the CMP as “non-compliant” and determined the project would cause “significant degradation” and be contrary to the public interest. Accordingly, USACE rejected Pebble Partnership’s permit application.
The Pebble Partnership submitted its request for appeal of the ROD on January 19, 2021. The request for appeal reflects the Pebble Partnership’s position that USACE's ROD and permitting decision – including its significant degradation finding, its public interest review findings, and its rejection of Pebble's CMP – are contrary to law, unprecedented in Alaska, and unsupported by the administrative record, in particular the Pebble Project FEIS. The specific reasons for appeal asserted by the Pebble Partnership include: (i) the finding of “significant degradation” by USACE is contrary to law and unsupported by the record; (ii) USACE’s rejection of the CMP is contrary to USACE regulations and guidance, including the failure to provide the Pebble Partnership with an opportunity to correct the alleged deficiencies; and, (iii) the determination by USACE that the Pebble Project is not in the public interest is contrary to law and unsupported by the public record.
| Pebble Project | Page 330 |
| NI 43-101 Technical Report Update and Preliminary Economic Assessment | August 21, 2023 |
|
|
|
In a letter dated February 24, 2021, USACE confirmed the Pebble Partnership’s RFA is "complete and meets the criteria for appeal." USACE appointed a review officer to oversee the administrative appeal process. On April 25, 2023, the USACE issued its appeal decision, remanding the permit back to the USACE – Alaska District to re-evaluate specific issues. The remand included a deadline of June 9, 2023, for the USACE – Alaska District to consider the impacts of the EPA’s Final Determination, as described below, and notify the Pebble Partnership of how it plans to proceed on remand. The Alaska District has requested four extensions to that deadline, with the latest extension to September 26, 2023.
On September 9, 2021, the EPA announced they planned to reinitiate the process of making a CWA Section 404(c) determination for the waters of Bristol Bay, which would set aside the 2019 withdrawal of that action that was based on a 2017 settlement agreement between the EPA and Pebble Partnership and supported by the results of the FEIS. On January 30, 2023, the EPA issued a Final Determination under Section 404(c) of the Clean Water Act to limit the use of certain waters in the Bristol Bay watershed as disposal sites for discharges of dredged or fill material associated with development of the proposed project. The EPA determined that certain discharges associated with developing the project would have “unacceptable adverse effects” on the salmon fishery in the Bristol Bay watershed. The Final Determination establishes a “defined area for prohibition” coextensive with the current mine plan footprint which prohibits the disposal of dredged or fill material for the Pebble Project and would also establish a 309-square-mile “defined area for restriction.”
On July 26, 2023, the State of Alaska filed a Motion for Leave to File a Bill of Complaint against the United States and Michael S. Regan, Administrator of the EPA, in the U.S. Supreme Court. The State’s Motion requests that the Supreme Court exercise its original jurisdiction to hear its dispute. The Complaint asserts three causes of action, seeking an order that the Final Determination be vacated or declared unenforceable, or in the alternative, seeking damages for breach of contract and just compensation for the taking of the State’s property.
Depending on the outcome of the above, the company and the Pebble Partnership may seek judicial review of the Final Determination in an appropriate United States federal district court. While the Final Determination concludes EPA’s administrative process, it is only the initial trigger in the judicial review process. If successful in overturning the agency’s action, the Pebble Partnership could continue to pursue any state or federal permits necessary to develop the resource.
In addition to the USACE permits, the project will require federal permits from the U.S. Coast Guard, the Bureau of Environmental Enforcement, the National Marine Fisheries Service, and the U.S. Fish and Wildlife Service, in addition to many other federal authorizations. There is no certainty that these federal and State permits and authorizations will be granted.
Numerous environmental permits and plans will also be required by various State and local agencies. The Pebble Partnership will work with applicable permitting agencies and the State of Alaska’s large mine permitting team to provide complete permit applications in an orderly manner. There is no certainty that these federal permits and authorizations will be granted.
In November 2014, Alaskan voters approved the Bristol Bay Forever public initiative. Based on that initiative, development of the Pebble Project requires legislative approval upon securing all other permits and authorizations.
25.11 Markets and Contracts
The Pebble Project would produce copper-gold and molybdenum concentrates. The copper-gold concentrate would be trucked via purpose-built containers from the mine site to the marine terminal where they would be loaded onto transshipment barges, and then unloaded directly into the holds of Handysize bulk carriers for shipment to smelter customers in Asia and Europe. The molybdenum concentrate would be filtered at the mine site and placed in large sacks which are in turn placed in conventional shipping containers. The containers would be trucked to the port and shipped to refineries located outside Alaska. Other economically valuable minerals (gold, silver, and palladium in the copper-gold concentrate and rhenium in the molybdenum concentrate) would be present in the concentrates.
| Pebble Project | Page 331 |
| NI 43-101 Technical Report Update and Preliminary Economic Assessment | August 21, 2023 |
|
|
|
The copper-gold concentrate is expected to be marketed in China, Japan, India, Korea, and Europe. The molybdenum concentrate market is expected to be sold principally into in Asia.
For copper-gold concentrate ocean transportation costs are assumed to be $50 per wet tonne and concentrate moisture content was assumed to be 8%. For molybdenum concentrate ocean transportation costs are assumed to be $171 per wet tonne and concentrate moisture content was assumed to be 5%.
As of the report’s effective date, no contracts for supply of reagents and consumables, shipping or tolling of products have been entered into.
25.12 Capital and Operating Costs
The total estimated initial capital cost for the design, construction, installation, and commissioning of the Pebble Project is $6.77 B, which includes all direct, indirect, Owner’s and contingency costs. Capital costs estimated here are well aligned with the publicly reported costs other constructed projects of similar scale and complexity.
Sustaining capital investment in the project over the 20-year mine life is limited to TSF improvements, and replacement of mobile equipment for mining and road maintenance. These life cycle costs are applied in the financial model on a year-by-year basis, with a cumulative total of $1.29 B including indirect, Owner’s, and contingency costs.
Mine closure and reclamation costs are not included in the capital or operating costs but are factored into the financial model to account for site decommissioning and long-term water treatment plant operations.
The average annual operating cost for the project, is estimated to be US$900.3 M per year over the proposed 20-year life. This equates to US$13.95/ton milled, based on the 180,000 ton/day plant capacity.
25.13 Economic Analysis
The economic analysis of the proposed project, under both the Base Case and the sensitivity Full Capital Case demonstrate the Pebble Project can achieve a positive return on investment. Based on the assumptions and parameters in this report, the PEA shows a US$ 2.24 B post-tax NPV and 16.2% post-tax IRR for the Base Case.
Financial results for the project are most sensitive to copper price, gold price and head grade of the mineralized feed material.
25.14 Potential Expansions
Selected expansions were evaluated in the 2023 PEA to provide a view into potential longer-term outcomes that could be achieved by the Pebble Project. These demonstrate a robust, long-life project which could supply metals important for the U.S. economy for decades. Future analysis would optimize these opportunities. Of note, any future potential expansion must be subjected to Federal and State permitting processes prior to advancing.
| Pebble Project | Page 332 |
| NI 43-101 Technical Report Update and Preliminary Economic Assessment | August 21, 2023 |
|
|
|
25.15 Risks and Opportunities
25.15.1 Risks
25.15.1.1 Mineral Resource
| · | The 2023 PEA includes the use of inferred mineral resources that are considered too speculative geologically to have the economic considerations applied to them that would enable them to be categorized as mineral reserves. There is no certainty that the 2023 PEA results will be realized. |
|
|
|
| · | The 2023 MRE may ultimately be affected by a broad range of environmental, permitting, legal, title, socio economic, marketing, and political factors pertaining to the specific characteristics of the Pebble deposit (including its scale, location, orientation and polymetallic nature) as well as its setting (from a natural, social, jurisdictional and political perspective). |
|
|
|
| · | Factors that may affect the 2023 MRE include: |
|
|
|
| · | changes to the geological, geotechnical, and geometallurgical models as a result of additional drilling or new studies; |
|
|
|
| · | the discovery of extensions to known mineralization as a result of additional drilling; |
|
|
|
| · | changes to the rhenium: molybdenum correlation coefficients and resultant regression equation due to additional drilling; |
|
|
|
| · | changes to commodity prices resulting in changes to the test for reasonable prospects for eventual economic extraction; and |
|
|
|
| · | changes to the metallurgical recoveries resulting in changes to the test for reasonable prospects for eventual economic extraction. |
Mineral resources that are not mineral reserves do not have demonstrated economic viability.
The risk is the inferred resources are not realized and thus the PEA economics will be affected.
The mineral resource estimates contained have not been adjusted for any risk that the required environmental permits may not be obtained for the project. The uncertainty associated with the ability of the project to obtain required environmental permits is a risk to the reasonable prospects for Eventual Economic Extraction of the mineralization and the classification of the estimate as a mineral resource.
25.15.1.2 Mining Methods
| · | Pit wall slopes: The pit wall slope assessments were completed to a prefeasibility level of confidence. Additional field work and analysis are required to confirm these designs for operations. The pit wall slopes may flatten and impact the tonnes moved if further geotechnical investigation reveals less competent ground conditions. |
25.15.1.3 Recovery Methods
| · | Process recoveries: The metallurgical testwork completed on the Pebble deposit has been extensive but additional work is required to complete a feasibility study and designs recoveries for payable metals are not achieved. If the recoveries identified in the PEA are not demonstrated, the project economics will be negatively impacted. If required, additional reagents will increase operating costs. |
| Pebble Project | Page 333 |
| NI 43-101 Technical Report Update and Preliminary Economic Assessment | August 21, 2023 |
|
|
|
| · | Deleterious elements: The metallurgical testwork highlighted the low levels of impurity elements in the Pebble feed materials and correspondingly low deportment to saleable products, and likewise the process plant design incorporated no special treatment steps to manage impurities in the feed. There is a risk that pockets of the Pebble deposit will contain elevated levels of deleterious elements that could report to the concentrates products at levels which could incur penalty charges or adversely influence the saleability of the products. Operational controls could avoid these potential impacts. |
25.15.1.4 Tailings and Water Management
| · | Tailings structures designs: The tailings and water management pond structures designs have been completed to a preliminary level. Significant additional field data and design are required to prepare these structures for construction. |
|
|
|
| · | Alaska dam permitting: The tailings and water management structures will be subject to an extensive design review and permitting process in Alaska. The process could result in changes to the designs. |
|
|
|
| · | Groundwater: Additional field work and analysis are required to confirm specific design criteria for open pit wall and tailings structures. |
25.15.1.5 Natural Gas Supply
| · | Natural gas: Natural gas has provided heating and electrical energy in southcentral Alaska for more than five decades. While there are indications of additional natural gas resources to be defined in the area, exploration must be completed to confirm these resources and to bring them into production. If this work does not proceed within an adequate timeframe to meet the Pebble development schedule or the efforts are not successful at developing new resources, the project would have to rely on the import of liquified natural gas (LNG). There are significant global sources of LNG and while its import is technically feasible, the price of LNG and the cost of installing and operating re-gas facilities could increase the capital and operating cost estimates. |
25.15.1.6 Environmental and Permitting
| · | The Pebble Project is the subject of significant public opposition, in Alaska and elsewhere in the United States. The ability for the Pebble Project to gain necessary regulatory approvals may be negatively impacted by this opposition. |
|
|
|
| · | Northern Dynasty is party to several class action legal complaints and Pebble Partnership is subject to a government investigation regarding public statements made regarding the project. While these matters do not directly affect the development of the project, they could negatively impact Northern Dynasty’s and the Pebble Partnership’s ability to finance the development of the project or the ability to obtain required permitting. |
|
|
|
| · | On January 30, 2023, the EPA issued the Final Determination under Section 404(c) of the CWA, imposing limitations on the use of certain waters in the Bristol Bay watershed as disposal sites for certain discharges of dredged or fill material associated with development of a mine at the Pebble deposit. The Final Determination establishes a “defined area for prohibition” coextensive with the current mine plan footprint in which the EPA would prohibit the disposal of dredged or fill material for the Pebble Project. The Final Determination also establishes a 309-square-mile “defined area for restriction” that encompasses the area of the Pebble Project. The Pebble Partnership believes that there are numerous legal and factual flaws in the Final Determination. The Final Determination may be challenged in an appropriate U.S. federal district court. Even if the appeal of the Record of Decision is successful (see 12.15.2.8 below), there is no assurance that any challenge by the Pebble Partnership to the EPA’s Final Determination will be successful. |
| Pebble Project | Page 334 |
| NI 43-101 Technical Report Update and Preliminary Economic Assessment | August 21, 2023 |
|
|
|
| · | In November 2020, USACE denied Pebble Partnership’s permit application. That decision was appealed. On April 25, 2023, the USACE Pacific Ocean Division issued its Administrative Appeal Decision and remanded the permit decision back to the USACE – Alaska District to re-evaluate specific issues raised in the appeal. As a result of the remand decision, and in light of the EPA’s Final Determination, the District was instructed to review the appeal decision and notify the parties how it planned to proceed within 45 days of the remand issuance. The Alaska District has requested and received four extensions to this deadline. The current deadline is September 26, 2023. The proposed project cannot proceed unless and until the ROD is overturned and all necessary permits, including the CWA 404 Permit, are obtained. There is no certainty that these permits will be obtained. |
|
|
|
| · | Bristol Bay Forever: The Bristol Bay Forever was a public initiative approved by Alaskan voters in November 2014. Based on that initiative, development of the Pebble Project requires legislative approval upon securing all other permits and authorizations. The Project will not be able to proceed if it fails to receive this approval. |
25.15.1.7 Economic Analysis
| · | Cost estimates: The cost estimates contained in the 2023 PEA are completed to a preliminary level. Additional analysis and engineering are required to confirm these results. There is a risk that actual costs incurred vary from those estimated herein. |
|
|
|
| · | Metal prices and realization costs: Metal prices and realization costs are subject to significant fluctuation, particularly over the periods identified for the proposed project and potential expansion scenarios. These fluctuations may have a significant impact on the financial results of future studies and the actual results achieved by an operating mine. |
|
|
|
| · | The project is subject to taxation at three government levels (local, State, and Federal). These tax regimes may change over time resulting in different results than those identified in the 2023 PEA. |
25.15.2 Opportunities
25.15.2.1 Mineral Resource
| · | The Pebble property includes a number of opportunities to expand the mineral resource estimate through future exploration. The most significant opportunity is obtained in drill hole 6348 which intersected 949 ft with an average grade of 1.24% copper, 0.74 g/t gold, and 0.042% molybdenum, or 1.92% CuEq. This drill hole lies east of the ZG1 Fault and follow up drilling of the Cretaceous host rocks to this mineralization has not yet been completed, thereby leaving the extent of this high-grade mineralization unknown. |
|
|
|
| · | Geophysical and geochemical surveys and reconnaissance exploration drilling have identified several targets located well outside the current Pebble resource estimate area that warrant future exploration. |
|
|
|
| · | Elevated levels of palladium, vanadium, titanium, and tellurium have been noted in raw analytical data and in metallurgical studies and represent opportunities to further benefit the economics of the Pebble deposit. |
25.15.2.2 Mining Methods
The mine plan was developed using conventional mining technology. Three areas which could improve the mining results are as follows:
| · | Trolley-assist has been shown at other mines to improve cycle times and engine life, both of which would reduce operating costs. To accomplish this, additional capacity would likely be required for the power plant. |
| Pebble Project | Page 335 |
| NI 43-101 Technical Report Update and Preliminary Economic Assessment | August 21, 2023 |
|
|
|
| · | In-pit crushing for the proposed project as well as extending the in-pit crushing for the potential expansion scenarios may prove beneficial. |
|
|
|
| · | Mine operations are increasingly moving to autonomous equipment and remote operations centres. These have seen real benefits, particularly in remote operation such as envisioned at Pebble. |
25.15.2.3 Recovery Methods
| · | Flotation: A number of measures have been developed recently which could improve flotation performance at Pebble, including advances in coarse particle flotation. Further analysis of these advances could benefit Pebble. |
|
|
|
| · | The supergene domains at Pebble contribute a significant portion of the process plant feed during the first several years of operation. Additional testwork and analysis could determine if alternate strategies could be employed to improve recoveries in these zones. |
|
|
|
| · | Pre-sorting techniques have become accepted components of many new process plants. A study could be warranted to determine if pre-sorting could enhance project outcomes. |
|
|
|
| · | Analysis of alternate secondary gold recovery technologies could improve the financial results and enhance the permitting process. |
|
|
|
| · | The molybdenum concentrate production creates the opportunity to add a molybdenum concentrate refinery to produce a value-added product in Alaska and reduce overall carbon footprint of project by reduced shipping. |
25.15.2.4 Infrastructure
| · | Further detailed analysis of the influent water quality and water treatment schemes may see reductions in complexity and cost. |
|
|
|
| · | The facilities at the mine site have currently been estimated on the basis of being “stick-built” on site. The access road has been designed to accommodate modules weighing up to 2,000 tons. Further detailed analysis should be completed to determine if cost and/or schedule efficiencies can be realized by modularizing the mine site power plant, the water treatment plants, and components of the process plant and tailings facilities. |
25.15.2.5 Environmental
| · | Evaluation of carbon dioxide capture and sequestration opportunities may reveal an opportunity to reduce the project’s carbon emissions. |
|
|
|
| · | There may be an opportunity, through the permitting challenges, to optimize the project as well as the fish and marine habitat compensation proposed. |
| Pebble Project | Page 336 |
| NI 43-101 Technical Report Update and Preliminary Economic Assessment | August 21, 2023 |
|
|
|
26 RECOMMENDATIONS
26.1 Introduction
The Pebble Project demonstrates positive economics, as shown by the results presented in this technical report.
It is recommended to continue developing the project through the prefeasibility study stage. Table 26-1 summarizes the estimated cost for the recommended future work on the project.
Table 26‑1: Cost Summary for the Recommended Future Work
| Item | Budget ($M) |
| Metallurgical Testwork | 8.5 |
| Mineral Resource Estimate | 10.2 |
| Mining Method | 8.1 |
| Process and Infrastructure Engineering | 1.0 |
| Access Road | 6.5 |
| Tailings and Waste Management | 18.0 |
| Total | 52.3 |
26.2 Metallurgical Testwork
26.2.1 Metallurgy Testwork
Future testwork is required to provide additional data to define silver recovery to the copper-gold concentrate, rhenium recovery to the molybdenum concentrate, and precious metals to the gravity concentrate.
Additional analysis and circuit optimization are recommended for treatment of supergene material. This should include collection of additional metallurgical samples from drilling these specific metallurgical domains.
An initial assessment of potential treatment methods of molybdenum concentrates should be completed to optimize the value of molybdenum and rhenium.
26.2.2 Grinding Circuit SAG Mill Size
Continued analysis is recommended to determine the optimum grinding circuit configuration.
26.2.3 Flotation Circuit Optimization
Coarse particle and column or other means of flotation should be evaluated.
| Pebble Project | Page 337 |
| NI 43-101 Technical Report Update and Preliminary Economic Assessment | August 21, 2023 |
|
|
|
26.2.4 Estimated Metallurgical Program Cost
The estimated cost to complete the recommended metallurgical program, including sample collection, is $8.5 M.
26.3 Mineral Resource Estimate
26.3.1 Update of Inferred Resource
A mineral resource used as the basis for a prefeasibility or feasibility study, as defined by NI 43-101, must be classified as measured or indicated. A small portion of the mineral resource within the proposed project is classified as inferred and this should be upgraded by infill drilling in order to prepare for a future prefeasibility study.
The estimated cost of the block model update is $10 M.
26.3.2 Block Model Update
The model should be updated as additional data are acquired from drilling to convert inferred resource to measured and indicated.
The estimated cost of the block model update is $0.1 M.
26.3.3 Additional Metals
Elevated levels of palladium, vanadium, titanium, and tellurium have been noted in raw analytical data and in metallurgical studies. A scoping level program is recommended to determine their potential for inclusion in future resource estimates. Such a study would focus on the deportment and distribution of these metals, as well as the best approach to their quantification.
The estimated cost of the block model update is $0.1 M.
26.3.4 Estimated Resource Update Cost
The estimated total cost of the recommended program is $10.2 M.
26.4 Mining Methods
The following recommendations for future mining work include the following:
| · | Detailed mining production schedule and designs should be developed with all mining activities to understand potential bottlenecks and assess possible cost reduction from technologies such as in-pit crushing and conveying, autonomous trucking, and blast hole drilling. |
|
|
|
| · | Detailed geotechnical studies should be conducted to better define the appropriate pit slope angles and design parameters for the pit, stockpiles, and overburden stockpiles. |
| Pebble Project | Page 338 |
| NI 43-101 Technical Report Update and Preliminary Economic Assessment | August 21, 2023 |
|
|
|
The estimated cost to complete the recommended work is $8.1 M, including drilling additional geotechnical investigation holes.
26.5 Process and Infrastructure Engineering
26.5.1 Process Plant and Infrastructure
The estimated cost for process and infrastructure engineering for the PFS is $ 1.0 M. Engineering deliverables would include:
| · | Process trade-off studies; |
|
|
|
| · | Flow diagrams (comminution, recovery processes, tails); |
|
|
|
| · | Detailed equipment list; |
|
|
|
| · | Power listing and consumption estimate; |
|
|
|
| · | Architectural (building sizes) to estimate steel and concrete quantities; |
|
|
|
| · | Detailed material and water balance; |
|
|
|
| · | Detailed process design criteria; |
|
|
|
| · | General arrangements (GA) and elevation drawings; |
|
|
|
| · | Electrical single line drawing; |
|
|
|
| · | Equipment and supply quotations updated and sources determined; |
|
|
|
| · | Estimate of equipment and materials freight quantities; |
|
|
|
| · | Capital and operating cost estimate; |
|
|
|
| · | Major equipment spares and warehouse inventory cost estimate; |
|
|
|
| · | Construction workhours estimate; and |
|
|
|
| · | Construction schedule. |
Additional studies are necessary to finalize the location of the process plant and related infrastructure. An investigation of the soil conditions should be performed in order to simplify the design of the mill building and major equipment foundations.
26.5.2 Access Road
Further alignment information, geotechnical detail and aggregate sourcing data will be required to support access road design.
The main access and secondary road alignments and designs need to be refined to better determine issues and costs. Considerations include the following:
| · | right of way and other permit constraints, if any; |
|
|
|
| · | optimizing the road corridor; |
| Pebble Project | Page 339 |
| NI 43-101 Technical Report Update and Preliminary Economic Assessment | August 21, 2023 |
|
|
|
| · | road horizontal and vertical alignments, cross-section designs and corresponding earth quantities; |
|
|
|
| · | design requirements for frost-susceptible, wet rock areas; |
|
|
|
| · | concept level bridge general arrangement and profile designs taking into account geotechnical information; |
|
|
|
| · | geotechnical investigations along the road alignment and at all bridge sites; |
|
|
|
| · | hydrology and hydraulics studies for stream crossing design; and |
|
|
|
| · | drilling and sampling of proposed material borrow sources to define material characteristics and suitability. |
The estimated cost to complete this work is $6.5 M.
26.6 Tailings and Waste Management
Recommendations require the following be completed to support the advancement of the Pebble Project permitting case tailings and water management:
| · | prepare a detailed material balance that includes quantities and timing for construction and closure materials (overburden/growth medium, quarried rock, PAG rock). |
|
|
|
| · | Prepare a detailed construction execution plan to support the initial construction planning; complete additional geotechnical investigations to support prefeasibility level TSF and water management designs, such as: |
|
| o | geotechnical infill drilling and sampling in overburden soils and rock; |
|
|
|
|
|
| o | hydrogeological testing of soil and rock; |
|
|
|
|
|
| o | test pitting to characterize the surficial geology; |
|
|
|
|
|
| o | delineation of construction materials and local borrow areas; |
|
|
|
|
|
| o | additional investigations to confirm the bedrock surface below embankment structures; |
|
|
|
|
|
| o | laboratory testing of samples collected in the field; |
| · | carry out tailings testwork and tailings consolidation modelling for both TSFs; |
|
|
|
| · | revise and update the mine plan, watershed and groundwater models as appropriate during future studies; and |
|
|
|
| · | initiate an Alaska Dam Safety Program and engage the Independent Review Panel. |
The estimated cost to complete this program, including sample collection, is $18 M.
| Pebble Project | Page 340 |
| NI 43-101 Technical Report Update and Preliminary Economic Assessment | August 21, 2023 |
|
|
|
27 REFERENCES
Alaska Department Fish and Game (ADFG), 2013. Anadromous Waters Catalog. https://www.adfg.alaska.gov/sf/SARR/AWC/index.cfm
Alaska Department of Fish and Game (ADFG), 2010. 2009 Bristol Bay Area Annual Management Report. Fishery Management Report No. 10-25.
Alaska Department of Fish and Game (ADFG), 2019. 2018 Bristol Bay Area Annual Management Report. Fishery Management Report No. 19-12.
Alaska Department of Fish and Game (ADFG), 2021. 2019 Bristol Bay Area Annual Management Report. Fishery Management Report No. 21-04.
Alaska Department of Fish and Game (ADFG), 2021. 2020 Bristol Bay Area Annual Management Report. Fishery Management Report No. 21-16.
Alaska Department of Fish and Game (ADFG), 2022. 2021 Bristol Bay Area Annual Management Report. Fishery Management Report No. 22-14.
Alaska Department of Fish and Game (ADFG), 2022. 2022 Bristol Bay Salmon Season Summary. Advisory Announcement
Alaska Department of Fish and Game (ADFG), 2020. Bristol Bay Salmon Escapement (2019). https://www.adfg.alaska.gov/index.cfm?adfg=commercialbyareabristolbay.escapement.
Alaska Department of Law, Press Release, July 26, 2023, “Alaska Takes 404(c) Fight Directly to Supreme Court”, https://law.alaska.gov/press/releases/2023/072623-Section404.html
Alaska Department of Natural Resources, 2005. Bristol Bay Area Plan for State Lands. http://dnr.alaska.gov/mlw/planning/areaplans/bristol/pdf/bbap_complete.pdf
Alaska Department of Natural Resources - ADNR, June 2005, “Guidelines for Cooperation with the Alaska Dam Safety Program.”
Alaska Department of Natural Resources - ADNR, September 2013, “Bristol Bay Area Plan for State Lands (Adopted April 2005, Revised September 2013)”
Alaska Department of Natural Resources - ADNR, July 2017, “Guidelines for Cooperation with the Alaska Dam Safety Program.” Draft revision.
Amato, J.M., Foley, C., Heizler, M., and Esser, R., 2007, 40Ar/39Ar and U-Pb geochronology, geochemistry, and tectonic setting of three episodes of Cretaceous-Eocene calc-alkaline magmatism in the Lake Clark Region, southwestern Alaska: in Ridgway, K.D., Trop, J.M., Glen, J.M.G., and O’Neill, J.M., eds., Tectonic Growth of a Collisional Continental Margin: Crustal Evolution of Southern Alaska: Geological Society of America Special Paper 431, p. 455-475.
| Pebble Project | Page 341 |
| NI 43-101 Technical Report Update and Preliminary Economic Assessment | August 21, 2023 |
|
|
|
Anderson, E.D., Hitzman, M.W., Monecke, T., Bedrosian, P.A., Shah, A.K., and Kelley, K.D., 2013, Geological analysis of aeromagnetic data from southwestern Alaska: Implications for exploration in the area of the Pebble porphyry Cu-Au-Mo deposit. Economic Geology, in press.
Bouley, B.A., St. George, P., and Wetherbee, P.K., 1995, Geology and discovery at Pebble Copper, a copper-gold porphyry system in southwest Alaska: in Schroeter, T.G., ed., Porphyry Deposits of the Northwestern Cordillera of North America, CIM Special Volume 46, p. 422-435.
Bundtzen, T.K., and Miller, M.L., 1997, Precious metals associated with Late Cretaceous-early Tertiary igneous rocks of southwestern Alaska: in Goldfarb, R.J., and Miller, L.D., eds., Mineral Deposits of Alaska: Economic Geology Monograph 9, p. 242-286.
CIM, 2003, Best Practices in Uranium Estimation Guidelines
Clark, A.H., 1993, Are outsized porphyry copper deposits either anatomically or environmentally distinctive? Society of Economic Geologists Special Publication 2, p. 213-283.
Couture, J.F., and Siddorn, J., 2007, Technical report on the Whistler Cu-Au exploration project, Alaska Range, Alaska. Available on www.sedar.com, 92 p.
Decker, J., Bergman, S.C., Blodgett, R.B., Box, S.E., Bundtzen, T.L., Clough, J.G., Conrad, W.L., Gilbert, W.G., Miller, M.L., Murphy, J.M., Robinson, M.S., and Wallace, W.K., 1994, Geology of southwestern Alaska: in Plafker, G., and Berg, H.C., eds., The Geology of Alaska. Geological Society of America, The Geology of North America, v. G-1., p. 285-310.
Detterman, R.L., and Reed, B.L, 1973. Surficial Deposits of the Iliamna Quadrange, Alaska, U.S. Geological Survey Bulletin 1368-A, 64 p.
Detterman, R.L., and Reed, B.L., 1980, Stratigraphy, structure, and economic geology of the Iliamna quadrangle, Alaska: U.S. Geological Survey Bulletin 1368-B, 86 p.
Foley, J.Y., Light, T.D., Nelson, S.W., and Harris, R.A., 1997, Mineral occurrences associated with mafic-ultramafic and related alkaline complexes in Alaska; in Goldfarb, R.J., and Miller, L.D., eds., Mineral Deposits of Alaska. Economic Geology Monograph 9, p. 396-449.
G & T Metallurgical Services Ltd., 2011. Copper Molybdenum Separation Testing on a Pebble Bulk Concentrate. September 22, 2011.
Gaunt, J.D., Rebagliati, C.M., Lang, J., Titley, E., Melis, L., Barratt, D., and Hodgson, S., 2010, Technical report on the 2009 program and update on mineral resources and metallurgy, Pebble copper-gold-molybdenum project, Alaska. Available on www.sedar.com, 195 p.
Gaunt, J.D., Rebagliati, C.M., Lang, J., Titley, E., and Lu, T., 2014, Technical report on the Pebble Project, Southwest Alaska, USA. Available on www.sedar.com, 170 p.
Gaunt, J.D., Lang, J., Titley, E., and Lu, T., 2015, 2014 Technical Report on the Pebble Project, Southwest Alaska, USA. Available on www.sedar.com, 182 p.
Gaunt, J.D., Rebagliati, C.M., Lang, J., Titley, E., Lu, T., and Hodgson, S., 2018, Technical report on the Pebble Project, Southwest Alaska, USA. Available on www.sedar.com, 191 p.
| Pebble Project | Page 342 |
| NI 43-101 Technical Report Update and Preliminary Economic Assessment | August 21, 2023 |
|
|
|
Gaunt, J.D., Lang, J., Titley, E., Lu, T., and Hodgson, S., 2020, 2020 Technical Report on the Pebble Project, Southwest Alaska, USA. Available on www.sedar.com, 239 p.
Gaunt, J.D., Lang, J., Titley, E., Ghaffari, H., and Hodgson, S., 2021, 2021 Technical Report on the Pebble Project, Southwest Alaska, USA. Available on www.sedar.com, 245 p.
Gaunt, J.D., Lang, J., Titley, E., Ghaffari, H., and Hodgson, S., 2023, 2023 Amended Technical Report on the Pebble Project, Southwest Alaska, USA. Available on www.sedar.com, 245 p
Gaunt, J.D., Lang, J., Titley, E., Ghaffari, H., and Hodgson, S., 2023, 2023 Technical Report on the Pebble Project, Southwest Alaska, USA. Available on www.sedar.com, 245 p
Ghaffari, H., Morrison, R.S., de Ruijter, M.A., Živković, A., Hantelmann, T., Ramsey, D., and Cowie, S., 2011, Preliminary Assessment of the Pebble Project, Southwest Alaska, Available on www.sedar.com, 572 p.
Goldfarb, R.J., 1997, Metallogenic evolution of Alaska; in Goldfarb, R.J., and Miller, L.D., eds., Mineral Deposits of Alaska, Society of Economic Geologists Monograph 9, p. 4-34.
Goldfarb, R.J., Hart, C.J.R, and Anderson, E.D., 2013, Regional tectonic framework of the Pebble deposit: Economic Geology, in press.
Gregory, M.J., 2017. A fluid inclusion and stable isotope study of the Pebble porphyry copper-gold-molybdenum deposit, Alaska. Ore Geology Reviews, v. 80, p. 1279-1303.
Gregory, M., and Lang, J., 2009, Hydrothermal controls on copper sulphide speciation, metal distribution and gold deportment in the Pebble porphyry Cu-Au-Mo deposit, southwest Alaska: Proceedings of the 10th Biennial Meeting of the Society for Geology Applied to Mineral Deposits, Townsville, Australia, p. 524-526.
Gregory, M.J., and Lang, J.R., 2011, Controls on Au deportment in the Pebble Cu-Au-Mo porphyry deposit, Alaska: in Williams, P.J., Oliver, N., and Rusk, B., eds., Let's Talk Ore Deposits: Proceedings of the Eleventh Biennial SGA Meeting, Antofagasta, Chile, p. 524-526.
Gregory, M.J., and Lang, J.R., 2012, The Pebble porphyry Cu-Au-Mo deposit, Alaska. Society of Mining Engineers Annual Meeting, Seattle, preprint 12-141.
Gregory, M.J., Lang, J.R., Gilbert, S., and Hoal, K.O., 2013, Geometallurgy of the Pebble copper-gold-molybdenum deposit, Alaska: Implications for gold distribution and paragenesis: Economic Geology, v. 108, pp. 463-482.
Gustafson, L.B., and Hunt, J.P., 1975, The porphyry copper deposit at El Salvador, Chile: Economic Geology, v. 70, p. 857–912.
Gustafson, L.B., and Quiroga G., J., 1995, Patterns of mineralization and alteration below the porphyry copper orebody at El Salvador, Chile: Economic Geology, v. 90, p. 2-16.
Haeussler, P.J., and Saltus, R.W., 2005, 26 km of offset on the Lake Clark fault since late Eocene time: U.S. Geological Survey, Professional Paper 1709A, 4 p.
Haeussler, P.J., and Saltus, R.W., 2011, Location and Extent of Tertiary Structures in Cook Inlet Basin, Alaska, and Mantle Dynamics that Focus deformation and Subsidence, in Dumoulin, J.A., and Galloway, J.P., eds., Studies by the U.S. Geological Survey in Alaska 2008–2009: U.S. Geological Survey Professional Paper 1776–D, 26 p.
| Pebble Project | Page 343 |
| NI 43-101 Technical Report Update and Preliminary Economic Assessment | August 21, 2023 |
|
|
|
Hamilton, T., and Klieforth, R.F., 2010, Surficial geologic map of parts of the D-6 and D-7 quadrangles, Pebble project area, southwestern Alaska: Alaska Division of Geological & Geophysical Surveys, Report of Investigation 2009-4, 19 p.
Hames, B.P., and Roberts, M.D. (2020). The Whistler porphyry Au-Cu deposit, Alaska. In Sharman, E.R., Lang, J.R., and Chapman, J.B. (Eds.) Porphyry Deposits of the Northwestern Cordillera of North America: A 25-Year Update. Canadian Institute of Mining and Metallurgy Special Volume 57. Montreal, QC: Canadian Institute of Mining, Metallurgy and Petroleum. In Press.
Hampton, B.A., Ridgway, K.D., and Gehrels, G.E., 2010, A detrital record of Mesozoic island arc accretion and exhumation in the North American Cordillera: U-Pb geochronology of the Kahiltna basin, southern Alaska: Tectonics, v. 29, TC4015, doi:10.1029/2009TC002544, 21p.
Hanley, J., Kerr, M., LeFort, D., Warren, M., Mackenzie, M., and Sedge, C., 2020, Platinum-group element (PGE) enrichment in alkalic porphyry Cu-Au deposits in the Canadian cordillera: new insights from mineralogical and fluid inclusion studies. In Sharman, E.R., Lang, J.R., and Chapman, J.B. (Eds.) Porphyry Deposits of the Northwestern Cordillera of North America: A 25-Year Update. Canadian Institute of Mining and Metallurgy Special Volume 57. Montreal, QC: Canadian Institute of Mining, Metallurgy and Petroleum. In Press.
Harraden, C.L., McNulty, B.A., Gregory, M.J., and Lang, J.R., 2012, Shortwave infrared spectral analysis of hydrothermal alteration associated with the Pebble porphyry copper-gold-molybdenum deposit, Iliamna, Alaska, USA: Economic Geology, in press.
Hart CJR, 2010. Intrusive rocks associated with the Pebble porphyry Cu-Au-Mo deposit, southwest Alaska. GSA Denver annual meeting abstract 182738.
Hart, C.J., Lang, J.R., Goldfarb, R.J., and Farmer, G.L., 2010, Intrusive rocks associated with the Pebble porphyry Cu-Au-Mo deposit, southwest Alaska. Geological Society of America Abstracts with Programs, v. 42, p. 676.
Haslinger, R.J., Payne, J.G., Price, S., and Rebagliati, C.M., 2004, 2003 Summary report on the Pebble porphyry gold-copper project, Iliamna Lake area, southwestern Alaska, USA. Available on www.sedar.com, 119 p.
Hawley, C., 2004 Alaska resource data file, Iliamna quadrangle, Alaska: U.S. Geological Survey Open-File Report 2004-105, 118 p.
Haynes, F.H., and Titley, S.R., 1980, The evolution of fracture-related permeability within the Ruby Star Granodiorite, Sierrita porphyry copper deposit, Pima County, Arizona: Economic Geology, v. 75, p. 673-683.
Iriondo, A., Kunk, M.J., and Wilson, F.H., 2003, 40Ar/39Ar geochronology of igneous rocks in the Taylor Mountains and Dillingham quadrangles in SW Alaska: U.S. Geological Survey Open-File Report 03-0421.
John, D.A., Ayuso, R.A., Barton, M.D., Blakely, R.J., Bodnar, R.J., Dilles, J.H., Gray, F., Graybeal, F.T., Mars, J.C., McPhee, D.K., Seal, R.R., Taylor, R.D., and Vikre, P.G., 2010, Porphyry copper deposit model, Section B of Mineral Deposit Models for Resource Assessment. U.S. Geological Survey, Scientific Investigations Report 2010-5070-B, 169 p.
John, D.A., Seal, R.R., II, and Polyak, D.E., 2017, Rhenium, Section P of Schulz, K.J., DeYoung, J.H., Jr., Seal, R.R., II, and Bradley, D.C. (eds.), Critical mineral resources of the United States—Economic and environmental geology and prospects for future supply. U.S. Geological Survey Professional Paper 1802, p. P1–P49
Jones, M. et al, 2012. 2012 Bristol Bay Area Management Report No. 13-20.
| Pebble Project | Page 344 |
| NI 43-101 Technical Report Update and Preliminary Economic Assessment | August 21, 2023 |
|
|
|
Kalanchey, Robin, P.Eng., Ausenco, Ghaffari, Hassan, P.Eng., Tetra Tech Canada Inc., Abdel Hafez, Sabry,P.Eng., Tetra Tech Canada Inc., Galbraith, Les, P.Eng., P.E., Knight Piésold Ltd., Gaunt, J. David, P. Geo., Hunter Dickinson Services Inc., Titley, Eric, P. Geo., Hunter Dickinson Services Inc., Hodgson, Stephen, P.Eng., Hunter Dickinson Services Inc., and Lang, James, P. Geo., J M Lang Professional Consulting Inc., 2021, Preliminary Economic Assessment NI 43-101 Technical Report, Pebble Project, Alaska, USA, effective date: September 9, 2021. Available on www.sedar.com. 365 p.
Kalanchey, Robin, P.Eng., Ausenco, Ghaffari, Hassan, P.Eng., Tetra Tech Canada Inc., Abdel Hafez, Sabry,P.Eng., Tetra Tech Canada Inc., Galbraith, Les, P.Eng., P.E., Knight Piésold Ltd., Gaunt, J. David, P. Geo., Hunter Dickinson Services Inc., Titley, Eric, P. Geo., Hunter Dickinson Services Inc., Hodgson, Stephen, P.Eng., Hunter Dickinson Services Inc., and Lang, James, P. Geo., J M Lang Professional Consulting Inc., 2022, Preliminary Economic Assessment NI 43-101 Technical Report Update, Pebble Project, Alaska, USA, effective date: October 1, 2022. Available on www.sedar.com. 381 p.
Kalbas, J.L., Ridgeway, K.D., and Gehrels, G.E., 2007, Stratigraphy, depositional systems, and provenance of the Lower Cretaceous Kahiltna assemblage, western Alaska Range: Basin development in response to oblique collision: in Ridgeway, K.D., Trop, J.M., Glen, J.M.G, Evolution of Southern Alaska: Geological Society of America Special Paper 431, p. 307-344.
Kelley, K.D., Eppinger, R.G., Lang, J., Smith, S.M., and Fey, D.L., 2011, Porphyry Cu indicator minerals in till as an exploration tool: example from the giant Pebble porphyry Cu-Au-Mo deposit, Alaska: Geochemistry: Exploration, Environment, Analysis, v. 11, p. 321-334.
Khashgerel, B., Rye, R.O., Kavalieris, I, and Hayashi, K., 2009, Thesericitic to advanced argillic transition: Stable isotope and mineralogical characteristics from the Hugo Dummett porphyry Cu-Au deposit, OyuTolgoi district, Mongolia: Economic Geology, v. 104, p. 1087-1110.
Knight Piésold Ltd., 2020. Pebble Project – Water Balance and Water Quality Model Report. VA101 176/60-3, Rev. 1, January 2020.
Koehler, R.D., and Reger, R.D., 2011, Reconnaissance evaluation of the Lake Clark fault, Tyonek area, Alaska. State of Alaska Department of Natural Resources, Division of Geological & Geophysical Surveys, PRELIMINARY INTERPRETIVE REPORT 2011-1, 10 p.
Koehler, R.D., 2010, Technical review of a trench across a potential fault scarp feature east of lower Talarik Creek, Lake Iliamna area, southwestern Alaska. State of Alaska Department of Natural Resources, Alaska Division of Geological & Geophysical Surveys, MISCELLANEOUS PUBLICATION 139, 12 p.
Kreiner, D.C., Jones III, J.V., Kelley, K.D., and Graham, G.E. (2020). Tectonic and magmatic controls on the metallogenesis of porphyry deposits in Alaska. In Sharman, E.R., Lang, J.R., and Chapman, J.B. (Eds.) Porphyry Deposits of the Northwestern Cordillera of North America: A 25-Year Update. Canadian Institute of Mining and Metallurgy Special Volume 57. Montreal, QC: Canadian Institute of Mining, Metallurgy and Petroleum. In Press.
Kremenetskii, A.A., Popov, V.S., and Gromalova, N.A., 2012, The formation age of ores from the Pebble Cu-Au-Mo giant deposit (Alaska, United States). Doklady Earth Sciences, v. 442, part 2, p. 196-201.
Lang, J.R., Gregory, M.J., Rebagliati, C.M., Payne, J.G., Oliver, J.L., and Roberts, K., 2013, Geology and magmatic-hydrothermal evolution of the giant Pebble porphyry copper-gold-molybdenum deposit, southwest Alaska, USA. Economic Geology, v. 108, 437-462.
| Pebble Project | Page 345 |
| NI 43-101 Technical Report Update and Preliminary Economic Assessment | August 21, 2023 |
|
|
|
Lang, J.R., Rebagliati, C.M., Roberts, K., and Payne, J.G., 2008, The Pebble copper-gold-molybdenum porphyry deposit, southwest Alaska USA: Proceedings of PACRIM 2008, AUSIMM, p. 27-32.
Lang, J.R., Stanley, C.R., and Thompson, J.F.H., 1995, Porphyry copper-gold deposits related to alkalic igneous rocks in the Triassic-Jurassic arc terranes of British Columbia. In: Pierce, F.W, and Bolm, J.G., eds., Porphyry Copper Deposits of the American Cordillera. Arizona Geological Society Digest, v. 20, p. 219-236.
McCandless, T.E., Ruiz, J., and Campbell, A.R., 1993, Rhenium behaviour in molybdenite in hypogene and near-surface environments: Implications for Re-Os Geochronometry: Geochimicaet Cosmochimica Acta, v. 57, p. 889-905.
McClelland, W.C., Gehrels, G.E., and Saleeby, J.B., 1992, Upper Jurassic-Lower Cretaceous basinal strata along the Cordilleran Margin: Implications for the accretionary history of the Alexander-Wrangellia-Peninsular Terrane: Tectonics, v. 11, p. 823-835.
McFall, K.A., Naden, J., Roberts, S., Baker, T., Spratt, J., and McDonald, I., 2018, Platinum-group minerals in the Skouries Cu-Au (Pd, Pt, Te) porphyry deposit. Ore Geology Reviews, v. 99, p. 344-364.
Meyer, C., and Hemley, J.J., 1967, Wall rock alteration. In: Barnes, H.L., ed., Geochemistry of hydrothermal ore deposits: New York, Holt, Rhinehart and Winston, p. 166-235.
Mine Environmental Neutral Drainage Program, 1991. Acid Road Drainage Prediction Manual, MEND Project 1.16.1b, CANMET – MSL Division, Department of Energy, Mines and Resources, Canada.
Nicholson Analytical Consulting, 2009, QA/QC Report 2008 Drilling Program Pebble Project, Unpublished company report. October 29, 2009.
Northern Dynasty Minerals Ltd., (2022): “Northern Dynasty secures innovative royalty agreement for proceeds of up to $60 M on non-core metals”, July 27, 2022
Olson, N.H. (2015). The geology, geochronology, and geochemistry of the Kaskanak batholith, and other Late Cretaceous to Eocene magmatism at the Pebble porphyry Cu-Au-Mo deposit, SW Alaska. Unpublished M.Sc thesis, Oregon State University.
Olson, N.H., Dilles, J.H., Kent, A.J.R., and Lang, J.R. (2017). Geochemistry of the Cretaceous Kaskanak batholith and genesis of the Pebble porphyry Cu-Au-Mo deposit, Southwest Alaska. American Mineralogist, v. 102, p. 1597–1621.
Olson, N.H., Lang, J.R., and Dilles, J.H. (2020). The Pebble porphyry Cu-Au-Mo deposit, southwestern Alaska. In Sharman, E.R., Lang, J.R., and Chapman, J.B. (Eds.) Porphyry Deposits of the Northwestern Cordillera of North America: A 25-Year Update. Canadian Institute of Mining and Metallurgy Special Volume 57. Montreal, QC: Canadian Institute of Mining, Metallurgy and Petroleum. In Press
Outotec (Canada) Ltd., 2010. Outotec Thickener Interpretations and Recommendations for Test Data. Report TH-0493, Pebble Project, April 9, 2010.
Outotec (Canada) Ltd., 2010. Outotec Thickener Interpretations and Recommendations for Test Data. Report TH-0497, Pebble Project. June 17, 2010.
Pavlis, T.L., Sisson, V.B., Foster, H., Nokleberg, W.J., and Plafker, G., 1993, Constraints on crustal extension in the western Yukon-Tanana terrane, central Alaska: Tectonics, v. 12, p. 103-122.
| Pebble Project | Page 346 |
| NI 43-101 Technical Report Update and Preliminary Economic Assessment | August 21, 2023 |
|
|
|
Pebble Limited Partnership, 2012. Pebble Project Environmental Baseline Document 2004 through 2008.
Pebble Limited Partnership, 2018. Pebble Project Supplemental Environmental Baseline Document.
Pebble Limited Partnership, 2018. Pebble Project Description Updated October 2018.
Pebble Limited Partnership, 2020. Pebble Project Description. POA-2017-271 Updated May 2020
Phillips, C.H., Gambell, N.A., and Fountain, D.S., 1974, Hydrothermal alteration, mineralization and zoning in the Ray deposit: Economic Geology, v. 69, p. 1237-1250.
Plafker, G., and Berg, H.C., 1994, Overview of the geology and tectonic evolution of Alaska: in Plafker, G., and Berg, H.C., eds., The Geology of Alaska: Geological Society of America, The Geology of North America, v. G-1, p. 989-1021.
Rebagliati, C.M., and Haslinger, R.J., 2003, Summary report on the Pebble copper-gold porphyry project, Iliamna Lake area, southwestern Alaska, USA. Available on www.sedar.com.94 p.
Rebagliati. C.M. and Haslinger, R.J., Payne, J.G., and Price, C.M., 2004. Technical Report on the Pebble Project. May 2004.
Rebagliati, C.M., Payne, J.G., and Lang, J.R., 2005, 2004 summary report on the Pebble porphyry gold-copper project, Iliamna Lake area, southwestern Alaska, USA. Available on www.sedar.com.79 p.
Rebagliati, C.M., and Payne, J.G., 2006, 2005 summary report on the Pebble porphyry copper-gold project, Iliamna Lake area, southwestern Alaska, USA. Available on www.sedar.com.111 p.
Rebagliati, C.M., and Payne, J.G., 2007, 2006 summary report on the Pebble porphyry copper-gold-molybdenum project, Iliamna Lake area, southwestern Alaska, USA. Available on www.sedar.com.119 p.
Rebagliati, C.M., Lang, J.R., Titley, E., Gaunt, J.D., Melis, L., Barratt, D., and Hodgson, S., 2010, Technical report on the 2009 program and update on mineral resources and metallurgy, Pebble copper-gold-molybdenum project, Iliamna Lake area, southwestern Alaska, USA. Available on www.sedar.com, 194 p.
Rebagliati, C.M., Lang, J.R., Titley, E., Gaunt, J.D., Rennie, D., Melis, L., Barratt, D., and Hodgson, S., 2008, Technical report on the 2007 program and updates on metallurgy and resources. Available on www.sedar.com.
Rebagliati, C.M., Lang, J.R., Titley, E., Gaunt, J.D., Rennie, D., Melis, L., Barratt, D., and Hodgson, S., 2009, Technical report on the 2008 program and updates on mineral resources and metallurgy. Available on www.sedar.com.
Rebagliati, M., and Lang, J., 2009, The Pebble porphyry copper-gold-molybdenum discovery, Alaska, USA. Conference Proceedings, New GenGold 2009, Case Histories of Discoveries, Perth, p. 121-132.
Reed, B.L., and Lanphere, M.A., 1973, Alaska-Aleutian Range batholith: Geochronology, chemistry, and relation to circum-Pacific plutonism: Geological Society of America Bulletin, v. 84, p. 2583-2610.
Rombach, C., and Newberry, R., 2001, Shotgun deposit: Granite porphyry-hosted gold-arsenic mineralization in southwestern Alaska, USA: Mineralium Deposita, v. 36, p. 607-621.
S&P Global, The Future of Copper – Will the looming supply gap short-circuit the energy transition?, July 2022
| Pebble Project | Page 347 |
| NI 43-101 Technical Report Update and Preliminary Economic Assessment | August 21, 2023 |
|
|
|
Schrader, C.M., 2001, Geochronology and geology of the Pebble Cu-Au-Mo porphyry and the Sill Au-Ag epithermal deposits, southwest Alaska. Unpublished M.Sc thesis, University of Georgia, Athens, 109 p.
SEDAR (System for Electronic Document Analysis and Retrieval): www.sedarplus.com
Seedorff, E., Dilles, J.H., Proffett, J.M., Einaudi, M.T., Zurcher, L., Stavast, W.J.A., Johnson, D.A., and Barton, M.D., 2005, Porphyry deposits: Characteristics and origin of hypogene features: in Hedenquist, J.W., Thompson, J.F., Goldfarb, R.J., and Richards, J.P., eds., Economic Geology 100thAnniversary Volume, 1905-2005. Society of Economic Geologists, p. 251-298.
SGS-Lakefield Research Ltd., 2010. An Investigation into the Pebble East and Pebble West Metallurgical Programs. Project #12072-002 Final Report, May 3, 2010.
SGS-Lakefield Research Ltd., 2010. An Investigation into the Recovery of Copper, Gold, and Molybdenum from Samples from Pebble East and West Deposits. Project #12072-002-Report #2, May 10, 2010.
SGS-Lakefield Research Ltd., 2010. An Investigation into the Recovery of Copper, Gold, and Molybdenum from Samples from Pebble East and West Deposits. Project #12072-003/007-Report #3 Rev 1, September 24, 2014.
SGS-Lakefield Research Ltd., 2014. A Summary of Pebble East and West Metallurgical Programs. September 5, 2014.
Shah, A., Bedrosian, P., Anderson, E., Kelley, K., and Lang, J., 2009, Geophysical data used to characterize the regional setting of the Pebble porphyry deposit in southwest Alaska: Geological Society of America Annual Meeting, Program with Abstracts, v. 41, p. 493.
Sillitoe, R.H., 2010, Porphyry copper systems: Economic Geology, v. 105, p. 3-41.
Sinclair, W.D., Jonasson, I., Kirkham, R.V., and Soregaroli, A.E., 2009, Rhenium and other platinum-group metals in porphyry deposits. Geological Survey of Canada, Open File 6181.
SME Mineral Processing &Extractive Metallurgy Handbook, 2018 Review of MAP Development Work, Dreisinger Consulting Inc., September 16, 2012
Srivastava, M, 2020 Prediction of Missing Rhenium for Pebble, 2020, Internal Company Memo
St. George, P., Wetherbee, P.K., Buddington, A.M., Samson, D.P., 1992, Pebble Copper Project 1991 Progress Report, Cominco Alaska, Unpublished Company Report, February 1992.
State of Alaska, Department of Labor and Workforce Development, January 18, 2013, Press Release No. 13.
SRK Consulting (Canada) Inc., Pebble Project, 2012 Pre-Feasibility Pit Slop (Rock) Design, Progress Report, 2nd Draft.
United States Army Corps of Engineers, 2020. Pebble Project EIS Final Impact Statement. Department of the Army. Alaska District. July 2020 U.S. Fish and Wildlife Service, Culvert Design Guidelines for Ecological Function, U.S. Fish and Wildlife Service Alaska Fish Passage Program, Revision 5, February 5th, 2020
United States Geological Survey (USGS), 2013. Watershed Boundary Dataset. https://www.usgs.gov/core-science-systems/ngp/national-hydrography/watershed-boundary-dataset
| Pebble Project | Page 348 |
| NI 43-101 Technical Report Update and Preliminary Economic Assessment | August 21, 2023 |
|
|
|
United States Geological Survey (USGS), 2017. Rhenium, Section P of Critical Mineral Resources of the United States—Economic and Environmental Geology and Prospects for Future Supply. https://pubs.usgs.gov/pp/1802/p/pp1802p.pdf
United States Geological Survey (USGS), 2021. Mineral Commodity Summaries, January 2021. https://pubs.usgs.gov/periodicals/mcs2021/mcs2021-rhenium.pdf
United States Geological Survey, Rhenium Mineral Commodity Summary, January 2022
United States Supreme Court, Sackett v. Environmental Protection Agency, 25 May 2023.
https://www.supremecourt.gov/opinions/22pdf/21-454_4g15.pdf
Wallace WK, Hanks CL and JF Rogers, 1989, The southern Kahiltna terrane: Implications for the tectonic evolution of southwestern Alaska. GSA Bulletin 101, 1389-1407.
Wallace, W.E., Hanks, C.L., and Rogers, J.F., 1989, The southern Kahiltna terrane: Implications for the tectonic evolution of southwestern Alaska: Geological Society of America Bulletin, v. 101, p. 1389-1407.
Wesson et al, 2007. https://earthquake.usgs.gov/hazards/hazmaps/ak/index.php#2007
Young, L.E., St. George, P., and Bouley, B.A., 1997, Porphyry copper deposits in relation to the magmatic history and palinspastic restoration of Alaska: in Goldfarb, R.J., and Miller, L.D., eds., Mineral Deposits of Alaska: Society of Economic Geologists Monograph 9, p. 306-333.
| Pebble Project | Page 349 |
| NI 43-101 Technical Report Update and Preliminary Economic Assessment | August 21, 2023 |
|
|
|
|
|
| 552996 | KAK 66 | 553560 | PEBB 22 | 638808 | PEB 30 |
|
|
| 552997 | KAK 67 | 553561 | PEBB 23 | 638809 | PEB 31 |
|
|
| 552998 | KAK 68 | 553562 | PEBB 24 | 638810 | PEB 32 |
|
|
| 552999 | KAK 69 | 553563 | PEBB 25 | 638811 | PEB 33 |
| 553000 | KAK 70 | 553564 | PEBB 26 | 638812 | PEB 34 |
||
|
|
| 553001 | KAK 71 | 553565 | PEBB 27 | 638813 | PEB 35 |
|
|
| 553002 | KAK 72 | 553566 | PEBB 28 | 638814 | PEB 36 |
| Appendix A – MINERAL CLAIMS |
|
| 553567 | PEBB 29 | 638815 | PEB 37 |
|
|
|
| 553003 | KAK 73 | 553568 | PEBB 30 | 638816 | PEB 38 |
|
|
| 553004 | KAK 74 | 553569 | PEBB 31 | 638821 | PEB 43 |
|
|
| 553005 | KAK 75 | 553570 | PEBB 32 | 638822 | PEB 44 |
| PEBBLE EAST CLAIMS | 553006 | KAK 76 | 553571 | PEBB 33 | 638823 | PEB 45 |
|
| ADL # | CLAIM NAME | 553007 | KAK 77 | 553572 | PEBB 34 | 638824 | PEB 46 |
| 552871 | SOUTH PEBBLE 113 | 553008 | KAK 78 | 553573 | PEBB 35 | 638825 | PEB 47 |
| 552872 | SOUTH PEBBLE 114 | 553009 | KAK 79 | 553574 | PEBB 36 | 638826 | PEB 48 |
| 552873 | SOUTH PEBBLE 115 | 553010 | KAK 80 | 553575 | PEBB 37 | 638827 | PEB 49 |
| 552931 | KAK 1 |
|
| 553576 | PEBB 38 | 638828 | PEB 50 |
| 552932 | KAK 2 | ADL # | CLAIM NAME | 553577 | PEBB 39 | 638829 | PEB 51 |
| 552933 | KAK 3 | 553011 | KAK 81 | 553578 | PEBE 1 | 638830 | PEB 52 |
| 552936 | KAK 6 | 553012 | KAK 82 |
|
| 638835 | PEB 57 |
| 552937 | KAK 7 | 553013 | KAK 83 | ADL # | CLAIM NAME | 638836 | PEB 58 |
| 552938 | KAK 8 | 553014 | KAK 84 | 553579 | PEBE 2 | 638837 | PEB 59 |
| 552939 | KAK 9 | 553015 | KAK 85 | 553580 | PEBE 3 |
|
|
| 552940 | KAK 10 | 553016 | KAK 86 | 553581 | PEBE 4 | ADL # | CLAIM NAME |
| 552941 | KAK 11 | 553017 | KAK 87 | 553582 | PEBE 5 | 638838 | PEB 60 |
| 552948 | KAK 18 | 553018 | KAK 88 | 553583 | PEBE 6 | 638839 | PEB 61 |
| 552949 | KAK 19 | 553019 | KAK 89 | 553584 | PEBE 7 | 638840 | PEB 62 |
| 552950 | KAK 20 | 553500 | PEBA 74 | 553585 | PEBE 8 | 638841 | PEB 63 |
| 552951 | KAK 21 | 553501 | PEBA 75 | 553586 | PEBE 9 | 638842 | PEB 64 |
| 552952 | KAK 22 | 553502 | PEBA 76 | 553587 | PEBE 10 | 638843 | PEB 65 |
| 552953 | KAK 23 | 553517 | PEBA 91 | 553589 | PEBF 2 | 638844 | PEB 66 |
| 552954 | KAK 24 | 553518 | PEBA 92 | 553590 | PEBF 3 | 638850 | PEB 72 |
| 552955 | KAK 25 | 553519 | PEBA 93 | 553591 | PEBF 4 | 638851 | PEB 73 |
| 552959 | KAK 29 | 553522 | PEBA 96 | 553592 | PEBF 5 | 638852 | PEB 74 |
| 552960 | KAK 30 | 553523 | PEBA 97 | 553593 | PEBF 6 | 638853 | PEB 75 |
| 552961 | KAK 31 | 553524 | PEBA 98 | 553595 | PEBF 8 | 638854 | PEB 76 |
| 552962 | KAK 32 | 553525 | PEBA 99 | 553596 | PEBF 9 | 638855 | PEB 77 |
| 552963 | KAK 33 | 553526 | PEBA 100 | 553597 | PEBF 10 | 638856 | PEB 78 |
| 552964 | KAK 34 | 553527 | PEBA 101 | 553598 | PEBF 11 | 638857 | PEB 79 |
| 552965 | KAK 35 | 553528 | PEBA 102 | 553599 | PEBF 12 | 638858 | PEB 80 |
| 552966 | KAK 36 | 553529 | PEBA 103 | 553600 | PEBF 13 | 638865 | PEB 87 |
| 552967 | KAK 37 | 553530 | PEBA 104 | 553602 | PEBF 15 | 638866 | PEB 88 |
| 552968 | KAK 38 | 553531 | PEBA 105 | 553603 | PEBF 16 | 638867 | PEB 89 |
| 552969 | KAK 39 | 553532 | PEBA 106 | 553604 | PEBF 17 | 638868 | PEB 90 |
| 552970 | KAK 40 | 553533 | PEBA 107 | 553605 | PEBF 18 | 638869 | PEB 91 |
| 552971 | KAK 41 | 553534 | PEBA 108 | 553606 | PEBF 19 | 638870 | PEB 92 |
| 552972 | KAK 42 | 553535 | PEBA 109 | 553607 | PEBF 20 | 638871 | PEB 93 |
| 552973 | KAK 43 | 553536 | PEBA 110 | 553615 | SILL 6155 | 638872 | PEB 94 |
| 552974 | KAK 44 | 553537 | PEBA 111 | 553616 | SILL 6156 | 638873 | PEB 95 |
| 552975 | KAK 45 | 553538 | PEBA 112 | 553617 | SILL 6256 | 638874 | PEB 96 |
| 552976 | KAK 46 | 553539 | PEBB 1 | 638779 | PEB 1 | 638875 | PEB 97 |
| 552977 | KAK 47 | 553540 | PEBB 2 | 638780 | PEB 2 | 638886 | PEB 108 |
| 552978 | KAK 48 | 553541 | PEBB 3 | 638781 | PEB 3 | 638887 | PEB 109 |
| 552979 | KAK 49 | 553542 | PEBB 4 | 638782 | PEB 4 | 638888 | PEB 110 |
| 552980 | KAK 50 | 553543 | PEBB 5 | 638783 | PEB 5 | 638889 | PEB 111 |
| 552981 | KAK 51 | 553544 | PEBB 6 | 638784 | PEB 6 | 638890 | PEB 112 |
| 552982 | KAK 52 | 553545 | PEBB 7 | 638785 | PEB 7 | 638891 | PEB 113 |
| 552983 | KAK 53 | 553546 | PEBB 8 | 638786 | PEB 8 | 638892 | PEB 114 |
| 552984 | KAK 54 | 553547 | PEBB 9 | 638791 | PEB 13 | 638893 | PEB 115 |
| 552985 | KAK 55 | 553548 | PEBB 10 | 638792 | PEB 14 | 640061 | PEB N-1 |
| 552986 | KAK 56 | 553549 | PEBB 11 | 638793 | PEB 15 | 640062 | PEB N-2 |
| 552987 | KAK 57 | 553550 | PEBB 12 | 638794 | PEB 16 | 640063 | PEB N-3 |
| 552988 | KAK 58 | 553551 | PEBB 13 | 638795 | PEB 17 | 640064 | PEB N-4 |
| 552989 | KAK 59 | 553552 | PEBB 14 | 638796 | PEB 18 | 640065 | PEB N-5 |
| 552990 | KAK 60 | 553553 | PEBB 15 | 638797 | PEB 19 | 640066 | PEB N-6 |
| 552991 | KAK 61 | 553554 | PEBB 16 | 638798 | PEB 20 | 640067 | PEB N-7 |
| 552992 | KAK 62 | 553555 | PEBB 17 | 638799 | PEB 21 | 640068 | PEB N-8 |
| 552993 | KAK 63 | 553556 | PEBB 18 | 638800 | PEB 22 | 640069 | PEB N-9 |
| 552994 | KAK 64 | 553557 | PEBB 19 | 638801 | PEB 23 | 640070 | PEB N-10 |
| 552995 | KAK 65 | 553558 | PEBB 20 | 638802 | PEB 24 | 640071 | PEB N-11 |
|
|
| 553559 | PEBB 21 | 638807 | PEB 29 | 640072 | PEB N-12 |
| Pebble Project | Appendix A |
| NI 43-101 Technical Report Update and Preliminary Economic Assessment | August 21, 2023 |
|
|
|
| 640073 | PEB N-13 | 642373 | PEB EB 36 | 642441 | PEB WB 30 | 643951 | PEB NW 17 |
| 640074 | PEB N-14 | 642374 | PEB EB 37 | 642442 | PEB WB 31 | 643952 | PEB NW 18 |
| 640075 | PEB N-15 | 642375 | PEB EB 38 | 642443 | PEB WB 32 | 643953 | PEB NW 19 |
| 640076 | PEB N-16 | 642376 | PEB EB 39 | 642444 | PEB WB 33 | 643954 | PEB NW 20 |
| 640077 | PEB N-17 | 642377 | PEB EB 40 | 642445 | PEB WB 34 | 643955 | PEB NW 21 |
| 640078 | PEB N-18 | 642378 | PEB EB 41 | 642446 | PEB WB 35 | 643956 | PEB NW 22 |
| 640079 | PEB N-19 | 642379 | PEB EB 42 | 642447 | PEB WB 36 | 643957 | PEB NW 23 |
| 640080 | PEB N-20 | 642380 | PEB EB 43 | 642448 | PEB WB 37 | 643958 | PEB NW 24 |
| 640081 | PEB N-21 | 642381 | PEB EB 44 | 642449 | PEB WB 38 | 644196 | PEB SE 33 |
| 640082 | PEB N-22 | 642382 | PEB EB 45 | 642450 | PEB WB 39 | 644197 | PEB SE 34 |
| 640083 | PEB N-23 | 642383 | PEB EB 46 | 643892 | PEB SE A1 | 644198 | PEB SE 35 |
| 640084 | PEB N-24 | 642384 | PEB EB 47 | 643893 | PEB SE A2 | 644199 | PEB SE 36 |
| 640085 | PEB N-25 | 642385 | PEB EB 48 | 643894 | PEB SE A3 | 644200 | PEB SE 37 |
| 640086 | PEB N-26 | 642386 | PEB EB 49 | 643895 | PEB SE A4 | 644201 | PEB SE 38 |
| 640087 | PEB N-27 | 642387 | PEB EB 50 | 643896 | PEB SE A5 | 644202 | PEB SE 39 |
| 640088 | PEB N-28 | 642388 | PEB EB 51 | 643897 | PEB SE A6 | 644203 | PEB SE 40 |
| 640089 | PEB N-29 | 642389 | PEB EB 52 | 643898 | PEB SE A7 | 644204 | PEB SE 41 |
| 640090 | PEB N-30 | 642390 | PEB EB 53 | 643899 | PEB SE 1 | 644205 | PEB SE 42 |
| 640091 | PEB N-31 | 642391 | PEB EB 54 | 643900 | PEB SE 2 | 644206 | PEB SE 43 |
| 640092 | PEB N-32 | 642392 | PEB EB 55 | 643901 | PEB SE 3 | 644207 | PEB SE 44 |
| 640093 | PEB N-33 | 642393 | PEB EB 56 | 643902 | PEB SE 4 | 644208 | PEB SE 45 |
| 640094 | PEB N-34 | 642394 | PEB EB 57 | 643903 | PEB SE 5 | 644209 | PEB SE 46 |
| 640095 | PEB N-35 | 642395 | PEB EB 58 | 643904 | PEB SE 6 | 644210 | PEB SE 47 |
| 640096 | PEB N-36 | 642396 | PEB EB 59 | 643905 | PEB SE 7 | 644211 | PEB SE 48 |
| 642057 | SOUTH PEBBLE 101 | 642397 | PEB EB 60 | 643906 | PEB SE 8 | 644212 | PEB SE 49 |
| PEBBLE EAST CLAIMS | 642398 | PEB EB 61 | 643907 | PEB SE 9 | 644213 | PEB SE 50 |
|
| ADL # | CLAIM NAME | 642399 | PEB EB 62 | 643908 | PEB SE 10 | 644214 | PEB SE 51 |
| 642058 | SOUTH PEBBLE 102 | 642400 | PEB EB 63 | 643909 | PEB SE 11 | 644215 | PEB SE 52 |
| 642059 | SOUTH PEBBLE 103 | 642401 | PEB EB 64 | 643910 | PEB SE 12 | 644216 | PEB SE 53 |
| 642060 | SOUTH PEBBLE 104 |
|
| 643911 | PEB SE 13 | 644217 | PEB SE 54 |
| 642061 | SOUTH PEBBLE 105 | ADL # | CLAIM NAME | 643912 | PEB SE 14 | 644218 | PEB SE 55 |
| 642062 | SOUTH PEBBLE 106 | 642402 | PEB EB 65 | 643913 | PEB SE 15 | 644219 | PEB SE 56 |
| 642334 | PEB EBA 1 | 642403 | PEB EB 66 | 643914 | PEB SE 16 | 644220 | PEB SE 57 |
| 642335 | PEB EBA 2 | 642404 | PEB EB 67 | 643915 | PEB SE 17 | 644221 | PEB SE 58 |
| 642336 | PEB EBA 3 | 642405 | PEB EB 68 |
|
| 644225 | PEB SE A8 |
| 642337 | PEB EBA 4 | 642406 | PEB EB 69 | ADL # | CLAIM NAME | 644226 | PEB SE A9 |
| 642338 | PEB EB 1 | 642407 | PEB EB 70 | 643916 | PEB SE 18 | 644227 | PEB SE A10 |
| 642339 | PEB EB 2 | 642408 | PEB EB 71 | 643917 | PEB SE 19 | 644228 | PEB SE A11 |
| 642340 | PEB EB 3 | 642409 | PEB EB 72 | 643918 | PEB SE 20 |
|
|
| 642341 | PEB EB 4 | 642410 | PEB EB 73 | 643919 | PEB SE 21 | ADL # | CLAIM NAME |
| 642342 | PEB EB 5 | 642411 | PEB EB 74 | 643920 | PEB SE 22 | 644229 | PEB SE A12 |
| 642343 | PEB EB 6 | 642412 | PEB WB 1 | 643921 | PEB SE 23 | 644230 | PEB SE A13 |
| 642344 | PEB EB 7 | 642413 | PEB WB 2 | 643922 | PEB SE 24 | 644231 | PEB EB 75 |
| 642345 | PEB EB 8 | 642414 | PEB WB 3 | 643923 | PEB SE 25 | 644232 | PEB EB 76 |
| 642346 | PEB EB 9 | 642415 | PEB WB 4 | 643924 | PEB SE 26 | 644233 | PEB EB 77 |
| 642347 | PEB EB 10 | 642416 | PEB WB 5 | 643925 | PEB SE 27 | 644234 | PEB EB 78 |
| 642348 | PEB EB 11 | 642417 | PEB WB 6 | 643926 | PEB SE 28 | 644235 | PEB EB 79 |
| 642349 | PEB EB 12 | 642418 | PEB WB 7 | 643927 | PEB SE 29 | 644236 | PEB EB 80 |
| 642350 | PEB EB 13 | 642419 | PEB WB 8 | 643928 | PEB SE 30 | 644237 | PEB EB 81 |
| 642351 | PEB EB 14 | 642420 | PEB WB 9 | 643929 | PEB SE 31 | 644238 | PEB EB 82 |
| 642352 | PEB EB 15 | 642421 | PEB WB 10 | 643930 | PEB SE 32 | 644239 | PEB EB 83 |
| 642353 | PEB EB 16 | 642422 | PEB WB 11 | 643931 | PEB NW A1 | 644240 | PEB EB 84 |
| 642354 | PEB EB 17 | 642423 | PEB WB 12 | 643932 | PEB NW A2 | 644241 | PEB EB 85 |
| 642355 | PEB EB 18 | 642424 | PEB WB 13 | 643933 | PEB NW A3 | 644242 | PEB EB 86 |
| 642356 | PEB EB 19 | 642425 | PEB WB 14 | 643934 | PEB NW A4 | 644243 | PEB EB 87 |
| 642357 | PEB EB 20 |
|
| 643935 | PEB NW 1 | 644244 | PEB EB 88 |
| 642358 | PEB EB 21 | 642426 | PEB WB 15 | 643936 | PEB NW 2 | 644245 | PEB EB 89 |
| 642359 | PEB EB 22 | 642427 | PEB WB 16 | 643937 | PEB NW 3 | 644246 | PEB EB 90 |
| 642360 | PEB EB 23 | 642428 | PEB WB 17 | 643938 | PEB NW 4 | 644247 | PEB EB 91 |
| 642361 | PEB EB 24 | 642429 | PEB WB 18 | 643939 | PEB NW 5 | 644248 | PEB EB 92 |
| 642362 | PEB EB 25 | 642430 | PEB WB 19 | 643940 | PEB NW 6 | 644249 | PEB EB 93 |
| 642363 | PEB EB 26 | 642431 | PEB WB 20 | 643941 | PEB NW 7 | 644250 | PEB EB 94 |
| 642364 | PEB EB 27 | 642432 | PEB WB 21 | 643942 | PEB NW 8 | 644251 | PEB EB 95 |
| 642365 | PEB EB 28 | 642433 | PEB WB 22 | 643943 | PEB NW 9 | 644252 | PEB EB A5 |
| 642366 | PEB EB 29 | 642434 | PEB WB 23 | 643944 | PEB NW 10 | 644253 | PEB EB A6 |
| 642367 | PEB EB 30 | 642435 | PEB WB 24 | 643945 | PEB NW 11 | 644254 | PEB EB A7 |
| 642368 | PEB EB 31 | 642436 | PEB WB 25 | 643946 | PEB NW 12 | 644255 | PEB EB A8 |
| 642369 | PEB EB 32 | 642437 | PEB WB 26 | 643947 | PEB NW 13 | 644256 | PEB WB 40 |
| 642370 | PEB EB 33 | 642438 | PEB WB 27 | 643948 | PEB NW 14 | 644257 | PEB WB 41 |
| 642371 | PEB EB 34 | 642439 | PEB WB 28 | 643949 | PEB NW 15 | 644258 | PEB WB 42 |
| 642372 | PEB EB 35 | 642440 | PEB WB 29 | 643950 | PEB NW 16 | 644259 | PEB WB 43 |
| Pebble Project | Appendix A |
| NI 43-101 Technical Report Update and Preliminary Economic Assessment | August 21, 2023 |
|
|
|
| 644260 | PEB WB 44 | 644478 | KAK 182 | 649714 | KAK 270 | 657940 | KAK 377 |
| 644261 | PEB WB 45 | 644479 | KAK 183 | 649715 | KAK 271 | 663828 | KAK 136A |
| 644262 | PEB WB 46 | 644480 | KAK 184 | 649716 | KAK 272 | 663829 | KAK 137A |
| 644263 | PEB WB 47 | 644481 | KAK 185 | 649717 | KAK 273 | 663846 | KAK 168A |
| 644264 | PEB WB 48 | 644482 | KAK 186 | 649718 | KAK 274 | 663847 | KAK 169A |
| 644265 | PEB WB 49 | 644483 | KAK 187 | 649719 | KAK 275 | 663848 | KAK 170A |
| 644266 | PEB WB 50 | 644881 | KAK 188 | 649720 | KAK 276 |
|
|
| 644267 | PEB WB 51 | 644882 | KAK 189 | 649721 | KAK 277 | PEBBLE WEST CLAIMS |
|
| 644268 | PEB WB 52 | 644883 | KAK 190 | 649722 | KAK 278 | ADL # | CLAIM NAME |
| 644269 | PEB WB 53 | 644884 | KAK 191 | 649723 | KAK 279 | 516769 | SILL 5951 |
| 644270 | PEB WB 54 | 644885 | KAK 192 | 649724 | KAK 280 | 516770 | SILL 5952 |
| 644271 | PEB WB 55 | 644886 | KAK 193 | 649725 | KAK 281 | 516779 | SILL 6051 |
| 644272 | PEB WB 56 | 644887 | KAK 194 | 649726 | KAK 282 | 516780 | SILL 6052 |
| 644273 | PEB WB 57 | 644888 | KAK 195 | 649727 | KAK 283 | 516789 | SILL 6151 |
| 644274 | PEB WB 58 | 646604 | PEBBLE BEACH 5942 | 649728 | KAK 284 | 516790 | SILL 6152 |
| 644275 | PEB WB 59 | 646605 | PEBBLE BEACH 5943 | 649729 | KAK 285 | 516797 | SILL 6247 |
| 644276 | PEB WB 60 | 646606 | PEB K 1 | 649730 | KAK 286 | 516798 | SILL 6248 |
| 644277 | PEB WB 61 | 646607 | PEB K 2 | 649731 | KAK 287 | 516799 | SILL 6249 |
| 644278 | PEB WB 62 | 646608 | PEB K 3 | 649732 | KAK 288 | 516800 | SILL 6250 |
| 644279 | PEB WB 63 | 646609 | PEB K 4 | 649733 | KAK 289 | 516801 | SILL 6251 |
| 644305 | SP 194 | 646610 | PEB K 5 | 649734 | KAK 290 | 516802 | SILL 6252 |
| 644306 | SP 195 | 646611 | PEB K 6 | 649735 | KAK 291 | 516806 | PEBBLE BEACH 5448 |
| 644307 | SP 196 | 646612 | PEB K 7 | 649736 | KAK 292 | 516807 | PEBBLE BEACH 5449 |
| 644308 | SP 197 | 646613 | PEB K 8 | 649737 | KAK 293 | 516808 | PEBBLE BEACH 5450 |
| 644309 | SP 198 | 646614 | PEB K 9 | 649738 | KAK 294 | 516809 | PEBBLE BEACH 5451 |
| 644389 | KAK 93 | 646615 | PEB K 10 | 649739 | KAK 295 | 516810 | PEBBLE BEACH 5452 |
| 644390 | KAK 94 | 646616 | PEB K 11 | 649740 | KAK 296 | 516811 | PEBBLE BEACH 5453 |
| 644391 | KAK 95 | 646617 | PEB K 12 | 649741 | KAK 297 | 516812 | PEBBLE BEACH 5454 |
| 644392 | KAK 96 | 648906 | PEB WB 64 | 649742 | KAK 298 | 516813 | PEBBLE BEACH 5548 |
| 644393 | KAK 97 | 648907 | PEB WB 65 | 649743 | KAK 299 | 516814 | PEBBLE BEACH 5549 |
| 644394 | KAK 98 | 648908 | PEB WB 66 | 649744 | KAK 300 | 516815 | PEBBLE BEACH 5550 |
| 644395 | KAK 99 | 648909 | PEB WB 67 | 649745 | KAK 301 | 516816 | PEBBLE BEACH 5551 |
| 644396 | KAK 100 | 649677 | KAK 233 | 649746 | KAK 302 | 516817 | PEBBLE BEACH 5552 |
| 644397 | KAK 101 | 649678 | KAK 234 | 649747 | KAK 303 | 516818 | PEBBLE BEACH 5553 |
| 644398 | KAK 102 | 649679 | KAK 235 | 649748 | KAK 304 | 516819 | PEBBLE BEACH 5554 |
| 644399 | KAK 103 | 649680 | KAK 236 | 649749 | KAK 305 | 516820 | PEBBLE BEACH 5651 |
| 644400 | KAK 104 | 649681 | KAK 237 | 649750 | KAK 306 | 516821 | PEBBLE BEACH 5652 |
| 644401 | KAK 105 | 649682 | KAK 238 | 649751 | KAK 307 | 516822 | PEBBLE BEACH 5653 |
| 644402 | KAK 106 | 649683 | KAK 239 | 649752 | KAK 308 | 516823 | PEBBLE BEACH 5654 |
| 644403 | KAK 107 | 649684 | KAK 240 | 649753 | KAK 309 | 516824 | PEBBLE BEACH 5751 |
| 644404 | KAK 108 | 649685 | KAK 241 | 649754 | KAK 310 | 516825 | PEBBLE BEACH 5752 |
| 644405 | KAK 109 | 649686 | KAK 242 | 649755 | KAK 311 | 516826 | PEBBLE BEACH 5753 |
| PEBBLE EAST CLAIMS | 649687 | KAK 243 | 649756 | KAK 312 | 516827 | PEBBLE BEACH 5754 |
|
| ADL # | CLAIM NAME | 649688 | KAK 244 | 649757 | KAK 313 | 516828 | PEBBLE BEACH 5852 |
| 644406 | KAK 110 | 649689 | KAK 245 | 649758 | KAK 314 | 516829 | PEBBLE BEACH 5853 |
| 644407 | KAK 111 | 649690 | KAK 246 | 649759 | KAK 315 | 516830 | PEBBLE BEACH 5854 |
| 644408 | KAK 112 |
|
| 649760 | KAK 316 | 516831 | PEBBLE BEACH 5952 |
| 644409 | KAK 113 | ADL # | CLAIM NAME | 649761 | KAK 317 | 516832 | PEBBLE BEACH 5953 |
| 644410 | KAK 114 | 649691 | KAK 247 | 649762 | KAK 318 | 516833 | PEBBLE BEACH 5954 |
| 644411 | KAK 115 | 649692 | KAK 248 | 649763 | KAK 319 | 516834 | PEBBLE BEACH 6052 |
| 644412 | KAK 116 | 649693 | KAK 249 |
|
| 516835 | PEBBLE BEACH 6053 |
| 644413 | KAK 117 | 649694 | KAK 250 | ADL # | CLAIM NAME | 516836 | PEBBLE BEACH 6054 |
| 644414 | KAK 118 | 649695 | KAK 251 | 649764 | KAK 320 | 516837 | PEBBLE BEACH 6153 |
| 644415 | KAK 119 | 649696 | KAK 252 | 649765 | KAK 321 | 516838 | PEBBLE BEACH 6154 |
| 644421 | KAK 125 | 649697 | KAK 253 | 649766 | KAK 322 |
|
|
| 644422 | KAK 126 | 649698 | KAK 254 | 649767 | KAK 323 | ADL # | CLAIM NAME |
| 644423 | KAK 127 | 649699 | KAK 255 | 649768 | KAK 324 | 516839 | PEBBLE BEACH 4651 |
| 644424 | KAK 128 | 649700 | KAK 256 | 649769 | KAK 325 | 516840 | PEBBLE BEACH 4652 |
| 644425 | KAK 129 | 649701 | KAK 257 | 649770 | KAK 326 | 516841 | PEBBLE BEACH 4653 |
| 644426 | KAK 130 | 649702 | KAK 258 | 657903 | KAK 340 | 516842 | PEBBLE BEACH 4751 |
| 644467 | KAK 171 | 649703 | KAK 259 | 657904 | KAK 341 | 516843 | PEBBLE BEACH 4752 |
| 644468 | KAK 172 | 649704 | KAK 260 | 657905 | KAK 342 | 516844 | PEBBLE BEACH 4753 |
| 644469 | KAK 173 | 649705 | KAK 261 | 657906 | KAK 343 | 516845 | PEBBLE BEACH 4851 |
| 644470 | KAK 174 | 649706 | KAK 262 | 657915 | KAK 352 | 516846 | PEBBLE BEACH 4852 |
| 644471 | KAK 175 | 649707 | KAK 263 | 657916 | KAK 353 | 516847 | PEBBLE BEACH 4853 |
| 644472 | KAK 176 | 649708 | KAK 264 | 657917 | KAK 354 | 516848 | PEBBLE BEACH 4951 |
| 644473 | KAK 177 | 649709 | KAK 265 | 657918 | KAK 355 | 516849 | PEBBLE BEACH 4952 |
| 644474 | KAK 178 | 649710 | KAK 266 | 657927 | KAK 364 | 516850 | PEBBLE BEACH 4953 |
| 644475 | KAK 179 | 649711 | KAK 267 | 657928 | KAK 365 | 516851 | PEBBLE BEACH 5048 |
| 644476 | KAK 180 | 649712 | KAK 268 | 657929 | KAK 366 | 516852 | PEBBLE BEACH 5049 |
| 644477 | KAK 181 | 649713 | KAK 269 | 657930 | KAK 367 |
| |
| Pebble Project | Appendix A |
| NI 43-101 Technical Report Update and Preliminary Economic Assessment | August 21, 2023 |
|
|
|
| 516853 | PEBBLE BEACH 5050 | 524540 | SILL 6244 | 524784 | PEBBLE BEACH 4248 | 524853 | PEBBLE BEACH 6250 |
| 516854 | PEBBLE BEACH 5051 | 524541 | SILL 6245 | 524785 | PEBBLE BEACH 4249 | 524854 | PEBBLE BEACH 6251 |
| 516855 | PEBBLE BEACH 5052 | 524542 | SILL 6246 | 524786 | PEBBLE BEACH 4255 | 524855 | PEBBLE BEACH 6252 |
| 516856 | PEBBLE BEACH 5053 | 524543 | SILL 6343 | 524787 | PEBBLE BEACH 4348 | 524856 | PEBBLE BEACH 6253 |
| 516857 | PEBBLE BEACH 5148 | 524544 | SILL 6344 | 524788 | PEBBLE BEACH 4349 | 524857 | PEBBLE BEACH 6254 |
| 516858 | PEBBLE BEACH 5149 | 524550 | SILL 6443 | 524789 | PEBBLE BEACH 4355 | 524858 | PEBBLE BEACH 6348 |
| 516859 | PEBBLE BEACH 5150 | 524551 | SILL 6444 | 524790 | PEBBLE BEACH 4448 | 524859 | PEBBLE BEACH 6349 |
| 516860 | PEBBLE BEACH 5151 | 524557 | SILL 6543 | 524791 | PEBBLE BEACH 4449 | 524860 | PEBBLE BEACH 6350 |
| 516861 | PEBBLE BEACH 5152 | 524558 | SILL 6544 | 524792 | PEBBLE BEACH 4450 | 524861 | PEBBLE BEACH 6351 |
| 516862 | PEBBLE BEACH 5153 | 524568 | SILL 6643 | 524793 | PEBBLE BEACH 4454 | 524862 | PEBBLE BEACH 6352 |
| 516863 | PEBBLE BEACH 5248 | 524569 | SILL 6644 | 524794 | PEBBLE BEACH 4455 | 524863 | PEBBLE BEACH 6353 |
| 516864 | PEBBLE BEACH 5249 | 524579 | SILL 6743 | 524795 | PEBBLE BEACH 4548 | 524864 | PEBBLE BEACH 6354 |
| 516865 | PEBBLE BEACH 5250 | 524580 | SILL 6744 | 524796 | PEBBLE BEACH 4549 | 525849 | PEBBLE BEACH 6152 |
| 516866 | PEBBLE BEACH 5251 | 524595 | SILL 6843 | 524797 | PEBBLE BEACH 4550 | 531355 | PEBBLE BEACH 3642 |
| 516867 | PEBBLE BEACH 5252 | 524596 | SILL 6844 | 524798 | PEBBLE BEACH 4554 | 531356 | PEBBLE BEACH 3643 |
| 516868 | PEBBLE BEACH 5253 | 524611 | SILL 6943 | 524799 | PEBBLE BEACH 4555 | 531357 | PEBBLE BEACH 3644 |
| 516869 | PEBBLE BEACH 5348 | 524612 | SILL 6944 | 524800 | PEBBLE BEACH 4648 | 531358 | PEBBLE BEACH 3645 |
| 516870 | PEBBLE BEACH 5349 | 524630 | SILL 7043 | 524801 | PEBBLE BEACH 4649 | 531359 | PEBBLE BEACH 3742 |
| 516871 | PEBBLE BEACH 5350 | 524631 | SILL 7044 | 524802 | PEBBLE BEACH 4650 | 531360 | PEBBLE BEACH 3743 |
| 516872 | PEBBLE BEACH 5351 | 524649 | SILL 7143 | 524803 | PEBBLE BEACH 4654 | 531361 | PEBBLE BEACH 3744 |
| 516873 | PEBBLE BEACH 5352 | 524650 | SILL 7144 | 524804 | PEBBLE BEACH 4655 | 531362 | PEBBLE BEACH 3745 |
| 516874 | PEBBLE BEACH 5353 | 524668 | SILL 7243 | 524805 | PEBBLE BEACH 4748 | 531363 | PEBBLE BEACH 3842 |
| 516879 | SILL 6351 | 524669 | SILL 7244 | 524806 | PEBBLE BEACH 4749 | 531364 | PEBBLE BEACH 3843 |
| 516880 | SILL 6352 | 524684 | SILL 7343 | 524807 | PEBBLE BEACH 4750 | 531365 | PEBBLE BEACH 3844 |
| 516888 | SILL 6451 | 524685 | SILL 7344 | 524808 | PEBBLE BEACH 4754 | 531366 | PEBBLE BEACH 3845 |
| 516889 | SILL 6452 | 524698 | SILL 7443 | 524809 | PEBBLE BEACH 4755 | 531367 | PEBBLE BEACH 3846 |
| 516948 | PEBBLE BEACH 3850 | 524699 | SILL 7444 | 524810 | PEBBLE BEACH 4848 | 531368 | PEBBLE BEACH 3847 |
| 516949 | PEBBLE BEACH 3851 | 524712 | SILL 7543 | 524811 | PEBBLE BEACH 4849 | 531369 | PEBBLE BEACH 3942 |
| 516950 | PEBBLE BEACH 3852 | 524713 | SILL 7544 | 524812 | PEBBLE BEACH 4850 | 531370 | PEBBLE BEACH 3943 |
| 516951 | PEBBLE BEACH 3950 | 524714 | SILL 7545 | 524813 | PEBBLE BEACH 4854 | 531371 | PEBBLE BEACH 3944 |
| 516952 | PEBBLE BEACH 3951 | 524715 | SILL 7546 | 524814 | PEBBLE BEACH 4855 | 531372 | PEBBLE BEACH 3945 |
| 516953 | PEBBLE BEACH 3952 | 524716 | SILL 7547 | 524815 | PEBBLE BEACH 4948 | 531373 | PEBBLE BEACH 3946 |
| 516954 | PEBBLE BEACH 4050 | 524717 | SILL 7548 | 524816 | PEBBLE BEACH 4949 | 531374 | PEBBLE BEACH 3947 |
| 516955 | PEBBLE BEACH 4051 | 524748 | PEBBLE BEACH 3452 | 524817 | PEBBLE BEACH 4950 | 531375 | PEBBLE BEACH 4042 |
| 516956 | PEBBLE BEACH 4052 | 524749 | PEBBLE BEACH 3453 | 524818 | PEBBLE BEACH 4954 | 531376 | PEBBLE BEACH 4043 |
| 516957 | PEBBLE BEACH 4150 | 524750 | PEBBLE BEACH 3454 | 524819 | PEBBLE BEACH 4955 | 531377 | PEBBLE BEACH 4044 |
| 516958 | PEBBLE BEACH 4151 | 524751 | PEBBLE BEACH 3455 | 524820 | PEBBLE BEACH 5054 | 531378 | PEBBLE BEACH 4045 |
| 516959 | PEBBLE BEACH 4152 | 524752 | PEBBLE BEACH 3552 | 524821 | PEBBLE BEACH 5055 | 531379 | PEBBLE BEACH 4046 |
| 516960 | PEBBLE BEACH 4250 | 524753 | PEBBLE BEACH 3553 | 524822 | PEBBLE BEACH 5154 | 531380 | PEBBLE BEACH 4047 |
| 516961 | PEBBLE BEACH 4251 | 524754 | PEBBLE BEACH 3554 | 524823 | PEBBLE BEACH 5155 | 531381 | PEBBLE BEACH 4142 |
| 516962 | PEBBLE BEACH 4252 | 524755 | PEBBLE BEACH 3555 | 524824 | PEBBLE BEACH 5254 | 531382 | PEBBLE BEACH 4143 |
| 516963 | PEBBLE BEACH 4253 | 524756 | PEBBLE BEACH 3652 | 524825 | PEBBLE BEACH 5255 | 531383 | PEBBLE BEACH 4144 |
| 516964 | PEBBLE BEACH 4254 | 524757 | PEBBLE BEACH 3653 | 524826 | PEBBLE BEACH 5354 | 531384 | PEBBLE BEACH 4145 |
| 516965 | PEBBLE BEACH 4350 | 524758 | PEBBLE BEACH 3654 | 524827 | PEBBLE BEACH 5355 | 531385 | PEBBLE BEACH 4146 |
| 516966 | PEBBLE BEACH 4351 | 524759 | PEBBLE BEACH 3655 | 524828 | PEBBLE BEACH 5455 | 531386 | PEBBLE BEACH 4147 |
| 516967 | PEBBLE BEACH 4352 | 524760 | PEBBLE BEACH 3752 | 524829 | PEBBLE BEACH 5648 | 531387 | PEBBLE BEACH 4244 |
| 516968 | PEBBLE BEACH 4353 | 524761 | PEBBLE BEACH 3753 | 524830 | PEBBLE BEACH 5649 | 531388 | PEBBLE BEACH 4245 |
| 516969 | PEBBLE BEACH 4354 | 524762 | PEBBLE BEACH 3754 | 524831 | PEBBLE BEACH 5650 | 531389 | PEBBLE BEACH 4246 |
| 516970 | PEBBLE BEACH 4451 | 524763 | PEBBLE BEACH 3755 | 524832 | PEBBLE BEACH 5748 | 531390 | PEBBLE BEACH 4247 |
| 516971 | PEBBLE BEACH 4452 | 524764 | PEBBLE BEACH 3848 | 524833 | PEBBLE BEACH 5749 | 531391 | PEBBLE BEACH 4344 |
| 516972 | PEBBLE BEACH 4453 | 524765 | PEBBLE BEACH 3849 | 524834 | PEBBLE BEACH 5750 | 531392 | PEBBLE BEACH 4345 |
| 516973 | PEBBLE BEACH 4551 | 524766 | PEBBLE BEACH 3853 | 524835 | PEBBLE BEACH 5848 | 531393 | PEBBLE BEACH 4346 |
| 516974 | PEBBLE BEACH 4552 | 524767 | PEBBLE BEACH 3854 | 524836 | PEBBLE BEACH 5849 | 531394 | PEBBLE BEACH 4347 |
| 516975 | PEBBLE BEACH 4553 | 524768 | PEBBLE BEACH 3855 | 524837 | PEBBLE BEACH 5850 | 531395 | PEBBLE BEACH 4444 |
| 524511 | SILL 5543 | 524769 | PEBBLE BEACH 3948 | 524838 | PEBBLE BEACH 5851 | 531396 | PEBBLE BEACH 4445 |
| 524512 | SILL 5544 | 524770 | PEBBLE BEACH 3949 | 524839 | PEBBLE BEACH 5948 | 531397 | PEBBLE BEACH 4446 |
| 524515 | SILL 5643 | 524771 | PEBBLE BEACH 3953 | 524840 | PEBBLE BEACH 5949 | 531398 | PEBBLE BEACH 4447 |
| 524516 | SILL 5644 | 524772 | PEBBLE BEACH 3954 | 524841 | PEBBLE BEACH 5950 | 531399 | PEBBLE BEACH 4544 |
| 524519 | SILL 5743 | 524773 | PEBBLE BEACH 3955 | 524842 | PEBBLE BEACH 5951 | 531400 | PEBBLE BEACH 4547 |
| PEBBLE WEST CLAIMS | 524774 | PEBBLE BEACH 4048 | 524843 | PEBBLE BEACH 6048 | 531401 | PEBBLE BEACH 4644 |
|
| ADL # | CLAIM NAME | 524775 | PEBBLE BEACH 4049 | 524844 | PEBBLE BEACH 6049 | 531402 | PEBBLE BEACH 4645 |
| 524520 | SILL 5744 | 524776 | PEBBLE BEACH 4053 | 524845 | PEBBLE BEACH 6050 | 531403 | PEBBLE BEACH 4646 |
| 524523 | SILL 5843 | 524777 | PEBBLE BEACH 4054 | 524846 | PEBBLE BEACH 6051 | 531404 | PEBBLE BEACH 4647 |
| 524524 | SILL 5844 |
|
| 524847 | PEBBLE BEACH 6148 | 531405 | PEBBLE BEACH 4744 |
| 524527 | SILL 5943 | ADL # | CLAIM NAME | 524848 | PEBBLE BEACH 6149 | 531406 | PEBBLE BEACH 4745 |
| 524528 | SILL 5944 | 524778 | PEBBLE BEACH 4055 | 524849 | PEBBLE BEACH 6150 | 531407 | PEBBLE BEACH 4746 |
| 524531 | SILL 6043 | 524779 | PEBBLE BEACH 4148 | 524850 | PEBBLE BEACH 6151 | 531408 | PEBBLE BEACH 4747 |
| 524532 | SILL 6044 | 524780 | PEBBLE BEACH 4149 |
|
| 531409 | PEBBLE BEACH 4844 |
| 524535 | SILL 6143 | 524781 | PEBBLE BEACH 4153 | ADL # | CLAIM NAME | 531410 | PEBBLE BEACH 4845 |
| 524536 | SILL 6144 | 524782 | PEBBLE BEACH 4154 | 524851 | PEBBLE BEACH 6248 | 531411 | PEBBLE BEACH 4846 |
| 524539 | SILL 6243 | 524783 | PEBBLE BEACH 4155 | 524852 | PEBBLE BEACH 6249 | 531412 | PEBBLE BEACH 4847 |
| Pebble Project | Appendix A |
| NI 43-101 Technical Report Update and Preliminary Economic Assessment | August 21, 2023 |
|
|
|
|
|
| 540414 | PEBBLE BEACH 6454 | 542562 | PEBBLE BEACH 4956 | 566373 | PEBBLE BEACH 2242 |
| ADL # | CLAIM NAME | 540415 | PEBBLE BEACH 6455 | 542563 | PEBBLE BEACH 5056 | 566407 | PEBBLE BEACH 2336 |
| 531413 | PEBBLE BEACH 4944 | 540416 | PEBBLE BEACH 6548 | 542564 | PEBBLE BEACH 5156 | 566408 | PEBBLE BEACH 2337 |
| 531414 | PEBBLE BEACH 4945 | 540417 | PEBBLE BEACH 6549 | 542565 | PEBBLE BEACH 5256 | 566409 | PEBBLE BEACH 2338 |
| 531415 | PEBBLE BEACH 4946 | PEBBLE WEST CLAIMS | 542566 | PEBBLE BEACH 5356 | 566410 | PEBBLE BEACH 2339 |
|
| 531416 | PEBBLE BEACH 4947 | ADL # | CLAIM NAME | 542567 | PEBBLE BEACH 5456 | 566411 | PEBBLE BEACH 2340 |
| 531417 | PEBBLE BEACH 5044 | 540418 | PEBBLE BEACH 6550 | 542568 | PEBBLE BEACH 5556 | 566412 | PEBBLE BEACH 2341 |
| 531418 | PEBBLE BEACH 5045 | 540419 | PEBBLE BEACH 6551 | 542569 | PEBBLE BEACH 5656 | 566413 | PEBBLE BEACH 2342 |
| 531419 | PEBBLE BEACH 5046 | 540420 | PEBBLE BEACH 6552 |
|
| 566447 | PEBBLE BEACH 2436 |
| 531420 | PEBBLE BEACH 5047 | 540421 | PEBBLE BEACH 6553 | ADL # | CLAIM NAME | 566448 | PEBBLE BEACH 2437 |
| 531421 | PEBBLE BEACH 5144 | 540422 | PEBBLE BEACH 6554 | 542570 | PEBBLE BEACH 5756 | 566449 | PEBBLE BEACH 2438 |
| 531422 | PEBBLE BEACH 5145 | 540423 | PEBBLE BEACH 6555 | 542571 | PEBBLE BEACH 5856 | 566450 | PEBBLE BEACH 2439 |
| 531423 | PEBBLE BEACH 5146 | 540424 | SILL 7643 | 542572 | PEBBLE BEACH 5956 |
|
|
| 531424 | PEBBLE BEACH 5147 | 540425 | SILL 7644 | 542573 | PEBBLE BEACH 6056 | ADL # | CLAIM NAME |
| 531425 | PEBBLE BEACH 5244 | 540426 | SILL 7645 | 542574 | PEBBLE BEACH 6156 | 566451 | PEBBLE BEACH 2440 |
| 531426 | PEBBLE BEACH 5245 | 540427 | SILL 7646 | 542575 | PEBBLE BEACH 6256 | 566452 | PEBBLE BEACH 2441 |
| 531427 | PEBBLE BEACH 5246 | 540428 | SILL 7647 | 542576 | PEBBLE BEACH 6356 | 566453 | PEBBLE BEACH 2442 |
| 531428 | PEBBLE BEACH 5247 | 540429 | SILL 7648 | 542577 | PEBBLE BEACH 6456 | 566487 | PEBBLE BEACH 2536 |
| 531429 | PEBBLE BEACH 5344 | 540430 | SILL 7743 | 542578 | PEBBLE BEACH 6556 | 566488 | PEBBLE BEACH 2537 |
| 531430 | PEBBLE BEACH 5345 | 540431 | SILL 7744 | 542579 | PEBBLE BEACH 4642 | 566489 | PEBBLE BEACH 2538 |
| 531431 | PEBBLE BEACH 5346 | 540432 | SILL 7745 | 542580 | PEBBLE BEACH 4643 | 566490 | PEBBLE BEACH 2539 |
| 531432 | PEBBLE BEACH 5347 | 540433 | SILL 7746 | 542581 | PEBBLE BEACH 4742 | 566491 | PEBBLE BEACH 2540 |
| 531433 | PEBBLE BEACH 5444 | 540434 | SILL 7747 | 542582 | PEBBLE BEACH 4743 | 566492 | PEBBLE BEACH 2541 |
| 531434 | PEBBLE BEACH 5445 | 540435 | SILL 7748 | 542583 | PEBBLE BEACH 4842 | 566527 | PEBBLE BEACH 2636 |
| 531435 | PEBBLE BEACH 5446 | 540436 | SILL 7843 | 542584 | PEBBLE BEACH 4843 | 566528 | PEBBLE BEACH 2637 |
| 531436 | PEBBLE BEACH 5447 | 540437 | SILL 7844 | 542585 | PEBBLE BEACH 4942 | 566529 | PEBBLE BEACH 2638 |
| 531437 | PEBBLE BEACH 5544 | 540438 | SILL 7845 | 542586 | PEBBLE BEACH 4943 | 566530 | PEBBLE BEACH 2639 |
| 531438 | PEBBLE BEACH 5545 | 540439 | SILL 7846 | 542587 | PEBBLE BEACH 5042 | 566531 | PEBBLE BEACH 2640 |
| 531439 | PEBBLE BEACH 5546 | 540440 | SILL 7847 | 542588 | PEBBLE BEACH 5043 | 566532 | PEBBLE BEACH 2641 |
| 531440 | PEBBLE BEACH 5547 | 540441 | SILL 7848 | 542589 | PEBBLE BEACH 5142 | 566567 | PEBBLE BEACH 2736 |
| 531441 | PEBBLE BEACH 5644 | 540442 | SILL 7943 | 542590 | PEBBLE BEACH 5143 | 566568 | PEBBLE BEACH 2737 |
| 531442 | PEBBLE BEACH 5645 | 540443 | SILL 7944 | 542591 | PEBBLE BEACH 5242 | 566569 | PEBBLE BEACH 2738 |
| 531443 | PEBBLE BEACH 5646 | 540444 | SILL 7945 | 542592 | PEBBLE BEACH 5243 | 566570 | PEBBLE BEACH 2739 |
| 531444 | PEBBLE BEACH 5647 | 540445 | SILL 7946 | 542593 | PEBBLE BEACH 5342 | 566571 | PEBBLE BEACH 2740 |
| 531445 | PEBBLE BEACH 5744 | 540446 | SILL 7947 | 542594 | PEBBLE BEACH 5343 | 566572 | PEBBLE BEACH 2741 |
| 531446 | PEBBLE BEACH 5745 | 540447 | SILL 7948 | 542595 | PEBBLE BEACH 5442 | 566607 | PEBBLE BEACH 3138 |
| 531447 | PEBBLE BEACH 5746 | 540448 | SILL 8043 | 542596 | PEBBLE BEACH 5443 | 566608 | PEBBLE BEACH 3139 |
| 531448 | PEBBLE BEACH 5747 | 540449 | SILL 8044 | 542597 | PEBBLE BEACH 5542 | 566609 | PEBBLE BEACH 3140 |
| 531449 | PEBBLE BEACH 5844 | 540450 | SILL 8045 | 542598 | PEBBLE BEACH 5543 | 566610 | PEBBLE BEACH 3141 |
| 531450 | PEBBLE BEACH 5845 | 540451 | SILL 8046 | 542599 | PEBBLE BEACH 5642 | 566637 | PEBBLE BEACH 2938 |
| 531451 | PEBBLE BEACH 5846 | 540452 | SILL 8047 | 542600 | PEBBLE BEACH 5643 | 566638 | PEBBLE BEACH 2939 |
| 531452 | PEBBLE BEACH 5847 | 540453 | SILL 8048 | 542601 | PEBBLE BEACH 5742 | 566639 | PEBBLE BEACH 2940 |
| 531453 | PEBBLE BEACH 5944 | 540454 | SILL 8143 | 542602 | PEBBLE BEACH 5743 | 566640 | PEBBLE BEACH 2941 |
| 531454 | PEBBLE BEACH 5945 | 540455 | SILL 8144 | 542603 | PEBBLE BEACH 5842 | 566655 | PEBBLE BEACH 2836 |
| 531455 | PEBBLE BEACH 5946 | 540456 | SILL 8145 | 542604 | PEBBLE BEACH 5843 | 566656 | PEBBLE BEACH 2837 |
| 531456 | PEBBLE BEACH 5947 | 540457 | SILL 8146 | 552929 | SOUTH PEBBLE 171 | 566657 | PEBBLE BEACH 2838 |
| 531457 | PEBBLE BEACH 6044 | 540458 | SILL 8147 | 552930 | SOUTH PEBBLE 172 | 566658 | PEBBLE BEACH 2839 |
| 531458 | PEBBLE BEACH 6045 | 540459 | SILL 8148 | 566247 | PEBBLE BEACH 1936 | 566659 | PEBBLE BEACH 2840 |
| 531459 | PEBBLE BEACH 6046 | 540460 | SILL 8243 | 566248 | PEBBLE BEACH 1937 | 566660 | PEBBLE BEACH 2841 |
| 531460 | PEBBLE BEACH 6047 | 540461 | SILL 8244 | 566249 | PEBBLE BEACH 1938 | 566697 | PEBBLE BEACH 3238 |
| 531461 | PEBBLE BEACH 6144 | 540462 | SILL 8245 | 566250 | PEBBLE BEACH 1939 | 566698 | PEBBLE BEACH 3239 |
| 531462 | PEBBLE BEACH 6145 | 540463 | SILL 8246 | 566251 | PEBBLE BEACH 1940 | 566699 | PEBBLE BEACH 3240 |
| 531463 | PEBBLE BEACH 6146 | 540464 | SILL 8247 | 566252 | PEBBLE BEACH 1941 | 566700 | PEBBLE BEACH 3241 |
| 531464 | PEBBLE BEACH 6147 | 540465 | SILL 8248 | 566287 | PEBBLE BEACH 2036 | 566701 | PEBBLE BEACH 3242 |
| 531648 | PEBBLE BEACH 4545 | 540466 | SILL 8343 | 566288 | PEBBLE BEACH 2037 | 566737 | PEBBLE BEACH 3038 |
| 531649 | PEBBLE BEACH 4546 | 540467 | SILL 8344 | 566289 | PEBBLE BEACH 2038 | 566738 | PEBBLE BEACH 3039 |
| 540399 | PEBBLE BEACH 5555 | 540468 | SILL 8443 | 566290 | PEBBLE BEACH 2039 | 566739 | PEBBLE BEACH 3040 |
| 540400 | PEBBLE BEACH 5655 | 540469 | SILL 8444 | 566291 | PEBBLE BEACH 2040 | 566740 | PEBBLE BEACH 3041 |
| 540401 | PEBBLE BEACH 5755 | 540470 | SILL 8543 | 566292 | PEBBLE BEACH 2041 | 566751 | PEBBLE BEACH 3252 |
| 540402 | PEBBLE BEACH 5855 | 540471 | SILL 8544 | 566327 | PEBBLE BEACH 2136 | 566752 | PEBBLE BEACH 3253 |
| 540403 | PEBBLE BEACH 5955 | 540472 | SILL 8643 | 566328 | PEBBLE BEACH 2137 | 566753 | PEBBLE BEACH 3254 |
| 540404 | PEBBLE BEACH 6055 | 540473 | SILL 8644 | 566329 | PEBBLE BEACH 2138 | 566754 | PEBBLE BEACH 3255 |
| 540405 | PEBBLE BEACH 6155 | 541245 | PB 113 | 566330 | PEBBLE BEACH 2139 | 566767 | PEBBLE BEACH 3338 |
| 540406 | PEBBLE BEACH 6255 | 541246 | PB 114 | 566331 | PEBBLE BEACH 2140 | 566768 | PEBBLE BEACH 3339 |
| 540407 | PEBBLE BEACH 6355 | 541247 | PB 115 | 566332 | PEBBLE BEACH 2141 | 566769 | PEBBLE BEACH 3340 |
| 540408 | PEBBLE BEACH 6448 | 541248 | PB 116 | 566367 | PEBBLE BEACH 2236 | 566770 | PEBBLE BEACH 3341 |
| 540409 | PEBBLE BEACH 6449 | 541249 | PB 117 | 566368 | PEBBLE BEACH 2237 | 566771 | PEBBLE BEACH 3342 |
| 540410 | PEBBLE BEACH 6450 | 541250 | PB 118 | 566369 | PEBBLE BEACH 2238 | 566781 | PEBBLE BEACH 3352 |
| 540411 | PEBBLE BEACH 6451 | 541251 | PB 119 | 566370 | PEBBLE BEACH 2239 | 566782 | PEBBLE BEACH 3353 |
| 540412 | PEBBLE BEACH 6452 | 541252 | PB 120 | 566371 | PEBBLE BEACH 2240 | 566783 | PEBBLE BEACH 3354 |
| 540413 | PEBBLE BEACH 6453 | 542561 | PEBBLE BEACH 4856 | 566372 | PEBBLE BEACH 2241 | 566784 | PEBBLE BEACH 3355 |
| Pebble Project | Appendix A |
| NI 43-101 Technical Report Update and Preliminary Economic Assessment | August 21, 2023 |
|
|
|
| 566793 | PEBBLE BEACH 3438 | 566918 | PEBBLE BEACH 4439 | 566987 | PEBBLE BEACH 6040 | 567106 | PEBBLE BEACH 6950 |
| 566794 | PEBBLE BEACH 3439 | 566919 | PEBBLE BEACH 4440 | 566988 | PEBBLE BEACH 6041 | 567107 | PEBBLE BEACH 6951 |
| 566795 | PEBBLE BEACH 3440 | 566920 | PEBBLE BEACH 4441 | 566989 | PEBBLE BEACH 6042 | 567841 | SILL 5343 |
| 566796 | PEBBLE BEACH 3441 | 566921 | PEBBLE BEACH 4442 | 566990 | PEBBLE BEACH 6043 | 567842 | SILL 5344 |
| 566797 | PEBBLE BEACH 3446 | 566922 | PEBBLE BEACH 4443 | 566991 | PEBBLE BEACH 6138 | 567843 | SILL 5345 |
| 566798 | PEBBLE BEACH 3447 | 566923 | PEBBLE BEACH 4538 | 566992 | PEBBLE BEACH 6139 | 567844 | SILL 5346 |
| 566799 | PEBBLE BEACH 3448 | 566924 | PEBBLE BEACH 4539 | 566993 | PEBBLE BEACH 6140 | 567845 | SILL 5347 |
| 566800 | PEBBLE BEACH 3449 | 566925 | PEBBLE BEACH 4540 | 566994 | PEBBLE BEACH 6141 | 567855 | SILL 5443 |
| 566801 | PEBBLE BEACH 3450 | 566926 | PEBBLE BEACH 4541 | 566995 | PEBBLE BEACH 6142 | 567856 | SILL 5444 |
| 566802 | PEBBLE BEACH 3451 | 566927 | PEBBLE BEACH 4542 | 566996 | PEBBLE BEACH 6143 | 567857 | SILL 5445 |
| 566811 | PEBBLE BEACH 3538 | 566928 | PEBBLE BEACH 4543 | 566997 | PEBBLE BEACH 6238 | 567858 | SILL 5446 |
| 566812 | PEBBLE BEACH 3539 | 566929 | PEBBLE BEACH 4638 | 566998 | PEBBLE BEACH 6239 | 567859 | SILL 5447 |
| 566813 | PEBBLE BEACH 3540 | 566930 | PEBBLE BEACH 4639 | 566999 | PEBBLE BEACH 6240 | 567860 | SILL 5448 |
| 566814 | PEBBLE BEACH 3541 | 566931 | PEBBLE BEACH 4640 | 567000 | PEBBLE BEACH 6241 | 567869 | SILL 5545 |
| 566815 | PEBBLE BEACH 3546 | 566932 | PEBBLE BEACH 4641 | 567001 | PEBBLE BEACH 6242 | 567870 | SILL 5546 |
| 566816 | PEBBLE BEACH 3547 | 566933 | PEBBLE BEACH 4738 | 567002 | PEBBLE BEACH 6243 | 567871 | SILL 5547 |
|
|
| 566934 | PEBBLE BEACH 4739 | 567003 | PEBBLE BEACH 6244 | 567872 | SILL 5548 |
| ADL # | CLAIM NAME | 566935 | PEBBLE BEACH 4740 | 567004 | PEBBLE BEACH 6245 | 567873 | SILL 5549 |
| 566817 | PEBBLE BEACH 3548 | 566936 | PEBBLE BEACH 4741 | 567005 | PEBBLE BEACH 6246 | 567881 | SILL 5645 |
| 566818 | PEBBLE BEACH 3549 | 566937 | PEBBLE BEACH 4838 | 567006 | PEBBLE BEACH 6247 | 567882 | SILL 5646 |
| 566819 | PEBBLE BEACH 3550 | PEBBLE WEST CLAIMS | 567007 | PEBBLE BEACH 6338 | 567883 | SILL 5647 |
|
| 566820 | PEBBLE BEACH 3551 | ADL # | CLAIM NAME | 567008 | PEBBLE BEACH 6339 | 567884 | SILL 5648 |
| 566829 | PEBBLE BEACH 3638 | 566938 | PEBBLE BEACH 4839 | 567009 | PEBBLE BEACH 6340 | 567885 | SILL 5649 |
| 566830 | PEBBLE BEACH 3639 | 566939 | PEBBLE BEACH 4840 | 567010 | PEBBLE BEACH 6341 | 567886 | SILL 5650 |
| 566831 | PEBBLE BEACH 3640 | 566940 | PEBBLE BEACH 4841 |
|
| 567893 | SILL 5745 |
| 566832 | PEBBLE BEACH 3641 | 566941 | PEBBLE BEACH 4938 | ADL # | CLAIM NAME | 567894 | SILL 5746 |
| 566833 | PEBBLE BEACH 3646 | 566942 | PEBBLE BEACH 4939 | 567011 | PEBBLE BEACH 6342 | 567895 | SILL 5747 |
| 566834 | PEBBLE BEACH 3647 | 566943 | PEBBLE BEACH 4940 | 567012 | PEBBLE BEACH 6343 | 567896 | SILL 5748 |
| 566835 | PEBBLE BEACH 3648 | 566944 | PEBBLE BEACH 4941 | 567013 | PEBBLE BEACH 6344 |
|
|
| 566836 | PEBBLE BEACH 3649 | 566945 | PEBBLE BEACH 5038 | 567014 | PEBBLE BEACH 6345 | ADL # | CLAIM NAME |
| 566837 | PEBBLE BEACH 3650 | 566946 | PEBBLE BEACH 5039 | 567015 | PEBBLE BEACH 6346 | 567897 | SILL 5749 |
| 566838 | PEBBLE BEACH 3651 | 566947 | PEBBLE BEACH 5040 | 567016 | PEBBLE BEACH 6347 | 567898 | SILL 5750 |
| 566847 | PEBBLE BEACH 3738 | 566948 | PEBBLE BEACH 5041 | 567017 | PEBBLE BEACH 6438 | 567905 | SILL 5845 |
| 566848 | PEBBLE BEACH 3739 | 566949 | PEBBLE BEACH 5138 | 567018 | PEBBLE BEACH 6439 | 567906 | SILL 5846 |
| 566849 | PEBBLE BEACH 3740 | 566950 | PEBBLE BEACH 5139 | 567019 | PEBBLE BEACH 6440 | 567907 | SILL 5847 |
| 566850 | PEBBLE BEACH 3741 | 566951 | PEBBLE BEACH 5140 | 567020 | PEBBLE BEACH 6441 | 567908 | SILL 5848 |
| 566851 | PEBBLE BEACH 3746 | 566952 | PEBBLE BEACH 5141 | 567021 | PEBBLE BEACH 6442 | 567909 | SILL 5849 |
| 566852 | PEBBLE BEACH 3747 | 566953 | PEBBLE BEACH 5238 | 567022 | PEBBLE BEACH 6443 | 567910 | SILL 5850 |
| 566853 | PEBBLE BEACH 3748 | 566954 | PEBBLE BEACH 5239 | 567023 | PEBBLE BEACH 6444 | 567911 | SILL 5851 |
| 566854 | PEBBLE BEACH 3749 | 566955 | PEBBLE BEACH 5240 | 567024 | PEBBLE BEACH 6445 | 567917 | SILL 5945 |
| 566855 | PEBBLE BEACH 3750 | 566956 | PEBBLE BEACH 5241 | 567025 | PEBBLE BEACH 6446 | 567918 | SILL 5946 |
| 566856 | PEBBLE BEACH 3751 | 566957 | PEBBLE BEACH 5338 | 567026 | PEBBLE BEACH 6447 | 567919 | SILL 5947 |
| 566865 | PEBBLE BEACH 3838 | 566958 | PEBBLE BEACH 5339 | 567035 | PEBBLE BEACH 6546 | 567920 | SILL 5948 |
| 566866 | PEBBLE BEACH 3839 | 566959 | PEBBLE BEACH 5340 | 567036 | PEBBLE BEACH 6547 | 567921 | SILL 5949 |
| 566867 | PEBBLE BEACH 3840 | 566960 | PEBBLE BEACH 5341 | 567045 | PEBBLE BEACH 6646 | 567922 | SILL 5950 |
| 566868 | PEBBLE BEACH 3841 | 566961 | PEBBLE BEACH 5438 | 567046 | PEBBLE BEACH 6647 | 567923 | SILL 5953 |
| 566877 | PEBBLE BEACH 3938 | 566962 | PEBBLE BEACH 5439 | 567047 | PEBBLE BEACH 6648 | 567927 | SILL 6045 |
| 566878 | PEBBLE BEACH 3939 | 566963 | PEBBLE BEACH 5440 | 567048 | PEBBLE BEACH 6649 | 567928 | SILL 6046 |
| 566879 | PEBBLE BEACH 3940 | 566964 | PEBBLE BEACH 5441 | 567049 | PEBBLE BEACH 6650 | 567929 | SILL 6047 |
| 566880 | PEBBLE BEACH 3941 | 566965 | PEBBLE BEACH 5538 | 567050 | PEBBLE BEACH 6651 | 567930 | SILL 6048 |
| 566889 | PEBBLE BEACH 4038 | 566966 | PEBBLE BEACH 5539 | 567051 | PEBBLE BEACH 6652 | 567931 | SILL 6049 |
| 566890 | PEBBLE BEACH 4039 | 566967 | PEBBLE BEACH 5540 | 567052 | PEBBLE BEACH 6653 | 567932 | SILL 6050 |
| 566891 | PEBBLE BEACH 4040 | 566968 | PEBBLE BEACH 5541 | 567053 | PEBBLE BEACH 6654 | 567933 | SILL 6053 |
| 566892 | PEBBLE BEACH 4041 | 566969 | PEBBLE BEACH 5638 | 567054 | PEBBLE BEACH 6655 | 567937 | SILL 6145 |
| 566901 | PEBBLE BEACH 4138 | 566970 | PEBBLE BEACH 5639 | 567055 | PEBBLE BEACH 6656 | 567938 | SILL 6146 |
| 566902 | PEBBLE BEACH 4139 | 566971 | PEBBLE BEACH 5640 | 567064 | PEBBLE BEACH 6746 | 567939 | SILL 6147 |
| 566903 | PEBBLE BEACH 4140 | 566972 | PEBBLE BEACH 5641 | 567065 | PEBBLE BEACH 6747 | 567940 | SILL 6148 |
| 566904 | PEBBLE BEACH 4141 | 566973 | PEBBLE BEACH 5738 | 567066 | PEBBLE BEACH 6748 | 567941 | SILL 6149 |
| 566905 | PEBBLE BEACH 4238 | 566974 | PEBBLE BEACH 5739 | 567067 | PEBBLE BEACH 6749 | 567942 | SILL 6150 |
| 566906 | PEBBLE BEACH 4239 | 566975 | PEBBLE BEACH 5740 | 567068 | PEBBLE BEACH 6750 | 567943 | SILL 6153 |
| 566907 | PEBBLE BEACH 4240 | 566976 | PEBBLE BEACH 5741 | 567069 | PEBBLE BEACH 6751 | 567944 | SILL 6154 |
| 566908 | PEBBLE BEACH 4241 | 566977 | PEBBLE BEACH 5838 | 567083 | PEBBLE BEACH 6846 | 567947 | SILL 6253 |
| 566909 | PEBBLE BEACH 4242 | 566978 | PEBBLE BEACH 5839 | 567084 | PEBBLE BEACH 6847 | 567948 | SILL 6254 |
| 566910 | PEBBLE BEACH 4243 | 566979 | PEBBLE BEACH 5840 | 567085 | PEBBLE BEACH 6848 | 567949 | SILL 6255 |
| 566911 | PEBBLE BEACH 4338 | 566980 | PEBBLE BEACH 5841 | 567086 | PEBBLE BEACH 6849 | 567951 | SILL 6345 |
| 566912 | PEBBLE BEACH 4339 | 566981 | PEBBLE BEACH 5938 | 567087 | PEBBLE BEACH 6850 | 567952 | SILL 6346 |
| 566913 | PEBBLE BEACH 4340 | 566982 | PEBBLE BEACH 5939 | 567088 | PEBBLE BEACH 6851 | 567953 | SILL 6347 |
| 566914 | PEBBLE BEACH 4341 | 566983 | PEBBLE BEACH 5940 | 567102 | PEBBLE BEACH 6946 | 567954 | SILL 6348 |
| 566915 | PEBBLE BEACH 4342 | 566984 | PEBBLE BEACH 5941 | 567103 | PEBBLE BEACH 6947 | 567955 | SILL 6349 |
| 566916 | PEBBLE BEACH 4343 | 566985 | PEBBLE BEACH 6038 | 567104 | PEBBLE BEACH 6948 | 567956 | SILL 6350 |
| 566917 | PEBBLE BEACH 4438 | 566986 | PEBBLE BEACH 6039 | 567105 | PEBBLE BEACH 6949 | 567957 | SILL 6353 |
| Pebble Project | Appendix A |
| NI 43-101 Technical Report Update and Preliminary Economic Assessment | August 21, 2023 |
|
|
|
| 567958 | SILL 6354 | 642835 | BC 347 | 643438 | BC 1007 |
|
| 567959 | SILL 6355 | 642836 | BC 348 | 643439 | BC 1008 |
|
| 567960 | SILL 6356 | 642837 | BC 349 | 643440 | BC 1009 |
|
| 567961 | SILL 6445 | 642838 | BC 350 | 643441 | BC 1010 |
|
| 567962 | SILL 6446 | 642839 | BC 351 | 644292 | SP 181 |
|
| 567963 | SILL 6447 | 642840 | BC 352 | 644293 | SP 182 |
|
| 567964 | SILL 6448 | 642841 | BC 353 | 644294 | SP 183 |
|
| 567965 | SILL 6449 | 642842 | BC 354 | 644295 | SP 184 |
|
| 567966 | SILL 6450 | 642843 | BC 355 | 644296 | SP 185 |
|
| 567967 | SILL 6453 | 642850 | BC 362 | 644297 | SP 186 |
|
| 567968 | SILL 6454 | 642851 | BC 363 | 644298 | SP 187 |
|
| 567969 | SILL 6455 | 642852 | BC 364 | 644299 | SP 188 |
|
| 567970 | SILL 6456 | 642853 | BC 365 | 644300 | SP 189 |
|
| 567971 | SILL 6545 | 642854 | BC 366 | 644301 | SP 190 |
|
| 567972 | SILL 6546 | 642855 | BC 367 | 644318 | SP 207 |
|
| 567973 | SILL 6547 | 642856 | BC 368 | 644319 | SP 208 |
|
| 567974 | SILL 6548 | 642857 | BC 369 | 644320 | SP 209 |
|
| 567975 | SILL 6549 | 642858 | BC 370 | 644321 | SP 210 |
|
| 567976 | SILL 6550 | 642859 | BC 371 | 644322 | SP 216 |
|
| 567977 | SILL 6551 | 642860 | BC 372 | 644323 | SP 225 |
|
| 567978 | SILL 6552 | 642861 | BC 373 | 644324 | SP 226 |
|
| 567979 | SILL 6553 | 642862 | BC 374 | ADL # | CLAIM NAME |
|
| 567980 | SILL 6554 | 642869 | BC 381 | 644325 | SP 227 |
|
| 567981 | SILL 6555 | 642870 | BC 382 | 644326 | SP 228 |
|
| 567982 | SILL 6556 | 642871 | BC 383 | 644327 | SP 229 |
|
| 568175 | SILL 8345 | 642872 | BC 384 | 644328 | SP 230 |
|
| 568176 | SILL 8346 | 642873 | BC 385 | 644329 | SP 231 |
|
| 568177 | SILL 8347 | 642874 | BC 386 | 644330 | SP 232 |
|
| 568178 | SILL 8348 | 642875 | BC 387 | 644331 | SP 235 |
|
| 568255 | SILL 8743 | 642876 | BC 388 | 644332 | SP 236 |
|
| 568256 | SILL 8744 | 642877 | BC 389 | 644333 | SP 237 |
|
| 642755 | BC 267 | 642878 | BC 390 | 644334 | SP 238 |
|
|
|
| 642879 | BC 391 | 644335 | SP 239 |
|
| ADL # | CLAIM NAME | 642880 | BC 392 | 644336 | SP 245 |
|
| 642756 | BC 268 | 642881 | BC 393 | 644733 | SOUTH PEBBLE 234 |
|
| 642757 | BC 269 | 642888 | BC 400 | 644734 | SOUTH PEBBLE 240 |
|
| 642758 | BC 270 | PEBBLE WEST CLAIMS | 644735 | SOUTH PEBBLE 241 |
|
|
| 642759 | BC 271 | ADL # | CLAIM NAME | 644736 | SOUTH PEBBLE 242 |
|
| 642766 | BC 278 | 642889 | BC 401 | 644737 | SOUTH PEBBLE 243 |
|
| 642767 | BC 279 | 642890 | BC 402 | 644738 | SOUTH PEBBLE 244 |
|
| 642768 | BC 280 | 642891 | BC 403 | 645612 | SP 322 |
|
| 642769 | BC 281 | 642892 | BC 404 | 645613 | SP 323 |
|
| 642770 | BC 282 | 642893 | BC 405 | 645614 | SP 324 |
|
| 642777 | BC 289 | 642894 | BC 406 | 645615 | SP 325 |
|
| 642778 | BC 290 | 642895 | BC 407 | 645616 | SP 326 |
|
| 642779 | BC 291 | 642896 | BC 408 | 645617 | SP 327 |
|
| 642780 | BC 292 | 642897 | BC 409 | 645618 | SP 328 |
|
| 642781 | BC 293 | 642898 | BC 410 | 645630 | SP 340 |
|
| 642788 | BC 300 | 642899 | BC 411 | 645631 | SP 341 |
|
| 642789 | BC 301 | 642900 | BC 412 | 645632 | SP 342 |
|
| 642790 | BC 302 | 642907 | BC 419 | 645633 | SP 343 |
|
| 642791 | BC 303 | 642908 | BC 420 | 645634 | SP 344 |
|
| 642792 | BC 304 | 642909 | BC 421 | 645635 | SP 345 |
|
| 642799 | BC 311 | 642910 | BC 422 | 645642 | SP 352 |
|
| 642800 | BC 312 | 642911 | BC 423 | 645643 | SP 353 |
|
| 642801 | BC 313 | 642912 | BC 424 | 645644 | SP 354 |
|
| 642802 | BC 314 | 642913 | BC 425 | 645645 | SP 355 |
|
| 642803 | BC 315 | 642914 | BC 426 | 645646 | SP 356 |
|
| 642810 | BC 322 | 642915 | BC 427 | 645647 | SP 357 |
|
| 642811 | BC 323 | 642916 | BC 428 | 645654 | SP 364 |
|
| 642812 | BC 324 | 642917 | BC 429 | 645655 | SP 365 |
|
| 642813 | BC 325 | 642918 | BC 430 | 645656 | SP 366 |
|
| 642814 | BC 326 | 642919 | BC 431 | 645657 | SP 367 |
|
| 642821 | BC 333 | 643432 | BC 1001 | 645658 | SP 368 |
|
| 642822 | BC 334 |
|
| 645659 | SP 369 |
|
| 642823 | BC 335 | ADL # | CLAIM NAME |
|
|
|
| 642824 | BC 336 | 643433 | BC 1002 |
|
|
|
| 642825 | BC 337 | 643434 | BC 1003 |
|
|
|
| 642826 | BC 338 | 643435 | BC 1004 |
|
|
|
| 642827 | BC 339 | 643436 | BC 1005 |
|
|
|
| 642834 | BC 346 | 643437 | BC 1006 |
|
|
|
| Pebble Project | Appendix A |
| NI 43-101 Technical Report Update and Preliminary Economic Assessment | August 21, 2023 |
|
|
|
| SUMMARY: PEBBLE EAST CLAIMS 751 PEBBLE WEST CLAIMS 1089 TOTAL NUMBER OF CLAIMS 1840 |
| Resource Lands |
|
|
| Exploration Lands |
|
|
| Pebble Project | Appendix A |
| NI 43-101 Technical Report Update and Preliminary Economic Assessment | August 21, 2023 |