| Delaware | 001-37872 | 47-4257046 | ||||||||||||
| (State or other jurisdiction of incorporation) | (Commission File Number) | (I.R.S. Employer Identification No.) | ||||||||||||
| 2001 Westside Parkway | |||||||||||
| Suite 155 | |||||||||||
| Alpharetta, | Georgia | 30004 | |||||||||
| (Address of Principal Executive Offices) | (Zip Code) | ||||||||||
| Title of each class | Trading Symbol | Name of each exchange on which registered | ||||||||||||
| Common stock, $0.001 par value | PRTH | Nasdaq Global Market | ||||||||||||
| Exhibit Number | Description | ||||
| 104 | The cover page from this Current Report on Form 8-K, formatted in Inline XBRL | ||||
Dated: November 7, 2024 |
||||||||
| PRIORITY TECHNOLOGY HOLDINGS, INC. | ||||||||
| By: /s/ Timothy O'Leary | ||||||||
| Name: Timothy O'Leary | ||||||||
| Title: Chief Financial Officer | ||||||||

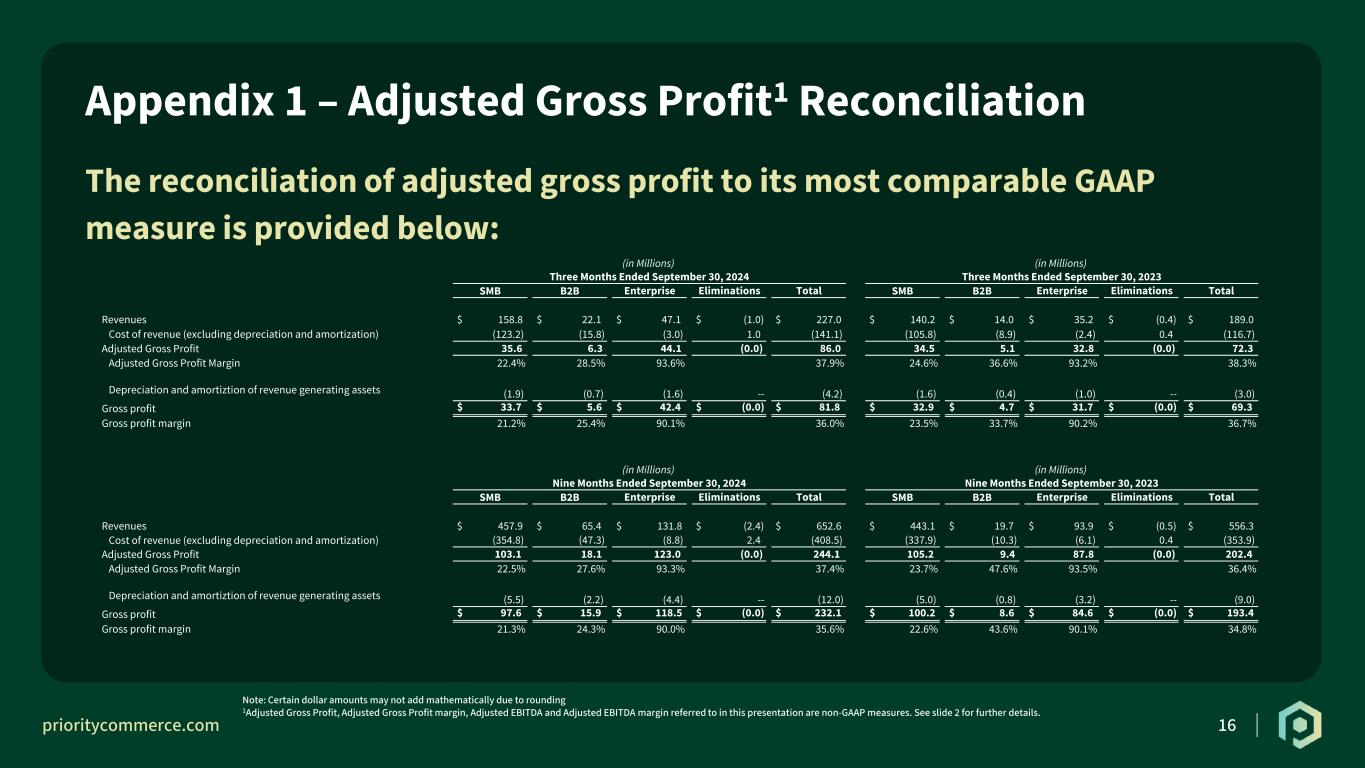
| (in thousands) | Three Months Ended September 30, | ||||||||||
| 2024 | 2023 | ||||||||||
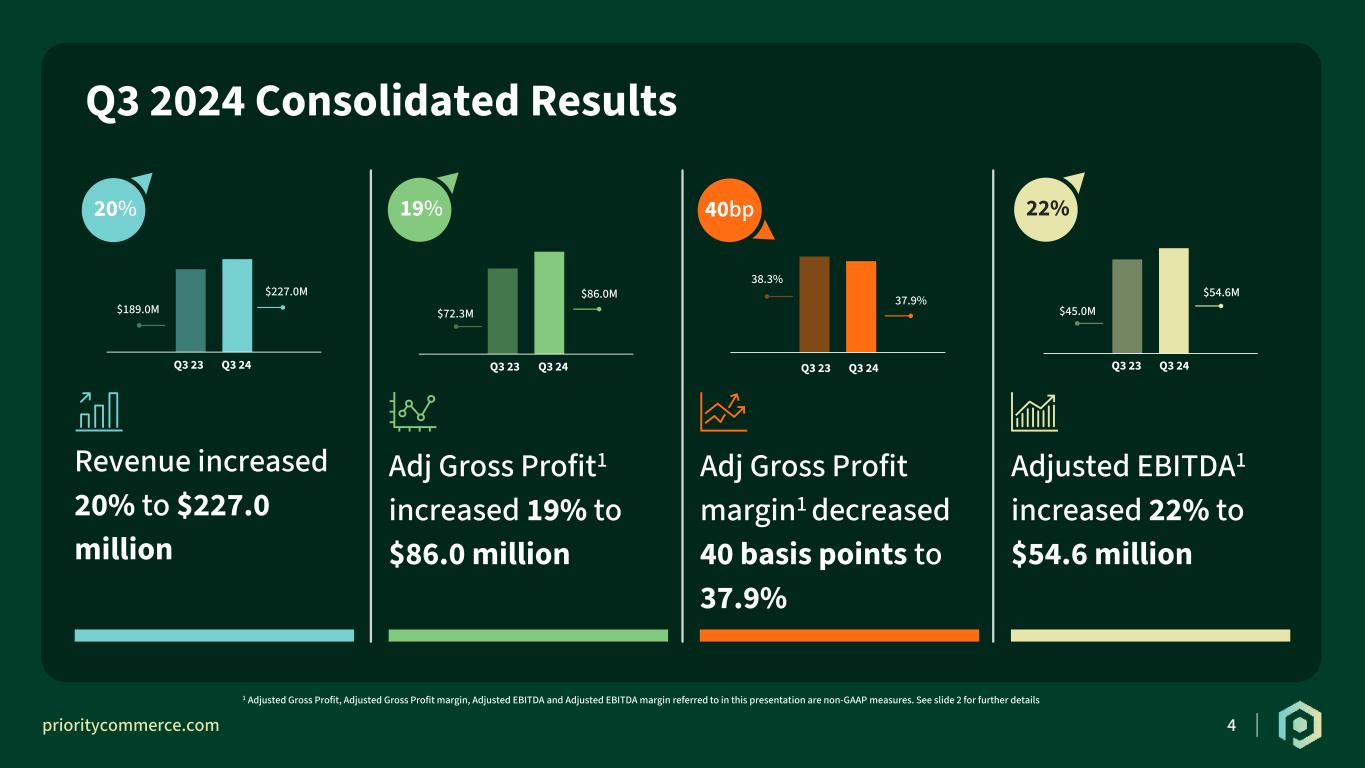
| Revenues | $ | 227,049 | $ | 189,015 | |||||||
| Cost of revenue (excluding depreciation and amortization) | (141,070) | (116,682) | |||||||||
| Adjusted gross profit | $ | 85,979 | $ | 72,333 | |||||||
| Adjusted gross profit margin | 37.9 | % | 38.3 | % | |||||||
| Depreciation and amortization of revenue generating assets | (4,207) | (3,000) | |||||||||
| Gross profit | $ | 81,772 | $ | 69,333 | |||||||
| Gross profit margin | 36.0 | % | 36.7 | % | |||||||
| (in thousands) | Three Months Ended September 30, | ||||||||||
| 2024 | 2023 | ||||||||||
| Net income (loss) | $ | 10,608 | $ | (87) | |||||||
| Interest expense | 23,246 | 19,997 | |||||||||
| Income tax expense | 4,899 | 4,328 | |||||||||
| Depreciation and amortization | 13,733 | 17,275 | |||||||||
| EBITDA | 52,486 | 41,513 | |||||||||
| Debt extinguishment and modification | 43 | — | |||||||||
| Non-recurring gain | — | (166) | |||||||||
| Selling, general and administrative (non-recurring) | 696 | 2,114 | |||||||||
| Non-cash stock-based compensation | 1,416 | 1,501 | |||||||||
| Adjusted EBITDA | $ | 54,641 | $ | 44,962 | |||||||
| (in thousands) | Three Months Ended September 30, | ||||||||||
| 2024 | 2023 | ||||||||||
| Selling, general and administrative expenses (non-recurring): | |||||||||||
| Certain legal fees | 552 | 656 | |||||||||
| Professional, accounting and consulting fees | 128 | 1,364 | |||||||||
| Other expenses, net | 16 | 94 | |||||||||
| $ | 696 | $ | 2,114 | ||||||||
| Three Months Ended September 30, | Nine Months Ended September 30, | ||||||||||||||||||||||
| 2024 | 2023 | 2024 | 2023 | ||||||||||||||||||||
| Revenues | $ | 227,049 | $ | 189,015 | $ | 652,635 | $ | 556,333 | |||||||||||||||
| Operating expenses | |||||||||||||||||||||||
| Cost of revenue (excludes depreciation and amortization) | 141,070 | 116,682 | 408,486 | 353,929 | |||||||||||||||||||
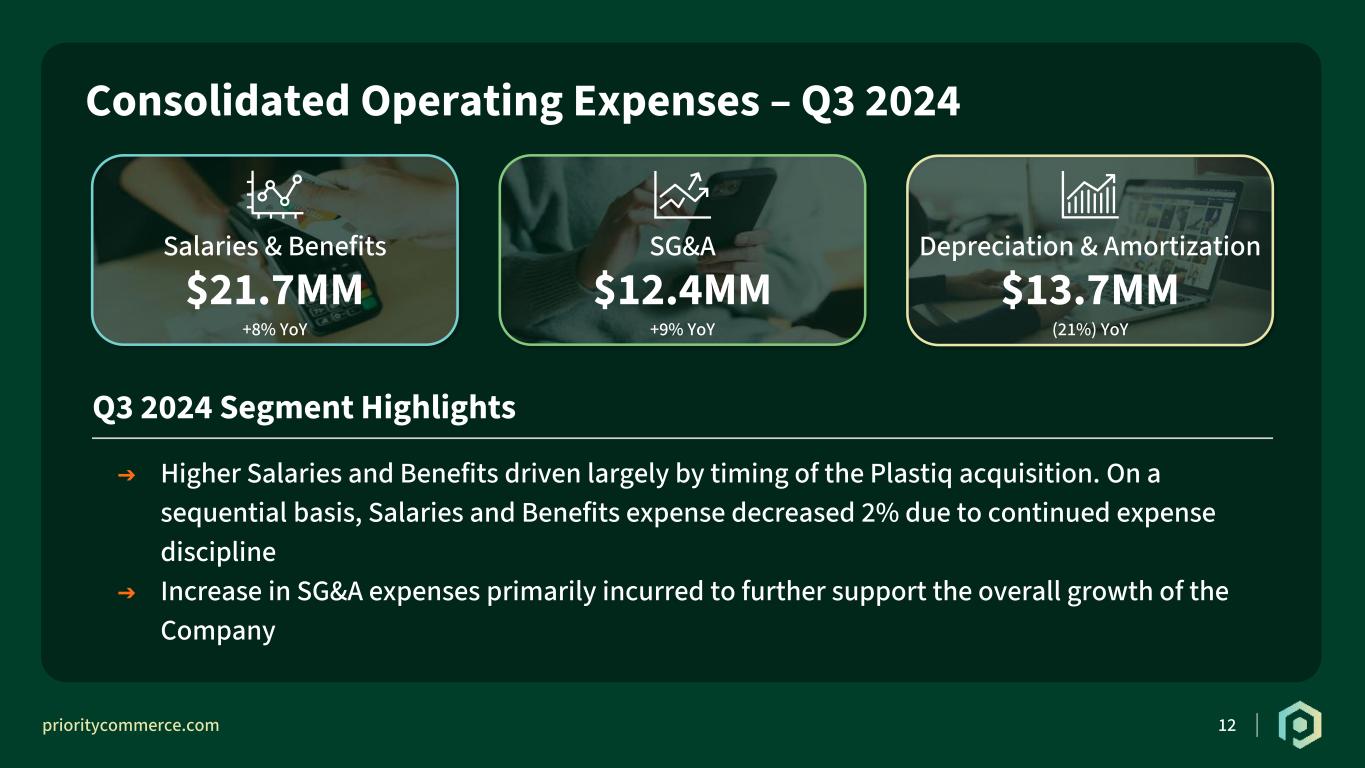
| Salary and employee benefits | 21,748 | 20,129 | 66,017 | 58,286 | |||||||||||||||||||
| Depreciation and amortization | 13,733 | 17,275 | 44,230 | 53,303 | |||||||||||||||||||
| Selling, general and administrative | 12,413 | 11,423 | 34,620 | 31,328 | |||||||||||||||||||
| Total operating expenses | 188,964 | 165,509 | 553,353 | 496,846 | |||||||||||||||||||
| Operating income | 38,085 | 23,506 | 99,282 | 59,487 | |||||||||||||||||||
| Other (expense) income | |||||||||||||||||||||||
| Interest expense | (23,246) | (19,997) | (65,836) | (55,461) | |||||||||||||||||||
| Debt extinguishment and modification costs | (43) | — | (8,666) | — | |||||||||||||||||||
| Other income, net | 711 | 732 | 2,011 | 1,319 | |||||||||||||||||||
| Total other expense, net | (22,578) | (19,265) | (72,491) | (54,142) | |||||||||||||||||||
| Income before income taxes | 15,507 | 4,241 | 26,791 | 5,345 | |||||||||||||||||||
| Income tax expense | 4,899 | 4,328 | 9,996 | 6,550 | |||||||||||||||||||
| Net income (loss) | 10,608 | (87) | 16,795 | (1,205) | |||||||||||||||||||
| Less: Dividends and accretion attributable to redeemable senior preferred stockholders | (5,121) | (12,192) | (36,348) | (35,252) | |||||||||||||||||||
| Less: Return on redeemable NCI in consolidated subsidiary | — | — | (639) | — | |||||||||||||||||||
| Net income (loss) attributable to common stockholders | 5,487 | (12,279) | $ | (20,192) | $ | (36,457) | |||||||||||||||||
| Other comprehensive income ( loss) | |||||||||||||||||||||||
| Foreign currency translation adjustments | (28) | (65) | (37) | (34) | |||||||||||||||||||
| Comprehensive income (loss) | $ | 5,459 | $ | (12,344) | $ | (20,229) | $ | (36,491) | |||||||||||||||
| Earnings (loss) per common share: | |||||||||||||||||||||||
| Basic | $ | 0.07 | $ | (0.16) | $ | (0.26) | $ | (0.47) | |||||||||||||||
| Diluted | $ | 0.07 | $ | (0.16) | $ | (0.26) | $ | (0.47) | |||||||||||||||
| Weighted-average common shares outstanding: | |||||||||||||||||||||||
| Basic | 77,973 | 78,381 | 77,910 | 78,270 | |||||||||||||||||||
| Diluted | 80,095 | 78,381 | 77,910 | 78,270 | |||||||||||||||||||
| September 30, 2024 | December 31, 2023 | ||||||||||
| Assets | |||||||||||
| Current assets: | |||||||||||
| Cash and cash equivalents | $ | 41,072 | $ | 39,604 | |||||||
| Restricted cash | 13,398 | 11,923 | |||||||||
| Accounts receivable, net of allowances | 73,393 | 58,551 | |||||||||
| Prepaid expenses and other current assets | 19,103 | 13,273 | |||||||||
| Current portion of notes receivable, net of allowance | 2,567 | 1,468 | |||||||||
| Settlement assets and customer/subscriber account balances | 879,361 | 756,475 | |||||||||
| Total current assets | 1,028,894 | 881,294 | |||||||||
| Notes receivable, less current portion | 3,727 | 3,728 | |||||||||
| Property, equipment and software, net | 51,603 | 44,680 | |||||||||
| Goodwill | 376,091 | 376,103 | |||||||||
| Intangible assets, net | 248,819 | 273,350 | |||||||||
| Deferred income taxes, net | 25,477 | 22,533 | |||||||||
| Other noncurrent assets | 25,058 | 13,649 | |||||||||
| Total assets | $ | 1,759,669 | 1,615,337 | ||||||||
| Liabilities, Redeemable Senior Preferred Stock, Redeemable NCI, and Stockholders' Deficit | |||||||||||
| Current liabilities: | |||||||||||
| Accounts payable and accrued expenses | $ | 67,009 | $ | 52,643 | |||||||
| Accrued residual commissions | 35,818 | 33,025 | |||||||||
| Customer deposits and advance payments | 4,205 | 3,934 | |||||||||
| Current portion of long-term debt | 8,350 | 6,712 | |||||||||
| Settlement and customer/subscriber account obligations | 875,815 | 755,754 | |||||||||
| Total current liabilities | 991,197 | 852,068 | |||||||||
| Long-term debt, net of current portion, discounts and debt issuance costs | 808,081 | 631,965 | |||||||||
| Other noncurrent liabilities | 19,241 | 18,763 | |||||||||
| Total liabilities | 1,818,519 | 1,502,796 | |||||||||
| Redeemable senior preferred stock, net of discounts and issuance costs | 105,098 | 258,605 | |||||||||
| Stockholders' deficit: | |||||||||||
| Preferred stock | — | — | |||||||||
| Common stock | 77 | 77 | |||||||||
| Treasury stock, at cost | (19,278) | (12,815) | |||||||||
| Additional paid-in capital | — | — | |||||||||
| Accumulated other comprehensive loss | (66) | (29) | |||||||||
| Accumulated deficit | (146,571) | (134,951) | |||||||||
| Total stockholders' deficit attributable to stockholders of Priority | (165,838) | (147,718) | |||||||||
| Non-controlling interests in consolidated subsidiaries | 1,890 | 1,654 | |||||||||
| Total stockholders' deficit | (163,948) | (146,064) | |||||||||
| Total liabilities, redeemable senior preferred stock, redeemable NCI and stockholders' deficit | $ | 1,759,669 | $ | 1,615,337 | |||||||
| Nine Months Ended September 30, | |||||||||||
| 2024 | 2023 | ||||||||||
| Cash flows from operating activities: | |||||||||||
| Net income (loss) | $ | 16,795 | $ | (1,205) | |||||||
| Adjustments to reconcile net loss to net cash provided by operating activities: | |||||||||||
| Depreciation and amortization of assets | 44,230 | 53,303 | |||||||||
| Stock-based, ESPP and incentive units compensation | 4,878 | 5,183 | |||||||||
| Amortization of debt issuance costs and discounts | 2,250 | 2,812 | |||||||||
| Debt extinguishment and modification costs | 8,666 | — | |||||||||
| Deferred income tax | (2,944) | (2,432) | |||||||||
| Change in contingent consideration | 3,280 | 906 | |||||||||
| Other non-cash items, net | (37) | (169) | |||||||||
| Change in operating assets and liabilities: | |||||||||||
| Accounts receivable | (15,712) | 17,931 | |||||||||
| Prepaid expenses and other current assets | (2,808) | (2,630) | |||||||||
| Income taxes (receivable) payable | (3,000) | 498 | |||||||||
| Notes receivable | (883) | (668) | |||||||||
| Accounts payable and other accrued liabilities | 12,864 | 302 | |||||||||
| Customer deposits and advance payments | 271 | 3,802 | |||||||||
| Other assets and liabilities, net | (5,998) | (4,953) | |||||||||
| Net cash provided by operating activities | 61,852 | 72,680 | |||||||||
| Cash flows from investing activities: | |||||||||||
| Acquisition of business, net of cash acquired | — | (28,182) | |||||||||
| Additions to property, equipment and software | (17,044) | (15,268) | |||||||||
| Notes receivable, net | (216) | 151 | |||||||||
| Acquisitions of assets and other investing activities | (7,474) | (7,925) | |||||||||
| Net cash used in investing activities | (24,734) | (51,224) | |||||||||
| Cash flows from financing activities: | |||||||||||
| Proceeds from issuance of long-term debt, net of issue discount | 830,200 | — | |||||||||
| Debt issuance and modification costs paid | (6,901) | (807) | |||||||||
| Repayments of long-term debt | (656,460) | (4,650) | |||||||||
| Borrowings under revolving credit facility | — | 44,000 | |||||||||
| Repayments of borrowings under revolving credit facility | — | (23,500) | |||||||||
| Redemption of PHOT redeemable NCI | (2,130) | — | |||||||||
| Repurchases of shares withheld for taxes | (1,208) | (1,018) | |||||||||
| Redemption of senior preferred stock | (136,936) | — | |||||||||
| Redemption of accumulated unpaid dividend on redeemable senior preferred stock | (30,819) | — | |||||||||
| Dividends paid to redeemable senior preferred stockholders | (22,099) | (17,908) | |||||||||
| Settlement and customer/subscriber accounts obligations, net | 116,065 | 165,610 | |||||||||
| Payment of contingent consideration related to business combination | (4,996) | (4,698) | |||||||||
| Net cash provided by financing activities | 84,716 | 157,029 | |||||||||
| Net change in cash and cash equivalents and restricted cash: | |||||||||||
| Net increase in cash and cash equivalents, and restricted cash | 121,834 | 178,485 | |||||||||
| Cash and cash equivalents and restricted cash at beginning of period | 796,223 | 560,610 | |||||||||
| Cash and cash equivalents and restricted cash at end of period | $ | 918,057 | $ | 739,095 | |||||||
| Reconciliation of cash and cash equivalents, and restricted cash: | |||||||||||
| Cash and cash equivalents | $ | 41,072 | $ | 24,595 | |||||||
| Restricted cash | 13,398 | 13,890 | |||||||||
| Cash and cash equivalents included in settlement assets and customer/subscriber account balances | 863,587 | 700,610 | |||||||||
| Total cash and cash equivalents, and restricted cash | $ | 918,057 | $ | 739,095 | |||||||
| Three Months Ended September 30, | Nine Months Ended September 30, | ||||||||||||||||||||||
| 2024 | 2023 | 2024 | 2023 | ||||||||||||||||||||
| SMB Payments: | |||||||||||||||||||||||
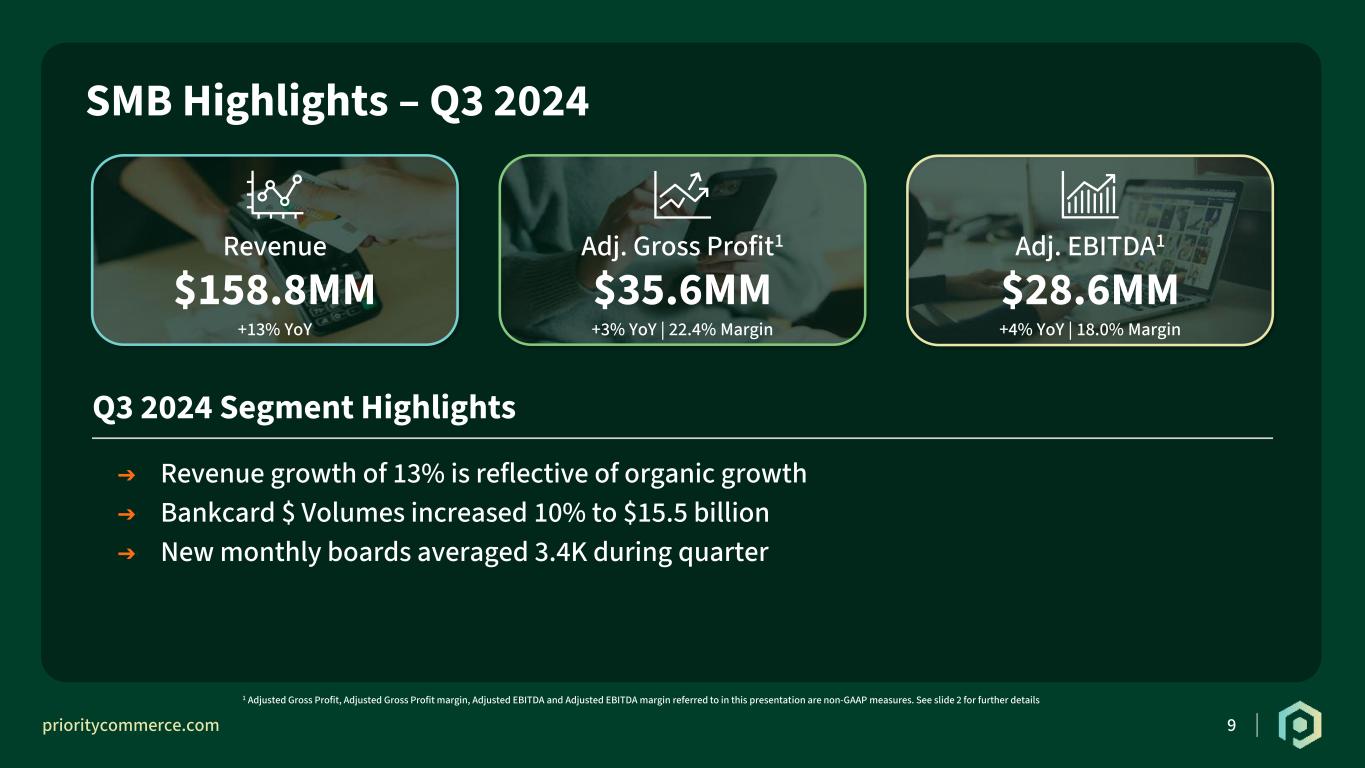
| Revenues | $ | 158,770 | $ | 140,241 | $ | 457,875 | $ | 443,122 | |||||||||||||||
| Adjusted EBITDA | $ | 28,644 | $ | 27,613 | $ | 82,265 | $ | 84,449 | |||||||||||||||
| Key Indicators: | |||||||||||||||||||||||
| Merchant bankcard processing dollar value | $ | 15,517,131 | $ | 14,150,995 | $ | 46,096,861 | $ | 44,483,491 | |||||||||||||||
| Merchant bankcard transaction count | 195,786 | 178,721 | 564,855 | 522,470 | |||||||||||||||||||
| B2B Payments: | |||||||||||||||||||||||
| Revenues | $ | 22,143 | $ | 13,985 | $ | 65,368 | $ | 19,744 | |||||||||||||||
| Adjusted EBITDA | $ | 1,933 | $ | 1,359 | $ | 5,209 | $ | 1,877 | |||||||||||||||
| Key Indicators: | |||||||||||||||||||||||
| B2B issuing dollar volume | $ | 255,323 | $ | 221,456 | $ | 732,589 | $ | 636,361 | |||||||||||||||
| B2B issuing transaction count | 256 | 267 | 738 | 829 | |||||||||||||||||||
| Enterprise Payments: | |||||||||||||||||||||||
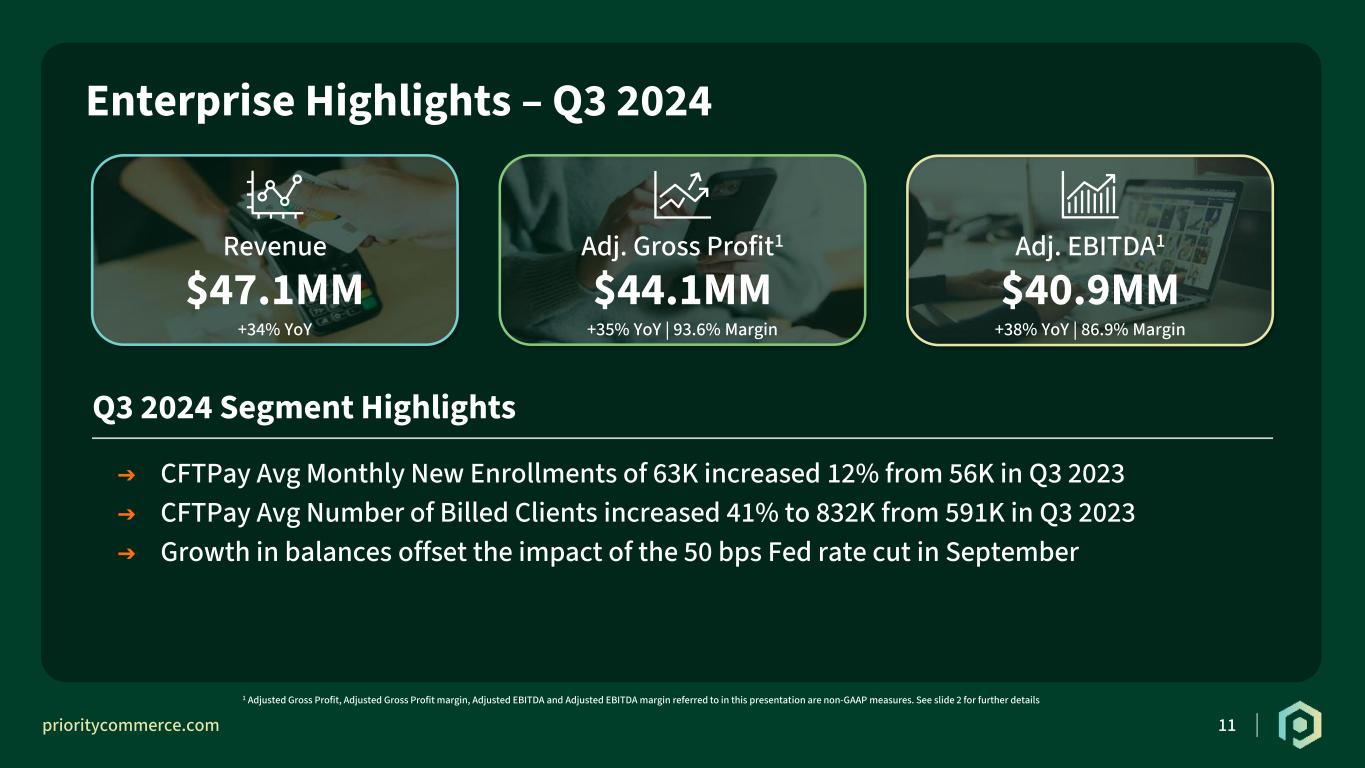
| Revenues | $ | 47,099 | $ | 35,174 | $ | 131,758 | $ | 93,919 | |||||||||||||||
| Adjusted EBITDA | $ | 40,940 | $ | 29,757 | $ | 112,911 | $ | 77,853 | |||||||||||||||
| Key Indicators: | |||||||||||||||||||||||
| Average billed clients | 832,351 | 590,578 | 766,370 | 525,274 | |||||||||||||||||||
| Average monthly new enrollments | 62,875 | 56,269 | 57,281 | 51,864 | |||||||||||||||||||
| Three Months Ended September 30, 2024 | ||||||||||||||||||||||||||||||||
| SMB Payments | B2B Payments | Enterprise Payments | Corporate | Total Consolidated | ||||||||||||||||||||||||||||
| Reconciliation of Adjusted EBITDA to GAAP Measure: | ||||||||||||||||||||||||||||||||
| Adjusted EBITDA | $ | 28,644 | $ | 1,933 | $ | 40,940 | $ | (16,876) | $ | 54,641 | ||||||||||||||||||||||
| Interest expense | — | (1,066) | — | (22,180) | (23,246) | |||||||||||||||||||||||||||
| Depreciation and amortization | (6,939) | (1,261) | (4,304) | (1,229) | (13,733) | |||||||||||||||||||||||||||
| Debt modification and extinguishment expenses | — | — | — | (43) | (43) | |||||||||||||||||||||||||||
| Selling, general and administrative (non-recurring) | — | — | — | (696) | (696) | |||||||||||||||||||||||||||
| Non-cash stock based compensation | (4) | (73) | (33) | (1,306) | (1,416) | |||||||||||||||||||||||||||
| Income (loss) before taxes | $ | 21,701 | $ | (467) | $ | 36,603 | $ | (42,330) | $ | 15,507 | ||||||||||||||||||||||
| Nine Months Ended September 30, 2024 | ||||||||||||||||||||||||||||||||
| SMB Payments | B2B Payments | Enterprise Payments | Corporate | Total Consolidated | ||||||||||||||||||||||||||||
| Reconciliation of Adjusted EBITDA to GAAP Measure: | ||||||||||||||||||||||||||||||||
| Adjusted EBITDA | $ | 82,265 | $ | 5,209 | $ | 112,911 | $ | (47,853) | $ | 152,532 | ||||||||||||||||||||||
| Interest expense | (1) | (3,280) | — | (62,555) | (65,836) | |||||||||||||||||||||||||||
| Depreciation and amortization | (24,065) | (3,992) | (12,431) | (3,742) | (44,230) | |||||||||||||||||||||||||||
| Debt modification and extinguishment expenses | — | — | — | (8,666) | (8,666) | |||||||||||||||||||||||||||
| Selling, general and administrative (non-recurring) | — | — | — | (2,131) | (2,131) | |||||||||||||||||||||||||||
| Non-cash stock based compensation | (12) | (299) | (98) | (4,469) | (4,878) | |||||||||||||||||||||||||||
| Income (loss) before taxes | $ | 58,187 | $ | (2,362) | $ | 100,382 | $ | (129,416) | $ | 26,791 | ||||||||||||||||||||||
| Three Months Ended September 30, 2023 | ||||||||||||||||||||||||||||||||
| SMB Payments | B2B Payments | Enterprise Payments | Corporate | Total Consolidated | ||||||||||||||||||||||||||||
| Reconciliation of Adjusted EBITDA to GAAP Measure: | ||||||||||||||||||||||||||||||||
| Adjusted EBITDA | $ | 27,613 | $ | 1,359 | $ | 29,757 | $ | (13,767) | $ | 44,962 | ||||||||||||||||||||||
| Interest expense | — | (498) | (62) | (19,437) | (19,997) | |||||||||||||||||||||||||||
| Depreciation and amortization | (9,136) | (719) | (5,947) | (1,473) | (17,275) | |||||||||||||||||||||||||||
| Selling, general and administrative (non-recurring) | — | — | — | (2,114) | (2,114) | |||||||||||||||||||||||||||
| Non-cash stock based compensation | (114) | (36) | (66) | (1,285) | (1,501) | |||||||||||||||||||||||||||
| Other non-recurring gain, net | — | — | — | 166 | 166 | |||||||||||||||||||||||||||
| Income (loss) before taxes | $ | 18,363 | $ | 106 | $ | 23,682 | $ | (37,910) | $ | 4,241 | ||||||||||||||||||||||
| Nine Months Ended September 30, 2023 | ||||||||||||||||||||||||||||||||
| SMB Payments | B2B Payments | Enterprise Payments | Corporate | Total Consolidated | ||||||||||||||||||||||||||||
| Reconciliation of Adjusted EBITDA to GAAP Measure: | ||||||||||||||||||||||||||||||||
| Adjusted EBITDA | $ | 84,449 | $ | 1,877 | $ | 77,853 | $ | (40,484) | $ | 123,695 | ||||||||||||||||||||||
| Interest expense | — | (498) | (293) | (54,670) | (55,461) | |||||||||||||||||||||||||||
| Depreciation and amortization | (27,553) | (756) | (18,571) | (6,423) | (53,303) | |||||||||||||||||||||||||||
| Selling, general and administrative (non-recurring) | — | — | — | (4,410) | (4,410) | |||||||||||||||||||||||||||
| Non-cash stock based compensation | (408) | (237) | (195) | (4,343) | (5,183) | |||||||||||||||||||||||||||
| Other non-recurring gain, net | — | — | — | 7 | 7 | |||||||||||||||||||||||||||
| Income (loss) before taxes | $ | 56,488 | $ | 386 | $ | 58,794 | $ | (110,323) | $ | 5,345 | ||||||||||||||||||||||

