false2023Q30001645113--12-31P3YP1Y0M23D00016451132023-01-012023-09-3000016451132023-10-20xbrli:shares00016451132023-09-30iso4217:USD00016451132022-12-3100016451132023-07-012023-09-3000016451132022-07-012022-09-3000016451132022-01-012022-09-3000016451132022-01-012022-12-31iso4217:USDxbrli:shares0001645113us-gaap:CommonStockMember2022-12-310001645113us-gaap:AdditionalPaidInCapitalMember2022-12-310001645113us-gaap:AccumulatedOtherComprehensiveIncomeMember2022-12-310001645113us-gaap:RetainedEarningsMember2022-12-310001645113us-gaap:AdditionalPaidInCapitalMember2023-01-012023-03-3100016451132023-01-012023-03-310001645113us-gaap:CommonStockMember2023-01-012023-03-310001645113us-gaap:AccumulatedOtherComprehensiveIncomeMember2023-01-012023-03-310001645113us-gaap:RetainedEarningsMember2023-01-012023-03-310001645113us-gaap:CommonStockMember2023-03-310001645113us-gaap:AdditionalPaidInCapitalMember2023-03-310001645113us-gaap:AccumulatedOtherComprehensiveIncomeMember2023-03-310001645113us-gaap:RetainedEarningsMember2023-03-3100016451132023-03-310001645113us-gaap:AdditionalPaidInCapitalMember2023-04-012023-06-3000016451132023-04-012023-06-300001645113us-gaap:CommonStockMember2023-04-012023-06-300001645113us-gaap:AccumulatedOtherComprehensiveIncomeMember2023-04-012023-06-300001645113us-gaap:RetainedEarningsMember2023-04-012023-06-300001645113us-gaap:CommonStockMember2023-06-300001645113us-gaap:AdditionalPaidInCapitalMember2023-06-300001645113us-gaap:AccumulatedOtherComprehensiveIncomeMember2023-06-300001645113us-gaap:RetainedEarningsMember2023-06-3000016451132023-06-300001645113us-gaap:AdditionalPaidInCapitalMember2023-07-012023-09-300001645113us-gaap:CommonStockMember2023-07-012023-09-300001645113us-gaap:AccumulatedOtherComprehensiveIncomeMember2023-07-012023-09-300001645113us-gaap:RetainedEarningsMember2023-07-012023-09-300001645113us-gaap:CommonStockMember2023-09-300001645113us-gaap:AdditionalPaidInCapitalMember2023-09-300001645113us-gaap:AccumulatedOtherComprehensiveIncomeMember2023-09-300001645113us-gaap:RetainedEarningsMember2023-09-300001645113us-gaap:CommonStockMember2021-12-310001645113us-gaap:AdditionalPaidInCapitalMember2021-12-310001645113us-gaap:AccumulatedOtherComprehensiveIncomeMember2021-12-310001645113us-gaap:RetainedEarningsMember2021-12-3100016451132021-12-310001645113us-gaap:AdditionalPaidInCapitalMember2022-01-012022-03-3100016451132022-01-012022-03-310001645113us-gaap:CommonStockMember2022-01-012022-03-310001645113us-gaap:AccumulatedOtherComprehensiveIncomeMember2022-01-012022-03-310001645113us-gaap:RetainedEarningsMember2022-01-012022-03-310001645113us-gaap:CommonStockMember2022-03-310001645113us-gaap:AdditionalPaidInCapitalMember2022-03-310001645113us-gaap:AccumulatedOtherComprehensiveIncomeMember2022-03-310001645113us-gaap:RetainedEarningsMember2022-03-3100016451132022-03-310001645113us-gaap:AdditionalPaidInCapitalMember2022-04-012022-06-3000016451132022-04-012022-06-300001645113us-gaap:CommonStockMember2022-04-012022-06-300001645113us-gaap:AccumulatedOtherComprehensiveIncomeMember2022-04-012022-06-300001645113us-gaap:RetainedEarningsMember2022-04-012022-06-300001645113us-gaap:CommonStockMember2022-06-300001645113us-gaap:AdditionalPaidInCapitalMember2022-06-300001645113us-gaap:AccumulatedOtherComprehensiveIncomeMember2022-06-300001645113us-gaap:RetainedEarningsMember2022-06-3000016451132022-06-300001645113us-gaap:AdditionalPaidInCapitalMember2022-07-012022-09-300001645113us-gaap:CommonStockMember2022-07-012022-09-300001645113us-gaap:AccumulatedOtherComprehensiveIncomeMember2022-07-012022-09-300001645113us-gaap:RetainedEarningsMember2022-07-012022-09-300001645113us-gaap:CommonStockMember2022-09-300001645113us-gaap:AdditionalPaidInCapitalMember2022-09-300001645113us-gaap:AccumulatedOtherComprehensiveIncomeMember2022-09-300001645113us-gaap:RetainedEarningsMember2022-09-3000016451132022-09-300001645113us-gaap:CashMember2023-09-300001645113us-gaap:CashAndCashEquivalentsMemberus-gaap:CashMember2023-09-300001645113us-gaap:FairValueInputsLevel1Memberus-gaap:MoneyMarketFundsMember2023-09-300001645113us-gaap:CashAndCashEquivalentsMemberus-gaap:FairValueInputsLevel1Memberus-gaap:MoneyMarketFundsMember2023-09-300001645113us-gaap:CertificatesOfDepositMemberus-gaap:FairValueInputsLevel2Member2023-09-300001645113us-gaap:CashAndCashEquivalentsMemberus-gaap:CertificatesOfDepositMemberus-gaap:FairValueInputsLevel2Member2023-09-300001645113us-gaap:CertificatesOfDepositMemberus-gaap:FairValueInputsLevel2Memberus-gaap:ShortTermInvestmentsMember2023-09-300001645113us-gaap:FairValueInputsLevel1Memberus-gaap:USTreasurySecuritiesMember2023-09-300001645113us-gaap:FairValueInputsLevel1Memberus-gaap:ShortTermInvestmentsMemberus-gaap:USTreasurySecuritiesMember2023-09-300001645113us-gaap:USGovernmentAgenciesDebtSecuritiesMemberus-gaap:FairValueInputsLevel2Member2023-09-300001645113us-gaap:USGovernmentAgenciesDebtSecuritiesMemberus-gaap:FairValueInputsLevel2Memberus-gaap:ShortTermInvestmentsMember2023-09-300001645113us-gaap:FairValueInputsLevel2Memberus-gaap:CorporateDebtSecuritiesMember2023-09-300001645113us-gaap:CashAndCashEquivalentsMemberus-gaap:FairValueInputsLevel2Memberus-gaap:CorporateDebtSecuritiesMember2023-09-300001645113us-gaap:FairValueInputsLevel2Memberus-gaap:ShortTermInvestmentsMemberus-gaap:CorporateDebtSecuritiesMember2023-09-300001645113us-gaap:CashAndCashEquivalentsMember2023-09-300001645113us-gaap:ShortTermInvestmentsMember2023-09-300001645113us-gaap:CashMember2022-12-310001645113us-gaap:CashAndCashEquivalentsMemberus-gaap:CashMember2022-12-310001645113us-gaap:FairValueInputsLevel1Memberus-gaap:MoneyMarketFundsMember2022-12-310001645113us-gaap:CashAndCashEquivalentsMemberus-gaap:FairValueInputsLevel1Memberus-gaap:MoneyMarketFundsMember2022-12-310001645113us-gaap:CertificatesOfDepositMemberus-gaap:FairValueInputsLevel2Member2022-12-310001645113us-gaap:CashAndCashEquivalentsMemberus-gaap:CertificatesOfDepositMemberus-gaap:FairValueInputsLevel2Member2022-12-310001645113us-gaap:CertificatesOfDepositMemberus-gaap:FairValueInputsLevel2Memberus-gaap:ShortTermInvestmentsMember2022-12-310001645113us-gaap:FairValueInputsLevel1Memberus-gaap:USTreasurySecuritiesMember2022-12-310001645113us-gaap:FairValueInputsLevel1Memberus-gaap:ShortTermInvestmentsMemberus-gaap:USTreasurySecuritiesMember2022-12-310001645113us-gaap:USGovernmentAgenciesDebtSecuritiesMemberus-gaap:FairValueInputsLevel2Member2022-12-310001645113us-gaap:USGovernmentAgenciesDebtSecuritiesMemberus-gaap:FairValueInputsLevel2Memberus-gaap:ShortTermInvestmentsMember2022-12-310001645113us-gaap:FairValueInputsLevel2Memberus-gaap:CorporateDebtSecuritiesMember2022-12-310001645113us-gaap:CashAndCashEquivalentsMemberus-gaap:FairValueInputsLevel2Memberus-gaap:CorporateDebtSecuritiesMember2022-12-310001645113us-gaap:FairValueInputsLevel2Memberus-gaap:ShortTermInvestmentsMemberus-gaap:CorporateDebtSecuritiesMember2022-12-310001645113us-gaap:CashAndCashEquivalentsMember2022-12-310001645113us-gaap:ShortTermInvestmentsMember2022-12-310001645113us-gaap:AssetPledgedAsCollateralMember2023-09-3000016451132022-11-012022-11-300001645113us-gaap:AccumulatedNetUnrealizedInvestmentGainLossMember2023-09-300001645113us-gaap:AccumulatedNetUnrealizedInvestmentGainLossMember2022-12-31iso4217:EUR0001645113us-gaap:RevolvingCreditFacilityMember2020-11-062020-11-060001645113us-gaap:RevolvingCreditFacilityMember2020-11-060001645113us-gaap:RevolvingCreditFacilityMember2023-01-012023-09-300001645113us-gaap:RevolvingCreditFacilityMember2023-09-300001645113us-gaap:RevolvingCreditFacilityMembersrt:MinimumMemberus-gaap:LineOfCreditMember2020-11-062020-11-06xbrli:pure0001645113us-gaap:RevolvingCreditFacilityMembersrt:MaximumMemberus-gaap:LineOfCreditMember2020-11-062020-11-060001645113nvcr:A0ConvertibleSeniorNotesDue2025Memberus-gaap:ConvertibleDebtMember2020-11-050001645113nvcr:A0ConvertibleSeniorNotesDue2025Memberus-gaap:ConvertibleDebtMember2023-09-300001645113nvcr:A0ConvertibleSeniorNotesDue2025Memberus-gaap:ConvertibleDebtMember2022-12-310001645113nvcr:A0ConvertibleSeniorNotesDue2025Memberus-gaap:ConvertibleDebtMember2023-07-012023-09-300001645113nvcr:A0ConvertibleSeniorNotesDue2025Memberus-gaap:ConvertibleDebtMember2022-07-012022-09-300001645113nvcr:A0ConvertibleSeniorNotesDue2025Memberus-gaap:ConvertibleDebtMember2023-01-012023-09-300001645113nvcr:A0ConvertibleSeniorNotesDue2025Memberus-gaap:ConvertibleDebtMember2022-01-012022-09-300001645113nvcr:A0ConvertibleSeniorNotesDue2025Memberus-gaap:ConvertibleDebtMember2022-01-012022-12-310001645113nvcr:TwoThousandFifteenPlanMemberus-gaap:EmployeeStockOptionMembersrt:MinimumMember2023-01-012023-09-300001645113nvcr:TwoThousandFifteenPlanMemberus-gaap:EmployeeStockOptionMembersrt:MaximumMember2023-01-012023-09-300001645113nvcr:TwoThousandFifteenPlanMemberus-gaap:EmployeeStockOptionMember2023-01-012023-09-300001645113nvcr:TwoThousandFifteenPlanMemberus-gaap:RestrictedStockUnitsRSUMember2023-01-012023-09-300001645113nvcr:TwoThousandFifteenPlanMembersrt:MinimumMembernvcr:PerformanceBasedShareUnitsPSUsMember2023-01-012023-09-300001645113nvcr:TwoThousandFifteenPlanMembersrt:MaximumMembernvcr:PerformanceBasedShareUnitsPSUsMember2023-01-012023-09-300001645113nvcr:TwoThousandFifteenPlanMember2023-09-300001645113us-gaap:EmployeeStockMember2023-01-012023-09-300001645113nvcr:RestrictedStockUnitsRSUsAndPerformanceBasedShareUnitsPSUsMember2022-12-310001645113nvcr:RestrictedStockUnitsRSUsAndPerformanceBasedShareUnitsPSUsMember2023-01-012023-09-300001645113nvcr:RestrictedStockUnitsRSUsAndPerformanceBasedShareUnitsPSUsMember2023-09-300001645113nvcr:PerformanceBasedShareUnitsPSUsMembernvcr:AwardOneMember2023-09-300001645113nvcr:PerformanceBasedShareUnitsPSUsMembernvcr:AwardOneMember2023-01-012023-09-300001645113nvcr:AwardTwoMembernvcr:PerformanceBasedShareUnitsPSUsMember2023-09-300001645113nvcr:AwardTwoMembernvcr:PerformanceBasedShareUnitsPSUsMember2023-01-012023-09-300001645113nvcr:AwardThreeMembernvcr:PerformanceBasedShareUnitsPSUsMember2023-09-300001645113nvcr:AwardThreeMembernvcr:PerformanceBasedShareUnitsPSUsMember2023-01-012023-09-300001645113nvcr:PerformanceBasedShareUnitsPSUsMembernvcr:AwardFourMember2023-09-300001645113nvcr:PerformanceBasedShareUnitsPSUsMembernvcr:AwardFourMember2023-01-012023-09-300001645113nvcr:PerformanceBasedShareUnitsPSUsMembernvcr:AwardFiveMember2023-09-300001645113nvcr:PerformanceBasedShareUnitsPSUsMembernvcr:AwardFiveMember2023-01-012023-09-300001645113nvcr:PerformanceBasedShareUnitsPSUsMembernvcr:AwardSixMember2023-09-300001645113nvcr:PerformanceBasedShareUnitsPSUsMembernvcr:AwardSixMember2023-01-012023-09-300001645113nvcr:PerformanceBasedShareUnitsPSUsMember2023-09-300001645113nvcr:PerformanceBasedShareUnitsPSUsMember2023-01-012023-09-300001645113us-gaap:EmployeeStockMember2023-09-300001645113us-gaap:EmployeeStockOptionMembersrt:MinimumMember2023-01-012023-09-300001645113us-gaap:EmployeeStockOptionMembersrt:MaximumMember2023-01-012023-09-300001645113us-gaap:EmployeeStockOptionMembersrt:MinimumMember2022-01-012022-09-300001645113us-gaap:EmployeeStockOptionMembersrt:MaximumMember2022-01-012022-09-300001645113us-gaap:EmployeeStockOptionMembersrt:MinimumMember2022-01-012022-12-310001645113us-gaap:EmployeeStockOptionMembersrt:MaximumMember2022-01-012022-12-310001645113us-gaap:EmployeeStockOptionMember2023-01-012023-09-300001645113us-gaap:EmployeeStockOptionMember2022-01-012022-09-300001645113us-gaap:EmployeeStockOptionMember2022-01-012022-12-310001645113us-gaap:EmployeeStockMember2022-01-012022-09-300001645113us-gaap:EmployeeStockMember2022-01-012022-12-310001645113nvcr:CostOfRevenueMember2023-07-012023-09-300001645113nvcr:CostOfRevenueMember2022-07-012022-09-300001645113nvcr:CostOfRevenueMember2023-01-012023-09-300001645113nvcr:CostOfRevenueMember2022-01-012022-09-300001645113nvcr:CostOfRevenueMember2022-01-012022-12-310001645113us-gaap:ResearchAndDevelopmentExpenseMember2023-07-012023-09-300001645113us-gaap:ResearchAndDevelopmentExpenseMember2022-07-012022-09-300001645113us-gaap:ResearchAndDevelopmentExpenseMember2023-01-012023-09-300001645113us-gaap:ResearchAndDevelopmentExpenseMember2022-01-012022-09-300001645113us-gaap:ResearchAndDevelopmentExpenseMember2022-01-012022-12-310001645113nvcr:SalesAndMarketingMember2023-07-012023-09-300001645113nvcr:SalesAndMarketingMember2022-07-012022-09-300001645113nvcr:SalesAndMarketingMember2023-01-012023-09-300001645113nvcr:SalesAndMarketingMember2022-01-012022-09-300001645113nvcr:SalesAndMarketingMember2022-01-012022-12-310001645113us-gaap:GeneralAndAdministrativeExpenseMember2023-07-012023-09-300001645113us-gaap:GeneralAndAdministrativeExpenseMember2022-07-012022-09-300001645113us-gaap:GeneralAndAdministrativeExpenseMember2023-01-012023-09-300001645113us-gaap:GeneralAndAdministrativeExpenseMember2022-01-012022-09-300001645113us-gaap:GeneralAndAdministrativeExpenseMember2022-01-012022-12-310001645113us-gaap:EmployeeStockOptionMember2023-07-012023-09-300001645113us-gaap:EmployeeStockOptionMember2022-07-012022-09-300001645113us-gaap:EmployeeStockOptionMember2023-01-012023-09-300001645113us-gaap:EmployeeStockOptionMember2022-01-012022-09-300001645113us-gaap:EmployeeStockOptionMember2022-01-012022-12-310001645113nvcr:RestrictedStockUnitsRSUsAndPerformanceBasedShareUnitsPSUsMember2023-07-012023-09-300001645113nvcr:RestrictedStockUnitsRSUsAndPerformanceBasedShareUnitsPSUsMember2022-07-012022-09-300001645113nvcr:RestrictedStockUnitsRSUsAndPerformanceBasedShareUnitsPSUsMember2023-01-012023-09-300001645113nvcr:RestrictedStockUnitsRSUsAndPerformanceBasedShareUnitsPSUsMember2022-01-012022-09-300001645113nvcr:RestrictedStockUnitsRSUsAndPerformanceBasedShareUnitsPSUsMember2022-01-012022-12-310001645113us-gaap:EmployeeStockMember2023-07-012023-09-300001645113us-gaap:EmployeeStockMember2022-07-012022-09-300001645113us-gaap:EmployeeStockMember2023-01-012023-09-300001645113us-gaap:EmployeeStockMember2022-01-012022-09-300001645113us-gaap:EmployeeStockMember2022-01-012022-12-310001645113country:US2023-09-300001645113country:US2022-12-310001645113country:IL2023-09-300001645113country:IL2022-12-310001645113country:CH2023-09-300001645113country:CH2022-12-310001645113country:JP2023-09-300001645113country:JP2022-12-310001645113country:DE2023-09-300001645113country:DE2022-12-310001645113nvcr:OthersCountriesMember2023-09-300001645113nvcr:OthersCountriesMember2022-12-310001645113country:US2023-07-012023-09-300001645113country:US2022-07-012022-09-300001645113country:US2023-01-012023-09-300001645113country:US2022-01-012022-09-300001645113country:US2022-01-012022-12-310001645113country:DE2023-07-012023-09-300001645113country:DE2022-07-012022-09-300001645113country:DE2023-01-012023-09-300001645113country:DE2022-01-012022-09-300001645113country:DE2022-01-012022-12-310001645113country:JP2023-07-012023-09-300001645113country:JP2022-07-012022-09-300001645113country:JP2023-01-012023-09-300001645113country:JP2022-01-012022-09-300001645113country:JP2022-01-012022-12-310001645113country:CN2023-07-012023-09-300001645113country:CN2022-07-012022-09-300001645113country:CN2023-01-012023-09-300001645113country:CN2022-01-012022-09-300001645113country:CN2022-01-012022-12-310001645113nvcr:OthersCountriesMember2023-07-012023-09-300001645113nvcr:OthersCountriesMember2022-07-012022-09-300001645113nvcr:OthersCountriesMember2023-01-012023-09-300001645113nvcr:OthersCountriesMember2022-01-012022-09-300001645113nvcr:OthersCountriesMember2022-01-012022-12-310001645113nvcr:PriteshShahMember2023-07-012023-09-300001645113nvcr:PriteshShahMember2023-09-30
UNITED STATES
SECURITIES AND EXCHANGE COMMISSION
Washington, D.C. 20549
_______________________________________________________
FORM 10-Q
(Mark One)
|
|
|
|
|
|
| ☒ |
QUARTERLY REPORT PURSUANT TO SECTION 13 OR 15(d) OF THE SECURITIES EXCHANGE ACT OF 1934 |
For the quarterly period ended September 30, 2023
or
|
|
|
|
|
|
| ☐ |
TRANSITION REPORT PURSUANT TO SECTION 13 OR 15(d) OF THE SECURITIES EXCHANGE ACT OF 1934 |
For the transition period from to
Commission File Number 001-37565
NovoCure Limited
(Exact Name of Registrant as Specified in Its Charter)
|
|
|
|
|
|
|
|
|
| Jersey |
|
98-1057807 |
| (State or Other Jurisdiction of |
|
(I.R.S. Employer |
| Incorporation or Organization) |
|
Identification No.) |
No. 4 The Forum
Grenville Street
St. Helier, Jersey JE2 4UF
(Address of principal executive offices, including zip code)
+44 (0) 15 3475 6700
(Registrant’s Telephone Number, Including Area Code)
Not Applicable
(Former Name, Former Address and Former Fiscal Year, If Changed Since Last Report)
_______________________________________________________
Securities registered pursuant to Section 12(b) of the Securities Exchange Act of 1934:
|
|
|
|
|
|
|
|
|
| Title of each class |
Trading Symbol(s) |
Name of each exchange on which registered |
| Ordinary Shares, no par value |
NVCR |
The Nasdaq Stock Market LLC |
Indicate by check mark whether the registrant (1) has filed all reports required to be filed by Section 13 or 15(d) of the Securities Exchange Act of 1934 during the preceding 12 months (or for such shorter period that the registrant was required to file such reports) and (2) has been subject to such filing requirements for the past 90 days. Yes ☒ No ☐.
Indicate by check mark whether the registrant has submitted electronically every Interactive Data File required to be submitted pursuant to Rule 405 of Regulation S-T (§232.405 of this chapter) during the preceding 12 months (or for such shorter period that the registrant was required to submit such files). Yes ☒ No ☐.
Indicate by check mark whether the registrant is a large accelerated filer, an accelerated filer, a non-accelerated filer, a smaller reporting company or an emerging growth company. See definitions of “large accelerated filer,” “accelerated filer,” “smaller reporting company” and “emerging growth company” in Rule 12b-2 of the Exchange Act.
|
|
|
|
|
|
|
|
|
|
|
|
|
|
|
| Large accelerated filer |
☒ |
|
Accelerated filer |
☐ |
|
|
|
|
| Non-accelerated filer |
☐ |
|
Smaller reporting company |
☐ |
|
|
|
|
|
|
|
|
Emerging growth company |
☐ |
If an emerging growth company, indicate by check mark if the registrant has elected not to use the extended transition period for complying with any new or revised financial accounting standards provided pursuant to Section 13(a) of the Exchange Act. ☐
Indicate by check mark whether the registrant is a shell company (as defined in Rule 12b-2 of the Exchange Act). Yes ☐ No ☒.
Indicate the number of shares outstanding of each of the issuer’s classes of common stock, as of the latest practicable date.
|
|
|
|
|
|
|
|
|
| Class |
|
Outstanding as of October 20, 2023 |
| Ordinary shares, no par value |
|
106,861,113 Shares |
CAUTIONARY NOTE REGARDING FORWARD-LOOKING STATEMENTS
In addition to historical facts or statements of current condition, this report contains forward-looking statements within the meaning of Section 27A of the Securities Act of 1933, as amended, and Section 21E of the Securities Exchange Act of 1934, as amended. Forward-looking statements contained in this report are based on our current plans, expectations, hopes, beliefs, intentions or strategies concerning future developments and their impact on us. Forward-looking statements contained in this report constitute our expectations or forecasts of future events as of the date this report was filed with the Securities and Exchange Commission (the “SEC”) and are not statements of historical fact. You can identify these statements by the fact that they do not relate strictly to historical or current facts. Such statements may include words such as “anticipate,” “will,” “estimate,” “expect,” “project,” “intend,” “should,” “plan,” “believe,” “hope” and other words and terms of similar meaning in connection with any discussion of, among other things, future operating or financial performance, strategic initiatives and business strategies, regulatory or competitive environments, our intellectual property and research and development related to our Tumor Treating Fields devices marketed under various brand names, including Optune and Optune Lua, and software and systems to support and optimize the delivery of Tumor Treating Fields (collectively, our “Products”). In particular, these forward-looking statements include, among others, statements about:
•our research and development, clinical study and commercialization activities and projected expenditures;
•the further commercialization of our Products for current and future indications;
•our business strategies and the expansion of our sales and marketing efforts;
•the market acceptance of our Products for current and future indications by patients, physicians, third-party payers and others in the healthcare and scientific community;
•our plans to pursue the use of our Products for the treatment of solid tumor cancers other than glioblastoma multiforme (“GBM”) and malignant pleural mesothelioma (“MPM”);
•our estimates regarding revenues, expenses, capital requirements and needs for additional financing;
•our ability to obtain regulatory approvals for the use of our Products in indications other than GBM and MPM;
•our ability to acquire from third-party suppliers the supplies needed to manufacture our Products;
•our ability to manufacture adequate supply of our Products;
•our ability to secure and maintain adequate coverage from third-party payers to reimburse us for our Products for current and future indications;
•our ability to receive payment from third-party payers for use of our Products for current and future indications;
•our ability to obtain, maintain, develop protect, defend or enforce our intellectual property position;
•our ability to manage the risks associated with business disruptions caused by natural disasters, extreme weather events, pandemics such as the COVID-19 pandemic, including the emergence of variant strains, or international conflict and other disruptions outside of our control;
•our cash needs; and
•our prospects, financial condition and results of operations.
These forward-looking statements involve a number of risks and uncertainties (some of which are beyond our control) or other assumptions that may cause actual results or performance to be materially different from those expressed or implied by these forward-looking statements. Should one or more of these risks or uncertainties materialize, or should any of our assumptions prove incorrect, actual results may vary in material respects from those projected in these forward-looking statements. Factors which may cause such differences to occur include those risks and uncertainties set forth under Part I, Item 1A., “Risk Factors” in our Annual Report on Form 10-K for the fiscal year ended December 31, 2022 filed on February 23, 2023, as well as other risks and uncertainties set forth from time to time in the reports we file with the SEC. In our prior filings, references to NovoTTF-100L now refer to Optune Lua. We do not intend to update publicly any forward-looking statement, whether as a result of new information, future events or otherwise, except as required by law.
TRADEMARKS
This Quarterly Report on Form 10-Q includes trademarks of NovoCure Limited and other persons. All trademarks or trade names referred to herein are the property of their respective owners.
NovoCure Limited
Quarterly Report on Form 10-Q
PART I—FINANCIAL INFORMATION
Item 1. Financial Statements
|
|
|
|
|
|
|
|
|
|
|
|
NOVOCURE LIMITED AND SUBSIDIARIES
CONSOLIDATED BALANCE SHEETS |
| U.S. dollars in thousands (except share data) |
|
September 30,
2023 |
|
December 31, 2022 |
|
Unaudited |
|
Audited |
| ASSETS |
|
|
|
| CURRENT ASSETS: |
|
|
|
| Cash and cash equivalents |
$ |
154,860 |
|
|
$ |
115,326 |
|
| Short-term investments |
766,388 |
|
|
854,099 |
|
| Restricted cash |
1,652 |
|
|
508 |
|
| Trade receivables, net |
65,133 |
|
|
86,261 |
|
| Receivables and prepaid expenses |
23,163 |
|
|
25,959 |
|
| Inventories |
36,806 |
|
|
29,376 |
|
| Total current assets |
1,048,002 |
|
|
1,111,529 |
|
| LONG-TERM ASSETS: |
|
|
|
| Property and equipment, net |
45,564 |
|
|
32,678 |
|
| Field equipment, net |
11,357 |
|
|
12,684 |
|
| Right-of-use assets |
29,014 |
|
|
23,596 |
|
| Other long-term assets |
12,416 |
|
|
11,161 |
|
| Total long-term assets |
98,351 |
|
|
80,119 |
|
| TOTAL ASSETS |
$ |
1,146,353 |
|
|
$ |
1,191,648 |
|
|
|
|
|
| The accompanying notes are an integral part of these unaudited consolidated financial statements. |
|
|
|
|
|
|
|
|
|
|
|
|
NOVOCURE LIMITED AND SUBSIDIARIES
CONSOLIDATED BALANCE SHEETS |
| U.S. dollars in thousands (except share data) |
|
September 30,
2023 |
|
December 31, 2022 |
|
Unaudited |
|
Audited |
| LIABILITIES AND SHAREHOLDERS' EQUITY |
|
|
|
| CURRENT LIABILITIES: |
|
|
|
| Trade payables |
$ |
79,668 |
|
|
$ |
85,197 |
|
| Other payables, lease liabilities and accrued expenses |
77,493 |
|
|
73,580 |
|
| Total current liabilities |
157,161 |
|
|
158,777 |
|
| LONG-TERM LIABILITIES: |
|
|
|
| Long-term debt, net |
567,986 |
|
|
565,509 |
|
| Deferred revenues |
— |
|
|
2,878 |
|
| Long-term leases |
22,054 |
|
|
18,762 |
|
| Employee benefit liabilities |
5,373 |
|
|
4,404 |
|
| Other long-term liabilities |
75 |
|
|
148 |
|
| Total long-term liabilities |
595,488 |
|
|
591,701 |
|
| TOTAL LIABILITIES |
752,649 |
|
|
750,478 |
|
| COMMITMENTS AND CONTINGENCIES |
|
|
|
|
|
|
|
| SHAREHOLDERS' EQUITY: |
|
|
|
| Share capital - |
|
|
|
|
Ordinary shares no par value, unlimited shares authorized; issued and outstanding:
106,748,270 shares and 105,049,411 shares at September 30, 2023 (unaudited) and December 31, 2022, respectively
|
— |
|
|
— |
|
| Additional paid-in capital |
1,334,120 |
|
|
1,222,063 |
|
| Accumulated other comprehensive income (loss) |
(1,992) |
|
|
(2,433) |
|
| Retained earnings (accumulated deficit) |
(938,424) |
|
|
(778,460) |
|
| TOTAL SHAREHOLDERS' EQUITY |
393,704 |
|
|
441,170 |
|
| TOTAL LIABILITIES AND SHAREHOLDERS' EQUITY |
$ |
1,146,353 |
|
|
$ |
1,191,648 |
|
The accompanying notes are an integral part of these unaudited consolidated financial statements.
|
|
|
|
|
|
|
|
|
|
|
|
|
|
|
|
|
|
|
|
|
|
|
|
|
|
|
|
|
|
NOVOCURE LIMITED AND SUBSIDIARIES
CONSOLIDATED STATEMENTS OF OPERATIONS |
| U.S. dollars in thousands (except share and per share data) |
|
Three months ended September 30, |
|
Nine months ended September 30, |
|
Year ended December 31, |
|
2023 |
|
2022 |
|
2023 |
|
2022 |
|
2022 |
|
Unaudited |
|
Unaudited |
|
Audited |
| Net revenues |
$ |
127,321 |
|
|
$ |
130,998 |
|
|
$ |
375,554 |
|
|
$ |
409,411 |
|
|
$ |
537,840 |
|
| Cost of revenues |
32,092 |
|
|
29,749 |
|
|
95,724 |
|
|
85,979 |
|
|
114,867 |
|
| Gross profit |
95,229 |
|
|
101,249 |
|
|
279,830 |
|
|
323,432 |
|
|
422,973 |
|
|
|
|
|
|
|
|
|
|
|
| Operating costs and expenses: |
|
|
|
|
|
|
|
|
|
| Research, development and clinical studies |
53,623 |
|
|
51,956 |
|
|
168,754 |
|
|
151,265 |
|
|
206,085 |
|
| Sales and marketing |
57,964 |
|
|
41,395 |
|
|
167,621 |
|
|
124,029 |
|
|
173,658 |
|
| General and administrative |
41,887 |
|
|
32,509 |
|
|
124,609 |
|
|
94,683 |
|
|
132,753 |
|
| Total operating costs and expenses |
153,474 |
|
|
125,860 |
|
|
460,984 |
|
|
369,977 |
|
|
512,496 |
|
|
|
|
|
|
|
|
|
|
|
| Operating income (loss) |
(58,245) |
|
|
(24,611) |
|
|
(181,154) |
|
|
(46,545) |
|
|
(89,523) |
|
| Financial income (expenses), net |
10,023 |
|
|
1,194 |
|
|
27,948 |
|
|
(2,743) |
|
|
7,677 |
|
|
|
|
|
|
|
|
|
|
|
| Income (loss) before income tax |
(48,222) |
|
|
(23,417) |
|
|
(153,206) |
|
|
(49,288) |
|
|
(81,846) |
|
| Income tax |
1,263 |
|
|
3,159 |
|
|
6,758 |
|
|
5,943 |
|
|
10,688 |
|
| Net income (loss) |
$ |
(49,485) |
|
|
$ |
(26,576) |
|
|
$ |
(159,964) |
|
|
$ |
(55,231) |
|
|
$ |
(92,534) |
|
|
|
|
|
|
|
|
|
|
|
| Basic and diluted net income (loss) per ordinary share |
$ |
(0.46) |
|
|
$ |
(0.25) |
|
|
$ |
(1.51) |
|
|
$ |
(0.53) |
|
|
$ |
(0.88) |
|
| Weighted average number of ordinary shares used in computing basic and diluted net income (loss) per share |
106,772,814 |
|
|
104,884,583 |
|
|
106,219,194 |
|
|
104,552,803 |
|
|
104,660,476 |
|
The accompanying notes are an integral part of these unaudited consolidated financial statements.
|
|
|
|
|
|
|
|
|
|
|
|
|
|
|
|
|
|
|
|
|
|
|
|
|
|
|
|
|
|
| CONSOLIDATED STATEMENTS OF COMPREHENSIVE INCOME (LOSS) |
| U.S. dollars in thousands |
|
Three months ended September 30, |
|
Nine months ended September 30, |
|
Year ended December 31, |
|
2023 |
|
2022 |
|
2023 |
|
2022 |
|
2022 |
|
Unaudited |
|
Unaudited |
|
Audited |
| Net income (loss) |
$ |
(49,485) |
|
|
$ |
(26,576) |
|
|
$ |
(159,964) |
|
|
$ |
(55,231) |
|
|
$ |
(92,534) |
|
| Other comprehensive income (loss), net of tax: |
|
|
|
|
|
|
|
|
|
| Change in foreign currency translation adjustments |
826 |
|
|
541 |
|
|
1,655 |
|
|
1,550 |
|
|
1,425 |
|
| Unrealized gain (loss) from debt securities |
15 |
|
|
(127) |
|
|
440 |
|
|
(896) |
|
|
(445) |
|
| Pension benefit plan |
(852) |
|
|
(625) |
|
|
(1,654) |
|
|
209 |
|
|
(244) |
|
| Total comprehensive income (loss) |
$ |
(49,496) |
|
|
$ |
(26,787) |
|
|
$ |
(159,523) |
|
|
$ |
(54,368) |
|
|
$ |
(91,798) |
|
|
|
|
|
|
|
|
|
|
|
|
|
|
|
|
|
|
|
|
|
|
|
|
|
|
|
|
|
|
|
NOVOCURE LIMITED AND SUBSIDIARIES
CONSOLIDATED STATEMENTS OF CHANGES IN SHAREHOLDERS’ EQUITY |
| U.S. dollars in thousands (except share data) |
|
Ordinary shares |
|
Additional
paid-in
capital |
|
Accumulated
other
comprehensive
loss |
|
Retained earnings (accumulated
deficit) |
|
Total shareholders'
equity |
|
|
|
|
| Balance as of December 31, 2022 (audited) |
105,049,411 |
|
|
$ |
1,222,063 |
|
|
$ |
(2,433) |
|
|
$ |
(778,460) |
|
|
$ |
441,170 |
|
|
|
|
|
|
|
|
|
|
|
| Share-based compensation to employees |
— |
|
|
39,084 |
|
|
— |
|
|
— |
|
|
39,084 |
|
| Exercise of options and vested RSUs |
1,137,751 |
|
|
5,211 |
|
|
— |
|
|
— |
|
|
5,211 |
|
Other comprehensive income (loss), net of tax benefit of $0 |
— |
|
|
— |
|
|
(258) |
|
|
— |
|
|
(258) |
|
| Net income (loss) |
— |
|
|
— |
|
|
— |
|
|
(53,061) |
|
|
(53,061) |
|
| Balance as of March 31, 2023 (Unaudited) |
106,187,162 |
|
|
$ |
1,266,358 |
|
|
$ |
(2,691) |
|
|
$ |
(831,521) |
|
|
$ |
432,146 |
|
|
|
|
|
|
|
|
|
|
|
| Share-based compensation to employees |
— |
|
|
32,740 |
|
|
— |
|
|
— |
|
|
32,740 |
|
| Proceeds from issuance of shares |
81,730 |
|
|
2,883 |
|
|
— |
|
|
— |
|
|
2,883 |
|
| Exercise of options and vested RSUs |
336,439 |
|
|
4,622 |
|
|
|
|
— |
|
|
4,622 |
|
Other comprehensive income (loss), net of tax benefit of $0 |
— |
|
|
— |
|
|
710 |
|
|
— |
|
|
710 |
|
| Net income (loss) |
— |
|
|
— |
|
|
— |
|
|
(57,418) |
|
|
(57,418) |
|
| Balance as of June 30, 2023 (Unaudited) |
106,605,331 |
|
|
$ |
1,306,603 |
|
|
$ |
(1,981) |
|
|
$ |
(888,939) |
|
|
$ |
415,683 |
|
|
|
|
|
|
|
|
|
|
|
| Share-based compensation to employees |
— |
|
|
26,346 |
|
|
— |
|
|
— |
|
|
26,346 |
|
| Exercise of options and vested RSUs |
142,939 |
|
|
1,171 |
|
|
— |
|
|
— |
|
|
1,171 |
|
Other comprehensive income (loss), net of tax benefit of $0 |
— |
|
|
— |
|
|
(11) |
|
|
— |
|
|
(11) |
|
| Net income (loss) |
— |
|
|
— |
|
|
— |
|
|
(49,485) |
|
|
(49,485) |
|
| Balance as of September 30, 2023 (Unaudited) |
106,748,270 |
|
|
$ |
1,334,120 |
|
|
$ |
(1,992) |
|
|
$ |
(938,424) |
|
|
$ |
393,704 |
|
|
|
|
|
|
|
|
|
|
|
|
|
|
|
|
|
|
|
|
|
|
|
|
|
|
|
|
|
|
|
|
|
|
Ordinary shares |
|
Additional
paid-in
capital |
|
Accumulated
other
comprehensive
loss |
|
Retained earnings (accumulated
deficit) |
|
Total shareholders'
equity |
|
|
|
|
|
| Balance as of December 31, 2021 (audited) |
103,971,263 |
|
|
$ |
1,099,589 |
|
|
$ |
(3,169) |
|
|
$ |
(685,926) |
|
|
$ |
410,494 |
|
|
|
|
|
|
|
|
|
|
|
| Share-based compensation to employees |
— |
|
|
25,045 |
|
|
— |
|
|
— |
|
|
25,045 |
|
| Exercise of options and vested RSUs |
587,825 |
|
|
3,148 |
|
|
— |
|
|
— |
|
|
3,148 |
|
Other comprehensive income (loss), net of tax benefit of $0 |
— |
|
|
— |
|
|
1,841 |
|
|
— |
|
|
1,841 |
|
| Net income (loss) |
— |
|
|
— |
|
|
— |
|
|
(4,647) |
|
|
(4,647) |
|
| Balance as of March 31, 2022 (Unaudited) |
104,559,088 |
|
|
$ |
1,127,782 |
|
|
$ |
(1,328) |
|
|
$ |
(690,573) |
|
|
$ |
435,881 |
|
|
|
|
|
|
|
|
|
|
|
| Share-based compensation to employees |
— |
|
|
25,823 |
|
|
— |
|
|
— |
|
|
25,823 |
|
| Proceeds from issuance of shares |
46,709 |
|
|
2,759 |
|
|
— |
|
|
— |
|
|
2,759 |
|
| Exercise of options and vested RSUs |
121,888 |
|
|
1,984 |
|
|
— |
|
|
— |
|
|
1,984 |
|
Other comprehensive income (loss), net of tax benefit of $0 |
— |
|
|
— |
|
(767) |
|
|
— |
|
|
(767) |
|
| Net income (loss) |
— |
|
|
— |
|
— |
|
|
(24,008) |
|
|
(24,008) |
|
| Balance as of June 30, 2022 (Unaudited) |
104,727,685 |
|
|
$ |
1,158,348 |
|
|
$ |
(2,095) |
|
|
$ |
(714,581) |
|
|
$ |
441,672 |
|
|
|
|
|
|
|
|
|
|
|
| Share-based compensation to employees |
— |
|
|
26,305 |
|
|
— |
|
|
— |
|
|
26,305 |
|
| Exercise of options and vested RSUs |
215,256 |
|
|
4,211 |
|
|
— |
|
|
— |
|
|
4,211 |
|
Other comprehensive income (loss), net of tax benefit of $0 |
— |
|
|
— |
|
|
(211) |
|
|
— |
|
|
(211) |
|
| Net income (loss) |
— |
|
|
— |
|
|
— |
|
|
(26,576) |
|
|
(26,576) |
|
| Balance as of September 30, 2022 (Unaudited) |
104,942,941 |
|
|
$ |
1,188,864 |
|
|
$ |
(2,306) |
|
|
$ |
(741,157) |
|
|
$ |
445,401 |
|
The accompanying notes are an integral part of these unaudited consolidated financial statements.
|
|
|
|
|
|
|
|
|
|
|
|
|
|
|
|
|
|
|
|
|
|
|
|
|
|
|
|
|
|
NOVOCURE LIMITED AND SUBSIDIARIES
CONSOLIDATED STATEMENTS OF CASH FLOWS |
| U.S. dollars in thousands |
| |
Three months ended September 30, |
|
Nine months ended September 30, |
|
Year ended December 31, |
|
2023 |
|
2022 |
|
2023 |
|
2022 |
|
2022 |
|
Unaudited |
|
Unaudited |
|
Audited |
| Cash flows from operating activities: |
|
|
|
|
|
|
|
|
|
| Net income (loss) |
$ |
(49,485) |
|
|
$ |
(26,576) |
|
|
$ |
(159,964) |
|
|
$ |
(55,231) |
|
|
$ |
(92,534) |
|
| Adjustments to reconcile net income (loss) to net cash provided by (used in) operating activities: |
|
|
|
|
|
|
|
|
|
| Depreciation and amortization |
2,803 |
|
|
2,659 |
|
|
8,246 |
|
|
7,924 |
|
|
10,624 |
|
| Accrued Interest |
480 |
|
|
1 |
|
|
530 |
|
|
(822) |
|
|
(2,216) |
|
| Asset write-downs and impairment of field equipment |
112 |
|
|
163 |
|
|
374 |
|
|
514 |
|
|
955 |
|
| Share-based compensation |
26,346 |
|
|
26,305 |
|
|
98,170 |
|
|
77,173 |
|
|
106,955 |
|
| Foreign currency remeasurement loss (gain) |
1,398 |
|
|
(141) |
|
|
2,185 |
|
|
1,051 |
|
|
(3,256) |
|
| Decrease (increase) in accounts receivables |
2,642 |
|
|
11,522 |
|
|
24,094 |
|
|
6,318 |
|
|
2,547 |
|
| Amortization of discount (premium) |
(6,691) |
|
|
232 |
|
|
(15,822) |
|
|
1,743 |
|
|
(1,536) |
|
| Decrease (increase) in inventories |
(4,080) |
|
|
2,952 |
|
|
(8,250) |
|
|
(2,061) |
|
|
(4,342) |
|
| Decrease (increase) in other long-term assets |
3,971 |
|
|
1,665 |
|
|
3,585 |
|
|
5,885 |
|
|
7,107 |
|
| Increase (decrease) in accounts payables and accrued expenses |
6,265 |
|
|
5,265 |
|
|
(3,992) |
|
|
(1,895) |
|
|
14,257 |
|
| Increase (decrease) in other long-term liabilities |
(3,075) |
|
|
(1,627) |
|
|
(7,934) |
|
|
(6,104) |
|
|
(7,773) |
|
| Net cash provided by (used in) operating activities |
$ |
(19,314) |
|
|
$ |
22,420 |
|
|
(58,778) |
|
|
34,495 |
|
|
30,788 |
|
|
|
|
|
|
|
|
|
|
|
| Cash flows from investing activities: |
|
|
|
|
|
|
|
|
|
| Purchase of property, equipment and field equipment |
$ |
(7,253) |
|
|
$ |
(5,703) |
|
|
(20,272) |
|
|
(14,927) |
|
|
(21,358) |
|
| Proceeds from maturity of short-term investments |
275,549 |
|
|
358,729 |
|
|
916,433 |
|
|
1,074,763 |
|
|
1,179,289 |
|
| Purchase of short-term investments |
(251,038) |
|
|
(503,270) |
|
|
(810,513) |
|
|
(1,071,733) |
|
|
(1,297,888) |
|
| Net cash provided by (used in) investing activities |
$ |
17,258 |
|
|
$ |
(150,244) |
|
|
85,648 |
|
|
(11,897) |
|
|
(139,957) |
|
|
|
|
|
|
|
|
|
|
|
| Cash flows from financing activities: |
|
|
|
|
|
|
|
|
|
| Proceeds from issuance of shares, net |
$ |
— |
|
|
$ |
— |
|
|
2,883 |
|
|
2,759 |
|
|
5,224 |
|
|
|
|
|
|
|
|
|
|
|
| Repayment of long-term debt |
— |
|
|
(7) |
|
|
(10) |
|
|
(21) |
|
|
(28) |
|
| Exercise of options |
1,171 |
|
|
4,211 |
|
|
11,004 |
|
|
9,343 |
|
|
10,295 |
|
| Net cash provided by (used in) financing activities |
$ |
1,171 |
|
|
$ |
4,204 |
|
|
13,877 |
|
|
12,081 |
|
|
15,491 |
|
|
|
|
|
|
|
|
|
|
|
| Effect of exchange rate changes on cash, cash equivalents and restricted cash |
$ |
(97) |
|
|
$ |
(107) |
|
|
(69) |
|
|
(252) |
|
|
(97) |
|
|
|
|
|
|
|
|
|
|
|
| Increase (decrease) in cash, cash equivalents and restricted cash |
(982) |
|
|
(123,727) |
|
|
40,678 |
|
|
34,427 |
|
|
(93,775) |
|
| Cash, cash equivalents and restricted cash at the beginning of the period |
157,494 |
|
|
367,763 |
|
|
115,834 |
|
|
209,609 |
|
|
209,609 |
|
|
|
|
|
|
|
|
|
|
|
| Cash, cash equivalents and restricted cash at the end of the period |
$ |
156,512 |
|
|
$ |
244,036 |
|
|
$ |
156,512 |
|
|
$ |
244,036 |
|
|
$ |
115,834 |
|
|
|
|
|
|
|
|
|
|
|
|
|
|
|
|
|
|
|
|
|
|
|
|
|
|
|
|
|
|
|
|
|
|
|
|
|
|
|
|
|
|
|
|
|
|
|
|
|
|
|
|
|
|
|
|
|
|
|
|
|
|
|
NOVOCURE LIMITED AND SUBSIDIARIES
CONSOLIDATED STATEMENTS OF CASH FLOWS |
| U.S. dollars in thousands |
|
|
|
|
|
|
|
|
|
|
| Supplemental cash flow activities: |
|
|
|
|
|
|
|
|
|
| Cash paid during the period for: |
|
|
|
|
|
|
|
|
|
| Income taxes paid (refunded), net |
$ |
1,202 |
|
|
$ |
907 |
|
|
$ |
8,745 |
|
|
$ |
3,933 |
|
|
$ |
5,480 |
|
| Interest paid |
$ |
— |
|
|
$ |
1 |
|
|
$ |
1 |
|
|
$ |
3 |
|
|
$ |
41 |
|
| Reconciliation of cash, cash equivalents and restricted cash: |
|
|
|
|
|
|
|
|
|
| Cash and cash equivalents |
$ |
154,860 |
|
|
$ |
243,805 |
|
|
$ |
154,860 |
|
|
$ |
243,805 |
|
|
$ |
115,326 |
|
| Restricted cash |
1,652 |
|
|
231 |
|
|
1,652 |
|
|
231 |
|
|
508 |
|
| Total cash, cash equivalents and restricted cash |
$ |
156,512 |
|
|
$ |
244,036 |
|
|
$ |
156,512 |
|
|
$ |
244,036 |
|
|
$ |
115,834 |
|
| Non-cash activities: |
|
|
|
|
|
|
|
|
|
| Right-of-use assets obtained in exchange for lease liabilities |
$ |
4,693 |
|
|
$ |
2,828 |
|
|
$ |
10,477 |
|
|
$ |
6,687 |
|
|
$ |
12,117 |
|
The accompanying notes are an integral part of these unaudited consolidated financial statements.
NOVOCURE LIMITED AND SUBSIDIARIES
NOTES TO UNAUDITED CONSOLIDATED FINANCIAL STATEMENTS
U.S. dollars in thousands (except share data)
NOTE 1: ORGANIZATION AND BASIS OF PRESENTATION
Organization. NovoCure Limited (including its consolidated subsidiaries, the "Company") was incorporated in the Bailiwick of Jersey and is principally engaged in the development, manufacture and commercialization of Tumor Treating Fields ("TTFields") devices, including Optune and Optune Lua (collectively, our "Products"), for the treatment of solid tumor cancers. The Company markets Optune and Optune Lua in multiple countries around the globe with the majority of revenues coming from the use of Optune in the U.S., Germany and Japan. The Company also has a License and Collaboration Agreement (the "Zai Agreement") with Zai Lab (Shanghai) Co., Ltd. ("Zai") to market Optune in China, Hong Kong, Macau and Taiwan ("Greater China").
Financial statement preparation. The accompanying unaudited consolidated financial statements include the accounts of the Company and intercompany accounts and transactions have been eliminated. In the opinion of the Company’s management, the unaudited consolidated financial statements reflect all adjustments, which are normal and recurring in nature, necessary for fair financial statement presentation for the periods presented. The preparation of these unaudited consolidated financial statements in conformity with U.S. generally accepted accounting principles ("GAAP") requires management to make estimates and assumptions that affect the amounts reported in these unaudited consolidated financial statements and accompanying notes. Actual results could differ materially from those estimates. These unaudited consolidated financial statements and accompanying notes should be read in conjunction with the Company’s annual consolidated financial statements and the notes thereto included in the Company’s Annual Report on Form 10-K for the fiscal year ended December 31, 2022 (the "2022 10-K") filed with the Securities and Exchange Commission on February 23, 2023.
The significant accounting policies applied in the audited annual consolidated financial statements of the Company as disclosed in the 2022 10-K are applied consistently in these unaudited interim consolidated financial statements.
Concentration Risks. The Company's cash, cash equivalents, short-term investments and trade receivables are potentially subject to a concentration of risk. Cash, cash equivalents and short-term investments are invested at top tier financial institutions globally and the total value invested at any one institution is limited pursuant to the Company's investment policy. These investments may be in excess of insured limitations or not insured in certain jurisdictions. Generally, these investments may be redeemed upon demand according to the terms of the securities.
The Company's trade receivables are due from numerous governments and federal and state agencies that are paid from their respective budgets, and from hundreds of health insurance companies. The Company does not believe that there are significant default risks associated with these governments, agencies and health insurance companies based upon the Company's historical experience.
The Company has no off-balance sheet concentrations of credit risk such as foreign exchange contracts, option contracts or other foreign hedging arrangements.
NOTE 2: CASH, CASH EQUIVALENTS AND SHORT-TERM INVESTMENTS
Cash equivalents include items almost as liquid as cash, with maturity periods of three months or less when purchased, and short-term investments include items with maturity dates between three months and one year when purchased. As of September 30, 2023 and December 31, 2022, the Company’s cash and cash equivalents and short-term investments were composed of:
|
|
|
|
|
|
|
|
|
|
|
|
|
|
|
|
|
|
|
|
|
|
|
|
|
|
|
|
|
|
|
|
|
|
|
|
|
|
|
|
|
|
|
|
|
|
|
|
|
September 30, 2023 |
|
Unaudited |
|
Fair value level |
|
Adjusted cost basis |
|
Unrealized gains |
|
Unrealized losses |
|
Fair market value |
|
Recorded basis |
|
Cash and cash equivalents |
|
Short-term investments (2) |
| Cash |
|
|
$ |
8,636 |
|
|
$ |
— |
|
|
$ |
— |
|
|
$ |
8,636 |
|
|
$ |
8,636 |
|
|
$ |
8,636 |
|
|
$ |
— |
|
| Money market funds |
Level 1 |
|
141,224 |
|
|
— |
|
|
— |
|
|
141,224 |
|
|
141,224 |
|
|
141,224 |
|
|
— |
|
| Certificate of deposits and term deposits |
Level 2 |
|
163,820 |
|
|
— |
|
|
— |
|
|
163,820 |
|
|
163,820 |
|
|
5,000 |
|
|
158,820 |
|
| HTM securities (1) |
|
|
|
|
|
|
|
|
|
|
|
|
|
|
|
| U.S. Treasury bills |
Level 1 |
|
$ |
109,595 |
|
|
$ |
15 |
|
|
$ |
(14) |
|
|
109,596 |
|
|
109,595 |
|
|
$ |
— |
|
|
$ |
109,595 |
|
| Government and governmental agencies |
Level 2 |
|
$ |
24,596 |
|
|
$ |
— |
|
|
$ |
(15) |
|
|
24,581 |
|
|
24,596 |
|
|
$ |
— |
|
|
$ |
24,596 |
|
| Corporate debt securities |
Level 2 |
|
$ |
473,377 |
|
|
$ |
83 |
|
|
$ |
(281) |
|
|
473,179 |
|
|
473,377 |
|
|
$ |
— |
|
|
$ |
473,377 |
|
|
|
|
|
|
|
|
|
|
|
|
|
|
|
|
|
|
|
|
$ |
607,568 |
|
|
$ |
98 |
|
|
$ |
(310) |
|
|
$ |
607,356 |
|
|
$ |
607,568 |
|
|
$ |
— |
|
|
$ |
607,568 |
|
|
|
|
|
|
|
|
|
|
|
|
|
|
|
|
|
| Total |
|
|
$ |
921,248 |
|
|
$ |
98 |
|
|
$ |
(310) |
|
|
$ |
921,036 |
|
|
$ |
921,248 |
|
|
$ |
154,860 |
|
|
$ |
766,388 |
|
|
|
|
|
|
|
|
|
|
|
|
|
|
|
|
|
|
|
|
|
|
|
|
|
|
|
|
|
|
|
|
|
|
|
|
|
|
|
|
|
|
|
|
|
|
|
|
|
|
December 31, 2022 |
|
Audited |
|
Fair value level |
|
Adjusted cost basis |
|
Unrealized gains |
|
Unrealized losses |
|
Fair market value |
|
Recorded basis |
|
Cash and cash equivalents |
|
Short-term investments |
| Cash |
|
|
$ |
9,697 |
|
|
$ |
— |
|
|
$ |
— |
|
|
$ |
9,697 |
|
|
$ |
9,697 |
|
|
$ |
9,697 |
|
|
$ |
— |
|
| Money market funds |
Level 1 |
|
105,629 |
|
|
— |
|
|
— |
|
|
105,629 |
|
|
105,629 |
|
|
105,629 |
|
|
— |
|
| Certificate of deposits and term deposits |
Level 2 |
|
316,946 |
|
|
— |
|
|
— |
|
|
316,946 |
|
|
316,946 |
|
|
— |
|
|
316,946 |
|
| HTM securities (1) |
|
|
|
|
|
|
|
|
|
|
|
|
|
|
|
| U.S. Treasury bills |
Level 1 |
|
$ |
188,030 |
|
|
$ |
8 |
|
|
$ |
(540) |
|
|
187,498 |
|
|
188,030 |
|
|
$ |
— |
|
|
$ |
188,030 |
|
| Government and governmental agencies |
Level 2 |
|
$ |
44,357 |
|
|
$ |
12 |
|
|
$ |
(12) |
|
|
44,357 |
|
|
44,357 |
|
|
$ |
— |
|
|
$ |
44,357 |
|
| Corporate debt securities |
Level 2 |
|
$ |
304,766 |
|
|
$ |
1,066 |
|
|
$ |
(587) |
|
|
305,245 |
|
|
304,766 |
|
|
$ |
— |
|
|
$ |
304,766 |
|
|
|
|
|
|
|
|
|
|
|
|
|
|
|
|
|
|
|
|
$ |
537,153 |
|
|
$ |
1,086 |
|
|
$ |
(1,139) |
|
|
$ |
537,100 |
|
|
$ |
537,153 |
|
|
$ |
— |
|
|
$ |
537,153 |
|
|
|
|
|
|
|
|
|
|
|
|
|
|
|
|
|
| Total |
|
|
$ |
969,425 |
|
|
$ |
1,086 |
|
|
$ |
(1,139) |
|
|
$ |
969,372 |
|
|
$ |
969,425 |
|
|
$ |
115,326 |
|
|
$ |
854,099 |
|
(1) Changes in fair value of held-to-maturity ("HTM") securities are presented for disclosure purposes as required by ASC 320 "Investments — Debt Securities" and are recorded as finance expenses only if the unrealized loss is identified as a credit loss.
(2) Pursuant to a bank guaranty, $15,862 of short-term investments are pledged. See Note 4.
In November 2022, the Company transferred all of its available-for-sale portfolio to HTM as part of the Company's investment strategy. Such transfers are made at fair value at the date of transfer. The net unrealized loss on these securities at the date of transfer was $911. These securities continue to be reported in accumulated comprehensive income (loss) and are amortized over the remaining lives of the securities as an adjustment to the yield. As of September 30, 2023 and December 31, 2022, the unamortized unrealized loss balances were $5 and $445, respectively, and are reported in accumulated other comprehensive income (loss).
In accordance with ASC 820, "Fair Value Measurements and Disclosures," the Company measures its money market funds at fair value. The fair value of the money market funds and HTM securities, which is presented for disclosure purposes, is classified within Level 1 or Level 2. This is because these assets are valued using quoted market prices or alternative pricing sources and models utilizing market observable inputs.
As of September 30, 2023 and December 31, 2022, all investments mature in one year or less.
Unrealized losses from debt securities are primarily attributable to changes in interest rates. The Company does not believe any remaining unrealized losses represent impairments based on the evaluation of available evidence.
NOTE 3: INVENTORIES
Inventories are stated at the lower of cost or net realizable value. The weighted average methodology is applied to determine cost. As of September 30, 2023 and December 31, 2022, the Company’s inventories were composed of:
|
|
|
|
|
|
|
|
|
|
|
|
|
September 30,
2023 |
|
December 31,
2022 |
| |
Unaudited |
|
Audited |
| Raw materials |
$ |
10,382 |
|
|
$ |
4,314 |
|
| Work in progress |
7,518 |
|
|
9,321 |
|
| Finished products |
18,906 |
|
|
15,741 |
|
| Total |
$ |
36,806 |
|
|
$ |
29,376 |
|
NOTE 4: COMMITMENTS AND CONTINGENT LIABILITIES
Operating Leases. The facilities of the Company are leased under various operating lease agreements for periods, including options for extensions, ending no later than 2044. The Company also leases motor vehicles under various operating leases, which expire on various dates, the latest of which is in 2026.
Pledged deposits and bank guarantees. As of September 30, 2023 and December 31, 2022, the Company pledged bank deposits of $2,643 and $2,296, respectively, to cover bank guarantees in respect of its leases of operating facilities and obtained bank guarantees for the fulfillment of the Company’s lease and other contractual commitments of $2,991 and $2,459, respectively. In addition, €15,000 ($15,862) of the Company's short term investments are pledged to a bank as guarantee for the Company's due execution of cash concentration agreements.
Senior secured revolving credit facility. On November 6, 2020, the Company entered into a three-year $150,000 senior secured revolving credit facility ("2020 Credit Facility") with a syndicate of relationship banks. On February 17, 2023, the Company gave irrevocable notice to the administrative agent under the 2020 Credit Facility that the Company terminated all commitments, effective February 22, 2023. This effectively terminated the 2020 Credit Facility, as the Company's ability to borrow and the Company's obligations to comply with all covenants ended on such date. The liens and guaranties in favor of the lenders are released. There was no early termination fee payable and the Company had no outstanding balance borrowed under the 2020 Credit Facility.
The commitments under the 2020 Credit Facility were guaranteed by certain of the Company's subsidiaries and secured by a first lien on the Company's and certain of its subsidiaries’ assets. Outstanding loans bore interest per annum at a sliding scale based on a secured leverage ratio from 2.75% to 3.25% above the applicable interbank borrowing reference rate for the currency in which the loan is denominated. Additionally, the 2020 Credit Facility contained a fee for the unused revolving credit commitments at a sliding scale based on our secured leverage ratio from 0.35% to 0.45%. The 2020 Credit Facility contained financial covenants requiring maintenance of a minimum fixed charge coverage ratio and specifying a maximum senior secured net leverage ratio, as well as customary events of default which include a change of control, which are no longer applicable.
Legal Proceedings. In June 2023, a putative class action lawsuit was filed against the Company, its Executive Chairman and its Chief Executive Officer. The complaint, which purports to be brought on behalf of a class of persons and/or entities who purchased or otherwise acquired ordinary shares of the Company from January 5, 2023 through June 5, 2023, allege material misstatements and/or omissions in the Company’s public statements with respect to the results from its phase 3 LUNAR clinical trial. The Company believes that the action is without merit and plans to defend the lawsuit vigorously. As of September 30, 2023, the Company has not accrued any amounts in respect of this claim, as it believes liability is not probable and the amount of any potential liability cannot be reasonably estimated.
NOTE 5: CONVERTIBLE NOTE
On November 5, 2020, the Company issued $575,000 aggregate principal amount of 0% Convertible Senior Notes due 2025 (the “Notes”).
The Notes mature on November 1, 2025, unless earlier repurchased, redeemed or converted as set forth in the Notes. As of September 30, 2023, the conditions allowing holders of the Notes to convert were not met. The Notes are therefore not convertible as of September 30, 2023 and are classified as long-term liability.
The net carrying amount of the liability of the Notes as of September 30, 2023 and December 31, 2022 are as follows:
|
|
|
|
|
|
|
|
|
|
|
|
|
|
|
September 30,
2023 |
|
|
|
December 31,
2022 |
|
Unaudited |
|
|
|
Audited |
| Liability component, net: |
|
|
|
|
|
| Principal amount |
$ |
575,000 |
|
|
|
|
$ |
575,000 |
|
| Unamortized issuance costs |
(7,014) |
|
|
|
|
(9,491) |
|
| Net carrying amount of liability component (1) |
$ |
567,986 |
|
|
|
|
$ |
565,509 |
|
(1) An effective interest rate determines the fair value of the Notes, therefore they are categorized as Level 3 in accordance with ASC 820. The estimated fair value of the net carrying amount of liability component of the Notes as of September 30, 2023 and December 31, 2022 were $480,791 and $455,091, respectively.
The net carrying amount of the liability is represented by the principal amount of the Notes, less total issuance costs plus any amortization of issuance costs. The total issuance costs upon issuance of the Notes were $16,561 and are amortized to interest expense using the effective interest rate method over the contractual term of the Notes. Interest expense is recognized at an annual effective interest rate of 0.59% over the contractual term of the Notes.
Finance expense related to the Notes was as follows:
|
|
|
|
|
|
|
|
|
|
|
|
|
|
|
|
|
|
|
|
|
|
|
|
|
|
|
|
|
|
|
Three months ended September 30, |
|
Nine months ended September 30, |
|
Year ended December 31,
2022 |
|
2023 |
|
2022 |
|
2023 |
|
2022 |
|
|
Unaudited |
|
Unaudited |
|
Audited |
Amortization of debt issuance costs |
836 |
|
|
831 |
|
|
2,477 |
|
|
2,461 |
|
|
3,293 |
|
Total finance expense recognized |
$ |
836 |
|
|
$ |
831 |
|
|
$ |
2,477 |
|
|
$ |
2,461 |
|
|
$ |
3,293 |
|
NOTE 6: SHARE OPTION PLANS AND ESPP
In September 2015, the Company adopted the 2015 Omnibus Incentive Plan (the “2015 Plan”). Under the 2015 Plan, the Company can issue various types of equity compensation awards such as share options, restricted shares, performance shares, restricted share units (“RSUs”), performance-based share units (“PSUs”), long-term cash awards and other share-based awards.
Options granted under the 2015 Plan generally have a two-year or four-year vesting period and expire ten years after the date of grant. Options granted under the 2015 Plan that are canceled or forfeited before expiration become available for future grants. RSUs granted under the 2015 Plan generally vest over a three-year period. PSUs granted under the 2015 Plan generally vest between a three- and six-year period as performance targets are attained. RSUs and PSUs granted under the 2015 Plan that are canceled before expiration become available for future grants. As of September 30, 2023, 18,729,954 ordinary shares were available for grant under the 2015 Plan.
A summary of the status of the Company’s option plans as of September 30, 2023 and changes during the period then ended is presented below:
|
|
|
|
|
|
|
|
|
|
|
|
|
Nine months ended September 30, 2023 |
|
Unaudited |
|
Number
of options |
|
Weighted
average
exercise
price |
| Outstanding at beginning of year |
8,786,364 |
|
|
$ |
37.27 |
|
| Granted |
942,643 |
|
|
66.90 |
|
| Exercised |
(787,569) |
|
|
13.94 |
|
| Forfeited and canceled |
(321,556) |
|
|
73.09 |
|
| Outstanding as of September 30, 2023 |
8,619,882 |
|
|
$ |
41.31 |
|
|
|
|
|
| Exercisable options |
6,810,232 |
|
|
$ |
31.18 |
|
For the nine months ended September 30, 2023, options to purchase 787,569 ordinary shares were exercised, resulting in the issuance of 787,569 ordinary shares.
A summary of the status of the Company’s RSUs and PSUs as of September 30, 2023 and changes during the period then ended is presented below.
|
|
|
|
|
|
|
|
|
|
|
|
|
Nine months ended September 30, 2023 |
|
Unaudited |
|
Number
of RSU/PSUs |
|
Weighted
average
grant date fair value |
| Unvested at beginning of year |
5,377,459 |
|
|
$ |
66.87 |
|
| Granted |
1,457,681 |
|
|
70.39 |
|
| Vested |
(829,560) |
|
|
84.94 |
|
| Forfeited and cancelled |
(178,399) |
|
|
86.51 |
|
| Unvested as of September 30, 2023 (1) |
5,827,181 |
|
|
64.60 |
|
(1) Includes PSUs that have a mix of service, market and other milestone performance vesting conditions which are vested upon achievements of performance milestones that are not probable as of September 30, 2023, in accordance with ASC 718 "Compensation — Stock Compensation" as follows:
|
|
|
|
|
|
|
|
|
|
|
|
|
|
|
|
|
|
|
September 30, 2023 |
|
Number of
PSUs |
|
Fair value at grant date per PSU |
|
Total fair value at grant date |
|
2,703,852 |
|
|
$ |
48.16 |
|
|
$ |
130,218 |
|
|
220,533 |
|
|
76.97 |
|
|
16,974 |
|
|
249,402 |
|
|
80.59 |
|
|
20,099 |
|
|
15,210 |
|
|
87.66 |
|
|
1,333 |
|
|
10,532 |
|
|
94.94 |
|
|
1,000 |
|
|
161,912 |
|
|
114.26 |
|
|
18,500 |
|
|
3,361,441 |
|
|
|
|
$ |
188,127 |
|
These PSUs will be expensed over the performance period when the vesting conditions become probable in accordance with ASC 718.
In September 2015, the Company adopted an employee share purchase plan (“ESPP”) to encourage and enable eligible employees to acquire ownership of the Company’s ordinary shares purchased through accumulated payroll deductions on an after-tax basis. In the United States, the ESPP is intended to be an “employee stock purchase plan” within the meaning of Section 423 of the Internal Revenue Code and the provisions of the ESPP are construed in a manner consistent with the requirements of such section. As of September 30, 2023, 4,787,003 ordinary shares were available to be purchased by eligible employees under the ESPP.
The fair value of share-based awards was estimated using the Black-Scholes model for all equity grants. For market condition awards, the Company also applied the Monte-Carlo simulation model. The Company assessed fair value using the following underlying assumptions:
|
|
|
|
|
|
|
|
|
|
|
|
|
|
|
|
|
|
|
Nine months ended September 30, |
|
Year ended December 31,
2022 |
|
2023 |
|
2022 |
|
|
Unaudited |
|
Audited |
| Stock Option Plans |
|
|
|
|
|
| Expected term (years) |
5.50-6.00 |
|
5.33-5.83 |
|
5.33-5.83 |
| Expected volatility |
63%-67% |
|
60%-62% |
|
60%-62% |
| Risk-free interest rate |
3.48%-4.16% |
|
1.58%-3.04% |
|
1.58%-4.23% |
|
|
|
|
|
|
|
|
|
|
|
|
|
|
|
|
|
|
| Dividend yield |
0.00 |
% |
|
0.00 |
% |
|
0.00 |
% |
| ESPP |
|
|
|
|
|
| Expected term (years) |
0.50 |
|
0.50 |
|
0.50 |
|
|
|
|
|
|
|
|
|
|
|
|
| Expected volatility |
56%-122% |
|
51%-77% |
|
51%-77% |
| Risk-free interest rate |
4.76%-5.38% |
|
0.19%-2.52% |
|
0.19%-2.52% |
| Dividend yield |
0.00 |
% |
|
0.00 |
% |
|
0.00 |
% |
The total non-cash share-based compensation expense related to all of the Company’s equity-based awards recognized for the three and nine months ended September 30, 2023 and 2022, and the year ended December 31, 2022 was:
|
|
|
|
|
|
|
|
|
|
|
|
|
|
|
|
|
|
|
|
|
|
|
|
|
|
|
|
|
|
|
Three months ended September 30, |
|
Nine months ended September 30, |
|
Year ended December 31,
2022 |
|
2023 |
|
2022 |
|
2023 |
|
2022 |
|
|
Unaudited |
|
Unaudited |
|
Audited |
| Cost of revenues |
$ |
1,511 |
|
|
$ |
1,013 |
|
|
$ |
5,540 |
|
|
$ |
2,994 |
|
|
$ |
4,690 |
|
| Research, development and clinical studies |
6,683 |
|
|
7,430 |
|
|
26,999 |
|
|
21,855 |
|
|
30,790 |
|
| Sales and marketing |
8,973 |
|
|
7,686 |
|
|
30,830 |
|
|
21,143 |
|
|
28,826 |
|
| General and administrative |
9,179 |
|
|
10,176 |
|
|
34,801 |
|
|
31,181 |
|
|
42,649 |
|
| Total share-based compensation expense |
$ |
26,346 |
|
|
$ |
26,305 |
|
|
$ |
98,170 |
|
|
$ |
77,173 |
|
|
$ |
106,955 |
|
NOTE 7: Basic and diluted net income (loss) per ordinary share
Basic net income (loss) per share is computed based on the weighted average number of ordinary shares outstanding during each period. Diluted net income per share is computed based on the weighted average number of ordinary shares outstanding during the period, plus potential dilutive shares (deriving from options, RSUs, PSUs, convertible notes and the ESPP) considered outstanding during the period, in accordance with ASC 260-10 "Earnings Per Share", as determined under the if-converted method.
The following table sets forth the computation of the Company’s basic and diluted net income (loss) per ordinary share:
|
|
|
|
|
|
|
|
|
|
|
|
|
|
|
|
|
|
|
|
|
|
|
|
|
|
|
|
|
|
| |
Three months ended September 30, |
|
Nine months ended September 30, |
|
Year ended December 31,
2022 |
| |
2023 |
|
2022 |
|
2023 |
|
2022 |
|
|
Unaudited |
|
Unaudited |
|
Audited |
| Net income (loss) attributable to ordinary shares as reported used in computing basic and diluted net income (loss) per share |
$ |
(49,485) |
|
|
$ |
(26,576) |
|
|
$ |
(159,964) |
|
|
$ |
(55,231) |
|
|
$ |
(92,534) |
|
|
|
|
|
|
|
|
|
|
|
|
|
|
|
|
|
|
|
|
|
|
|
|
|
|
|
|
|
|
|
|
|
|
|
|
|
|
|
|
|
|
|
|
|
|
|
|
|
|
|
|
|
|
|
|
|
|
|
|
|
| Weighted average number of ordinary shares used in computing diluted net income (loss) per share |
106,772,814 |
|
|
104,884,583 |
|
|
106,219,194 |
|
|
104,552,803 |
|
|
104,660,476 |
|
|
|
|
|
|
|
|
|
|
|
Potentially anti-dilutive shares that were excluded from the computation of basic net income (loss) per share: |
|
|
|
|
|
|
|
|
|
| Options |
6,250,189 |
|
|
6,440,190 |
|
|
6,354,627 |
|
|
6,695,719 |
|
|
6,387,275 |
|
RSUs and PSUs |
2,590,322 |
|
|
827,789 |
|
|
1,470,542 |
|
|
920,364 |
|
|
822,421 |
|
| ESPP |
96,444 |
|
|
21,462 |
|
|
150,930 |
|
|
52,601 |
|
|
62,910 |
|
| Weighted anti-dilutive shares outstanding which were not included in the diluted calculation |
8,936,955 |
|
|
7,289,441 |
|
|
7,976,099 |
|
|
7,668,684 |
|
|
7,272,606 |
|
|
|
|
|
|
|
|
|
|
|
| Basic and diluted net income (loss) per ordinary share |
$ |
(0.46) |
|
|
$ |
(0.25) |
|
|
$ |
(1.51) |
|
|
$ |
(0.53) |
|
|
$ |
(0.88) |
|
|
|
|
|
|
|
|
|
|
|
|
|
|
|
|
|
|
|
|
|
NOTE 8: SUPPLEMENTAL INFORMATION
The Company operates in a single reportable segment.
The following table presents long-lived assets by location:
|
|
|
|
|
|
|
|
|
|
|
|
|
September 30,
2023 |
|
December 31,
2022 |
| |
Unaudited |
|
Audited |
| United States |
$ |
38,482 |
|
|
$ |
30,012 |
|
| Israel |
8,100 |
|
|
7,180 |
|
| Switzerland |
6,327 |
|
|
5,084 |
|
| Japan |
965 |
|
|
1,063 |
|
| Germany |
1,039 |
|
|
762 |
|
| Others |
2,008 |
|
|
1,261 |
|
| Total long lived assets |
$ |
56,921 |
|
|
$ |
45,362 |
|
The Company’s revenues by geographic region, based on the customer’s location, are summarized as follows:
|
|
|
|
|
|
|
|
|
|
|
|
|
|
|
|
|
|
|
|
|
|
|
|
|
|
|
|
|
|
|
Three months ended September 30, |
|
Nine months ended September 30, |
|
Year ended December 31,
2022 |
|
2023 |
|
2022 |
|
2023 |
|
2022 |
|
|
Unaudited |
|
Unaudited |
|
Audited |
| United States |
$ |
86,243 |
|
|
$ |
102,651 |
|
|
$ |
258,429 |
|
|
$ |
308,270 |
|
|
$ |
406,894 |
|
| Germany |
14,683 |
|
|
6,780 |
|
|
45,547 |
|
|
36,366 |
|
|
46,120 |
|
| Japan |
7,588 |
|
|
7,865 |
|
|
24,118 |
|
|
24,887 |
|
|
32,781 |
|
| Greater China (1) |
6,756 |
|
|
6,164 |
|
|
18,822 |
|
|
16,465 |
|
|
21,332 |
|
| Others |
12,051 |
|
|
7,538 |
|
|
28,638 |
|
|
23,423 |
|
|
30,713 |
|
| Total net revenues |
$ |
127,321 |
|
|
$ |
130,998 |
|
|
$ |
375,554 |
|
|
$ |
409,411 |
|
|
$ |
537,840 |
|
(1) For additional information, see Note 12 to the Consolidated Financial Statements in the 2022 10-K.
Item 2. Management’s Discussion and Analysis of Financial Condition and Results of Operations
Management’s Discussion and Analysis of Financial Condition and Results of Operations (“MD&A”) is intended to provide information to assist you in better understanding and evaluating our financial condition and results of operations. We encourage you to read this MD&A in conjunction with our unaudited consolidated financial statements and the notes thereto for the period ended September 30, 2023 included in Part I, Item 1 of this Quarterly Report on Form 10-Q. This discussion contains forward-looking statements that involve risks and uncertainties. Please refer to the information under the heading “Cautionary Note Regarding Forward-Looking Statements” elsewhere in this report. References to the words “we,” “our,” “us,” and the “Company” in this report refer to NovoCure Limited, including its consolidated subsidiaries.
Critical Accounting Policies and Estimates
In accordance with U.S. generally accepted accounting principles (“GAAP”), in preparing our financial statements, we must make estimates and assumptions that affect the reported amounts of assets and liabilities, the disclosure of contingent assets and liabilities as of the date of the financial statements and the reported amounts of net revenues and expenses during the reporting period. We develop and periodically change these estimates and assumptions based on historical experience and on various other factors that we believe are reasonable under the circumstances. Actual results may differ from these estimates.
The critical accounting policies requiring estimates, assumptions and judgments that we believe have the most significant impact on our consolidated financial statements can be found in our 2022 10-K. For additional information, see Note 1 to our unaudited consolidated financial statements in Part I, Item 1 of this Quarterly Report. There were no other material changes to our critical accounting policies and estimates as compared to the critical accounting policies and estimates described in our 2022 10-K.
Overview
We are a global oncology company with a proprietary platform technology called Tumor Treating Fields ("TTFields"), which are electric fields that exert physical forces to kill cancer cells via a variety of mechanisms. Our key priorities are to drive commercial adoption of Optune, our commercial TTFields device, and to advance clinical and product development programs intended to extend overall survival in some of the most aggressive forms of cancer.
Optune is approved by the U.S. Food and Drug Administration ("FDA") under the Premarket Approval ("PMA") pathway for the treatment of adult patients with newly diagnosed glioblastoma ("GBM") together with temozolomide, a chemotherapy drug, and for adult patients with GBM following confirmed recurrence after chemotherapy as monotherapy treatment. We also have a CE certificate to market Optune for the treatment of GBM in the European Union ("EU"), as well as approval or local registration in the United Kingdom ("UK"), Japan, Canada and certain other countries. Optune Lua is approved by the FDA under the Humanitarian Device Exemption ("HDE") pathway to treat malignant pleural mesothelioma ("MPM") together with standard chemotherapies. We have also received CE certification in the EU and approval or local registration to market Optune Lua in certain other countries. We market Optune and Optune Lua in multiple countries around the globe with the majority of our revenues coming from the use of Optune in the U.S., Germany and Japan. In March 2023, we announced the availability and reimbursement of Optune together with temozolomide for the treatment of adult patients with newly diagnosed GBM in France and we are now treating patients. We are actively evaluating opportunities to expand our international footprint.
We believe the physical mechanisms of action behind TTFields therapy may be broadly applicable to solid tumor cancers and are conducting a number of phase 2 and phase 3 trials exploring application in cancers of the brain, torso and abdomen. We are designing several additional phase 2 and phase 3 trials in partnership with oncology leaders to further explore the capabilities of TTFields. We anticipate expanding our clinical pipeline over time to study the safety and efficacy of TTFields for additional solid tumor indications and combinations with other cancer treatment modalities.
Thoracic Cancer Program Updates
In June 2023, we presented positive results from the phase 3 LUNAR study evaluating the use of TTFields together with standard therapies for the treatment of metastatic NSCLC following platinum-failure. The LUNAR study met its primary endpoint with a statistically significant and clinically meaningful 3-month improvement in median overall survival ("OS") with TTFields therapy added to standard therapies (HR=0.74, P=0.035). Patients randomized to receive TTFields together with standard therapies demonstrated median OS of 13.2 months compared to 9.9 months in patients treated with standard therapies alone.
Patients randomized to receive TTFields and physician’s choice immune checkpoint inhibitor ("ICI") (n=66) demonstrated a median OS of 18.5 months, a profound extension compared to the median OS of 10.8 months demonstrated by patients that received ICI alone (n=68; HR=0.63; P=0.03). Patients randomized to receive TTFields and docetaxel (n=71) had a positive survival trend with a median OS of 11.1 months vs 8.7 months (n=71). TTFields therapy was well-tolerated with no added systemic toxicities and few grade 3 (no grade 4 or 5) device-related adverse events. In August 2023, the data from the LUNAR study were published in The Lancet Oncology, and additional data detailing the LUNAR study have since been presented at multiple medical congresses. These data are expected to serve as the basis for a PMA submission to the FDA in the second half of 2023.
In March 2023, we announced the final patient enrolled in the phase 3 METIS study evaluating the efficacy of TTFields therapy following stereotactic radiosurgery for the treatment of patients with brain metastases from NSCLC. Following the completion of enrollment, patients will be followed for a minimum of 12 months with top-line data anticipated in the first quarter of 2024.
We are planning to launch several additional trials intended to further explore the use of TTFields therapy in the treatment of NSCLC. In July 2023, the FDA accepted the investigation device exemption for the LUNAR-2 clinical trial ("LUNAR-2"), a randomized, phase 3 study testing the safety and effectiveness of TTFields concomitant with pembrolizumab and platinum-based chemotherapy in patients with metastatic NSCLC. The two primary endpoints of LUNAR-2 are overall survival and progression-free survival. LUNAR-2 is designed to accrue 734 patients with a 21-month follow-up following the enrollment of the last patient.
Abdominal Cancer Program Updates
In July 2023, we announced that an independent data monitoring committee ("DMC") conducted a pre-specified interim analysis for the phase 3 PANOVA-3 study for the treatment of unresectable, locally advanced pancreatic cancer. As part of the interim analysis, the DMC reviewed the safety and efficacy data for all locally advanced pancreatic cancer patients enrolled in the study. The interim analysis resulted in a DMC recommendation that the study should continue to final analysis. The PANOVA-3 study accrued 556 patients as of February 2023 and data will be reviewed in 2024, following an 18-month follow-up period.
In August 2023, the first patient was enrolled in the phase 2 PANOVA-4 study evaluating the safety and efficacy of TTFields therapy together with atezolizumab, gemcitabine and nab-paclitaxel in the treatment of metastatic pancreatic cancer. The PANOVA-4 study is designed to enroll 76 patients with a 12-month follow-up following the enrollment of the last patient. This study is the result of a clinical study collaboration with Roche.
In August 2023, we announced that the phase 3 INNOVATE-3 study for the treatment of platinum-resistant ovarian cancer did not meet its primary endpoint of overall survival at the final analysis. Consistent with previously reported studies, TTFields therapy was well-tolerated with no added systemic toxicities. An exploratory subgroup analysis suggested a potential survival benefit in patients who received only one prior line of therapy. Full evaluation of the data from the INNOVATE-3 trial, including subgroup analyses, is ongoing and we will work with trial investigators to share the full results with the scientific community in the future.
The table below presents the current status of the ongoing clinical studies in our pipeline and anticipated timing of data.
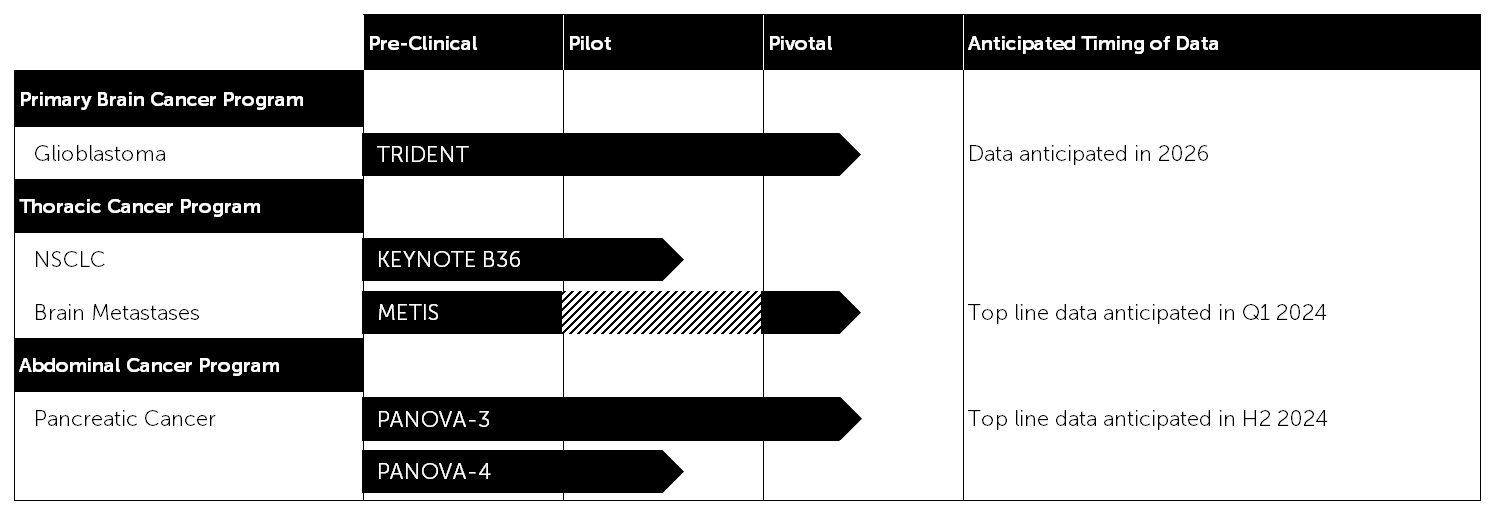
Our therapy is delivered through a medical device and we continue to advance our Products with the intention to extend survival and maintain quality of life for patients. We have several product development programs underway that are designed to optimize TTFields delivery to the target tumor and enhance patient ease of use. One of these initiatives is the launch of new arrays, which are thinner, lighter and more flexible. We have obtained a CE Mark and have begun rolling out our new arrays in multiple European countries. We plan to submit for regulatory approval in the U.S. via a PMA supplement by year-end 2023.
Our intellectual property portfolio contains hundreds of issued patents and numerous patent applications pending worldwide. We believe we possess global commercialization rights to our Products in oncology and are well-positioned to extend those rights into the future as we continue to find innovative ways to improve our Products.
In 2018, we granted Zai Lab (Shanghai) Co., Ltd. ("Zai") a license to commercialize Optune in China, Hong Kong, Macau and Taiwan ("Greater China") under a License and Collaboration Agreement (the "Zai Agreement"). The Zai Agreement also establishes a development partnership intended to accelerate the development of TTFields in multiple solid tumor cancer indications. For additional information, see Note 12 to the Consolidated Financial Statements in the Company’s Annual Report on Form 10-K for the fiscal year ended December 31, 2022 (the "2022 10-K").
We view our operations and manage our business in one operating segment. For the three and nine months ended September 30, 2023, our net revenues were $127.3 million and $375.6 million, respectively. Our net loss for the three and nine months ended September 30, 2023 was $49.5 million and $160.0 million, respectively. As of September 30, 2023, we had an accumulated deficit of $938.4 million. Our net loss resulted primarily from increasing investments designed to support our commercial business, geographic expansion and pre-commercial activities associated with potential future indication launches.
Impact of COVID-19
On May 5, 2023, the World Health Organization (“WHO”) declared the end of the COVID-19 pandemic as a public health emergency of international concern, however the WHO maintains that the virus remains a global health threat. Since the pandemic began, we have followed the guidance of the WHO, the U.S. Centers for Disease Control and Prevention, and local health authorities in all of our active markets and will continue to do so. The COVID-19 pandemic did not have a material impact on our financial results through the third quarter of 2023. The pandemic is not having a direct impact on our day-to-day operations; however, we are still observing lingering impacts that might continue to impact our business and clinical studies in the future. For example, in many locations staffing levels at clinical trial sites have not returned to pre-pandemic levels, and our ability to conduct and monitor clinical studies may be impacted.
Given the aggressive nature of the cancers that we treat, we believe that the fundamental value proposition of the TTFields platform remains unchanged. We continue to evaluate and plan for the potential effects of a possible COVID-19 resurgence on our business moving forward. The extent to which the COVID-19 pandemic may impact our business and clinical studies in the future will depend on further developments, which are highly uncertain and cannot be predicted with confidence.
The COVID-19 pandemic may also have the effect of heightening many of the other risks described in our risk factors disclosed in our 2022 10-K.
Impact of Current Events
On September 30, 2023, President Biden signed into law a continuing resolution that allowed the U.S. government to continue to be funded and operating through November 17, 2023. If full appropriations or continuing resolutions are not enacted, it is likely that some U.S. Food and Drug Administration functions would be required to stop working until they are funded. As a result, the review process for new products and clinical trials could be delayed.
On October 7, 2023, the State of Israel was attacked by and subsequently declared war on Hamas. As of the date of this filing, we believe that there is no immediate risk to our business facilities or operations. Our supply chain teams are working to increase stock levels to mitigate distribution and service risks from our suppliers in Israel.
Commentary on Results of Operations
Net revenues. Our revenues are primarily derived from patients using our Products in our active markets. We charge for treatment with our Products on a monthly basis. Our potential net revenues per patient are determined by our ability to secure payment, the monthly fee we collect and the number of months that the patient remains on therapy.
We also receive revenues pursuant to the Zai Agreement. For additional information regarding the Zai Agreement, see Note 12 to the Consolidated Financial Statements in our 2022 10-K.
Cost of revenues. We contract with third parties to manufacture our Products. Our cost of revenues is primarily comprised of the following:
•disposable arrays;
•depreciation expense for the field equipment, including the electric field generator used by patients;
•patient support and other personnel costs; and
•overhead costs, such as facilities, freight and depreciation of property, plant and equipment associated with managing our inventory, warehousing and order fulfillment functions.
Operating expenses. Our operating expenses consist of research, development and clinical studies, sales and marketing and general and administrative expenses. Personnel costs are a significant component for each category of operating expenses and consist of wages, benefits and bonuses. Personnel costs also include share-based compensation.
Financial income (expenses), net. Financial income (expenses), net primarily consists of interest income from cash balances and short-term investments, credit facility interest expense and related debt issuance costs, and gains (losses) from foreign currency transactions. Our reporting currency is the U.S. dollar. We have historically held substantially all of our cash balances in U.S. dollar denominated accounts to minimize the risk of translational currency exposure.
Results of Operations
The following discussion provides an analysis of our results of operations and reasons for material changes therein for the three and nine months ended September 30, 2023 as compared to the three and nine months ended September 30, 2022. The tables contained in this section report U.S. dollars in thousands (except share, patient, and prescription data). The following table sets forth our consolidated statements of operations data:
|
|
|
|
|
|
|
|
|
|
|
|
|
|
|
|
|
|
|
|
|
|
|
|
|
Three months ended September 30, |
|
Nine months ended September 30, |
|
2023 |
|
2022 |
|
2023 |
|
2022 |
|
Unaudited |
|
Unaudited |
| Net revenues |
$ |
127,321 |
|
|
$ |
130,998 |
|
|
$ |
375,554 |
|
|
$ |
409,411 |
|
| Cost of revenues |
32,092 |
|
|
29,749 |
|
|
95,724 |
|
|
85,979 |
|
| Gross profit |
95,229 |
|
|
101,249 |
|
|
279,830 |
|
|
323,432 |
|
|
|
|
|
|
|
|
|
| Operating costs and expenses: |
|
|
|
|
|
|
|
| Research, development and clinical studies |
53,623 |
|
|
51,956 |
|
|
168,754 |
|
|
151,265 |
|
| Sales and marketing |
57,964 |
|
|
41,395 |
|
|
167,621 |
|
|
124,029 |
|
| General and administrative |
41,887 |
|
|
32,509 |
|
|
124,609 |
|
|
94,683 |
|
| Total operating costs and expenses |
153,474 |
|
|
125,860 |
|
|
460,984 |
|
|
369,977 |
|
|
|
|
|
|
|
|
|
| Operating income (loss) |
(58,245) |
|
|
(24,611) |
|
|
(181,154) |
|
|
(46,545) |
|
| Financial income (expenses), net |
10,023 |
|
|
1,194 |
|
|
27,948 |
|
|
(2,743) |
|
|
|
|
|
|
|
|
|
| Income (loss) before income taxes |
(48,222) |
|
|
(23,417) |
|
|
(153,206) |
|
|
(49,288) |
|
| Income taxes |
1,263 |
|
|
3,159 |
|
|
6,758 |
|
|
5,943 |
|
| Net income (loss) |
$ |
(49,485) |
|
|
$ |
(26,576) |
|
|
$ |
(159,964) |
|
|
$ |
(55,231) |
|
|
|
|
|
|
|
|
|
| Basic and diluted net income (loss) per ordinary share |
$ |
(0.46) |
|
|
$ |
(0.25) |
|
|
$ |
(1.51) |
|
|
$ |
(0.53) |
|
| Weighted average number of ordinary shares used in computing basic and diluted net income (loss) per share |
106,772,814 |
|
|
104,884,583 |
|
|
106,219,194 |
|
|
104,552,803 |
|
|
|
|
|
|
|
|
|
The following table details the share-based compensation expense included in costs and expenses:
|
|
|
|
|
|
|
|
|
|
|
|
|
|
|
|
|
|
|
|
|
|
|
|
|
Three months ended September 30, |
|
Nine months ended September 30, |
|
2023 |
|
2022 |
|
2023 |
|
2022 |
|
Unaudited |
|
Unaudited |
| Cost of revenues |
$ |
1,511 |
|
|
$ |
1,013 |
|
|
$ |
5,540 |
|
|
$ |
2,994 |
|
| Research, development and clinical studies |
6,683 |
|
|
7,430 |
|
|
26,999 |
|
|
21,855 |
|
| Sales and marketing |
8,973 |
|
|
7,686 |
|
|
30,830 |
|
|
21,143 |
|
| General and administrative |
9,179 |
|
|
10,176 |
|
|
34,801 |
|
|
31,181 |
|
| Total share-based compensation expense |
$ |
26,346 |
|
|
$ |
26,305 |
|
|
$ |
98,170 |
|
|
$ |
77,173 |
|
Key performance indicators
We believe certain commercial operating statistics are useful to investors in evaluating our commercial business as they help our management team and investors evaluate and compare the adoption of our Products from period to period. The number of active patients on therapy is our principal revenue driver. An "active patient" is a patient who is receiving treatment under a commercial prescription order as of the measurement date, including patients who may be on a temporary break from treatment and who plan to resume treatment in less than 60 days. Prescriptions are a leading indicator of demand. A "prescription received" is a commercial order for Optune or Optune Lua that is received from a physician certified to treat patients with our Products for a patient not previously on Optune or Optune Lua. Orders to renew or extend treatment are not included in this total.
The following table includes certain commercial operating statistics for and as of the end of the periods presented.
|
|
|
|
|
|
|
|
|
|
|
|
|
September 30, |
| Operating statistics |
2023 |
|
2022 |
| Active patients at period end |
|
|
|
| United States (1) |
2,179 |
|
|
2,181 |
|
| Germany |
492 |
|
|
468 |
|
| Japan |
353 |
|
|
354 |
|
| Others |
615 |
|
|
417 |
|
| Total |
3,639 |
|
|
3,420 |
|
|
|
|
|
|
|
|
|
|
|
|
|
|
|
|
|
|
|
|
|
|
|
|
|
|
Three months ended September 30, |
|
Nine months ended September 30, |
| |
2023 |
|
2022 |
|
2023 |
|
2022 |
| Prescriptions received in period |
|
|
|
|
|
|
|
| United States (1) |
920 |
|
|
978 |
|
|
2,952 |
|
|
2,867 |
|
| Germany |
163 |
|
|
214 |
|
|
575 |
|
|
650 |
|
| Japan |
85 |
|
|
79 |
|
|
249 |
|
|
276 |
|
| Others |
299 |
|
|
118 |
|
|
743 |
|
|
363 |
|
| Total |
1,467 |
|
|
1,389 |
|
|
4,519 |
|
|
4,156 |
|
(1) United States includes data for Canada for 2022. For 2023, Canada is included in "Others".
There were 17 active MPM patients on therapy as of September 30, 2023 and 18 MPM prescriptions were received in the three months ended September 30, 2023.
Three and nine months ended September 30, 2023 compared to three and nine months ended September 30, 2022
|
|
|
|
|
|
|
|
|
|
|
|
|
|
|
|
|
|
|
|
|
|
|
|
|
|
|
|
|
|
|
|
|
|
|
|
|
Three months ended September 30, |
|
Nine months ended September 30, |
|
2023 |
|
2022 |
|
% Change |
|
2023 |
|
2022 |
|
% Change |
| Net revenues |
$ |
127,321 |
|
|
$ |
130,998 |
|
|
(3) |
% |
|
$ |
375,554 |
|
|
$ |
409,411 |
|
|
(8) |
% |
Net revenues. Net revenues decreased 3% to $127.3 million for the three months ending September 30, 2023 from $131.0 million for the same period in 2022, and decreased 8% to $375.6 million for the nine-month period ended September 30, 2023 from $409.4 million for the same period in 2022. For the three months ended September 30, 2023, the decrease primarily resulted from $14.5 million in reduced collections from denied or appealed claims in the U.S., partially offset by an increase of $7.9 million resulting from improved reimbursement approval rates in Germany and $4.2 million from our launch in France. For the nine month period ended September 30, 2023, the decrease resulted primarily from $41.9 million in reduced collections from denied or appealed claims in the U.S., partially offset by an increase of $9.2 million resulting from improved reimbursement approval rates in Germany and $4.2 million from our launch in France.
We believe the outstanding denied and appealed claims that were most accessible were largely exhausted in 2022 and the remaining outstanding claims will take time to collect. As a result, we expect future net revenue to more closely reflect core drivers: number of active patients on therapy, duration of therapy, and net realized price per month. We continue to actively appeal and pursue the remaining previously denied claims, but the cadence and size of these collections are difficult to predict.
|
|
|
|
|
|
|
|
|
|
|
|
|
|
|
|
|
|
|
|
|
|
|
|
|
|
|
|
|
|
|
|
|
|
|
|
|
Three months ended September 30, |
|
Nine months ended September 30, |
|
2023 |
|
2022 |
|
% Change |
|
2023 |
|
2022 |
|
% Change |
| Cost of revenues |
$ |
32,092 |
|
|
$ |
29,749 |
|
|
8 |
% |
|
$ |
95,724 |
|
|
$ |
85,979 |
|
|
11 |
% |
Cost of revenues. Our cost of revenues for the three months ended September 30, 2023 was $32.1 million, an increase of 8% from $29.7 million for the same period in 2022, and $95.7 million for the nine months ended September 30, 2023, an increase of 11% from $86.0 million for the same period in 2022.
For the three and nine months ended September 30, 2023, the increase in cost of revenues was primarily due to increased costs of $2.1 million and $8.6 million, respectively, in patient support capacity in anticipation of treating larger patient populations in new cancer indications and expansion into new geographic regions.
Excluding sales to Zai, cost of revenues per active patient per month was $2,599 for the three months ended September 30, 2023, an increase of 2% from $2,543 for the same period in 2022, primarily due to increased patient support capacity and the ongoing launch of next generation arrays. Cost of revenues per active patient is calculated by dividing the cost of revenues for the quarter less equipment sales to Zai for the quarter by the average of the active patients at the end of the prior quarter and the ending active patients in the current quarter. This quarterly figure is then divided by three to estimate the monthly cost of revenues per active patient. Sales to Zai are deducted because they are sold at cost and in anticipation of future royalties from Zai, and Zai patient counts are not included in our active patient population. Product sales to Zai totaled $4.0 million and $10.3 million for the three and nine months ended September 30, 2023 compared to $3.5 million and $8.8 million for the three and nine months ended September 30, 2022.
Gross margin was 75% for the three months ended September 30, 2023 compared to 77% for the three months ended September 30, 2022. Gross margin was 75% for the nine months ended September 30, 2023 and 79% for the nine months ended September 30, 2022. We expect that our gross margins will continue to be impacted by current and future product enhancements, such as the ongoing launch of next generation arrays. We continue to focus on opportunities to increase efficiencies and scale within our supply chain. This includes evaluating new materials, manufacturers, and processes that could lead to lower costs.
Operating Expenses.
|
|
|
|
|
|
|
|
|
|
|
|
|
|
|
|
|
|
|
|
|
|
|
|
|
|
|
|
|
|
|
|
|
|
|
|
|
Three months ended September 30, |
|
Nine months ended September 30, |
|
2023 |
|
2022 |
|
% Change |
|
2023 |
|
2022 |
|
% Change |
| Research, development and clinical studies |
$ |
53,623 |
|
|
$ |
51,956 |
|
|
3 |
% |
|
$ |
168,754 |
|
|
$ |
151,265 |
|
|
12 |
% |
| Sales and marketing |
57,964 |
|
|
41,395 |
|
|
40 |
% |
|
167,621 |
|
|
124,029 |
|
|
35 |
% |
| General and administrative |
41,887 |
|
|
32,509 |
|
|
29 |
% |
|
124,609 |
|
|
94,683 |
|
|
32 |
% |
| Total operating expenses |
$ |
153,474 |
|
|
$ |
125,860 |
|
|
22 |
% |
|
$ |
460,984 |
|
|
$ |
369,977 |
|
|
25 |
% |
Research, development and clinical study expenses. Research, development and clinical study expenses increased 3% to $53.6 million for the three months ended September 30, 2023 from $52.0 million for the same period in 2022, and increased 12% to $168.8 million for the nine-month period ended September 30, 2023 from $151.3 million in the same period in 2022. For the three months ended September 30, 2023, the change resulted primarily from an increase in quality assurance, regulatory affairs, product development, and safety costs in anticipation of clinical trial launches and regulatory filings. For the nine months ended September 30, 2023, the increase was primarily driven by a $12.2 million increase in quality assurance, regulatory affairs, product development, and safety costs and an increase of $5.1 million in other personnel expenses. Total research and development expenses can fluctuate quarter-to-quarter dependent upon the amount of clinical research organization services delivered, clinical materials procured and the number of trials actively underway within a given quarter.
Sales and marketing expenses. Sales and marketing expenses increased 40% to $58.0 million for the three months ended September 30, 2023 from $41.4 million for the same period in 2022, and increased 35% to $167.6 million for the nine-month period ended September 30, 2023 from $124.0 million for the same period in 2022. For the three and nine months ended September 30, 2023, these changes were primarily due to increases of $11.7 million and $24.4 million, respectively, in costs associated with geographic expansion and pre-launch activities intended to increase awareness in TTFields in anticipation of future approvals in new indications, as well as increased personnel costs of $1.3 million and $9.7 million, respectively.
General and administrative expenses. General and administrative expenses increased 29% to $41.9 million for the three-month period ended September 30, 2023 from $32.5 million for the same period in 2022, and increased 32% to $124.6 million for the nine months ended September 30, 2023 from $94.7 million for the same period in 2022. For the three and nine months ended September 30, 2023, these changes were primarily due to increases in personnel and project expenses to support potential new indication launches, new geographic launches, supply chain expansion and information technology enhancements of $9.4 million and $29.9 million, respectively.
|
|
|
|
|
|
|
|
|
|
|
|
|
|
|
|
|
|
|
|
|
|
|
|
|
|
|
|
|
|
|
|
|
|
|
|
|
Three months ended September 30, |
|
Nine months ended September 30, |
|
2023 |
|
2022 |
|
% Change |
|
2023 |
|
2022 |
|
% Change |
| Financial income (expenses), net |
$ |
10,023 |
|
|
$ |
1,194 |
|
|
739 |
% |
|
$ |
27,948 |
|
|
$ |
(2,743) |
|
|
(1,119) |
% |
Financial income (expenses), net. Financial income increased 739% to $10 million in income for the three months ended September 30, 2023 from $1.2 million of income for the same period in 2022 and financial income increased 1,119% to $27.9 million in income for the nine months ended September 30, 2023 from $2.7 million in expenses for the same period in 2022. For the three-month period ending September 30, 2023, the change from 2022 was primarily due to $8.0 million in increased interest income and $0.8 million in reduced foreign exchange rate expenses. For the nine-month period ending September 30, 2023, the change from 2022 was primarily due to $26.5 million in increased interest income and $4.6 million in reduced foreign exchange expenses.
|
|
|
|
|
|
|
|
|
|
|
|
|
|
|
|
|
|
|
|
|
|
|
|
|
|
|
|
|
|
|
|
|
|
|
|
|
Three months ended September 30, |
|
Nine months ended September 30, |
|
2023 |
|
2022 |
|
% Change |
|
2023 |
|
2022 |
|
% Change |
| Income taxes |
$ |
1,263 |
|
|
$ |
3,159 |
|
|
(60) |
% |
|
$ |
6,758 |
|
|
$ |
5,943 |
|
|
14 |
% |
Income taxes. Income taxes decreased $1.9 million, or 60%, to $1.3 million for the three months ended September 30, 2023 from $3.2 million for the same period in 2022, and income taxes increased $0.8 million, or 14% to $6.8 million for the nine months ended September 30, 2023 from $5.9 million for the same period in 2022. The increase reflects a change in the mix of applicable statutory tax rates in active jurisdictions.
Non-GAAP financial measures
We also measure our performance using a non-GAAP measurement of earnings before interest, taxes, depreciation, amortization and shared-based compensation (“Adjusted EBITDA”). We believe Adjusted EBITDA is useful to investors in evaluating our operating performance because it helps investors evaluate and compare the results of our operations from period to period by removing the impact of earnings attributable to our capital structure, tax rate and material non-cash items, specifically share-based compensation.
We calculate Adjusted EBITDA as operating income before financial expenses and income taxes, net of depreciation, amortization and share-based compensation. The following table reconciles net income (loss), which is the most directly comparable GAAP operating performance measure, to Adjusted EBITDA.
|
|
|
|
|
|
|
|
|
|
|
|
|
|
|
|
|
|
|
|
|
|
|
|
|
|
|
|
|
|
|
|
|
|
|
|
|
Three months ended September 30, |
|
Nine months ended September 30, |
|
2023 |
|
2022 |
|
% Change |
|
2023 |
|
2022 |
|
% Change |
| Net income (loss) |
$ |
(49,485) |
|
|
$ |
(26,576) |
|
|
86 |
% |
|
$ |
(159,964) |
|
|
$ |
(55,231) |
|
|
190 |
% |
| Add: Income tax |
1,263 |
|
|
3,159 |
|
|
(60) |
% |
|
6,758 |
|
|
5,943 |
|
|
14 |
% |
| Add: Financial expenses (income), net |
(10,023) |
|
|
(1,194) |
|
|
739 |
% |
|
(27,948) |
|
|
2,743 |
|
|
(1,119) |
% |
| Add: Depreciation and amortization |
2,803 |
|
|
2,659 |
|
|
5 |
% |
|
8,246 |
|
|
7,924 |
|
|
4 |
% |
| EBITDA |
$ |
(55,442) |
|
|
$ |
(21,952) |
|
|
153 |
% |
|
$ |
(172,908) |
|
|
$ |
(38,621) |
|
|
348 |
% |
| Add: Share-based compensation |
26,346 |
|
|
26,305 |
|
|
— |
% |
|
98,170 |
|
|
77,173 |
|
|
27 |
% |
| Adjusted EBITDA |
$ |
(29,096) |
|
|
$ |
4,353 |
|
|
(768) |
% |
|
$ |
(74,738) |
|
|
$ |
38,552 |
|
|
(294) |
% |
Adjusted EBITDA decreased by $33.4 million, or 768%, to a loss of $29.1 million for the three months ended September 30, 2023 from income of $4.4 million for the same period in 2022, and decreased by $113.3 million, or 294%, to a loss of $74.7 million for the nine months ended September 30, 2023 from income of $38.6 million for the same period in 2022. This decrease was primarily attributable to increased growth investments intended to expand our capacity to treat larger patient populations, to enhance commercial capabilities and to increase awareness of TTFields in anticipation of potential future approvals in new indications, and a reduction in revenue as described above.
Liquidity and Capital Resources
We have incurred significant losses and cumulative negative cash flows from operations since our founding in 2000. As of September 30, 2023, we had an accumulated deficit of $938.4 million. To date, we have primarily financed our operations through the issuance and sale of equity and the proceeds from long-term loans.
At September 30, 2023, we had $921.2 million in cash, cash equivalents and short-term investments, a decrease of $48.2 million compared to $969.4 million at December 31, 2022. We believe our cash, cash equivalents and short-term investments as of September 30, 2023 are sufficient for our operations for at least the next 12 months based on our existing business plan and our ability to control the timing of significant expense commitments. We expect that our operating expenses will continue to increase over the next several years and may outpace our gross profit as we prepare to expand into additional indications beyond GBM. As a result, we may need to raise additional capital to fund our operations.
The following summary of our cash flows for the periods indicated has been derived from our unaudited consolidated financial statements, which are included elsewhere in this Quarterly Report:
|
|
|
|
|
|
|
|
|
|
|
|
|
|
|
|
|
|
|
|
|
|
|
|
|
Nine months ended September 30, |
|
|
|
|
|
2023 |
|
2022 |
|
Change |
|
% Change |
| Net cash provided by (used in) operating activities |
$ |
(58,778) |
|
|
$ |
34,495 |
|
|
$ |
(93,273) |
|
|
(270) |
% |
| Net cash provided by (used in) investing activities |
85,648 |
|
|
(11,897) |
|
|
97,545 |
|
|
(820) |
% |
| Net cash provided by financing activities |
13,877 |
|
|
12,081 |
|
|
1,796 |
|
|
15 |
% |
| Effect of exchange rate changes on cash and cash equivalents |
(69) |
|
|
(252) |
|
|
183 |
|
|
(73) |
% |
| Net increase (decrease) in cash, cash equivalents and restricted cash |
$ |
40,678 |
|
|
$ |
34,427 |
|
|
$ |
6,251 |
|
|
18 |
% |
Operating activities. Net cash used in or provided by operating activities represents our net income (loss) for the periods presented, share-based compensation and depreciation and amortization. Operating cash flows are also impacted by changes in working capital.
Net cash used in operating activities increased by $93.3 million from $34.5 million net cash provided by operating activities for the nine months ended September 30, 2022 to $58.8 million net cash used in operating activities for the nine months ended September 30, 2023. This increase was a result of net income decreasing $104.7 million, offset by a $9.5 million decrease in working capital, an increase of $6.2 million in cash to non-cash based expenses primarily consisting of shared-based compensation, and an increase of $4.3 million in other long term assets and liabilities. The $9.5 million decrease in working capital includes a $17.8 million decrease in accounts receivable offset by an increase of $6.2 million in inventories.
Investing activities. Our investing activities consist primarily of investments in and redemptions of our short-term investments as well as investments in property and equipment.
Net cash provided by investing activities was $85.6 million for the nine months ended September 30, 2023, compared to $11.9 million used in investing activities for the nine months ended September 30, 2022. The $85.6 million net cash provided by investing activities for the nine months ended September 30, 2023 was primarily attributable to $105.9 million of net proceeds from the maturity of short-term investments and the purchase of $20.3 million of property and equipment. The $11.9 million net cash used in investing activities for the nine months ended September 30, 2022 was primarily attributable to $3.0 million of net proceeds in short-term investments and by the purchase of $14.9 million of property and equipment.
Financing activities. To date, our primary financing activities have been the sale of equity and the proceeds from long-term loans. Net cash provided by financing activities was $13.9 million for the nine months ended September 30, 2023, as compared to $12.1 million provided by financing activities for the nine months ended September 30, 2022. The net cash provided by financing activities for the nine months ended September 30, 2023 and September 30, 2022 included proceeds from the exercise of options under the Company's stock option plan.
Convertible Notes
On November 5, 2020, we issued $575.0 million aggregate principal amount of 0% Convertible Senior Notes due 2025 (the “Notes”). The Notes are senior unsecured obligations. The Notes do not bear regular interest, and the principal amount of the Notes will not accrete. The Notes are convertible at an initial conversion rate of 5.9439 ordinary shares per $1,000 principal amount of the Notes, which is equivalent to an initial conversion price of approximately $168.24 per ordinary share. The Notes are convertible at the option of the holders upon the satisfaction of certain other conditions and during certain periods, and if the Company exercises its right to redeem the Notes as permitted or required by the indenture. On or after August 1, 2025 until the close of the business on the business day immediately preceding the maturity date, holders may convert all or any portion of their Notes at the conversion rate at any time irrespective of the foregoing conditions.
In January 2021, we irrevocably elected to settle all conversions of Notes by a combination of cash and our ordinary shares and that the cash portion per $1,000 principal amount of Notes for all conversion settlements shall be $1,000. Accordingly, from and after the date of the election, upon conversion of any Notes, holders of Notes will receive, with respect to each $1,000 principal amount of Notes converted, cash in an amount up to $1,000 and the balance of the conversion value, if any, in our ordinary shares.
For more information, see Note 10a. to the Consolidated Financial Statements in the 2022 10-K.
Term loan credit facility
On November 6, 2020, we entered into a new three-year $150.0 million senior secured revolving credit facility with a syndicate of relationship banks (the "2020 Credit Facility"). On February 17, 2023, we gave irrevocable notice to the administrative agent under the 2020 Credit Facility that we terminated all commitments, effective February 22, 2023. This effectively terminated the 2020 Credit Facility, as our ability to borrow and our obligations to comply with all covenants ended on such date. The liens and guaranties in favor of the lenders are released. There was no early termination fee payable.
The commitments under the 2020 Credit Facility were guaranteed by certain of our subsidiaries and secured by a first lien on our and certain of our subsidiaries’ assets. Outstanding loans bore interest per annum at a sliding scale based on the our secured leverage ratio from 2.75% to 3.25% above the applicable interbank borrowing reference rate for the currency in which the loan is denominated. Additionally, the 2020 Credit Facility contained a fee for the unused revolving credit commitments at a sliding scale based on our secured leverage ratio from 0.35% to 0.45%. The 2020 Credit Facility contained financial covenants requiring maintenance of a minimum fixed charge coverage ratio and specifying a maximum senior secured net leverage ratio, as well as customary events of default which include a change of control, which are no longer applicable.
Contractual Obligations and Commitments
There have been no material changes from the information disclosed in our 2022 10-K.
Off-Balance Sheet Arrangements
We did not have during the periods presented, and we do not currently have, any off-balance sheet arrangements as defined under U.S. Securities and Exchange Commission (“SEC”) rules.
Item 3. Quantitative and Qualitative Disclosures About Market Risk
There have been no material changes from the information disclosed in our 2022 10-K.
Item 4. Controls and Procedures
Evaluation of Disclosure Controls and Procedures
As required by Rule 13a-15(b) under the Securities Exchange Act of 1934, as amended (the “Exchange Act”), our management, under the supervision and with the participation of our Chief Executive Officer and Chief Financial Officer, has evaluated the effectiveness of our disclosure controls and procedures as of September 30, 2023. The term “disclosure controls and procedures,” as defined in Rules 13a-15(e) and 15d-15(e) under the Exchange Act, means controls and other procedures of a company that are designed to ensure that information required to be disclosed by a company in the reports that it files or submits under the Exchange Act is recorded, processed, summarized and reported within the time periods specified in the SEC’s rules and forms. Disclosure controls and procedures include, without limitation, controls and procedures designed to ensure that information required to be disclosed by a company in the reports that it files or submits under the Exchange Act is accumulated and communicated to the company’s management, including its principal executive and principal financial officers, as appropriate, to allow timely decisions regarding required disclosure.
Management recognizes that any controls and procedures, no matter how well designed and operated, can provide only reasonable assurance of achieving their objectives and management necessarily applies its judgment in evaluating the cost-benefit relationship of possible controls and procedures. Based on the evaluation of our disclosure controls and procedures as of September 30, 2023, our Chief Executive Officer and Chief Financial Officer have concluded that, as of September 30, 2023, our disclosure controls and procedures were effective at the reasonable assurance level.
Changes in Internal Control over Financial Reporting
There has been no change in our internal control over financial reporting during the quarter ended September 30, 2023 that has materially affected, or is reasonably likely to materially affect, our internal control over financial reporting.
PART II—OTHER INFORMATION
Item 1. Legal Proceedings
In June 2023, a putative class action lawsuit was filed against the Company, its Executive Chairman and its Chief Executive Officer. The complaint, which purports to be brought on behalf of a class of persons and/or entities who purchased or otherwise acquired ordinary shares of the Company from January 5, 2023 through June 5, 2023, allege material misstatements and/or omissions in the Company’s public statements with respect to the results from its phase 3 LUNAR clinical trial. The Company believes that the action is without merit and plans to defend the lawsuit vigorously.
In addition, from time to time, we are involved in various legal proceedings, claims, investigations and litigation that arise in the ordinary course of our business. Litigation is inherently uncertain. Accordingly, we cannot predict with certainty the outcome of these matters. After considering a number of factors, including (but not limited to) the views of legal counsel, the nature of contingencies to which the Company is subject and prior experience, management believes that the ultimate disposition of these legal actions will not materially affect its consolidated financial position or results of operations.
Item 1A. Risk Factors
There have been no material changes to our risk factors disclosed in Part I, Item 1A “Risk Factors” in the 2022 10-K.
Item 2. Unregistered Sales of Equity Securities and Use of Proceeds
None.
Item 3. Defaults Upon Senior Securities
None.
Item 4. Mine Safety Disclosures
Not applicable.
Item 5. Other Information
Departure of Directors or Certain Officers
On October 26, 2023, the Company announced that Pritesh Shah will resign as Chief Growth Officer, effective January 1, 2024, and will remain with the Company in a non-executive capacity
Securities Trading Plans of Executive Officers and Directors
Rule 10b5-1 under the Exchange Act provides an affirmative defense that enables prearranged transactions in securities in a manner that avoids concerns about initiating transactions at a future date while possibly in possession of material nonpublic information. Our Insider Trading Policy permits our executive officers and directors to enter into trading plans designed to comply with Rule 10b5-1.
The following table describes contracts, instructions or written plans for the purchase or sale of our securities that are intended to satisfy the affirmative defense conditions of Rule 10b5–1(c) promulgated under the Securities Exchange Act of 1934, as amended (each a "Rule 10b5-1 Plan") adopted by our executive officers and directors during the three month period ending September 30, 2023:
|
|
|
|
|
|
|
|
|
|
|
|
|
|
|
|
|
|
Name |
Title |
Date of Adoption |
Duration of Rule 10b5-1 Plan |
Aggregate Number of Securities to be Purchased Pursuant to the Rule 10b5-1 Plan |
Aggregate Number of Securities to be Sold Pursuant to the Rule 10b5-1 Plan |
Pritesh Shah |
Chief Growth Officer |
August 8, 2023 |
8/30/2024 |
— |
103,304 |
|
|
|
|
|
|
During the three-month period ending September 30, 2023, none of our executive officers or directors terminated a Rule 10b5-1 trading plan or adopted or terminated a non-Rule 10b5-1 trading arrangement (as defined in Item 408(c) of Regulation S-K).
Item 6. Exhibits
EXHIBIT INDEX
|
|
|
|
|
|
|
|
|
|
|
|
|
|
|
|
|
|
|
|
|
|
|
|
|
|
|
|
|
|
|
|
|
Exhibit
Number |
|
|
|
Incorporated by Reference |
|
Filed
Herewith |
|
Exhibit Description |
|
Form |
|
Date |
|
Number |
|
| 31.1 |
|
|
|
|
|
|
|
|
|
X |
| 31.2 |
|
|
|
|
|
|
|
|
|
X |
| 32.1* |
|
|
|
|
|
|
|
|
|
X |
| 32.2* |
|
|
|
|
|
|
|
|
|
X |
| 101.INS |
|
Inline XBRL Instance Document |
|
|
|
|
|
|
|
X |
| 101.SCH |
|
Inline XBRL Taxonomy Extension Schema Document |
|
|
|
|
|
|
|
X |
| 101.CAL |
|
Inline XBRL Taxonomy Extension Calculation Linkbase Document |
|
|
|
|
|
|
|
X |
| 101.DEF |
|
Inline XBRL Taxonomy Extension Definition Linkbase Document |
|
|
|
|
|
|
|
X |
| 101.LAB |
|
Inline XBRL Taxonomy Extension Label Linkbase Document |
|
|
|
|
|
|
|
X |
| 101.PRE |
|
Inline XBRL Extension Presentation Linkbase Document |
|
|
|
|
|
|
|
X |
| 104 |
|
Cover Page Interactive Date File (formatted as Inline XBRL and contained in Exhibit 101) |
|
|
|
|
|
|
|
X |
____________________________________________
* The certifications attached as Exhibits 32.1 and 32.2 that accompany this Quarterly Report on Form 10-Q are not deemed filed with the Securities and Exchange Commission and are not to be incorporated by reference into any filing of NovoCure Limited under the Securities Act of 1933, as amended, or the Securities Exchange Act of 1934, as amended, whether made before or after the date of this Form 10-Q, irrespective of any general incorporation language contained in such filing.
SIGNATURES
Pursuant to the requirements of the Securities Exchange Act of 1934, the registrant has duly caused this report to be signed on its behalf by the undersigned thereunto duly authorized.
|
|
|
|
|
|
|
|
|
|
|
NovoCure Limited |
|
|
|
| Date: October 26, 2023 |
|
/s/ Ashley Cordova |
|
|
Ashley Cordova
Chief Financial Officer
(principal financial and accounting officer
and duly authorized officer) |
EX-31.1
2
nvcr-20230930exx311.htm
EX-31.1
Document
Exhibit 31.1
CERTIFICATIONS
I, Asaf Danziger, certify that:
1.I have reviewed this Quarterly Report on Form 10-Q of NovoCure Limited;
2.Based on my knowledge, this report does not contain any untrue statement of a material fact or omit to state a material fact necessary to make the statements made, in light of the circumstances under which such statements were made, not misleading with respect to the period covered by this report;
3.Based on my knowledge, the financial statements, and other financial information included in this report, fairly present in all material respects the financial condition, results of operations and cash flows of the registrant as of, and for, the periods presented in this report;
4.The registrant's other certifying officer(s) and I are responsible for establishing and maintaining disclosure controls and procedures (as defined in Exchange Act Rules 13a-15(e) and 15d-15(e)) and internal control over financial reporting (as defined in Exchange Act Rules 13a-15(f) and 15d-15(f)) for the registrant and have:
(a)Designed such disclosure controls and procedures, or caused such disclosure controls and procedures to be designed under our supervision, to ensure that material information relating to the registrant, including its consolidated subsidiaries, is made known to us by others within those entities, particularly during the period in which this report is being prepared;
(b)Designed such internal control over financial reporting, or caused such internal control over financial reporting to be designed under our supervision, to provide reasonable assurance regarding the reliability of financial reporting and the preparation of financial statements for external purposes in accordance with generally accepted accounting principles;
(c)Evaluated the effectiveness of the registrant's disclosure controls and procedures and presented in this report our conclusions about the effectiveness of the disclosure controls and procedures, as of the end of the period covered by this report based on such evaluation; and
(d)Disclosed in this report any change in the registrant's internal control over financial reporting that occurred during the registrant's most recent fiscal quarter (the registrant's fourth fiscal quarter in the case of an annual report) that has materially affected, or is reasonably likely to materially affect, the registrant's internal control over financial reporting.
5.The registrant's other certifying officers and I have disclosed, based on our most recent evaluation of internal control over financial reporting, to the registrant's auditors and the audit committee of the registrant's board of directors (or persons performing the equivalent functions):
(a)all significant deficiencies and material weaknesses in the design or operation of internal control over financial reporting which are reasonably likely to adversely affect the registrant's ability to record, process, summarize and report financial information; and
(b)any fraud, whether or not material, that involves management or other employees who have a significant role in the registrant's internal controls over financial reporting.
|
|
|
|
|
|
| Date: October 26, 2023 |
|
|
|
| /s/ Asaf Danziger |
|
| Asaf Danziger |
|
| Chief Executive Officer and Director |
|
EX-31.2
3
nvcr-20230930xexx312.htm
EX-31.2
Document
Exhibit 31.2
CERTIFICATIONS
I, Ashley Cordova, certify that:
1.I have reviewed this Quarterly Report on Form 10-Q of NovoCure Limited;
2.Based on my knowledge, this report does not contain any untrue statement of a material fact or omit to state a material fact necessary to make the statements made, in light of the circumstances under which such statements were made, not misleading with respect to the period covered by this report;
3.Based on my knowledge, the financial statements, and other financial information included in this report, fairly present in all material respects the financial condition, results of operations and cash flows of the registrant as of, and for, the periods presented in this report;
4.The registrant's other certifying officer(s) and I are responsible for establishing and maintaining disclosure controls and procedures (as defined in Exchange Act Rules 13a-15(e) and 15d-15(e)) and internal control over financial reporting (as defined in Exchange Act Rules 13a-15(f) and 15d-15(f)) for the registrant and have:
(a)Designed such disclosure controls and procedures, or caused such disclosure controls and procedures to be designed under our supervision, to ensure that material information relating to the registrant, including its consolidated subsidiaries, is made known to us by others within those entities, particularly during the period in which this report is being prepared;
(b)Designed such internal control over financial reporting, or caused such internal control over financial reporting to be designed under our supervision, to provide reasonable assurance regarding the reliability of financial reporting and the preparation of financial statements for external purposes in accordance with generally accepted accounting principles;
(c)Evaluated the effectiveness of the registrant's disclosure controls and procedures and presented in this report our conclusions about the effectiveness of the disclosure controls and procedures, as of the end of the period covered by this report based on such evaluation; and
(d)Disclosed in this report any change in the registrant's internal control over financial reporting that occurred during the registrant's most recent fiscal quarter (the registrant's fourth fiscal quarter in the case of an annual report) that has materially affected, or is reasonably likely to materially affect, the registrant's internal control over financial reporting.
5.The registrant's other certifying officers and I have disclosed, based on our most recent evaluation of internal control over financial reporting, to the registrant's auditors and the audit committee of the registrant's board of directors (or persons performing the equivalent functions):
(a)all significant deficiencies and material weaknesses in the design or operation of internal control over financial reporting which are reasonably likely to adversely affect the registrant's ability to record, process, summarize and report financial information; and
(b)any fraud, whether or not material, that involves management or other employees who have a significant role in the registrant's internal controls over financial reporting.
|
|
|
|
|
|
| Date: October 26, 2023 |
|
|
|
| /s/ Ashley Cordova |
|
| Ashley Cordova |
|
| Chief Financial Officer |
|
| (Principal Accounting and Financial Officer) |
|
EX-32.1
4
nvcr-20230930xexx321.htm
EX-32.1
Document
Exhibit 32.1
NOVOCURE LIMITED
CERTIFICATION PURSUANT TO
18 U.S.C. SECTION 1350,
AS ADOPTED PURSUANT TO
SECTION 906 OF THE SARBANES-OXLEY ACT OF 2002
In connection with the Quarterly Report of NovoCure Limited (the "Company") on Form 10-Q for the quarter ended September 30, 2023, as filed with the Securities and Exchange Commission on the date hereof (the "Report"), I, Asaf Danziger, Chief Executive Officer (Principal Executive Officer) of the Company, certify, pursuant to 18 U.S.C. § 1350, as adopted pursuant to § 906 of the Sarbanes-Oxley Act of 2002, that:
(1)The Report fully complies with the requirements of section 13(a) or 15(d) of the Securities Exchange Act of 1934; and
(2)The information contained in the Report fairly presents, in all material respects, the financial condition and result of operations of the Company.
|
|
|
|
|
|
| /s/ Asaf Danziger |
|
| Asaf Danziger |
|
| Chief Executive Officer |
|
| (Principal Executive Officer) |
|
Date: October 26, 2023
A signed original of this written statement required by Section 906 has been provided to the Company and will be retained by the Company and furnished to the Securities and Exchange Commission or its staff on request.
This certification accompanies the Report to which it relates, is not deemed filed with the Securities and Exchange Commission and is not to be incorporated by reference into any filing of NovoCure Limited under the Securities Act of 1933, as amended, or the Securities Exchange Act of 1934, as amended (whether made before or after the date of the Report), irrespective of any general incorporation language contained in such filing.
EX-32.2
5
nvcr-20230930xexx322.htm
EX-32.2
Document
Exhibit 32.2
NOVOCURE LIMITED
CERTIFICATION PURSUANT TO
18 U.S.C. SECTION 1350,
AS ADOPTED PURSUANT TO
SECTION 906 OF THE SARBANES-OXLEY ACT OF 2002
In connection with the Quarterly Report of NovoCure Limited (the "Company") on Form 10-Q for the quarter ended September 30, 2023, as filed with the Securities and Exchange Commission on the date hereof (the "Report"), I, Ashley Cordova, Chief Financial Officer (Principal Financial and Accounting Officer) of the Company, certify, pursuant to 18 U.S.C. § 1350, as adopted pursuant to § 906 of the Sarbanes-Oxley Act of 2002, that:
(1)The Report fully complies with the requirements of section 13(a) or 15(d) of the Securities Exchange Act of 1934; and
(2)The information contained in the Report fairly presents, in all material respects, the financial condition and result of operations of the Company.
|
|
|
|
|
|
| /s/ Ashley Cordova |
|
| Ashley Cordova |
|
| Chief Financial Officer |
|
| (Principal Financial and Accounting Officer) |
|
Date: October 26, 2023
A signed original of this written statement required by Section 906 has been provided to the Company and will be retained by the Company and furnished to the Securities and Exchange Commission or its staff on request.
This certification accompanies the Report to which it relates, is not deemed filed with the Securities and Exchange Commission and is not to be incorporated by reference into any filing of NovoCure Limited under the Securities Act of 1933, as amended, or the Securities Exchange Act of 1934, as amended (whether made before or after the date of the Report), irrespective of any general incorporation language contained in such filing.