UNITED STATES
SECURITIES AND EXCHANGE COMMISSION
Washington, D.C. 20549
FORM 8-K
CURRENT REPORT
PURSUANT TO SECTION 13 OR 15(d) OF THE
SECURITIES EXCHANGE ACT OF 1934
Date of Report (Date of earliest event reported): June 16, 2025
POWERFLEET, INC.
(Exact Name of Registrant as Specified in its Charter)
| Delaware | 001-39080 | 83-4366463 | ||
| (State
or Other Jurisdiction of Incorporation) |
(Commission
File Number) |
(IRS
Employer Identification No.) |
| 123 Tice Boulevard, Woodcliff Lake, New Jersey | 07677 | |
| (Address of Principal Executive Offices) | (Zip Code) |
Registrant’s telephone number, including area code (201) 996-9000
(Former name or former address, if changed since last report)
Check the appropriate box below if the Form 8-K filing is intended to simultaneously satisfy the filing obligation of the registrant under any of the following provisions (see General Instruction A.2. below):
| ☐ | Written communications pursuant to Rule 425 under the Securities Act (17 CFR 230.425) |
| ☐ | Soliciting material pursuant to Rule 14a-12 under the Exchange Act (17 CFR 240.14a-12) |
| ☐ | Pre-commencement communications pursuant to Rule 14d-2(b) under the Exchange Act (17 CFR 240.14d-2(b)) |
| ☐ | Pre-commencement communications pursuant to Rule 13e-4(c) under the Exchange Act (17 CFR 240.13e-4(c)) |
Securities registered pursuant to Section 12(b) of the Act:
| Title of each class | Trading Symbol(s) | Name of each exchange on which registered | ||
| Common Stock, par value $0.01 per share | AIOT | The Nasdaq Global Market |
Indicate by check mark whether the registrant is an emerging growth company as defined in Rule 405 of the Securities Act of 1933 (17 CFR §230.405) or Rule 12b-2 of the Securities Exchange Act of 1934 (17 CFR §240.12b-2).
Emerging growth company ☐
If an emerging growth company, indicate by check mark if the registrant has elected not to use the extended transition period for complying with any new or revised financial accounting standards provided pursuant to Section 13(a) of the Exchange Act. ☐
Item 2.02. Results of Operations and Financial Condition.
On June 16, 2025, Powerfleet, Inc. (the “Company”) issued a press release regarding financial results for the fiscal year ended March 31, 2025. A copy of the press release is being furnished as Exhibit 99.1 to this Current Report on Form 8-K.
Item 7.01. Regulation FD Disclosure.
As previously announced, the Company will hold a conference call on June 16, 2025 at 8:30 a.m. Eastern time (5:30 a.m. Pacific time) to discuss the financial results for the fiscal quarter and fiscal year ended March 31, 2025 and provide a business update. The slide presentation that will accompany the conference call is being furnished as Exhibit 99.2 to this Current Report on Form 8-K.
The information in this report is being furnished pursuant to Items 2.02 and 7.01 of Form 8-K. In accordance with General Instruction B.2. of Form 8-K, the information in this report, including Exhibits 99.1 and 99.2, shall not be deemed “filed” for the purposes of Section 18 of the Securities Exchange Act of 1934, as amended, or otherwise subject to the liability of that section, nor shall it be deemed incorporated by reference in any filing under the Securities Act of 1933, as amended, except as may be expressly set forth by specific reference in such a filing.
Cautionary Note Regarding Forward-Looking Statements
This report, including Exhibits 99.1 and 99.2, contains forward-looking statements within the meaning of federal securities laws. The Company’s actual results may differ from its expectations, estimates and projections and, consequently, you should not rely on these forward-looking statements as predictions of future events. Forward-looking statements may be identified by words such as “expect,” “estimate,” “project,” “budget,” “forecast,” “anticipate,” “intend,” “plan,” “may,” “will,” “could,” “should,” “believes,” “predicts,” “potential,” “continue,” and similar expressions. These forward-looking statements include, without limitation, the Company’s expectations with respect to its beliefs, plans, goals, objectives, expectations, anticipations, assumptions, estimates, intentions and future performance, as well as anticipated financial impacts of the business combination with MiX Telematics and the acquisition of Fleet Complete. Forward-looking statements involve significant known and unknown risks, uncertainties and other factors, which may cause their actual results, performance or achievements to be materially different from the future results, performance or achievements expressed or implied by such forward-looking statements. All statements other than statements of historical fact are statements that could be forward-looking statements. Most of these factors are outside the Company’s control and are difficult to predict. The risks and uncertainties referred to above include, but are not limited to, risks related to: (i) future global economic and business conditions, including the effect of conflicts in certain geographies and the potential imposition of tariffs; (ii) integration of the Company’s, MiX Telematics’ and Fleet Complete’s businesses and the ability to recognize the anticipated synergies and benefits of the transactions with MiX Telematics and Fleet Complete; (iii) the commercial, financial, reputational and regulatory risks to its business that may arise as a consequence of operating across multiple geographies; (iv) disruptions in its global supply chain or failures by subcontractors; (v) the loss of any of its key customers or reduction in the purchase of our products by any such customers; (vi) reliance on third-party channel partner relationships; (vii) our inability to adequately protect its intellectual property; (viii) changes in technology or products, which may be more difficult or costly, or less effective, than anticipated; (ix) potential breaches of its information technology systems; (x) its ability to obtain additional capital to fund its operations; and (xi) such other factors as are set forth in the periodic reports filed by the Company with the Securities and Exchange Commission (“SEC”), including but not limited to those described under the heading “Risk Factors” in its annual reports on Form 10-K, quarterly reports on Form 10-Q and any other filings made with the SEC from time to time, which are available via the SEC’s website at http://www.sec.gov. Should one or more of these risks or uncertainties materialize, or should underlying assumptions prove to be incorrect, actual results may vary materially from those indicated or anticipated by these forward-looking statements. Therefore, you should not rely on any of these forward-looking statements.
The forward-looking statements included in this report are made only as of the date of this report, and except as otherwise required by applicable securities law, the Company assumes no obligation, nor does the Company intend to publicly update or revise any forward-looking statements to reflect subsequent events or circumstances.
Item 9.01. Financial Statements and Exhibits.
(d) Exhibits.
| Exhibit No. | Description | |
| 99.1 | Press release, dated June 16, 2025. | |
| 99.2 | Slide presentation, dated June 16, 2025. | |
| 104 | Cover Page Interactive Data File (embedded within the Inline XBRL document). |
SIGNATURE
Pursuant to the requirements of the Securities Exchange Act of 1934, the registrant has duly caused this report to be signed on its behalf by the undersigned hereunto duly authorized.
| POWERFLEET, INC. | ||
| By: | /s/ David Wilson | |
| Name: | David Wilson | |
| Title: | Chief Financial Officer | |
Date: June 16, 2025
Exhibit 99.1

Powerfleet Reports Annual FY2025 Results: A Breakout Year of Strategic Transformation and Scaled Growth
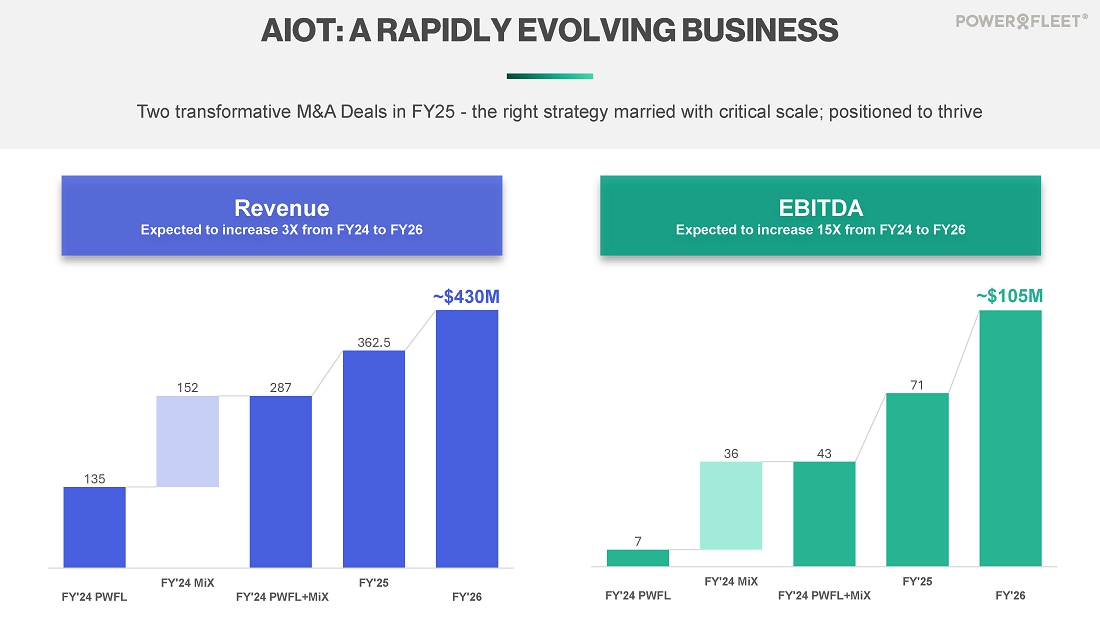
Total revenue growth for fiscal 2025 of 26% to $362.5 million, with ~75% SaaS recurring revenue.
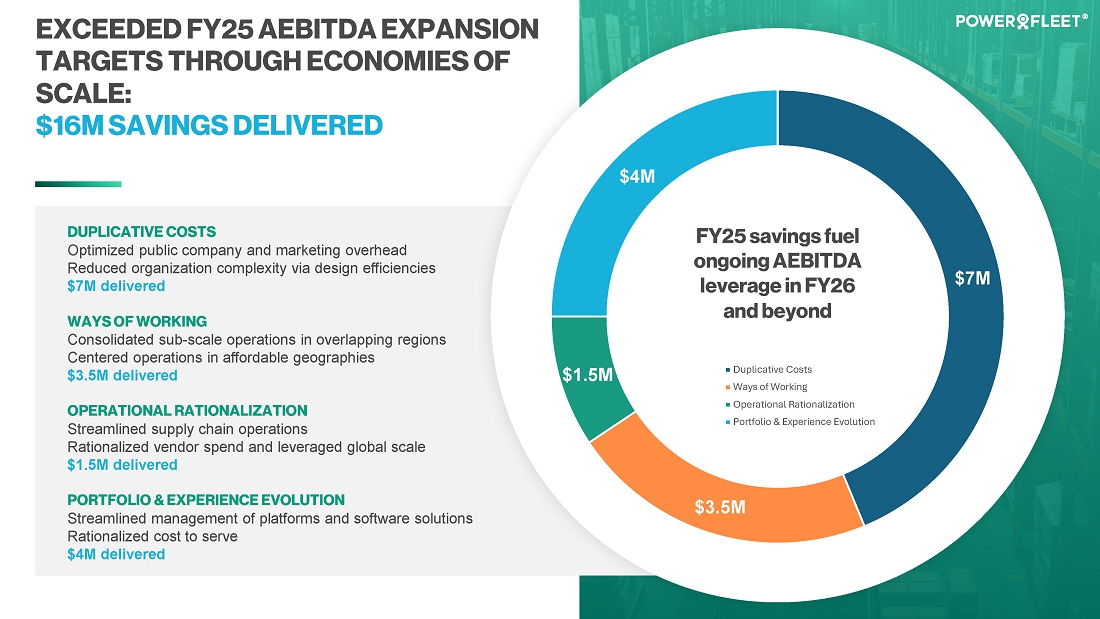
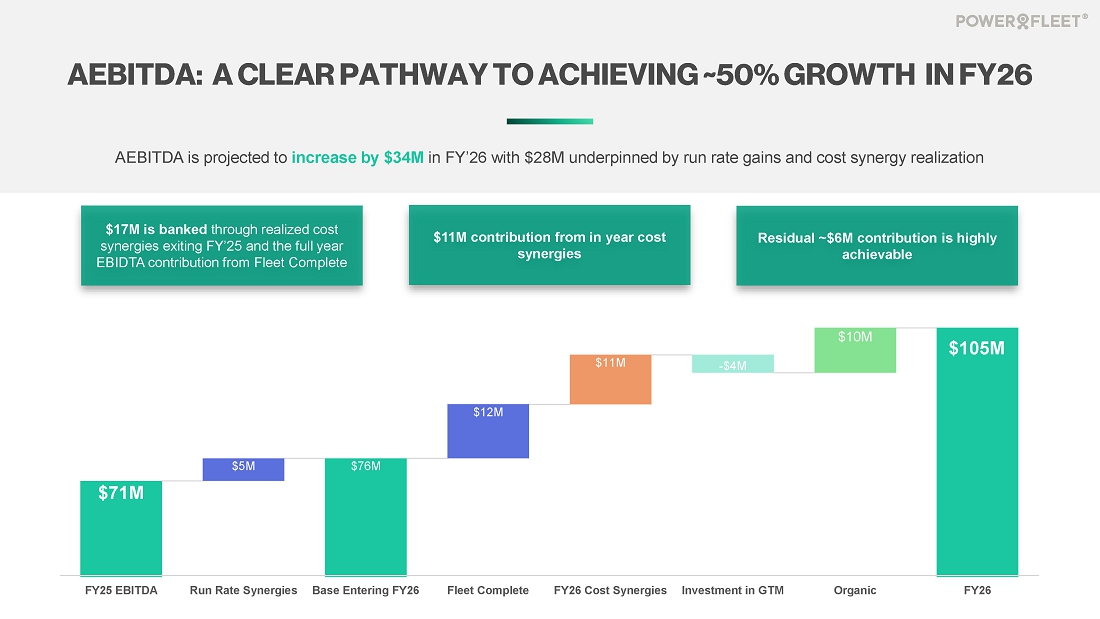
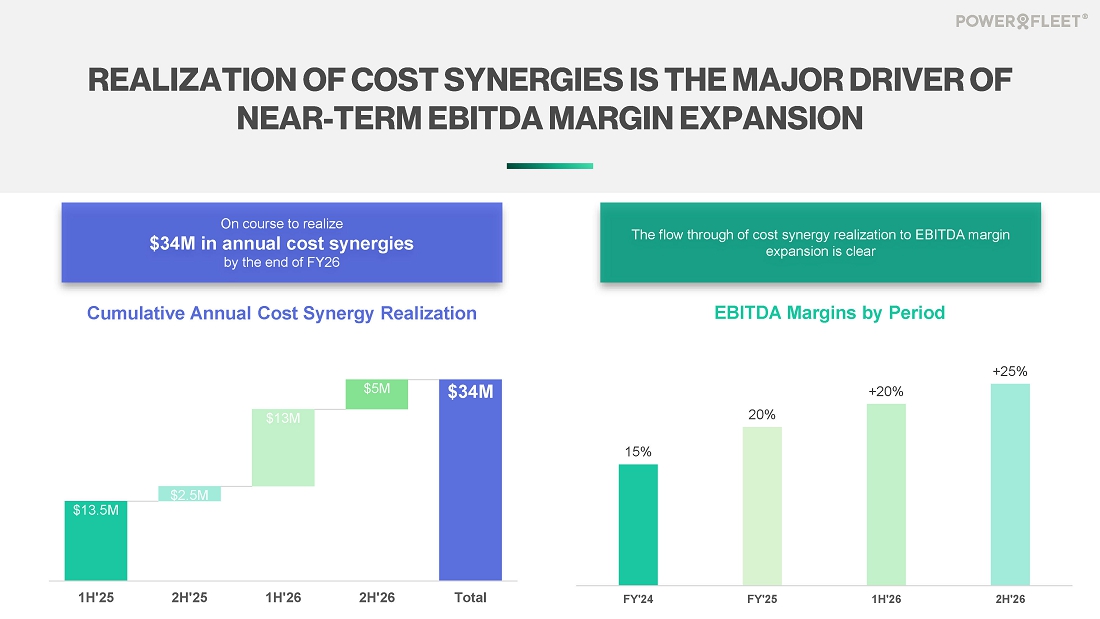
Annual adjusted EBITDA climbed 65% year-over-year to $71 million, with adjusted EBITDA margin expanding 500 basis points to 20%.
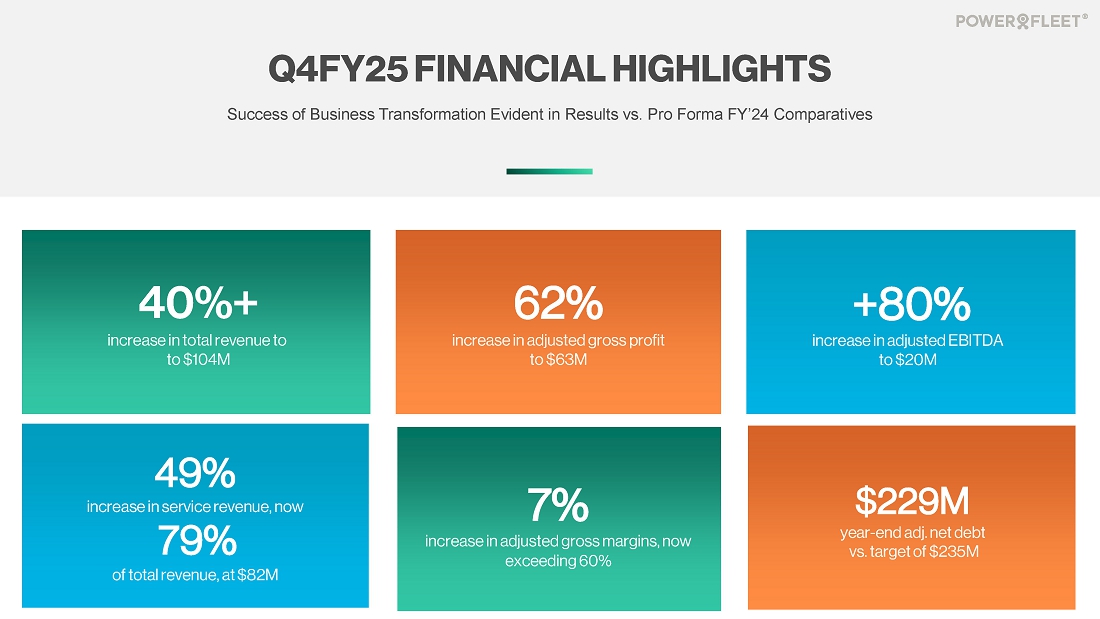
Q4 total revenue increased 42% year-over-year to $103.6 million, with Service revenue increasing 49% to $81.8m, while adjusted EBITDA grew 84% to $20.4 million.
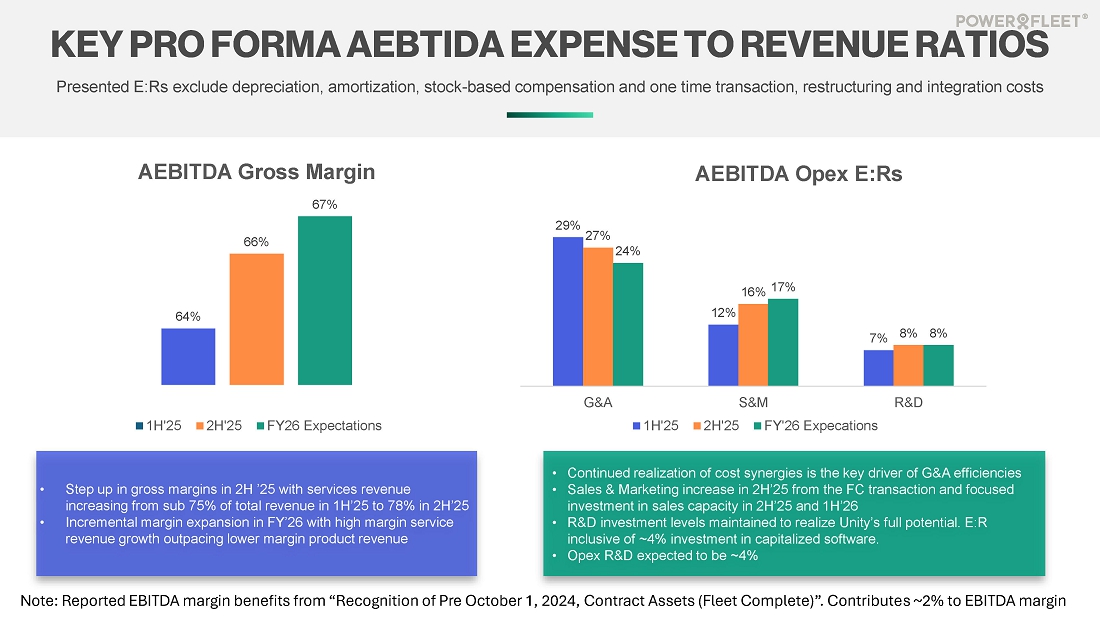
Q4 total adjusted gross margin exceeded 60%, compared to 53% in the prior year.
Extended Conference Call to be Held at 8:30am ET; Slide Presentation Accessible Here
WOODCLIFF LAKE, NJ – June 16, 2025 – Powerfleet, Inc. (Nasdaq: AIOT) reported its financial results for the fiscal year and the fourth quarter ended March 31, 2025.
MANAGEMENT COMMENTARY
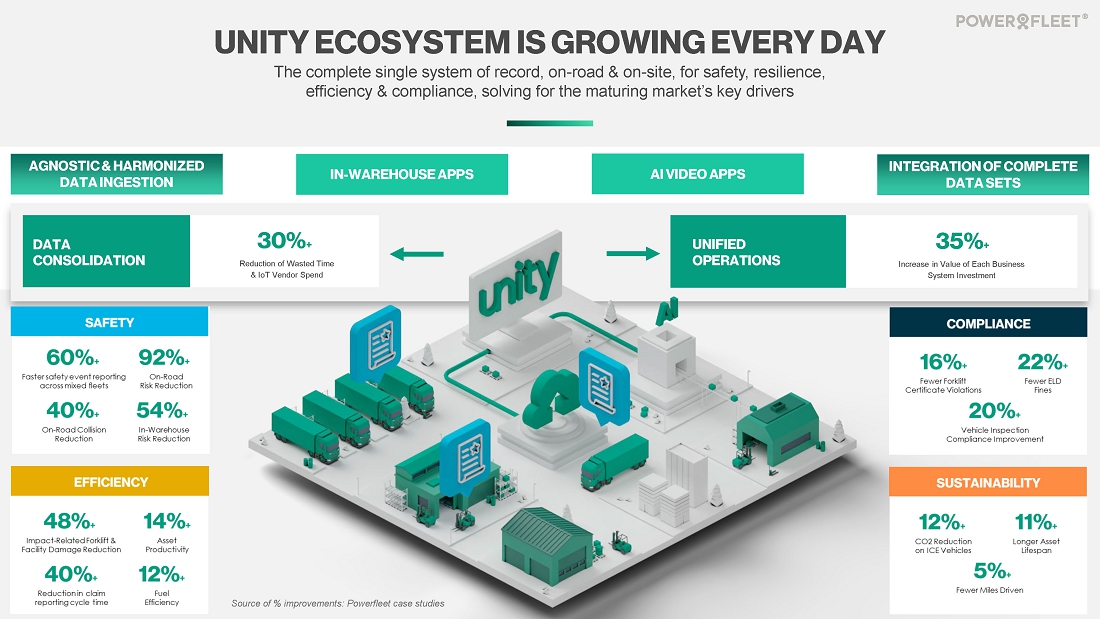
“Fiscal 2025 was a true milestone year for Powerfleet – a period in which we executed a bold reinvention strategy integrating two major acquisitions in just 12 months, achieved our organic growth and profitability metrics, and established Powerfleet as a global AIoT SaaS leader – with the Unity platform at the center of our customer value creation strategy,” said Steve Towe, Powerfleet CEO.
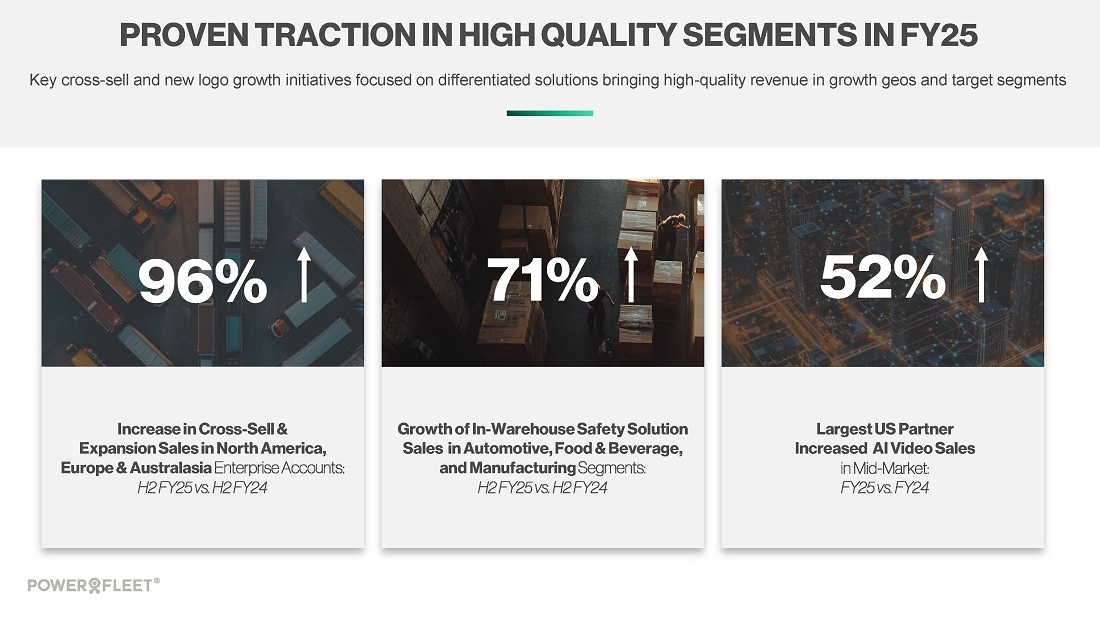
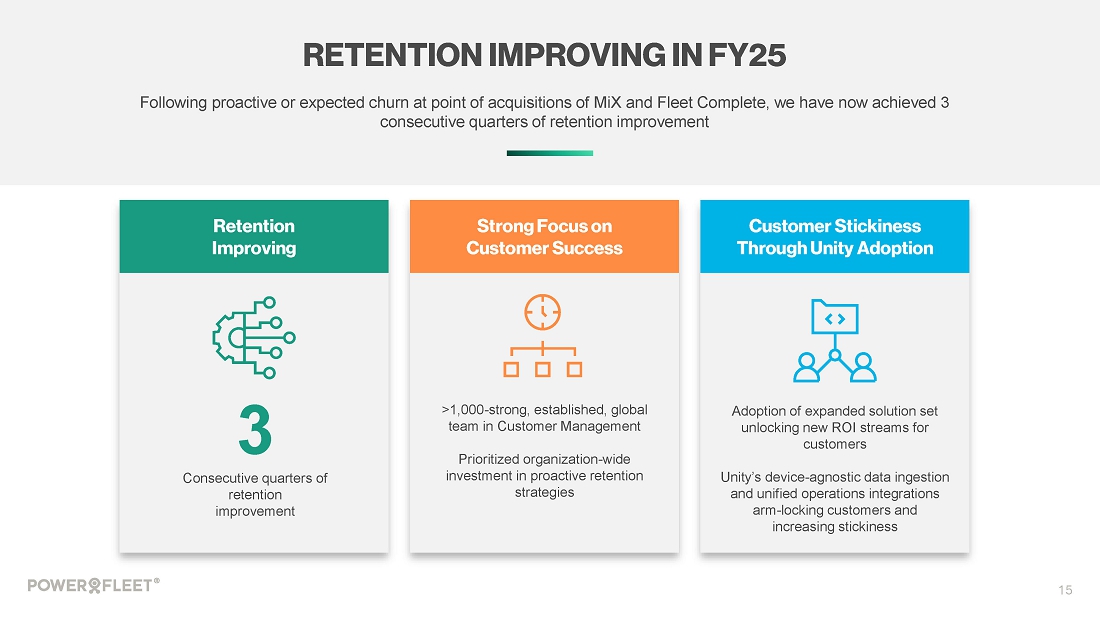
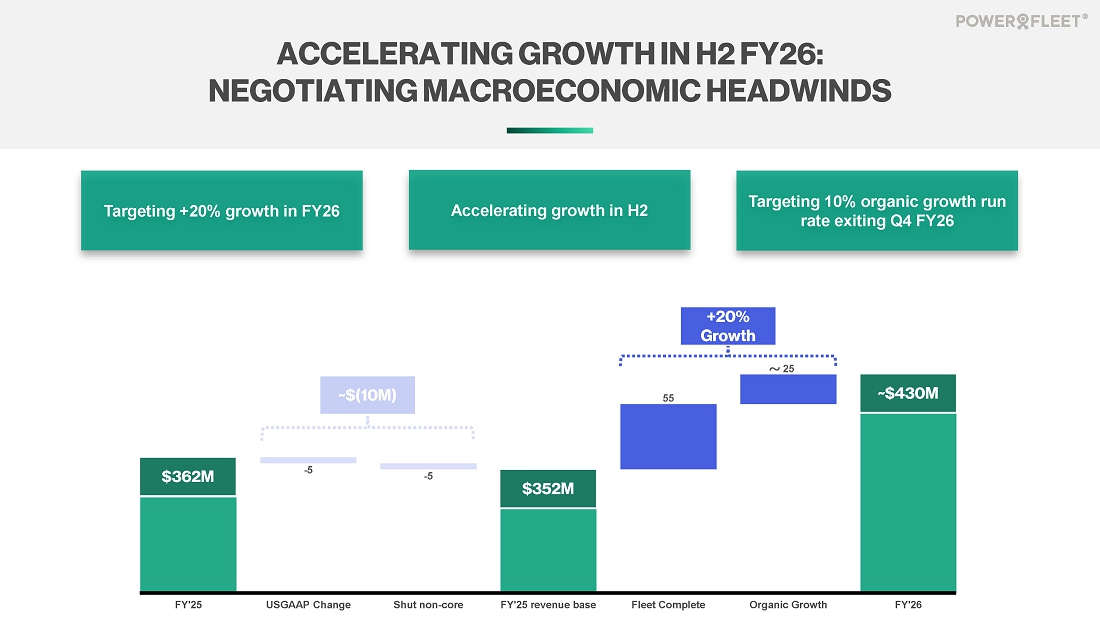
“As we enter fiscal 2026, we do so as a stronger, more focused company, by proactively eliminating low-quality and non-strategic revenue from the acquired businesses. Our go-forward, high-quality revenue streams delivered strong organic growth year-over-year in FY25, with AI video growing more than 20% and in-warehouse safety solutions growing 17%. While we remain mindful of macroeconomic headwinds, we are confident in expanding our growth in FY26, particularly in the second half, driven by a strong, expanding pipeline and supported by the resilience of our international operations which grew organically by 13% in FY25.”
Towe added, “With our Unity data highway as the central engine, we’re ready to scale faster, deliver greater value to customers, and continue unlocking the full potential of the company within the dynamic market we serve.”
FISCAL YEAR 2025 OPERATIONAL AND FINANCIAL HIGHLIGHTS
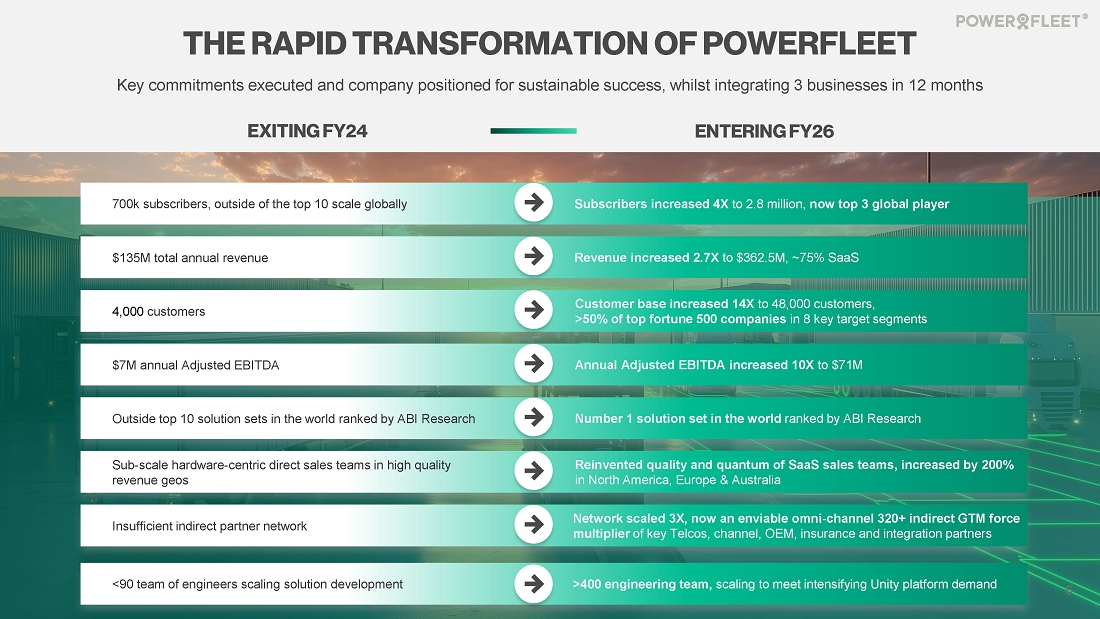
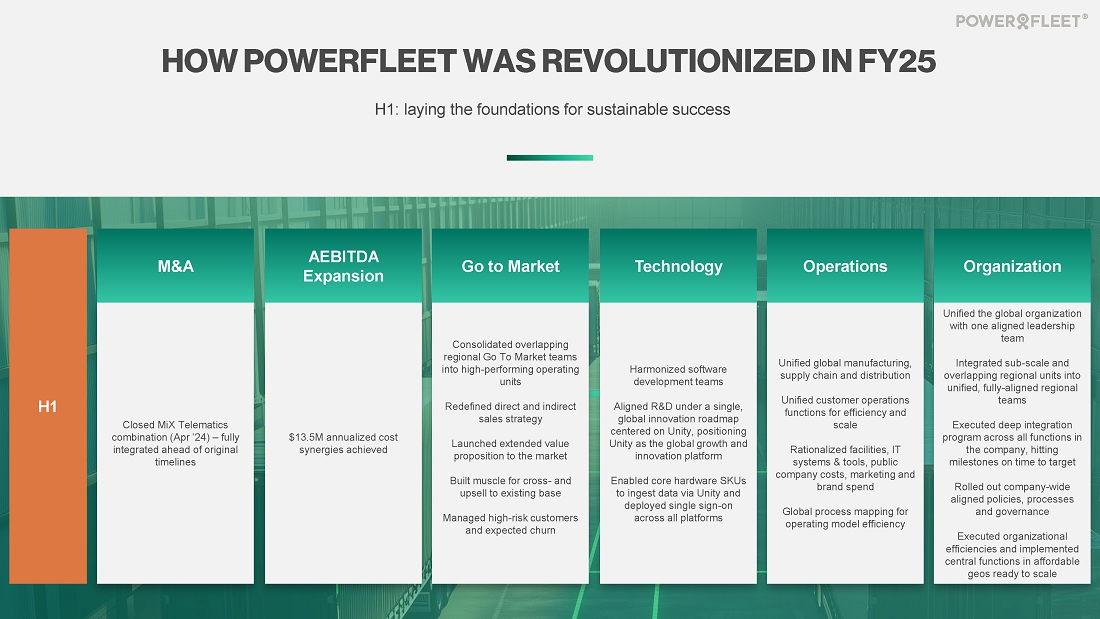
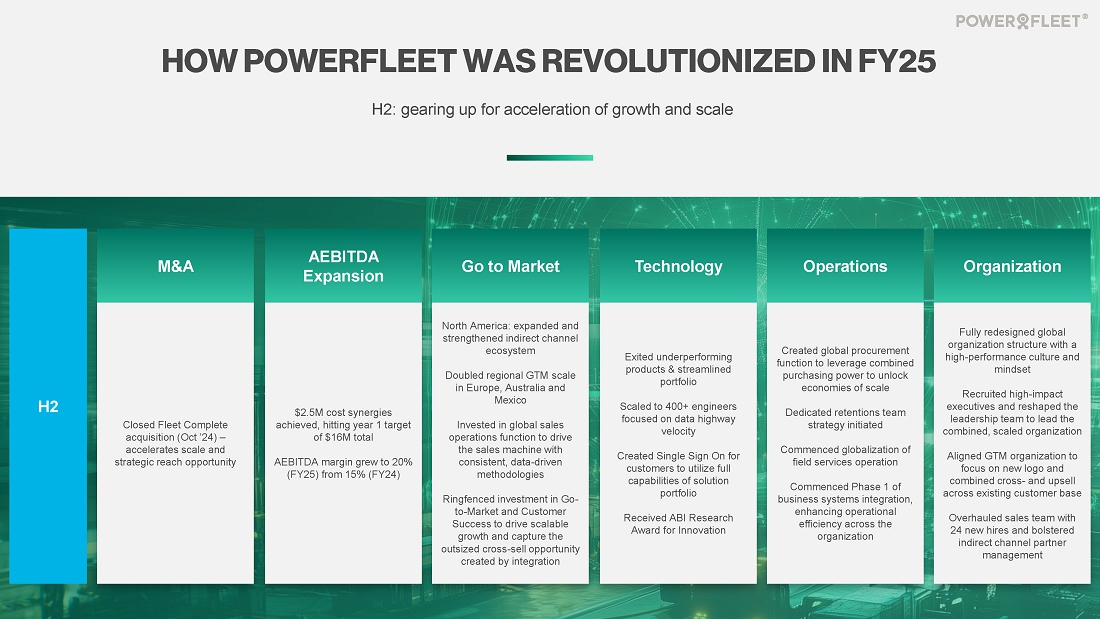
Powerfleet delivered an accelerated transformation of the business in FY25 - executing an aggressive M&A strategy and unlocking the foundation for scalable, high-margin growth.
Full Year Financial Performance Highlights: Pro Forma Basis Reflecting FY’24 MiX Combination Comparatives
| ● | Total revenue increased 26% to $362.5 million, with ~75% derived from high-margin, recurring SaaS revenue - underscoring the successful pivot to a subscription-first business model. | |
| ● | Adjusted EBITDA increased 65% year-over-year to $71 million, with adjusted EBITDA margins expanding by 5% to 20%, reflecting disciplined execution, cost synergy realization and operating leverage. | |
| ● | The combined business achieved $16 million in annualized cost synergies during FY25, with $11 million flowing through to in-year adjusted EBITDA performance. |
Operational Scale and Reach
| ● | The subscriber base expanded 4x to 2.8 million, positioning Powerfleet among the top three global AIoT SaaS providers. | |
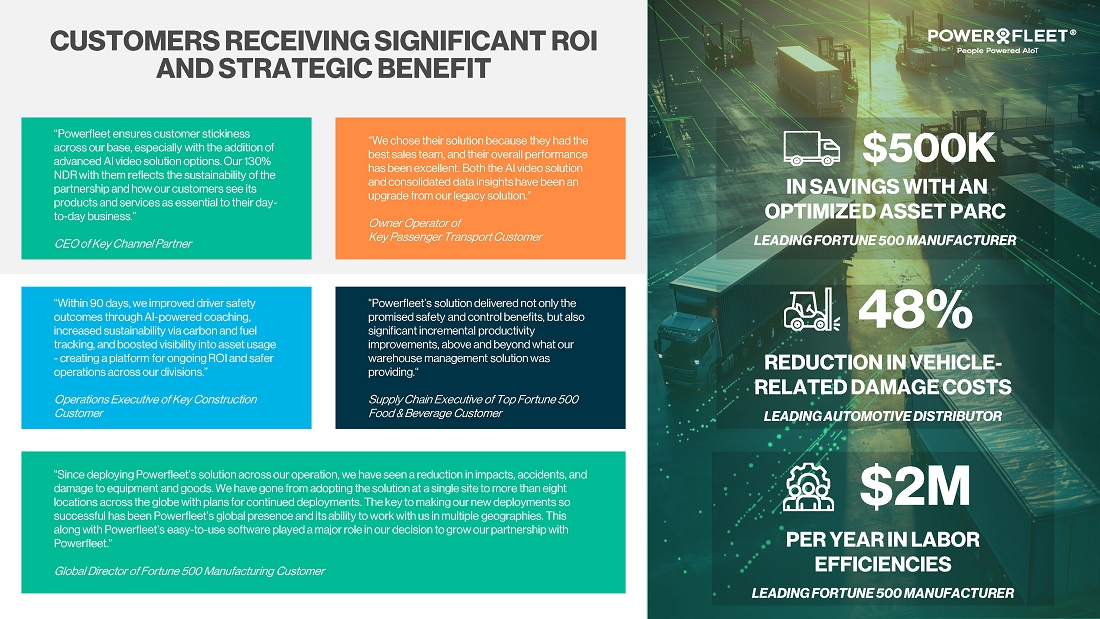
| ● | Customer base multiplied to 48,000, including over half the Fortune 500 - across 8 verticals primed for cross-sell and upsell opportunities. | |
| ● | Sales coverage doubled across North America, Europe, and Australasia. Indirect channel network has tripled to over 320 strategic alliances, including leading global telcos, vehicle and asset OEMs, and insurance partners. |
Go To Market Momentum
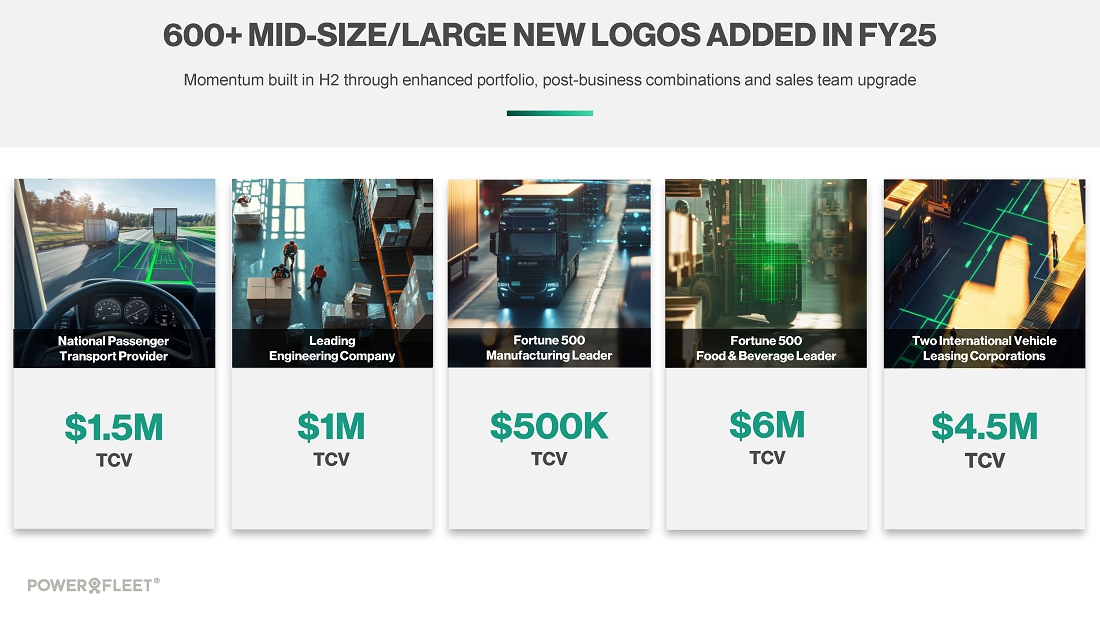
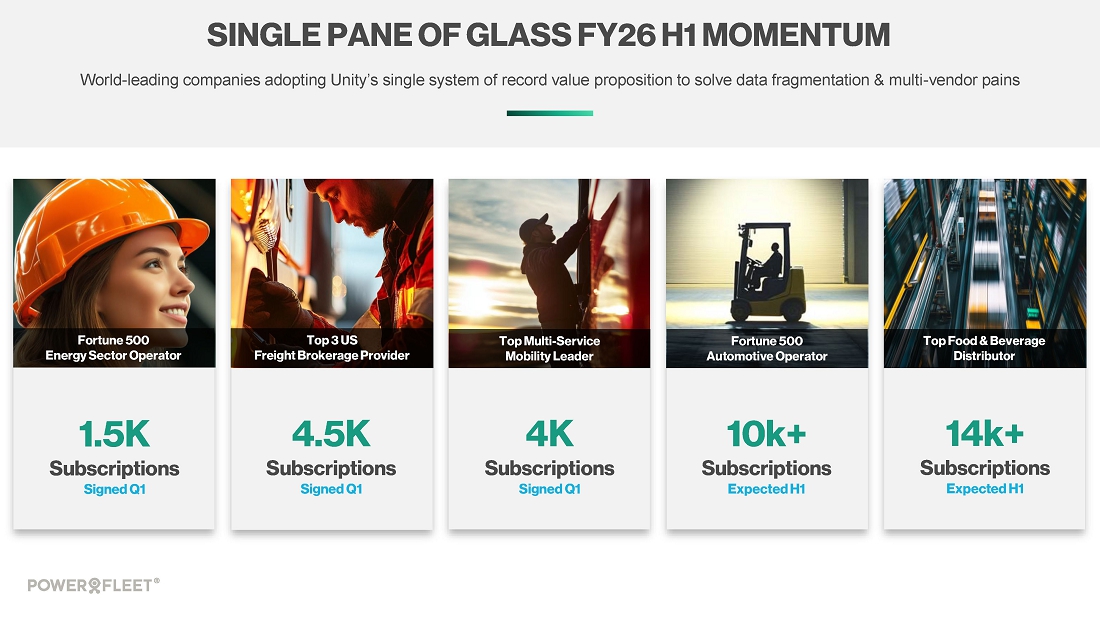
| ● | 600+ midmarket and enterprise customer logos were added in FY25, across key verticals such as logistics, food and beverage, automotive, and industrials. | |
| ● | Accelerated double-digit organic growth in key strategic solution sets of AI video and in-warehouse safety, alongside 13% year on year growth in international operations. | |
| ● | Sales efforts continued to drive high-value wins, including a major Q4 Unity AI video safety partnership win with a large North American student transportation company managing 9,000 drivers across 34 states, | |
| ● | Exiting the year with 50%+ of all new sales - high value AI video and in-warehouse safety and compliance solutions, representing a significant global sales motion shift year on year. |
Technology and Innovation
| ● | Unity recognized as the #1 global solution and platform portfolio by ABI Research, reflecting leadership in platform depth, AI maturity, and usability. | |
| ● | Quadrupled Unity Data Highway-dedicated engineering headcount to over 400 full time employees, fueling platform innovation | |
| ● | Gained momentum and sales traction with device-agnostic, single pane of glass solution |
|
|
FOURTH QUARTER 2025 FINANCIAL RESULTS: PRO FORMA BASIS REFLECTING FY’24 MIX COMBINATION COMPARATIVES
Total revenue grew 42% year-over-year to $103.6 million, driven by the Fleet Complete acquisition and AI video solutions. Service revenue rose 49% to $81.8 million while product revenue grew 23% to $21.9 million, Gross profit increased 42% to $54.8 million. On an adjusted basis, excluding the amortization of acquisition-related intangibles and post-acquisition inventory rationalization, gross profit rose by $24.0 million, or 62%, to $62.6 million. Adjusted service gross margin expanded significantly, increasing by 7.6 percentage points to 68.8%, after excluding $5.2 million in non-cash amortization.
Adjusted product gross margin also improved, rising to 28.7% from 27.3% in the prior year, after excluding $2.6 million in acquisition-related inventory write-offs. As a result, total adjusted gross margin exceeded 60%, compared to 53.0% in the prior year.
Operating expenses totaled $61.7 million, including $7.5 million in one-time transaction, integration, and restructuring costs, consistent with the level of one-time expenses incurred in the prior year. Excluding one-time items, adjusted operating expenses were $54.2 million, up from $37.6 million, with the increase primarily driven by the addition of Fleet Complete.
Adjusted EBITDA increased 84% to $20.4 million, up from $11.1 million in the prior year, reflecting contributions from the Fleet Complete acquisition, organic growth, gross margin expansion and cost synergies. Net loss attributable to common stockholders was $0.09 per share, compared to $0.19 per share in the prior year, reflecting improved financial performance and an increase in shares outstanding. After adjusting for one-time expenses and amortization of acquisition-related intangibles, adjusted net income was $0.02 per share, up from a loss of $0.01 per share in the prior year.
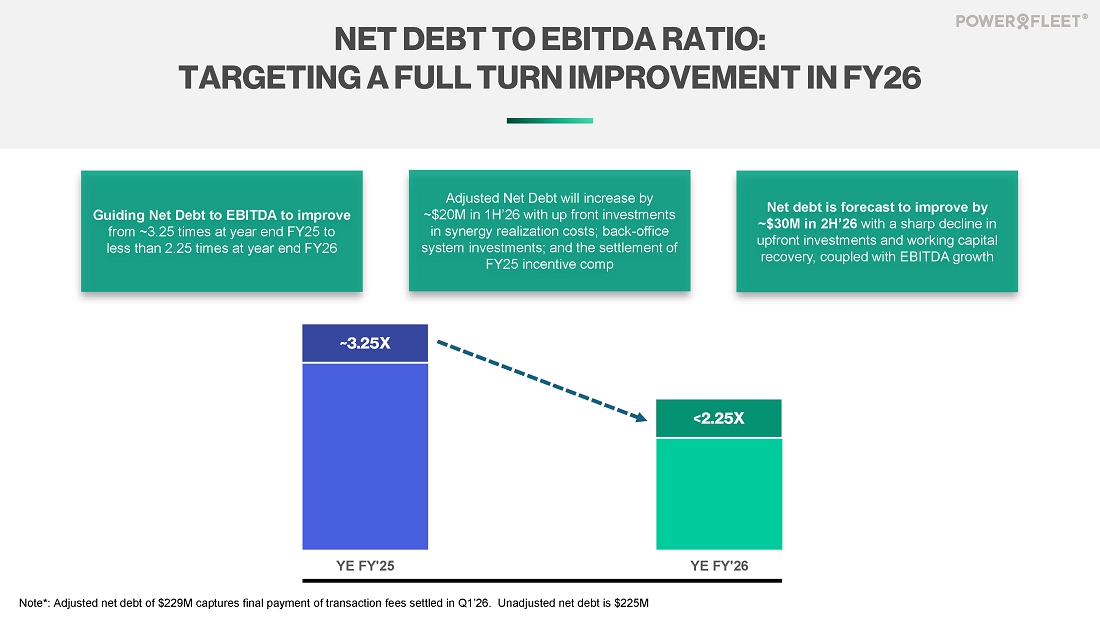
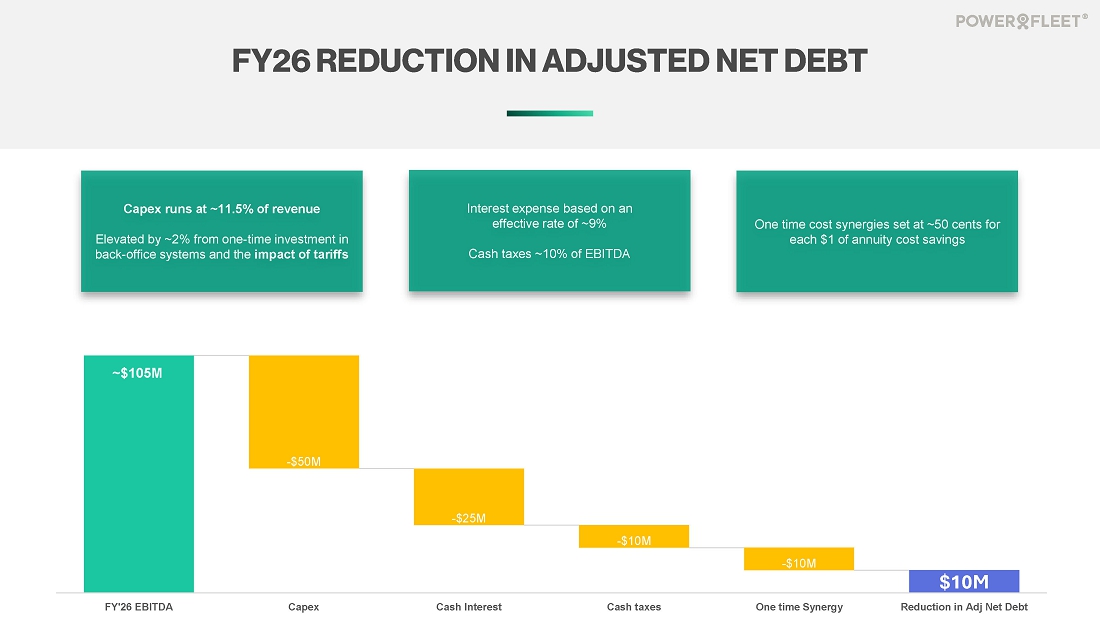
Net debt at quarter end was $225.0 million, consisting of $48.8 million in cash and $273.8 million total debt. Net debt, adjusted for $3.6 million in unsettled transaction costs, was $228.6 million, outperforming our year-end guidance of approximately $235 million by $6.4 million.
INVESTOR CONFERENCE CALL AND BUSINESS UPDATE
Powerfleet management will hold a conference call on Monday, June 16, 2025, at 8:30 a.m. Eastern time (5:30 a.m. Pacific time) to discuss results for the fourth quarter and fiscal year ended March 31, 2025, and provide a business update.
Date: Monday, June 16, 2025
Time: 8:30 a.m. Eastern time (5:30 a.m. Pacific time)
Toll Free: 888-506-0062
International: 973-528-0011
Participant Access Code: 539753
The conference call will be broadcast simultaneously and available for replay here. Additionally, both the webcast and accompanying slide presentation will be available via the investor section of Powerfleet’s website at ir.powerfleet.com.
|
|
NON-GAAP FINANCIAL MEASURES
To supplement its financial statements presented in accordance with Generally Accepted Accounting Principles (GAAP), Powerfleet provides certain non-GAAP measures of financial performance. These non-GAAP measures include adjusted EBITDA, adjusted gross margin, adjusted gross profit, adjusted service margin, adjusted product margin, adjusted operating expenses, adjusted net income per share and net debt. Reference to these non-GAAP measures should be considered in addition to results prepared under current accounting standards, but are not a substitute for, or superior to, GAAP results. These non-GAAP measures are provided to enhance investors’ overall understanding of Powerfleet’s current financial performance. Specifically, Powerfleet believes the non-GAAP measures provide useful information to both management and investors by excluding certain expenses, gains and losses and fluctuations in currency rates that may not be indicative of its core operating results and business outlook. These non-GAAP measures are not measures of financial performance or liquidity under GAAP and, accordingly, should not be considered as an alternative to net income, gross margin, gross profit, total debt, cash flow from operating activities or earnings per share as an indicator of operating performance or liquidity. Because Powerfleet’s method for calculating the non-GAAP measures may differ from other companies’ methods, the non-GAAP measures may not be comparable to similarly titled measures reported by other companies. Reconciliation of all non-GAAP measures included in this press release to the most directly comparable GAAP measures can be found in the financial tables included in this press release.
ABOUT POWERFLEET
Powerfleet (Nasdaq: AIOT; JSE: PWR) is a global leader in the artificial intelligence of things (AIoT) software-as-a-service (SaaS) mobile asset industry. With more than 30 years of experience, Powerfleet unifies business operations through the ingestion, harmonization, and integration of data, irrespective of source, and delivers actionable insights to help companies save lives, time, and money. Powerfleet’s ethos transcends our data ecosystem and commitment to innovation; our people-centric approach empowers our customers to realize impactful and sustained business improvement. The company is headquartered in New Jersey, United States, with offices around the globe. Explore more at www.powerfleet.com. Powerfleet has a primary listing on The Nasdaq Global Market and a secondary listing on the Main Board of the Johannesburg Stock Exchange (JSE).
CAUTIONARY NOTE REGARDING FORWARD-LOOKING STATEMENTS
This press release contains forward-looking statements within the meaning of federal securities laws. Powerfleet’s actual results may differ from its expectations, estimates and projections and consequently, you should not rely on these forward-looking statements as predictions of future events. Forward-looking statements may be identified by words such as “expect,” “estimate,” “project,” “budget,” “forecast,” “anticipate,” “intend,” “plan,” “may,” “will,” “could,” “should,” “believes,” “predicts,” “potential,” “continue,” and similar expressions.
|
|
These forward-looking statements include, without limitation, our expectations with respect to our beliefs, plans, goals, objectives, expectations, anticipations, assumptions, estimates, intentions and future performance, as well as anticipated financial impacts of our transactions with MiX Telematics and Fleet Complete. Forward-looking statements involve significant known and unknown risks, uncertainties and other factors, which may cause our actual results, performance or achievements to be materially different from the future results, performance or achievements expressed or implied by such forward-looking statements. All statements other than statements of historical fact are statements that could be forward-looking statements. Most of these factors are outside our control and are difficult to predict. The risks and uncertainties referred to above include, but are not limited to, risks related to: (i) future global economic and business conditions, including the effect of conflicts in certain geographies and the potential imposition of tariffs; (ii) integration of our, MiX Telematics’ and Fleet Complete’s businesses and the ability to recognize the anticipated synergies and benefits of the transactions with MiX Telematics and Fleet Complete; (iii) the commercial, financial, reputational and regulatory risks to our business that may arise as a consequence of operating across multiple geographies; (iv) disruptions in our global supply chain or failures by subcontractors; (v) the loss of any of our key customers or reduction in the purchase of our products by any such customers; (vi) reliance on third-party channel partner relationships; (vii) our inability to adequately protect our intellectual property; (viii) changes in technology or products, which may be more difficult or costly, or less effective, than anticipated; (ix) potential breaches of our information technology systems; (x) our ability to obtain additional capital to fund our operations; and (xi) such other factors as are set forth in the periodic reports filed by us with the Securities and Exchange Commission (SEC), including but not limited to those described under the heading “Risk Factors” in our annual reports on Form 10-K, quarterly reports on Form 10-Q and any other filings made with the SEC from time to time, which are available via the SEC’s website at http://www.sec.gov. Should one or more of these risks or uncertainties materialize, or should underlying assumptions prove to be incorrect, actual results may vary materially from those indicated or anticipated by these forward-looking statements. Therefore, you should not rely on any of these forward-looking statements.
The forward-looking statements included in this press release are made only as of the date of this press release, and except as otherwise required by applicable securities law, we assume no obligation, nor do we intend to publicly update or revise any forward-looking statements to reflect subsequent events or circumstances.
Powerfleet
Investor Contacts
Carolyn Capaccio and Jody Burfening
LHA Investor Relations
AIOTIRTeam@lhai.com
Powerfleet
Media Contact
Jonathan Bates
jonathan.bates@powerfleet.com
+44 121 717-5360
|
|
POWERFLEET, INC. AND SUBSIDIARIES
CONDENSED CONSOLIDATED STATEMENTS OF OPERATIONS
(In thousands, except per share data)
| Three Months Ended March 31, | Year Ended March 31, | |||||||||||||||
| 2024 | 2025 | 2024 | 2025 | |||||||||||||
| Pro Forma Combined | Consolidated | Pro Forma Combined | Consolidated | |||||||||||||
| Revenues: | ||||||||||||||||
| Products | $ | 17,793 | $ | 21,866 | $ | 67,665 | $ | 85,584 | ||||||||
| Services | 55,029 | 81,772 | 219,239 | 276,931 | ||||||||||||
| Total revenues | 72,822 | 103,638 | 286,904 | 362,515 | ||||||||||||
| Cost of revenues: | ||||||||||||||||
| Cost of products | 12,935 | 18,152 | 48,316 | 61,961 | ||||||||||||
| Cost of services | 21,324 | 30,723 | 79,636 | 106,017 | ||||||||||||
| Total cost of revenues | 34,259 | 48,875 | 127,952 | 167,978 | ||||||||||||
| Gross profit | 38,563 | 54,763 | 158,952 | 194,537 | ||||||||||||
| Operating expenses: | ||||||||||||||||
| Selling, general and administrative expenses | 41,366 | 56,839 | 151,839 | 204,361 | ||||||||||||
| Research and development expenses | 3,733 | 4,904 | 14,793 | 16,061 | ||||||||||||
| Total operating expenses | 45,099 | 61,743 | 166,632 | 220,422 | ||||||||||||
| Loss from operations | (6,536 | ) | (6,980 | ) | (7,680 | ) | (25,885 | ) | ||||||||
| Interest income | 627 | 95 | 1,480 | 926 | ||||||||||||
| Interest expense | (1,410 | ) | (5,655 | ) | (4,521 | ) | (20,330 | ) | ||||||||
| Bargain purchase - Movingdots | — | — | 1,800 | — | ||||||||||||
| Other expense, net | — | (202 | ) | (266 | ) | (1,163 | ) | |||||||||
| Net loss before income taxes | (7,319 | ) | (12,742 | ) | (9,187 | ) | (46,452 | ) | ||||||||
| Income tax (expense) benefit | (1,917 | ) | 304 | (7,014 | ) | (4,517 | ) | |||||||||
| Net loss before non-controlling interest | (9,236 | ) | (12,438 | ) | (16,201 | ) | (50,969 | ) | ||||||||
| Non-controlling interest | (12 | ) | (1 | ) | (50 | ) | (18 | ) | ||||||||
| Net loss | (9,248 | ) | (12,439 | ) | (16,251 | ) | (50,987 | ) | ||||||||
| Accretion of preferred stock | (9,996 | ) | — | (15,480 | ) | — | ||||||||||
| Preferred stock dividend | (1,129 | ) | — | (4,514 | ) | (25 | ) | |||||||||
| Net loss attributable to common stockholders | $ | (20,373 | ) | $ | (12,439 | ) | $ | (36,245 | ) | $ | (51,012 | ) | ||||
| Net loss per share attributable to common stockholders - basic and diluted | $ | (0.19 | ) | $ | (0.09 | ) | $ | (0.34 | ) | $ | (0.43 | ) | ||||
| Weighted average common shares outstanding - basic and diluted | 106,894 | 132,793 | 106,894 | 119,877 | ||||||||||||
|
|
POWERFLEET, INC. AND SUBSIDIARIES
CONDENSED CONSOLIDATED BALANCE SHEETS
(In thousands, except per share data)
| March 31, 2024 | March 31, 2025 | |||||||
Pro Forma Combined |
Consolidated | |||||||
| ASSETS | ||||||||
| Current assets: | ||||||||
| Cash and cash equivalents | $ | 51,091 | $ | 44,392 | ||||
| Restricted cash | 86,104 | 4,396 | ||||||
| Accounts receivables, net | 55,008 | 78,623 | ||||||
| Inventory, net | 25,800 | 18,350 | ||||||
| Prepaid expenses and other current assets | 17,826 | 23,319 | ||||||
| Total current assets | 235,829 | 169,080 | ||||||
| Fixed assets, net | 48,306 | 58,011 | ||||||
| Goodwill | 121,713 | 383,146 | ||||||
| Intangible assets, net | 40,444 | 258,582 | ||||||
| Right-of-use asset | 11,222 | 12,339 | ||||||
| Severance payable fund | 3,796 | 3,796 | ||||||
| Deferred tax asset | 3,874 | 3,934 | ||||||
| Other assets | 19,090 | 21,183 | ||||||
| Total assets | $ | 484,274 | $ | 910,071 | ||||
| LIABILITIES | ||||||||
| Current liabilities: | ||||||||
| Short-term bank debt and current maturities of long-term debt | $ | 22,109 | $ | 41,632 | ||||
| Accounts payable | 27,174 | 41,599 | ||||||
| Accrued expenses and other current liabilities | 33,589 | 45,327 | ||||||
| Deferred revenue - current | 12,236 | 17,375 | ||||||
| Lease liability - current | 2,648 | 5,076 | ||||||
| Total current liabilities | 97,756 | 151,009 | ||||||
| Long-term debt - less current maturities | 113,810 | 232,160 | ||||||
| Deferred revenue - less current portion | 4,892 | 5,197 | ||||||
| Lease liability - less current portion | 8,773 | 8,191 | ||||||
| Accrued severance payable | 4,597 | 6,039 | ||||||
| Deferred tax liability | 18,669 | 57,712 | ||||||
| Other long-term liabilities | 2,980 | 3,021 | ||||||
| Total liabilities | 251,477 | 463,329 | ||||||
| Convertible redeemable preferred stock: Series A | 90,273 | — | ||||||
| STOCKHOLDERS’ EQUITY | ||||||||
| Preferred stock | — | — | ||||||
| Common stock | 63,842 | 1,343 | ||||||
| Additional paid-in capital | 200,218 | 671,400 | ||||||
| Accumulated deficit | (78,516 | ) | (205,783 | ) | ||||
| Accumulated other comprehensive loss | (17,133 | ) | (8,850 | ) | ||||
| Treasury stock | (25,997 | ) | (11,518 | ) | ||||
| Total stockholders’ equity | 142,414 | 446,592 | ||||||
| Non-controlling interest | 110 | 150 | ||||||
| Total equity | 142,524 | 446,742 | ||||||
| Total liabilities, convertible redeemable preferred stock, and stockholders’ equity | $ | 484,274 | $ | 910,071 | ||||
|
|
POWERFLEET, INC. AND SUBSIDIARIES
CONDENSED CONSOLIDATED STATEMENTS OF CASH FLOWS
(In thousands)
| Year Ended March 31, | ||||||||
| 2024 | 2025 | |||||||
| Pro Forma Combined | Consolidated | |||||||
| Cash flows from operating activities | ||||||||
| Net loss | $ | (16,251 | ) | $ | (50,987 | ) | ||
| Adjustments to reconcile net loss to cash provided by (used in) operating activities: | ||||||||
| Non-controlling interest | 50 | 18 | ||||||
| Gain on bargain purchase | (1,800 | ) | — | |||||
| Inventory write-downs | 2,172 | 4,480 | ||||||
| Stock-based compensation expense | 5,214 | 9,362 | ||||||
| Depreciation and amortization | 29,548 | 47,494 | ||||||
| Impairment of long-lived assets | 139 | — | ||||||
| Right-of-use assets, non-cash lease expense | 2,919 | 5,007 | ||||||
| Derivative mark-to-market adjustment | — | (504 | ) | |||||
| Bad debts expense | 7,534 | 9,418 | ||||||
| Deferred income taxes | 3,235 | (4,872 | ) | |||||
| Shares issued for transaction bonuses | — | 889 | ||||||
| Lease termination and modification losses | — | 295 | ||||||
| Other non-cash items | 6,338 | 1,061 | ||||||
| Changes in operating assets and liabilities: | ||||||||
| Accounts receivables | (9,298 | ) | (14,048 | ) | ||||
| Inventory | (601 | ) | 5,729 | |||||
| Prepaid expenses and other current assets | (1,078 | ) | 5,474 | |||||
| Deferred costs | (8,514 | ) | (8,437 | ) | ||||
| Deferred revenue | (180 | ) | 1,748 | |||||
| Accounts payable and accrued expenses | 9,731 | (12,162 | ) | |||||
| Lease liabilities | (2,851 | ) | (4,558 | ) | ||||
| Accrued severance payable | 15 | 1,248 | ||||||
| Net cash provided by (used in) operating activities | 26,322 | (3,345 | ) | |||||
| Cash flows from investing activities: | ||||||||
| Acquisition, net of cash assumed | — | (137,112 | ) | |||||
| Proceeds from sale of fixed assets | — | 12 | ||||||
| Capitalized software development costs | (9,512 | ) | (13,782 | ) | ||||
| Capital expenditures | (20,709 | ) | (20,008 | ) | ||||
| Deferred consideration paid | — | — | ||||||
| Repayment of loan advanced to external parties | — | 294 | ||||||
| Net cash used in investing activities | (30,221 | ) | (170,596 | ) | ||||
| Cash flows from financing activities: | ||||||||
| Repayment of long-term debt | (14,116 | ) | (2,642 | ) | ||||
| Short-term bank debt, net | (158 | ) | 19,551 | |||||
| Deferred consideration paid | (1,955 | ) | — | |||||
| Purchase of treasury stock upon vesting of restricted stock | (674 | ) | (2,836 | ) | ||||
| Repayment of financing lease | (129 | ) | — | |||||
| Payment of preferred stock dividend and redemption of preferred stock | (3,385 | ) | (90,298 | ) | ||||
| Proceeds from private placement, net | — | 66,459 | ||||||
| Proceeds from long-term debt | 115,000 | 125,000 | ||||||
| Payment of long-term debt costs | (1,081 | ) | (1,410 | ) | ||||
| Proceeds from exercise of stock options, net | 36 | 1,898 | ||||||
| Cash paid on dividends to affiliates | (5,320 | ) | — | |||||
| Net cash provided by financing activities | 88,218 | 115,722 | ||||||
| Effect of foreign exchange rate changes on cash and cash equivalents | (2,870 | ) | (2,657 | ) | ||||
| Net increase (decrease) in cash and cash equivalents, and restricted cash | 81,449 | (60,876 | ) | |||||
| Cash and cash equivalents, and restricted cash at beginning of the period | 55,746 | 109,664 | ||||||
| Cash and cash equivalents, and restricted cash at end of the period | $ | 137,195 | $ | 48,788 | ||||
| Reconciliation of cash, cash equivalents, and restricted cash, beginning of the period | ||||||||
| Cash and cash equivalents | 54,656 | 24,354 | ||||||
| Restricted cash | 1,090 | 85,310 | ||||||
| Cash, cash equivalents, and restricted cash, beginning of the period | $ | 55,746 | $ | 109,664 | ||||
| Reconciliation of cash, cash equivalents, and restricted cash, end of the period | ||||||||
| Cash and cash equivalents | 51,091 | 44,392 | ||||||
| Restricted cash | 86,104 | 4,396 | ||||||
| Cash, cash equivalents, and restricted cash, end of the period | $ | 137,195 | $ | 48,788 | ||||
| Supplemental disclosure of cash flow information: | ||||||||
| Cash paid for: | ||||||||
| Taxes | $ | 3,381 | $ | 4,283 | ||||
| Interest | $ | 2,414 | $ | 15,335 | ||||
| Noncash investing and financing activities: | ||||||||
| Common stock issued for transaction bonus | $ | — | $ | 9 | ||||
| Shares issued in connection with MiX Combination | $ | — | $ | 362,005 | ||||
| Shares issued in connection with Fleet Complete acquisition | $ | — | $ | 21,343 | ||||
| Value of licensed intellectual property acquired in connection with Movingdots acquisition | $ | 1,517 | $ | — | ||||
| Preferred stock dividends paid in shares | $ | 1,108 | $ | — | ||||
| Issuance of derivative on long-term debt | $ | 2,226 | $ | — | ||||
|
|
POWERFLEET, INC. AND SUBSIDIARIES
RECONCILIATION OF GAAP TO ADJUSTED EBITDA FINANCIAL MEASURES
(In thousands)
| Three Months Ended March 31, | Year Ended March 31, | |||||||||||||||
| 2024 | 2025 | 2024 | 2025 | |||||||||||||
| Pro Forma Combined | Consolidated | Pro Forma Combined | Consolidated | |||||||||||||
| Net loss attributable to common stockholders | $ | (20,373 | ) | $ | (12,439 | ) | $ | (36,245 | ) | $ | (51,012 | ) | ||||
| Non-controlling interest | 12 | 1 | 50 | 18 | ||||||||||||
| Preferred stock dividend and accretion | 11,125 | — | 19,994 | 25 | ||||||||||||
| Interest expense, net | 935 | 5,560 | 3,192 | 19,404 | ||||||||||||
| Other expense, net | 55 | — | 87 | — | ||||||||||||
| Income tax expense (benefit) | 1,917 | (304 | ) | 7,014 | 4,517 | |||||||||||
| Depreciation and amortization | 8,369 | 14,452 | 29,548 | 47,494 | ||||||||||||
| Stock-based compensation | 1,311 | 924 | 5,214 | 9,362 | ||||||||||||
| Foreign currency losses | 438 | 502 | 1,493 | 1,790 | ||||||||||||
| Restructuring-related expenses | 324 | 6,969 | 1,065 | 10,077 | ||||||||||||
| Gain on bargain purchase - Movingdots | — | — | (1,800 | ) | — | |||||||||||
| Impairment of long-lived assets | 139 | — | 139 | — | ||||||||||||
| Derivative mark-to-market adjustment | — | (29 | ) | — | (504 | ) | ||||||||||
| Recognition of pre-October 1, 2024 contract assets (Fleet Complete) | — | 1,768 | — | 3,809 | ||||||||||||
| Net profit on fixed assets | (66 | ) | — | (115 | ) | — | ||||||||||
| Contingent consideration remeasurement | (250 | ) | — | (1,299 | ) | — | ||||||||||
| Acquisition-related expenses | 7,177 | 428 | 14,313 | 21,300 | ||||||||||||
| Integration-related expenses | — | 2,592 | — | 4,851 | ||||||||||||
| Non-recurring transitional service agreement costs | — | — | 482 | — | ||||||||||||
| Adjusted EBITDA | $ | 11,113 | $ | 20,424 | $ | 43,132 | $ | 71,131 | ||||||||
|
|
POWERFLEET, INC. AND SUBSIDIARIES
RECONCILIATION OF GAAP TO NON-GAAP NET (LOSS) INCOME FINANCIAL MEASURES
(In thousands)
| Three Months Ended March 31, | Year Ended March 31, | |||||||||||||||
| 2024 | 2025 | 2024 | 2025 | |||||||||||||
| Pro Forma Combined | Consolidated | Pro Forma Combined | Consolidated | |||||||||||||
| Net loss | $ | (9,248 | ) | $ | (12,439 | ) | $ | (16,251 | ) | $ | (50,987 | ) | ||||
| Incremental intangible assets amortization expense as a result of MiX Telematics and Fleet Complete business combinations | — | 5,201 | — | 14,752 | ||||||||||||
| Stock-based compensation (non-recurring/accelerated cost) | — | — | — | 4,693 | ||||||||||||
| Foreign currency losses | 438 | 502 | 1,493 | 1,790 | ||||||||||||
| Income tax effect of net foreign exchange (losses) gains | 389 | (377 | ) | 279 | (602 | ) | ||||||||||
| Restructuring-related expenses | 324 | 6,969 | 1,065 | 10,077 | ||||||||||||
| Income tax effect of restructuring costs | — | (53 | ) | (7 | ) | (207 | ) | |||||||||
| Derivative mark-to-market adjustment | — | (29 | ) | — | (504 | ) | ||||||||||
| Acquisition-related expenses | 7,177 | 428 | 14,313 | 21,300 | ||||||||||||
| Integration-related expenses | — | 2,592 | — | 4,851 | ||||||||||||
| Non-recurring transitional service agreement costs | — | — | 482 | — | ||||||||||||
| Income tax effect of non-recurring transitional service agreement costs | (130 | ) | — | (130 | ) | — | ||||||||||
| Contingent consideration remeasurement | (250 | ) | — | (1,299 | ) | — | ||||||||||
| Non-GAAP net (loss) income | $ | (1,300 | ) | $ | 2,794 | $ | (55 | ) | $ | 5,163 | ||||||
| Weighted average shares outstanding | 106,894 | 132,793 | 106,894 | 119,877 | ||||||||||||
| Non-GAAP net (loss) income per share - basic | $ | (0.01 | ) | $ | 0.02 | $ | (0.001 | ) | $ | 0.04 | ||||||
|
|
POWERFLEET, INC. AND SUBSIDIARIES
ADJUSTED GROSS PROFIT MARGINS
(In thousands)
| Three Months Ended March 31, | Year Ended March 31, | |||||||||||||||
| 2024 | 2025 | 2024 | 2025 | |||||||||||||
| Pro Forma Combined | Consolidated | Pro Forma Combined | Consolidated | |||||||||||||
| Revenues: | ||||||||||||||||
| Products | $ | 17,793 | $ | 21,866 | $ | 67,665 | $ | 85,584 | ||||||||
| Services | 55,029 | 81,772 | 219,239 | 276,931 | ||||||||||||
| Total revenues | 72,822 | 103,638 | 286,904 | 362,515 | ||||||||||||
| Cost of revenues: | ||||||||||||||||
| Cost of products | 12,935 | 18,152 | 48,316 | 61,961 | ||||||||||||
| Cost of services | 21,324 | 30,723 | 79,636 | 106,017 | ||||||||||||
| Total cost of revenues | 34,259 | 48,875 | 127,952 | 167,978 | ||||||||||||
| Gross profit | $ | 38,563 | 54,763 | $ | 158,952 | $ | 194,537 | |||||||||
| Product margin | 27.3 | % | 17.0 | % | 28.6 | % | 27.6 | % | ||||||||
| Service margin | 61.2 | % | 62.4 | % | 63.7 | % | 61.7 | % | ||||||||
| Total gross profit margin | 53.0 | % | 52.8 | % | 55.4 | % | 53.7 | % | ||||||||
| Incremental intangible assets amortization expense as a result of MiX Telematics and Fleet Complete business combinations | $ | — | $ | 5,201 | $ | — | $ | 14,752 | ||||||||
| Inventory rationalization | $ | — | $ | 2,570 | $ | — | $ | 3,310 | ||||||||
| Product margin | 27.3 | % | 28.7 | % | 28.6 | % | 31.5 | % | ||||||||
| Service margin | 61.2 | % | 68.8 | % | 63.7 | % | 67.0 | % | ||||||||
| Adjusted total gross profit margin | 53.0 | % | 60.3 | % | 55.4 | % | 58.6 | % | ||||||||
|
|
POWERFLEET, INC. AND SUBSIDIARIES
ADJUSTED OPERATING EXPENSES
(In thousands)
| Three Months Ended March 31, | Year Ended March 31, | |||||||||||||||
| 2024 | 2025 | 2024 | 2025 | |||||||||||||
| Pro Forma Combined | Consolidated | Pro Forma Combined | Consolidated | |||||||||||||
| Total operating expenses | $ | 45,099 | $ | 61,743 | $ | 166,632 | $ | 220,422 | ||||||||
| Adjusted for once-off costs | ||||||||||||||||
| Acquisition-related expenses | 7,177 | 428 | 14,313 | 21,300 | ||||||||||||
| Integration-related costs | — | 2,592 | — | 4,851 | ||||||||||||
| Stock-based compensation (non-recurring/accelerated cost) | — | — | — | 4,693 | ||||||||||||
| Restructuring-related expenses | 324 | 4,499 | 1,065 | 6,767 | ||||||||||||
| 7,501 | 7,519 | 15,378 | 37,611 | |||||||||||||
| Adjusted operating expenses | $ | 37,598 | $ | 54,224 | $ | 151,254 | $ | 182,811 | ||||||||
|
|
POWERFLEET, INC. AND MiX TELEMATICS
CONDENSED CONSOLIDATED STATEMENTS OF OPERATIONS
(In thousands, except per share data)
| Three Months Ended March 31, 2024 | ||||||||||||||||
| Powerfleet Inc. | MiX Telematics | Adjustments to align disclosure | Pro Forma Combined | |||||||||||||
| Revenues: | ||||||||||||||||
| Products | $ | 12,081 | $ | 6,705 | $ | (993 | ) | $ | 17,793 | |||||||
| Services | 21,659 | 32,377 | 993 | 55,029 | ||||||||||||
| Total revenues | 33,740 | 39,082 | — | 72,822 | ||||||||||||
| Cost of revenues: | ||||||||||||||||
| Cost of products | 9,513 | 4,690 | (1,268 | ) | 12,935 | |||||||||||
| Cost of services | 8,024 | 12,032 | 1,268 | 21,324 | ||||||||||||
| Total cost of revenues | 17,537 | 16,722 | — | 34,259 | ||||||||||||
| Gross profit | 16,203 | 22,360 | — | 38,563 | ||||||||||||
| Operating expenses: | ||||||||||||||||
| Selling, general and administrative expenses | 21,832 | 19,534 | — | 41,366 | ||||||||||||
| Research and development expenses | 2,018 | 1,715 | — | 3,733 | ||||||||||||
| Total operating expenses | 23,850 | 21,249 | — | 45,099 | ||||||||||||
| (Loss) income from operations | (7,647 | ) | 1,111 | — | (6,536 | ) | ||||||||||
| Interest income | 259 | 368 | — | 627 | ||||||||||||
| Interest expense | (708 | ) | (702 | ) | — | (1,410 | ) | |||||||||
| Other (expense) income, net | (55 | ) | 55 | — | — | |||||||||||
| Net (loss) income before income taxes | (8,151 | ) | 832 | — | (7,319 | ) | ||||||||||
| Income tax expense | (352 | ) | (1,565 | ) | — | (1,917 | ) | |||||||||
| Net loss before non-controlling interest | (8,503 | ) | (733 | ) | — | (9,236 | ) | |||||||||
| Non-controlling interest | (12 | ) | — | — | (12 | ) | ||||||||||
| Net loss | (8,515 | ) | (733 | ) | — | (9,248 | ) | |||||||||
| Accretion of preferred stock | (9,996 | ) | — | — | (9,996 | ) | ||||||||||
| Preferred stock dividend | (1,129 | ) | — | — | (1,129 | ) | ||||||||||
| Net loss attributable to common stockholders | $ | (19,640 | ) | $ | (733 | ) | $ | — | $ | (20,373 | ) | |||||
| Net loss per share attributable to common stockholders - basic and diluted | $ | (0.55 | ) | $ | (0.01 | ) | $ | (0.19 | ) | |||||||
| Weighted average common shares outstanding - basic | 35,813 | 71,081 | 106,894 | |||||||||||||
|
|
POWERFLEET, INC. AND MiX TELEMATICS
CONDENSED CONSOLIDATED STATEMENTS OF OPERATIONS
(In thousands, except per share data)
| Year Ended March 31, 2024 | ||||||||||||||||
| Powerfleet Inc. | MiX Telematics | Adjustments to align disclosure | Pro Forma Combined | |||||||||||||
| Revenues: | ||||||||||||||||
| Products | $ | 49,313 | $ | 21,600 | $ | (3,248 | ) | $ | 67,665 | |||||||
| Services | 85,311 | 130,680 | 3,248 | 219,239 | ||||||||||||
| Total revenues | 134,624 | 152,280 | — | 286,904 | ||||||||||||
| Cost of revenues: | ||||||||||||||||
| Cost of products | 36,916 | 14,628 | (3,228 | ) | 48,316 | |||||||||||
| Cost of services | 31,003 | 45,405 | 3,228 | 79,636 | ||||||||||||
| Total cost of revenues | 67,919 | 60,033 | — | 127,952 | ||||||||||||
| Gross profit | 66,705 | 92,247 | — | 158,952 | ||||||||||||
| Operating expenses: | ||||||||||||||||
| Selling, general and administrative expenses | 76,144 | 75,695 | — | 151,839 | ||||||||||||
| Research and development expenses | 8,675 | 6,118 | — | 14,793 | ||||||||||||
| Total operating expenses | 84,819 | 81,813 | — | 166,632 | ||||||||||||
| (Loss) income from operations | (18,114 | ) | 10,434 | — | (7,680 | ) | ||||||||||
| Interest income | 338 | 1,142 | — | 1,480 | ||||||||||||
| Interest expense | (2,174 | ) | (2,347 | ) | — | (4,521 | ) | |||||||||
| Bargain purchase - Movingdots | 1,800 | — | — | 1,800 | ||||||||||||
| Other expense, net | (87 | ) | (179 | ) | — | (266 | ) | |||||||||
| Net (loss) income before income taxes | (18,237 | ) | 9,050 | — | (9,187 | ) | ||||||||||
| Income tax expense | (549 | ) | (6,465 | ) | — | (7,014 | ) | |||||||||
| Net (loss) income before non-controlling interest | (18,786 | ) | 2,585 | — | (16,201 | ) | ||||||||||
| Non-controlling interest | (50 | ) | — | — | (50 | ) | ||||||||||
| Net (loss) income | (18,836 | ) | 2,585 | — | (16,251 | ) | ||||||||||
| Accretion of preferred stock | (15,480 | ) | — | — | (15,480 | ) | ||||||||||
| Preferred stock dividend | (4,514 | ) | — | — | (4,514 | ) | ||||||||||
| Net (loss) income attributable to common stockholders | $ | (38,830 | ) | $ | 2,585 | $ | — | $ | (36,245 | ) | ||||||
| Net (loss) income per share attributable to common stockholders - basic | $ | (1.09 | ) | $ | 0.04 | $ | (0.34 | ) | ||||||||
| Weighted average common shares outstanding - basic | 35,694 | 71,200 | 106,894 | |||||||||||||
|
|
POWERFLEET, INC. AND MiX TELEMATICS
CONDENSED CONSOLIDATED BALANCE SHEETS
(In thousands, except per share data)
| March 31, 2024 | ||||||||||||
| Powerfleet Inc. | MiX Telematics | Pro Forma Combined | ||||||||||
| ASSETS | ||||||||||||
| Current assets: | ||||||||||||
| Cash and cash equivalents | $ | 24,354 | $ | 26,737 | $ | 51,091 | ||||||
| Restricted cash | 85,310 | 794 | 86,104 | |||||||||
| Accounts receivables, net | 30,333 | 24,675 | 55,008 | |||||||||
| Inventory, net | 21,658 | 4,142 | 25,800 | |||||||||
| Prepaid expenses and other current assets | 8,133 | 9,693 | 17,826 | |||||||||
| Total current assets | 169,788 | 66,041 | 235,829 | |||||||||
| Fixed assets, net | 12,719 | 35,587 | 48,306 | |||||||||
| Goodwill | 83,487 | 38,226 | 121,713 | |||||||||
| Intangible assets, net | 19,652 | 20,792 | 40,444 | |||||||||
| Right-of-use asset | 7,428 | 3,794 | 11,222 | |||||||||
| Severance payable fund | 3,796 | — | 3,796 | |||||||||
| Deferred tax asset | 2,781 | 1,093 | 3,874 | |||||||||
| Other assets | 9,029 | 10,061 | 19,090 | |||||||||
| Total assets | $ | 308,680 | $ | 175,594 | $ | 484,274 | ||||||
| LIABILITIES | ||||||||||||
| Current liabilities: | ||||||||||||
| Short-term bank debt and current maturities of long-term debt | $ | 1,951 | $ | 20,158 | $ | 22,109 | ||||||
| Accounts payable | 20,025 | 7,149 | 27,174 | |||||||||
| Accrued expenses and other current liabilities | 13,983 | 19,606 | 33,589 | |||||||||
| Deferred revenue - current | 5,842 | 6,394 | 12,236 | |||||||||
| Lease liability - current | 1,789 | 859 | 2,648 | |||||||||
| Total current liabilities | 43,590 | 54,166 | 97,756 | |||||||||
| Long-term debt - less current maturities | 113,810 | — | 113,810 | |||||||||
| Deferred revenue - less current portion | 4,892 | — | 4,892 | |||||||||
| Lease liability - less current portion | 5,921 | 2,852 | 8,773 | |||||||||
| Accrued severance payable | 4,597 | — | 4,597 | |||||||||
| Deferred tax liability | 4,465 | 14,204 | 18,669 | |||||||||
| Other long-term liabilities | 2,496 | 484 | 2,980 | |||||||||
| Total liabilities | 179,771 | 71,706 | 251,477 | |||||||||
| Convertible redeemable preferred stock: Series A | 90,273 | — | 90,273 | |||||||||
| STOCKHOLDERS’ EQUITY | ||||||||||||
| Preferred stock | — | — | — | |||||||||
| Common stock | 387 | 63,455 | 63,842 | |||||||||
| Additional paid-in capital | 202,607 | (2,389 | ) | 200,218 | ||||||||
| Accumulated deficit | (154,796 | ) | 76,280 | (78,516 | ) | |||||||
| Accumulated other comprehensive loss | (985 | ) | (16,148 | ) | (17,133 | ) | ||||||
| Treasury stock | (8,682 | ) | (17,315 | ) | (25,997 | ) | ||||||
| Total stockholders’ equity | 38,531 | 103,883 | 142,414 | |||||||||
| Non-controlling interest | 105 | 5 | 110 | |||||||||
| Total equity | 38,636 | 103,888 | 142,524 | |||||||||
| Total liabilities, convertible redeemable preferred stock, and stockholders’ equity | $ | 308,680 | $ | 175,594 | $ | 484,274 | ||||||
|
|
POWERFLEET, INC. AND MiX TELEMATICS
CONDENSED CONSOLIDATED STATEMENTS OF CASH FLOWS
(In thousands)
| Year Ended March 31, 2024 | ||||||||||||
| Powerfleet Inc. | MiX Telematics | Pro Forma Combined | ||||||||||
| Cash flows from operating activities | ||||||||||||
| Net (loss) income | $ | (18,836 | ) | $ | 2,585 | $ | (16,251 | ) | ||||
| Adjustments to reconcile net (loss) income to cash provided by operating activities: | ||||||||||||
| Non-controlling interest | 50 | — | 50 | |||||||||
| Gain on bargain purchase | (1,800 | ) | — | (1,800 | ) | |||||||
| Inventory reserve | 1,557 | 615 | 2,172 | |||||||||
| Stock based compensation expense | 4,104 | 1,110 | 5,214 | |||||||||
| Depreciation and amortization | 9,098 | 20,450 | 29,548 | |||||||||
| Impairment of long-lived assets | — | 139 | 139 | |||||||||
| Right-of-use assets, non-cash lease expense | 2,919 | — | 2,919 | |||||||||
| Bad debts expense | 2,309 | 5,225 | 7,534 | |||||||||
| Deferred income taxes | (281 | ) | 3,516 | 3,235 | ||||||||
| Other non-cash items | (55 | ) | 6,393 | 6,338 | ||||||||
| Changes in operating assets and liabilities: | ||||||||||||
| Accounts receivables | (1,538 | ) | (7,760 | ) | (9,298 | ) | ||||||
| Inventories | (780 | ) | 179 | (601 | ) | |||||||
| Prepaid expenses and other current assets | (564 | ) | (514 | ) | (1,078 | ) | ||||||
| Deferred costs | 481 | (8,995 | ) | (8,514 | ) | |||||||
| Deferred revenue | (180 | ) | — | (180 | ) | |||||||
| Accounts payable and accrued expenses | 8,786 | 945 | 9,731 | |||||||||
| Lease liabilities | (2,851 | ) | — | (2,851 | ) | |||||||
| Accrued severance payable, net | 15 | — | 15 | |||||||||
| Net cash provided by operating activities | 2,434 | 23,888 | 26,322 | |||||||||
| Cash flows from investing activities: | ||||||||||||
| Capitalized software development costs | (3,540 | ) | (5,972 | ) | (9,512 | ) | ||||||
| Capital expenditures | (3,673 | ) | (17,036 | ) | (20,709 | ) | ||||||
| Net cash used in investing activities | (7,213 | ) | (23,008 | ) | (30,221 | ) | ||||||
| Cash flows from financing activities: | ||||||||||||
| Repayment of long-term debt | (14,116 | ) | — | (14,116 | ) | |||||||
| Short-term bank debt, net | (5,708 | ) | 5,550 | (158 | ) | |||||||
| Deferred consideration paid | — | (1,955 | ) | (1,955 | ) | |||||||
| Purchase of treasury stock upon vesting of restricted stock | (128 | ) | (546 | ) | (674 | ) | ||||||
| Repayment of financing lease | (129 | ) | — | (129 | ) | |||||||
| Payment of preferred stock dividend and redemption of preferred stock | (3,385 | ) | — | (3,385 | ) | |||||||
| Proceeds from long-term debt | 115,000 | — | 115,000 | |||||||||
| Payment of long-term debt costs | (1,081 | ) | — | (1,081 | ) | |||||||
| Proceeds from exercise of stock options, net | 36 | — | 36 | |||||||||
| Cash paid on dividends to affiliates | — | (5,320 | ) | (5,320 | ) | |||||||
| Net cash from (used in) financing activities | 90,489 | (2,271 | ) | 88,218 | ||||||||
| Effect of foreign exchange rate changes on cash and cash equivalents | (1,135 | ) | (1,735 | ) | (2,870 | ) | ||||||
| Net increase (decrease) in cash and cash equivalents, and restricted cash | 84,575 | (3,126 | ) | 81,449 | ||||||||
| Cash and cash equivalents, and restricted cash at beginning of the period | 25,089 | 30,657 | 55,746 | |||||||||
| Cash and cash equivalents, and restricted cash at end of the period | $ | 109,664 | $ | 27,531 | $ | 137,195 | ||||||
| Reconciliation of cash, cash equivalents, and restricted cash, beginning of the period | ||||||||||||
| Cash and cash equivalents | 24,780 | 29,876 | 54,656 | |||||||||
| Restricted cash | 309 | 781 | 1,090 | |||||||||
| Cash, cash equivalents, and restricted cash, beginning of the period | $ | 25,089 | $ | 30,657 | $ | 55,746 | ||||||
| Reconciliation of cash, cash equivalents, and restricted cash, end of the period | ||||||||||||
| Cash and cash equivalents | 24,354 | 26,737 | 51,091 | |||||||||
| Restricted cash | 85,310 | 794 | 86,104 | |||||||||
| Cash, cash equivalents, and restricted cash, end of the period | $ | 109,664 | $ | 27,531 | $ | 137,195 | ||||||
| Supplemental disclosure of cash flow information: | ||||||||||||
| Cash paid for: | ||||||||||||
| Taxes | $ | 432 | $ | 2,949 | $ | 3,381 | ||||||
| Interest | $ | 1,720 | $ | 694 | $ | 2,414 | ||||||
| Noncash investing and financing activities: | ||||||||||||
| Value of licensed intellectual property acquired in connection with Movingdots acquisition | $ | 1,517 | $ | — | $ | 1,517 | ||||||
| Preferred stock dividends paid in shares | $ | 1,108 | $ | — | $ | 1,108 | ||||||
| Issuance of derivative on long-term debt | $ | 2,226 | $ | — | $ | 2,226 | ||||||
|
|
POWERFLEET, INC. AND MiX TELEMATICS
RECONCILIATION OF GAAP TO ADJUSTED EBITDA FINANCIAL MEASURES
(In thousands)
| Three Months Ended March 31, 2024 | ||||||||||||
| Powerfleet Inc. | MiX Telematics | Pro Forma Combined | ||||||||||
| Net loss attributable to common stockholders | $ | (19,640 | ) | $ | (733 | ) | $ | (20,373 | ) | |||
| Non-controlling interest | 12 | — | 12 | |||||||||
| Preferred stock dividend and accretion | 11,125 | — | 11,125 | |||||||||
| Interest expense, net | 601 | 334 | 935 | |||||||||
| Other expense, net | 55 | — | 55 | |||||||||
| Income tax expense | 352 | 1,565 | 1,917 | |||||||||
| Depreciation and amortization | 1,943 | 6,426 | 8,369 | |||||||||
| Stock-based compensation | 1,028 | 283 | 1,311 | |||||||||
| Foreign currency losses | 43 | 395 | 438 | |||||||||
| Restructuring-related expenses | 324 | — | 324 | |||||||||
| Impairment of long-lived assets | — | 139 | 139 | |||||||||
| Net profit on fixed assets | — | (66 | ) | (66 | ) | |||||||
| Contingent consideration remeasurement | — | (250 | ) | (250 | ) | |||||||
| Acquisition-related expenses | 6,078 | 1,099 | 7,177 | |||||||||
| Adjusted EBITDA | $ | 1,921 | $ | 9,192 | $ | 11,113 | ||||||
|
|
POWERFLEET, INC. AND MiX TELEMATICS
RECONCILIATION OF GAAP TO ADJUSTED EBITDA FINANCIAL MEASURES
(In thousands)
| Year Ended March 31, 2024 | ||||||||||||
| Powerfleet Inc. | MiX Telematics | Pro Forma Combined | ||||||||||
| Net (loss) profit attributable to common stockholders | $ | (38,830 | ) | $ | 2,585 | $ | (36,245 | ) | ||||
| Non-controlling interest | 50 | — | 50 | |||||||||
| Preferred stock dividend and accretion | 19,994 | — | 19,994 | |||||||||
| Interest expense, net | 1,987 | 1,205 | 3,192 | |||||||||
| Other expense, net | 87 | — | 87 | |||||||||
| Income tax expense | 549 | 6,465 | 7,014 | |||||||||
| Depreciation and amortization | 9,098 | 20,450 | 29,548 | |||||||||
| Stock-based compensation | 4,104 | 1,110 | 5,214 | |||||||||
| Foreign currency translation | (248 | ) | 1,741 | 1,493 | ||||||||
| Restructuring-related expenses | 1,035 | 30 | 1,065 | |||||||||
| Gain on Bargain purchase - Movingdots | (1,800 | ) | — | (1,800 | ) | |||||||
| Impairment of long-lived assets | — | 139 | 139 | |||||||||
| Net profit on fixed assets | — | (115 | ) | (115 | ) | |||||||
| Contingent consideration remeasurement | — | (1,299 | ) | (1,299 | ) | |||||||
| Acquisition-related expenses | 11,218 | 3,095 | 14,313 | |||||||||
| Non-recurring transitional service agreement costs | — | 482 | 482 | |||||||||
| Adjusted EBITDA | $ | 7,244 | $ | 35,888 | $ | 43,132 | ||||||
|
|
POWERFLEET, INC. AND MiX TELEMATICS
RECONCILIATION OF GAAP TO NON-GAAP NET (LOSS) INCOME FINANCIAL MEASURES
(In thousands)
| Three Months Ended March 31, 2024 | ||||||||||||
| Powerfleet Inc. | MiX Telematics | Pro Forma Combined | ||||||||||
| Net (loss) income | $ | (8,515 | ) | $ | (733 | ) | $ | (9,248 | ) | |||
| Foreign currency losses | 43 | 395 | 438 | |||||||||
| Income tax effect of net foreign exchange losses | — | 389 | 389 | |||||||||
| Restructuring-related expenses | 324 | — | 324 | |||||||||
| Acquisition-related expenses | 6,078 | 1,099 | 7,177 | |||||||||
| Non-recurring transitional service agreement costs | — | — | — | |||||||||
| Income tax effect of non-recurring transitional service agreement costs | — | (130 | ) | (130 | ) | |||||||
| Contingent consideration remeasurement | — | (250 | ) | (250 | ) | |||||||
| Non-GAAP net (loss) income | $ | (2,070 | ) | $ | 770 | $ | (1,300 | ) | ||||
| Weighted average shares outstanding | 35,813 | 71,081 | 106,894 | |||||||||
| Non-GAAP net income per share - basic | $ | (0.06 | ) | $ | 0.01 | $ | (0.01 | ) | ||||
|
|
POWERFLEET, INC. AND MiX TELEMATICS
RECONCILIATION OF GAAP TO NON-GAAP NET (LOSS) INCOME FINANCIAL MEASURES
(In thousands)
| Year Ended March 31, 2024 | ||||||||||||
| Powerfleet Inc. | MiX Telematics | Pro Forma Combined | ||||||||||
| Net (loss) income | $ | (18,836 | ) | $ | 2,585 | $ | (16,251 | ) | ||||
| Foreign currency (gains) losses | (248 | ) | 1,741 | 1,493 | ||||||||
| Income tax effect of net foreign exchange losses | — | 279 | 279 | |||||||||
| Restructuring-related expenses | 1,035 | 30 | 1,065 | |||||||||
| Income tax effect of restructuring costs | — | (7 | ) | (7 | ) | |||||||
| Acquisition-related expenses | 11,218 | 3,095 | 14,313 | |||||||||
| Non-recurring transitional service agreement costs | — | 482 | 482 | |||||||||
| Income tax effect of non-recurring transitional service agreement costs | — | (130 | ) | (130 | ) | |||||||
| Contingent consideration remeasurement | — | (1,299 | ) | (1,299 | ) | |||||||
| Non-GAAP net (loss) income | $ | (6,831 | ) | $ | 6,776 | $ | (55 | ) | ||||
| Weighted average shares outstanding | 35,694 | 71,200 | 106,894 | |||||||||
| Non-GAAP net (loss) income per share - basic | $ | (0.19 | ) | $ | 0.10 | $ | (0.001 | ) | ||||
|
|
Exhibit 99.2