UNITED STATES
SECURITIES AND EXCHANGE COMMISSION
WASHINGTON, D.C. 20549
FORM 8-K
CURRENT REPORT
Pursuant to Section 13 OR 15(d) of The Securities Exchange Act of 1934
Date of Report (Date of earliest event reported): March 28, 2025
SBC Medical Group Holdings Incorporated
(Exact name of registrant as specified in its charter)
| Delaware | 001-41462 | 88-1192288 | ||
|
(State or other jurisdiction of incorporation) |
(Commission File Number) |
(IRS Employer Identification No.) |
|
200 Spectrum Center Dr. STE 300 Irvine, CA |
92618 | |
| (Address of principal executive offices) | (Zip Code) |
949-593-0250
(Registrant’s telephone number, including area code)
Not Applicable
(Former name or former address, if changed since last report.)
Check the appropriate box below if the Form 8-K filing is intended to simultaneously satisfy the filing obligation of the registrant under any of the following provisions:
| ☐ | Written communications pursuant to Rule 425 under the Securities Act (17 CFR 230.425) |
| ☐ | Soliciting material pursuant to Rule 14a-12 under the Exchange Act (17 CFR 240.14a-12) |
| ☐ | Pre-commencement communications pursuant to Rule 14d-2(b) under the Exchange Act (17 CFR 240.14d-2(b)) |
| ☐ | Pre-commencement communications pursuant to Rule 13e-4(c) under the Exchange Act (17 CFR 240.13e-4(c)) |
Securities registered pursuant to Section 12(b) of the Act:
| Title of each class | Trading Symbol(s) | Name of each exchange on which registered | ||
| Common Stock, $0.0001 par value per share | SBC | The Nasdaq Stock Market LLC | ||
| Redeemable Warrants, each whole warrant exercisable for one share of Common Stock at an exercise price of $11.50 per share | SBCWW | The Nasdaq Stock Market LLC |
Indicate by check mark whether the registrant is an emerging growth company as defined in Rule 405 of the Securities Act of 1933 or Rule 12b-2 of the Securities Exchange Act of 1934.
Emerging growth company ☒
If an emerging growth company, indicate by check mark if the registrant has elected not to use the extended transition period for complying with any new or revised financial accounting standards provided pursuant to Section 13(a) of the Exchange Act. ☐
Item 2.02 Results of Operations and Financial Condition.
On March 28, 2025, SBC Medical Group Holdings Incorporated, or the Company, issued a press release announcing its results for the quarter ended December 31, 2024 and the full year 2024. The press release is attached as Exhibit 99.1 and is incorporated herein by reference.
Attached hereto as Exhibit 99.2 and incorporated by reference herein is an investor presentation regarding results for the quarter ended December 31, 2024 and the full year 2024, or the Investor Presentation. The Investor Presentation was posted to https://sbc-holdings.com/en/ir/ir-presentation immediately after the filing of this Current Report.
The information furnished under this Item 2.02, including Exhibit 99.1 and 99.2, shall not be deemed “filed” for purposes of Section 18 of the Securities Exchange Act of 1934, as amended (the “Exchange Act”), or otherwise subject to the liabilities under that section and shall not be deemed to be incorporated by reference into any filing under the Securities Act of 1933, as amended, or the Exchange Act, except as otherwise expressly stated by specific reference in any such filing.
Item 9.01 Financial Statement and Exhibits
(d) Exhibits.
| Exhibit No. | Description | |
| 99.1 | Press Release, dated March 28, 2025, entitled “SBC Medical Group Holdings Announces Fourth Quarter and Full Year 2024 Financial Results” | |
| 99.2 | Investor Presentation | |
| 104 | The cover page of this Current Report on Form 8-K, formatted in inline XBRL (included as Exhibit 101). |
SIGNATURE
Pursuant to the requirements of the Securities Exchange Act of 1934, the registrant has duly caused this report to be signed on its behalf by the undersigned, hereunto duly authorized.
| SBC Medical Group Holdings Incorporated | ||
| Dated: March 28, 2025 | By: | /s/ Ryoji Murata |
| Ryoji Murata | ||
| Chief Financial Officer | ||
Exhibit 99.1
SBC Medical Group Holdings Inc. Announces Fourth Quarter and Full Year 2024 Financial Results
Irvine, California, U.S.A., March 28, 2025 (Business Wire) — SBC Medical Group Holdings Incorporated (NASDAQ: SBC, “SBC Medical” or the “Company”), a global owner, operator and provider of management services and products to cosmetic treatment centers, today announced its financial results for - the three months ended December 31, 2024 and full year 2024.
Fourth Quarter 2024 Highlights
| ● | Total revenues were $44 million, representing a 29% year-over-year decrease. | |
| ● | Gross profit was $34 million, representing a 22% year-over-year decrease. | |
| ● | Income from operations was $5 million, representing an 80% year-over-year decrease. | |
| ● | EBITDA1, which is calculated by adding depreciation and amortization expense and impairment loss to income from operations was $21 million, representing a 22% year-over-year decrease. EBITDA margin1 was 47% for the fourth quarter of 2024, compared to 43% for the fourth quarter of 2023. | |
| ● | Net income attributable to SBC Medical Group was $7 million, representing a 54% year-over-year decrease. | |
| ● | Earnings per share, which is defined as net income attributable to the Company divided by the weighted average number of outstanding shares, was $0.06 for the three months ended December 31, 2024, representing a year-over-year decrease of 58%. |
Full Year 2024 Highlights
| ● | Total revenues were $205 million, representing a 6% year-over-year increase. | |
| ● | Gross Profit was $156 million, representing a 14% year-over-year increase. | |
| ● | Income from operations was $70 million, representing a 1% year-over-year decrease. | |
| ● | EBITDA1, which is calculated by adding depreciation and amortization expense and impairment loss to income from operations was $89 million, representing an 8% year-over-year increase. EBITDA margin1 was 43% for the year of 2024, compared to 43% for the year of 2023. | |
| ● | Net Income attributable to SBC Medical Group was $47 million, representing an 18% year-over-year increase. | |
| ● | Return on equity, which is defined as net income attributable to the Company divided by the average of shareholder’s equity as of December 31, 2023, and December 31, 2024, was 28% representing a year-over-year decrease of 4 percentage points. | |
| ● | Earnings per share, which is defined as net income attributable to the Company divided by the weighted average number of outstanding shares, was $0.48 for the twelve months ended December 31, 2024, representing a year-over-year increase of 14%. | |
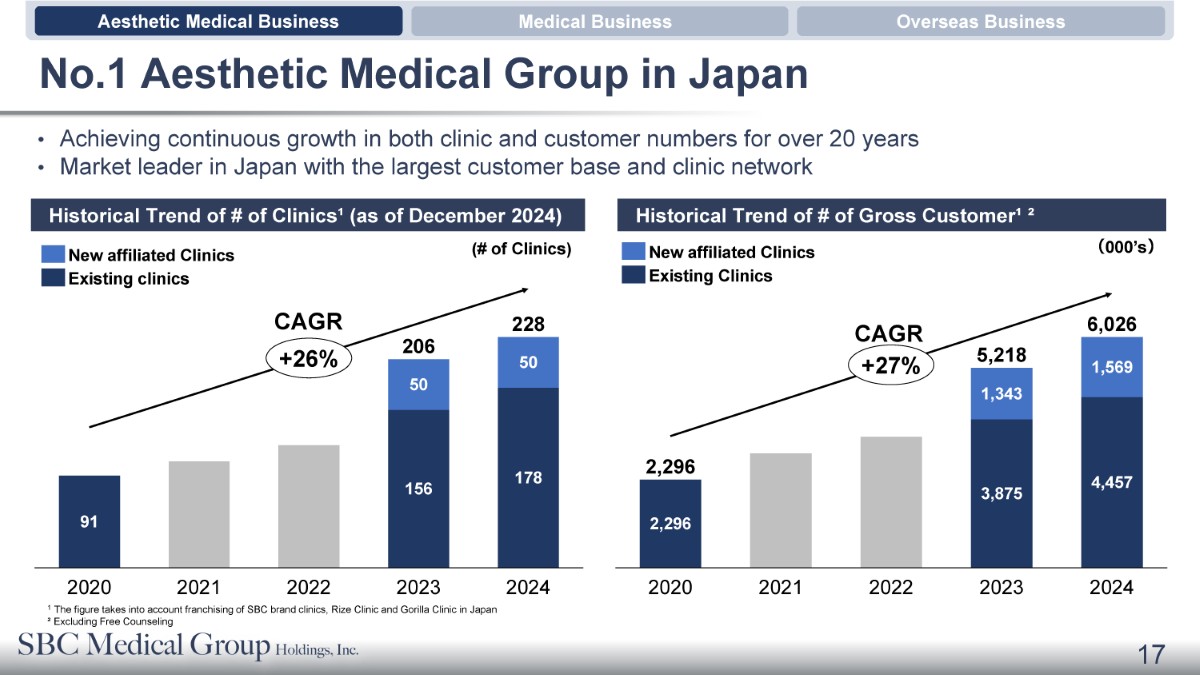
| ● | Number of partner clinics was 251 as of December 31, 2024, representing an increase of 43 clinics from December 31, 2023. |
1 EBITDA and EBITDA Margin are non-GAAP financial measures. For more information on non-GAAP financial measure, please see the section of “Use of Non-GAAP Financial Measures” and the table captioned “Unaudited Reconciliations of GAAP and Non-GAAP Results.”
| ● | Number of customers2 in the last twelve months ended December 31, 2024, was 6.03 million, representing a 15% year-over-year increase. | |
| ● | Repeat rate for customers3 who visited franchisee’s clinics twice or more was 71 %. |
Yoshiyuki Aikawa, Chairman and Chief Executive Officer of SBC Medical, said, “The year of 2024 was a momentous year for us, showcasing our solid performance and sustained growth, culminating in our successful Nasdaq listing. We delivered strong 2024 results with top line growing by 6% while bottom line surged 18% year over year. More encouragingly, supported by our extensive network of 251 clinics, we served 6.0 million loyal customers over the last twelve months, with a repeat rate exceeding 70%. As we continue to see increasing global demand for aesthetic medical services, we remain committed to developing a strong franchising structure and network, and expanding our business both domestically and internationally. Looking ahead, we remain dedicated to not only maintaining, but expanding, our competitive edge while capturing the significant growth opportunities both at home and abroad. With these goals we aim to create long-term value and drive sustainable growth for our shareholders.”
Full Year 2024 Financial Results
Total revenues were $205 million, an increase of 6% year-over-year despite the negative impact of the discontinuation of the staffing business, driven by the expansion of franchise clinics.
EBITDA was $89 million, an increased 8% year-over-year due to one-time factors such as stock-based compensation expenses (USD 13.0 million). However, excluding these one-time factors and foreign exchange impacts (USD 6.9 million), EBITDA increased 32% year-over-year.
Non-operating income and expenses totaled USD 3 million, primarily driven by the gain on the sale of Cellpro Japan, partially offset by an impairment loss on certain equity holdings. Consequently, net income attributable to SBC increased 18% year-over-year, achieving both revenue and profit growth compared to the previous fiscal year.
Business Highlights
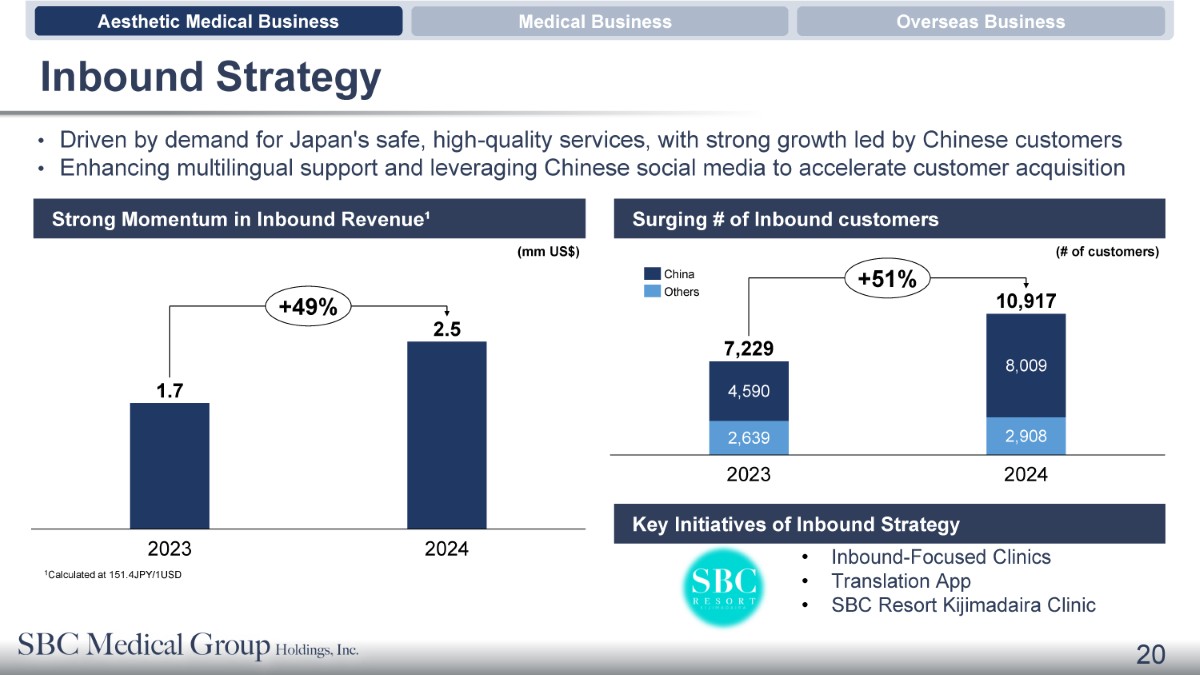
In 2024, Japan’s Ministry of Health, Labor and Welfare, the regulator of the medical industry, raised concerns regarding the expansion of aesthetic medical business, and intensified competition, which led to the shake out of some hair removal clinics. Despite such a challenging competitive environment, SBC Medical maintained its market leadership by driving market expansion through an appropriate pricing strategy for franchise clinics. As a result, the number of customers reached 6 million, a 15% year-over-year increase, while the number of unique customers4 grew 11% year-over-year to 1.9 million.
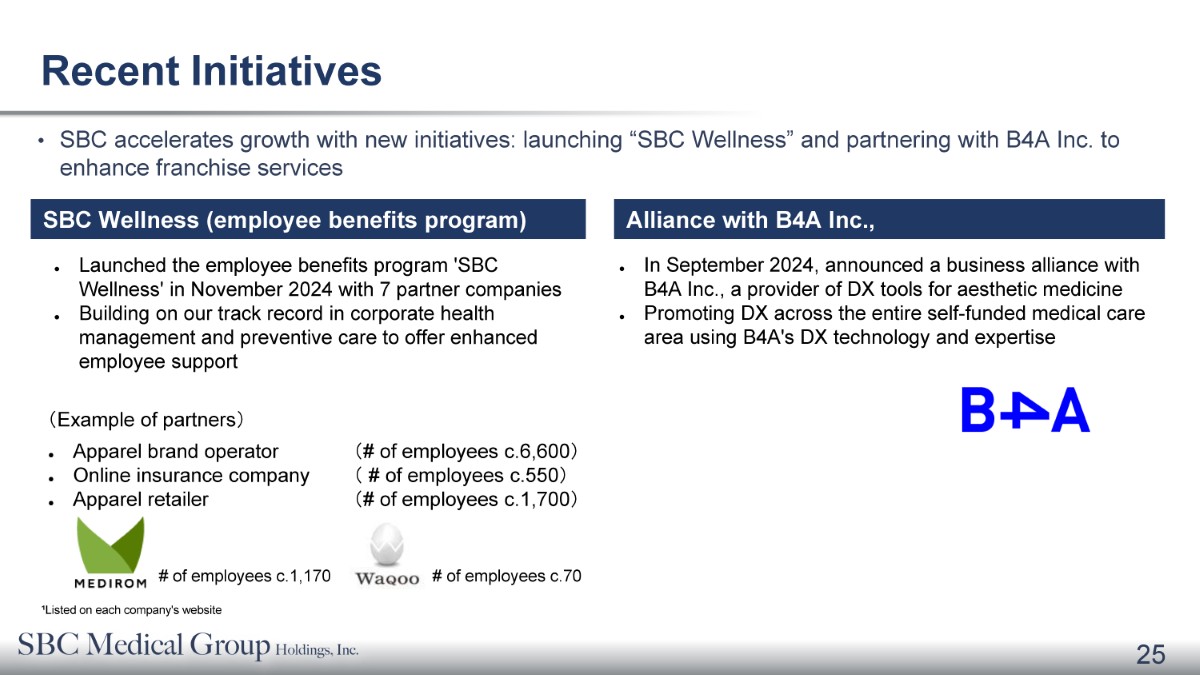
On the overseas business, SBC Medical acquired Aesthetic Healthcare Holdings Pte. and its subsidiaries (“AHH”) in Singapore, securing a strategic footprint to function as the Company’s business hub in Asia. Additionally, SBC Medical launched the “SBC Wellness” employee benefit program and entered into a strategic partnership with B4A, a SaaS company for aesthetic clinics in Japan, executing key initiatives to expand its business.
2 The number of customers takes into account customers of SBC brand clinics, Rize Clinic and Gorilla Clinic, but does not take account customers of AHH Clinics
3 The number of customers takes into account customers of SBC brand clinics, Rize Clinic and Gorilla Clinic, but does not take account customers of AHH Clinics, but excluding free counseling
4 The number of unique customers account for each individual customer only once, regardless of how many times they have used our clinics or franchise clinics In FY2025, while the aesthetic dermatology market is expected to continue expanding, competition is also expected to intensify.
Outlook for FY2025
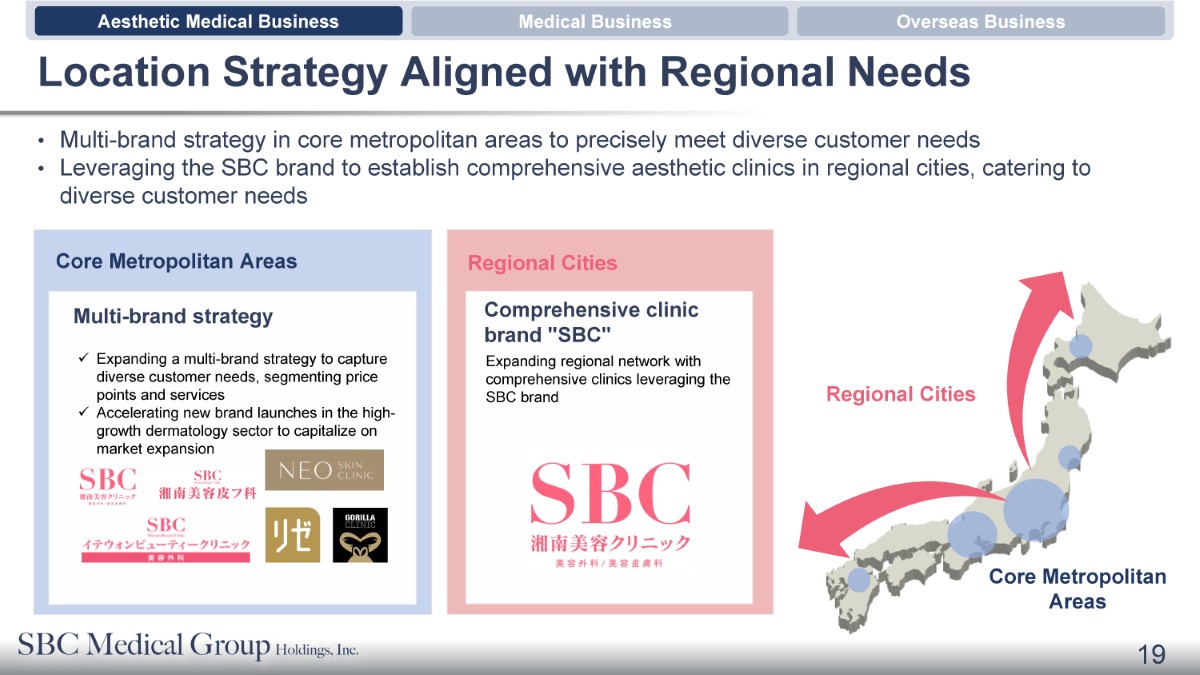
To solidify its dominant market position, SBC Medical will implement strategic price revision and other initiatives.
Furthermore, to support the long-term expansion of our franchise clinic network, the Company will revise its franchise fee structure starting in April 2025. This revision aims to alleviate the initial financial burden on franchisees while introducing a tiered fee system aligned with clinic scale and the consulting services provided by SBC Medical Group Co., Ltd.
If the revised fee structure had been applied starting in April 2024, it is estimated that total revenues for fiscal year 2024 would have decreased by approximately 10%. However, the Company expects the impact on total revenues and income from operations for fiscal year 2025 to be offset by the absence of one-time losses that were recorded in fiscal year 2024, which were impairment loss on intangible assets and stock-based compensation. Nevertheless, the ultimate financial impact remains uncertain and will depend on a number of factors, many of which are beyond the Company’s control.
Conference Call
The Company will hold a conference call on Friday, March 28, 2025, at 8:00 am Eastern Time (or Friday, March 28, 2025, at 9:00 pm Japan Time) to discuss the financial results and take questions live.
Please register in advance of the conference using the link provided below. It will automatically direct you to the registration page of “SBC 2024 Full Year Financial Results Briefing”. Please follow the steps to enter your registration details, then click “Submit”. Upon registration, you will be able to access the dedicated Conference Call viewing site. In addition to viewing the conference call, this site provides access to information about the speakers as well as past investor relations materials.
Pre-registration is accessible online at https://edge.media-server.com/mmc/p/demkfxps/.
Starting 10 minutes before the conference call begins, you will be able to view the full-year earnings presentation materials on the site. The materials will also be available for download.
A replay of the conference call will be accessible until March 28, 2026.
Additionally, a live and archived webcast of this conference call will be available at https://ir.sbc-holdings.com/ .
About SBC Medical
SBC Medical, headquartered in Irvine, California and Tokyo, Japan, owns and provides management services and products to cosmetic treatment centers. The Company is primarily focused on providing comprehensive management services to franchise clinics, including but not limited to advertising and marketing needs across various platforms (such as social media networks), staff management (such as recruitment and training), booking reservations for franchise clinic customers, assistance with franchise employee housing rentals and facility rentals, construction and design of franchise clinics, medical equipment and medical consumables procurement (resale), the provision of cosmetic products to franchise clinics for resale to clinic customers, licensure of the use of patent-pending and non-patented medical technologies, trademark and brand use, IT software solutions (including but not limited to remote medical consultations), management of the franchise clinic’s customer rewards program (customer loyalty point program), and payment tools for the franchise clinics.
For more information, visit https://sbc-holdings.com/
Use of Non-GAAP Financial Measures
The Company uses non-GAAP measures, such as EBITDA, in evaluating its operating results and for financial and operational decision-making purposes. The Company believes that the non-GAAP financial measures help identify underlying trends in its business. The Company believes that the non-GAAP financial measures provide useful information about the Company’s results of operations, enhance the overall understanding of the Company’s past performance and future prospects and allow for greater visibility with respect to key metrics used by the Company’s management in its financial and operational decision-making.
The non-GAAP financial measures are not defined under U.S. GAAP and are not presented in accordance with U.S. GAAP. The non-GAAP financial measures have limitations as analytical tools, and when assessing the Company’s operating performance, cash flows or liquidity, investors should not consider them in isolation, or as a substitute for net loss, cash flows provided by operating activities or other consolidated statements of operations and cash flows data prepared in accordance with U.S. GAAP.
The Company mitigates these limitations by reconciling the non-GAAP financial measures to the most comparable U.S. GAAP performance measures, all of which should be considered when evaluating the Company’s performance.
For more information on the non-GAAP financial measures, please see the table captioned “Unaudited Reconciliations of GAAP and Non-GAAP Results.”
Forward Looking Statements
This press release contains forward-looking statements. Forward-looking statements are not historical facts or statements of current conditions, but instead represent only the Company’s beliefs regarding future events and performance, many of which, by their nature, are inherently uncertain and outside of the Company’s control. These forward-looking statements reflect the Company’s current views with respect to, among other things, the Company’s financial performance; growth in revenue and earnings; business prospects and opportunities; and capital deployment plans and liquidity. In some cases, forward-looking statements can be identified by the use of words such as “may,” “should,” “expects,” “anticipates,” “contemplates,” “estimates,” “believes,” “plans,” “projected,” “predicts,” “potential,” or “hopes” or the negative of these or similar terms. The Company cautions readers not to place undue reliance upon any forward-looking statements, which are current only as of the date of this release and are subject to various risks, uncertainties, assumptions, or changes in circumstances that are difficult to predict or quantify. The forward-looking statements are based on management’s current expectations and are not guarantees of future performance. The Company does not undertake or accept any obligation to release publicly any updates or revisions to any forward-looking statements to reflect any change in its expectations or any change in events, conditions, or circumstances on which any such statement is based, except as required by law. Factors that may cause actual results to differ materially from current expectations may emerge from time to time, and it is not possible for the Company to predict all of them; such factors include, among other things, changes in global, regional, or local economic, business, competitive, market and regulatory conditions, and those listed under the heading “Risk Factors” and elsewhere in the Company’s filings with the U.S. Securities and Exchange Commission (the “SEC”), which are accessible on the SEC’s website at www.sec.gov.
Contact:
In Asia:
SBC Medical Group Holdings Incorporated
Hikaru Fukui / Head of Investor Relations
E-mail: ir@sbc-holdings.com
In the US:
ICR LLC
Bill Zima / Managing Partner
Email: bill.zima@icrinc.com
SBC MEDICAL GROUP HOLDINGS INCORPORATED
CONSOLIDATED BALANCE SHEETS
| As of December 31, | ||||||||
| 2024 | 2023 | |||||||
| ASSETS | ||||||||
| Current assets: | ||||||||
| Cash and cash equivalents | $ | 125,044,092 | $ | 103,022,932 | ||||
| Accounts receivable | 1,413,433 | 1,437,077 | ||||||
| Accounts receivable – related parties | 28,846,680 | 33,676,672 | ||||||
| Inventories | 1,494,891 | 3,090,923 | ||||||
| Finance lease receivables, current – related parties | 5,992,585 | 6,143,564 | ||||||
| Customer loans receivable, current | 10,382,537 | 8,484,753 | ||||||
| Prepaid expenses and other current assets | 11,276,802 | 10,050,005 | ||||||
| Total current assets | 184,451,020 | 165,905,926 | ||||||
| Non-current assets: | ||||||||
| Property and equipment, net | 8,771,902 | 13,582,017 | ||||||
| Intangible assets, net | 1,590,052 | 19,739,276 | ||||||
| Long-term investments, net | 3,049,972 | 849,434 | ||||||
| Goodwill, net | 4,613,784 | 3,590,791 | ||||||
| Finance lease receivables, non-current – related parties | 8,397,582 | 3,420,489 | ||||||
| Operating lease right-of-use assets | 5,267,056 | 5,919,937 | ||||||
| Deferred tax assets | 9,798,071 | — | ||||||
| Customer loans receivable, non-current | 5,023,551 | 6,444,025 | ||||||
| Long-term prepayments | 1,745,801 | 4,099,763 | ||||||
| Long-term investments in MCs – related parties | 17,820,910 | 19,811,555 | ||||||
| Other assets | 15,553,453 | 15,442,058 | ||||||
| Total non-current assets | 81,632,134 | 92,899,345 | ||||||
| Total assets | $ | 266,083,154 | $ | 258,805,271 | ||||
| LIABILITIES AND STOCKHOLDERS’ EQUITY | ||||||||
| Current liabilities: | ||||||||
| Accounts payable | $ | 13,875,179 | $ | 26,531,944 | ||||
| Accounts payable – related party | 659,044 | — | ||||||
| Current portion of long-term loans | 96,824 | 156,217 | ||||||
| Notes payable, current – related parties | 26,255 | 3,369,203 | ||||||
| Advances from customers | 820,898 | 2,074,457 | ||||||
| Advances from customers – related parties | 11,739,533 | 23,058,175 | ||||||
| Income tax payable | 18,705,851 | 8,782,930 | ||||||
| Operating lease liabilities, current | 4,341,522 | 3,885,812 | ||||||
| Accrued liabilities and other current liabilities | 8,103,194 | 21,009,009 | ||||||
| Due to related party | 2,823,590 | 3,583,523 | ||||||
| Total current liabilities | 61,191,890 | 92,451,270 | ||||||
SBC MEDICAL GROUP HOLDINGS INCORPORATED
CONSOLIDATED BALANCE SHEETS — (Continued)
| As of December 31, | ||||||||
| 2024 | 2023 | |||||||
| Non-current liabilities: | ||||||||
| Long-term loans | 6,502,682 | 1,062,722 | ||||||
| Notes payable, non-current – related parties | 5,334 | 11,948,219 | ||||||
| Deferred tax liabilities | 926,023 | 6,013,565 | ||||||
| Operating lease liabilities, non-current | 1,241,526 | 2,444,316 | ||||||
| Other liabilities | 1,193,541 | 1,074,930 | ||||||
| Total non-current liabilities | 9,869,106 | 22,543,752 | ||||||
| Total liabilities | 71,060,996 | 114,995,022 | ||||||
| Stockholders’ equity: | ||||||||
| Preferred stock ($0.0001 par value, 20,000,000 shares authorized; no shares issued and outstanding as of December 31, 2024 and 2023)** | — | — | ||||||
| Common stock ($0.0001 par value, 400,000,000 shares authorized, 103,020,816 and 94,192,433 shares issued, 102,750,816 and 94,192,433 shares outstanding as of December 31, 2024 and 2023, respectively)** | 10,302 | 9,419 | ||||||
| Additional paid-in capital** | 62,513,923 | 36,879,281 | ||||||
| Treasury stock (at cost, 270,000 and nil shares of common stock as of December 31, 2024 and 2023, respectively) | (2,700,000 | ) | — | |||||
| Retained earnings | 189,463,007 | 142,848,732 | ||||||
| Accumulated other comprehensive loss | (54,178,075 | ) | (37,578,255 | ) | ||||
| Total SBC Medical Group Holdings Incorporated stockholders’ equity | 195,109,157 | 142,159,177 | ||||||
| Non-controlling interests | (86,999 | ) | 1,651,072 | |||||
| Total stockholders’ equity | 195,022,158 | 143,810,249 | ||||||
| Total liabilities and stockholders’ equity | $ | 266,083,154 | $ | 258,805,271 | ||||
| ** | Retrospectively restated for effect of reverse recapitalization on September 17, 2024. |
The accompanying notes are an integral part of these consolidated financial statements.
SBC MEDICAL GROUP HOLDINGS INCORPORATED
CONSOLIDATED STATEMENTS OF OPERATIONS AND COMPREHENSIVE INCOME
|
For the Years Ended December 31, |
||||||||
| 2024 | 2023 | |||||||
| Revenues, net – related parties | $ | 195,173,889 | $ | 182,738,049 | ||||
| Revenues, net | 10,241,653 | 10,804,374 | ||||||
| Total revenues, net | 205,415,542 | 193,542,423 | ||||||
| Cost of revenues (including cost of revenues from a related party of $8,472,202 and $2,842,588 for the years ended December 31, 2024 and 2023, respectively) | 49,365,035 | 56,238,385 | ||||||
| Gross profit | 156,050,507 | 137,304,038 | ||||||
| Operating expenses: | ||||||||
| Selling, general and administrative expenses | 57,665,140 | 66,234,942 | ||||||
| Stock-based compensation | 13,022,692 | — | ||||||
| Impairment loss on intangible asset | 15,058,965 | — | ||||||
| Misappropriation loss | — | 409,030 | ||||||
| Total operating expenses | 85,746,797 | 66,643,972 | ||||||
| Income from operations | 70,303,710 | 70,660,066 | ||||||
| Other income (expenses): | ||||||||
| Interest income | 19,943 | 86,748 | ||||||
| Interest expense | (28,300 | ) | (45,292 | ) | ||||
| Other income (including other income from related parties of $2,673,077 and nil for the years ended December 31, 2024 and 2023, respectively) | 4,810,008 | 3,623,332 | ||||||
| Other expenses | (5,463,153 | ) | (745,519 | ) | ||||
| Gain on disposal of subsidiary | 3,813,609 | — | ||||||
| Total other income | 3,152,107 | 2,919,269 | ||||||
| Income before income taxes | 73,455,817 | 73,579,335 | ||||||
| Income tax expense | 26,765,925 | 35,018,729 | ||||||
| Net income | 46,689,892 | 38,560,606 | ||||||
| Less: net income (loss) attributable to non-controlling interests | 75,617 | (809,430 | ) | |||||
| Net income attributable to SBC Medical Group Holdings Incorporated | $ | 46,614,275 | $ | 39,370,036 | ||||
| Other comprehensive loss: | ||||||||
| Foreign currency translation adjustment | $ | (16,557,607 | ) | $ | (12,855,686 | ) | ||
| Reclassification of unrealized gain on available-for-sale debt security to net income when realized, net of tax effect of nil and $3,869 for the years ended December 31, 2024 and 2023, respectively | — | (8,760 | ) | |||||
| Total comprehensive income | 30,132,285 | 25,696,160 | ||||||
| Less: comprehensive income (loss) attributable to non-controlling interests | 117,830 | (948,896 | ) | |||||
| Comprehensive income attributable to SBC Medical Group Holdings Incorporated | $ | 30,014,455 | $ | 26,645,056 | ||||
| Net income per share attributable to SBC Medical Group Holdings Incorporated** | ||||||||
| Basic and diluted | $ | 0.48 | $ | 0.42 | ||||
| Weighted average shares outstanding** | ||||||||
| Basic and diluted | 96,561,041 | 94,192,433 | ||||||
| ** | Retrospectively restated for effect of reverse recapitalization on September 17, 2024. |
The accompanying notes are an integral part of these consolidated financial statements.
SBC MEDICAL GROUP HOLDINGS INCORPORATED
CONSOLIDATED STATEMENTS OF CASH FLOWS
|
For the Years Ended December 31, |
||||||||
| 2024 | 2023 | |||||||
| CASH FLOWS FROM OPERATING ACTIVITIES | ||||||||
| Net income | $ | 46,689,892 | $ | 38,560,606 | ||||
| Adjustments to reconcile net income to net cash provided by operating activities: | ||||||||
| Depreciation and amortization expense | 3,799,377 | 12,246,942 | ||||||
| Non-cash lease expense | 3,870,198 | 3,297,824 | ||||||
| Provision for (reversal of) credit losses | (402,196 | ) | 370,754 | |||||
| Stock-based compensation | 13,022,692 | — | ||||||
| Impairment loss on property and equipment | — | 204,026 | ||||||
| Impairment loss on intangible asset | 15,058,965 | — | ||||||
| Impairment loss on long-term investment | 529,596 | — | ||||||
| Realized gain on short-term investments | — | (223,164 | ) | |||||
| Fair value change of long-term investments | 2,617,435 | — | ||||||
| Gain on disposal of subsidiary | (3,813,609 | ) | — | |||||
| Loss (gain) on disposal of property and equipment and intangible assets | 511,947 | (249,532 | ) | |||||
| Deferred income taxes | (14,417,087 | ) | 4,113,395 | |||||
| Changes in operating assets and liabilities: | ||||||||
| Accounts receivable | (733,219 | ) | (596,069 | ) | ||||
| Accounts receivable – related parties | 1,350,413 | (22,402,301 | ) | |||||
| Inventories | 1,124,805 | (1,825,942 | ) | |||||
| Finance lease receivables – related parties | (5,991,486 | ) | 16,575,319 | |||||
| Customer loans receivable | 18,477,327 | 413,867 | ||||||
| Prepaid expenses and other current assets | (2,268,209 | ) | 4,102,808 | |||||
| Long-term prepayments | 1,910,274 | (3,539,280 | ) | |||||
| Other assets | (1,692,642 | ) | (1,328,682 | ) | ||||
| Accounts payable | (9,588,067 | ) | 12,201,755 | |||||
| Accounts payable – related party | 682,320 | — | ||||||
| Notes payable – related parties | (34,756,754 | ) | (23,816 | ) | ||||
| Advances from customers | (1,476,240 | ) | 461,043 | |||||
| Advances from customers – related parties | (9,144,031 | ) | (4,264,184 | ) | ||||
| Income tax payable | 11,228,429 | 13,359,434 | ||||||
| Operating lease liabilities | (3,950,587 | ) | (3,158,619 | ) | ||||
| Accrued liabilities and other current liabilities | (12,096,825 | ) | 4,452,022 | |||||
| Accrued retirement compensation expense – related party | — | (22,082,643 | ) | |||||
| Other liabilities | 40,215 | 4,759 | ||||||
| NET CASH PROVIDED BY OPERATING ACTIVITIES | 20,582,933 | 50,670,322 | ||||||
| CASH FLOWS FROM INVESTING ACTIVITIES | ||||||||
| Purchase of property and equipment | (2,564,643 | ) | (8,543,351 | ) | ||||
| Purchase of intangible assets | — | (1,683,030 | ) | |||||
| Purchase of convertible note | (1,700,000 | ) | (1,000,000 | ) | ||||
| Prepayments for property and equipment | (843,740 | ) | (981,567 | ) | ||||
| Advances to related parties | (622,804 | ) | (2,283,020 | ) | ||||
| Payments made on behalf of a related party | (5,572,564 | ) | — | |||||
| Purchase of short-term investments | — | (2,106,720 | ) | |||||
| Purchase of long-term investments | (331,496 | ) | — | |||||
| Long-term investments in MCs – related parties | — | (26,780 | ) | |||||
| Cash received (paid) for acquisition of subsidiaries, net of cash acquired | (4,236,009 | ) | 722,551 | |||||
| Long-term loans to others | (172,411 | ) | (926,020 | ) | ||||
| Repayments from related parties | 6,597,564 | 1,912,266 | ||||||
| Repayments from others | 176,109 | 581,274 | ||||||
| Proceeds from sales of short-term investments | — | 4,127,261 | ||||||
| Proceeds from surrender of life insurance policies | — | 3,954,760 | ||||||
| Disposal of subsidiaries, net of cash disposed of | (832,416 | ) | — | |||||
| Proceeds from disposal of property and equipment | — | 8,046,007 | ||||||
| NET CASH PROVIDED BY (USED IN) INVESTING ACTIVITIES | (10,102,410 | ) | 1,793,631 | |||||
SBC MEDICAL GROUP HOLDINGS INCORPORATED
CONSOLIDATED STATEMENTS OF CASH FLOWS — (Continued)
| As of December 31, | ||||||||
| 2024 | 2023 | |||||||
| CASH FLOWS FROM FINANCING ACTIVITIES | ||||||||
| Borrowings from a long-term loan | 6,603,253 | — | ||||||
| Borrowings from related parties | 5,481,787 | 12,310,106 | ||||||
| Proceeds from reverse recapitalization, net of transaction costs | 11,707,417 | — | ||||||
| Proceeds from issuance of common stock | — | 10 | ||||||
| Proceeds from exercise of stock warrants | 31,374 | — | ||||||
| Repayments of long-term loans | (119,017 | ) | (8,730,942 | ) | ||||
| Repayments to related parties | (739,414 | ) | (7,707,007 | ) | ||||
| Deemed contribution in connection with disposal of property and equipment | — | 9,620,453 | ||||||
| Deemed contribution in connection with reorganization | — | 642,748 | ||||||
| NET CASH PROVIDED BY FINANCING ACTIVITIES | 22,965,400 | 6,135,368 | ||||||
| Effect of changes in foreign currency exchange rate | (11,424,763 | ) | (7,314,383 | ) | ||||
| NET INCREASE IN CASH AND CASH EQUIVALENTS | 22,021,160 | 51,284,938 | ||||||
| CASH AND CASH EQUIVALENTS AS OF THE BEGINNING OF THE YEAR | 103,022,932 | 51,737,994 | ||||||
| CASH AND CASH EQUIVALENTS AS OF THE END OF THE YEAR | $ | 125,044,092 | $ | 103,022,932 | ||||
| SUPPLEMENTAL DISCLOSURE OF CASH FLOW INFORMATION | ||||||||
| Cash paid for interest expense | $ | 28,300 | $ | 45,292 | ||||
| Net cash paid for income taxes | $ | 30,239,002 | $ | 17,842,407 | ||||
| NON-CASH INVESTING AND FINANCING ACTIVITIES | ||||||||
| Property and equipment transferred from long-term prepayments | $ | 597,602 | $ | 7,681,830 | ||||
| An intangible asset transferred from long-term prepayments | $ | — | $ | 17,666,115 | ||||
| Deemed contribution in connection with disposal of subsidiaries | $ | 1,473,571 | $ | — | ||||
| Settlement of loan payable to a related party in connection with disposal of property and equipment | $ | — | $ | 4,163,604 | ||||
| Operating lease right-of-use assets obtained in exchange for operating lease liabilities | $ | — | $ | 2,305,199 | ||||
| Remeasurement of operating lease liabilities and right-of-use assets due to lease modifications | $ | 2,908,554 | $ | 2,110,079 | ||||
| Issuance of common stock from conversion of convertible note | $ | 2,700,000 | $ | — | ||||
| Settlement of loan payable to a related party in connection with issuance of common stock | $ | — | $ | 795 | ||||
| Non-cash purchase consideration for an asset acquisition | $ | — | $ | 705,528 | ||||
| Issuance of promissory notes to related parties in connection with loan services provided | $ | 20,524,499 | $ | 15,396,709 | ||||
The accompanying notes are an integral part of these consolidated financial statements.
RECONCILIATION OF GAAP TO NON-GAAP FINANCIAL MEASURES
SBC MEDICAL GROUP HOLDINGS INCORPORATED
Reconciliations of GAAP and Non-GAAP Results
| For the Three Months Ended December 31, | For the Years ended December 31, | |||||||||||||||
| 2024 | 2023 | 2024 | 2023 | |||||||||||||
| Income from operations | $ | 4,717,662 | $ | 23,989,307 | $ | 70,303,710 | 70,660,066 | |||||||||
| Depreciation and amortization expense | 931,596 | 2,558,302 | 3,799,377 | 12,246,942 | ||||||||||||
| Impairment loss | 15,058,965 | - | 15,058,965 | - | ||||||||||||
| EBITDA | 20,708,223 | 26,547,609 | 89,162,052 | 82,907,008 | ||||||||||||
| EBITDA margin | 47 | % | 43 | % | 43 | % | 43 | % | ||||||||
Exhibit 99.2