May 23, 20230001628908false00016289082023-05-232023-05-23
UNITED STATES
SECURITIES AND EXCHANGE COMMISSION
WASHINGTON, D.C. 20549
_________________________
FORM 8-K
_________________________
CURRENT REPORT
Pursuant to Section 13 or 15(d) of
The Securities Exchange Act of 1934
May 23, 2023
Date of Report (Date of earliest event reported)
Evolent Health, Inc.
(Exact name of registrant as specified in its charter)
_________________________
|
|
|
|
|
|
|
|
|
|
|
|
|
|
|
|
|
|
|
|
|
|
|
|
|
|
|
|
|
|
|
|
|
|
Delaware |
|
001-37415 |
|
32-0454912 |
|
|
(State or other jurisdiction of incorporation or organization) |
|
Commission File Number: |
|
(I.R.S. Employer
Identification No.) |
|
|
|
|
|
|
|
|
|
|
|
|
|
800 N. Glebe Road |
, |
Suite 500 |
, |
Arlington |
, |
Virginia |
, |
22203 |
|
|
(Address of principal executive offices)(zip code) |
|
(571) 389-6000
(Registrant’s telephone number, including area code)
Not Applicable
(Former name, former address and former fiscal year, if changed since last report.)
_________________________
Check the appropriate box below if the Form 8-K filing is intended to simultaneously satisfy the filing obligation of the registrant under any of the following provisions:
☐ Written communications pursuant to Rule 425 under the Securities Act (17 CFR 230.425)
☐ Soliciting material pursuant to Rule 14a-12 under the Exchange Act (17 CFR 240.14a-12)
☐ Pre-commencement communications pursuant to Rule 14d-2(b) under the Exchange Act (17 CFR 240.14d-2(b))
☐ Pre-commencement communications pursuant to Rule 13e-4(c) under the Exchange Act (17 CFR 240.13e-4(c))
Securities registered pursuant to Section 12(b) of the Act:
|
|
|
|
|
|
|
|
|
|
|
|
|
|
|
| Title of each class |
|
Trading Symbol(s) |
|
Name of each exchange on which registered |
| Class A Common Stock of Evolent Health, Inc., par value $0.01 per share |
|
EVH |
|
New York Stock Exchange |
Indicate by check mark whether the registrant is an emerging growth company as defined in Rule 405 of the Securities Act of 1933 (§230.405 of this chapter) or Rule 12b-2 of the Securities Exchange Act of 1934 (§240.12b-2 of this chapter).
Emerging growth company ☐
If an emerging growth company, indicate by check mark if the registrant has elected not to use the extended transition period for complying with any new or revised financial accounting standards provided pursuant to Section 13(a) of the Exchange Act.
Item 7.01. Regulation FD Disclosure
On May 23, 2023, Evolent Health, Inc. (the “Company”) posted investor presentation materials that the Company will be presenting at the Company’s Investor Day on the investor relations section of the Company’s website, furnished as Exhibit 99.1 to this Form 8-K and incorporated herein by reference.
The information in this report shall not be deemed “filed” for purposes of Section 18 of the Securities Exchange Act of 1934, as amended (the “Exchange Act”), or incorporated by reference in any filing under the Securities Act of 1933, as amended, or the Exchange Act, except as shall be expressly set forth by specific reference in such filing.
Item 9.01. Financial Statements and Exhibits.
|
|
|
|
|
|
|
|
|
| Exhibit No. |
|
Description |
|
|
|
| 104 |
|
The cover page from this Current Report on Form 8-K, formatted as Inline XBRL |
SIGNATURES
Pursuant to the requirements of the Securities Exchange Act of 1934, the registrant has duly caused this report to be signed on its behalf by the undersigned hereunto duly authorized.
|
|
|
|
|
|
| EVOLENT HEALTH, INC. |
|
|
| By: |
/s/ Jonathan D. Weinberg |
| Name: |
Jonathan D. Weinberg |
| Title: |
General Counsel and Secretary |
Date: May 23, 2023
EX-99.1
2
exhibit991.htm
EX-99.1
exhibit991

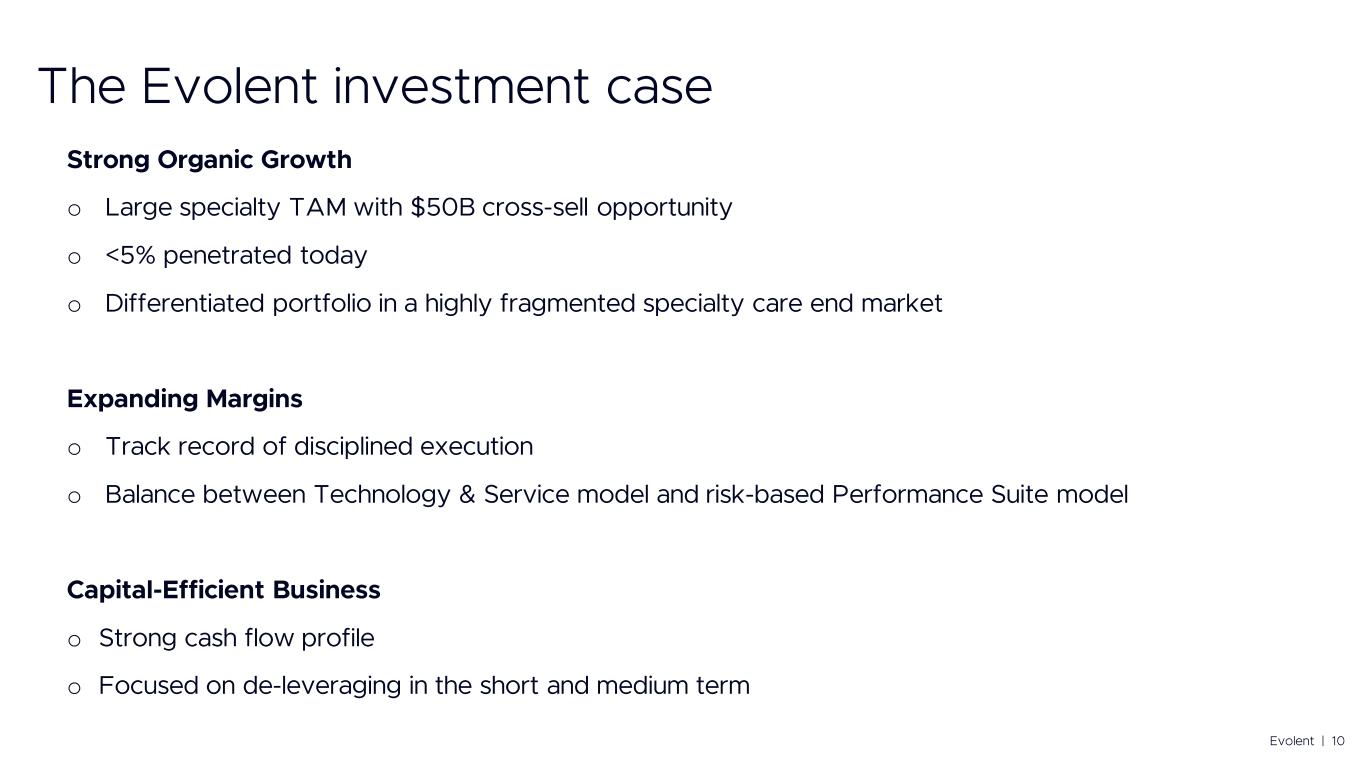
$1.95B 2023 Revenue Outlook at Midpoint 39%1 Revenue CAGR Q4 2019 – Q1 2023 $190M1 2023 Adjusted EBITDA Outlook at Midpoint ~110% Revenue Renewal Rate (2022) $50B Cross-Sell Revenue Opportunity out of $150B Specialty TAM ~5,000 FTE’s Including ~300 MDs and ~1,100 Other Clinicians
o o o o o o o
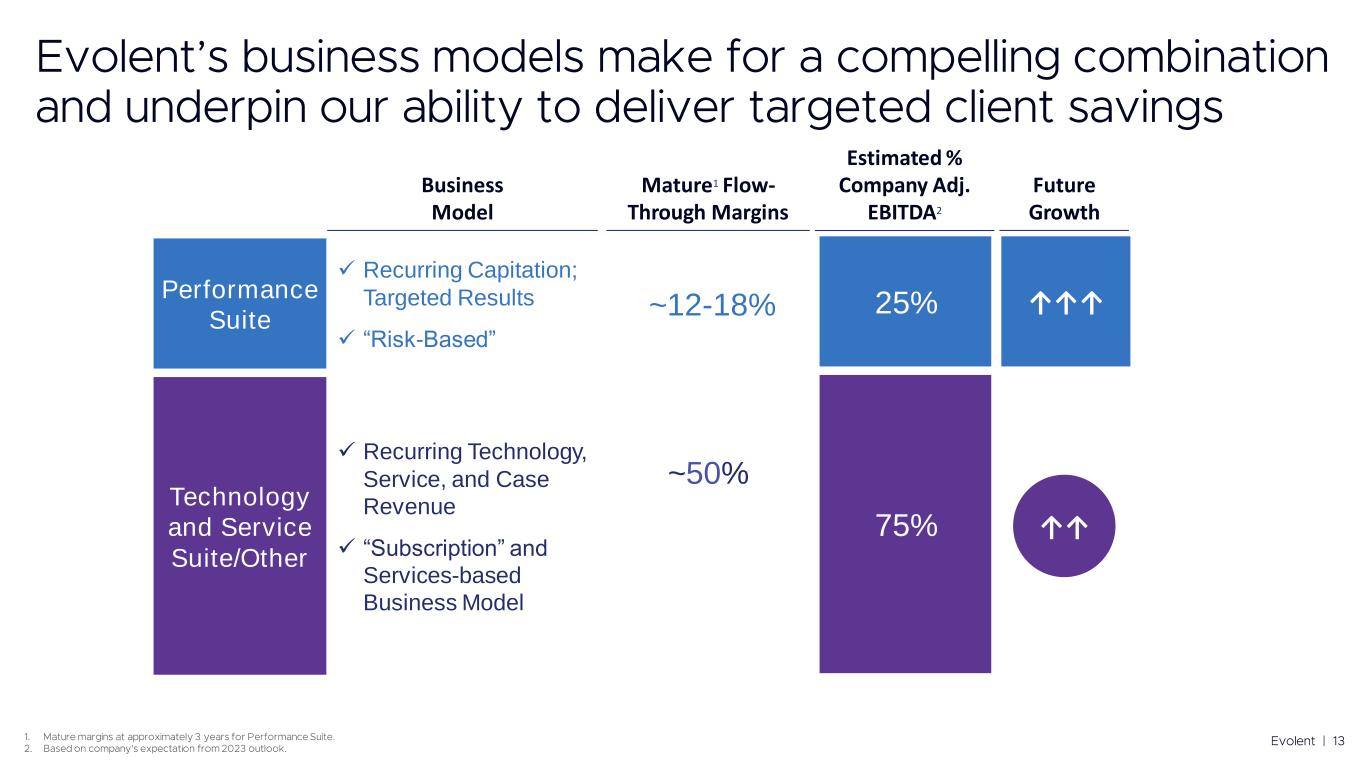
Performance Suite Technology and Service Suite/Other Business Model Mature1 Flow- Through Margins Estimated % Company Adj. EBITDA2 Future Growth ✓ Recurring Capitation; Targeted Results ✓ “Risk-Based” ✓ Recurring Technology, Service, and Case Revenue ✓ “Subscription” and Services-based Business Model ~12-18% ~50% 25% 75% ↑↑↑ ↑↑
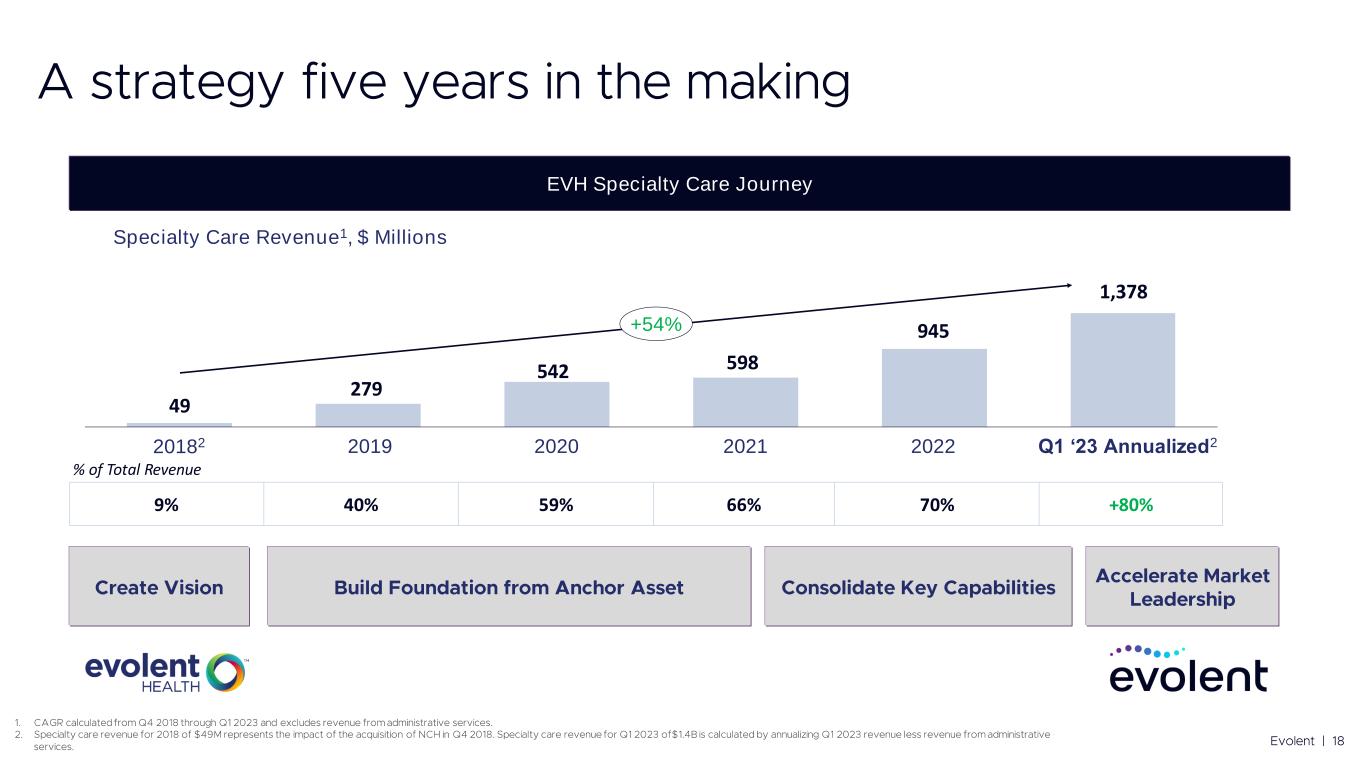
49 279 542 598 945 1,378 Q1 ‘23 Annualized220222019 20212020 +54% Specialty Care Revenue1, $ Millions EVH Specialty Care Journey 9% 40% 59% 66% 70% +80% % of Total Revenue 20182

• • •• • 1 2 3 4 • • •• •

• • • • • • • • • • • • •
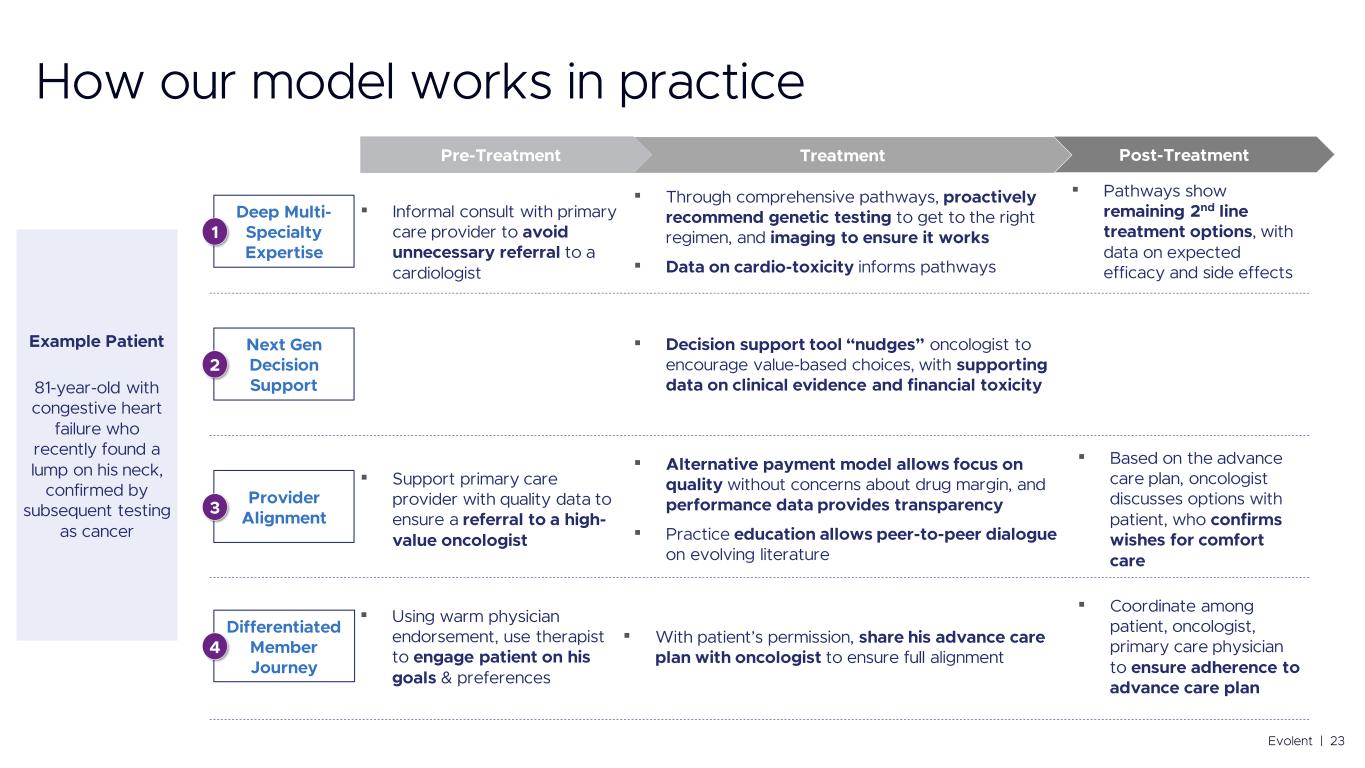
▪ ▪ ▪ ▪ ▪ ▪ ▪ ▪ ▪ ▪ ▪ ▪

• • Q4 2020 Q2 2021 Q4 2021 Q2 2022 Q4 2022 Preferred Pathway Non-Preferred Pathway 6.6 7.7 6.5 7.0 7.5 8.0 8.5 Q1 2020 Q4 2022 Requested AUC Score Approved AUC Score 2019 2020 2021 2022 Total Hip Replacement Total Knee Replacement

▪ ▪ ▪ ▪ ▪ ▪ ▪ ▪ ▪ ▪
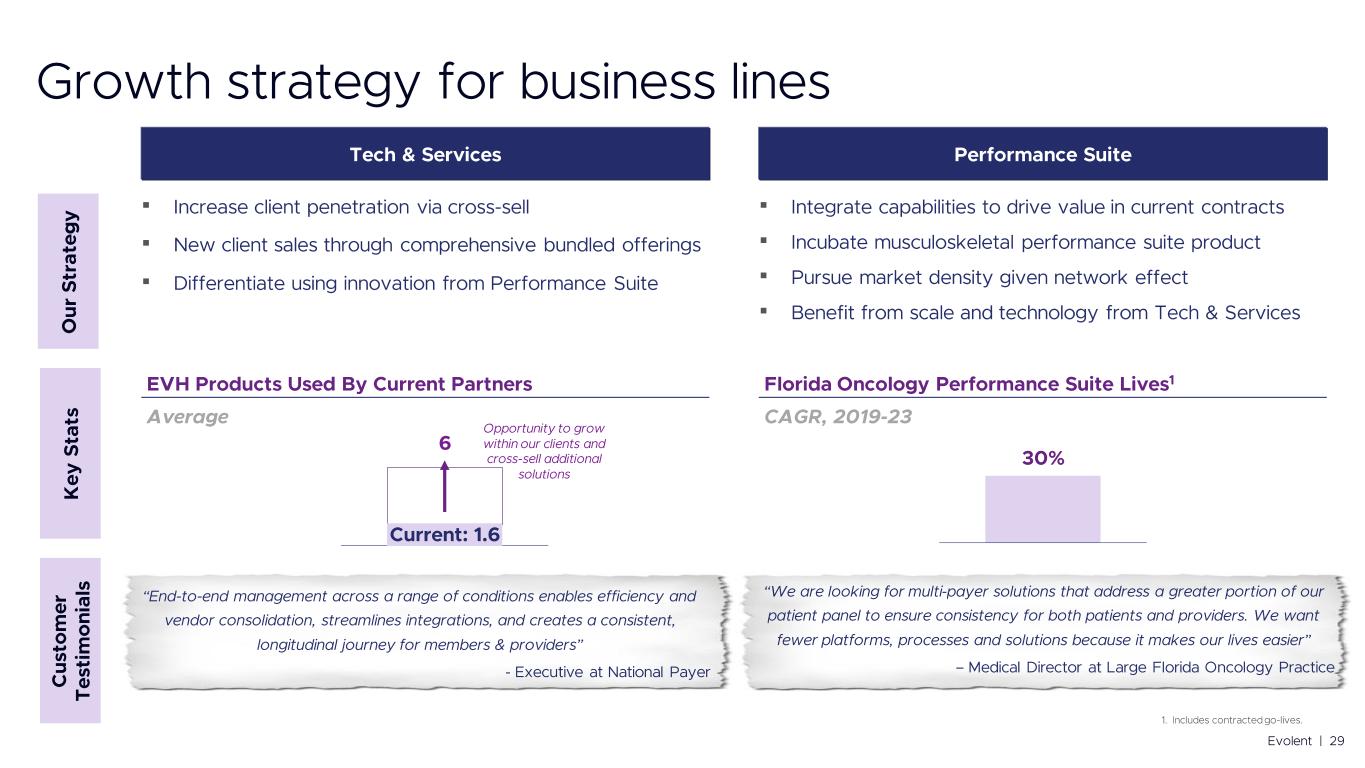
▪ ▪ ▪ ▪ ▪ ▪ ▪

Significant runway in large and growing market with high unmet need Differentiated product portfolio with demonstrated proof points of client value Focused plan to execute against comprehensive growth opportunity
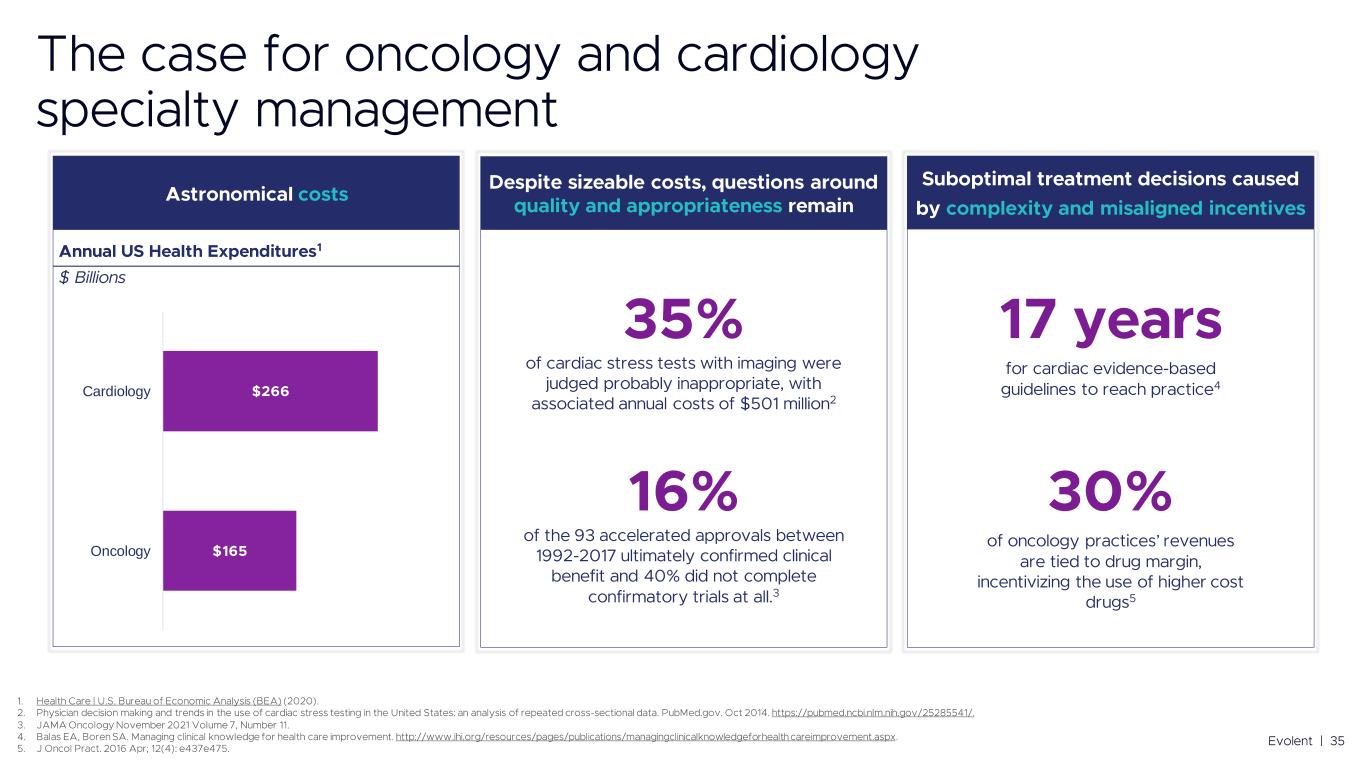
Oncology Cardiology

• • • • • • • • • •
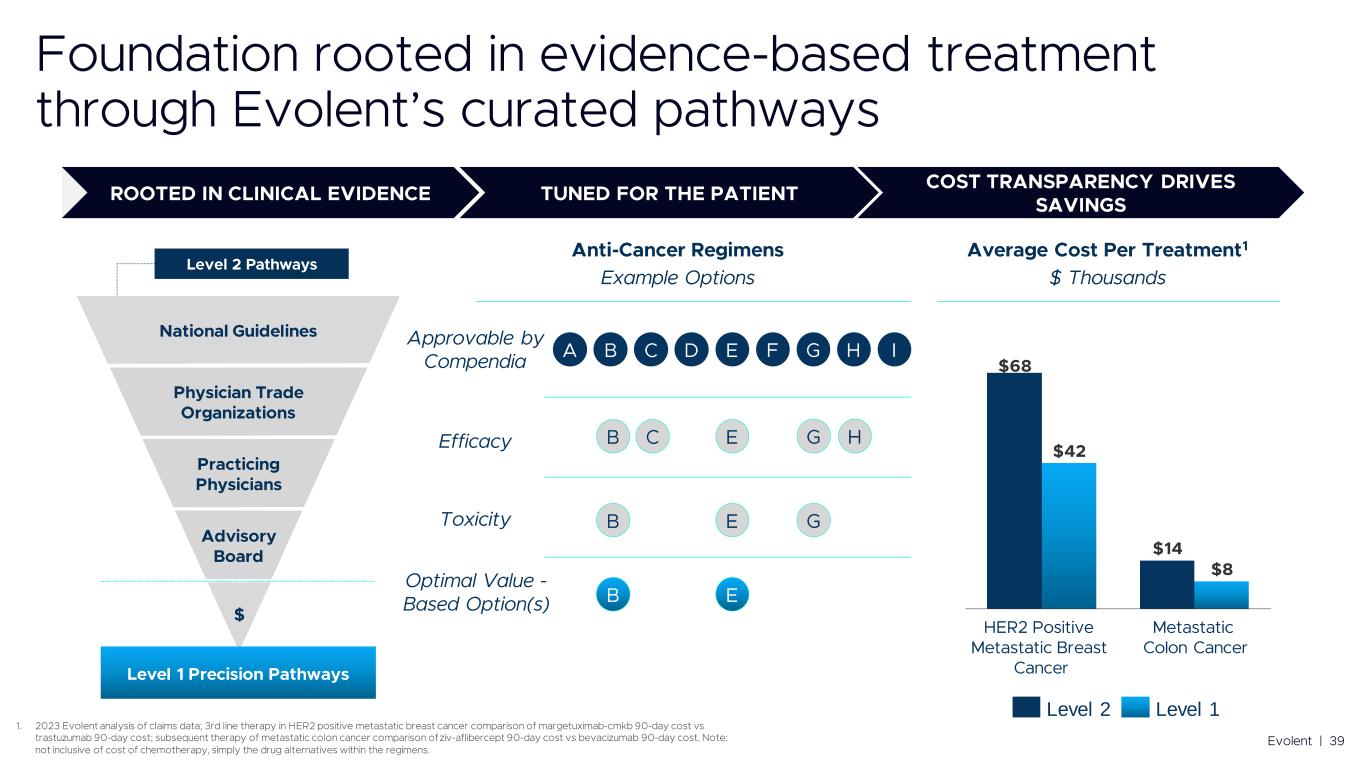
Level 1Level 2

P2P Attempted Not Successful P2P Attempted Successful Outreach Recommend Adverse Determination Approved Withdrawn Cancel Discontinued Forwarded Void

topotecan lurbinectedin Median overall survival, months 8 9 Median progression-free survival, months 4 3.5 Objective remission rate % 30 30 Quarterly cost $620 $42,800
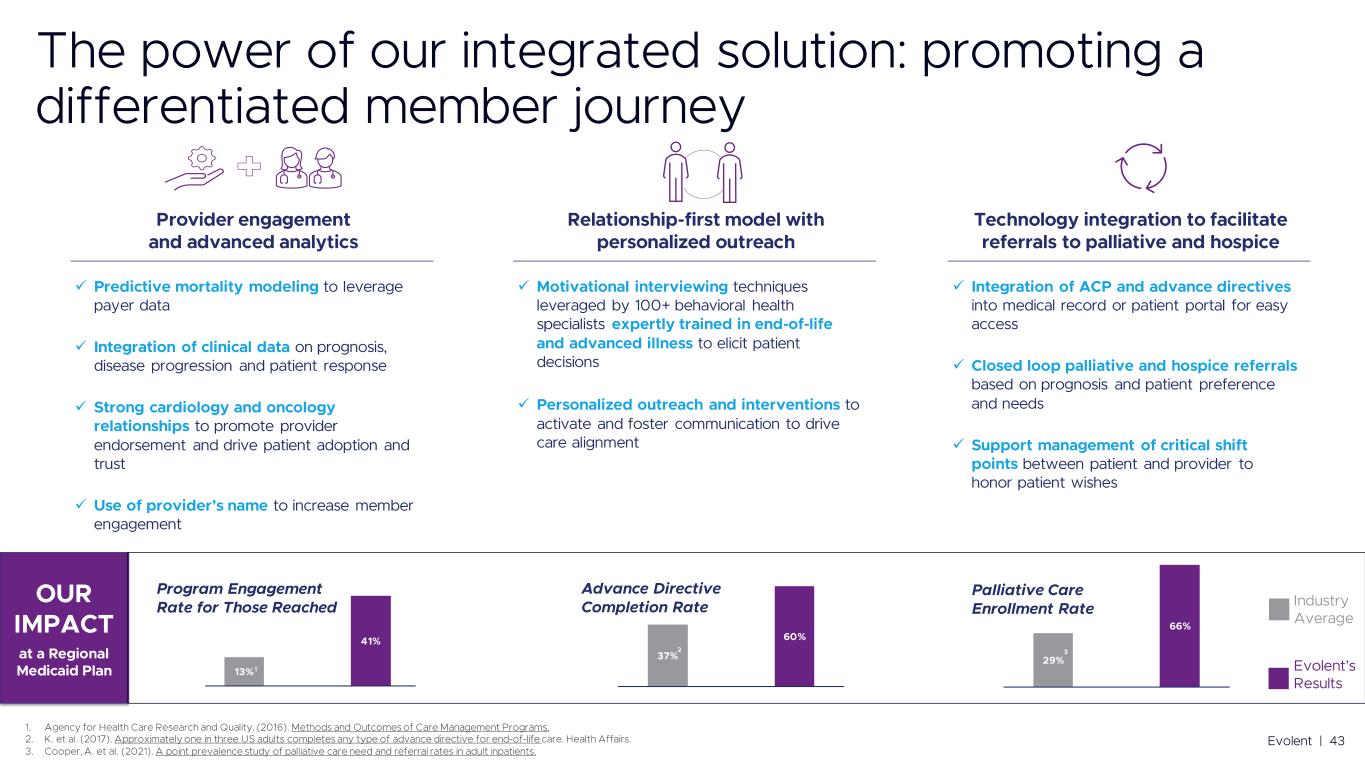
✓ ✓ ✓ ✓ ✓ ✓ ✓ ✓ ✓
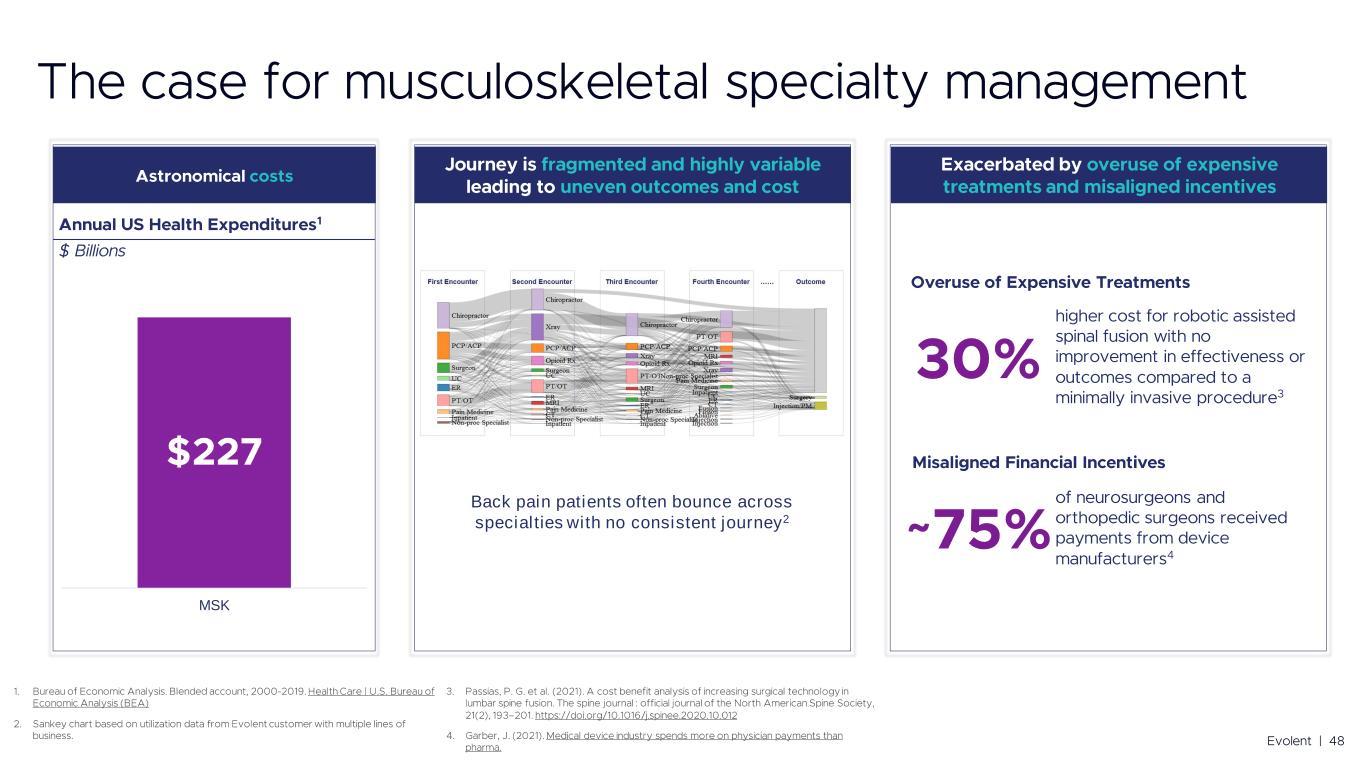
Back pain patients often bounce across specialties with no consistent journey2 MSK

• • • • • • • • • •

1 2 3 4
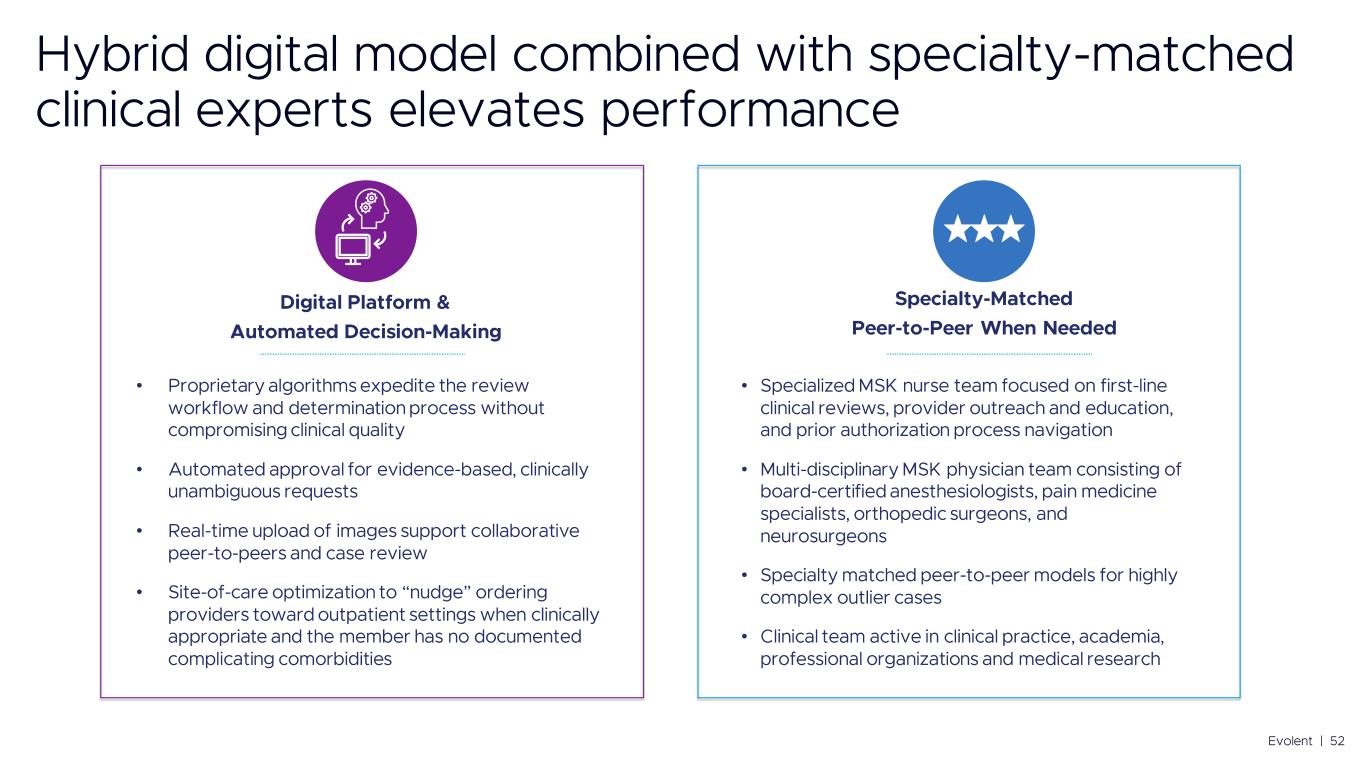
• • • • • • • •
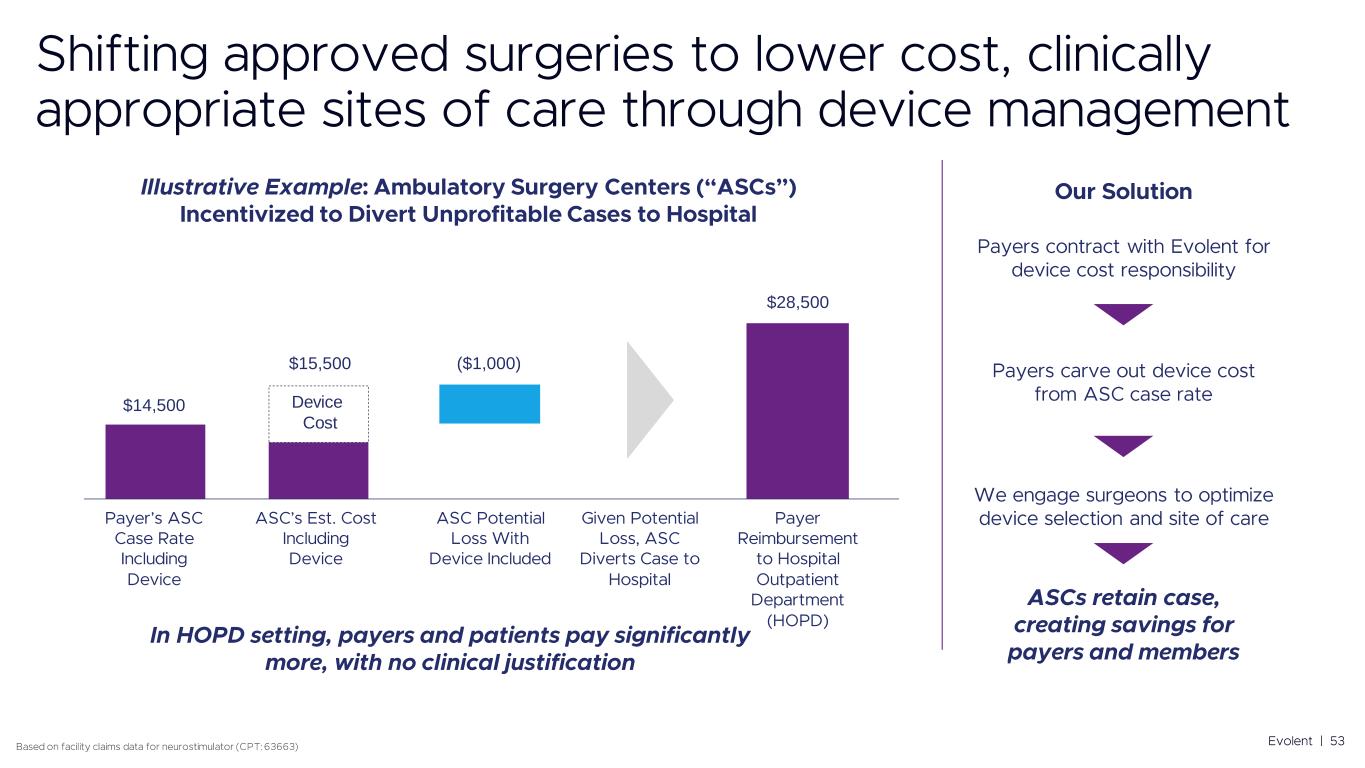
$14,500 $15,500 Device Cost ($1,000) $28,500
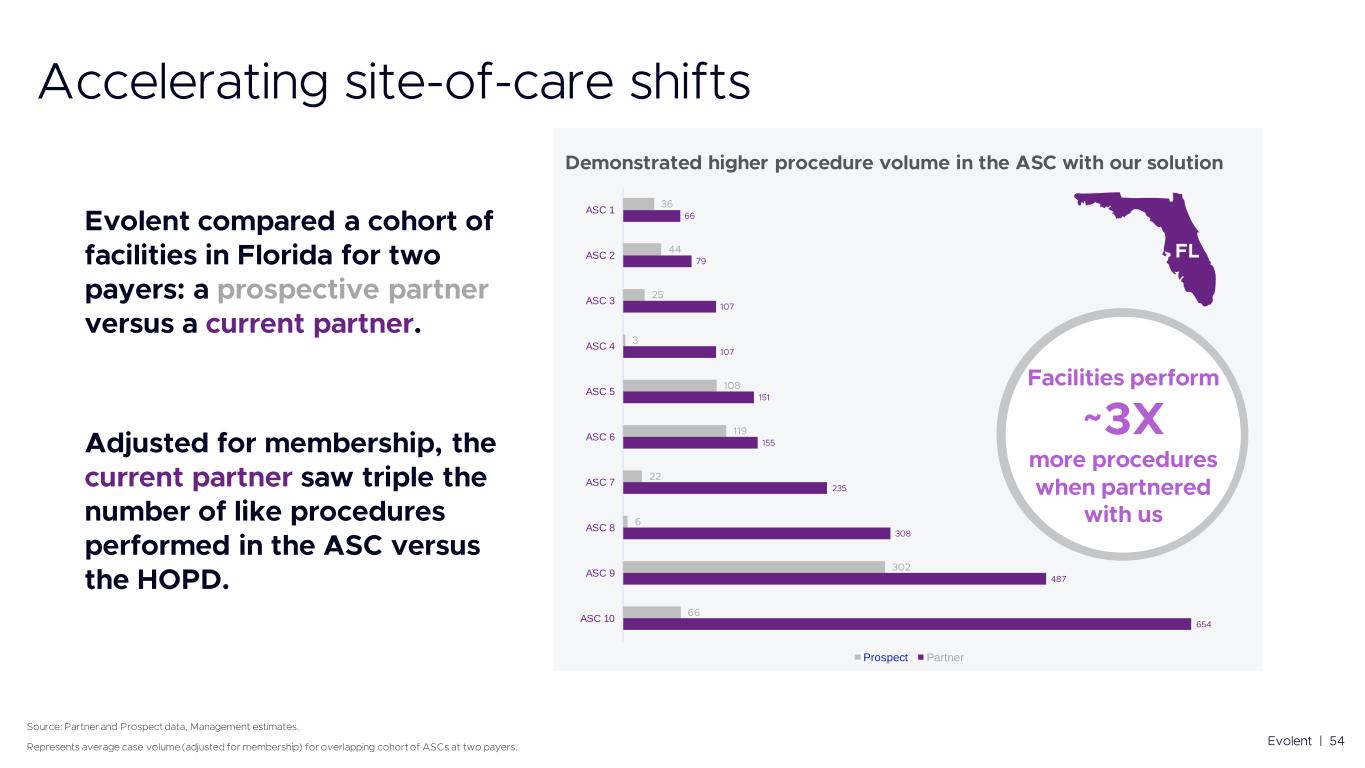
ASC 10 ASC 9 ASC 8 ASC 7 ASC 6 ASC 5 ASC 4 ASC 3 ASC 2 ASC 1 Prospect Partner

Unique ability to address both avoidable and necessary procedure spend Promoting transparency to optimize device selection decision-making Multiple points of entry to manage MSK

Provider Alignment Next Gen Decision Support Differentiated Member Journey Oncology Cardiology MSK Radiology Genetic Testing Configurable Technology and Administrative Platform Actionable Analytics and Integration End-of-Life Deep Multi- Specialty Expertise Complex Care1 2 3 4
• • • ✓ • • • ✓ • ✓ • • • • •

Headquarters: Pune, India Existing Capabilities • Back-end Administrative Operations (Claims, Enrollment, Provider Data, Workforce Management, Testing/Quality, Implementation) • IT Operations (Data/Production Operations, Technical Support, Corporate Infrastructure) • Product & Engineering (RPA, Prod Dev & Mgt, Quality Automation) Headquarters: Manila, Philippines Existing Capabilities • Customer Service • Clinical Operations (Intake, Clinical Reviews, Appeals) • We have scale: Our global team represent ~25% of our total workforce; all Evolent-badged employees • Lowers our cost to deliver: Significant labor arbitrage • Drives increased service level: Enables 24x7 operations and unlocks access to highly skilled talent Large opportunity to expand global footprint to the specialty business; expansion efforts are underway in both India and the Philippines
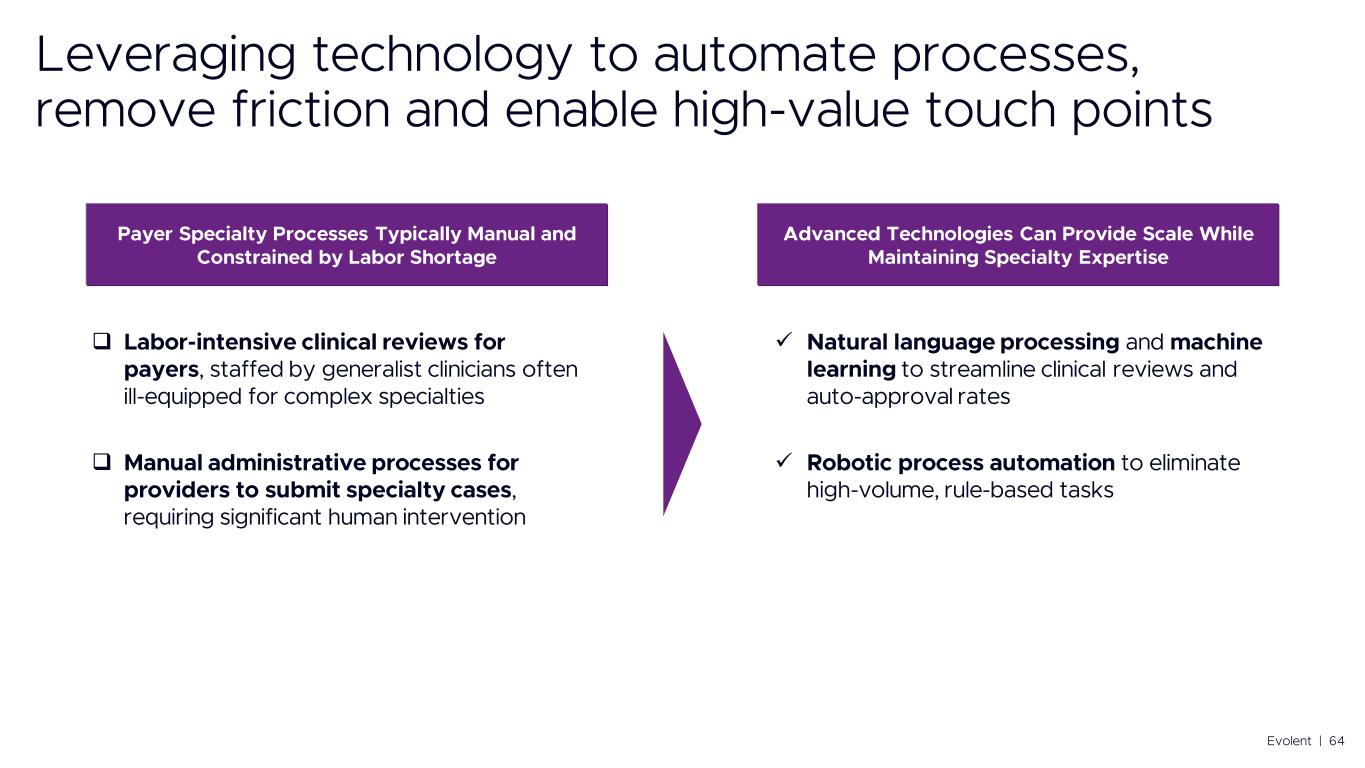
❑ ❑ ✓ ✓

• ▪ • • • •
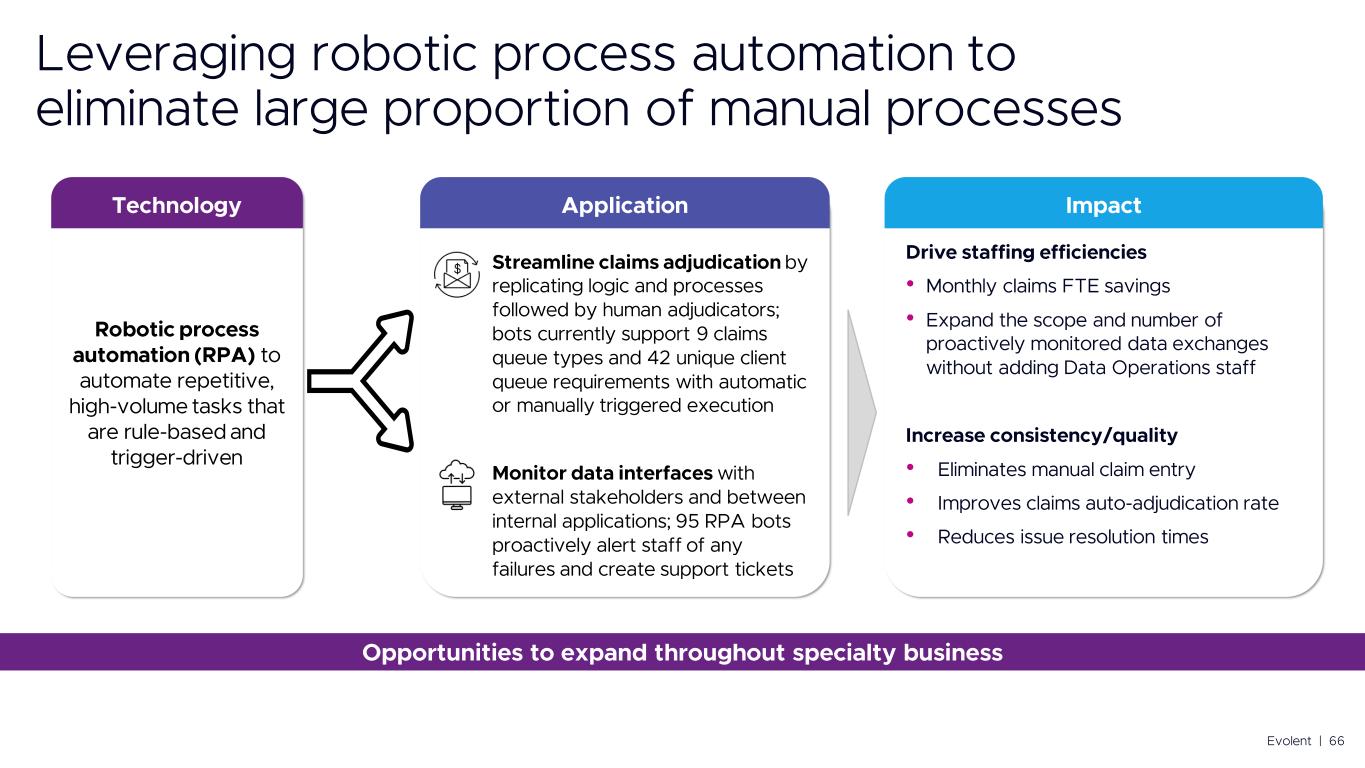
• • • • •

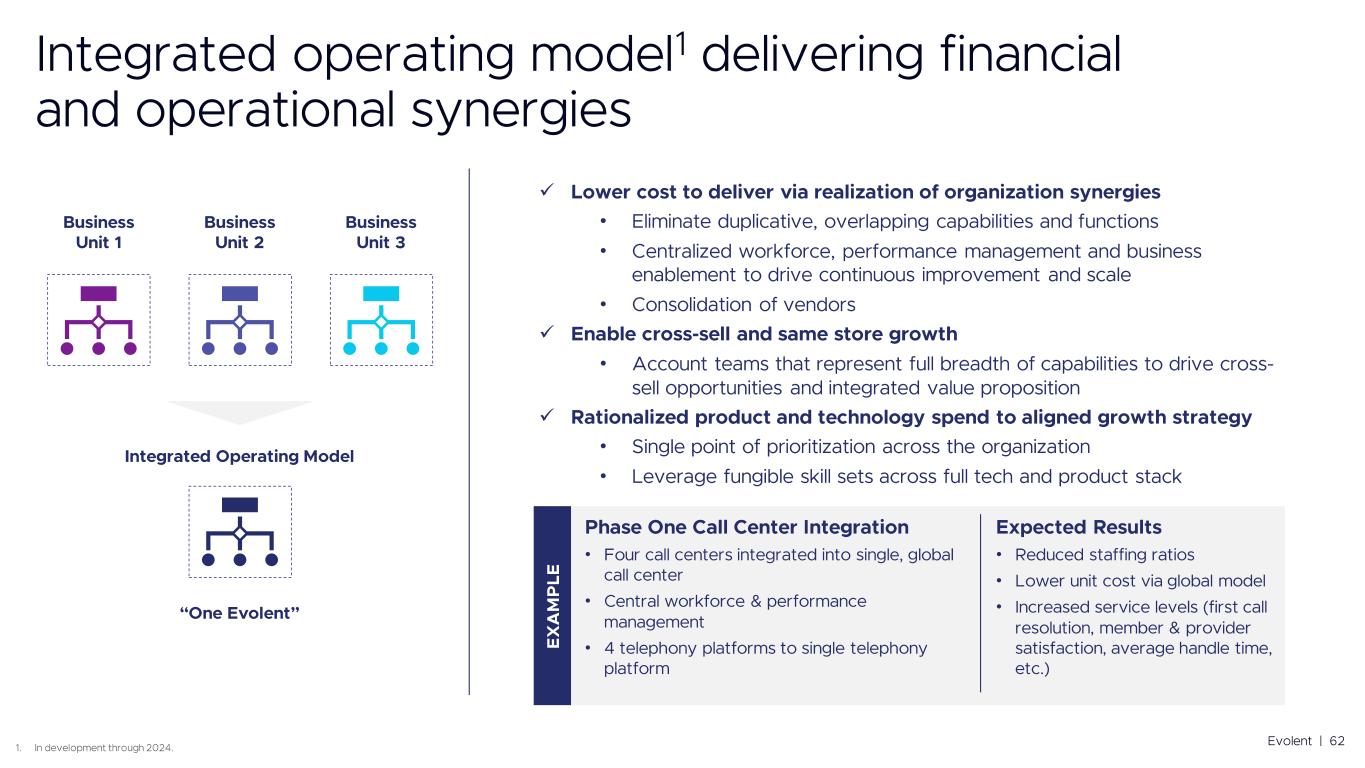
One Evolent with the goal of delivering operational and financial synergies Significant opportunity to leverage automation and global scale Deep bench of operational and technology expertise

5

Challenges • • • • • 80% 87% 83%

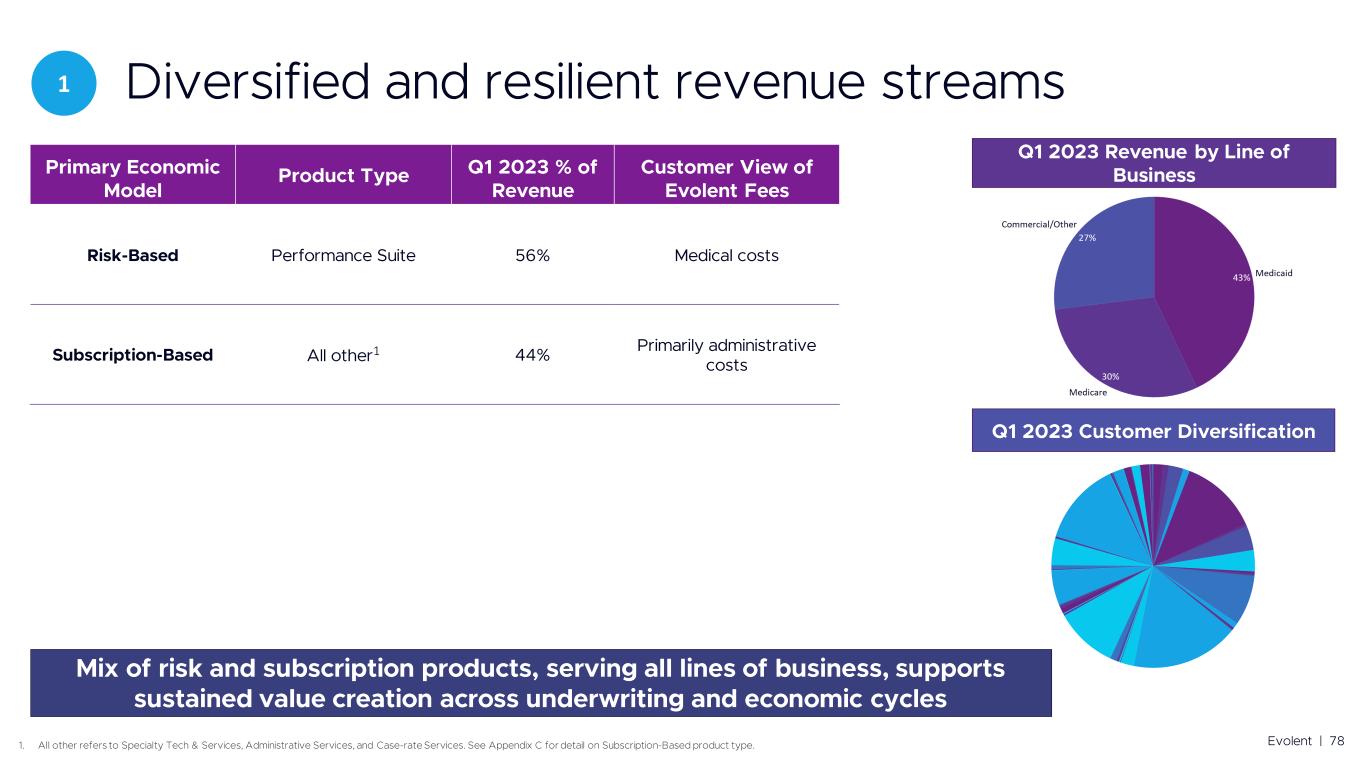
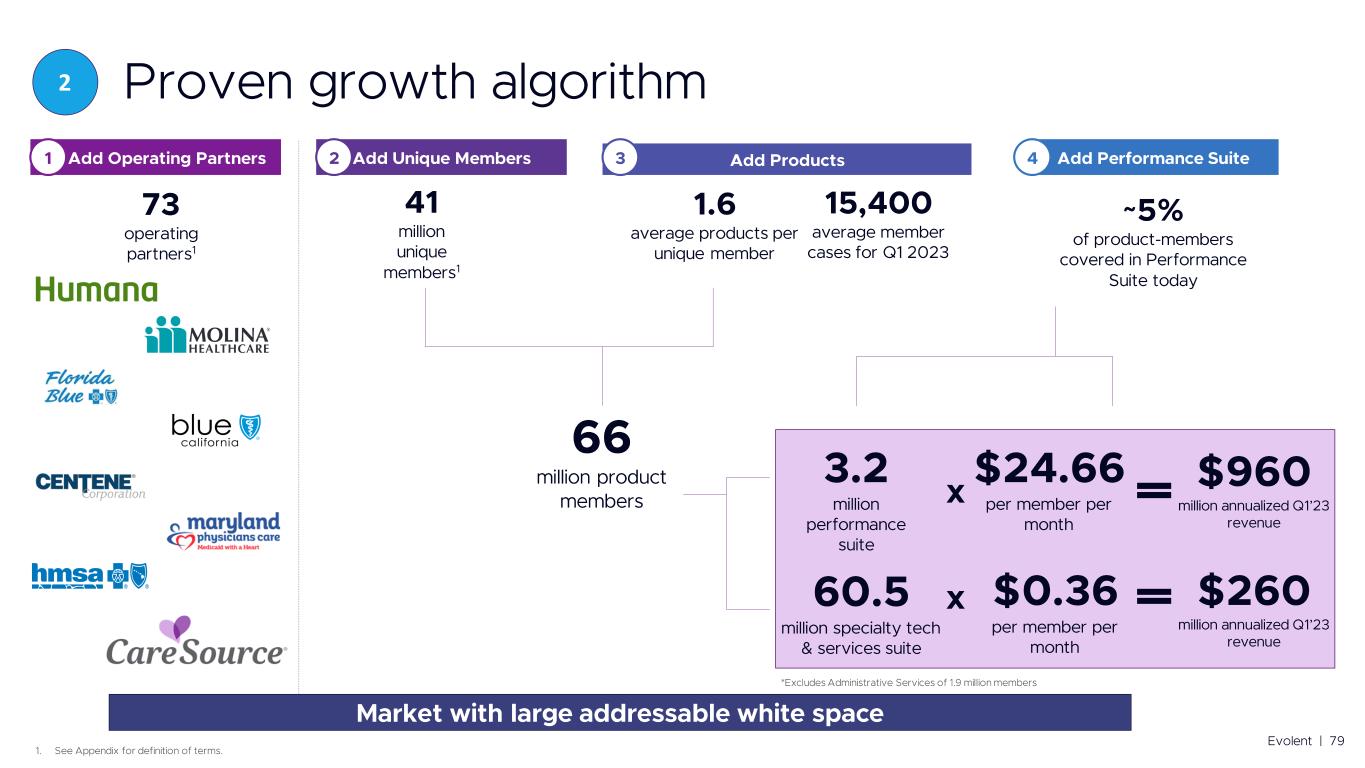
Diversified and resilient revenue streams Proven growth algorithm Attractive gross margin profiles enable sustained earnings growth Capital-light model with clear capital allocation priorities 1 2 3 4
1 1
2

✓ ✓ ✓ 2
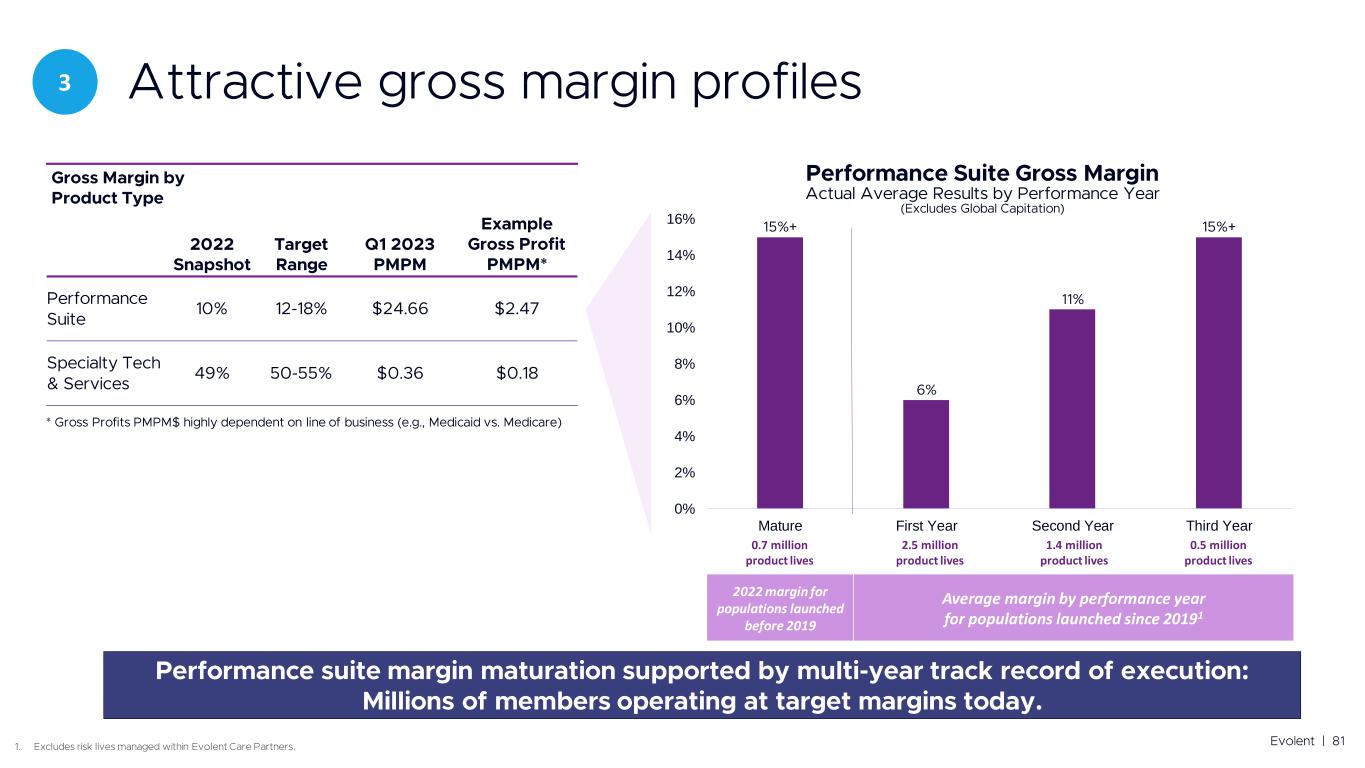
2022 margin for populations launched before 2019 Average margin by performance year for populations launched since 20191 0% 2% 4% 6% 8% 10% 12% 14% 16% Mature First Year Second Year Third Year 0.7 million product lives 2.5 million product lives 1.4 million product lives 0.5 million product lives 3

✓ ✓ ✓ ✓ ✓ 3
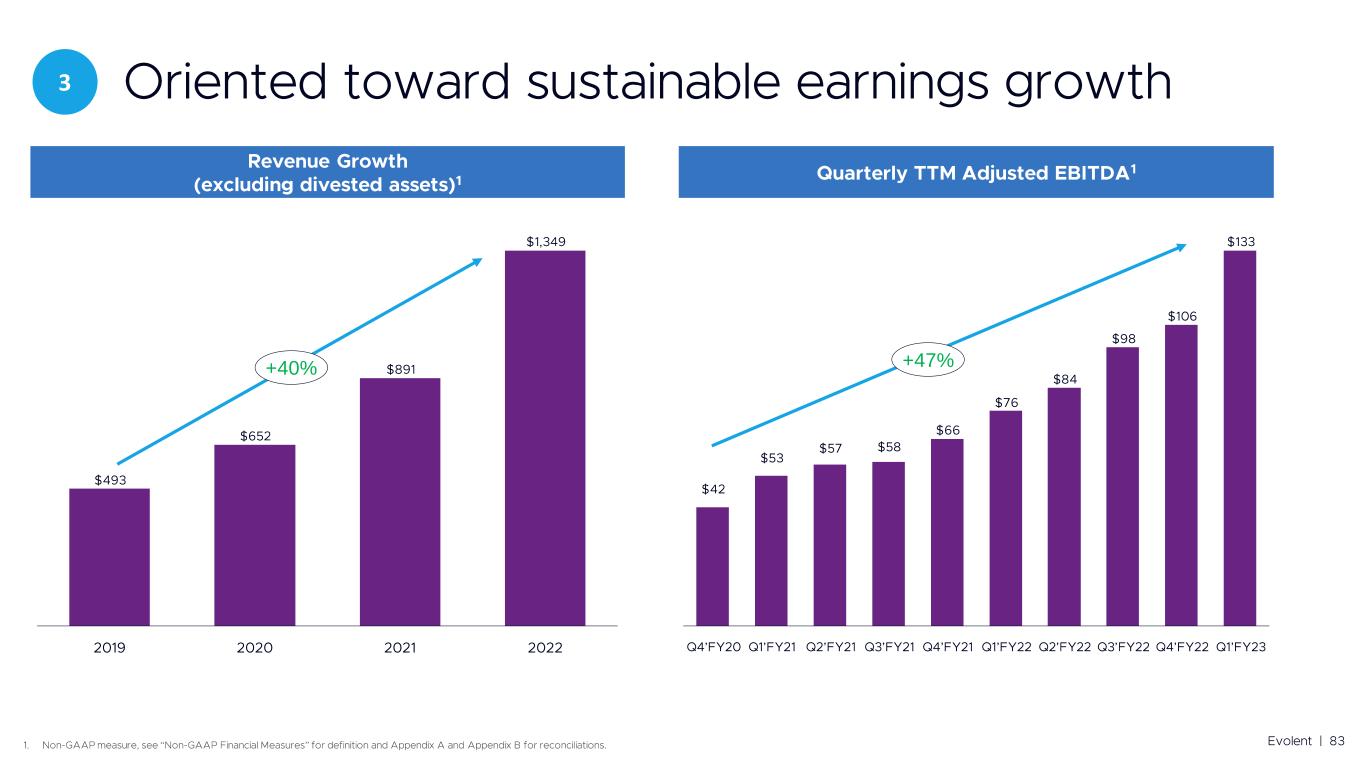
3 +40% +47%

0 20 40 60 80 100 120 140 Adj. EBITDA1 Cash Interest Other Operating Cash Flows including Working Capital Federal Taxes Operating Cashflow Final Reported operating cashflow Operating cash deployed in acquisitions and severance1 $75 56% of Adj EBITDA 4

• • • • • ✓ ✓ ✓ 4

2022 Adjusted EBITDA Acquired Adjusted EBITDA (fully synergized) Performance Suite Maturation by EOY 2024 Line of Sight Before Net New Growth Target Adjusted EBITDA from Net New Growth by EOY 2024 Exit 2024 Target
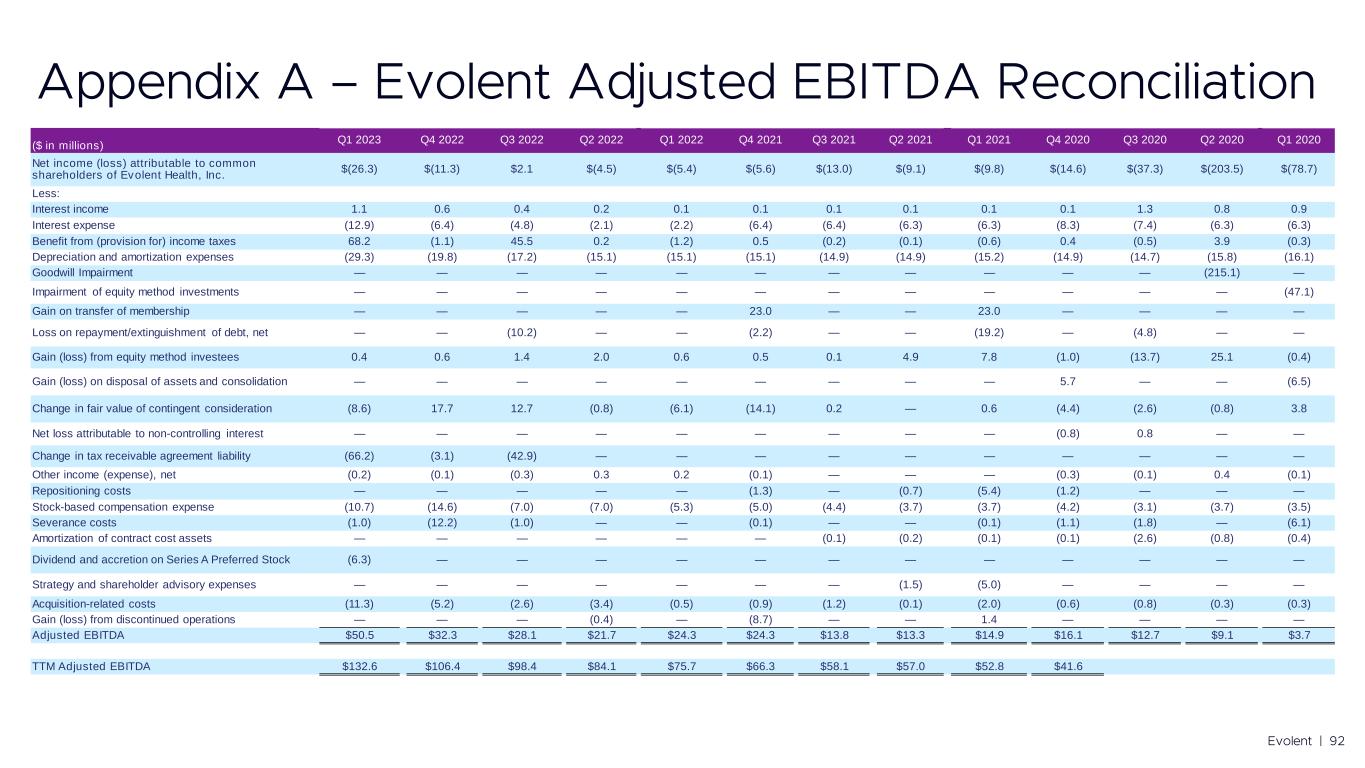
($ in millions) Q1 2023 Q4 2022 Q3 2022 Q2 2022 Q1 2022 Q4 2021 Q3 2021 Q2 2021 Q1 2021 Q4 2020 Q3 2020 Q2 2020 Q1 2020 Net income (loss) attributable to common shareholders of Evolent Health, Inc. $(26.3) $(11.3) $2.1 $(4.5) $(5.4) $(5.6) $(13.0) $(9.1) $(9.8) $(14.6) $(37.3) $(203.5) $(78.7) Less: Interest income 1.1 0.6 0.4 0.2 0.1 0.1 0.1 0.1 0.1 0.1 1.3 0.8 0.9 Interest expense (12.9) (6.4) (4.8) (2.1) (2.2) (6.4) (6.4) (6.3) (6.3) (8.3) (7.4) (6.3) (6.3) Benefit from (provision for) income taxes 68.2 (1.1) 45.5 0.2 (1.2) 0.5 (0.2) (0.1) (0.6) 0.4 (0.5) 3.9 (0.3) Depreciation and amortization expenses (29.3) (19.8) (17.2) (15.1) (15.1) (15.1) (14.9) (14.9) (15.2) (14.9) (14.7) (15.8) (16.1) Goodwill Impairment — — — — — — — — — — — (215.1) — Impairment of equity method investments — — — — — — — — — — — — (47.1) Gain on transfer of membership — — — — — 23.0 — — 23.0 — — — — Loss on repayment/extinguishment of debt, net — — (10.2) — — (2.2) — — (19.2) — (4.8) — — Gain (loss) from equity method investees 0.4 0.6 1.4 2.0 0.6 0.5 0.1 4.9 7.8 (1.0) (13.7) 25.1 (0.4) Gain (loss) on disposal of assets and consolidation — — — — — — — — — 5.7 — — (6.5) Change in fair value of contingent consideration (8.6) 17.7 12.7 (0.8) (6.1) (14.1) 0.2 — 0.6 (4.4) (2.6) (0.8) 3.8 Net loss attributable to non-controlling interest — — — — — — — — — (0.8) 0.8 — — Change in tax receivable agreement liability (66.2) (3.1) (42.9) — — — — — — — — — — Other income (expense), net (0.2) (0.1) (0.3) 0.3 0.2 (0.1) — — — (0.3) (0.1) 0.4 (0.1) Repositioning costs — — — — — (1.3) — (0.7) (5.4) (1.2) — — — Stock-based compensation expense (10.7) (14.6) (7.0) (7.0) (5.3) (5.0) (4.4) (3.7) (3.7) (4.2) (3.1) (3.7) (3.5) Severance costs (1.0) (12.2) (1.0) — — (0.1) — — (0.1) (1.1) (1.8) — (6.1) Amortization of contract cost assets — — — — — — (0.1) (0.2) (0.1) (0.1) (2.6) (0.8) (0.4) Dividend and accretion on Series A Preferred Stock (6.3) — — — — — — — — — — — — Strategy and shareholder advisory expenses — — — — — — — (1.5) (5.0) — — — — Acquisition-related costs (11.3) (5.2) (2.6) (3.4) (0.5) (0.9) (1.2) (0.1) (2.0) (0.6) (0.8) (0.3) (0.3) Gain (loss) from discontinued operations — — — (0.4) — (8.7) — — 1.4 — — — — Adjusted EBITDA $50.5 $32.3 $28.1 $21.7 $24.3 $24.3 $13.8 $13.3 $14.9 $16.1 $12.7 $9.1 $3.7 TTM Adjusted EBITDA $132.6 $106.4 $98.4 $84.1 $75.7 $66.3 $58.1 $57.0 $52.8 $41.6
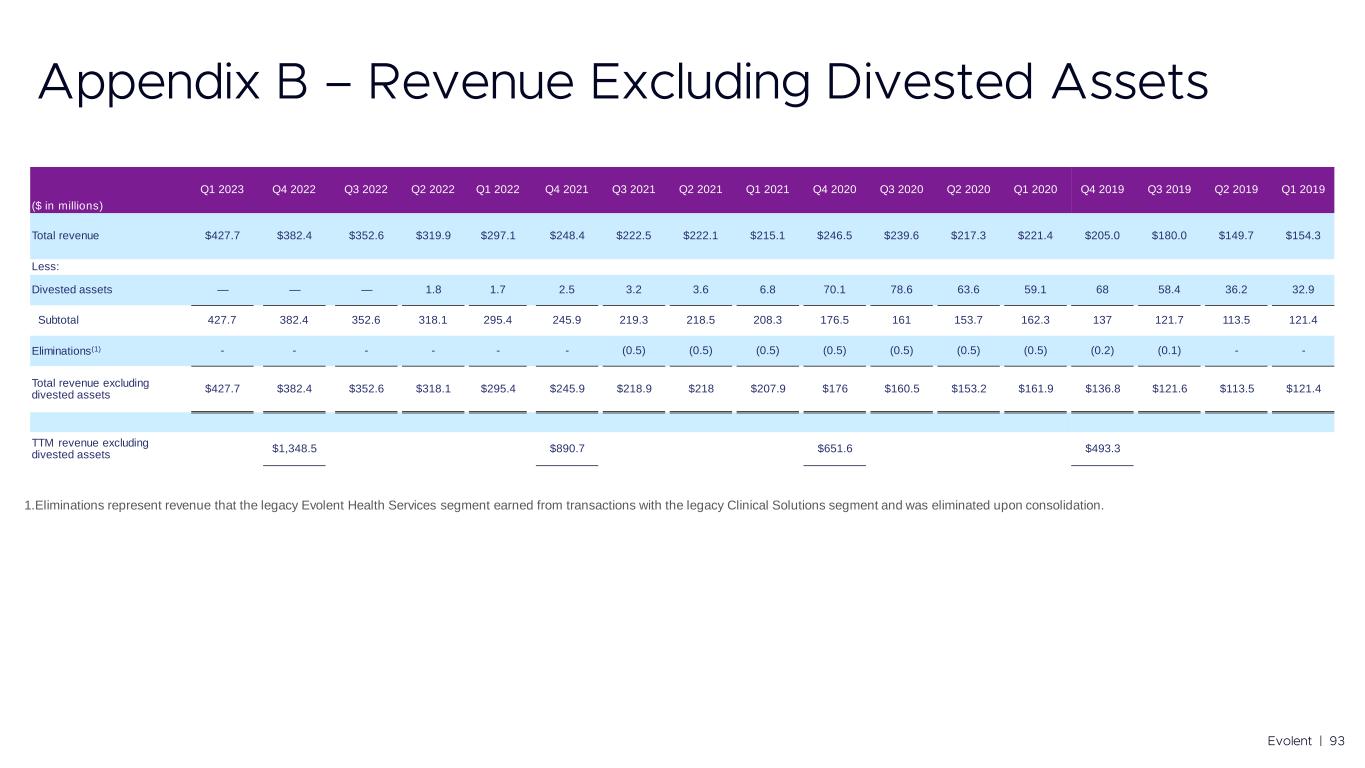
1.Eliminations represent revenue that the legacy Evolent Health Services segment earned from transactions with the legacy Clinical Solutions segment and was eliminated upon consolidation. ($ in millions) Q1 2023 Q4 2022 Q3 2022 Q2 2022 Q1 2022 Q4 2021 Q3 2021 Q2 2021 Q1 2021 Q4 2020 Q3 2020 Q2 2020 Q1 2020 Q4 2019 Q3 2019 Q2 2019 Q1 2019 Total revenue $427.7 $382.4 $352.6 $319.9 $297.1 $248.4 $222.5 $222.1 $215.1 $246.5 $239.6 $217.3 $221.4 $205.0 $180.0 $149.7 $154.3 Less: Divested assets — — — 1.8 1.7 2.5 3.2 3.6 6.8 70.1 78.6 63.6 59.1 68 58.4 36.2 32.9 Subtotal 427.7 382.4 352.6 318.1 295.4 245.9 219.3 218.5 208.3 176.5 161 153.7 162.3 137 121.7 113.5 121.4 Eliminations(1) - - - - - - (0.5) (0.5) (0.5) (0.5) (0.5) (0.5) (0.5) (0.2) (0.1) - - Total revenue excluding divested assets $427.7 $382.4 $352.6 $318.1 $295.4 $245.9 $218.9 $218 $207.9 $176 $160.5 $153.2 $161.9 $136.8 $121.6 $113.5 $121.4 TTM revenue excluding divested assets $1,348.5 $890.7 $651.6 $493.3


