株探米国株
エドガーで原本を確認する
6-K 1 form6-kquarterlyfilings.htm 6-K Document

SECURITIES AND EXCHANGE COMMISSION
Washington, D.C. 20549
______________________

FORM 6-K

REPORT OF FOREIGN PRIVATE ISSUER
PURSUANT TO RULE 13a-16 OR 15d-16
OF THE SECURITIES EXCHANGE ACT OF 1934
For October 14, 2026

Commission File Number 001-33463

______________________

ASML Holding N.V.

De Run 6501
5504 DR Veldhoven
The Netherlands
(Address of principal executive offices)
______________________

Indicate by check mark whether the registrant files or will file annual reports under cover of Form 20-F or Form 40-F.

Form 20-F x Form 40-F ¨

Indicate by check mark if the registrant is submitting the Form 6-K on paper as permitted by Regulation S-T Rule 101(b)(1): ¨

Indicate by check mark if the registrant is submitting the Form 6-K on paper as permitted by Regulation S-T Rule 101(b)(7): ¨


EXHIBITS 99.1 AND 99.3 TO THIS REPORT ON FORM 6-K ARE INCORPORATED BY REFERENCE IN THE REGISTRATION STATEMENT ON FORM S-8 (FILE NO. 333-203390), THE REGISTRATION STATEMENT ON FORM S-8 (FILE NO. 333-219442), THE REGISTRATION STATEMENT ON FORM S-8 (FILE NO. 333-227464) AND THE REGISTRATION STATEMENT ON FORM S-8 (FILE NO. 333-291580) OF ASML HOLDING N.V. AND IN THE OUTSTANDING PROSPECTUSES CONTAINED IN SUCH REGISTRATION STATEMENTS.


Exhibits                                 logo6ka.jpg

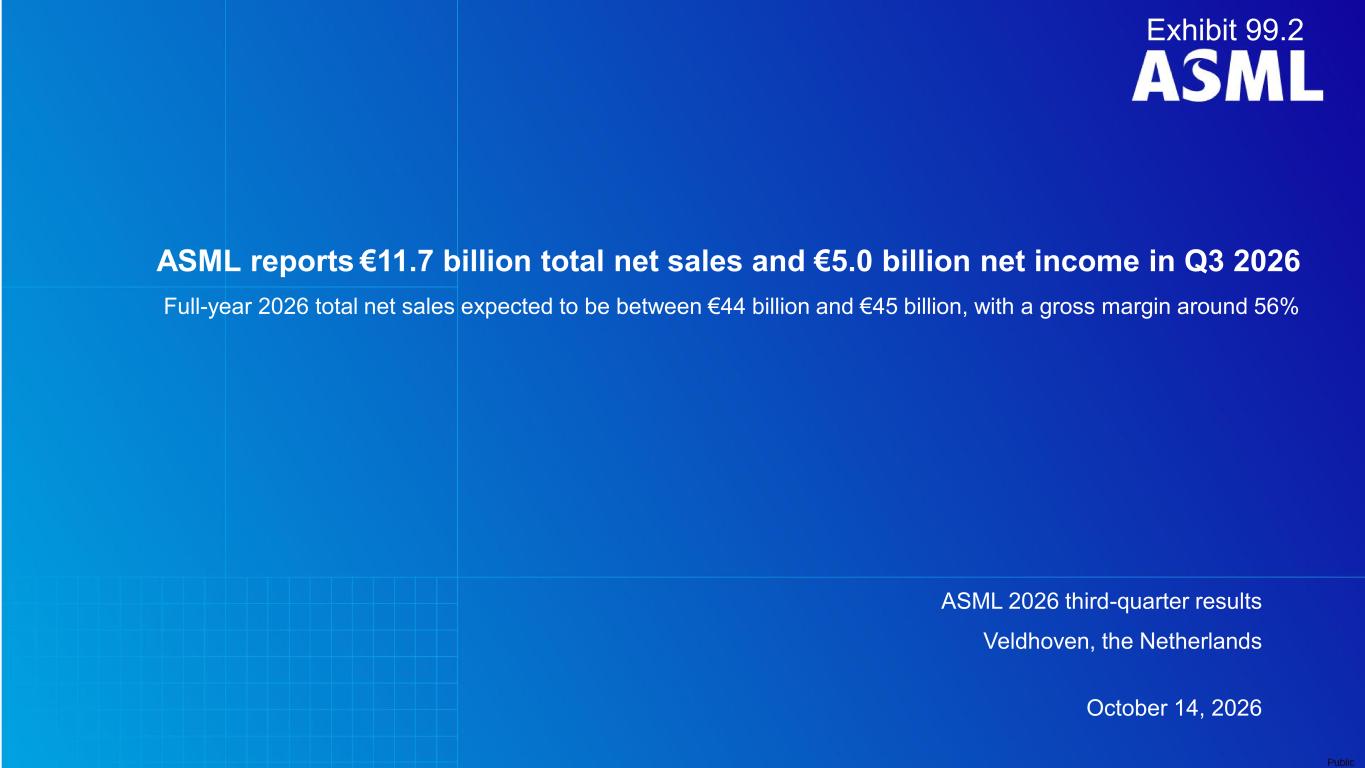
99.1    “ASML reports €11.7 billion total net sales and €5.0 billion net income in Q3 2026. Full-year 2026 total net sales expected to be between €44 billion and €45 billion, with a gross margin around 56%", press release dated October 14, 2026

99.2    “ASML reports €11.7 billion total net sales and €5.0 billion net income in Q3 2026. Full-year 2026 total net sales expected to be between €44 billion and €45 billion, with a gross margin around 56%", presentation dated October 14, 2026
99.3    Summary US GAAP Consolidated Financial Statements


SIGNATURES

Pursuant to the requirements of the Securities Exchange Act of 1934, the registrant has duly caused this report to be signed on its behalf by the undersigned, thereunto duly authorized.

    ASML HOLDING N.V. (Registrant)

Date: October 14, 2026    By:    /s/ Christophe D. Fouquet
        Christophe D. Fouquet
        Chief Executive Officer


EX-99.1 2 pressreleasefinancialresul.htm EX-99.1 Document
Exhibit 99.1
ASML reports €11.7 billion total net sales and €5.0 billion net income in Q3 2026
Full-year 2026 total net sales expected to be between €44 billion and €45 billion, with a gross margin around 56%

VELDHOVEN, the Netherlands, October 14, 2026 – Today, ASML Holding NV (ASML) has published its 2026 third-quarter results.

•Q3 total net sales of €11.7 billion, gross margin of 57.5%, net income of €5.0 billion
•ASML expects Q4 2026 total net sales between €14.2 billion and €15.2 billion, and a gross margin around 57%
•Full-year 2026 total net sales expected to be between €44 billion and €45 billion, with a gross margin around 56%


(Figures in millions of euros unless otherwise indicated) Q2 2026 Q3 2026
Total net sales
9,326 11,662
...of which Installed Base Management sales1
2,762 3,289
New lithography systems sold (units) 86 113
Used lithography systems sold (units) 5 8
Gross profit 5,035 6,700
Gross margin (%) 54.0 57.5
Net income 2,918 4,960
EPS (basic; in euros) 7.59 12.95
End-quarter cash and cash equivalents and short-term investments 7,582 12,735
Numbers have been rounded for readers' convenience. A complete summary of US GAAP Consolidated Statements of Operations is published on www.asml.com.

CEO statement and outlook
"In the third quarter we reported a record total net sales of €11.7 billion, towards the high end of our guidance, reflecting the strong execution of our ramp-up. Installed Base Management sales1 came in above guidance at €3.3 billion as a result of the continued strong demand for productivity upgrades. This drove the gross margin above guidance at 57.5%.
"Our customers continue to increase their short- and medium-term equipment demand forecasts with us, driven primarily by their views on the size and duration of AI-related investments. In light of their demand visibility, some customers are expressing an interest in placing orders with us for 2029 and even 2030.
"With such strong visibility and an order book momentum that continues to increase quarter on quarter this year, we now expect that our supply as currently planned for both 2027 and 2028 will not fully meet the demand of our customers2. Given this, we are investigating ways to increase capacity for 2028 beyond the 30% increase we previously communicated. In addition, we continue to provide significant wafer capacity to our customers through our productivity upgrade portfolio.
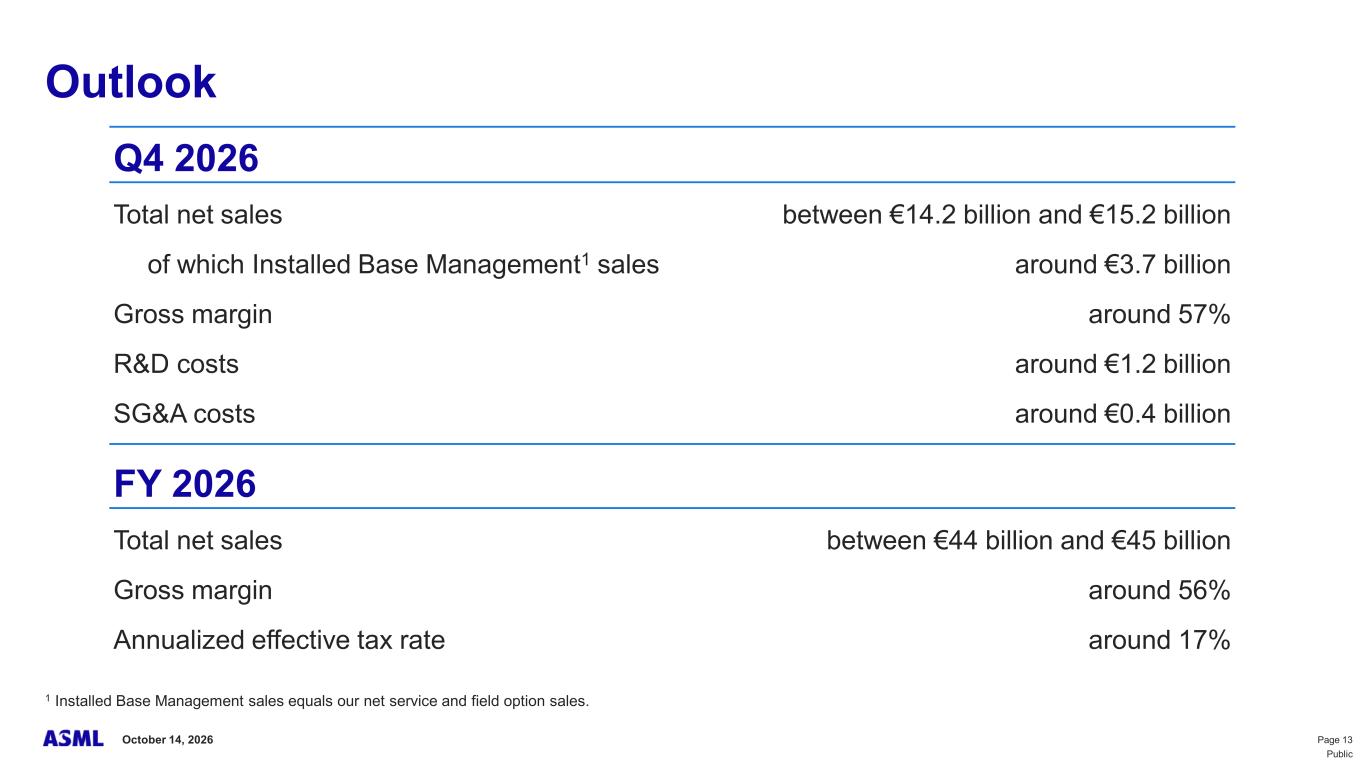
"We expect fourth-quarter 2026 total net sales between €14.2 billion and €15.2 billion, with a gross margin around 57%. We expect R&D costs of around €1.2 billion and SG&A costs of around €0.4 billion. We expect total net sales for 2026 to be between €44 billion and €45 billion, with a gross margin around 56%," said ASML President and Chief Executive Officer Christophe Fouquet.


Update share buyback program and dividend
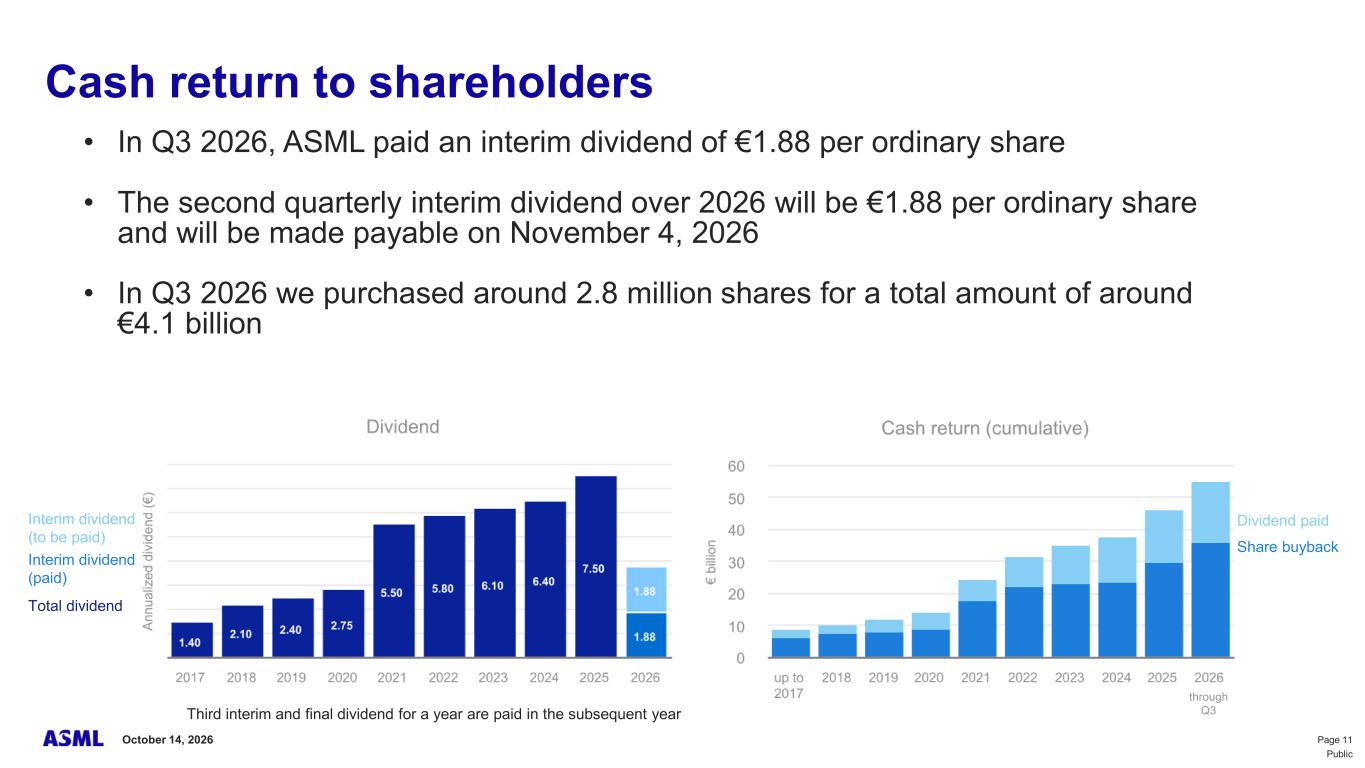
In the third quarter, we purchased around €4.1 billion worth of shares under the current 2026–2028 share buyback program.
An interim dividend over 2026 of €1.88 per ordinary share will be made payable on November 4, 2026.
Details of the share buyback program as well as transactions pursuant thereto, and details of the dividend are published on ASML's website (www.asml.com/investors).

1 Installed Base Management sales equals our net service and field option sales.
2 This refers to the figures in our Q2 2026 financial results press release, where we stated that we plan to increase 2026 low NA EUV and DUV immersion capacity by 30% in 2027, and are investigating a further 30% increase for both in 2028.


Media Relations contacts
Investor Relations contacts
Monique Mols +31 6 5284 4418
Jim Kavanagh +31 40 268 3938
Sarah de Crescenzo +1 925 899 8985
Pete Convertito +1 203 919 1714
Karen Lo +886 9 397 88635
Peter Cheang +886 3 659 6771


Quarterly video interview and investor call
With this press release, ASML is publishing a video interview in which CEO Christophe Fouquet and CFO Roger Dassen discuss the 2026 third-quarter results and outlook for 2026. This video and the video transcript can be viewed on www.asml.com shortly after the publication of this press release.

An investor call will be hosted by CEO Christophe Fouquet and CFO Roger Dassen on October 14, 2026 at 15:00 Central European Time / 09:00 US Eastern Time. Details can be found on our website.

About ASML
ASML is a leading supplier to the semiconductor industry. The company provides chipmakers with hardware, software and services to mass produce the patterns of integrated circuits (microchips). Together with its partners, ASML drives the advancement of more affordable, more powerful, more energy-efficient microchips. ASML enables groundbreaking technology to solve some of humanity's toughest challenges, such as in healthcare, energy use and conservation, mobility and agriculture. ASML is a multinational company headquartered in Veldhoven, the Netherlands, with offices across EMEA, the US and Asia. Every day, ASML’s more than 45,500 employees (FTE) challenge the status quo and push technology to new limits. ASML is traded on Euronext Amsterdam and NASDAQ under the symbol ASML. Discover ASML – our products, technology and career opportunities – at www.asml.com.

US GAAP Financial Reporting
ASML's primary accounting standard for quarterly earnings releases and annual reports is US GAAP, the accounting principles generally accepted in the United States of America. Quarterly US GAAP Consolidated Statements of Operations, Consolidated Statements of Cash Flows and Consolidated Balance Sheets are available on www.asml.com.
The Consolidated Balance Sheets of ASML Holding N.V. as of September 27, 2026, the related Consolidated Statements of Operations and Consolidated Statements of Cash Flows for the quarter and nine months ended September 27, 2026, as presented in this press release, are unaudited.

Regulated information
This press release contains inside information within the meaning of Article 7(1) of the EU Market Abuse Regulation.
2


Forward Looking Statements
This document and related discussions contain statements that are forward-looking within the meaning of the U.S. Private Securities Litigation Reform Act of 1995, including statements with respect to plans, strategies, expected trends, including expected trends in the semiconductor industry and end markets, business dynamics and business environment trends, the expected impact of AI investments and impact of AI technologies on demand for chips and our systems and semiconductor growth outlook and impact on our customers and our business, lithography intensity, plans and capability to increase capacity and output and expected capacity and investigation of ways to increase capacity, our product portfolio and portfolio roadmaps, backlog, expectations and customer plans with respect to High NA EUV and holistic lithography adoption, technological developments and expected shipment of systems, supply and demand trends, visibility into longer-term demand, outlook including expected sales of market segments and geographies, outlook and expected financial results including outlook and expected results for Q4 2026, including expected total net sales, IBM sales, gross margin, R&D costs, SG&A costs, outlook and expectations with respect to full year 2026 including expected full year 2026 total net sales, gross margin and annualized effective tax rate, expectations with respect to EUV, DUV and IBM sales in 2026, and expectations with respect to future years, investor key messages, our expectation to continue to return significant amounts of cash to shareholders through growing dividends and share buybacks and statements with respect to dividends, expected performance and capabilities of our systems and product roadmaps, customer outlook, demand forecasts, demand visibility and plans including customer orders and interest in placing orders in future years, customer roadmaps, capital expenditures and customer plans and capability with respect to capacity expansion, ESG strategy and commitments and other non-historical statements. You can generally identify these statements by the use of words like “may”, “expect”, “will”, “could”, “should”, “project”, “believe”, “anticipate”, “expect”, “plan”, “estimate”, “forecast”, “guide”, “potential”, “intend”, “continue”, “target”, “future”, “progress”, “goal”, “model”, “opportunity”, “commitment” and variations of these words or comparable words. These statements are not historical facts, but rather are based on current expectations, estimates, assumptions, plans and projections about our business and industry and our future financial results and readers should not place undue reliance on them. Forward-looking statements do not guarantee future performance and involve a number of substantial known and unknown risks and uncertainties. These risks and uncertainties include, without limitation, risks relating to customer demand, semiconductor equipment industry capacity, worldwide demand for semiconductors and semiconductor manufacturing capacity, lithography tool utilization and semiconductor inventory levels, general trends and consumer confidence in the semiconductor industry, the impact of general economic conditions, including the impact of the macroeconomic and geopolitical environment on the semiconductor industry, semiconductor market conditions, the impact of AI on our customers and our business, the pace and scale of customer increase in capacity, industry and business and semiconductor demand and demand for our tools, the impact of inflation, interest rate and exchange rate fluctuations, wars and geopolitical developments, the impact of pandemics, the performance of our systems, the success of technology advances and the pace of new product development and customer acceptance of and demand for new technologies, products and models and customer roadmaps, our production capacity and ability to adjust capacity to meet demand, supply chain capacity, timely availability of parts and components, raw materials, critical manufacturing equipment and qualified employees, our ability to produce systems to meet demand, the number and timing of systems ordered, shipped and recognized in revenue, risks relating to fluctuations in orders and our ability to convert orders into sales and whether customer interest in orders in future years results in actual orders, risks relating to the realization of our backlog, the risk of order cancellations, delays or push outs and restrictions on shipments of systems, including ordered systems, under export controls, risks relating to the trade environment, import/export and national security regulations and orders and their impact on us, including the impact of changes in export regulations and the impact of such regulations on our ability to obtain necessary licenses and to sell our systems and provide services to certain customers, the impact of the tariff announcements, changes in tax rates, available liquidity and free cash flow and liquidity requirements, our ability to refinance our indebtedness, available cash and distributable reserves for, and other factors impacting, dividend payments and share repurchases, the number of shares that we repurchase under our share repurchase program, our ability to enforce patents and protect intellectual property rights and the outcome of intellectual property disputes and litigation, our ability to meet ESG goals and commitments and execute our ESG strategy, risks relating to future financial results and the risk that future results may differ from our outlook and other factors that may impact ASML’s business or financial results, and other risks indicated in the risk factors included in ASML’s Annual Report on Form 20-F for the year ended December 31, 2025 and other filings with and submissions to the US Securities and Exchange Commission. These forward-looking statements are made only as of the date of this document. We undertake no obligation to update any forward-looking statements after the date of this report or to conform such statements to actual results or revised expectations, except as required by law.

3

EX-99.2 3 a2026_10x14xpresentation.htm EX-99.2 a2026_10x14xpresentation
ASML 2026 third-quarter results Veldhoven, the Netherlands October 14, 2026 ASML reports €11.7 billion total net sales and €5.0 billion net income in Q3 2026 Full-year 2026 total net sales expected to be between €44 billion and €45 billion, with a gross margin around 56% Exhibit 99.2


Page 2October 14, 2026 Public • Investor key messages • Business summary • Outlook • Financial statements Agenda


Page 3October 14, 2026 Investor key messages


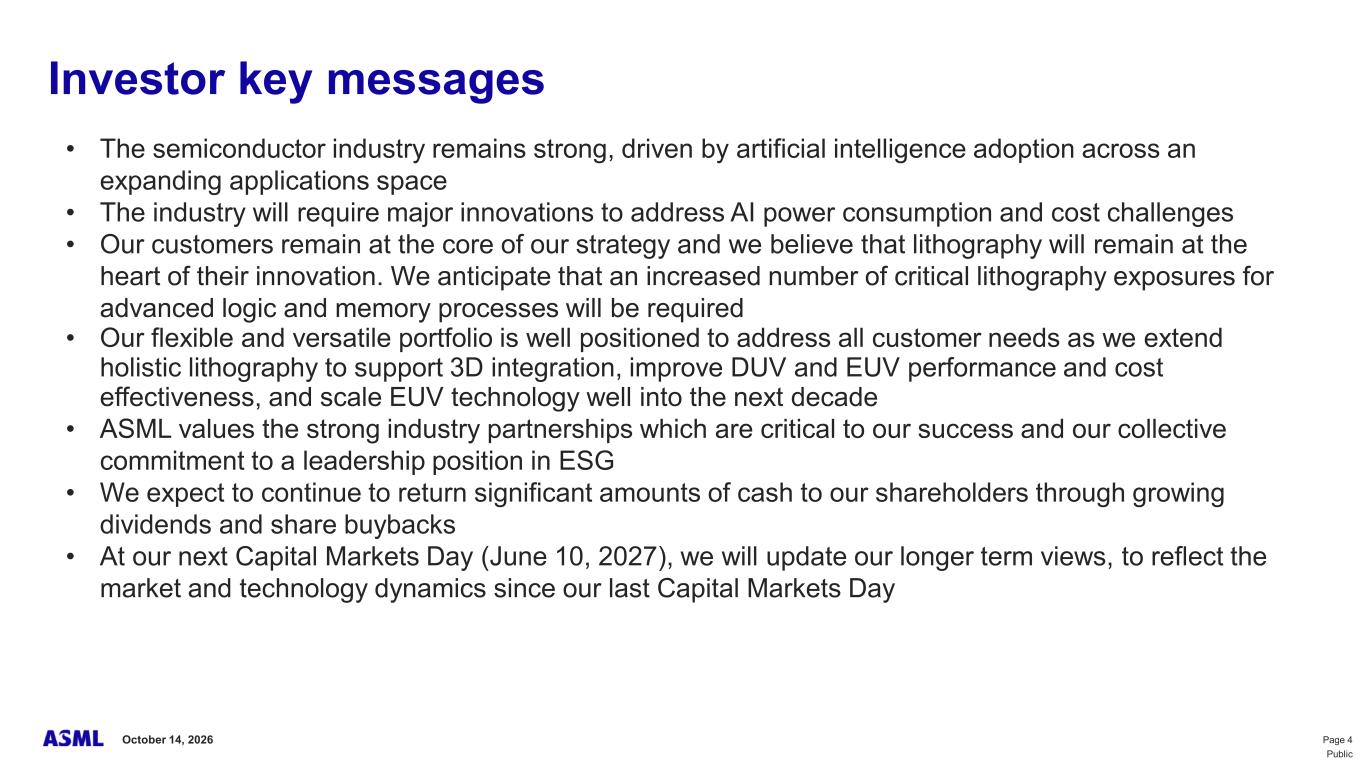
Page 4October 14, 2026 Public Investor key messages • The semiconductor industry remains strong, driven by artificial intelligence adoption across an expanding applications space • The industry will require major innovations to address AI power consumption and cost challenges • Our customers remain at the core of our strategy and we believe that lithography will remain at the heart of their innovation. We anticipate that an increased number of critical lithography exposures for advanced logic and memory processes will be required • Our flexible and versatile portfolio is well positioned to address all customer needs as we extend holistic lithography to support 3D integration, improve DUV and EUV performance and cost effectiveness, and scale EUV technology well into the next decade • ASML values the strong industry partnerships which are critical to our success and our collective commitment to a leadership position in ESG • We expect to continue to return significant amounts of cash to our shareholders through growing dividends and share buybacks • At our next Capital Markets Day (June 10, 2027), we will update our longer term views, to reflect the market and technology dynamics since our last Capital Markets Day


Page 5October 14, 2026 Business summary


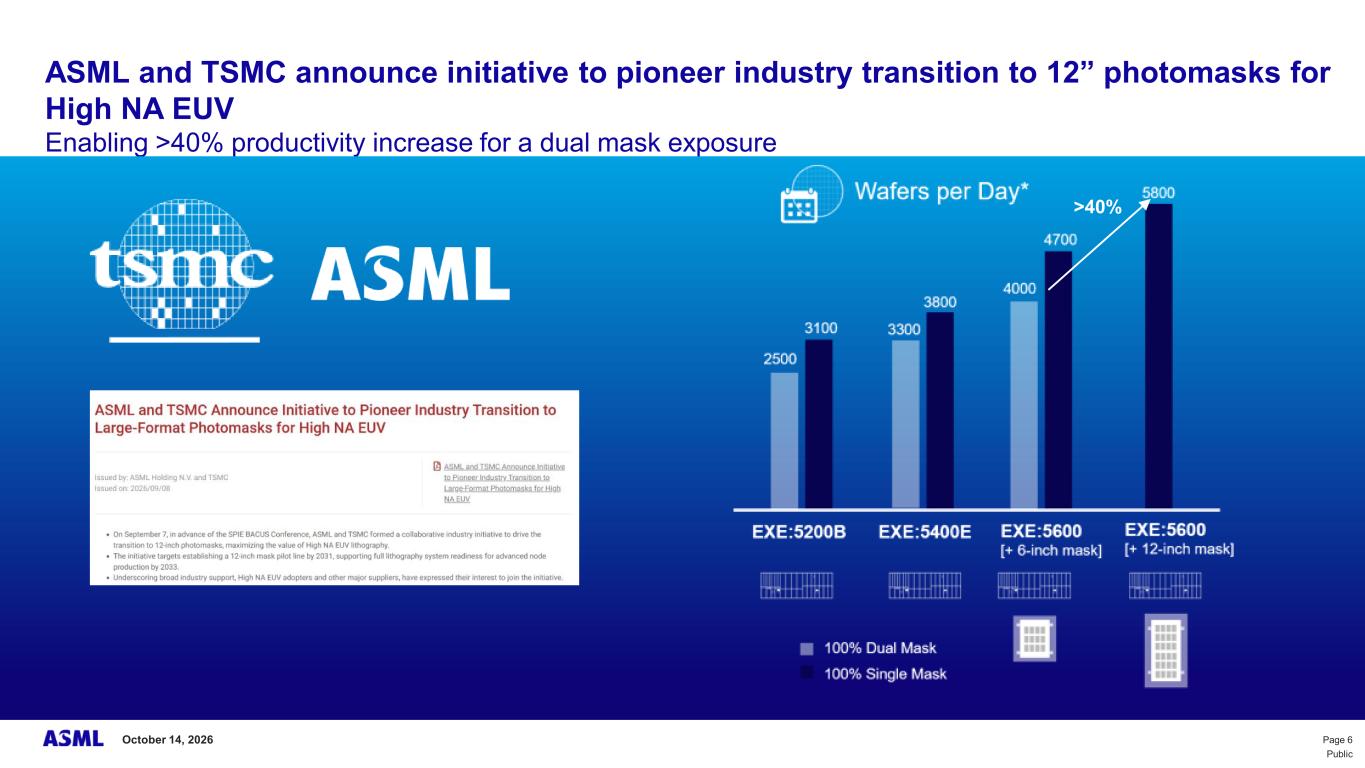
Page 6October 14, 2026 Public ASML and TSMC announce initiative to pioneer industry transition to 12” photomasks for High NA EUV Enabling >40% productivity increase for a dual mask exposure >40%


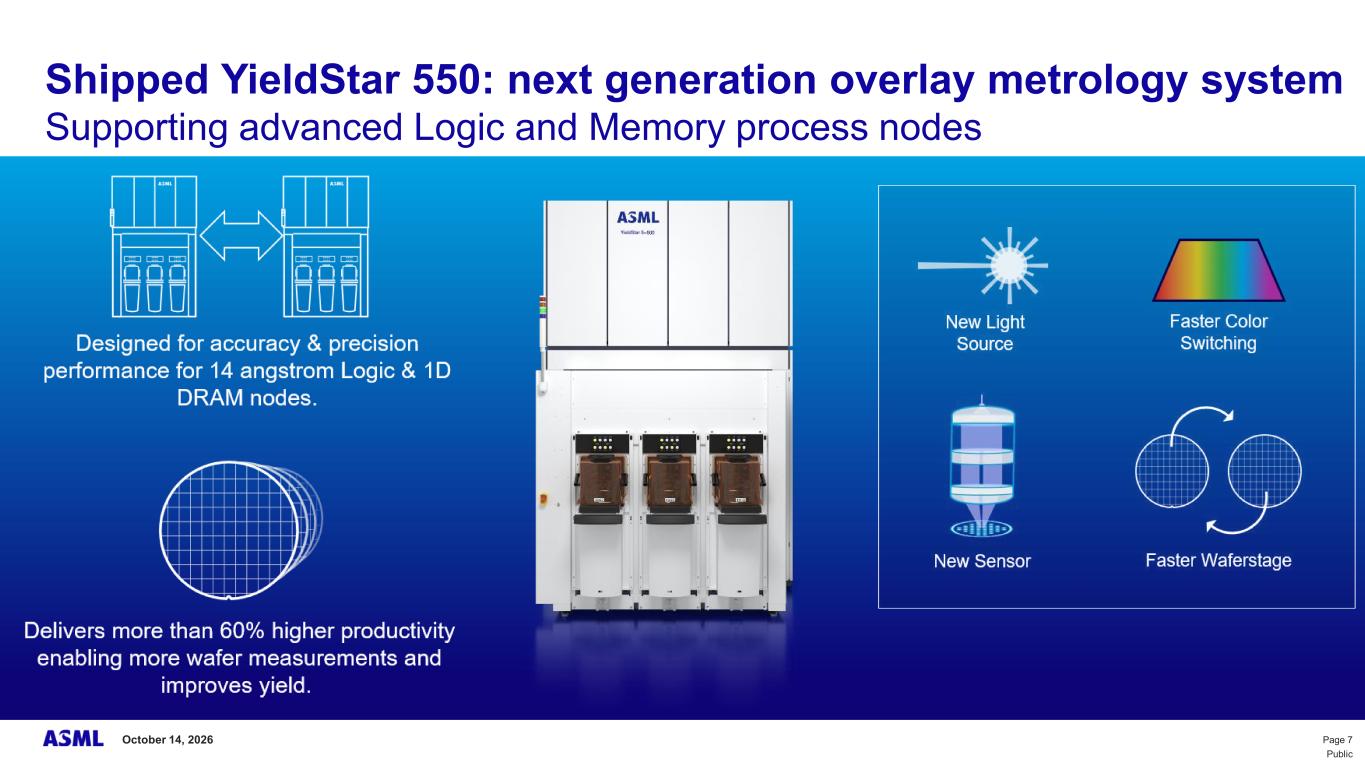
Page 7October 14, 2026 Public Shipped YieldStar 550: next generation overlay metrology system Supporting advanced Logic and Memory process nodes


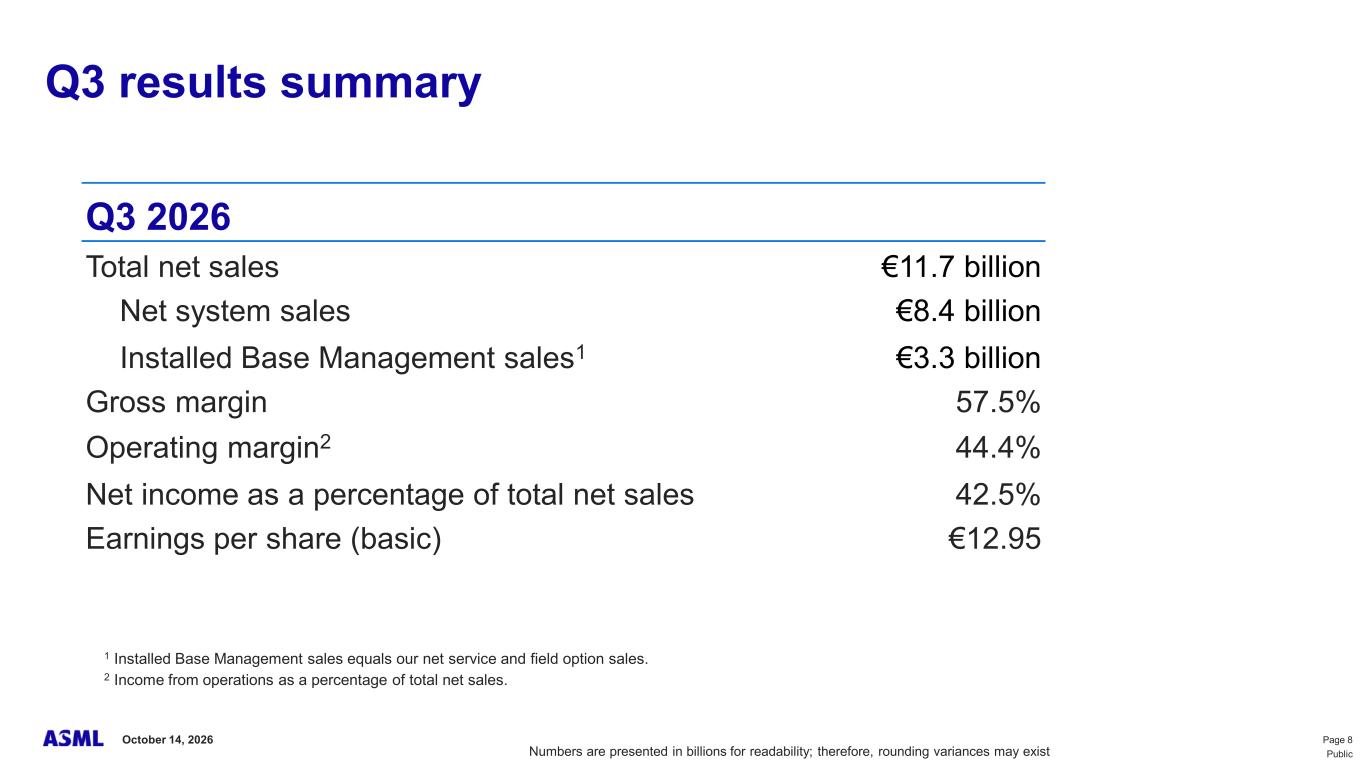
Page 8October 14, 2026 Public 1 Installed Base Management sales equals our net service and field option sales. 2 Income from operations as a percentage of total net sales. Q3 results summary Numbers are presented in billions for readability; therefore, rounding variances may exist Q3 2026 Total net sales €11.7 billion Net system sales €8.4 billion Installed Base Management sales1 €3.3 billion Gross margin 57.5% Operating margin2 44.4% Net income as a percentage of total net sales 42.5% Earnings per share (basic) €12.95


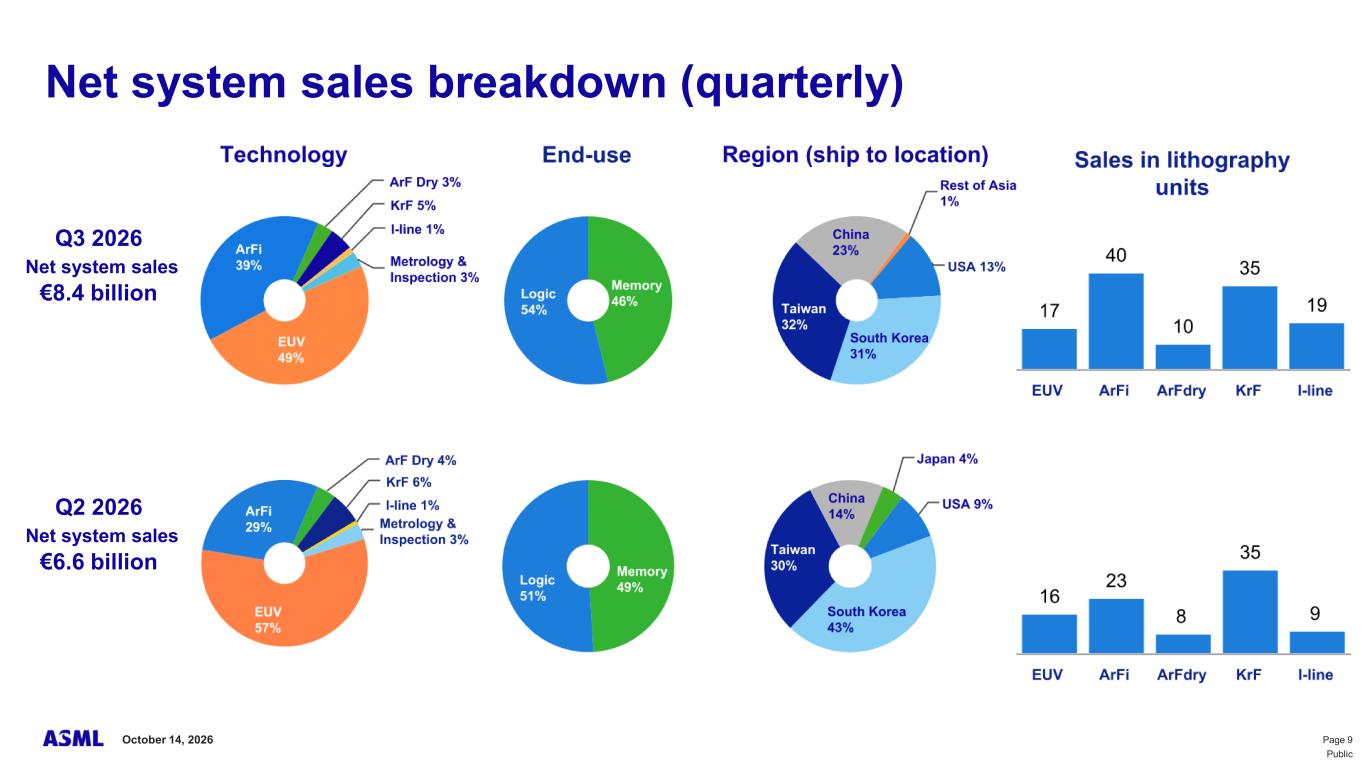
Page 9October 14, 2026 Public Net system sales breakdown (quarterly) Q3 2026 Net system sales €8.4 billion Q2 2026 Net system sales €6.6 billion


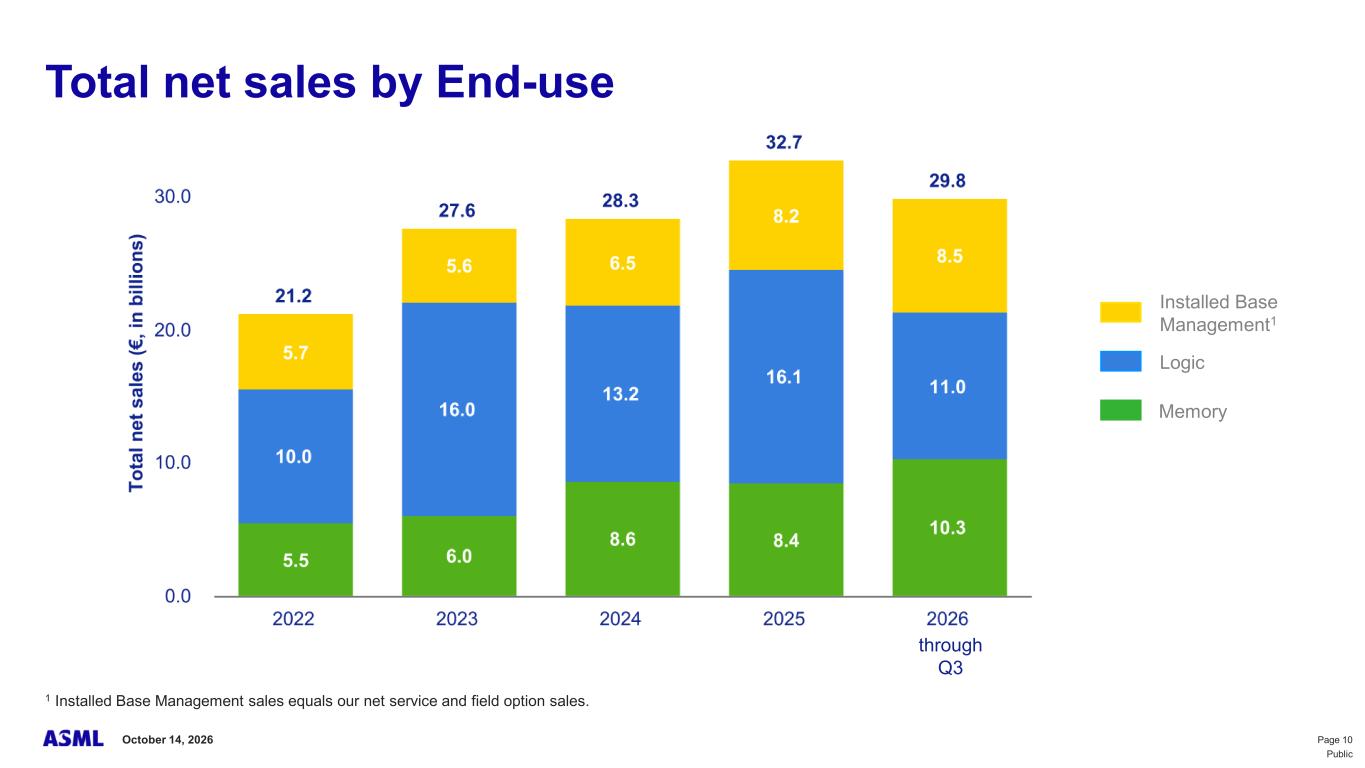
Page 10October 14, 2026 Public Logic Memory Installed Base Management1 1 Installed Base Management sales equals our net service and field option sales. Total net sales by End-use through Q3


Page 11October 14, 2026 Public • In Q3 2026, ASML paid an interim dividend of €1.88 per ordinary share • The second quarterly interim dividend over 2026 will be €1.88 per ordinary share and will be made payable on November 4, 2026 • In Q3 2026 we purchased around 2.8 million shares for a total amount of around €4.1 billion Cash return to shareholders Share buyback Dividend paid Third interim and final dividend for a year are paid in the subsequent year through Q3 Total dividend Interim dividend (paid) Interim dividend (to be paid)


Page 12October 14, 2026 Outlook


Page 13October 14, 2026 Public Outlook Q4 2026 Total net sales between €14.2 billion and €15.2 billion of which Installed Base Management1 sales around €3.7 billion Gross margin around 57% R&D costs around €1.2 billion SG&A costs around €0.4 billion FY 2026 Total net sales between €44 billion and €45 billion Gross margin around 56% Annualized effective tax rate around 17% 1 Installed Base Management sales equals our net service and field option sales.


Page 14October 14, 2026 Financial statements


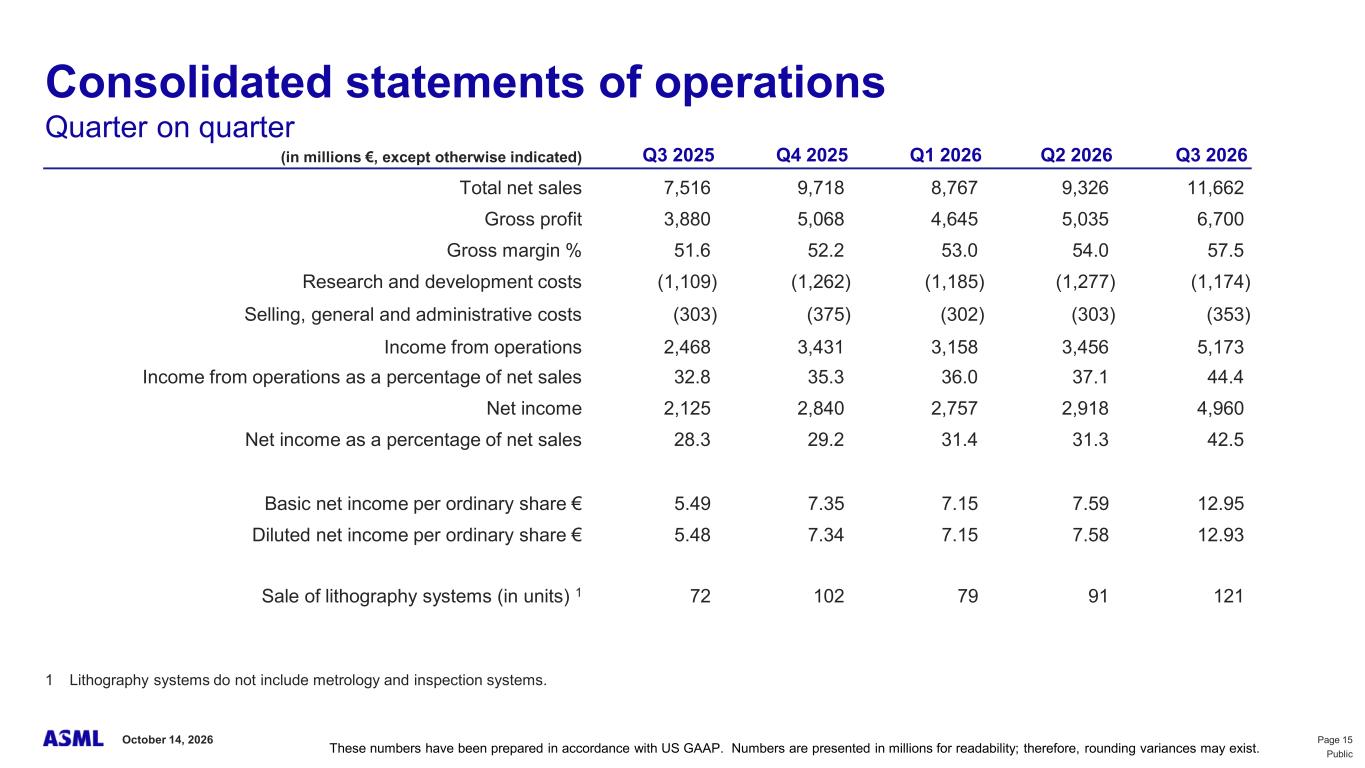
Page 15October 14, 2026 Public Consolidated statements of operations Quarter on quarter (in millions €, except otherwise indicated) Q3 2025 Q4 2025 Q1 2026 Q2 2026 Q3 2026 Total net sales 7,516 9,718 8,767 9,326 11,662 Gross profit 3,880 5,068 4,645 5,035 6,700 Gross margin % 51.6 52.2 53.0 54.0 57.5 Research and development costs (1,109) (1,262) (1,185) (1,277) (1,174) Selling, general and administrative costs (303) (375) (302) (303) (353) Income from operations 2,468 3,431 3,158 3,456 5,173 Income from operations as a percentage of net sales 32.8 35.3 36.0 37.1 44.4 Net income 2,125 2,840 2,757 2,918 4,960 Net income as a percentage of net sales 28.3 29.2 31.4 31.3 42.5 Basic net income per ordinary share € 5.49 7.35 7.15 7.59 12.95 Diluted net income per ordinary share € 5.48 7.34 7.15 7.58 12.93 Sale of lithography systems (in units) 1 72 102 79 91 121 1 Lithography systems do not include metrology and inspection systems. These numbers have been prepared in accordance with US GAAP. Numbers are presented in millions for readability; therefore, rounding variances may exist.


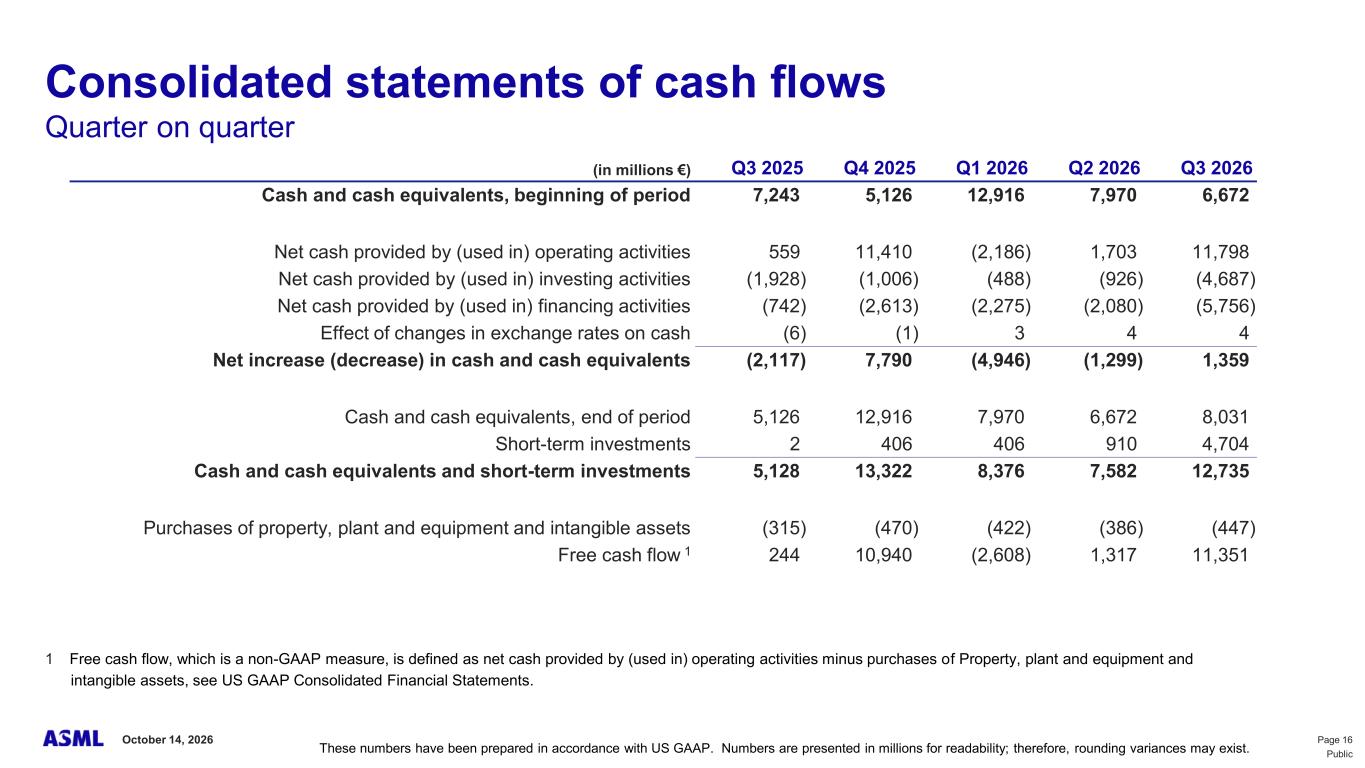
Page 16October 14, 2026 Public Consolidated statements of cash flows Quarter on quarter (in millions €) Q3 2025 Q4 2025 Q1 2026 Q2 2026 Q3 2026 Cash and cash equivalents, beginning of period 7,243 5,126 12,916 7,970 6,672 Net cash provided by (used in) operating activities 559 11,410 (2,186) 1,703 11,798 Net cash provided by (used in) investing activities (1,928) (1,006) (488) (926) (4,687) Net cash provided by (used in) financing activities (742) (2,613) (2,275) (2,080) (5,756) Effect of changes in exchange rates on cash (6) (1) 3 4 4 Net increase (decrease) in cash and cash equivalents (2,117) 7,790 (4,946) (1,299) 1,359 Cash and cash equivalents, end of period 5,126 12,916 7,970 6,672 8,031 Short-term investments 2 406 406 910 4,704 Cash and cash equivalents and short-term investments 5,128 13,322 8,376 7,582 12,735 Purchases of property, plant and equipment and intangible assets (315) (470) (422) (386) (447) Free cash flow 1 244 10,940 (2,608) 1,317 11,351 1 Free cash flow, which is a non-GAAP measure, is defined as net cash provided by (used in) operating activities minus purchases of Property, plant and equipment and intangible assets, see US GAAP Consolidated Financial Statements. These numbers have been prepared in accordance with US GAAP. Numbers are presented in millions for readability; therefore, rounding variances may exist.


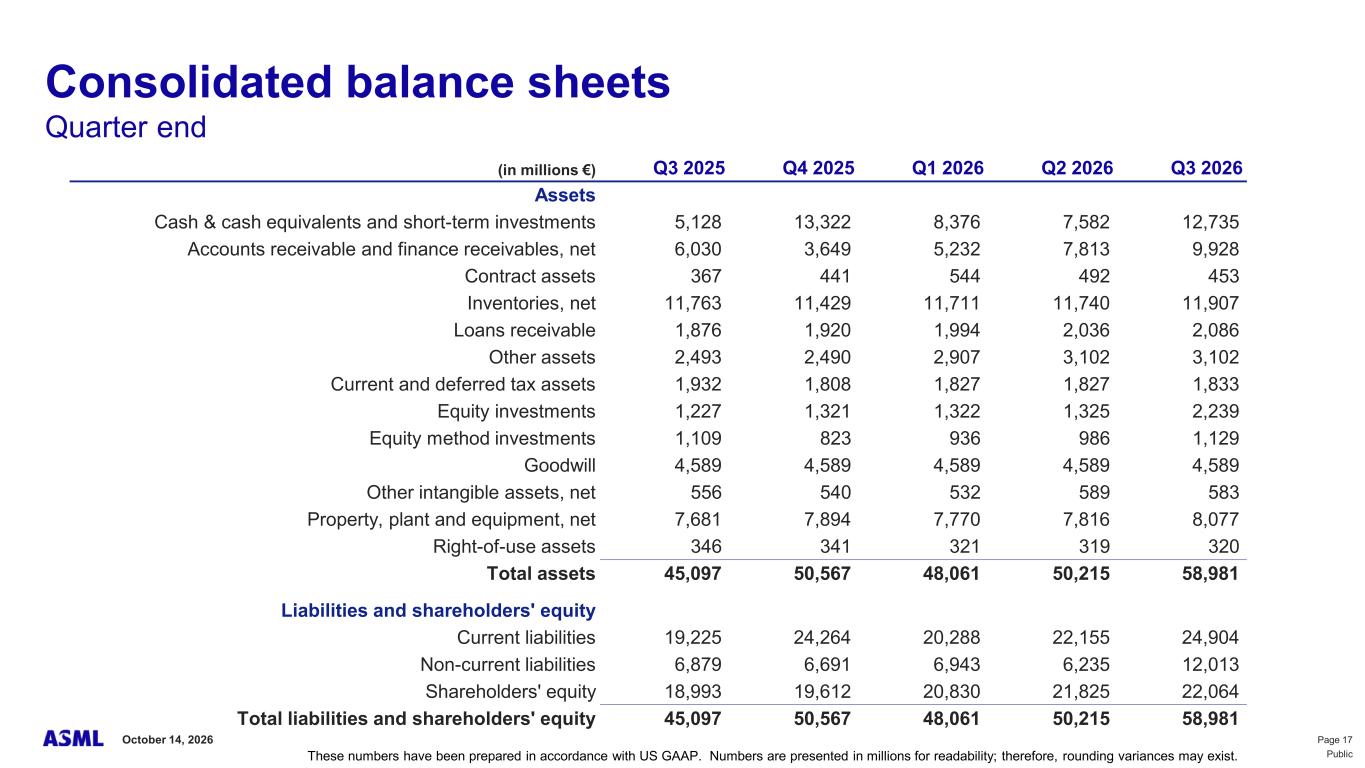
Page 17October 14, 2026 Public Consolidated balance sheets Quarter end (in millions €) Q3 2025 Q4 2025 Q1 2026 Q2 2026 Q3 2026 Assets Cash & cash equivalents and short-term investments 5,128 13,322 8,376 7,582 12,735 Accounts receivable and finance receivables, net 6,030 3,649 5,232 7,813 9,928 Contract assets 367 441 544 492 453 Inventories, net 11,763 11,429 11,711 11,740 11,907 Loans receivable 1,876 1,920 1,994 2,036 2,086 Other assets 2,493 2,490 2,907 3,102 3,102 Current and deferred tax assets 1,932 1,808 1,827 1,827 1,833 Equity investments 1,227 1,321 1,322 1,325 2,239 Equity method investments 1,109 823 936 986 1,129 Goodwill 4,589 4,589 4,589 4,589 4,589 Other intangible assets, net 556 540 532 589 583 Property, plant and equipment, net 7,681 7,894 7,770 7,816 8,077 Right-of-use assets 346 341 321 319 320 Total assets 45,097 50,567 48,061 50,215 58,981 Liabilities and shareholders' equity Current liabilities 19,225 24,264 20,288 22,155 24,904 Non-current liabilities 6,879 6,691 6,943 6,235 12,013 Shareholders' equity 18,993 19,612 20,830 21,825 22,064 Total liabilities and shareholders' equity 45,097 50,567 48,061 50,215 58,981 These numbers have been prepared in accordance with US GAAP. Numbers are presented in millions for readability; therefore, rounding variances may exist.


Page 18October 14, 2026 Public This document and related discussions contain statements that are forward-looking within the meaning of the U.S. Private Securities Litigation Reform Act of 1995, including statements with respect to plans, strategies, expected trends, including expected trends in the semiconductor industry and end markets, business dynamics and business environment trends, the expected impact of AI investments and impact of AI technologies on demand for chips and our systems and semiconductor growth outlook and impact on our customers and our business, lithography intensity, plans and capability to increase capacity and output and expected capacity and investigation of ways to increase capacity, our product portfolio and portfolio roadmaps, backlog, expectations and customer plans with respect to High NA EUV and holistic lithography adoption, technological developments and expected shipment of systems, supply and demand trends, visibility into longer-term demand, outlook including expected sales of market segments and geographies, outlook and expected financial results including outlook and expected results for Q4 2026, including expected total net sales, IBM sales, gross margin, R&D costs, SG&A costs, outlook and expectations with respect to full year 2026 including expected full year 2026 total net sales, gross margin and annualized effective tax rate, expectations with respect to EUV, DUV and IBM sales in 2026, and expectations with respect to future years, investor key messages, our expectation to continue to return significant amounts of cash to shareholders through growing dividends and share buybacks and statements with respect to dividends, expected performance and capabilities of our systems and product roadmaps, customer outlook, demand forecasts, demand visibility and plans including customer orders and interest in placing orders in future years, customer roadmaps, capital expenditures and customer plans and capability with respect to capacity expansion, ESG strategy and commitments and other non-historical statements. You can generally identify these statements by the use of words like “may”, “expect”, “will”, “could”, “should”, “project”, “believe”, “anticipate”, “expect”, “plan”, “estimate”, “forecast”, “guide”, “potential”, “intend”, “continue”, “target”, “future”, “progress”, “goal”, “model”, “opportunity”, “commitment” and variations of these words or comparable words. These statements are not historical facts, but rather are based on current expectations, estimates, assumptions, plans and projections about our business and industry and our future financial results and readers should not place undue reliance on them. Forward-looking statements do not guarantee future performance and involve a number of substantial known and unknown risks and uncertainties. These risks and uncertainties include, without limitation, risks relating to customer demand, semiconductor equipment industry capacity, worldwide demand for semiconductors and semiconductor manufacturing capacity, lithography tool utilization and semiconductor inventory levels, general trends and consumer confidence in the semiconductor industry, the impact of general economic conditions, including the impact of the macroeconomic and geopolitical environment on the semiconductor industry, semiconductor market conditions, the impact of AI on our customers and our business, the pace and scale of customer increase in capacity, industry and business and semiconductor demand and demand for our tools, the impact of inflation, interest rate and exchange rate fluctuations, wars and geopolitical developments, the impact of pandemics, the performance of our systems, the success of technology advances and the pace of new product development and customer acceptance of and demand for new technologies, products and models and customer roadmaps, our production capacity and ability to adjust capacity to meet demand, supply chain capacity, timely availability of parts and components, raw materials, critical manufacturing equipment and qualified employees, our ability to produce systems to meet demand, the number and timing of systems ordered, shipped and recognized in revenue, risks relating to fluctuations in orders and our ability to convert orders into sales and whether customer interest in orders in future years results in actual orders, risks relating to the realization of our backlog, the risk of order cancellations, delays or push outs and restrictions on shipments of systems, including ordered systems, under export controls, risks relating to the trade environment, import/export and national security regulations and orders and their impact on us, including the impact of changes in export regulations and the impact of such regulations on our ability to obtain necessary licenses and to sell our systems and provide services to certain customers, the impact of the tariff announcements, changes in tax rates, available liquidity and free cash flow and liquidity requirements, our ability to refinance our indebtedness, available cash and distributable reserves for, and other factors impacting, dividend payments and share repurchases, the number of shares that we repurchase under our share repurchase program, our ability to enforce patents and protect intellectual property rights and the outcome of intellectual property disputes and litigation, our ability to meet ESG goals and commitments and execute our ESG strategy, risks relating to future financial results and the risk that future results may differ from our outlook and other factors that may impact ASML’s business or financial results, and other risks indicated in the risk factors included in ASML’s Annual Report on Form 20-F for the year ended December 31, 2025 and other filings with and submissions to the US Securities and Exchange Commission. These forward-looking statements are made only as of the date of this document. We undertake no obligation to update any forward-looking statements after the date of this report or to conform such statements to actual results or revised expectations, except as required by law. Forward looking statements


EX-99.3 4 financial_statementsxusx.htm EX-99.3 financial_statementsxusx
Financial Statements US GAAP Q3 2026 Powering technology forward with you Exhibit 99.3

 
ASML Financial Statements US GAAP Q3 2026 2 Summary US GAAP Consolidated Statements of Operations 3 Summary US GAAP Ratios and Other Data 4 Summary US GAAP Consolidated Balance Sheets 5 Summary US GAAP Consolidated Statements of Cash Flows 6 Quarterly Summary US GAAP Consolidated Statements of Operations 7 Quarterly Summary US GAAP Ratios and Other Data 8 Quarterly Summary US GAAP Consolidated Balance Sheets 9 Quarterly Summary US GAAP Consolidated Statements of Cash Flows 10 Notes to the Summary US GAAP Consolidated Financial Statements 11 Forward Looking Statements Consolidated Statements of Operations Ratios and Other Data Consolidated Balance Sheets Consolidated Statements of Cash Flows Contents
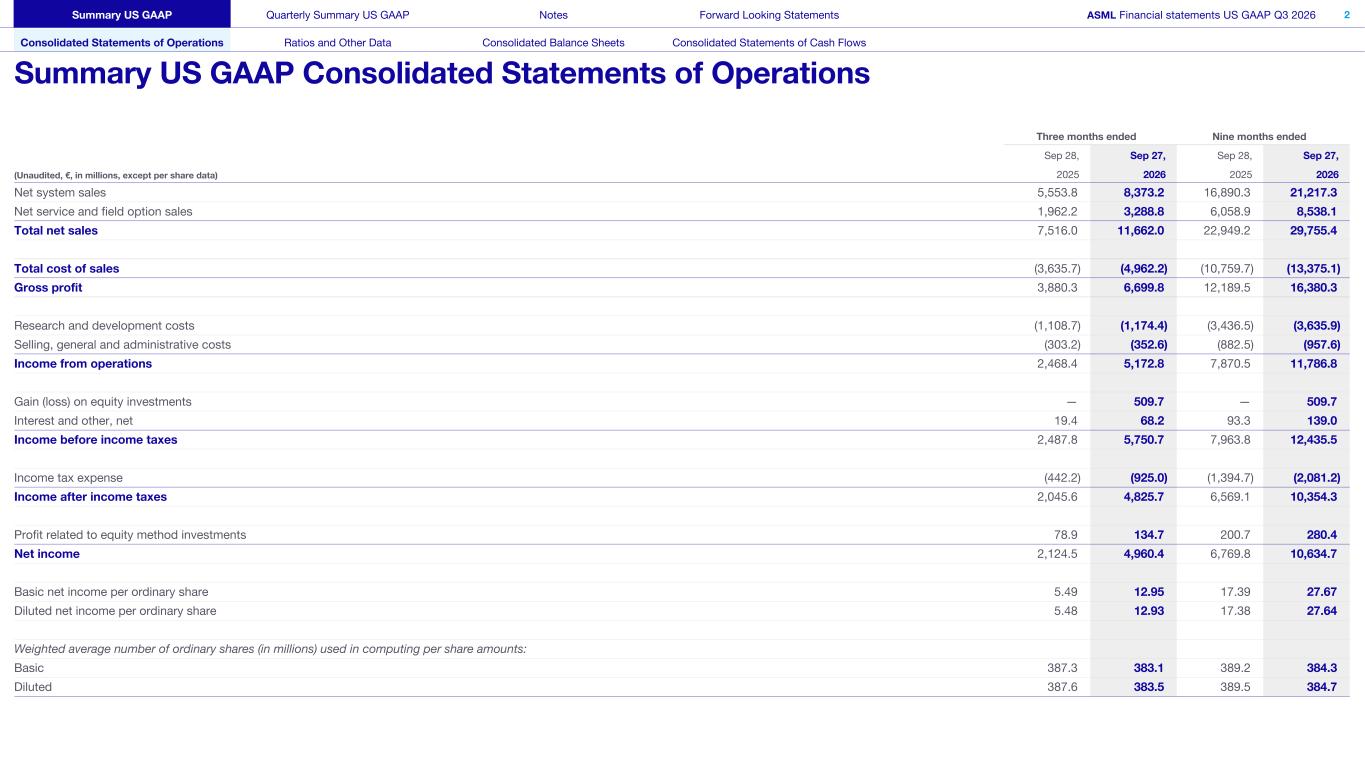

 
Three months ended Nine months ended Sep 28, Sep 27, Sep 28, Sep 27, (Unaudited, €, in millions, except per share data) 2025 2026 2025 2026 Net system sales 5,553.8 8,373.2 16,890.3 21,217.3 Net service and field option sales 1,962.2 3,288.8 6,058.9 8,538.1 Total net sales 7,516.0 11,662.0 22,949.2 29,755.4 Total cost of sales (3,635.7) (4,962.2) (10,759.7) (13,375.1) Gross profit 3,880.3 6,699.8 12,189.5 16,380.3 Research and development costs (1,108.7) (1,174.4) (3,436.5) (3,635.9) Selling, general and administrative costs (303.2) (352.6) (882.5) (957.6) Income from operations 2,468.4 5,172.8 7,870.5 11,786.8 Gain (loss) on equity investments — 509.7 — 509.7 Interest and other, net 19.4 68.2 93.3 139.0 Income before income taxes 2,487.8 5,750.7 7,963.8 12,435.5 Income tax expense (442.2) (925.0) (1,394.7) (2,081.2) Income after income taxes 2,045.6 4,825.7 6,569.1 10,354.3 Profit related to equity method investments 78.9 134.7 200.7 280.4 Net income 2,124.5 4,960.4 6,769.8 10,634.7 Basic net income per ordinary share 5.49 12.95 17.39 27.67 Diluted net income per ordinary share 5.48 12.93 17.38 27.64 Weighted average number of ordinary shares (in millions) used in computing per share amounts: Basic 387.3 383.1 389.2 384.3 Diluted 387.6 383.5 389.5 384.7 Summary US GAAP Quarterly Summary US GAAP Notes Forward Looking Statements ASML Financial statements US GAAP Q3 2026 2 Consolidated Statements of Operations Ratios and Other Data Consolidated Balance Sheets Consolidated Statements of Cash Flows Summary US GAAP Consolidated Statements of Operations
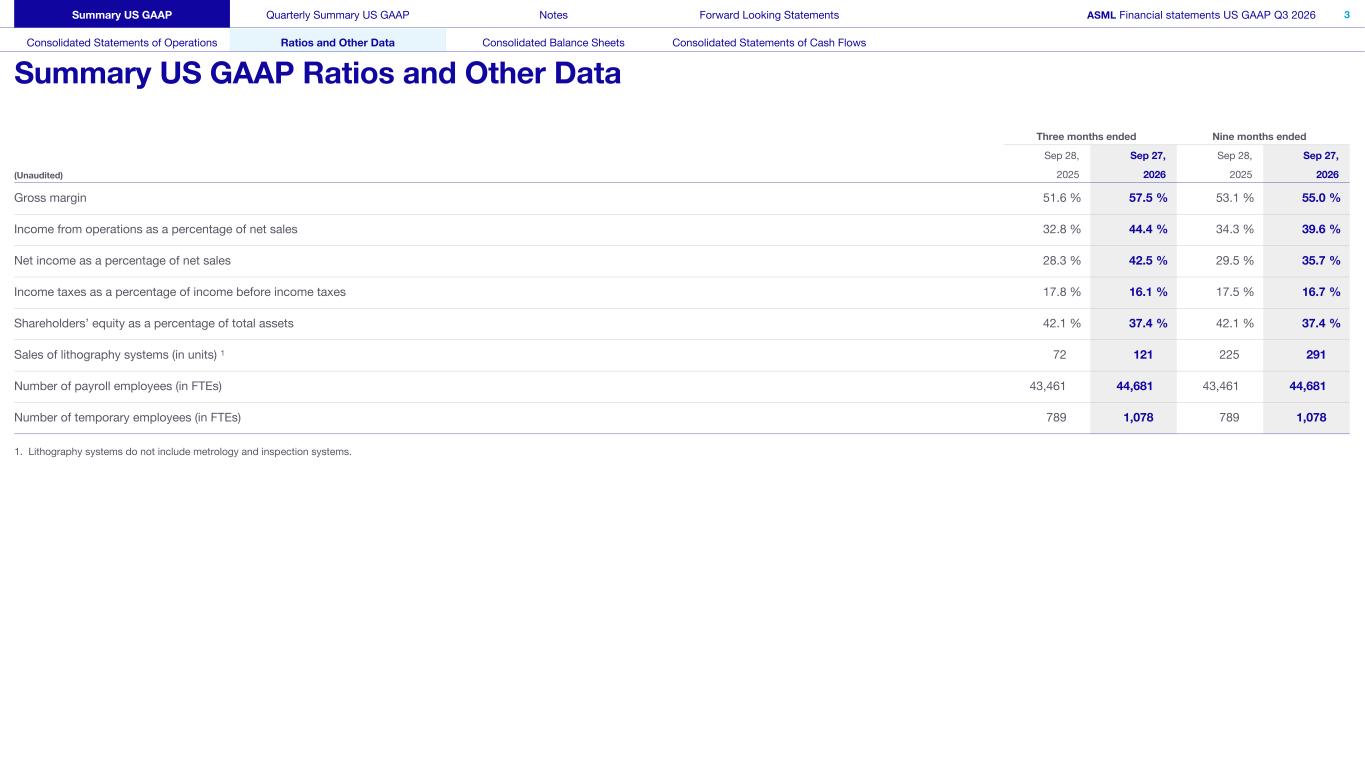

 
Three months ended Nine months ended Sep 28, Sep 27, Sep 28, Sep 27, (Unaudited) 2025 2026 2025 2026 Gross margin 51.6 % 57.5 % 53.1 % 55.0 % Income from operations as a percentage of net sales 32.8 % 44.4 % 34.3 % 39.6 % Net income as a percentage of net sales 28.3 % 42.5 % 29.5 % 35.7 % Income taxes as a percentage of income before income taxes 17.8 % 16.1 % 17.5 % 16.7 % Shareholders’ equity as a percentage of total assets 42.1 % 37.4 % 42.1 % 37.4 % Sales of lithography systems (in units) 1 72 121 225 291 Number of payroll employees (in FTEs) 43,461 44,681 43,461 44,681 Number of temporary employees (in FTEs) 789 1,078 789 1,078 1. Lithography systems do not include metrology and inspection systems. Summary US GAAP Quarterly Summary US GAAP Notes Forward Looking Statements ASML Financial statements US GAAP Q3 2026 3 Consolidated Statements of Operations Ratios and Other Data Consolidated Balance Sheets Consolidated Statements of Cash Flows Summary US GAAP Ratios and Other Data
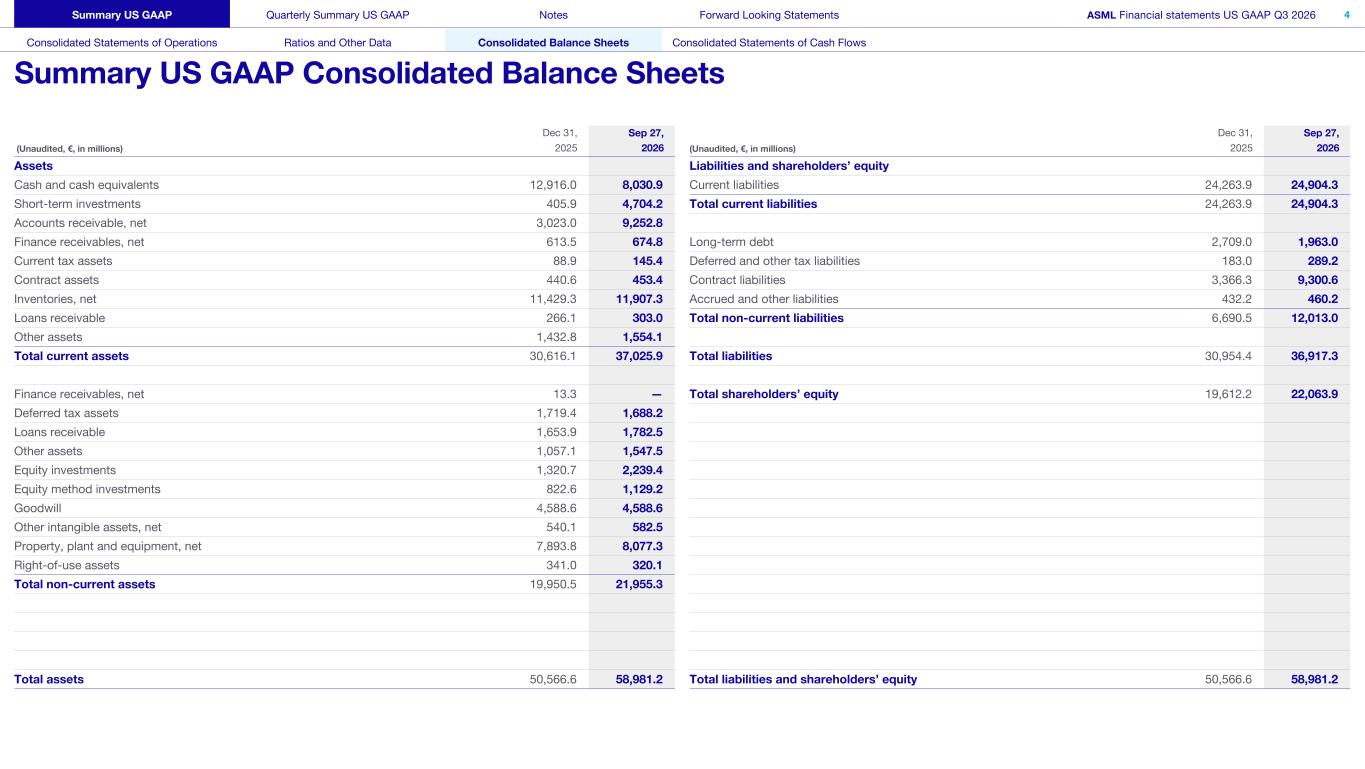

 
Dec 31, Sep 27, (Unaudited, €, in millions) 2025 2026 Assets Cash and cash equivalents 12,916.0 8,030.9 Short-term investments 405.9 4,704.2 Accounts receivable, net 3,023.0 9,252.8 Finance receivables, net 613.5 674.8 Current tax assets 88.9 145.4 Contract assets 440.6 453.4 Inventories, net 11,429.3 11,907.3 Loans receivable 266.1 303.0 Other assets 1,432.8 1,554.1 Total current assets 30,616.1 37,025.9 Finance receivables, net 13.3 — Deferred tax assets 1,719.4 1,688.2 Loans receivable 1,653.9 1,782.5 Other assets 1,057.1 1,547.5 Equity investments 1,320.7 2,239.4 Equity method investments 822.6 1,129.2 Goodwill 4,588.6 4,588.6 Other intangible assets, net 540.1 582.5 Property, plant and equipment, net 7,893.8 8,077.3 Right-of-use assets 341.0 320.1 Total non-current assets 19,950.5 21,955.3 Total assets 50,566.6 58,981.2 Dec 31, Sep 27, (Unaudited, €, in millions) 2025 2026 Liabilities and shareholders’ equity Current liabilities 24,263.9 24,904.3 Total current liabilities 24,263.9 24,904.3 Long-term debt 2,709.0 1,963.0 Deferred and other tax liabilities 183.0 289.2 Contract liabilities 3,366.3 9,300.6 Accrued and other liabilities 432.2 460.2 Total non-current liabilities 6,690.5 12,013.0 Total liabilities 30,954.4 36,917.3 Total shareholders’ equity 19,612.2 22,063.9 Total liabilities and shareholders’ equity 50,566.6 58,981.2 Summary US GAAP Quarterly Summary US GAAP Notes Forward Looking Statements ASML Financial statements US GAAP Q3 2026 4 Consolidated Statements of Operations Ratios and Other Data Consolidated Balance Sheets Consolidated Statements of Cash Flows Summary US GAAP Consolidated Balance Sheets
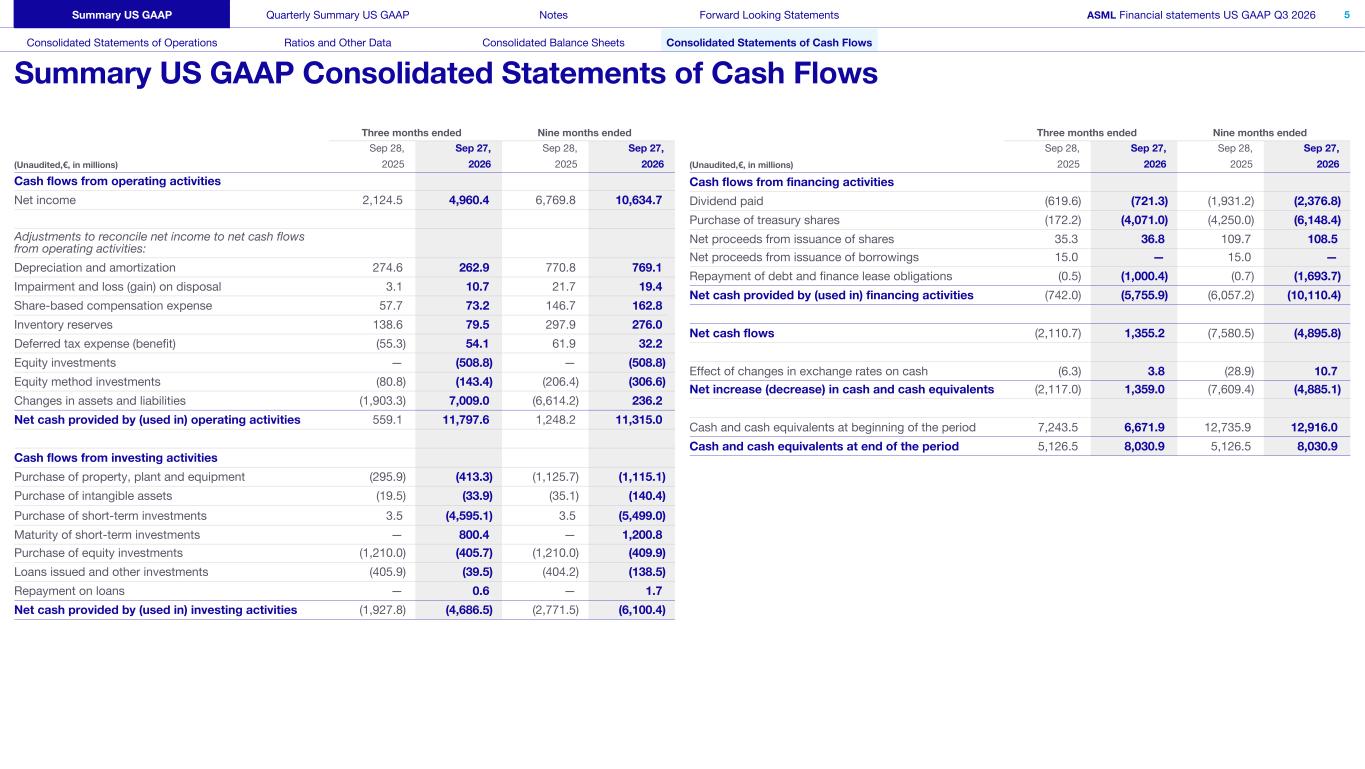

 
Cash flows from operating activities Net income 2,124.5 4,960.4 6,769.8 10,634.7 Adjustments to reconcile net income to net cash flows from operating activities: Depreciation and amortization 274.6 262.9 770.8 769.1 Impairment and loss (gain) on disposal 3.1 10.7 21.7 19.4 Share-based compensation expense 57.7 73.2 146.7 162.8 Inventory reserves 138.6 79.5 297.9 276.0 Deferred tax expense (benefit) (55.3) 54.1 61.9 32.2 Equity investments — (508.8) — (508.8) Equity method investments (80.8) (143.4) (206.4) (306.6) Changes in assets and liabilities (1,903.3) 7,009.0 (6,614.2) 236.2 Net cash provided by (used in) operating activities 559.1 11,797.6 1,248.2 11,315.0 Cash flows from investing activities Purchase of property, plant and equipment (295.9) (413.3) (1,125.7) (1,115.1) Purchase of intangible assets (19.5) (33.9) (35.1) (140.4) Purchase of short-term investments 3.5 (4,595.1) 3.5 (5,499.0) Maturity of short-term investments — 800.4 — 1,200.8 Purchase of equity investments (1,210.0) (405.7) (1,210.0) (409.9) Loans issued and other investments (405.9) (39.5) (404.2) (138.5) Repayment on loans — 0.6 — 1.7 Net cash provided by (used in) investing activities (1,927.8) (4,686.5) (2,771.5) (6,100.4) Three months ended Nine months ended Sep 28, Sep 27, Sep 28, Sep 27, (Unaudited,€, in millions) 2025 2026 2025 2026 Cash flows from financing activities Dividend paid (619.6) (721.3) (1,931.2) (2,376.8) Purchase of treasury shares (172.2) (4,071.0) (4,250.0) (6,148.4) Net proceeds from issuance of shares 35.3 36.8 109.7 108.5 Net proceeds from issuance of borrowings 15.0 — 15.0 — Repayment of debt and finance lease obligations (0.5) (1,000.4) (0.7) (1,693.7) Net cash provided by (used in) financing activities (742.0) (5,755.9) (6,057.2) (10,110.4) Net cash flows (2,110.7) 1,355.2 (7,580.5) (4,895.8) Effect of changes in exchange rates on cash (6.3) 3.8 (28.9) 10.7 Net increase (decrease) in cash and cash equivalents (2,117.0) 1,359.0 (7,609.4) (4,885.1) Cash and cash equivalents at beginning of the period 7,243.5 6,671.9 12,735.9 12,916.0 Cash and cash equivalents at end of the period 5,126.5 8,030.9 5,126.5 8,030.9 Three months ended Nine months ended Sep 28, Sep 27, Sep 28, Sep 27, (Unaudited,€, in millions) 2025 2026 2025 2026 Summary US GAAP Quarterly Summary US GAAP Notes Forward Looking Statements ASML Financial statements US GAAP Q3 2026 5 Consolidated Statements of Operations Ratios and Other Data Consolidated Balance Sheets Consolidated Statements of Cash Flows Summary US GAAP Consolidated Statements of Cash Flows
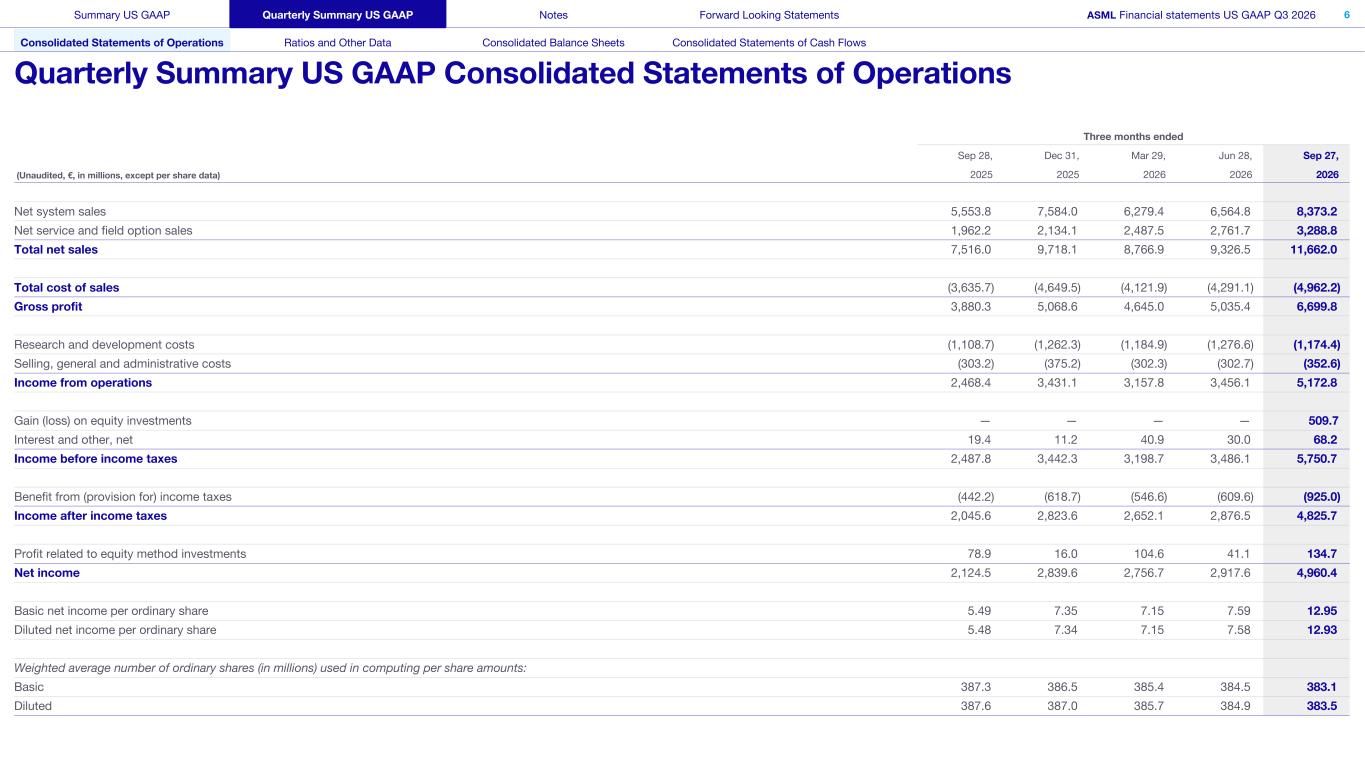

 
Three months ended Sep 28, Dec 31, Mar 29, Jun 28, Sep 27, (Unaudited, €, in millions, except per share data) 2025 2025 2026 2026 2026 Net system sales 5,553.8 7,584.0 6,279.4 6,564.8 8,373.2 Net service and field option sales 1,962.2 2,134.1 2,487.5 2,761.7 3,288.8 Total net sales 7,516.0 9,718.1 8,766.9 9,326.5 11,662.0 Total cost of sales (3,635.7) (4,649.5) (4,121.9) (4,291.1) (4,962.2) Gross profit 3,880.3 5,068.6 4,645.0 5,035.4 6,699.8 Research and development costs (1,108.7) (1,262.3) (1,184.9) (1,276.6) (1,174.4) Selling, general and administrative costs (303.2) (375.2) (302.3) (302.7) (352.6) Income from operations 2,468.4 3,431.1 3,157.8 3,456.1 5,172.8 Gain (loss) on equity investments — — — — 509.7 Interest and other, net 19.4 11.2 40.9 30.0 68.2 Income before income taxes 2,487.8 3,442.3 3,198.7 3,486.1 5,750.7 Benefit from (provision for) income taxes (442.2) (618.7) (546.6) (609.6) (925.0) Income after income taxes 2,045.6 2,823.6 2,652.1 2,876.5 4,825.7 Profit related to equity method investments 78.9 16.0 104.6 41.1 134.7 Net income 2,124.5 2,839.6 2,756.7 2,917.6 4,960.4 Basic net income per ordinary share 5.49 7.35 7.15 7.59 12.95 Diluted net income per ordinary share 5.48 7.34 7.15 7.58 12.93 Weighted average number of ordinary shares (in millions) used in computing per share amounts: Basic 387.3 386.5 385.4 384.5 383.1 Diluted 387.6 387.0 385.7 384.9 383.5 Summary US GAAP Quarterly Summary US GAAP Notes Forward Looking Statements ASML Financial statements US GAAP Q3 2026 6 Consolidated Statements of Operations Ratios and Other Data Consolidated Balance Sheets Consolidated Statements of Cash Flows Quarterly Summary US GAAP Consolidated Statements of Operations
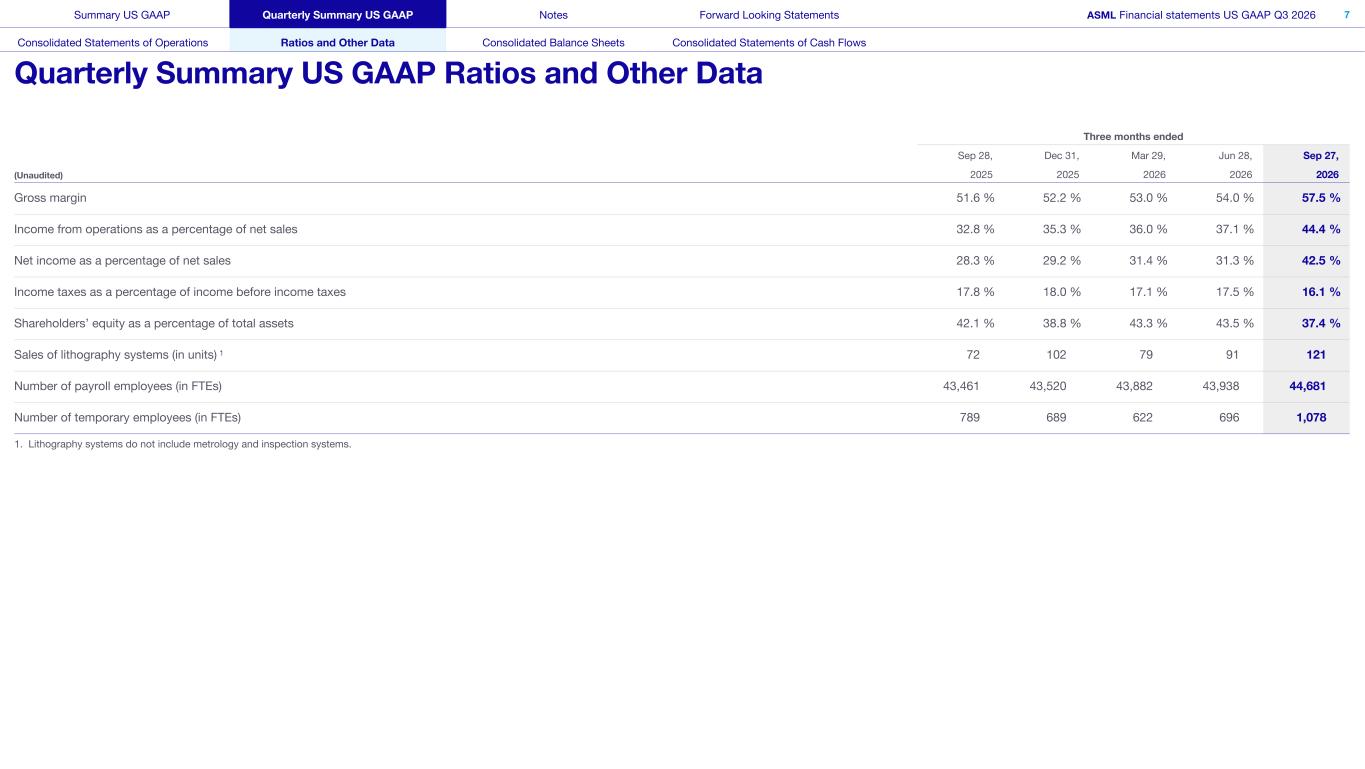

 
Three months ended Sep 28, Dec 31, Mar 29, Jun 28, Sep 27, (Unaudited) 2025 2025 2026 2026 2026 Gross margin 51.6 % 52.2 % 53.0 % 54.0 % 57.5 % Income from operations as a percentage of net sales 32.8 % 35.3 % 36.0 % 37.1 % 44.4 % Net income as a percentage of net sales 28.3 % 29.2 % 31.4 % 31.3 % 42.5 % Income taxes as a percentage of income before income taxes 17.8 % 18.0 % 17.1 % 17.5 % 16.1 % Shareholders’ equity as a percentage of total assets 42.1 % 38.8 % 43.3 % 43.5 % 37.4 % Sales of lithography systems (in units) 1 72 102 79 91 121 Number of payroll employees (in FTEs) 43,461 43,520 43,882 43,938 44,681 Number of temporary employees (in FTEs) 789 689 622 696 1,078 1. Lithography systems do not include metrology and inspection systems. Summary US GAAP Quarterly Summary US GAAP Notes Forward Looking Statements ASML Financial statements US GAAP Q3 2026 7 Consolidated Statements of Operations Ratios and Other Data Consolidated Balance Sheets Consolidated Statements of Cash Flows Quarterly Summary US GAAP Ratios and Other Data
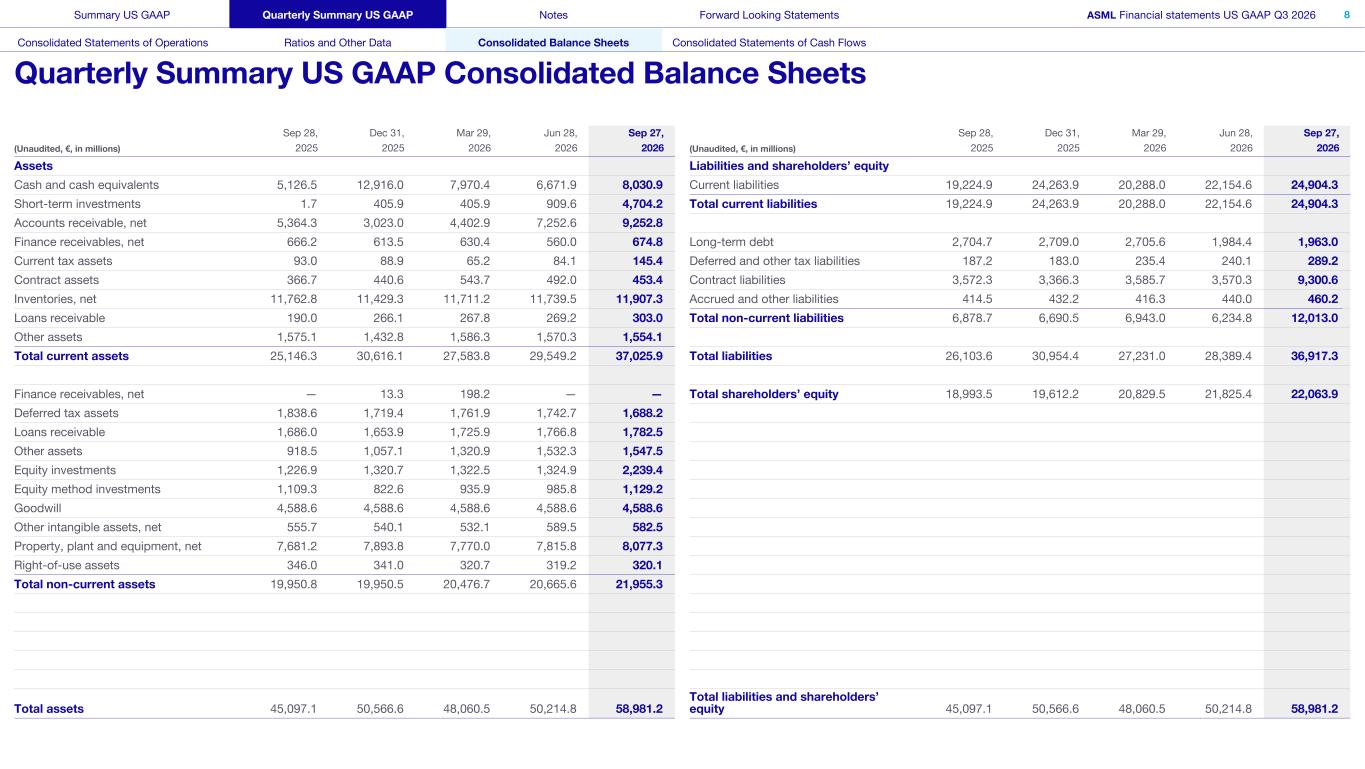

 
Sep 28, Dec 31, Mar 29, Jun 28, Sep 27, (Unaudited, €, in millions) 2025 2025 2026 2026 2026 Assets Cash and cash equivalents 5,126.5 12,916.0 7,970.4 6,671.9 8,030.9 Short-term investments 1.7 405.9 405.9 909.6 4,704.2 Accounts receivable, net 5,364.3 3,023.0 4,402.9 7,252.6 9,252.8 Finance receivables, net 666.2 613.5 630.4 560.0 674.8 Current tax assets 93.0 88.9 65.2 84.1 145.4 Contract assets 366.7 440.6 543.7 492.0 453.4 Inventories, net 11,762.8 11,429.3 11,711.2 11,739.5 11,907.3 Loans receivable 190.0 266.1 267.8 269.2 303.0 Other assets 1,575.1 1,432.8 1,586.3 1,570.3 1,554.1 Total current assets 25,146.3 30,616.1 27,583.8 29,549.2 37,025.9 Finance receivables, net — 13.3 198.2 — — Deferred tax assets 1,838.6 1,719.4 1,761.9 1,742.7 1,688.2 Loans receivable 1,686.0 1,653.9 1,725.9 1,766.8 1,782.5 Other assets 918.5 1,057.1 1,320.9 1,532.3 1,547.5 Equity investments 1,226.9 1,320.7 1,322.5 1,324.9 2,239.4 Equity method investments 1,109.3 822.6 935.9 985.8 1,129.2 Goodwill 4,588.6 4,588.6 4,588.6 4,588.6 4,588.6 Other intangible assets, net 555.7 540.1 532.1 589.5 582.5 Property, plant and equipment, net 7,681.2 7,893.8 7,770.0 7,815.8 8,077.3 Right-of-use assets 346.0 341.0 320.7 319.2 320.1 Total non-current assets 19,950.8 19,950.5 20,476.7 20,665.6 21,955.3 Total assets 45,097.1 50,566.6 48,060.5 50,214.8 58,981.2 Sep 28, Dec 31, Mar 29, Jun 28, Sep 27, (Unaudited, €, in millions) 2025 2025 2026 2026 2026 Liabilities and shareholders’ equity Current liabilities 19,224.9 24,263.9 20,288.0 22,154.6 24,904.3 Total current liabilities 19,224.9 24,263.9 20,288.0 22,154.6 24,904.3 Long-term debt 2,704.7 2,709.0 2,705.6 1,984.4 1,963.0 Deferred and other tax liabilities 187.2 183.0 235.4 240.1 289.2 Contract liabilities 3,572.3 3,366.3 3,585.7 3,570.3 9,300.6 Accrued and other liabilities 414.5 432.2 416.3 440.0 460.2 Total non-current liabilities 6,878.7 6,690.5 6,943.0 6,234.8 12,013.0 Total liabilities 26,103.6 30,954.4 27,231.0 28,389.4 36,917.3 Total shareholders’ equity 18,993.5 19,612.2 20,829.5 21,825.4 22,063.9 Total liabilities and shareholders’ equity 45,097.1 50,566.6 48,060.5 50,214.8 58,981.2 Summary US GAAP Quarterly Summary US GAAP Notes Forward Looking Statements ASML Financial statements US GAAP Q3 2026 8 Consolidated Statements of Operations Ratios and Other Data Consolidated Balance Sheets Consolidated Statements of Cash Flows Quarterly Summary US GAAP Consolidated Balance Sheets
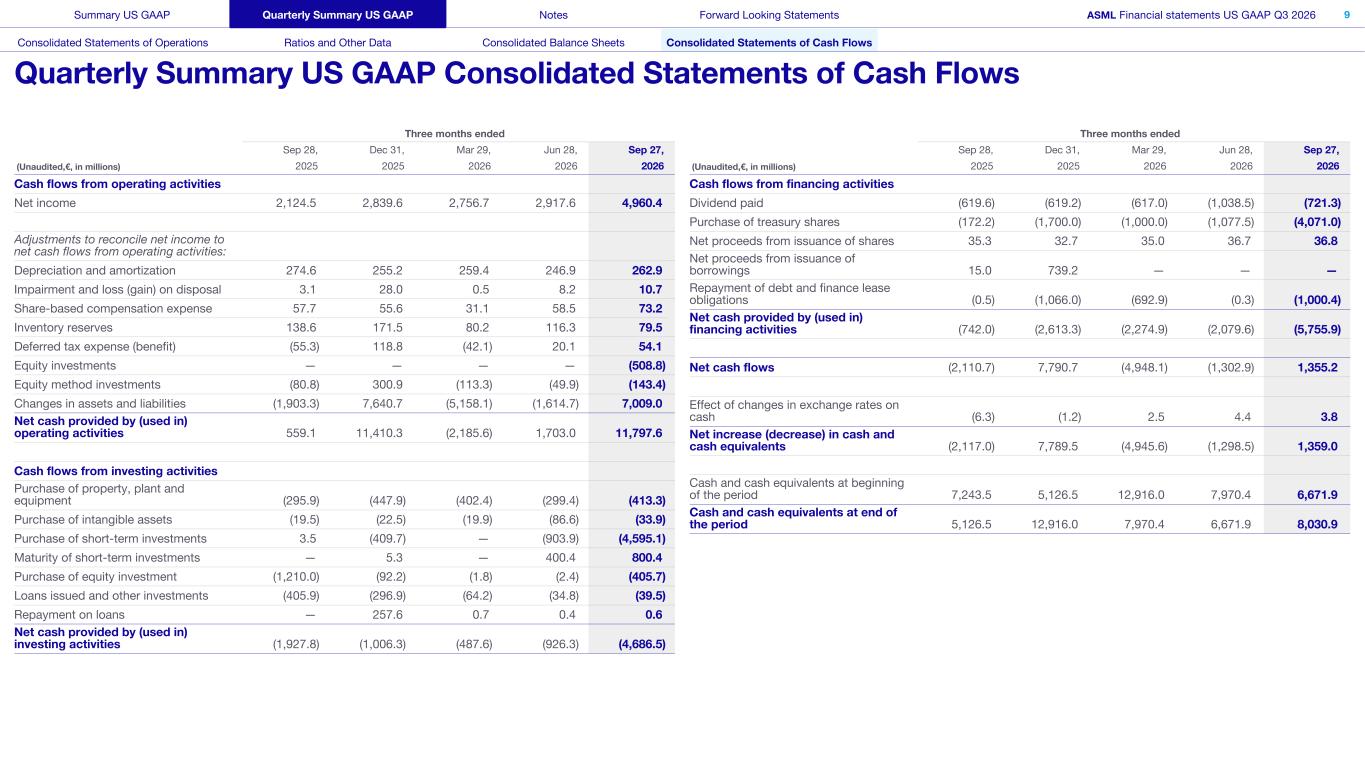

 
Cash flows from operating activities Net income 2,124.5 2,839.6 2,756.7 2,917.6 4,960.4 Adjustments to reconcile net income to net cash flows from operating activities: Depreciation and amortization 274.6 255.2 259.4 246.9 262.9 Impairment and loss (gain) on disposal 3.1 28.0 0.5 8.2 10.7 Share-based compensation expense 57.7 55.6 31.1 58.5 73.2 Inventory reserves 138.6 171.5 80.2 116.3 79.5 Deferred tax expense (benefit) (55.3) 118.8 (42.1) 20.1 54.1 Equity investments — — — — (508.8) Equity method investments (80.8) 300.9 (113.3) (49.9) (143.4) Changes in assets and liabilities (1,903.3) 7,640.7 (5,158.1) (1,614.7) 7,009.0 Net cash provided by (used in) operating activities 559.1 11,410.3 (2,185.6) 1,703.0 11,797.6 Cash flows from investing activities Purchase of property, plant and equipment (295.9) (447.9) (402.4) (299.4) (413.3) Purchase of intangible assets (19.5) (22.5) (19.9) (86.6) (33.9) Purchase of short-term investments 3.5 (409.7) — (903.9) (4,595.1) Maturity of short-term investments — 5.3 — 400.4 800.4 Purchase of equity investment (1,210.0) (92.2) (1.8) (2.4) (405.7) Loans issued and other investments (405.9) (296.9) (64.2) (34.8) (39.5) Repayment on loans — 257.6 0.7 0.4 0.6 Net cash provided by (used in) investing activities (1,927.8) (1,006.3) (487.6) (926.3) (4,686.5) Three months ended Sep 28, Dec 31, Mar 29, Jun 28, Sep 27, (Unaudited,€, in millions) 2025 2025 2026 2026 2026 Cash flows from financing activities Dividend paid (619.6) (619.2) (617.0) (1,038.5) (721.3) Purchase of treasury shares (172.2) (1,700.0) (1,000.0) (1,077.5) (4,071.0) Net proceeds from issuance of shares 35.3 32.7 35.0 36.7 36.8 Net proceeds from issuance of borrowings 15.0 739.2 — — — Repayment of debt and finance lease obligations (0.5) (1,066.0) (692.9) (0.3) (1,000.4) Net cash provided by (used in) financing activities (742.0) (2,613.3) (2,274.9) (2,079.6) (5,755.9) Net cash flows (2,110.7) 7,790.7 (4,948.1) (1,302.9) 1,355.2 Effect of changes in exchange rates on cash (6.3) (1.2) 2.5 4.4 3.8 Net increase (decrease) in cash and cash equivalents (2,117.0) 7,789.5 (4,945.6) (1,298.5) 1,359.0 Cash and cash equivalents at beginning of the period 7,243.5 5,126.5 12,916.0 7,970.4 6,671.9 Cash and cash equivalents at end of the period 5,126.5 12,916.0 7,970.4 6,671.9 8,030.9 Three months ended Sep 28, Dec 31, Mar 29, Jun 28, Sep 27, (Unaudited,€, in millions) 2025 2025 2026 2026 2026 Summary US GAAP Quarterly Summary US GAAP Notes Forward Looking Statements ASML Financial statements US GAAP Q3 2026 9 Consolidated Statements of Operations Ratios and Other Data Consolidated Balance Sheets Consolidated Statements of Cash Flows Quarterly Summary US GAAP Consolidated Statements of Cash Flows
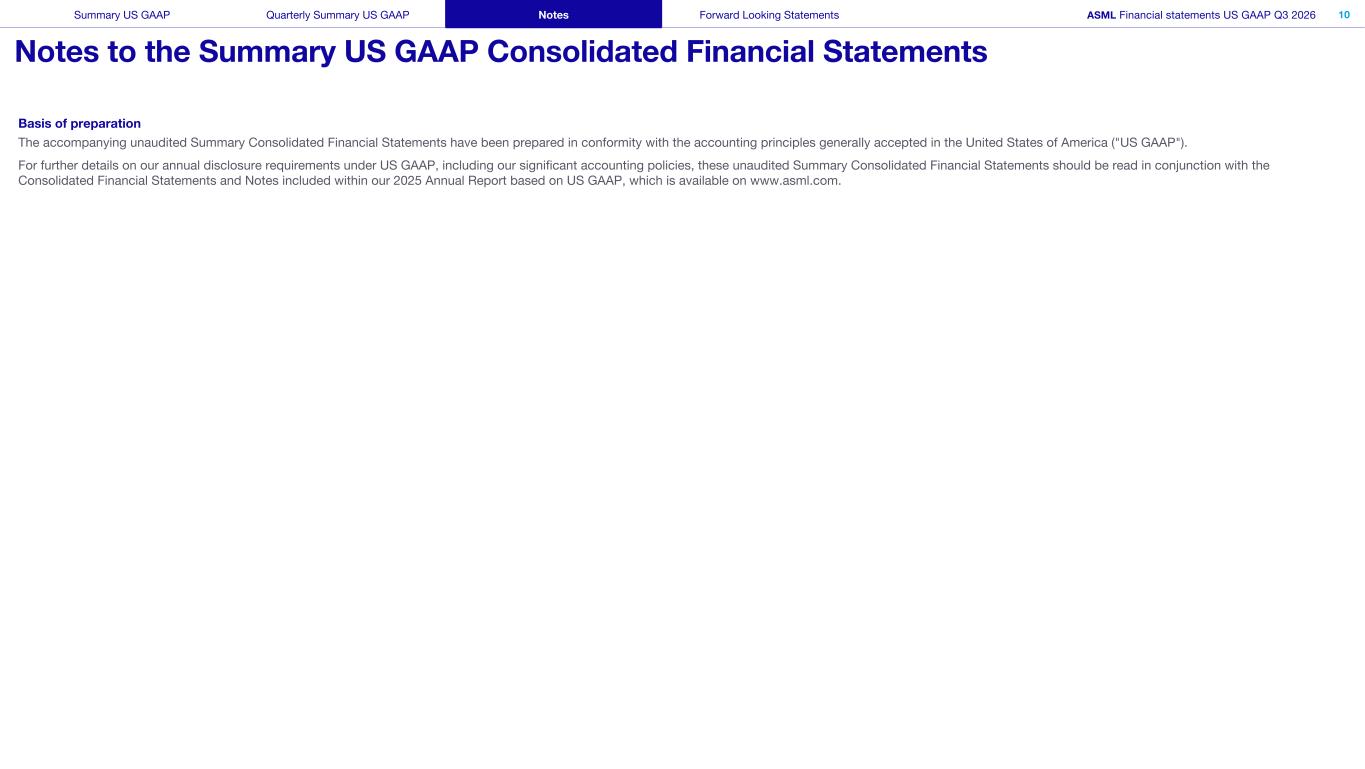

 
Basis of preparation The accompanying unaudited Summary Consolidated Financial Statements have been prepared in conformity with the accounting principles generally accepted in the United States of America ("US GAAP"). For further details on our annual disclosure requirements under US GAAP, including our significant accounting policies, these unaudited Summary Consolidated Financial Statements should be read in conjunction with the Consolidated Financial Statements and Notes included within our 2025 Annual Report based on US GAAP, which is available on www.asml.com. Summary US GAAP Quarterly Summary US GAAP Notes Forward Looking Statements ASML Financial statements US GAAP Q3 2026 10 Notes to the Summary US GAAP Consolidated Financial Statements

 
This document and related discussions contain statements that are forward-looking within the meaning of the U.S. Private Securities Litigation Reform Act of 1995, including statements with respect to plans, strategies, expected trends, including expected trends in the semiconductor industry and end markets, business dynamics and business environment trends, the expected impact of AI investments and impact of AI technologies on demand for chips and our systems and semiconductor growth outlook and impact on our customers and our business, lithography intensity, plans and capability to increase capacity and output and expected capacity and investigation of ways to increase capacity, our product portfolio and portfolio roadmaps, backlog, expectations and customer plans with respect to High NA EUV and holistic lithography adoption, technological developments and expected shipment of systems, supply and demand trends, visibility into longer-term demand, outlook including expected sales of market segments and geographies, outlook and expected financial results including outlook and expected results for Q4 2026, including expected total net sales, IBM sales, gross margin, R&D costs, SG&A costs, outlook and expectations with respect to full year 2026 including expected full year 2026 total net sales, gross margin and annualized effective tax rate, expectations with respect to EUV, DUV and IBM sales in 2026, and expectations with respect to future years, investor key messages, our expectation to continue to return significant amounts of cash to shareholders through growing dividends and share buybacks and statements with respect to dividends, expected performance and capabilities of our systems and product roadmaps, customer outlook, demand forecasts, demand visibility and plans including customer orders and interest in placing orders in future years, customer roadmaps, capital expenditures and customer plans and capability with respect to capacity expansion, ESG strategy and commitments and other non-historical statements. You can generally identify these statements by the use of words like “may”, “expect”, “will”, “could”, “should”, “project”, “believe”, “anticipate”, “expect”, “plan”, “estimate”, “forecast”, “guide”, “potential”, “intend”, “continue”, “target”, “future”, “progress”, “goal”, “model”, “opportunity”, “commitment” and variations of these words or comparable words. These statements are not historical facts, but rather are based on current expectations, estimates, assumptions, plans and projections about our business and industry and our future financial results and readers should not place undue reliance on them. Forward-looking statements do not guarantee future performance and involve a number of substantial known and unknown risks and uncertainties. These risks and uncertainties include, without limitation, risks relating to customer demand, semiconductor equipment industry capacity, worldwide demand for semiconductors and semiconductor manufacturing capacity, lithography tool utilization and semiconductor inventory levels, general trends and consumer confidence in the semiconductor industry, the impact of general economic conditions, including the impact of the macroeconomic and geopolitical environment on the semiconductor industry, semiconductor market conditions, the impact of AI on our customers and our business, the pace and scale of customer increase in capacity, industry and business and semiconductor demand and demand for our tools, the impact of inflation, interest rate and exchange rate fluctuations, wars and geopolitical developments, the impact of pandemics, the performance of our systems, the success of technology advances and the pace of new product development and customer acceptance of and demand for new technologies, products and models and customer roadmaps, our production capacity and ability to adjust capacity to meet demand, supply chain capacity, timely availability of parts and components, raw materials, critical manufacturing equipment and qualified employees, our ability to produce systems to meet demand, the number and timing of systems ordered, shipped and recognized in revenue, risks relating to fluctuations in orders and our ability to convert orders into sales and whether customer interest in orders in future years results in actual orders, risks relating to the realization of our backlog, the risk of order cancellations, delays or push outs and restrictions on shipments of systems, including ordered systems, under export controls, risks relating to the trade environment, import/export and national security regulations and orders and their impact on us, including the impact of changes in export regulations and the impact of such regulations on our ability to obtain necessary licenses and to sell our systems and provide services to certain customers, the impact of the tariff announcements, changes in tax rates, available liquidity and free cash flow and liquidity requirements, our ability to refinance our indebtedness, available cash and distributable reserves for, and other factors impacting, dividend payments and share repurchases, the number of shares that we repurchase under our share repurchase program, our ability to enforce patents and protect intellectual property rights and the outcome of intellectual property disputes and litigation, our ability to meet ESG goals and commitments and execute our ESG strategy, risks relating to future financial results and the risk that future results may differ from our outlook and other factors that may impact ASML’s business or financial results, and other risks indicated in the risk factors included in ASML’s Annual Report on Form 20-F for the year ended December 31, 2025 and other filings with and submissions to the US Securities and Exchange Commission. These forward-looking statements are made only as of the date of this document. We undertake no obligation to update any forward-looking statements after the date of this report or to conform such statements to actual results or revised expectations, except as required by law. Summary US GAAP Quarterly Summary US GAAP Notes Forward Looking Statements ASML Financial statements US GAAP Q3 2026 11 Forward Looking Statements