Document
Pangaea Logistics Solutions Ltd. Reports Financial Results for the Second Quarter Ended June 30, 2026
NEWPORT, RI - August 10, 2026 - Pangaea Logistics Solutions Ltd. (“Pangaea” or the “Company”) (Nasdaq: PANL), a global provider of comprehensive maritime logistics solutions, announced today its results for the three months ended June 30, 2026.
SECOND QUARTER 2026 RESULTS
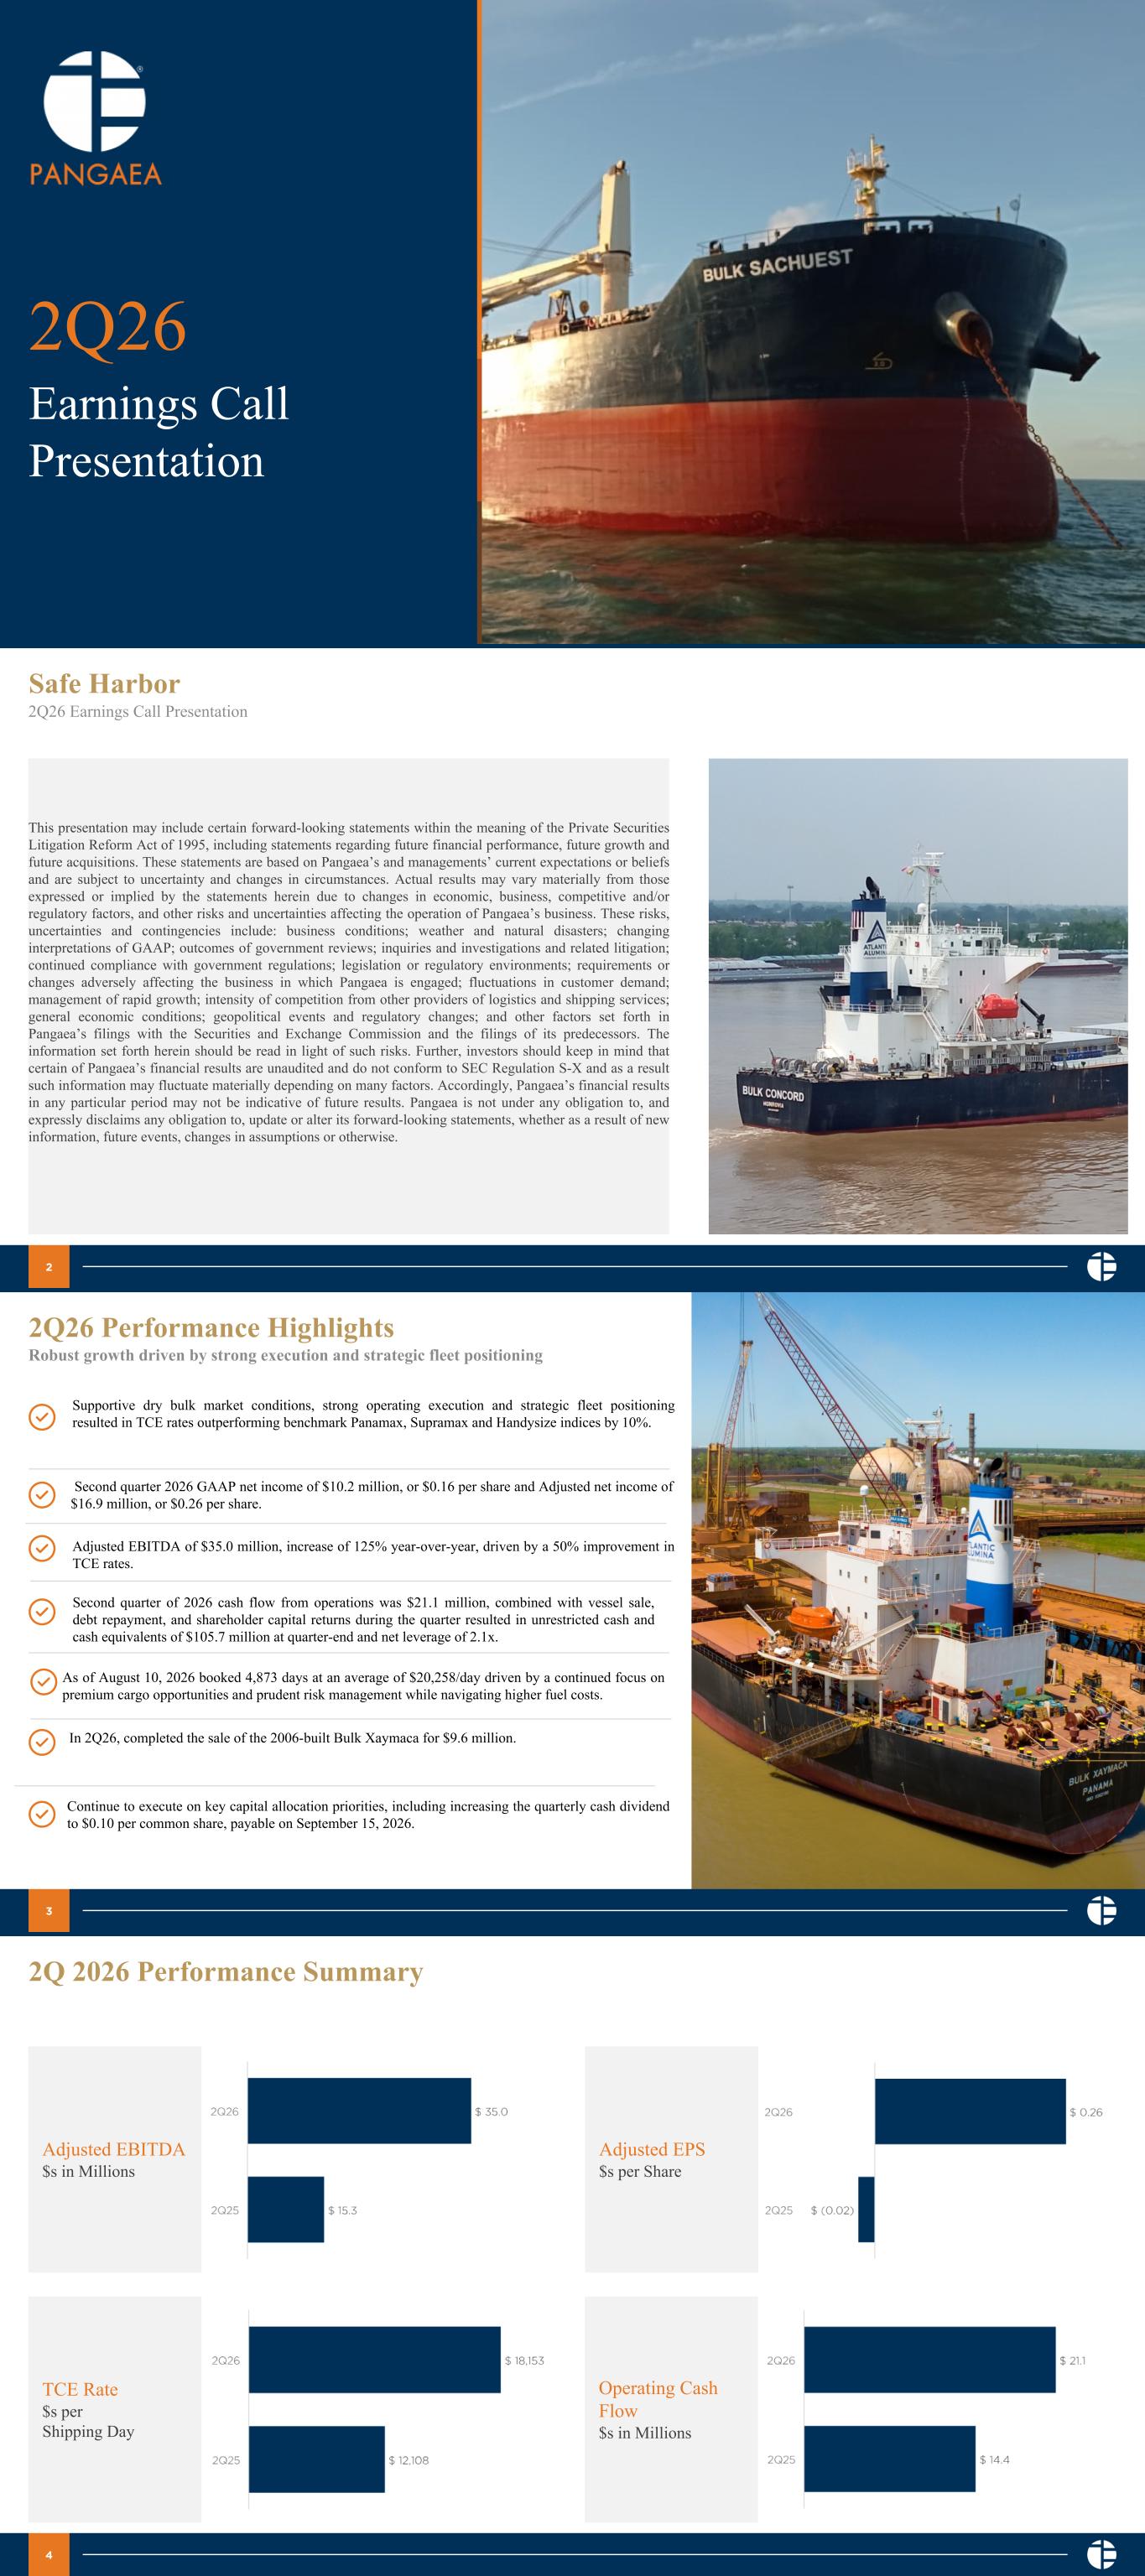
•GAAP net income attributable to Pangaea of $10.2 million, or $0.16 per share
•Adjusted net income attributable to Pangaea of $16.9 million, or $0.26 per share
•Adjusted EBITDA of $35.0 million
•Operating cash flow of $21.1 million
•Time Charter Equivalent ("TCE") rates earned by Pangaea of $18,153 per day
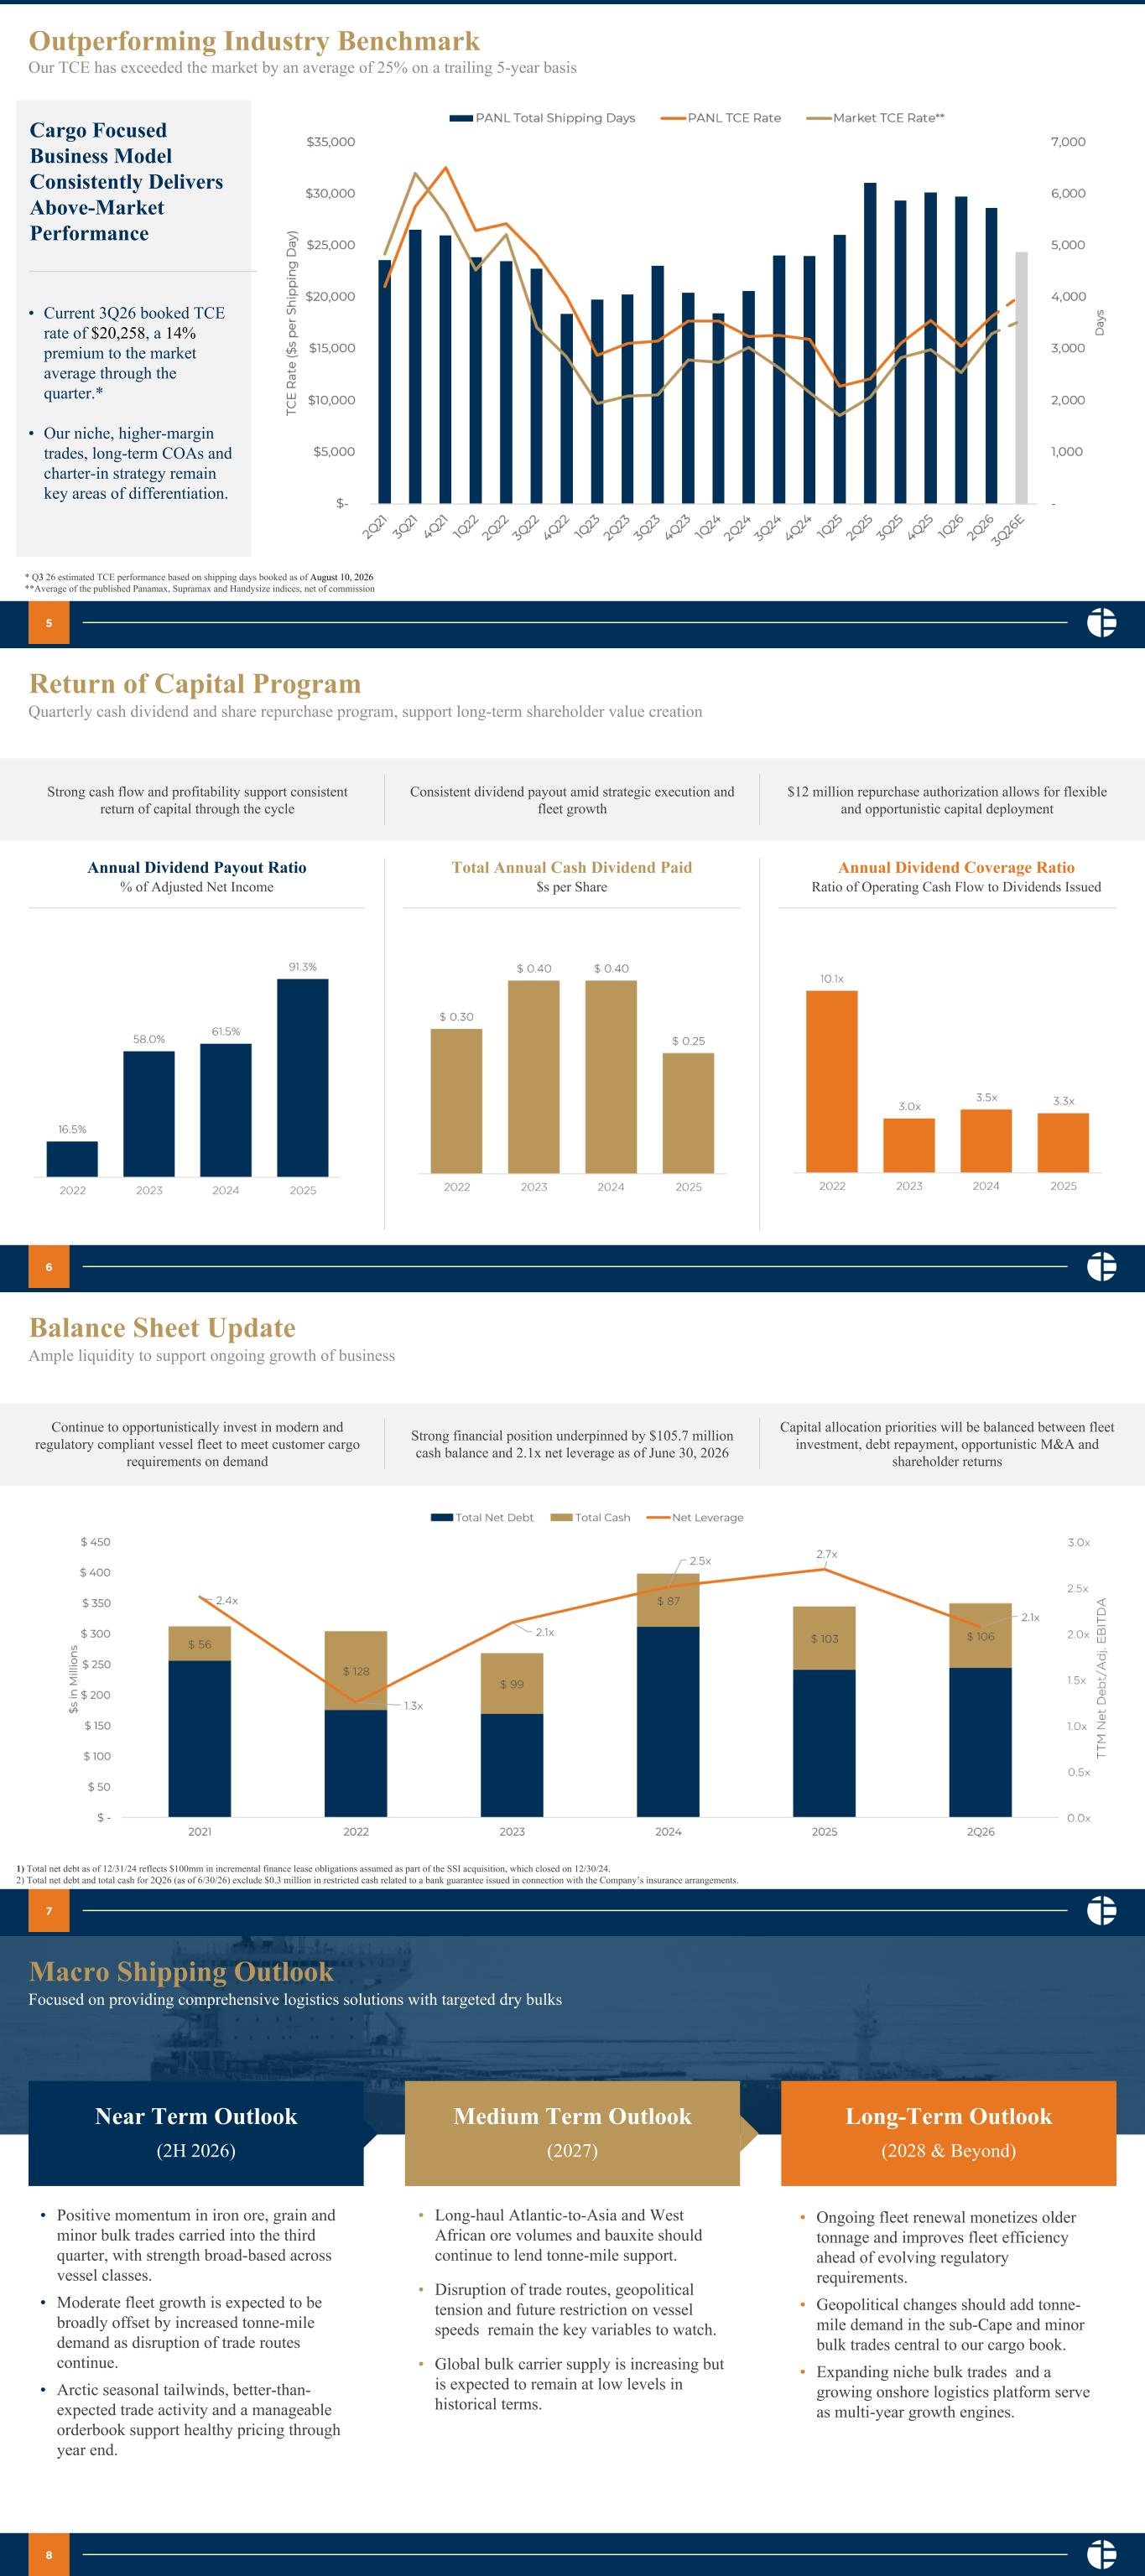
•Pangaea’s TCE rates exceeded the average Baltic Panamax, Supramax, and Handysize indices by 10%
•Ratio of net debt to trailing twelve-month Adjusted EBITDA of 2.1x
•Declared quarterly cash dividend of $0.10 per common share
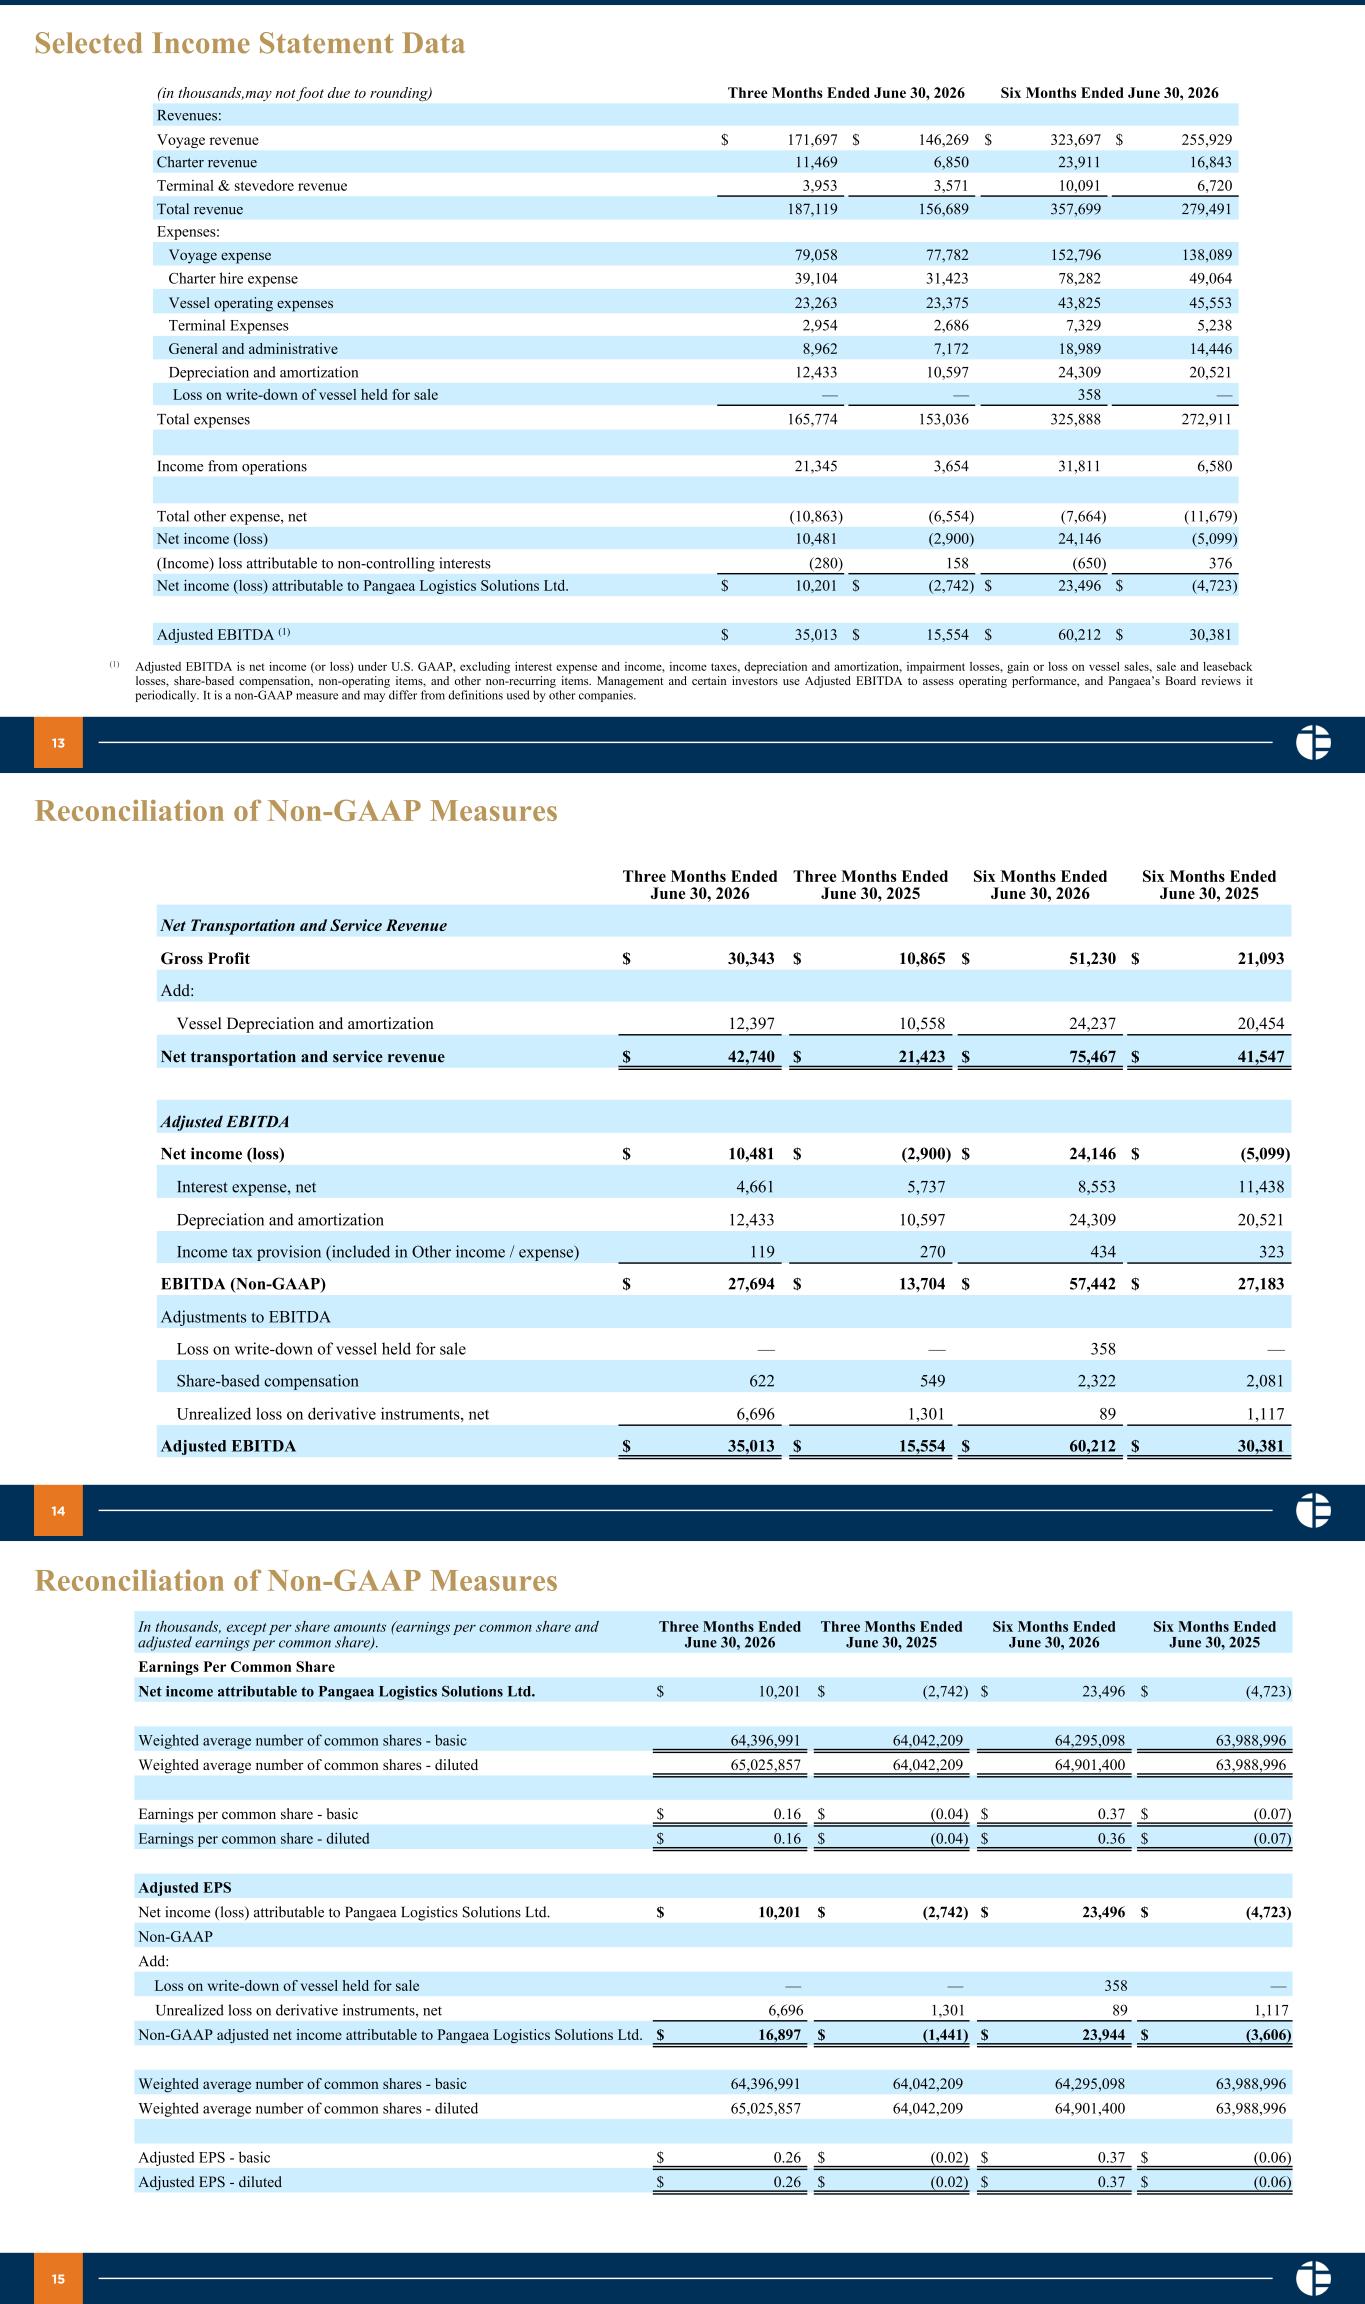
For the three months ended June 30, 2026, Pangaea reported non-GAAP adjusted net income of $16.9 million, or $0.26 net income per share, on total revenue of $187.1 million. Second quarter TCE rates increased 50% on a year-over-year basis, while total shipping days, which include both voyage and time charter days, decreased 8% to 5,735 days primarily due the sale of two owned vessels in the fleet compared to the prior-year period.
The TCE earned was $18,153 per day for the three months ended June 30, 2026, compared to an average of $12,108 per day for the same period in 2025. During the second quarter ended June 30, 2026, the Company’s average TCE rate exceeded the benchmark average Baltic Panamax, Supramax, and Handysize indices by 10%, supported by Pangaea’s long-term contracts of affreightment ("COAs"), specialized fleet, and cargo-focused strategy.
Total Adjusted EBITDA increased by 125.1% to $35.0 million in the second quarter of 2026, compared to the prior-year period. Total Adjusted EBITDA margin was 18.7% during the second quarter of 2026, compared to 9.8% during the prior year period.
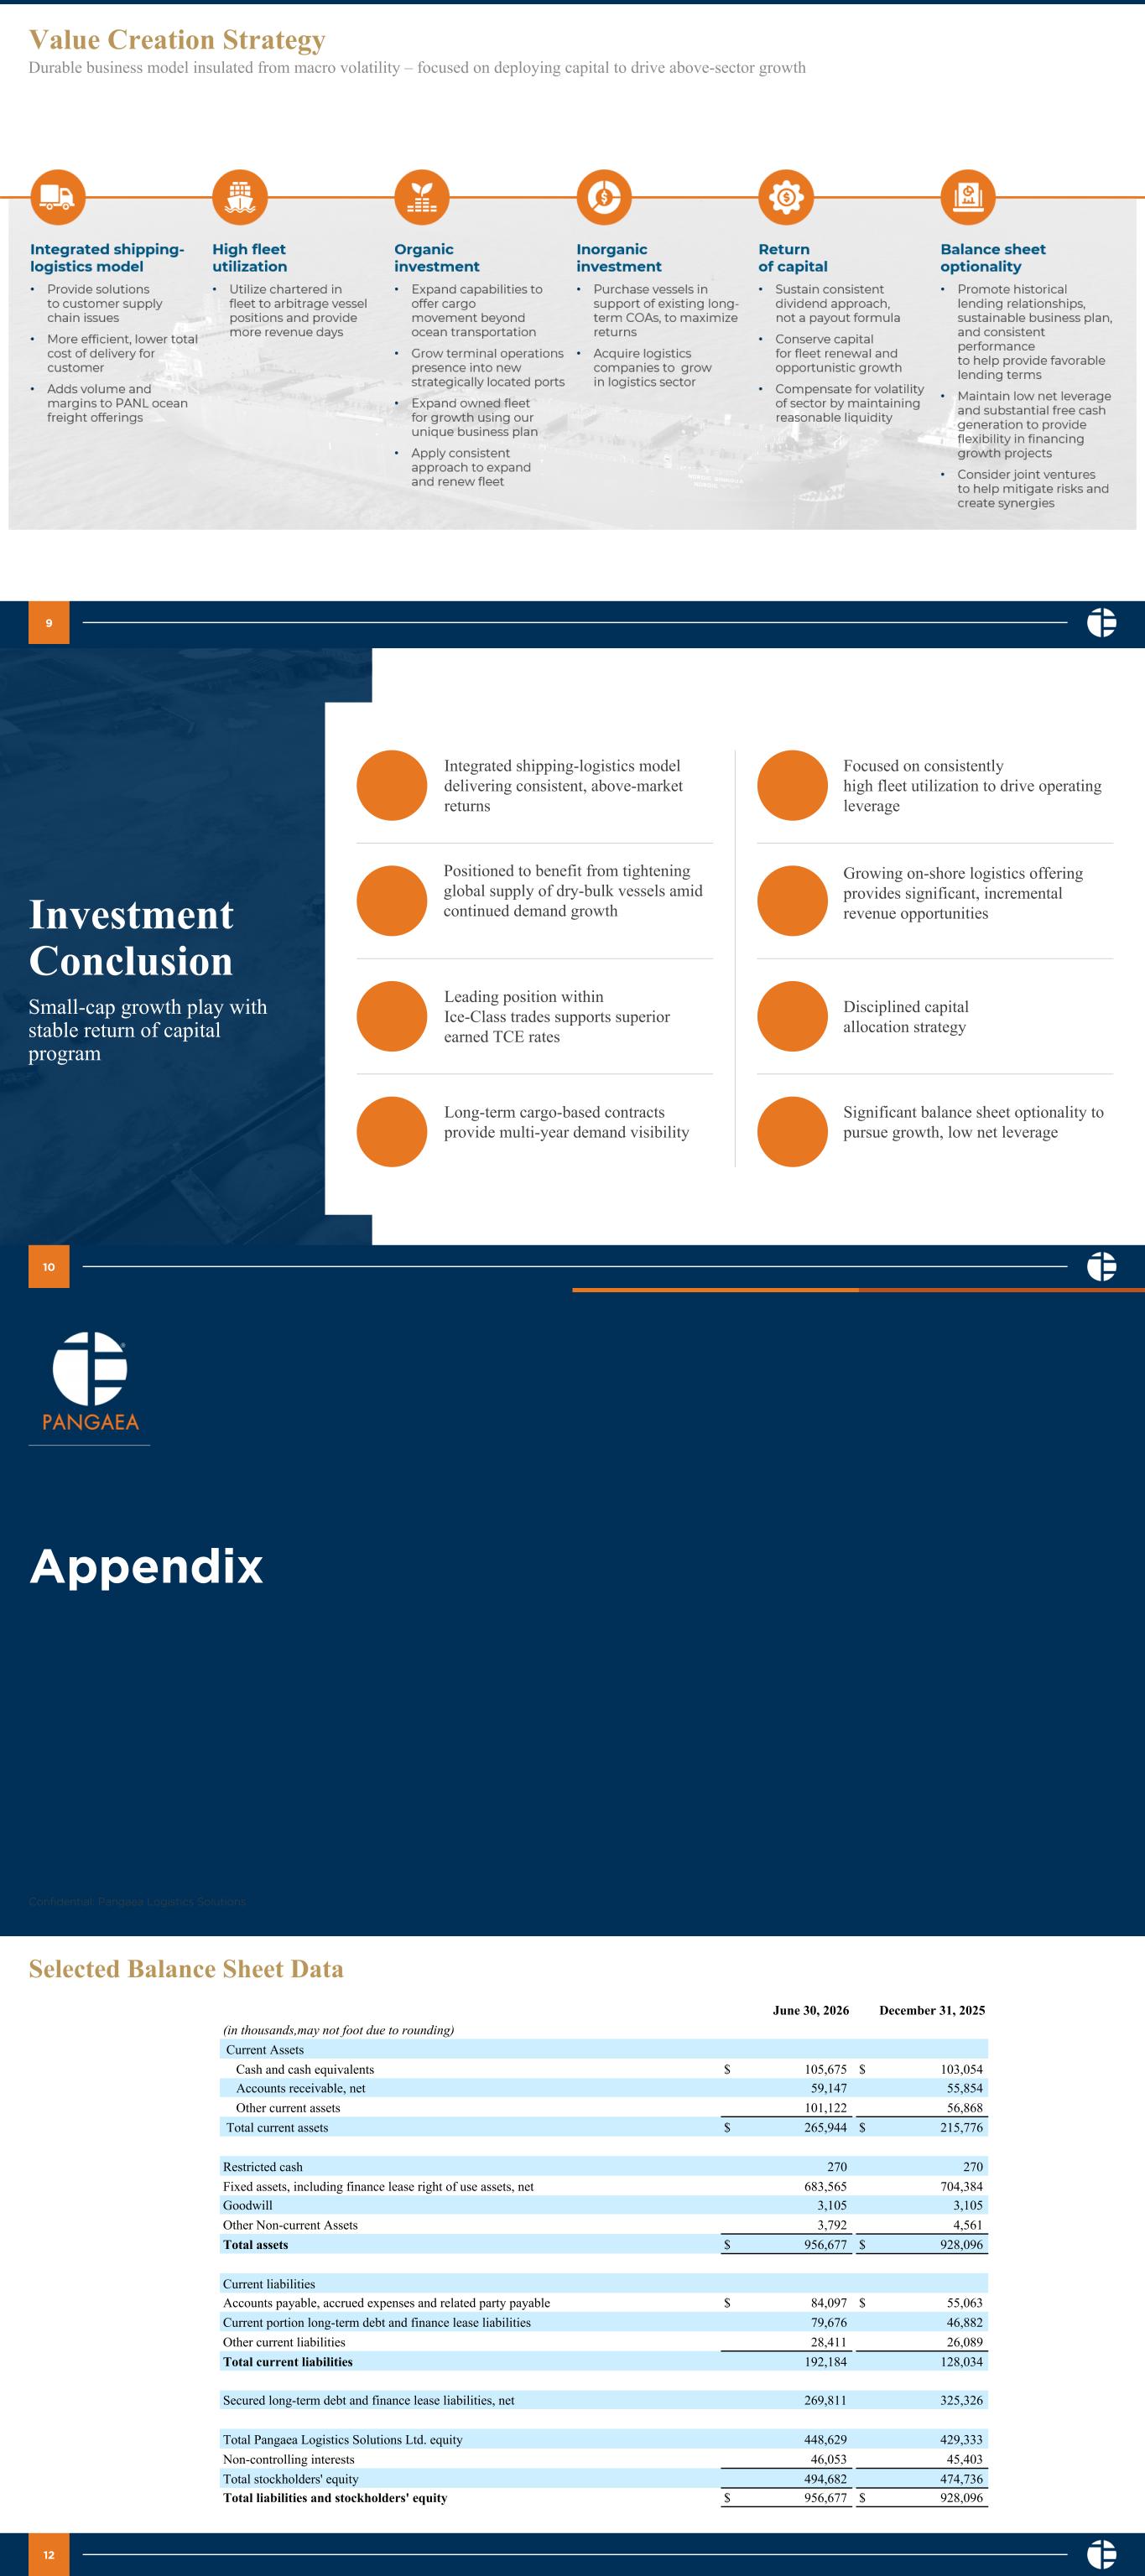
As of June 30, 2026, the Company had $105.7 million in unrestricted cash and cash equivalents. Total debt, including finance lease obligations was $352.4 million. During the three months ending June 30, 2026, the Company made payments of $4.3 million on long-term debt, $7.0 million on financing obligations, and $0.3 million on finance lease liabilities. The Company also paid $3.2 million in dividends.
The Company’s Board of Directors also declared a quarterly cash dividend of $0.10 per common share, payable on September 15, 2026, to shareholders of record as of the close of business on September 1, 2026.
MANAGEMENT COMMENTARY
“Our strong execution, fleet positioning and favorable market conditions combined to generate robust year-over-year growth on both our top and bottom line in the second quarter,” stated Mads Boye Petersen, President and Chief Executive Officer of Pangaea Logistics Solutions. “Our performance reflects our focus on the positioning of our fleet to enable us to capitalize on back haul opportunities and expand our presence in the Pacific market. While shipping days were down compared to the prior year period, we generated an increase in TCE rates of 50% year-over-year and outperformed market rates by 10%. In our Atlantic markets, we increased our exposure to shorter-term time charters and executed well with our chartered-in business by taking advantage of arbitrage opportunities and efficiently trade our owned vessels, which further enhanced our second quarter financial results.”
“Demand for dry bulk shipping has been strong through the first half of the year,” Petersen noted. “Chinese iron ore imports and the transport of grains from the Atlantic to Asia have been key factors underpinning market fundamentals thus far in 2026. These favorable dynamics have continued into the third quarter, and quarter-to-date we have executed 4,873 shipping days at an average TCE of $20,258 per day, as we enter our premium summer ice class season."
"Our strong second quarter profitability drove increased cash flow during the second quarter, which enhanced our liquidity position. Our financial flexibility enables us to take a balanced, returns-focused approach to capital,” continued Petersen. “We continue to prioritize sustainable returns of capital and selective organic growth investments, all with the objective of enhancing long-term shareholder value. During the quarter, we advanced our port expansion strategy with the start-up of operations at Port Tampa Bay, Florida.”
“Looking ahead, we are focused on maintaining commercial discipline, efficient execution across our platform and continuing to grow our integrated logistics capabilities,” concluded Petersen. “With a dynamic operating model, a strong liquidity position and a
clear capital allocation strategy, we believe Pangaea is well positioned to navigate changing market conditions while continuing to create value for shareholders."
STRATEGIC UPDATE
Pangaea remains committed to developing a leading dry bulk logistics and transportation services company of scale, providing its customers with specialized shipping and supply chain and logistics offerings in commodity and niche markets that drive premium returns measured in time charter equivalent per day.
Growing our combined shipping and logistics model. Pangaea continues to grow its integrated shipping and logistics model to deliver increased value across the dry bulk supply chain. In addition to operating a specialized fleet of dry bulk vessels, the Company provides stevedoring services and maintains port and terminal operations capabilities that complement its core shipping platform. During the second quarter of 2026, the Company continued to advance its organic growth strategy by scaling its port and terminal operations with the start-up of new operations at Port Tampa Bay, Florida. This investment is designed to expand the Company’s logistics activities, strengthen customer relationships and support long-term growth through a broader service offering.
Continue to drive strong fleet utilization. Pangaea delivered strong fleet utilization during the second quarter, supported by strategic fleet positioning to capitalize on back haul opportunities as well as on a favorable demand environment in the Pacific. The Company’s owned fleet of 38 vessels operated at high efficiency, supplemented by an average of 26 chartered-in vessels to fulfill cargo and COA commitments. Following the successful integration of the recently acquired handy-size fleet, Pangaea remains focused on optimizing utilization across its expanded platform and enhancing flexibility to meet the evolving needs of its customers.
Continue to upgrade fleet, while divesting older, non-core assets. Pangaea continues to execute its disciplined fleet renewal strategy, selectively investing in modern assets to support TCE performance, comply with evolving regulatory standards and meet customer cargo requirements. In February 2026, the Company entered into an agreement to sell the 2006-built Bulk Xaymaca for $9.6 million, a transaction that was completed in the second quarter of 2026. These actions reflect Pangaea’s continued commitment to maintaining a modern, efficient fleet and divesting older, non-core assets.
SECOND QUARTER 2026 CONFERENCE CALL
The Company’s management team will host a conference call to discuss the Company’s financial results on Tuesday, August 11, 2026 at 8:00 a.m., Eastern Time (ET). Accompanying presentation materials will be available in the Investor Relations section of the Company’s website at https://www.pangaeals.com/investors/.
To participate in the live teleconference:
Domestic Live: 1-833-316-1983
International Live: 1-785-838-9310
Conference ID: PANLQ226
To listen to a replay of the teleconference, which will be available through August 18, 2026:
Domestic Replay: 1-800-925-9941
International Replay: 1-402-220-5395
Pangaea Logistics Solutions Ltd.
Unaudited Interim Condensed Consolidated Statements of Operations
(U.S. Dollars in thousands, except for share and per share data)
|
|
|
|
|
|
|
|
|
|
|
|
|
|
|
|
|
|
|
|
|
|
|
|
|
Three Months Ended June 30, |
|
Six Months Ended June 30, |
|
2026 |
|
2025 |
|
2026 |
|
2025 |
| Revenues: |
|
|
|
|
|
|
|
| Voyage revenue |
$ |
171,697 |
|
|
$ |
146,269 |
|
|
$ |
323,697 |
|
|
$ |
255,929 |
|
| Charter revenue |
11,469 |
|
|
6,850 |
|
|
23,911 |
|
|
16,843 |
|
| Port terminal & stevedore revenue |
3,953 |
|
|
3,571 |
|
|
10,091 |
|
|
6,720 |
|
| Total revenues, net |
187,119 |
|
|
156,689 |
|
|
357,699 |
|
|
279,491 |
|
| Expenses: |
|
|
|
|
|
|
|
| Voyage expense |
79,058 |
|
|
77,782 |
|
|
152,796 |
|
|
138,089 |
|
| Charter hire expense |
39,104 |
|
|
31,423 |
|
|
78,282 |
|
|
49,064 |
|
| Vessel operating expense |
23,263 |
|
|
23,375 |
|
|
43,825 |
|
|
45,553 |
|
| Terminal & Stevedore Expenses |
2,954 |
|
|
2,686 |
|
|
7,329 |
|
|
5,238 |
|
| General and administrative |
8,962 |
|
|
7,172 |
|
|
18,989 |
|
|
14,446 |
|
| Depreciation and amortization |
12,433 |
|
|
10,597 |
|
|
24,309 |
|
|
20,521 |
|
| Loss on write-down of vessel held for sale |
— |
|
|
— |
|
|
358 |
|
|
— |
|
|
|
|
|
|
|
|
|
| Total expenses |
165,774 |
|
|
153,036 |
|
|
325,888 |
|
|
272,911 |
|
|
|
|
|
|
|
|
|
| Income from operations |
21,345 |
|
|
3,654 |
|
|
31,811 |
|
|
6,580 |
|
|
|
|
|
|
|
|
|
| Other income (expense): |
|
|
|
|
|
|
|
| Interest expense |
(5,730) |
|
|
(6,028) |
|
|
(11,674) |
|
|
(12,174) |
|
| Interest income |
1,069 |
|
|
292 |
|
|
3,121 |
|
|
736 |
|
|
|
|
|
|
|
|
|
| Unrealized loss on derivative instruments, net |
(6,696) |
|
|
(1,301) |
|
|
(89) |
|
|
(1,117) |
|
| Other income |
494 |
|
|
484 |
|
|
978 |
|
|
877 |
|
| Total other income (expense), net |
(10,863) |
|
|
(6,554) |
|
|
(7,664) |
|
|
(11,679) |
|
|
|
|
|
|
|
|
|
| Net income (loss) |
10,481 |
|
|
(2,900) |
|
|
24,146 |
|
|
(5,099) |
|
| (Income) loss attributable to non-controlling interests |
(280) |
|
|
158 |
|
|
(650) |
|
|
376 |
|
| Net income (loss) attributable to Pangaea Logistics Solutions Ltd. |
$ |
10,201 |
|
|
$ |
(2,742) |
|
|
$ |
23,496 |
|
|
$ |
(4,723) |
|
|
|
|
|
|
|
|
|
| Net income (loss) per common share |
|
|
|
|
|
|
|
| Basic |
$ |
0.16 |
|
|
$ |
(0.04) |
|
|
$ |
0.37 |
|
|
$ |
(0.07) |
|
| Diluted |
$ |
0.16 |
|
|
$ |
(0.04) |
|
|
$ |
0.36 |
|
|
$ |
(0.07) |
|
|
|
|
|
|
|
|
|
| Weighted average shares used to compute earnings per common share: |
|
|
|
|
|
|
|
| Basic |
64,396,991 |
|
|
64,042,209 |
|
|
64,295,098 |
|
|
63,988,996 |
|
| Diluted |
65,025,857 |
|
|
64,042,209 |
|
|
64,901,400 |
|
|
63,988,996 |
|
Amounts presented in the accompanying consolidated financial statements are expressed in thousands of U.S. dollars unless otherwise indicated. Certain amounts may not sum due to rounding.
Pangaea Logistics Solutions Ltd.
Unaudited Interim Condensed Consolidated Balance Sheets
(U.S. Dollars in thousands, except for share and per share data)
|
|
|
|
|
|
|
|
|
|
|
|
|
June 30, 2026 |
|
December 31, 2025 |
| Assets |
|
|
|
| Current assets |
|
|
|
| Cash and cash equivalents |
$ |
105,675 |
|
|
$ |
103,054 |
|
|
|
|
|
| Accounts receivable (net of allowance of $6,536 and $6,017 at June 30, 2026 and December 31, 2025, respectively) |
59,147 |
|
|
55,854 |
|
| Inventories |
51,095 |
|
|
28,389 |
|
| Advance hire, prepaid expenses and other current assets |
50,027 |
|
|
28,478 |
|
|
|
|
|
| Total current assets |
265,944 |
|
|
215,776 |
|
|
|
|
|
| Restricted cash |
270 |
|
|
270 |
|
Fixed assets, at cost, net of accumulated depreciation of $200,962 and $179,988 at June 30, 2026 and December 31, 2025, respectively |
667,189 |
|
|
677,518 |
|
|
|
|
|
Finance lease right of use assets, at cost, net of accumulated depreciation of $7,648 and $12,678 at June 30, 2026 and December 31, 2025, respectively |
16,376 |
|
|
26,866 |
|
| Goodwill |
3,105 |
|
|
3,105 |
|
| Other non-current Assets |
3,792 |
|
|
4,561 |
|
| Total assets |
$ |
956,677 |
|
|
$ |
928,096 |
|
|
|
|
|
| Liabilities and stockholders' equity |
|
|
|
| Current liabilities |
|
|
|
| Accounts payable, accrued expenses and other current liabilities |
$ |
83,012 |
|
|
$ |
54,257 |
|
| Affiliated companies payable |
1,085 |
|
|
806 |
|
| Deferred revenue |
27,805 |
|
|
24,891 |
|
| Current portion of secured long-term debt |
40,155 |
|
|
16,910 |
|
| Current portion of financing obligations |
38,521 |
|
|
27,896 |
|
| Current portion of finance lease liabilities |
1,000 |
|
|
2,076 |
|
| Dividend payable |
607 |
|
|
1,198 |
|
| Total current liabilities |
192,184 |
|
|
128,034 |
|
|
|
|
|
| Noncurrent liabilities |
|
|
|
| Secured long-term debt, net |
66,542 |
|
|
97,157 |
|
| Financing obligations, net |
195,360 |
|
|
219,774 |
|
| Long-term liabilities - other |
7,909 |
|
|
8,395 |
|
| Total noncurrent liabilities |
269,811 |
|
|
325,326 |
|
|
|
|
|
| Stockholders' equity: |
|
|
|
|
|
|
|
Common stock, $0.0001 par value, 100,000,000 shares authorized; 65,473,772 shares issued and outstanding at June 30, 2026; 64,973,988 shares issued and outstanding at December 31, 2025 |
7 |
|
|
7 |
|
| Additional paid-in capital |
259,394 |
|
|
257,072 |
|
| Retained earnings |
189,228 |
|
|
172,255 |
|
| Total Pangaea Logistics Solutions Ltd. equity |
448,629 |
|
|
429,333 |
|
| Non-controlling interests |
46,053 |
|
|
45,403 |
|
| Total stockholders' equity |
494,682 |
|
|
474,736 |
|
| Total liabilities and stockholders' equity |
$ |
956,677 |
|
|
$ |
928,096 |
|
Pangaea Logistics Solutions, Ltd.
Unaudited Interim Condensed Consolidated Statements of Cash Flows
(U.S. dollars in thousands, except per share data)
|
|
|
|
|
|
|
|
|
|
|
|
|
Six Months Ended June 30, |
|
2026 |
|
2025 |
| Operating activities |
|
|
|
| Net income (loss) |
$ |
24,146 |
|
|
$ |
(5,099) |
|
| Adjustments to reconcile net income to net cash provided by operations: |
|
|
|
| Depreciation and amortization expense |
24,309 |
|
|
20,521 |
|
| Amortization of deferred financing costs |
517 |
|
|
611 |
|
| Amortization of prepaid rent |
59 |
|
|
60 |
|
| Unrealized (gain) loss on derivative instruments |
89 |
|
|
1,117 |
|
| Income from equity method investee |
(1,240) |
|
|
(877) |
|
|
|
|
|
| Provision for doubtful accounts |
904 |
|
|
1,066 |
|
| Loss on write-down of vessel held for sale |
358 |
|
|
— |
|
|
|
|
|
| Drydocking costs |
(8,946) |
|
|
(11,945) |
|
| Share-based compensation |
2,322 |
|
|
2,081 |
|
| Change in operating assets and liabilities: |
|
|
|
| Accounts receivable |
(4,197) |
|
|
(8,021) |
|
| Inventories |
(22,706) |
|
|
(5,736) |
|
| Advance hire, prepaid expenses and other current assets |
(22,079) |
|
|
(355) |
|
| Accounts payable, accrued expenses and other current liabilities |
29,426 |
|
|
13,572 |
|
| Deferred revenue |
2,914 |
|
|
3,044 |
|
| Net cash provided by operating activities |
25,878 |
|
|
10,039 |
|
|
|
|
|
| Investing activities |
|
|
|
| Purchase of vessels, vessel improvements and equipment |
(684) |
|
|
(223) |
|
|
|
|
|
| Purchase of fixed assets and equipment |
(3,740) |
|
|
(1,346) |
|
| Proceeds from sale of vessels and equipment |
9,678 |
|
|
— |
|
|
|
|
|
| Dividends received from equity method investments |
1,100 |
|
|
— |
|
| Distributions from (Contributions to) non-consolidated subsidiaries |
754 |
|
|
(842) |
|
| Net cash provided by (used in) investing activities |
7,109 |
|
|
(2,411) |
|
|
|
|
|
| Financing activities |
|
|
|
| Proceeds from long-term debt |
812 |
|
|
— |
|
|
|
|
|
| Payments of long-term debt |
(8,471) |
|
|
(8,269) |
|
|
|
|
|
| Payments of financing obligations |
(14,017) |
|
|
(12,602) |
|
| Payments of finance leases |
(1,576) |
|
|
(1,422) |
|
| Dividends paid to non-controlling interests |
— |
|
|
(1,942) |
|
| Cash dividends paid |
(7,114) |
|
|
(9,939) |
|
| Payments to repurchase ordinary shares |
— |
|
|
(1,007) |
|
|
|
|
|
|
|
|
|
| Net cash used in financing activities |
(30,366) |
|
|
(35,180) |
|
|
|
|
|
| Net change in cash and cash equivalents |
2,621 |
|
|
(27,553) |
|
| Cash and cash equivalents at beginning of period |
103,054 |
|
|
86,805 |
|
| Cash, cash equivalents, and restricted cash at end of period |
$ |
105,675 |
|
|
$ |
59,253 |
|
|
|
|
|
| Supplemental cash flow information |
|
|
|
| Cash and cash equivalents |
$ |
105,675 |
|
|
$ |
63,949 |
|
| Restricted cash |
270 |
|
|
— |
|
| Total cash, cash equivalents and restricted cash at end of period |
$ |
105,945 |
|
|
$ |
63,949 |
|
| Capital expenditures included in accounts payable and accrued expenses |
$ |
3,399 |
|
|
$ |
2,010 |
|
Pangaea Logistics Solutions Ltd.
Reconciliation of Non-GAAP Measures
(unaudited)
|
|
|
|
|
|
|
|
|
|
|
|
|
|
|
|
|
|
|
|
|
|
|
|
|
|
|
|
|
Three Months Ended June 30, |
|
Six Months Ended June 30, |
|
|
2026 |
|
2025 |
|
2026 |
|
2025 |
| Net Transportation and Service Revenue |
|
|
|
|
|
|
|
|
| Gross Profit |
|
$ |
30,343 |
|
|
$ |
10,865 |
|
|
$ |
51,230 |
|
|
$ |
21,093 |
|
| Add: |
|
|
|
|
|
|
|
|
| Vessel Depreciation and Amortization |
|
12,397 |
|
|
10,558 |
|
|
24,237 |
|
|
20,454 |
|
| Net transportation and service revenue |
|
$ |
42,740 |
|
|
$ |
21,423 |
|
|
$ |
75,467 |
|
|
$ |
41,547 |
|
|
|
|
|
|
|
|
|
|
| Adjusted EBITDA |
|
|
|
|
|
|
|
|
| Net income (loss) |
|
10,481 |
|
|
(2,900) |
|
|
24,146 |
|
|
(5,099) |
|
| Interest expense, net |
|
4,661 |
|
|
5,737 |
|
|
8,553 |
|
|
11,438 |
|
|
|
|
|
|
|
|
|
|
| Depreciation and amortization |
|
12,433 |
|
|
10,597 |
|
|
24,309 |
|
|
20,521 |
|
| Income tax provision (included in Other income / expense) |
|
119 |
|
|
270 |
|
|
434 |
|
|
323 |
|
| EBITDA |
|
$ |
27,694 |
|
|
$ |
13,704 |
|
|
$ |
57,442 |
|
|
$ |
27,183 |
|
| Non-GAAP Adjustments: |
|
|
|
|
|
|
|
|
| Loss on write-down of vessel held for sale |
|
— |
|
|
— |
|
|
358 |
|
|
— |
|
|
|
|
|
|
|
|
|
|
| Share-based compensation |
|
622 |
|
|
549 |
|
|
2,322 |
|
|
2,081 |
|
| Unrealized loss on derivative instruments, net |
|
6,696 |
|
|
1,301 |
|
|
89 |
|
|
1,117 |
|
| Adjusted EBITDA (Non-GAAP) |
|
$ |
35,013 |
|
|
$ |
15,554 |
|
|
$ |
60,212 |
|
|
$ |
30,381 |
|
|
|
|
|
|
|
|
|
|
| Net income (loss) per common share |
|
|
|
|
|
|
|
|
| Net income (loss) attributable to Pangaea Logistics Solutions Ltd. |
|
$ |
10,201 |
|
|
$ |
(2,742) |
|
|
$ |
23,496 |
|
|
$ |
(4,723) |
|
|
|
|
|
|
|
|
|
|
| Weighted average number of common shares outstanding - basic |
|
64,396,991 |
|
|
64,042,209 |
|
|
64,295,098 |
|
|
63,988.996 |
|
| Weighted average number of common shares outstanding - diluted |
|
65,025,857 |
|
|
64,042,209 |
|
|
64,901,400 |
|
|
63,988.996 |
|
|
|
|
|
|
|
|
|
|
| Basic net income (loss) per share |
|
$ |
0.16 |
|
|
$ |
(0.04) |
|
|
$ |
0.37 |
|
|
$ |
(0.07) |
|
| Diluted net income (loss) per share |
|
$ |
0.16 |
|
|
$ |
(0.04) |
|
|
$ |
0.36 |
|
|
$ |
(0.07) |
|
|
|
|
|
|
|
|
|
|
| Adjusted EPS |
|
|
|
|
|
|
|
|
| Net income (loss) attributable to Pangaea Logistics Solutions Ltd. |
|
$ |
10,201 |
|
|
$ |
(2,742) |
|
|
$ |
23,496 |
|
|
$ |
(4,723) |
|
| Non-GAAP |
|
|
|
|
|
|
|
|
| Add: |
|
|
|
|
|
|
|
|
| Loss on write-down of vessel held for sale |
|
— |
|
|
— |
|
|
358 |
|
|
— |
|
|
|
|
|
|
|
|
|
|
| Unrealized loss on derivative instruments, net |
|
6,696 |
|
|
1,301 |
|
|
89 |
|
|
1,117 |
|
| Non-GAAP adjusted net income attributable to Pangaea Logistics Solutions Ltd. |
|
$ |
16,897 |
|
|
$ |
(1,441) |
|
|
$ |
23,944 |
|
|
$ |
(3,606) |
|
|
|
|
|
|
|
|
|
|
| Weighted average number of common shares - basic |
|
64,396,991 |
|
|
64,042,209 |
|
|
64,295,098 |
|
|
63,988,996 |
|
| Weighted average number of common shares - diluted |
|
65,025,857 |
|
|
64,042,209 |
|
|
64,901,400 |
|
|
63,988,996 |
|
|
|
|
|
|
|
|
|
|
| Adjusted EPS - basic |
|
$ |
0.26 |
|
|
$ |
(0.02) |
|
|
$ |
0.37 |
|
|
$ |
(0.06) |
|
| Adjusted EPS - diluted |
|
$ |
0.26 |
|
|
$ |
(0.02) |
|
|
$ |
0.37 |
|
|
$ |
(0.06) |
|
Amounts presented in the accompanying consolidated financial statements are expressed in thousands of U.S. dollars unless otherwise indicated. Certain amounts may not sum due to rounding.
INFORMATION ABOUT NON-GAAP FINANCIAL MEASURES. As used herein, “GAAP” refers to accounting principles generally accepted in the United States of America. To supplement our consolidated financial statements prepared and presented in accordance with GAAP, this earnings release discusses non-GAAP financial measures, including non-GAAP net revenue and non-GAAP adjusted EBITDA. This is considered a non-GAAP financial measure as defined in Rule 101 of Regulation G promulgated by the Securities and Exchange Commission. Generally, a non-GAAP financial measure is a numerical measure of a company’s historical or future performance, financial position, or cash flows that either excludes or includes amounts that are not normally excluded or included in the most directly comparable measure calculated and presented in accordance with GAAP. The presentation of this non-GAAP financial information is not intended to be considered in isolation or as a substitute for, or superior to, the financial information prepared and presented in accordance with GAAP.
We use non-GAAP financial measures for internal financial and operational decision making purposes and as a means to evaluate period-to-period comparisons of the performance and results of operations of our core business. Our management believes that non-GAAP financial measures provide meaningful supplemental information regarding the performance of our core business by excluding charges that are not incurred in the normal course of business. Non-GAAP financial measures also facilitate management's internal planning and comparisons to our historical performance and liquidity. We believe certain non-GAAP financial measures are useful to investors as they allow for greater transparency with respect to key metrics used by management in its financial and operational decision making and are used by our institutional investors and the analyst community to help them analyze the performance and operational results of our core business.
Adjusted gross profit. Adjusted gross profit is defined as GAAP gross profit excluding transportation and service depreciation and amortization. Management believes this measure provides investors with additional insight into the operating performance of the Company’s shipping, terminal and stevedoring operations by excluding non-cash depreciation and amortization expenses associated with vessels and terminal and stevedoring assets. Adjusted gross profit is not a measure recognized under U.S. GAAP and should not be considered an alternative to gross profit, operating income or net income. The Company’s definition of adjusted gross profit may not be comparable to similarly titled measures used by other companies.
Adjusted EBITDA and adjusted EPS. Adjusted EBITDA represents net income (loss), determined in accordance with U.S. GAAP, adjusted for interest expense, net, income taxes, depreciation and amortization and, when applicable, certain items that management does not consider indicative of core operating performance, including vessel impairment charges, share-based compensation, unrealized gains and losses on derivative instruments, gains or losses on vessel sale or sale and leaseback transactions, and other non-operating or non-recurring items.
Earnings per share represents net income divided by the weighted average number of common shares outstanding. Adjusted earnings per share represents net income attributable to Pangaea Logistics Solutions Ltd., adjusted when applicable for items such as vessel impairment charges, unrealized gains and losses on derivative instruments, gains or losses on vessel sale or sale and leaseback transactions, and certain non-recurring items, divided by the weighted average number of shares of common stock.
The table above provides a reconciliation of the non-GAAP financial measures presented herein to the most directly comparable financial measures prepared in accordance with GAAP.
About Pangaea Logistics Solutions Ltd.
Pangaea Logistics Solutions Ltd. (NASDAQ: PANL) and its subsidiaries (collectively, “Pangaea” or the “Company”) provides seaborne drybulk logistics and transportation services as well as terminal and stevedoring services. Pangaea utilizes its logistics expertise to service a broad base of industrial customers who require the transportation of a wide variety of drybulk cargoes, including grains, coal, iron ore, pig iron, hot briquetted iron, bauxite, alumina, cement clinker, dolomite and limestone. The Company addresses the logistics needs of its customers by undertaking a comprehensive set of services and activities, including cargo loading, cargo discharge, port and terminal operations, vessel chartering, voyage planning, and vessel technical management. Learn more at www.pangaeals.com.
Investor Relations Contacts
|
|
|
|
|
|
|
|
|
| Gianni Del Signore |
|
Stefan C. Neely |
| Chief Financial Officer |
|
Vallum Advisors |
| 401-846-7790 |
|
|
| Investors@pangaeals.com |
|
PANL@val-adv.com |
Forward-Looking Statements
Certain statements in this press release are “forward-looking statements” within the meaning of the Private Securities Litigation Act of 1995. These forward-looking statements are based on our current expectations and beliefs and are subject to a number of risk factors and uncertainties that could cause actual results to differ materially from those described in the forward-looking statements. The Company disclaims any obligation to publicly update or revise these statements whether as a result of new information, future events or otherwise, except as required by law. Such risks and uncertainties include, without limitation, the strength of world economies and currencies, general market conditions, including fluctuations in charter rates and vessel values, changes in demand for dry bulk shipping capacity, changes in our operating expenses, including bunker prices, dry-docking and insurance costs, the market for our vessels, availability of financing and refinancing, charter counterparty performance, ability to obtain financing and comply with covenants in such financing arrangements, changes in governmental rules and regulations or actions taken by regulatory authorities, potential liability from pending or future litigation, general domestic and international political conditions, potential disruption of shipping routes due to accidents or political events, vessels breakdowns and instances of off-hires and other factors, as well as other risks that have been included in filings with the Securities and Exchange Commission, all of which are available at www.sec.gov.
 エドガーで原本を確認する