株探米国株
エドガーで原本を確認する
0001820721FALSE00018207212026-08-052026-08-05

UNITED STATES
SECURITIES AND EXCHANGE COMMISSION
WASHINGTON, D.C. 20549 

FORM 8-K 

CURRENT REPORT
Pursuant to Section 13 or 15(d)
of the Securities Exchange Act of 1934
Date of Earliest Event Reported: August 5, 2026 
ARRAY TECHNOLOGIES, INC.
(Exact Name of Registrant as Specified in its Charter) 
 
Delaware
001-39613
83-2747826
(State or Other Jurisdiction
of Incorporation)
(Commission
File Number)
(IRS Employer
Identification No.)
3901 Midway Place NE
Albuquerque, New Mexico 87109
(Address of Principal Executive Offices) (Zip Code)
Registrant’s telephone number, including area code: (505881-7567 
Check the appropriate box below if the Form 8-K filing is intended to simultaneously satisfy the filing obligation of the registrant under any of the following provisions: 
Written communications pursuant to Rule 425 under the Securities Act (17 CFR 230.425)
Soliciting material pursuant to Rule 14a-12 under the Exchange Act (17 CFR 240.14a-12)
Pre-commencement communications pursuant to Rule 14d-2(b) under the Exchange Act (17 CFR 240.14d-2(b))
Pre-commencement communications pursuant to Rule 13e-4(c) under the Exchange Act (17 CFR 240.13e-4(c))
Securities registered pursuant to Section 12(b) of the Act:
Title of each class
Trading
Symbol(s)
Name of each exchange
on which registered
Common Stock, $0.001 Par Value
ARRY
Nasdaq Global Market
Indicate by check mark whether the registrant is an emerging growth company as defined in Rule 405 of the Securities Act of 1933 (§230.405 of this chapter) or Rule 12b-2 of the Securities Exchange Act of 1934 (§240.12b-2 of this chapter).
Emerging growth company  
If an emerging growth company, indicate by check mark if the registrant has elected not to use the extended transition period for complying with any new or revised financial accounting standards provided pursuant to Section 13(a) of the Exchange Act. ☐


Item 2.02     Results of Operations and Financial Condition.

On August 5, 2026, Array Technologies Inc. (the “Company”), announced its financial results as of and for the quarter ended June 30, 2026 by issuing a press release, a copy of which is furnished as Exhibit 99.1 to this Current Report on Form 8-K and incorporated by reference herein. In the press release, the Company also announced that it would be holding a conference call on August 5, 2026, at 5:00 p.m. Eastern Time to discuss its financial results and provide an investor presentation. A copy of the investor presentation will be posted to our website at www.arraytechinc.com and is attached as Exhibit 99.2 hereto.

The information included in Item 2.02 of this Current Report on Form 8-K and the exhibits attached hereto are being furnished and shall not be deemed “filed” for purposes of Section 18 of the Securities Exchange Act of 1934, as amended (the “Exchange Act”), or otherwise subject to the liabilities of that section, nor shall it be deemed incorporated by reference into any other filing under the Securities Act of 1933, as amended, or the Exchange Act, regardless of any general incorporation language in any such filing.


Item 9.01     Financial Statements and Exhibits.
(d) Exhibits.

The following exhibits are filed as part of this report:

Exhibit#
Description
99.1
99.2
104
Cover Page Interactive Data File (embedded within the Inline XBRL document).


SIGNATURE
Pursuant to the requirements of the Securities Exchange Act of 1934, the registrant has duly caused this report to be signed on its behalf by the undersigned hereunto duly authorized.

Array Technologies, Inc.
Date: August 5, 2026
By:
/s/ H. Keith Jennings
Name: H. Keith Jennings
Title: Chief Financial Officer


EX-99.1 2 exhibit9912026q2pressrelea.htm EX-99.1 Document

August 5, 2026

ARRAY Technologies Reports Financial Results for the Second Quarter 2026

Delivers Record $2.5 Billion Orderbook While Advancing Innovation Strategy

2026 Second Quarter Business Highlights
Record total executed contracts and awarded orders at June 30, 2026 of $2.5 billion, a 37% increase year-over-year
Over $500 million of new orders in the quarter and a trailing twelve-month book-to-bill of 1.5x
Surpassed 100 gigawatts of tracker products delivered worldwide, a significant milestone representing ARRAY’s successful leadership in the utility-scale solar industry
Formally launched DuraTrack D2STM for international markets
Announced next-generation OmniTrack®, which accommodates an industry-leading 2° of slope change between adjacent posts

2026 Second Quarter Financial Highlights
(in millions, except per share) 2Q 2026
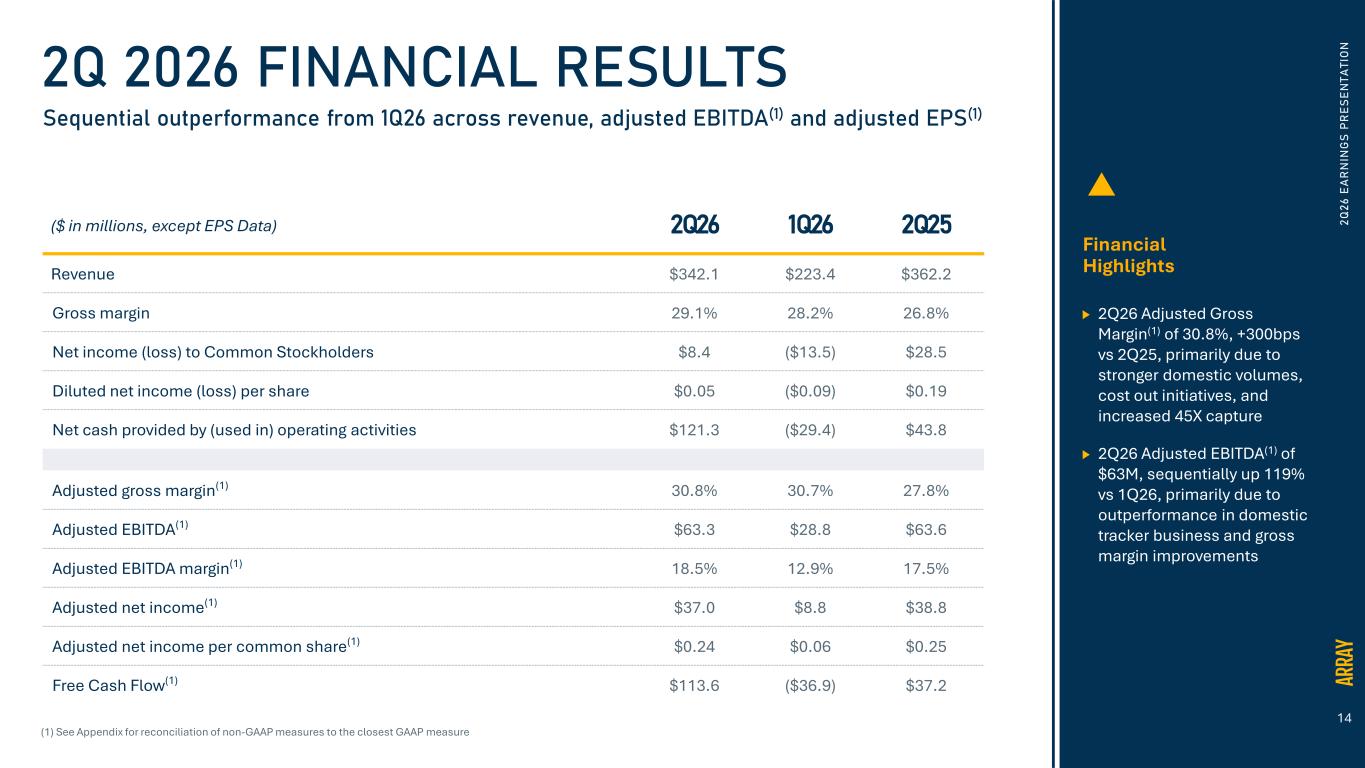
Revenue $342.1
Gross margin 29.1%
Adjusted gross margin(1)
30.8%
Net income to common stockholders $8.4
Adjusted EBITDA(1)
$63.3
Net income per basic and diluted common share $0.05
Adjusted net income per diluted common share(1)
$0.24

ALBUQUERQUE, NM — (GLOBE NEWSWIRE) — ARRAY Technologies, Inc. (NASDAQ: ARRY) (“ARRAY” or the “Company”), a leading global provider of solar tracking technology and fixed-tilt products, foundation solutions, software systems and services, today announced financial results for its second quarter ended June 30, 2026.

“ARRAY delivered a strong second quarter while achieving a significant company milestone, surpassing 100 gigawatts of cumulative tracker product shipments since our founding. For the third consecutive quarter, we achieved a record orderbook of $2.5 billion, reflecting continued share gains and strong execution. During the quarter, we advanced our innovation strategy with the formal launch of DuraTrack D2S and our next-generation OmniTrack product offerings. We continued to build on that momentum in July with the announcement of our new 60° tracker capabilities and the launch of the ARRAY AtlasTM suite of foundation-to-tracker solutions. Our pending acquisition of Affordable Wire Management (AWM)(2), will further advance our balance of system strategy by adding high-margin cable management and safety products. We remain focused on expanding our ability to provide a more integrated, technically interoperable solution set for utility-scale solar customers,” said Chief Executive Officer, Kevin G. Hostetler.

Mr. Hostetler continued, “Supported by our strong first-half financial performance, we are updating our full-year guidance. While we will continue to monitor market dynamics, we believe our $2.5 billion record orderbook, strong customer demand, and expanding solution set give us confidence in our ability to execute and create long-term value.”

1


Updating Full Year 2026 Guidance
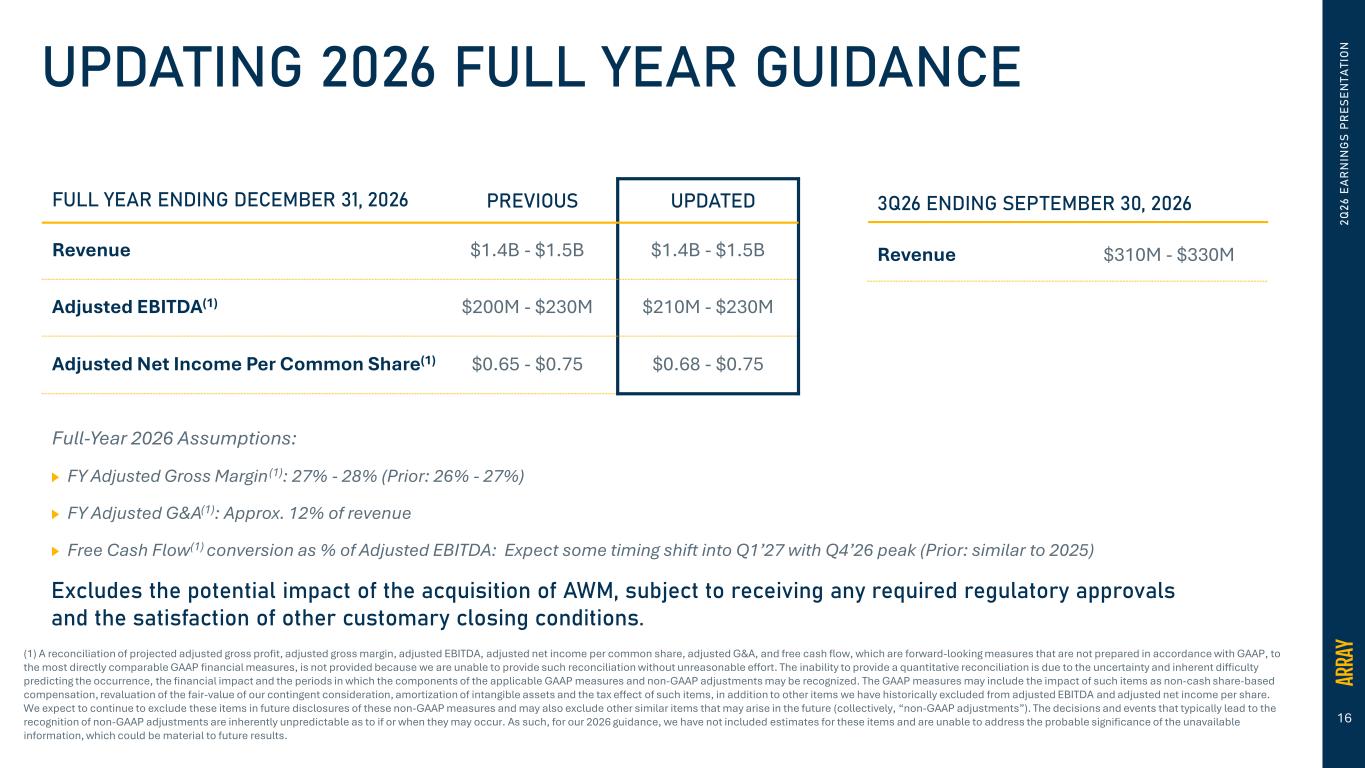
Following our strong first half performance, we now expect full-year Adjusted Gross Margin(1) to be in the range of 27% to 28%. As a result, for the year ending December 31, 2026, the Company now expects:
Revenue to be in the range of $1.4 billion to $1.5 billion, consistent with the prior range
Adjusted EBITDA(3) to be in the range of $210 million to $230 million, previously $200 million to $230 million
Adjusted net income per common share(3) to be in the range of $0.68 to $0.75, previously $0.65 to $0.75

For the quarter ending September 30, 2026, the Company expects revenue to be in the range of $310 million to $330 million.

(1) A reconciliation of the most comparable GAAP measure to its Non-GAAP measure is included below.
(2) The transaction is expected to close in the third quarter of 2026, subject to receiving any required regulatory approvals and the satisfaction of other customary closing conditions.
(3) A reconciliation of projected Adjusted gross profit, Adjusted gross margin, Adjusted EBITDA and Adjusted net income per common share, which are forward-looking measures that are not prepared in accordance with GAAP, to the most directly comparable GAAP financial measures, is not provided because we are unable to provide such reconciliation without unreasonable effort. The inability to provide a quantitative reconciliation is due to the uncertainty and inherent difficulty predicting the occurrence, the financial impact and the periods in which the components of the applicable GAAP measures and non-GAAP adjustments may be recognized. The GAAP measures may include the impact of such items as non-cash share-based compensation, revaluation of the fair-value of our contingent consideration, and the tax effect of such items, in addition to other items we have historically excluded from Adjusted EBITDA and Adjusted net income per common share. We expect to continue to exclude these items in future disclosures of these non-GAAP measures and may also exclude other similar items that may arise in the future (collectively, “non-GAAP adjustments”). The decisions and events that typically lead to the recognition of non-GAAP adjustments are inherently unpredictable as to if or when they may occur. As such, for our 2026 guidance, we have not included estimates for these items and are unable to address the probable significance of the unavailable information, which could be material to future results.

Supplemental Presentation and Conference Call Information
ARRAY has posted a supplemental presentation to its website, which will be discussed during the conference call hosted by management today, August 5, 2026, at 5:00 p.m. ET. The conference call can be accessed live over the phone by dialing (888)-396-8049 (domestic) or (416)-764-8646 (international), or via webcast of the live conference call by logging onto the Investor Relations section of the Company’s website at http://ir.arraytechinc.com. A telephonic replay will be available approximately three hours after the call by dialing (877)-660-6853 (domestic), or (201)-612-7415 (international), with the passcode 13761476. The telephonic replay will be available until 11:59 p.m. (ET) on August 19, 2026. The online replay will be available for 14 days on the same website, immediately following the call.

About ARRAY Technologies, Inc.
ARRAY Technologies (NASDAQ: ARRY) is a leading global provider of solar tracking technology and fixed-tilt systems to utility-scale and distributed generation customers, who construct, develop, and operate solar PV sites. With solutions engineered to withstand the harshest weather conditions, ARRAY’s high-quality solar trackers, fixed-tilt systems, software platforms, foundation solutions, and field services combine to optimize energy production and deliver value to our customers for the entire lifecycle of a project. Founded and headquartered in the United States, ARRAY is rooted in manufacturing and driven by technology - relying on its domestic manufacturing, diversified global supply chain, and customer-centric approach to design, deliver, commission, train, and support solar energy deployment around the world. For more news and information on ARRAY, please visit arraytechinc.com.

Investor Relations Contact:
Investor Relations
505-437-0010
investors@arraytechinc.com

2


Media Contact:
Steven Kirsch
505-738-6923
steven.kirsch@arraytechinc.com

Forward-Looking Statements
This press release contains forward-looking statements that are based on our management’s beliefs and assumptions and on information currently available to our management. Forward-looking statements include information concerning our possible or assumed future results of operations, business strategies, technology or product developments, financing and investment plans, dividend policy, competitive position, industry and regulatory environment, including potential regulatory reform related to energy credits, uncertainty relating to the implementation of tariffs and changes in trade policy, including the reduction or elimination of certain government incentives, ability to provide 100% domestic content trackers, expectations regarding the macroeconomic environment and geopolitical developments, including the effects of tariffs and changes in trade policy, potential growth opportunities and the effects of competition. Forward-looking statements include statements that are not historical facts and can be identified by terms such as “anticipate,” “believe,” “could,” “estimate,” “expect,” “intend,” “may,” “plan,” “potential,” “predict,” “project,” “seek,” “should,” “will,” “would,” “positioned, ” “designed to,” or similar expressions and the negatives of those terms.

ARRAY’s actual results and the timing of events could materially differ from those anticipated in such forward-looking statements as a result of certain risks, uncertainties and other factors, including without limitation: changes in growth or the rate of growth in demand for solar energy projects; factors outside of our control affecting the variability and demand for solar energy, including but not limited to, the retail price of electricity, availability of in-demand components like high-voltage breakers, various policies related to the permitting and interconnection costs of solar plants, and the availability of incentives for solar energy and solar energy production systems, which makes it difficult to predict our future prospects; competitive pressures within our industry; competition from conventional and renewable energy sources; a loss of one or more of our significant customers, their inability to perform under their contracts, or their default in payment; a drop in the price of electricity derived from the utility grid or from alternative energy sources; fluctuations in our results of operations across fiscal periods, which could make our future performance difficult to predict and could cause our results of operations for a particular period to fall below expectations; any increase in interest rates, or a reduction in the availability of tax equity or project debt capital in the global financial markets, which could make it difficult for customers to finance the cost of a solar energy system and reduce the demand for our products; existing electric utility industry policies and regulations, and any subsequent changes or new related policies and regulations, including as a result of the One Big Beautiful Bill Act, which may present technical, regulatory and economic barriers to the purchase and use of solar energy systems and may significantly reduce demand for our products or harm our ability to compete; the interruption of the flow of materials from international vendors, which could disrupt our supply chain, including as a result of the imposition of new and/or additional duties, tariffs and other charges or restrictions on imports and exports; changes in the global trade environment, including the continuation or imposition of import tariffs or other import restrictions; geopolitical, macroeconomic and other market conditions unrelated to our operating performance including but not limited to a pandemic, the Russia-Ukraine war, attacks on shipping in the Red Sea and Strait of Hormuz, conflict in the Middle East (including, but not limited to, the war in Iran), changing trade policies, inflation and interest rates; our ability to convert our orders in backlog into revenue; the reduction, elimination or expiration, or our failure to optimize the benefits of government incentives for, or regulations mandating the use of, renewable energy and solar energy, particularly in relation to our competitors, which could reduce demand for solar energy systems; failure to, or incurrence of significant costs in order to, obtain, maintain, protect, defend or enforce, our intellectual property and other proprietary rights; delays in construction projects and any failure to manage our inventory; significant changes in the cost of raw materials; disruptions to transportation and logistics, including increases in shipping costs; defects or performance problems in our products, which could result in loss of customers, reputational damage and decreased revenue; delays, disruptions or quality control problems in our product development operations; the development, deployment and commercialization of new products, including DuraTrack D2S, OmniTrack 2.0, the 60 degree variant of DuraTrack, and our ARRAY Atlas suite of foundation-to-tracker solutions; our ability to retain our key personnel or failure to attract
3


additional qualified personnel; additional business, financial, regulatory and competitive risks due to our continued planned expansion into new markets; cybersecurity or other data incidents, including unauthorized disclosure of personal or sensitive data or theft of confidential information and the use of artificial intelligence by cyber threat actors; a failure to maintain an effective system of integrated internal controls over financial reporting, which may impair our ability to report our financial results accurately; our substantial indebtedness, risks related to actual or threatened public health epidemics, pandemics, outbreaks or crises; changes to laws and regulations, including changes to tax laws and regulations, that are applied adversely to us or our customers; our ability to complete the acquisition of Affordable Wire Management, LLC (“AWM”) on the anticipated terms and timetable, including the possibility that closing conditions may not be satisfied or waived; our ability to successfully integrate APA Solar, LLC (“APA”) and AWM into our existing operations, realize the anticipated benefits or synergies of the acquisitions of APA and AWM and achieve strategic or other objectives relating to the acquisitions; risks related to any unforeseen liabilities of AWM; and other factors listed and described in more detail in the section captioned “Risk Factors” in our Annual Report on Form 10-K, our Quarterly Reports on Form 10-Q, and our other documents on file with the U.S. Securities and Exchange Commission, each of which can be found on our website, www.arraytechinc.com.

Given these uncertainties, you should not place undue reliance on forward-looking statements. Also, forward-looking statements represent our management’s beliefs and assumptions only as of the date of this press release. You should read this press release with the understanding that our actual future results may be materially different from what we expect. Except as required by law, we assume no obligation to update these forward-looking statements, or to update the reasons actual results could differ materially from those anticipated in these forward-looking statements, even if new information becomes available in the future.

Non-GAAP Financial Information
This press release includes certain financial measures that are not presented in accordance with U.S. generally accepted accounting principles (“GAAP”), including Adjusted gross profit, Adjusted gross margin, Adjusted EBITDA, Adjusted EBITDA margin, Adjusted net income, Adjusted net income per common share, Adjusted general and administrative expense and Free cash flow.

We define Adjusted gross profit as gross profit plus (i) amortization of developed technology and backlog and (ii) acquisition-related expenses. We define Adjusted gross margin as Adjusted gross profit as a percentage of revenue. We define Adjusted EBITDA as net income (loss) to common stockholders plus (i) other income, net, (ii) gain on extinguishment of debts, net, (iii) foreign currency gain, net, (iv) preferred dividends and accretion, (v) interest expense, (vi) income tax expense, (vii) depreciation expense, (viii) amortization of intangibles, (ix) amortization of developed technology and backlog, (x) equity-based compensation, (xi) change in fair value of contingent consideration, (xii) certain legal expenses, and (xiii) acquisition-related expenses. We define Adjusted EBITDA margin as Adjusted EBITDA as a percentage of revenue. We define Adjusted net income as net income (loss) to common stockholders plus (i) amortization of intangibles, (ii) amortization of developed technology and backlog, (iii) amortization of debt discount and issuance costs, (iv) gain on extinguishment of debts, net (v) Series A preferred stock accretion, (vi) equity-based compensation, (vii) change in fair value of contingent consideration, (viii) certain legal expenses, (ix) acquisition-related expenses, and (x) income tax expense adjustments. We define Adjusted general and administrative expense as general and administrative expense less (i) equity-based compensation, (ii) certain legal expenses, and (iii) acquisition-related expenses. We define Free cash flow as Net cash provided by operating activities less purchase of property, plant and equipment.

A detailed reconciliation between GAAP results and results excluding special items (“non-GAAP”) is included within this press release. We calculate net income (loss) per common share as net income (loss) to common stockholders divided by the basic and diluted weighted average number of shares outstanding for the applicable period and we define Adjusted net income per common share as Adjusted net income (as detailed above) divided by the basic and diluted weighted average number of shares outstanding for the applicable period.

We believe that these non-GAAP financial measures are provided to enhance the reader’s understanding of our past financial performance and our prospects for the future. Our management team uses these non-GAAP financial measures in
4


assessing the Company’s performance, as well as in planning and forecasting future periods. The non-GAAP financial information is presented for supplemental informational purposes only and should not be considered a substitute for financial information presented in accordance with GAAP and may be different from similarly titled non-GAAP measures used by other companies.

Among other limitations, Adjusted gross profit, Adjusted gross margin, Adjusted EBITDA, Adjusted net income, Adjusted net income per common share, Adjusted general and administrative expense and Free cash flow do not reflect our cash expenditures, or future requirements, for capital expenditures or contractual commitments; do not reflect the impact of certain cash charges resulting from matters we consider not to be indicative of our ongoing operations; do not reflect income tax expense or benefit; and other companies in our industry may calculate Adjusted gross profit, Adjusted gross margin, Adjusted EBITDA, Adjusted net income, Adjusted net income per common share, Adjusted general and administrative expense and Free cash flow differently than we do, which limits their usefulness as comparative measures. Because of these limitations, Adjusted gross profit, Adjusted gross margin, Adjusted EBITDA, Adjusted net income, Adjusted net income per common share, Adjusted general and administrative expense and Free cash flow should not be considered in isolation or as substitutes for performance measures calculated in accordance with GAAP.

We compensate for these limitations by relying primarily on our GAAP results and using Adjusted gross profit, Adjusted gross margin, Adjusted EBITDA, Adjusted net income, Adjusted net income per common share, Adjusted general and administrative expense and Free cash flow on a supplemental basis.

You should review the reconciliation of gross profit to Adjusted gross profit and Adjusted gross margin, net income (loss) to Adjusted EBITDA, Adjusted net income and Adjusted net income per common share, General and administrative expense to Adjusted general and administrative expense and Net cash used in operating activities to Free cash flow below and not rely on any single financial measure to evaluate our business.

5

Array Technologies, Inc.
Condensed Consolidated Balance Sheets (unaudited)
(in thousands, except per share and share amounts)
June 30, 2026 December 31, 2025
ASSETS
Current assets
Cash and cash equivalents $ 307,302  $ 244,388 
Restricted cash —  1,596 
Accounts receivable, net of allowance of $5,895 and $6,245, respectively
323,439  271,578 
Inventories, net 156,469  150,374 
Prepaid expenses and other 104,576  201,108 
Total current assets 891,786  869,044 
Property, plant and equipment, net 68,180  58,225 
Lease assets 92,380  97,088 
Goodwill 135,173  135,173 
Other intangible assets, net 212,472  238,579 
Deferred income tax assets 24,843  23,965 
Other assets 109,202  29,718 
Total assets $ 1,534,036  $ 1,451,792 
LIABILITIES, REDEEMABLE PERPETUAL PREFERRED STOCK AND STOCKHOLDERS' EQUITY
Current liabilities
Accounts payable $ 161,092  $ 143,994 
Accrued expenses 101,501  54,289 
Income tax payable 3,839  4,687 
Current portion of deferred revenue 105,103  128,433 
Current portion of contingent consideration 10,975  14,551 
Current portion of warranty liability 12,390  10,844 
Current portion of lease liabilities 7,411  7,662 
Current portion of debt —  10,315 
Other current liabilities 3,451  2,237 
Total current liabilities 405,762  377,012 
Deferred income tax liabilities 20,374  22,133 
Deferred revenue, net of current portion 45,385  16,794 
Contingent consideration, net of current portion 13,596  12,739 
Warranty liability, net of current portion 5,863  5,466 
Lease liabilities, net of current portion 87,726  89,552 
Long-term debt, net of current portion 657,749  658,664 
Other long-term liabilities 1,488  9,044 
Total liabilities 1,237,943  1,191,404 
Commitments and contingencies
6

Array Technologies, Inc.
Condensed Consolidated Balance Sheets (unaudited)
(in thousands, except per share and share amounts)
June 30, 2026 December 31, 2025
Series A Redeemable Perpetual Preferred Stock of $0.001 par value; 500,000 authorized; 400,0001 and 490,829 shares issued as of June 30, 2026 and December 31, 2025, respectively; liquidation preference of $506.4 million and $493.1 million at each date, respectively
498,173  466,728 
Stockholders’ equity
Preferred stock of $0.001 par value - 4,500,000 shares authorized; none issued at respective dates —  — 
Common stock of $0.001 par value - 1,000,000,000 shares authorized; 153,972,487 and 152,779,614 shares issued at respective dates
155  152 
Additional paid-in capital 203,156  226,848 
Accumulated deficit (396,516) (422,859)
Accumulated other comprehensive loss
(8,875) (10,481)
Total stockholders’ equity (202,080) (206,340)
Total liabilities, redeemable perpetual preferred stock and stockholders’ equity $ 1,534,036  $ 1,451,792 

(1) Adjusted to reflect the increase in Liquidation Preference rather than the number of shares.


7


Array Technologies, Inc.
Condensed Consolidated Statements of Operations (unaudited)
(in thousands, except per share amounts)
Three Months Ended June 30, Six Months Ended June 30,
2026 2025 2026 2025
Revenue $ 342,065  $ 362,243  $ 565,477  $ 664,606 
Cost of revenue
Cost of product and service revenue 236,846  261,479  391,640  483,775 
Amortization of developed technology and backlog 5,615  3,640  11,229  7,279 
Total cost of revenue 242,461 265,119 402,869  491,054 
Gross profit 99,604  97,124  162,608  173,552 
Operating expenses
General and administrative 54,325  44,954  104,729  88,899 
Change in fair value of contingent consideration 2,441  150  (145) — 
Depreciation and amortization 8,073  5,644  16,150  10,993 
Total operating expenses 64,839  50,748  120,734  99,892 
Income from operations
34,765  46,376  41,874  73,660 
Interest income 2,402  3,800  4,789  7,119 
Interest expense (5,786) (8,768) (11,349) (16,803)
Foreign currency gain, net 529  1,343  690  2,032 
Gain on extinguishment of debts, net —  14,207  —  14,207 
Other expense, net (187) (79) (156) (56)
Total other (expense) income, net (3,042) 10,503  (6,026) 6,499 
Income before income tax expense
31,723  56,879  35,848  80,159 
Income tax expense
7,377  13,617  9,505  20,151 
Net income
24,346  43,262  26,343  60,008 
Preferred dividends and accretion 15,908  14,788  31,445  29,231 
Net income (loss) to common stockholders $ 8,438  $ 28,474  $ (5,102) $ 30,777 
Income (loss) per common share
Basic $ 0.05  $ 0.19  $ (0.03) $ 0.20 
Diluted $ 0.05  $ 0.19  $ (0.03) $ 0.20 
Weighted average number of common shares outstanding
Basic 153,866  152,584  153,414  152,331 
Diluted 155,685  153,068  153,414  152,958 
8


Array Technologies, Inc.
Consolidated Statements of Cash Flows (unaudited)
(in thousands)

Three Months Ended June 30, Six Months Ended June 30,
2026 2025 2026 2025
Operating activities
Net income $ 24,346  $ 43,262  $ 26,343  $ 60,008 
Adjustments to reconcile net income to cash provided by operating activities:
Provision for bad debts (192) 239  1,910 
Deferred tax benefit (1,041) (1,270) (2,637) (246)
Depreciation and amortization 10,100  6,256  19,851  12,188 
Amortization of developed technology and backlog 5,615  3,640  11,229  7,279 
Amortization of debt discount and issuance costs 892  1,951  1,768  3,457 
Gain on extinguishment of debts, net —  (14,207) —  (14,207)
Equity-based compensation 4,579  3,898  8,520  6,696 
Change in fair value of contingent consideration 2,441  150  (145) — 
Warranty provision 3,672  3,616  7,013  5,336 
Inventory reserve 1,723  1,843  1,197  2,682 
Other non-cash 529  10  690  10 
Changes in operating assets and liabilities
68,615  (5,547) 18,026  (54,331)
Net cash provided by operating activities 121,279  43,841  91,858  30,782 
Investing activities
Purchase of property, plant and equipment (7,633) (6,631) (15,144) (8,983)
Net cash used in investing activities
(7,633) (6,631) (15,144) (8,983)
Financing activities
Proceeds from issuance of other debt 14,036  49,202  38,254  57,064 
Proceeds from issuance of convertible notes —  345,000  —  345,000 
Premium paid on capped call —  (35,087) —  (35,087)
Fees paid on issuance of convertible notes —  (10,434) —  (10,434)
Repayments of other debt (23,591) (47,460) (51,003) (54,754)
Repayments of term loan facility —  (232,800) —  (233,875)
Repayments of convertible notes —  (78,363) —  (78,363)
Contingent consideration payments —  —  (2,574) (1,204)
Other financing 38  (1,109) (1,806) (1,123)
Net cash used in financing activities (9,517) (11,051) (17,129) (12,776)
Effect of exchange rate changes on cash and cash equivalent balances 1,180  3,118  1,733  5,606 
9


Array Technologies, Inc.
Condensed Consolidated Statements of Cash Flows (unaudited) (continued)
(in thousands)
Three Months Ended June 30, Six Months Ended June 30,
2026 2025 2026 2025
Net change in cash and cash equivalents and restricted cash 105,309  29,277  61,318  14,629 
Cash and cash equivalents, and restricted cash beginning of period 201,993  349,493  245,984  364,141 
Cash and cash equivalents and restricted cash, end of period $ 307,302  $ 378,770  $ 307,302  $ 378,770 

10

Array Technologies, Inc.
Adjusted Gross Profit, Adjusted EBITDA, Adjusted Net Income, Adjusted General and Administrative Expense and Free Cash Flow Reconciliation (unaudited)
(in thousands, except per share amounts)
The following table reconciles Gross profit to Adjusted gross profit:
Three Months Ended June 30, Six Months Ended June 30,
2026 2025 2026 2025
Revenue $ 342,065 $ 362,243 $ 565,477 $ 664,606
Cost of revenue 242,461 265,119 402,869 491,054
Gross profit 99,604 97,124 162,608 173,552
Gross margin 29.1% 26.8% 28.8% 26.1%
Amortization of developed technology and backlog
5,615 3,640 11,229 7,279
Acquisition-related expenses(a)
40 80
Adjusted gross profit $ 105,259 $ 100,764 $ 173,917 $ 180,831
Adjusted gross margin 30.8  % 27.8  % 30.8  % 27.2  %

(a) Represents acquisition-related fair value adjustments to Property, plant, and equipment.

The following table reconciles Net income to Adjusted EBITDA:
Three Months Ended June 30, Six Months Ended June 30,
2026 2025 2026 2025
Net income $ 24,346  $ 43,262  $ 26,343  $ 60,008 
Preferred dividends and accretion 15,908  14,788  31,445  29,231 
Net income (loss) to common stockholders 8,438  28,474  (5,102) 30,777 
Other income, net (2,215) (3,721) (4,633) (7,063)
Gain on extinguishment of debts, net —  (14,207) —  (14,207)
Foreign currency gain, net (529) (1,343) (690) (2,032)
Preferred dividends and accretion 15,908  14,788  31,445  29,231 
Interest expense 5,786  8,768  11,349  16,803 
Income tax expense 7,377  13,617  9,505  20,151 
Depreciation expense 2,728  1,178  5,092  2,221 
Amortization of intangibles 7,371  5,078  14,759  9,967 
Amortization of developed technology and backlog 5,615  3,640  11,229  7,279 
Equity-based compensation 4,579  3,898  8,520  6,696 
Change in fair value of contingent consideration 2,441  150  (145) — 
Certain legal expenses(a)
—  149  —  1,232 
Acquisition-related expenses(b)
5,761  3,087  10,758  3,087 
Adjusted EBITDA $ 63,260  $ 63,556  $ 92,087  $ 104,142 

(a) Represents certain legal fees and other related costs associated with (i) actions filed against the company and certain officers and directors alleging violations of the Securities Act of 1933 and the Securities Exchange Act of 1934, which litigation was dismissed with prejudice by the Court on May 19, 2023 and subsequently appealed. On March 24, 2026, the Second Circuit affirmed the dismissal of such action with prejudice, and (ii) legal and success fees related to a regional tax dispute for a period prior to the acquisition of STI, and (iii) other litigation and legal
11

Array Technologies, Inc.
Adjusted Gross Profit, Adjusted EBITDA, Adjusted Net Income, Adjusted General and Administrative Expense and Free Cash Flow Reconciliation (unaudited)
(in thousands, except per share amounts)
matters. We consider these costs not representative of legal costs that we will incur from time to time in the ordinary course of our business.
(b) Represents acquisition-related expenses.

The following table reconciles Net income to Adjusted net income:
Three Months Ended June 30, Six Months Ended June 30,
2026 2025 2026 2025
Net income $ 24,346  $ 43,262  $ 26,343  $ 60,008 
Preferred dividends and accretion 15,908  14,788  31,445  29,231 
Net income (loss) to common stockholders 8,438  28,474  (5,102) 30,777 
Amortization of intangibles 7,371  5,078  14,759  9,967 
Amortization of developed technology and backlog 5,615  3,640  11,229  7,279 
Amortization of debt discount and issuance costs 892  2,064  1,768  3,457 
Gain on extinguishment of debts, net —  (14,207) —  (14,207)
Series A Preferred stock accretion
8,032  7,393  15,900  14,634 
Equity-based compensation
4,579  3,898  8,520  6,696 
Change in fair value of contingent consideration 2,441  150  (145) — 
Certain legal expenses(a)
—  149  —  1,232 
Acquisition-related expenses(b)
5,825  3,087  10,886  3,087 
Income tax expense of adjustments(c)
(6,145) (975) (11,935) (4,449)
Adjusted net income $ 37,048  $ 38,751  $ 45,880  $ 58,473 
Income (loss) per common share
Basic $ 0.05  $ 0.19  $ (0.03) $ 0.20 
Diluted $ 0.05  $ 0.19  $ (0.03) $ 0.20 
Weighted average number of common shares outstanding
Basic 153,866  152,584  153,414  152,331 
Diluted 155,685  153,068  153,414  152,958 
Adjusted net income per common share
Basic $ 0.24  $ 0.25  $ 0.30  $ 0.38 
Diluted $ 0.24  $ 0.25  $ 0.29  $ 0.38 
Weighted average number of common shares outstanding
Basic 153,866  152,584  153,414  152,331 
Diluted 155,685  153,068  155,673  152,958 

(a) Represents certain legal fees and other related costs associated with (i) actions filed against the company and certain officers and directors alleging violations of the Securities Act of 1933 and the Securities Exchange Act of
12

Array Technologies, Inc.
Adjusted Gross Profit, Adjusted EBITDA, Adjusted Net Income, Adjusted General and Administrative Expense and Free Cash Flow Reconciliation (unaudited)
(in thousands, except per share amounts)
1934, which litigation was dismissed with prejudice by the Court on May 19, 2023 and subsequently appealed. On March 24, 2026, the Second Circuit affirmed the dismissal of such action with prejudice, and (ii) legal and success fees related to a regional tax dispute for a period prior to the acquisition of STI, and (iii) other litigation and legal matters. We consider these costs not representative of legal costs that we will incur from time to time in the ordinary course of our business.
(b) Represents acquisition-related expenses and fair value adjustments to Property, plant and equipment.
(c) Represents the estimated tax impact of all Adjusted Net Income add-backs, excluding those which represent permanent differences between book versus tax.

The following table reconciles General and administrative expense to Adjusted general and administrative expense:
Three Months Ended June 30, Six Months Ended June 30,
2026 2025 2026 2025
General and administrative expense $ 54,325 $ 44,954 $ 104,729 $ 88,899
Equity-based compensation
(4,579) (3,898) (8,520) (6,696)
Certain legal expenses(a)
(149) (1,232)
Acquisition-related expenses(b)
(5,761) (3,087) (10,758) (3,087)
Adjusted general and administrative expense $ 43,985 $ 37,820 $ 85,451 $ 77,884

(a) Represents certain legal fees and other related costs associated with (i) actions filed against the company and certain officers and directors alleging violations of the Securities Act of 1933 and the Securities Exchange Act of 1934, which litigation was dismissed with prejudice by the Court on May 19, 2023 and subsequently appealed. On March 24, 2026, the Second Circuit affirmed the dismissal of such action with prejudice, and (ii) legal and success fees related to a regional tax dispute for a period prior to the acquisition of STI, and (iii) other litigation and legal matters. We consider these costs not representative of legal costs that we will incur from time to time in the ordinary course of our business.
(b) Represents acquisition-related expenses.

The following table reconciles Net cash used in operating activities to Free cash flow:
Three Months Ended June 30, Six Months Ended June 30,
2026 2025 2026 2025
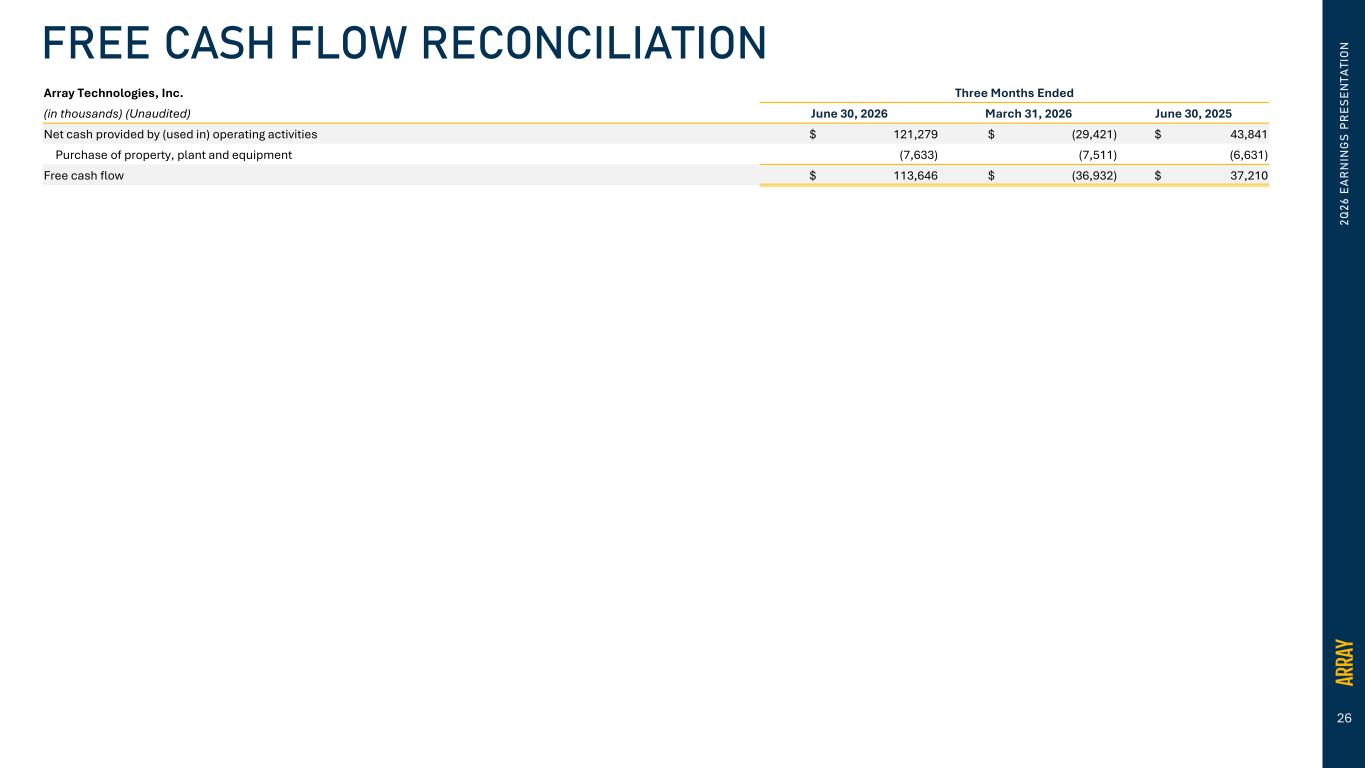
Net cash provided by (used in) operating activities $ 121,279 $ 43,841 $ 91,858 $ 30,782
Purchase of property, plant and equipment (7,633) (6,631) (15,144) (8,983)
Free cash flow
$ 113,646 $ 37,210 $ 76,714 $ 21,799
13
EX-99.2 3 exhibit9922026q2earnings.htm EX-99.2 exhibit9922026q2earnings
0 2Q 26 E A R N IN G S PR ES EN TA TI O N 2Q 2026 EARNINGS PRESENTATION August 5, 2026


1 DISCLAIMER 2Q 26 E A R N IN G S PR ES EN TA TI O N FORWARD LOOKING STATEMENTS This presentation contains forward-looking statements that are based on our management’s beliefs and assumptions and on information currently available to our management. Forward-looking statements include information concerning our possible or assumed future results of operations, business strategies, technology or product developments, financing and investment plans, dividend policy, competitive position, industry and regulatory environment, including potential regulatory reform related to energy credits, uncertainty relating to the implementation of tariffs and changes in trade policy, including the reduction or elimination of certain government incentives, ability to provide 100% domestic content trackers, expectations regarding the macroeconomic environment and geopolitical developments, including the effects of tariffs and changes in trade policy, potential growth opportunities and the effects of competition. Forward-looking statements include statements that are not historical facts and can be identified by terms such as “anticipate,” “believe,” “could,” “estimate,” “expect,” “intend,” “may,” “plan,” “potential,” “predict,” “project,” “seek,” “should,” “will,” “would,” “positioned,” “designed to” or similar expressions and the negatives of those terms. Our actual results and the timing of events could materially differ from those anticipated in such forward-looking statements as a result of certain risks, uncertainties and other factors, including without limitation: changes in growth or the rate of growth in demand for solar energy projects; factors outside of our control affecting the variability and demand for solar energy, including but not limited to, the retail price of electricity, availability of in-demand components like high-voltage breakers, various policies related to the permitting and interconnection costs of solar plants, and the availability of incentives for solar energy and solar energy production systems, which makes it difficult to predict our future prospects; competitive pressures within our industry; competition from conventional and renewable energy sources; a loss of one or more of our significant customers, their inability to perform under their contracts, or their default in payment; a drop in the price of electricity derived from the utility grid or from alternative energy sources; fluctuations in our results of operations across fiscal periods, which could make our future performance difficult to predict and could cause our results of operations for a particular period to fall below expectations; any increase in interest rates, or a reduction in the availability of tax equity or project debt capital in the global financial markets, which could make it difficult for customers to finance the cost of a solar energy system and reduce the demand for our products; existing electric utility industry policies and regulations, and any subsequent changes or new related policies and regulations, including as a result of the One Big Beautiful Bill Act, which may present technical, regulatory and economic barriers to the purchase and use of solar energy systems and may significantly reduce demand for our products or harm our ability to compete; the interruption of the flow of materials from international vendors, which could disrupt our supply chain, including as a result of the imposition of new and/or additional duties, tariffs and other charges or restrictions on imports and exports; changes in the global trade environment, including the continuation or imposition of import tariffs or other import restrictions; geopolitical, macroeconomic and other market conditions unrelated to our operating performance including but not limited to a pandemic, the Russia-Ukraine war, attacks on shipping in the Red Sea and Strait of Hormuz, conflict in the Middle East (including, but not limited to, the war in Iran), changing trade policies, inflation and interest rates; our ability to convert our orders in backlog into revenue; the reduction, elimination or expiration, or our failure to optimize the benefits of government incentives for, or regulations mandating the use of, renewable energy and solar energy, particularly in relation to our competitors, which could reduce demand for solar energy systems; failure to, or incurrence of significant costs in order to, obtain, maintain, protect, defend or enforce, our intellectual property and other proprietary rights; delays in construction projects and any failure to manage our inventory; significant changes in the cost of raw materials; disruptions to transportation and logistics, including increases in shipping costs; defects or performance problems in our products, which could result in loss of customers, reputational damage and decreased revenue; delays, disruptions or quality control problems in our product development operations; the development, deployment and commercialization of new products, including DuraTrack D2STM, OmniTrack 2.0, the 60 degree variant of DuraTrack, and our ARRAY AtlasTM suite of foundation-to-tracker solutions; our ability to retain our key personnel or failure to attract additional qualified personnel; additional business, financial, regulatory and competitive risks due to our continued planned expansion into new markets; cybersecurity or other data incidents, including unauthorized disclosure of personal or sensitive data or theft of confidential information and the use of artificial intelligence by cyber threat actors; a failure to maintain an effective system of integrated internal controls over financial reporting, which may impair our ability to report our financial results accurately; our substantial indebtedness, risks related to actual or threatened public health epidemics, pandemics, outbreaks or crises; changes to laws and regulations, including changes to tax laws and regulations, that are applied adversely to us or our customers; our ability to complete the acquisition of Affordable Wire Management, LLC (“AWM”) on the anticipated terms and timetable, including the possibility that closing conditions may not be satisfied or waived; our ability to successfully integrate APA Solar, LLC (“APA”) and AWM into our existing operations, realize the anticipated benefits or synergies of the acquisitions of APA and AWM and achieve strategic and other objectives relating to the acquisitions; risks related to any unforeseen liabilities of AWM; and other factors listed and described in more detail in the section captioned “Risk Factors” in our Annual Report on Form 10-K, our Quarterly Reports on Form 10-Q, and our other documents on file with the U.S. Securities and Exchange Commission. Given these uncertainties, you should not place undue reliance on forward-looking statements. Also, forward-looking statements represent our management’s beliefs and assumptions only as of the date of this presentation. You should read this presentation with the understanding that our actual future results may be materially different from what we expect. Except as required by law, we assume no obligation to update these forward-looking statements, or to update the reasons actual results could differ materially from those anticipated in these forward-looking statements, even if new information becomes available in the future. NON-GAAP FINANCIAL INFORMATION This presentation includes certain financial measures that are not presented in accordance with U.S. generally accepted accounting principles (“GAAP”), including Adjusted gross profit, Adjusted gross margin, Adjusted EBITDA, Adjusted EBITDA margin, Adjusted net income, Adjusted net income per common share, Adjusted general and administrative expense and Free cash flow. We define Adjusted gross profit as gross profit plus (i) amortization of developed technology and backlog and (ii) acquisition-related expenses. We define Adjusted gross margin as Adjusted gross profit as a percentage of revenue. We define Adjusted EBITDA as net income (loss) to common stockholders plus (i) other income, net, (ii) gain on extinguishment of debts, net, (iii) foreign currency (gain) loss, net, (iv) preferred dividends and accretion, (v) interest expense, (vi) income tax expense (benefit), (vii) depreciation expense, (viii) amortization of intangibles, (ix) amortization of developed technology and backlog, (x) equity-based compensation, (xi) change in fair value of contingent consideration, (xii) goodwill impairment, (xiii) certain legal expenses, (xiv) acquisition-related expenses, (xv) inventory valuation charge, and (xvi) other costs. We define Adjusted EBITDA margin as Adjusted EBITDA as a percentage of revenue. We define Adjusted net income as net income (loss) to common stockholders plus (i) amortization of intangibles, (ii) amortization of developed technology and backlog, (iii) amortization of debt discount and issuance costs, (iv) gain on extinguishment of debt, net (v) Series A preferred stock accretion, (vi) equity- based compensation, (vii) change in fair value of contingent consideration, (viii) certain legal expenses, (ix) acquisition-related expenses, and (x) income tax expense adjustments. We define Adjusted general and administrative expense as general and administrative expense less (i) equity-based compensation, (ii) certain legal expenses, and (iii) acquisition-related expenses. We define Free cash flow as Net cash provided by (used in) operating activities less purchase of property, plant and equipment. A detailed reconciliation between GAAP results and results excluding special items (“non-GAAP”) is included within this presentation. We calculate net income (loss) per common share as net income (loss) to common stockholders divided by the basic and diluted weighted average number of shares outstanding for the applicable period and we define Adjusted net income per common share as Adjusted net income (as detailed above) divided by the basic and diluted weighted average number of shares outstanding for the applicable period. We believe that these non-GAAP financial measures are provided to enhance the reader’s understanding of our past financial performance and our prospects for the future. Our management team uses these non-GAAP financial measures in assessing the Company’s performance, as well as in planning and forecasting future periods. The non-GAAP financial information is presented for supplemental informational purposes only and should not be considered a substitute for financial information presented in accordance with GAAP and may be different from similarly titled non-GAAP measures used by other companies. Among other limitations, Adjusted gross profit, Adjusted gross margin, Adjusted EBITDA, Adjusted EBITDA margin, Adjusted net income, Adjusted net income per common share, Adjusted general and administrative expense and Free cash flow do not reflect our cash expenditures, or future requirements, for capital expenditures or contractual commitments; do not reflect the impact of certain cash charges resulting from matters we consider not to be indicative of our ongoing operations; do not reflect income tax expense or benefit; and other companies in our industry may calculate Adjusted gross profit, Adjusted gross margin, Adjusted EBITDA, Adjusted EBITDA margin, Adjusted net income, Adjusted net income per common share, Adjusted general and administrative expense and Free cash flow differently than we do, which limits their usefulness as comparative measures. Because of these limitations Adjusted gross profit, Adjusted gross margin, Adjusted EBITDA, Adjusted EBITDA margin, Adjusted net income, Adjusted net income per common share, Adjusted general and administrative expense and Free cash flow should not be considered in isolation or as substitutes for performance measures calculated in accordance with GAAP. We compensate for these limitations by relying primarily on our GAAP results and using Adjusted gross profit, Adjusted gross margin, Adjusted EBITDA, Adjusted EBITDA margin, Adjusted net income, Adjusted net income per common share, Adjusted general and administrative expense and Free cash flow on a supplemental basis. You should review the reconciliation of gross profit to Adjusted gross profit and Adjusted gross margin, net income (loss) to Adjusted EBITDA, Adjusted EBITDA margin, Adjusted net income and Adjusted net income per common share, General and administrative expense to Adjusted general and administrative expense and Net cash provided by operating activities to Free cash flow below and not rely on any single financial measure to evaluate our business. MARKET AND INDUSTRY DATA This presentation also contains information regarding our market and our industry that is derived from third-party research and publications. That information may rely upon a number of assumptions and limitations, and we have not independently verified its accuracy or completeness.


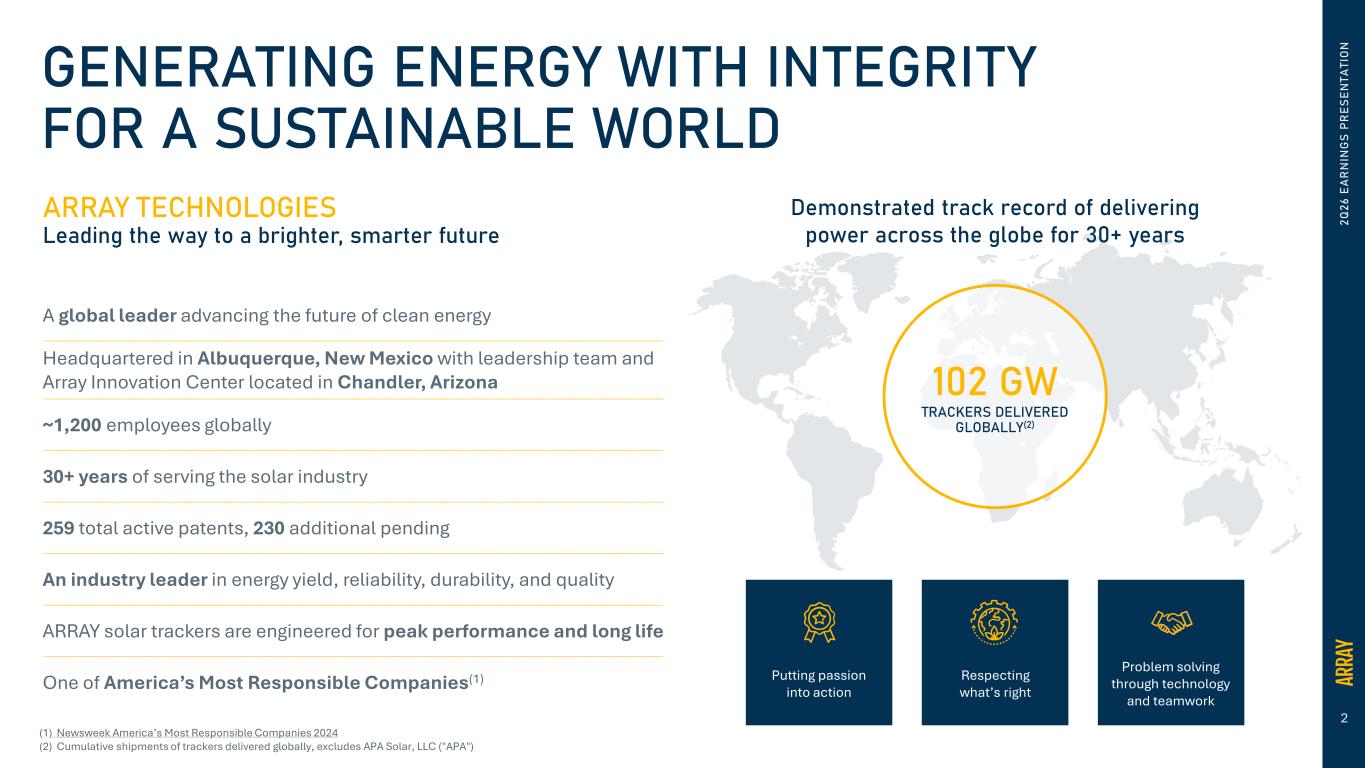
2 2Q 26 E A R N IN G S PR ES EN TA TI O NGENERATING ENERGY WITH INTEGRITY FOR A SUSTAINABLE WORLD ARRAY TECHNOLOGIES Leading the way to a brighter, smarter future A global leader advancing the future of clean energy Headquartered in Albuquerque, New Mexico with leadership team and Array Innovation Center located in Chandler, Arizona ~1,200 employees globally 30+ years of serving the solar industry 259 total active patents, 230 additional pending An industry leader in energy yield, reliability, durability, and quality ARRAY solar trackers are engineered for peak performance and long life One of America’s Most Responsible Companies(1) 102 GW TRACKERS DELIVERED GLOBALLY(2) Demonstrated track record of delivering power across the globe for 30+ years Putting passion into action Respecting what’s right Problem solving through technology and teamwork (1) Newsweek America’s Most Responsible Companies 2024 (2) Cumulative shipments of trackers delivered globally, excludes APA Solar, LLC ("APA")


3 2Q 26 E A R N IN G S PR ES EN TA TI O N BUSINESS UPDATE Kevin G. Hostetler Chief Executive Officer


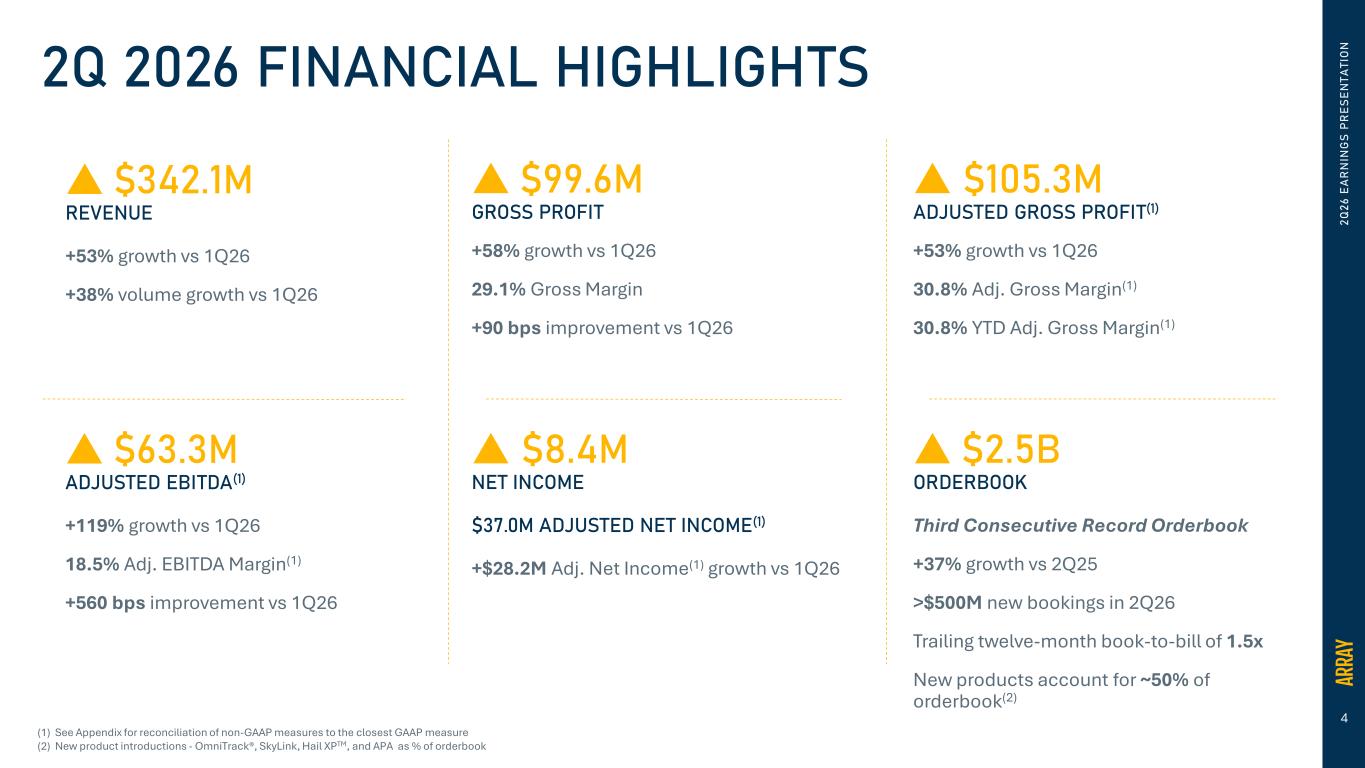
4 2Q 2026 FINANCIAL HIGHLIGHTS  �99.6M GROSS PROFIT +58% growth vs 1Q26 29.1% Gross Margin +90 bps improvement vs 1Q26  �105.3M ADJUSTED GROSS PROFIT(1) +53% growth vs 1Q26 30.8% Adj. Gross Margin(1) 30.8% YTD Adj. Gross Margin(1)  �8.4M NET INCOME �37.0M ADJUSTED NET INCOME(1) +$28.2M Adj. Net Income(1) growth vs 1Q26  �63.3M ADJUSTED EBITDA(1) +119% growth vs 1Q26 18.5% Adj. EBITDA Margin(1) +560 bps improvement vs 1Q26  �2.5B ORDERBOOK Third Consecutive Record Orderbook +37% growth vs 2Q25 >$500M new bookings in 2Q26 Trailing twelve-month book-to-bill of 1.5x New products account for ~50% of orderbook(2) (1) See Appendix for reconciliation of non-GAAP measures to the closest GAAP measure (2) New product introductions - OmniTrack®, SkyLink, Hail XPTM, and APA as % of orderbook  �342.1M REVENUE +53% growth vs 1Q26 +38% volume growth vs 1Q26 2Q 26 E A R N IN G S PR ES EN TA TI O N


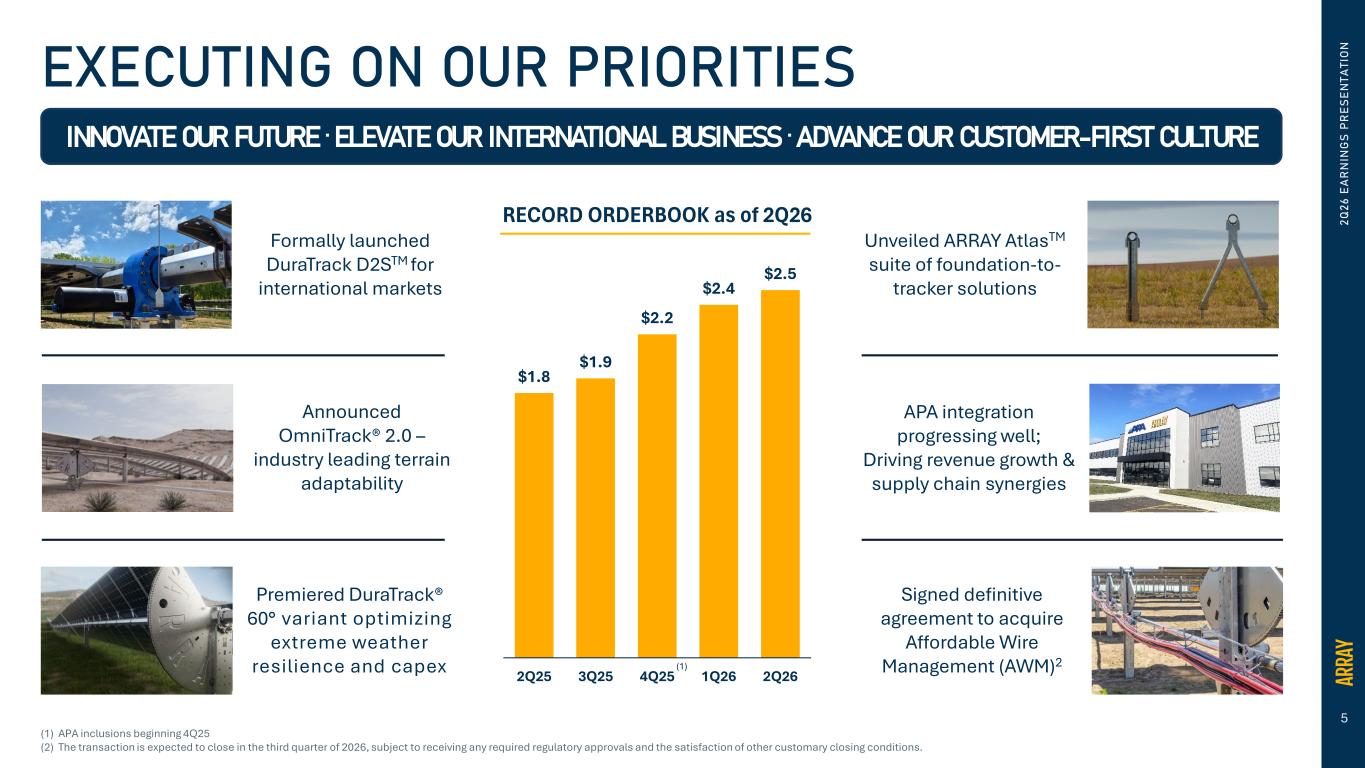
5 2Q 26 E A R N IN G S PR ES EN TA TI O NEXECUTING ON OUR PRIORITIES INNOVATE OUR FUTURE . ELEVATE OUR INTERNATIONAL BUSINESS . ADVANCE OUR CUSTOMER-FIRST CULTURE Announced OmniTrack® 2.0 – industry leading terrain adaptability Formally launched DuraTrack D2STM for international markets Premiered DuraTrack® 60° variant optimizing extreme weather resilience and capex Unveiled ARRAY AtlasTM suite of foundation-to- tracker solutions APA integration progressing well; Driving revenue growth & supply chain synergies (1) APA inclusions beginning 4Q25 (2) The transaction is expected to close in the third quarter of 2026, subject to receiving any required regulatory approvals and the satisfaction of other customary closing conditions. Signed definitive agreement to acquire Affordable Wire Management (AWM)2 $1.8 $1.9 $2.2 $2.4 $2.5 2Q25 3Q25 4Q25 1Q26 2Q26 RECORD ORDERBOOK as of 2Q26 (1)


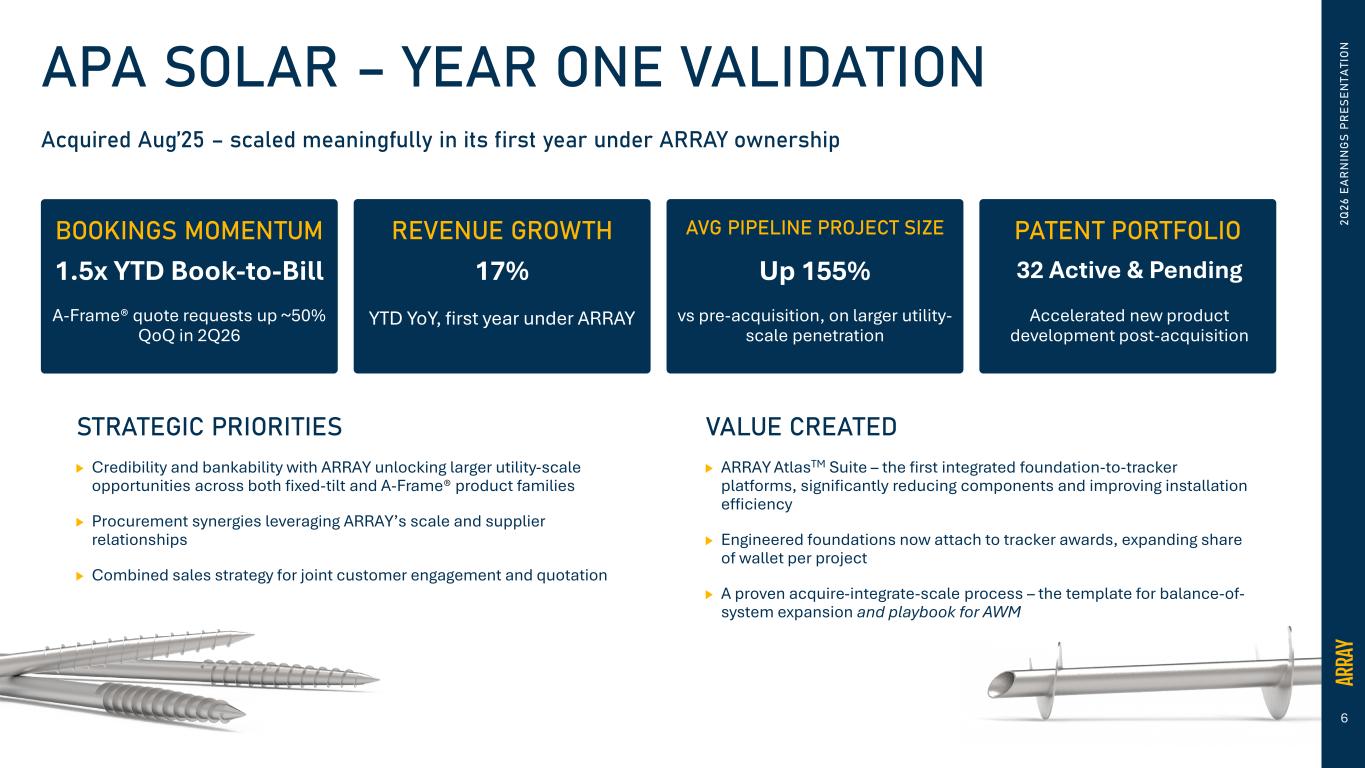
6 2Q 26 E A R N IN G S PR ES EN TA TI O NAPA SOLAR – YEAR ONE VALIDATION STRATEGIC PRIORITIES Credibility and bankability with ARRAY unlocking larger utility-scale opportunities across both fixed-tilt and A-Frame® product families Procurement synergies leveraging ARRAY’s scale and supplier relationships Combined sales strategy for joint customer engagement and quotation VALUE CREATED ARRAY AtlasTM Suite – the first integrated foundation-to-tracker platforms, significantly reducing components and improving installation efficiency Engineered foundations now attach to tracker awards, expanding share of wallet per project A proven acquire-integrate-scale process – the template for balance-of- system expansion and playbook for AWM Acquired Aug’25 – scaled meaningfully in its first year under ARRAY ownership BOOKINGS MOMENTUM REVENUE GROWTH AVG PIPELINE PROJECT SIZE PATENT PORTFOLIO 1.5x YTD Book-to-Bill A-Frame® quote requests up ~50% QoQ in 2Q26 17% YTD YoY, first year under ARRAY Up 155% vs pre-acquisition, on larger utility- scale penetration 32 Active & Pending Accelerated new product development post-acquisition


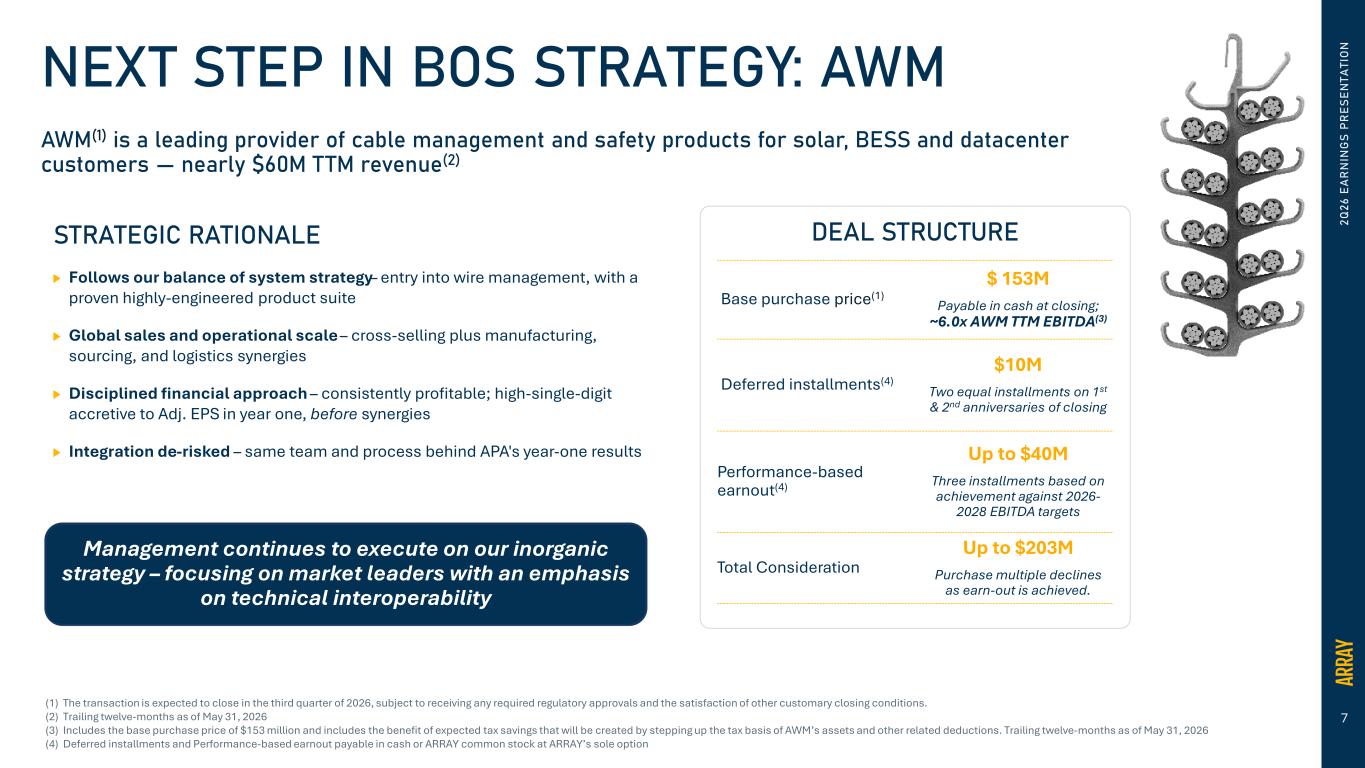
7 2Q 26 E A R N IN G S PR ES EN TA TI O NNEXT STEP IN BOS STRATEGY: AWM AWM(1) is a leading provider of cable management and safety products for solar, BESS and datacenter customers — nearly �60M TTM revenue(2) STRATEGIC RATIONALE Follows our balance of system strategy– entry into wire management, with a proven highly-engineered product suite Global sales and operational scale – cross-selling plus manufacturing, sourcing, and logistics synergies Disciplined financial approach – consistently profitable; high-single-digit accretive to Adj. EPS in year one, before synergies Integration de-risked – same team and process behind APA's year-one results Management continues to execute on our inorganic strategy – focusing on market leaders with an emphasis on technical interoperability Base purchase price(1) $ 153M Payable in cash at closing; ~6.0x AWM TTM EBITDA(3) Deferred installments(4) $10M Two equal installments on 1st & 2nd anniversaries of closing Performance-based earnout(4) Up to $40M Three installments based on achievement against 2026- 2028 EBITDA targets Total Consideration Up to $203M Purchase multiple declines as earn-out is achieved. DEAL STRUCTURE (1) The transaction is expected to close in the third quarter of 2026, subject to receiving any required regulatory approvals and the satisfaction of other customary closing conditions. (2) Trailing twelve-months as of May 31, 2026 (3) Includes the base purchase price of $153 million and includes the benefit of expected tax savings that will be created by stepping up the tax basis of AWM’s assets and other related deductions. Trailing twelve-months as of May 31, 2026 (4) Deferred installments and Performance-based earnout payable in cash or ARRAY common stock at ARRAY’s sole option


8 2Q 26 E A R N IN G S PR ES EN TA TI O N INNOVATION & PORTFOLIO EXPANSION Neil Manning President & Chief Operating Officer


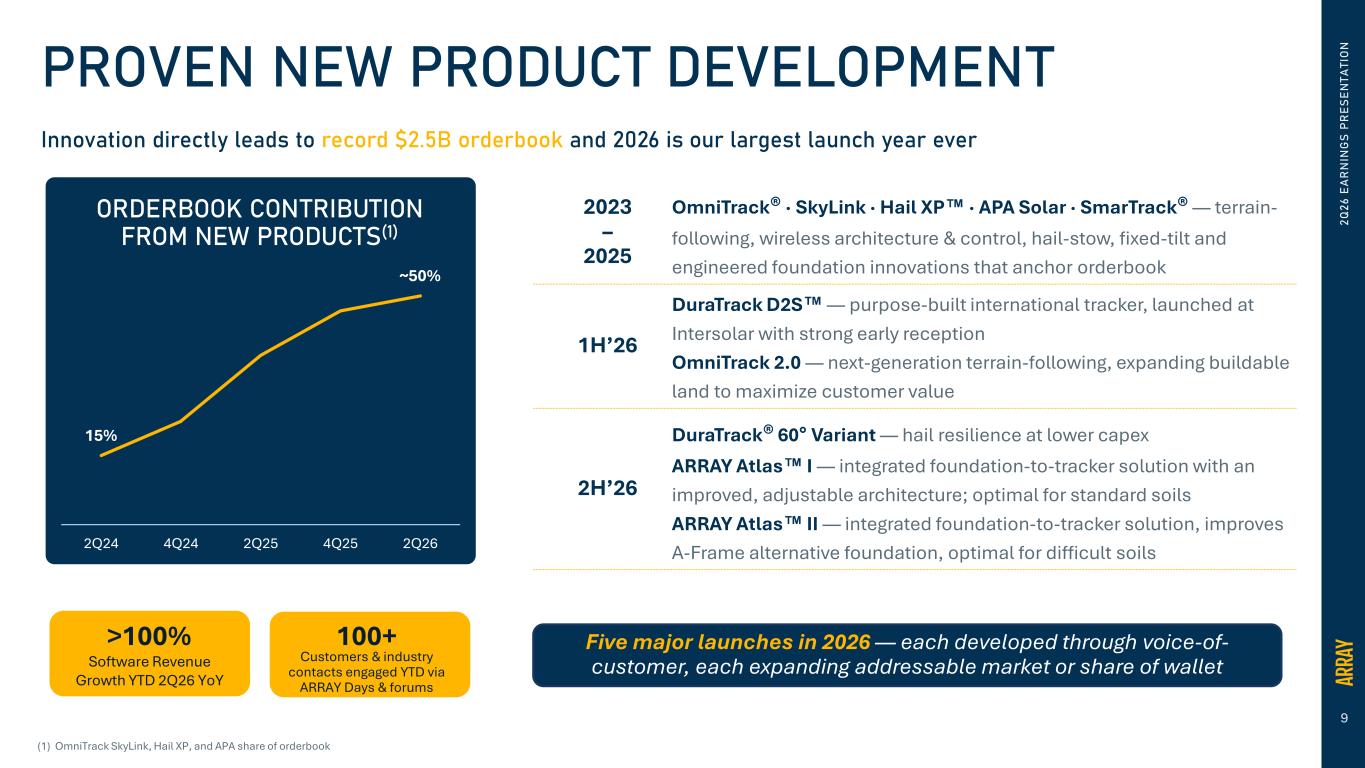
9 2Q 26 E A R N IN G S PR ES EN TA TI O NPROVEN NEW PRODUCT DEVELOPMENT Innovation directly leads to record �2.5B orderbook and 2026 is our largest launch year ever 15% ~50% 2Q24 4Q24 2Q25 4Q25 2Q26 ORDERBOOK CONTRIBUTION FROM NEW PRODUCTS(1) >100% Software Revenue Growth YTD 2Q26 YoY 100+ Customers & industry contacts engaged YTD via ARRAY Days & forums (1) OmniTrack SkyLink, Hail XP, and APA share of orderbook 2023 – 2025 OmniTrack® · SkyLink · Hail XP · APA Solar · SmarTrack® — terrain- following, wireless architecture & control, hail-stow, fixed-tilt and engineered foundation innovations that anchor orderbook 1H’26 DuraTrack D2S — purpose-built international tracker, launched at Intersolar with strong early reception OmniTrack 2.0 — next-generation terrain-following, expanding buildable land to maximize customer value 2H’26 DuraTrack® 60° Variant — hail resilience at lower capex ARRAY Atlas I — integrated foundation-to-tracker solution with an improved, adjustable architecture; optimal for standard soils ARRAY Atlas II — integrated foundation-to-tracker solution, improves A-Frame alternative foundation, optimal for difficult soils Five major launches in 2026 — each developed through voice-of- customer, each expanding addressable market or share of wallet


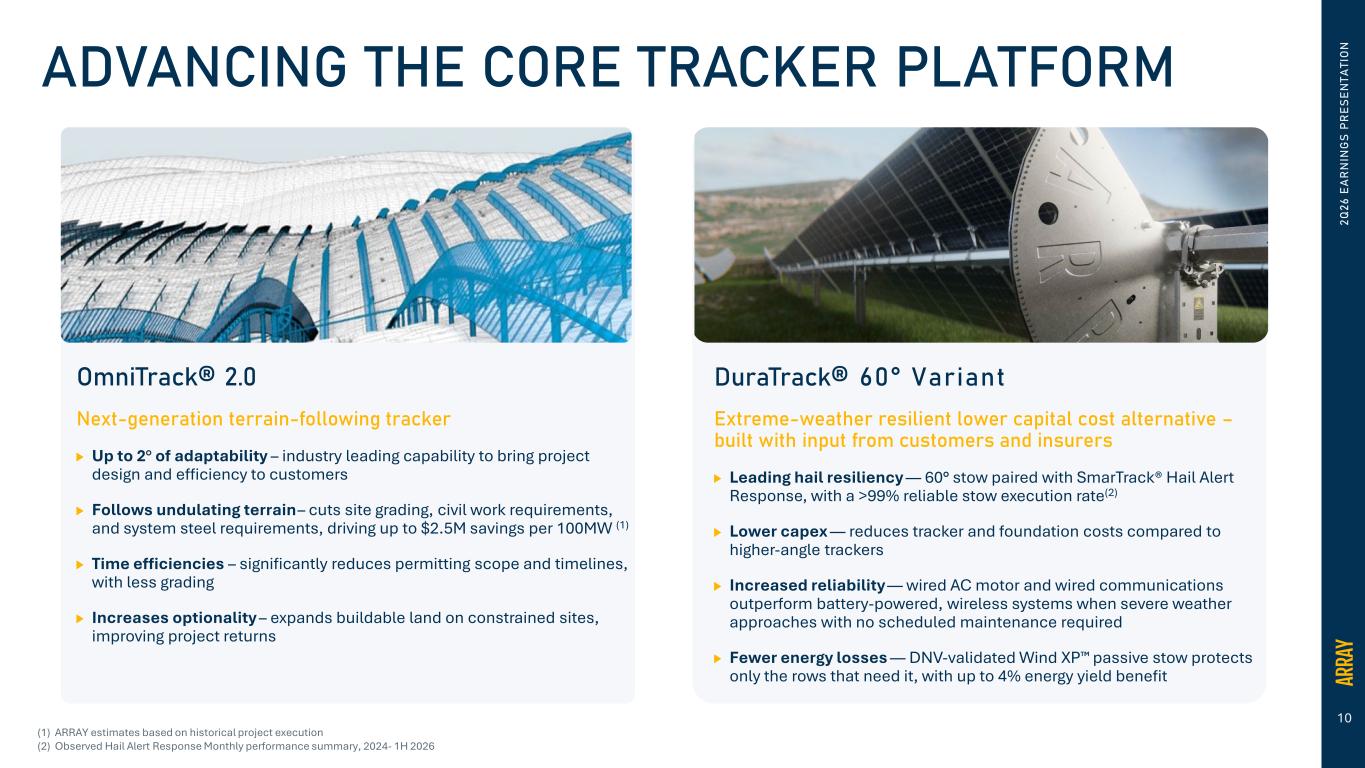
10 2Q 26 E A R N IN G S PR ES EN TA TI O NADVANCING THE CORE TRACKER PLATFORM OmniTrack® 2.0 Next-generation terrain-following tracker Up to 2° of adaptability – industry leading capability to bring project design and efficiency to customers Follows undulating terrain – cuts site grading, civil work requirements, and system steel requirements, driving up to $2.5M savings per 100MW (1) Time efficiencies – significantly reduces permitting scope and timelines, with less grading Increases optionality – expands buildable land on constrained sites, improving project returns DuraTrack® 60° Variant Extreme-weather resilient lower capital cost alternative – built with input from customers and insurers Leading hail resiliency — 60° stow paired with SmarTrack® Hail Alert Response, with a >99% reliable stow execution rate(2) Lower capex — reduces tracker and foundation costs compared to higher-angle trackers Increased reliability — wired AC motor and wired communications outperform battery-powered, wireless systems when severe weather approaches with no scheduled maintenance required Fewer energy losses — DNV-validated Wind XP passive stow protects only the rows that need it, with up to 4% energy yield benefit (1) ARRAY estimates based on historical project execution (2) Observed Hail Alert Response Monthly performance summary, 2024- 1H 2026


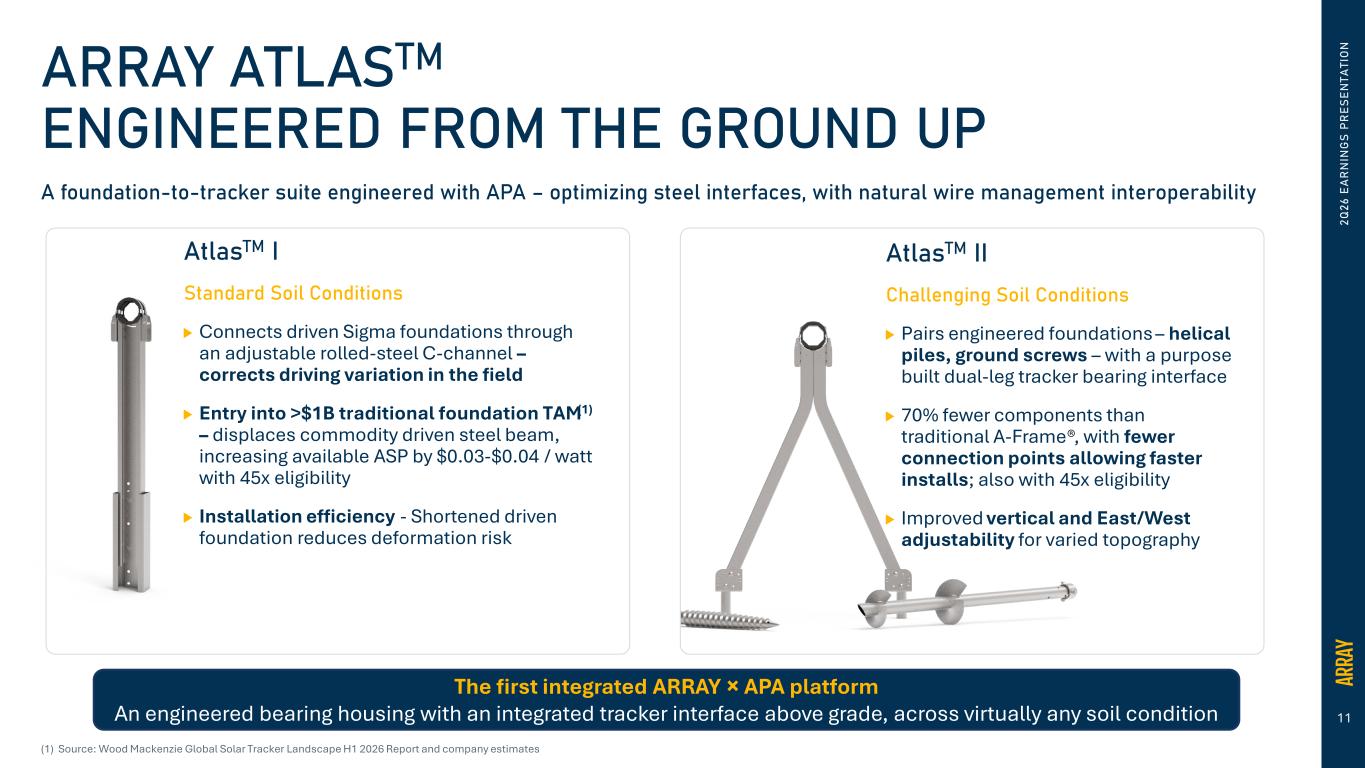
11 2Q 26 E A R N IN G S PR ES EN TA TI O NARRAY ATLASTM ENGINEERED FROM THE GROUND UP A foundation-to-tracker suite engineered with APA – optimizing steel interfaces, with natural wire management interoperability AtlasTM I Standard Soil Conditions Connects driven Sigma foundations through an adjustable rolled-steel C-channel – corrects driving variation in the field Entry into >$1B traditional foundation TAM(1) – displaces commodity driven steel beam, increasing available ASP by $0.03-$0.04 / watt with 45x eligibility Installation efficiency - Shortened driven foundation reduces deformation risk AtlasTM II Challenging Soil Conditions Pairs engineered foundations – helical piles, ground screws – with a purpose built dual-leg tracker bearing interface 70% fewer components than traditional A-Frame®, with fewer connection points allowing faster installs; also with 45x eligibility Improved vertical and East/West adjustability for varied topography The first integrated ARRAY × APA platform An engineered bearing housing with an integrated tracker interface above grade, across virtually any soil condition (1) Source: Wood Mackenzie Global Solar Tracker Landscape H1 2026 Report and company estimates


12 H. Keith Jennings Chief Financial Officer FINANCIAL UPDATE 2Q 26 E A R N IN G S PR ES EN TA TI O N


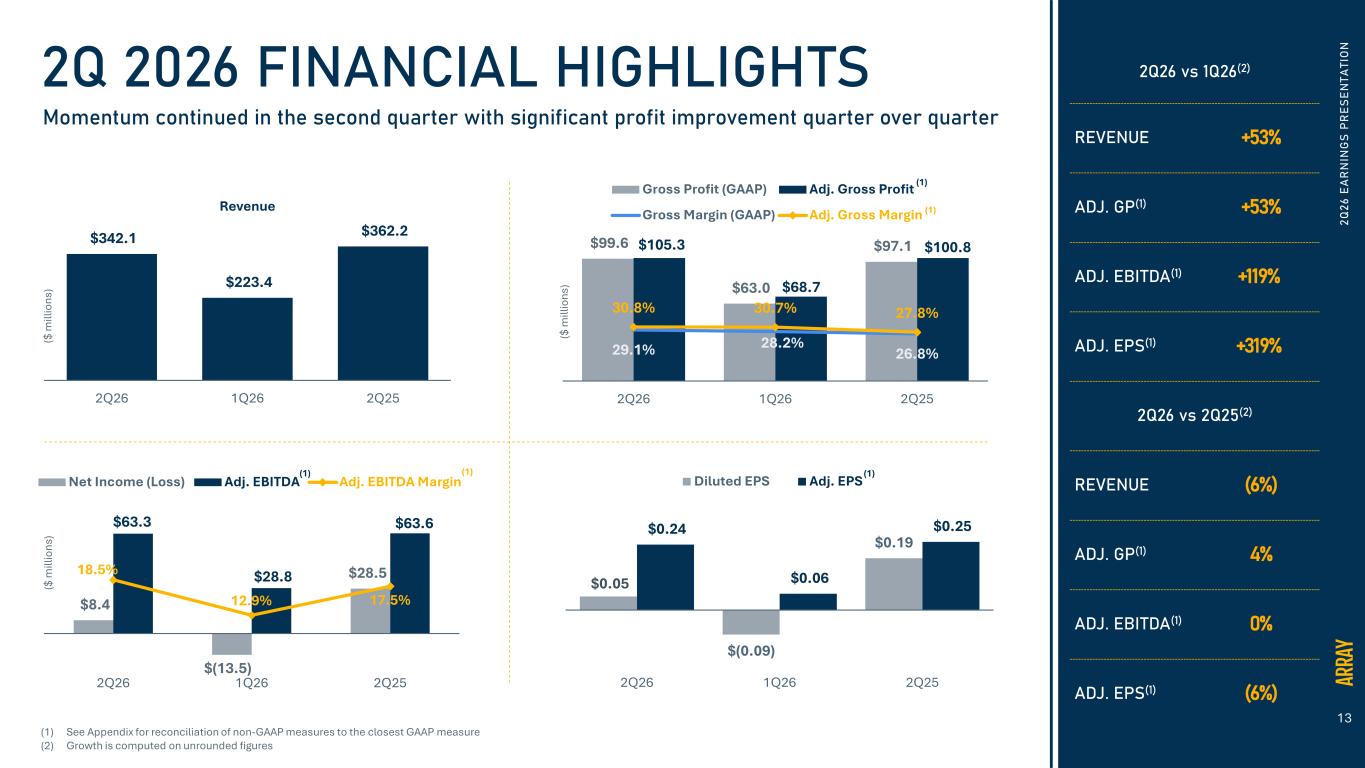
13 $99.6 $63.0 $97.1 $105.3 $68.7 $100.8 29.1% 28.2% 26.8% 30.8% 30.7% 27.8% 2Q26 1Q26 2Q25 Gross Profit (GAAP) Adj. Gross Profit Gross Margin (GAAP) Adj. Gross Margin 2Q 26 E A R N IN G S PR ES EN TA TI O N2Q 2026 FINANCIAL HIGHLIGHTS Momentum continued in the second quarter with significant profit improvement quarter over quarter $342.1 $223.4 $362.2 2Q26 1Q26 2Q25 Revenue $0.05 $(0.09) $0.19 $0.24 $0.06 $0.25 2Q26 1Q26 2Q25 Diluted EPS Adj. EPS $8.4 $(13.5) $28.5 $63.3 $28.8 $63.6 18.5% 12.9% 17.5% 2Q26 1Q26 2Q25 Net Income (Loss) Adj. EBITDA Adj. EBITDA Margin 2Q26 vs 1Q26(2) REVENUE +53% ADJ. GP(1) +53% ADJ. EBITDA(1) +119% ADJ. EPS(1) +319% 2Q26 vs 2Q25(2) REVENUE (6%) ADJ. GP(1) 4% ADJ. EBITDA(1) 0% ADJ. EPS(1) (6%) ($ m ill io ns ) ($ m ill io ns ) ($ m ill io ns ) (1) (1) (1) (1)(1) (1) See Appendix for reconciliation of non-GAAP measures to the closest GAAP measure (2) Growth is computed on unrounded figures


14 2Q 2026 FINANCIAL RESULTS Sequential outperformance from 1Q26 across revenue, adjusted EBITDA(1) and adjusted EPS(1) Financial Highlights 2Q26 Adjusted Gross Margin(1) of 30.8%, +300bps vs 2Q25, primarily due to stronger domestic volumes, cost out initiatives, and increased 45X capture 2Q26 Adjusted EBITDA(1) of $63M, sequentially up 119% vs 1Q26, primarily due to outperformance in domestic tracker business and gross margin improvements (1) See Appendix for reconciliation of non-GAAP measures to the closest GAAP measure ($ in millions, except EPS Data) 2Q26 1Q26 2Q25 Revenue $342.1 $223.4 $362.2 Gross margin 29.1% 28.2% 26.8% Net income (loss) to Common Stockholders $8.4 ($13.5) $28.5 Diluted net income (loss) per share $0.05 ($0.09) $0.19 Net cash provided by (used in) operating activities $121.3 ($29.4) $43.8 Adjusted gross margin(1) 30.8% 30.7% 27.8% Adjusted EBITDA(1) $63.3 $28.8 $63.6 Adjusted EBITDA margin(1) 18.5% 12.9% 17.5% Adjusted net income(1) $37.0 $8.8 $38.8 Adjusted net income per common share(1) $0.24 $0.06 $0.25 Free Cash Flow(1) $113.6 ($36.9) $37.2 2Q 26 E A R N IN G S PR ES EN TA TI O N


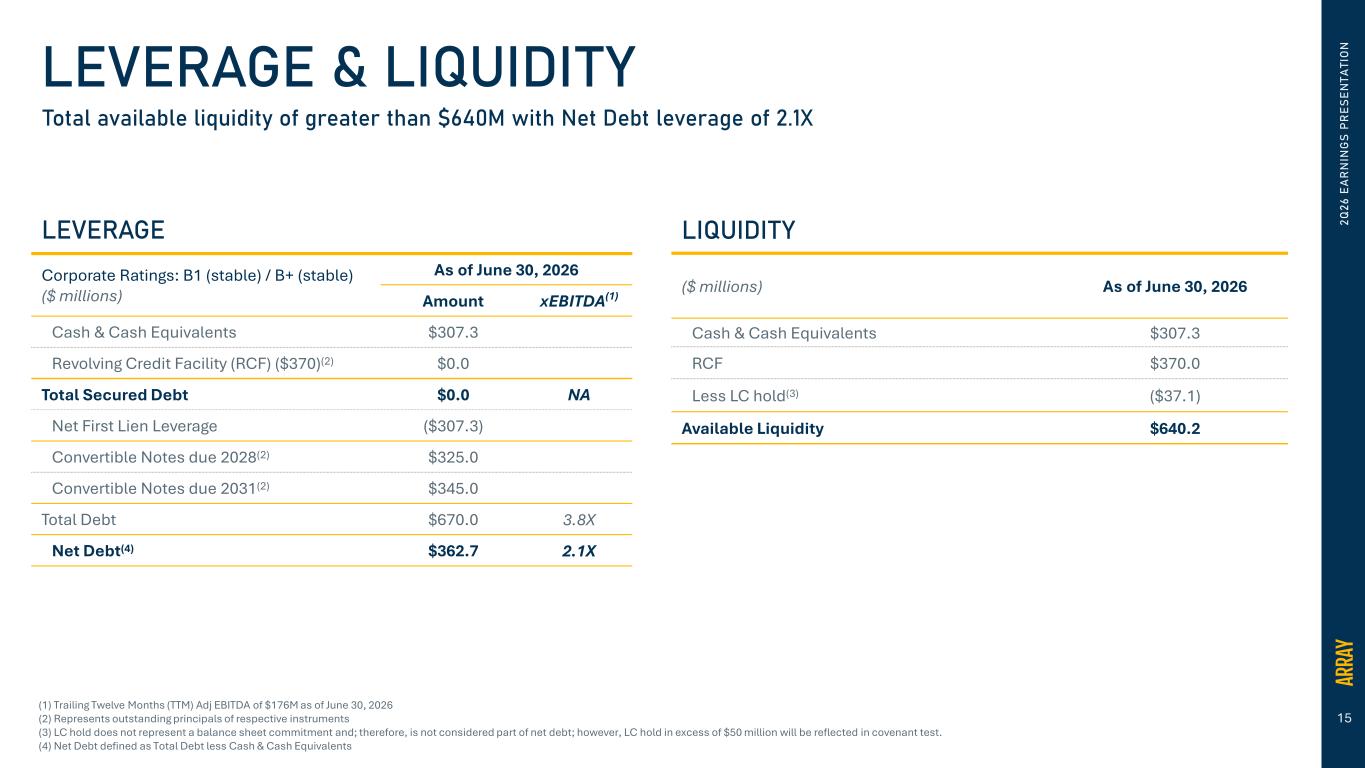
15 2Q 26 E A R N IN G S PR ES EN TA TI O NLEVERAGE & LIQUIDITY Total available liquidity of greater than �640M with Net Debt leverage of 2.1X LIQUIDITY ($ millions) As of June 30, 2026 Cash & Cash Equivalents $307.3 RCF $370.0 Less LC hold(3) ($37.1) Available Liquidity $640.2 (1) Trailing Twelve Months (TTM) Adj EBITDA of $176M as of June 30, 2026 (2) Represents outstanding principals of respective instruments (3) LC hold does not represent a balance sheet commitment and; therefore, is not considered part of net debt; however, LC hold in excess of $50 million will be reflected in covenant test. (4) Net Debt defined as Total Debt less Cash & Cash Equivalents LEVERAGE Corporate Ratings: B1 (stable) / B+ (stable) ($ millions) As of June 30, 2026 Amount xEBITDA(1) Cash & Cash Equivalents $307.3 Revolving Credit Facility (RCF) ($370)(2) $0.0 Total Secured Debt $0.0 NA Net First Lien Leverage ($307.3) Convertible Notes due 2028(2) $325.0 Convertible Notes due 2031(2) $345.0 Total Debt $670.0 3.8X Net Debt(4) $362.7 2.1X


16 2Q 26 E A R N IN G S PR ES EN TA TI O NUPDATING 2026 FULL YEAR GUIDANCE FULL YEAR ENDING DECEMBER 31, 2026 PREVIOUS UPDATED Revenue $1.4B - $1.5B $1.4B - $1.5B Adjusted EBITDA(1) $200M - $230M $210M - $230M Adjusted Net Income Per Common Share(1) $0.65 - $0.75 $0.68 - $0.75 (1) A reconciliation of projected adjusted gross profit, adjusted gross margin, adjusted EBITDA, adjusted net income per common share, adjusted G&A, and free cash flow, which are forward-looking measures that are not prepared in accordance with GAAP, to the most directly comparable GAAP financial measures, is not provided because we are unable to provide such reconciliation without unreasonable effort. The inability to provide a quantitative reconciliation is due to the uncertainty and inherent difficulty predicting the occurrence, the financial impact and the periods in which the components of the applicable GAAP measures and non-GAAP adjustments may be recognized. The GAAP measures may include the impact of such items as non-cash share-based compensation, revaluation of the fair-value of our contingent consideration, amortization of intangible assets and the tax effect of such items, in addition to other items we have historically excluded from adjusted EBITDA and adjusted net income per share. We expect to continue to exclude these items in future disclosures of these non-GAAP measures and may also exclude other similar items that may arise in the future (collectively, “non-GAAP adjustments”). The decisions and events that typically lead to the recognition of non-GAAP adjustments are inherently unpredictable as to if or when they may occur. As such, for our 2026 guidance, we have not included estimates for these items and are unable to address the probable significance of the unavailable information, which could be material to future results. 3Q26 ENDING SEPTEMBER 30, 2026 Full-Year 2026 Assumptions: FY Adjusted Gross Margin(1): 27% - 28% (Prior: 26% - 27%) FY Adjusted G&A(1): Approx. 12% of revenue Free Cash Flow(1) conversion as % of Adjusted EBITDA: Expect some timing shift into Q1’27 with Q4’26 peak (Prior: similar to 2025) Revenue $310M - $330M Excludes the potential impact of the acquisition of AWM, subject to receiving any required regulatory approvals and the satisfaction of other customary closing conditions.


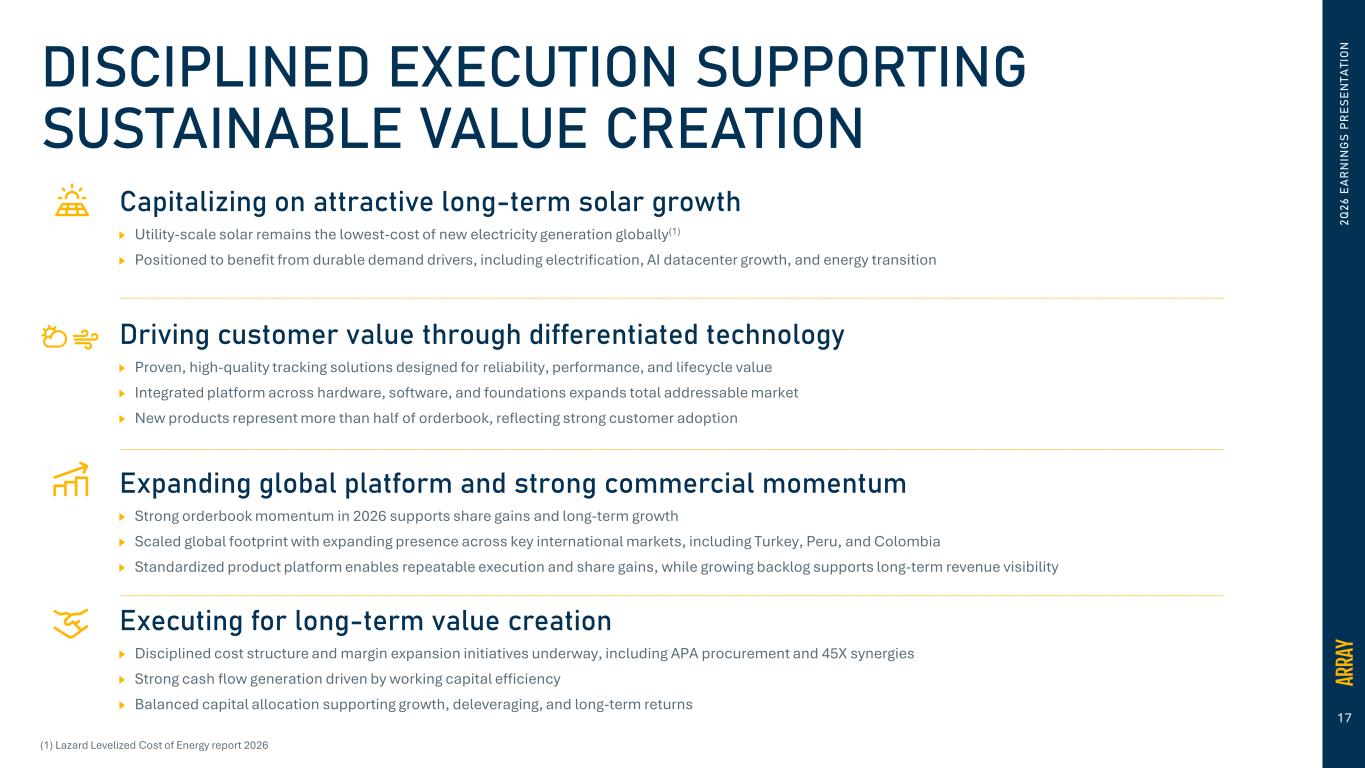
17 Capitalizing on attractive long-term solar growth Utility-scale solar remains the lowest-cost of new electricity generation globally(1) Positioned to benefit from durable demand drivers, including electrification, AI datacenter growth, and energy transition Driving customer value through differentiated technology Proven, high-quality tracking solutions designed for reliability, performance, and lifecycle value Integrated platform across hardware, software, and foundations expands total addressable market New products represent more than half of orderbook, reflecting strong customer adoption Expanding global platform and strong commercial momentum Strong orderbook momentum in 2026 supports share gains and long-term growth Scaled global footprint with expanding presence across key international markets, including Turkey, Peru, and Colombia Standardized product platform enables repeatable execution and share gains, while growing backlog supports long-term revenue visibility Executing for long-term value creation Disciplined cost structure and margin expansion initiatives underway, including APA procurement and 45X synergies Strong cash flow generation driven by working capital efficiency Balanced capital allocation supporting growth, deleveraging, and long-term returns (1) Lazard Levelized Cost of Energy report 2026 2Q 26 E A R N IN G S PR ES EN TA TI O NDISCIPLINED EXECUTION SUPPORTING SUSTAINABLE VALUE CREATION


18 APPENDIX 2Q 26 E A R N IN G S PR ES EN TA TI O N


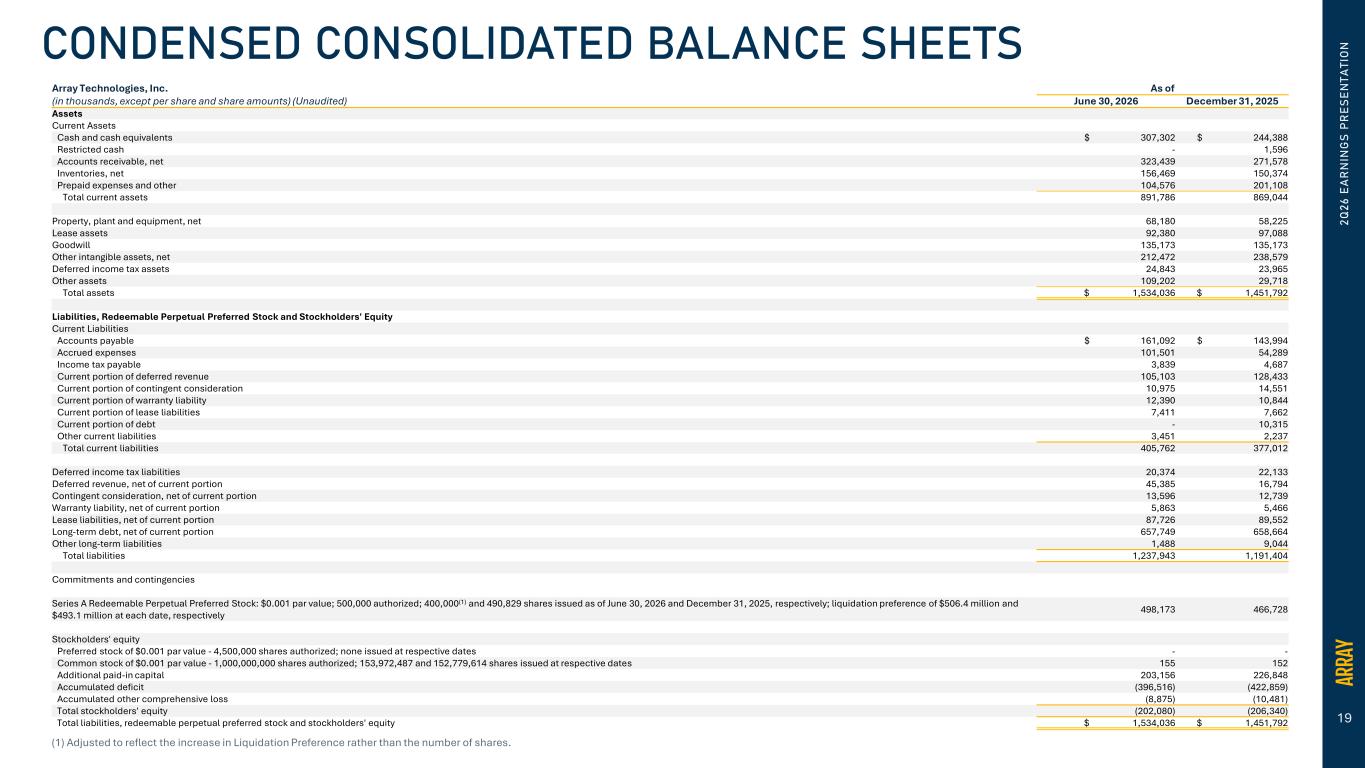
19 Array Technologies, Inc. As of (in thousands, except per share and share amounts) (Unaudited) June 30, 2026 December 31, 2025 Assets Current Assets Cash and cash equivalents $ 307,302 $ 244,388 Restricted cash - 1,596 Accounts receivable, net 323,439 271,578 Inventories, net 156,469 150,374 Prepaid expenses and other 104,576 201,108 Total current assets 891,786 869,044 Property, plant and equipment, net 68,180 58,225 Lease assets 92,380 97,088 Goodwill 135,173 135,173 Other intangible assets, net 212,472 238,579 Deferred income tax assets 24,843 23,965 Other assets 109,202 29,718 Total assets $ 1,534,036 $ 1,451,792 Liabilities, Redeemable Perpetual Preferred Stock and Stockholders' Equity Current Liabilities Accounts payable $ 161,092 $ 143,994 Accrued expenses 101,501 54,289 Income tax payable 3,839 4,687 Current portion of deferred revenue 105,103 128,433 Current portion of contingent consideration 10,975 14,551 Current portion of warranty liability 12,390 10,844 Current portion of lease liabilities 7,411 7,662 Current portion of debt - 10,315 Other current liabilities 3,451 2,237 Total current liabilities 405,762 377,012 Deferred income tax liabilities 20,374 22,133 Deferred revenue, net of current portion 45,385 16,794 Contingent consideration, net of current portion 13,596 12,739 Warranty liability, net of current portion 5,863 5,466 Lease liabilities, net of current portion 87,726 89,552 Long-term debt, net of current portion 657,749 658,664 Other long-term liabilities 1,488 9,044 Total liabilities 1,237,943 1,191,404 Commitments and contingencies Series A Redeemable Perpetual Preferred Stock: $0.001 par value; 500,000 authorized; 400,000(1) and 490,829 shares issued as of June 30, 2026 and December 31, 2025, respectively; liquidation preference of $506.4 million and $493.1 million at each date, respectively 498,173 466,728 Stockholders' equity Preferred stock of $0.001 par value - 4,500,000 shares authorized; none issued at respective dates - - Common stock of $0.001 par value - 1,000,000,000 shares authorized; 153,972,487 and 152,779,614 shares issued at respective dates 155 152 Additional paid-in capital 203,156 226,848 Accumulated deficit (396,516) (422,859) Accumulated other comprehensive loss (8,875) (10,481) Total stockholders' equity (202,080) (206,340) Total liabilities, redeemable perpetual preferred stock and stockholders' equity $ 1,534,036 $ 1,451,792 2Q 26 E A R N IN G S PR ES EN TA TI O NCONDENSED CONSOLIDATED BALANCE SHEETS (1) Adjusted to reflect the increase in Liquidation Preference rather than the number of shares.


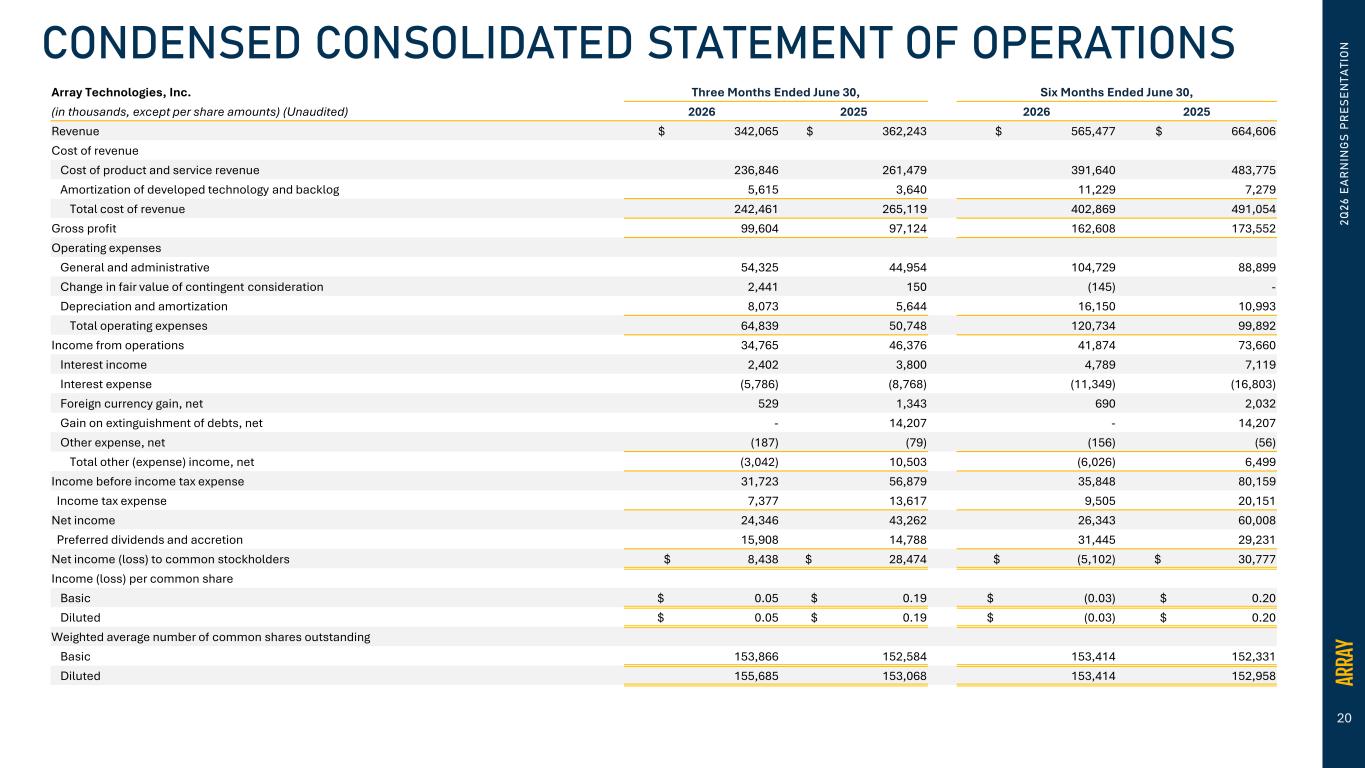
20 2Q 26 E A R N IN G S PR ES EN TA TI O NCONDENSED CONSOLIDATED STATEMENT OF OPERATIONS Array Technologies, Inc. Three Months Ended June 30, Six Months Ended June 30, (in thousands, except per share amounts) (Unaudited) 2026 2025 2026 2025 Revenue $ 342,065 $ 362,243 $ 565,477 $ 664,606 Cost of revenue Cost of product and service revenue 236,846 261,479 391,640 483,775 Amortization of developed technology and backlog 5,615 3,640 11,229 7,279 Total cost of revenue 242,461 265,119 402,869 491,054 Gross profit 99,604 97,124 162,608 173,552 Operating expenses General and administrative 54,325 44,954 104,729 88,899 Change in fair value of contingent consideration 2,441 150 (145) - Depreciation and amortization 8,073 5,644 16,150 10,993 Total operating expenses 64,839 50,748 120,734 99,892 Income from operations 34,765 46,376 41,874 73,660 Interest income 2,402 3,800 4,789 7,119 Interest expense (5,786) (8,768) (11,349) (16,803) Foreign currency gain, net 529 1,343 690 2,032 Gain on extinguishment of debts, net - 14,207 - 14,207 Other expense, net (187) (79) (156) (56) Total other (expense) income, net (3,042) 10,503 (6,026) 6,499 Income before income tax expense 31,723 56,879 35,848 80,159 Income tax expense 7,377 13,617 9,505 20,151 Net income 24,346 43,262 26,343 60,008 Preferred dividends and accretion 15,908 14,788 31,445 29,231 Net income (loss) to common stockholders $ 8,438 $ 28,474 $ (5,102) $ 30,777 Income (loss) per common share Basic $ 0.05 $ 0.19 $ (0.03) $ 0.20 Diluted $ 0.05 $ 0.19 $ (0.03) $ 0.20 Weighted average number of common shares outstanding Basic 153,866 152,584 153,414 152,331 Diluted 155,685 153,068 153,414 152,958


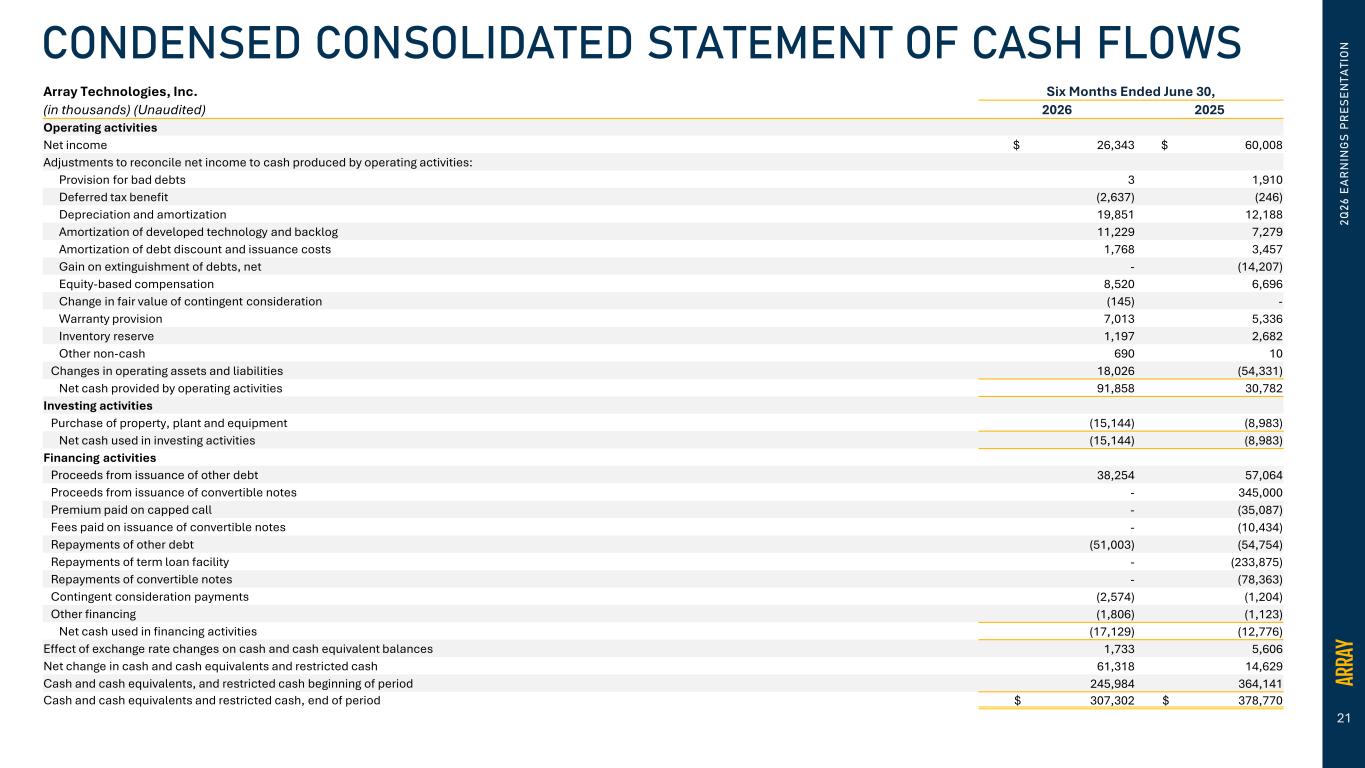
21 2Q 26 E A R N IN G S PR ES EN TA TI O NCONDENSED CONSOLIDATED STATEMENT OF CASH FLOWS Array Technologies, Inc. Six Months Ended June 30, (in thousands) (Unaudited) 2026 2025 Operating activities Net income $ 26,343 $ 60,008 Adjustments to reconcile net income to cash produced by operating activities: Provision for bad debts 3 1,910 Deferred tax benefit (2,637) (246) Depreciation and amortization 19,851 12,188 Amortization of developed technology and backlog 11,229 7,279 Amortization of debt discount and issuance costs 1,768 3,457 Gain on extinguishment of debts, net - (14,207) Equity-based compensation 8,520 6,696 Change in fair value of contingent consideration (145) - Warranty provision 7,013 5,336 Inventory reserve 1,197 2,682 Other non-cash 690 10 Changes in operating assets and liabilities 18,026 (54,331) Net cash provided by operating activities 91,858 30,782 Investing activities Purchase of property, plant and equipment (15,144) (8,983) Net cash used in investing activities (15,144) (8,983) Financing activities Proceeds from issuance of other debt 38,254 57,064 Proceeds from issuance of convertible notes - 345,000 Premium paid on capped call - (35,087) Fees paid on issuance of convertible notes - (10,434) Repayments of other debt (51,003) (54,754) Repayments of term loan facility - (233,875) Repayments of convertible notes - (78,363) Contingent consideration payments (2,574) (1,204) Other financing (1,806) (1,123) Net cash used in financing activities (17,129) (12,776) Effect of exchange rate changes on cash and cash equivalent balances 1,733 5,606 Net change in cash and cash equivalents and restricted cash 61,318 14,629 Cash and cash equivalents, and restricted cash beginning of period 245,984 364,141 Cash and cash equivalents and restricted cash, end of period $ 307,302 $ 378,770


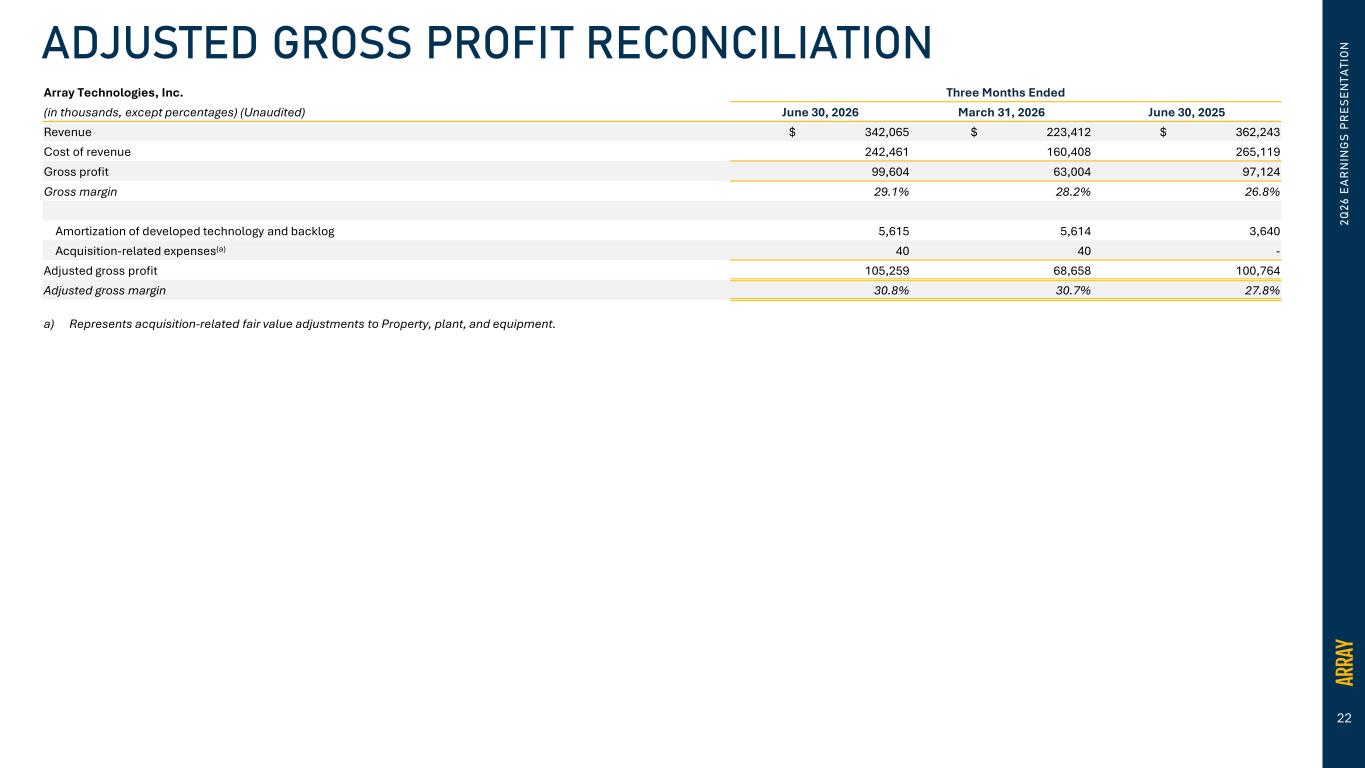
22 2Q 26 E A R N IN G S PR ES EN TA TI O NADJUSTED GROSS PROFIT RECONCILIATION Array Technologies, Inc. Three Months Ended (in thousands, except percentages) (Unaudited) June 30, 2026 March 31, 2026 June 30, 2025 Revenue $ 342,065 $ 223,412 $ 362,243 Cost of revenue 242,461 160,408 265,119 Gross profit 99,604 63,004 97,124 Gross margin 29.1% 28.2% 26.8% Amortization of developed technology and backlog 5,615 5,614 3,640 Acquisition-related expenses(a) 40 40 - Adjusted gross profit 105,259 68,658 100,764 Adjusted gross margin 30.8% 30.7% 27.8% a) Represents acquisition-related fair value adjustments to Property, plant, and equipment.


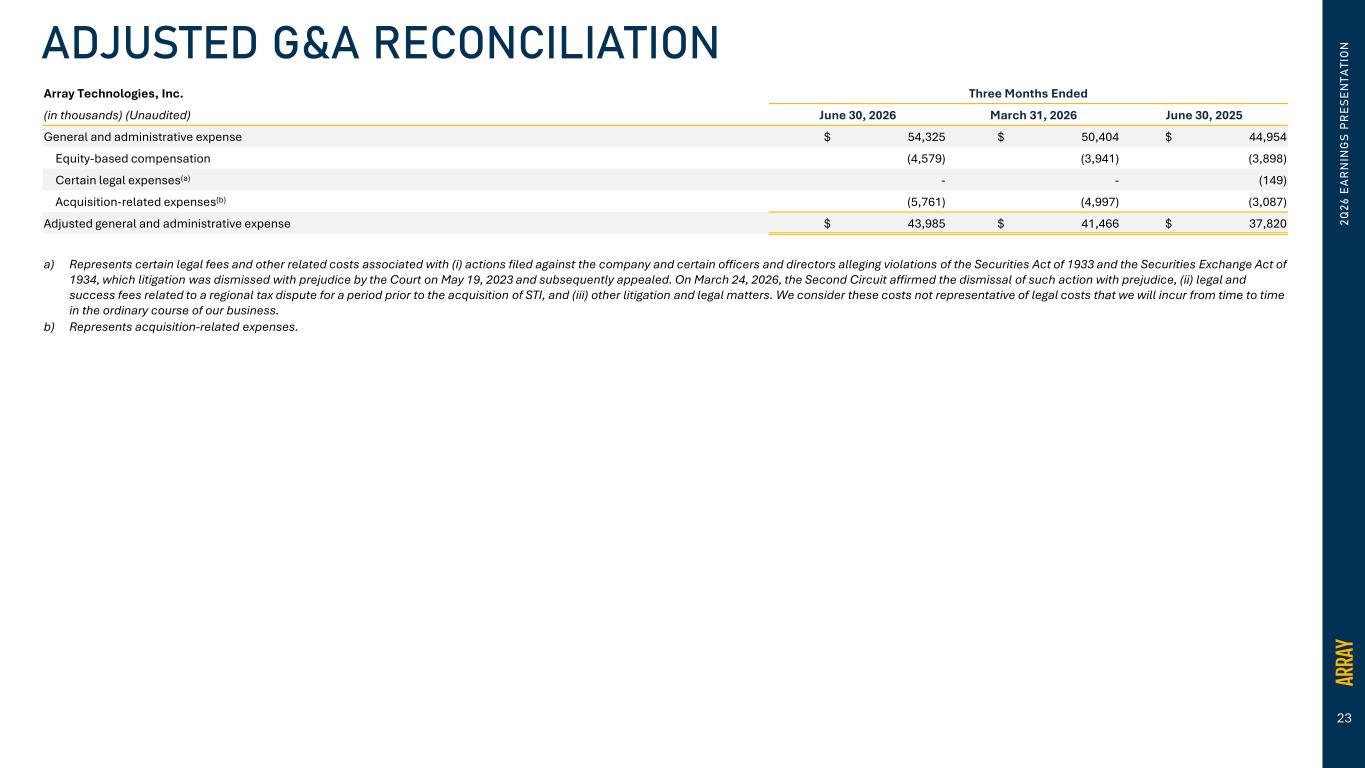
23 Array Technologies, Inc. Three Months Ended (in thousands) (Unaudited) June 30, 2026 March 31, 2026 June 30, 2025 General and administrative expense $ 54,325 $ 50,404 $ 44,954 Equity-based compensation (4,579) (3,941) (3,898) Certain legal expenses(a) - - (149) Acquisition-related expenses(b) (5,761) (4,997) (3,087) Adjusted general and administrative expense $ 43,985 $ 41,466 $ 37,820 a) Represents certain legal fees and other related costs associated with (i) actions filed against the company and certain officers and directors alleging violations of the Securities Act of 1933 and the Securities Exchange Act of 1934, which litigation was dismissed with prejudice by the Court on May 19, 2023 and subsequently appealed. On March 24, 2026, the Second Circuit affirmed the dismissal of such action with prejudice, (ii) legal and success fees related to a regional tax dispute for a period prior to the acquisition of STI, and (iii) other litigation and legal matters. We consider these costs not representative of legal costs that we will incur from time to time in the ordinary course of our business. b) Represents acquisition-related expenses. 2Q 26 E A R N IN G S PR ES EN TA TI O NADJUSTED G&A RECONCILIATION


24 Array Technologies, Inc. Three Months Ended (in thousands) (Unaudited) June 30, 2026 March 31, 2026 December 31, 2025 September 30, 2025 June 30, 2025 Net income (loss) $ 24,346 $ 1,997 $ (145,746) $ 33,503 $ 43,262 Preferred dividends and accretion 15,908 15,537 15,422 15,144 14,788 Net income (loss) to common stockholders $ 8,438 $ (13,540) $ (161,168) $ 18,359 $ 28,474 Other income, net (2,215) (2,418) (752) (3,045) (3,721) Gain on extinguishment of debts, net - - - - (14,207) Foreign currency (gain) loss, net (529) (161) (16) 6 (1,343) Preferred dividends and accretion 15,908 15,537 15,422 15,144 14,788 Interest expense 5,786 5,563 5,482 5,046 8,768 Income tax expense (benefit) 7,377 2,128 (7,074) 9,941 13,617 Depreciation expense 2,728 2,364 2,336 1,537 1,178 Amortization of intangibles 7,371 7,388 7,508 6,199 5,078 Amortization of developed technology and backlog 5,615 5,614 5,807 4,434 3,640 Equity-based compensation 4,579 3,941 4,228 4,647 3,898 Change in fair value of contingent consideration 2,441 (2,586) (837) 1,014 150 Goodwill impairment - - 102,560 - - Certain legal expenses(a) - - - - 149 Acquisition-related expenses(b) 5,761 4,997 5,960 8,912 3,087 Inventory valuation charge(c) - - 29,516 - - Other costs(d) - - 2,267 - - Adjusted EBITDA $ 63,260 $ 28,827 $ 11,239 $ 72,194 $ 63,556 Adjusted EBITDA margin 18.5% 12.9% 5.0% 18.3% 17.5% a) Represents certain legal fees and other related costs associated with (i) actions filed against the company and certain officers and directors alleging violations of the Securities Act of 1933 and the Securities Exchange Act of 1934, which litigation was dismissed with prejudice by the Court on May 19, 2023 and subsequently appealed. On March 24, 2026, the Second Circuit affirmed the dismissal of such action with prejudice, (ii) legal and success fees related to a regional tax dispute for a period prior to the acquisition of STI, and (iii) other litigation and legal matters. We consider these costs not representative of legal costs that we will incur from time to time in the ordinary course of our business. b) Represents acquisition-related expenses. c) Represents inventory valuation charge related to phase-out of STI H250TM inventory that is not SmarTrack® compatible. d) Represents $1.2 million organization restructuring and $1.1 million resolution of STI legacy VAT matter. 2Q 26 E A R N IN G S PR ES EN TA TI O NADJUSTED EBITDA RECONCILIATION


25 2Q 26 E A R N IN G S PR ES EN TA TI O NADJUSTED NET INCOME RECONCILIATION Array Technologies, Inc. Three Months Ended (in thousands, except per share amounts) (Unaudited) June 30, 2026 March 31, 2026 June 30, 2025 Net income $ 24,346 $ 1,997 $ 43,262 Preferred dividends and accretion 15,908 15,537 14,788 Net income (loss) to common stockholders $ 8,438 $ (13,540) $ 28,474 Amortization of intangibles 7,371 7,388 5,078 Amortization of developed technology and backlog 5,615 5,614 3,640 Amortization of debt discount and issuance costs 892 876 2,064 Gain on extinguishment of debts, net - - (14,207) Series A Preferred Stock accretion 8,032 7,868 7,393 Equity-based compensation 4,579 3,941 3,898 Change in fair value of contingent consideration 2,441 (2,586) 150 Certain legal expenses (a) - - 149 Acquisition-related expenses(b) 5,825 5,061 3,087 Income tax expense of adjustments (c) (6,145) (5,790) (975) Adjusted net income $ 37,048 $ 8,832 $ 38,751 Income (loss) per common share Basic $ 0.05 $ (0.09) $ 0.19 Diluted $ 0.05 $ (0.09) $ 0.19 Weighted average number of common shares outstanding Basic 153,866 152,956 152,584 Diluted 155,685 152,956 153,068 Adjusted net income per common share Basic $ 0.24 $ 0.06 $ 0.25 Diluted $ 0.24 $ 0.06 $ 0.25 Weighted average number of common shares outstanding Basic 153,866 152,956 152,584 Diluted 155,685 155,485 153,068 a) Represents certain legal fees and other related costs associated with (i) actions filed against the company and certain officers and directors alleging violations of the Securities Act of 1933 and the Securities Exchange Act of 1934, which litigation was dismissed with prejudice by the Court on May 19, 2023 and subsequently appealed. On March 24, 2026, the Second Circuit affirmed the dismissal of such action with prejudice, (ii) legal and success fees related to a regional tax dispute for a period prior to the acquisition of STI, and (iii) other litigation and legal matters. We consider these costs not representative of legal costs that we will incur from time to time in the ordinary course of our business. b) Represents acquisition-related expenses and fair value adjustments to Property, plant, and equipment. c) Represents the estimated tax impact of all Adjusted Net Income add-backs, excluding those which represent permanent differences between book versus tax.


26 2Q 26 E A R N IN G S PR ES EN TA TI O NFREE CASH FLOW RECONCILIATION Array Technologies, Inc. Three Months Ended (in thousands) (Unaudited) June 30, 2026 March 31, 2026 June 30, 2025 Net cash provided by (used in) operating activities $ 121,279 $ (29,421) $ 43,841 Purchase of property, plant and equipment (7,633) (7,511) (6,631) Free cash flow $ 113,646 $ (36,932) $ 37,210


27 2Q 26 E A R N IN G S PR ES EN TA TI O N THANK YOU investors@arraytechinc.com