| Exhibit | Description of Exhibit | |||||||
| 99.1 | ||||||||
| 99.2 | ||||||||
| 99.3 | ||||||||
| 99.4 | ||||||||
| HIGH TIDE INC. | ||||||||
| (Registrant) | ||||||||
Date: June 15, 2026 |
By: | /s/ Raj Grover | ||||||
| Raj Grover | ||||||||
| President and Chief Executive Officer | ||||||||

|
High Tide Inc. | ||||
| Condensed Interim Consolidated Statements of Financial Position | |||||
| As at April 30, 2026 and October 31, 2025 | |||||
| (Unaudited — In thousands of Canadian dollars) | |||||
Notes |
2026 | 2025 | ||||||||||||||||||
| $ | $ | |||||||||||||||||||
| Assets | ||||||||||||||||||||
| Current assets | ||||||||||||||||||||
| Cash and cash equivalents | 27,425 | 39,254 | ||||||||||||||||||
| Restricted cash | 3, 17 | 9,096 | 8,629 | |||||||||||||||||
| Marketable securities | 58 | 64 | ||||||||||||||||||
| Trade and other receivables | 11 | 7,721 | 5,615 | |||||||||||||||||
| Inventory | 10 | 71,700 | 67,406 | |||||||||||||||||
| Prepaid expenses and deposits | 9 | 15,358 | 15,917 | |||||||||||||||||
| Total current assets | 131,358 | 136,885 | ||||||||||||||||||
| Non-current assets | ||||||||||||||||||||
| Property and equipment | 7 | 29,086 | 29,436 | |||||||||||||||||
| Right‐of‐use assets | 27 | 56,252 | 47,793 | |||||||||||||||||
| Long term prepaid expenses and deposits | 9 | 5,381 | 4,114 | |||||||||||||||||
| Intangible assets and goodwill | 8 | 124,505 | 129,549 | |||||||||||||||||
| Long term contract asset | 5 | 1,285 | 1,285 | |||||||||||||||||
| Total non-current assets | 216,509 | 212,177 | ||||||||||||||||||
| Total assets | 347,867 | 349,062 | ||||||||||||||||||
| Liabilities | ||||||||||||||||||||
| Current liabilities | ||||||||||||||||||||
| Accounts payable and accrued liabilities | 13 | 55,341 | 47,251 | |||||||||||||||||
| Income tax payable | 7,339 | 7,189 | ||||||||||||||||||
| Deferred revenue | 14 | 3,259 | 7,989 | |||||||||||||||||
| Interest bearing loans and borrowings | 17 | 7,064 | 16,189 | |||||||||||||||||
| Current portion of notes payable | 12 | 1,245 | 1,536 | |||||||||||||||||
| Current portion of lease liabilities | 27 | 9,905 | 9,814 | |||||||||||||||||
| Current derivative liability | 16 | 5,757 | 9,951 | |||||||||||||||||
| Total current liabilities | 89,910 | 99,919 | ||||||||||||||||||
| Non-current liabilities | ||||||||||||||||||||
| Notes payable | 12 | 11,836 | 11,903 | |||||||||||||||||
| Lease liabilities | 27 | 47,767 | 39,986 | |||||||||||||||||
| Deferred tax liability | 7,011 | 7,100 | ||||||||||||||||||
| Secured debentures | 18 | 12,765 | 12,536 | |||||||||||||||||
| Convertible debt | 15 | 18,764 | 17,877 | |||||||||||||||||
| Derivative liability | 16 | 57,902 | 56,954 | |||||||||||||||||
| Total non-current liabilities | 156,045 | 146,356 | ||||||||||||||||||
| Total liabilities | 245,955 | 246,275 | ||||||||||||||||||
| Shareholders' equity | ||||||||||||||||||||
| Share capital | 20 |
331,108 | 329,642 | |||||||||||||||||
| Warrants | 22 | 4,546 | 4,546 | |||||||||||||||||
| Contributed surplus | 41,358 | 42,024 | ||||||||||||||||||
| Derivative liability - equity | 16 | (35,797) | (35,797) | |||||||||||||||||
| Accumulated other comprehensive income | 6,539 | 7,299 | ||||||||||||||||||
| Accumulated deficit | (259,097) | (260,105) | ||||||||||||||||||
| Equity attributable to owners of the Company | 88,657 | 87,609 | ||||||||||||||||||
| Non-controlling interest | 30 | 13,255 | 15,178 | |||||||||||||||||
| Total shareholders' equity | 101,912 | 102,787 | ||||||||||||||||||
| Total liabilities and shareholders' equity | 347,867 | 349,062 | ||||||||||||||||||
3 | ||
|
High Tide Inc. | ||||
| Condensed Interim Consolidated Statements of Income (Loss) and Comprehensive Income (Loss) | |||||
| For the three and six months ended April 30, 2026 and 2025 | |||||
| (Unaudited — In thousands of Canadian dollars, except share and per share amounts) | |||||
| Three months ended | Six months ended | ||||||||||||||||||||||||||||
Notes |
2026 | 2025 | 2026 | 2025 | |||||||||||||||||||||||||
| $ | $ | $ | $ | ||||||||||||||||||||||||||
| Revenue | 6, 25 | 179,296 | 137,804 | 357,625 | 280,265 | ||||||||||||||||||||||||
| Cost of sales | (130,113) | (102,333) | (263,343) | (209,354) | |||||||||||||||||||||||||
| Inventory fair value | (792) | — | (1,482) | — | |||||||||||||||||||||||||
| Gross profit | 48,391 | 35,471 | 92,800 | 70,911 | |||||||||||||||||||||||||
| Expenses | |||||||||||||||||||||||||||||
| Salaries, wages and benefits | (21,281) | (17,476) | (42,386) | (35,057) | |||||||||||||||||||||||||
| Share-based compensation | 21 | (881) | (1,250) | (1,251) | (2,425) | ||||||||||||||||||||||||
| General and administration | (7,241) | (5,768) | (14,634) | (12,331) | |||||||||||||||||||||||||
| Professional fees | (3,819) | (1,690) | (6,256) | (3,499) | |||||||||||||||||||||||||
| Advertising and promotion | (924) | (1,030) | (1,868) | (1,942) | |||||||||||||||||||||||||
| Depreciation and amortization | 7, 8, 27 | (6,146) | (5,880) | (14,172) | (11,727) | ||||||||||||||||||||||||
| Interest and bank charges | (2,002) | (1,445) | (3,765) | (2,931) | |||||||||||||||||||||||||
| Total expenses | (42,294) | (34,539) | (84,332) | (69,912) | |||||||||||||||||||||||||
| Income from operations | 6,097 | 932 | 8,468 | 999 | |||||||||||||||||||||||||
| Other income (expenses) | |||||||||||||||||||||||||||||
| Finance and other costs | 19 | (5,228) | (3,566) | (11,341) | (6,297) | ||||||||||||||||||||||||
| Gain (loss) on foreign exchange | 212 | (114) | 356 | (101) | |||||||||||||||||||||||||
| Other loss | — | (42) | — | (42) | |||||||||||||||||||||||||
| Fair value change in derivative liability | 16 | (762) | — | 2,524 | — | ||||||||||||||||||||||||
| Total other (expenses) income | (5,778) | (3,722) | (8,461) | (6,440) | |||||||||||||||||||||||||
| Income (loss) before taxes | 319 | (2,790) | 7 | (5,441) | |||||||||||||||||||||||||
| Income tax expense | (295) | (46) | (335) | (84) | |||||||||||||||||||||||||
| Net income (loss) | 24 | (2,836) | (328) | (5,525) | |||||||||||||||||||||||||
| Other comprehensive income (loss) | |||||||||||||||||||||||||||||
| Translation difference on foreign operations | (414) | (1,044) | (760) | (163) | |||||||||||||||||||||||||
| Total comprehensive loss | (390) | (3,880) | (1,088) | (5,688) | |||||||||||||||||||||||||
| Net loss attributed to: | |||||||||||||||||||||||||||||
| Owners of the Company | (197) | (2,898) | 1,008 | (5,706) | |||||||||||||||||||||||||
| Non-controlling interest | 30 | 221 | 62 | (1,336) | 181 | ||||||||||||||||||||||||
| 24 | (2,836) | (328) | (5,525) | ||||||||||||||||||||||||||
| | |||||||||||||||||||||||||||||
| Comprehensive loss attributed to: | |||||||||||||||||||||||||||||
| Owners of the Company | (377) | (3,957) | 227 | (5,879) | |||||||||||||||||||||||||
| Non-controlling interest | 30 | (13) | 77 | (1,315) | 191 | ||||||||||||||||||||||||
| (390) | (3,880) | (1,088) | (5,688) | ||||||||||||||||||||||||||
| | |||||||||||||||||||||||||||||
| Income (loss) per share | |||||||||||||||||||||||||||||
| Basic and diluted | 23 | — | (0.04) | 0.01 | (0.07) | ||||||||||||||||||||||||
4 | ||
|
|
High Tide Inc. | ||||
| Condensed Interim Consolidated Statements of Changes in Equity | |||||
| For the six months ended April 30, 2026 and 2025 | |||||
| (Unaudited — In thousands of Canadian dollars) | |||||
Accumulated |
||||||||||||||||||||||||||||||||||||||||||||||||||||||||||||||
| Derivative | other |
Attributable |
||||||||||||||||||||||||||||||||||||||||||||||||||||||||||||
Contributed |
liability - | comprehensive |
Accumulated |
to owners of |
||||||||||||||||||||||||||||||||||||||||||||||||||||||||||
Notes |
Share capital |
Warrants |
surplus |
equity | income (loss) |
deficit |
the Company |
NCI |
Total |
|||||||||||||||||||||||||||||||||||||||||||||||||||||
| $ | $ | $ | $ | $ | $ | $ | $ | $ | ||||||||||||||||||||||||||||||||||||||||||||||||||||||
| Opening balance, November 1, 2024 | 300,643 | 4,632 | 40,507 | — | 6,848 | (209,358) | 143,272 | 2,240 | 145,512 | |||||||||||||||||||||||||||||||||||||||||||||||||||||
| Issuance of shares in equity financing | 52 | — | — | — | — | — | 52 | — | 52 | |||||||||||||||||||||||||||||||||||||||||||||||||||||
| Share-based compensation | — | — | 2,425 | — | — | — | 2,425 | — | 2,425 | |||||||||||||||||||||||||||||||||||||||||||||||||||||
| Share issuance costs | (95) | — | — | — | — | — | (95) | — | (95) | |||||||||||||||||||||||||||||||||||||||||||||||||||||
| RSUs vested | 227 | — | (227) | — | — | — | — | — | — | |||||||||||||||||||||||||||||||||||||||||||||||||||||
| Warrants exercised | 84 | (22) | - | — | — | — | 62 | — | 62 | |||||||||||||||||||||||||||||||||||||||||||||||||||||
| Options exercised | 451 | — | (239) | — | — | — | 212 | — | 212 | |||||||||||||||||||||||||||||||||||||||||||||||||||||
| Cumulative translation adjustment | — | — | — | — | (163) | — | (163) | — | (163) | |||||||||||||||||||||||||||||||||||||||||||||||||||||
| Partner distributions | — | — | — | — | — | — | — | (567) | (567) | |||||||||||||||||||||||||||||||||||||||||||||||||||||
| Net loss for the period | — | — | — | — | — | (5,706) | (5,706) | 181 | (5,525) | |||||||||||||||||||||||||||||||||||||||||||||||||||||
| Balance, April 30, 2025 | 301,362 | 4,610 | 42,466 | — | 6,685 | (215,064) | 140,059 | 1,854 | 141,913 | |||||||||||||||||||||||||||||||||||||||||||||||||||||
| Opening balance, November 1, 2025 | 329,642 | 4,546 | 42,024 | (35,797) | 7,299 | (260,105) | 87,609 | 15,178 | 102,787 | |||||||||||||||||||||||||||||||||||||||||||||||||||||
| Share-based compensation | 21 | — | — | 1,251 | — | — | — | 1,251 | — | 1,251 | ||||||||||||||||||||||||||||||||||||||||||||||||||||
| Share issuance costs | 20 | (12) | — | — | — | — | — | (12) | — | (12) | ||||||||||||||||||||||||||||||||||||||||||||||||||||
| RSUs vested | 20 | 1,733 | — | (1,733) | — | — | — | — | — | — | ||||||||||||||||||||||||||||||||||||||||||||||||||||
| Equity awards related costs | 20 | (439) | — | — | — | — | — | (439) | — | (439) | ||||||||||||||||||||||||||||||||||||||||||||||||||||
| Options exercised | 20 | 184 | — | (184) | — | — | — | — | — | — | ||||||||||||||||||||||||||||||||||||||||||||||||||||
| Cumulative translation adjustment | — | — | — | — | (760) | — | (760) | — | (760) | |||||||||||||||||||||||||||||||||||||||||||||||||||||
| Partner distributions | — | — | — | — | — | — | — | (587) | (587) | |||||||||||||||||||||||||||||||||||||||||||||||||||||
| Net income (loss) for the period | — | — | — | — | — | 1,008 | 1,008 | (1,336) | (328) | |||||||||||||||||||||||||||||||||||||||||||||||||||||
| Balance, April 30, 2026 | 331,108 | 4,546 | — | 41,358 | (35,797) | 6,539 | (259,097) | (259,716) | 88,657 | 13,255 | 101,912 | |||||||||||||||||||||||||||||||||||||||||||||||||||
| + | ||
5 | ||
 |
High Tide Inc. | ||||
| Condensed Interim Consolidated Statements of Cash Flows | |||||
|
For the six months ended April 30, 2026 and 2025
(Unaudited – In thousands of Canadian dollars, except share and per share amounts)
| |||||
Notes |
2026 | 2025 | ||||||||||||||||||
| $ | $ | |||||||||||||||||||
| Operating activities | ||||||||||||||||||||
| Net loss for the period | (328) | (5,525) | ||||||||||||||||||
| Adjustments for items not affecting cash and cash equivalents | ||||||||||||||||||||
| Income tax expense | 335 | 84 | ||||||||||||||||||
| Accretion expense | 19 | 1,491 | 476 | |||||||||||||||||
| Depreciation and amortization | 7, 8, 27 | 14,172 | 11,727 | |||||||||||||||||
| Share-based compensation | 21 | 1,251 | 2,425 | |||||||||||||||||
| Fair value change in derivative liability | (2,524) | — | ||||||||||||||||||
| Gain on foreign exchange | (356) | 101 | ||||||||||||||||||
| Other loss | 197 | 42 | ||||||||||||||||||
| 14,238 | 9,330 | |||||||||||||||||||
| Changes in non-cash working capital | ||||||||||||||||||||
| Trade and other receivables | (2,303) | 556 | ||||||||||||||||||
| Inventory | (4,294) | 1,112 | ||||||||||||||||||
| Prepaid expenses and deposits | (708) | (2,616) | ||||||||||||||||||
| Accounts payable and accrued liabilities | 8,090 | (6) | ||||||||||||||||||
| Deferred revenue | (4,730) | 562 | ||||||||||||||||||
| Net cash provided by operating activities | 10,293 | 8,938 | ||||||||||||||||||
| Investing activities | ||||||||||||||||||||
| Purchase of property and equipment | 7 | (3,449) | (4,988) | |||||||||||||||||
| Purchase of intangible assets | 8 | (527) | (176) | |||||||||||||||||
| Acquisition of retail store leases | (900) | — | ||||||||||||||||||
| Purchase to obtain right-of-use assets | (86) | (138) | ||||||||||||||||||
| Proceeds from marketable securities | — | 409 | ||||||||||||||||||
| Net cash used in investing activities | (4,962) | (4,893) | ||||||||||||||||||
| Financing activities | ||||||||||||||||||||
| Repayment of interest bearing loans and borrowings | 17 | (16,389) | (1,839) | |||||||||||||||||
| Proceeds from interest bearing loans net of issue costs | 17 | 7,264 | — | |||||||||||||||||
| Repayment of notes payable | (733) | (13,862) | ||||||||||||||||||
| Lease liability payments | 27 | (5,297) | (4,889) | |||||||||||||||||
| Share issuance costs | 20 | (12) | (95) | |||||||||||||||||
| Partner distributions | (587) | (567) | ||||||||||||||||||
| Issuance of shares in equity financing | 20 | — | 52 | |||||||||||||||||
| Warrants exercised | 22 | — | 62 | |||||||||||||||||
| Equity awards related costs | 20 | (439) | — | |||||||||||||||||
| Options exercised | 105 | 220 | ||||||||||||||||||
| Proceeds from secured debentures | — | 4,427 | ||||||||||||||||||
| Net cash used in financing activities | (16,088) | (16,491) | ||||||||||||||||||
| Effect of foreign exchange on cash | (605) | (129) | ||||||||||||||||||
| | ||||||||||||||||||||
| Net decrease in cash | (11,362) | (12,575) | ||||||||||||||||||
| Cash and cash equivalents, and restricted cash, beginning of period | 47,883 | 47,267 | ||||||||||||||||||
| Cash and cash equivalents, and restricted cash, end of period | 36,521 | 34,692 | ||||||||||||||||||
| Supplemental cash flow information | ||||||||||||||||||||
| Cash interest received | 164 | 224 | ||||||||||||||||||
| Cash interest paid | 4,150 | 3,575 | ||||||||||||||||||
| Cash taxes paid | 105 | 42 | ||||||||||||||||||
| Non-cash addition to right-of-use assets | 14,215 | 6,496 | ||||||||||||||||||
6 | ||
|
High Tide Inc. | ||||
| Notes to the Condensed Interim Consolidated Financial Statements | |||||
| For the three months and six months ended April 30, 2026 and 2025 | |||||
| (Stated — In thousands of Canadian dollars, except share and per share amounts) | |||||
7 | ||
|
High Tide Inc. | ||||
| Notes to the Condensed Interim Consolidated Financial Statements | |||||
| For the three months and six months ended April 30, 2026 and 2025 | |||||
| (Stated — In thousands of Canadian dollars, except share and per share amounts) | |||||
| Subsidiaries | Places of operations | Percentage Ownership | Principal activities | Functional Currency | ||||||||||
| Canna Cabana Inc. | Canada | 100% | Cannabis retail | Canadian Dollar | ||||||||||
| 2680495 Ontario Inc. | Canada | 100% | Cannabis retail | Canadian Dollar | ||||||||||
| Valiant Distribution Canada Inc. | Canada | 100% | Wholesale distribution | Canadian Dollar | ||||||||||
| META Growth Corp. | Canada | 100% | Cannabis retail | Canadian Dollar | ||||||||||
| HT Global Imports Inc. | Canada | 100% | Product sourcing and imports | Canadian Dollar | ||||||||||
| 2049213 Ontario Inc. | Canada | 100% | Cannabis retail | Canadian Dollar | ||||||||||
| 1171882 B.C. Ltd. | Canada | 100% | Cannabis retail | Canadian Dollar | ||||||||||
| High Tide BV (Grasscity) | Netherlands | 100% | E-commerce retail | European Euro | ||||||||||
| Valiant Distribution Inc. | United States | 100% | Wholesale distribution | U.S. Dollar | ||||||||||
| Smoke Cartel USA, Inc. | United States | 100% | E-commerce retail | U.S. Dollar | ||||||||||
| Fab Nutrition, LLC | United States | 100% | E-commerce retail | U.S. Dollar | ||||||||||
| Halo Kushbar Retail Inc. | Canada | 100% | Cannabis retail | Canadian Dollar | ||||||||||
| Nuleaf Naturals LLC | United States | 100% | E-commerce retail | U.S. Dollar | ||||||||||
| DHC Supply, LLC | United States | 100% | E-commerce retail | U.S. Dollar | ||||||||||
| DS Distribution Inc. | United States | 100% | E-commerce retail | U.S. Dollar | ||||||||||
| High Tide Germany GmbH | Germany | 100% | E-commerce and wholesale | European Euro | ||||||||||
| 2629268 Alberta Ltd. | Canada | 87.5% | Cannabis retail | Canadian Dollar | ||||||||||
| Enigmaa Ltd. (Blessed CBD) | United Kingdom | 80% | CBD retail and distribution | British Pound Sterling | ||||||||||
| Remexian Pharma GMBH | Germany | 51% | Medical cannabis distribution | European Euro | ||||||||||
| Saturninus Partners GP | Canada | 50% | Cannabis retail | Canadian Dollar | ||||||||||
| NAC Thompson North Ltd. Partnership | Canada | 49% | Cannabis retail | Canadian Dollar | ||||||||||
| NAC OCN Ltd. Partnership | Canada | 49% | Cannabis retail | Canadian Dollar | ||||||||||
8 | ||
|
High Tide Inc. | ||||
| Notes to the Condensed Interim Consolidated Financial Statements | |||||
| For the three months and six months ended April 30, 2026 and 2025 | |||||
| (Stated — In thousands of Canadian dollars, except share and per share amounts) | |||||
| EUR | $ | ||||||||||
| Common shares | 16,725 | 26,856 | |||||||||
| Cash | 7,654 | 12,289 | |||||||||
| Vendor loan | 5,609 | 9,007 | |||||||||
| Long-term contract asset | (800) | (1,285) | |||||||||
Total consideration(i) |
29,188 | 46,867 | |||||||||
| Purchase price allocation | |||||||||||
| Trade and other receivable | 595 | 955 | |||||||||
| Inventory | 19,953 | 32,039 | |||||||||
| Prepaid expenses and deposits | 5,929 | 9,520 | |||||||||
| Property, plant and equipment | 236 | 379 | |||||||||
| Intangible assets | 21,151 | 33,962 | |||||||||
| Accounts payable and accrued liabilities | (14,065) | (22,575) | |||||||||
| Income tax payable | (3,495) | (5,612) | |||||||||
| Interest bearing loans and borrowings | (4,004) | (6,429) | |||||||||
| Notes payable | (2,855) | (4,584) | |||||||||
| Goodwill | 19,468 | 31,260 | |||||||||
| Deferred tax liability | (4,391) | (7,051) | |||||||||
| Non controlling interest | (9,334) | (14,997) | |||||||||
| 29,188 | 46,867 | ||||||||||
9 | ||
|
High Tide Inc. | ||||
| Notes to the Condensed Interim Consolidated Financial Statements | |||||
| For the three months and six months ended April 30, 2026 and 2025 | |||||
| (Stated — In thousands of Canadian dollars, except share and per share amounts) | |||||
10 | ||
|
High Tide Inc. | ||||
| Notes to the Condensed Interim Consolidated Financial Statements | |||||
| For the three months and six months ended April 30, 2026 and 2025 | |||||
| (Stated — In thousands of Canadian dollars, except share and per share amounts) | |||||
| For the three months ended April 30 | 2026 | 2025 | 2026 | 2025 | 2026 | 2025 | |||||||||||||||||||||||||||||
| Bricks-and-mortar | Bricks-and-mortar | Medical cannabis distribution |
Medical cannabis distribution |
Total | Total | ||||||||||||||||||||||||||||||
| $ | $ | $ | $ | $ | $ | ||||||||||||||||||||||||||||||
Primary geographical markets(i) |
|||||||||||||||||||||||||||||||||||
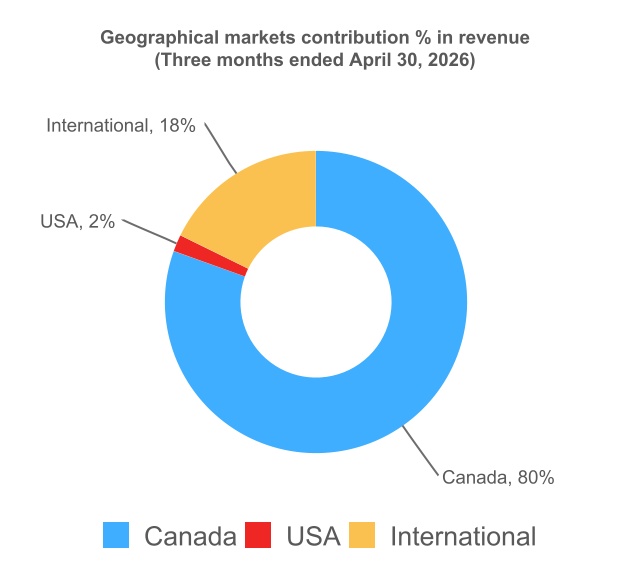
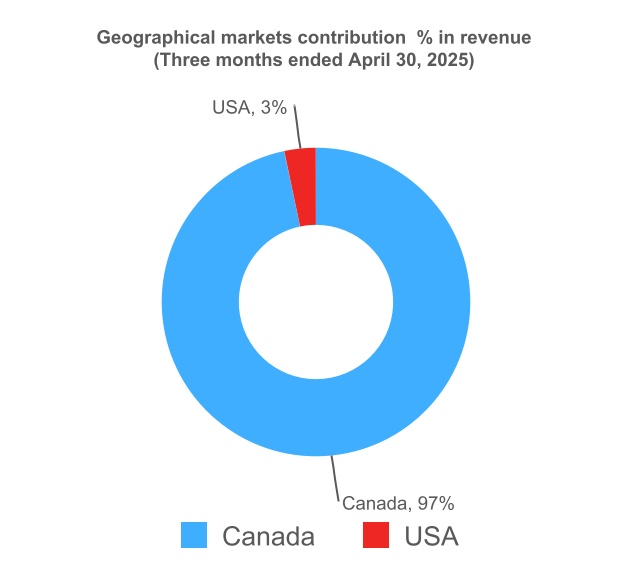
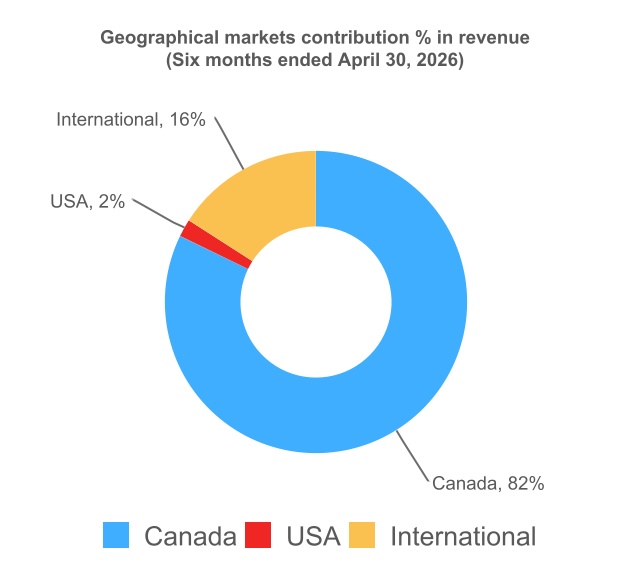
| Canada | 144,331 | 133,091 | — | — | 144,331 | 133,091 | |||||||||||||||||||||||||||||
| USA | 3,167 | 4,542 | — | — | 3,167 | 4,542 | |||||||||||||||||||||||||||||
| International | 159 | 171 | 31,639 | — | 31,798 | 171 | |||||||||||||||||||||||||||||
| Total revenue | 147,657 | 137,804 | 31,639 | — | 179,296 | 137,804 | |||||||||||||||||||||||||||||
| Major products and services | |||||||||||||||||||||||||||||||||||
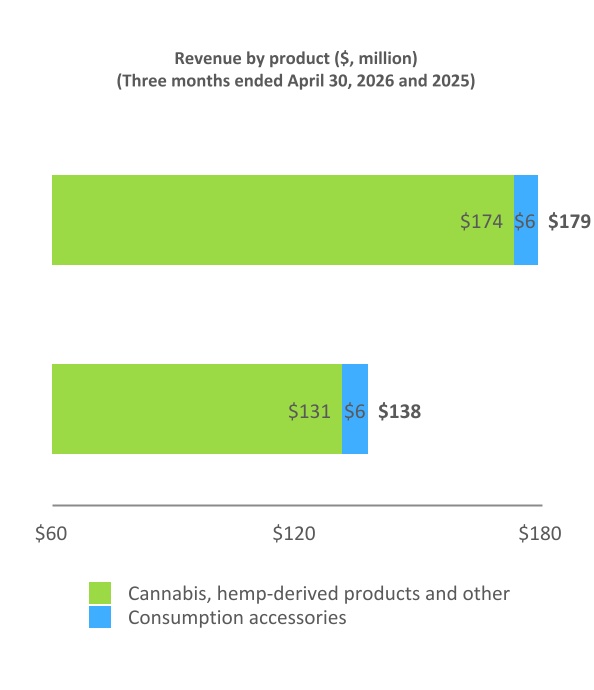
| Cannabis, hemp-derived products and other | 142,014 | 131,389 | 31,548 | — | 173,562 | 131,389 | |||||||||||||||||||||||||||||
| Consumption accessories | 5,643 | 6,415 | 91 | — | 5,734 | 6,415 | |||||||||||||||||||||||||||||
| Total revenue | 147,657 | 137,804 | 31,639 | — | 179,296 | 137,804 | |||||||||||||||||||||||||||||
| Timing of revenue recognition | |||||||||||||||||||||||||||||||||||
| Transferred at a point in time | 147,657 | 137,804 | 31,639 | — | 179,296 | 137,804 | |||||||||||||||||||||||||||||
| Total revenue | 147,657 | 137,804 | 31,639 | — | 179,296 | 137,804 | |||||||||||||||||||||||||||||
| For the six months ended April 30 | 2026 | 2025 | 2026 | 2025 | 2026 | 2025 | |||||||||||||||||||||||||||||
| Bricks-and-mortar | Bricks-and-mortar | Medical cannabis distribution |
Medical cannabis distribution |
Total | Total | ||||||||||||||||||||||||||||||
| $ | $ | $ | $ | $ | $ | ||||||||||||||||||||||||||||||
Primary geographical markets(i) |
|||||||||||||||||||||||||||||||||||
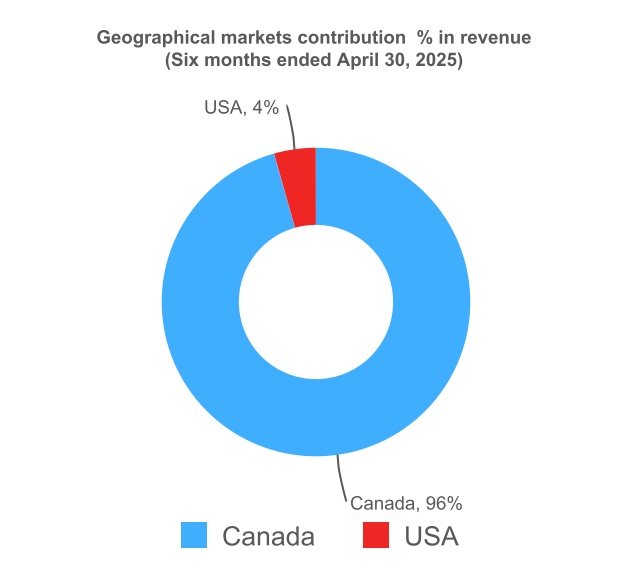
| Canada | 294,021 | 268,805 | — | — | 294,021 | 268,805 | |||||||||||||||||||||||||||||
| USA | 6,692 | 11,000 | — | — | 6,692 | 11,000 | |||||||||||||||||||||||||||||
| International | 294 | 460 | 56,618 | — | 56,912 | 460 | |||||||||||||||||||||||||||||
| Total revenue | 301,007 | 280,265 | 56,618 | — | 357,625 | 280,265 | |||||||||||||||||||||||||||||
| Major products and services | |||||||||||||||||||||||||||||||||||
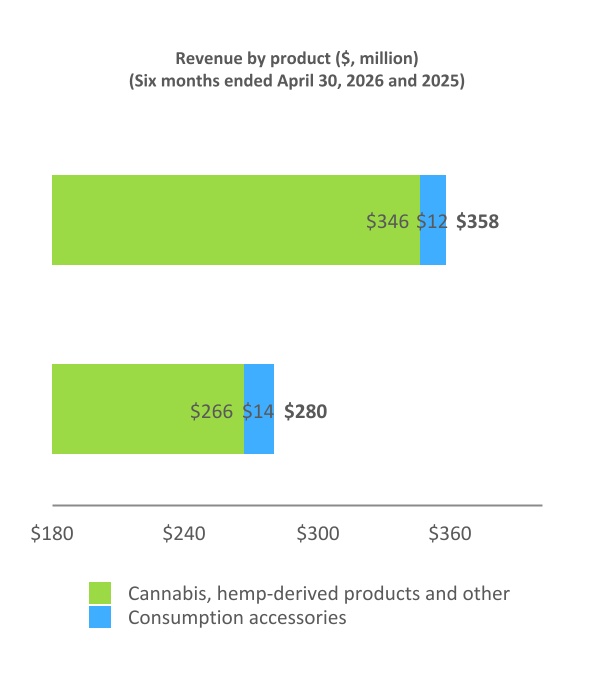
| Cannabis, hemp-derived products and other | 289,381 | 266,306 | 56,527 | — | 345,908 | 266,306 | |||||||||||||||||||||||||||||
| Consumption accessories | 11,626 | 13,959 | 91 | — | 11,717 | 13,959 | |||||||||||||||||||||||||||||
| Total revenue | 301,007 | 280,265 | 56,618 | — | 357,625 | 280,265 | |||||||||||||||||||||||||||||
| Timing of revenue recognition | |||||||||||||||||||||||||||||||||||
| Transferred at a point in time | 301,007 | 280,265 | 56,618 | — | 357,625 | 280,265 | |||||||||||||||||||||||||||||
| Total revenue | 301,007 | 280,265 | 56,618 | — | 357,625 | 280,265 | |||||||||||||||||||||||||||||
11 | ||
|
High Tide Inc. | ||||
| Notes to the Condensed Interim Consolidated Financial Statements | |||||
| For the three months and six months ended April 30, 2026 and 2025 | |||||
| (Stated — In thousands of Canadian dollars, except share and per share amounts) | |||||
| Office equipment | Production | Leasehold | ||||||||||||||||||||||||||||||||||||
| and computers | equipment | improvements | Vehicles | Buildings | Total | |||||||||||||||||||||||||||||||||
| Cost | $ | $ | $ | $ | $ | $ | ||||||||||||||||||||||||||||||||
| Opening balance, November 1, 2024 | 6,677 | 3,859 | 49,476 | 40 | 3,710 | 63,762 | ||||||||||||||||||||||||||||||||
| Additions | 649 | 11 | 8,550 | — | 875 | 10,085 | ||||||||||||||||||||||||||||||||
| Additions from business combinations | 176 | 40 | 20 | — | 145 | 381 | ||||||||||||||||||||||||||||||||
| Foreign currency translation | 25 | 23 | 13 | — | (12) | 49 | ||||||||||||||||||||||||||||||||
| Balance, October 31, 2025 | 7,527 | 3,933 | 58,059 | 40 | 4,718 | 74,277 | ||||||||||||||||||||||||||||||||
| Additions | 373 | — | 3,071 | — | 5 | 3,449 | ||||||||||||||||||||||||||||||||
| Foreign currency translation | (12) | (110) | (87) | — | (2) | (211) | ||||||||||||||||||||||||||||||||
| Balance, April 30, 2026 | 7,888 | 3,823 | 61,043 | 40 | 4,721 | 77,515 | ||||||||||||||||||||||||||||||||
| Accumulated depreciation | ||||||||||||||||||||||||||||||||||||||
| Opening balance, November 1, 2024 | 4,018 | 2,213 | 29,333 | 15 | 712 | 36,291 | ||||||||||||||||||||||||||||||||
| Depreciation | 1,024 | 776 | 6,411 | 4 | 256 | 8,471 | ||||||||||||||||||||||||||||||||
| Foreign currency translation | 40 | 25 | 9 | — | 5 | 79 | ||||||||||||||||||||||||||||||||
| Balance, October 31, 2025 | 5,082 | 3,014 | 35,753 | 19 | 973 | 44,841 | ||||||||||||||||||||||||||||||||
| Depreciation | 445 | 257 | 2,895 | 3 | 136 | 3,736 | ||||||||||||||||||||||||||||||||
| Foreign currency translation | (10) | (96) | (42) | — | — | (148) | ||||||||||||||||||||||||||||||||
| Balance, April 30, 2026 | 5,517 | 3,175 | 38,606 | 22 | 1,109 | 48,429 | ||||||||||||||||||||||||||||||||
| Net Book Value, October 31, 2025 | 2,445 | 919 | 22,306 | 21 | 3,745 | 29,436 | ||||||||||||||||||||||||||||||||
| Net Book Value, April 30, 2026 | 2,371 | 648 | 22,437 | 18 | 3,612 | 29,086 | ||||||||||||||||||||||||||||||||
12 | ||
|
High Tide Inc. | ||||
| Notes to the Condensed Interim Consolidated Financial Statements | |||||
| For the three months and six months ended April 30, 2026 and 2025 | |||||
| (Stated — In thousands of Canadian dollars, except share and per share amounts) | |||||
| Software | Licenses | Brand name | Customer relationship | Supplier relationship | Goodwill | Total | |||||||||||||||||||||||
| Cost | $ | $ | $ | $ | $ | $ | $ | ||||||||||||||||||||||
| Opening balance, November 1, 2024 | 11,986 | 46,148 | 8,585 | — | — | 73,373 | 140,092 | ||||||||||||||||||||||
| Additions | 211 | — | — | — | — | - | 211 | ||||||||||||||||||||||
| Additions from business combinations | — | 2,634 | 10,295 | 18,383 | 2,650 | 31,260 | 65,222 | ||||||||||||||||||||||
| Impairment loss | (10,721) | — | (7,657) | — | — | (14,807) | (33,185) | ||||||||||||||||||||||
| Foreign currency translation | 238 | 18 | 162 | 130 | 18 | 295 | 861 | ||||||||||||||||||||||
| Balance, October 31, 2025 | 1,714 | 48,800 | 11,385 | 18,513 | 2,668 | 90,121 | 173,201 | ||||||||||||||||||||||
| Additions | 24 | 402 | 101 | — | — | — | 527 | ||||||||||||||||||||||
| Foreign currency translation | — | (96) | (130) | (233) | (33) | (396) | (888) | ||||||||||||||||||||||
| Balance, April 30, 2026 | 1,738 | 49,106 | 11,356 | 18,280 | 2,635 | 89,725 | 172,840 | ||||||||||||||||||||||
| Accumulated amortization | |||||||||||||||||||||||||||||
| Opening balance, November 1, 2024 | 8,475 | 38,659 | 142 | — | — | — | 47,276 | ||||||||||||||||||||||
| Amortization | 2,120 | 2,372 | 533 | 594 | 144 | — | 5,763 | ||||||||||||||||||||||
| Impairment Loss | (9,621) | — | — | — | — | — | (9,621) | ||||||||||||||||||||||
| Foreign currency translation | 168 | 3 | 35 | 23 | 5 | — | 234 | ||||||||||||||||||||||
| Balance, October 31, 2025 | 1,142 | 41,034 | 710 | 617 | 149 | — | 43,652 | ||||||||||||||||||||||
| Amortization | 119 | 1,187 | 1,128 | 1,844 | 443 | — | 4,721 | ||||||||||||||||||||||
| Foreign currency translation | - | (3) | (5) | (24) | (6) | — | (38) | ||||||||||||||||||||||
| Balance, April 30, 2026 | 1,261 | 42,218 | 1,833 | 2,437 | 586 | — | 48,335 | ||||||||||||||||||||||
| Net Book Value, October 31, 2025 | 572 | 7,766 | 10,675 | 17,896 | 2,519 | 90,121 | 129,549 | ||||||||||||||||||||||
| Net Book Value, April 30, 2026 | 477 | 6,888 | 9,523 | 15,843 | 2,049 | 89,725 | 124,505 | ||||||||||||||||||||||
| As at | April 30, 2026 | October 31, 2025 | ||||||||||||
| $ | $ | |||||||||||||
| Deposits on cannabis retail outlets | 2,904 |
2,622 |
||||||||||||
| Prepaid insurance and other | 6,242 |
4,578 |
||||||||||||
| Prepayment on inventory | 11,593 |
12,831 |
||||||||||||
| Total | 20,739 | 20,031 | ||||||||||||
| Less current portion | (15,358) | (15,917) | ||||||||||||
| Long-term | 5,381 | 4,114 | ||||||||||||
13 | ||
|
High Tide Inc. | ||||
| Notes to the Condensed Interim Consolidated Financial Statements | |||||
| For the three months and six months ended April 30, 2026 and 2025 | |||||
| (Stated — In thousands of Canadian dollars, except share and per share amounts) | |||||
| As at | April 30, 2026 | October 31, 2025 | ||||||||||||
| $ | $ | |||||||||||||
| Finished goods | 46,990 | 56,336 | ||||||||||||
| Raw material | 25,069 | 11,430 | ||||||||||||
| Work in process | 3 | 6 | ||||||||||||
| Provision for obsolescence | (362) | (366) | ||||||||||||
| Total | 71,700 | 67,406 | ||||||||||||
| As at | April 30, 2026 | October 31, 2025 | ||||||||||||
| $ | $ | |||||||||||||
| Trade accounts receivables | 24,754 | 15,557 | ||||||||||||
Factoring(i) |
(15,907) | (9,013) | ||||||||||||
| Allowance for doubtful accounts | (1,126) | (929) | ||||||||||||
| Total | 7,721 | 5,615 | ||||||||||||
14 | ||
|
High Tide Inc. | ||||
| Notes to the Condensed Interim Consolidated Financial Statements | |||||
| For the three months and six months ended April 30, 2026 and 2025 | |||||
| (Stated — In thousands of Canadian dollars, except share and per share amounts) | |||||
As at |
April 30, 2026 |
October 31, 2025 |
||||||||||||
$ |
$ |
|||||||||||||
Vendor loan - face value |
12,290 |
12,290 |
||||||||||||
Vendor loan - unamortized discount |
(2,914) | (3,283) | ||||||||||||
Vendor loan(i) |
9,376 |
9,007 |
||||||||||||
Term loan(ii) |
3,193 |
3,637 |
||||||||||||
Other(iii) |
512 |
795 |
||||||||||||
Total |
13,081 |
13,439 |
||||||||||||
Less current portion |
(1,245) | (1,536) | ||||||||||||
Long-term obligation |
11,836 |
11,903 |
||||||||||||
15 | ||
|
High Tide Inc. | ||||
| Notes to the Condensed Interim Consolidated Financial Statements | |||||
| For the three months and six months ended April 30, 2026 and 2025 | |||||
| (Stated — In thousands of Canadian dollars, except share and per share amounts) | |||||
| As at | April 30, 2026 |
October 31, 2025 |
||||||||||||
$ |
$ |
|||||||||||||
Accounts payable |
36,140 |
27,765 |
||||||||||||
| Accrued liabilities | 9,403 |
12,484 |
||||||||||||
Sales tax payable |
9,798 |
7,002 |
||||||||||||
| Total | 55,341 |
47,251 |
||||||||||||
As at |
April 30, 2026 |
October 31, 2025 |
||||||||||||
$ |
$ |
|||||||||||||
| Cannabis, hemp-derived products and other revenue | 1,245 |
3,308 |
||||||||||||
| Elite membership revenue | 1,752 |
1,404 |
||||||||||||
| Goods shipped not delivered | 262 |
3,277 |
||||||||||||
Total |
3,259 |
7,989 |
||||||||||||
As at |
April 30, 2026 |
October 31, 2025 |
||||||||||||
$ |
$ | |||||||||||||
| Face value | 30,000 | - | 30,000 | |||||||||||
| Freestanding derivative | (7,299) | (7,299) | ||||||||||||
| Unamortized issuance cost | (3,937) | (4,824) | ||||||||||||
Total |
18,764 |
17,877 |
||||||||||||
16 | ||
|
High Tide Inc. | ||||
| Notes to the Condensed Interim Consolidated Financial Statements | |||||
| For the three months and six months ended April 30, 2026 and 2025 | |||||
| (Stated — In thousands of Canadian dollars, except share and per share amounts) | |||||
As at |
April 30, 2026 |
October 31, 2025 |
||||||||||||
$ |
$ |
|||||||||||||
Opening balance |
9,951 |
— |
||||||||||||
Initial recognition |
— |
7,299 |
||||||||||||
Fair value change |
(4,194) | 2,652 |
||||||||||||
Fair value, end of the period |
5,757 |
9,951 |
||||||||||||
| As at | April 30, 2026 | October 31, 2025 | ||||||||||||
| $ | $ | |||||||||||||
| Opening balance | 56,954 | — | ||||||||||||
| Initial recognition | — | 35,797 | ||||||||||||
| Fair value change | 1,670 | 20,907 | ||||||||||||
| (Loss) or gain on foreign exchange | (722) | 250 | ||||||||||||
| Total | 57,902 | 56,954 | ||||||||||||
17 | ||
|
High Tide Inc. | ||||
| Notes to the Condensed Interim Consolidated Financial Statements | |||||
| For the three months and six months ended April 30, 2026 and 2025 | |||||
| (Stated — In thousands of Canadian dollars, except share and per share amounts) | |||||
| As at | April 30, 2026 | October 31, 2025 | ||||||||||||
| $ | $ | |||||||||||||
ConnectFirst loan(i) |
7,064 | 9,104 | ||||||||||||
Bank borrowings(ii) |
— | 4,851 | ||||||||||||
Working capital loan(iii) |
— | 2,234 | ||||||||||||
| Total | 7,064 | 16,189 | ||||||||||||
| Less current portion | (7,064) | (16,189) | ||||||||||||
| Long-term obligation | — | — | ||||||||||||
For the period |
April 30, 2026 |
April 30, 2025 |
||||||||||||
$ |
$ |
|||||||||||||
| Repayments: | ||||||||||||||
Bank borrowing (money market loan) |
4,851 |
— |
||||||||||||
Bank borrowing (credit facility) |
7,264 | — | ||||||||||||
ConnectFirst |
2,040 |
1,839 |
||||||||||||
Working capital loan |
2,234 |
— |
||||||||||||
Total |
16,389 |
1,839 |
||||||||||||
Additions |
||||||||||||||
Bank borrowing (money market loan) |
7,264 | — | ||||||||||||
Total |
7,264 |
— |
||||||||||||
18 | ||
|
High Tide Inc. | ||||
| Notes to the Condensed Interim Consolidated Financial Statements | |||||
| For the three months and six months ended April 30, 2026 and 2025 | |||||
| (Stated — In thousands of Canadian dollars, except share and per share amounts) | |||||
19 | ||
|
High Tide Inc. | ||||
| Notes to the Condensed Interim Consolidated Financial Statements | |||||
| For the three months and six months ended April 30, 2026 and 2025 | |||||
| (Stated — In thousands of Canadian dollars, except share and per share amounts) | |||||
| As at | April 30, 2026 | October 31, 2025 | ||||||||||||
| $ | $ | |||||||||||||
| Face value | 15,000 | 15,000 | ||||||||||||
| Unamortized discount | (1,045) | (1,152) | ||||||||||||
| Unamortized issuance fees | (1,190) | (1,312) | ||||||||||||
| Total | 12,765 | 12,536 | ||||||||||||
Three months ended April 30, |
Six months ended April 30, |
|||||||||||||||||||||||||
2026 |
2025 |
2026 |
2025 |
|||||||||||||||||||||||
$ |
$ |
$ |
$ |
|||||||||||||||||||||||
Accretion on convertible debt |
445 |
— |
887 |
— |
||||||||||||||||||||||
Accretion on notes payable |
144 |
29 |
375 |
165 |
||||||||||||||||||||||
Accretion on secured debentures |
122 |
161 |
229 |
311 |
||||||||||||||||||||||
Accretion on lease liabilities |
1,099 |
945 |
2,056 |
1,881 |
||||||||||||||||||||||
Interest on notes payable |
264 |
— |
544 |
218 |
||||||||||||||||||||||
Interest on debentures |
439 |
596 |
896 |
986 |
||||||||||||||||||||||
Interest on interest bearing borrowings |
345 |
219 |
724 |
490 |
||||||||||||||||||||||
Interest on convertible debt |
293 |
— |
595 |
— |
||||||||||||||||||||||
Transaction and other costs for the period |
2,077 |
1,616 |
5,035 |
2,246 |
||||||||||||||||||||||
Total |
5,228 |
3,566 |
11,341 |
6,297 |
||||||||||||||||||||||
20 | ||
|
High Tide Inc. | ||||
| Notes to the Condensed Interim Consolidated Financial Statements | |||||
| For the three months and six months ended April 30, 2026 and 2025 | |||||
| (Stated — In thousands of Canadian dollars, except share and per share amounts) | |||||
| Common shares: | ||||||||||||||
| Number of shares | Amount | |||||||||||||
| # | $ | |||||||||||||
| Opening balance, November 1, 2024 | 80,787,017 | 300,643 | ||||||||||||
| Purchase of Remexian - paid in shares | 5,864,373 | 26,856 | ||||||||||||
Issuance of shares through ATM(i) |
11,600 | 52 | ||||||||||||
| Vested restricted share units (RSU) | 504,044 | 1,388 | ||||||||||||
| Share issuance cost | — | (292) | ||||||||||||
| Options exercised | 227,947 | 664 | ||||||||||||
| Warrants exercised | 89,800 | 331 | ||||||||||||
| Balance, October 31, 2025 | 87,484,781 | 329,642 | ||||||||||||
| Vested restricted share units (RSU) | 295,190 | 1,733 | ||||||||||||
| Equity awards related costs | — | (439) | ||||||||||||
| Share issuance cost | — | (12) | ||||||||||||
| Options exercised | 89,785 | 184 | ||||||||||||
| Balance, April 30, 2026 | 87,869,756 | 331,108 | ||||||||||||
21 | ||
|
High Tide Inc. | ||||
| Notes to the Condensed Interim Consolidated Financial Statements | |||||
| For the three months and six months ended April 30, 2026 and 2025 | |||||
| (Stated — In thousands of Canadian dollars, except share and per share amounts) | |||||
| For the six months ended | For the year ended | |||||||||||||||||||||||||
| April 30, 2026 | October 31, 2025 | |||||||||||||||||||||||||
Number of options |
Weighted average exercise price ($) |
Number of options |
Weighted average exercise price ($) |
|||||||||||||||||||||||
| Opening balance | 2,503,457 | 2.76 | 3,080,452 | 2.97 | ||||||||||||||||||||||
| Granted | 170,500 | 3.25 | 280,500 | 3.45 | ||||||||||||||||||||||
| Exercised | (139,750) | 2.08 | (382,000) | 2.55 | ||||||||||||||||||||||
| Forfeited or expired | (81,250) | 2.61 | (475,495) | 4.65 | ||||||||||||||||||||||
| Balance, April 30, 2026 | 2,452,957 | 2.85 | 2,503,457 | 2.76 | ||||||||||||||||||||||
| Exercisable, end of period | 2,115,082 | 2.77 | 2,212,582 | 2.70 | ||||||||||||||||||||||
| Outstanding options | Exercisable options | ||||||||||||||||||||||||||||
| Number of options outstanding | Weighted average remaining life (years) | Weighted average exercise price ($) | Number of options exercisable | Weighted average exercise price ($) | |||||||||||||||||||||||||
| Range of exercise price | |||||||||||||||||||||||||||||
| $2.52- $2.75 | 2,013,209 | 0.45 | 2.74 | 1,993,582 | 2.74 | ||||||||||||||||||||||||
$2.76 - $4.16 |
439,748 | 2.2 | 3.34 | 121,500 | 3.23 | ||||||||||||||||||||||||
2.52 - $4.16 |
2,452,957 | 0.76 | 2.85 | 2,115,082 | 2.77 | ||||||||||||||||||||||||
| Number of shares | ||||||||||||||
| As at | April 30, 2026 | October 31, 2025 | ||||||||||||
| Opening balance | 918,688 | 687,747 | ||||||||||||
| Granted | 1,424,088 | 918,688 | ||||||||||||
| Vested and issued | (435,618) | (687,747) | ||||||||||||
| Balance, April 30, 2026 | 1,907,158 | 918,688 | ||||||||||||
| Three months ended April 30, | Six months ended April 30, | |||||||||||||||||||||||||
| 2026 | 2025 | 2026 | 2025 | |||||||||||||||||||||||
| $ | $ | $ | $ | |||||||||||||||||||||||
| Stock options | 79 | 167 | 110 | 385 | ||||||||||||||||||||||
| RSUs | 802 | 1,083 | 1,141 | 2,040 | ||||||||||||||||||||||
| Total | 881 | 1,250 | 1,251 | 2,425 | ||||||||||||||||||||||
22 | ||
|
High Tide Inc. | ||||
| Notes to the Condensed Interim Consolidated Financial Statements | |||||
| For the three months and six months ended April 30, 2026 and 2025 | |||||
| (Stated — In thousands of Canadian dollars, except share and per share amounts) | |||||
| Warrants | Weighted average exercise price | Weighted average number of years to expiry | Expiry dates | |||||||||||||||||||||||||||||
| # | $ | $ | ||||||||||||||||||||||||||||||
| Opening balance | 4,852,366 | 4,632 | 2.73 | 2.98 | ||||||||||||||||||||||||||||
| Warrants exercised | (89,800) | (86) | 2.73 | 1.72 | 7/22/2027 | |||||||||||||||||||||||||||
Warrants issued(i) |
3,836,317 | - | 3.91 | 4.71 | 7/16/2030 | |||||||||||||||||||||||||||
| Balance, October 31, 2025 | 8,598,883 | 4,546 | 3.26 | 3.05 | ||||||||||||||||||||||||||||
Warrants exercised |
— | — | — | — | ||||||||||||||||||||||||||||
| Balance, April 30, 2026 | 8,598,883 | 4,546 | 3.26 | 2.56 | ||||||||||||||||||||||||||||
| Three months ended April 30, | Six months ended April 30, | |||||||||||||||||||||||||
| 2026 | 2025 | 2026 | 2025 | |||||||||||||||||||||||
| $ | $ | $ | $ | |||||||||||||||||||||||
| Net income (loss) for the period | 24 | (2,836) | (328) | (5,525) | ||||||||||||||||||||||
| Non-controlling interest portion of net income (loss) | 221 | 62 | (1,336) | 181 | ||||||||||||||||||||||
| Net Income (loss) attributable to the owners of the Company | (197) | (2,898) | 1,008 | (5,706) | ||||||||||||||||||||||
| # | # | |||||||||||||||||||||||||
| Weighted average number of common shares - basic | 87,867,707 | 80,935,843 | 87,790,503 | 80,904,690 | ||||||||||||||||||||||
| Basic income (loss) per share | — | (0.04) | 0.01 | (0.07) | ||||||||||||||||||||||
| Weighted average number of common shares - diluted | 87,867,707 | 80,935,843 | 94,798,768 | 80,904,690 | ||||||||||||||||||||||
| Diluted income (loss) per share | — | (0.04) | 0.01 | (0.07) | ||||||||||||||||||||||
23 | ||
|
High Tide Inc. | ||||
| Notes to the Condensed Interim Consolidated Financial Statements | |||||
| For the three months and six months ended April 30, 2026 and 2025 | |||||
| (Stated — In thousands of Canadian dollars, except share and per share amounts) | |||||
| As at | April 30, 2026 | October 31, 2025 | ||||||||||||
| $ | $ | |||||||||||||
| Current (for less than 30 days) | 6,183 | 3,989 | ||||||||||||
| 31 – 60 days | 370 | 99 | ||||||||||||
| 61 – 90 days | 150 | 101 | ||||||||||||
| Greater than 90 days | 2,144 | 2,355 | ||||||||||||
| Less allowance | (1,126) | (929) | ||||||||||||
| 7,721 | 5,615 | |||||||||||||
24 | ||
|
High Tide Inc. | ||||
| Notes to the Condensed Interim Consolidated Financial Statements | |||||
| For the three months and six months ended April 30, 2026 and 2025 | |||||
| (Stated — In thousands of Canadian dollars, except share and per share amounts) | |||||
|
Contractual
Cash Flows
|
2026 |
2026 |
2027-2028 |
2029-2030 |
2031 and beyond |
|||||||||||||||||||||||||||
$ |
$ |
$ |
$ |
$ |
$ |
|||||||||||||||||||||||||||
Accounts payable and accrued liabilities |
55,341 | 55,341 | — | — | — | |||||||||||||||||||||||||||
| Income tax payable | 7,339 | 7,339 | — | — | — | |||||||||||||||||||||||||||
Undiscounted lease obligations |
74,845 | 7,103 | 26,225 | 17,892 | 23,625 | |||||||||||||||||||||||||||
Notes payable |
20,004 | 926 | 3,539 | 15,282 | 257 | |||||||||||||||||||||||||||
Interest bearing loans and borrowings |
7,479 | 2,329 | 5,150 | — | — | |||||||||||||||||||||||||||
Secured debentures |
21,006 | 902 | 3,605 | 16,499 | — | |||||||||||||||||||||||||||
Convertible debt |
35,152 | 602 | 2,401 | 32,149 | — | |||||||||||||||||||||||||||
Total |
221,166 | 74,542 | 40,920 | 81,822 | 23,882 | |||||||||||||||||||||||||||
| As at | April 30, 2026 | October 31, 2025 | ||||||||||||||||||||||||||||||
| (Canadian dollar equivalent amounts of GBP, EUR, USD) | GBP | EUR | USD | Total | Total | |||||||||||||||||||||||||||
| $ | $ | $ | $ | $ | ||||||||||||||||||||||||||||
| Cash | 170 | (3,371) | 1,834 | (1,367) | 2,899 | |||||||||||||||||||||||||||
| Trade and other receivables | 116 | 3,403 | 308 | 3,827 | 2,533 | |||||||||||||||||||||||||||
| Accounts payable and accrued liabilities | (98) | (34,939) | (2,103) | (37,140) | (26,025) | |||||||||||||||||||||||||||
| Net monetary assets | 188 | (34,907) | 39 | (34,680) | (20,593) | |||||||||||||||||||||||||||
25 | ||
|
High Tide Inc. | ||||
| Notes to the Condensed Interim Consolidated Financial Statements | |||||
| For the three months and six months ended April 30, 2026 and 2025 | |||||
| (Stated — In thousands of Canadian dollars, except share and per share amounts) | |||||
| Bricks-and-mortar | Bricks-and-mortar | Medical cannabis distribution | Medical cannabis distribution | Total | Total | |||||||||||||||||||||||||||||||||
| For the three months ended April 30, | 2026 | 2025 | 2026 | 2025 | 2026 | 2025 | ||||||||||||||||||||||||||||||||
| $ | $ | $ | $ | $ | $ | |||||||||||||||||||||||||||||||||
| Total revenue | $ | 147,657 | $ | 137,804 | $ | 31,639 | $ | — | $ | 179,296 | $ | 137,804 | ||||||||||||||||||||||||||
| Gross profit | $ | 40,685 | $ | 35,471 | $ | 7,706 | $ | — | $ | 48,391 | $ | 35,471 | ||||||||||||||||||||||||||
| Income (loss) from operations | $ | 5,725 | $ | 932 | $ | 372 | $ | — | $ | 6,097 | $ | 932 | ||||||||||||||||||||||||||
| Bricks-and-mortar | Bricks-and-mortar | Medical cannabis distribution | Medical cannabis distribution | Total | Total | |||||||||||||||||||||||||||||||||
| For the six months ended April 30, | 2026 | 2025 | 2026 | 2025 | 2026 | 2025 | ||||||||||||||||||||||||||||||||
| $ | $ | $ | $ | $ | $ | |||||||||||||||||||||||||||||||||
| Total Revenue | 301,007 | 280,265 | 56,618 | — | 357,625 | 280,265 | ||||||||||||||||||||||||||||||||
| Gross profit (loss) | 82,785 | 70,911 | 10,015 | — | 92,800 | 70,911 | ||||||||||||||||||||||||||||||||
| Income (loss) from operations | 10,970 | 999 | (2,502) | — | 8,468 | 999 | ||||||||||||||||||||||||||||||||
| Bricks-and-mortar | Bricks-and-mortar | Medical cannabis distribution | Medical cannabis distribution | Total | Total | |||||||||||||||||||||||||||||||||
| As at April 30, 2026 and October 31, 2025 | 2026 | 2025 | 2026 | 2025 | 2026 | 2025 | ||||||||||||||||||||||||||||||||
| $ | $ | $ | $ | $ | $ | |||||||||||||||||||||||||||||||||
| Current assets | 84,440 | 92,028 | 46,918 | 44,857 | 131,358 | 136,885 | ||||||||||||||||||||||||||||||||
| Non-current assets | 152,967 | 146,626 | 63,542 | 65,551 | 216,509 | 212,177 | ||||||||||||||||||||||||||||||||
| Current liabilities | 46,072 | 58,990 | 43,838 | 40,928 | 89,910 | 99,918 | ||||||||||||||||||||||||||||||||
| Non-current liabilities | 130,352 | 136,098 | 25,693 | 10,258 | 156,045 | 146,356 | ||||||||||||||||||||||||||||||||
26 | ||
|
High Tide Inc. | ||||
| Notes to the Condensed Interim Consolidated Financial Statements | |||||
| For the three months and six months ended April 30, 2026 and 2025 | |||||
| (Stated — In thousands of Canadian dollars, except share and per share amounts) | |||||
| Canada | Canada | USA | USA | International | International | Total | Total | |||||||||||||||||||||||||||||||||||||||||||
| For the three months ended April 30, | 2026 | 2025 | 2026 | 2025 | 2026 | 2025 | 2026 | 2025 | ||||||||||||||||||||||||||||||||||||||||||
| $ | $ | $ | $ | $ | $ | $ | $ | |||||||||||||||||||||||||||||||||||||||||||
| Total revenue | 144,331 | 133,091 | 3,167 | 4,542 | 31,798 | 171 | 179,296 | 137,804 | ||||||||||||||||||||||||||||||||||||||||||
| Gross profit (loss) | 39,728 | 34,002 | 894 | 1,428 | 7,769 | 41 | 48,391 | 35,471 | ||||||||||||||||||||||||||||||||||||||||||
| Income (loss) from operations | $ | 5,900 | 5,900 | 5,409 | (1,407) | (4,241) | 1,604 | (236) | 6,097 | 932 | ||||||||||||||||||||||||||||||||||||||||
| Canada | Canada | USA | USA | International | International | Total | Total | |||||||||||||||||||||||||||||||||||||||||||
| For the six months ended April 30, | 2026 | 2025 | 2026 | 2025 | 2026 | 2025 | 2026 | 2025 | ||||||||||||||||||||||||||||||||||||||||||
| $ | $ | $ | $ | $ | $ | $ | $ | |||||||||||||||||||||||||||||||||||||||||||
| Total revenue | 294,021 | 268,805 | 6,692 | 11,000 | 56,912 | 460 | 357,625 | 280,265 | ||||||||||||||||||||||||||||||||||||||||||
| Gross profit (loss) | 80,918 | 67,274 | 1,760 | 3,456 | 10,122 | 181 | 92,800 | 70,911 | ||||||||||||||||||||||||||||||||||||||||||
| Income (loss) from operations | 11,955 | 7,366 | (3,023) | (5,847) | (464) | (520) | 8,468 | 999 | ||||||||||||||||||||||||||||||||||||||||||
| Canada | Canada | USA | USA | International | International | Total | Total | |||||||||||||||||||||||||||||||||||||||||||
| As at April 30, 2026 and October 31, 2025 | 2026 | 2025 | 2026 | 2025 | 2026 | 2025 | 2026 | 2025 | ||||||||||||||||||||||||||||||||||||||||||
| $ | $ | $ | $ | $ | $ | $ | $ | |||||||||||||||||||||||||||||||||||||||||||
| Current assets | 79,839 | 84,442 | 6,460 | 6,824 | 45,059 | 45,619 | 131,358 | 136,885 | ||||||||||||||||||||||||||||||||||||||||||
| Non-current assets | 150,029 | 143,604 | 1,859 | 2,587 | 64,621 | 65,986 | 216,509 | 212,177 | ||||||||||||||||||||||||||||||||||||||||||
| Current liabilities | 43,890 | 55,763 | 3,650 | 2,832 | 42,370 | 41,324 | 89,910 | 99,919 | ||||||||||||||||||||||||||||||||||||||||||
| Non-current liabilities | 144,185 | 134,918 | 1,162 | 1,509 | 10,698 | 9,929 | 156,045 | 146,356 | ||||||||||||||||||||||||||||||||||||||||||
27 | ||
|
High Tide Inc. | ||||
| Notes to the Condensed Interim Consolidated Financial Statements | |||||
| For the three months and six months ended April 30, 2026 and 2025 | |||||
| (Stated — In thousands of Canadian dollars, except share and per share amounts) | |||||
| Right-of-use assets | April 30, 2026 | October 31, 2025 | ||||||||||||
| $ | $ | |||||||||||||
| Opening balance | 47,793 | 36,525 | ||||||||||||
| Net additions | 14,215 | 12,779 | ||||||||||||
| Reassessment of lease terms | — | 10,711 | ||||||||||||
| Terminations | (41) | (2,146) | ||||||||||||
| Depreciation expense | (5,715) | (10,076) | ||||||||||||
| Total | 56,252 | 47,793 | ||||||||||||
| Lease Liabilities | April 30, 2026 | October 31, 2025 | ||||||||||||
| $ | $ | |||||||||||||
| Opening balance | 49,800 | 40,207 | ||||||||||||
| Additions | 13,246 | 12,539 | ||||||||||||
| Reassessment of lease terms, net of interest | — | 9,086 | ||||||||||||
| Terminations | (50) | (2,054) | ||||||||||||
| Foreign currency | (27) | 29 | ||||||||||||
| Repayments | (5,297) | (10,007) | ||||||||||||
| Total | 57,672 | 49,800 | ||||||||||||
| Less: current | (9,905) | (9,814) | ||||||||||||
| Non-current | 47,767 | 39,986 | ||||||||||||
28 | ||
|
High Tide Inc. | ||||
| Notes to the Condensed Interim Consolidated Financial Statements | |||||
| For the three months and six months ended April 30, 2026 and 2025 | |||||
| (Stated — In thousands of Canadian dollars, except share and per share amounts) | |||||
| Balance as at | April 30, 2026 | October 31, 2025 | ||||||||||||
| $ | $ | |||||||||||||
| Total current assets | 47,983 | 49,014 | ||||||||||||
| Total non-current assets | 64,657 | 67,785 | ||||||||||||
| Total current liabilities | (43,801) | (42,770) | ||||||||||||
| Total non-current liabilities | (9,401) | (9,976) | ||||||||||||
| For the period | Three months ended April 30, | Six months ended April 30, |
||||||||||||||||||||||||
| 2026 | 2025 |
2026 |
2025 |
|||||||||||||||||||||||
$ |
$ |
$ |
$ |
|||||||||||||||||||||||
| Revenues | 35,404 |
4,080 |
64,609 |
8,537 |
||||||||||||||||||||||
| Net (loss) income | 221 |
(31) |
(1,336) |
54 |
||||||||||||||||||||||
| Total comprehensive (loss) income | (13) |
46 |
(1,315) |
106 |
||||||||||||||||||||||
29 | ||
|
High Tide Inc. | ||||
| Notes to the Condensed Interim Consolidated Financial Statements | |||||
| For the three months and six months ended April 30, 2026 and 2025 | |||||
| (Stated — In thousands of Canadian dollars, except share and per share amounts) | |||||
| As at | April 30, 2026 | April 30, 2025 | ||||||||||||||||||
| Remexian | Other subsidiaries | Total | Remexian | Other subsidiaries | Total | |||||||||||||||
| $ | $ | $ | $ | $ | ||||||||||||||||
| Opening balance, beginning of the period | 13,708 | 1,470 | 15,178 | — | 2,240 | 2,240 | ||||||||||||||
| Share of net income (Loss) for three months ended January 31, 2026 | (1,743) | 186 | (1,557) | — | 119 | 119 | ||||||||||||||
| Share of net income (Loss) for three months ended April 30, 2026 | 95 | 126 | 221 | — | 62 | 62 | ||||||||||||||
| Distributions for three months ended January 31, 2026 | — | — | — | — | — | — | ||||||||||||||
| Distributions for three months ended April 30, 2026 | — | (587) | (587) | — | (567) | (567) | ||||||||||||||
| Balance, end of the period | 12,060 | 1,195 | 13,255 | — | 1,854 | 1,854 | ||||||||||||||
30 | ||
|
High Tide Inc. | ||||
| Management's Discussion and Analysis | |||||
| For the three and six months ended April 30, 2026 and 2025 | |||||
| (In thousands of Canadian dollars, except share and per share amounts or otherwise stated) | |||||
|
 |
 |
||||||
 |
 |
 |
||||||
 |
 |
 |
||||||
 |
 |
 |
||||||
2 | ||
|
High Tide Inc. | ||||
| Management's Discussion and Analysis | |||||
| For the three and six months ended April 30, 2026 and 2025 | |||||
| (In thousands of Canadian dollars, except share and per share amounts or otherwise stated) | |||||
3 | ||
|
High Tide Inc. | ||||
| Management's Discussion and Analysis | |||||
| For the three and six months ended April 30, 2026 and 2025 | |||||
| (In thousands of Canadian dollars, except share and per share amounts or otherwise stated) | |||||
4 | ||
|
High Tide Inc. | ||||
| Management's Discussion and Analysis | |||||
| For the three and six months ended April 30, 2026 and 2025 | |||||
| (In thousands of Canadian dollars, except share and per share amounts or otherwise stated) | |||||
| Three months ended April 30, | Six months ended April 30, | ||||||||||||||||||||||||||||||||||
| 2026 | 2025 | Change | 2026 | 2025 | Change | ||||||||||||||||||||||||||||||
| $ | $ | ∆ | $ | $ | ∆ | ||||||||||||||||||||||||||||||
Free cash flow(i) |
1,482 | 4,896 | (70)% | 4,421 | 2,996 | 48% | |||||||||||||||||||||||||||||
| Net cash provided by operating activities | 4,433 | 8,255 | (46)% | 10,293 | 8,938 | 15% | |||||||||||||||||||||||||||||
| Revenue | 179,296 | 137,804 | 30% | 357,625 | 280,265 | 28% | |||||||||||||||||||||||||||||
| Gross profit | 48,391 | 35,471 | 36% | 92,800 | 70,911 | 31% | |||||||||||||||||||||||||||||
Gross margin(ii) |
27% | 26% | 1% | 26% | 25% | 1% | |||||||||||||||||||||||||||||
Adjusted gross margin(iii) |
27% | 26% | 1% | 26% | 25% | 1% | |||||||||||||||||||||||||||||
Operating expense(iv) |
(35,267) | (27,409) | 29% | (68,909) | (55,760) | 24% | |||||||||||||||||||||||||||||
Operating expense as a % of revenue(v) |
20% | 20% | —% | 19% | 20% | (1)% | |||||||||||||||||||||||||||||
| Total expenses | (42,294) | (34,539) | 22% | (84,332) | (69,912) | 21% | |||||||||||||||||||||||||||||
| Income from operations | 6,097 | 932 | 554% | 8,468 | 999 | 748% | |||||||||||||||||||||||||||||
Adjusted EBITDA(vi) |
13,916 | 8,062 | 73% | 25,373 | 15,151 | 67% | |||||||||||||||||||||||||||||
Adjusted EBITDA as a percentage of revenue(vii) |
8% | 6% | 2% | 7% | 5% | 2% | |||||||||||||||||||||||||||||
| Net income (loss) | 24 | (2,836) | —% | (328) | (5,525) | —% | |||||||||||||||||||||||||||||
Adjusted net income (loss) before fair value change in derivative liability and excluding NCI(viii) |
565 | (2,898) | —% | (1,516) | (5,706) | —% | |||||||||||||||||||||||||||||
Adjusted basic and diluted income (loss) per share(ix) |
0.01 | (0.04) | —% | (0.02) | (0.07) | —% | |||||||||||||||||||||||||||||
5 | ||
|
High Tide Inc. | ||||
| Management's Discussion and Analysis | |||||
| For the three and six months ended April 30, 2026 and 2025 | |||||
| (In thousands of Canadian dollars, except share and per share amounts or otherwise stated) | |||||
| Three months ended April 30, | Six months ended April 30, | |||||||||||||||||||||||||||||||||||||
| 2026 | 2025 | Change | 2026 | 2025 | Change | |||||||||||||||||||||||||||||||||
| $ | $ | ∆ | $ | $ | ∆ | |||||||||||||||||||||||||||||||||
| Cannabis, hemp-derived products and other revenue | 173,562 | 131,389 | 32% | 345,908 | 266,306 | 30% | ||||||||||||||||||||||||||||||||
| Consumption accessories | 5,734 | 6,415 | (11)% | 11,717 | 13,959 | (16)% | ||||||||||||||||||||||||||||||||
| Revenue | 179,296 | 137,804 | 30% | 357,625 | 280,265 | 28% | ||||||||||||||||||||||||||||||||
| Gross profit | 48,391 | 35,471 | 36% | 92,800 | 70,911 | 31% | ||||||||||||||||||||||||||||||||
Gross margin(i) |
27% | 26% | 1% | 26% | 25% | 1% |
||||||||||||||||||||||||||||||||
| Three months ended April 30, | Six months ended April 30, | |||||||||||||||||||||||||||||||||||||
| 2026 | 2025 | Change | 2026 | 2025 | Change | |||||||||||||||||||||||||||||||||
| $ | $ | ∆ | $ | $ | ∆ | |||||||||||||||||||||||||||||||||
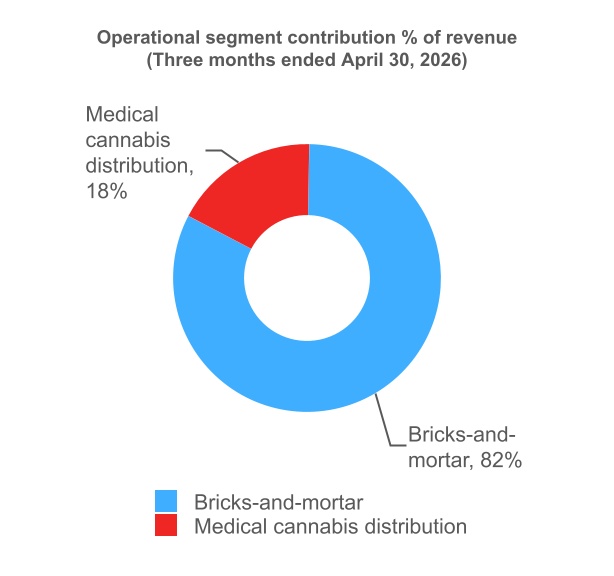
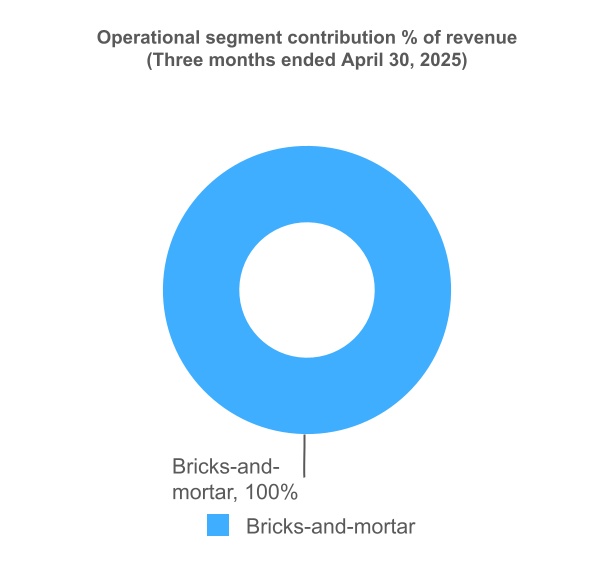
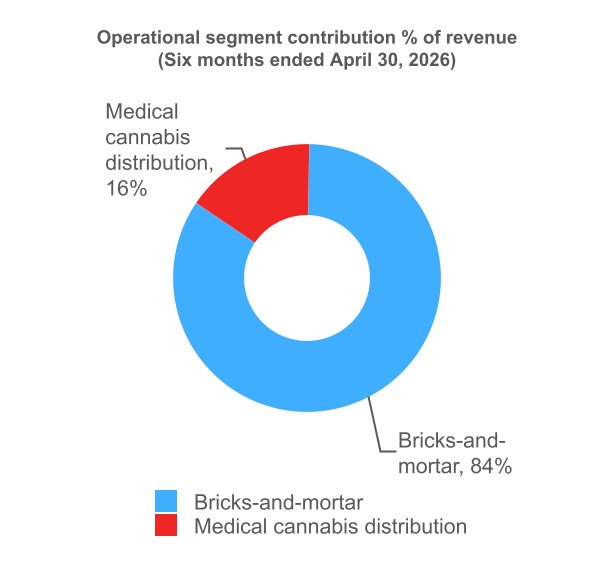
| Bricks-and-mortar | 147,657 | 137,804 | 7% | 301,007 | 280,265 | 7% | ||||||||||||||||||||||||||||||||
| Medical cannabis distribution | 31,639 | — | —% | 56,618 | — | —% | ||||||||||||||||||||||||||||||||
| Revenue | 179,296 | 137,804 | 30% | 357,625 | 280,265 | 28% | ||||||||||||||||||||||||||||||||
Gross margin - bricks-and-mortar(i) |
28% | 26% | 2% | 28% | 25% | 3% | ||||||||||||||||||||||||||||||||
Adjusted gross margin - medical cannabis distribution(ii) |
27% |
—% |
—% | 20% |
—% |
—% |
||||||||||||||||||||||||||||||||
6 | ||
|
High Tide Inc. | ||||
| Management's Discussion and Analysis | |||||
| For the three and six months ended April 30, 2026 and 2025 | |||||
| (In thousands of Canadian dollars, except share and per share amounts or otherwise stated) | |||||
Three months ended April 30 |
Six months ended April 30, |
|||||||||||||||||||||||||||||||||||||
2026 |
2025 |
Change |
2026 |
2025 |
Change |
|||||||||||||||||||||||||||||||||
$ |
$ |
∆ |
$ |
$ |
∆ |
|||||||||||||||||||||||||||||||||
Salaries, wages and benefits |
21,281 |
17,476 |
22% |
42,386 |
35,057 |
21% |
||||||||||||||||||||||||||||||||
General and administration |
7,241 |
5,768 |
26% |
14,634 |
12,331 |
19% |
||||||||||||||||||||||||||||||||
Professional fees |
3,819 |
1,690 |
126% |
6,256 |
3,499 |
79% |
||||||||||||||||||||||||||||||||
Advertising and promotion |
924 |
1,030 |
(10)% |
1,868 |
1,942 |
(4)% |
||||||||||||||||||||||||||||||||
Interest and bank charges |
2,002 |
1,445 |
38% |
3,765 |
2,931 |
29% |
||||||||||||||||||||||||||||||||
Operating expense(i) |
35,267 |
27,409 |
29% |
68,909 |
55,760 |
24% |
||||||||||||||||||||||||||||||||
Depreciation and amortization |
6,146 |
5,880 |
5% |
14,172 |
11,727 |
21% |
||||||||||||||||||||||||||||||||
Share-based compensation |
881 |
1,250 |
(30)% |
1,251 |
2,425 |
(48)% |
||||||||||||||||||||||||||||||||
Total expense |
42,294 |
34,539 |
22% |
84,332 |
69,912 |
21% |
||||||||||||||||||||||||||||||||
Total expenses as a % of revenue(ii) |
23.6% |
25.1% |
(1.5)% |
23.6% |
24.9% |
(1.3)% |
||||||||||||||||||||||||||||||||
Three months ended April 30 |
Six months ended April 30, |
|||||||||||||||||||||||||||||||||||||
2026 |
2025 |
Change |
2026 |
2025 |
Change |
|||||||||||||||||||||||||||||||||
∆ |
∆ |
|||||||||||||||||||||||||||||||||||||
Salaries, wages and benefits |
11.9% | 12.7% | (0.8)% |
11.9% | 12.5% | (0.6)% | ||||||||||||||||||||||||||||||||
General and administration |
4.0% | 4.2% | (0.2)% |
4.1% | 4.4% | (0.3)% | ||||||||||||||||||||||||||||||||
Professional fees |
2.1% | 1.2% | 0.9% |
1.7% | 1.2% | 0.5% | ||||||||||||||||||||||||||||||||
Advertising and promotion |
0.5% | 0.7% | (0.2)% |
0.5% | 0.7% | (0.2)% | ||||||||||||||||||||||||||||||||
Interest and bank charges |
1.1% | 1.0% | 0.1% |
1.1% | 1.0% | 0.1% | ||||||||||||||||||||||||||||||||
Operating expense(i) |
19.7% | 19.9% | (0.2)% |
19.3% | 19.9% | (0.6)% | ||||||||||||||||||||||||||||||||
Depreciation and amortization |
3.4% | 4.3% | (0.9)% |
4.0% | 4.2% | (0.2)% | ||||||||||||||||||||||||||||||||
Share-based compensation |
0.5% | 0.9% | (0.4)% | 0.3% | 0.9% | (0.6)% | ||||||||||||||||||||||||||||||||
Total expenses as a % of revenue |
23.6% | 25.1% | (1.5)% |
23.6% | 24.9% | (1.3)% | ||||||||||||||||||||||||||||||||
7 | ||
|
High Tide Inc. | ||||
| Management's Discussion and Analysis | |||||
| For the three and six months ended April 30, 2026 and 2025 | |||||
| (In thousands of Canadian dollars, except share and per share amounts or otherwise stated) | |||||
| 2026 | 2025 | 2024 | ||||||||||||||||||||||||
| Q2 | Q1 | Q4 | Q3 | Q2 | Q1 | Q4 | Q3 | |||||||||||||||||||
| Net Income (loss) | 24 | (352) | (46,711) | 832 | (2,836) | (2,689) | (4,802) | 825 | ||||||||||||||||||
| Income/deferred tax expense (recovery) | 295 | 40 | (178) | 69 | 46 | 38 | (153) | 671 | ||||||||||||||||||
| Accretion and interest | 3,151 | 3,155 | 1,213 | 1,795 | 1,950 | 2,101 | 2,308 | 1,681 | ||||||||||||||||||
| Depreciation and amortization | 6,146 | 8,026 | 6,503 | 6,080 | 5,880 | 5,847 | 5,362 | 5,678 | ||||||||||||||||||
EBITDA(i) |
9,616 | 10,869 | (39,173) | 8,776 | 5,040 | 5,297 | 2,715 | 8,855 | ||||||||||||||||||
| Inventory fair value | 792 | 690 | 865 | — | — | — | — | — | ||||||||||||||||||
| Foreign exchange (gain) loss | (212) | (144) | 333 | 120 | 114 | (13) | 5 | 19 | ||||||||||||||||||
| Transaction and acquisition costs | 2,077 | 2,958 | 2,682 | 881 | 1,616 | 630 | 773 | 12 | ||||||||||||||||||
| Other (gain) loss | — | — | (41) | (1) | 42 | — | (874) | 6 | ||||||||||||||||||
| Impairment loss | — | — | 23,564 | — | — | — | 4,964 | — | ||||||||||||||||||
| Share-based compensation | 881 | 370 | 668 | 824 | 1,250 | 1,175 | 750 | 881 | ||||||||||||||||||
| Loss (gain) on fair value change in derivative liability | 762 | (3,286) | 23,516 | 43 | — | — | (88) | (159) | ||||||||||||||||||
Adjusted EBITDA(i) |
13,916 | 11,457 | 12,414 | 10,643 | 8,062 | 7,089 | 8,245 | 9,614 | ||||||||||||||||||
Adjusted EBITDA margin(ii) |
8% | 6% | 8% | 7% | 6% | 5% | 6% | 7% | ||||||||||||||||||
| Adjusted EBITDA - trailing twelve months | 48,430 | 42,576 | 38,208 | 34,039 | 33,010 | 34,989 | 38,335 | 38,452 | ||||||||||||||||||
8 | ||
|
High Tide Inc. | ||||
| Management's Discussion and Analysis | |||||
| For the three and six months ended April 30, 2026 and 2025 | |||||
| (In thousands of Canadian dollars, except share and per share amounts or otherwise stated) | |||||
| 2026 | 2025 | 2024 | ||||||||||||||||||||||||||||||||||||||||||||||||
| Q2 | Q1 | Q4 | Q3 | Q2 | Q1 | Q4 | Q3 | |||||||||||||||||||||||||||||||||||||||||||
| Cash flow from operating activities | 8,752 | 5,486 | 6,599 | 8,231 | 4,686 | 4,644 | 6,179 | 8,928 | ||||||||||||||||||||||||||||||||||||||||||
| Changes in non-cash working capital | (4,319) | 374 | (2,321) | 2,419 | 3,569 | (3,961) | 3,473 | (2,715) | ||||||||||||||||||||||||||||||||||||||||||
| Net cash provided by operating activities | 4,433 | 5,860 | 4,278 | 10,650 | 8,255 | 683 | 9,652 | 6,213 | ||||||||||||||||||||||||||||||||||||||||||
Sustaining capex(i) |
(289) | (286) | (345) | (460) | (692) | (361) | (533) | (279) | ||||||||||||||||||||||||||||||||||||||||||
| Lease liability payments | (2,662) | (2,635) | (2,610) | (2,508) | (2,667) | (2,222) | (3,211) | (2,842) | ||||||||||||||||||||||||||||||||||||||||||
Free cash flow(ii) |
1,482 | 2,939 | 1,323 | 7,682 | 4,896 | (1,900) | 5,908 | 3,092 | ||||||||||||||||||||||||||||||||||||||||||
| Free cash flow - trailing twelve months | 13,426 | 16,840 | 12,001 | 16,586 | 11,996 | 16,483 | 21,991 | 21,770 | ||||||||||||||||||||||||||||||||||||||||||
9 | ||
|
High Tide Inc. | ||||
| Management's Discussion and Analysis | |||||
| For the three and six months ended April 30, 2026 and 2025 | |||||
| (In thousands of Canadian dollars, except share and per share amounts or otherwise stated) | |||||

10 | ||
|
High Tide Inc. | ||||
| Management's Discussion and Analysis | |||||
| For the three and six months ended April 30, 2026 and 2025 | |||||
| (In thousands of Canadian dollars, except share and per share amounts or otherwise stated) | |||||
| Bricks-and-mortar | Bricks-and-mortar | Medical cannabis distribution | Medical cannabis distribution | Total | Total | ||||||||||||||||||||||||||||||||||||
| As at April 30, 2026 and October 31, 2025 | 2026 | 2025 | 2026 | 2025 | 2026 | 2025 | |||||||||||||||||||||||||||||||||||
| $ | $ | $ | $ | $ | $ | ||||||||||||||||||||||||||||||||||||
| Current assets | 84,440 | 92,028 | 46,918 | 44,857 | 131,358 | 136,885 | |||||||||||||||||||||||||||||||||||
| Non-current assets | 152,967 | 146,626 | 63,542 | 65,551 | 216,509 | 212,177 | |||||||||||||||||||||||||||||||||||
| Current liabilities | 46,072 | 58,990 | 43,838 | 40,928 | 89,910 | 99,918 | |||||||||||||||||||||||||||||||||||
| Non-current liabilities | 130,352 | 136,098 | 25,693 | 10,258 | 156,045 | 146,356 | |||||||||||||||||||||||||||||||||||
11 | ||
|
High Tide Inc. | ||||
| Management's Discussion and Analysis | |||||
| For the three and six months ended April 30, 2026 and 2025 | |||||
| (In thousands of Canadian dollars, except share and per share amounts or otherwise stated) | |||||
| Bricks-and-mortar | Bricks-and-mortar | Medical cannabis distribution | Medical cannabis distribution | Total | Total | ||||||||||||||||||||||||||||||||||||
| For the three months ended April 30, | 2026 | 2025 | 2026 | 2025 | 2026 | 2025 | |||||||||||||||||||||||||||||||||||
| $ | $ | $ | $ | $ | $ | ||||||||||||||||||||||||||||||||||||
| Revenue | 147,657 | 137,804 | 31,639 | — | 179,296 | 137,804 | |||||||||||||||||||||||||||||||||||
| Gross profit | 40,685 | 35,471 | 7,706 | — | 48,391 | 35,471 | |||||||||||||||||||||||||||||||||||
Gross profit margin(i) |
28% | 26% | 24% | —% | 27% | 26% | |||||||||||||||||||||||||||||||||||
Adjusted gross margin(ii) |
28% | 26% | 27% | —% | 27% | 26% | |||||||||||||||||||||||||||||||||||
Operating expense(iii) |
29,959 | 27,409 | 5,308 | — | 35,267 | 27,409 | |||||||||||||||||||||||||||||||||||
| Income (loss) from operations | 5,725 | 932 | 372 | — | 6,097 | 932 | |||||||||||||||||||||||||||||||||||
Adjusted EBITDA(iv) |
10,727 | 8,062 | 3,189 | — | 13,916 | 8,062 | |||||||||||||||||||||||||||||||||||
Adjusted EBITDA margin(v) |
7% | 6% | 10% | —% | 8% | 6% | |||||||||||||||||||||||||||||||||||
| Bricks-and-mortar | Bricks-and-mortar | Medical cannabis distribution | Medical cannabis distribution | Total | Total | ||||||||||||||||||||||||||||||||||||
| For the six months ended April 30, | 2026 | 2025 | 2026 | 2025 | 2026 | 2025 | |||||||||||||||||||||||||||||||||||
| $ | $ | $ | $ | $ | $ | ||||||||||||||||||||||||||||||||||||
| Revenue | 301,007 | 280,265 | 56,618 | — | 357,625 | 280,265 | |||||||||||||||||||||||||||||||||||
| Gross profit (loss) | 82,785 | 70,911 | 10,015 | — | 92,800 | 70,911 | |||||||||||||||||||||||||||||||||||
Gross margin(i) |
28% | 25% | 18% | —% | 26% | 25% | |||||||||||||||||||||||||||||||||||
Adjusted gross margin(ii) |
28% | 25% | 20% | —% | 26% | 25% | |||||||||||||||||||||||||||||||||||
Operating expense(iii) |
60,338 | 55,760 | 8,571 | — | 68,909 | 55,760 | |||||||||||||||||||||||||||||||||||
| Income (loss) from operations | 10,970 | 999 | (2,502) | — | 8,468 | 999 | |||||||||||||||||||||||||||||||||||
Adjusted EBITDA(iv) |
22,447 | 15,151 | 2,926 | — | 25,373 | 15,151 | |||||||||||||||||||||||||||||||||||
Adjusted EBITDA margin(v) |
7% | 5% | 5% | —% | 7% | 5% | |||||||||||||||||||||||||||||||||||
12 | ||
|
High Tide Inc. | ||||
| Management's Discussion and Analysis | |||||
| For the three and six months ended April 30, 2026 and 2025 | |||||
| (In thousands of Canadian dollars, except share and per share amounts or otherwise stated) | |||||
Three months ended April 30 |
Six months ended April 30, |
||||||||||||||||||||||||||||||||||
2026 |
2025 |
Change |
2026 |
2025 |
Change |
||||||||||||||||||||||||||||||
$ |
$ |
∆ |
$ |
$ |
∆ |
||||||||||||||||||||||||||||||
Cannabis, hemp-derived products and other revenue |
142,014 |
131,389 |
8% |
289,381 |
266,306 |
9% |
|||||||||||||||||||||||||||||
Consumption accessories |
5,643 |
6,415 |
(12)% |
11,626 |
13,959 |
(17)% |
|||||||||||||||||||||||||||||
Revenue |
147,657 |
137,804 |
7% |
301,007 |
280,265 |
7% |
|||||||||||||||||||||||||||||
Cost of sales |
106,972 |
102,333 |
5% |
218,222 |
209,354 |
4% |
|||||||||||||||||||||||||||||
Gross profit |
40,685 |
35,471 |
15% |
82,785 |
70,911 |
17% |
|||||||||||||||||||||||||||||
Gross margin(i) |
28% |
26% |
2% |
28% |
25% |
3% |
|||||||||||||||||||||||||||||
Operating expense(ii) |
29,959 |
27,409 |
9% |
60,338 |
55,760 |
8% |
|||||||||||||||||||||||||||||
Depreciation and amortization |
4,270 |
5,880 |
(27)% |
10,428 |
11,727 |
(11)% |
|||||||||||||||||||||||||||||
Share-based compensation |
732 |
1,250 |
(41)% |
1,049 |
2,425 |
(57)% |
|||||||||||||||||||||||||||||
Total expenses |
34,960 |
34,539 |
1% |
71,815 |
69,912 |
3% |
|||||||||||||||||||||||||||||
Income from operations |
5,725 |
932 |
514% |
10,970 |
999 |
998% |
|||||||||||||||||||||||||||||
Adjusted EBITDA(i) |
10,727 |
8,062 |
33% |
22,447 |
15,151 |
48% |
|||||||||||||||||||||||||||||
Adjusted EBITDA margin(iii) |
7% |
6% |
1% |
7% |
5% |
2% |
|||||||||||||||||||||||||||||
Salaries, wages and benefits as a % of revenue(iv) |
13% |
13% |
—% |
13% |
13% |
—% |
|||||||||||||||||||||||||||||
Operating expense as a % of revenue(v) |
20% |
20% |
—% |
20% |
20% |
—% |
|||||||||||||||||||||||||||||
13 | ||
|
High Tide Inc. | ||||
| Management's Discussion and Analysis | |||||
| For the three and six months ended April 30, 2026 and 2025 | |||||
| (In thousands of Canadian dollars, except share and per share amounts or otherwise stated) | |||||
| Three months ended April 30, | Six months ended April 30, | |||||||||||||||||||
| 2026 | 2025 | Change | 2026 | 2025 | Change | |||||||||||||||
| $ | $ | ∆ |
$ | $ | ∆ |
|||||||||||||||
| Cannabis and hemp-derived products | 31,548 | — | 31,548 | 56,527 | — | 56,527 | ||||||||||||||
| Consumption accessories | 91 | — | 91 | 91 | — | 91 | ||||||||||||||
| Revenue | 31,639 | — | 31,639 | 56,618 | — | 56,618 | ||||||||||||||
| Cost of sales | 23,141 | — | 23,141 | 45,121 | — | 45,121 | ||||||||||||||
| Inventory fair value | 792 | — | 792 | 1,482 | — | 1,482 | ||||||||||||||
| Gross profit | 7,706 | — | 7,706 | 10,015 | — | 10,015 | ||||||||||||||
Adjusted gross profit(i) |
8,498 | — | 8,498 | 11,497 | — | 11,497 | ||||||||||||||
Adjusted gross margin(ii) |
27% | —% | — | 20% | —% | — | ||||||||||||||
Operating expense(iii) |
5,308 | — | 5,308 | 8,571 | — | 8,571 | ||||||||||||||
| Depreciation and amortization | 1,876 | — | 1,876 | 3,743 | — | 3,743 | ||||||||||||||
| Share-based compensation | 149 | — | 149 | 203 | — | 203 | ||||||||||||||
| Total expenses | 7,334 | — | 7,334 | 12,517 | — | 12,517 | ||||||||||||||
| Income (loss) from operations | 372 | — | 372 | (2,502) | — | (2,502) | ||||||||||||||
| Adjusted EBITDA | 3,189 | — | 3,189 | 2,926 | — | 2,926 | ||||||||||||||
Adjusted EBITDA margin(iv) |
10% | —% | —% | 5% | —% | —% | ||||||||||||||
Salaries, wages and benefits as a % of revenue(v) |
6% | —% | —% | 5% | —% | —% | ||||||||||||||
Operating expense as a % of revenue(vi) |
17% | —% | —% | 15% | —% | —% | ||||||||||||||
14 | ||
|
High Tide Inc. | ||||
| Management's Discussion and Analysis | |||||
| For the three and six months ended April 30, 2026 and 2025 | |||||
| (In thousands of Canadian dollars, except share and per share amounts or otherwise stated) | |||||
15 | ||
|
High Tide Inc. | ||||
| Management's Discussion and Analysis | |||||
| For the three and six months ended April 30, 2026 and 2025 | |||||
| (In thousands of Canadian dollars, except share and per share amounts or otherwise stated) | |||||
16 | ||
|
High Tide Inc. | ||||
| Management's Discussion and Analysis | |||||
| For the three and six months ended April 30, 2026 and 2025 | |||||
| (In thousands of Canadian dollars, except share and per share amounts or otherwise stated) | |||||
| Canada | Canada | USA | USA | International | International | Total | Total | |||||||||||||||||||||||||||||||||||||||||||
| For the three months ended April 30, | 2026 | 2025 | 2026 | 2025 | 2026 | 2025 | 2026 | 2025 | ||||||||||||||||||||||||||||||||||||||||||
| $ | $ | $ | $ | $ | $ | $ | $ | |||||||||||||||||||||||||||||||||||||||||||
| Revenue | 144,331 | 133,091 | 3,167 | 4,542 | 31,798 | 171 | 179,296 | 137,804 | ||||||||||||||||||||||||||||||||||||||||||
| Cost of sales | 104,603 | 99,089 | 2,273 | 3,114 | 23,237 | 130 | 130,113 | 102,333 | ||||||||||||||||||||||||||||||||||||||||||
| Inventory fair value | - | - | - | - | 792 | - | 792 | - | ||||||||||||||||||||||||||||||||||||||||||
| Gross profit | 39,728 | 34,002 | 894 | 1,428 | 7,769 | 41 | 48,391 | 35,471 | ||||||||||||||||||||||||||||||||||||||||||
Gross margin(i) |
28% | 26% | 28% | 31% | 24% | 24% | 27% | 26% | ||||||||||||||||||||||||||||||||||||||||||
Adjusted gross margin(ii) |
28% | 26% | 28% | 31% | 27% | 24% | 27% | 26% | ||||||||||||||||||||||||||||||||||||||||||
| Total expenses | 33,828 | 28,593 | 2,301 | 5,669 | 6,165 | 277 | 42,294 | 34,539 | ||||||||||||||||||||||||||||||||||||||||||
| Income (loss) from operations | 5,900 | 5,409 | (1,407) | (4,241) | 1,604 | (236) | 6,097 | 932 | ||||||||||||||||||||||||||||||||||||||||||
| Depreciation and amortization | 3,970 | 5,115 | 328 | 763 | 1,848 | 2 | 6,146 | 5,880 | ||||||||||||||||||||||||||||||||||||||||||
| Share-based compensation | 881 | 1,250 | — | — | — | — | 881 | 1,250 | ||||||||||||||||||||||||||||||||||||||||||
| Inventory fair value | — | — | — | — | 792 | — | 792 | — | ||||||||||||||||||||||||||||||||||||||||||
Adjusted EBITDA(i) |
10,751 | 11,774 | (1,079) | (3,478) | 4,244 | (234) | 13,916 | 8,062 | ||||||||||||||||||||||||||||||||||||||||||
| Canada | Canada | USA | USA | International | International | Total | Total | |||||||||||||||||||||||||||||||||||||||||||
| For the six months ended April 30, | 2026 | 2025 | 2026 | 2025 | 2026 | 2025 | 2026 | 2025 | ||||||||||||||||||||||||||||||||||||||||||
| $ | $ | $ | $ | $ | $ | $ | $ | |||||||||||||||||||||||||||||||||||||||||||
| Revenue | 294,021 | 268,805 | 6,692 | 11,000 | 56,912 | 460 | 357,625 | 280,265 | ||||||||||||||||||||||||||||||||||||||||||
| Cost of sales | 213,103 | 201,531 | 4,932 | 7,544 | 45,308 | 279 | 263,343 | 209,354 | ||||||||||||||||||||||||||||||||||||||||||
| Inventory fair value | — | — | — | — | 1,482 | — | 1,482 | — | ||||||||||||||||||||||||||||||||||||||||||
| Gross profit | 80,918 | 67,274 | 1,760 | 3,456 | 10,122 | 181 | 92,800 | 70,911 | ||||||||||||||||||||||||||||||||||||||||||
Gross margin(i) |
28% | 25% | 26% | 31% | 18% | 39% | 26% | 25% | ||||||||||||||||||||||||||||||||||||||||||
Adjusted gross margin(ii) |
28% | 25% | 26% | 31% | 20% | 39% | 26% | 25% | ||||||||||||||||||||||||||||||||||||||||||
| Total expenses | 68,963 | 59,908 | 4,783 | 9,303 | 10,586 | 701 | 84,332 | 69,912 | ||||||||||||||||||||||||||||||||||||||||||
| Income (loss) from operations | 11,955 | 7,366 | (3,023) | (5,847) | (464) | (520) | 8,468 | 999 | ||||||||||||||||||||||||||||||||||||||||||
| Depreciation and amortization | 9,825 | 10,067 | 672 | 1,606 | 3,675 | 54 | 14,172 | 11,727 | ||||||||||||||||||||||||||||||||||||||||||
| Share-based compensation | 1,251 | 2,425 | — | — | — | — | 1,251 | 2,425 | ||||||||||||||||||||||||||||||||||||||||||
| Inventory fair value | — | — | — | — | 1,482 | — | 1,482 | — | ||||||||||||||||||||||||||||||||||||||||||
Adjusted EBITDA(i) |
23,031 | 19,858 | (2,351) | (4,241) | 4,693 | (466) | 25,373 | 15,151 | ||||||||||||||||||||||||||||||||||||||||||
17 | ||
|
High Tide Inc. | ||||
| Management's Discussion and Analysis | |||||
| For the three and six months ended April 30, 2026 and 2025 | |||||
| (In thousands of Canadian dollars, except share and per share amounts or otherwise stated) | |||||
| Canada | Canada | USA | USA | International | International | Total | Total | |||||||||||||||||||||||||||||||||||||||||||
| As at April 30, 2026 and October 31, 2025 | 2026 | 2025 | 2026 | 2025 | 2026 | 2025 | 2026 | 2025 | ||||||||||||||||||||||||||||||||||||||||||
| $ | $ | $ | $ | $ | $ | $ | $ | |||||||||||||||||||||||||||||||||||||||||||
| Current assets | 79,839 | 84,442 | 6,460 | 6,824 | 45,059 | 45,619 | 131,358 | 136,885 | ||||||||||||||||||||||||||||||||||||||||||
| Non-current assets | 150,029 | 143,604 | 1,859 | 2,587 | 64,621 | 65,986 | 216,509 | 212,177 | ||||||||||||||||||||||||||||||||||||||||||
| Current liabilities | 43,890 | 55,763 | 3,650 | 2,832 | 42,370 | 41,324 | 89,910 | 99,919 | ||||||||||||||||||||||||||||||||||||||||||
| Non-current liabilities | 144,185 | 134,918 | 1,162 | 1,509 | 10,698 | 9,929 | 156,045 | 146,356 | ||||||||||||||||||||||||||||||||||||||||||
18 | ||
|
High Tide Inc. | ||||
| Management's Discussion and Analysis | |||||
| For the three and six months ended April 30, 2026 and 2025 | |||||
| (In thousands of Canadian dollars, except share and per share amounts or otherwise stated) | |||||
| 2026 | 2025 | 2024 | ||||||||||||||||||||||||
| Q2 | Q1 | Q4 | Q3 | Q2 | Q1 | Q4 | Q3 | |||||||||||||||||||
Free cash flow(i) |
1,482 | 2,939 | 1,323 | 7,682 | 4,896 | (1,900) | 5,908 | 3,092 | ||||||||||||||||||
| Cash and cash equivalents, and restricted cash | 36,521 | 46,374 | 47,883 | 63,809 | 34,692 | 33,341 | 47,267 | 35,254 | ||||||||||||||||||
| Cannabis, hemp-derived products and other | 173,562 | 172,346 | 158,538 | 143,946 | 131,389 | 134,917 | 131,167 | 124,713 | ||||||||||||||||||
| Consumption accessories | 5,734 | 5,983 | 5,493 | 5,744 | 6,415 | 7,544 | 7,128 | 6,972 | ||||||||||||||||||
| Revenue | 179,296 | 178,329 | 164,031 | 149,690 | 137,804 | 142,461 | 138,295 | 131,685 | ||||||||||||||||||
| Revenue - QoQ change (%) | 1% | 9% | 10% | 9% | (3)% | 3% | 5% | 6% | ||||||||||||||||||
| Gross profit | 48,391 | 44,409 | 42,528 | 40,091 | 35,471 | 35,440 | 35,755 | 35,454 | ||||||||||||||||||
| Gross profit - QoQ change | 3,982 | 1,881 | 2,437 | 4,620 | 31 | (315) | 301 | 155 | ||||||||||||||||||
Gross margin(i) |
27% | 25% | 26% | 27% | 26% | 25% | 26% | 27% | ||||||||||||||||||
Adjusted gross margin(iii) |
27% | 25% | 26% | 27% | 26% | 25% | 26% | 27% | ||||||||||||||||||
| Salaries, wages and benefits | 21,281 | 21,105 | 18,814 | 18,288 | 17,476 | 17,581 | 17,083 | 16,667 | ||||||||||||||||||
| General and administration | 7,241 | 7,393 | 7,099 | 6,623 | 5,768 | 6,563 | 5,856 | 4,815 | ||||||||||||||||||
| Professional fees | 3,819 | 2,437 | 2,669 | 2,301 | 1,690 | 1,809 | 1,919 | 1,749 | ||||||||||||||||||
| Advertising and promotion | 924 | 944 | 651 | 592 | 1,030 | 912 | 1,012 | 1,178 | ||||||||||||||||||
| Interest and bank charges | 2,002 | 1,763 | 1,746 | 1,644 | 1,445 | 1,486 | 1,640 | 1,431 | ||||||||||||||||||
Operating Expense(ii) |
35,267 | 33,642 | 30,979 | 29,448 | 27,409 | 28,351 | 27,510 | 25,840 | ||||||||||||||||||
| Operating expense as a % of revenue | 20% | 19% | 19% | 20% | 20% | 20% | 20% | 20% | ||||||||||||||||||
Adjusted EBITDA (i) |
13,916 | 11,457 | 12,414 | 10,643 | 8,062 | 7,089 | 8,245 | 9,614 | ||||||||||||||||||
Adjusted EBITDA margin(i) |
8% | 6% | 8% | 7% | 6% | 5% | 6% | 7% | ||||||||||||||||||
| Income (loss) from operations | 6,097 | 2,371 | (19,186) | 3,739 | 932 | 67 | (2,831) | 3,055 | ||||||||||||||||||
| Net income (loss) | 24 | (352) | (46,711) | 832 | (2,836) | (2,689) | (4,802) | 825 | ||||||||||||||||||
Adjusted net income (loss) before impairment and fair value change in derivative liability and excluding NCI(iv) |
565 | (2,081) | 1,442 | 598 | (2,898) | (2,808) | (39) | 558 | ||||||||||||||||||
| Basic and diluted income (loss) per share | — | 0.01 | (0.56) | 0.01 | (0.04) | (0.03) | (0.06) | 0.01 | ||||||||||||||||||
19 | ||
|
High Tide Inc. | ||||
| Management's Discussion and Analysis | |||||
| For the three and six months ended April 30, 2026 and 2025 | |||||
| (In thousands of Canadian dollars, except share and per share amounts or otherwise stated) | |||||
2026 |
2025 |
2024 |
||||||||||||||||||||||||
As a percentage of revenue |
Q2 | Q1 | Q4 | Q3 | Q2 | Q1 | Q4 | Q3 | ||||||||||||||||||
Salaries, wages and benefits |
11.9% |
11.8% | 11.5% | 12.2% |
12.7% | 12.3% |
12.4% |
12.7% |
||||||||||||||||||
General and administration |
4.0% |
4.1% | 4.3% | 4.4% |
4.2% | 4.6% |
4.2% |
3.7% |
||||||||||||||||||
Professional fees |
2.1% |
1.4% | 1.6% | 1.5% |
1.2% | 1.3% |
1.4% |
1.3% |
||||||||||||||||||
Advertising and promotion |
0.5% |
0.5% | 0.4% | 0.4% |
0.7% | 0.6% |
0.7% |
0.9% |
||||||||||||||||||
Interest and bank charges |
1.1% |
1.0% | 1.1% | 1.1% |
1.0% | 1.0% |
1.2% |
1.1% |
||||||||||||||||||
Operating expense(i) |
19.7% |
18.9% | 18.9% | 19.7% |
19.9% | 19.9% |
19.9% |
19.6% |
||||||||||||||||||
| 2026 | 2025 | 2024 | ||||||||||||||||||||||||
| Q2 | Q1 | Q4 | Q3 | Q2 | Q1 | Q4 | Q3 | |||||||||||||||||||
| Store count | 221 | 218 | 211 | 203 | 195 | 189 | 186 | 180 | ||||||||||||||||||
| Revenue | 147,657 | 153,350 | 154,221 | 149,690 | 137,804 | 142,461 | 138,295 | 131,685 | ||||||||||||||||||
| % change | (4)% | (1)% | 3% | 9% | (3)% | 3% | 5% | 6% | ||||||||||||||||||
| Gross profit | 40,685 | 42,100 | 42,140 | 40,091 | 35,471 | 35,440 | 35,755 | 35,454 | ||||||||||||||||||
| Gross margin | 28% | 27% | 27% | 27% | 26% | 25% | 26% | 27% | ||||||||||||||||||
Operating expense(i) |
29,959 | 30,378 | 29,709 | 29,448 | 27,409 | 28,351 | 27,510 | 25,840 | ||||||||||||||||||
| Depreciation and amortization | 4,270 | 6,160 | 5,336 | 6,080 | 5,880 | 5,847 | 5,362 | 5,678 | ||||||||||||||||||
| Share-based compensation | 732 | 317 | 655 | 824 | 1,250 | 1,175 | 750 | 881 | ||||||||||||||||||
| Impairment loss | — | — | 23,564 | — | — | — | 4,964 | — | ||||||||||||||||||
| Total expense | 34,960 | 36,855 | 59,264 | 36,352 | 34,539 | 35,373 | 38,586 | 32,399 | ||||||||||||||||||
| Income from operations | 5,725 | 5,245 | (17,123) | 3,739 | 932 | 67 | (2,831) | 3,055 | ||||||||||||||||||
| Adjusted EBITDA | 10,727 | 11,722 | 12,432 | 10,643 | 8,062 | 7,089 | 8,245 | 9,614 | ||||||||||||||||||
| Adjusted EBITDA margin | 7% | 8% | 8% | 7% | 6% | 5% | 6% | 7% | ||||||||||||||||||
20 | ||
|
High Tide Inc. | ||||
| Management's Discussion and Analysis | |||||
| For the three and six months ended April 30, 2026 and 2025 | |||||
| (In thousands of Canadian dollars, except share and per share amounts or otherwise stated) | |||||
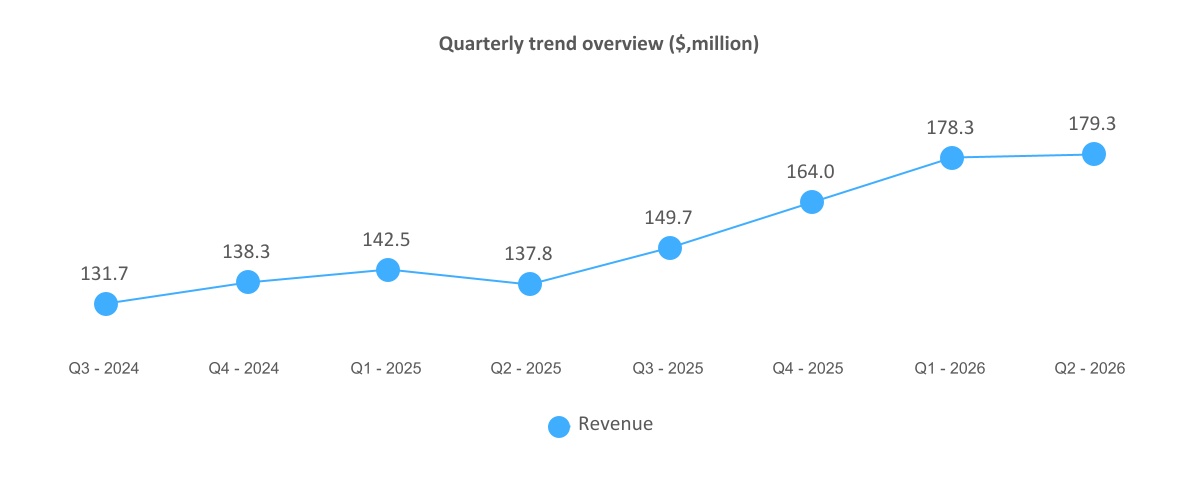
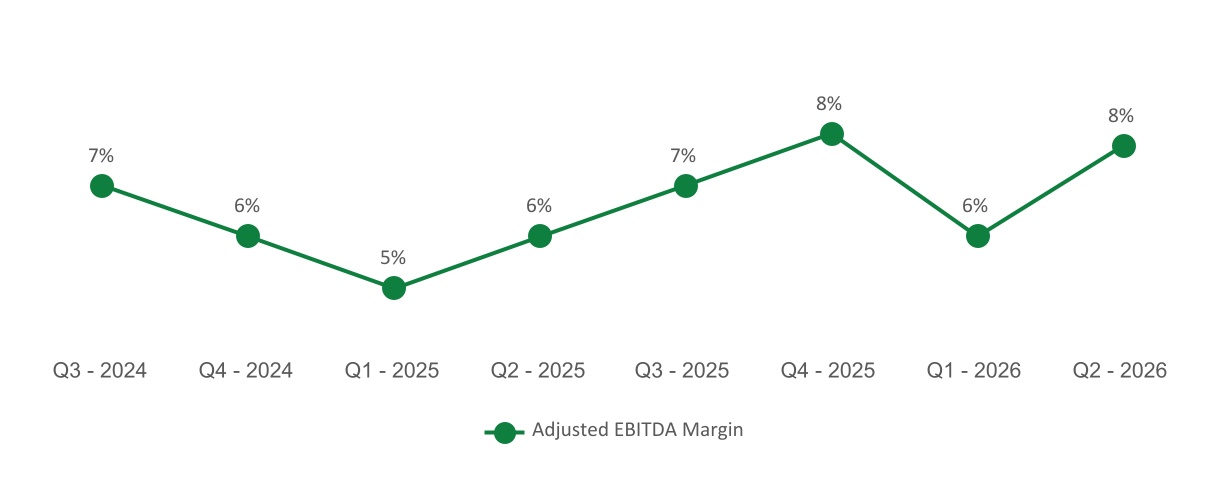
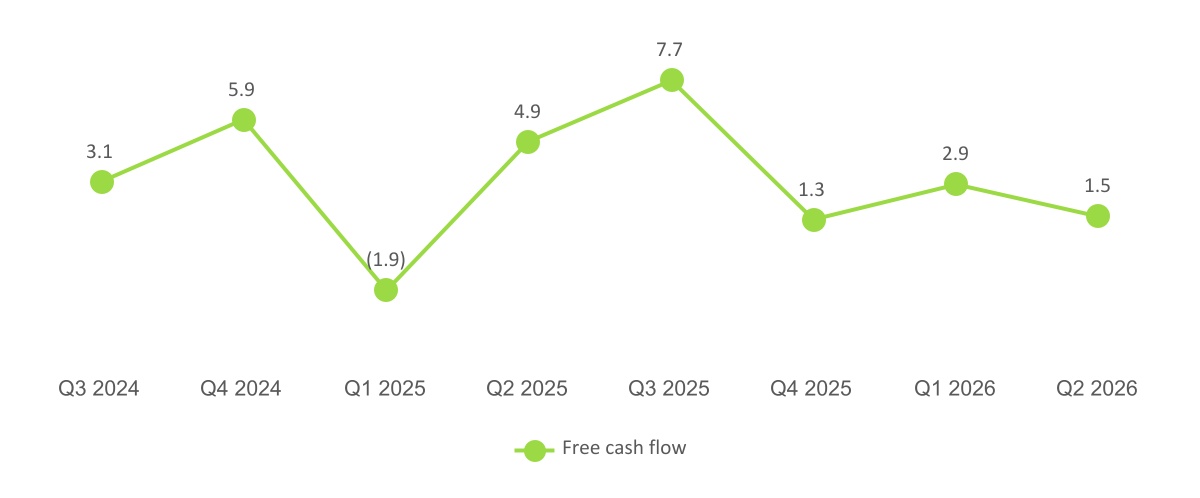
21 | ||
|
High Tide Inc. | ||||
| Management's Discussion and Analysis | |||||
| For the three and six months ended April 30, 2026 and 2025 | |||||
| (In thousands of Canadian dollars, except share and per share amounts or otherwise stated) | |||||
| Assets | April 30, 2026 | October 31, 2025 | Change | ||||||||
| Current assets | 131,358 | 136,885 | (5,527) | ||||||||
| Non-current assets | 216,509 | 212,177 | 4,332 | ||||||||
| Total assets | 347,867 | 349,062 | (1,195) | ||||||||
| Liabilities | |||||||||||
| Current liabilities | 89,910 | 99,919 | (10,009) | ||||||||
| Non-current liabilities | 156,045 | 146,356 | 9,689 | ||||||||
| Total liabilities | 245,955 | 246,275 | (320) | ||||||||
| Equity | 101,912 | 102,787 | (875) | ||||||||
| Total liabilities & equity | 347,867 | 349,062 | (1,195) | ||||||||
| Working Capital | 41,448 | 36,966 | 4,482 | ||||||||
22 | ||
|
High Tide Inc. | ||||
| Management's Discussion and Analysis | |||||
| For the three and six months ended April 30, 2026 and 2025 | |||||
| (In thousands of Canadian dollars, except share and per share amounts or otherwise stated) | |||||
| April 30, 2026 | April 30, 2025 | Change | |||||||||
| Net cash provided by operating activities | 10,293 | 8,938 | 1,355 | ||||||||
| Net cash used in investing activities | (4,962) | (4,893) | (69) | ||||||||
| Net cash used in financing activities | (16,088) | (16,491) | 403 | ||||||||
| Effect of foreign exchange on cash | (605) | (129) | (476) | ||||||||
| Net (decrease) increase in cash | (11,362) | (12,575) | 1,213 | ||||||||
| Cash and cash equivalents, and restricted cash, beginning of period | 47,883 | 47,267 | 616 | ||||||||
| Cash and cash equivalents, and restricted cash, end of period | 36,521 | 34,692 | 1,829 | ||||||||
23 | ||
|
High Tide Inc. | ||||
| Management's Discussion and Analysis | |||||
| For the three and six months ended April 30, 2026 and 2025 | |||||
| (In thousands of Canadian dollars, except share and per share amounts or otherwise stated) | |||||
|
Contractual
Cash Flows
|
2026 |
2027-2028 |
2029-2030 |
2031 and beyond |
||||||||||||||||||||||||||||
$ |
$ |
$ |
$ |
$ |
||||||||||||||||||||||||||||
Accounts payable and accrued liabilities |
55,341 | 55,341 | – | – | – | |||||||||||||||||||||||||||
Income tax payable |
7,339 | 7,339 | – | – | – | |||||||||||||||||||||||||||
Undiscounted lease obligations |
74,845 | 7,103 | 26,225 | 17,892 | 23,625 | |||||||||||||||||||||||||||
Notes payable |
20,004 | 926 | 3,539 | 15,282 | 257 | |||||||||||||||||||||||||||
Interest bearing loans and borrowings |
7,479 | 2,329 | 5,150 | – | – | |||||||||||||||||||||||||||
Secured debentures |
21,006 | 902 | 3,605 | 16,499 | – | |||||||||||||||||||||||||||
Convertible debt |
35,152 | 602 | 2,401 | 32,149 | – | |||||||||||||||||||||||||||
Total |
221,166 | 74,542 | 40,920 | 81,822 | 23,882 | |||||||||||||||||||||||||||
Facility |
Principal amount outstanding at April 30, 2026 |
April 30, 2026 |
October 31, 2025 |
Rate |
Maturity |
||||||||||||
$ |
$ |
$ |
|||||||||||||||
Interest bearing loan – connectFirst |
7,064 |
7,064 |
9,104 |
Variable: Prime + 2.5% |
Sept. 5, 2027 |
||||||||||||
Secured debentures |
15,000 |
12,765 |
12,536 |
Fixed: 12% coupon |
July 31, 2029 |
||||||||||||
Notes payable – vendor loan |
12,290 |
9,376 |
9,007 |
Fixed: 7% |
Dec. 31, 2029 |
||||||||||||
Convertible debt – Cronos |
30,000 |
18,764 |
17,877 |
Fixed: 4% coupon |
July 16, 2030 |
||||||||||||
Recourse to High Tide |
64,354 |
47,969 |
48,524 |
||||||||||||||
Interest bearing loan – working capital loan |
— | — | 2,234 |
Fixed: 5% |
Jan 4, 2026 |
||||||||||||
Interest bearing loan – German bank borrowing |
— | — | 4,851 |
Variable: EURIBOR + 2.50% |
April 30, 2026 |
||||||||||||
Notes payable - Remexian unsecured loans |
447 |
447 |
728 |
Fixed: 10% average rate |
Oct 31, 2026 |
||||||||||||
Notes payable – term loan |
3,193 |
3,193 |
3,637 |
Fixed: 4.82% |
Mar 31, 2030 |
||||||||||||
Notes payable – other loan |
209 |
65 |
67 |
Fixed: 3.75% |
May 19, 2050 |
||||||||||||
Non-recourse to High Tide(i) |
3,849 |
3,705 |
11,517 |
||||||||||||||
Total debt |
68,203 |
51,674 |
60,041 |
||||||||||||||
24 | ||
|
High Tide Inc. | ||||
| Management's Discussion and Analysis | |||||
| For the three and six months ended April 30, 2026 and 2025 | |||||
| (In thousands of Canadian dollars, except share and per share amounts or otherwise stated) | |||||
Securities (i) |
Units Outstanding | |||||||
| Common shares | 87,870,176 | |||||||
| Warrants | 8,598,883 | |||||||
| Stock options | 2,469,957 | |||||||
| RSUs | 1,907,158 | |||||||
25 | ||
|
High Tide Inc. | ||||
| Management's Discussion and Analysis | |||||
| For the three and six months ended April 30, 2026 and 2025 | |||||
| (In thousands of Canadian dollars, except share and per share amounts or otherwise stated) | |||||
26 | ||
|
High Tide Inc. | ||||
| Management's Discussion and Analysis | |||||
| For the three and six months ended April 30, 2026 and 2025 | |||||
| (In thousands of Canadian dollars, except share and per share amounts or otherwise stated) | |||||
27 | ||
|
High Tide Inc. | ||||
| Management's Discussion and Analysis | |||||
| For the three and six months ended April 30, 2026 and 2025 | |||||
| (In thousands of Canadian dollars, except share and per share amounts or otherwise stated) | |||||
28 | ||
|
High Tide Inc. | ||||
| Management's Discussion and Analysis | |||||
| For the three and six months ended April 30, 2026 and 2025 | |||||
| (In thousands of Canadian dollars, except share and per share amounts or otherwise stated) | |||||
29 | ||
|
High Tide Inc. | ||||
| Management's Discussion and Analysis | |||||
| For the three and six months ended April 30, 2026 and 2025 | |||||
| (In thousands of Canadian dollars, except share and per share amounts or otherwise stated) | |||||
30 | ||
|
High Tide Inc. | ||||
| Management's Discussion and Analysis | |||||
| For the three and six months ended April 30, 2026 and 2025 | |||||
| (In thousands of Canadian dollars, except share and per share amounts or otherwise stated) | |||||
31 | ||