

ASML Annual Report 2025
|
3 |
Financial performance
|
Risk and security
|
…through
customer
collaboration.
|
…through cutting-
edge physics.
|
Read more about this story |
…through collective
innovation.
|
…through diverse,
inspired talent.
|
Read more about this story |
…using the
potential of AI.
|
…while aiming
to reduce
environmental
impact.
|
Read more about this story |
Read more about this story |

Read more in Highlights online > |
||
Our 2025 online report highlights
key information from this pdf.
|
1. Strategic report | ||
Special note regarding forward-
looking statements
|
||
At a glance – 2025 overview |
||
In conversation with our CEO |
||
Our business |
||
Our holistic approach to lithography |
||
Our products and services |
||
Our marketplace |
||
Our business strategy |
||
Deepen customer trust |
||
Extend our technology and holistic
product leadership
|
||
Strengthen ecosystem
relationships
|
||
Create an exceptional workplace |
||
Drive operational excellence |
||
Deliver on ESG sustainability |
||
Our business model |
||
Engaged stakeholders |
||
Financial performance |
||
Message from our CFO |
||
Financial performance KPIs |
||
Long-term growth opportunities |
||
Risk and security |
||
Understanding ASML’s risk
management framework
|
||
How we manage risk |
||
Risk factors |
||
Information security |
||
2. Corporate governance | ||
Corporate governance |
||
Corporate governance at a glance |
||
Board of Management |
||
Supervisory Board |
||
Other Board-related matters |
||
AGM and share capital |
||
Financial reporting and audit |
||
Compliance with corporate
governance requirements
|
||
Supervisory Board report |
||
In conversation with the Chair of
the Supervisory Board
|
||
Supervisory Board focus in 2025 |
||
Meetings and attendance |
||
Composition and skills |
||
Evaluation |
||
Supervisory Board committees |
||
Financial statements and profit
allocation
|
||
Remuneration report |
||
In conversation with the Chair of the
Remuneration Committee
|
||
Board of Management remuneration
at a glance
|
||
Remuneration Committee |
||
Board of Management remuneration |
||
Supervisory Board remuneration |
||
Other information |
||
3. Sustainability statements | ||
Limited assurance report of the
independent auditors on the
Sustainability statements
|
||
General disclosures |
||
Basis for preparation |
||
ESG sustainability governance |
||
ESG sustainability at a glance |
||
Value chain and ecosystem overview |
||
Environmental and human rights
due diligence
|
||
Impact, risk and opportunity
management
|
||
Environmental |
||
Energy efficiency and climate action |
||
Circular economy |
||
EU Taxonomy |
||
Other disclosures: Water
management in our own operations
|
||
Social |
||
Attractive workplace for all |
||
Responsible value chain |
||
Innovation ecosystem |
||
Valued partner in our communities |
||
Governance |
||
ESG integrated governance |
||
Reference table |
||
4. Financial statements | ||
Consolidated financial statements |
||
Reports of independent registered
public accounting firms
|
||
Consolidated statements of
operations
|
||
Consolidated statements of
comprehensive income
|
||
Consolidated balance sheets |
||
Consolidated statements of
shareholders’ equity
|
||
Consolidated statements of
cash flows
|
||
Notes to the Consolidated
financial statements
|
||
Other appendices |
||
Definitions |
||
Exhibit index |
||
A definition or explanation of abbreviations, technical terms
and other terms used throughout this Annual Report can
be found in the Definitions section. In some cases, numbers
have been rounded for readers’ convenience.
This report comprises regulated information within the
meaning of articles 1:1 and 5:25c of the Dutch Financial
Markets Supervision Act (Wet op het Financieel Toezicht).
The sections Strategic report, Sustainability statements
(except for the Limited assurance report of the independent
auditor on the Sustainability statements), and subsections
Corporate governance and Supervisory Board report,
together form the Management Report.
In this report the name ‘ASML’ is sometimes used for
convenience in contexts where reference is made to ASML
Holding N.V. and/or any of its consolidated subsidiaries, as
the context may require.
References to our website and/or video presentations in
this Annual Report are for reference only and none nor any
portion thereof are incorporated by reference in this report.
© 2025-2026, ASML Netherlands B.V. All Rights Reserved.
|
ASML Annual Report 2025
|
5 |
Financial performance
|
Risk and security
|
 88%
Customer satisfaction
survey score
|
 €4.7bn
Research & Development
|
 5,100
Total number of suppliers
|
 €32.7bn
Total net sales
|
 52.8%
Gross margin
|
 €8.5bn
Returned to shareholders
|
 535
System sales in units
|
 > 44,000
Total employees (FTEs)
|
 21%
Women in our workforce
(headcount)
|
 143
Nationalities
|
ASML Annual Report 2025
|
7 |
Financial performance
|
Risk and security
|
 0 kt
Net scope 1 and 2 CO2e emissions
|
 11.5 Mt
Net scope 3 CO2e emissions
|
 90%
Reuse rate of parts returned
from the field and factory
|
 €1,750
Amount invested in communities
(per employee), including
employee giving
|

Our values |
||||||
We
challenge
By questioning the status
quo and pushing boundaries,
keeping technology
moving forward.
|
We
collaborate
By tapping into our collective
potential together with our
partners and stakeholders,
expanding our knowledge
and skills, learning from
each other and creating
better solutions.
|
We
care
By acting with integrity
and respect, and providing
a safe, inclusive and trusting
environment where our
people can learn and grow.
|
Global scale |
Asia
China
Japan
Malaysia
Singapore
South Korea
Taiwan
|
EMEA
Belgium
France
Germany
Ireland
Israel
Italy
Netherlands
United Kingdom
|
North
America
Arizona
California
Colorado
Connecticut
Idaho
Massachusetts
New Mexico
New York
Oregon
Texas
Utah
Virginia
|
||
60+
Locations
|
3
Continents
|
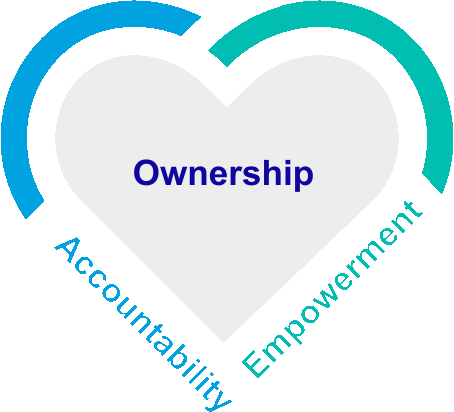
Empowered colleagues |
||
We promote a
culture of ownership,
where people feel
empowered to act
and be accountable.
|
||
Our commitment
to sustainability
|
|||
E |
We aim to help expand computing
power while minimizing energy use,
emissions and waste.
|
||
S |
We aim to deliver responsible growth
that benefits all our stakeholders.
|
||
G |
We aim to act on our responsibilities
and anchor them across our
entire business through integrated
governance, engaged stakeholders
and transparent reporting.
|
||

ASML Annual Report 2025
|
8 |
Financial performance
|
Risk and security
|
Christophe Fouquet
President, Chief Executive Officer and
Chair of the Board of Management
|

ASML Annual Report 2025
|
9 |
Financial performance
|
Risk and security
|
Christophe Fouquet discusses
the principal themes of the year,
the achievements that gave him
most satisfaction and how ASML
aims to maintain its performance
in the years ahead while meeting
the needs of a diverse group
of stakeholders
| |
Q |
Looking back at the year,
what were the most
significant milestones
and challenges?
|
ASML Annual Report 2025
|
10 |
Financial performance
|
Risk and security
|
 |
|
Our guiding principle is to always
ask where we can add the most
value and have the greatest impact
for our customers, both today and
in the future.”
| |
Christophe Fouquet |
|
President, Chief Executive Officer and Chair of the Board of Management |
|
 | |
Q |
What technological
breakthroughs have given you
the greatest sense of pride?
|
|||
Q |
How will the appointment of a
new CTO support innovation
at ASML?
|
|||
ASML Annual Report 2025
|
11 |
Financial performance
|
Risk and security
|
Q |
ASML has a long-standing
commitment to ESG. What
progress did you make
in 2025?
|
|||

Q |
Can you give some
examples of how ASML has
strengthened relationships
with stakeholders over
the last year?
|

ASML Annual Report 2025
|
12 |
Financial performance
|
Risk and security
|
Q |
How can ASML continue to
stand out as an attractive
employer for innovation talent?
|
|||
Q |
How do you continue to drive
innovation at ASML?
|
|||
Q |
How do you see 2026 shaping
up, and what challenges do
you expect?
|
|||
Our success
will be built on
the passion,
talent and
determination
of our people.”
|
Christophe Fouquet |
President, Chief Executive Officer and
Chair of the Board of Management
|

ASML Annual Report 2025
|
13 |
Financial performance
|
Risk and security
|
Our holistic approach to lithography |
|||
Our products and services |
|||
Our marketplace |
|||
Our business strategy |
|||
Deepen customer trust |
|||
Extend our technology and holistic
product leadership
|
|||
Strengthen ecosystem relationships |
|||
Create an exceptional workplace |
|||
Drive operational excellence |
|||
Deliver on ESG sustainability |
|||
Our business model |
|||
Engaged stakeholders |
|||

ASML Annual Report 2025
|
14 |
Financial performance
|
Risk and security
|

ASML Annual Report 2025
|
15 |
Financial performance
|
Risk and security
|
The chipmaking process
|
||
Microchip manufacturing is a complex, multi-step
process that takes place in highly specialized
semiconductor fabrication plants, known as ‘fabs’.
Transforming a silicon wafer into finished chips can
take up to six months and involves hundreds of tightly
controlled steps and quality checks. Lithography is
one of the most critical steps in the mass production
of microchips. It is the only step where each chip on
a wafer is individually processed, which means we
can maximize yield and performance by optimizing
patterning chip-by-chip.
The diagram on the right illustrates the key steps
of the manufacturing journey. As chip designs
become more complex and feature sizes continue
to shrink, the challenges of manufacturing increase.
That’s why a holistic approach to lithography is
essential. It enables greater precision, efficiency
and value throughout the process.
|
||
Steps in the chip manufacturing process |
||
Together, the following steps create a single layer
of a microchip. To build a complete device, these
steps are repeated for each additional layer.
1.Deposition: Different materials – conductors,
insulating films and semiconductors – are
deposited onto a silicon wafer.
2.Photoresist coating: The wafer is coated with
a light-sensitive layer called photoresist.
3.Lithography: The microchip pattern is printed
by using light to project it onto the wafer.
4.Baking and developing: The wafer is baked and
developed to fix the pattern in the photoresist.
5.Etching: Reactive gases are used to etch away
excess material, leaving the circuit pattern behind.
6. Ion implantation: The wafer may be bombarded
with ions to tune the semiconductor’s properties.
7. Photoresist removal: The remaining photoresist
is removed.
|
||

ASML Annual Report 2025
|
16 |
Financial performance
|
Risk and security
|
What is edge placement error (EPE)? |
||
EPE measures the difference between
the intended and the printed features of
a microchip. It combines overlay errors
(misalignment between layers) and
critical dimension variations (feature-
width deviations).
Take, for example, a line with right and
left edges. On a microchip, this line and
its edges must be precise and placed in
exact locations – any deviation, no matter
how slight, can compromise functionality
and cause the entire chip to fail.
|
||

ASML Annual Report 2025
|
17 |
Financial performance
|
Risk and security
|
Maximizing the process window |
||
Our integrated lithography solutions
work to maximize the process window
– the collection of acceptable ranges
of process parameters that allow a
microchip to be manufactured and
meet desired specifications.
|
||
By incorporating computational lithography,
metrology and inspection, ASML’s lithography
portfolio enables customers to maximize this window
– keeping lithography systems stable in a high-volume
manufacturing setting and leading to a higher yield
with more good wafers per day. Lithography is the
only step in the microchip manufacturing process in
which in-line adjustments can be made chip by chip
to optimize performance.
Our lithography systems are a hybrid of high-tech
hardware and advanced software. Without the system
and process control software we develop, it would be
impossible for our lithography systems to manufacture
the ever-smaller features in advanced microchips.
Our software products enable automated control
loops to maintain optimal operation of lithography
processes and therefore maximize yield.
|
||


Latest: Success with our TWINSCAN
EXE:5200B
In early April 2025, we shipped our
first TWINSCAN EXE:5200B system
– the successor to the TWINSCAN
EXE:5000 – ready to be used in high-
volume manufacturing. At 175 wafers
per hour, it offers 60% higher productivity
compared to the TWINSCAN EXE:5000
– thanks to an improved EUV light source
that delivers increased power at the
wafer level, translating to a higher system
throughput. The TWINSCAN EXE:5200B
also features improved projection optics,
developed in cooperation with our strategic
partner Carl Zeiss SMT, that maximize
imaging and overlay (layer-to-layer
alignment) performance.
|
|
ASML Annual Report 2025
|
19 |
Financial performance
|
Risk and security
|
Latest: TWINSCAN NXE:3800E reaches
full productivity specification
In 2025, we shipped TWINSCAN
NXE:3800E systems to our customers
at full specification, which includes 220
wafers-per-hour throughput – a 37%
improvement compared to the TWINSCAN
NXE:3600D – a higher-power light source,
new wafer handler, faster wafer stages and
high-power imaging control functionality.
We completed field upgrades to bring
systems that were already in customer
fabs to the same specifications. The rollout
across the installed base remains on track.
|
|
Latest: TWINSCAN XT:260
The TWINSCAN XT:260, the latest addition
to our i-line portfolio, combines high
throughput with the imaging accuracy of
a scanner. It offers up to four times higher
productivity compared to existing solutions,
making it a cost-effective technology to
support our customers in 3D integration
applications, including advanced packaging,
as well as other emerging technologies,
such as image sensors, displays and
photonics. Contributing to that high
throughput is a new high-transmission lens
with 2x, rather than 4x, reduction that
enables the system to print on a larger area
of a wafer in a single exposure. The XT:260
is unique in that it combines large-area
patterning with a scanner exposure
approach that enables better imaging and
overlay correction than a stepper. The
system integrates easily with other ASML
systems in our customers’ fabs, for fast,
seamless adoption into production.
|
|

ASML Annual Report 2025
|
20 |
Financial performance
|
Risk and security
|
Latest: YieldStar 550 and YieldStar 1390
The YieldStar 500 has achieved broad
acceptance among our leading customers,
providing advanced pre-etch overlay control
with improved cost of technology and
performance in matching and accuracy.
Building on this success, the YieldStar 550
is designed to further improve matching
and accuracy while maintaining productivity
– even when utilizing multi-wavelength
recipes – to ensure process robustness
for overlay. Early-access packages have
been delivered to customers for initial
qualification on next-generation nodes,
with phase 1 of the product scheduled
for release in 2026.
The first YieldStar 1390 was shipped in
2025, featuring a higher-power light source
and advanced software to accelerate
recipe setup. With increased throughput
from faster optical metrology, the YieldStar
1390 is positioned to drive broader customer
adoption for after-etch overlay control
by delivering superior performance and
cost effectiveness.
|
|
Latest: HMI eScan 1100
The HMI eScan1100 is our first multibeam
inspection system featuring 25 beams for
large wafer coverage and high throughput.
It offers industry-leading application
coverage for electrical and patterning
defects, delivering 10 times higher
throughput than single-beam systems
for advanced Logic and DRAM.
This capability enables full wafer fingerprint
capture (scanning multiple microchips
across the wafer to create a detailed defect
map) within acceptable inspection times
and accelerates yield learning by moving
insights forward up to one and a half
months compared to end-of-line electrical
probe tests. Within the context of defect
type and layer, the eScan1100 speeds up
root-cause analysis beyond probe-based
methods. Industry-wide adoption of voltage
contrast for product monitoring is driving
strong demand for multibeam
inspection systems.
|
|
 |
ASML Annual Report 2025
|
21 |
Financial performance
|
Risk and security
|
Latest: Enhanced computational
lithography solutions for High NA EUV
In 2025, we enhanced our solutions for
High NA EUV with source, mask and
wavefront co-optimization; model
capability and accuracy improvements;
optical proximity correction (OPC); and
curvilinear OPC performance enhancements.
Machine learning and AI continue to
enable these advanced techniques by
delivering accuracy and speed.
|
||
 | ||


1.Macroeconomic and
geopolitical trends
|
||
2.Megatrends
|
||
3.Semiconductor industry
market developments
|
||
4.The forces impacting
our strategy
|
1. Macroeconomic and geopolitical trends
|
Economic outlook |
|
Global geopolitics – technological
and AI sovereignty
|

b
r
|
1. Macroeconomic and geopolitical trends (continued)
|
Global geopolitics – export controls |
2. Megatrends
|
|
Key megatrends impacting the semiconductor marketplace |
Connected
world
|
||
•Artificial intelligence
•Hyperconnectivity
•Cloud infrastructure
•Internet of Things
|
||
Climate change
and resource scarcity
|
||
•Energy transition
•Electrification and smart mobility
•Agricultural innovation
•Smarter use of limited resources
|
||
Social and
economic shifts
|
||
•Working and learning remotely
•Healthcare and medical tech
•Technological and AI sovereignty
•Automation
|
||

2. Megatrends (continued)
|
Connected world |
|
 |
 |
 |
 |
Climate change and resource scarcity |
|
 |
 |

2. Megatrends (continued)
|
Climate change and resource scarcity (continued) |
|
 |
 |
Social and economic shifts |
|
|
 |
 |

3. Semiconductor industry market developments |
|
Logic and Memory markets explained |

4. The forces impacting our strategy |
Maintaining customer trust requires focus on innovation,
cost, quality, response time and sustainability.
|
We need to manage complexity in systems and processes
and strengthen our sites, supply chain and people.
|
The virtuous cycle of Moore’s Law continues – potentially
accelerated further by AI.
|
Geopolitical volatility requires a more robust approach to
support our customers and people.
|
The industry pushes against the limits of scaling and uses
a widening array of levers to increase density.
|
Success and systemic relevance have increased our
responsibility to society.
|

ASML Annual Report 2025
|
28 |
Financial performance
|
Risk and security
|

ASML Annual Report 2025
|
29 |
Financial performance
|
Risk and security
|
1 |
||
Deepen
customer
trust
|
||
Consistently deliver innovative,
high-quality and reliable holistic
lithography solutions that foster
long-term customer partnerships
and set industry standards
for excellence
|

ASML Annual Report 2025
|
30 |
Financial performance
|
Risk and security
|
 |
Read more |
ASML Annual Report 2025
|
31 |
Financial performance
|
Risk and security
|

2 |
||
Extend our
technology
and holistic
product
leadership
|
||
Integrate hardware, software
and emerging solutions to create
industry-defining products for
our stakeholders
|
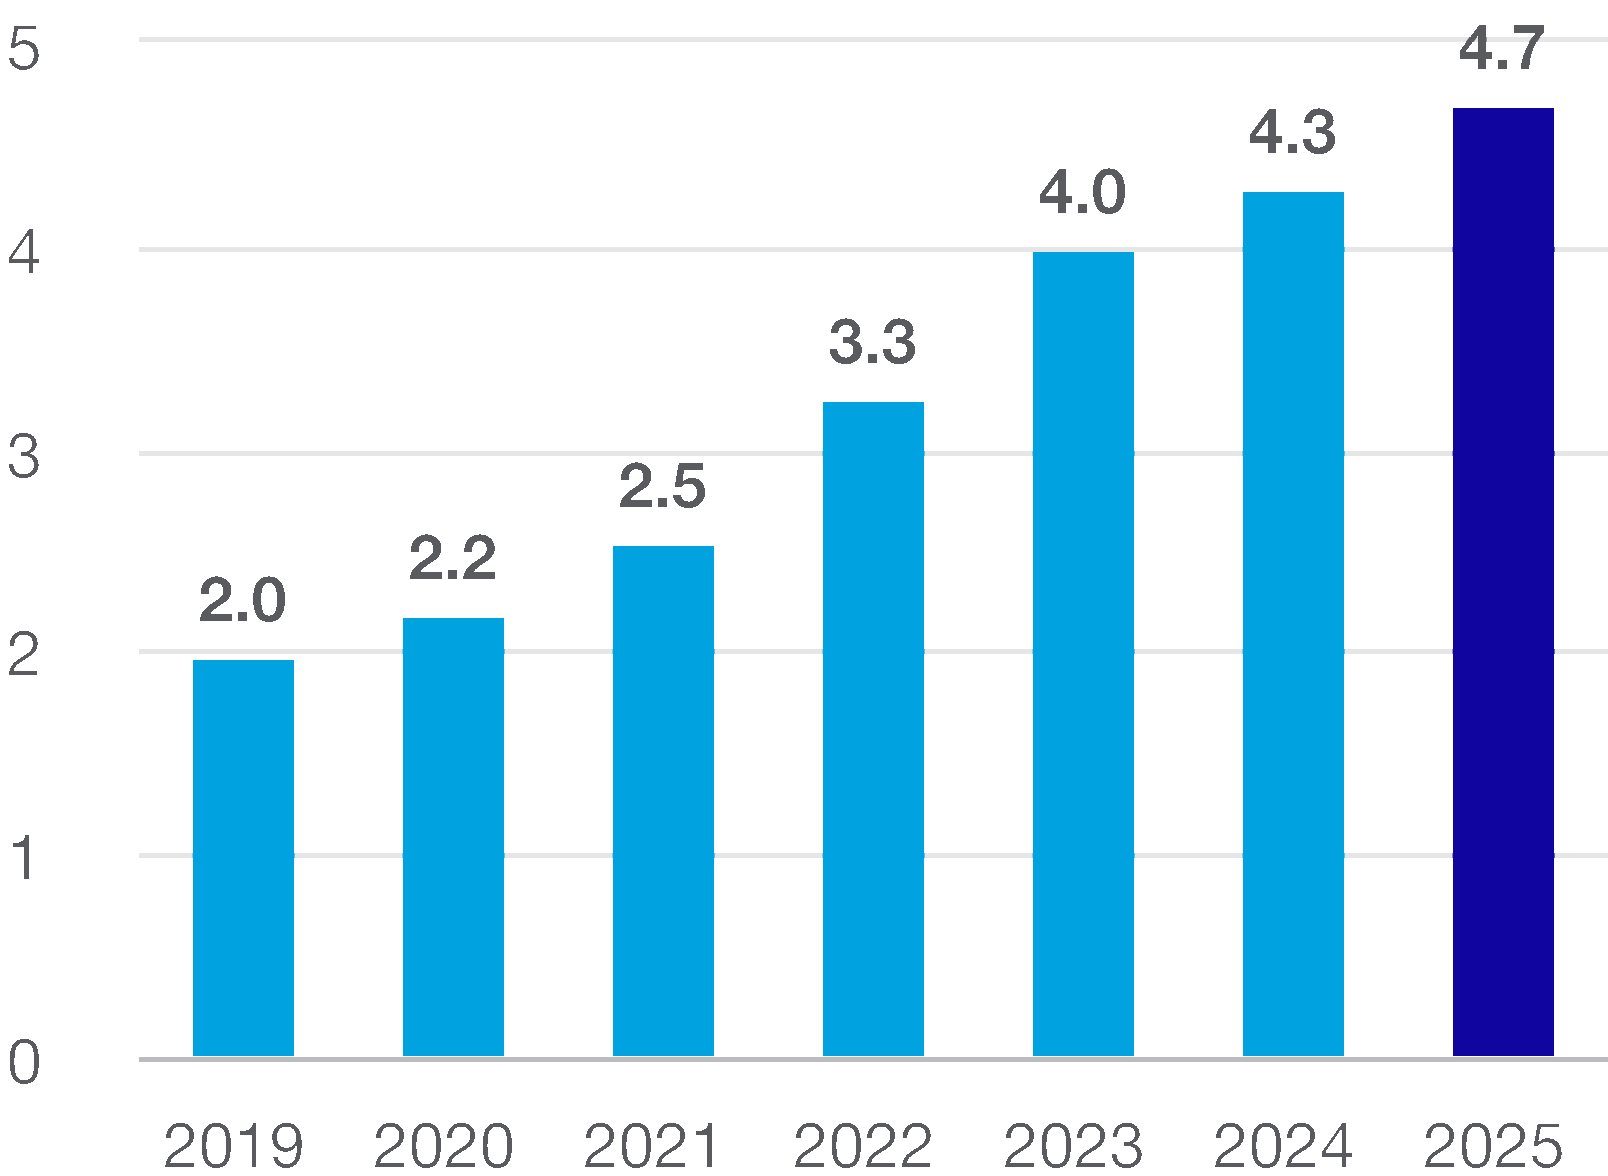
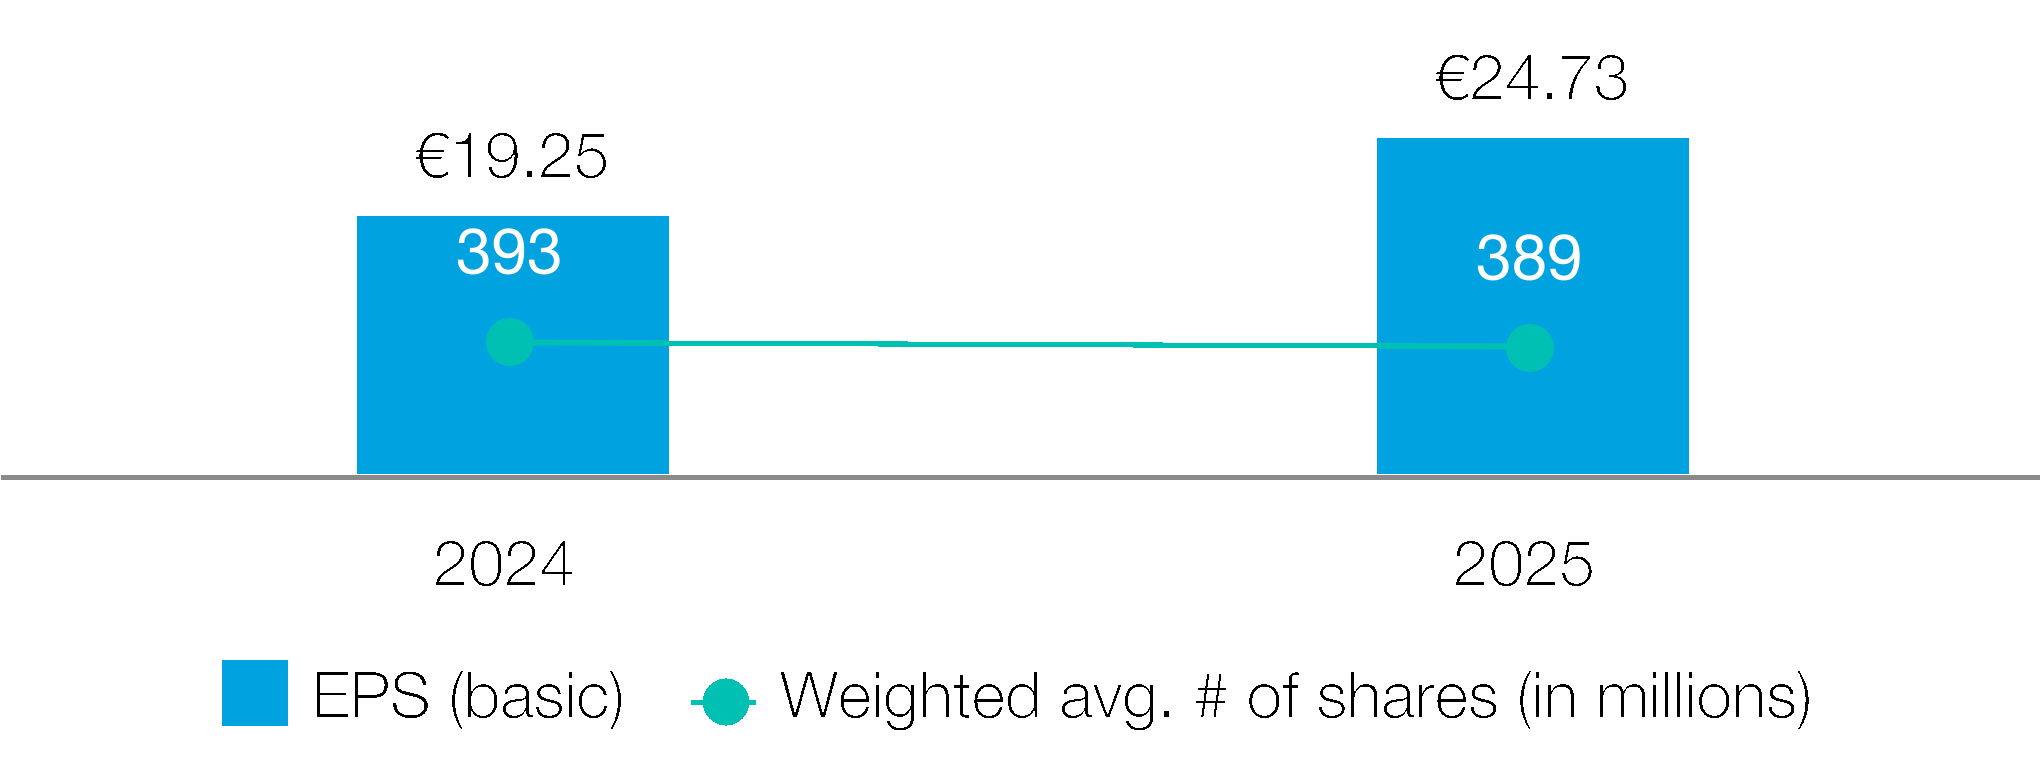
Research and development (in € billions) |

ASML Annual Report 2025
|
32 |
Financial performance
|
Risk and security
|
|
Read more |
ASML Annual Report 2025
|
33 |
Financial performance
|
Risk and security
|

3 |
||
Strengthen
ecosystem
relationships
|
||
Collaborate with suppliers,
academic partners and industry
leaders to foster innovation,
resilience and shared success
across the value chain
|

ASML Annual Report 2025
|
34 |
Financial performance
|
Risk and security
|
|
Read more |
ASML Annual Report 2025
|
35 |
Financial performance
|
Risk and security
|

4 |
||
Create an
exceptional
workplace
|
||
Foster inclusivity, support
talent development and cultivate
a culture where all employees
thrive and contribute to long-
term success
|

ASML People strategy |
Develop a
scalable and
sustainable
organization
|
Build a
workplace
that works
for everyone
|
Exceptional
talent,
exceptional
workplace
|

ASML Annual Report 2025
|
36 |
Financial performance
|
Risk and security
|
|
Read more |
ASML Annual Report 2025
|
37 |
Financial performance
|
Risk and security
|

5 |
||
Drive
operational
excellence
|
||
Drive continuous improvement,
efficiency and integrity to ensure
high performance, quality
and resilience throughout
the organization
|


ASML Annual Report 2025
|
38 |
Financial performance
|
Risk and security
|
|
Read more |
ASML Annual Report 2025
|
39 |
Financial performance
|
Risk and security
|

6 |
||
Deliver
on ESG
sustainability
|
||
Drive progress in environmental,
social and governance issues
important to ASML and our
stakeholders
|

ASML Annual Report 2025
|
40 |
Financial performance
|
Risk and security
|
|
Read more |

ASML Annual Report 2025
|
41 |
Financial performance
|
Risk and security
|
People and culture |
||||
 |
We depend on more than 44,000 talented,
dedicated and motivated employees who
live our values of challenge, collaborate and
care. Every day, our colleagues in R&D,
manufacturing, customer support, sourcing
and supply chain, and support functions, are
empowered to take on the exciting challenge
of building and maintaining the most
advanced lithography, metrology and
inspection systems in the world.
|
|||
Capital |
||||
 |
We have strong capital reserves,
underpinned by a robust balance sheet.
Total shareholder equity at the end of 2025
amounts to €19.6 billion on a consolidated
balance sheet total of €50.6 billion and
net cash provided by
operating activities of
€12.7 billion in 2025.
|
|||

Manufacturing facilities |
||||
 |
We have eight factories in Europe, the US
and Asia that provide high-precision, highly
controlled environments where we assemble,
test and deliver our complex lithography and
metrology and inspection portfolio, from
prototype to final product.
|
|||
Innovation |
||||
 |
In 2025, total R&D was €4.7 billion. But we
do not innovate alone – our more than 16,000
R&D employees collaborate closely within
an innovation ecosystem of key partners in
the value chain.
Our lithography solutions are the result of
strong partnerships based on trust, respect,
and shared risks and incentives to compete
and drive innovation.
|
|||

How we create
sustainable long-term
value throughout the
semiconductor
value chain.
As a leading provider of
holistic lithography solutions,
we deliver value throughout
the semiconductor value
chain. Our comprehensive
lithography portfolio enables
cost-effective microchip
scaling and supports our
customers’ technology
roadmaps.
|

ASML Annual Report 2025
|
43 |
Financial performance
|
Risk and security
|
Customers |
|
Our world-leading lithography
systems enable our customers
to develop ever-more-powerful
and energy-efficient chips for new
applications and devices. At the
same time, we help our customers
reduce their costs and
environmental footprint.
|
|
€32.7bn
Total net sales
|
|
2024: €28.3bn
|
|
535
System sales in units
|
|
2024: 583
|
|
88%
Customer satisfaction
survey score
|
|
2024: 86%
|
Employees |
|
ASML is a growing business
providing employment
opportunities around the world.
We invest in people’s career
development and well-being,
and aim to provide a diverse and
inclusive environment where they
can achieve their full potential.
|
|
78.9%
Employee engagement score
(three-year rolling average)
|
|
2024: 78.9%
|
|
21%
Women in our workforce
(headcount)
|
|
2024: 21%
|
|
4.1%
Attrition rate
|
|
2024: 3.8%
|
Suppliers |
|
Our suppliers help deliver our
innovations and are critical to
our value chain and our ambition
to be a sustainable leader in the
semiconductor industry. Long-term
relationships, close collaboration,
transparency and a commitment
to sustainability with our suppliers
are key to our success.
|
|
5,100
Total number of suppliers
|
|
2024: 5,150
|
|
90%
Responsible Business Alliance
(RBA) self-assessment
completed (in %)
|
|
2024: 91%
|
|
100%
Suppliers with overall high
risk evaluated and follow-up
agreed (in %)
|
|
2024: 100%
|
Shareholders |
|
Effective and disciplined
investment of cash flow drives the
profitable growth of our company,
and can deliver solid financial
performance and a healthy
financial position. This underpins
our ability to return cash to
shareholders through growing
dividends and share buybacks.
|
|
€12.7bn
Net cash provided by
operating activities
|
|
2024: €11.2bn
|
|
€7.50
Proposed annualized
dividend per share
|
|
2024: €6.40
|
|
€5.9bn
Share buyback
|
|
2024: €0.5bn
|
Society |
|
We play an active role in the
communities where we operate –
recognizing that, when the
community thrives, so do we.
We believe our collaborative
ecosystem nurtures innovation and
benefits society. For example, we
share our expertise with universities
and research institutes,
|
|
€1,750
Amount invested in communities
(per employee), including
employee giving
|
|
2024: €1,084
|
|
€20.6m
Contribution to
EU research projects
|
|
2024: €18.9m
|
|
11.5 Mt
Net scope 3 CO2e emissions
|
|
2024: 12.0 Mt
|
support young tech companies
and promote science, technology,
engineering and mathematics
(STEM) education worldwide.
We are also committed to creating
sustainable value by reducing our
environmental footprint – both from
our operations and during the use
of our products and services.
|
90%
Reuse rate of parts returned
from field and factory
|
2024: 88%
|
0 kt
Net1 scope 1 and 2
CO2e emissions
|
2024: 33 kt
|
1. Net scope 1 and 2 CO2e emissions result
from compensating for residual emissions
and do not represent our gross emissions.
|


Customers |
88%
Customer satisfaction survey score
|

Employees |
90%
of new colleagues starting in 2025 indicated
they had a positive onboarding experience
|
52%
of our employees have been in the company
less than five years
|
28%
of our employees today are not nationals of
the country they work in
|

Suppliers |
By partnering closely with and
supporting our suppliers, we
aim to ensure they’re prepared
to work with us for years to
come – and to weather the
changes the chip industry is
known for, including periods
of rapid growth and business-
cycle fluctuations.
|

Shareholders |
€8.5bn
Returned to shareholders through dividends
and share buybacks in 2025.
|

Society |
ASML’s Societal Conference – building community connections |
||||
The Societal Conference is ASML’s annual event
to highlight and enhance societal engagement with
public partners. The 2025 conference – its second
edition – focused on ‘Broad Prosperity & Collaboration
in Brainport’, exploring the links between economic
growth, social resilience and shared responsibility.
It serves as a platform for reflection, dialogue and
encouraging joint action within the region.
|
We invited representatives from business, local
and national government, and societal partners –
with 267 registrations in total.
|
|||

ASML Annual Report 2025
|
51 |
Financial performance
|
Risk and security
|
Roger Dassen
Executive Vice President and Chief Financial Officer
|
|
ASML Annual Report 2025
|
52 |
Financial performance
|
Risk and security
|
€32.7bn |
Total net sales |
52.8% |
Gross margin |
€8.5bn |
Returned to
shareholders
|

ASML Annual Report 2025
|
53 |
Financial performance
|
Risk and security
|

Sales |
Profitability |
Liquidity |
|||||||||
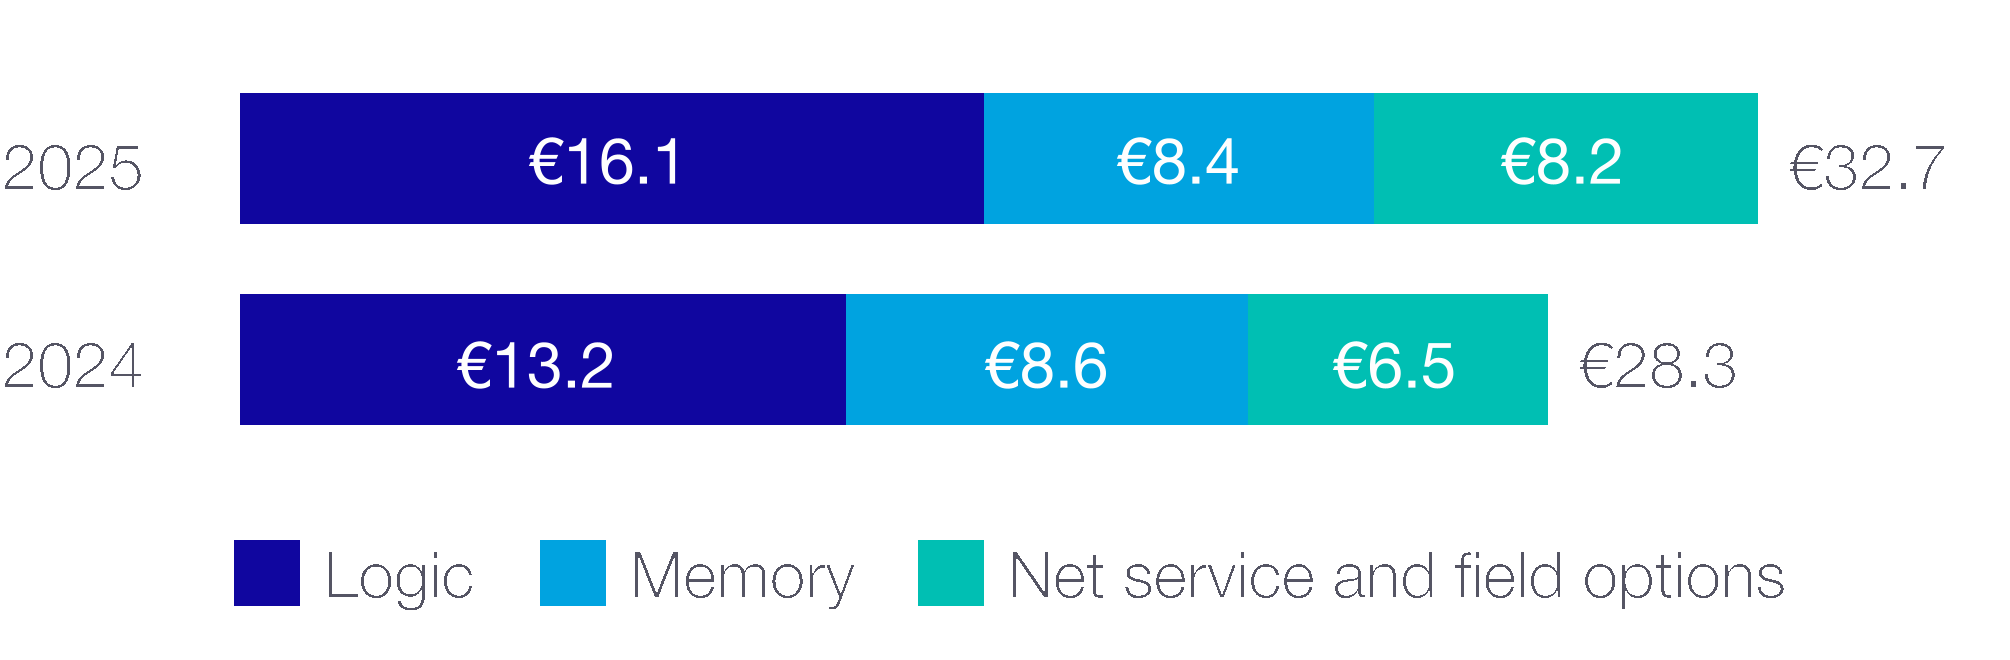
Total net sales |
Gross profit |
% of total net sales |
Cash and cash equivalents and short-term investments (year end) |
||||||||
€32.7bn |
€17.3bn |
52.8% |
€13.3bn |
||||||||
2024: €28.3bn
|
2024: €14.5bn
|
2024: 51.3%
|
2024: €12.7bn
|
||||||||
Net system sales |
Income from operations |
Net cash provided by operating activities |
|||||||||
€24.5bn |
€11.3bn |
34.6% |
€12.7bn |
||||||||
2024: €21.8bn
|
2024: €9.0bn
|
2024: 31.9%
|
2024: €11.2bn
|
||||||||
Net service and field option sales |
Net income |
Free cash flow2
|
|||||||||
€8.2bn |
€9.6bn |
29.4% |
€11.0bn |
||||||||
2024: €6.5bn
|
2024: €7.6bn
|
2024: 26.8%
|
2024: €9.1bn
|
||||||||
Sales of lithography systems (in units)1
|
Earnings per share (basic) |
||||||||||
327 |
€24.73 |
||||||||||
2024: 418
|
2024: €19.25
|
||||||||||
EUV systems recognized (in units) |
|||||||||||
48 |
|||||||||||
2024: 44
|
1. |
Lithography systems do not include metrology and inspection systems. |
|||||||||
2. |
Free cash flow is a non-GAAP measure and is defined as net cash provided by operating activities (2025: €12,658.5 million and 2024: €11,166.2 million) minus purchase of property,
plant and equipment (2025: €1,573.6 million and 2024: €2,067.2 million) and purchase of intangible assets (2025: €57.6 million and 2024: €15.9 million). We believe that free cash flow
is an important liquidity metric for our investors, reflecting cash that is available for acquisitions, to repay debt and to return money to our shareholders by means of dividends and share
buybacks. Purchase of property, plant and equipment and purchase of intangible assets are deducted from net cash provided by operating activities in calculating free cash flow because
these payments are necessary to support the maintenance and investments in our assets to maintain the current asset base.
|
||||||||||
Operating results of 2025 compared to 2024
|
Year ended December 31 (€, in millions) |
2024 |
%1
|
2025 |
%1
|
% Change |
Net system sales |
21,768.7 |
77.0 |
24,474.3 |
74.9 |
12.4 |
Net service and field option sales |
6,494.2 |
23.0 |
8,193.0 |
25.1 |
26.2 |
Total net sales |
28,262.9 |
100.0 |
32,667.3 |
100.0 |
15.6 |
Cost of system sales |
(10,406.9) |
(36.8) |
(11,384.0) |
(34.8) |
9.4 |
Cost of service and field option sales |
(3,364.0) |
(11.9) |
(4,025.3) |
(12.3) |
19.7 |
Total cost of sales |
(13,770.9) |
(48.7) |
(15,409.3) |
(47.2) |
11.9 |
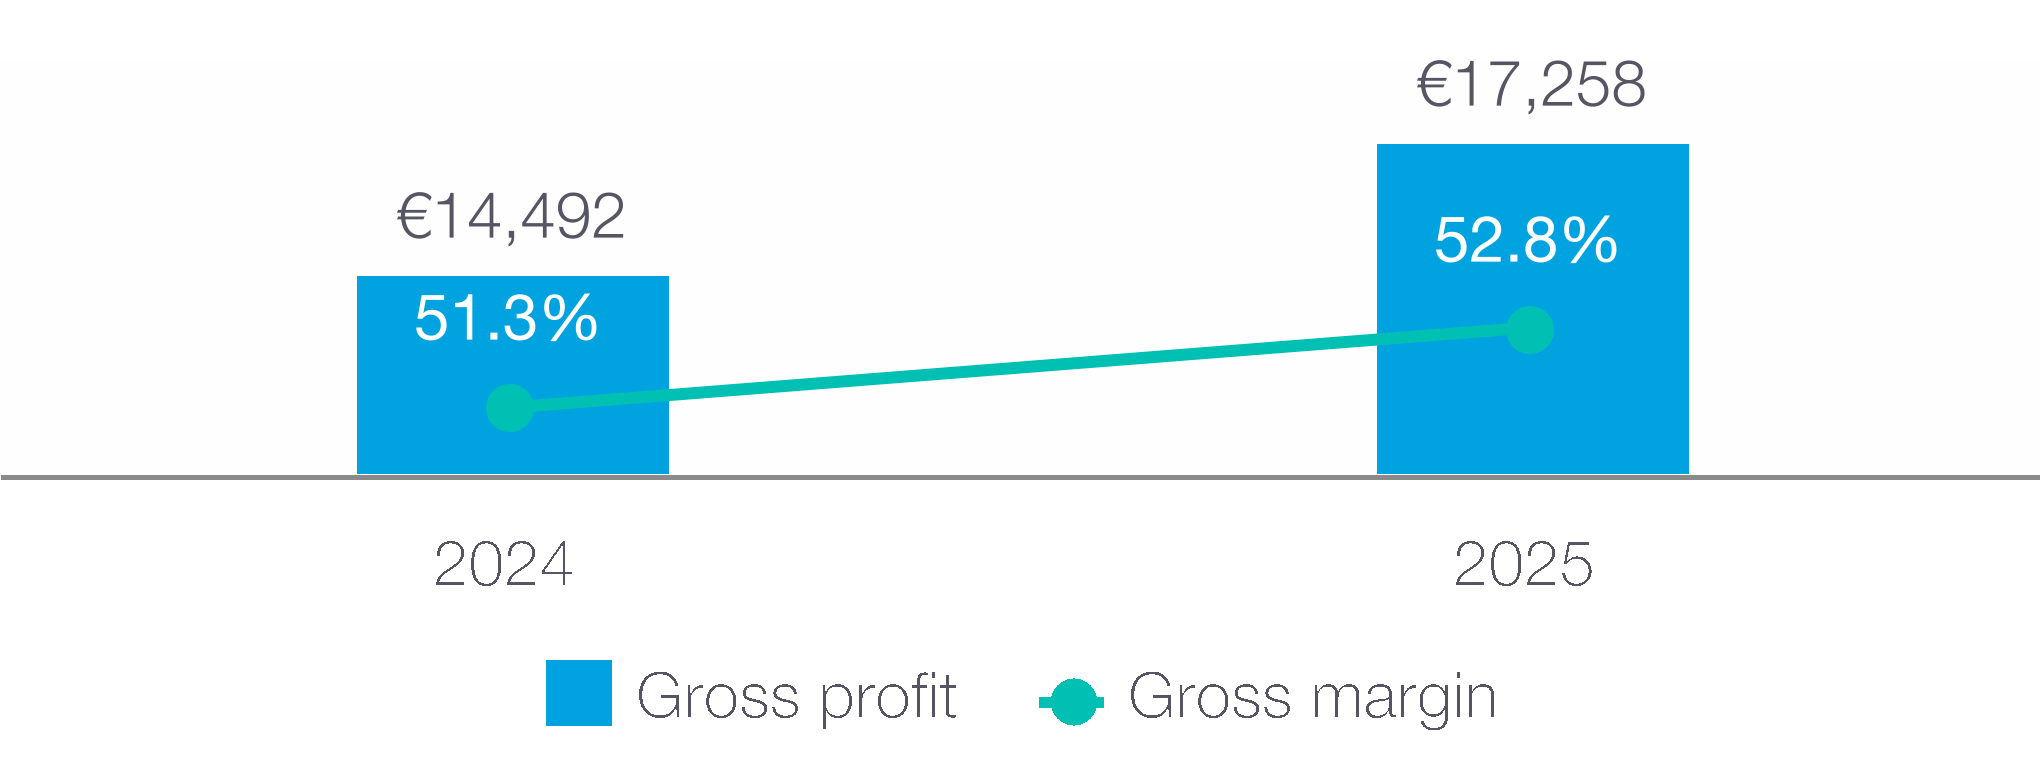
Gross profit |
14,492.0 |
51.3 |
17,258.0 |
52.8 |
19.1 |
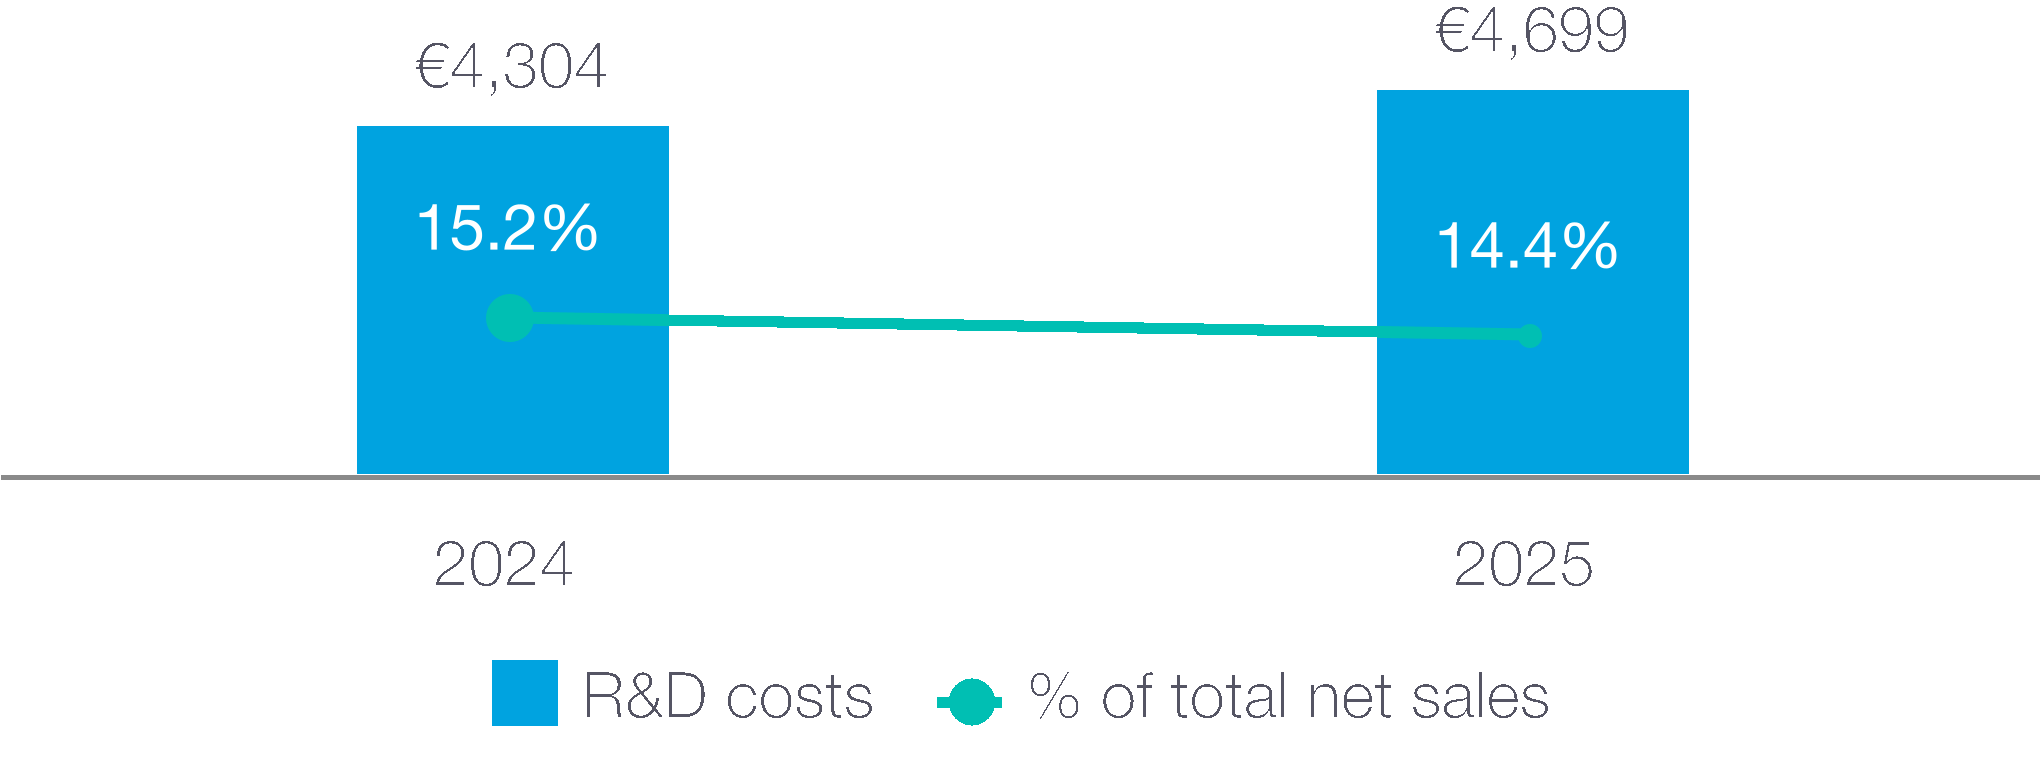
Research and development (R&D) costs |
(4,303.7) |
(15.2) |
(4,698.8) |
(14.4) |
9.2 |
Selling, general and administrative (SG&A) costs |
(1,165.7) |
(4.1) |
(1,257.8) |
(3.9) |
7.9 |
Income from operations |
9,022.6 |
31.9 |
11,301.4 |
34.6 |
25.3 |
Interest and other, net |
19.8 |
0.1 |
104.7 |
0.3 |
428.8 |
Income before income taxes |
9,042.4 |
32.0 |
11,406.1 |
34.9 |
26.1 |
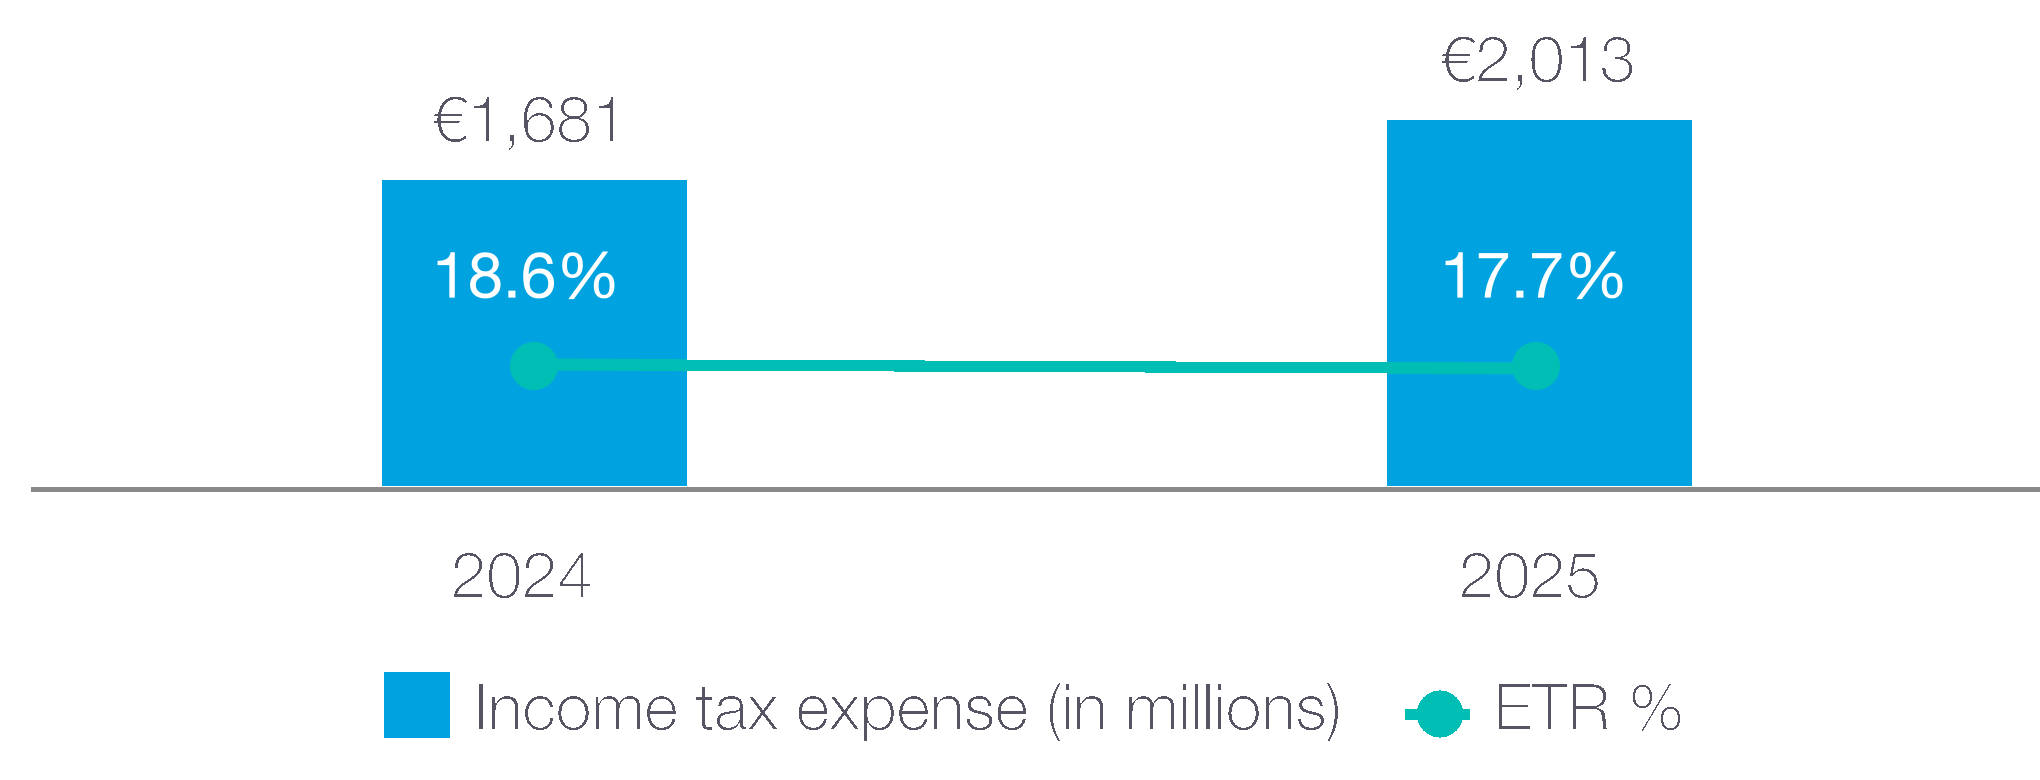
Income tax expense |
(1,680.6) |
(5.9) |
(2,013.4) |
(6.2) |
19.8 |
Income after income taxes |
7,361.8 |
26.0 |
9,392.7 |
28.8 |
27.6 |
Profit from equity method investments |
209.8 |
0.7 |
216.7 |
0.7 |
3.3 |
Net income |
7,571.6 |
26.8 |
9,609.4 |
29.4 |
26.9 |
For a comparison of ASML’s operating results for the year ended December 31, 2024, with the year ended
December 31, 2023, please see Financial performance – Performance KPIs – Operating results of 2024
compared with 2023 of ASML’s Annual Report on Form 20-F for the year ended December 31, 2024.
|
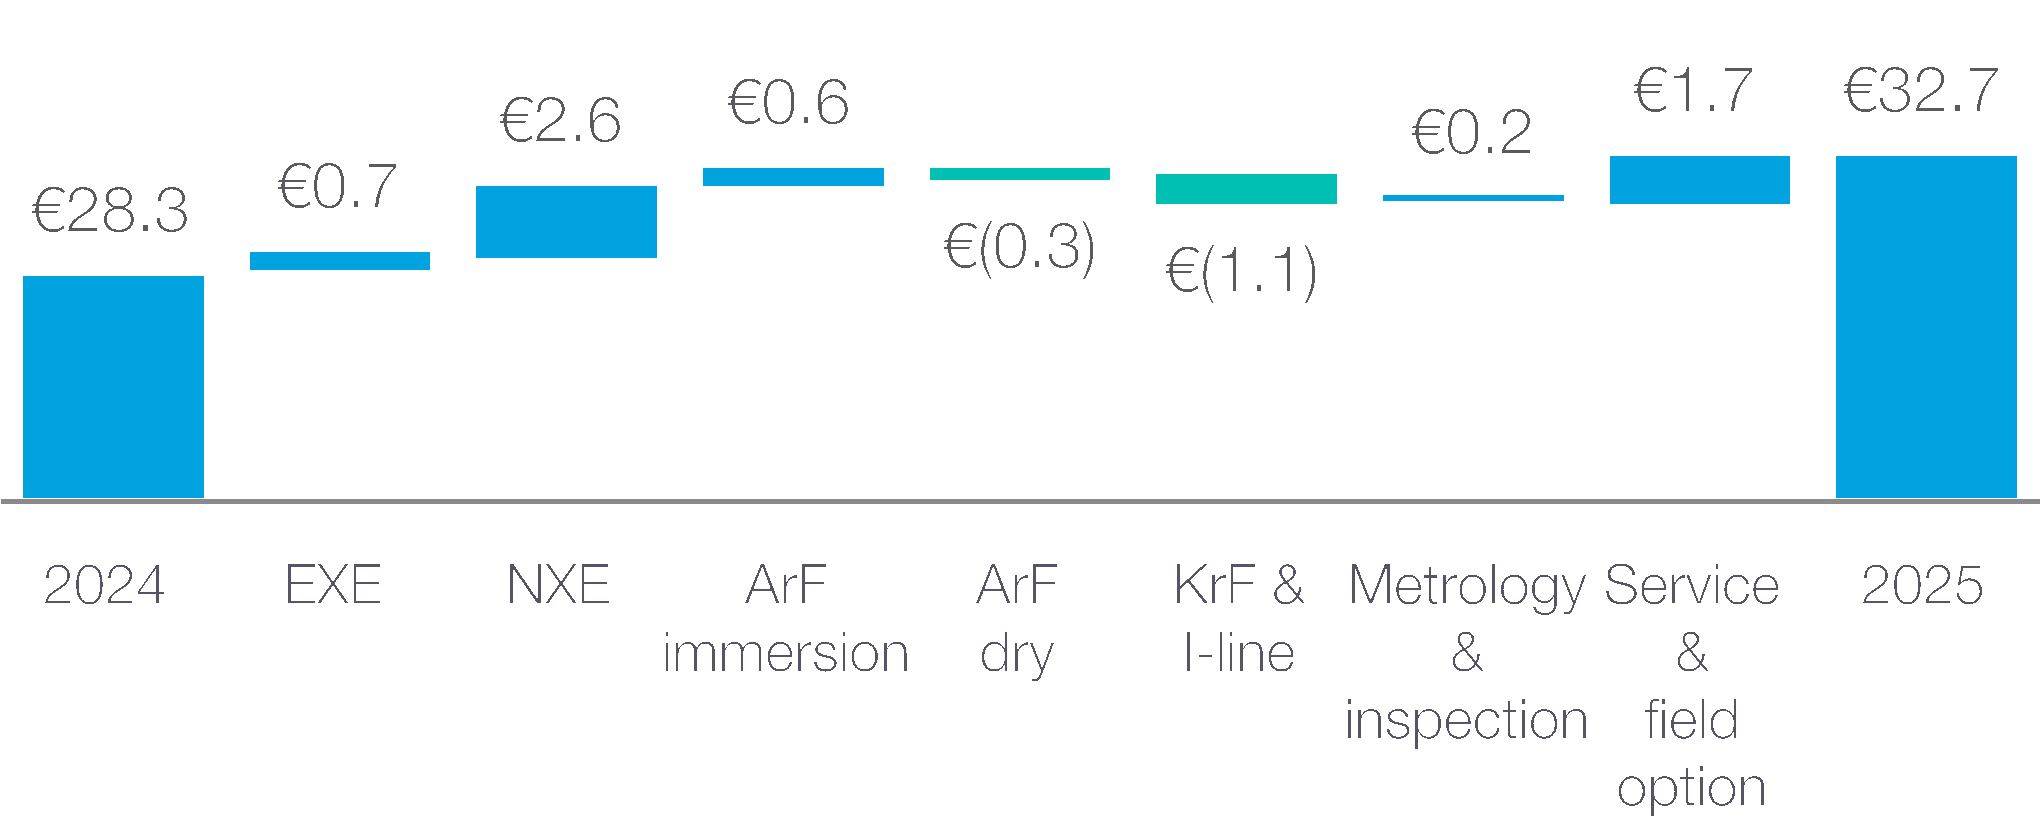
Total net sales growth (in billions) |
15.6% |
Net sales |
12.4% |
Net system sales |
26.2% |
Net service and field
option sales
|
Net sales (in billions)
|
Gross profit (in millions) and gross margin (in %)
|
Research and development costs (in millions)
|
Selling, general and administrative costs (in millions)
|

Income taxes (in millions)
|
Net income and earnings per share |

Year ended December 31 (€, in millions) |
2024 |
2025 |
Cash and cash equivalents, beginning of period |
7,004.7 |
12,735.9 |
Net cash provided by (used in) operating activities |
11,166.2 |
12,658.5 |
Net cash provided by (used in) investing activities |
(2,609.3) |
(3,777.8) |
Net cash provided by (used in) financing activities |
(2,832.1) |
(8,670.5) |
Effect of changes in exchange rates on cash |
6.4 |
(30.1) |
Net increase (decrease) in cash and cash equivalents |
5,731.2 |
180.1 |
Cash and cash equivalents, end of period |
12,735.9 |
12,916.0 |
Short-term investments, end of period |
5.4 |
405.9 |
Cash and cash equivalents and short-term investments |
12,741.3 |
13,321.9 |
Purchases of property, plant and equipment and intangible assets |
(2,083.1) |
(1,631.2) |
Free cash flow1 (Non-GAAP measure)
|
9,083.1 |
11,027.3 |
Long-term models as presented
at 2024 Investor Day
|
||||
 |
||||
Total sales opportunity (in €bn) |
2024
Investor
Day
|
|||
Sales
2030
|
||||
High scenario |
||||
EUV sales |
32 |
|||
Non-EUV sales (lithography and M&I*) |
15 |
|||
Installed base management** |
13 |
|||
Total |
60 |
|||
Moderate scenario |
||||
EUV sales |
26 |
|||
Non-EUV sales (lithography and M&I*) |
14 |
|||
Installed base management** |
12 |
|||
Total |
52 |
|||
Low scenario |
||||
EUV sales |
22 |
|||
Non-EUV sales (lithography and M&I*) |
11 |
|||
Installed base management** |
11 |
|||
Total |
44 |
|||
* M&I: Metrology and inspection.
** Installed base management equals our net service and field
option sales.
|
||||

ASML Annual Report 2025
|
61 |
Financial performance
|
Risk and security
|
Q |
Why is it so important for
ASML to manage risks?
|
Q |
How does ASML manage its
risks at an organizational level?
|
Q |
What is the main purpose of
risk management at ASML?
|
Q |
Could you explain the structure
of the ERM process at ASML?
|
Q |
What exactly is the ASML
risk universe?
|
Q |
How does ASML adapt to
new and emerging risks?
|

ASML Annual Report 2025
|
62 |
Financial performance
|
Risk and security
|
Q |
What are examples of
risks ASML faces in today’s
global landscape?
|
Q |
How do economic
uncertainties and market
volatility impact ASML?
|
Q |
Why is information protection
so important for ASML?
|
Q |
What growth challenges
is ASML encountering as
it looks to the future?
|
ASML Annual Report 2025
|
63 |
Financial performance
|
Risk and security
|

Risk management governance structure |
|||||||||
Supervisory Board |
Audit Committee |
||||||||
Request to investigate
specific risk topics
|
•Deep dives on
selected topics
•Risk topics feedback
|
•Assertion on control
effectiveness
•Quarterly progress reporting
|
|||||||
Board of Management |
|||||||||
Compliance, Ethics, Security and Risk
Committee (CESR)
Risk oversight
|
Disclosure Committee
Internal Control Committee
|
||||||||
•Risk appetite
•Risk management policy
•CESR sub-committees
(governance)
|
•Risk assessment results
•Risk response progress
•Incidents
|
•Control effectiveness
|
|||||||
Risk owners |
|||||||||

Risk assessment |
Risk response |
|||
Top-down risk assessment
CESR / Risk owners / Emerging risks
|
Coordination and follow-up
Risk owners
|
|||
Risk identification |
Risk landscape |
Risk appetite |
Risk analysis |
||
Risk evaluation |
Risk treatment |
Bottom-up risk assessment
Business
|
Execution
Action owners
|
Risk type | |||
 |
Strategic |
 |
Compliance |
 |
Operations |
 |
Other |
 |
Finance and reporting |
||
Overview of risk factors | |
Risk
type
|
Risk factor |
|
|
|
|
|
|
|
|
|
|
|
|
|
|
|
|
|
|
|
|
|
|
|
|
|
|
|
|
|
|
|
|
|
|
|
|
|
|
|
|
|
|
|
|
|
|
|
|

The risk factors outlined in this section
are categorized into the following types:
Strategic, Operations, Finance and
reporting, Compliance, and Other.
Each of these risks, along with the
associated events described, could have
a material adverse impact on our business,
financial position, operating results,
and reputation. Additionally, there may
be risks currently unknown to us, or risks
we presently consider immaterial, that
could become significant over time.
Some of the factors and events discussed
may have occurred previously. Any such
disclosure does not constitute
a representation that such factors, events,
or contingencies have or have not occurred
in the past; it is provided because their
potential future occurrence could have a
material adverse effect on our business.
Moreover, many of these risks may be
exacerbated by global developments, such
as wars, geopolitical tensions, inflation,
industry downturns, and international
responses – including new regulations
or tariffs – alongside broader adverse
economic and business conditions.
|
Strategic |
|||||||||||
|
Our future success depends on our ability to respond
in a timely manner to commercial and technological
developments in the semiconductor industry
|
The success of new product introductions is
uncertain and depends on our ability to
successfully execute our R&D programs
|
We face intense competition |
||||||||||
Our ability to develop new technologies and improve existing ones
– across products and services – relies on several key factors.
These include the success of our own and our suppliers’ R&D
efforts, as well as our ability to complete product development
and design efficiently and ahead of competitors.
If the technologies we pursue to help customers produce
smaller, more energy-efficient chips are less effective or more
costly than those of our competitors, our business could be
negatively impacted. Similarly, if customers choose not to adopt
our innovations or shift toward architectures that rely less on
lithography, our competitive position may weaken. For instance,
the success of our EUV 0.55 NA (High NA) technology – which
we view as essential to advancing Moore’s Law – depends on
continued technical progress by both us and our suppliers.
We invest heavily in developing and launching new and enhanced
technologies, products, and services. If these efforts fail, or if
customers do not adopt them, or if alternative solutions gain
traction, our competitive edge and financial returns may suffer.
This could also lead to impairment charges on capitalized
technologies, including prototypes, or costs related to obsolete
inventory – especially as technological complexity increases.
Due to the high complexity and cost of our systems, customers
may opt for existing technologies over newer ones, or delay
investments if they are not economically justified or aligned
with their product cycles.
Moreover, global economic conditions and fluctuations in the
semiconductor market influence customer investment decisions,
creating uncertainty around the timing and demand for new
systems. This can slow the overall transition to new nodes
and technologies.
Finally, we rely on our suppliers to maintain their development
roadmaps. Any delays – whether due to technical challenges,
financial constraints, or other factors – can hinder our ability
to meet our own development timelines.
|
As our products become more complex, the cost and time
required to develop new products and technologies continue to
rise – a trend we expect to persist. Developing new technologies
demands substantial R&D investments from both ASML and our
suppliers. Suppliers may be unable or unwilling to commit the
necessary resources for continued (co-)development, which has
led and can continue to lead to ASML funding these R&D efforts
or limiting our own investment capacity.
If our R&D initiatives fail to deliver the desired technologies on
time or at all, we may struggle to launch new products, services,
or innovations – and risk not recovering our R&D expenditures.
Additionally, during periods of high customer demand, we may
need to prioritize production over R&D activities which may hinder
the advancement or success of new product introductions.
|
The semiconductor equipment industry is highly competitive.
Our competitiveness depends on our ability to develop new and
enhanced products and services that bring value to our customers
and are competitively priced and introduced on a timely basis – as
well as our ability to protect and defend our intellectual property,
trade secrets or other proprietary information.
We compete primarily with Canon and Nikon in respect of DUV
systems. Both have substantial financial resources and broad
patent portfolios. Each continues to offer products that compete
directly with our DUV systems, which may impact our sales or
business. In addition, adverse market conditions, long-term
overcapacity or a decrease in the value of the Japanese yen in
relation to the euro have increased and could continue to increase
price-based competition, resulting in lower prices and lower
sales and margins.
We also face competition from new competitors with substantial
financial resources, as well as from those driven by the ambition
of self-sufficiency in the geopolitical context. Furthermore, we
may face competition from alternative technological solutions
or semiconductor manufacturing processes.
We also compete with providers of applications that support or
enhance complex patterning solutions, such as Applied Materials
Inc. and KLA-Tencor Corporation. These applications compete
with our offerings, which is a significant part of our business.
|
||||||||||
Strategic (continued) |
||||||||||||||
|
The semiconductor industry can be cyclical, and we may be adversely affected by any downturn |
We derive most of our revenues from the sale of a
relatively small number of products
|
Failure to adequately protect intellectual property
could harm our business
|
||||||||||||
The semiconductor industry has historically been cyclical. As
a supplier to the global semiconductor industry, we are subject
to its business cycles. The timing, duration and volatility are difficult
to predict and can have a significant impact on semiconductor
equipment manufacturers including ASML. Newer entrants to the
industry, including Chinese semiconductor manufacturers, could
increase the risk of cyclicality in the future. Certain key end-market
customers – Logic and Memory – exhibit different levels of
cyclicality and different business cycles. Cyclicality may be
worsened by the geopolitical situation – for example, if countries
increase semiconductor capacity for higher levels of self-
sufficiency, thereby creating global overcapacity.
Sales of our lithography systems, services and other holistic
lithography products depend in large part on the level of capital
expenditures by semiconductor manufacturers. These in turn
are influenced by industry cycles, the drive for technological
sovereignty and a range of competitive and other factors, including
semiconductor industry conditions and prospects. The timing and
magnitude of capital expenditures of our customers also impact
the available production capacity of the industry to produce chips,
which can lead to imbalances in the supply and demand.
Reductions or delays in capital expenditures by our customers,
or incorrect assumptions by us about our customers’ capital
expenditures, could adversely impact our business.
We make various assumptions about future demand in our
financial models and our capital expenditures and planning for
production capacity. To the extent that actual results prove to
be materially different from our assumptions, we may have
overcapacity, capacity constraints, or may have allocated capital
expenditure and resources to make products that are not in demand
by customers (at the expense of products that are in demand)
and our actual results could differ substantially from those implied
by our financial models.
|
Capital expenditures by our customers may not continue at
current levels and may decline. Capital expenditures by some
customers have declined compared to prior years and we have
experienced changes in timing of orders from certain customers,
and we are subject to uncertainty in future customer demand.
The global economic environment, including inflation, interest
rates and geopolitical events, contributes to this uncertainty.
An uncertain global economy frequently leads to reduced consumer
and business spending, and could cause our customers to decrease,
cancel or delay their orders – and we have experienced customers
scaling back their capacity additions. High interest rates and
volatility in financial markets could make it more difficult for our
customers to raise capital, whether debt or equity, to finance
their purchases of equipment, including the products we sell.
The foregoing could lead to reduced demand, which may
adversely affect our product sales and revenues and may
harm our business and operating results.
As we have significantly increased our organization in previous
years in terms of employees, infrastructure, manufacturing capacity
and other areas, it would be difficult to adjust our costs adequately
in a timely manner in the event of an industry downturn.
If we are unable to adapt appropriately and in a timely manner
to changes resulting from macroeconomic conditions, our business,
financial conditions or results of operations may be materially and
adversely affected.
|
We derive most of our revenues from the sale of a relatively small
number of lithography systems (327 units in 2025, 418 units in
2024 and 449 units in 2023). As a result, the timing of shipments
and recognition of system sales for a particular reporting period,
as a result of shipment delays or other factors, may have a material
impact on our results of operations in that period, and this impact
is greater as prices for our systems increase. In recent years, we
have used fast shipments for some customers, which allows us to
deliver systems more quickly by having some final testing and
formal acceptance carried out on customer sites instead of at our
own facilities. This typically leads to a delay of revenue recognition
for those shipments until formal customer acceptance, which can
impact comparability of our results of operations from period
to period.
In addition, our installed base revenues are impacted by the
number of systems we sell, and other factors; for example,
customers may perform more of these services themselves,
find other third-party suppliers to provide them, or we may be
limited by export control restrictions.
|
We rely on intellectual property (IP) rights such as patents, copyrights
and trade secrets to protect our proprietary technology. However, we
face the risk of such protective measures proving inadequate and we
could suffer material harm because, among other matters:
1.IP laws may not sufficiently support our proprietary rights or
may change adversely in the future.
2.Our agreements (e.g. confidentiality, licensing) with our
customers, employees and technology development partners
and others to protect our IP may not provide sufficient
protection or may be breached or terminated.
3.Patent rights may not be granted or interpreted as we expect.
4.Patent rights will expire, which may result in key
technology becoming widely available, which may
harm our competitive position.
5.The steps we take to prevent misappropriation or infringement
of our proprietary rights may not be successful.
6.IP rights can be difficult to enforce in countries where the
application and enforcement of the laws governing such
rights may not have reached the same level compared with
other jurisdictions where we operate.
7.Third parties may be able to develop or obtain patents for
our own or for similar competing technology.
Legal proceedings may be necessary to enforce our IP rights
and the validity and scope may be challenged by others. Any
such proceedings may result in substantial costs and diversion
of management resources, and, in the event of decisions
unfavorable to us in proceedings, could result in significant
costs or have a significant impact on our business.
We have experienced and may in the future experience
misappropriation attacks by third parties or our employees,
including theft of IP. Such incidents may result in third parties
or others, without authorization, obtaining, copying, using or
disclosing our IP, despite our efforts to protect our rights.
Our suppliers face similar risks which could have a
consequential impact on us.
|
|||||||||||
Strategic (continued) |
||||||||||||||
|
Defending against intellectual property claims
brought by others could harm our business
|
We are exposed to economic, geopolitical and other developments in our international operations. |
We may be unable to make desirable acquisitions,
to invest successfully, or to integrate successfully
any businesses we acquire
|
||||||||||||
In the course of our business, we have been and may be subject
to claims by third parties alleging that our products or processes
infringe upon their IP rights. If successful, such claims could limit
or prohibit us from developing our technology, and manufacturing
and selling our products.
Our customers may also be subject to claims of infringement
from third parties, including patent-holder companies, alleging
that our products used by such customers in the manufacturing
of semiconductor products and/or the processes relating to the
use of our products infringe on one or more patents issued to
such third parties. If such claims are successful, we could be
required to indemnify our customers for losses incurred by or
damages assessed against them as a result of such infringement.
We may incur substantial licensing or settlement costs to settle
claims or limit our exposure to the IP claims of third parties.
Patent litigation is complex and may extend for a protracted
period of time, giving rise to the potential for substantial costs
and diverting the attention of key management and technical
personnel. Potential adverse outcomes from patent litigation may
include payment of significant monetary damages, injunctive relief
prohibiting our manufacturing, exporting or selling of products,
reputational damage and/or settlement involving significant
payments by us.
|
Our business is subject to a range of export control restrictions,
sanctions, tariffs, and broader international trade regulations that
affect our ability to deliver systems, technology, and services.
Geopolitical tensions have already led – and may continue to lead –
to an increase in such restrictions. For example, deliveries to certain
countries, such as China, have been increasingly impacted by
export regulations, which impose requirements to obtain specific
licenses and approvals. Specifically, under Dutch, US and other
applicable laws, we are required to secure export licenses for
EUV systems, specific DUV immersion systems, and some of
our other products.
In addition, the US government has implemented trade measures
that include license requirements for transacting with certain
Chinese entities. These include license requirements for the sale or
transfer of US-origin items, as well as limitations on support by US
persons for non-US origin items destined for advanced-node fabs
in China. These measures have restricted, and may continue to
restrict, our ability to supply specific products and services, as we
do not control the licensing process or approval criteria. The scope
and list of restricted entities remain subject to change and may be
further expanded. Further, obtaining US licenses to authorize foreign
nationals to work on programs involving controlled US items has
become increasingly difficult in recent years.
A significant number of our customers and suppliers are located
outside of the US. Rise in tariffs increase our costs for importing
materials, parts and components and can negatively impact our
margins and reduce our competitiveness. Tariffs also increase the
cost for customers of importing our products, which could harm
customer demand for our products.
ASML is also subject to export control regulations in jurisdictions
outside the EU and US. Developments in multilateral and bilateral
treaties, national regulations, and trade, security, and investment
policies have already impacted – and may continue to impact – our
operations, as well as those of our suppliers and customers.
|
These developments, as well as a global push for technological
sovereignty, may lead to long-term shifts in global trade dynamics,
competition, and technology supply chains, which could potentially
affect our business and growth prospects. Customers in China
represented 29.1% of our 2025 total net sales and 36.1% of our
2024 net sales. Countries affected by export control restrictions
may also introduce countermeasures, which could result in
conflicting regulations and legal liabilities.
The semiconductor industry relies on raw materials that are controlled
by specific countries. In the current geopolitical climate, the risk of these
materials becoming restricted or unavailable is increasing, which could
affect our suppliers, customers, and ASML directly. For example, China
has imposed or issued directives to impose various export controls on
its products including certain minerals.
Geopolitical instability and potential nationalization of assets also
poses risks to our business. For instance, several of our facilities,
supply chain partners, and customers are located in Taiwan, which
has a unique international political status. Changes in cross-strait
relations, Taiwanese government policies, or broader political,
economic, or social developments could affect our ability to serve
customers in Taiwan – who represented 25.5% of our 2025 total
net sales and 15.4% of our 2024 total net sales.
Similarly, we have operations and customers in South Korea.
A deterioration in relations with North Korea or the outbreak of
conflict could disrupt our ability to serve such customers. Customers
in South Korea represented 25.0% of our 2025 total net sales
and 22.7% of our 2024 total net sales.
A limited portion of our suppliers, customers, and support teams
are based in Israel. Regional tensions have had limited impact but
could further impact our business operations.
We also plan to initiate sales and support operations in countries
where ASML does not currently have such operations, such as
India. As we expand into new markets, risks related to matters
such as regulatory compliance, intellectual property protection,
political and infrastructure challenges, talent acquisition and
cultural and social differences may be further amplified.
|
From time to time, we may acquire or make investments in
businesses, business lines or technologies to complement,
enhance, or expand our existing operations and product portfolio,
or to pursue strategic growth opportunities. However, these
transactions may not always deliver the expected financial or
strategic benefits and could disrupt our operations or hinder
our performance.
Even when transactions are finalized, integrating the acquired
business or technology can present significant risks – including
difficulties in aligning operations, retaining key talent, and merging
systems, processes, and cultures.
Acquisitions and investments may also place additional strain on
our management and operational resources, potentially diverting
attention from core business activities. Furthermore, acquired
entities may have compliance gaps or liabilities that are not
immediately apparent, and their existing controls may not meet
our standards.
In connection with acquisitions, antitrust and national security
regulators have imposed and may in the future impose conditions,
including requirements to divest assets or other conditions that
could make it difficult for us to integrate the businesses that we
acquire. Furthermore, we may have difficulty in obtaining, or be
unable to obtain, antitrust and national security clearances,
which could inhibit future desired acquisitions.
Additionally, acquisitions and investments often result in the
recognition of goodwill and intangible assets. These must be
reviewed periodically for impairment under accounting standards.
If impairment indicators arise, we may be required to adjust asset
valuations and record impairment charges, which could negatively
impact our financial results.
|
|||||||||||
Strategic (continued) |
Operations |
|||||||||||||
|
A high percentage of net sales is derived from a
few customers
|
We may not be able to achieve our ESG objectives or adapt and respond in a timely manner to emerging
ESG expectations and regulations
|
We depend on our ability to manage the growth of our
organization and attract and retain a sufficient number
of adequately educated and skilled employees
|
||||||||||||
We sell our lithography systems to a relatively small number
of customers, making our business vulnerable to customer
concentration risk. The loss of any major customer, or a
significant reduction or delay in their orders, could materially impact
our financial performance. This risk is heightened by ongoing
consolidation within the semiconductor manufacturing industry.
Although our metrology and inspection systems and computational
lithography are contributing an increasing share of revenue, many
of these customers overlap with those purchasing our lithography
systems. As a result, while the ranking of our largest customers
may shift year to year, our sales remain concentrated among a
limited group.
Total net sales to our largest customer amounted to
€7,796.7 million, or 23.9% of total net sales in 2025, compared
with €4,682.4 million, or 16.6% of total net sales in 2024. In 2025,
38.0% of total net sales were made to our two largest customers.
The loss of any key customer, or a substantial change in their
purchasing behavior, could have a material adverse effect on
our business, financial condition, and operating results.
|
Companies are under growing scrutiny regarding their ESG
policies and practices. A wide range of stakeholders – including,
but not limited to, investors, capital providers, shareholder
advocacy groups, market participants, customers, suppliers,
regulators and local communities – are increasingly focused on
ESG-related issues. In certain jurisdictions where we operate, there is
heightened attention on making positive contributions to society and
minimizing negative environmental and social impacts throughout
the entire product lifecycle.
Not all stakeholders may agree or align with our ESG goals
and initiatives, and stakeholder expectations may shift over
time. Regulatory bodies and governments across the different
jurisdictions in which we operate may also hold conflicting views
on ESG practices and standards. Failing to meet our ESG
objectives or to respond effectively to evolving or conflicting
stakeholder expectations, regulations, practices and disclosure
requirements could harm our brand and reputation, hinder our
ability to attract and retain talent, increase costs, cause lower
sales, and negatively impact our operations and growth ambitions.
Our ESG sustainability strategy may not achieve the intended
results, and our estimates concerning the feasibility, timing and
cost of meeting stated goals are subject to risks and uncertainties.
We use offsets to help us meet some of our emissions targets.
Our ability to meet our ESG goals could be hindered by for instance
the availability of offsets at commercially reasonable terms.
The complexity of our technology and products may also limit our
ability to achieve certain aspects of our ESG goals – which also
depends heavily on our suppliers’ ability to reduce their ecological
footprints and on our customers’ ability to source renewable
electricity. If they fall short, we may not meet our targets. Similarly,
achieving our ESG goals depends on governments delivering on
their stated ambitions on decarbonization. Finally, customer
satisfaction with our ESG progress can influence demand.
|
The shift toward a low-carbon and circular economy, including
the reduction and abandonment of toxic materials, has led to
increased regulation, which may require changes to product
designs, impose technology restrictions, raise costs, and introduce
carbon taxes or pollution controls and may also result in supply
chain interruptions if we are not able to adapt in time. New laws
and regulations driven by environmental and social concerns may
affect us, our suppliers, and our customers, potentially resulting in
higher compliance costs and indirect costs across our value chain.
The regulatory landscape for ESG disclosure requirements
continues to evolve, potentially leading to non-compliance,
inconsistencies in data, incorrect ESG disclosures, and
increased scrutiny. This could lead to potential fines, litigation,
and/or reputational damage.
|
Our business depends significantly on our ability to attract and
retain employees in the long term, including a large number of
highly qualified professionals.
Our R&D programs, in particular, require a substantial number of
skilled employees. If we are unable to recruit, develop, and retain
enough qualified personnel, our ability to execute R&D effectively
and on schedule may be compromised.
Due to the unique and complex nature of our technology,
engineers with the necessary expertise are scarce and typically
not available from other industries. We invest heavily in training
our employees to work with our systems, making their retention
a critical factor in our success. The increasing complexity of our
products also means that new and existing employees face
longer learning curves.
Our suppliers face similar challenges in attracting and retaining
qualified talent, particularly for programs that support our R&D
and technology development. If they are unable to maintain the
necessary workforce, it could impact their technology roadmaps
and, in turn, affect our R&D efforts and timely delivery of components.
The growth of our organization, driven by strong customer demand,
has placed pressure on our ability to effectively manage our people,
facilities, operations, and resources. If we are unable to address
these challenges successfully, it could negatively impact our
operational performance and our reputation as an employer.
|
|||||||||||
Operations (continued) |
||||||||||||||
|
We may face challenges in managing the
industrialization of our products and bringing them
to high-volume production
|
We are highly dependent on the performance of a limited number of critical suppliers of single-source key
components
|
We are dependent on the continued operation of a
limited number of manufacturing facilities
|
||||||||||||
Successfully bringing new products to high-volume production
at a value-based price and in a cost-efficient manner depends on
our ability to manage product industrialization and control costs.
Customer adoption is closely tied to product performance in the
field. As our systems become more complex, the risk increases that
products may not meet development milestones, specifications, or
quality standards. If performance or quality falls short – particularly
in areas such as wafer capacity – demand may decline and
additional costs may arise.
Scaling newly developed products to full production requires
significant infrastructure expansion, including enhanced manufacturing
capabilities, increased component supply, and training of qualified
personnel. It may also require suppliers to scale their operations.
If we or our suppliers are unable to adapt accordingly, we may
face delays or limitations in introducing new technologies, products,
or enhancements, or in achieving high-volume production.
Even when industrialization is successful, reaching profitable
margins can take years. New technologies may not yield the same
margins as existing ones, and we may face challenges in adjusting
pricing and cost structures effectively. Additionally, new product
introductions can impact liquidity, as longer cycle times increase
working capital requirements. The growing complexity of our products
also demands greater upfront investment, and delays in revenue
recognition can negatively affect our cost structure and margins.
Furthermore, the increasing number of EUV systems in the field
requires expanded customer support capabilities. The ability to
efficiently manage shipments, maintenance, servicing, and
upgrades is critical to ensuring continued system productivity.
Any constraints in these areas could affect delivery timelines
and operational performance.
|
We depend on third-party vendors for the components and
subassemblies used in our systems, including their design. Many
of these parts are single-sourced or supplied by a limited number
of vendors. As our business has grown, so has our reliance on
single suppliers – particularly due to the highly specialized nature
of many components. This is especially true for EUV systems,
where the complexity and uniqueness of parts often make multi-
sourcing economically impractical.
In many cases, our sourcing strategy follows the principle of
“single sourcing, dual competence”. However, relying on a limited
group of suppliers introduces several risks – including potential
shortages, delays in obtaining components at acceptable costs,
and reduced control over pricing and quality. Supply disruptions
may arise from various causes, such as labor strikes, fires, energy
shortages, infrastructure access, pandemics, flooding, cyberattacks,
blockades, sabotage, or other natural or man-made disasters.
Such disruptions can delay the delivery of parts and subassemblies,
which in turn may delay our product shipments and negatively
impact our business.
For example, some suppliers have faced operational disruptions
due to (raw) material shortages and cyberattacks. Persistent delays
or an inability to secure timely deliveries – or any other circumstance
that requires us to find alternative sources – could significantly
hinder our ability to meet customer demand, damaging
relationships and materially impacting our business.
The number of lithography systems we are able to produce is limited by
the production capacity of one of our key suppliers, Carl Zeiss SMT, our
sole supplier of lenses, mirrors, illuminators, collectors and other critical
optical components (which we refer to as optics). We have an exclusive
arrangement with Carl Zeiss SMT. If this supplier became unable to
maintain and increase production levels, we could be unable to fulfill
orders. This could have a material impact on our business and damage
relationships with our customers. Furthermore, if Carl Zeiss SMT were
to terminate its supply relationship with us or be unable to maintain
production of optics over a prolonged period, we would effectively
cease to be able to conduct our business.
|
Occasionally, we experience supply constraints that affect
production. Both we and our suppliers continue to invest in
expanding capacity, but we may still fall short of meeting full
customer demand. Conversely, if demand decreases or fails to
match our increased capacity, we risk overcapacity, leading to
higher costs and potential losses on those investments.
Additionally, most of our key suppliers, including Carl Zeiss
SMT, operate a limited number of manufacturing facilities.
Any disruption at these sites could significantly impact our
production. As our products become more complex, lead times
for components have increased. Inaccurate demand forecasting
or shipment delays can result in insufficient supply, delaying
system deliveries and limiting our responsiveness to market
changes. On the other hand, overestimating demand could lead
to excess inventory and obsolescence.
We also rely on suppliers to develop new models and products
aligned with our technology roadmap. If they fail to meet our
specifications or timelines, our business could be adversely affected.
Historically, we shipped systems by air, but have recently begun
using ocean freight for some deliveries. This shift introduces new
risks, such as delays, defects, or damage during transit.
|
All of our manufacturing activities, including subassembly, final
assembly and system testing, take place in (cleanroom) facilities
in Veldhoven, Eindhoven, Oirschot (the Netherlands), Berlin
(Germany), Wilton, San Diego (US), Pyeongtaek (South Korea)
and Linkou and Tainan (Taiwan). These facilities may be subject
to disruption for various reasons, including work stoppages, fire,
energy shortages and access issues, pandemic outbreaks,
flooding, cyberattacks, blockages, sabotage or other disasters,
natural or otherwise. Alternative production capacity may not be
available if a major disruption were to occur.
Climate change is contributing to more frequent and severe
weather events, rising sea levels, and droughts, all of which pose
risks to our operational continuity and supply chain resilience.
We do not fully insure our risk exposure, and not all disasters,
other potential disruptions and risks are insurable. As a result,
we may be subject to the financial impact of uninsured losses,
which could have an adverse impact on our financial condition
and results of operations.
|
|||||||||||
Operations (continued) |
||||||||||||||
|
Our operations expose us to health, safety and
environment risks
|
Cybersecurity and other security incidents, or disruptions in our processes or technology systems, could
materially adversely affect our business operations
|
We are exposed to risks related to the use of
artificial intelligence
|
||||||||||||
Hazardous substances are used in the production and operation
of our products and systems. Their use subjects us to a variety
of governmental regulations relating to environmental protection
and employee and product health and safety. This includes the
transport, use, storage, discharge, handling, emission, generation
and disposal of toxic or other hazardous substances. In addition,
operating our systems (which use lasers and other potentially
hazardous components) can be dangerous and can result in injury.
Non-compliance with these regulations could lead to harm to
individuals and the environment, and may result in substantial
fines, production halts, changes to our manufacturing and testing
processes, reputational damage, and restrictions on our
operations or sales.
As our products become increasingly complex, we continue to
invest in risk assessments and the development of preventive and
protective measures to safeguard the health and safety of both our
employees (during production, installation, and service activities)
and those of our customers (during system operation). However,
these measures may not fully eliminate all risks. A failure to comply
with applicable regulations could expose us to significant liabilities
and adversely affect our business.
|
We depend heavily on the accuracy, availability, and security
of our information technology (IT) and operational technology
(OT) systems. While we have implemented various safeguards,
including cybersecurity measures, our systems remain vulnerable
to breaches or damage caused by malware, cyberattacks, natural
and man-made disasters, human error, or unauthorized physical or
electronic access. We have encountered such incidents in the past.
As ASML’s prominence in the semiconductor industry grows,
so does the likelihood of being targeted in security attacks.
Cyberattacks targeting our IT and OT infrastructure – as well as
those of our customers, suppliers, and service providers – are
increasing in frequency and sophistication. These attacks include
malware, unauthorized attempts to access data, and other security
breaches. Such incidents can disrupt critical systems and lead to
the unauthorized release, corruption, or loss of confidential
information, including data related to our customers, employees,
and suppliers. Emerging technologies like AI and quantum computing
may further enable advanced cyber threats or circumvent existing
security protocols. Cybersecurity threats continue to evolve, and we
remain exposed to both known and unknown risks. In some cases,
we or our stakeholders may be unaware of an incident or its full
impact. There is also a risk that our products could inadvertently
expose customers to cyber threats, which could
harm their operations.
We rely on our employees and those of our suppliers and
partners to classify and handle sensitive data responsibly, to
deploy our assets securely and to provide access on a need-to-know
basis. However, inadvertent actions or misconduct by these
individuals have led – and may continue to lead – to unauthorized
access, data breaches, theft, system interruptions, or loss of
information. These insider risk events can result in competitive
disadvantages, violations of export controls and other regulations,
and may expose us to fines, penalties, reputational damage, and
increased regulatory scrutiny.
|
Any system failure, accident or security breach or any other of the
foregoing risks could result in business disruption, theft of our IP or
trade secrets, unauthorized access to, or disclosure of, customer,
employee, supplier or other confidential information, corruption of
our data or of our systems, reputational damage or litigation, and
violation of applicable laws.
Furthermore, malware may harm our products and could be
inadvertently transmitted to our customers’ systems and operations.
This could result in loss of customers, litigation, regulatory investigation
and proceedings that could expose us to civil or criminal liabilities and
diversion of significant management attention and resources.
We may incur substantial costs to recover from such incidents,
including rebuilding systems, enhancing security measures,
modifying products and services, defending against legal claims,
and responding to regulatory actions. We are also dependent on
our strategic IT suppliers to recover from disruptions or attacks.
Despite these efforts, remediation may not be fully effective and
could result in service interruptions, negative publicity, customer
dissatisfaction, and loss of business.
Additionally, our processes and systems may struggle to keep
pace with our growth. From time to time, we implement updates
to our IT systems and software which can disrupt or shut down our
IT systems. We may not be able to successfully launch or migrate
IT systems as planned without disruption to our operations – for
example, our planned ERP migration.
Our organization increasingly relies on a limited number of cloud
service providers and third-party IT services to support critical
operations, data storage, and infrastructure. This creates a
concentration risk, where disruptions affecting one provider
can have widespread operational, financial, and reputational
consequences. Additionally, dependency on other IT services,
such as identity management, networking, software platforms,
and interfaces, can compound this risk. Key concerns include
operational disruptions, vendor lock-in, regulatory and compliance
challenges, integration complexity and security vulnerabilities,
including shared infrastructure risks.
|
We are increasingly integrating artificial intelligence (AI) into our
technology development, business operations, and the products
and services we offer. While AI presents significant opportunities,
it also introduces a range of complex and rapidly evolving risks –
including competitive, legal, regulatory, operational, and
ethical challenges.
We may fail to implement AI in a timely and effective manner.
AI can be costly, and there is no assurance that it will improve our
technologies, enhance our operations, or result in products and
services that resonate with our customers. Competitors may
adopt more effective AI strategies, potentially providing
competitive advantage.
AI systems can also be vulnerable to flaws in algorithms, training
methods, or datasets, which may contain irrelevant, insufficient,
or biased information. These issues can result in unintended or
inaccurate outputs, legal liabilities, reputational damage, and
material harm to our business.
The adoption of AI technologies may introduce several risks,
including potential loss, infringement, or misappropriation of
intellectual property, as well as concerns related to data privacy
and cybersecurity. Additional security challenges may arise, such
as managing contextual access and defining the scope of actions
permitted for AI agents. Furthermore, ethical considerations
surrounding AI could impact market acceptance and potentially
reduce demand for our products and services.
Governments are actively developing laws and regulations related
to AI. Compliance with these evolving requirements may increase
operational costs and restrict how we use AI in our products and
services. Any actual or perceived failure to meet these standards
could lead to legal consequences, reputational harm, or other
adverse impacts on our business.
|
|||||||||||
Operations (continued) |
Finance and reporting |
|||||||||||||
|
We face challenges to meet expected demand |
We are exposed to financial risks including liquidity risk, interest rate risk, counterparty credit risk, foreign
exchange risk and inflation risk
|
Changes in taxation could affect our future
profitability
|
||||||||||||
We are continuing to increase production capacity in our end-to-
end supply chain to meet future demand, but we face challenges
in increasing capacity. For example, we depend on our suppliers
increasing their capacity and their ability to invest, and it takes
time to build the production space and equipment required for
expansion. We and our supply chain also need to obtain permits
to make expansion possible, and the time it takes for these to
be granted may cause delays.
It is a challenge for ASML and its suppliers to hire and retain
employees to support expansion. Our processes and systems
and those of our supply chain may also not be able to adequately
support our growth. If we are not successful in increasing our
capacity to meet future demand, this could impact our relationships
with customers and our competitive position.
We and our suppliers have invested significantly in increasing
capacity, and we face various risks in connection with this, including
risks relating to system quality, the risk that we have not accurately
predicted demand, and risks associated with maintaining a much
larger production infrastructure and supplier ecosystem, including
higher costs and challenges in controlling the enlarged
production process.
We also face the risk that our increase in capacity could result in
capacity that exceeds demand (overcapacity).
|
As a global company, we are exposed to a variety of financial risks,
including those related to liquidity, interest rates, counterparty
credit, currencies and inflation.
Liquidity risk
Negative developments in our business or global capital markets
could affect our ability to meet our financial obligations or to raise
or refinance debt in the capital or loan markets. In addition, we
might be unable to repatriate cash from a country when needed
for use elsewhere due to legal restrictions or required formalities.
Currency risk
Our Financial statements are expressed in euros. Accordingly,
our results of operations are exposed to fluctuations in exchange
rates between the euro and other currencies. Changes in currency
exchange rates can result in losses in our Financial statements.
We are particularly exposed to fluctuations in the exchange rates
between the US dollar, the Japanese yen, the South Korean won,
the Taiwanese dollar and the Chinese yuan, in relation to the euro.
We incur costs of sales predominantly in euros, with portions also
denominated in US and Taiwanese dollars. A small portion of our
operating results are driven by movements in currencies other than
the euro, US dollar, Japanese yen, South Korean won, Taiwanese
dollar or Chinese yuan.
Inflation risk
We are exposed to increases in costs due to inflation for costs
of goods, transportation and wages. We have experienced and
experience higher-than-normal inflation, which impacts our costs
and margins in case we are not able to pass on increased costs
in our prices.
|
Interest rate risk
Our Eurobonds bear interest at fixed rates. Our cash, investments,
Euro Commercial Paper program and credit facilities bear interest
at a floating rate. Failure to effectively hedge this risk could impact
our financial condition and results of operation. In addition, we
could experience an increase in borrowing costs due to a ratings
downgrade (or the expectation of a downgrade), developments in
capital and lending markets or developments in our businesses.
Counterparty credit risk
We are exposed to credit risk, particularly with respect to (financial)
counterparties with whom we hold our cash and investments, as
well as our customers and, in some instances, to suppliers. As a
result of our limited number of customers, counterparty credit risk
on our receivables is concentrated. Our three largest customers
(based on total net sales) accounted for €1,294.2 million, or 35.4%
of accounts receivable and finance receivables, at December 31,
2025, compared with €2,641.9 million, or 54.1%, at December 31,
2024. Accordingly, business failure or insolvency of one of our
main customers could result in significant credit losses.
|
We are subject to income taxes in the Netherlands and other
countries in which we operate. Our effective tax rate has fluctuated
in the past and may do so in the future.
Our effective tax rate can be affected by changes in our business
environment, changes in tax legislation in the countries where we
operate, developments driven by global organizations such as the
Organisation for Economic Co-operation and Development (OECD),
and any change in approach to tax by tax authorities. Initiatives like
the BEPS and Global Minimum Tax rules have already resulted in
and may result in further increased compliance obligations for
ASML. This may result in an increase in our effective tax rate in
future years.
Changes in tax legislation may adversely impact our tax position
and consequently our net income. Our worldwide effective tax rate
is heavily impacted by R&D incentives included in tax laws and
regulations in the countries where we operate, such as the so-
called innovation box in the Netherlands and the R&D credits we
obtain in the US. If relevant jurisdictions alter their tax policies/laws
in this respect, it may have an adverse effect on our worldwide
effective tax rate. In addition, jurisdictions levy corporate income
tax at different rates. The mix of our sales over the various
jurisdictions in which we operate may vary from year to year,
resulting in a different mix of corporate income tax rates applicable
to our profits. This can also affect our worldwide effective tax
rate and impact our net income.
|
|||||||||||
Compliance |
Other |
|||||||||||||
|
We are subject to regulatory and compliance obligations in the various countries where we operate and
the complexity of compliance requirements increases
|
Restrictions on shareholder rights may dilute
voting power
|
We may not declare cash dividends, conduct share
buybacks at all or in any particular amounts in any
given year
|
||||||||||||
We are subject to a variety of laws and regulations across the
jurisdictions where we operate, including but not limited to those
relating to trade, national security, tax, export controls including
licensing or authorization requirements, reporting, product
compliance, anti-corruption, antitrust, foreign direct investment,
ESG, human rights, data protection, AI technologies, spatial
planning, environmental matters, workplace safety regulations,
securities laws and stock exchange rules. With the significant
growth of our business in recent years, ensuring compliance
with laws and regulations and our internal policies across our
continually expanding organization has become more challenging.
We face the risk that, despite our significant efforts and proactive
approach to compliance, we may fail to comply with such laws,
regulations or policies.
We operate in a significant and growing number of countries in
the world, and we are therefore subject to numerous and differing,
and sometimes conflicting, regulatory frameworks, which can
impact how we operate our business. In particular, the regulatory
environment regarding export and sanctions has become
increasingly restrictive, and, as a result, our ability to sell some
of our products and services to certain customers is subject to
restrictions and requires government authorization, which can
lead to delays in or a prohibition on shipments of products to
certain customers.
|
Laws and regulations that impact our business are regularly
amended and we are subject to new laws and regulations. We
are also subject to the changing interpretations by and positioning
of regulators, including in the granting of required licenses to ship
products as well as in investigations and enforcement. Additional
or amended regulations or changes in policies of governments and
regulators could increase compliance costs and risks associated
with non-compliance, or could impact our manufacturing or
distribution processes or location of sales and where and to whom
we can deliver and service our products and services, and could
affect the timing of product introductions, the cost of our
production, and products themselves as well as their commercial
success in each market in which we operate.
We are subject to investigations, audits and reviews by regulatory
authorities in the various jurisdictions where we operate regarding
compliance with laws and regulations, including tax laws. These
may arise due to misunderstandings, disputes, or suspicions of
non-compliance or otherwise, and can be resource-intensive and
have reputational and financial implications for us. Despite our
efforts and proactive compliance program, we may be found to
be non-compliant with applicable regulations.
Compliance with existing and new regulations can result in
compliance costs, increased risk of non-compliance and limitations
on our business, which can impact our results of operations.
The consequences of non-compliance include fines, penalties and
litigation, business disruption, the loss of trade or export privileges,
reputational harm, additional regulatory scrutiny measures and the
erosion of stakeholder trust, any of which could have a material
adverse effect on our business and results of operations.
|
ASML's Articles of Association provide that it is subject to the
provisions of Dutch law applicable to large corporations, called
‘structuurregime’. These provisions concentrate control of certain
corporate decisions and transactions in the hands of the Supervisory
Board (SB). As a result, holders of ordinary shares may have more
difficulty in protecting their interests in the face of actions by members
of the SB than if we were not subject to the ‘structuurregime’.
Our authorized share capital includes a class of cumulative
preference shares. We have granted our preference shares
foundation (Stichting Preferente Aandelen ASML) an option to
acquire, at the nominal value of €0.09 per share, such cumulative
preference shares. Exercise of the preference share option would
effectively dilute the voting power of our outstanding ordinary
shares by one-half, which may discourage or significantly impede
a third party from acquiring a majority of our voting shares.
|
We aim to pay a quarterly dividend that is growing (on an
annualized basis) over time, and we conduct share buybacks from
time to time. The dividend proposal and amount of share buybacks
in any given year are subject to, among other factors, the availability
of distributable profits, retained earnings and cash, the BoM's
views on our potential future liquidity requirements, including
for investments in production capacity and working capital
requirements, the funding of our R&D programs and acquisition
opportunities that may arise from time to time, and future
changes in applicable tax and corporate laws.
The BoM may decide not to pay a dividend or to pay a lower dividend
than is contemplated by our aim or dividend policy. In addition, we
may suspend, adjust the amount of or discontinue share buyback
programs, we may not enter into new share buyback programs, and
we may otherwise fail to complete buyback programs.
|
|||||||||||

ASML Annual Report 2025
|
75 |
Corporate governance at a glance |
||
Board of Management |
||
Supervisory Board |
||
Other Board-related matters |
||
AGM and share capital |
||
Financial reporting and audit |
||
Compliance with corporate governance requirements
|
||
Supervisory Board report |
||
In conversation with the Chair of the Supervisory Board |
||
Supervisory Board focus in 2025 |
||
Meetings and attendance |
||
Composition and skills |
||
Evaluation |
||
Supervisory Board committees |
||
Financial statements and profit allocation |
||
Remuneration report |
||
In conversation with the Chair of the Remuneration Committee |
||
Board of Management remuneration at a glance |
||
Remuneration Committee |
||
Board of Management remuneration |
||
Supervisory Board remuneration |
||
Other information |

ASML Annual Report 2025
|
76 |
OVERVIEW |
||
These pages provide
an overview of and a
brief introduction to the
Corporate governance
section of our
Annual Report.
|
 |
|
I am confident that
our new management
team and continued
focus on technological
leadership will secure
our long-term success.”
|
|
Nils Andersen |
|
Chair of the Supervisory Board |
Supervisory Board skills |
International management |
89% |
|
Finance/governance |
78% |
|
Remuneration |
78% |
|
Human resources |
100% |
|
IT/digital/cyber |
67% |
|
ESG |
100% |
|
Semiconductor ecosystem |
56% |
|
Technology |
44% |
|
Supply chain |
78% |
|
Business in Asia |
89% |
Stakeholders |

Read more
|
Remuneration |
Our Board of Management Remuneration
Policy is designed to fairly incentivize the
delivery of our strategic business priorities
and create sustainable long-term value.
|
Supervisory Board diversity, nationality and tenure |

56% |
44% |
4.1 |
|||||
Men |
Women |
Years average
tenure
|
|||||
(2024: 4.2)
|
|||||||
Dutch |
x2 |
||
German |
x1 |
||
American |
x2 |
||
British |
x1 |
||
Danish |
x1 |
||
Belgian |
x2 |
||
Board of Management (€’000s)
| |||||||
Christophe D.
Fouquet
|
€7,021 |
||||||
Frédéric J.M.
Schneider-Maunoury
|
€4,366 |
||||||
Roger J.M. Dassen |
€4,350 |
||||||
Wayne R. Allan |
€4,463 |
||||||
James (Jim) P.
Koonmen
|
€4,083 |
||||||
Base salary and benefit |
STI |
LTI |
|||||

Supervisory Board attendance |
|||||||||||
Supervisory
Board
|
Audit
Committee
|
Remuneration
Committee
|
Selection
and Nomination
Committee
|
Technology
Committee
|
ESG
Committee
|
||||||
98% |
100% |
100% |
100% |
100% |
100% |
||||||
ASML Annual Report 2025
|
77 |
ASML corporate governance structure |
||||||||||||||||||||||
Shareholders |
||||||||||||||||||||||
Supervisory Board |
||||||||||||||||||||||
Audit
Committee
|
ESG
Committee
|
Remuneration
Committee
|
Selection and
Nomination
Committee
|
Technology
Committee
|
||||||||||||||||||
Board of Management |
||||||||||||||||||||||
ASML organization | ||||||||||||
Business axis:
Customer
|
Business axis:
Product
|
Technology
axis
|
Execution
axis
|
Enabling
axis
|
||||||||
ASML Annual Report 2025
|
78 |

ASML Annual Report 2025
|
79 |
Christophe D. Fouquet
(1973, French)
|
James (Jim) P. Koonmen
(1967, American, Irish)
|
||||||||||||||||
President, Chief Executive Officer and
Chair of the Board of Management
Term expires 2028
|
Executive Vice President and
Chief Customer Officer
Term expires 2028
|
||||||||||||||||
Christophe Fouquet became President and CEO in 2024,
having served as Executive Vice President EUV from 2018
until 2022, Executive Vice President and Chief Business
Officer from 2022 until 2024 and member of the Board of
Management since 2018. Since joining ASML in 2008, he
has held several positions, including Senior Director
Marketing, Vice President Product Management, and
Executive Vice President Applications, a position he held
from 2013 until 2018. Prior to joining ASML, he worked for
semiconductor equipment peers KLA-Tencor and Applied
Materials. Christophe holds a master’s degree in Physics
from the Institut Polytechnique de Grenoble.
|
Jim Koonmen joined ASML in 2007 through the
acquisition of Brion, where he was General Manager
from 2008 until 2015. He subsequently served as the
CEO of Cymer and then led the Applications business
for five years. Before he joined ASML, Jim was Vice
President of Marketing and Operations at MEMX,
Director of Manufacturing Engineering at Onetta and
Director of Operations at Johnson & Johnson. Jim holds
a Master of Science in Management from the MIT Sloan
School of Management and a Master of Science in
Aeronautics and Astronautics from the Massachusetts
Institute of Technology.
|
||||||||||||||||
Roger J.M. Dassen
(1965, Dutch)
|
Wayne R. Allan
(1967, American)
|
Frédéric J.M. Schneider-Maunoury
(1961, French)
|
|||||||||||||||
Executive Vice President
and Chief Financial Officer
Term expires 2026
|
Executive Vice President and Chief Strategic
Sourcing & Procurement Officer
Term expires 2027
|
Executive Vice President
and Chief Operations Officer
Term expires 2026
|
|||||||||||||||
Roger Dassen joined ASML in June 2018 and was
appointed Executive Vice President, CFO and member of
the Board of Management at the AGM the same year. He
had previously served as Global Vice Chair and member of
the Executive Board of Deloitte Touche Tohmatsu Limited,
having been CEO of Deloitte Holding B.V. Roger holds a
master’s in Economics and Business Administration, a
post-master’s in Auditing and a PhD in Business
Administration, all from the University of Maastricht. He is
Professor of Auditing at Vrije Universiteit Amsterdam, and
sits on the Supervisory Board of the Dutch National Bank.
He is also the Chair of the Supervisory Board of Maastricht
University Medical Center+ and he joined the Strategic
Committee of Mistral AI as a member in 2025.
|
Wayne Allan was appointed Executive Vice President,
Chief Strategic Sourcing & Procurement Officer and
member of the Board of Management in 2023. Wayne
joined ASML in 2018 as Executive Vice President of
Customer Support. Before he joined ASML, Wayne
served as Senior Vice President of Global Manufacturing
Operations and as Vice President of Wafer Fabs at
Micron Technology, Inc., the company where he began
his career in 1987 as a production operator. He
continued to move into operations roles of increasing
leadership in engineering, planning and production.
|
Frédéric Schneider-Maunoury has been Executive Vice
President and Chief Operations Officer since he joined
ASML in 2009. He was appointed to the Board of
Management in 2010. Prior to joining ASML, Frédéric
was Vice President Thermal Products Manufacturing at
power generation and rail transport equipment group
Alstom, having previously served as General Manager of
its worldwide Hydro Business. Before this, Frédéric had
held various positions at the French Ministry of Trade
and Industry. He is a graduate of École polytechnique
(1985) and École Nationale Supérieure des Mines (1988)
in Paris.
|
|||||||||||||||

ASML Annual Report 2025
|
80 |
Stage 1 |
Stage 2 |
Stage 3 |
Stage 4 |
Stage 5 |
||||||
Recommendation
right of GM and
Works Council
|
Announcement
of nomination for
appointment by SB
|
Works Council has
the right to determine
its position
|
Formal nomination
for appointment
by SB
|
Appointment
of SB member
by GM
|

ASML Annual Report 2025
|
81 |
Nils S. Andersen
(1958, Danish)
|
Member of the Supervisory Board since 2023
(First term expires in 2027)
|
Chair of the Supervisory Board, Chair of the
Selection and Nomination Committee, member
of the Audit Committee
|
Nils Andersen joined the Supervisory Board in 2023, and has been its
Chair since. Nils also serves as Chair of the Board of Scan Global
Logistics A/S. From 2015 until May 2024, he served as Non-Executive
Director of Unilever Plc and was appointed as Chair as per 2019. From
2018 until 2023, he was the Chair of the Supervisory Board of Akzo
Nobel N.V. and, between 2007 and 2016, he was Group Chief Executive
of A.P. Møller–Mærsk. From 2001 until 2007, Nils served as President
and Chief Executive Officer of Carlsberg and Carlsberg Breweries.
|
Terri L. Kelly
(1961, American)
|
Member of the Supervisory Board since 2018
(Second term expires in 2026)
|
Vice Chair of the Supervisory Board, Chair of the
Remuneration Committee, member of the Selection
and Nomination Committee
|
Terri Kelly has been a member of the Supervisory Board since 2018.
Previously, she was President and CEO at W.L. Gore & Associates
from 2005 until 2018, having worked at Gore since 1983 in various
management roles. She also served on Gore’s Board of Directors
through July 2018. Terri is a Trustee of the Alfred I. Dupont Charitable
Trust, which provides oversight of the Nemours Foundation. She is the
Chair of the Board of Trustees of the University of Delaware and a
member of the Board of Directors of United Rentals, Inc.
|
Birgit M. Conix
(1965, Belgian)
|
Member of the Supervisory Board since 2021
(Second term expires in 2029)
|
Chair of the ESG Committee and member
of the Audit Committee
|
Birgit Conix became a member of the Supervisory Board in 2021.
Effective per February 1, 2025, she was appointed as Non-Executive
Director of AstraZeneca PLC and is a member of the Audit
Committee. Prior to this, she was CFO and a member of the
Management Board of Sonova Holding AG from June 2021 until
February 2025. From 2018 until January 1, 2021, Birgit was a member
of the Executive Board and CFO of TUI AG. She was previously the
CFO of the Belgian media, cable and telecommunications company
Telenet Group N.V. Prior to that, Birgit held various management
positions in finance at Johnson & Johnson, Heineken, Tenneco and
Reed Elsevier.
|
D. Mark Durcan
(1961, American)
|
Member of the Supervisory Board since 2020
(Second term expires in 2028)
|
Chair of the Technology Committee, member
of the Selection and Nomination Committee
|
Mark Durcan was appointed as a member of the Supervisory Board in
2020. He is Chair of the Board of Directors at Cencora since October
1 , 2025. He is also a member of the Board of Trustees for Rice
University (Texas) and as Director at Natural Intelligence Systems CA,
a private Al startup company. From 2012 to 2017, he was CEO of
Micron Technology, Inc., having joined the company in 1984 and
having held various management positions before being appointed
CEO. Furthermore, Mark was a non-executive director of Advanced
Micro Devices, Inc., and a director at Freescale Semiconductor, MWI
Veterinary Supply, Veoneer, Inc. and St Luke’s Health System (Idaho).
|

ASML Annual Report 2025
|
82 |
Catharina (Karien) E.G. van Gennip
(1968, Dutch)
|
Member of the Supervisory Board since
2025 (First term expires in 2029)
|
Member of the ESG Committee and
the Remuneration Committee
|
Karien van Gennip brings extensive leadership experience
across professional services, financial services and public
policy. She has served as Minister of Social Affairs and
Employment and Deputy Prime Minister in the Dutch
government, CEO of Dutch healthcare insurer VGZ , and
CEO of ING France. Earlier in her career, she was State
Secretary of Economic Affairs, Minister for Foreign Trade,
held roles at McKinsey&Company, the Dutch Authority for
Financial Markets and ING, and served on various for
profit and not for profit Boards in the past. She has an
educational background in Physics from Delft University of
Technology and holds an MBA from INSEAD. Karien is
currently a Member of the Monitoring Committee
Corporate Governance, a Board member of Royal
Concertgebouw Orchestra, and a member of the
European Council on Foreign Relations.
|
D. Warren A. East
(1961, British)
|
||
Member of the Supervisory Board since 2020
(Second term expires in 2028)
|
||
Member of the Audit Committee, the
Selection & Nomination Committee and
the Technology Committee
|
||
Warren East became a member of the Supervisory
Board in 2020 and is currently a Non-Executive Board
member at Tokamak Energy plc. Furthermore, he is
also currently the Chair of the Board of Directors
of NATS Holdings Ltd., the UK’s National Air Traffic
Service. In October 2025, Warren joined ITM Power plc
as a Non-Executive Director. Warren was CEO of Rolls-
Royce Group Plc from 2015 until December 2022. He
spent his early career at Texas Instruments Ltd. from
1985 to 1994 before joining ARM Holdings, Plc., where
he held various management positions and was
appointed CEO from 2001 to 2013.
|
Jack P. de Kreij
(1959, Dutch)
|
||
Member of the Supervisory Board since 2023
(First term expires in 2027)
|
||
Chair of the Audit Committee and member
of the Remuneration Committee
|
||
Jack de Kreij joined the Supervisory Board in 2023. Among
other roles, he is currently the Vice Chair of the
Supervisory Board and Chair of the Audit Committee at
Wolters Kluwer N.V. Jack is also a member of the
Supervisory Board, Chair of the Audit Committee and
member of the ESG Committee at Royal Boskalis
Westminster N.V. In addition, he is the Chair of the Board
of the Dutch Association of Listed Companies (VEUO).
Jack served as the Vice Chair of the Supervisory Board
and Chair of the Audit Committee at TomTom N.V. until
April 2025. From 2003 to 2018, Jack was CFO and a
member of the Executive Board of Royal Vopak N.V.,
taking on the role of Vice Chair from 2010 to 2018.
Between 1986 and 2003 he worked at
PricewaterhouseCoopers, where he held various
management positions as (Senior) Partner and was among
other roles Managing Partner & Territory Leader of the
M&A-focused Transaction Services practice in the
Netherlands. Jack started his career in 1980 with the
Dutch Ministry of Finance, where he worked until 1986.
|
||
Alexander F.M. Everke
(1963, German)
|
||
Member of the Supervisory Board since 2022
(First term expires in 2026)
|
||
Member of the ESG Committee and
the Remuneration Committee
|
||
Alexander Everke joined the Supervisory Board in
2022. He also serves as member of the Supervisory
Board of Aixtron SE, a position he has held since May
2024 and has become the Chair of the Supervisory
Board since 2025. He is the former CEO of ams-
OSRAM AG, a position he held from March 2016 until
April 2023, after having joined ams AG in October
2015. Prior to that, Alexander held a range of positions
in the semiconductor industry, including management
roles at Siemens and Infineon and various leadership
positions at NXP Semiconductors.
|
An L. Steegen
(1971, Belgian)
|
||
Member of the Supervisory Board since 2022
(First term expires in 2026)
|
||
Member of the ESG Committee and
the Technology Committee
|
||
An Steegen joined the Supervisory Board in 2022. She
is CEO and member of the Board of Directors of Barco
N.V. since September 1, 2024, after having served as a
co-CEO and member of the Board of Directors since
October 1 , 2021. Prior to that, An was R&D director at
IBM Semiconductor and Executive Vice President at
the research institute imec in Belgium. Furthermore, An
was CTO and Executive Vice President Electronic and
Electro-Optical Materials at Umicore.
|
ASML Annual Report 2025
|
83 |
Supervisory Board |
||||||||
 |
Dutch |
x2 |
||||||
56% |
||||||||
German |
x1 |
|||||||
American |
x2 |
|||||||
Male members |
||||||||
Supervisory
Board
nationality
|
British |
x1 |
||||||
 |
Danish |
x1 |
||||||
44% |
||||||||
Belgian |
x2 |
|||||||
Female members |
||||||||

 |
|
|
||||
29% |
16% |
21% |
||||
Gender
diversity: %
inflow of
women (all job
grades)
|
Gender
diversity: %
representation
of women in
job grade 13+
|
Women in our
workforce
(headcount)
|
||||
ASML Annual Report 2025
|
84 |

ASML Annual Report 2025
|
85 |
Our AGM is held at least once
a year and generally takes place
in Veldhoven, the Netherlands.
The agenda for the AGM typically
includes the following topics:
|
|
Item 1
Discussion of the Management Report and
the adoption of the Financial statements over
the past financial year.
Item 2
Discussion of the dividend policy and
approval of any proposed dividends.
Item 3
Advisory vote on the Remuneration report
over the past financial year.
Item 4
The discharge from liability of the members
of the Board of Management and the
Supervisory Board for the performance of
their responsibilities in the previous
financial year.
Item 5
The limited authorization for the Board of
Management to issue (rights to) shares in
ASML’s capital, and to exclude preemptive
rights for such issuances, as well as to
repurchase shares and to cancel shares.
Item 6
Any other topics proposed by the Board
of Management, the Supervisory Board or
shareholders in accordance with Dutch law
and the Articles of Association.
| |
ASML Annual Report 2025
|
86 |
ASML’s authorized share capital amounts to €126.0 million and is divided into:
|
|||||
Type of shares |
Number of shares |
Nominal value |
Votes per share |
||
Cumulative preference shares |
700,000,000 |
€0.09 per share
|
1 |
||
Ordinary shares |
700,000,000 |
€0.09 per share
|
1 |
||
The issued and fully paid-up ordinary shares with a nominal value of €0.09 each were as follows:
|
|||||
As of December 31 |
2023 |
2024 |
2025 |
||
Issued ordinary shares with nominal value of €0.09 |
393,421,721 |
393,283,720 |
385,417,665 |
||
Issued ordinary treasury shares with nominal value of €0.09 |
6,162,857 |
546,972 |
2,730,009 |
||
Total issued ordinary shares with nominal value of €0.09 |
399,584,578 |
393,830,692 |
388,147,674 |
||
ASML Annual Report 2025
|
87 |
Shares |
% of class4
|
|
BlackRock, Inc.1
|
26,325,103 |
6.83% |
Capital Research and Management Company2
|
19,612,223 |
5.09% |
Members of ASML’s current Board of Management and Supervisory Board (8 persons)3
|
51,095.11 |
0.01% |
1.Based solely on the Schedule 13-G/A filed by Blackrock, Inc. with the SEC on April 23, 2025, BlackRock, Inc reports voting power with respect
to 24,171,923 of these 26,325,103 shares. A public filing with the AFM on December 6, 2022, shows an aggregate indirect capital interest of
5.80% and voting rights of 7.23%, based on the total number of issued shares and voting rights at that time.
2.As reported to the AFM on June 12, 2025, Capital Research and Management Company (CRMC) reports 19,612,223 voting rights corresponding
to 19,612,223 ordinary shares, but does not report ownership right related to those shares.
3.Does not include unvested shares granted to members of the Board of Management. For further information, see Remuneration Report –
Board of Management Remuneration.
4.As a percentage of the total number of ordinary shares issued and outstanding, 385,417,665 as of December 31, 2025, which excludes
2,730,009 ordinary shares which have been issued but are held in treasury by ASML and 15,642 fractional shares of which 15,024 are owned by
(former) ASML employees and 618 are owned by ASML. The share ownership percentages reported to the AFM or the SEC are expressed as a
percentage of the total number of ordinary shares issued (including treasury stock) and, accordingly, percentages reflected in this table may
differ from percentages reported to the AFM or the SEC.
| ||
ASML Annual Report 2025
|
88 |
Annual Reports |
||
We publish, among others, the following
annual reports regarding the financial
year 2025:
•The statutory Annual Report, has been prepared
in accordance with the requirements of Dutch law.
The Financial statements included therein are
prepared in accordance with Part 9 of Book 2
of the Dutch Civil Code and EU-IFRS, and the
Sustainability statements included therein are
prepared in accordance with the European
Sustainability Reporting Standards (ESRS).
•The Annual Report on Form 20-F, prepared in
accordance with the requirements of the Exchange
Act and regulations and the Form promulgated by
the SEC. The Financial statements included therein
are prepared in conformity with US GAAP.
Both reports have the same qualitative base
and provide the same description of our business,
corporate governance, and risk factors specific to
the semiconductor industry, ASML and our shares.
We also provide sensitivity analyses through:
•A narrative explanation of our Financial statements.
•The context within which financial information
should be analyzed.
•Information about the quality and variability of
our earnings and cash flow.
|
||

ASML Annual report 2025
|
89 |

ASML Annual Report 2025
|
90 |
Practices followed by ASML in lieu of Nasdaq rules | |
Quorum |
ASML does not follow Nasdaq’s quorum requirements applicable to meetings of ordinary
shareholders. In accordance with Dutch law and generally accepted Dutch business practice,
ASML’s Articles of Association provide that there are no quorum requirements generally applicable
to general meetings of shareholders.
|
Solicitation of
proxies
|
ASML does not follow Nasdaq’s requirements regarding the solicitation of proxies and the provision
of proxy statements for general meetings of shareholders. ASML does furnish proxy statements and
solicit proxies for the General Meeting. Dutch corporate law sets a mandatory (participation and
voting) record date for Dutch listed companies at the 28th day prior to the date of the General
Meeting. Shareholders registered at such a record date are entitled to attend and exercise their
rights as shareholders at the General Meeting, regardless of a sale of shares after the record date.
|
Distribution of
Annual Report
|
ASML does not follow Nasdaq’s requirement regarding distribution to shareholders of copies of
an annual report containing audited Financial statements prior to our AGM. The distribution of our
annual reports to shareholders is not required under Dutch corporate law or Dutch securities laws,
or by Euronext Amsterdam. Furthermore, it is generally accepted business practice for Dutch
companies not to distribute annual reports. In part, this is because the Dutch system of bearer
shares has made it impractical to keep a current list of holders of the bearer shares in order to
distribute the annual reports. Instead, we make our Annual Report available at our corporate head
office in the Netherlands (and at the offices of our Dutch listing agent, as stated in the convening
notice for the meeting) no later than 42 days prior to convocation of the AGM. In addition, we post
a copy of our annual reports on our website prior to the AGM.
|
Equity
compensation
arrangements
|
ASML does not follow Nasdaq’s requirement to obtain shareholder approval of stock option or
purchase plans or other equity compensation arrangements available to officers, directors or
employees. It is not required under Dutch law or generally accepted practice for Dutch companies
to obtain shareholder approval of equity compensation arrangements available to officers, directors
or employees. The General Meeting adopts the Remuneration Policy for the Board of Management,
approves equity compensation arrangements for the Board of Management and approves the
remuneration for the Supervisory Board. Equity compensation arrangements for employees are
adopted by the Board of Management within limits approved by the General Meeting. The
Remuneration Committee evaluates the achievements of individual members of the Board of
Management with respect to the short- and long-term quantitative performance, and the full
Supervisory Board evaluates the quantitative performance criteria.
|

ASML Annual Report 2025
|
91 |

ASML Annual Report 2025
|
92 |
Q |
What were the highlights
of 2025, from a Supervisory
Board perspective?
|
|||
Q |
How does the Supervisory
Board support the delivery
of ASML’s strategy?
|
|||

ASML Annual Report 2025
|
93 |
Q |
What role does stakeholder
engagement play in the work
of the Supervisory Board?
|
|||
Q |
What are your thoughts on
the changes to the
Supervisory Board in 2025?
|
|||
Q |
What is the Supervisory
Board’s focus for 2026
and beyond?
|
|||
ASML Annual Report 2025
|
94 |
 |
 |
|||
9 |
44% |
|||
Supervisory
Board meetings
|
Female
members
|
|||
(2024: 7)
|
(2024: 44%)
|
|||
 |
 |
|||
98% |
4.1 |
|||
Attendance
rate
|
Years average
tenure
|
|||
(2024: 95%)
|
(2024: 4.2)
|
|||
 |
||||
In a complex geopolitical
environment, our strategy
centered on resilience and
sustainable long-term value
creation.”
|
||||
Nils Andersen |
||||
Chair of the Supervisory Board |
||||
Supervisory Board focus in 2025 | |||
Throughout 2025, the Supervisory Board agenda was centered on the strategy
and its execution, financial and operational performance, business developments,
risk management, and its people and organization. Based on the strategic priorities
for ASML as agreed in the annual strategy review, several topics were extensively
discussed by means of deep dives, allowing a focused and in-depth review.
| |||
Strategy and sustainable long-term value creation |
|||
Focus areas 2025 |
|||
•Annual strategy review
•Geopolitical strategy
•ASML operating model
•Semiconductor industry and lithography market
•High Productivity Platform
|
•Technology and holistic lithography roadmap
•ERP migration
•Global footprint
•People strategy
•AI strategy
|
||
This year we have been elevating our strategy and how
we can continue to deliver long-term and sustainable
value for all our stakeholders. As part of our annual
strategy review, we have been refining our strategic
direction and choices for our key dimensions in
products, technology and operational excellence.
We reaffirmed our support for the overall strategic
direction and reviewed the principal strategic
challenges and priority areas for further development
during the annual strategy review. The Supervisory
Board provided its perspectives on several topics
such as semiconductor and lithography market
developments, Artificial Intelligence strategy, people
strategy, cost and flexibility, future technology and
innovation roadmap, and ASML’s global footprint.
|
For 2025, we remained fully aligned with ASML’s
strategy, anchored in six pillars that are ASML’s
strategic priorities: 1. Deepen customer trust;
2. Extend our technology and holistic product
roadmap; 3. Strengthen ecosystem relationships; 4.
Create an exceptional workplace; 5. Drive operational
excellence; and 6. Deliver on ESG sustainability.
As part of the annual strategy review, we held dedicated
workshops focused on our Global footprint, 3D device
integration, technology and holistic product roadmap,
semiconductor and lithography market, Artificial
Intelligence, High Productivity Platform and ERP
migration. These sessions enable an engaged and
focused discussion between the Supervisory Board
and Board of Management on key strategic matters,
and we highly value this way of contributing to the
strategic decision-making process.
|
||
ASML Annual Report 2025
|
95 |
Risk |
|||||
Focus areas 2025 |
|||||
Deep dive: Geopolitics
|
|||||
•Geopolitics
•Strategic risks
•(IT) Security
|
|||||
As a Supervisory Board we closely followed
geopolitical developments, including developments
related to export controls and tariffs and we looked
at potential impacts for ASML and mitigation
measures. We provided the Board of Management
with advice concerning amongst others advocacy,
scenarios, risk, engagement with stakeholders and
we also invited external experts on geopolitics to
provide their outside views. We highly value these
discussions, as they bring additional perspectives to
the Supervisory Board.
|
|||||
Overseeing the company’s risk management continues
to be a key element of our responsibilities, which
includes the risk management process and its
effectiveness. More information on risk management
can be found in the section of the Audit Committee.
The Supervisory Board’s discussions with the Board
of Management on strategy and execution are anchored
in risk awareness, factoring in external developments,
risk appetite, and mitigation approaches. In 2025, we
continued to pay close attention to the risks related to
geopolitical developments, not only looking at short
term developments, but also assessing the potential
long-term risks to ASML’s strategy and business.
Furthermore, the Supervisory Board spent time on
looking into strategic risks in the area of technology
and markets in dedicated deep dive sessions. On (IT)
Security, the Supervisory Board received regular updates
in accordance with our governance framework to
oversee and follow-up on related developments.
|
|||||
 |
|||||
Strategy and sustainable long-term value
creation (continued)
|
Spotlight: Artificial Intelligence (AI)
|
||
The Supervisory Board discussed with the Board of
Management developments and opportunities in the
area of AI. We performed a deep dive as part of our
annual strategy session and discussed ASML’s
partnership with, and investment in, Mistral AI. As
a Supervisory Board we are fully supportive of the
Company’s AI strategy, which is aimed at bringing
important benefits to ASML and our customers.
While the landscape we operate in remains volatile,
we are confident ASML is well-positioned to
effectively harness the AI-driven market momentum.
|
||
 |
||
Market and business developments |
ASML Annual Report 2025
|
96 |
Financial and operational performance |
|||
Focus areas 2025 |
|||
•Annual Results and Annual Report
•External audit report
•Statutory interim report
|
•Cash return including dividend policy, final and
interim dividend, share buyback program and
share cancellation
•ERP migration
•Cost, flexibility and order lead time
|
||
We reviewed the annual and interim Financial
statements, including non-financial information, the
quarterly results and accompanying press releases,
as well as the year-end audits of the US GAAP and
EU-IFRS Financial statements.
As part of the financial updates the Supervisory Board,
assisted by the Audit Committee, reviewed ASML’s
financing and cash-return policies. The Supervisory
Board approved the Board of Management’s proposals
for the final and interim dividends paid in 2025. Furthermore,
we monitored the execution of the 2023–2025 share
buyback program. The Supervisory Board also discussed
and approved the 2026-2028 share buyback program,
which was announced on January 28, 2026.
|
Given the challenging economic climate – and because
ASML decided to support customers and suppliers in
navigating this situation – attention was paid to free
cash flow.
Furthermore, we paid attention to the enterprise
resource planning (ERP) migration program, which
was identified as one of the key focus areas in
strategy execution.
Another area of focus during 2025 was cost and
flexibility. While our outlook for future growth remains
strong, short-term volatility will occur. We reviewed
together with the Board of Management the way to
address challenges related to a down cycle while at the
same time preparing for the upcycle when it occurs,
and we were kept informed about the efforts aimed at
reducing order lead times.
|
||
People and organization |
|||
Focus areas 2025 |
|||
•People strategy
•Results of employee engagement survey
•Operating model
•Composition of Board of Management
|
•Composition of the Supervisory Board
•Remuneration Policy for the Board of Management
•Remuneration of the Supervisory Board
|
||
The topics of people and organization continued to
be key areas of focus for the Supervisory Board – we
believe these are of critical importance for the future
success of ASML, building a great place to work, and
enabling the attraction and development of the right
talent. On several occasions, we were provided with
updates on Human Resources and Organization
(HR&O). Topics covered included the People Strategy,
progress made on the ASML leadership program, the
results of the annual employee engagement survey
and inclusion and diversity (I&D).
Specific attention was paid to evaluating the ASML
operating model following the changes in the customer
and supply chain organizations in 2023 and 2024 and
ASML’s leadership transition in 2024. The Supervisory
Board also advised the Board of Management in
relation to the intended changes in the Technology and
IT organizations as announced on January 28, 2026.
|
The Supervisory Board also discussed in their plenary
meetings the composition and remuneration of the
Board of Management and the Supervisory Board.
Detailed information about these topics can be found
in the reports of the Selection and Nomination
Committee and the Remuneration Committee.
|
||
ASML Annual Report 2025
|
97 |
Deep dive: Technology – 3D device integration |
||
As a Supervisory Board, we also reviewed industry
needs and the evolving customer roadmaps. Together
with the Board of Management, we recognize that,
while 2D packaging remains relevant, 3D packaging is
becoming more important. We fully support the Board
of Management entering into this technology. In line
with ASML’s plans to support our customers in the 3D
integration space, we saw ASML shipping its first
product serving the advanced packaging market.
We are pleased with the achievement of this
milestone, and we are proud of our people working
everyday to improve our ASML technology.
|
||
 |
||
Governance and stakeholders |
|||
Focus areas 2025 |
|||
•Supervisory Board evaluation
•AGM agenda
•Legal and Corporate governance developments
|
•AGM update
•Engagements with stakeholders
|
||
We regularly discussed ASML’s relationship with its
shareholders, and Supervisory Board members engaged
with shareholders throughout the year on topics such
as ASML’s strategy and performance, governance and
ESG. The Remuneration Committee engaged with a
variety of shareholders and other stakeholders regarding
remuneration. More information can be found in the
Remuneration Report.
A Supervisory Board delegation held two formal
meetings with the Works Council in 2024, exchanging
views on ASML’s strategy and priorities, and performance
and challenges – in particular related to the growth and
increased complexity of its business, as well as the
challenging external circumstances. In this context,
employee well-being and engagement were also
discussed. During 2025 we also engaged with the
Works Council on specific topics, such as Board of
Management and Supervisory Board remuneration
and we collaborated with the Works Council on the
topic of composition of the Supervisory Board, given
the Works Council’s (enhanced) right of recommendation,
which led to the appointment of Karien van Gennip as
a Supervisory Board member at the 2025 AGM.
|
We met with one of ASML’s key suppliers in an online
session, and the Chair of the Supervisory Board
attended the annual Suppliers’ Day.
At the end of 2025, we visited two of ASML’s customers
and were informed about their roadmaps, business
development and challenges.
These stakeholder interactions are highly valuable
for the Supervisory Board because they increase
our understanding of ASML’s stakeholders and the
challenges they face. The Supervisory Board also
discussed legal and corporate governance
developments, including the revised Dutch Corporate
Governance Code 2025, which introduced the risk
management statement.
|
||
ASML Annual Report 2025
|
98 |
Supervisory Board meeting attendance overview |
||||||||||
 |
||||||||||
98% |
||||||||||
Attendance rate |
||||||||||
Name |
Supervisory
Board
|
Audit
Committee
|
Remuneration
Committee
|
Selection and
Nomination
Committee
|
Technology
Committee
|
ESG
Committee
|
||||
Nils Andersen (Chair) |
9/9 |
10/10 |
n/a |
4/4 |
n/a |
n/a |
||||
Terri Kelly (Vice Chair) |
8/9 |
n/a |
7/7 |
4/4 |
n/a |
n/a |
||||
Birgit Conix |
9/9 |
10/10 |
n/a |
n/a |
n/a |
3/3 |
||||
Mark Durcan |
9/9 |
n/a |
n/a |
4/4 |
5/5 |
n/a |
||||
Warren East |
9/9 |
10/10 |
n/a |
4/4 |
5/5 |
n/a |
||||
Alexander Everke |
9/9 |
n/a |
7/7 |
n/a |
n/a |
3/3 |
||||
Karien van Gennip1
|
7/7 |
n/a |
4/4 |
n/a |
n/a |
2/2 |
||||
Jack de Kreij |
9/9 |
10/10 |
7/7 |
n/a |
n/a |
n/a |
||||
An Steegen |
8/9 |
n/a |
n/a |
n/a |
5/5 |
3/3 |
||||
Annet Aris1
|
2/2 |
n/a |
3/3 |
1/1 |
2/2 |
n/a |
||||
1.Attendance data are reported from each member’s formal date of appointment through the formal end date of their appointment, as
applicable. At the AGM held on 23 April 2025, Karien van Gennip was appointed to the Supervisory Board and joined the Remuneration
Committee and the ESG Committee. Annet Aris stepped down per the same AGM.
|
||||||||||
Meetings of the Supervisory Board
The majority of the Supervisory Board and
committee meetings held in 2025 were in person,
but the Supervisory Board also met virtually on some
occasions. In addition to plenary discussions, to
optimize interaction, break-out sessions in smaller
groups were organized for the discussion of key
strategic topics. To further maximize the time available
for discussion, preview videos were used alongside
written meeting materials as part of the meeting
preparation process.
|
ASML Annual Report 2025
|
99 |
Supervisory Board skills |
|||||||||||||||||||||||||||||||||
Board member |
General skills |
ASML skills |
|||||||||||||||||||||||||||||||
Nils Andersen (Chair) |
• |
• |
• |
• |
• |
• |
• |
||||||||||||||||||||||||||
Terri Kelly (Vice Chair) |
• |
• |
• |
• |
• |
• |
|||||||||||||||||||||||||||
Birgit Conix |
• |
• |
• |
• |
• |
• |
• |
||||||||||||||||||||||||||
Mark Durcan |
• |
• |
• |
• |
• |
• |
• |
• |
• |
||||||||||||||||||||||||
Warren East |
• |
• |
• |
• |
• |
• |
• |
• |
• |
• |
|||||||||||||||||||||||
Alexander Everke |
• |
• |
• |
• |
• |
• |
• |
• |
• |
• |
|||||||||||||||||||||||
Karien van Gennip |
• |
• |
• |
• |
• |
• |
|||||||||||||||||||||||||||
Jack de Kreij |
• |
• |
• |
• |
• |
• |
• |
• |
|||||||||||||||||||||||||
An Steegen |
• |
• |
• |
• |
• |
• |
• |
• |
|||||||||||||||||||||||||
(Former)
Executive
Board
member
of (listed)
international
company
|
Finance/
governance
|
Remuneration |
Human
resources
/employee
relations
|
IT/digital
/cyber
|
ESG |
Semiconductor
ecosystem
|
Deep
understanding
of semiconductor
technology
|
High-tech
manufacturing/
integrated
supply chain
management
|
Business
in Asia
|
||||||||||||||||||||||||

ASML Annual Report 2025
|
100 |

ASML Annual Report 2025
|
101 |
Evaluation process 2025 |
|||||||||||||||||||
1 |
Self-assessment |
2 |
Process |
3 |
Internal outreach |
4 |
Feedback |
5 |
Actions and follow-up |
||||||||||
Supervisory Board and
Selection and Nomination
Committee agree on the
scope and approach of
the review.
|
The process focuses on
the internal evaluation of the
functioning of the Supervisory
Board and its Committees.
|
The Supervisory Board and
the Board of Management
complete online surveys,
which are followed by 1-1
sessions with individual
Supervisory Board members.
|
The Supervisory Board
and Board of Management
consider the outcome of
the evaluation, assessing the
effectiveness of its practices
and functioning.
|
New initiatives to improve
the Supervisory Board’s
effectiveness are identified
and actioned, becoming
part of next year’s
evaluation process.
|
|||||||||||||||
Evaluation themes |
•SB composition
•SB meetings and support
|
•SB dynamics (including
with the BoM)
•SB Chair
|
•SB committees
•Strategic oversight
|
•Risk oversight
•Change and forward outlook
|
|||||||||||||||

ASML Annual Report 2025
|
102 |
Supervisory Board |
||||||||||
Audit
Committee
|
ESG
Committee
|
Remuneration
Committee
|
Selection and
Nomination
Committee
|
Technology
Committee
|
||||||
Assisting in
overseeing the integrity
and quality of our
financial reporting
and the effectiveness
of risk management
and controls
|
Overseeing the
ESG sustainability
strategy and
performance aimed
at sustainable, long-
term value creation
|
Overseeing the
development and
implementation of
the remuneration
policies, in cooperation
with the Audit and
Technology Committee
|
Assisting with
the preparation of
the selection criteria
and appointment
procedures for the
Supervisory Board
and Board of
Management
|
Providing advice
with respect to our
technology plans
required to execute
the business strategy
|
||||||
4 |
4 |
4 |
4 |
3 |
||||||
Members |
Members |
Members |
Members |
Members |
||||||
ASML Annual Report 2025
|
103 |
|
Audit Committee |
|||||
 |
The Audit Committee assists
the Supervisory Board in
overseeing the integrity and
quality of our financial reporting
and the effectiveness of the
internal risk management and
internal control systems.
|
||||
 |
Members |
||||
Jack de Kreij (Chair) |
|||||
Amidst geopolitical
uncertainty and
market volatility, we
focused on
disciplined risk
management and
resilience in support
of ASML's long-term
value creation.”
|
Nils Andersen |
||||
Birgit Conix |
|||||
Warren East |
|||||
The members of the Audit Committee are all
independent members of the Supervisory Board.
The Supervisory Board has determined that both Jack
de Kreij and Birgit Conix qualify as Audit Committee
financial experts pursuant to section 407 of the
Sarbanes-Oxley Act and Dutch statutory rules, taking
into consideration their extensive financial
backgrounds and experience.
|
|||||
Jack de Kreij |
|||||
Chair of the Audit Committee |
|||||
ASML Annual Report 2025
|
104 |

ASML Annual Report 2025
|
105 |
ASML Annual Report 2025
|
106 |
ESG Committee |
|||||
 |
The ESG Committee advises
the Supervisory Board in carrying
out its governance and oversight
responsibilities with regard to
sustainability, environmental,
social and governance matters.
|
||||
 |
Members |
||||
Birgit Conix (Chair) |
|||||
ASML continues
to embrace ESG
responsibly and
pragmatically,
safeguarding
compliance with
evolving regulations.”
|
Alexander Everke |
||||
An Steegen |
|||||
Karien van Gennip |
|||||
The ESG Committee may be supported by external
experts as well as those from within ASML, who act
as advisers on the subjects reviewed and discussed.
|
|||||
Birgit Conix |
|||||
Chair of the ESG Committee |
|||||

ASML Annual Report 2025
|
107 |
Supervisory activities in the area of ESG sustainability |
||||||||||
Supervisory Board
Oversight of overall company strategy aimed at sustainable long-term
value creation and company performance, including ESG aspects
|
||||||||||
Audit
Committee
|
ESG
Committee
|
Remuneration
Committee
|
Selection
and Nomination
Committee
|
Technology
Committee
|
||||||
Non-financial
reporting, ESG internal
controls and assurance
|
Oversight of ESG
strategy (execution)
and performance
|
ESG metrics as
part of executive
remuneration
|
Corporate
governance leadership
development
and succession
including diversity
|
Product and
technology roadmap-
related ESG matters/
programs (e.g. EUV
energy efficiency)
|
||||||
ASML Annual Report 2025
|
108 |
Selection and Nomination Committee |
|||||
 |
The Selection and Nomination
Committee assists the
Supervisory Board in relation
to its responsibilities regarding
the composition and functioning
of the Supervisory Board and
the Board of Management, and
the monitoring of corporate
governance developments.
|
||||
 |
Members |
||||
Nils Andersen (Chair) |
|||||
This year we
prioritized leadership
continuity and an
enhanced board
composition by
adding Marco Pieters
as CTO, with his
intended appointment
to the Board of
Management in 2026.”
|
Warren East |
||||
Mark Durcan |
|||||
Terri Kelly |
|||||
Each member is an independent member of our
Supervisory Board, in accordance with the Nasdaq
Listing Rules.
|
|||||
Nils Andersen |
|||||
Chair of the Selection and Nomination Committee |
|||||
ASML Annual Report 2025
|
109 |
ASML Annual Report 2025
|
110 |
Technology Committee |
|||||
 |
The Technology Committee
advises the Supervisory Board
with respect to the technology
plans required to execute
our business strategy.
|
||||
 |
Members |
||||
Mark Durcan (Chair) |
|||||
In Q4 2025,
the Technology
Committee visited
ASML's facility in
San Diego, US.”
|
Warren East |
||||
An Steegen |
|||||
The Technology Committee is supported by external
experts and those from within ASML, who act as
advisers on the subjects reviewed and discussed.
External experts may include representatives of
customers, suppliers and partners – increasing the
Committee’s understanding of the technology and
research required to develop our leading-edge systems.
|
|||||
Mark Durcan |
|||||
Chair of the Technology Committee |
|||||

ASML Annual Report 2025
|
111 |
Spotlight: Visit to San Diego – US |
||||
Q&A with Patrick O’Keeffe |
||||
CEO Cymer |
||||
Q: |
What was your key objective for
the Technology Committee visit?
|
|||
Patrick O’Keeffe: Together, we set out to show the
Technology Committee what we do in San Diego, the
lithography light source center of excellence for ASML
and how it all came about.
|
||||
Q: |
What topics did you discuss with the
Technology Committee?
|
|||
Patrick O’Keeffe: We shared an overview of our
people, products, and programs; updated the
Technology Committee on the business, and
explained how Cymer operates independently from
ASML yet remains closely connected in our work.
|
||||
Q: |
What stands out to you when you look
back on the visit?
|
|||
Patrick O’Keeffe: It was very valuable to interact with
the Technology Committee during their visit to ASML’s
San Diego site and to exchange perspectives on the
important work that we are doing and on how Cymer
contributes to ASML’s overall technology and
manufacturing network.
|
||||
 |
||||
ASML Annual Report 2025
|
112 |


ASML Annual Report 2025
|
113 |
Q |
What were the main
achievements of the
Remuneration Committee
in 2025?
|
Q |
Could you reflect on the
outcomes for the STI and
LTI this year?
|
ASML Annual Report 2025
|
114 |
Q |
How did you engage with
stakeholders while developing
the new policy for the Board
of Management?
|
Q |
What role does the
Remuneration Committee
play in attracting and retaining
the right talent on the Board
of Management?
|
Q |
How is remuneration of
the Board of Management
linked to pay for the broader
ASML workforce?
|
Q |
What were the key findings of
the societal benchmark that
was recently carried out?
|
Q |
How did you deal with
the inclusion and diversity
performance measures
following the issuance of the
US Executive Order, given the
differences between the US
and Europe?
|
Q |
Could you reflect on the
change to the Committee’s
composition in 2025?
|
Q |
Looking ahead, what is the
focus for 2026?
|

ASML Annual Report 2025
|
115 |
Our remuneration principles for performance support long-term success and sustainable value |
|||
Competitiveness |
Our remuneration structure and levels intend to be competitive
in the relevant labor market, while at the same time taking into
account societal trends and perceptions.
|
||
Alignment |
Our Remuneration Policy is aligned with the short-term and long-
term incentive policies for ASML senior management and other
ASML employees and takes into account internal relativities.
|
||
Long-term orientation |
Our Remuneration Policy and incentives focus on sustainable
and long-term value creation.
|
||
Compliance |
Our Remuneration Policy is intended to comply with the principles
of good corporate governance.
|
||
Simplicity and
transparency
|
Our Remuneration Policy and its execution are as simple as
possible and easily understandable to all stakeholders.
|
||
Linking remuneration to purpose and strategy |
||||||||||
Purpose |
Strategy |
Incentive
measures
|
Pay for
performance
|
|||||||
Unlocking
the potential
of people
and society
by pushing
technology
to new limits
|
Deepen
customer trust
|
Strategic orientation |
Remuneration
outcomes
|
|||||||
Extend our
technology and
holistic product
leadership
|
||||||||||
Financial measures |
||||||||||
Strengthen
ecosystem
relationships
|
||||||||||
Customer orientation |
||||||||||
Create an
exceptional
workplace
|
||||||||||
Technology leadership |
||||||||||
Drive operational
excellence
|
||||||||||
ESG measures |
||||||||||
Deliver on ESG
sustainability
|
||||||||||
How we performed in 2025 |
||||||||
Financial (based on US GAAP) |
Non-financial |
|||||||
€32.7bn |
€17.3bn |
€11.3bn |
8.4 |
|||||
Total sales
(2024: €28.3bn)
|
Gross profit
(2024: €14.5bn)
|
Income from operations
(2024: €9.0bn)
|
Technology Leadership
Index score
(2024: 8.0)
|
|||||
€12.7bn |
€24.73 |
€13.3bn |
78.9% |
|||||
Net cash provided by
operating activities
(2024: €11.2bn)
|
Earnings
per share
(2024: €19.25)
|
Cash and cash
equivalents and short-
term investments at
year end
(2024: €12.7bn)
|
Employee engagement
score (three-year rolling
average)
(2024: 78.9%)
|
|||||

ASML Annual Report 2025
|
116 |
We aim to align the total
remuneration for our Board of
Management to our business
strategy through a combination
of fixed pay and short- and long-
term incentives, underpinned
by stretching targets.
| |||
€24.3m |
|||
Total remuneration |
|||
142.5% |
|||
STI pay-out (% of target) |
|||
137.4% |
|||
LTI pay-out (% of target) |
|||
46:1
|
|||
CEO vs. average per FTE |
|||
Total remuneration 2025 (€’000s) |
|
Christophe D. Fouquet |
|
7,021 |
|
Frédéric J.M. Schneider-Maunoury |
|
4,366 |
|
Roger J.M. Dassen |
|
4,350 |
|
Wayne R. Allan |
|
4,463 |
|
James (Jim) P. Koonmen |
|
4,083 |
|
Remuneration summary (€’000s) |
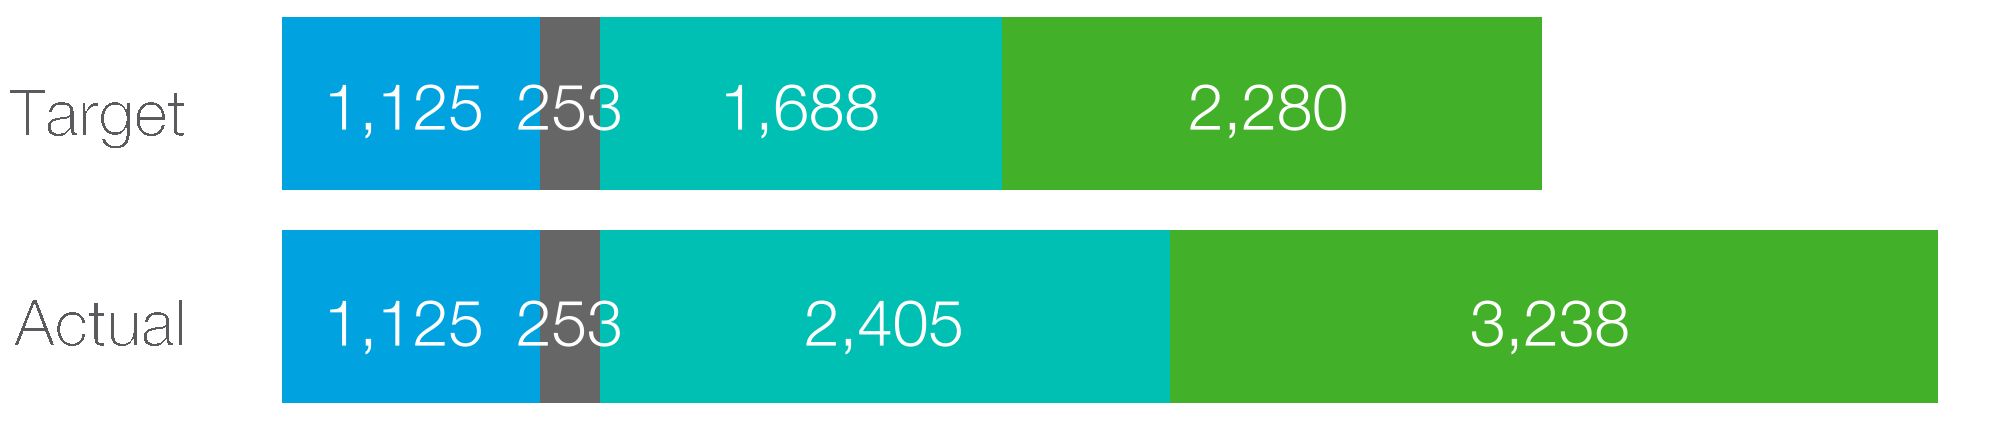


Base salary |
Pension and other benefits |
STI |
LTI |
|||||||||||
Stakeholder engagement in 2025 |
|||
During 2025, we consulted with our large
shareholders and other stakeholders, as well
as with our Board of Management. Engagements
took mainly place prior to the 2025 AGM.
|
|||
Shareholders |
|||
Number of organizations met |
9 |
||
Number of meetings |
12 |
||
Percentage of issued share capital owned1
|
20.5% |
||
Shareholders representatives and proxy
advisers
|
|||
Number of organizations met |
3 |
||
Number of meetings |
6 |
||
Works Council |
|||
Number of organizations met |
1 |
||
Number of meetings |
>5 |
||
ASML Annual Report 2025
|
117 |
Remuneration Committee |
|||||
 |
The Remuneration Committee
advises the Supervisory Board
and prepares the Supervisory
Board’s resolutions with respect
to the remuneration of the
Board of Management and
the Supervisory Board.
|
||||
 |
Members |
||||
Terri Kelly (Chair) |
|||||
The updated policy
further enables the
Committee to select
performance
measures to drive
sustainable long-term
value creation.”
|
Karien van Gennip |
||||
Alexander Everke |
|||||
Jack de Kreij |
|||||
Each member is an independent, non-executive member
of our Supervisory Board in accordance with the
Rules of procedure of the Remuneration Committee.
Ms. Kelly is neither a former member of our Board of
Management, nor a member of the management board
of another listed company. Currently, no member of
the Remuneration Committee is a member of the
management board of another Dutch listed company.
|
|||||
Terri Kelly |
|||||
Chair of the Remuneration Committee |
|||||
ASML Annual Report 2025
|
118 |

ASML Annual Report 2025
|
119 |
In this section of the Remuneration report, we provide an overview of the Remuneration Policy for the Board of Management, which was adopted by the General Meeting on April 23,
2025 and has been applicable as of January 1, 2025. It also contains information about the high level implementation of the Policy for 2025.
The full Policy can be found in the Governance section of our website.
| |
Remuneration as a strategic instrument |
Remuneration as a strategic instrument |
Reference group and market positioning |
Link to strategy / rationale |
2025 Policy |
Competitiveness
The remuneration structure and levels intend
to be competitive in the relevant labor market
while taking into account societal trends
and perceptions
|
Alignment
The Remuneration Policy is aligned with the short-
term and long-term incentive policy for ASML
senior management and other ASML employees,
taking into account internal relativities
|
|||
Long-term orientation
The Remuneration Policy focuses on
sustainable long-term value creation,
and incentives aligned accordingly
|
Compliance
The Remuneration Policy is intended to comply
with the principles of good corporate governance
|
|||
Simplicity and transparency
The Remuneration Policy and its execution are
as simple as possible and easily understandable
to all stakeholders
|
||||
2025 Implementation |
|||||
Reference group composition (as defined for 2025) |
|||||
European companies with focus on
long-term technology / industrial
engineering / R&D
|
ABB
Airbus
Dassault Systèmes
Medtronic
|
Novartis
Philips
Roche
Safran
|
SAP
Siemens
Schneider Electric
|
||
Semiconductor manufacturing /
design companies
|
Broadcom
Intel
Micron Technology
|
Qualcomm
STMicroelectronics
Infineon Technologies
|
NXP Semiconductors |
||
Semiconductor equipment |
Applied Materials |
KLA Corporation |
Lam Research |
||

ASML Annual Report 2025
|
120 |
Link to strategy / rationale |
Base salary |
Short-term
incentive (STI)
|
Long-term
incentive (LTI)
|
Retirement and
other benefits
|
Total
remuneration
|
||||
Total direct compensation (TDC) |
||||||||
2025 Policy |

STI performance measure
weighting
|

20-40% |
Link to strategy / rationale |
2025 Policy |
2025 Implementation |
||||
Attract, motivate and retain qualified
industry professionals for the Board of
Management in order to define and
achieve strategic goals.
|
The base salary constitutes the main fixed
element of the remuneration package and
is derived from, among others, the market
benchmark as well as the aimed TDC
positioning. Base salaries are reviewed
annually by the Supervisory Board.
|
Increased with 4% compared to 2024,
leading to the following base salaries
for 2025:
|
||||
60-80% |
Base salaries 2025 | |
CEO |
€1,125,100 |
Other BoM
member*
|
€784,000 |
*$849,323 for J.P. Koonmen. We refer to
the ‘Total remuneration Board of
Management’ table in this regard.
| |
Weight |
||
Financial measures |
60-80% |
|
Non-financial measures |
20-40% |
2025 Implementation |
STI target levels |

CEO |
|
Other BoM
members
|
|
STI performance measure
weighting
|
40% |
60% |
Weight |
||
Financial measures |
60% |
|
Non-financial measures |
40% |

ASML Annual Report 2025
|
121 |
Link to strategy / rationale |
2025 Policy |

LTI performance measure
weighting
|

20-40% |
20-30% |
30-50% |
Weight |
||
Relative TSR |
20-30% |
|
Financial strategic value drivers |
30-50% |
|
Non-financial measures |
20-40% |
2025 Implementation |
LTI 2025-2027 target levels |

CEO |
|
Other BoM
members
|
|
LTI 2025-2027 performance
measure weighting
|
25% |
40% |
35% |
Relative TSR |
25% |
|
Financial strategic value drivers |
35% |
|
Non-financial measures |
40% |
% Variable |
|||
2025 levels
for maximum
performance
|
P |
89% |
|
M |
86% |
||
2025 levels
for on target
performance
|
P |
81% |
|
M |
77% |
||
2025 levels
for threshold
performance
|
P |
64% |
|
M |
58% |
||
Below
threshold
performance
|
P |
00% |
|
M |
00% |
||


P = President and CEO
|
M = Other members
|
||
Base salary |
STI |
LTI |
|

ASML Annual Report 2025
|
122 |
Link to strategy / rationale |
2025 Policy |
|||
Contribute to the competitiveness of the overall remuneration
package and create alignment with market practice.
|
The pension arrangements and other benefits are aimed at
reflecting local market practice and may evolve year-over-year.
|
Link to strategy / rationale |
2025 Policy |
|||
Requirement for a minimum share ownership by members of the
Board of Management. Ensuring alignment between the interests of
the Board of Management members and our sustainable long-term
value creation.
|
•President and CEO: four times annual base salary
•Other Board of Management members: three times annual
base salary
•Five-year period to comply.
|
2025 Implementation |
||||||
In 2025, with the exception of Jim Koonmen who participates in the US Employees’ Savings and Retirement Plan, all Board of Management
members participated in the pension arrangement for the Board of Management, based on the ‘excedent’ (supplementary) arrangement for
our employees in the Netherlands. It consists of a gross pension element (for the salary below approximately €138,000 minus the threshold)
and a net pension element (for the salary above approximately €138,000).
Expenses reimbursed by ASML in 2025 included company car costs, representation allowances, social security costs, health and disability
insurance costs and other benefits which reflect local market practice.
|
||||||
2025 Implementation |
||||||
The table below show the share ownership guidelines, net number of shares and share ownership ratio of each Board of Management member
as per December 31, 2025. All Board of Management members complied with the minimum ownership guidelines per year-end 2025.
|
||||||
Board of Management |
Ownership
guidelines
|
2025 base
salary
(in € thousands)
|
Number of shares3
|
Ownership ratio1
|
||
C.D. Fouquet |
4x base |
1.125 |
7,040 |
5.77 |
||
F.J.M. Schneider-Maunoury |
3x base |
784 |
19,711 |
23.17 |
||
R.J.M. Dassen |
3x base |
784 |
6,643 |
7.81 |
||
W.R. Allan |
3x base |
784 |
4,239 |
4.98 |
||
J.P. Koonmen2
|
3x base |
757 |
7,621 |
9.28 |
||
1.The Ownership ratio is calculated by multiplying the net number of shares with the share price of €921.40 (based on the Euronext
Amsterdam closing share price of December 31, 2025) and dividing this by the 2025 base salary.
2.James (Jim) P. Koonmen’s Long-Term Incentive (LTI) grants are vested in ASML NY shares (listed on the US Nasdaq). His ownership
ratio, calculated based on his 2025 US dollar base salary of $849,323 and the ASML NY share price of $1,069.86 (based on the closing
share price of December 31, 2025), is 9.60.
3.Includes vested LTI shares and may include shares acquired outside of ASML’s share plans.
|
||||||
ASML Annual Report 2025
|
123 |

Annual plan
2025
|
Performance
metrics selected
|
EBIT %
Customer
Orientation
Strategic
Orientation
|
Performance
assessment
by SB
|
ASML Annual Report 2025
|
124 |
Performance metric |
Weight |
Performance targets1
|
Actual
performance
|
Pay-out2
% of target
|
||
Threshold |
Target |
Stretch |
||||
EBIT Margin (%) (Non-GAAP measure) |
60% |
28.0% |
30.5% |
33.0% |
34.6% |
150.0% |
Customer Orientation |
20% |
113.1% |
||||
Consisting of the following weighted sub-targets: |
||||||
Adoption of multibeam |
2.5% |
* |
75.0% |
|||
DUV Cost and Competitiveness |
2.5% |
* |
120.0% |
|||
EUV 0.33 NA maturity |
2.5% |
* |
110.0% |
|||
EUV 0.55 NA insertion |
2.5% |
* |
0.0% |
|||
ASML Customer Trust Survey |
10% |
* |
150% |
|||
Strategic Orientation |
20% |
149.2% |
||||
Consisting of the following weighted sub-targets: |
||||||
Enterprise Resource Planning |
5% |
* |
150.0% |
|||
High Productivity Platform |
5% |
* |
148.9% |
|||
New Product Quality |
5% |
* |
147.9% |
|||
Global Supply Chain Development |
5% |
* |
150.0% |
|||
Total |
100% |
142.5% |
||||
Performance metric |
Weight |
EBIT Margin (%) (Non-GAAP measure) |
60% |
Customer Orientation |
20% |
Consisting of the following weighted sub-targets: |
|
Adoption of multibeam |
2.5% |
DUV Cost and Competitiveness |
2.5% |
EUV 0.33 NA maturity |
2.5% |
EUV 0.55 NA maturity |
2.5% |
ASML Customer Trust Survey |
10% |
Strategic Orientation |
20% |
Consisting of the following weighted sub-targets: |
|
Enterprise Resource Planning |
5% |
Strategic Product Development and Cost of Technology |
5% |
New Product Quality |
5% |
Global Supply Chain Development |
5% |
Total |
100% |
ASML Annual Report 2025
|
125 |
Target-setting process | |||||||
Review company
strategy in line with
financial plan
|
Determine
business priorities
for upcoming
three-year
performance
period
|
Determine
LTI performance
measures for
three-year
performance
period
|
Finalize long-term
financial plan
|
||||
Step 1 |
Step 2 |
Step 3 |
Step 4 |
||||

ASML Annual Report 2025
|
126 |
Performance metric |
Performance targets |
|||
Weight |
Threshold |
Target |
Stretch |
|
Relative TSR |
25% |
As per Remuneration Policy |
||
ROAIC (2025–2027)1 (Non-GAAP measure)
|
35% |
35% |
50% |
65% |
ESG Measures |
20% |
|||
Consisting of equally weighted sub-metrics: |
||||
Gender diversity2:
|
6.7% |
|||
• % Inflow of women JG 9+ (external and
internal inflow)
|
23% |
25% |
27% |
|
• % Representation of women in JG 13+ |
14% |
15% |
16% |
|
Engagement and inclusion: |
6.7% |
|||
• Employee engagement
(Relative benchmark target vs. top 25%
performing companies (3 year rolling))
|
—4p.p |
—2p.p |
0p.p |
|
• Inclusion score
(Relative benchmark target vs. top 25%
performing companies (3 year rolling))
|
—4p.p |
—2p.p |
0p.p |
|
EUV energy use per wafer pass (kWh per
wafer pass)
|
6.7% |
5.0 |
4.7 |
4.5 |
Technology Leadership Index |
20% |
4 |
6 |
10 |
Total |
100% |
|||
Vesting of shares process |
||||||||||||||||
Grant
date
|
Vesting period
within three
years
|
Vesting
date
|
Holding period
two years
|
End of transfer
restrictions
|
||||||||||||
•In the period between the grant date
and the vesting date, performance shares
are conditional
|
•Performance shares are delivered to the
participant. However, transfer restrictions
apply: acquired performance shares cannot
be transferred during the holding period
•Participant is allowed to sell sufficient
performance shares to cover tax obligations
|
|||||||||||||||

ASML Annual Report 2025
|
127 |
Performance targets |
Actual
performance
|
Pay-out %2
% of target
|
|||||
Performance metric |
Weight |
Threshold |
Target |
Stretch |
|||
Relative TSR |
30% |
115.9% |
202.8% |
365.4% |
203.9% |
100.7% |
|
Normalized three-year average cash
conversion rate %1 (Non-GAAP measure)
|
30% |
85.0% |
90.0% |
95.0% |
92.0% |
140.9% |
|
Technology Leadership Index |
20% |
4 |
6 |
10 |
8.4 |
160.1% |
|
ESG Measures |
20% |
164.3% |
|||||
Consisting of the following sub-measures: |
|||||||
Net zero emission (scope 1+2) with
minimum compensation
|
6.7% |
<37kt
compensation
|
<30kt
compensation
|
<20kt
compensation
|
19.4 |
200.0% |
|
Employee engagement
(Relative benchmark target vs. top 25%
performing companies (3 year rolling))
|
6.7% |
-4% |
-2% |
0% |
-2.3% |
93.0% |
|
Total and JG9+ female inflow 3
|
6.7% |
22% |
24% |
26% |
28.8% |
200.0% |
|
Total |
100% |
137.4% |
4 |
||||
Performance targets |
||||
Performance metric |
Weight |
Threshold |
Target |
Stretch |
Relative TSR |
25% |
As per Remuneration Policy |
||
ROAIC (2026–2028)1 (Non-GAAP measure)
|
35% |
45% |
55% |
65% |
ESG measures2
|
20% |
|||
Consisting of the following sub-measures: |
||||
EUV EXE:5200C single patterning (kWh per wafer pass,
with NXE:3800E multi-patterning as baseline)
|
5.0% |
8.8 |
8.6 |
8.4 |
Localization of service part repair, reducing related
logistics emissions by up to 26% annually (% of service
parts that were sent for repair locally)
|
5.0% |
50% |
60% |
70% |
Gender diversity: |
5.0% |
|||
• % Inflow of women JG 9+ (external and internal inflow) |
24% |
26% |
28% |
|
• % Representation of women in JG 13+ |
15.5% |
16.5% |
17.5% |
|
Engagement and inclusion: |
5.0% |
|||
• Employee engagement: delta between ASML and
benchmark 3 year rolling average (benchmark is top
25% performing companies)
|
—4p.p. |
—2 p.p. |
0 p.p. |
|
• Inclusion: delta between ASML and benchmark 3 year
rolling average (benchmark is top 25% performing
companies)
|
—4p.p. |
—2 p.p. |
0 p.p. |
|
Technology Leadership Index |
20% |
4 |
6 |
10 |
Total |
100% |
|||
ASML Annual Report 2025
|
128 |
Board of Management member |
Financial year |
Base salary |
Pension |
Other benefits |
Total fixed |
% Fixed |
STI |
LTI |
Total variable |
% Variable |
Ratio
fixed/variable
|
Total
remuneration
|
||
C.D. Fouquet1
|
2025 |
1,125 |
181 |
72 |
1,378 |
19.6% |
2,405 |
3,238 |
5,643 |
80.4% |
0.24 |
7,021 |
||
2024 |
979 |
111 |
63 |
1,153 |
21.2% |
1,532 |
2,747 |
4,279 |
78.8% |
0.27 |
5,432 |
|||
2023 |
725 |
82 |
56 |
863 |
24.5% |
883 |
1,773 |
2,656 |
75.5% |
0.32 |
3,519 |
|||
F.J.M. Schneider-Maunoury |
2025 |
784 |
171 |
59 |
1,014 |
23.2% |
1,229 |
2,123 |
3,352 |
76.8% |
0.30 |
4,366 |
||
2024 |
754 |
161 |
51 |
966 |
23.0% |
1,026 |
2,217 |
3,243 |
77.0% |
0.30 |
4,209 |
|||
2023 |
725 |
148 |
45 |
918 |
25.7% |
883 |
1,773 |
2,656 |
74.3% |
0.35 |
3,574 |
|||
R.J.M. Dassen |
2025 |
784 |
146 |
68 |
998 |
22.9% |
1,229 |
2,123 |
3,352 |
77.1% |
0.30 |
4,350 |
||
2024 |
754 |
133 |
60 |
947 |
22.6% |
1,026 |
2,217 |
3,243 |
77.4% |
0.29 |
4,190 |
|||
2023 |
725 |
121 |
56 |
902 |
25.4% |
883 |
1,773 |
2,656 |
74.6% |
0.34 |
3,558 |
|||
W.R. Allan2
|
2025 |
784 |
138 |
189 |
5 |
1,111 |
24.9% |
1,229 |
2,123 |
3,352 |
75.1% |
0.33 |
4,463 |
|
2024 |
754 |
133 |
163 |
5 |
1,050 |
26.9% |
1,026 |
1,821 |
2,847 |
73.1% |
0.37 |
3,897 |
||
2023 |
492 |
82 |
38 |
612 |
29.6% |
599 |
860 |
1,459 |
70.4% |
0.42 |
2,071 |
|||
J.P. Koonmen3,4
|
2025 |
757 |
12 |
433 |
5 |
1,202 |
29.4% |
1,186 |
1,695 |
6 |
2,881 |
70.6% |
0.42 |
4,083 |
2024 |
516 |
8 |
206 |
5 |
730 |
31.1% |
702 |
915 |
1,617 |
68.9% |
0.45 |
2,347 |
||
Total Board of Management |
2025 |
4,234 |
648 |
821 |
5,703 |
23.5% |
7,278 |
11,302 |
18,580 |
76.5% |
0.31 |
24,283 |
||
2024 |
3,757 |
546 |
543 |
4,846 |
24.1% |
5,312 |
9,917 |
15,229 |
75.9% |
0.32 |
20,075 |
|||
2023 |
2,667 |
433 |
195 |
3,295 |
25.9% |
3,248 |
6,179 |
9,427 |
74.1% |
0.35 |
12,722 |
ASML Annual Report 2025
|
129 |
Former Board of Management member |
Financial year |
Base salary |
Pension |
Other benefits |
Total fixed |
% Fixed |
STI |
LTI |
Total variable |
% Variable |
Ratio
fixed/variable
|
Total
remuneration
|
P.T.F.M. Wennink1,2,3
|
2024 |
345 |
82 |
119 |
546 |
10.9% |
494 |
3,953 |
4,447 |
89.1% |
0.12 |
4,993 |
2023 |
1,040 |
248 |
61 |
1,349 |
22.7% |
1,400 |
3,192 |
4,592 |
77.3% |
0.29 |
5,941 |
|
M.A. van den Brink1,2
|
2024 |
345 |
82 |
111 |
538 |
10.8% |
494 |
3,953 |
4,447 |
89.2% |
0.12 |
4,985 |
2023 |
1,040 |
248 |
59 |
1,347 |
22.7% |
1,400 |
3,192 |
4,592 |
77.3% |
0.29 |
5,939 |
|
Total former Board of Management |
2024 |
690 |
164 |
230 |
1,084 |
10.9% |
988 |
7,906 |
8,894 |
89.1% |
0.12 |
9,978 |
2023 |
2,080 |
496 |
120 |
2,696 |
22.7% |
2,800 |
6,384 |
9,184 |
77.3% |
0.29 |
11,880 |
ASML Annual Report 2025
|
130 |
Of market-based element |
Of non-market-based elements |
||||||||||||
Board of Management member |
Grant date |
Status |
Full control |
Number of
shares at target
|
Fair value at
grant date
|
Number of
shares at target
|
Fair value at
grant date
|
Total number of
shares at target
|
Total number of
shares at
maximum
(200%)
|
Vesting date |
Number of
vested shares
on publication
date3
|
Year-end
closing share
price in year of
vesting3
|
End of lock-up
date
|
C.D. Fouquet |
4/23/25 |
Conditional |
No |
1,157 |
918.9 |
3,472 |
567.2 |
4,629 |
9,258 |
1/1/28 |
n/a |
n/a |
1/1/30 |
1/23/24 |
Conditional |
No |
1,065 |
939.9 |
2,485 |
692.7 |
3,550 |
7,100 |
1/1/27 |
n/a |
n/a |
1/1/29 |
|
1/27/23 |
Conditional1
|
No |
731 |
901.9 |
1,706 |
603.4 |
2,437 |
4,874 |
1/1/26 |
3,348 |
921.4 |
1/1/28 |
|
4/29/22 |
Unconditional |
No |
483 |
596.0 |
1,126 |
533.5 |
1,609 |
3,217 |
1/1/25 |
2,128 |
678.7 |
1/1/27 |
|
1/22/21 |
Unconditional |
No |
717 |
635.6 |
1,670 |
454.9 |
2,387 |
4,774 |
1/1/24 |
3,763 |
681.7 |
1/1/26 |
|
F.J.M. Schneider-Maunoury |
4/23/25 |
Conditional |
No |
660 |
918.9 |
1,979 |
567.2 |
2,639 |
5,278 |
1/1/28 |
n/a |
n/a |
1/1/30 |
1/23/24 |
Conditional |
No |
668 |
939.9 |
1,559 |
692.7 |
2,227 |
4,453 |
1/1/27 |
n/a |
n/a |
1/1/29 |
|
1/27/23 |
Conditional1
|
No |
731 |
901.9 |
1,706 |
603.4 |
2,437 |
4,874 |
1/1/26 |
3,348 |
921.4 |
1/1/28 |
|
4/29/22 |
Unconditional |
No |
483 |
596.0 |
1,126 |
533.5 |
1,609 |
3,217 |
1/1/25 |
2,128 |
678.7 |
1/1/27 |
|
1/22/21 |
Unconditional |
No |
717 |
635.6 |
1,670 |
454.9 |
2,387 |
4,774 |
1/1/24 |
3,763 |
681.7 |
1/1/26 |
|
R.J.M. Dassen |
4/23/25 |
Conditional |
No |
660 |
918.9 |
1,979 |
567.2 |
2,639 |
5,278 |
1/1/28 |
n/a |
n/a |
1/1/30 |
1/23/24 |
Conditional |
No |
668 |
939.9 |
1,559 |
692.7 |
2,227 |
4,453 |
1/1/27 |
n/a |
n/a |
1/1/29 |
|
1/27/23 |
Conditional1
|
No |
731 |
901.9 |
1,706 |
603.4 |
2,437 |
4,874 |
1/1/26 |
3,348 |
921.4 |
1/1/28 |
|
4/29/22 |
Unconditional |
No |
483 |
596.0 |
1,126 |
533.5 |
1,609 |
3,217 |
1/1/25 |
2,128 |
678.7 |
1/1/27 |
|
1/22/21 |
Unconditional |
No |
717 |
635.6 |
1,670 |
454.9 |
2,387 |
4,774 |
1/1/24 |
3,763 |
681.7 |
1/1/26 |
|
W.R. Allan |
4/23/25 |
Conditional |
No |
660 |
918.9 |
1,979 |
567.2 |
2,639 |
5,278 |
1/1/28 |
n/a |
n/a |
1/1/30 |
1/23/24 |
Conditional |
No |
668 |
939.9 |
1,559 |
692.7 |
2,227 |
4,453 |
1/1/27 |
n/a |
n/a |
1/1/29 |
|
1/27/23 |
Conditional1
|
No |
731 |
901.9 |
1,706 |
603.4 |
2,437 |
4,874 |
1/1/26 |
3,348 |
921.4 |
1/1/28 |
|
J.P. Koonmen2
|
4/23/25 |
Conditional |
No |
673 |
918.9 |
2,020 |
567.2 |
2,693 |
5,386 |
1/1/28 |
n/a |
n/a |
1/1/30 |
1/23/24 |
Conditional |
No |
676 |
939.9 |
1,578 |
692.7 |
2,255 |
4,509 |
1/1/27 |
n/a |
n/a |
1/1/29 |
|
ASML Annual Report 2025
|
131 |
Of market-based element |
Of non-market-based elements |
||||||||||||
Former Board of Management member |
Grant date |
Status |
Full control |
Number of
shares at
target
|
Fair value at
grant date
|
Number of
shares at
target
|
Fair value at
grant date
|
Total number
of shares at
target
|
Total number of
shares at
maximum
(200%)
|
Vesting date |
Number of
vested shares
on publication
date3
|
Year-end
closing share
price in year of
vesting3
|
End of lock-up
date
|
P.T.F.M. Wennink1
|
1/23/24 |
Conditional |
No |
316 |
939.9 |
738 |
692.7 |
1,054 |
2,109 |
1/1/27 |
n/a |
n/a |
1/1/29 |
1/27/23 |
Conditional2
|
No |
1,049 |
901.9 |
2,447 |
603.4 |
3,496 |
6,991 |
1/1/26 |
4,802 |
921.4 |
1/1/28 |
|
4/29/22 |
Unconditional |
No |
709 |
596.0 |
1,655 |
533.5 |
2,364 |
4,727 |
1/1/25 |
3,126 |
678.7 |
1/1/27 |
|
1/22/21 |
Unconditional |
No |
1,053 |
635.6 |
2,455 |
454.9 |
3,508 |
7,016 |
1/1/24 |
5,531 |
681.7 |
1/1/26 |
|
M.A. van den Brink1
|
1/23/24 |
Conditional |
No |
316 |
939.9 |
738 |
692.7 |
1,054 |
2,109 |
1/1/27 |
n/a |
n/a |
1/1/29 |
1/27/23 |
Conditional2
|
No |
1,049 |
901.9 |
2,447 |
603.4 |
3,496 |
6,991 |
1/1/26 |
4,802 |
921.4 |
1/1/28 |
|
4/29/22 |
Unconditional |
No |
709 |
596.0 |
1,655 |
533.5 |
2,364 |
4,727 |
1/1/25 |
3,126 |
678.7 |
1/1/27 |
|
1/22/21 |
Unconditional |
No |
1,053 |
635.6 |
2,455 |
454.9 |
3,508 |
7,016 |
1/1/24 |
5,531 |
681.7 |
1/1/26 |
|
Instrument |
Performance shares |
||
Grant |
Conditional grant on an annual basis based on maximum-achievable opportunity. The number of performance shares to be conditionally awarded is calculated using the volume-weighted average share price during
the last quarter of the year preceding the conditional award.
|
||
Grant date |
Date on which the performance shares are conditionally granted. |
||
Performance period |
Period of three years over which the achievement of the predefined performance targets is measured. |
||
Vesting |
The shares will become unconditional after the end of the performance period, depending on the level of achievement of the predetermined performance targets. |
||
Holding period |
The minimum holding period is two years after the vesting date. |
||
Upon termination of contract, the transfer restrictions will remain in place during the holding period except in case of decease. |
|||
In case a tax payment is due by the members of the Board of Management over the retrieved variable income, performance shares may be partially sold at vesting (‘sell to cover’) in accordance with the law and
internal regulations.
|
ASML Annual Report 2025
|
132 |
For the year ended December 31 (€, in thousands) |
2021 |
2022 |
Change (in %) |
2023 |
Change (in %) |
2024 |
Change (in %) |
2025 |
Change (in %) |
Net sales |
18,610,994 |
21,173,448 |
13.8 |
27,558,506 |
30.2 |
28,262,877 |
2.6 |
32,667,251 |
15.6 |
Net income based on US GAAP |
5,883,177 |
5,624,209 |
(4.4) |
7,838,994 |
39.4 |
7,571,563 |
(3.4) |
9,609,432 |
26.9 |
Net income based on EU-IFRS |
6,134,595 |
6,395,775 |
4.3 |
8,115,168 |
26.9 |
8,348,971 |
2.9 |
10,212,993 |
22.3 |
ASML share price (closing price on Euronext Amsterdam in €) |
706.7 |
503.8 |
(28.7) |
681.7 |
35.3 |
678.7 |
(0.4) |
921.4 |
35.8 |
Average number of payroll employees in FTEs |
28,223 |
33,071 |
17.2 |
38,805 |
17.3 |
41,697 |
7.5 |
43,267 |
3.8 |
Employee engagement score |
78.0% |
77.9% |
(0.1) |
80.3% |
3.1 |
78.4% |
(2.4) |
78.0% |
(0.5) |
Remuneration C.D. Fouquet (CEO)1
|
3,137 |
2,798 |
(10.8) |
3,519 |
25.8 |
5,432 |
54.4 |
7,021 |
29.3 |
Remuneration F.J.M. Schneider-Maunoury |
3,158 |
2,844 |
(9.9) |
3,574 |
25.7 |
4,209 |
17.8 |
4,366 |
3.7 |
Remuneration R.J.M. Dassen |
3,800 |
2,834 |
(25.4) |
3,558 |
25.5 |
4,190 |
17.8 |
4,350 |
3.8 |
Remuneration W.R. Allan3
|
n/a |
n/a |
n/a |
2,071 |
n/a |
3,897 |
88.2 |
4,463 |
14.5 |
Remuneration J.P. Koonmen4
|
n/a |
n/a |
n/a |
n/a |
n/a |
2,347 |
n/a |
4,083 |
74.0 |
Remuneration P.T.F.M. Wennink (former CEO)2
|
4,820 |
4,280 |
(11.2) |
5,941 |
38.8 |
4,993 |
(16.0) |
n/a |
n/a |
Remuneration M.A. van den Brink |
4,819 |
4,279 |
(11.2) |
5,939 |
38.8 |
4,985 |
(16.1) |
n/a |
n/a |
Average remuneration per FTE based on US GAAP
|
122 |
125 |
2.5 |
138 |
10.4 |
145 |
5.1 |
153 |
5.5 |
Average remuneration per FTE based on EU-IFRS |
122 |
118 |
(3.3) |
143 |
21.2 |
145 |
1.4 |
153 |
5.5 |
Internal pay ratio (CEO versus employee remuneration based on US GAAP)5
|
40 |
34 |
(15.0) |
43 |
26.5 |
40 |
(7.0) |
46 |
15.0 |
Internal pay ratio (CEO versus employee remuneration based on EU-IFRS)5
|
40 |
36 |
(10.0) |
42 |
16.7 |
40 |
(4.8) |
46 |
15.0 |
ASML Annual Report 2025
|
133 |
ASML Annual Report 2025
|
134 |

ASML Annual Report 2025
|
135 |
Fixed remuneration |
|||||||
Description in 2023 Remuneration Policy |
2024 |
2025 |
1 |
||||
Fixed remuneration paid in cash including a base membership fee,
committee fees and additional compensation contingent on
Supervisory Board members’ activities and responsibilities.
|
Chair of Supervisory Board |
€140,000 |
€165,000 |
||||
Vice Chair of Supervisory Board |
€100,000 |
€125,000 |
|||||
Member of Supervisory Board |
€80,000 |
€105,000 |
|||||
Chair Audit Committee |
€27,000 |
€32,000 |
|||||
Member Audit Committee |
€18,000 |
€22,000 |
|||||
Chair of other committees |
€22,000 |
€26,000 |
|||||
Member of other committees |
€16,000 |
€18,000 |
|||||
Extra allowance for intercontinental meetings |
|||||||
Description in 2023 Remuneration Policy |
2024 |
2025 |
1 |
||||
Extra, fixed allowance paid in connection with additional time
commitment for intercontinental travel.
|
For each meeting that involves
intercontinental travel.
|
€5,000 |
€5,000 |
||||
Expenses |
|||||||
Description in 2023 Remuneration Policy |
2024 |
2025 |
1 |
||||
Expenses incurred in relation to meeting attendance are reimbursed.
In addition, a fixed net cost allowance may be granted, covering
certain pre-defined out-of-pocket expenses.
|
Fixed net cost allowance |
||||||
Chair of Supervisory Board |
€1,980 |
No longer
applicable
|
|||||
Member of Supervisory Board |
€1,380 |
No longer
applicable
|
|||||
Remuneration in special circumstances |
|||||||
The Supervisory Board may, upon recommendation of the
Remuneration Committee, grant additional remuneration in special
circumstances. This may concern granting increased Supervisory
Board and/or committee fees, depending on the character of the
circumstances – for instance, if there were a significant increase
in time investment by its members.
|
The additional annual remuneration per member will be capped at
one time the amount of the annual Supervisory Board membership
fee payable to such member.
The Supervisory Board considers an increase of at least 25% a
significant increase in time investment.
|
||||||
Loans and guarantees |
||||||
Description |
Value |
|||||
No (personal) loans or guarantees or the like will be granted. |
Not applicable |
|||||
Shares and share ownership |
||||||
Description |
Value |
|||||
No (rights to) shares are granted by way of remuneration. Any
holding of ASML shares is for the purpose of long-term investment.
Any trading activity is subject to our Insider Trading Rules.
|
Not applicable |
|||||
Other arrangements |
||||||
Description |
Value |
|||||
(Re)appointment based on Dutch law and our Articles of
Association. No clawback, severance or change in control
arrangements is in place.
|
Not applicable |
|||||
ASML Annual Report 2025
|
136 |
Supervisory Board member |
Membership fees
2025
|
Committee fees
2025
|
Allowances 20251
|
Ratio fixed/variable
2025
|
Total remuneration
2025
|
Total remuneration
2024
|
Total remuneration
2023
|
Total remuneration
2022
|
Total remuneration
2021
|
N.S. Andersen |
159 |
46 |
5 |
1.0 |
210 |
187 |
123 |
n/a |
n/a |
T.L. Kelly |
113 |
43 |
15 |
1.0 |
171 |
129 |
137 |
126 |
107 |
B.M. Conix |
99 |
46 |
5 |
1.0 |
150 |
126 |
109 |
99 |
63 |
D.M. Durcan |
99 |
43 |
15 |
1.0 |
157 |
144 |
137 |
126 |
112 |
D.W.A. East |
99 |
52 |
10 |
1.0 |
161 |
120 |
119 |
99 |
93 |
J.P. de Kreij |
99 |
48 |
5 |
1.0 |
152 |
129 |
85 |
n/a |
n/a |
A.F.M. Everke |
99 |
35 |
5 |
1.0 |
139 |
118 |
104 |
66 |
n/a |
A.L. Steegen |
99 |
35 |
10 |
1.0 |
144 |
118 |
109 |
66 |
n/a |
C.E.G. van Gennip |
72 |
25 |
10 |
1.0 |
107 |
n/a |
n/a |
n/a |
n/a |
Total |
938 |
373 |
80 |
1.0 |
1,391 |
1,071 |
923 |
582 |
375 |
Former Supervisory Board member |
Total remuneration
2025
|
Total remuneration
2024
|
Total remuneration
2023
|
A.P. Aris |
48 |
154 |
152 |
G.J. Kleisterlee |
n/a |
n/a |
61 |
R.D. Schwalb |
n/a |
n/a |
37 |
Total |
48 |
154 |
250 |
ASML Annual Report 2025
|
137 |
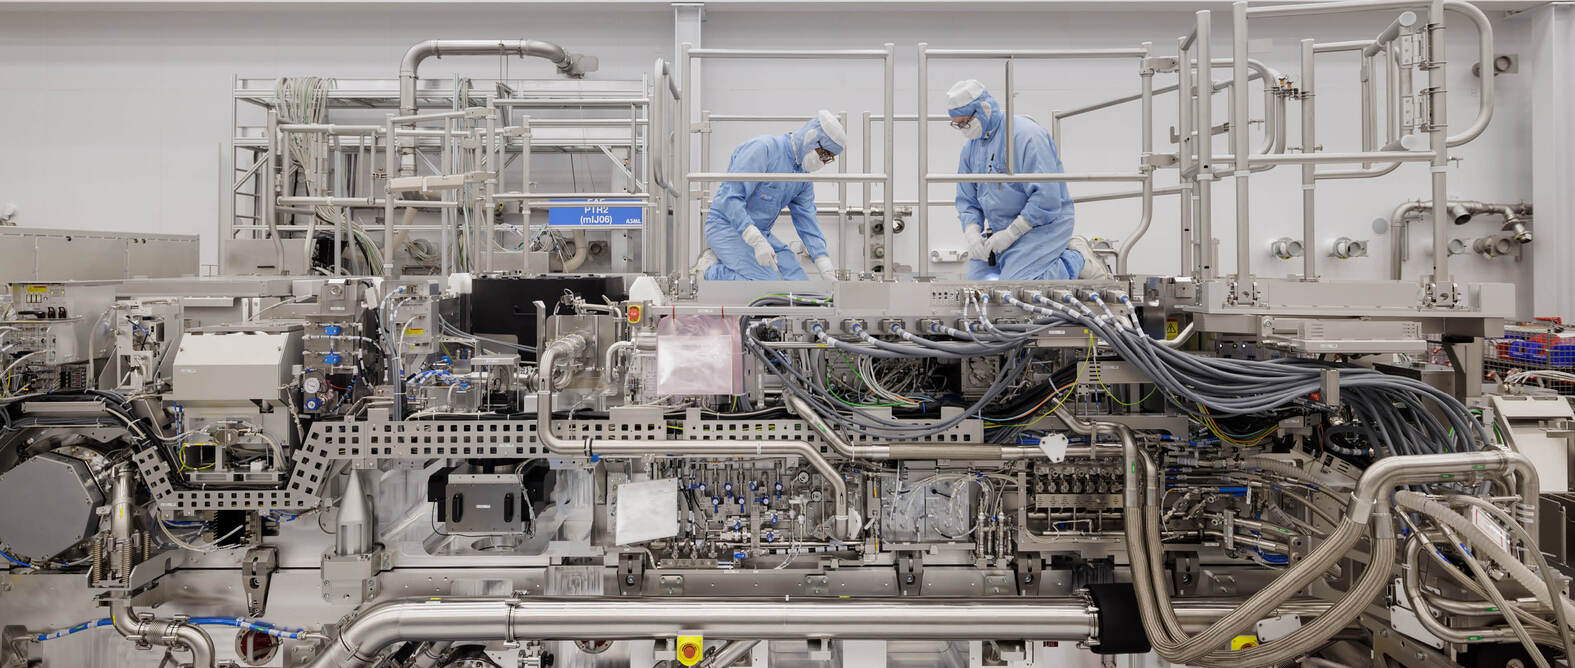

ASML Annual Report 2025
|
138 |
Limited assurance report of the independent auditor
on the Sustainability statements
|
||
General disclosures |
||
Basis for preparation |
||
ESG sustainability governance |
||
ESG sustainability at a glance |
||
Value chain and ecosystem overview |
||
Environmental and human rights due diligence |
||
Impact, risk and opportunity management |
||
Environmental |
||
Energy efficiency and climate action |
||
Circular economy |
||
EU Taxonomy |
||
Other disclosures: Water management in our own operations |
||
Social |
||
Attractive workplace for all |
||
Responsible value chain |
||
Innovation ecosystem |
||
Valued partner in our communities |
||
Governance |
||
ESG integrated governance |
||
Reference table |

ASML Annual Report 2025
|
139 |
ASML Annual Report 2025
|
140 |
ASML Annual Report 2025
|
141 |
ASML Annual Report 2025
|
142 |
ASML Annual Report 2025
|
143 |
ASML Annual Report 2025
|
144 |
Our environmental, social and governance (ESG) sustainability governance model |
|||||||||||||||||||||||||||
Supervisory Board |
|||||||||||||||||||||||||||
•Supervises, monitors and advises the
Board of Management on ESG
sustainability aspects advised by the
ESG committee
•Identifies principal risks and opportunities
|
|||||||||||||||||||||||||||
Board of Management |
|||||||||||||||||||||||||||
•Sets and oversees ESG sustainability
strategy
•Oversees execution
|
|||||||||||||||||||||||||||
ESG Sustainability team |
|||||||||||||||||||||||||||
•Supports the Board of Management on
ESG sustainability aspects
|
|||||||||||||||||||||||||||
Cross-functional collaboration |
|||||||||||||||||||||||||||
Energy
efficiency
and climate
action
|
Circular
economy
|
Attractive
workplace
for all
|
Responsible
value chain
|
Innovation
ecosystem
|
Valued
partner in our
communities
|
ESG
integrated
governance
|
Engaged
stakeholders
|
Transparent
reporting
|
|||||||||||||||||||
ASML Annual Report 2025
|
145 |

ASML Annual Report 2025
|
146 |
Key |
||
 |
On track / achieved |
|
 |
Off track / not achieved |
|
Our vision is to enable groundbreaking technology to solve some of humanity’s toughest challenges |
Our business strategy | |||||||||||||||||||||
1 |
Deepen customer trust |
2 |
Extend our technology and
holistic product leadership
|
3 |
Strengthen ecosystem
relationships
|
4 |
Create an exceptional
workplace
|
5 |
Drive operational
excellence
|
6 |
Deliver on ESG sustainability |
||||||||||
Environmental |
Social |
Governance |
||||||
We aim to help expand computing power while minimizing energy use, emissions and waste.
Our focus on energy efficiency and climate action – and on the circular economy –
is fundamental to achieving this goal.
|
We aim to deliver responsible growth that benefits all our stakeholders – providing an
attractive workplace for all, building a responsible value chain, fueling innovation in our
ecosystem and being a valued partner to communities.
|
We aim to act on our responsibilities and anchor them across our entire business through
integrated governance, engaged stakeholders and transparent reporting.
|
||||||
Description |
Target |
Performance |
||
Energy
efficiency and
climate action
|
Net scope 1 and 2 CO2e emissions
|
GHG neutral by
2025
|
0 kt |
|
Gross scope 1 and 2 CO2e emissions
|
45 kt by 2025
(SBTi)
|
26 kt |
|
|
Net scope 3 CO2e emissions (Mt)
|
GHG neutral by
2040
|
11.5 Mt |
|
|
Scope 3 intensity in CO2e (per €m
gross profit)
|
0.93 kt by 2025
(SBTi)
|
0.67 kt |
|
|
Commitment from our top-80%
suppliers (based on CO2e emissions) to
reduce their CO2e footprint by 2030
|
75% commitment
from top 80%
suppliers by 2026
|
32% |
|
|
NXE energy use per wafer pass
(NXE:3800E, measured in 2025)
|
5.1 kWh by 2025
|
5.5 kWh |
|
|
Circular
economy
|
Total waste from operations (excl.
construction and demolition waste)
|
N/A |
15,258 t |
N/A |
Reuse rate of parts returned from the
field and factory
|
90% by 2025
|
90% |
|
|
Recycling rate (excl. construction
and demolition waste)
|
65% by 2025
|
66% |
|
|
Waste generated per €m revenue (excl.
construction and demolition waste)
|
322 kg by 2025
|
467 kg |
|
|
Description |
Target |
Performance |
||
Attractive
workplace
for all
|
Employee engagement score (three-
year rolling average)
|
>-2.0% vs. top
25% performing
companies by
2025
|
78.9% |
|
-2.3% | ||||
Employee inclusion score (three-year
rolling average)
|
>-3.0% vs. top
25% performing
companies by
2025
|
80.2% |
|
|
-0.6% | ||||
Attrition rate |
<7.0% by 2025
|
4.1% |
|
|
Gender diversity: % inflow of women
(all job grades)
|
24% by 2025
|
29% |
|
|
Gender diversity: % inflow of women
to job grade 9+
|
24% by 2025
|
28% |
|
|
Gender diversity: % representation of
women in job grade 13+
|
14% by 2026
|
16% |
|
|
Responsible
value chain
|
No 2025 strategic performance
indicator
|
N/A |
N/A |
N/A |
Innovation
ecosystem
|
Research and development1
|
>€4.0bn by 2025
|
€4.7bn |
|
Valued partner
in our
communities
|
Amount invested in communities (per
employee), including employee giving
|
€2,500/
employee by
2025
|
€1,750 |
|
Description |
Target |
Performance |
||
Integrated
governance
|
No 2025 strategic performance indicator |
N/A |
N/A |
|
Engaged
stakeholders
|
Combined ranking on four ratings listed
below – ambition to rate above average.
|
N/A |
N/A |
|
Transparent
reporting
|
No 2025 strategic performance indicator |
N/A |
N/A |
|
External recognition of our sustainability performance2
Our leading performance in sustainability has been recognized by assessments and external
corporate ratings. ESG benchmarks and rating agencies give us objective insights into our
performance and how we compare with industry peers. We focus on benchmarks that in our
view are: recognized by our stakeholders, that are the most relevant in helping us drive
continuous improvement, and that rely mostly on publicly available information.
Sustainalytics
As of July 2025, we received an ESG Risk Rating of 8.9 from Morningstar Sustainalytics and were
assessed to be at negligible risk of experiencing material financial impacts from ESG factors.3
MSCI ESG Rating
As of December 23, 2025, we received an MSCI ESG Rating of AAA (‘leader’). MSCI ESG
Ratings measure a company’s resilience to long-term, industry-specific sustainability risks.
CDP
As of December 2025, we received a score of A from CDP in relation to climate.
Responsible Business Alliance
Based on RBA’s Self-Assessment Questionnaire, we are assessed ‘low risk’ throughout 2025.
|
||||

ASML Annual Report 2025
|
147 |
ASML Annual Report 2025
|
148 |
ASML Annual Report 2025
|
149 |
Looking ahead |
Human rights |
||
The provisions of our Human Rights
Policy are derived from key international
human rights standards including the
International Labor Organization (ILO)
Declaration on Fundamental Principles
and Rights at Work and the UN Declaration
of Human Rights, the UNGC, the principles
specified in the Economic Co-operation
and Development (OECD) Guidelines for
Multinational Enterprises, and other relevant
standards such as the UN Women’s
Empowerment Principles, UNICEF’s
Children’s Rights and Business Principles
and the UN International Convention on
the Protection of the Rights of All Migrant
Workers and Members of Their Families.
Our Human Rights Policy explicitly specifies
our commitments to non-discrimination and
harassment, as well as the prevention of
trafficking in human beings, forced labor,
and child labor.
Our Human Rights Policy is a key part of
our ESG strategy, setting out our roadmap
and initiatives toward effectively and
responsibly managing areas of human
rights impacts in the ecosystem where
we operate.
|
||
ASML Annual Report 2025
|
150 |
How we identified our material topics |


ASML Annual Report 2025
|
151 |
 |
Environmental topics |
 |
Before suppliers |
 |
Actual positive impact |
 |
Risk |
 |
Short term |
|
|
Social topics |
 |
Suppliers |
 |
Potential positive impact |
 |
Opportunity |
 |
Medium term |
|
 |
Governance topics |
 |
Own operations |
 |
Actual negative impact |
 |
Long term |
|||
Entity specific topics |
 |
Customers |
 |
Potential negative impact |
||||||
 |
Beyond customers |
|||||||||

ESG strategy theme |
Description |
Value chain |
Impact
materiality
|
Financial
materiality
|
Time
frame
|
|||||
Energy use and GHG emissions from manufacturing and buildings (scope 1 and 2) |
 |
 |
|
|||||||
Impact on energy availability and the grid through our manufacturing and buildings |
|
|
|
|||||||
Impact on global warming through GHG emissions from the use of products and services sold by ASML, taking into account energy efficiency measures in products (scope 3 – category 11) |
|
|
|
|||||||
Impact on global warming through GHG emissions from the transportation and distribution services purchased by ASML (scope 3 – category 4) |
|
|
|
|||||||
Impact on global warming through GHG emissions from goods and services purchased (including capital goods) by ASML (scope 3 – categories 1 and 2) |
|
|
|
|||||||
Impact on global warming through energy use and GHG-emissions of business travel and commuting (scope 3 – categories 6 and 7) |
|
|
|
|||||||
Energy use and GHG emissions from the integral production process of our customers’ products (microchips) and their use in various applications (in ICT industry and broader society)1
|
|
|
|
|||||||
Reduction of energy use and GHG emissions from use of our customers’ products (microchips) and their use in various applications (in ICT industry and broader society)1
|
|
 |
|
|||||||
Financial opportunity for ASML due to increased market demand for low-carbon technologies (climate resilience analysis)2
|
|
 |
|
|||||||
Acute and chronic physical climate change risks to ASML and our customers (climate resilience analysis)2
|
|
 |
|
|||||||
Transition risks related to climate change (including technology, regulation, reputation and market risks) (climate resilience analysis)2
|
|
|
|
|||||||
Non-renewable resource inflows and outflows (Systems, parts and tools, transport materials) |
|
|
|
|||||||
Waste streams from our own operations and building renovation and construction activities (Systems, parts and tools, transport materials, non-product-related waste, real estate) |
|
|
|
|||||||
Supply chain disruptions caused by unavailability of materials and parts, including as a result of non-compliance with rules and regulations regarding hazardous substances (Systems,
parts and tools, transport materials)2
|
|
|
|
|||||||
Customer dissatisfaction and complaints due to not meeting agreed circular economy standards (Systems, parts and tools, transport materials)2
|
|
|
|
|||||||
Impact on employees by providing fair labor conditions and associated risk of (perception of) unfair working and employment conditions at ASML, affecting ability to engage and retain
talent (Labor conditions)
|
|
|
|
|
||||||
Impact on employees by facilitating knowledge and skills development which contribute to continued employability and professional growth, and associated risk of failure to attract,
develop and retain talents with adequate skills and knowledge (Learning and development)
|
|
|
|
|
||||||
Potential impact in case of failure to effectively manage employees’ well-being and work-life balance, including excessive overtime, resulting in stress, health issues and increased
likelihood of accidents, and associated risk of failure to engage and retain talent (Well-being)
|
|
 |
|
|
||||||
Potential impact on workers in case of failure to manage occupational health and safety, and associated risk in case this impact materializes (Occupational health and safety) |
|
|
|
|
||||||
Potential impact on workers’ right to freedom of association, collective bargaining and social dialogue in certain regions (Labor conditions)2
|
|
|
|
|||||||
Potential impact on workers as a result of discrimination and unequal treatment, including pay inequality, as well as violence and harassment in the workplace (Inclusion and diversity) |
|
|
|
|||||||
Failure to comply with health- and safety-related regulations or implement effective health and safety practices could result in liabilities and reputational risk (Occupational health and safety)2
|
|
|
|
|||||||
Failure to comply with labor law could lead to sanctions, financial loss or reputational damage (Labor conditions)2
|
|
|
|
ASML Annual Report 2025
|
152 |
|
Environmental topics |
|
Before suppliers |
|
Actual positive impact |
|
Risk |
|
Short term |
|
|
Social topics |
|
Suppliers |
|
Potential positive impact |
|
Opportunity |
|
Medium term |
|
|
Governance topics |
|
Own operations |
|
Actual negative impact |
|
Long term |
|||
Entity specific topics |
|
Customers |
|
Potential negative impact |
||||||
|
Beyond customers |
|||||||||
ESG strategy |
Description |
Value chain |
Impact
materiality
|
Financial
materiality
|
Time
frame
|
|||||
Potential impact on the health and safety of customer and partner employees while working on ASML systems, and associated risk if the impact materializes (Responsible product design)2
|
|
|
|
|
||||||
Potential impacts on human rights of supply chain workers in on-site facility services, electronics manufacturing and mining of minerals (Responsible supply chain) |
|
|
|
|||||||
Failure to comply with rules and regulations regarding conflict minerals (Responsible supply chain) |
|
|
|
|||||||
Potential impacts on human rights of workers at customers and beyond inherent to the technology sector (Responsible product use)2
|
|
|
|
|||||||
Improved quality of life through access to technology and digital services (Responsible product use)2
|
|
 |
|
|||||||
Potential impacts on society due to potential misuse of technology (Responsible product use)2
|
|
|
|
|||||||
Impact on society and stakeholders through ASML’s innovation ecosystem focused on ESG-related research, startups, scaleups, platforms and collaboration (ESG innovation) |
|
|
|
|||||||
Impact on local communities around ASML’s offices and factories through pressure on regional mobility, and impact on local communities around our Veldhoven operations through
nuisance, pressure on affordable housing and interaction between cultures (Attractive communities)
|
|
|
|
|||||||
Impact on local communities around our Veldhoven operations through pressure on the talent pipeline and education system (Inclusive communities) |
|
|
|
|||||||
Risk of an unattractive community for future employees to live in (limited housing, social cohesion issues), impacting ASML’s ability to attract talent (Attractive communities, Inclusive communities) |
|
|
|
|||||||
Adverse reactions from neighbors, local communities and municipalities due to the pressure from ASML on infrastructure, availability of talent, schools, housing and social cohesion,
which can impact the license to effectively manage our business (Attractive communities, Inclusive communities)
|
|
|
|
|||||||
Impact on people and environment across the supply chain through the fair management of relationships with suppliers (Responsible business conduct and compliance)2
|
|
|
|
|||||||
Failure to comply with laws and regulations for supply chain due diligence (Responsible business conduct and compliance)2
|
|
|
|
|||||||
Failure to comply with data privacy regulations or breaches of data privacy (Responsible business conduct and compliance)2
|
|
|
|
|||||||
Potential impact on stakeholders and associated risk in case ASML workers fail to comply with ASML’s code of conduct, policies and values, as well as with regulations due to
increasing complexity as we expand into more countries (Responsible business conduct and compliance)2
|
|
|
|
|
||||||
Failure to engage customers and suppliers on environmental and social topics (ESG risk management)2
|
|
|
|

ASML Annual Report 2025
|
153 |
Our ambition |
|||
We aim to help expand
computing power while
minimizing energy use,
emissions and waste.
Our focus on energy
efficiency and climate
action – and on the
circular economy –
is fundamental to
achieving this goal.
|
|||
On the following pages we set out our
approach and progress to date.
|
|||

Energy efficiency and climate action |
|||||||
 |
We aim to reduce our climate impacts,
working closely with our partners and peers
in the entire semiconductor value chain –
in our own operations, together with our
suppliers, in our customers’ production
processes and through reducing the energy
used by semiconductors in operation by
enabling scaling.
We aim to be greenhouse gas neutral
across our value chain by 2040.
|
We’ll do this by focusing on the
following sub-topics:
|
|||||
•Manufacturing and buildings
•Purchased goods and services
•Logistics
•Business travel
•Employee commuting
•Product use
|
|||||||
We also report on our resilience analysis
of our strategy and business model in
relation to climate change, using a
climate scenario analysis.
|
|||||||
Climate Transition Plan |
||
Our Climate Transition Plan is our strategic
roadmap that underpins our ambition to
align with the goals of the Paris Agreement.
With our SBTi-validated emission reduction
targets, we commit to taking ambitious
action by driving our Climate Transition
Plan in each of the emission categories.
|
||
Circular economy |
||||||
We aim to minimize resource inflows and
waste outflows, to generate business value
and avoid negative impacts on the planet.
We aim to have zero waste from our
operations to landfill and incineration
by 2030.
|
 |
|||||
We’ll do this by focusing on the
following sub-topics:
•Systems
•Parts and tools
•Transport materials
•Non-product-related waste
(hazardous and non-hazardous)
•Real estate
|
||||||
EU Taxonomy at ASML |
||
In our EU Taxonomy disclosure we have
classified our environmentally sustainable
economic activities and investments,
and report the related economic key
performance indicators of turnover, capital
expenditure and operational expenditure.
We report on the alignment assessment
of our eligible economic activities and on
ASML meeting the minimum safeguards
constituted chiefly by the OECD Guidelines
and UN Guiding Principles.
|
||


ASML Annual Report 2025
|
154 |
...for the planet |
|
The world is turning to technology to help solve some of its most
pressing challenges. We provide innovative lithography solutions for
producing microchips that help society reduce global energy use and
mitigate GHG emissions.1
At the same time, growing demand for enhanced chip functionality
means the complexity and energy consumption of microchip patterning
is increasing. Limiting global warming to 1.5°C, in line with the Paris
Agreement, therefore needs accelerated and increased action.
1. To clearly demarcate the scope of our policy on energy efficiency and climate action,
please note that ‘climate action’ is defined as mitigation of GHG emissions. Within our
policy, we refer to emissions as GHG emissions – and, of these, CO2 emissions are most
material to ASML.
|

...for ASML |
Our goal is to expand the availability of computing power and data storage
capability while reducing the environmental impact of our operations, our
supply chain and the use of our products, in line with increasing customer
requests for improved energy efficiency and evolving societal expectations
for climate action.
To mitigate our negative climate impacts – mainly those from our products’
energy consumption and emissions from sourcing and supply chain activities
– we are aiming for GHG neutrality across our entire value chain by 2040,
while closely working with our suppliers and customers to limit the increase
of energy demand for producing, shipping and operating our systems. Our
approach therefore also contributes to our customers’ and suppliers’ own
ESG sustainability objectives and encourages collaboration to exchange
experience and reduce emissions. ESG sustainability is also a key driver
of both employee engagement and our ability to attract new talent.
|
Key |
||
|
On track / achieved |
|
|
Off track / not achieved |
|
Our 2025 progress |
||||
Net scope 1 and 2
CO2e emissions
|
Gross scope 1 and 2
CO2e emissions
|
|||
0 kt |
26 kt |
|||
2024: 33 kt
|
2024: 33 kt
|
|||
2025 target: GHG neutral |
2025 SBTi target: 45 kt |
|||
Net scope 3
CO2e emissions
|
Scope 3 intensity in CO2e
(per €m gross profit)
|
|||
11.5 Mt |
0.67 kt |
|||
2024: 12.0 Mt
|
2024: 0.83 kt
|
|||
2040 target: GHG neutral |
2025 SBTi target: 0.93 kt
|
|||
Commitment from
top-80% suppliers
(based on CO2e emissions)
to reduce their CO2e
footprint by 2030
|
NXE energy use per
wafer pass
(NXE:3800E, measured
in 2025)
|
|||
32% |
5.5 kWh |
|||
2024: 17%
|
2024: 5.9 kwh
|
|||
2026 target: 75%
|
2025 target: 5.1kWh
|
|||

Manufacturing
and buildings
|
Purchased goods
and services
|
Logistics |
Business travel |
Employee
commuting
|
Product use |

ASML Annual Report 2025
|
155 |
Key |
||||
 |
Actual positive impact |
|
Risk |
|
 |
Potential positive impact |
|
Opportunity |
|
 |
Actual negative impact |
|||
 |
Potential negative impact |
|||
Upstream |
Own operations |
Downstream |
Whole value chain |
||
 |
Transition risks related
to climate change
(including technology,
regulation, reputation
and market risks) (climate
resilience analysis)
|
|
 |
Impact on global warming through GHG emissions from the
transportation and distribution services purchased by ASML
(scope 3 – category 4)
|
|
Impact on global warming through GHG emissions from
goods and services purchased (including capital goods) by
ASML (scope 3 – categories 1 and 2)
|
|
Energy use and GHG emissions from manufacturing and
buildings (scope 1 and 2)
|
|
Impact on energy availability and the grid through our
manufacturing and buildings
|
|
Impact on global warming through energy use and GHG-
emissions of business travel and commuting (scope 3 –
categories 6 and 7)
|
 |
Financial opportunity for ASML due to increased market
demand for low-carbon technologies (climate resilience
analysis)
|
|
Impact on global warming through GHG emissions from the
use of products and services sold by ASML, taking into
account energy efficiency measures in products (scope 3 –
category 11)
|
|
Energy use and GHG emissions from the integral production
process of our customers’ products (microchips) and their use
in various applications (in ICT industry and broader society)
|
 |
Reduction of energy use and GHG emissions from use of our
customers’ products (microchips) and their use in various
applications (in ICT industry and broader society)
|
|
Acute and chronic physical climate change risks to ASML and our customers (climate resilience analysis) |
ASML Annual Report 2025
|
156 |
Introduction |
ASML’s climate targets validated by SBTi |
||||
In 2025, the Science Based
Targets initiative (SBTi) officially
validated both ASML’s near-term
(2030) and long-term (2040) gross
emission targets that support
our path to GHG neutrality.
The SBTi's Corporate Net-Zero Standard
is the world’s pre-eminent framework for
corporate target-setting in line with climate
science. It includes the guidance, criteria
and recommendations for companies to
set science-based net-zero targets
consistent with limiting global temperature
rise to 1.5°C.
According to SBTi, the aim is to roughly
halve absolute scope 1 and 2 emissions by
2030, while in the longer term companies
must cut all possible emissions before
2050. For scope 3 emissions, either an
absolute path to -90% or an emission
intensity path to -97% can be chosen.
We have opted for an emission intensity
pathway toward -97% by 2040 compared
to base year 2019, and have defined our
emission intensity as CO2e emissions per €m
gross profit (in accordance with US GAAP).
|
The manufacturing of semiconductors
requires significant energy, with electricity
consumption the biggest source of our
industry’s GHG emissions. A challenge for
the industry is to grow to meet demand,
while at the same time reducing emissions.
ASML’s role here is important, and the
validation by SBTi of our gross scope 1
and 2 and intensity scope 3 GHG targets
means our targets meet rigorous criteria
and are consistent with the latest
climate science.
|
|||

ASML Annual Report 2025
|
157 |
Aiming for GHG neutrality by 2040 |

ASML Annual Report 2025
|
158 |
Levers for action |
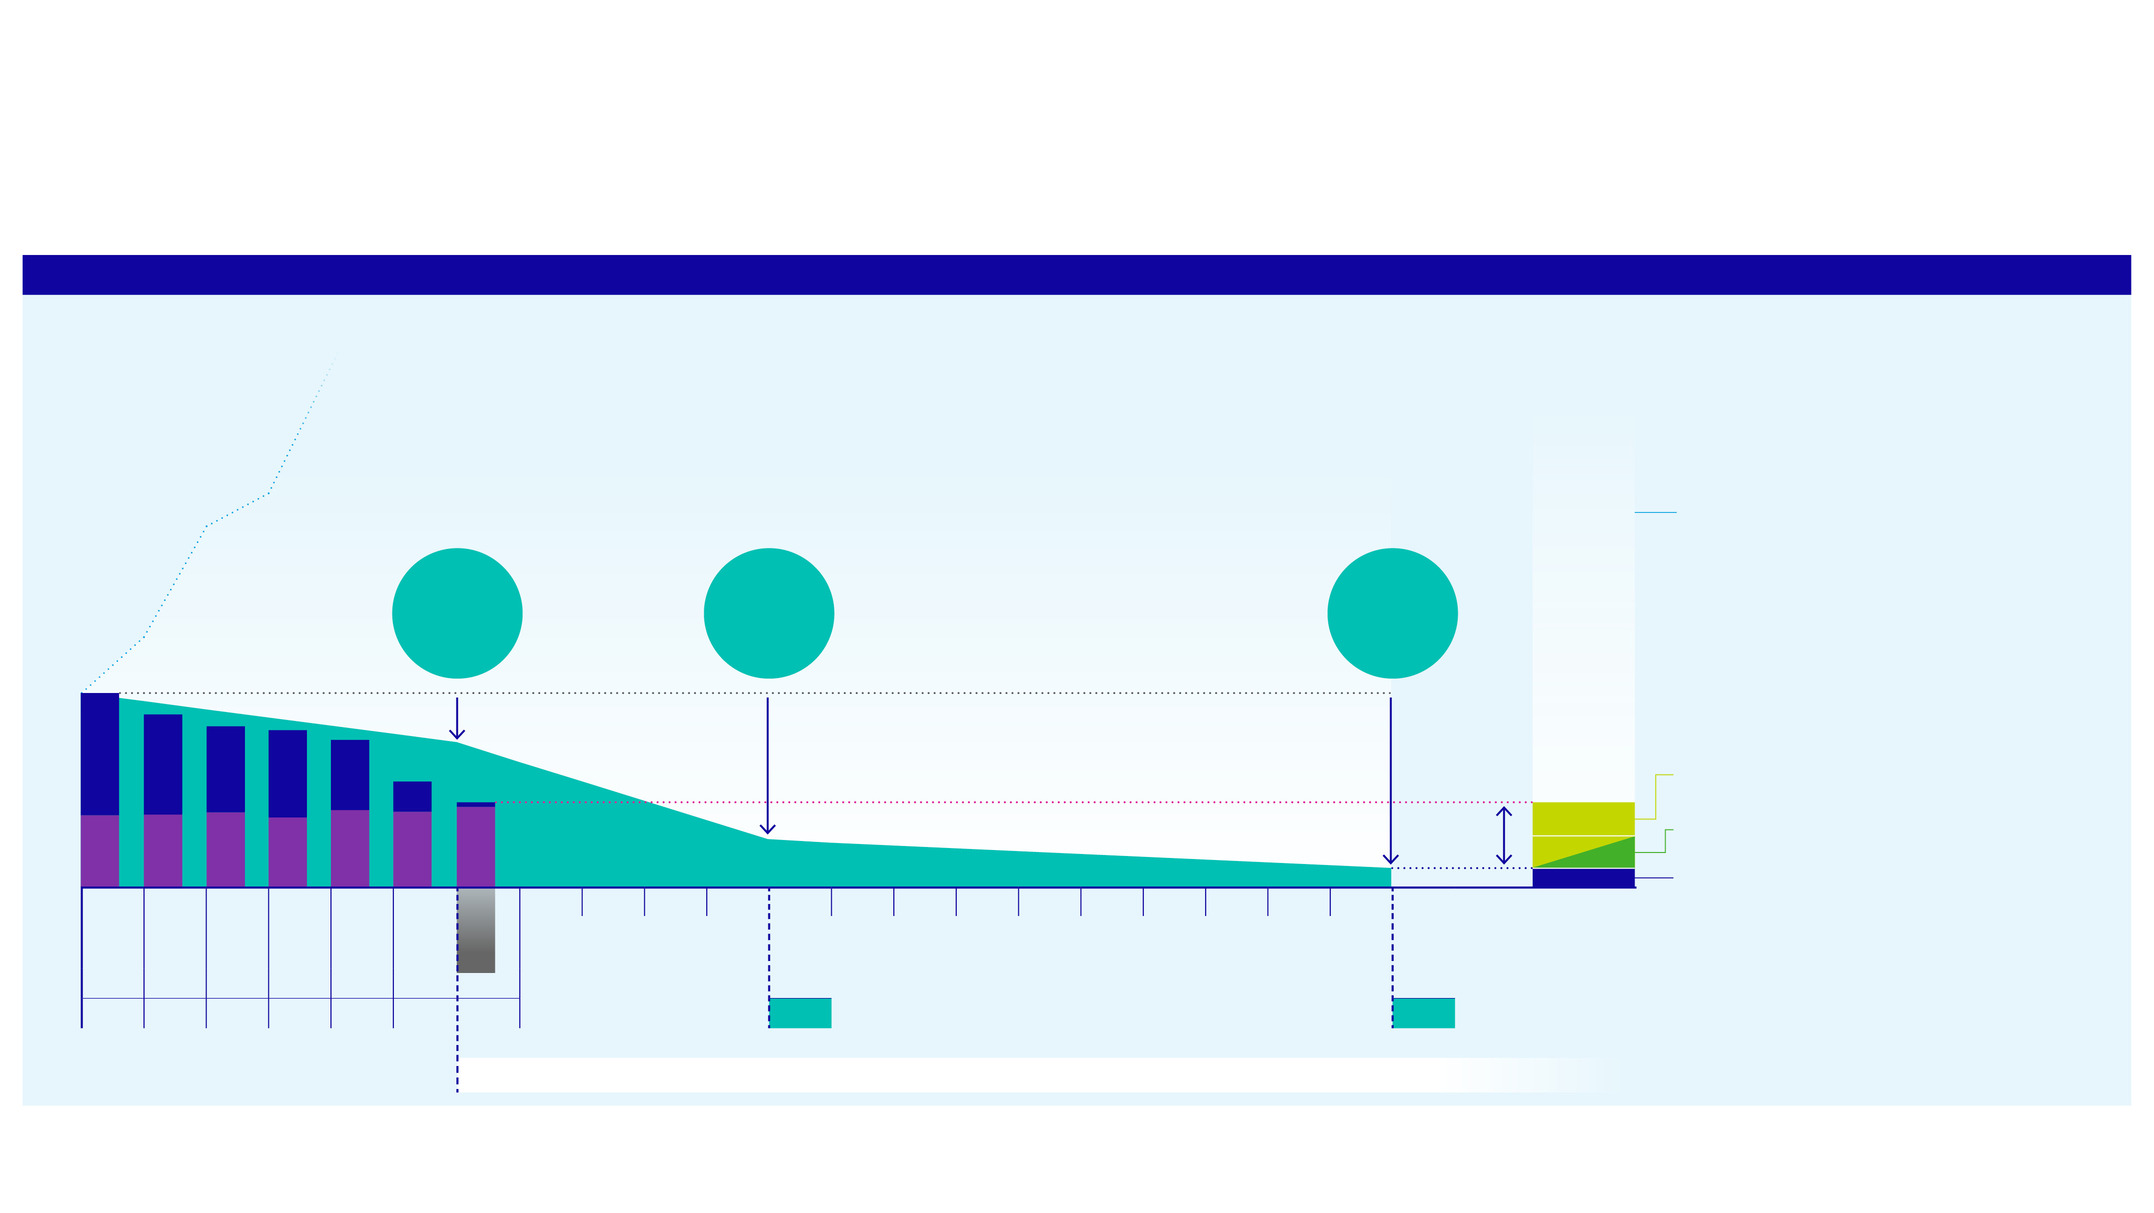
ASML Annual Report 2025
|
159 |
Scope 1 historic emissions1
|
Reducing energy use |
||||
Scope 2 historic emissions1
|
Using renewable energy |
||||
ASML’s SBTi emission target trajectory |
Emissions compensated |
||||
150 |
100 |
50 |
0 |
10 |
10 |
6.0 |
2019 |
2020 |
2021 |
2022 |
2023 |
2024 |
2030 |
2040 |
||||
-26 |
|||||||||||
60 |
54 |
50 |
49 |
46 |
33 |
26 |
Actual gross emissions (kt CO2e)
|
||||
0% |
11% |
17% |
19% |
24% |
46% |
56% |
75% |
90% |
Emission reduction vs. base year (%)
|
2025 |
GHG neutrality target: |
Scope 1 and 2 emissions (manufacturing and buildings) |

ASML Annual Report 2025
|
160 |
Supply chain emissions1
|
Reducing energy use |
||||
Product use emissions1
|
Using renewable energy |
||||
ASML’s SBTi emission target trajectory |
|||||
50 |
40 |
30 |
20 |
10 |
0 |
Avoided/reduced emissions2
|
||
Global decarbonization |
||
Read
more
|
||
Product use: energy reduction roadmaps |
||
Logistics: air-to-ocean project |
||
Purchased goods and services:
commitments from suppliers
|
||
Product use: renewable energy
at customers via SCC
|
||
Other projects, including on business
travel and employee commuting3
|
||
Innovation gap |
||
Residual emissions4
| ||
16.9 |
7.9 |
0.1 |
6.3 |
5.6 |
0.5 |
2.2 |
2.3 |
2019 |
2020 |
2021 |
2022 |
2023 |
2024 |
2025 |
2030 |
2040 |
|||
7.6 |
7.6 |
10.8 |
11.0 |
13.6 |
12.0 |
11.6 |
Actual gross emissions (Mt CO2e)
|
||||
1.44 |
1.12 |
1.10 |
1.02 |
0.96 |
0.83 |
0.67 |
0.65 |
0.04 |
Emission intensity (kt CO2e per €m gross profit)
|
||
0% |
22% |
24% |
29% |
33% |
42% |
53% |
55% |
97% |
Emission intensity reduction vs. base year (%)
|
GHG neutrality target: |
Business travel
Employee commuting3
|
Supply
chain
|
Entire
value chain
|
ASML Annual Report 2025
|
161 |
ASML Annual Report 2025
|
162 |
Making carbon a financial consideration |
|
Energy-efficient heating and cooling of buildings at the Veldhoven campus |
|
We aim to drive continuous improvement in energy saving – from optimized
controls in our cleanrooms, to on-site green hydrogen generation and reuse
of waste heat, for example at our Veldhoven campus.
|
|

ASML Annual Report 2025
|
163 |
ASML Annual Report 2025
|
164 |
Our objective |
 |
|
We aim to reduce emissions from our
manufacturing locations and buildings by
lowering energy consumption, increasing
the use of renewable energy, and
compensating for residual emissions.
| |
Our scope |
-40 |
-30 |
-20 |
-10 |
0 |
10 |
20 |
30 |
40 |
|
2024 |
|||||||||
2025 |
|||||||||
|
Achieved |
2025 target: GHG neutral |
|||||||
Targets and performance |

0 |
50 |
100 |
150 |
200 |
|
2024 |
|||||
2025 |
|||||
Achieved |
2025 target: 100 TJ
|
||||

0% |
20% |
40% |
60% |
80% |
100% |
||
2024 |
|||||||
2025 |
|||||||
Achieved |
2025 target: 100%
|
||||||

Our actions and resources |
ASML Annual Report 2025
|
165 |
2024 emissions net of
renewables
|
Using renewable energy |
||||
Reducing energy use |
|||||
2025 gross emissions
before renewables
|
Emissions compensated |
||||
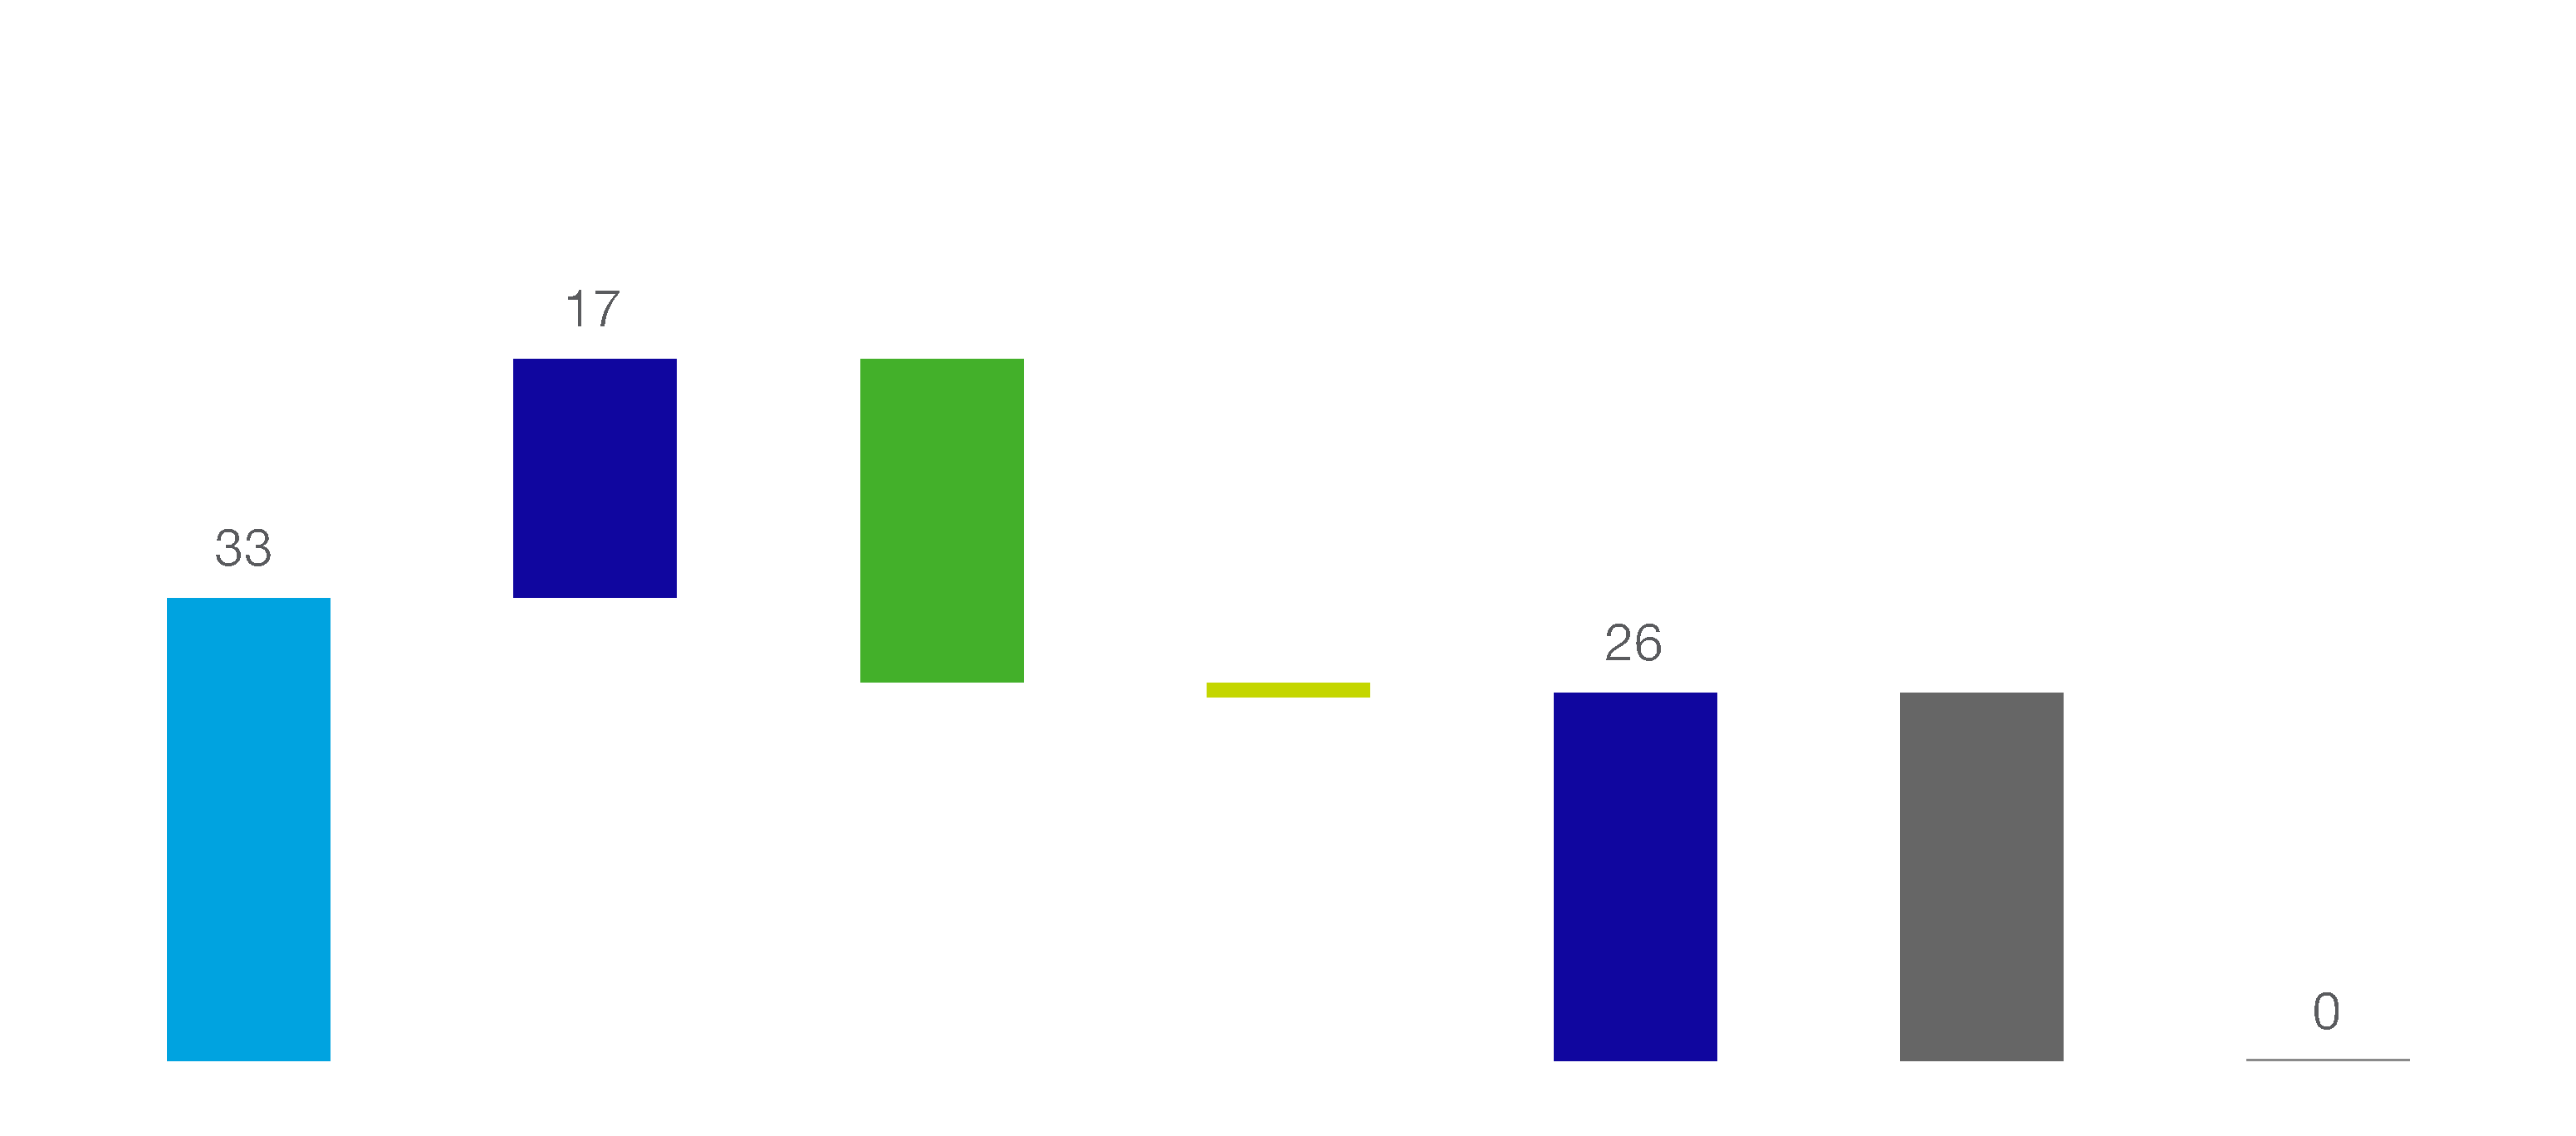
60 |
50 |
40 |
30 |
20 |
10 |
0 |
2024
emissions net
of renewable
energy
|
Step up toward
2025 gross
emissions
before
renewable
energy
|
Step up toward
2025 of
renewable
energy
purchase
|
Energy savings
master plan
reduction
|
2025 gross
emission net of
renewable
energy
|
2025 emissions
compensated
|
2025 net
emissions
|
|||||||
Key energy-saving projects in 2025 |
|||||
In 2025, we saw an acceleration
of the energy-saving projects in
the master plan. These included:
•Improving the energy efficiency of our
DUV factory by renovating the building
in Veldhoven (savings approximately
3 TJ per year).
•Upgrading the chiller installation and
installation of electrical steam humidifiers
in Eindhoven (savings approximately
9 TJ per year).
|
•Insulating piping systems in Wilton
(savings approximately 4 TJ per year).
•LED lighting projects in Taiwan
and Veldhoven (savings approximately
2 TJ per year).
•Multiple small improvements during
the year and projects from earlier
years, finalized in and accounted for
as of 2025 (savings approximately
30 TJ total per year).
Together with earlier projects realized as
of 2021, we exceeded our target of saving
100 TJ per year by 2025.
|
||||
Looking ahead |
ASML Annual Report 2025
|
166 |
Our objective |
 |
|
We aim to reduce emissions in our supply
chain by working closely with suppliers to
embed low-carbon practices and drive
systemic change toward a GHG neutral
supply chain by 2030.
| |
Our scope |
Targets and performance |
0 |
1,000 |
2,000 |
3,000 |
4,000 |
5,000 |
6,000 |
|
2024 |
|||||||
2025 |
|||||||
Off track |
2030 target: GHG neutral |
|

Off track |
2026 target: 75%
|
|
0% |
20% |
40% |
60% |
80% |
100% |
||
2024 |
|||||||
2025 |
|||||||

Our actions and resources |
ASML Annual Report 2025
|
167 |
Looking ahead |
ASML Annual Report 2025
|
168 |
Our objective |
 |
|
We aim to reduce emissions by reconsidering
our logistics flows and collaborating with
logistics partners to transition toward more
sustainable modes of transport.
| |
Our scope |
Targets and performance |
Become GHG neutral for scope 3
emissions related to logistics by 2030
|
0 |
50 |
100 |
150 |
200 |
250 |
300 |
350 |
||
2024 |
|||||||||
2025 |
|||||||||
On track |
2030 target: GHG neutral |
||

Scope 3 emissions from logistics |

Our actions and resources |

ASML Annual Report 2025
|
169 |
Looking ahead |
ASML Annual Report 2025
|
170 |
Our objective |
 |
|
We aim to reduce emissions from business
travel by limiting travel where possible,
encouraging train and electric vehicle for
shorter distances and contributing to SAF
programs, while compensating for
residual emissions.
| |
Our scope |
Targets and performance |
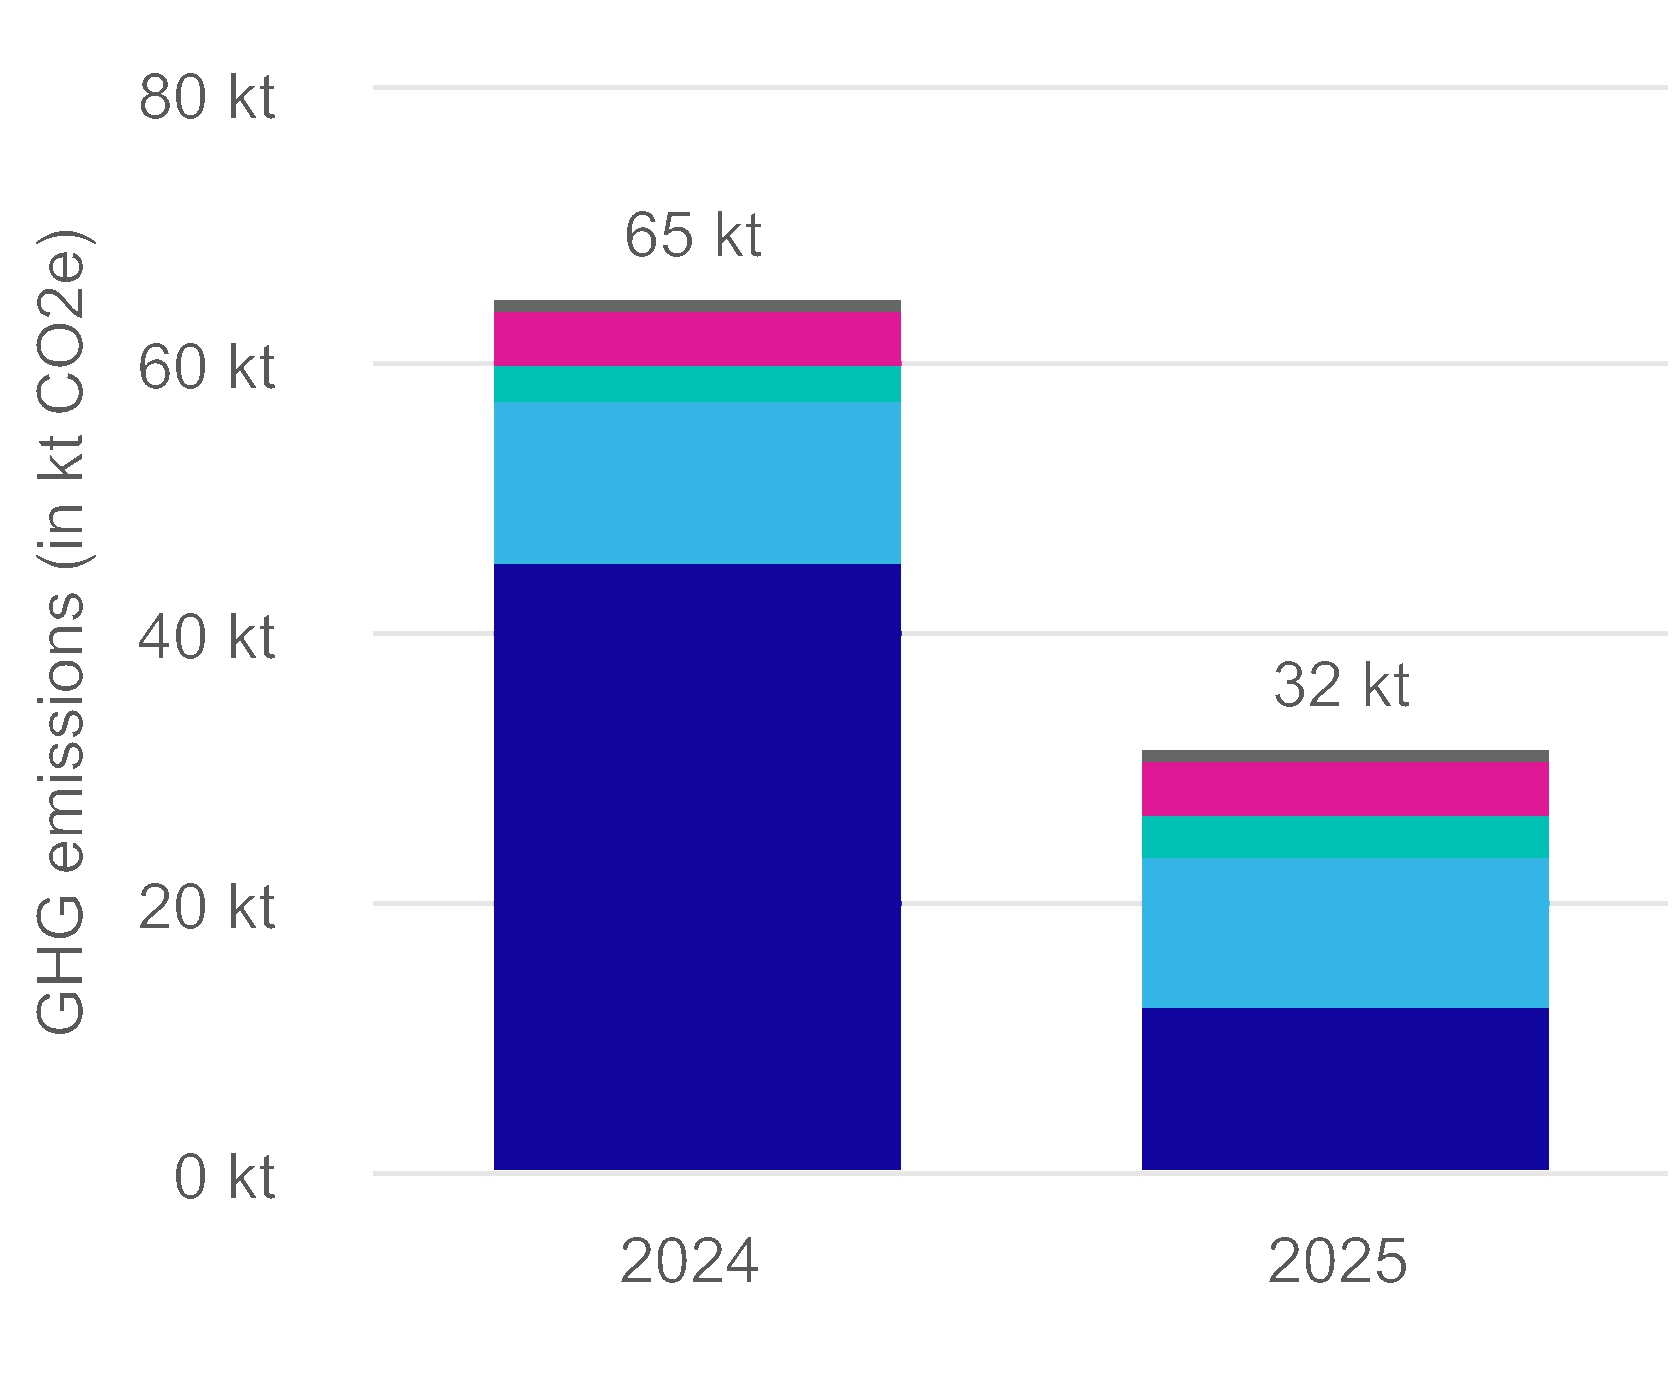
Become GHG neutral for scope 3
emissions from business travel by 2025
|
-80 |
-60 |
-40 |
-20 |
0 |
20 |
40 |
60 |
80 |
|
2024 |
|||||||||
2025 |
|||||||||
Achieved |
2025 target: GHG neutral |
||||||||

Scope 3 emissions from business travel |
Air travel (after
SAF purchase)
|
Car rental |
|||||
Public transport |
||||||
Hotel |
Taxi |
|||||
Our actions and resources |
Looking ahead |
ASML Annual Report 2025
|
171 |
Our objective |
 |
|
We aim to reduce emissions from employee
commuting by supporting the shift to
alternative modes of transport and the shift
to electric vehicles, while compensating for
residual emissions.
| |
Our scope |
Targets and performance |

Become GHG neutral for scope 3
emissions from employee commuting
by 2025
|
-60 |
-40 |
-20 |
0 |
20 |
40 |
60 |
|
2024 |
|||||||
2025 |
|||||||
Achieved |
2025 target: GHG neutral |
||||||

Scope 3 emissions from commuting |
Car |
Public transport |
|||||
Other |
||||||
Our actions and resources |
Looking ahead |
ASML Annual Report 2025
|
172 |
Our objective |
 |
In collaboration with our customers, we
aim to reduce emissions from product use
when designing new lithography, metrology
and inspection systems or parts, increasingly
focusing on reducing their energy consumption,
supporting progress toward GHG neutrality
by 2040.
|
Our scope |
0% |
-2% |
-4% |
-6% |
-8% |
-10% |
-12% |
-14% |
|
2024 |
||||||||
2025 |
||||||||
Targets and performance |
Not achieved |
2025 target: 5.1 kWh
|
|
0 |
2 |
4 |
6 |
8 |
10 |
|
2024 |
||||||
2025 |
||||||
Achieved |
2025 target: -10% |
|

Not achieved |
2025 target: -60%
|
|
0% |
-20% |
-40% |
-60% |
-80% |
-100% |
|
2024 |
||||||
2025 |
||||||

Achieve a 60% decrease (on 2018
baseline) in equivalent energy
consumption (kWh/wafer) of our NXE
systems by 2025
|

Scope 3 emissions from product use |
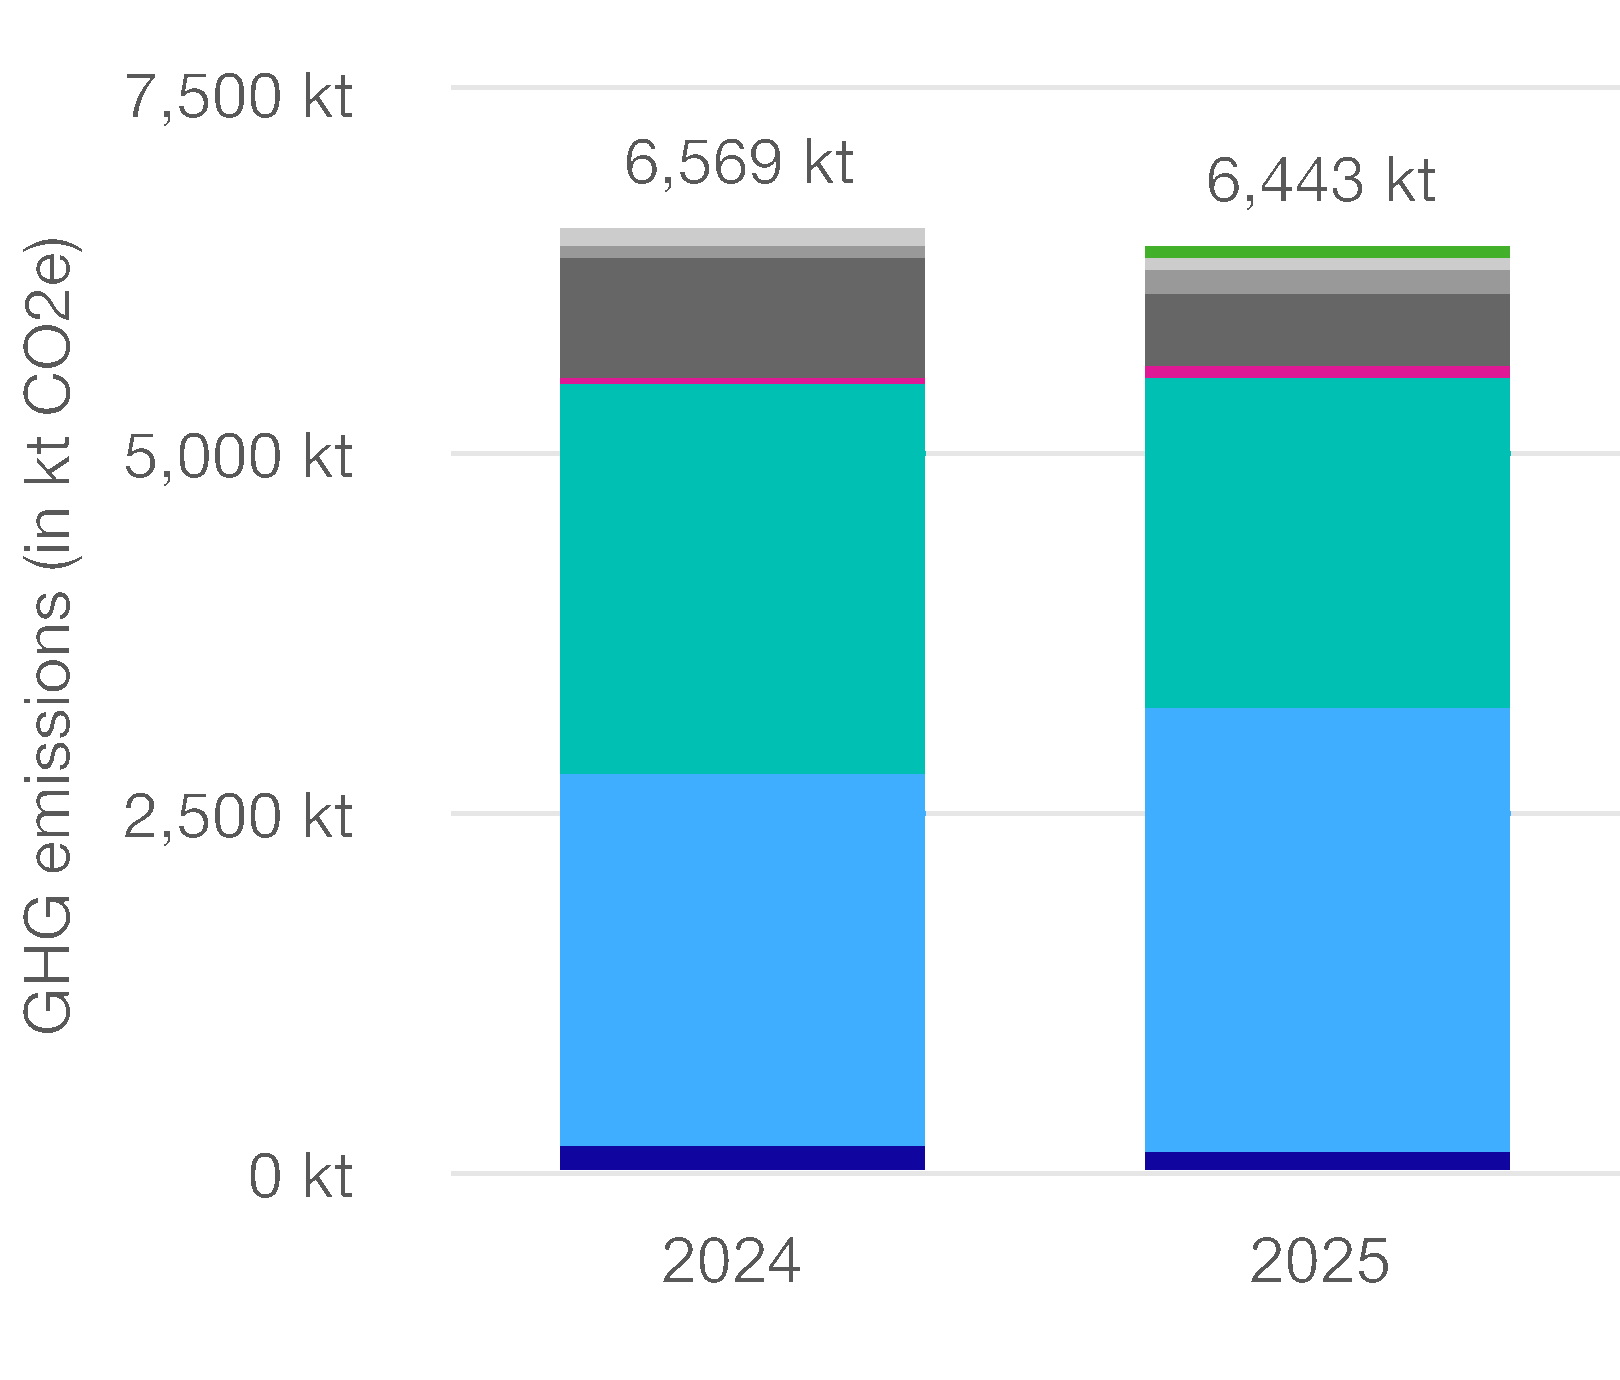
EXE |
PAS |
HMI |
||||||||
NXE |
XT |
Other |
||||||||
NXT |
YieldStar |
|||||||||
ASML Annual Report 2025
|
173 |
Our actions and resources |
ASML Annual Report 2025
|
174 |
Saving energy by enabling hydrogen reuse |

ASML Annual Report 2025
|
175 |
Looking ahead |
|
Semiconductor Climate Consortium (SCC) |
|
Customers, ICT and society |
|
The technology pioneered by our
R&D teams and partners sits at the
heart of global digitalization – and
has the potential to transform how
we all live and work.
We enable our customers to innovate
the semiconductor technologies that
can help humanity manage its challenges
and seize opportunities by facilitating
sustainable living and e-mobility, accessible
healthcare, food security and the transition
to renewable energy.
Our customers’ products are used in a
wide variety of applications, impacting
society’s GHG emissions both positively
and negatively – particularly when taking
into account the rapid adoption and
increasing integration of generative
AI capabilities.
In collaboration with the industry, we
aim to have a better understanding of
the GHG emissions caused by the use
of our customers’ products. We do this,
for example, by being a member of the
SCC, where we actively engage with our
customers on climate-related matters.
We do not measure emissions downstream
beyond our customers and have no targets
on these, because this is outside the scope
of our GHG reporting boundary.
|
|

ASML Annual Report 2025
|
176 |
Climate Transition Plan targets |
||||||||||
Topic |
Description |
Base year
2019
|
2024 |
2025 |
Target year
2025
|
Target year
2030
|
Target year
2040
|
|||
Scope 1 GHG emissions (in ktCO2e)
|
Gross scope 1 GHG emissions |
22 |
24 |
25 |
||||||
Percentage of scope 1 GHG emissions from regulated emissions trading schemes |
N/A |
N/A |
||||||||
Scope 2 GHG emissions (in ktCO2e)
|
Gross location-based scope 2 GHG emissions1
|
176 |
228 |
151 |
||||||
Gross market-based scope 2 GHG emissions |
38 |
9 |
1 |
|||||||
Subtotal of gross scope 1 and market-based scope 2 GHG emissions |
60 |
33 |
26 |
45 |
15 |
6 |
||||
Significant scope 3 GHG emissions
(in ktCO2e)
|
Total gross indirect (scope 3) GHG emissions |
7,578 |
11,961 |
11,617 |
15,700 |
19,500 |
2,300 |
|||
1 Purchased goods and services |
2,546 |
4,415 |
4,373 |
|||||||
2 Capital goods |
295 |
536 |
408 |
|||||||
3 Fuel and energy-related activities (not included in scope 1 or scope 2) |
10 |
13 |
9 |
|||||||
4 Upstream transportation and distribution |
213 |
322 |
302 |
|||||||
5 Waste generated in operations |
1 |
2 |
2 |
|||||||
6 Business traveling |
97 |
65 |
32 |
|||||||
7 Employee commuting |
42 |
36 |
45 |
|||||||
11 Use of sold products |
4,374 |
6,569 |
6,443 |
|||||||
12 End-of-life treatment of sold products |
0.1 |
0.2 |
0.3 |
|||||||
15 Investments2
|
0 |
3 |
3 |
|||||||
Percentage of scope 3 GHG emissions calculated using primary data |
2.5% |
2.6% |
||||||||
Total GHG emissions (in ktCO2e)
|
Total GHG emissions (location-based) |
12,213 |
11,793 |
|||||||
Total GHG emissions (market-based) |
11,994 |
11,643 |
||||||||
Topic |
Description |
2025 |
|
Carbon credits (in ktCO2e)
|
Carbon Credits cancelled in the reporting year |
104 |
|
Percentage of share of carbon credits from removal projects |
100% |
||
Percentage of share of carbon credits from recognized quality standards (registered with the ACR) |
100% |
||
Percentage of share of carbon credits from projects within the EU |
—% |
||
Percentage of share of carbon credits from projects within the US |
100% |
||
Percentage of share of carbon credits that qualify as corresponding adjustments |
—% |
||
Carbon credits planned to be cancelled in the next reporting year based on existing contractual agreements |
101 |
ASML Annual Report 2025
|
177 |
Topic |
Description |
2024 |
2025 |
|
Energy consumption (in MWh) |
(1) Fuel consumption from coal and coal products |
0 |
0 |
|
(2) Fuel consumption from crude oil and petroleum products |
690 |
38 |
||
(3) Fuel consumption from natural gas |
102,815 |
108,549 |
||
(4) Fuel consumption from other fossil sources |
0 |
0 |
||
(5) Consumption of purchased or acquired electricity, heat, steam and cooling from fossil sources |
17,517 |
3,251 |
||
(6) Total fossil energy consumption (calculated as the sum of lines 1–5) |
121,022 |
111,838 |
||
Percentage share of fossil sources in total energy consumption |
20.8% |
17.5% |
||
(7) Consumption from nuclear sources |
3,094 |
0 |
||
Percentage share of consumption from nuclear sources in total energy consumption |
0.5% |
0.0% |
||
(8) Fuel consumption from renewable sources, including biomass (also comprising industrial and municipal waste of biological origin, biogas,
renewable hydrogen, etc.)
|
0 |
0 |
||
(9) Consumption of purchased or acquired electricity, heat, steam and cooling from renewable sources |
457,368 |
525,147 |
||
(10) The consumption of self-generated non-fuel renewable energy |
760 |
2,600 |
||
(11) Total renewable energy consumption (calculated as the sum of lines 8–10) |
458,128 |
527,747 |
||
Percentage share of renewable sources in total energy consumption |
78.7% |
82.5% |
||
Total energy consumption (calculated as the sum of lines 6, 7 and 11) |
582,244 |
639,585 |
Topic |
Description |
2024 |
2025 |
|
Energy intensity
per net revenue1
|
Total energy consumption from activities in high climate impact sectors per net revenue from activities in high climate impact sectors (MWh/€m revenue) |
20.6 |
19.6 |
Topic |
Description |
2024 |
2025 |
|
GHG intensity1
|
Total GHG emissions from scope 1, 2 and 3 (location-based) per net revenue (tCOeq/(€m revenue) |
432 |
361 |
|
Total GHG emissions from scope 1, 2 and 3 (market-based) per net revenue (tCOeq/(€m revenue) |
424 |
356 |
||
Total GHG emissions from scope 3 (market-based) per gross profit (tCOeq/(€m gross profit) |
825 |
669 |
Topic |
Description |
2024 |
2025 |
|
Energy attribute certificates
(in MWh)
|
Guarantees of Origin (GOs) |
313,250 |
350,694 |
|
Renewable energy certificates (RECs) |
110,501 |
117,062 |
||
International renewable energy certificates (I-RECs) |
3,786 |
5,807 |
||
Taiwan renewable energy certificates (T-RECs) |
20,463 |
34,411 |
||
Korea renewable energy certificates (K-RECs) |
8,000 |
17,173 |
||
Total energy attribute certificates |
456,000 |
525,147 |
ASML Annual Report 2025
|
178 |
Platform |
DUV immersion |
|||||||
System type |
NXT:1980Di |
NXT:2050i |
NXT:1980Ei |
NXT:1960Bi +
PEP-B
|
NXT:2100i |
NXT:1980Fi |
NXT:2150 |
|
Year of energy measurement |
2015 |
2020 |
2021 |
2021 |
2022 |
2023 |
2024 |
|
Power consumption (in MW) |
0.16 |
0.16 |
0.16 |
0.15 |
0.16 |
0.17 |
0.17 |
|
ATP throughput (in wph) |
275 |
295 |
295 |
250 |
295 |
330 |
310 |
|
Energy use per wafer pass (in kWh) |
0.59 |
0.54 |
0.56 |
0.60 |
0.55 |
0.52 |
0.55 |
|
Platform |
DUV dry |
|||||||
System type |
XT:1460 |
NXT:1470 |
XT:860N |
NXT:870 |
XT:400M |
NXT:870B H200 |
XT:260 A100 |
|
Year of energy measurement |
2020 |
2020 |
2022 |
2022 |
2023 |
2025 |
2025 |
|
Power consumption (in MW) |
0.07 |
0.13 |
0.07 |
0.13 |
0.07 |
0.17 |
0.06 |
|
ATP throughput (in wph) |
209 |
277 |
260 |
330 |
250 |
401 |
276 |
|
Energy use per wafer pass (in kWh) |
0.34 |
0.47 |
0.27 |
0.38 |
0.30 |
0.42 |
0.22 |
|
Platform |
YieldStar |
HMI |
||||||
System type |
YS380 |
YS385 |
YS500 |
YS500 |
eScan1100 |
eP5XLE |
eP6 |
eP6 |
Year of energy measurement |
2020 |
2023 |
2024 |
2025 |
2023 |
2024 |
2024 |
2025 |
Power consumption (in MW) |
0.01 |
0.01 |
0.01 |
0.01 |
0.06 |
0.02 |
0.01 |
0.01 |
Platform |
EUV
30 mJ/cm2 dose
|
EUV
50 mJ/cm2 dose
|
||||||
System type |
NXE:3400B |
NXE:3400C |
NXE:3600D |
NXE:3600D |
NXE:3800E |
NXE:3800E |
EXE:5000A |
|
Year of energy measurement |
2018 |
2020 |
2021 |
2023 |
2024 |
2025 |
2025 |
|
Power consumption (in MW) |
1.44 |
1.31 |
1.32 |
1.23 |
1.31 |
1.26 |
1.37 |
|
ATP throughput (in wph) |
112 |
136 |
160 |
160 |
220 |
230 |
53 |
|
Energy use per wafer pass (in kWh) |
12.8 |
9.6 |
8.3 |
7.7 |
5.9 |
5.5 |
25.8 |
|
ASML Annual Report 2025
|
179 |
Methodology on targets |
ASML Annual Report 2025
|
180 |
Methodology on metrics |
ASML Annual Report 2025
|
181 |
ASML Annual Report 2025
|
182 |
ASML Annual Report 2025
|
183 |
ASML Annual Report 2025
|
184 |
Risk exposure and opportunity level | ||
High risk exposure: high financial impact on
ASML’s gross margin and/or market share
|
High opportunity: high financial impact on
ASML’s gross margin and/or market share
|
|
Medium risk exposure: medium financial
impact on ASML’s gross margin and/or
market share
|
Medium opportunity: medium financial impact
on ASML’s gross margin and/or market share
|
|
Low risk exposure: limited to no financial
impact on ASML’s gross margin and/or
market share
|
Low opportunity: limited to no financial impact
on ASML’s gross margin and/or market share
|
|
ASML Annual Report 2025
|
185 |
 |
Low |
 |
Medium |
 |
High |
Scenario analysis: Physical risks
4°C scenario
medium and long term
|
Value chain location |
Risk category |
Risk exposure |
Risk description |
Mitigating measures |
Anticipated financial effects |
 Customers
|
Acute and
chronic
climate
change
effects
|
|
The increased frequency and severity of climate change effects are
expected to impact our key customers, particularly in the long term
(2050). Extreme weather events are predicted to be more severe
and the manufacturing facilities of our key customers are especially
exposed to water stress, droughts, storms and typhoons – events
that can potentially disrupt their operations. These customers are
particularly sensitive to water stress and drought due to the heavy
reliance on water for the semiconductor manufacturing processes.
|
Our customers are implementing mitigating measures themselves,
such as retrofitting of facilities to increase water efficiency, conducting
risk assessments and engagement with their supply chain to mitigate
climate risks. Alongside this, we are working on technical solutions
to reduce the water needed for cooling EUV machines to contribute
to a lower dependency on water.
|
Lost revenue
In a 4°C scenario our key customers could experience the increased effects
from water stress and drought, which could lead to increased opex and capex
expenditures and revenue loss at customer level. Consequently, the demand for
our products could decrease as customers lose financial power. Our dependence
on a concentrated number of customers could have a material adverse effect
on our revenue and financial condition.
|
Increased capital expenditures
Our customers could demand machines that are more energy and water efficient,
which could require a redesign of (some of ) our products. R&D investments may
be required for this.
|
|||||
 Own operations
|
Acute and
chronic
climate
change
effects
|
|
The frequency and severity of climate change effects will increase
toward 2050. Tropical cyclones, heat stress and floods caused by
increased precipitation are predicted to be more severe in specific
regions, potentially damaging and disrupting our operations there.
Additionally, droughts could result in the disruption of water supply
due to water-dependent processes.
|
We have several key measures in place to mitigate the potential
effects of physical risks, including but not limited to robust building
designs, fire suppression systems in critical areas, stormwater control
mechanisms, water reserve controls, maintenance management,
power backup for safety/emergency systems and business
continuity strategies.
|
Lost revenue
Extreme weather events can disrupt production processes or transportation,
resulting in late deliveries. This can have a material adverse effect on our revenue
and financial condition.
|
Operational costs
Temperature increases can increase operational costs, due to the necessity of
additional air conditioning to ensure consistent climate conditions for our production
processes and the productivity of the workforce. Also, it is likely that insurance costs
will increase due to increased frequency and severity of extreme weather events in
a 4°C scenario.
|
|||||
Increased capital expenditures
In some cases, more investments will be needed to make our factories increasingly
resistant to the effects of climate change, including droughts, tropical cyclones, heat
stress, precipitation stress, floods and fire weather stress.
|
ASML Annual Report 2025
|
186 |
|
Low |
|
Medium |
|
High |
Scenario analysis: Transition risks
1.5°C scenario
medium term
|
Value chain location |
Risk category |
Risk exposure |
Risk description |
Mitigating measures |
Anticipated financial effects |
 Across value chain
|
Policy and
legal
|
|
The climate-related regulation landscape is expected to change in many
regions. This could lead to stricter regulation on sectors such as energy,
industry and transportation, but also on the technology sector. ESG
reporting will also have to become more extensive and carbon-pricing
regulations may be introduced. Climate regulation will have a strong
effect on the medium term (2030) because the world will have to act
soon to limit global warming. These regulations may impact ASML
directly in relation to its own manufacturing processes, or indirectly via
the cost of input materials through suppliers or customer requirements
for carbon efficiency.
|
We monitor climate-related regulations and policies to understand
the potential effect on our business and stakeholders on a global level.
We deploy our carbon footprint strategy, with which we achieved
Greenhouse Gas (GHG) neutrality for our scope 1 and 2, business travel
and employee commuting emissions by 2025, and aim to be GHG
neutral for our supply chain emissions by 2030 and for product use
emissions by 2040. The objective of our supply chain collaboration
programs and our product energy-efficiency roadmaps is to reduce
emissions from the products we purchase, reduce the carbon footprint
of our products, and enable low-carbon technology and products
across our entire value chain.
|
Increased cost of input materials
The price of our input materials is likely to increase in a 1.5°C scenario due to
climate-related regulations and carbon taxes.
|
Increased operating costs
Increased operating costs due to carbon taxation in a 1.5°C scenario.
| |||||
Increased capital expenditures
In a 1.5°C scenario, there will be increased capital expenditures as investments
are needed to make production processes more energy efficient or to change the
energy source. This is most relevant for our facilities in Taiwan and South Korea,
where the costs of moving to renewable energy are already very high. Additionally,
increased or prioritized R&D investments will be needed to support our
customers in meeting their own carbon-reduction requirements.
| |||||
 Suppliers
|
Market and
economic
|
|
The availability of some input materials (for example raw materials
used in our equipment like steel, aluminum and rare earth elements) is
expected to be impacted, since demand will increase in a low-carbon
economy. Increased demand and decreased availability, alongside
changes to production processes at our suppliers and potential carbon
prices, could significantly impact the cost of raw materials.
Compared to last year we see that raw material prices have already
increased due to geopolitical developments. In a 1.5°C scenario we
expect more increases – for example due to carbon tax – and have
therefore increased the risk exposure level from medium to high
compared to last year.
|
To mitigate the effects of higher input material prices, purchase
agreements are signed with suppliers. We have developed dedicated
supply chain programs to monitor the availability of raw materials and
economic development as well as a scarcity program to monitor
scarce commodities.
|
Increased capital expenditures
Both ASML and its suppliers need to increase R&D investments to be able to
adapt our systems to be more energy-efficient and reduce the carbon footprint
of the supply chain.
|
Increased operating costs
Increased operating costs due to the potential increase of raw material prices,
caused by limited availability and changes in supplier production processes in
relation to, for example, the production of green steel and aluminum.
| |||||
Across value chain
|
Technology |
|
Investments in new technology are required to mitigate carbon
emissions, and these transition costs could be very high. ASML is
highly dependent on its suppliers and customers to reach its climate
ambitions. Some of our manufacturing processes require fossil-fueled
technologies for which no alternatives are yet industrialized (such as
for steel), while there is currently a limited availability of renewable
energy in some regions where our products are operated.
Although we still foresee challenges as described, we lowered our risk
exposure score from high to medium compared to last year, due to the
fact that our GHG neutrality targets toward 2030 has been approved
by SBTi as aligned with the 1.5°C scenario.
|
We develop our products and technology roadmaps in close
collaboration with suppliers and customers, and we actively work
to reduce our products’ energy consumption. We are gathering more
insights on material inflows to find solutions to reuse materials and
reduce the carbon footprint of those used in the production process.
We expect that the deployment of our Climate Transition Plan
will support our transition to achieve GHG neutrality for
scope 1, 2 and 3 emissions by 2040.
|
Increased capital expenditures
ASML and value chain partners need to increase R&D investments to reduce the
carbon emissions of our lithography systems, metrology and inspection systems,
and computational lithography.
|
ASML Annual Report 2025
|
187 |
|
Low |
|
Medium |
|
High |
Scenario analysis: Transition risks
1.5°C scenario
medium term
|
Value chain location |
Risk category |
Risk exposure |
Risk description |
Mitigating measures |
Anticipated financial effects |
|
Reputation |
|
There will be greater scrutiny on the semiconductor sector as it
consumes large volumes of energy and water. Failure to decarbonize
and mitigate negative impacts on the environment could result in brand
and reputational risk for ASML – which could negatively affect
employee attraction and retention, and could result in a reduction in
available capital sources.
|
We have developed our ESG sustainability strategy to mitigate our
negative impacts and increase our positive impacts on ESG-related
topics. Part of this strategy is our Climate Transition Plan, which we
expect will help us to reduce our carbon emissions. By continuously
engaging with our relevant stakeholders, we seek to ensure our
strategy covers all our material impacts, risks and opportunities. The
Climate Transition Plan, its related strategic KPIs and its actions and
progress are monitored by the Board of Management (BoM).
|
Lost revenue
Reputational damage can lead to a decrease in demand from customers for our
products. Similarly, failure to manage climate impact can negatively impact
employee attraction and retention and indirectly lead to revenue loss.
|
Own operations |
Increased capital and operational expenditures
Increased capital and operational expenditures as investments are needed to
execute our ESG sustainability strategy.
|
||||
Scenario analysis: Climate change opportunities
1.5°C & 4°C opportunities
medium to long term
|
Value chain location |
Opportunity
level
|
Opportunity description |
Anticipated financial effects |
|
|
The increased demand for low-carbon technologies will create opportunities for the entire semiconductor industry. When
looking at the scenario of a low-carbon economy, semiconductors play a multifaceted role in mitigating carbon emissions.
They are needed for the generation and use of low-carbon energy sources, and are necessary for wind turbines, solar
panels and electric vehicles (EVs), among other technologies. Moreover, semiconductors are necessary in all smart
technologies that help improve energy efficiency, such as smart grids, while power semiconductors can be key in reducing
energy use. As demand for semiconductors may surge, the need for ASML lithography systems is also likely to increase.
|
Increased revenue
As demand for semiconductors increases, it is likely the need for lithography systems will, too. We will likely be able to
serve this need if we continue to follow our vision of producing microchips that are constantly becoming more energy
efficient. The increase in demand for semiconductors will be highly likely to lead to increased revenues.
|
Own operations
and Customers
|
|||
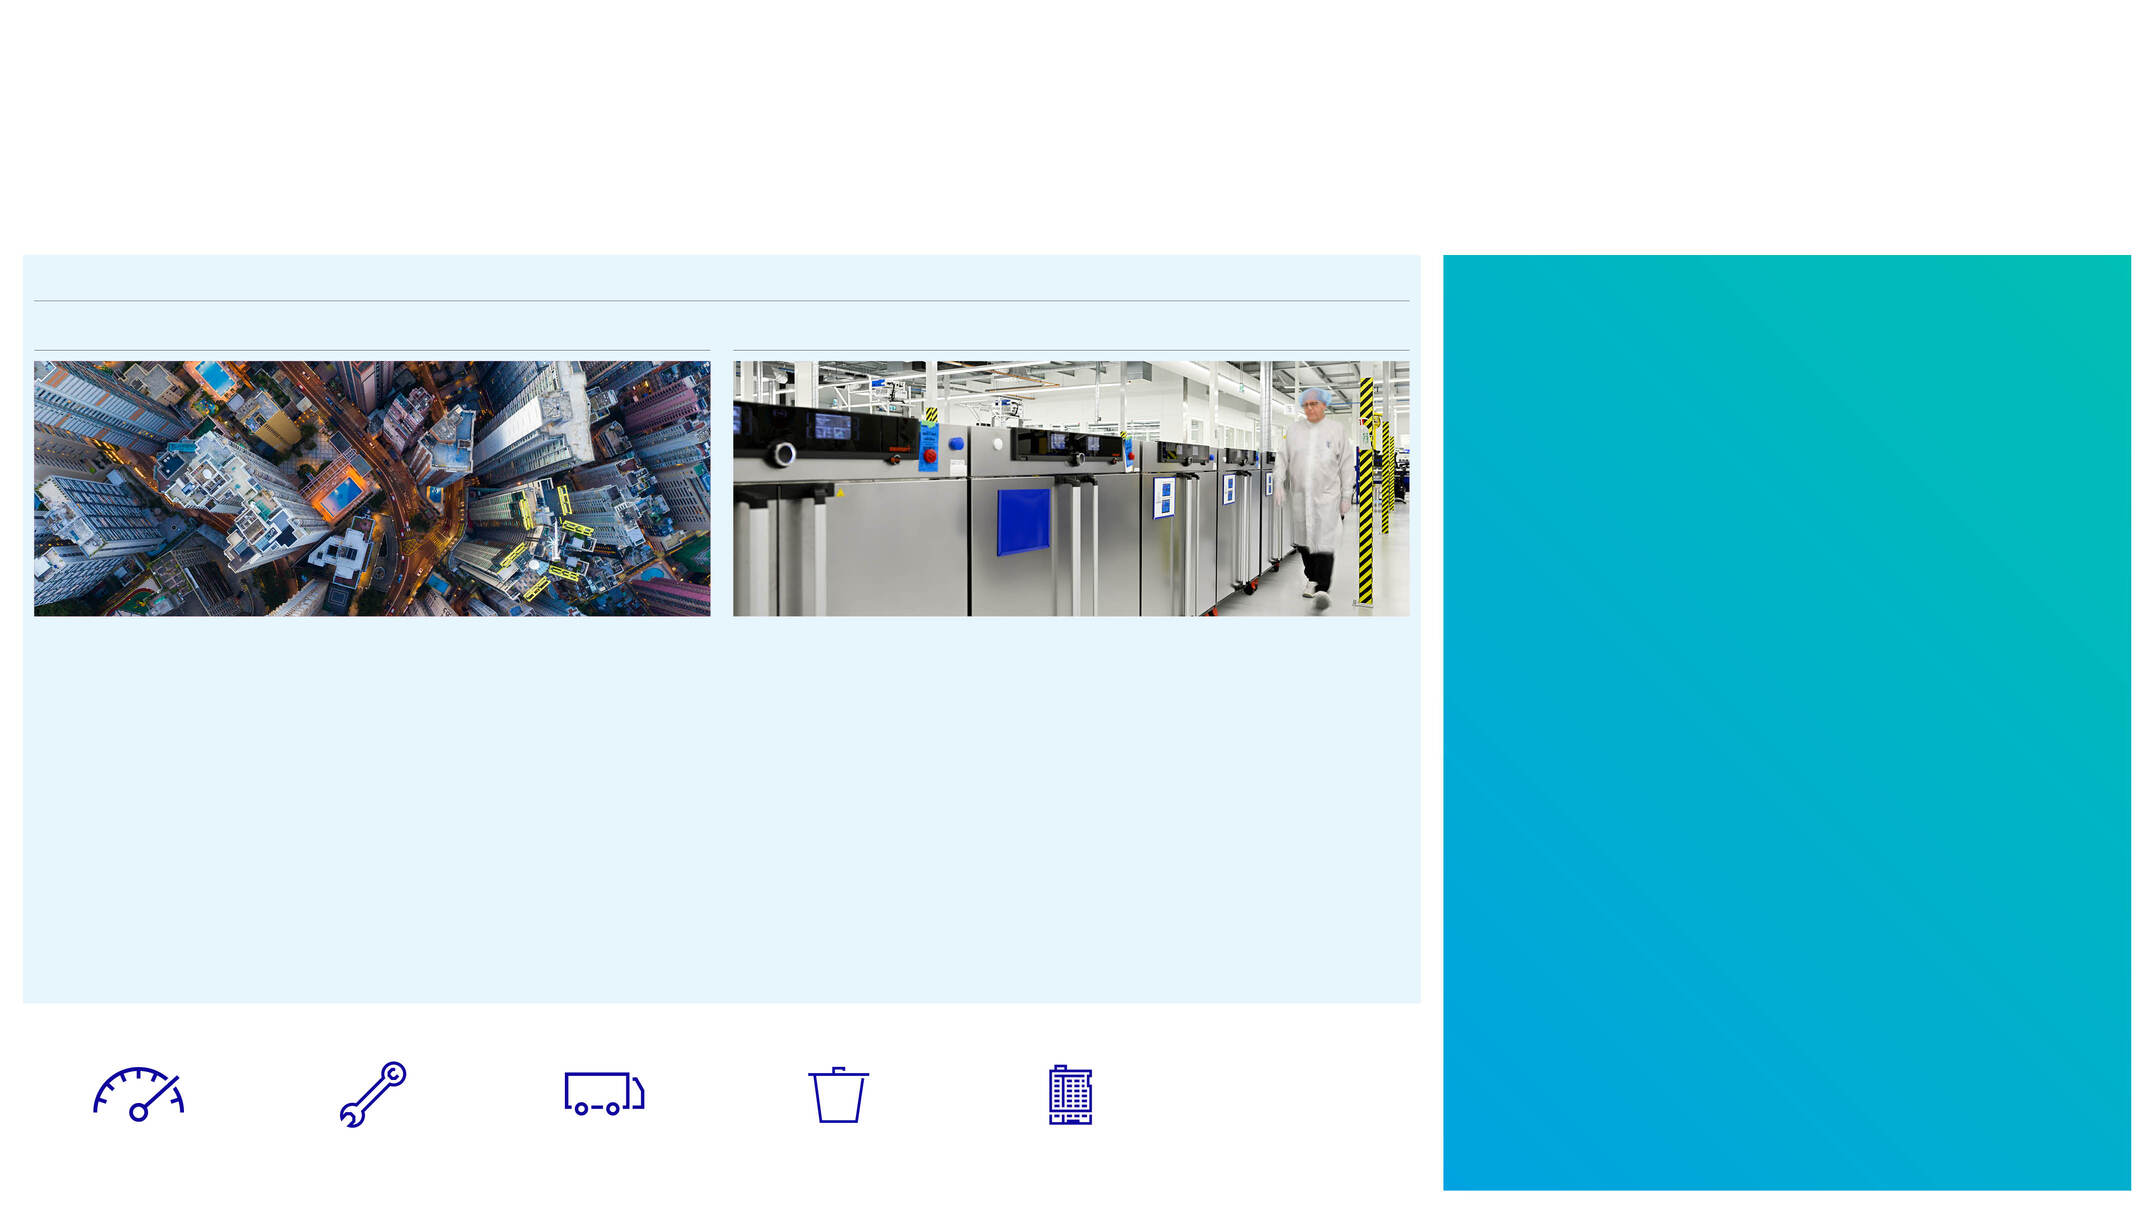
ASML Annual Report 2025
|
188 |
...for the planet |
|
The predominant linear model of the global economy – in which products
are produced, used and then thrown away as waste – is unsustainable.
It adds immense pressure to our planet’s limited resources, increases
greenhouse gas (GHG) emissions and generates waste and pollution.
A circular economy approach enables sustainable growth while reducing
waste, costs and environmental footprint, by creating business loops, ensuring
efficient use of resources and driving an innovative business model.
|
...for ASML |
By applying a circular economy strategy, we aim to ensure our products and
services create and retain as much value as possible for us, our shareholders,
our customers, our suppliers and other partners across our value chain.
This approach supports our employees’ desire to contribute to reducing
environmental impact, while improving systems and parts availability and
lowering the total cost of ownership for our customers. It also provides
opportunities for suppliers to reduce costs by reusing and avoiding the
use of new materials.
|
Key |
||
|
On track / achieved |
|
|
Off track / not achieved |
|
Our 2025 progress |
||||
Total waste from
operations (excluding
construction and
demolition waste)
|
Reuse rate of parts
returned from the
field and factory
|
|||
15,258 t
|
90% |
|||
2024: 13,267 t
|
2024: 88%
|
|||
2025 target: N/A |
2025 target: 90%
|
|||
Recycling rate (excluding
construction and
demolition waste)
|
Waste generated per
€m revenue (excluding
construction and
demolition waste)
|
|||
66% |
467 kg
|
|||
2024: 62%
|
2024: 469 kg
|
|||
2025 target: 65%
|
2025 target: 322 kg
|
|||
Systems |
Parts and tools |
Transport materials |
Non-product-related
waste
|
Real estate |
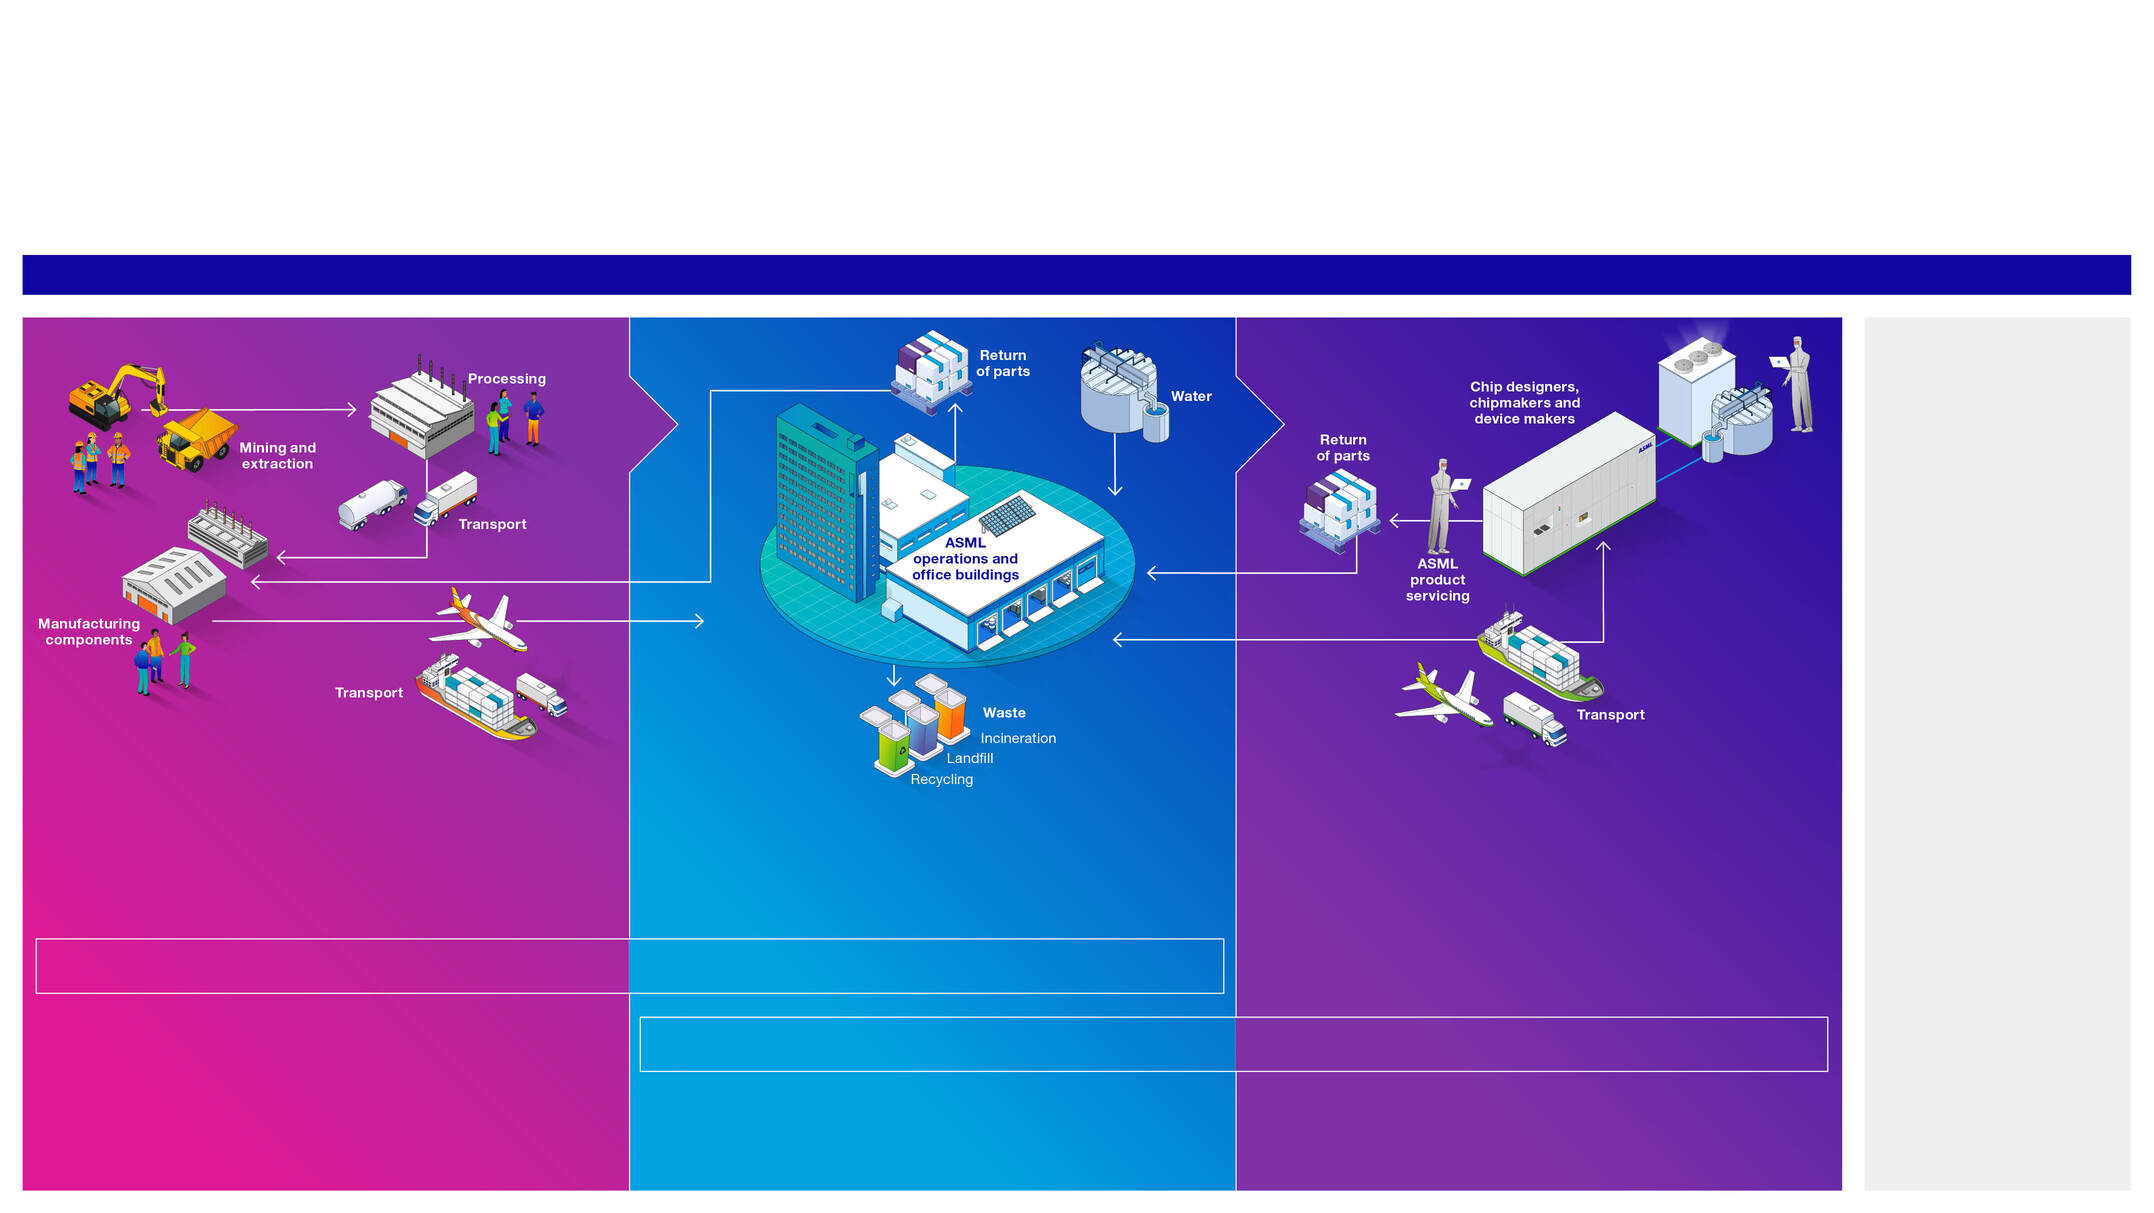
ASML Annual Report 2025
|
189 |
Key |
||||
|
Actual positive impact |
|
Risk |
|
|
Potential positive impact |
|
Opportunity |
|
|
Actual negative impact |
|||
|
Potential negative impact |
|||
Upstream |
Own operations |
Downstream |
Whole value chain |
||
|
Non-renewable resource
inflows and outflows
(Systems, parts and tools,
transport materials)
|
|
|
Waste streams from our own operations and building
renovation and construction activities (Systems, parts
and tools, transport materials, non-product-related
waste, real estate)
|
 |
Supply chain disruptions caused by unavailability of materials and parts, including as a result of non-compliance with rules and
regulations regarding hazardous substances (Systems, parts and tools, transport materials)
|
|
Customer dissatisfaction and complaints due to not meeting agreed circular economy standards (Systems, parts and tools,
transport materials)
|
ASML Annual Report 2025
|
190 |
Our approach |
Our different types of waste |
||
We measure our impact in
tonnes of waste, by category
(non-hazardous and hazardous)
and by material type (such as
plastics, paper, wood and
hazardous liquids).
Within our operations, we divide our
waste into four categories:
•Non-hazardous waste, such as
packaging material, waste from parts
resulting from upgrades or defects,
and general waste.
•Construction and demolition waste
as a result of building activities, which
tend to fluctuate over the years.
•Hazardous waste, such as the
chemicals we use in our manufacturing
processes. This can include everything
from lamps, batteries and liquids to
cleaning wipes and filters. Most of our
hazardous waste is in the form of liquids,
including acetone and piranha acid.
•Radioactive waste, which originates
from small amounts of radioactive
material in our products.
We include data on the CO2e impact
of processing our waste in our scope
3 emissions.
|
||


ASML Annual Report 2025
|
191 |
Levers for action |
ASML Annual Report 2025
|
192 |
Our objective |
 |
|
We aim to maintain systems in use for as
long as economically and environmentally
possible, focusing on service, upgrades
and refurbishment.
| |
Our scope |
Targets and performance |
2025 target: N/A |
|||
0% |
20% |
40% |
60% |
80% |
100% |
|
2024 | ||||||
2025 | ||||||

Our actions and resources |
Looking ahead |
ASML Annual Report 2025
|
193 |
Our objective |
 |
|
We aim to extend the lifetime value of our
parts by maximizing reuse through repair, and
by driving learning loops to improve design.
| |
Our scope |
Targets and performance |
0% |
20% |
40% |
60% |
80% |
100% |
|
2024 |
||||||
2025 |
||||||
Achieved |
2025 target: 90%
|
|||||

Our actions and resources |
ASML Annual Report 2025
|
194 |

Looking ahead |

ASML Annual Report 2025
|
195 |
Our objective |
 |
|
We aim for optimization of resource use,
reduction of waste and cost, and
enhancement of supply chain efficiency,
by increasing the reusability and recyclability
of transport materials.
| |
Our scope |
Targets and performance |
Our actions and resources |
Looking ahead |
ASML Annual Report 2025
|
196 |
Our objective |
 |
|
We aim to minimize waste and increase
our recycling rate with dedicated actions
to try to realize our ambition to have zero
waste from our operations to landfill and
incineration by 2030.
| |
Not achieved |
2025 target: 322 kg
|
|
0 |
100 |
200 |
300 |
400 |
500 |
600 |
|
2024 |
|||||||
2025 |
|||||||
Our scope |
Targets and performance |
Achieved |
2025 target: 65% |
|

0% |
20% |
40% |
60% |
80% |
100% |
|
2024 |
||||||
2025 |
||||||

Our total waste in 2025 | |
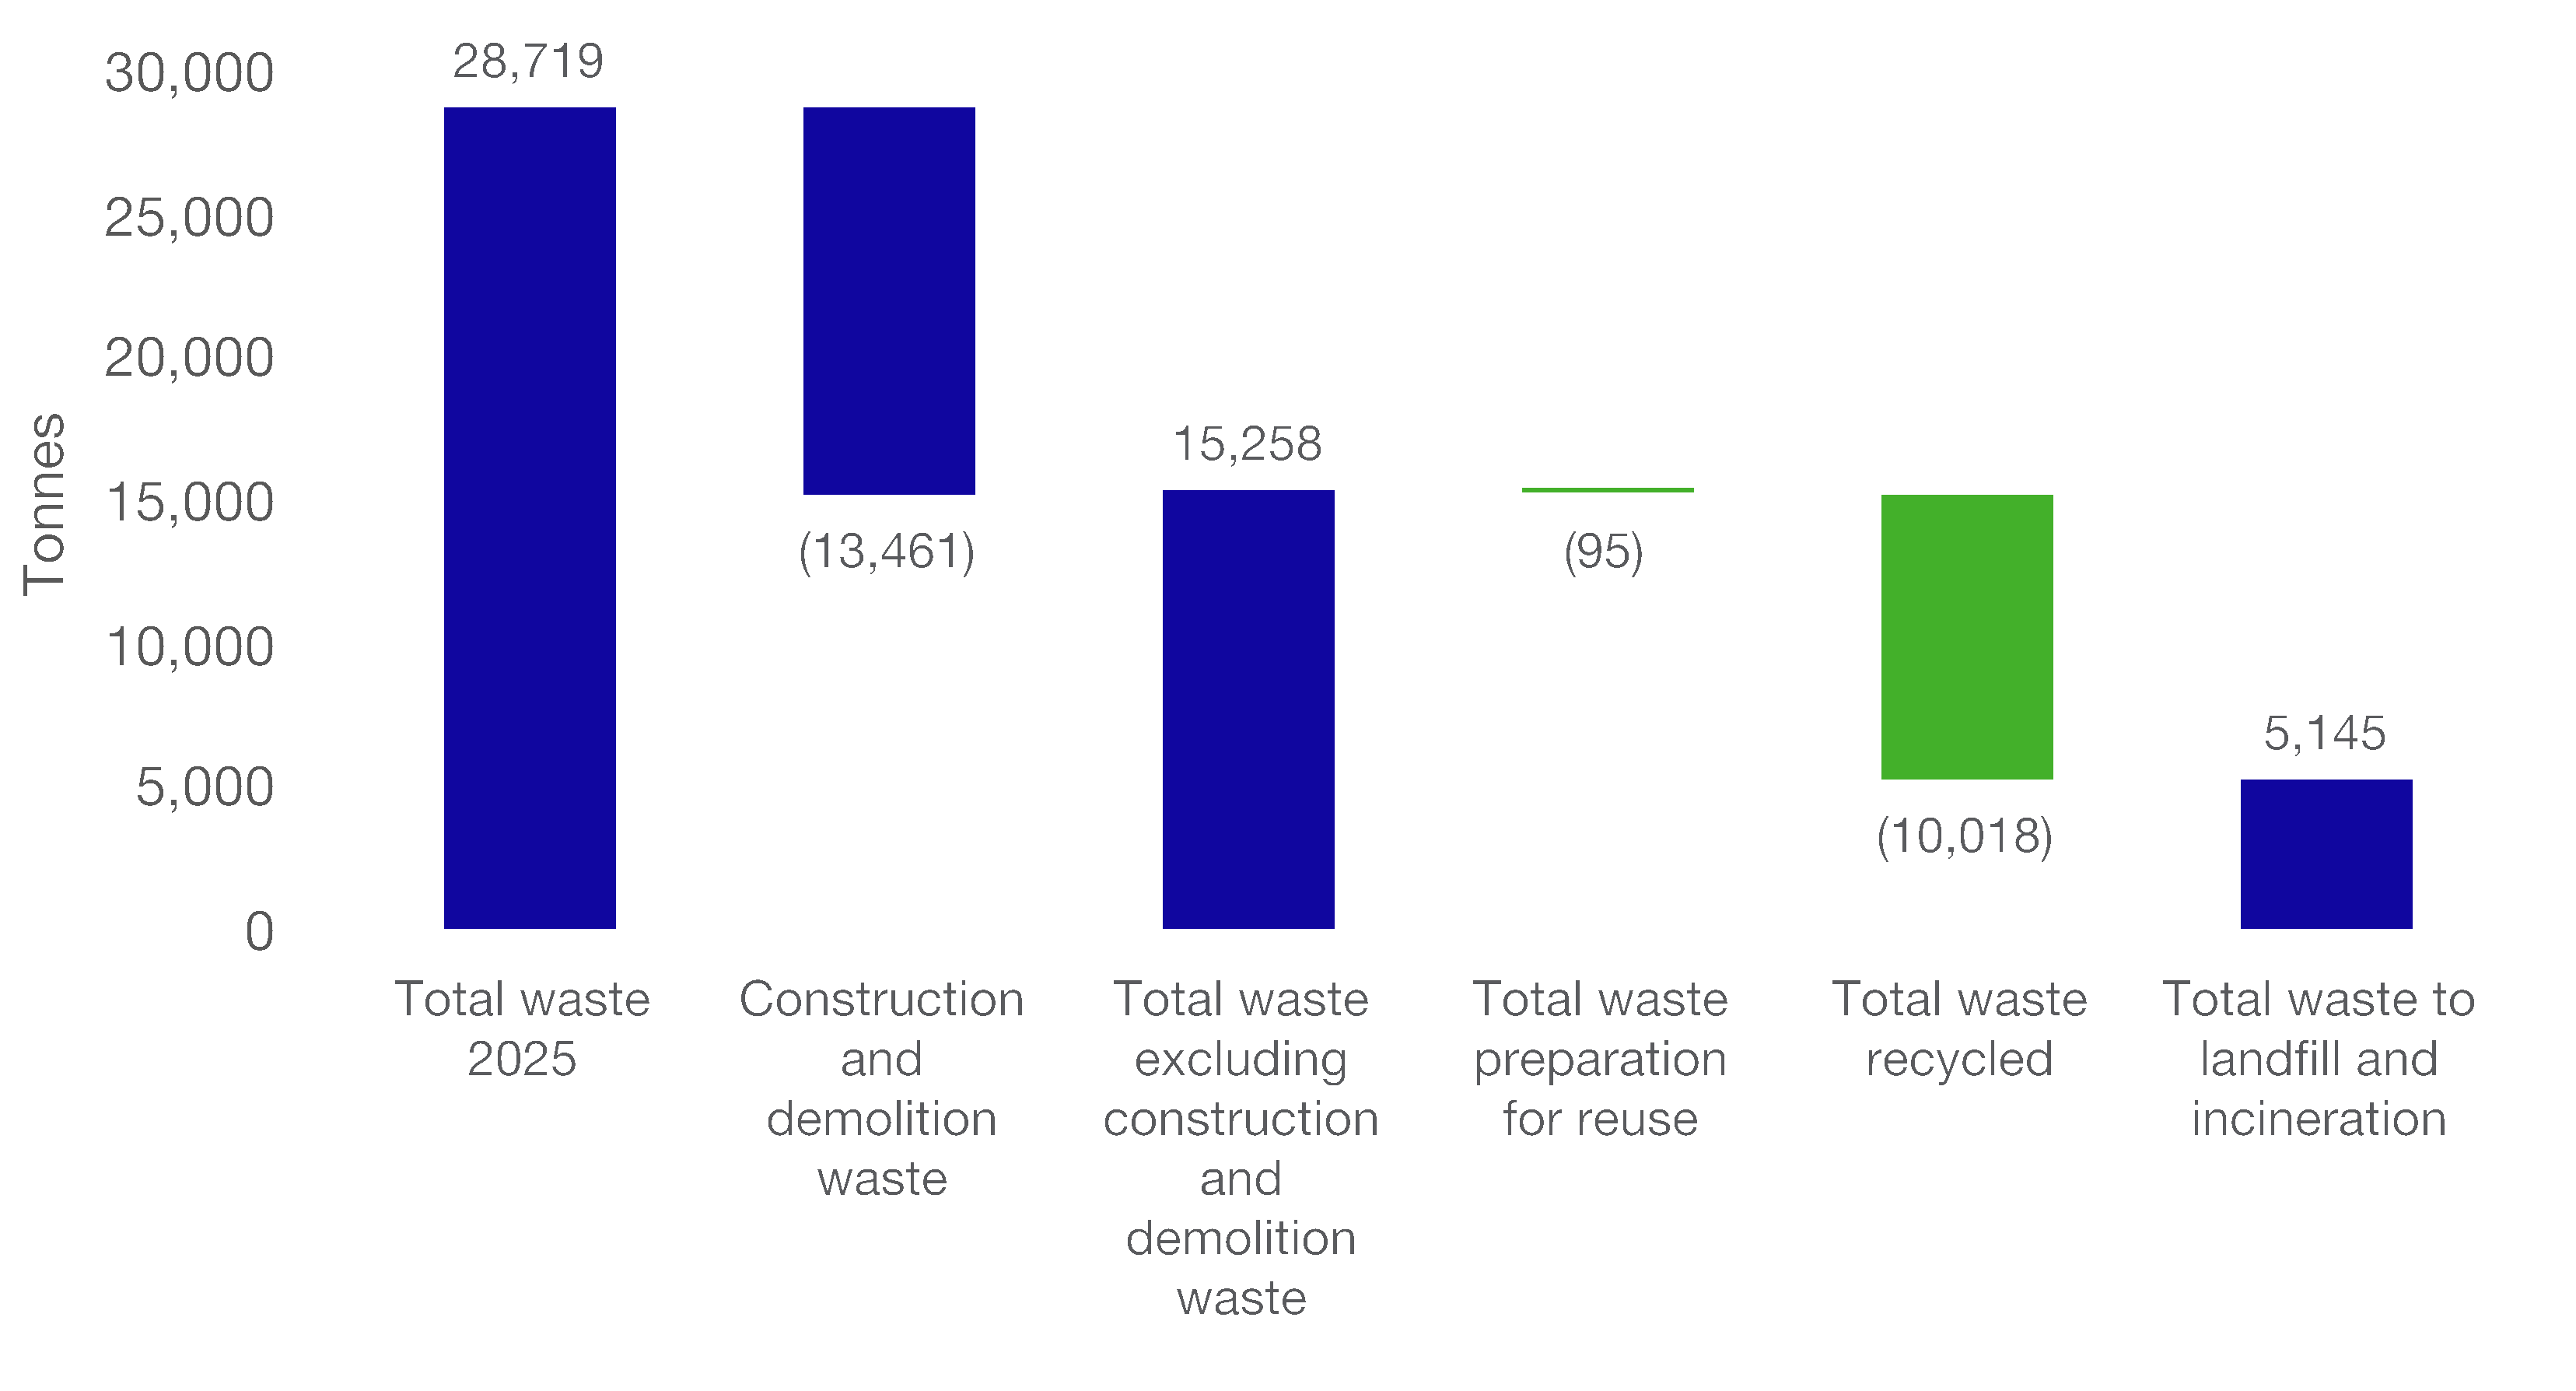
ASML Annual Report 2025
|
197 |
Our actions and resources |

Looking ahead |
ASML Annual Report 2025
|
198 |
Our objective |
 |
|
We aim to embed circular principles in real
estate by applying green building standards
and certification methods, with the goal of
making our new and existing buildings as
sustainable as possible.
In our owned real estate portfolio
management, we aim to have our newly built
and renovated buildings (those exceeding
€20 million investment) BREEAM-certified
for buildings in the EU, LEED-certified for
buildings in the US and Asia, and LEED/G-
SEED-certified for buildings in South Korea.
These certifications emphasize sustainability
through the circular use of materials and
waste reduction during a building’s design,
construction, and operation.
| |
Our scope |
Targets and performance |
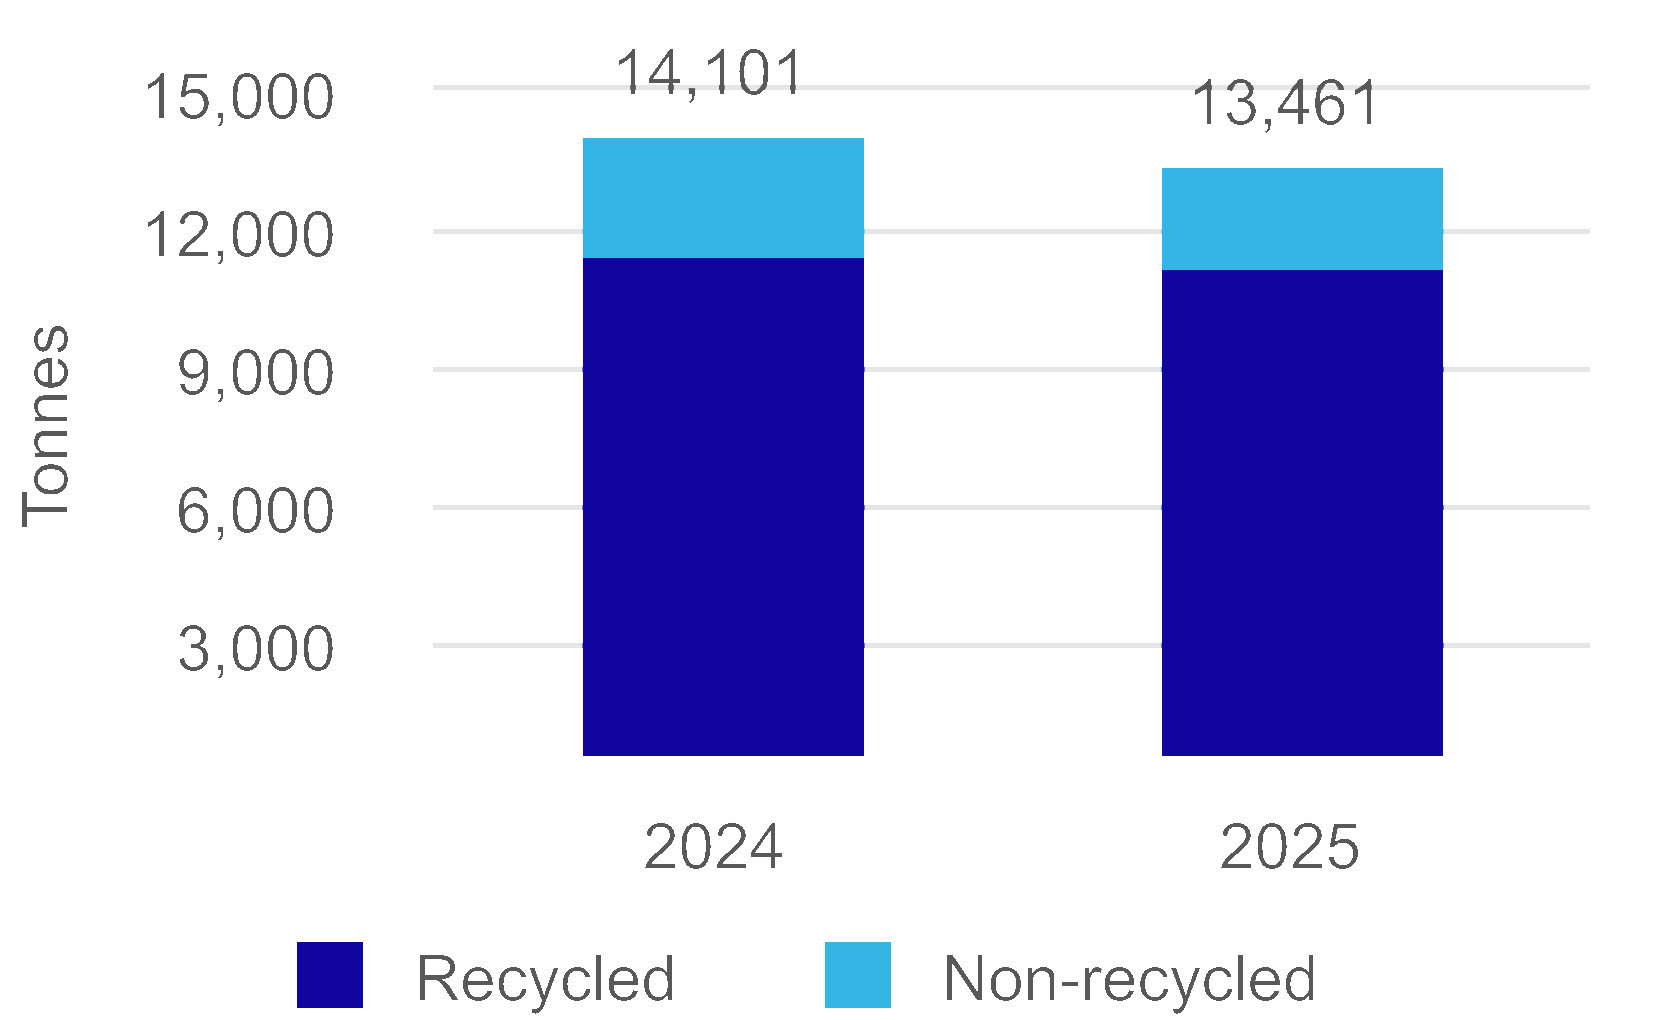
Our actions and resources |
Looking ahead |
ASML Annual Report 2025
|
199 |
Topic |
Description |
2024 |
2025 |
|
Resource inflows (in tonnes) |
Percentage of biological materials used in manufacturing that are sustainably sourced1
|
2% |
4% |
|
Biological materials used to manufacture products and services that are sustainably sourced |
800 |
1,920 |
||
Products and technical and biological materials used1
|
51,362 |
50,587 |
||
Percentage of secondary reused or recycled components, secondary intermediary products and secondary materials used in manufacturing (including packaging)1
|
57% |
60% |
||
Secondary reused components, secondary intermediary products and secondary materials used to manufacture products and services (including packaging) |
10,963 |
12,610 |
||
Secondary recycled components used to manufacture products and services (including packaging)1
|
18,490 |
17,857 |
Topic |
Description |
2024 |
2025 |
|
Resource outflows (in tonnes) |
Percentage of recyclable content in products and their packaging |
80.2% |
79.9% |
|
Recyclable content in products and their packaging1
|
30,552 |
28,228 |
Topic |
Description |
2024 |
2025 |
|
Waste generated by waste type
(in tonnes)2
|
Non-hazardous waste (excluding construction and demolition waste) |
12,243 |
14,252 |
|
Construction and demolition waste |
14,101 |
13,461 |
||
Hazardous waste |
1,024 |
1,006 |
||
Radioactive waste |
0.1 |
0.2 |
||
Total amount of waste generated by waste type |
27,368 |
28,719 |
||
Topic |
Description |
2024 |
2025 |
|
Waste diverted from disposal by
recovery operation type – Non-
hazardous waste (in tonnes)2
|
Preparation for reuse |
145 |
112 |
|
Recycling |
19,049 |
20,415 |
||
Other recovery operations |
0 |
0 |
||
Amount of waste diverted from disposal by recovery operation type – Non-hazardous waste |
19,194 |
20,527 |
||
Topic |
Description |
2024 |
2025 |
|
Waste diverted from disposal
by recovery operation type –
Hazardous waste (in tonnes)
|
Preparation for reuse |
37 |
44 |
|
Recycling |
757 |
756 |
||
Other recovery operations |
0 |
0 |
||
Amount of waste diverted from disposal by recovery operation type – Hazardous waste |
794 |
800 |
ASML Annual Report 2025
|
200 |
Topic |
Description |
2024 |
2025 |
|
Waste diverted from disposal
by recovery operation type –
Radioactive (in tonnes)
|
Preparation for reuse |
0.0 |
0.0 |
|
Recycling |
0.0 |
0.0 |
||
Other recovery operations |
0.0 |
0.0 |
||
Amount of waste diverted from disposal by recovery operation type – Radioactive |
0.0 |
0.0 |
||
Topic |
Description |
2024 |
2025 |
|
Waste directed to disposal by
treatment type – Non-hazardous
waste (in tonnes)1
|
Incineration |
5,954 |
6,157 |
|
Landfill |
1,196 |
1,029 |
||
Other disposal operations |
0 |
0 |
||
Amount of waste directed to disposal by treatment type – Non-hazardous waste |
7,150 |
7,186 |
||
Topic |
Description |
2024 |
2025 |
|
Waste directed to disposal by
treatment type – Hazardous waste
(in tonnes)
|
Incineration |
212 |
200 |
|
Landfill |
18 |
6 |
||
Other disposal operations |
0 |
0 |
||
Amount of waste directed to disposal by treatment type – Hazardous waste |
230 |
206 |
||
Topic |
Description |
2024 |
2025 |
|
Amount of waste directed to
disposal by treatment type –
Radioactive (in tonnes)
|
Incineration |
0.0 |
0.0 |
|
Landfill |
0.1 |
0.2 |
||
Other disposal operations |
0.0 |
0.0 |
||
Amount of waste directed to disposal by treatment type – Radioactive |
0.1 |
0.2 |
||
Topic |
Description |
2024 |
2025 |
|
Non-recycled (in tonnes)1
|
Preparation for reuse |
182 |
156 |
|
Non-recycled waste (including preparation for reuse) |
7,562 |
7,548 |
||
Percentage of non-recycled waste (including preparation for reuse) |
27.6% |
26.3% |
ASML Annual Report 2025
|
201 |
Topic |
Description |
2024 |
2025 |
|
Non-hazardous waste (in tonnes)1
|
General waste |
3,934 |
4,138 |
|
Waste wood |
2,842 |
3,401 |
||
Construction and demolition waste |
14,101 |
13,461 |
||
Metals |
1,410 |
2,246 |
||
Paper and cardboard |
1,178 |
1,341 |
||
Plastic |
828 |
1,153 |
||
Organic waste |
334 |
298 |
||
Electronics |
346 |
443 |
||
Glass |
16 |
13 |
||
Other non-hazardous waste |
1,355 |
1,219 |
||
Total non-hazardous waste |
26,344 |
27,713 |
||
Topic |
Description |
2024 |
2025 |
|
Hazardous waste (in tonnes)1
|
Hazardous liquids |
852 |
816 |
|
Cleaning wipes |
62 |
65 |
||
Empty packaging |
35 |
20 |
||
Batteries |
8 |
26 |
||
Filters |
1 |
1 |
||
Lamps |
1 |
1 |
||
Other hazardous waste |
65 |
77 |
||
Total hazardous waste |
1,024 |
1,006 |
ASML Annual Report 2025
|
202 |
Methodology on targets | |
Construction and demolition waste
|
||
Construction and demolition waste is excluded
from our targets because it does not result from
our daily operations. The amount also tends to
fluctuate over the years and can therefore make
the trend of the target metric unclear. However,
construction waste is included in our actuals.
|
||
Methodology on metrics | |

ASML Annual report 2025
|
203 |
Overview |
|
The EU Taxonomy
Regulation (EU 2020/852)
is a core part of the
European Green Deal.
It supports the flow
of capital toward more
sustainable economic
activities by creating
a common language
and standardized
reporting methodology
that helps determine
which activities can and
cannot be considered
‘environmentally
sustainable’.
|
|
1 |
Climate change mitigation
(CCM)
|
4 |
Transition to a circular economy (CE) |
|||
2 |
Climate change adaptation (CCA) |
5 |
Pollution prevention and control (PPC) |
|||
3 |
Sustainable use and protection of water
and marine resources (WTR)
|
6 |
Protection and restoration of biodiversity
and ecosystems (BIO)
|
|||
Summary of Taxonomy-aligned and eligible activities |
||||||||||||||||
The table below provides an overview of the proportion of turnover, capex and opex from products or services associated with Taxonomy-eligible and Taxonomy-aligned economic activities. |
||||||||||||||||
Financial year 2025 |
||||||||||||||||
KPI
(1)
|
Total
(2)
|
Proportion of
Taxonomy
eligible
activities
(3)
|
Taxonomy
aligned
activities
(4)
|
Proportion of
Taxonomy
aligned
activities
(5)
|
Breakdown by environmental objectives of Taxonomy aligned activities |
Proportion of
enabling
activities
(12)
|
Proportion of
transitional
activities
(13)
|
Not assessed
activities
considered
non-material
(14)
|
Taxonomy
aligned
activities in
previous
financial year
(N-1)
(15)
|
Proportion of
Taxonomy
aligned activities
in previous
financial year
(N-1) (16)
|
||||||
Climate
change
mitigation
(6)
|
Climate
change
adaptation
(7)
|
Water
(8)
|
Circular
Economy
(9)
|
Pollution
(10)
|
Bio-
diversity
(11)
|
|||||||||||
€, in millions |
% |
€, in millions |
% |
% |
% |
% |
% |
% |
% |
% |
% |
% |
€, in millions |
% |
||
Turnover |
32,667.3 |
98% |
0.0 |
0% |
0.2% |
0.0 |
0% |
|||||||||
Capex |
2,811.3 |
87% |
6.7 |
0.25% |
0.25% |
0.2% |
9% |
74.1 |
2% |
|||||||
Opex |
3,864.8 |
94% |
0.0 |
0% |
6% |
0.0 |
0% |
|||||||||
The basis for preparation, reporting scope, eligibility overview and overviews of turnover, capital expenditure and operational expenditure, including environmental objectives, key activities
and alignment assessments follow on the next pages.
|
||||||||||||||||
ASML Annual Report 2025
|
204 |
We apply a five-step approach to our EU Taxonomy assessment |
|||||||||||
1.
Identification
of eligible
activities
|
2.
Substantial
contribution
|
3.
Do no
significant
harm
|
4.
Compliance
with minimum
safeguards
|
5.
KPI
|
|||||||
Eligibility |
Compliance with technical screening criteria |
Compliance with
minimum safeguards
|
Alignment with
Taxonomy
|
||||||||

Environmental
objective
|
Taxonomy-eligible
activity
|
Related KPI |
Circular
economy (CE)
|
1.2 Manufacture of
electrical and electronic
equipment
|
Turnover,
opex, capex
|
Climate change
mitigation
(CCM)
|
4.1 Electricity generation
using solar photovoltaic
technology
|
Capex |
Climate change
mitigation
(CCM) and
Climate change
adaptation
(CCA)
|
4.9 Transmission and
distribution of electricity
|
|
Climate change
mitigation
(CCM)
|
4.16 Installation and
operation of electric heat
pumps
|
|
Circular
economy (CE)
|
5.1 Repair,
refurbishment and
remanufacturing
|
Turnover |
5.2 Sale of spare parts | ||
5.4 Sale of second-hand
goods
| ||
Climate change
mitigation
(CCM) and
Climate change
adaptation
(CCA)
|
7.2 Renovation of
existing buildings
|
Capex |
7.7 Acquisition and
ownership of buildings
| ||
Climate change
adaptation
(CCA)
|
14.2 Flood risk
prevention and
protection infrastructure
|
Capex |
ASML Annual Report 2025
|
205 |
Financial year 2025 |
|||||||||||||
Economic activities
(1)
|
Code
(2)
|
Taxonomy eligible
KPI (Proportion of
Taxonomy eligible
turnover)
(3)
|
Taxonomy aligned
KPI (monetary value
of turnover)
(4)
|
Taxonomy aligned
KPI (Proportion of
Taxonomy aligned
turnover)
(5)
|
Environmental objective of Taxonomy aligned activities |
Enabling activity
(12)
|
Transitional activity
(13)
|
Proportion of
Taxonomy aligned in
Taxonomy eligible
(14)
|
|||||
Climate
change
mitigation
(6)
|
Climate
change
adaptation
(7)
|
Water
(8)
|
Circular
Economy
(9)
|
Pollution
(10)
|
Bio-
diversity
(11)
|
||||||||
% |
€, in millions |
% |
% |
% |
% |
% |
% |
% |
(E where applicable) |
(T where applicable) |
% |
||
Manufacture of electrical and electronic equipment |
CE 1.2 |
82% |
0.0 |
0% |
0% |
0% |
|||||||
Repair, refurbishment and remanufacturing |
CE 5.1 |
14% |
0.0 |
0% |
0% |
0% |
|||||||
Sale of spare parts |
CE 5.2 |
0.2% |
0.0 |
0% |
0% |
0% |
|||||||
Sale of second-hand goods |
CE 5.4 |
2% |
0.0 |
0% |
0% |
0% |
|||||||
Sum of alignment per objective |
0% |
||||||||||||
Total |
98% |
0.0% |
0% |
0% |
0% |
||||||||

Turnover | |
< |
Not eligible |
2.1% |
|
< |
Eligible – Not aligned |
97.7% |
|
< |
Eligible – Aligned |
0% |
|
< |
Not assessed activities considered non-material |
0.2% |
|
ASML Annual Report 2025
|
206 |

Capital expenditure | |
< |
Not eligible |
3.4% |
|
< |
Eligible – Not aligned |
87.0% |
|
< |
Eligible – Aligned |
0.2% |
|
< |
Not assessed activities considered non-material |
9.4% |
|
ASML Annual Report 2025
|
207 |
Capex |
|||||||||||||
Financial year 2025 |
|||||||||||||
Economic activities
(1)
|
Code
(2)
|
Taxonomy eligible
KPI (Proportion of
Taxonomy eligible
capex)
(3)
|
Taxonomy aligned
KPI (monetary value
of capex)
(4)
|
Taxonomy aligned
KPI (Proportion of
Taxonomy aligned
capex)
(5)
|
Environmental objective of Taxonomy aligned activities |
||||||||
Climate
change
mitigation
(6)
|
Climate
change
adaptation
(7)
|
Water
(8)
|
Circular
Economy
(9)
|
Pollution
(10)
|
Bio-
diversity
(11)
|
Enabling activity
(12)
|
Transitional activity
(13)
|
Proportion of
Taxonomy aligned in
Taxonomy eligible
(14)
|
|||||
% |
€, in millions |
% |
% |
% |
% |
% |
% |
% |
(E where applicable) |
(T where applicable) |
% |
||
Manufacture of electrical and electronic equipment |
CE 1.2 |
55.3% |
0.0 |
0% |
0% |
0% |
|||||||
Electricity generation using solar photovoltaic technology |
CCM 4.1 |
0.05% |
1.3 |
0.05% |
0.05% |
100% |
|||||||
Transmission and distribution of electricity |
CCM 4.9
CCA 4.9
|
1.3% |
0.0 |
0% |
0% |
0% |
0% |
||||||
Installation and operation of electric heat pumps |
CCM 4.16 |
0.5% |
0.0 |
0% |
0% |
0% |
|||||||
Renovation of existing buildings |
CCM 7.2
CCA 7.2
|
6.2% |
0.0 |
0% |
0% |
0% |
0% |
||||||
Acquisition and ownership of buildings |
CCM 7.7
CCA 7.7
|
23.3% |
5.4 |
0.2% |
0.2% |
0.2% |
E |
0.8% |
|||||
Flood risk prevention and protection infrastructure |
CCA 14.2 |
0.3% |
0.0 |
0% |
0% |
0% |
|||||||
Sum of alignment per objective |
0.25% |
0.2% |
0% |
||||||||||
Total |
87% |
6.7 |
0.25% |
0.25% |
N/A |
0% |
N/A |
100.8% |
|||||
ASML Annual Report 2025
|
208 |

Operational expenditure | |
< |
Not eligible |
0% |
|
< |
Eligible – Not aligned |
94% |
|
< |
Eligible – Aligned |
0% |
|
< |
Not assessed activities considered non-material |
6% |
|
Opex |
|||||||||||||
Financial year 2025 |
|||||||||||||
Economic activities
(1)
|
Code
(2)
|
Taxonomy eligible
KPI (Proportion of
Taxonomy eligible
opex)
(3)
|
Taxonomy aligned
KPI (monetary value
of opex) (4)
|
Taxonomy aligned
KPI (Proportion of
Taxonomy aligned
opex) (5)
|
Environmental objective of Taxonomy aligned activities |
||||||||
Climate
change
mitigation
(6)
|
Climate
change
adaptation
(7)
|
Water
(8)
|
Circular
Economy
(9)
|
Pollution
(10)
|
Bio-
diversity
(11)
|
Enabling activity
(12)
|
Transitional activity
(13)
|
Proportion of
Taxonomy aligned in
Taxonomy eligible
(14)
|
|||||
% |
€, in millions |
% |
% |
% |
% |
% |
% |
% |
(E where
applicable)
|
(T where applicable) |
% |
||
Manufacture of electrical and electronic equipment |
CE 1.2 |
94% |
0.0 |
0% |
0% |
0% |
|||||||
Sum of alignment per objective |
0% |
||||||||||||
Total |
94% |
0% |
0% |
0% |
0% |
||||||||
ASML Annual Report 2025
|
209 |
Our objective |
 |
|
We aim to use water in our own operations
responsibly, recycle efficiently and reduce
our environmental impact.
| |
Why it matters |
Target and performance |
Our actions and resources |
Topic |
Description |
2025 |
|
Water
consumption
in our own
operations
(in 1,000 m3)
|
Total water consumption |
508 |
|
In areas at water risk, including areas of high-water stress |
365 |
||
Total recycled and reused |
7 |
||
Water intensity: Total water consumption in our own operations
per revenue (in m3/€m revenue)
|
16 |
Looking ahead |
Methodology on metrics |

ASML Annual Report 2025
|
210 |
Our ambition |
|||
We aim to deliver
responsible growth
that benefits all our
stakeholders – providing
an attractive workplace
for all, building a
responsible value chain,
fueling innovation in our
ecosystem and being a
valued partner to
communities.
|
|||
On the following pages, we set out
our approach and progress to date.
|
|||
Attractive
workplace for all
|
||
We strive to create a culture that empowers
our workforce to deliver on our vision by
ensuring people are proud to be part of
ASML and engaged with our ambitions.
We aim to attract and retain a healthy,
diverse and engaged workforce.
|
||
We’ll do this by focusing
on the following sub-topics:
|
||
•Talent attraction, employee
engagement and retention
•Learning and development
•Inclusion and diversity
•Occupational health and safety
•Labor conditions
•Well-being
|
||
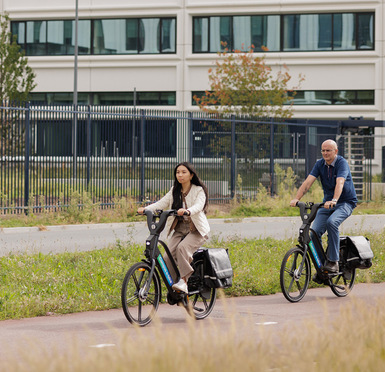 |
||
Responsible value chain |
||||
We seek to work with value chain partners
that are aligned with our values and
committed to upholding international
environmental and human rights standards.
We aim to prevent, mitigate and manage
adverse environmental and human
rights impacts in our value chain.
|
 |
|||
We’ll do this by focusing
on the following sub-topics:
•Responsible product design
•Responsible supply chain
•Responsible product use
|
||||
 |
||
Innovation
ecosystem
|
||
We’re fostering innovation through
collaboration and partnerships – where
trust and knowledge-sharing serves as
the foundation for long-term cooperation.
We aim to build a thriving, multi-
regional innovation ecosystem that
helps solve some of humanity’s
toughest challenges.
|
||
We’ll do this by focusing
on the following sub-topics:
|
||
ESG innovation:
•ESG-focused research
•ESG-focused startups and scaleups
•ESG-focused platforms and
collaborations
|
||


Valued partner in our communities |
||||
We believe we have a responsibility to be a
positive contributor and valued partner to
the communities in which we operate.
We aim to ensure that ASML and
communities benefit from each
other’s presence and support
each other’s development.
|
 |
|||
We’ll do this by focusing
on the following sub-topics:
•Attractive communities
•Inclusive communities
•Investing in STEM education
|
||||


ASML Annual Report 2025
|
211 |

...for the planet |
|
As an employer we have a responsibility to provide a working environment
where people can develop their talents, feel respected and safe, and be
healthy and thrive. We want to foster an exceptional workplace for our
exceptional talent.
This includes creating an inclusive culture where people are supported
in their learning, leadership, advancement and well-being – and where
international human rights are upheld and fair employment opportunities
are provided.
By prioritizing employee development and well-being, we also empower
employees to contribute meaningfully to their communities.
|
...for ASML |
As a key partner in the semiconductor ecosystem, we have a responsibility
to deliver the technology our customers need to drive innovation – and
healthy, diverse, engaged, highly skilled people are key to our performance
and long-term success.
To maintain our fast pace of innovation, we need to attract and retain the
best talent. By investing in our people, we help them reach their full potential
and enable us to keep powering technology forward.
ASML is preparing for a period of significant business growth – strong
leadership, people development and inclusion will be crucial for this and
for our future success.
|
Key |
||
|
On track / achieved |
|
|
Off track / not achieved |
|
Our 2025 progress |
||||
Employee engagement
score (three-year
rolling average)
|
Employee inclusion
score (three-year
rolling average)
|
|||
78.9% |
80.2% |
|||
2024: 78.9% vs. benchmark -2.1%
|
2024: 82.4% on par vs. benchmark
|
|||
2025 target: >-2.0% vs. top 25%
performing companies.
Employee engagement score
against benchmark 2025 -2.3%
|
2025 target: >-3.0% vs. top 25%
performing companies.
Employee inclusion score
against benchmark 2025 -0.6%
|
|||
Attrition rate |
Gender diversity: % inflow
of women (all job grades)
|
|||
4.1% |
29% |
|||
2024: 3.8%
|
2024: 26%
|
|||
2025 target: <7%
|
2025 target: 24%
|
|||
Gender diversity: %
representation of women
in job grade 13+
|
Gender diversity: % inflow
of women to job grade 9+
|
|||
16% |
28% |
|||
2024: 12%
|
2024: 30%
|
|||
2026 target: 14%
|
2025 target: 24%
|
|||
Talent attraction, employee
engagement and retention
|
Learning and
development
|
Inclusion and
diversity
|
Occupational health
and safety
|
Labor conditions |
Well-being |

ASML Annual Report 2025
|
212 |
Key |
||||
|
Actual positive impact |
|
Risk |
|
|
Potential positive impact |
|
Opportunity |
|
|
Actual negative impact |
|||
|
Potential negative impact |
|||
|
|
Impact on employees by providing fair labor
conditions and associated risk of (perception of)
unfair working and employment conditions at
ASML, affecting ability to engage and retain
talent (Labor conditions)
|
|
|
Impact on employees by facilitating knowledge
and skills development which contribute to
continued employability and professional
growth, and associated risk of failure to attract,
develop and retain talents with adequate skills
and knowledge (Learning and development)
|
 |
|
Potential impact in case of failure to effectively
manage employees’ well-being and work-life
balance, including excessive overtime, resulting
in stress, health issues and increased likelihood
of accidents, and associated risk of failure to
engage and retain talent (Well-being)
|
|
|
Potential impact on workers in case of failure to
manage occupational health and safety, and
associated risk in case this impact materializes
(Occupational health and safety)
|
|
Potential impact on workers’ right to freedom of
association, collective bargaining and social
dialogue in certain regions (Labor conditions)
|
|
Potential impact on workers as a result of
discrimination and unequal treatment, including
pay inequality, as well as violence and harassment
in the workplace (Inclusion and diversity)
|
|
Failure to comply with health- and safety-related
regulations or implement effective health and
safety practices could result in liabilities and
reputational risk (Occupational health and safety)
|
|
Failure to comply with labor law could lead to
sanctions, financial loss or reputational damage
(Labor conditions)
|

ASML Annual Report 2025
|
213 |
Our approach | |
Levers for action |
|

ASML Annual Report 2025
|
214 |

ASML Annual Report 2025
|
215 |
ASML Annual Report 2025
|
216 |
|
Process for engaging |

Process for remediation |
ASML Annual Report 2025
|
217 |
Our objective |
 | |
We aim to create an exceptional workplace
that attracts, engages and retains talent by
fostering an environment where people can
thrive, grow and contribute to the
company’s long-term success.
| |
Our scope |
Targets and performance |
Not achieved |
2025 target: Within 2 pp of
(or higher than) the top
25% of companies
|
||
-3% |
-2% |
-1% |
0% |
+1% |
+2% |
|
2024 | ||||||
2025 | ||||||

ASML Annual Report 2025
|
218 |
0% |
2% |
4% |
6% |
8% |
|||
2024 |
|||||||
2025 |
|||||||
Achieved |
2025 target: <7%
|
||||||

Our actions and resources |
Looking ahead |
ASML Annual Report 2025
|
219 |
Our objective |
 | |
We aim to support and empower our
employees on their development journey
to reach their career ambitions. We strive
to provide access to best-in-class learning
that promotes skills and knowledge growth
through targeted programs, innovative
training and emerging technologies such
as AI.
| |
Our scope |
0% |
20% |
40% |
60% |
80% |
100% |
|
2024 |
||||||
2025 |
||||||
Achieved |
2025 target: 80%
|
|||||
Targets and performance |
0% |
20% |
40% |
60% |
80% |
100% |
|||
2024 |
||||||||
2025 |
||||||||
Achieved |
2025 target: 80%
|
|||||||


Our actions and resources |
ASML Annual Report 2025
|
220 |

Unlocking gigs with AI |
Gigs initiative powered by AI | ||
 Gigs are short-term skill-development
activities designed to meet real
business needs while enabling
employees to explore, learn, and grow.
Gig recommendations in Career Hub
are tailored through AI and machine-
learning algorithms, considering
factors such as job profile, skills, past
experiences, career aspirations and
organizational requirements.
|
||

Looking ahead |
ASML Annual Report 2025
|
221 |
Our objective |
 |
|
We aim to foster inclusion, diversity and
sense of belonging in a safe environment
for all ASML workers, where everyone is
valued, respected and can fully contribute.
| |
0% |
10% |
20% |
30% |
40% |
|
2024 |
|||||
2025 |
|||||
Achieved |
2025 target: 24%
|
||||
Our scope |
Targets and performance |

ASML presents in this Annual Report its diversity and
inclusion policies and targets for, and progress on
achieving, gender diversity as required by Dutch law
and its Diversity and Inclusion Policy adopted by the
BoM pursuant to requirements of Dutch law. The US
executive order 14173 (EO) titled, “Ending Illegal
Discrimination and Restoring Merit-Based
Opportunity”, took effect on April 21, 2025. Our
diversity targets and key performance indicators
(KPIs) do not apply to ASML’s US operations or
employees. In addition, certain related programs and
initiatives do not apply to ASML’s US employees to the
extent they would conflict with the EO or other
applicable law, regulation or orders. The comparative
figures (including baseline figures) reported herein
capture all ASML’s employees worldwide.
|
||
Achieved |
2025 target: 24%
|
||
0% |
20% |
40% |
60% |
80% |
100% |
|
2024 | ||||||
2025 | ||||||

0% |
20% |
40% |
60% |
80% |
100% |
|
2024 | ||||||
2025 | ||||||
|
On track |
2026 target: 14%
|
|
-4% |
-3% |
-2% |
-1% |
0% |
1% |
2% |
|
2024 | |||||||
2025 | |||||||
|
Achieved |
2025 target: Within 3 pp of (or higher than)
the top 25% of companies
|
||


ASML Annual Report 2025
|
222 |

 |
“Inclusion requires focus and
consistent, intentional effort.
I see opportunities for
improvement within my
own organization.”
Nancy Mac Gillavry
Head of Finance
|
 |
“Gaining insight into how others experience their environment
can be truly eye-opening. Taking the time to see things from
different perspectives highlights the often unseen advantages
we may have, and reminds us of the value of empathy.”
Markus Matthes
Country Manager Germany
|
ASML Annual Report 2025
|
223 |
Our actions and resources |
Looking ahead |

ASML Annual Report 2025
|
224 |
Our objective |
 |
|
We aim to provide injury-free and healthy
working conditions for everyone on our
premises by eliminating hazards, reducing
safety risks and preventing occupational
ill health.
| |
Our scope |
Targets and performance |
0 |
0.2 |
0.4 |
0.6 |
0.8 |
1.0 |
1.2 |
|
2024 |
|||||||
2025 |
|||||||
Not achieved |
2025 target: 0.96
|
|

Our actions and resources |
Looking ahead |

ASML Annual Report 2025
|
225 |
Our objective |
 |
|
We aim to provide fair labor conditions and
social protection for all workers, regardless
of their location and contract types.
| |
Our scope | |
Targets and performance |
0% |
20% |
40% |
60% |
80% |
100% |
||
2024 |
|||||||
2025 |
|||||||
|
Achieved |
2025 Target: 100% |
|

Our actions and resources |
Looking ahead | |
ASML Annual Report 2025
|
226 |
Our objective |
 |
|
We aim to integrate well-being into daily
work practices, supporting employees in
maintaining a healthy, balanced, and
productive life.
| |

Our scope | |
Targets and performance |
-3% |
-2% |
-1% |
0% |
1% |
2% |
||
2024 |
|||||||
2025 |
|||||||
|
Achieved |
2025 target: Within 2 pp
of (or higher than) the top
25% of companies
|
|

Our actions and resources |
Looking ahead | |
ASML Annual Report 2025
|
227 |

Global Well-Being Month |


ASML Annual Report 2025
|
228 |
Topic |
Description |
2024 |
2025 |
|
Total number of employees –
headcount by gender
(as of December 31)
|
Male |
34,454 |
34,844 |
|
Female |
8,899 |
9,270 |
||
Other |
38 |
57 |
||
Not reported |
4 |
4 |
||
Total number of employees |
43,395 |
44,175 |
Topic |
Description |
2024 |
2025 |
||
Number of employees by significant
employment country or jurisdiction
(representing >10% total employees)
(headcount as of December 31)
|
The Netherlands |
23,194 |
23,707 |
||
Taiwan |
4,572 |
4,548 |
|||
United States |
8,310 |
8,242 |
Topic |
Description |
Female |
Male |
Other |
Not
disclosed
|
Total 2024 |
|
Total number of permanent and
temporary employees by gender
(headcount as of December 31)
|
Permanent employees |
8,212 |
32,216 |
32 |
4 |
40,464 |
|
Temporary employees |
687 |
2,238 |
6 |
0 |
2,931 |
||
Total employees |
8,899 |
34,454 |
38 |
4 |
43,395 |
Topic |
Description |
Female |
Male |
Other |
Not
disclosed
|
Total 2025 |
|
Total number of permanent and
temporary employees by gender
(headcount as of December 31)
|
Permanent employees |
8,672 |
32,960 |
50 |
4 |
41,686 |
|
Temporary employees |
598 |
1,884 |
7 |
0 |
2,489 |
||
Total employees |
9,270 |
34,844 |
57 |
4 |
44,175 |
Topic |
Description |
2024 |
2025 |
||
Reconciliation of the total number of
employees per ESRS to number of
employees reported in the
Consolidated financial statements
(as of December 31)
|
Total number of payroll and temporary employees reported in the Consolidated financial statements (Note 18) (in FTE) |
44,027 |
44,209 |
||
Less: Temporary employees reported in the Consolidated financial statements (Note 18) (non-employees as defined by ESRS) (in FTE) |
1,241 |
689 |
|||
Total number of payroll employees reported in the Consolidated financial statements (Note 18) (in FTE) |
42,786 |
43,520 |
|||
Total number of payroll employees reported in the Consolidated financial statements – converted to headcount unit of measure (in headcount) |
43,395 |
44,175 |
|||
Number of employees as defined by ESRS (in headcount) |
43,395 |
44,175 |
Topic |
Description |
2024 |
2025 |
||
Employee turnover (For the period
January 1 to December 31)1
|
Employee turnover (in headcount) |
1,652 |
1,847 |
||
Employee turnover rate |
3.9% |
4.2% |
ASML Annual Report 2025
|
229 |
Topic |
Description |
2024 |
2025 |
|
Percentage of total employees
covered by collective bargaining
agreements (as of December 31)
|
Employees covered by collective bargaining agreements |
61% |
62% |
Topic |
2024 |
2025 |
|||||||
The percentage of its total employees
within significant countries within the
EEA or significant regions outside the
EEA, covered by collective bargaining
agreements and/or workers,
representatives
(as of December 31, 2024 and 2025)
|
Collective bargaining coverage |
Social dialogue |
Collective bargaining coverage |
Social dialogue |
|||||
Employees – EEA
(for countries with
>50 empl.
representing >10%
total empl.)
|
Employees – non-
EEA (for regions
with >50 empl.
representing >10%
total empl.)
|
Workplace
representation (EEA
only) (for countries
with >50 empl.
representing >10%
total empl.)1
|
Employees – EEA
(for countries with
>50 empl.
representing >10%
total empl.)
|
Employees – non-
EEA (for regions
with >50 empl.
representing >10%
total empl.)1
|
Workplace
representation (EEA
only) (for countries
with >50 empl.
representing >10%
total empl.)1
|
||||
Coverage rate |
|||||||||
0–19% |
North America |
North America |
|||||||
20–39% |
Asia |
Asia |
|||||||
40–59% |
|||||||||
60–79% |
|||||||||
80–100% |
The Netherlands |
The Netherlands |
The Netherlands |
The Netherlands |
|||||
ASML Annual Report 2025
|
230 |
Topic |
Description |
2024 |
2025 |
||||
Gender distribution at top
management level (in percentage
and headcount as of December 31)
|
Male |
88% |
318 |
85% |
340 |
||
Female |
12% |
44 |
15% |
59 |
|||
Other |
0% |
1 |
0% |
1 |
|||
Not reported |
0% |
0 |
0% |
0 |
|||
Total employees at top management level |
100% |
363 |
100% |
400 |
|||
Topic |
Description |
2024 |
2025 |
||
Age distribution of employees (in
headcount as of December 31)
|
under 30 years old |
8,130 |
6,998 |
||
30–50 years old |
28,072 |
29,626 |
|||
over 50 years old |
7,193 |
7,551 |
|||
Total employees |
43,395 |
44,175 |
ASML Annual Report 2025
|
231 |
Topic |
Description |
2024 |
2025 |
||
Percentage of employees that
completed an annual performance
and career development review
against the total number of
employees by gender
|
Male |
94% |
95% |
||
Female |
93% |
94% |
|||
Other |
76% |
98% |
|||
Not reported |
100% |
100% |
|||
Total |
94% |
95% |
Topic |
Description |
2024 |
2025 |
||
Percentage of employees that
completed an annual performance and
career development review against the
total number of employees eligible for
a review by gender
|
Male |
96% |
96% |
||
Female |
96% |
96% |
|||
Other |
97% |
98% |
|||
Not reported |
100% |
100% |
|||
Total |
96% |
96% |
Topic |
Description |
2024 |
2025 |
||
Average number of training hours
per employee
|
Average number of training hours per employee headcount |
41 |
40 |
||
Topic |
Description |
2024 |
2025 |
||
Average number of training hours
per employee headcount by gender
|
Male |
42 |
41 |
||
Female |
35 |
35 |
|||
Other |
9 |
4 |
|||
Not reported |
60 |
87 |
ASML Annual Report 2025
|
232 |
Topic |
Description |
2024 |
2025 |
||
Percentage of employees covered
by our health and safety
management system
|
Employees covered by our health and safety management system |
100% |
100% |
Topic |
Description |
2024 |
2025 |
||
Number of work-related fatalities as
a result of injuries
|
Employee fatalities as a result of work-related injuries |
0 |
0 |
||
Non-employee fatalities as a result of work-related injuries |
0 |
0 |
|||
Other worker fatalities on-site as a result of work-related injuries |
0 |
0 |
Topic |
Description |
2024 |
2025 |
||
Total number and rate of employee
recordable work-related accidents
|
Number of employee recordable work-related injuries |
77 |
76 |
||
Rate of employee recordable work-related injuries |
1.11 |
1.05 |
ASML Annual Report 2025
|
233 |
Topic |
Description |
2024 |
2025 |
||
Gender pay gap |
Gender pay gap percentage |
10.2% |
9.3% |
Topic |
Description |
2024 |
2025 |
||
|
Annual total remuneration ratio |
Annual total remuneration ratio |
43 |
53 |
ASML Annual Report 2025
|
234 |
Methodology on targets | |
ASML Annual Report 2025
|
235 |
Methodology on metrics | |
ASML Annual Report 2025
|
236 |

ASML Annual Report 2025
|
237 |


...for the planet |
|
We believe that microchip-enabled digital technologies are among the most
critical tools for societal advancement. At the same time, we understand
that technological development presents environmental and human rights
challenges within global value chains. The goods and services we purchase,
the design choices we make and the products we sell are potentially linked
to impacts on the environment and human rights. We conduct due diligence
and work with suppliers and customers to implement responsible business
practices for protecting the environment and respecting human rights.
|
...for ASML |
We are dedicated to preventing and mitigating adverse environmental
and human rights impacts in our value chain. This is also what customers,
investors, employees and regulators expect from us. By committing to
international environmental and human rights standards we work to meet
stakeholder expectations, ensure compliance with regulations and build a
resilient value chain.
Our approach aligns with our employees’ expectations regarding responsible
business conduct, and contributes to the environmental and human rights
objectives of our customers and suppliers. It also supports our shareholders’
desire to improve long-term sustainability performance and minimize
business costs.
|
Key |
||
|
On track / achieved |
|
|
Off track / not achieved |
|
Our 2025 progress |
||||
Responsible Business
Alliance (RBA)
self-assessment completed
(in %)
|
Suppliers with overall high
risk evaluated and follow-
up agreed (in %)
|
|||
90% |
100% |
|||
2024: 91%
|
2024: 100%
|
|||
2025 target: 90%
|
2025 target: 100%
|
|||
Responsible
product design
|
Responsible
supply chain
|
Responsible
product use
|
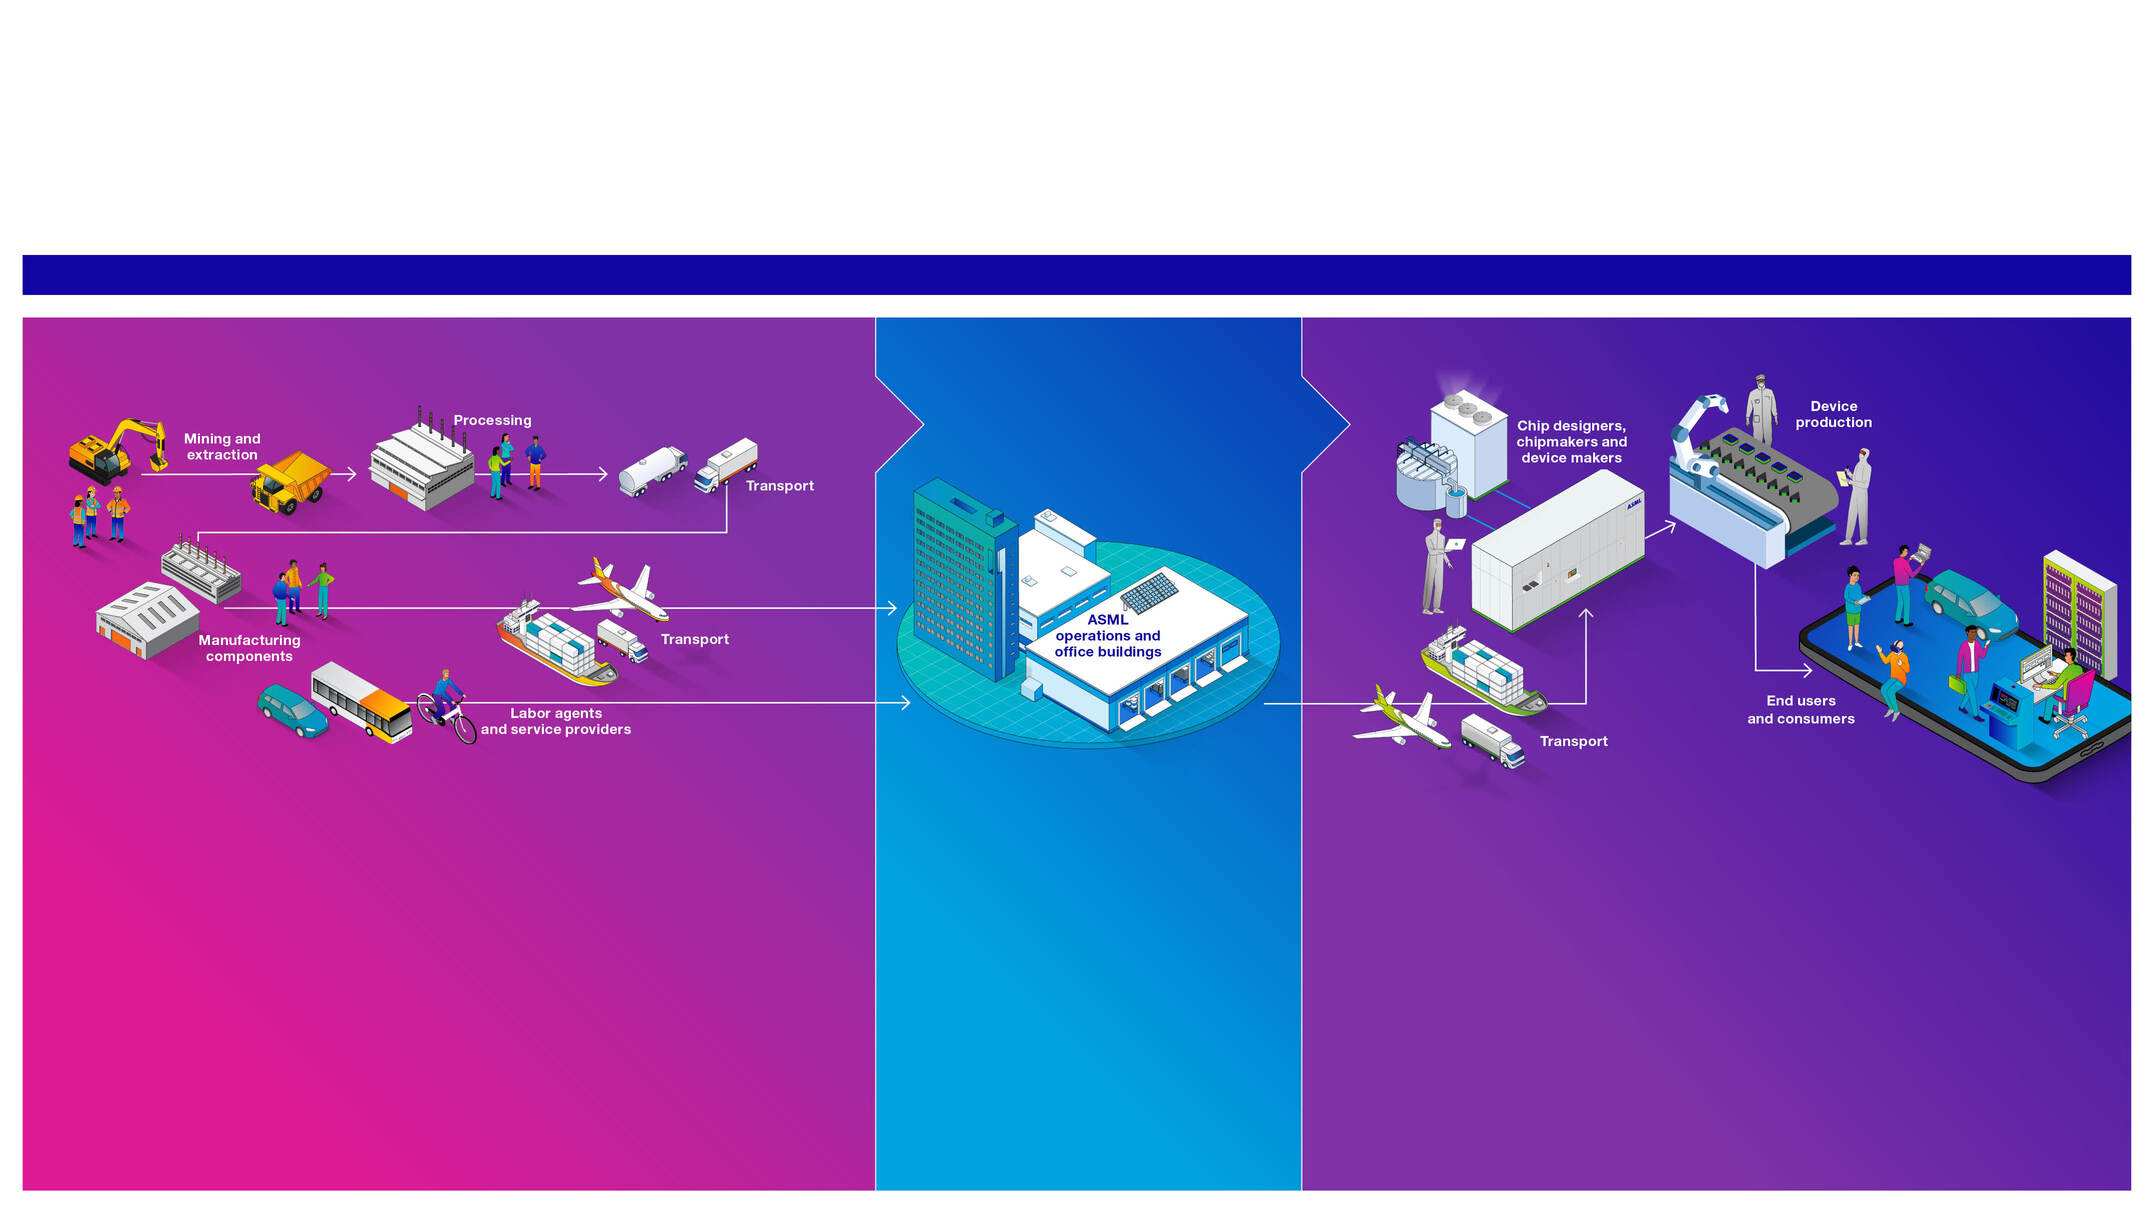
ASML Annual Report 2025
|
238 |
Key |
||||
|
Actual positive impact |
|
Risk |
|
|
Potential positive impact |
|
Opportunity |
|
|
Actual negative impact |
|||
|
Potential negative impact |
|||
|
Potential impacts on human rights of supply chain workers in on-site facility services,
electronics manufacturing and mining of minerals (Responsible supply chain)
|
|
Failure to comply with rules and regulations regarding conflict minerals (Responsible
supply chain)
|
|
|
Potential impact on the health and safety of customer and partner employees while
working on ASML systems, and associated risk if the impact materializes
(Responsible product design)
|
|
Potential impacts on human rights of workers at customers and beyond inherent to the
technology sector (Responsible product use)
|
|
 |
Improved quality of life through access to technology and digital services (Responsible
product use)
|
|
|
Potential impacts on society due to potential misuse of technology
(Responsible product use)
|

ASML Annual Report 2025
|
239 |
Levers for action |
Our approach | |

ASML Annual Report 2025
|
240 |
Levers for action (continued) |
ASML Annual Report 2025
|
241 |
Responsible product use |
||||
Just as we are committed to
protecting the environment
and respecting human rights,
we expect and encourage the
same from our customers.
Despite our efforts to conduct due
diligence, we do not always know – and
cannot control – which products our
customers and their own customers create
with the use of our products and services,
and cannot prevent all potential misuse.
However, we reserve the right to decline,
restrict or cease business in the event of
any violation of our responsible value chain
policy or our Human Rights Policy.
|
We recognize our wide-ranging
impact in society, contributing
to global digitalization and
transforming the ways in which
people live and work.
We believe that microchip-enabled digital
technologies are among the most critical
tools for societal advancement.
Driving this positive impact for society is
an integral part of our corporate vision and
business strategy, with related policies,
actions and targets embedded across our
operations and tracked for effectiveness.
At the same time, we understand that
technological development presents human
rights and environmental challenges within
global value chains.
One of the emerging environmental
challenges facing the world today is the
rapidly rising energy consumption of data
centers as a result of the growth of AI.
Addressing this issue will require more
efficient AI models and improved
semiconductors. If we do not act together
as an industry, emissions from semiconductor
production are forecasted to increase by a
a factor of four in 2030. This is a key
challenge that ASML and the entire industry
must face.
We continue to monitor our approach to
responsible product use.
|
|||
We conduct voluntary due diligence on our
customers by:
•Considering environmental and human
rights risks and impacts prior to entering
new business relationships.
•Seeking contractual assurances
regarding environmental and human
rights risks and impacts when relevant.
|


ASML Annual Report 2025
|
242 |
Our objective |
 |
|
We aim to adopt responsible design
practices to prevent and mitigate potential
impacts from material choices, manufacturing,
and use of our products on human rights
and the environment across our value chain.
| |
Our scope |
Targets and performance |
Our actions and resources |
Looking ahead | |

ASML Annual Report 2025
|
243 |
Our objective | |
Suppliers split by % spend |
||
Suppliers split by number |
 |
|
We aim to build a transparent supply chain
that respects human rights and the
environment, promotes positive contributions
to society, and actively prevents and
addresses potential negative impacts.
| |
Our scope | |
ASML suppliers |
||
We differentiate between our business-
critical, strategically important suppliers
and those in scope of the RBA Self-
Assessment Questionnaire (SAQ).
Business critical suppliers are responsible
for delivering a unique part and/or are
single-sourced, involve a switching time to
an alternative supplier of more than 12
weeks, or supply parts with long production
times. For those in scope of the RBA SAQ,
other factors are applied as our focus goes
beyond our own company – incorporating
environmental factors and human rights.
|
||
ASML suppliers |


Spend in 2025 |


272 business-
critical
suppliers
generate 89%
of product-
related spend
|
153 business-
critical
suppliers
generate 19%
of non-
product-
related spend
|


Product-related spend |
72% |
|
Non-product-related spend |
28% |
Supplier base in 2025 |

Product-related suppliers |
900 |
|
Non-product-related suppliers |
4,200 |
ASML Annual Report 2025
|
244 |
Targets and performance |
0% |
20% |
40% |
60% |
80% |
100% |
||
2024 |
|||||||
2025 |
|||||||
Achieved |
2025 target: 90%
|
||||||

0% |
20% |
40% |
60% |
80% |
100% |
||
2024 |
|||||||
2025 |
|||||||
Achieved |
2025 target: 100%
|
||||||

ASML Annual Report 2025
|
245 |
Key elements of the RBA SAQ |
|||
Element |
RBA commitment |
||
Labor |
To uphold the human rights of
all workers (direct and indirect)
and to treat them with dignity
and respect as understood by
the international community,
including the International
Labour Organization (ILO)’s
eight fundamental conventions.
|
||
Health and
safety
|
To minimize the incidence of work-
related injury and illness, and to
ensure a safe and healthy working
environment. Communication and
education are essential in identifying
and solving health and safety
issues in the workplace.
|
||
Environment |
Environmental responsibility
is integral to producing world-class
products and services. Adverse
effects on the environment, natural
resources and communities are to
be minimized, while safeguarding
the health and safety of the public.
|
||
Ethics |
To meet social responsibilities and
achieve success in the industry,
the highest standards of ethics
should be upheld – including but
not limited to business integrity,
anti-bribery and corruption,
antitrust and competition, and
protecting privacy.
|
||
Members and participants are committed to
establishing a management system to ensure:
|
|||
•Compliance with applicable laws, regulations
and customer requirements
•Conformance with the code standards
•Identification and mitigation of operational risks
•Facilitation of continuous improvement
|
|||
Our actions and resources | |
Looking ahead | |
Methodology on targets |
||
This section outlines the methodology
used to define and measure our targets
related to Responsible value chain.
Responsible supply chain
Achieve 90% completion of the RBA SAQ by all
suppliers in scope by 2025
We scope suppliers for self-assessment
based on (potential) impacts on the environment
and human rights, considering the sector
and country they operate in or services they
provide. We determine country and sector risk
using the RBA risk assessment platform, and
add on-site service providers, labor agents
and waste handlers to our scope as categories
that are inherently high risk. We also add
suppliers that were in scope last year, and
those for which ESG risks or impacts are
found via our ongoing screening of media
and other public sources.
Achieve 100% evaluation of – and agree follow-up
action with – our suppliers identified by the RBA
SAQ as having overall high risk, by 2025
We assess suppliers classified as overall high-
risk based on the RBA SAQ. This process
involves reviewing identified risks and
determining appropriate follow-up actions,
which may include requesting additional
information, adding contractual requirements,
conducting audits, or recommending third-
party training. We only count an assessment
as complete when the review of findings is
finalized and agreed actions are documented.
The scope of this target is limited to suppliers
for which an overall high risk is identified in
the RBA SAQ.
|
||

ASML Annual Report 2025
|
246 |
...for the planet |
|
Building a strong foundation that benefits our partners and other companies,
organizations and neighboring communities. Through ESG-focused
research, startups, scaleups, platforms and collaborations, we aim to
support innovative ideas and increase the technical talent pool needed
to solve some of society’s key challenges.
|
...for ASML |
Consumers across the world are using ever-more powerful and sophisticated
devices that are increasing the demand for microchips, in turn driving
demand for the chipmaking systems that make them smaller, faster, cheaper
and more powerful and energy-efficient.
We can only meet this demand by consistently and continuously advancing
our technology through innovation, in close collaboration with customers
and suppliers. Such innovation helps us attract and retain the best talent
and drives our long-term success.
|
Key |
||
|
On track / achieved |
|
|
Off track / not achieved |
|
Our 2025 progress |
||||
Number of ESG-focused
scaleup companies
supported (cumulative
in numbers)
|
Value of in-kind support
for startups and scaleups
|
|||
15 |
€1.5m |
|||
2024: 13
|
2024: €1.3m
|
|||
2025 target: 14
|
2025 target: N/A |
|||
ESG innovation |

ASML Annual Report 2025
|
247 |
Our material impacts, risks and opportunities relating to innovation ecosystem |
Levers for action |
Our approach |
|
Impact on society and stakeholders through ASML’s innovation
ecosystem focused on ESG-related research, startups, scaleups,
platforms and collaboration (ESG innovation)
|
Key | |
|
Actual positive impact |

ASML Annual Report 2025
|
248 |
Our objective |
 |
|
We aim to drive ESG-focused innovation that supports
ideas and initiatives addressing key sustainability
challenges, creating positive impact for local
communities and society.
| |
Our scope | |
Strategic support platforms for startups and scaleups |
Make Next Platform |
|
HighTechXL | |
DeepTechXL | |
ASML Annual Report 2025
|
249 |
Targets and performance |

€0 |
€150 |
€300 |
€450 |
€600 |
€750 |
€900 |
||
2024 |
||||||||
2025 |
||||||||
2025 target: N/A |
||||||||

0 |
4 |
8 |
12 |
16 |
20 |
||
2024 |
|||||||
2025 |
|||||||
|
Achieved |
2025 target: 14
|
|||||

Our actions and resources | |

ASML Annual Report 2025
|
250 |
ASML Young Makers Award |

AYMA 2025 Winners |
||||
 |
||||
•Proconceptious (University of
Groningen) – Offers personalized
contraception and preconception
care to support healthier, future-
proof generations.
•Heatlift Dynamics (TU Delft) –
Develops solid-state heat pumps
for precise, scalable thermal control
in advanced electronics.
|
•Piano Lites (University of Twente)
– Creates an LED-guided piano
system that makes learning intuitive,
fun, and accessible.
•Motex (TU Eindhoven) – Designs
an AI-powered smart helmet that
provides real-time alerts to enhance
motorcycle safety.
|
|||
Looking ahead | |

ASML Annual Report 2025
|
251 |
...for the planet |
|
Our activities have an impact that goes far beyond ASML, influencing the
communities in which we operate. Many of our locations, particularly our
headquarters, have experienced substantial growth in recent years – a trend
expected to continue.
While this growth can generate jobs, foster innovation and increase prosperity,
it also presents challenges, including added pressure on housing,
infrastructure and essential public services in the surrounding areas.
|

...for ASML |
When our communities thrive, so do we. We believe being a valued partner
to those around us is critical to our ability to scale effectively for our customers
and suppliers, and to deliver sustainable growth for our stakeholders. Many
ASML employees live in the communities where we operate, and want to be
proud of their company’s positive impact on their surroundings.
We know our activities and growth can affect these communities, so we
strive to build partnerships that benefit both sides today – and we work
together to support new development in the future.
|
Key |
||
|
On track / achieved |
|
|
Off track / not achieved |
|
Our 2025 progress |
||||
Amount invested in
communities (per
employee), including
employee giving
|
Total cost of volunteering |
|||
€1,750 |
€5.6m |
|||
2024: €1,084
|
2024: €3.1m
|
|||
2025 target: €2,500
|
2025 target: N/A
|
|||
Attractive
communities
|
Inclusive
communities
|
Investing in
STEM education
|
Employee giving |

ASML Annual Report 2025
|
252 |
Key |
||||
|
Actual positive impact |
|
Risk |
|
|
Potential positive impact |
|
Opportunity |
|
|
Actual negative impact |
|||
|
Potential negative impact |
|||
Communities |
Own operations |
|
Impact on local communities around ASML’s offices and factories through pressure on regional mobility, and impact on local communities around our
Veldhoven operations through nuisance, pressure on affordable housing and interaction between cultures (Attractive communities)
|
|
Impact on local communities around our Veldhoven operations through pressure on the talent pipeline and education system (Inclusive communities) |
|
Risk of an unattractive community for future employees to live in (limited housing, social cohesion issues), impacting ASML’s ability to attract talent
(Attractive communities, Inclusive communities)
|
|
Adverse reactions from neighbors, local communities and municipalities due to the pressure from ASML on infrastructure, availability of talent, schools,
housing and social cohesion, which can impact the license to effectively manage our business (Attractive communities, Inclusive communities)
|
ASML Annual Report 2025
|
253 |
Our approach |
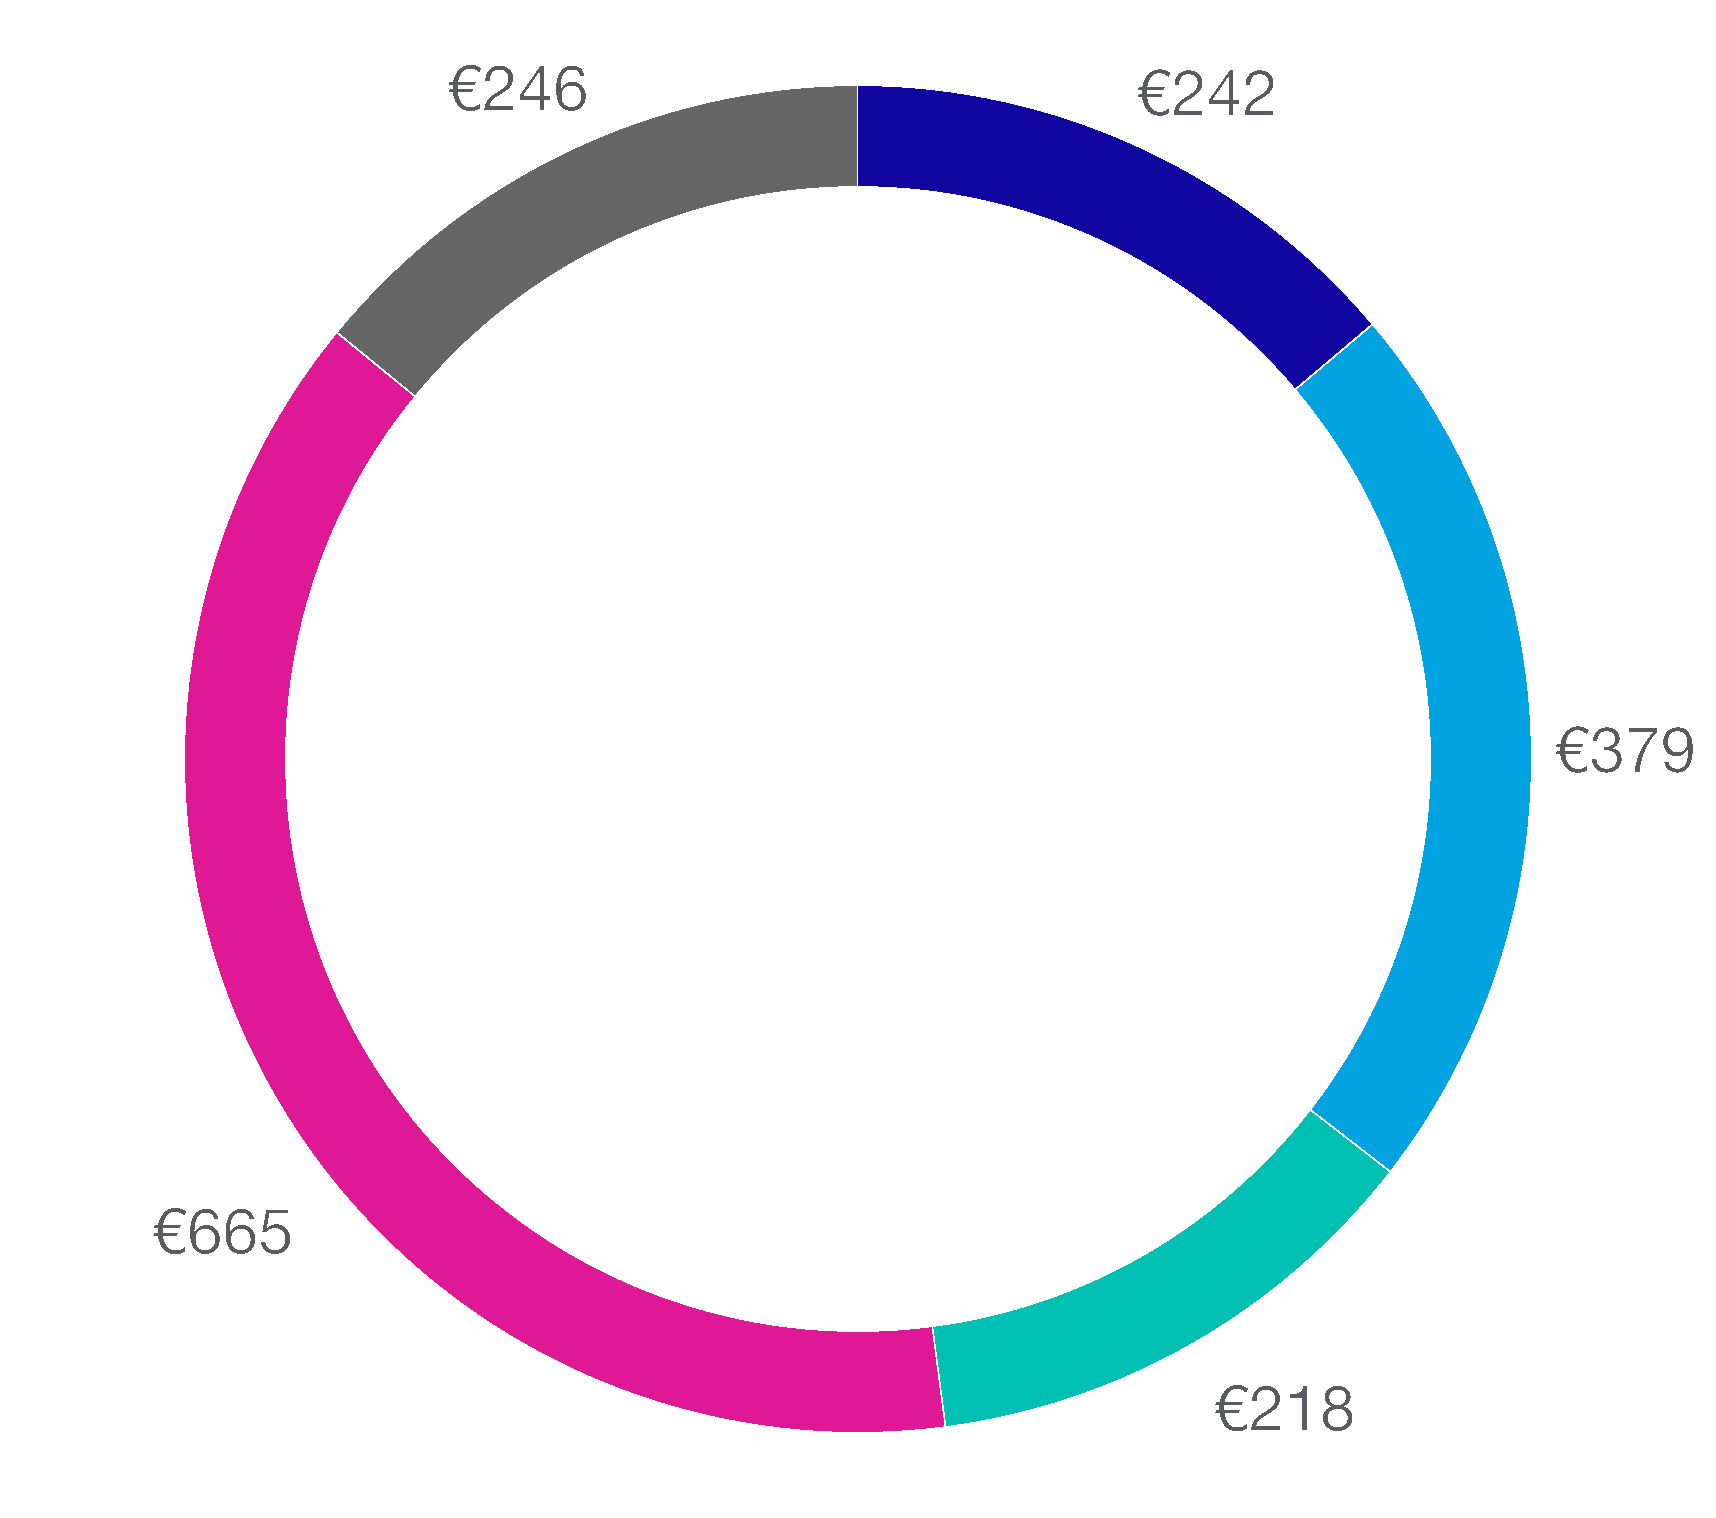
Targets and performance |
€0 |
€500 |
€1,000 |
€1,500 |
€2,000 |
€2,500 |
|
2024 |
||||||
2025 |
||||||
Not achieved |
2025 target: €2,500 €/employee
|
||

Amount invested (€/employee) |
2024 |
2025 |
||
< |
To creating attractive communities |
€257 |
€242 |
|
< |
To creating inclusive communities |
€189 |
€379 |
|
< |
To promoting STEM education |
€177 |
€218 |
|
< |
To realize ESG innovation1
|
€299 |
€665 |
|
< |
To Employee giving program |
€162 |
€246 |
|

ASML Annual Report 2025
|
254 |
Levers for action |

ASML Annual Report 2025
|
255 |
Process for engaging | |
Process for remediation | |
Employee Giving: Supporting causes close to the hearts of our employees |

Even small acts can
make a big difference.
That’s why thousands
of ASML employees
volunteer their time
each year – making a
positive contribution
to their communities.
|
Matching-gifts program | |
 |
 |
Over 2,600
non-profit
organizations
supported
|
€5.1 million total
contributed to
donations
in 2025
|
ASML Annual Report 2025
|
256 |
Our objective |
 |
|
We aim to enhance the overall quality of life
in the communities in which we operate.
We strive to help create vibrant, resilient
communities where people want to live,
work, and thrive.
| |
Our scope | |
Targets and performance |
€0 |
€50 |
€100 |
€150 |
€200 |
€250 |
€300 |
||
2024 |
||||||||
2025 |
||||||||
2025 target: N/A |
||||||||

Our actions and resources | |
ASML Annual Report 2025
|
257 |
Looking ahead | |

ASML Annual Report 2025
|
258 |
Our objective |
 |
|
We aim to foster communities that offer
equal opportunities for all. We strive to help
remove barriers and create environments
where everyone can participate fully.
| |
€0 |
€75 |
€150 |
€225 |
€300 |
€375 |
€450 |
||
2024 |
||||||||
2025 |
||||||||
2025 target: N/A |
||||||||
Our scope | |
Targets and performance |

Our actions and resources | |
ASML Annual Report 2025
|
259 |

Looking ahead | |
ASML Annual Report 2025
|
260 |
Our objective |
 |
|
We aim to boost STEM education for
children by supporting initiatives that build
skills for their future and help expand the
STEM talent pool needed by society.
| |
Our scope | |
Targets and performance |
0 |
50 |
100 |
150 |
200 |
250 |
300 |
||
2024 |
||||||||
2025 |
||||||||
2025 target: N/A |
||||||||

Our actions and resources | |
Looking ahead | |

ASML Annual Report 2025
|
261 |
ESG integrated governance |
||||||
We aim to integrate sustainability in our
day-to-day operations, to help us deliver
on our ESG sustainability mission
and responsibilities.
We aim to make ESG part of all regular,
day-to-day decision-making.
|
 |
|||||
We’ll do this by focusing on:
•Purpose, vision, mission and values
•Strategy and business priorities
•Organization, processes and governance
•ESG risk management
•Responsible business conduct and
compliance (covered in this section)
|
||||||
Our ambition |
||
We aim to act on our
responsibilities and
anchor them across
our entire business
through integrated
governance, engaged
stakeholders and
transparent reporting.
|
||
On the following pages, we set out
our approach and progress to date.
|
||
Transparent reporting |
||
We aim to be open and transparent,
driving progress while building trust with
our stakeholders through our commitment
to integrated reporting. We believe that
our ESG-related information is as
important as our financial information.
|
||
We aim for ‘best-in-class’ reporting,
according to our stakeholders.
We’ll do this by focusing on:
•Internal reporting and communications
•External reporting and communications
Read more on our policies and additional
disclosures at asml.com, such as our:
•Tax report
•Government & External Affairs report
•Group Diversity and Inclusion Policy
•Stakeholder Engagement Policy
•Speak Up & Non-retaliation Policy
|
||
 |
||

Engaged stakeholders |
||||||
 |
We depend on building strong, sustainable
relationships with all of our stakeholders
across the value chain.
We aim to be viewed as a top
performer on ESG sustainability by
our stakeholders.
|
We’ll do this by engaging with the
following stakeholder groups:
|
||||
•Customers
•Employees
•Suppliers
•Shareholders
•Society
|
||||||

ASML Annual Report 2025
|
262 |

...for the planet |
|
Sustainability matters to stakeholders up and down our value chain.
Together we are building a shared understanding of the importance of
ESG-driven thinking. Integrity, honesty and transparency about the economic,
environmental and social impact of our activities guide our entire ESG
approach, influencing the decisions we make and the performance
information we share.
To create long-term value for our stakeholders, we need to build strong
relationships with them and support those that are more vulnerable. We
must also ensure compliance with data privacy regulations and encourage
greater political engagement on ESG topics.
|
...for ASML |
We aim to act on our responsibilities and anchor ESG sustainability across
our entire business. We believe robust integrated governance policies, and
an ongoing commitment to responsible business conduct and risk
management, are essential.
Ethics and compliance are the foundations of our sustainability strategy.
We aim to create a fair, transparent and inclusive culture – where everyone
feels empowered to speak up about the changes needed to make our
sustainability transition a success.
Our approach keeps customers, suppliers and shareholders well informed,
enabling them to make their own business decisions with confidence. Having
their trust and collaboration is important in shaping our wider ESG strategy.
|
Key |
||
|
On track / achieved |
|
|
Off track / not achieved |
|
Our 2025 progress |
||||
Number of convictions for
violation of anti-corruption
and anti-bribery laws
|
Employees completing
the Code of Conduct
training course
|
|||
0 |
94% |
|||
2024: 0
|
2024: 97%
|
|||
2025 target: N/A
|
2025 target: N/A
|
|||
Employees understanding
the main principles of our
Code of Conduct and how
to follow them
|
Number of severe human
rights incidents
|
|||
96% |
0 |
|||
2024: — |
2024: 0
|
|||
2025 target: N/A
|
2025 target: N/A
|
|||
Responsible business
conduct and compliance
|
||||||
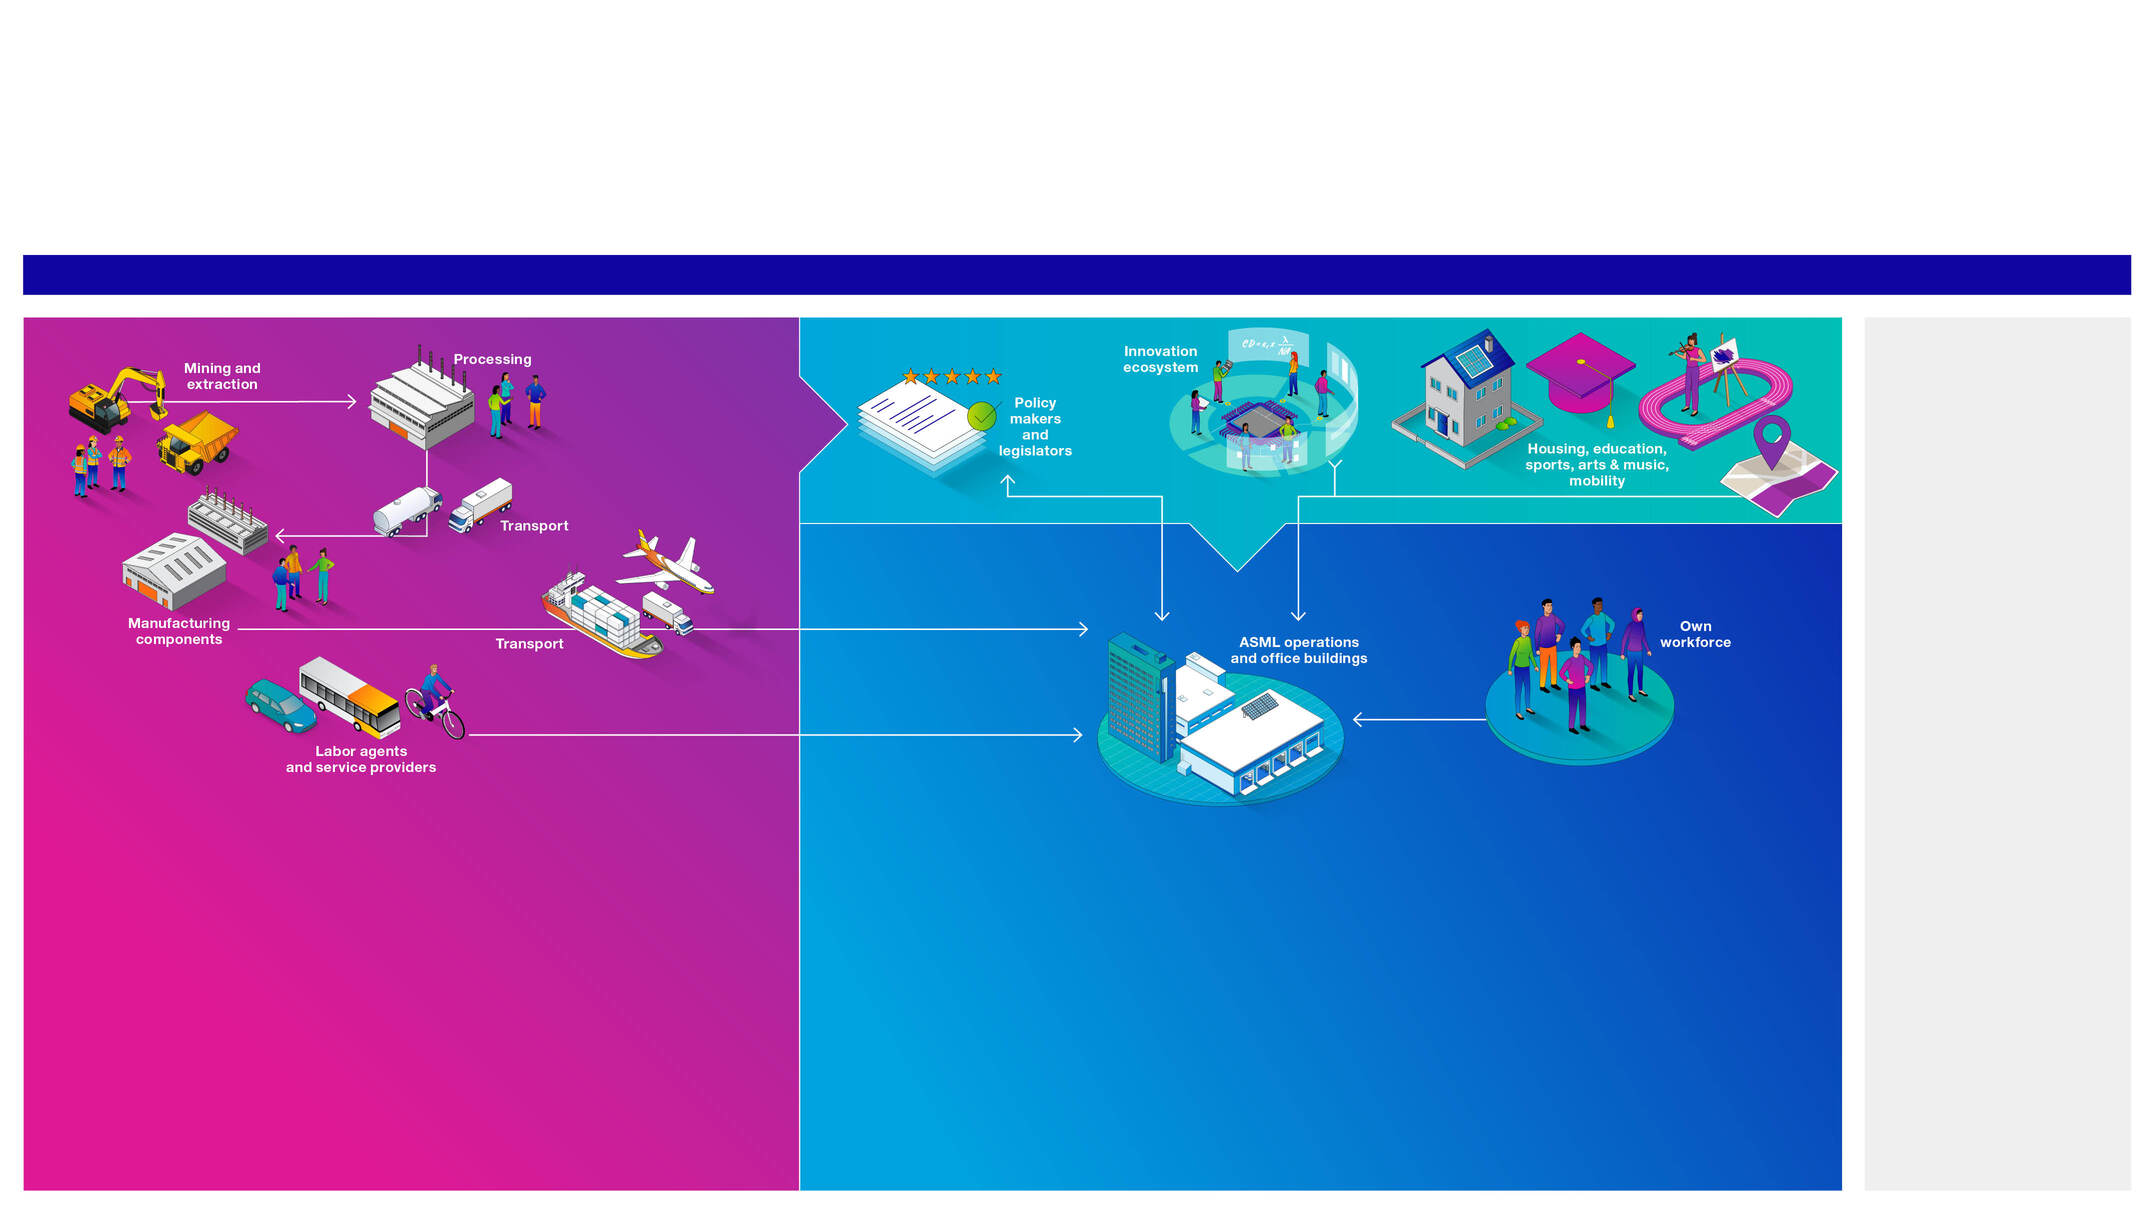
ASML Annual Report 2025
|
263 |
Key |
||||
|
Actual positive impact |
|
Risk |
|
|
Potential positive impact |
|
Opportunity |
|
|
Actual negative impact |
|||
|
Potential negative impact |
|||
Upstream |
Community |
|
Own
operations
|
Whole value chain |
||
|
Failure to comply with
data privacy regulations
or breaches of data
privacy (Responsible
business conduct and
compliance)
|
|
|
Failure to engage
customers and suppliers
on environmental and
social topics (ESG risk
management)
|
|
|
Impact on people and environment across the supply chain through the fair
management of relationships with suppliers (Responsible business conduct
and compliance)
|
|
Failure to comply with laws and regulations for supply chain due diligence
(Responsible business conduct and compliance)
|
|
|
Potential impact on stakeholders and associated risk in case ASML workers fail to comply with ASML’s
code of conduct, policies and values, as well as with regulations due to increasing complexity as we
expand into more countries (Responsible business conduct and compliance)
|
ASML Annual Report 2025
|
264 |
Our approach | |
Engaged stakeholders |
||
ASML’s ambition is to be seen
as a top performer in ESG
sustainability by its stakeholders.
Stakeholder engagement plays an
integral role in identifying our material
topics. Target development for the
ESG sustainability strategy is done in
close collaboration between our ESG
sustainability team and other parts of the
organization. Inputs from relevant internal
and external stakeholders are taken into
consideration throughout this process.
Our stakeholder engagement policy is
part of our overall ESG sustainability
policy and outlines how we connect with
five key groups – customers, employees,
shareholders, suppliers and society –
through listening, raising awareness and
aligning on shared goals. This engagement
is essential for identifying material
ESG topics and shaping our
sustainability strategy.
Read more about our policies and additional
disclosures, including our Tax report, Disclosure
Policy Bilateral Contacts with Shareholders,
Stakeholder Engagement Policy and our public
Competition Law Compliance Policy at asml.com
|
||
ASML Annual Report 2025
|
265 |
Levers for action |
ASML Annual Report 2025
|
266 |
Our objective |
 |
|
We aim to uphold ethical business practices
by embedding fairness, integrity, and
compliance in our operations. We maintain
zero tolerance for bribery and corruption.
| |
Our scope | |
Targets and performance | |
Speak Up reports received in 2025 |
< |
Out of Ethics scope |
24% |
< |
Inappropriate communication |
14% |
< |
Fraud and operational integrity |
9% |
< |
HR-related concerns |
8% |
< |
Harassment |
6% |
< |
Power and influence abuse |
6% |
< |
Other |
6% |
< |
Conflict of interests |
5% |
< |
Discrimination and inclusion |
5% |
< |
Asset protection |
5% |
< |
Health, safety and physical violence |
4% |
< |
Gifts and entertainment |
4% |
< |
Bullying |
4% |
ASML Annual Report 2025
|
267 |
Our actions and resources | |
Looking ahead | |
ASML Annual Report 2025
|
268 |
Topic |
Description |
2024 |
2025 |
||
Governance |
Number of convictions for violation of anti-corruption and anti-bribery laws |
0 |
0 |
||
Monetary value of fines for violation of anti-corruption and anti-bribery laws (€) |
0 |
0 |
|||
Number of complaints filed through channels for own workforce |
93 |
77 |
|||
Number of incidents of discrimination including harassment |
60 |
37 |
|||
Monetary value of fines, penalties and compensation for damages as a result of complaints or incidents of discrimination including harassment (€) |
0 |
0 |
|||
Number of severe human rights incidents |
0 |
0 |
|||
Monetary value of fines, penalties and compensations for damages as a result of severe human rights incidents (€) |
0 |
0 |
Methodology on metrics | |

ASML Annual Report 2025
|
269 |
Related ESRS disclosure requirements |
Reference |
Explanation |
ESRS 2 – General disclosures |
||
BP-1 – General basis for preparation of Sustainability statements |
•Sustainability statements – General disclosures – Basis for preparation
|
|
BP-2 – Disclosures in relation to specific circumstances |
•Sustainability statements – General disclosures – Basis for preparation
|
|
GOV-1 – The role of the administrative, management and supervisory bodies |
•Sustainability statements – General disclosures – ESG sustainability governance
•Corporate governance – Corporate governance – Supervisory Board
•Corporate governance – Corporate governance – Board of Management
•Corporate governance – Corporate governance – Other Board-related matters
|
Includes DR21d Board’s gender diversity ratio and DR21e Percentage of independent board
members
|
GOV-2 – Information provided to and sustainability matters addressed by the
undertaking’s administrative, management and supervisory bodies
|
•Sustainability statements – General disclosures – ESG sustainability governance
•Sustainability statements – General disclosures – Impact, risk and opportunity management
|
|
GOV-3 – Integration of sustainability-related performance in incentive schemes |
•Sustainability statements – General disclosures – ESG sustainability governance
•Corporate governance – Remuneration report – Board of Management remuneration
|
|
GOV-4 – Statement on due diligence |
•Sustainability statements – General disclosures – Environmental and human rights due diligence
|
Includes DR30 Statement on due diligence |
GOV-5 – Risk management and internal controls over sustainability reporting |
•Sustainability statements – General disclosures – ESG sustainability governance
|
|
SBM-1 – Strategy, business model and value chain |
•Strategic report – Our business
•Sustainability statements – General disclosures – ESG sustainability at a glance
•Sustainability statements – General disclosures – Value chain and ecosystem overview
•Sustainability statements – Social – Attractive workplace for all
•Sustainability statements – Social – Responsible value chain
|
DR40di Undertaking is active in fossil fuel (coal, oil and gas) sector, DR40dii Undertaking is
active in chemicals production, DR40diii Undertaking is active in controversial weapons and
DR40div Undertaking is active in cultivation and production of tobacco not applicable
|
SBM-2 – Interests and views of stakeholders |
•Strategic report – Our business – Engaged stakeholders
•Sustainability statements – General disclosures – Basis for preparation
|
|
SBM-3 – Material impacts, risks and opportunities, and their interaction with
strategy and business model
|
•Sustainability statements – General disclosures – Basis for preparation
•Sustainability statements – General disclosures – Impact, risk and opportunity management
|
Phase-in provision applied for DR48e and AR18 (anticipated financial effects) |
IRO-1 – Description of the process to identify and assess material impacts, risks
and opportunities
|
•Sustainability statements – General disclosures – Impact, risk and opportunity management
|
|
IRO-2 – Disclosure requirements in ESRS covered by the undertaking’s
sustainability statement
|
•Sustainability statements – General disclosures – Impact, risk and opportunity management
|
|
MDR-P – Policies adopted to manage material sustainability matters |
•Minimum disclosure requirements on policies are included in the ‘how we are managing’ sections of the topics
|
|
MDR-A – Actions and resources in relation to material sustainability matters |
•Minimum disclosure requirements on actions and resources are included in the ‘our actions and resources’
sections of the topics
|
|
MDR-M – Metrics in relation to material sustainability matters |
•Minimum disclosure requirements on metrics are included in the ‘targets and performance’ and ‘metrics table’
sections of the topics
|
|
MDR-T – Tracking effectiveness of policies and actions through targets |
•Minimum disclosure requirements on targets are included in the ‘targets and performance’ sections of
the topics
|
|
ESRS E1 Climate change |
||
GOV-3 – Integration of sustainability-related performance in incentive schemes |
•Corporate governance – Remuneration report – Board of Management remuneration
•Sustainability statements – Environmental – Energy efficiency and climate action – Targets and performance
|
|
E1-1 – Transition plan for climate change mitigation |
•Strategic report – Risk and security – Risk factors – Operations
•Sustainability statements – Environmental – Energy efficiency and climate action – How we are managing
energy efficiency and climate action: Climate Transition Plan
|
ASML Annual Report 2025
|
270 |
Related ESRS disclosure requirements |
Reference |
Explanation |
SBM-3 – Material impacts, risks and opportunities and their interaction with strategy
and business model
|
•Sustainability statements – Environmental – Energy efficiency and climate action – Climate resilience analysis
|
|
IRO-1 – Description of the processes to identify and assess material climate-related
impacts, risks and opportunities
|
•Sustainability statements – General disclosures – Impact, risk and opportunity management
•Sustainability statements – Environmental – Energy efficiency and climate action – Climate resilience analysis
|
|
E1-2 – Policies related to climate change mitigation and adaptation |
•Sustainability statements – Environmental – Energy efficiency and climate action – How we are managing
energy efficiency and climate action: Climate Transition Plan
•Strategic report – Risk and security – Risk factors – Operations
|
|
E1-3 – Actions and resources in relation to climate change policies |
•Sustainability statements – Environmental – Energy efficiency and climate action – Our actions and resources
|
|
E1-4 – Targets related to climate change mitigation and adaptation |
•Sustainability statements – Environmental – Energy efficiency and climate action – Climate resilience analysis
•Sustainability statements – Environmental – Energy efficiency and climate action – Targets and performance
|
Includes DR34 GHG emissions reduction targets |
E1-5 – Energy consumption and mix |
•Sustainability statements – Environmental – Energy efficiency and climate action – Metrics table and
Additional disclosures
|
Includes DR37, DR38, DR40, DR41, DR42, DR43 Energy consumption |
E1-6 – Gross scope 1, 2, 3 and Total GHG emissions |
•Sustainability statements – Environmental – Energy efficiency and climate action – Metrics table and
Additional disclosures
|
Includes DR44 Gross scope 1, 2, 3 and Total GHG emissions and DR 53–55 GHG emissions
intensity
|
E1-7 – GHG removals and GHG mitigation projects financed through carbon credits |
•Sustainability statements – Environmental – Energy efficiency and climate action – How we are managing
energy efficiency and climate action: Climate Transition Plan
•Sustainability statements – Environmental – Energy efficiency and climate action – Metrics table and
Additional disclosures
|
|
E1-8 – Internal carbon pricing |
•Sustainability statements – Environmental – Energy efficiency and climate action – How we are managing
energy efficiency and climate action: Climate Transition Plan
|
|
E1-9 – Anticipated financial effects from material physical and transition risks and
potential climate-related opportunities
|
Not included |
Phase-in provision applied |
ESRS E2 Pollution |
Not a material topic based on the outcome of our DMA |
|
ESRS E3 Water and marine resources |
Not a material topic based on the outcome of our DMA |
|
ESRS E4 Biodiversity and ecosystems |
Not a material topic based on the outcome of our DMA |
|
ESRS E5 Resource use and circular economy |
||
IRO-1 – Description of the processes to identify and assess material resource use
and circular economy-related impacts, risks and opportunities
|
•Sustainability statements – General disclosures – Impact, risk and opportunity management
|
|
E5-1 – Policies related to resource use and circular economy |
•Sustainability statements – Environmental – Circular economy – How we are managing circular economy
|
|
E5-2 – Actions and resources related to resource use and circular economy |
•Sustainability statements – Environmental – Circular economy – Our actions and resources
|
|
E5-3 – Targets related to resource use and circular economy |
•Sustainability statements – Environmental – Circular economy – Targets and performance
|
|
E5-4 – Resource inflows |
•Sustainability statements – Environmental – Circular economy – Metrics table and Additional disclosures
|
|
E5-5 – Resource outflows |
•Sustainability statements – Environmental – Circular economy – Metrics table and Additional disclosures
|
Includes DR37d Non-recycled waste and DR39 Hazardous waste and radioactive waste |
E5-6 – Anticipated financial effects from resource use and circular economy-related
impacts, risks and opportunities
|
Not included |
Phase-in provision applied |
ESRS S1 Own workforce |
||
SBM-2 – Interests and views of stakeholders |
•Sustainability statements – General disclosures – Impact, risk and opportunity management
|
|
SBM-3 – Material impacts, risks and opportunities and their interaction with strategy
and business model
|
•Sustainability statements – General disclosures – Impact, risk and opportunity management
|
Includes DR14f Risk of incidents of forced labor and DR14g Risk of incidents of child labor |
ASML Annual Report 2025
|
271 |
Related ESRS disclosure requirements |
Reference |
Explanation |
S1-1 – Policies related to own workforce |
•Sustainability statements – General disclosures – Environmental and human rights due diligence
•Sustainability statements – General disclosures – ESG sustainability governance
•Sustainability statements – Social – Attractive Workplace for all – How we are managing attractive workplace
for all
•Strategic report – Our business – Create an exceptional workplace
|
Includes DR20 Human rights policy commitments; DR21 Due diligence policies on issues
addressed by the fundamental International Labor Organization (ILO) Conventions 1 to 8;
DR22 Processes and measures for preventing trafficking in human beings and DR23
Workplace accident prevention policy or management system
|
S1-2 – Processes for engaging with own workforce and workers’ representatives
about impacts
|
•Sustainability statements – Social – Attractive Workplace for all – How we are managing attractive workplace
for all
•Strategic report – Our business – Engaged stakeholders – Employees
|
|
S1-3 – Processes to remediate negative impacts and channels for own workers to
workforce to raise concerns
|
•Sustainability statements – Social – Attractive Workplace for all – How we are managing attractive workplace
for all
|
Includes DR32c Grievance/complaints handling mechanisms |
S1-4 – Taking action on material impacts on own workforce, and approaches to
managing material risks and pursuing material opportunities related to own
workforce, and effectiveness of those actions
|
•Sustainability statements – Social – Attractive Workplace for all – How we are managing attractive workplace
for all
•Sustainability statements – Social – Attractive workplace for all – Our actions and resources
|
|
S1-5 – Targets related to managing material negative impacts, advancing positive
impacts, and managing material risks and opportunities
|
•Sustainability statements – Social – Attractive workplace for all – Targets and performance
|
|
S1-6 – Characteristics of the undertaking’s employees |
•Sustainability statements – Social – Attractive workplace for all – Metrics table and Additional disclosures
|
|
S1-7 – Characteristics of non-employees in the undertaking’s own workforce |
Not included |
‘Quick fix’ over phase-in provisions applied |
S1-8 – Collective bargaining coverage and social dialogue |
•Sustainability statements – Social – Attractive workplace for all – Metrics table and Additional disclosures
|
|
S1-9 – Diversity metrics |
•Sustainability statements – Social – Attractive workplace for all – Metrics table and Additional disclosures
|
|
S1-10 – Adequate wages |
•Sustainability statements – Social – Attractive workplace for all – Metrics table and Additional disclosures
|
|
S1-11 – Social protection |
Not included |
‘Quick fix’ over phase-in provisions applied |
S1-12 – Persons with disabilities |
Not included |
‘Quick fix’ over phase-in provisions applied |
S1-13 – Training and skills development metrics |
•Sustainability statements – Social – Attractive workplace for all – Metrics table and Additional disclosures
|
|
S1-14 – Health and safety metrics |
•Sustainability statements – Social – Attractive workplace for all – Metrics table and Additional disclosures
|
Includes DR88b DR88c Number of fatalities and number and rate of work-related accidents
–‘Quick fix’ over phase-in provisions applied for non-employees; DR88d Number of cases of
recordable work-related ill health; DR88e Number of days lost to injuries, accidents, fatalities
or illness.
|
S1-15 – Work-life balance metrics |
Not included |
‘Quick fix’ over phase-in provisions applied |
S1-16 – Remuneration metrics (pay gap and total remuneration) |
•Sustainability statements – Social – Attractive workplace for all – Metrics table and Additional disclosures
|
Includes DR97a Unadjusted gender pay gap and DR97b CEO pay ratio |
S1-17 – Incidents, complaints and severe human rights impacts |
•Sustainability statements – Governance – ESG integrated governance – Metrics table and Additional
disclosures
|
Includes DR103a Incidents of discrimination and DR104a Non-respect of UNGPs and
OECD Guidelines
|
ESRS S2 Workers in the value chain |
||
SBM-2 – Interests and views of stakeholders |
•Sustainability statements – General disclosures – Impact, risk and opportunity management
|
|
SBM-3 – Material impacts, risks and opportunities and their interaction with strategy
and business model
|
•Sustainability statements – General disclosures – Environmental and human rights due diligence
•Sustainability statements – General disclosures – Impact, risk and opportunity management
•Sustainability statements – General disclosures – Value chain and ecosystem overview
|
Includes DR11b Significant risk of child labor or forced labor in the value chain |
S2-1 – Policies related to value chain workers |
•Strategic report – Our business – Engaged stakeholders – Suppliers
•Sustainability statements – General disclosures – Environmental and human rights due diligence
•Sustainability statements – Social – Responsible value chain – How we are managing responsible value chain
|
Includes DR17 Human rights policy commitments; DR18 Policies related to value chain
workers; DR19 Non-respect of UNGPs and OECD Guidelines and Due diligence policies on
issues addressed by the fundamental ILO conventions 1 to 8
|
S2-2 – Processes for engaging with value chain workers about impacts |
•Strategic report – Our business – Engaged stakeholders – Suppliers
•Sustainability statements – General disclosures – Environmental and human rights due diligence
•Sustainability statements – Social – Responsible value chain – How we are managing responsible value chain
|
ASML Annual Report 2025
|
272 |
Related ESRS disclosure requirements |
Reference |
Explanation |
S2-3 – Processes to remediate negative impacts and channels for value chain
workers to raise concerns
|
•Sustainability statements – Social – Responsible value chain – How we are managing responsible value chain
•Sustainability statements – Governance – ESG integrated governance
|
|
S2-4 – Taking action on material impacts on value chain workers, and approaches
to managing material risks and pursuing material opportunities related to value chain
workers, and effectiveness of those actions
|
•Sustainability statements – Social – Responsible value chain – Our actions and resources
|
Includes DR36 Human rights issues and incidents connected to its upstream and
downstream value chain
|
S2-5 – Targets related to managing material negative impacts, advancing positive
impacts, and managing material risks and opportunities
|
•Sustainability statements – Social – Responsible value chain – Targets and performance
|
While we haven’t set measurable targets for this topic, our approach to tracking progress is
outlined in the referenced chapter.
|
ESRS S3 Affected communities |
||
SBM-2 – Interests and views of stakeholders |
•Sustainability statements – General disclosures – Impact, risk and opportunity management
|
|
SBM-3 – Material impacts, risks and opportunities and their interaction with strategy
and business model
|
•Sustainability statements – General disclosures – Impact, risk and opportunity management
|
|
S3-1 – Policies related to affected communities |
•Sustainability statements – Social – Valued partner in our communities – How we are managing valued partner
in our communities
|
Includes DR16 Human rights policy commitments; DR17 Non-respect of UNGPs, ILO
principles or OECD Guidelines
|
S3-2 – Processes for engaging with affected communities about impacts |
•Strategic report – Our business – Engaged stakeholders – Society
•Sustainability statements – Social – Valued partner in our communities – How we are managing valued partner
in our communities
|
|
S3-3 – Processes to remediate negative impacts and channels for affected
communities to raise concerns
|
•Sustainability statements – Social – Valued partner in our communities – How we are managing valued partner
in our communities
|
|
S3-4 – Taking action on material impacts on affected communities, and approaches
to managing material risks and pursuing material opportunities related to affected
communities, and effectiveness of those actions
|
•Sustainability statements – General disclosures – Environmental and human rights due diligence
•Sustainability statements – General disclosures – ESG sustainability governance
•Sustainability statements – Social – Valued partner in our communities – Our actions and resources
|
Includes DR36 Human rights issues and incidents |
S3-5 – Targets related to managing material negative impacts, advancing positive
impacts, and managing material risks and opportunities
|
•Sustainability statements – Social – Valued partner in our communities – Targets and performance
|
|
ESRS S4 Consumers and end-users |
Not a material topic based on the outcome of our DMA |
|
ESRS G1 Business conduct |
||
GOV-1 – The role of the administrative, supervisory and management bodies |
•Sustainability statements – General disclosures – ESG sustainability governance
•Corporate governance – Corporate governance – Supervisory Board
•Corporate governance – Corporate governance – Board of Management
•Sustainability statements – Governance – ESG integrated governance – How we are managing ESG integrated
governance
|
|
IRO-1 – Description of the processes to identify and assess material impacts, risks
and opportunities
|
•Sustainability statements – General disclosures – Impact, risk and opportunity management
|
|
G1-1 – Business conduct policies and corporate culture |
•Sustainability statements – Governance – ESG integrated governance
|
Includes DR10b United Nations Convention against Corruption; DR10d Protection of whistle-
blowers
|
G1-2 – Management of relationships with suppliers |
•Sustainability statements – Governance – ESG integrated governance
|
|
G1-3 – Prevention and detection of corruption and bribery |
•Sustainability statements – Governance – ESG integrated governance
|
|
G1-4 – Incidents of corruption or bribery |
•Sustainability statements – Governance – ESG integrated governance
|
Includes DR24a Fines for violation of anti-corruption and anti-bribery laws; DR24b Standards
of anti-corruption and anti-bribery
|
G1-5 – Political influence and lobbying activities |
Not a material sub-topic based on the outcome of our DMA |
|
G1-6 – Payment practices |
Not a material sub-topic based on the outcome of our DMA |

ASML Annual Report 2025
|
273 |
Consolidated financial statements |
||
Reports of independent registered public accounting firms |
||
Consolidated statements of operations |
||
Consolidated statements of comprehensive income |
||
Consolidated balance sheets |
||
Consolidated statements of shareholders’ equity |
||
Consolidated statements of cash flows |
||
Notes to the Consolidated financial statements |
ASML Annual Report 2025
|
274 |
ASML Annual Report 2025
|
275 |
ASML Annual Report 2025
|
276 |
ASML Annual Report 2025
|
277 |
Year ended December 31 (€, in millions, except per share data) |
Notes |
2023 |
2024 |
2025 |
|
Net system sales |
|||||
Net service and field option sales |
|||||
Total net sales |
2, 3 |
||||
Cost of system sales |
( |
( |
( |
||
Cost of service and field option sales |
( |
( |
( |
||
Total cost of sales1
|
( |
( |
( |
||
Gross profit |
|||||
Research and development (R&D) costs |
( |
( |
( |
||
Selling, general and administrative (SG&A) costs |
( |
( |
( |
||
Income from operations |
|||||
Interest and other, net |
16 |
||||
Income before income taxes |
|||||
Income tax expense |
21 |
( |
( |
( |
|
Income after income taxes |
|||||
Profit from equity method investments |
10 |
||||
Net income |
|||||
Basic net income per ordinary share |
23 |
||||
Diluted net income per ordinary share |
23 |
||||
Number of ordinary shares used in computing per share amounts: |
|||||
Basic |
23 |
||||
Diluted |
23 |
ASML Annual Report 2025
|
278 |
Year ended December 31 (€, in millions) |
Notes |
2023 |
2024 |
2025 |
|
Net income |
|||||
Other comprehensive income: |
|||||
Proportionate share of OCI from equity method investments |
( |
||||
Foreign currency translation, net of taxes: |
|||||
Gain (loss) on foreign currency translation |
( |
( |
|||
Financial instruments, net of taxes: |
|||||
Gain (loss) on derivative financial instruments |
( |
( |
|||
Transfers to net income from derivative financial instruments |
25 |
( |
|||
Other comprehensive income, net of taxes |
( |
( |
|||
Total comprehensive income, net of taxes |
|||||
Attributable to equity holders |
ASML Annual Report 2025
|
279 |
As of December 31 (€, in millions, except share and per share data) |
Notes |
2024 |
2025 |
|
Assets |
||||
Cash and cash equivalents |
4 |
|||
Short-term investments |
4 |
|||
Accounts receivable, net1
|
5 |
|||
Finance receivables, net |
6 |
|||
Current tax assets |
21 |
|||
Contract assets |
2 |
|||
Inventories, net |
7 |
|||
Loans receivable2
|
26 |
|||
Other assets4
|
8 |
|||
Total current assets |
||||
Finance receivables, net |
6 |
|||
Deferred tax assets |
21 |
|||
Loans receivable3
|
26 |
|||
Other assets5
|
8 |
|||
Equity investments |
9 |
|||
Equity method investments |
10 |
|||
Goodwill |
11 |
|||
Other intangible assets, net |
12 |
|||
Property, plant and equipment, net |
13 |
|||
Right-of-use assets |
14 |
|||
Total non-current assets |
||||
Total assets |
As of December 31 (€, in millions, except share and per share data) |
Notes |
2024 |
2025 |
|
Liabilities and shareholders’ equity |
||||
Accounts payable6
|
||||
Accrued and other liabilities7
|
15 |
|||
Current tax liabilities |
21 |
|||
Short-term borrowings and current portion of long-term debt |
16 |
|||
Contract liabilities |
2 |
|||
Total current liabilities |
||||
Long-term debt |
16 |
|||
Deferred and other income tax liabilities |
21 |
|||
Contract liabilities |
2 |
|||
Accrued and other liabilities |
15 |
|||
Total non-current liabilities |
||||
Total liabilities8
|
||||
Ordinary shares; € |
||||
Issued and outstanding shares |
||||
Share premium |
||||
Treasury shares at cost |
( |
( |
||
Retained earnings |
||||
Accumulated other comprehensive income |
||||
Total shareholders’ equity |
22 |
|||
Total liabilities and shareholders’ equity |
ASML Annual Report 2025
|
280 |
Notes |
Issued and outstanding shares |
Share premium |
Treasury shares
at cost
|
Retained
earnings
|
OCI1
|
Total |
|||
(€, in millions) |
Number |
Amount |
|||||||
Balance at January 1, 2023 |
( |
||||||||
Components of comprehensive income: |
|||||||||
Net income |
— |
— |
— |
— |
— |
||||
Proportionate share of OCI from equity method investments |
— |
— |
— |
— |
— |
||||
Gain (loss) on foreign currency translation |
— |
— |
— |
— |
— |
( |
( |
||
Gain (loss) on financial instruments |
— |
— |
— |
— |
— |
( |
( |
||
Total comprehensive income |
— |
— |
— |
— |
( |
||||
Purchase of treasury shares |
22 |
( |
— |
— |
( |
— |
— |
( |
|
Cancellation of treasury shares |
22 |
— |
( |
— |
( |
— |
|||
Share-based payments |
20 |
— |
— |
— |
— |
— |
|||
Issuance of shares |
20 |
— |
( |
( |
— |
||||
Dividend paid |
22 |
— |
— |
— |
— |
( |
— |
( |
|
Balance at December 31, 2023 |
( |
||||||||
Components of comprehensive income: |
|||||||||
Net income |
— |
— |
— |
— |
— |
||||
Proportionate share of OCI from equity method investments |
— |
— |
— |
— |
— |
( |
( |
||
Gain (loss) on foreign currency translation |
— |
— |
— |
— |
— |
||||
Gain (loss) on financial instruments |
— |
— |
— |
— |
— |
||||
Total comprehensive income |
— |
— |
— |
— |
|||||
Purchase of treasury shares |
22 |
( |
( |
— |
( |
— |
— |
( |
|
Cancellation of treasury shares |
22 |
— |
( |
— |
( |
— |
|||
Share-based payments |
20 |
— |
— |
— |
— |
— |
|||
Issuance of shares |
20 |
— |
( |
( |
— |
||||
Dividend paid |
22 |
— |
— |
— |
— |
( |
— |
( |
|
Balance at December 31, 2024 |
( |
||||||||
ASML Annual Report 2025
|
281 |
Notes |
Issued and outstanding shares |
Share premium |
Treasury shares
at cost
|
Retained
earnings
|
OCI1
|
Total |
|||
(€, in millions) |
Number |
Amount |
|||||||
Balance at December 31, 2024 |
( |
||||||||
Components of comprehensive income: |
|||||||||
Net income |
— |
— |
— |
— |
— |
||||
Proportionate share of OCI from equity method investments |
— |
— |
— |
— |
— |
||||
Gain (loss) on foreign currency translation |
— |
— |
— |
— |
— |
( |
( |
||
Gain (loss) on financial instruments |
— |
— |
— |
— |
— |
( |
( |
||
Total comprehensive income |
— |
— |
— |
— |
( |
||||
Purchase of treasury shares |
22 |
( |
— |
— |
( |
— |
— |
( |
|
Cancellation of treasury shares |
22 |
— |
( |
— |
( |
— |
|||
Share-based payments |
20 |
— |
— |
— |
— |
— |
|||
Issuance of shares |
20 |
— |
( |
( |
— |
||||
Dividend paid |
22 |
— |
— |
— |
— |
( |
— |
( |
|
Balance at December 31, 2025 |
( |
||||||||
ASML Annual Report 2025
|
282 |
Year ended December 31 (€, in millions) |
Notes |
2023 |
2024 |
2025 |
|
Cash flows from operating activities |
|||||
Net income |
|||||
Adjustments to reconcile net income to net cash flows from
operating activities:
|
|||||
Depreciation and amortization1
|
12, 13 |
||||
Impairment and loss on disposal |
12, 13 |
||||
Share-based compensation expense |
18, 20 |
||||
Inventory reserves |
7 |
||||
Deferred tax expense (benefit) |
21 |
( |
( |
||
Equity method investments2
|
10, 26 |
||||
Changes in assets and liabilities: |
|||||
Accounts receivable, net |
5 |
( |
|||
Finance receivables, net |
6 |
( |
( |
||
Inventories |
7 |
( |
( |
( |
|
Other assets |
8 |
( |
( |
( |
|
Accrued and other liabilities |
15 |
( |
|||
Accounts payable |
( |
||||
Current tax assets and liabilities |
21 |
( |
|||
Contract assets and liabilities |
2 |
( |
|||
Net cash provided by operating activities |
|||||
Cash flows from investing activities |
|||||
Purchase of property, plant and equipment3
|
13 |
( |
( |
( |
|
Purchase of intangible assets |
12 |
( |
( |
( |
|
Purchase of short-term investments |
4 |
( |
( |
( |
|
Maturity of short-term investments |
4 |
||||
Purchase of equity investments |
9 |
( |
|||
Loans issued and other investments4
|
26 |
( |
( |
( |
|
Repayment on loans5
|
26 |
||||
Acquisition of subsidiaries (net of cash acquired) |
( |
||||
Net cash used in investing activities |
( |
( |
( |
Year ended December 31 (€, in millions) |
Notes |
2023 |
2024 |
2025 |
|
Cash flows from financing activities |
|||||
Dividend paid |
22 |
( |
( |
( |
|
Purchase of treasury shares |
22 |
( |
( |
( |
|
Net proceeds from issuance of shares |
20 |
||||
Net proceeds from issuance of borrowings |
16 |
||||
Repayment of debt and finance lease obligations |
14, 16 |
( |
( |
( |
|
Net cash used in financing activities |
( |
( |
( |
||
Net cash flows |
( |
||||
Effect of changes in exchange rates on cash |
( |
( |
|||
Net increase (decrease) in cash and cash equivalents |
( |
||||
Cash and cash equivalents at beginning of the year |
4 |
||||
Cash and cash equivalents at end of the year |
4 |
||||
Supplemental disclosures of cash flow information |
|||||
Change in unpaid portion of property, plant and equipment,
excluded in investing activities, included in accounts payable
|
|||||
Interest received |
|||||
Interest paid |
( |
( |
( |
||
Income taxes paid, net of refunds |
( |
( |
( |
ASML Annual Report 2025
|
283 |
ASML Annual Report 2025
|
284 |
ASML Annual Report 2025
|
285 |
Goods or services |
Nature, timing of satisfying the performance obligations and significant
payment terms
|
||
New systems |
New systems sales include i-line, KrF, ArF dry, ArF immersion, NXE and EXE-related
systems, along with the related factory options ordered with the base system, as well
as metrology and inspection systems.
|
||
Prior to shipment, the majority of our systems undergo a factory acceptance test (FAT)
in our cleanroom facilities, effectively replicating the operating conditions that will be
present on the customer’s site, in order to verify whether the integrated system meets
its standard specifications and any additional technical and performance criteria agreed
with the customer.
|
|||
A system undergoing FAT is shipped only after all contractual specifications are met or
discrepancies from agreed-upon specifications are waived and customer sign-off is
received for delivery. Each system’s performance is re-tested through a site
acceptance test (SAT) after installation at the customer site. We have never failed to
successfully complete installation of a system at a customer’s premises. Acceptance at
FAT is considered to be proven for established technologies with a history of
successful customer acceptances at SAT (equal or better than FAT).
|
|||
Transfer of control and recognition of revenue of a system undergoing a FAT, and for
which customer acceptance at FAT is proven, will occur upon delivery of the system.
|
|||
Transfer of control and recognition of revenue of a system not undergoing a FAT, or for
which customer acceptance at FAT is not proven, will occur after successful installation
upon customer acceptance of the system at SAT.
|
|||
New system sales do not meet the requirements for over time revenue recognition
because our customers do not simultaneously receive and consume the benefits
provided by our performance, or control the asset throughout any stage of our
production process, or the systems are considered to have alternative use.
|
|||
Used systems |
We have no repurchase commitments in our general sales terms and conditions;
however, we may repurchase systems that we previously manufactured and sold, in
order to refurbish and resell the system to a different customer. This repurchase
decision is mainly driven by market demand expressed by other customers.
|
||
Transfer of control of a used system, and recognition of revenue, follow the same logic
as for our ‘New systems’.
|
ASML Annual Report 2025
|
286 |
Goods or services |
Nature, timing of satisfying the performance obligations and significant
payment terms
|
||
Field upgrades and options
(system enhancements)
|
Field upgrades and options mainly relate to goods and services that are delivered for
systems already installed in the customer factories. Certain upgrades require significant
installation efforts, enhancing an asset the customer controls, and therefore resulting in
transfer of control over the period of installation. The method of measuring progress is
based on what best depicts the satisfaction of our obligation in transferring control.
This is generally based on either the cost incurred method, which is estimated using
labor hours, or the value transferred method, which is estimated using system
performance measurements. For the options and other upgrades for which the
customer receives and consumes the benefit at the moment of delivery, the transfer of
control and recognition of revenue will occur upon delivery.
|
||
As long as we are not able to make a reliable estimate of the total efforts needed to
complete the upgrade, we only recognize revenue to cover costs incurred. Margin will
be realized at the earlier of us being able to make a reliable estimate or completion of
the upgrade.
|
|||
New product introduction |
If the installation of new products is determined not to be a separate performance
obligation or if there is not a sufficient established history of acceptance on FAT, a new
product is considered to be a “new product introduction".
|
||
Transfer of control and revenue recognition for new product introductions occurs after
successful installation and customer acceptance at SAT. Once there is an established
history of successful installation and customer acceptance, revenue will be recognized
consistent with other systems and goods after transfer of control.
|
|||
Installation |
Installation is provided within the selling price of a system. Installation is considered to
be distinct if it does not significantly modify the system being purchased and the
customer or a third party could be capable of performing the installation themselves,
if desired. Transfer of control takes place over the period of installation from delivery
through SAT, measured on a straight-line basis, as our performance is satisfied evenly
over this period of time. Installation is not considered to be distinct when recognition of
revenue related to a system occurs upon customer acceptance of the system at SAT
after installation is complete.
|
||
Warranties |
We provide standard warranty coverage on our systems for
and non-consumable parts necessary to repair our systems during these warranty
periods. These standard warranties cannot be purchased and do not provide a service
in addition to the general assurance the system will perform as promised. As a result,
no revenue is allocated to these standard warranties.
|
||
Both the extended and enhanced warranties on our systems are accounted for as a
separate performance obligation, with transfer of control taking place over the warranty
period, measured on a straight-line basis, as this is a stand-ready obligation.
|
Goods or services |
Nature, timing of satisfying the performance obligations and significant
payment terms
|
||
Time-based licenses and
related services
|
Time-based licenses relate to software licenses and the related services which are sold
for a period of time. The licenses and the related services are not considered to be
individually distinct, as the support services are integral to the customer’s ability to
continue to use the software license in the rapidly changing technological environment.
The transfer of control takes place over the license term, measured on a straight-line
basis, as our performance is satisfied evenly over this period of time. Payments are
generally made in installments throughout the license term.
|
||
Application projects |
Application projects are node transition and consulting projects which at times may be
provided as free service within a volume purchase agreement. Measuring satisfaction
of this performance obligation is performed through an input method based on the
labor hours expended relative to the estimated total labor hours, as this best depicts
the transfer of control of these kind of services.
|
||
Service contracts |
Service contracts are entered into with our customers to support our systems used in
their ongoing operations during the systems life cycle, typically in the form of full-
service agreements, limited manpower agreements, other labor agreements, parts
availability or parts usage agreements. These services are for a specified period of time
and typically have a fixed price. Control transfers over this period of time, measured on
a straight-line basis, as these are stand-ready obligations. For service contracts where
the price is not fixed, the transaction price has a variable component that is based on
the performance of the system.
|
||
Billable parts and labor |
Billable labor represents maintenance services to our systems installed in the
customer’s factories while in operation, through purchase orders from our customer.
Control over these services is transferred to the customer upon receipt of customer
sign-off.
|
||
Billable parts represent spare parts including optical components relating to our
systems installed in the customer’s factories while in operation, through purchase
orders from our customer.
|
|||
Billable parts can be: |
|||
•Sold as direct spare parts, for which control transfers point in time upon delivery; or
|
|||
•Sold as part of maintenance services, where control transfers point in time upon
receipt of customer sign-off.
|
|||
Field projects (relocations) |
Field projects represent mainly relocation services. Measuring satisfaction of this
performance obligation is performed through an input method based on the labor hours
expended relative to the estimated total labor hours, as this best depicts the transfer of
control of our service.
|
||
OnPulse maintenance |
OnPulse maintenance services are provided over a specified period of time on our light
source systems. Payment is determined by the number of pulses counted from each
light source system, which is variable. Invoicing is monthly based on the pulses
counted. Revenue is recognized in line with invoicing using the practical expedient in
ASC 606-10-55-18.
|
ASML Annual Report 2025
|
287 |
Year ended December 31 |
2023 |
2024 |
2025 |
|||
in units |
in € millions |
in units |
in € millions |
in units |
in € millions |
|
EXE |
||||||
NXE |
||||||
ArF immersion |
||||||
ArF dry |
||||||
KrF |
||||||
I-line |
||||||
Metrology & Inspection |
||||||
Total |
||||||
Year ended December 31 |
2023 |
2024 |
2025 |
|||
in units |
in € millions |
in units |
in € millions |
in units |
in € millions |
|
Logic |
||||||
Memory |
||||||
Total |
||||||
Year ended December 31 (€, in millions) |
2024 |
2025 |
|||
Contract assets |
Contract liabilities |
Contract assets |
Contract liabilities |
||
Balance at beginning of the year |
|||||
Transferred from contract assets to accounts
receivables
|
( |
— |
( |
— |
|
Revenue recognized during the year ending in contract
assets
|
— |
— |
|||
Revenue recognized that was included in contract
liabilities
|
— |
( |
— |
( |
|
Changes as a result of cumulative catch-up
adjustments arising from changes in estimates and
contract modifications
|
— |
( |
— |
||
Remaining performance obligations for which
considerations have been received, or for which we
have an unconditional right to consideration
|
— |
— |
|||
Transfer between contract assets and liabilities |
( |
( |
|||
Other |
— |
( |
— |
( |
|
Total |
|||||
ASML Annual Report 2025
|
288 |
Year ended December 31 (€, in millions) |
2023 |
2024 |
2025 |
|
New systems |
||||
Used systems |
||||
Net system sales |
Year ended December 31
(€, in millions)
|
2023 |
2024 |
2025 |
|||
Total net sales |
Long-lived assets |
Total net sales |
Long-lived assets |
Total net sales |
Long-lived assets |
|
Japan |
||||||
South Korea |
||||||
Singapore |
||||||
Taiwan |
||||||
China |
||||||
Rest of Asia |
||||||
Netherlands |
||||||
EMEA |
||||||
United States |
||||||
Total |
||||||
ASML Annual Report 2025
|
289 |
Year ended December 31 (€, in millions) |
2024 |
2025 |
|
Deposits with financial institutions, governments and government-related bodies |
|||
Investments in money market funds |
|||
Bank accounts |
|||
Cash and cash equivalents |
|||
Deposits with financial institutions, governments and government-related bodies |
|||
Short-term investments |
ASML Annual Report 2025
|
290 |
Year ended December 31 (€, in millions) |
2024 |
2025 |
|
Accounts receivable, gross |
|||
Allowance for credit losses |
|||
Accounts receivable, net |
Year ended December 31 (€, in millions) |
2024 |
2025 |
|
Finance receivables, gross |
|||
Unearned interest |
|||
Finance receivables, net |
|||
Current portion of finance receivables, gross |
|||
Current portion of unearned interest |
|||
Non-current portion of finance receivables, net |
(€, in millions) |
Amount |
2026 |
|
2027 |
|
2028 and thereafter |
|
Finance receivables, gross |
ASML Annual Report 2025
|
291 |
Year ended December 31 (€, in millions) |
2024 |
2025 |
|
Raw materials |
|||
Work-in-process |
|||
Finished products |
|||
Inventories, gross |
|||
Inventory reserves |
( |
( |
|
Inventories, net |
Year ended December 31 (€, in millions) |
2024 |
2025 |
|
Balance at beginning of year |
( |
( |
|
Additions for the year |
( |
( |
|
Effect of changes in exchange rates |
( |
||
Utilization of the reserve |
|||
Balance at end of year |
( |
( |
Year ended December 31 (€, in millions) |
2024 |
2025 |
|
Advance payments to Carl Zeiss SMT GmbH1
|
|||
Prepaid expenses |
|||
Derivative financial instruments2
|
|||
VAT receivable |
|||
Other assets |
|||
Other current assets |
|||
Advance payments to Carl Zeiss SMT GmbH1
|
|||
Prepaid expenses |
|||
Compensation plan assets |
|||
Other assets |
|||
Other non-current assets |
ASML Annual Report 2025
|
292 |
Year ended December 31 (€, in millions) |
2024 |
2025 |
|
Balance at beginning of year |
|||
Additions |
|||
Disposals |
|||
Other changes |
|||
Balance at end of year |
ASML Annual Report 2025
|
293 |
Category |
Estimated useful life |
Brands |
|
Intellectual property |
|
Developed technology |
|
Customer relationships |
|
Other |
ASML Annual Report 2025
|
294 |
€, in millions |
Brands |
Intellectual property |
Developed technology |
Customer relationships |
Other |
Total |
Cost |
||||||
Balance at January 1, 2024 |
||||||
Additions |
||||||
Disposals |
( |
( |
||||
Effect of changes in exchange rates |
( |
( |
||||
Balance at December 31, 2024 |
||||||
Additions |
||||||
Disposals |
( |
( |
||||
Effect of changes in exchange rates |
||||||
Balance at December 31, 2025 |
||||||
Accumulated amortization and impairment |
||||||
Balance at January 1, 2024 |
||||||
Amortization |
||||||
Impairment charges |
||||||
Disposals |
( |
( |
||||
Effect of changes in exchange rates |
||||||
Balance at December 31, 2024 |
||||||
Amortization |
||||||
Disposals |
( |
( |
||||
Effect of changes in exchange rates |
( |
( |
||||
Balance at December 31, 2025 |
||||||
Carrying amount |
||||||
December 31, 2024 |
||||||
December 31, 2025 |
ASML Annual Report 2025
|
295 |
Year ended December 31 (€, in millions) |
2023 |
2024 |
2025 |
|
Cost of sales |
||||
R&D costs |
||||
SG&A |
||||
Total amortization |
€, in millions |
Amount |
2026 |
|
2027 |
|
2028 |
|
2029 |
|
2030 |
|
Thereafter |
|
Total |
Category |
Estimated useful life |
Buildings |
|
Machinery and equipment |
|
Leasehold improvements |
|
Furniture, fixtures and other |
ASML Annual Report 2025
|
296 |
€, in millions |
Land and buildings |
Machinery and equipment |
Leasehold improvements |
Furniture, fixtures and other |
Total |
Cost |
|||||
Balance at January 1, 2024 |
|||||
Additions |
|||||
Disposals |
( |
( |
( |
( |
( |
Net non-cash movements to/from Inventories |
( |
( |
|||
Effect of changes in exchange rates |
( |
( |
|||
Balance at December 31, 2024 |
|||||
Additions |
|||||
Disposals |
( |
( |
( |
( |
( |
Net non-cash movements to/from Inventories |
|||||
Effect of changes in exchange rates |
( |
( |
( |
( |
( |
Balance at December 31, 2025 |
|||||
Accumulated depreciation and impairment |
|||||
Balance at January 1, 2024 |
|||||
Depreciation |
|||||
Impairment charges |
|||||
Disposals |
( |
( |
( |
||
Net non-cash movements to/from Inventories |
( |
( |
|||
Effect of changes in exchange rates |
|||||
Balance at December 31, 2024 |
|||||
Depreciation |
|||||
Impairment charges |
|||||
Disposals |
( |
( |
( |
( |
( |
Net non-cash movements to/from Inventories |
( |
( |
|||
Effect of changes in exchange rates |
( |
( |
( |
( |
( |
Balance at December 31, 2025 |
|||||
Carrying amount |
|||||
December 31, 2024 |
|||||
December 31, 2025 |
ASML Annual Report 2025
|
297 |
Year ended December 31 (€, in millions) |
2023 |
2024 |
2025 |
|
Cost of sales |
||||
R&D costs |
||||
SG&A |
||||
Total depreciation |
Year ended December 31 (€, in millions) |
2024 |
2025 |
|
Properties |
|||
Cars |
|||
Warehouses |
|||
Other |
|||
Right-of-use assets |
ASML Annual Report 2025
|
298 |
Year ended December 31 (€, in millions) |
2024 |
2025 |
|
Current |
|||
Non-current |
|||
Lease liabilities |
Year ended December 31 (€, in millions) |
2023 |
2024 |
2025 |
|
Properties |
||||
Cars |
||||
Equipment |
||||
Warehouses |
||||
Other |
||||
Lease expenses |
Year ended December 31 (€, in millions) |
2023 |
2024 |
2025 |
|
Total cash flows |
Year ended December 31 |
2023 |
2024 |
2025 |
|
Weighted average remaining lease term (months) |
||||
Weighted average discount rate (%) |
Year ended December 31 (€, in millions) |
2024 |
2025 |
|
Costs to be paid1
|
|||
Personnel-related items |
|||
Derivative financial instruments2
|
|||
Lease liabilities3
|
|||
Provisions |
|||
Standard warranty reserve |
|||
Refund liability |
|||
Other |
|||
Accrued and other liabilities |
|||
Less: non-current portion of accrued and other liabilities |
|||
Current portion of accrued and other liabilities |
ASML Annual Report 2025
|
299 |
Year ended December 31 (€, in millions) |
2024 |
2025 |
|
Balance at beginning of year |
|||
Additions for the year |
|||
Utilization of the reserve |
( |
( |
|
Effect of exchange rates |
( |
||
Balance at end of year |
Year ended December 31 (€, in millions) |
2024 |
2025 |
|
€
interest annually payable on July 7th
|
|||
€
2027 interest annually payable on May 28th
|
|||
€
2030 interest annually payable on February 25th
|
|||
€
interest annually payable on May 7th
|
|||
€
interest annually payable on May 17th
|
|||
€
2025 interest annually payable on December 6th
|
|||
Debt acquired from Berliner Glas (ASML Berlin GmbH) |
|||
Long-term debt |
|||
Less: current portion of long-term debt |
|||
Non-current portion of long-term debt |
€, in millions |
Amount |
2026 |
|
2027 |
|
2028 |
|
2029 |
|
2030 |
|
Thereafter |
|
Total debt maturities |
ASML Annual Report 2025
|
300 |
Year ended December 31 (€, in millions) |
2024 |
2025 |
|
Amortized cost amount |
|||
Fair value interest rate swaps1
|
( |
( |
|
Carrying amount |
Year ended December 31 (€, in millions) |
2024 |
2025 |
|
Principal amount |
|||
Carrying amount |
|||
Fair value1
|
ASML Annual Report 2025
|
301 |
Payments due by period (€, in billions) |
Total |
1 year |
2 years |
3 years |
4 years |
5 years |
>5 years |
Long-term debt and short-term borrowings
obligations, including interest1
|
|||||||
Lease obligations2
|
|||||||
Purchase obligations |
|||||||
Total contractual obligations |
ASML Annual Report 2025
|
302 |
Year ended December 31 (€, in millions) |
2023 |
2024 |
2025 |
|
Wages and salaries |
||||
Social security expenses |
||||
Pension and retirement expenses |
||||
Share-based payments |
||||
Personnel expenses |
Year ended December 31 (€, in millions) |
2023 |
2024 |
2025 |
|
Board of Management |
||||
Former Board of Management1
|
||||
Other employees |
||||
Total STI bonus expenses |
Average number of payroll employees in FTEs |
2023 |
2024 |
2025 |
|
Netherlands |
||||
Worldwide (including Netherlands) |
Year ended December 31 (in FTE) |
2023 |
2024 |
2025 |
|
Customer Support and Sales |
||||
Manufacturing and Supply Chain Management |
||||
Strategic Supply Management |
||||
General and Administrative |
||||
Research and Development |
||||
Total |
||||
Less: Temporary employees |
||||
Payroll employees |
ASML Annual Report 2025
|
303 |
Year ended December 31 (€, in millions) |
2023 |
2024 |
2025 |
|
Pension plan based on multi-employer union plan |
||||
Pension plans based on defined contribution and other plans |
||||
Pension and retirement expenses |
ASML Annual Report 2025
|
304 |
LTI performance plan criteria |
Market/Non-market element |
Weight |
Relative TSR |
Market |
|
Strategic value drivers |
Non-market |
|
Technology Leadership Index |
Non-market |
|
ESG measures |
Non-market |
|
Total |
ASML Annual Report 2025
|
305 |
Year ended December 31 |
2023 |
2024 |
2025 |
Share price in € at grant date |
|||
Expected volatility ASML |
|||
Average volatility of the peer group |
|||
Vesting period |
|||
Dividend yield |
|||
Risk free interest rate (Eurozone) |
|||
Risk free interest rate (US) |
Year ended December 31 (€, in millions) |
2023 |
2024 |
2025 |
Incurred expenses |
|||
Expected expenses of conditionally granted plans in future periods |
|||
Weighted average period for recognizing these expected expenses |
|||
Recognized income tax benefit (excluding excess income tax benefits) |
EUR-denominated |
USD-denominated |
|||||||
Year ended December 31 |
2023 |
2024 |
2025 |
2023 |
2024 |
2025 |
||
Total fair value of shares vested during the year (in millions) |
||||||||
Weighted average fair value of shares granted |
||||||||
EUR-denominated |
USD-denominated |
|||
Number
of shares
|
Weighted
average
fair value at
grant date
|
Number
of shares
|
Weighted
average
fair value at
grant date
|
|
Conditional shares outstanding at January 1, 2025 |
||||
Granted |
||||
Vested |
( |
( |
||
Forfeited |
( |
( |
||
Conditional shares outstanding at December 31, 2025 |
||||
ASML Annual Report 2025
|
306 |
EUR-denominated |
USD-denominated |
|||||||
Year ended December 31 |
2023 |
2024 |
2025 |
2023 |
2024 |
2025 |
||
Weighted average share price at stock option exercise |
||||||||
Aggregate intrinsic value of exercised stock options (in millions) |
||||||||
Weighted average remaining contractual term of exercisable
options (in years)
|
||||||||
Aggregate intrinsic value of exercisable stock options (in millions) |
||||||||
Aggregate intrinsic value of outstanding stock options (in millions) |
||||||||
EUR-denominated |
USD-denominated |
|||
Number
of options
|
Weighted
average exercise
price per ordinary
share (in €)
|
Number
of options
|
Weighted
average exercise
price per ordinary
share (in $)
|
|
Outstanding, January 1, 2025 |
||||
Granted |
||||
Exercised |
( |
( |
||
Forfeited |
||||
Expired |
( |
( |
||
Outstanding, December 31, 2025 |
||||
Exercisable, December 31, 2025 |
||||
EUR-denominated |
USD-denominated |
||||
Range of exercise
prices (in €)
|
Number of
outstanding options
|
Weighted average
remaining
contractual term of
outstanding (years)
|
Range of exercise
prices (in $)
|
Number of
outstanding options
|
Weighted average
remaining
contractual term of
outstanding (years)
|
Total |
Total |
||||
ASML Annual Report 2025
|
307 |
Year ended December 31 (€, in millions) |
2023 |
2024 |
2025 |
|
Netherlands |
||||
Foreign |
||||
Income before income taxes |
||||
Income tax (expense) / benefit current |
( |
( |
( |
|
Income tax (expense) / benefit deferred |
( |
( |
||
Income tax (expense) / benefit Netherlands |
( |
( |
( |
|
Income tax (expense) / benefit current |
( |
( |
( |
|
Income tax (expense) / benefit deferred |
( |
( |
||
Income tax (expense) / benefit Foreign |
( |
( |
( |
|
Total income tax (expense) / benefit current |
( |
( |
( |
|
Total income tax (expense) / benefit deferred |
( |
|||
Total income tax (expense) / benefit |
( |
( |
( |
ASML Annual Report 2025
|
308 |
Year ended December 31 (€, in millions) |
2023 |
2024 |
2025 |
|
Current year tax (expense) / benefit |
( |
( |
( |
|
Prior year tax (expense) / benefit |
( |
|||
Total current tax (expense) / benefit |
( |
( |
( |
Year ended December 31 (€, in millions) |
2023 |
2024 |
2025 |
|
Changes to recognition of operating losses and tax credits |
( |
( |
||
Prior year tax (expense) / benefit |
( |
|||
Tax rate changes |
||||
Origination and reversal of temporary differences, operating losses and
tax credits
|
( |
( |
||
Total deferred tax (expense) / benefit |
( |
Year ended December 31 (€, in millions)3
|
2024 |
2025 |
|
Top-up tax expense based on local QDMTT1
|
( |
||
Top-up tax expense based on IIR2
|
( |
||
Global minimum tax (expense) / benefit |
( |
Year ended December 31 (€, in millions) |
2025 |
%1
|
Income before income taxes |
||
Income tax expense based on ASML’s domestic rate |
( |
|
Foreign tax effects |
||
Other foreign jurisdictions |
||
Other |
( |
|
Netherlands |
||
Nontaxable or nondeductible items |
||
Adjustments in respect of tax incentives |
( |
|
Other nontaxable or nondeductible items |
( |
|
Other adjustments |
( |
|
Changes in the liability for unrecognized tax benefits |
( |
|
Income tax expense / Effective tax rate |
( |
ASML Annual Report 2025
|
309 |
Year ended December 31 (€, in millions) |
2023 |
%1
|
2024 |
%1
|
|
Income before income taxes |
|||||
Income tax provision based on ASML’s domestic rate |
( |
( |
|||
Effects of tax rates in foreign jurisdictions |
( |
( |
|||
Adjustments in respect of tax exempt income |
|||||
Adjustments in respect of tax incentives |
( |
( |
|||
Adjustments in respect of prior years’ current taxes |
( |
( |
|||
Adjustments in respect of prior years’ deferred taxes |
( |
( |
|||
Movements in the liability for unrecognized tax benefits |
( |
( |
|||
Global Minimum Tax |
( |
||||
Change in valuation allowance |
( |
||||
Equity method investments |
( |
( |
|||
Effect of change in tax rates |
( |
||||
Other credits and non-taxable items |
( |
||||
Provision for income taxes |
( |
( |
ASML Annual Report 2025
|
310 |
Jurisdiction / Year (€, in millions) |
2025 |
Domestic |
|
Netherlands |
( |
Foreign |
|
United States |
( |
South Korea |
( |
China |
( |
Rest of World |
( |
Total |
( |
Year ended December 31 (€, in millions) |
2024 |
2025 |
|
Liability for unrecognized tax benefits |
( |
( |
|
Deferred tax assets |
|||
Deferred tax liabilities |
( |
( |
|
Deferred and other tax assets (liabilities) |
ASML Annual Report 2025
|
311 |
Year ended December 31 (€, in millions) |
2024 |
2025 |
|
Balance as at January 1 |
( |
( |
|
Gross increases – tax positions in prior period |
( |
( |
|
Gross decreases – tax positions in prior period |
|||
Gross increases – tax positions in current period |
( |
( |
|
Settlements |
|||
Lapse of statute of limitations |
|||
Effect of changes in exchange rates |
( |
||
Total liability for unrecognized tax benefits |
( |
( |
|
Balance of accrued interest and penalties |
( |
( |
|
Total liabilities for unrecognized tax benefits including interest and penalties |
( |
( |
Jurisdictions |
Years |
Netherlands |
2022 – 2025 |
US |
2018 – 2025 |
Taiwan |
2020 – 2025 |
South Korea |
2022 – 2025 |
China |
2015 – 2025 |
ASML Annual Report 2025
|
312 |
Deferred taxes (€, in millions) |
January 1, 2025 |
Credits and other |
Consolidated
Statements
of Operations
|
Effect of changes
in exchange rates
|
December 31, 2025 |
|
Deferred tax assets: |
||||||
Capitalized R&D costs |
— |
( |
( |
|||
Goodwill |
— |
— |
||||
R&D and other tax credit carry forwards |
( |
( |
||||
Inventories |
( |
( |
||||
Contract liabilities |
( |
|||||
Accrued and other liabilities |
( |
( |
||||
Operating loss carry forwards |
||||||
Property, plant and equipment |
( |
|||||
Lease liabilities |
( |
( |
||||
Other intangible assets |
— |
( |
( |
|||
Share-based payments |
— |
( |
||||
Other temporary differences |
— |
|||||
Total deferred tax assets, gross |
( |
( |
||||
Valuation allowance1
|
( |
— |
( |
( |
||
Total deferred tax assets, net |
( |
( |
( |
|||
Deferred tax liabilities: |
||||||
Other intangible assets |
( |
— |
( |
|||
Goodwill |
( |
— |
( |
— |
( |
|
Inventories |
— |
— |
— |
|||
Right-of-use assets |
( |
— |
( |
|||
Property, plant and equipment |
( |
— |
( |
|||
Accrued and other liabilities |
( |
— |
( |
( |
||
Contract liabilities |
— |
— |
— |
|||
Long-term debt |
( |
— |
— |
( |
||
Other temporary differences |
( |
— |
( |
( |
||
Total deferred tax liabilities |
( |
( |
( |
|||
Net deferred tax assets (liabilities) |
( |
( |
( |
|||
Classified as: |
||||||
Deferred tax assets – non-current |
||||||
Deferred tax liabilities – non-current |
( |
( |
||||
Net deferred tax assets (liabilities) |
ASML Annual Report 2025
|
313 |
Deferred taxes (€, in millions) |
January 1, 2024 |
Credits and other |
Consolidated
Statements
of Operations
|
Income tax recognized
in Other
Comprehensive
Income
|
Effect of changes
in exchange rates
|
December 31, 2024 |
|
Deferred tax assets: |
|||||||
Capitalized R&D costs |
— |
( |
— |
||||
Goodwill |
— |
— |
|||||
R&D and other tax credit carry forwards |
( |
— |
|||||
Inventories |
— |
— |
|||||
Contract liabilities |
— |
— |
|||||
Accrued and other liabilities |
— |
( |
— |
||||
Operating loss carry forwards |
— |
( |
— |
— |
|||
Property, plant and equipment |
— |
( |
— |
( |
|||
Lease liabilities |
— |
( |
— |
||||
Other intangible assets |
— |
( |
— |
— |
|||
Share-based payments |
— |
— |
|||||
Other temporary differences |
— |
( |
|||||
Total deferred tax assets, gross |
( |
||||||
Valuation allowance1
|
( |
— |
( |
— |
( |
( |
|
Total deferred tax assets, net |
( |
||||||
Deferred tax liabilities: |
|||||||
Other intangible assets |
( |
— |
— |
( |
( |
||
Goodwill |
( |
— |
( |
— |
— |
( |
|
Inventories |
( |
— |
|||||
Right-of-use assets |
( |
— |
— |
( |
( |
||
Property, plant and equipment |
( |
— |
( |
— |
( |
||
Accrued and other liabilities |
( |
— |
— |
( |
|||
Contract liabilities |
( |
— |
— |
— |
|||
Long-term debt |
( |
— |
— |
— |
( |
||
Other temporary differences |
( |
— |
( |
— |
( |
||
Total deferred tax liabilities |
( |
( |
( |
||||
Net deferred tax assets (liabilities) |
( |
||||||
Classified as: |
|||||||
Deferred tax assets – non-current |
|||||||
Deferred tax liabilities – non-current |
( |
( |
|||||
Net deferred tax assets (liabilities) |
ASML Annual Report 2025
|
314 |
Type of shares |
Number of shares |
Nominal value |
Votes per share |
Cumulative preference shares |
€ |
||
Ordinary shares |
€ |
Year ended December 31 |
2023 |
2024 |
2025 |
|
Issued ordinary shares with nominal value of € |
||||
Issued ordinary treasury shares with nominal value of € |
||||
Total issued ordinary shares with nominal value of € |
ASML Annual Report 2025
|
315 |
ASML Annual Report 2025
|
316 |
Period |
Total number
of shares
purchased
|
Average
price paid per
Share (€)
|
Total number
of shares
purchased under
programs
|
Maximum value
of shares that may yet
be purchased
(€ millions)
|
January 1 – 31, 2025 |
||||
February 1 – 28, 2025 |
||||
March 1 – 31, 2025 |
||||
April 1 – 30, 2025 |
||||
May 1 – 31, 2025 |
||||
June 1 – 30, 2025 |
||||
July 1 – 31, 2025 |
||||
August 1 – 31, 2025 |
||||
September 1 – 30, 2025 |
||||
October 1 – 31, 2025 |
||||
November 1 – 30, 2025 |
||||
December 1 – 31, 2025 |
||||
Total |
ASML Annual Report 2025
|
317 |
Year ended December 31 (€, in millions, except per share data) |
2023 |
2024 |
2025 |
|
Net income |
||||
Weighted average number of shares outstanding |
||||
Basic net income per ordinary share |
||||
Weighted average number of shares outstanding |
||||
Plus shares applicable to options and conditional shares |
||||
Diluted weighted average number of shares |
||||
Diluted net income per ordinary share |
ASML Annual Report 2025
|
318 |
Year ended December 31 (€, in millions) |
2024 |
2025 |
|||
Impact on net
income
|
Impact on
equity
|
Impact on net
income
|
Impact on
equity
|
||
US dollar |
|||||
Japanese yen |
( |
( |
( |
||
Taiwanese dollar |
( |
( |
|||
South Korean won |
( |
||||
Chinese yuan |
( |
||||
Other currencies |
( |
||||
Total |
( |
( |
|||
Year ended December 31 (in billions) |
2024 |
2025 |
|
US dollar (USD) |
|||
Japanese yen (JPY) |
|||
Taiwanese dollar (TWD) |
|||
South Korean won (KRW) |
|||
Chinese yuan (CNY) |
Year ended December 31 (€, in millions) |
2023 |
2024 |
2025 |
|
Purchase transactions |
( |
( |
||
Net of taxes |
( |
( |
ASML Annual Report 2025
|
319 |
Year ended December 31 (€, in millions) |
2024 |
2025 |
|||
Impact on net
income
|
Impact on
equity
|
Impact on net
income
|
Impact on
equity
|
||
Effect of a |
|||||
ASML Annual Report 2025
|
320 |
Year ended December 31 (€, in millions) |
2024 |
2025 |
Confirmed obligations outstanding at the beginning of the year |
||
Invoices confirmed during the year |
||
Confirmed invoices paid during the year |
||
Confirmed obligations outstanding at the end of the year |
ASML Annual Report 2025
|
321 |
Year ended December 31 (€, in millions) |
2024 |
2025 |
|||
Notional
amount
|
Fair value |
Notional
amount
|
Fair value |
||
Forward foreign exchange contracts |
( |
||||
Interest rate swaps |
( |
( |
|||
Year ended December 31 (€, in millions) |
2024 |
2025 |
|||
Assets |
Liabilities |
Assets |
Liabilities |
||
Interest rate swaps – fair value hedges |
|||||
Forward foreign exchange contracts – cash flow
hedges
|
|||||
Forward foreign exchange contracts – no hedge
accounting
|
|||||
Total |
|||||
Less non-current portion: |
|||||
Interest rate swaps – fair value hedges |
|||||
Total non-current portion |
|||||
Total current portion |
|||||
ASML Annual Report 2025
|
322 |
Year ended December 31, 2025 (€, in millions) |
Level 1 |
Level 2 |
Level 3 |
Total |
|
Assets measured at fair value |
|||||
Derivative financial instruments1
|
|||||
Money market funds2
|
|||||
Short-term investments3
|
|||||
Total |
|||||
Liabilities measured at fair value |
|||||
Derivative financial instruments1
|
|||||
Assets and liabilities for which fair values are disclosed |
|||||
Loans receivable |
|||||
Long-term debt4
|
Year ended December 31, 2024 (€, in millions) |
Level 1 |
Level 2 |
Level 3 |
Total |
|
Assets measured at fair value |
|||||
Derivative financial instruments1
|
|||||
Money market funds2
|
|||||
Short-term investments3
|
|||||
Total |
|||||
Liabilities measured at fair value |
|||||
Derivative financial instruments1
|
|||||
Assets and liabilities for which fair values are disclosed |
|||||
Loans receivable |
|||||
Long-term debt4
|
ASML Annual Report 2025
|
323 |
ASML Annual Report 2025
|
324 |
Year ended December 31 (€, in millions) |
2024 |
2025 |
Maximum
exposure to loss
|
|
Advance payments included in Other assets |
||||
Loans receivable |
||||
Investment agreement for |
||||
Accounts receivable |
||||
Accounts payable |
||||
Cost to be paid included in Accrued and other liabilities |
Year ended December 31 (€, in millions) |
2023 |
2024 |
2025 |
|
Total purchases |
ASML Annual Report 2025
|
325 |

ASML Annual Report 2025
|
326 |
Principal accountant fees and services |
||
Property, plant and equipment |
||
Dutch and US taxation |
||
Financing policy |
||
Exchange controls |
||
Documents on display |
||
Controls and procedures |
||
Financial calendar and investor relations |
||
ASML contact information |
||
Reference table 20-F |
||
Definitions |
||
Signatures |
||
Exhibit index |
ASML Annual Report 2025
|
327 |
Year ended December 31 |
2024 |
2025 |
|||||
(€, in thousands) |
KPMG
Accountants
N.V.
|
KPMG
Network
|
Total |
PwC
Accountants
N.V.
|
PwC Network |
Total |
|
Audit fees |
3,857 |
1,188 |
5,045 |
4,728 |
1,381 |
6,109 |
|
Audit-related fees |
812 |
13 |
825 |
875 |
— |
875 |
|
Tax fees |
— |
— |
— |
— |
— |
— |
|
All other fees |
85 |
2 |
87 |
119 |
— |
119 |
|
Principal accountant fees |
4,754 |
1,203 |
5,957 |
5,722 |
1,381 |
7,103 |
|
ASML Annual Report 2025
|
328 |
ASML Annual Report 2025
|
329 |
ASML Annual Report 2025
|
330 |
ASML Annual Report 2025
|
331 |
ASML Annual Report 2025
|
332 |
ASML Annual Report 2025
|
333 |
ASML Annual Report 2025
|
334 |
Year ended December 31 (€, in millions) |
2024 |
2025 |
Deposits with financial institutions, governments and government-related bodies |
4,850.4 |
5,558.5 |
Investments in money market funds |
6,379.2 |
6,222.2 |
Bank accounts |
1,506.3 |
1,135.3 |
Cash and cash equivalents |
12,735.9 |
12,916.0 |
Deposits with financial institutions, governments and government-related bodies |
5.4 |
405.9 |
Short-term investments |
5.4 |
405.9 |

ASML Annual Report 2025
|
335 |
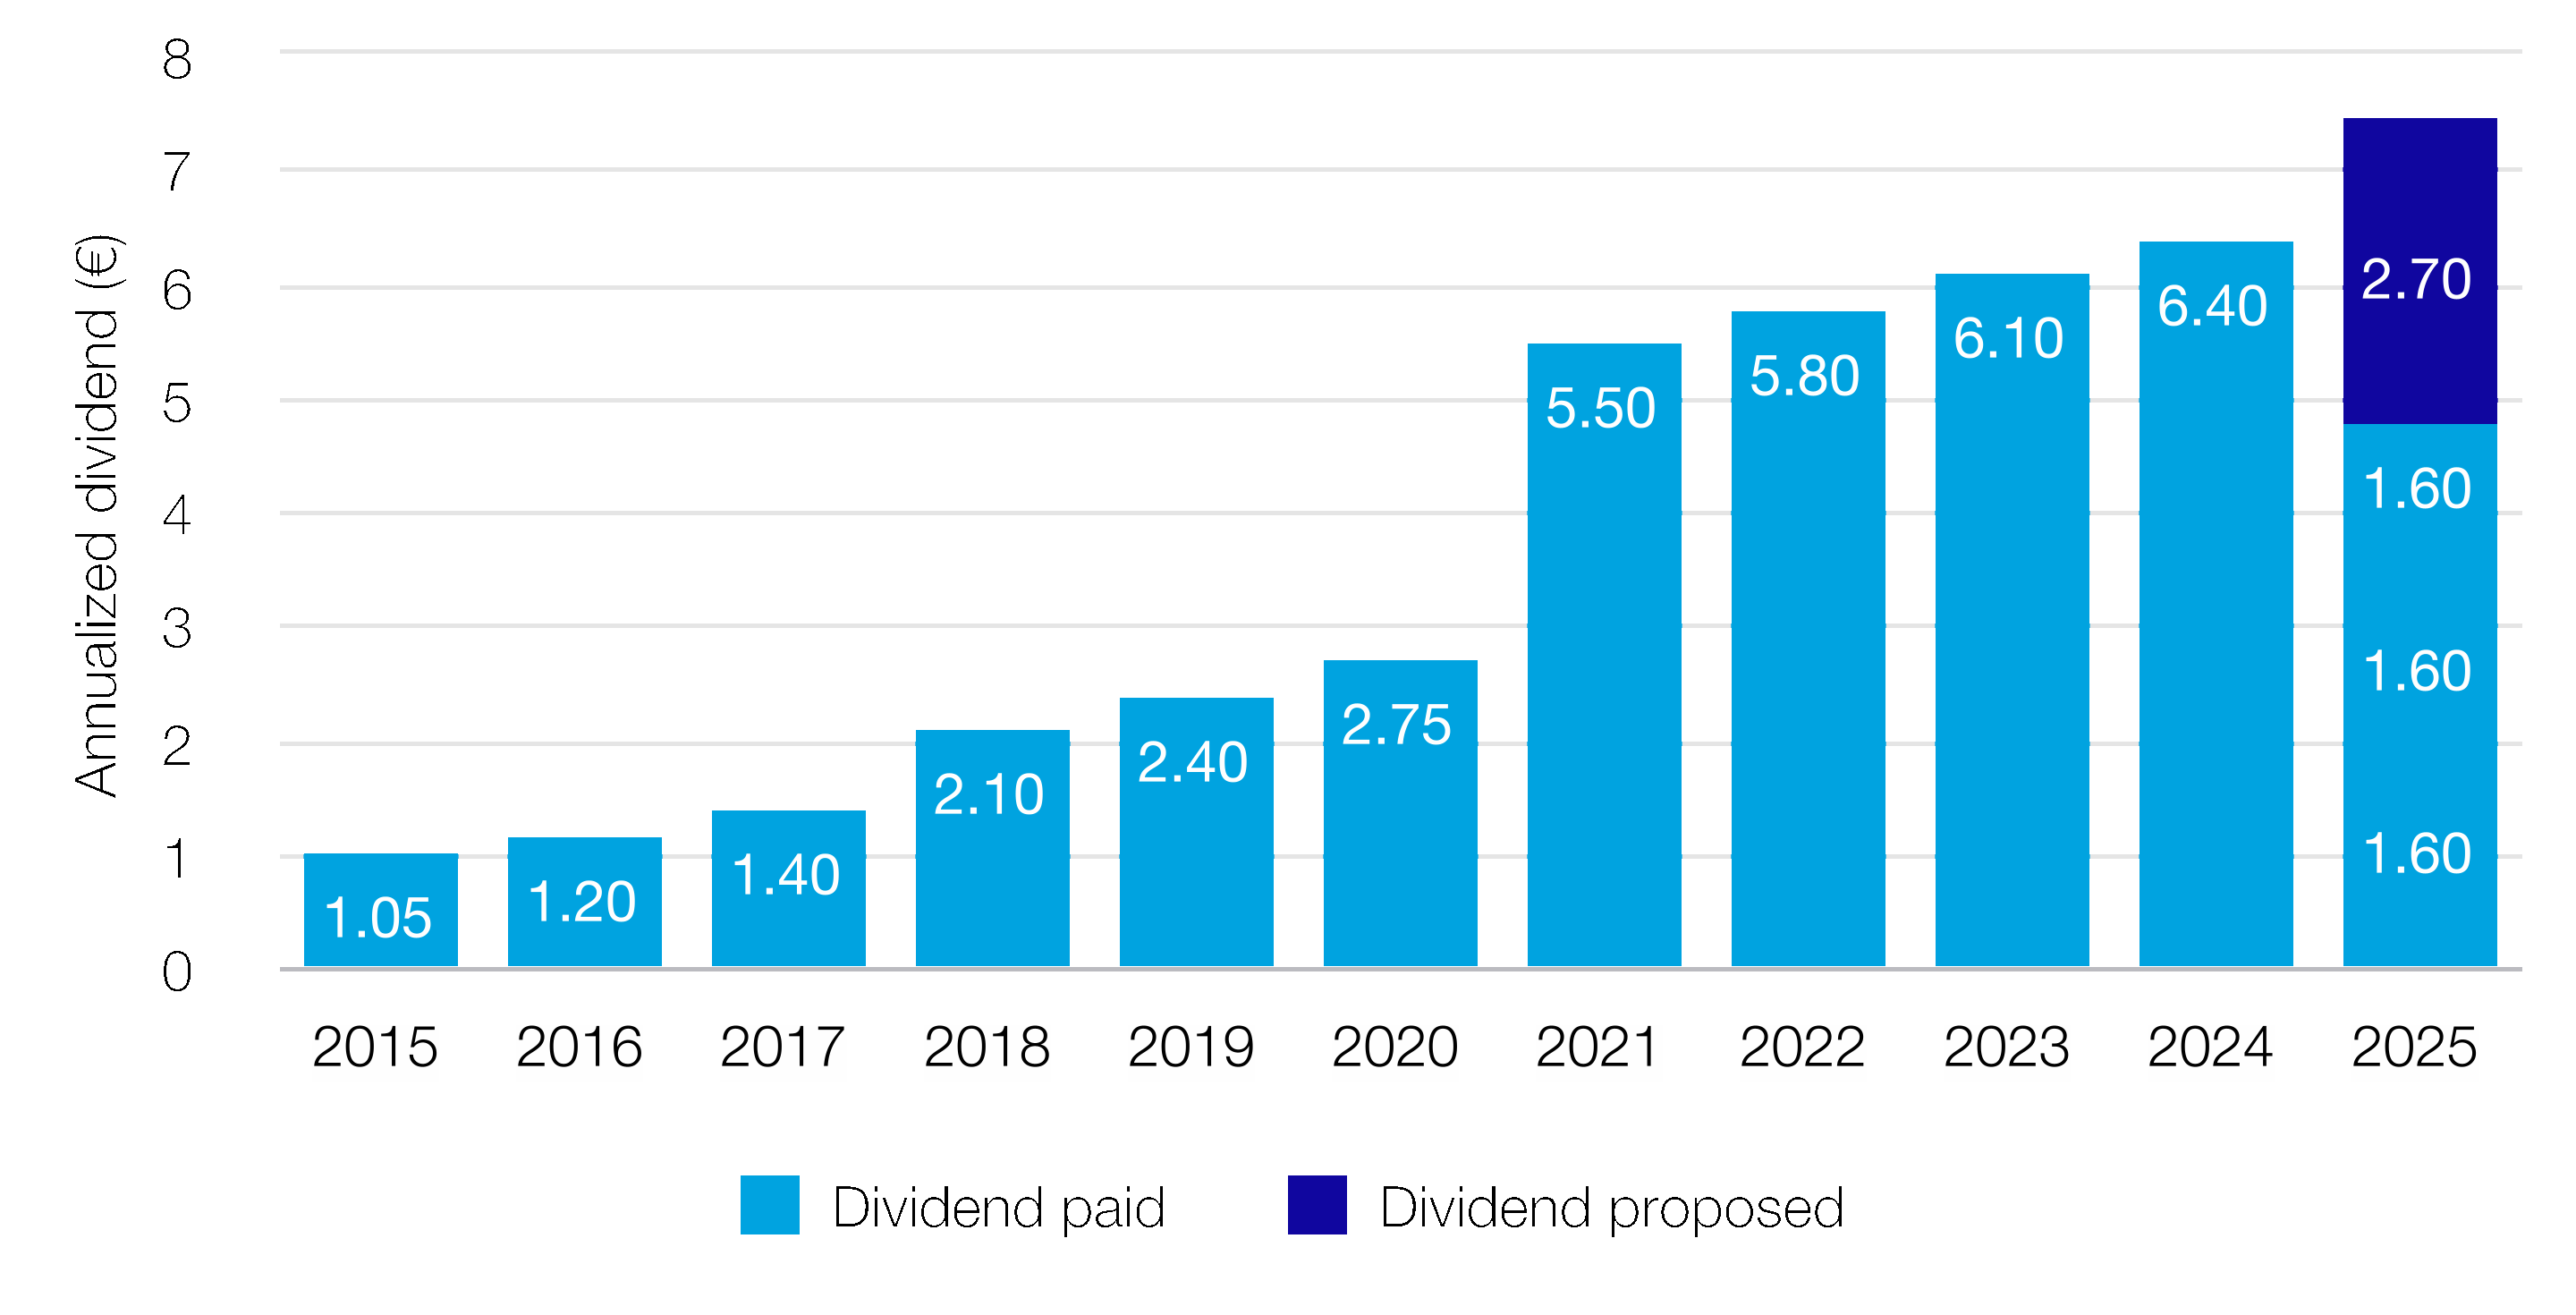

Cumulative cash returns
(Cash return is cumulative share buyback and dividend paid)
|

ASML Annual Report 2025
|
336 |
ASML Annual Report 2025
|
337 |
ASML Annual Report 2025
|
338 |
ASML Annual Report 2025
|
339 |
ASML Annual Report 2025
|
340 |
ASML Annual Report 2025
|
341 |
Item |
Form 20-F caption |
Location in this document |
Page |
Part I |
|||
1 |
Identity of Directors, Senior Management
and Advisers
|
Not applicable |
|
2 |
Offer Statistics and Expected Timetable |
Not applicable |
|
3 |
Key information |
||
B. Capitalization and Indebtedness |
Not applicable |
||
C. Reasons for the Offer and Use of Proceeds |
Not applicable |
||
D. Risk Factors |
Risk – Risk factors |
||
4 |
Information on the Company |
||
A. History and Development of the Company |
Cover page |
1 |
|
At a glance |
|||
Appendix – Property, plant and equipment |
|||
Appendix – Documents on display |
|||
Appendix – ASML contact information |
|||
B. Business Overview |
At a glance |
||
At a glance/Our business |
|||
Our marketplace |
|||
Note 2 Revenue from contracts with customers |
|||
Note 3 Segment disclosure |
|||
Risk – Risk Factors |
|||
C. Organizational Structure |
Corporate governance – Compliance with
Corporate governance requirements –
Corporate information
|
||
D. Property, Plant and Equipment |
Note 13 Property, plant and equipment, net |
||
Appendix – Property, plant and equipment |
|||
4A |
Unresolved Staff Comments |
Not applicable |
|
5 |
Operating and Financial Review and Prospects |
||
A. Operating Results |
Financial performance – Performance KPIs |
||
B. Liquidity and Capital Resources |
Financial performance – Performance KPIs |
||
Appendix – Financing policy |
|||
Consolidated statements of cash flows |
|||
Note 4 Cash and cash equivalents and short-
term investments
|
|||
Item |
Form 20-F caption |
Location in this document |
Page |
Note 16 Long-term debt, short-term
borrowings, interest and other, net
|
|||
Note 17 Commitments and contingencies |
|||
Note 25 Financial risk management |
|||
C. Research and Development, Patents and Licenses,
etc.
|
Extend our technology and holistic product
leadership
|
||
Financial performance – Research and
development costs
|
|||
Innovation ecosystem |
|||
D. Trend Information |
Long-term growth opportunities |
||
Risk – Risk factors |
|||
E. Critical Accounting Estimates |
Consolidated financial statements – Notes to
the Consolidated financial statements - Note 1
General information / summary of general
accounting policies
|
||
6 |
Directors, Senior Management and Employees |
||
A. Directors and Senior Management |
Corporate governance |
||
B. Compensation |
Remuneration Report |
||
C. Board Practices |
Corporate governance |
||
Corporate governance – Supervisory Board
report – Supervisory Board committees
|
|||
D. Employees |
Note 18 Personnel expenses and employee
information
|
||
E. Share Ownership |
Corporate governance – AGM and share capital
– Major shareholders
|
||
Remuneration Report – Board of Management
remuneration
|
|||
Note 20 Share-based compensation |
|||
F. Disclosure of a Registrant’s Action to Recover
Erroneously Awarded Compensation
|
Not applicable |
||
7 |
Major Shareholders and Related Party Transactions |
||
A. Major Shareholders |
Corporate governance – AGM and share capital
– Major shareholders
|
||
B. Related Party Transactions |
Note 26 Related parties and variable interest
entities
|
||
C. Interests of Experts & Counsel |
Not applicable |
||
ASML Annual Report 2025
|
342 |
Item |
Form 20-F caption |
Location in this document |
Page |
8 |
Financial Information |
||
A. Consolidated Statements and Other Financial
Information
|
Consolidated financial statements |
||
B. Significant Changes |
Long-term growth opportunities |
||
Notes to the Consolidated financial statements |
|||
9 |
The Offer and Listing |
||
A. Offer and Listing Details |
Exhibit 2.1 |
||
B. Plan of Distribution |
Not applicable |
||
C. Markets |
Exhibit 2.1 |
||
D. Selling Shareholders |
Not applicable |
||
E. Dilution |
Not applicable |
||
F. Expenses of the Issue |
Not applicable |
||
10 |
Additional Information |
||
A. Share Capital |
Not applicable |
||
B. Memorandum and Articles of Association |
Corporate governance |
||
C. Material Contracts |
Note 26 Related parties and variable interest
entities
|
||
D. Exchange Controls |
Appendix – Exchange controls |
||
E. Taxation |
Appendix – Dutch and US taxation |
||
F. Dividends and Paying Agents |
Not applicable |
||
G. Statement by Experts |
Not applicable |
||
H. Documents on Display |
Appendix – Documents on display |
||
I. Subsidiary Information |
Not applicable |
||
J. Annual Report to Security Holders |
Not applicable |
||
11 |
Quantitative and Qualitative Disclosures About
Market Risk
|
Note 16 Long-term debt, short-term
borrowings, interest and other, net
|
|
Note 25 Financial risk management |
|||
12 |
Description of Securities Other Than Equity
Securities
|
Not applicable |
|
Part II |
|||
13 |
Defaults, Dividend Arrearages and Delinquencies |
None |
|
14 |
Material Modifications to the Rights of Security
Holders and Use of Proceeds
|
None |
Item |
Form 20-F caption |
Location in this document |
Page |
15 |
Controls and Procedures |
Appendix – Controls and procedures |
|
16A |
Audit Committee Financial Expert |
Supervisory Board report – Supervisory Board
committees – Audit Committee
|
|
16B |
Code of Ethics |
Governance – ESG integrated governance –
Business ethics and Code of Conduct
|
|
16C |
Principal Accountant Fees and Services |
Appendix – Principal accountant fees and
services
|
|
16D |
Exemptions from the Listing Standards for Audit
Committees
|
Not applicable |
|
16E |
Purchases of Equity Securities by the Issuer and
Affiliated Purchasers
|
Note 22 Shareholders’ equity |
|
16F |
Change in Registrant’s Certifying Accountant |
None |
|
16G |
Corporate Governance |
Corporate governance – Compliance with
Corporate governance requirements – US
listing requirements
|
|
16H |
Mine Safety Disclosure |
Not applicable |
|
16I |
Disclosure Regarding Foreign Jurisdictions that
Prevent Inspections
|
Not applicable |
|
16J |
Insider Trading Policies |
Corporate governance – Exhibit index |
|
16K |
Cybersecurity |
Risk – Risk factors |
|
Corporate governance – Information security |
|||
Part III |
|||
17 |
Financial Statements |
Not applicable |
|
18 |
Financial Statements |
Consolidated financial statements |
|
19 |
Exhibits |
Exhibit index |
ASML Annual Report 2025
|
343 |
Name |
Description |
|
0–9 |
||
3TG |
Tin, tantalum, tungsten and gold |
|
A |
||
Affected communities |
People or groups of people living or working in areas in which ASML has operations and in areas
affected by ASML’s value chain.
|
|
 |
||
AFM |
The Dutch Authority for the Financial Markets (Autoriteit Financiële Markten) |
|
AGM |
Annual General Meeting |
|
AI |
Artificial intelligence |
|
Applied Materials Inc. |
Semiconductor equipment company |
|
ARCNL |
Advanced Research Center for Nanolithography |
|
ArF |
Argon fluoride |
|
ArFi |
Argon fluoride immersion |
|
ASC |
Accounting Standards Codification |
|
ASC 606 |
Accounting Standards Codification revenue recognition |
|
ASC 740 |
Accounting Standards Codification provision for income taxes |
|
ASC 820 |
Accounting Standards Codification for fair value measurement |
|
ASML |
ASML Holding N.V. and/or any of its subsidiaries and associates |
|
ASML Preference
Shares Foundation
|
Stichting Preferente Aandelen ASML |
|
ATP throughput |
Throughput of the measured system (in wph) according to the acceptance test protocol. |
|
B |
||
Backlog |
Backlog contains accumulated sales values for all system sales orders and inflation-related
adjustments, for which written authorizations have been accepted, and not yet recorded in total
net sales.
|
|
BEPS |
Base erosion and profit shifting |
|
Big data |
Extremely large data sets that may be analyzed computationally to reveal patterns, trends and
associations.
|
|
BoM |
ASML’s Board of Management |
|
Brainport Eindhoven |
A technology region in the south of the Netherlands where companies, educational institutions,
social and governmental organizations closely collaborate.
|
|
BREEAM |
Building Research Establishment Environmental Assessment Method |
|
C |
Name |
Description |
|
CAGR |
Compound annual growth rate |
|
Canon |
Canon Kabushiki Kaisha |
|
Capex |
Capital expenditures, defined as additions in property, plant and equipment plus additions in
intangible assets plus additions in right-of-use assets (operating and finance).
|
|
Capital resources |
Financial, manufactured, intellectual, human, social and relationship, and natural elements
employed to produce goods and services.
|
|
Carl Zeiss SMT |
Carl Zeiss SMT GmbH |
|
Cash conversion rate |
An economic statistic in controlling that represents the relationship between cash flow and net
profit. (Non-GAAP measure)
|
|
CD |
Critical dimension |
|
CDP |
The Carbon Disclosure Project |
|
CEO |
Chief Executive Officer |
|
CFO |
Chief Financial Officer |
|
CHIPS and Science
Act
|
The Creating Helpful Incentives to Produce Semiconductors and Science Act of 2022 (CHIPS
Act), signed into law in August 2022, designed to boost US competitiveness, innovation and
national security.
|
|
CISO |
Chief Information Security Officer |
|
CIT |
Corporate income tax |
|
CLA |
Collective labor agreement |
|
Cleanroom |
The central part of a wafer fab where wafers are processed and the environment is carefully
controlled to eliminate dust and other contaminants.
|
|
CMOS |
Complementary metal–oxide semiconductor |
|
CO2(e)
|
Carbon dioxide (equivalent) |
|
Code |
The Dutch Corporate Governance Code |
|
Code of Conduct |
Code of ethics and conduct |
|
Collective Bargaining
Agreement (CBA)
|
A written agreement that defines the terms and conditions of employment for ASML employees
and regulates relationship between ASML, ASML employees, trade unions and duly elected
employee representatives.
|
|
|
||
Company |
ASML Holding N.V. |
|
Computational
lithography
|
The use of powerful algorithms and computer modeling of the manufacturing process to optimize
reticle patterns by intentionally deforming them to compensate for physical and chemical effects
that occur during lithography and patterning.
|
|
COO |
Chief Operations Officer |
|
COSO |
Committee of Sponsoring Organizations of the Treadway Commission |
ASML Annual Report 2025
|
344 |
Name |
Description |
|
COVID-19 |
Coronavirus disease 2019 |
|
CPP |
ASML’s Community Partnership Program |
|
CPU |
Central processing unit |
|
CRA |
Cyber Resilience Act |
|
CRMC |
Capital Research and Management Company |
|
CSDDD |
Corporate Sustainability Due Diligence Directive |
|
CSPO |
Chief Strategic Sourcing & Procurement Officer |
|
CSRD |
Corporate Sustainability Reporting Directive |
|
CTO |
Chief Technology Officer |
|
Cymer |
Cymer Inc., Cymer LLC and its subsidiaries |
|
D |
||
DDR5 |
The 5th generation of double data rate synchronous dynamic random access memory. |
|
D&E |
Development and engineering |
|
DEFRA |
A comprehensive set of GHG emission factors from the UK Government Department for
Environment, Food & Rural Affairs, Department for Energy Security and Net Zero and Department
for Business, Energy & Industrial Strategy.
|
|
Deloitte |
Deloitte Accountants B.V. |
|
DRAM |
Dynamic random-access memory |
|
DUV |
A lithography technology that uses deep ultraviolet (DUV) light. |
|
E |
||
E-beam |
Electron beam |
|
EBIT |
Earnings before interest and taxes |
|
EBIT Margin % |
Income from operations as percentage of total net sales (Non-GAAP measure) |
|
ECP |
Euro Commercial Paper |
|
EGM |
Extraordinary General Meeting |
|
EHS |
Environment, health & safety |
|
EHS Competence
Center
|
A group within ASML that defines EHS standards, gathers best practices and helps managers
implement them.
|
|
EMEA |
Europe, the Middle East and Africa |
|
Employee |
Those individuals in an employment relationship with ASML according to national law or practice.
Employees in terms of ESRS reporting comprise total payroll employees for financial statement
reporting.
|
|
|
||
Name |
Description |
|
Employee turnover |
Employees who leave ASML voluntarily or due to dismissal, retirement or death in service,
thereby excluding termination by way of reaching the end of agreed contact duration.
|
|
|
||
EMS |
Environmental management system |
|
EoL |
End of life |
|
EPE |
Edge placement error |
|
EPS |
Earnings per share |
|
ERM |
Enterprise risk management |
|
ERP |
Enterprise resource planning |
|
eScan |
ASML’s e-beam wafer inspection system family for targeted in-line defect detection. |
|
ESG |
Environmental, social and governance |
|
ESRS |
European Sustainability Reporting Standards |
|
ETR |
Effective tax rate |
|
EU |
European Union |
|
EU-IFRS |
International Financial Reporting Standards, a set of accounting rules issued by the International
Accounting Standards Board, adopted by the European Union.
|
|
Euribor |
Euro Interbank Offered Rate |
|
Eurobond |
A bond denominated in euros |
|
Euroclear Nederland |
The Dutch Central Securities Depository (Nederlands Centraal Instituut voor Giraal
Effectenverkeer B.V.).
|
|
Euronext Amsterdam |
Euronext Amsterdam N.V. |
|
European Chips Act |
A law of the European Union adopted in September 2023, designed to strengthen the EU’s
semiconductor ecosystem through innovation and capacity building, increased supply chain
resilience and coordinated monitoring.
|
|
EUV |
A lithography technology that uses extreme ultraviolet (EUV) light with a wavelength of 13.5 nm –
this is the cutting-edge of lithography and provides the highest resolution possible.
|
|
EV |
Electric vehicle |
|
EVP |
Executive Vice President |
|
Exchange Act |
US Securities Exchange Act of 1934 |
|
EXE |
ASML’s second TWINSCAN platform for EUV lithography, also referred to as EUV 0.55 NA or
High NA EUV.
|
|
F |
ASML Annual Report 2025
|
345 |
Name |
Description |
|
Fab |
Semiconductor fabrication plant |
|
FAQ |
Frequently asked questions |
|
Fast shipment |
A fast shipment process skips some of the testing in our factory and provides our customers with
earlier access to wafer output capacity. When customer acceptance at FAT is not proven, this
leads to a deferral of revenue recognition until SAT.
|
|
FAT |
Factory acceptance test |
|
Feature |
The elements that make up the pattern for a given layer of a microchip. |
|
Fitch |
A leading provider of credit ratings, commentary and research for global capital markets. |
|
Flash |
A type of non-volatile memory used for storing and transferring information. |
|
Foundry |
A contract manufacturer of logic chips. |
|
Fraunhofer |
Applied research organization in Germany |
|
Free cash flow |
Defined as net cash provided by operating activities minus purchase of property, plant and
equipment and purchase of intangible assets. (Non-GAAP measure).
|
|
FTE |
Full-time equivalent |
|
G |
||
G-SEED |
Green Standard for Energy and Environmental Design (South Korea) |
|
GAAP |
Generally accepted accounting principles |
|
GDP |
Gross domestic product |
|
Gemba Walk |
The Gemba Walk is an opportunity for staff to stand back from their day-to-day tasks to walk the
floor of their workplace to identify wasteful activities.
|
|
GHG |
Greenhouse gas |
|
GHG neutrality |
We define GHG neutrality for scope 1, 2 and categories 6 and 7 (our own activities) as having our
remaining emissions, after ASML’s efforts to reach our GHG emission reduction targets,
compensated for by the same amount of tonnes (metric tons) of carbon credits that are verified
against recognized quality standards.
|
|
GPU |
Graphics processing unit |
|
H |
||
High-bandwidth
Memory
|
Type of computer memory designed to provide both high-bandwidth and low-power
consumption.
|
|
HMI |
The brand name for ASML’s range of electron beam (e-beam) wafer inspection and metrology
systems.
|
|
Holistic lithography |
Our approach to optimizing the entire microchip printing process and enabling affordable scaling
in chip technology by integrating lithography systems with computational modeling and wafer
metrology and inspection solutions to analyze and control the manufacturing process in real time.
|
Name |
Description |
|
Horizon Europe
Program
|
A public-private partnership that facilitates collaboration and strengthens the impact of research
and innovation in developing, supporting and implementing EU policies while tackling global
challenges.
|
|
HR&O |
Human Resources and Organization |
|
HTPCW |
High-temperature process cooling water |
|
I |
||
IC |
Integrated circuit |
|
ICT |
Information and communication technology |
|
IDM |
Integrated device manufacturer |
|
IEA |
International Energy Agency |
|
IFRS |
International financial reporting standards |
|
i-line |
Light with a wavelength of 365 nm, generated by mercury vapor lamps and used in some
lithography systems.
|
|
ILO |
International Labor Organization |
|
ILP |
Inclusive Leadership program |
|
Imaging |
The transfer of a pattern onto the photoresist on a wafer using light. |
|
imec |
Interuniversitair Micro-Elektronica Centrum |
|
Immersion lithography |
A lithography technique that uses a pool of ultrapure water between the lens and the wafer to
increase the lens’s numerical aperture (ability to collect and focus light). This improves both the
resolution and depth of focus for the lithography system.
|
|
Inclusion |
Creating a safe and trusting environment where everyone feels empowered to speak up and
make a difference and feels accepted for who they are and what they bring to the table.
|
|
I&D |
Inclusion and diversity |
|
Inclusion score |
The overall score related to the questions included in the employment engagement survey that
specifically relate to ‘inclusion’.
|
|
Industrial site |
Industrial buildings and offices combined at one location |
|
Intel |
Intel Corporation |
|
Internal Control –
Integrated Framework
2013
|
Criteria issued by the Committee of Sponsoring Organizations of the Treadway Commission |
|
Internet of Things (IoT) |
A network of physical objects embedded with sensors, actuators, electronics and software that
allow the objects to collect and exchange data.
|
|
IP |
Intellectual property |
|
IPCC |
Intergovernmental Panel on Climate Change |
ASML Annual Report 2025
|
346 |
Name |
Description |
|
IPR |
Intellectual property rights |
|
IRA |
Inflation Reduction Act of 2022 |
|
I-REC |
International renewable energy certificate |
|
IRS |
Internal Revenue Service of the United States |
|
ISO |
International Organization for Standardization |
|
ITM |
Integrated Talent Management |
|
J |
||
JG13+ |
Job grade 13 and higher |
|
JP Morgan Chase |
US-based holder of our New York share register |
|
K |
||
KLA-Tencor |
KLA-Tencor Corporation |
|
KPI |
Key performance indicator |
|
KPMG |
KPMG Accountants N.V. |
|
KrF |
Krypton fluoride |
|
kt |
Kilotonne or 1,000 tonnes (1 tonne = unit of mass equal to 1,000 kilograms) |
|
kWh |
Kilowatt-hour |
|
L |
||
LED |
Light-emitting diode |
|
LEED |
Leadership in Energy and Environmental Design |
|
LEP |
Lifetime Extension Package |
|
LGBTQIA+ |
Lesbian, gay, bisexual, transgender, queer, intersex, asexual and other identities |
|
Lithography |
Lithography, or photolithography, is the process in microchip manufacturing that uses light to
pattern parts on a silicon wafer.
|
|
Logic |
Integrated devices such as microprocessors, microcontrollers and graphics processing units.
Also refers to companies that manufacture such devices.
|
|
LTI |
Long-term incentive |
|
Living wage |
A wage that provides for the satisfaction of the needs of the employee and his/her family in the
light of national economic and social conditions.
|
|
M |
Name |
Description |
|
Management Report |
The sections Strategic report, Corporate governance, Supervisory Board report and Sustainability
statements together form the Management Report.
|
|
Memory |
Microchips, such as NAND Flash and DRAM, that store information. Also refers to companies
that manufacture such chips.
|
|
Metalektro |
Multi-employer union plan is managed by PME (Stichting Pensioenfonds van de Metalektro). |
|
Metrology |
The science of measurement on pattern quality before and during high-volume chip
manufacturing.
|
|
Minimum wage |
A national or sub-national lowest wage level established by legislation or collective bargaining. |
|
|
||
Mistral AI |
Mistral AI SAS |
|
mm |
Millimeter (one thousandth of a meter) |
|
MNP |
Make Next Platform |
|
Moody’s |
An American credit rating agency that provides corporate ratings. |
|
Moore’s Law |
The notion that the number of components on an integrated circuit doubles roughly every two
years.
|
|
Mt |
Megatonne, a metric unit equivalent to 1 million (106) tonnes, or 1 billion (109) kilograms
|
|
MW |
Megawatt, a metric unit equivalent to one million (106) watt
|
|
N |
||
N1-conversion |
A category of ‘non-employee’ in temporary role (maximum of 12 months) through placement
agency, to move into a ‘permanent employee’ position.
|
|
NA |
Numerical aperture |
|
NACE |
Statistical Classification of Economic Activities in the European Community |
|
NAND |
A binary logical operator that gives an output when it receives one or no input; a composite of
‘NOT AND’.
|
|
Nasdaq |
Nasdaq Stock Market LLC |
|
NEa |
Dutch Emissions Authority (Nederlandse Emissieautoriteit) |
|
Net bookings |
Net bookings include all system sales orders and inflation related adjustments, for which written
authorizations have been accepted.
|
|
Net-zero target |
Setting a net-zero target at the level of an undertaking aligned with meeting societal climate goals
means, according to the ESRS:
i. achieving a scale of value chain emissions reductions consistent with the abatement required
to reach global net-zero in 1.5˚C pathways; and
ii. neutralizing the impact of any residual emissions (after approximately 90–95% of GHG
emission reduction with the possibility for justified sectoral variations in line with a recognized
sectoral pathway) by permanently removing an equivalent volume of CO2.
|
|
|
||
NGO |
Non-governmental organization |
ASML Annual Report 2025
|
347 |
Name |
Description |
|
NIIT |
Net investment income tax |
|
Nikon |
Nikon Corporation |
|
NL |
The Netherlands |
|
nm |
Nanometer (one billionth of a meter) |
|
Node |
A stepping stone in the chipmaking industry’s roadmap for smaller features and more advanced
microchips, describes and differentiates generations of semiconductor manufacturing
technologies and the chips made with them. Nodes with ‘smaller sizes’ refer to more advanced
technologies.
|
|
Non-employees |
Includes both individual contractors supplying labor to ASML (‘self-employed people’) and
workers provided by ASML primarily engaged in ‘employment activities’ (NACE Code N78).
|
|
Non-GAAP |
A measure of a company’s historical or future financial performance, financial position or cash
flows that are not calculated or presented in accordance with the GAAP.
|
|
NPR |
Non-product-related |
|
NV |
Naamloze vennootschap, referred to as N.V. |
|
NXE |
ASML’s first TWINSCAN platform for EUV lithography with a numerical aperture of 0.33 that
provides 13 nm resolution to support advanced Logic and Memory chip production; also referred
to as EUV 0.33 NA.
|
|
NXT |
An enhanced version of the original TWINSCAN system platform offering significantly improved
overlay and productivity.
|
|
O |
||
OCI |
Other comprehensive income |
|
OECD |
Organisation for Economic Co-operation and Development |
|
OPC |
Optical proximity correction |
|
Other worker |
Individuals providing services connected to ASML operations or core activities not meeting the
definition of ‘employee’ or ‘non-employee’.
|
|
Overlay |
The layer-to-layer alignment of chip structures |
|
Own workforce |
Aggregate of ‘Employees’ and ‘Non-employees’ |
|
|
||
P |
||
PAS |
Philips Automatic Stepper – ASML’s first lithography platform that uses a single stage. |
|
Pattern fidelity |
A holistic measure of how well the desired pattern is reproduced on the wafer. |
|
Patterning |
The process of creating a pattern in a surface to build microchips. |
|
PEP |
Productivity Enhancement Package |
Name |
Description |
|
Performance and
career development
reviews
|
As part of the ASML Develop & Perform program, performance and career development reviews
refer to the annual evaluations, taking into account the employees’ performance and peer reviews
that result in a final overall rating provided by the employees’ direct superior.
|
|
Permanent employees |
Permanent employees are those individuals with long-term employment contracts with ASML
wherein there is no established termination date.
|
|
PFAS |
Perfluoroalkyl chemicals |
|
Philips |
Health technology company, headquartered in the Netherlands |
|
PHLX Semiconductor
Index
|
Philadelphia Semiconductor Sector Index |
|
PIs |
Performance indicators |
|
Piranha acid |
A highly corrosive cleaning solution composed of concentrated sulfuric acid and hydrogen
peroxide, primarily used within manufacturing to remove organic residues from wafer surfaces
after the wafer development process.
|
|
PME |
Pensioenfonds Metaelektro, a non-profit pension fund for the metal and technology sector in the
Netherlands.
|
|
PR |
Product-related |
|
Preference shares
foundation
|
Stichting Preferente Aandelen ASML |
|
Preference share
option
|
An option to acquire cumulative preference shares in our capital. |
|
PwC |
PricewaterhouseCoopers Accountants N.V. |
|
Q |
||
Q&As |
Questions and answers |
|
R |
||
R&D |
Research and development |
|
RBA |
Responsible Business Alliance |
|
REACH |
Registration, evaluation, authorization and restriction of chemicals |
|
REC |
Renewable Energy Certificate |
|
|
||
Recordable work-
related injuries
|
Work-related injury that results in any of the following: (i) death, days away from work, restricted
work or transfer to another job, medical treatment beyond first aid, or loss of consciousness; or
(ii) significant injury diagnosed by a physician or other licensed healthcare professional, even if it
does not result in death, days away from work, restricted work or job transfer, medical treatment
beyond first aid or loss of consciousness.
|
|
|
||
Remuneration Policy |
The remuneration policy applicable to the Board of Management of ASML Holding N.V. |
ASML Annual Report 2025
|
348 |
Name |
Description |
|
Reticle |
A plate containing the pattern of features to be transferred to the wafer for each exposure. |
|
RMAP |
Responsible Minerals Assurance Process |
|
RMI |
Responsible Minerals Initiative |
|
ROAIC |
Return on average invested capital (Non-GAAP measure) |
|
RoHS |
Restriction of hazardous substances |
|
rTSR |
Relative Total Shareholder Return |
|
S |
||
Standard & Poor’s |
A stock index of the United States that, due to its broad composition, gives a reliable picture of
developments in the American stock market.
|
|
SAQ |
Self-assessment questionnaire |
|
Sarbanes-Oxley Act |
The Sarbanes-Oxley Act of 2002 |
|
SAT |
Site acceptance test |
|
SB |
ASML’s Supervisory Board |
|
SBTi |
Science-Based Targets initiative |
|
SCC |
Semiconductor Climate Consortium |
|
Scope 1 CO2e
emissions
|
Direct carbon dioxide emissions from resources an organization owns or controls. |
|
Scope 2 CO2e
emissions
|
Indirect carbon dioxide emissions due to the energy an organization consumes. |
|
Scope 3 CO2e
emissions
|
All other indirect carbon dioxide emissions that occur in an organization’s value chain. |
|
Scope 3 CO2e
emissions intensity
|
All other indirect carbon dioxide emissions that occur in an organization’s value chain expressed
as a percentage of revenue or gross profit.
|
|
SEC |
The United States Securities and Exchange Commission |
|
SEMI |
Semiconductor Equipment and Materials International |
|
SEMI S2 |
SEMI S2 – Safety Guideline, Environmental, Health and Safety Guideline for Semiconductor
Manufacturing Equipment, a set of performance-based EHS considerations for semiconductor
manufacturing equipment.
|
|
SEMI S23 |
SEMI S23 – Guide for Conservation of Energy, Utilities and Materials Used by Semiconductor
Manufacturing Equipment, guidelines for collecting, analyzing and reporting energy-consuming
semiconductor manufacturing equipment utility data.
|
|
SG&A |
Selling, general and administrative expenses |
|
Shrink |
The process of developing smaller transistors for more advanced chips. |
Name |
Description |
|
Significant
employment country
|
Operating countries in which ASML has 50 or more employees representing at least 10% of its
total number of employees.
|
|
|
||
Significant
employment region
|
Operating regions in which ASML has 50 or more employees representing at least 10% of its
total number of employees.
|
|
|
||
SNEP |
System Node Extension Package |
|
SOC |
Security Operations Center |
|
Social dialogue |
Communication and exchanges between or among ASML, its organizations, representatives of
governments and workers’ representatives, on issues of common interest relating to economic
and social policy.
|
|
|
||
SS&P |
Strategic sourcing and procurement |
|
Star level |
Startups accelerated by Eindhoven Startup Alliance / HighTechXL that show a multiple of
investment of above 10 times.
|
|
STEM |
Science, technology, engineering and mathematics |
|
STI |
Short-term incentive |
|
STR |
Stichting Technology Rating, a non-profit organization |
|
T |
||
T-REC |
Taiwan Renewable Energy Certificate |
|
TCFD |
Task Force on Climate-related Financial Disclosures |
|
TDC |
Total direct compensation |
|
Technical competence |
The capabilities and spread of technical expertise among our people, and the extent to which
they are embedded in our processes and operations.
|
|
Temporary employees |
Temporary employees are those individuals with a fixed-term agreement with ASML wherein the
duration of the contract is agreed upon prior to its commencement.
|
|
Thales NL |
Dutch branch of the international Thales Group |
|
Throughput |
The number of wafers a system can process per hour |
|
Tier 1 (2, 3) supplier |
Tier 1 suppliers are direct suppliers, whereas Tier 2, 3 and beyond refer to suppliers of our
suppliers.
|
|
TJ |
Terajoule (one trillion joules) |
|
TLI |
Technology Leadership Index |
|
TNO |
Nederlandse Organisatie voor Toegepast Natuurwetenschappelijk Onderzoek (Netherlands
Organization for Applied Scientific Research)
|
ASML Annual Report 2025
|
349 |
Name |
Description |
|
Top management |
Top management within ASML has been defined as senior leadership (job grade 13) and higher
excluding the Supervisory Board.
|
|
TPRM |
Third-party risk management |
|
Training hours |
Hours of internal and external learning completed by employees and registered on ASML learning
platforms.
|
|
Transistor |
A semiconductor device that is the fundamental building block of microchips. |
|
TSMC |
Taiwan Semiconductor Manufacturing Company Ltd. |
|
TSR |
Total shareholder return |
|
TU/e |
Technische Universiteit Eindhoven |
|
TWINSCAN |
ASML’s unique lithography system platform, with two complete wafer stages to allow one wafer
to be mapped while another is being exposed, thereby enabling higher accuracy and throughput.
|
|
U |
||
UNGP |
United Nations Guiding Principles on Business and Human Rights |
|
US |
United States |
|
US GAAP |
Generally accepted accounting principles in the United States of America |
|
US Tax Treaty |
The treaty between the US and the Netherlands for the Avoidance of Double Taxation and the
Prevention of Fiscal Evasion with Respect to Taxes on Income.
|
|
V |
||
Vanderlande |
A material handling and logistics automation company based in the Netherlands. |
|
VAT |
Value-added tax |
|
VCP |
Virtual computing platform |
|
VER(s) |
Voluntary emission reduction (certificates) |
|
VIE |
Variable interest entity |
|
VNO-NCW |
The Confederation of Netherlands Industry and Employers |
|
VPA |
Volume purchase agreement |
|
W |
||
WACC |
Weighted average cost of capital |
|
Wafer inspection |
The process of locating and analyzing individual chip defects on a wafer. |
|
Wafer metrology |
The process of measuring the quality of patterns on a wafer. |
|
Waste intensity |
The total waste in millions of kilograms (excluding construction and demolition waste) divided by
revenue (in millions of euros).
|
Name |
Description |
|
Wavelength |
The distance between two peaks of a wave such as light. The shorter the wavelength of light
used in a lithography system, the smaller the features the system can resolve.
|
|
Website |
www.asml.com |
|
Works Council |
Works Council of ASML Netherlands B.V. |
|
wph |
Wafers per hour |
|
WSTS |
World Semiconductor Trade Statistics |
|
X |
||
XT |
ASML’s second TWINSCAN platform for DUV lithography, with two complete wafer stages to
allow one wafer to be mapped while another is being exposed, thereby enabling higher accuracy
and throughput.
|
|
Y |
||
YieldStar |
ASML’s optical diffraction-based wafer metrology platform. |
ASML Annual Report 2025
|
350 |
ASML Annual Report 2025
|
351 |
Exhibit No. |
Description |
|
1.1 |
Articles of Association of ASML Holding N.V. (English translation) (dated May 12, 2022) (Incorporated by
reference to the Registrant’s Annual Report on Form 20-F for the year ended December 31, 2023)
|
|
2.1 |
||
4.1 |
||
4.2 |
||
4.3 |
||
4.4 |
||
4.5 |
||
4.6 |
||
4.7 |
10.14 and 10.15, Carl Zeiss AG (Incorporated by reference to the Registrant’s Annual Report on Form 20-F
for the year ended December 31, 2019)3
|
|
4.8 |
||
8.1 |
||
12.1 |
||
13.1 |
Exhibit No. |
Description |
|
15.1 |
||
15.2 |
||
19.1 |
ASML Insider Trading Rules (incorporated by reference to the Registrant’s Annual Report on Form 20-F for
the year ended December 31, 2023) |
|
97.1 |
Clawback Policy (incorporated by reference to the Registrant’s Annual Report on Form 20-F for the year
ended December 31, 2023)
|
|
101.INS |
XBRL Instance Document2
|
|
101.SCH |
XBRL Taxonomy Extension Schema Document2
|
|
101.CAL |
XBRL Taxonomy Extension Calculation Linkbase Document2
|
|
101.DEF |
XBRL Taxonomy Extension Definition Linkbase Document2
|
|
101.LAB |
XBRL Taxonomy Extension Label Linkbase Document2
|
|
101.PRE |
XBRL Taxonomy Extension Presentation Linkbase Document2
|
|
104 |
Cover Page Interactive Data File (formatted as inline XBRL and contained in Exhibit 101)2
|
| Title of Each Class | Trading Symbol | Name of Each Exchange on Which Registered | ||||||
Ordinary Shares |
ASML |
The Nasdaq Stock Market LLC |
||||||
(Nominal value €0.09 per share) |
||||||||
| Type of shares | Amount of shares | Nominal value | Votes per share | ||||||||
| Cumulative preference shares | 700,000,000 | €0.09 per share | 1 | ||||||||
| Ordinary shares | 700,000,000 | €0.09 per share | 1 | ||||||||
| As of December 31 | 2023 | 2024 | 2025 | ||||||||
| Issued ordinary shares with nominal value of €0.09 | 393,421,721 | 393,283,720 | 385,417,665 | ||||||||
| Issued ordinary treasury shares with nominal value of €0.09 | 6,162,857 | 546,972 | 2,730,009 | ||||||||
| Total issued ordinary shares with nominal value of €0.09 | 399,584,578 | 393,830,692 | 388,147,674 | ||||||||
| Quorum | ASML does not follow Nasdaq’s quorum requirements applicable to meetings of ordinary shareholders. In accordance with Dutch law and generally accepted Dutch business practice, ASML’s Articles of Association provide that there are no quorum requirements generally applicable to general meetings of shareholders. | ||||
| Solicitation of proxies | ASML does not follow Nasdaq’s requirements regarding the solicitation of proxies and the provision of proxy statements for general meetings of shareholders. ASML does furnish proxy statements and solicit proxies for the General Meeting. Dutch corporate law sets a mandatory (participation and voting) record date for Dutch listed companies at the 28th day prior to the date of the General Meeting. Shareholders registered at such a record date are entitled to attend and exercise their rights as shareholders at the General Meeting, regardless of a sale of shares after the record date. | ||||
| Distribution of Annual Report | ASML does not follow Nasdaq’s requirement regarding distribution to shareholders of copies of an annual report containing audited Financial statements prior to our AGM. The distribution of our annual reports to shareholders is not required under Dutch corporate law or Dutch securities laws, or by Euronext Amsterdam. Furthermore, it is generally accepted business practice for Dutch companies not to distribute annual reports. In part, this is because the Dutch system of bearer shares has made it impractical to keep a current list of holders of the bearer shares in order to distribute the annual reports. Instead, we make our Annual Report available at our corporate head office in the Netherlands (and at the offices of our Dutch listing agent, as stated in the convening notice for the meeting) no later than 42 days prior to convocation of the AGM. In addition, we post a copy of our annual reports on our website prior to the AGM. | ||||
| Equity compensation arrangements | ASML does not follow Nasdaq’s requirement to obtain shareholder approval of stock option or purchase plans or other equity compensation arrangements available to officers, directors or employees. It is not required under Dutch law or generally accepted practice for Dutch companies to obtain shareholder approval of equity compensation arrangements available to officers, directors or employees. The General Meeting adopts the Remuneration Policy for the Board of Management, approves equity compensation arrangements for the Board of Management and approves the remuneration for the Supervisory Board. Equity compensation arrangements for employees are adopted by the Board of Management within limits approved by the General Meeting. The Remuneration Committee evaluates the achievements of individual members of the Board of Management with respect to the short- and long-term quantitative performance, and the full Supervisory Board evaluates the quantitative performance criteria. | ||||
| Legal Entity | Jurisdiction of Incorporation | ||||
Subsidiaries of ASML Holding N.V.1:
|
|||||
| ASML Belgium B.V. | Belgium (Antwerp) | ||||
| Hermes Microvision Co., Ltd. (Beijing) | China (Beijing) | ||||
| ASML (Shanghai) Electrical Equipment Co. Ltd. | China (Shanghai) | ||||
| ASML (Beijing) Equipment Repair Company Limited | China (Beijing) | ||||
| ASML (Shanghai) Lithography Facilities Science and Technology Co. Ltd. | China (Shanghai) | ||||
| Cymer Semiconductor Equipment (Shanghai) Co. Ltd. | China (Shanghai) | ||||
| Brion Technologies (Shenzhen) Co. Ltd. | China (Shenzhen) | ||||
| ASML France S.a.r.l. | France (Crolles) | ||||
| ASML Verwaltungs GmbH i.l. | Germany (Berlin) | ||||
| ASML Berlin GmbH (formerly Berliner Glas GmbH) | Germany (Berlin) | ||||
| ASML Germany GmbH | Germany (Dresden) | ||||
| ASML Participations Germany GmbH | Germany (Dresden) | ||||
| ASML Hong Kong Ltd. (in Members’ Voluntary Liquidation) | Hong Kong SAR | ||||
| ASML Ireland Ltd. | Ireland (Dublin) | ||||
| ASML Israel (2001) Ltd. | Israel (Kiryat Gat) | ||||
| ASML Italy S.r.l. | Italy (Avezzano) | ||||
| ASML Japan Co. Ltd. | Japan (Tokyo) | ||||
| Cymer Japan, Inc. | Japan (Tokyo) | ||||
| ASML Equipment Malaysia Sdn. Bhd. | Malaysia (Georgetown, Pulau Pinang) | ||||
| Cymer B.V. | Netherlands (Veldhoven) | ||||
| ASML Netherlands B.V. | Netherlands (Veldhoven) | ||||
| ASML Trading B.V. | Netherlands (Veldhoven) | ||||
| Hermes Microvision Incorporated B.V. | Netherlands (Veldhoven) | ||||
| ASML Singapore Pte. Ltd. | Singapore | ||||
| Cymer Singapore Pte Ltd. | Singapore | ||||
| ASML Korea Co. Ltd. | South Korea (Gyeonggi-Do) | ||||
| ASML Repair Center Korea Ltd. | South Korea (Gyeonggi-Do) | ||||
| Cymer Korea Inc. | South Korea (Gyeonggi-Do) | ||||
| ASML Taiwan Ltd. | Taiwan (Hsinchu City) | ||||
| ASML Technology Taiwan Ltd. | Taiwan (Hsinchu City) | ||||
| Cymer Southeast Asia Ltd. | Taiwan (Hsinchu City) | ||||
| ASML (UK) Ltd. | UK (Edinburgh (Scotland)) | ||||
| Cymer, LLC | US (Carson City, Nevada) | ||||
| EO Technical Solutions LLC | US (Vancouver, Washington) | ||||
| ASML US, LLC | US (Wilmington, Delaware) | ||||
| ASML US, LP | US (Wilmington, Delaware) | ||||
Associates of ASML Holding N.V.2:
|
|||||
| Carl Zeiss SMT Holding GmbH & Co. KG (24.9%) | Germany (Oberkochen) | ||||
| HighTechXL Group B.V. (31.97%) | Netherlands (Eindhoven) | ||||


