Earnings Conference Call 1Q25

Disclaimer 2 This presentation contains what are considered “forward-looking statements,” as defined in Section 27A of the 1933 Securities Act and Section 21E of the 1934 Securities Exchange Act, as amended. Some of these forward-looking statements are identified with words such as “believe,” “may,” “could,” “would,” “possible,” “will,” “should,” “expect,” “intend,” “plan,” “anticipate,” “estimate,” “potential,” “outlook” or “continue,” as well as the negative forms of these words, other terms of similar meaning or the use of future dates. The forward-looking statements include, without limitation, statements related to the declaration or payment of dividends, implementation of the key operational and financial strategies and investment plans, guidance about future operations and factors or trends that influence the financial situation, liquidity or operational results. Such statements reflect the current view of the management and are subject to diverse risks and uncertainties. These are qualified in accordance with the inherent risks and uncertainties involving future expectations in general, and actual results could differ materially from those currently anticipated due to various risks and uncertainties. There is no guarantee that the expected events, trends or results will actually occur. The statements are based on diverse assumptions and factors, including general economic and market conditions, industry conditions and operating factors. Any changes in such assumptions or factors could cause actual results to differ materially from current expectations. Suzano does not undertake any obligation to update any such forward-looking statements as a result of new information, future events or otherwise, except as expressly required by law. All forward-looking statements in this presentation are covered in their entirety by this disclaimer. In addition, this presentation contains some financial indicators that are not recognized by the BR GAAP or IFRS. These indicators do not have a standard meaning and may not be comparable to indicators with a similar description used by other companies. We provide these indicators because we use them as measurements of Suzano's performance; they should not be considered separately or as a replacement for other financial metrics that have been disclosed in accordance with BR GAAP or IFRS.

3 Adjusted EBITDA: Liquidity3 : 2.7 million tons (vs. 3.3 million tons 4Q24 and 2.4 million tons 1Q24) Pulp: 329 thousand tons (vs. 367 thousand tons 4Q24 and 256 thousand tons 1Q24) Paper and packaging1: Pulp Inventory: Normalized operational level Operating Cash Generation2: Cash cost ex-downtimes: R$4.9 billion (vs. R$6.5 billion 4Q24 and R$4.6 billion 1Q24) R$2.6 billion (vs. R$4.8 billion 4Q24 and R$2.5 billion 1Q24) R$859/ton (vs. R$807/ton 4Q24 and R$812/ton 1Q24) US$12.9 billion (vs. US$12.8 billion 4Q24 and US$11.9 billion 1Q24) Leverage4 : US$5.0 billion (vs. US$5.7 billion 4Q24 and US$6.3 billion 1Q24) Net debt: 3.0x in US$ (vs. 2.9x in 4Q24 and 3.5x in 1Q24) Sales Volume Financial Management Operating Performance 1 Excluding Consumer Goods. | 2 Operating Cash Generation = Adjusted EBITDA less Sustaining Capex. | 3 Considers Finnvera credit line. | 4 Net Debt / Adjusted EBITDA in the last twelve months. HIGHLIGHTS Heavy maintenance schedule and inventory rebuild limited pulp volumes. Well prepared to navigate the cycle.

2,199 2,102 1,666 468 634 430 468 560 406 5,994 5,715 5,980 6,215 769 349 144 1,262 Paper Sales¹ (‘000 ton) Average Net Price ($/ton) 1Q24 4Q24 1Q25 152 230 161 103 82 79 55 89256 367 329 1Q24 4Q24 1Q25 LTM 1Q25 Brazilian operations (domestic) 4 Paper Adjusted EBITDA and EBITDA Margin² R$ MM Consolidated (R$/ton) EBITDA Margin (%) 1 Excluding Consumer Goods. ² Excluding impact of Mgmt. LTI; 1Q24: -R$49/ton; 4Q24: - R$39/ton; 1Q25: -R$44/ton; LTM 1Q25: - R$27/ton 1Q24 4Q24 1,832 2,029 1,790 (1,339) (272) 32% 25% 1Q25 18% 27% LTM 1Q25 LTM 1Q25 PAPER AND PACKAGING BUSINESS Higher prices in Brazil and US operations – which is approaching breakeven. EBITDA mainly pressured by maintenance downtime costs at Mucuri unit. US operations Brazilian operations (R$/ton) R$ MM (73) Brazilian operations (exports) (24) (97) 1,271 1,460 1,387 US operations (US$/ton) Brazilian operations R$/ton R$/ton US operations

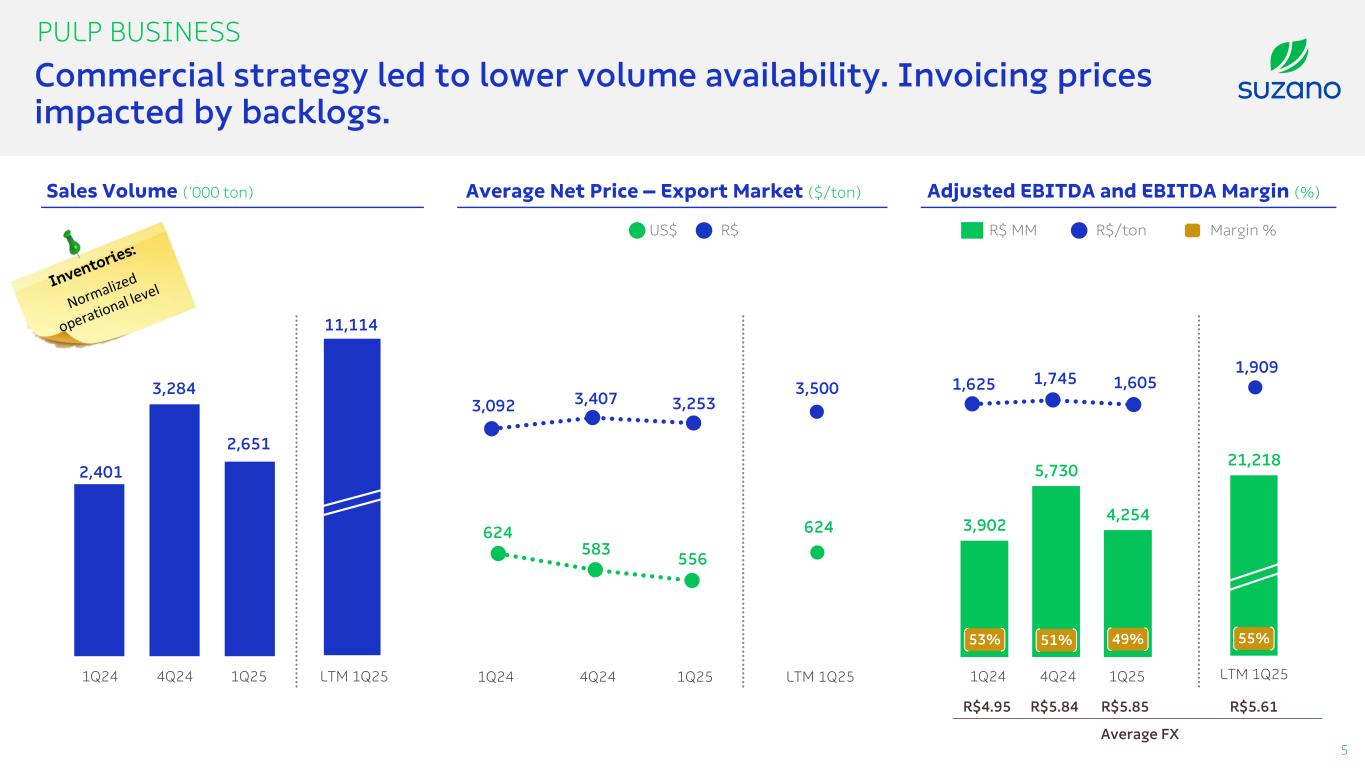
624 583 556 3,500 Average FX 3,902 5,730 4,254 624 2,401 3,284 2,651 PULP BUSINESS Sales Volume (‘000 ton) 1Q24 4Q24 1Q25 11,114 LTM 1Q25 Average Net Price – Export Market ($/ton) Adjusted EBITDA and EBITDA Margin (%) 21,218 1Q24 4Q24 1Q25 R$4.95 R$5.84 R$5.85 Commercial strategy led to lower volume availability. Invoicing prices impacted by backlogs. 5 1,625 1,745 1,605 R$ MM R$/ton Margin % 3,092 3,407 3,253 US$ R$ 53% 51% 49% 55% R$5.61 1,909 1Q24 4Q24 1Q25 LTM 1Q25 LTM 1Q25

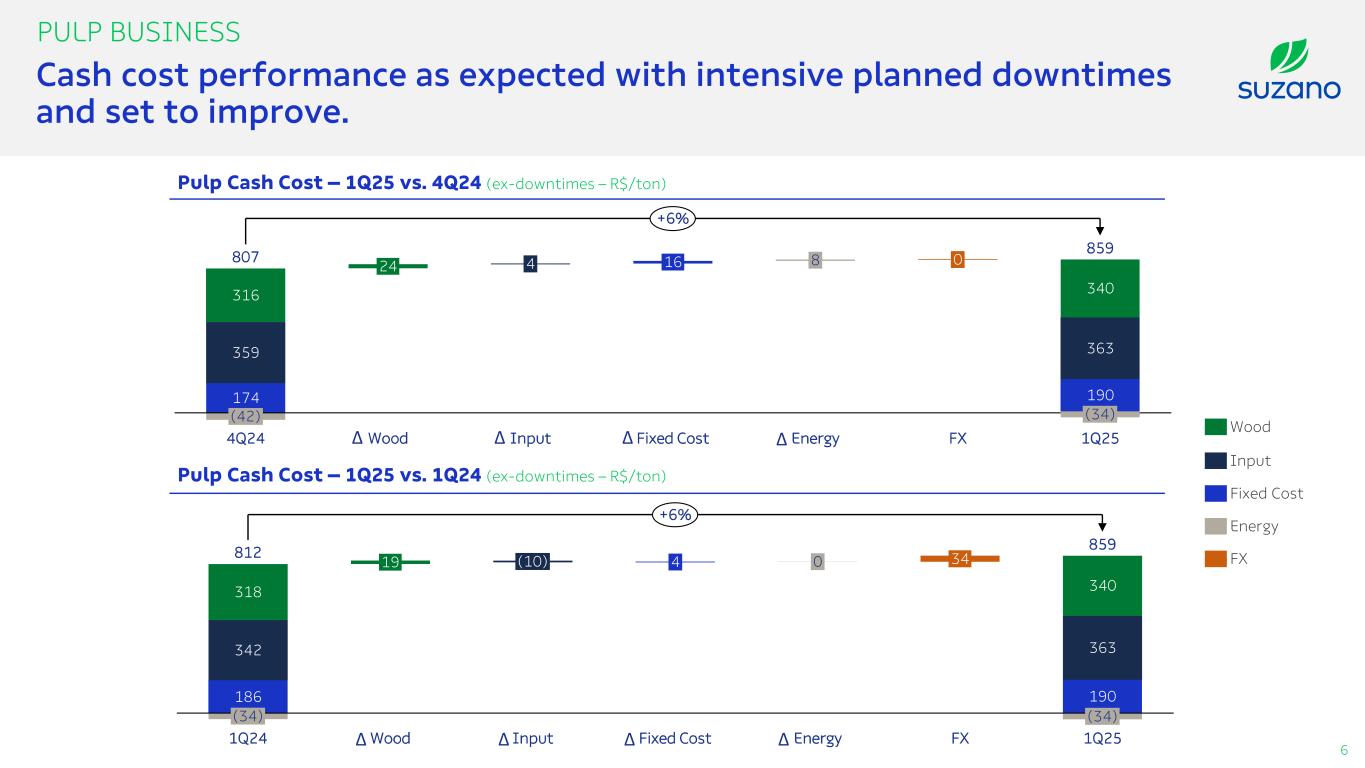
186 342 363 318 340 (34) 1Q24 19 Wood (10) Input 4 Fixed Cost 0 Energy 34 FX 190 (34) 1Q25 812 859 +6% 174 359 190 316 363 340 (42) 4Q24 24 Wood 4 Input 16 Fixed Cost 8 Energy 0 FX (34) 1Q25 807 859 +6% PULP BUSINESS Pulp Cash Cost – 1Q25 vs. 4Q24 (ex-downtimes – R$/ton) Pulp Cash Cost – 1Q25 vs. 1Q24 (ex-downtimes – R$/ton) 6 Cash cost performance as expected with intensive planned downtimes and set to improve. Δ Δ Δ Δ Δ Δ Δ Δ Wood Input Fixed Cost Energy FX

2.9 0.6 0.8 1.6 1.6 2.5 7.51.3 0.5 0.7 0.8 5.0 3.0 8.2 (12.8) Net Debt Dec. 2024 0.5 Capital for Allocation¹ (0.2) Capex ex-maintenance (12.5) Pro-forma Mar. 2025 (0.4) Share buyback and Interest on Equity (12.9) Net Debt Mar. 2025 3.6 3.3 3.13.5 2.9 3.0 Net Debt (US$ billion) 7 Dec/24Mar/24 Mar/25 1 Adjusted EBITDA (-) maintenance capex, (+/-) working capital, (-) accrued net interest, (-) income taxes, among others. | 2Finnvera credit lines. | 3Considers the portion of debt with currency swaps for foreign currency. Stand-by facilities Leverage (Net debt/EBITDA LTM) Liquidity 9M25 2026 2027 2028 2030 onwards 2029 Finnvera2 FINANCIAL MANAGEMENT 29% 82% 82% 68% 75% 67% In R$ In US$ Average Cost (in US$): 5.0% p.a. Average Term: 76 months Amortization Schedule (US$ billion) Cash on hand (59% in US$) % of debt in fixed rate (US$)3 Net debt and leverage uptick due to discretionary IoE payment. Management keeps focus on deleveraging. Liability Management: US$1.2 bn @ SOFR + 1.45% p.a

5.44 6.28 71% FX gap coverage Notional @ Mar/25: US$7.3 billion Current portfolio – ZCC Cash Flow Hedging FX volatility in the period enabled better hedging strikes. FINANCIAL MANAGEMENT (R$)Financial Results - 1Q25 (R$ billion) -1.1 5.7 3.1 -0.0 0.1 7.7 0.4 Effects related to cash flow hedge Net interest over debt ∆ FX on debt in US$ ∆ MtM of debt hedges ∆ MtM of cash flow hedges Effects related to debt management Others1-0.5 1 Includes: other financial income and expenses, capitalized interests, other foreign exchange variations and other hedges (commodities and embedded) Cash adjustments of debt hedges Cash adjustments of cash flow hedges Put / Call 5.36 6.16 4Q24 1Q25

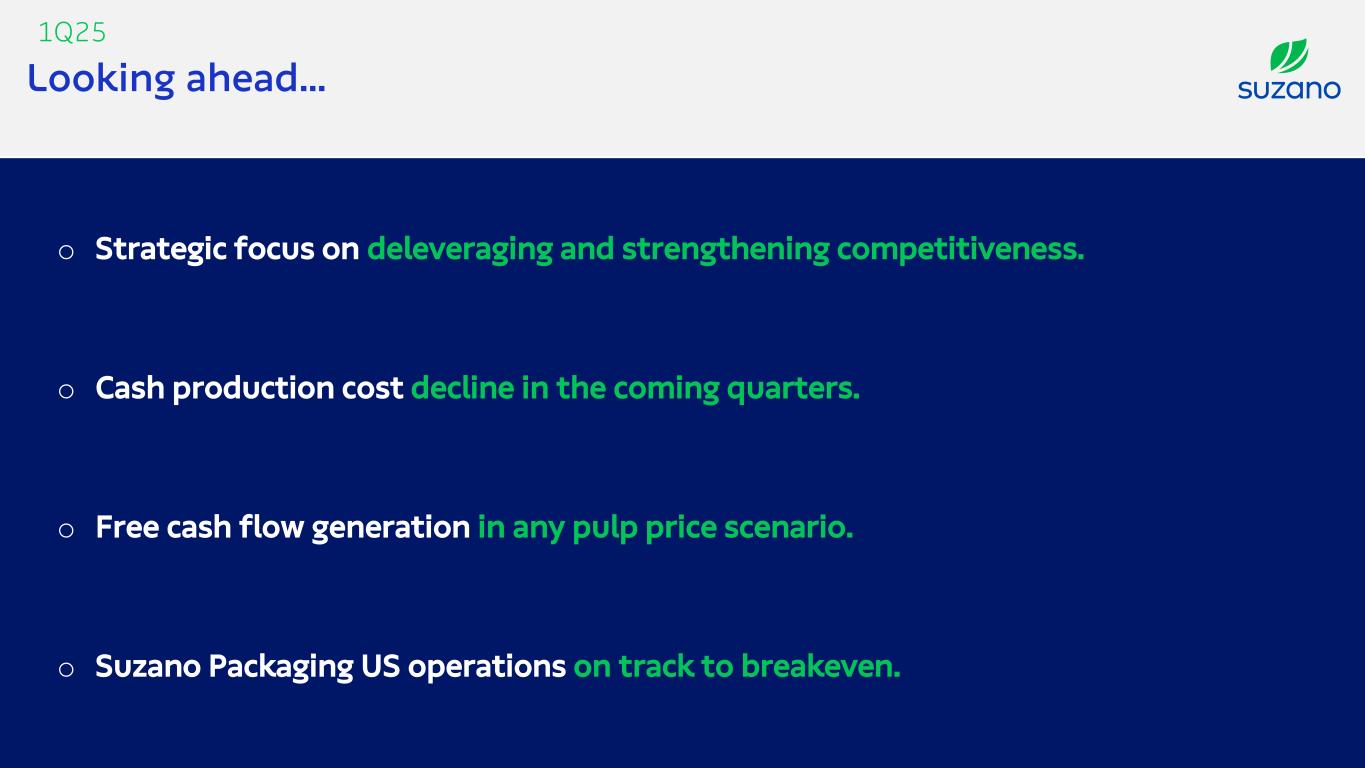
Looking ahead… o Cash production cost decline in the coming quarters. o Free cash flow generation in any pulp price scenario. o Suzano Packaging US operations on track to breakeven. o Strategic focus on deleveraging and strengthening competitiveness. 1Q25

Q&A 1Q25 Investor Relations ir.suzano.com.br ri@suzano.com.br


