Document
Stratasys Releases First Quarter 2025 Financial Results
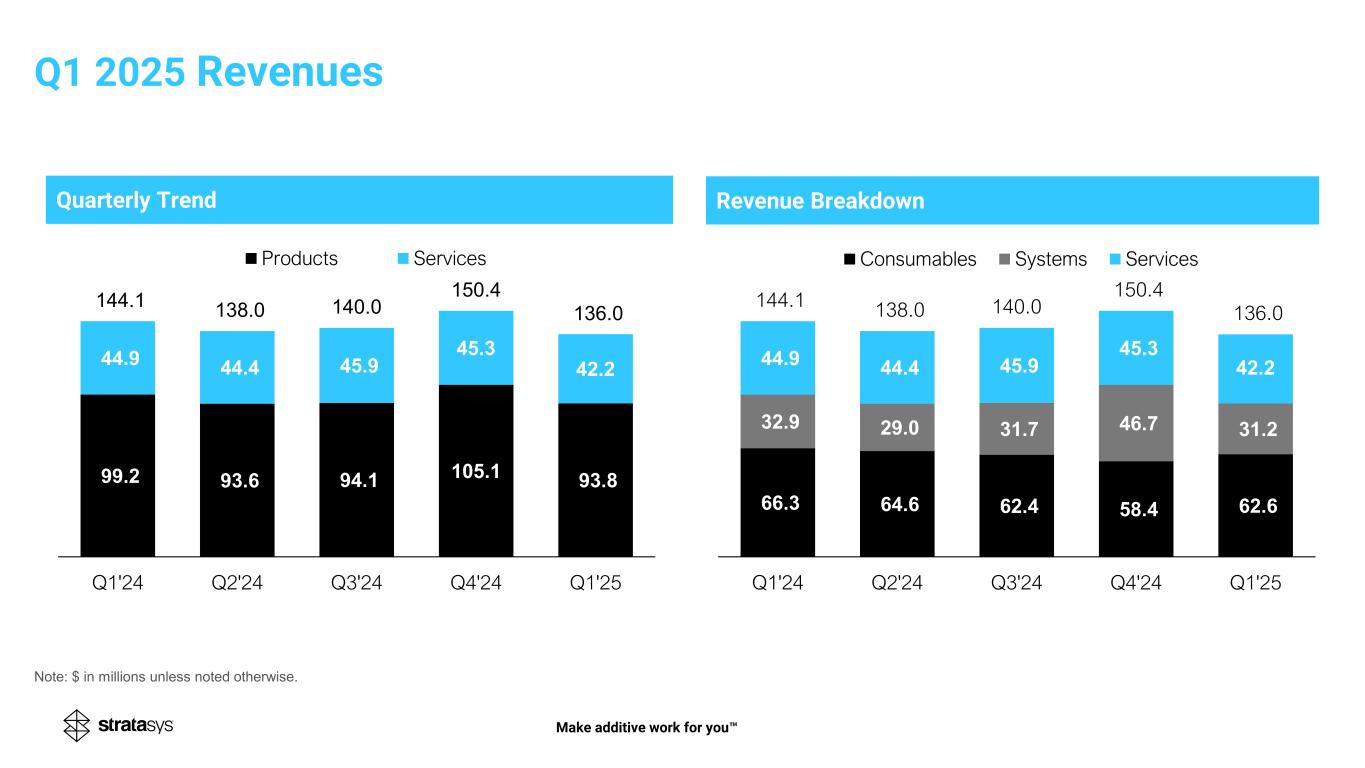
•Revenue of $136.0 million, compared to $144.1 million in the prior year period
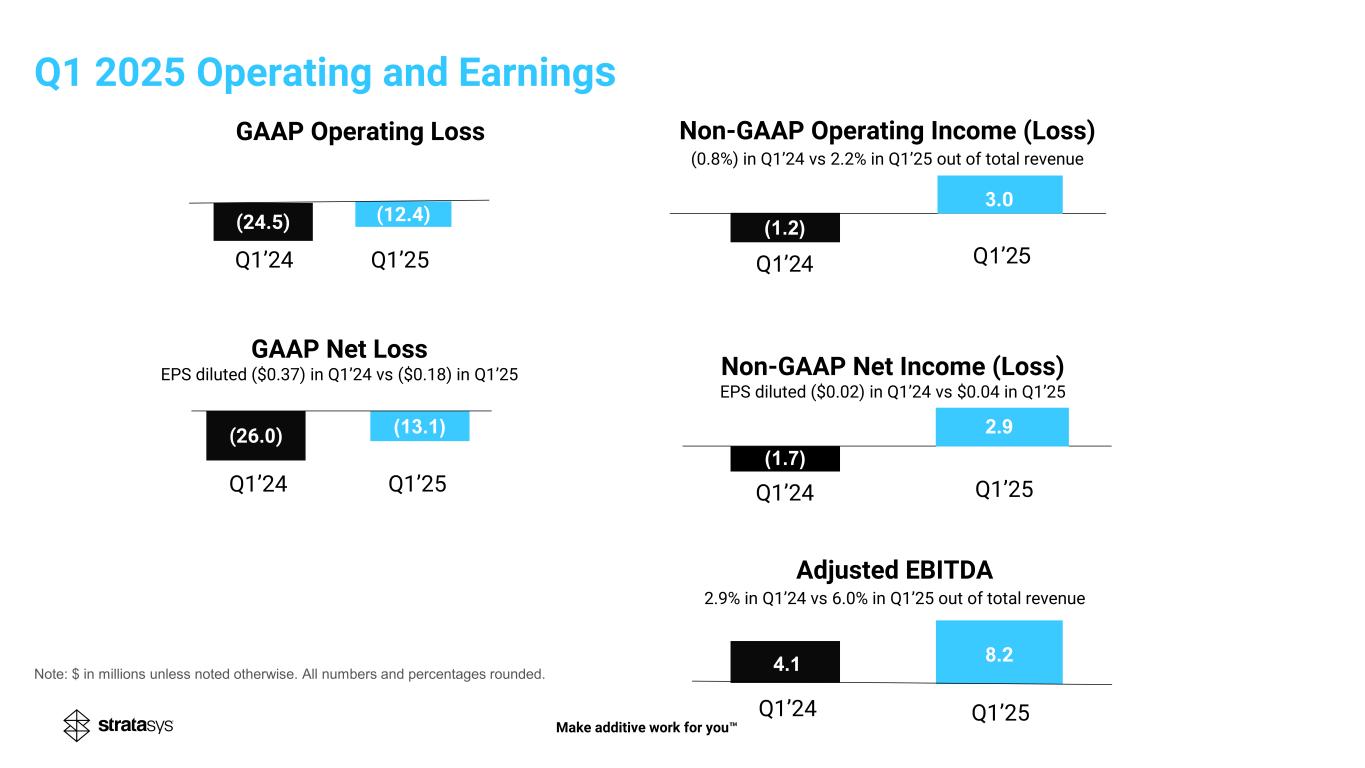
•GAAP net loss of $13.1 million, or $0.18 per diluted share, and non-GAAP net income of $2.9 million, or $0.04 per diluted share
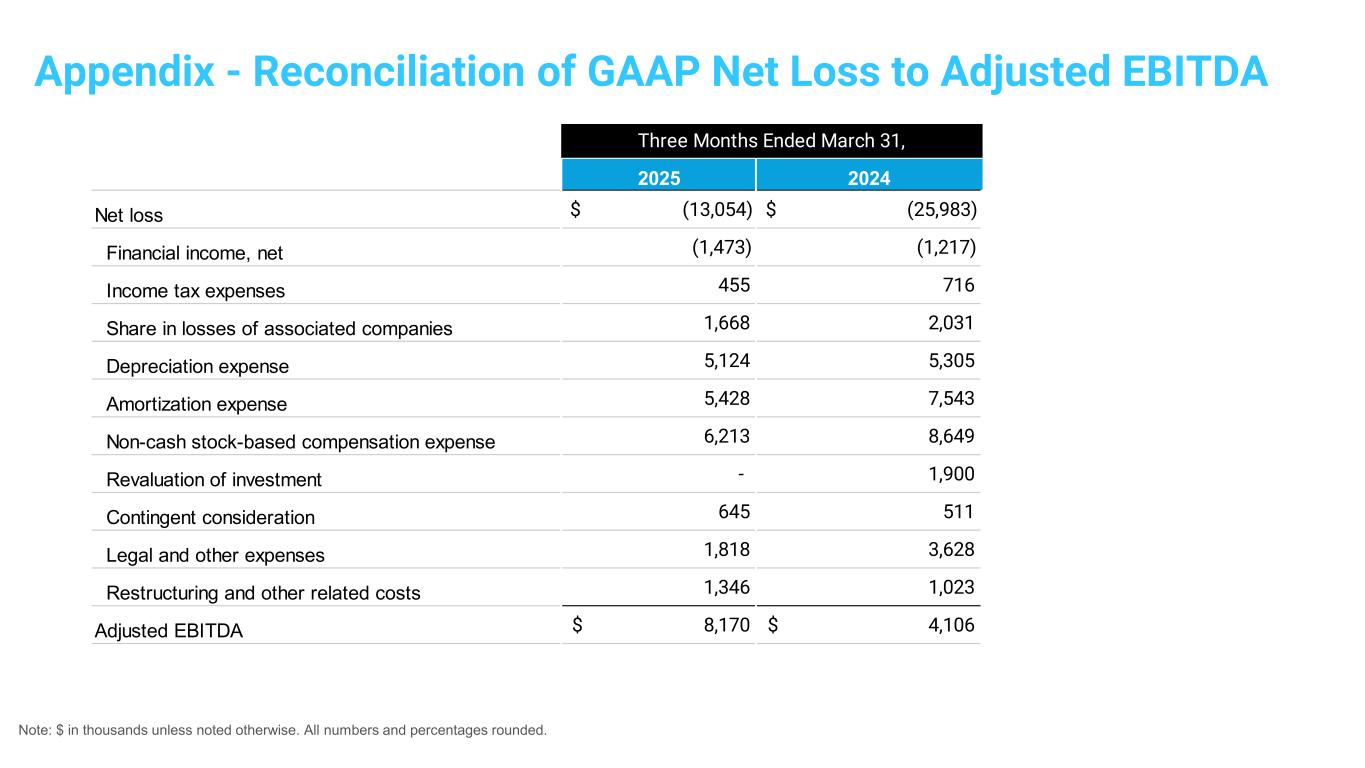
•Adjusted EBITDA of $8.2 million, compared to $4.1 million in the prior year period
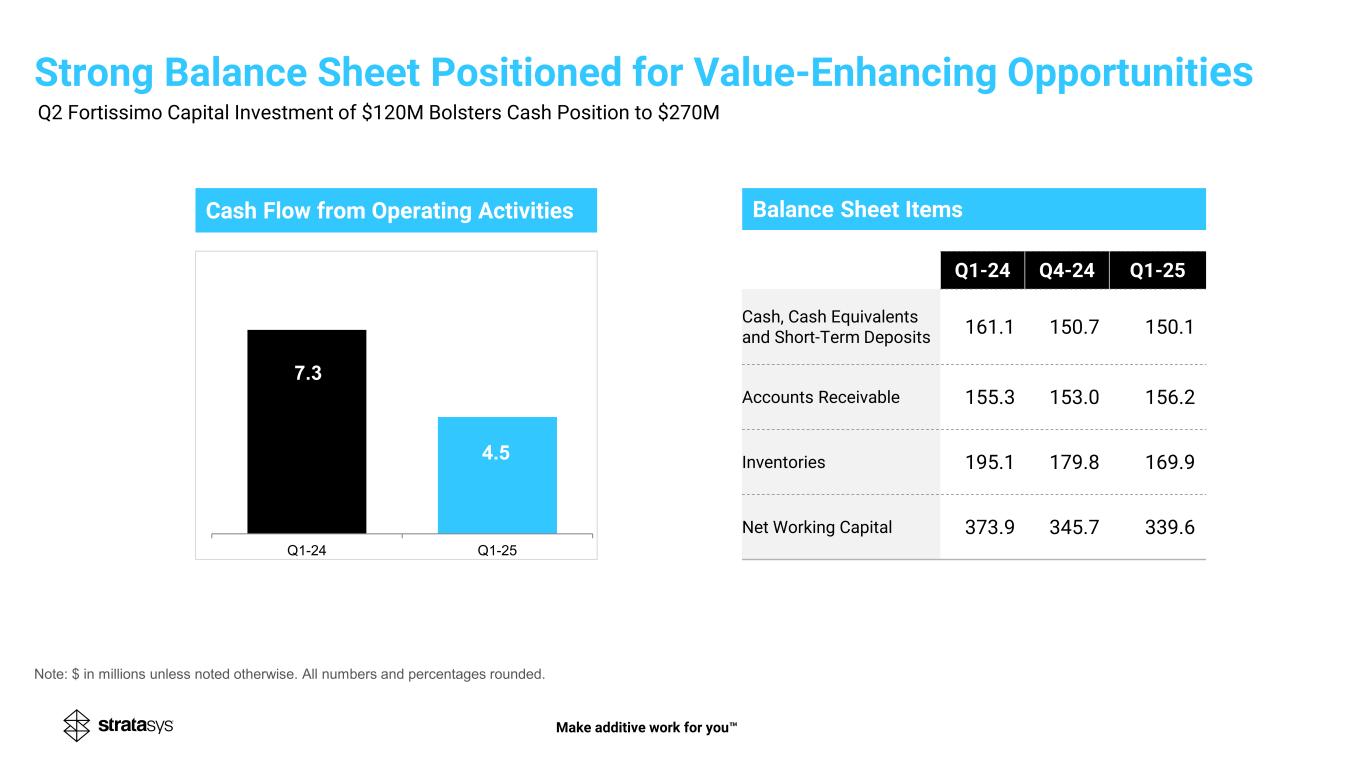
•$150.1 million cash, equivalents and short-term deposits and no debt at March 31, 2025
•Adds $120 million in cash from investment by Fortissimo Capital subsequent to quarter end
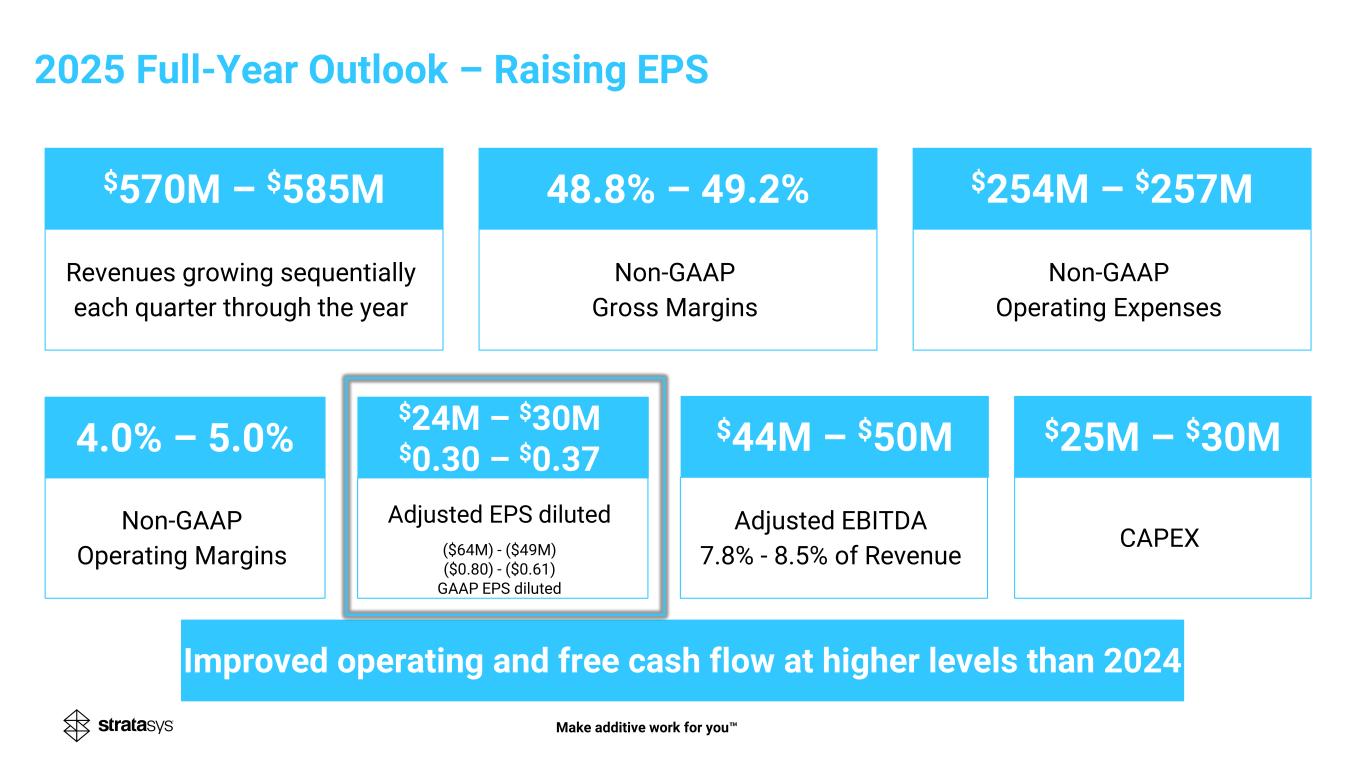
•Raises 2025 Outlook
MINNEAPOLIS & REHOVOT, Israel - (BUSINESS WIRE) - May 8, 2025 - Stratasys Ltd. (Nasdaq: SSYS), a leader in polymer 3D printing solutions, today announced its financial results for the first quarter ended March 31, 2025.
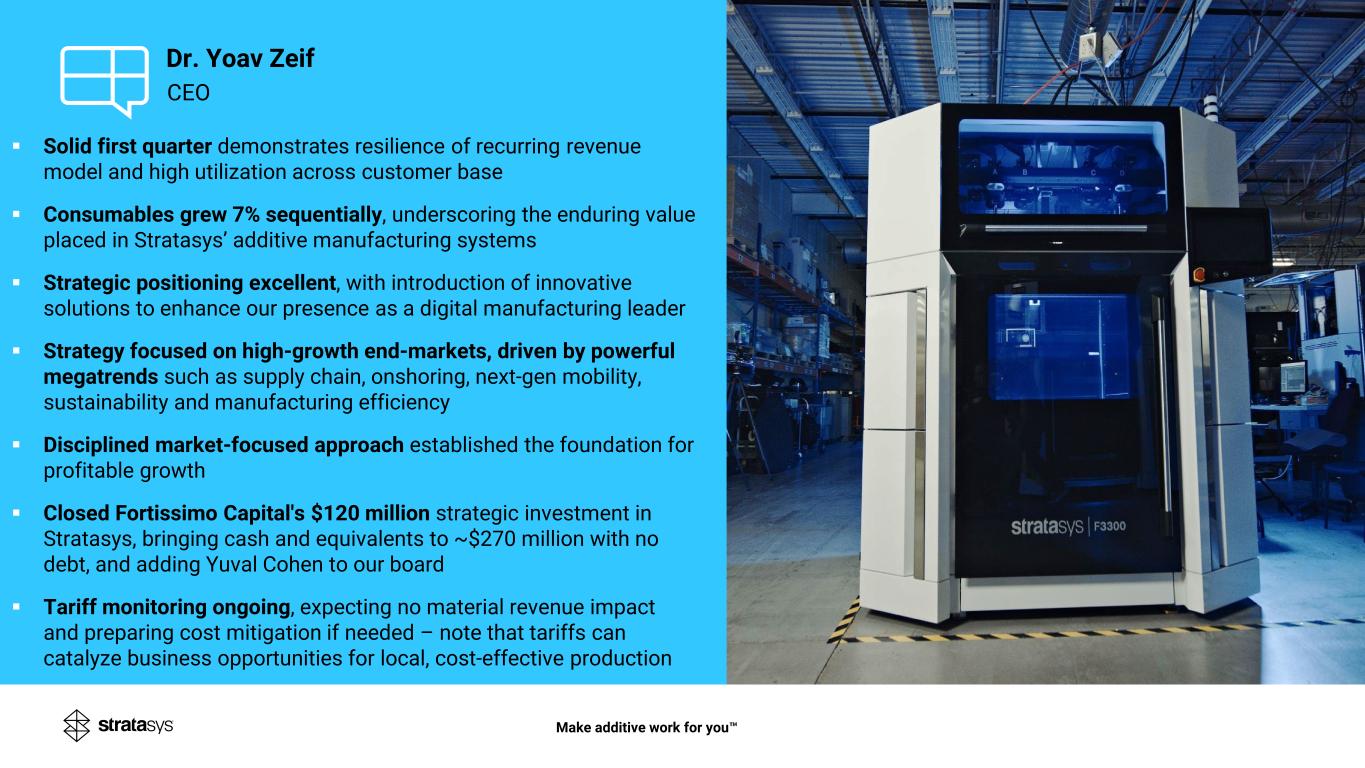
Dr. Yoav Zeif, Stratasys’ Chief Executive Officer, stated, “We delivered another quarter of net profitability on an adjusted basis and positive cash from operating activities. It's particularly encouraging to see 7% sequential growth in our recurring revenue Consumables, demonstrating continued solid utilization of existing systems by our customers. Our ongoing strategic efforts to streamline the business are proving successful, and we are positioned to deliver improved profitability, while maintaining our ability to scale when capital spending recovers.”
Dr. Zeif continued, “With the recent close of the $120 million Fortissimo investment we further strengthened our balance sheet, which will support our ability to invest in profitable growth, both organically and through attractive opportunities. We continue to strengthen our position in additive manufacturing by expanding our portfolio of best-in-class technology, materials, and software. We believe we are well-positioned to drive increased cash flow and profitability from our streamlined operations and recurring stream of revenue as we move through the balance of the year.”
Summary - First Quarter 2025 Financial Results Compared to First Quarter 2024:
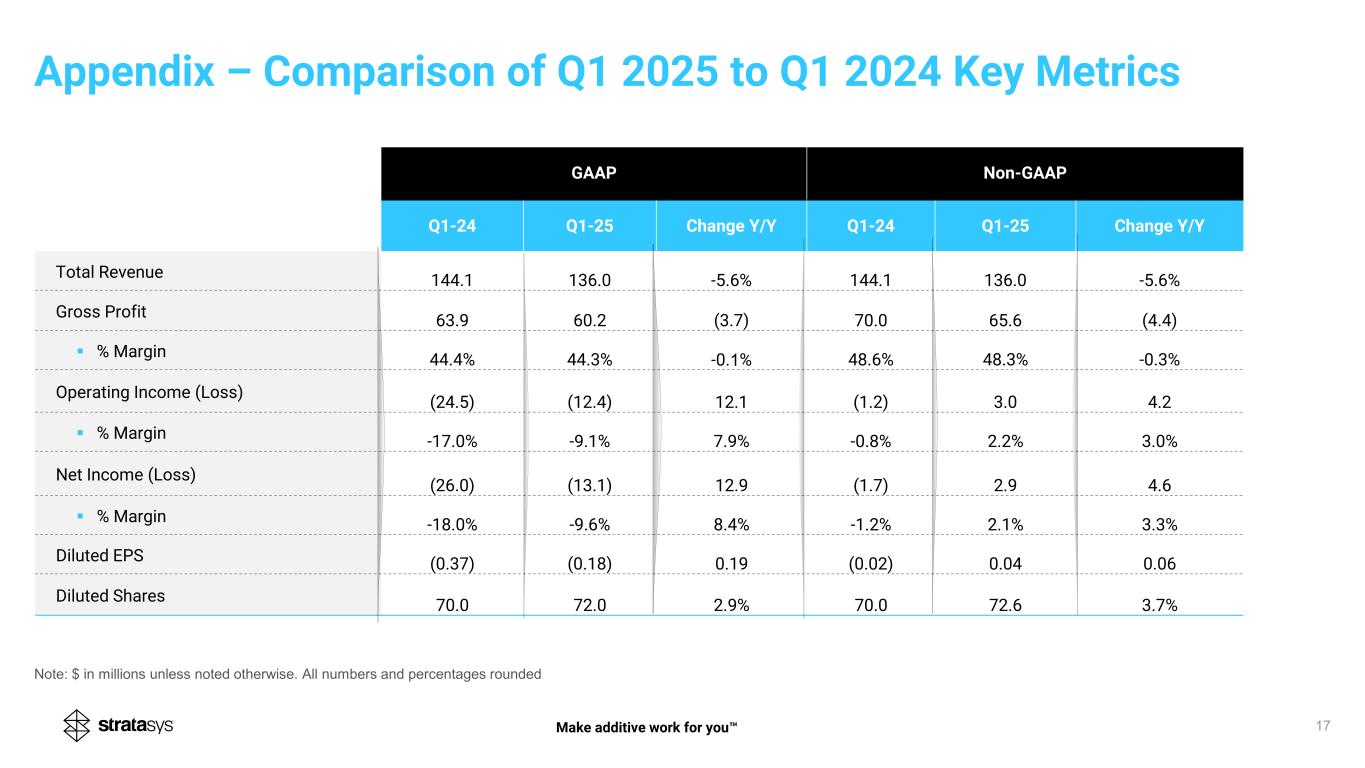
•Revenue of $136.0 million compared to $144.1 million.
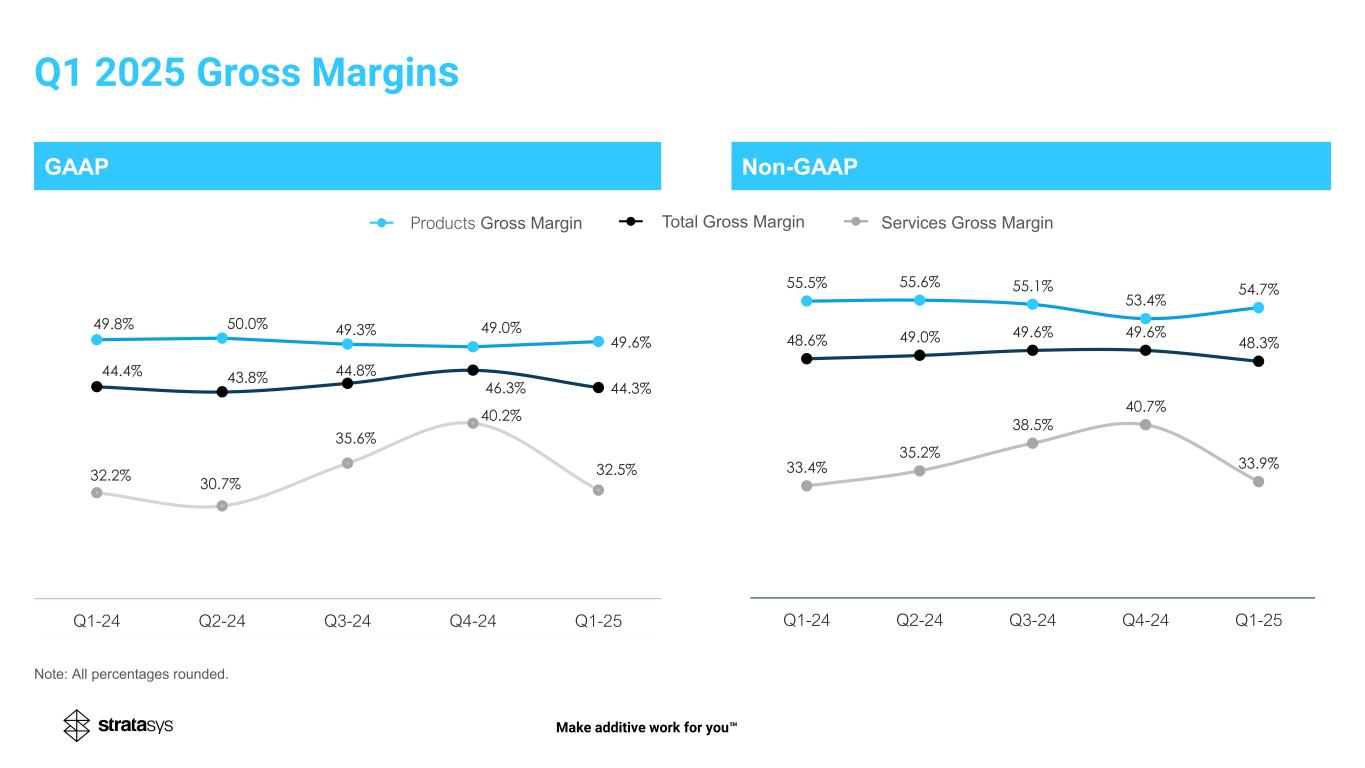
•GAAP gross margin of 44.3%, compared to 44.4%.
•Non-GAAP gross margin of 48.3%, compared to 48.6%.
•GAAP operating loss of $12.4 million, compared to an operating loss of $24.5 million.
•Non-GAAP operating income of $3.0 million, compared to an operating loss of $1.2 million.
•GAAP net loss of $13.1 million, or $0.18 per diluted share, compared to a net loss of $26.0 million, or $0.37 per diluted share.
•Non-GAAP net income of $2.9 million, or $0.04 per diluted share, compared to a net loss of $1.7 million, or $0.02 per diluted share.
•Adjusted EBITDA of $8.2 million, compared to $4.1 million.
•Cash provided by operating activities of $4.5 million, compared to $7.3 million.
Financial Outlook:
Based on current market conditions and assuming that the impacts of tariff policy, global inflationary pressures, relatively high interest rates and supply chain costs do not impede economic activity further, the Company is reiterating the following outlook for 2025:
•Full year revenue of $570 million to $585 million, improving sequentially over the course of the year.
•Based on current logistics and materials costs, full-year non-GAAP gross margins of 48.8%-49.2%, improving sequentially over the course of the year.
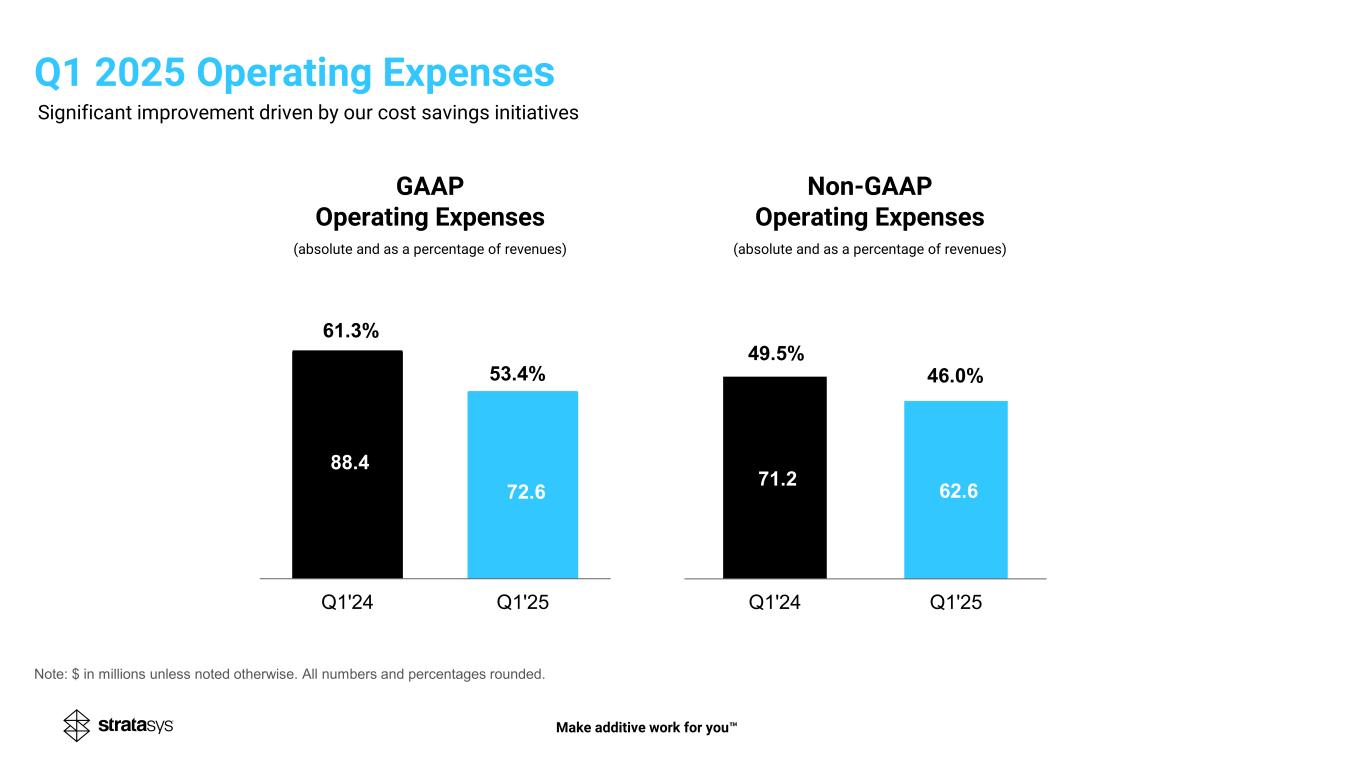
•Full year operating expenses in a range of $254 million to $257 million.
•Full year non-GAAP operating margins in a range of 4.0% to 5.0%.
•Adjusted EBITDA of $44 million to $50 million, or 7.8% to 8.5% of revenue.
•Capital expenditures of $25 million to $30 million.
•Expects to generate improved operating and free cashflow, at higher levels than in 2024.
As a result of the Fortissimo investment, the Company’s share count as of April 8 increased by approximately 11.65 million shares. The interest income the Company expects to generate from the $120 million investment will offset any potential dilution related to the share count. As a result, the Company is raising its 2025 annual earnings forecast as follows:
•GAAP net loss of $64 million to $49 million, up from $68 million to $53 million previously, and GAAP EPS of ($0.80) to ($0.61), an improvement as compared to ($0.93) to ($0.72) previously.
•Non-GAAP net income of $24 million to $30 million, up from $20 million to $26 million previously, and Non-GAAP EPS of $0.30 to $0.37, up from $0.28 to $0.35 previously.
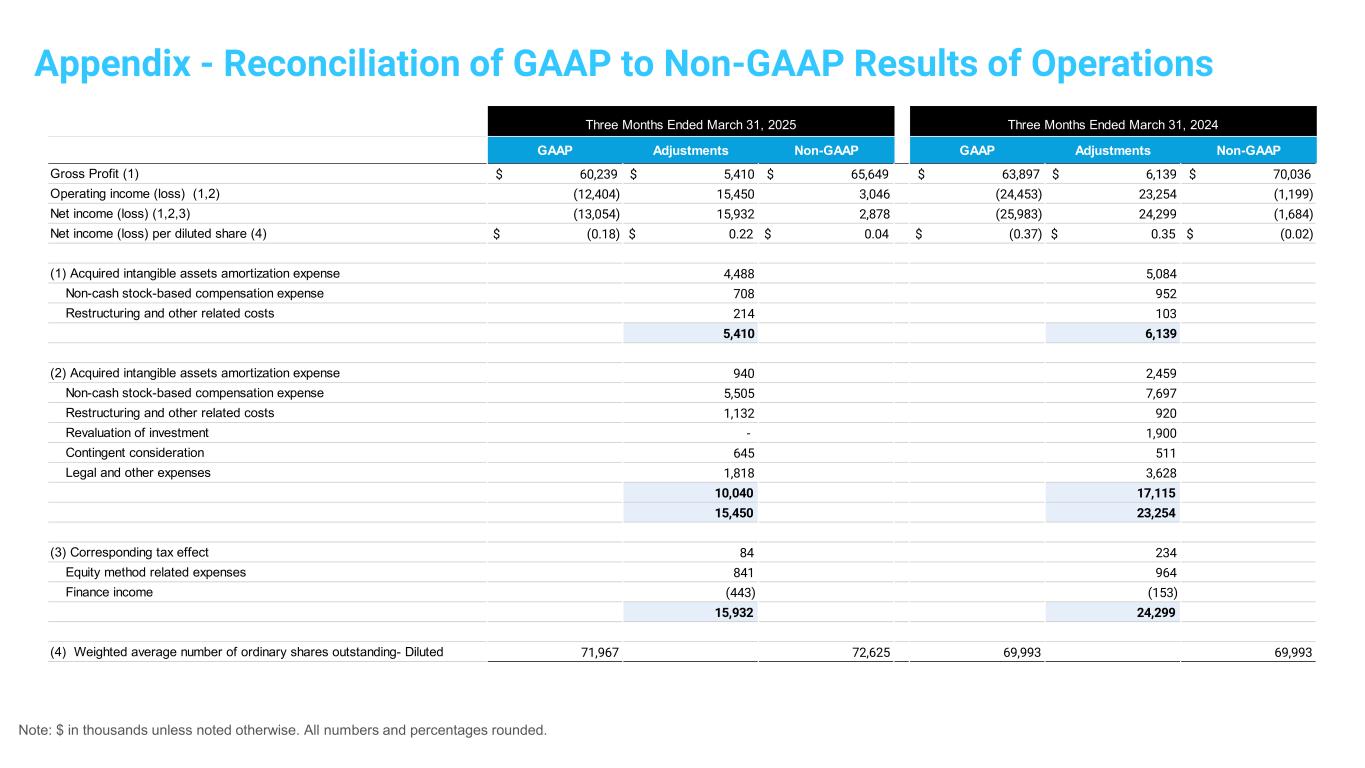
Appropriate reconciliations between our historical GAAP and non-GAAP financial measures, as well as between the GAAP and non-GAAP financial measures included in our updated financial outlook for 2025, are provided in the tables at the end of our press release and slide presentation, with itemized detail concerning the non-GAAP financial measures. We have not included, however, a reconciliation of our guidance for non-GAAP gross margins to the most directly comparable GAAP financial measure, as we are unable to do so without unreasonable effort or with reasonable certainty from a quantitative perspective.
Stratasys Ltd. First Quarter 2025 Webcast and Conference Call Details
The Company plans to webcast its conference call to discuss its first quarter 2025 financial results on Thursday, May 8, 2025, at 8:30 a.m. (ET).
The investor conference call will be available via live webcast on the Stratasys Web site at investors.stratasys.com, or directly at the following web address:
https://event.choruscall.com/mediaframe/webcast.html?webcastid=pGlPRdRX
To participate by telephone, the U.S. toll-free number is 877-407-0619 and the international dial-in is +1-412-902-1012. Investors are advised to dial into the call at least ten minutes prior to the call to register. The webcast will be available for six months at investors.stratasys.com, or by accessing the above-provided web address.
Stratasys is leading the global shift to additive manufacturing with innovative 3D printing solutions for industries such as aerospace, automotive, consumer products, healthcare, fashion and education. Through smart and connected 3D printers, polymer materials, a software ecosystem, and parts on demand, Stratasys solutions deliver competitive advantages at every stage in the product value chain. The world’s leading organizations turn to Stratasys to transform product design, bring agility to manufacturing and supply chains, and improve patient care.
To learn more about Stratasys, visit www.stratasys.com, the Stratasys blog, Twitter, LinkedIn, or Facebook. Stratasys reserves the right to utilize any of the foregoing social media platforms, including the Company’s websites, to share material, non-public information pursuant to the SEC’s Regulation FD. To the extent necessary and mandated by applicable law, Stratasys will also include such information in its public disclosure filings.
Stratasys is a registered trademark and the Stratasys signet is a trademark of Stratasys Ltd. and/or its subsidiaries or affiliates. All other trademarks are the property of their respective owners.
Cautionary Statement Regarding Forward-Looking Statements
The statements in this press release regarding Stratasys' strategy, and the statements regarding its projected future financial performance, including the financial guidance concerning its expected results for 2025 and beyond, are forward-looking statements reflecting management's current expectations and beliefs. These forward-looking statements are based on current information that is, by its nature, subject to rapid and even abrupt change. Due to risks and uncertainties associated with Stratasys' business, actual results could differ materially from those projected or implied by these forward-looking statements. These risks and uncertainties include, but are not limited to: the extent of our success at introducing new or improved products and solutions that gain market share; the extent of growth of the 3D printing market generally; the global macro-economic environment, including the extent of increased and/or reciprocal import tariffs that may be imposed by the U.S.
and other countries, and the impact that will have on inflation, interest rates, economic activity and currency exchange rates on a global scale, and on the additive manufacturing industry, our company and our customers, in particular; changes in our overall strategy, including as related to any restructuring activities and our capital expenditures; the impact of potential shifts in the prices or margins of the products that we sell or services that we provide, including due to a shift towards lower margin products or services; the impact of competition and new technologies; potential further charges against earnings that we could be required to take due to impairment of additional goodwill or other intangible assets; the extent of our success at successfully consummating and integrating into our existing business acquisitions or investments in new businesses, technologies, products or services; the potential adverse impact of recent global interruptions and delays involving freight carriers and other third parties on our supply chain and distribution network; global market, political and economic conditions, and in the countries in which we operate in particular; potential adverse effects of Israel’s retaliatory war against the terrorist organization Hamas and, intermittently, its conflict with Iran and the Houthi terrorist group in Yemen; costs and potential liability relating to litigation and regulatory proceedings; risks related to infringement of our intellectual property rights by others or infringement of others' intellectual property rights by us; the extent of our success at maintaining our liquidity and financing our operations and capital needs; the impact of tax regulations on our results of operations and financial condition; and those additional factors referred to in Item 3.D “Key Information - Risk Factors”, Item 4, “Information on the Company”, Item 5, “Operating and Financial Review and Prospects,” and all other parts of our Annual Report on Form 20-F for the year ended December 31, 2024, which we filed with the U.S. Securities and Exchange Commission, or SEC, on March 6, 2025 (the “2024 Annual Report”). Readers are urged to carefully review and consider the various disclosures made throughout our 2024 Annual Report and the Reports of Foreign Private Issuer on Form 6-K that attach Stratasys’ unaudited, condensed consolidated financial statements and its review of its results of operations and financial condition, for the quarterly periods throughout 2025, which will be furnished to the SEC throughout 2025, and our other reports filed with or furnished to the SEC, which are designed to advise interested parties of the risks and factors that may affect our business, financial condition, results of operations and prospects. Any guidance provided, and other forward-looking statements made, in this press release are provided or made (as applicable) as of the date hereof, and Stratasys undertakes no obligation to publicly update or revise any forward-looking statements, whether as a result of new information, future events or otherwise, except as required by law.
Use of Non-GAAP Financial Measures
The non-GAAP data included herein, which excludes certain items as described below, are non-GAAP financial measures. Our management believes that these non-GAAP financial measures are useful information for investors and shareholders of our company in gauging our results of operations (i) on an ongoing basis after excluding mergers, acquisitions and divestments related expense or gains and reorganization-related charges or gains, and legal provisions, (ii) excluding non-cash items such as share-based compensation expenses, acquired intangible assets amortization, including intangible assets amortization related to equity method investments, impairment of long-lived assets and goodwill, revaluation of our investments and the corresponding tax effect of those items, (iii) for certain non-GAAP measures, after eliminating the impact of changes attributable to currency exchange rate fluctuations, and (iv) after excluding changes in revenues solely attributable to divestitures of former subsidiary companies. These non-GAAP adjustments either do not reflect actual cash outlays that impact our liquidity and our financial condition or have a non-recurring impact on the statement of operations, as assessed by management. These non-GAAP financial measures are presented to permit investors to more fully understand how management assesses our performance for internal planning and forecasting purposes. The limitations of using these non-GAAP financial measures as performance measures are that they provide a view of our results of operations without including all items indicated above during a period, which may not provide a comparable view of our performance to other companies in our industry. Investors and other readers should consider non-GAAP measures only as supplements to, not as substitutes for or as superior measures to, the measures of financial performance prepared in accordance with GAAP. Reconciliation between results on a GAAP and non-GAAP basis is provided in the tables below.
Yonah Lloyd
CCO & VP Investor Relations
Yonah.Lloyd@stratasys.com
Source: Stratasys Ltd.
|
|
|
|
|
|
|
|
|
|
|
|
|
|
|
| Consolidated Balance Sheets |
|
|
|
|
(U.S. $ in thousands, except share data) |
|
|
|
|
| (Unaudited) |
|
|
|
|
|
|
March 31, 2025 |
|
December 31, 2024 |
| ASSETS |
|
|
|
|
| Current assets |
|
|
|
|
| Cash and cash equivalents |
|
$ |
70,061 |
|
|
$ |
70,200 |
|
| Short-term bank deposits |
|
80,000 |
|
|
80,500 |
|
| Accounts receivable, net of allowance for credit losses of $3,048 and $3,058 as of March 31, 2025 and December 31, 2024, respectively |
|
156,150 |
|
|
152,979 |
|
| Inventories |
|
169,881 |
|
|
179,809 |
|
| Prepaid expenses |
|
10,616 |
|
|
7,630 |
|
| Other current assets |
|
20,923 |
|
|
21,843 |
|
|
|
|
|
|
| Total current assets |
|
507,631 |
|
|
512,961 |
|
| Non-current assets |
|
|
|
|
| Property, plant and equipment, net |
|
186,866 |
|
|
184,379 |
|
| Goodwill |
|
99,463 |
|
|
99,082 |
|
| Other intangible assets, net |
|
101,619 |
|
|
106,253 |
|
| Operating lease right-of-use assets |
|
31,097 |
|
|
32,169 |
|
| Long-term investments |
|
81,518 |
|
|
80,205 |
|
| Other non-current assets |
|
14,950 |
|
|
14,697 |
|
|
|
|
|
|
| Total non-current assets |
|
515,513 |
|
|
516,785 |
|
|
|
|
|
|
| Total assets |
|
$ |
1,023,144 |
|
|
$ |
1,029,746 |
|
|
|
|
|
|
| LIABILITIES AND EQUITY |
|
|
|
|
| Current liabilities |
|
|
|
|
| Accounts payable |
|
$ |
38,032 |
|
|
$ |
44,977 |
|
| Accrued expenses and other current liabilities |
|
36,310 |
|
|
39,749 |
|
| Accrued compensation and related benefits |
|
34,905 |
|
|
29,206 |
|
| Deferred revenues - short-term |
|
51,897 |
|
|
46,347 |
|
| Operating lease liabilities - short-term |
|
6,921 |
|
|
6,935 |
|
|
|
|
|
|
| Total current liabilities |
|
168,065 |
|
|
167,214 |
|
| Non-current liabilities |
|
|
|
|
| Deferred revenues - long-term |
|
20,138 |
|
|
19,057 |
|
| Deferred income taxes |
|
459 |
|
|
507 |
|
| Operating lease liabilities - long-term |
|
24,363 |
|
|
25,155 |
|
| Contingent consideration - long-term |
|
5,089 |
|
|
4,933 |
|
| Other non-current liabilities |
|
20,189 |
|
|
19,889 |
|
|
|
|
|
|
| Total non-current liabilities |
|
70,238 |
|
|
69,541 |
|
|
|
|
|
|
| Total liabilities |
|
$ |
238,303 |
|
|
$ |
236,755 |
|
|
|
|
|
|
| Contingencies (see note 12) |
|
|
|
|
|
|
|
|
|
| Equity |
|
|
|
|
| Ordinary shares, NIS 0.01 nominal value, authorized 180,000 shares; 72,657 shares and 71,982 shares issued at March 31, 2025 and December 31, 2024, respectively; 72,391 shares and 71,716 shares outstanding at March 31, 2025 and December 31, 2024, respectively |
|
$ |
203 |
|
|
$ |
202 |
|
| Treasury shares at cost, 266 shares at March 31, 2025 and December 31, 2024 |
|
(1,995) |
|
|
(1,995) |
|
| Additional paid-in capital |
|
3,129,236 |
|
|
3,123,024 |
|
| Accumulated other comprehensive loss |
|
(9,340) |
|
|
(8,031) |
|
| Accumulated deficit |
|
(2,333,263) |
|
|
(2,320,209) |
|
| Total equity |
|
784,841 |
|
|
792,991 |
|
|
|
|
|
|
| Total liabilities and equity |
|
$ |
1,023,144 |
|
|
$ |
1,029,746 |
|
|
|
|
|
|
|
|
|
|
|
|
|
|
|
|
|
|
|
|
Consolidated Statements of Operations |
|
|
|
|
|
|
|
|
(U.S. $ in thousands, except per share data) |
|
Three Months Ended March 31, |
|
|
| (Unaudited) |
|
2025 |
|
2024 |
|
|
|
|
|
|
|
|
|
|
|
|
|
| Revenues |
|
|
|
|
|
|
|
|
| Products |
|
$ |
93,795 |
|
|
$ |
99,196 |
|
|
|
|
|
| Services |
|
42,251 |
|
|
44,854 |
|
|
|
|
|
|
|
136,046 |
|
|
144,050 |
|
|
|
|
|
| Cost of revenues |
|
|
|
|
|
|
|
|
| Products |
|
47,268 |
|
|
49,757 |
|
|
|
|
|
| Services |
|
28,539 |
|
|
30,396 |
|
|
|
|
|
|
|
75,807 |
|
|
80,153 |
|
|
|
|
|
|
|
|
|
|
|
|
|
|
| Gross profit |
|
60,239 |
|
|
63,897 |
|
|
|
|
|
|
|
|
|
|
|
|
|
|
| Operating expenses |
|
|
|
|
|
|
|
|
| Research and development, net |
|
18,792 |
|
|
23,977 |
|
|
|
|
|
| Selling, general and administrative |
|
53,851 |
|
|
64,373 |
|
|
|
|
|
|
|
72,643 |
|
|
88,350 |
|
|
|
|
|
|
|
|
|
|
|
|
|
|
| Operating loss |
|
(12,404) |
|
|
(24,453) |
|
|
|
|
|
|
|
|
|
|
|
|
|
|
Financial income, net |
|
1,473 |
|
|
1,217 |
|
|
|
|
|
|
|
|
|
|
|
|
|
|
| Loss before income taxes |
|
(10,931) |
|
|
(23,236) |
|
|
|
|
|
|
|
|
|
|
|
|
|
|
Income tax expenses |
|
455 |
|
|
716 |
|
|
|
|
|
|
|
|
|
|
|
|
|
|
Share in losses of associated companies |
|
1,668 |
|
|
2,031 |
|
|
|
|
|
|
|
|
|
|
|
|
|
|
| Net loss |
|
$ |
(13,054) |
|
|
$ |
(25,983) |
|
|
|
|
|
|
|
|
|
|
|
|
|
|
Net loss per ordinary share - basic and diluted |
|
$ |
(0.18) |
|
|
$ |
(0.37) |
|
|
|
|
|
|
|
|
|
|
|
|
|
|
Weighted average ordinary shares outstanding - basic and diluted |
|
71,967 |
|
|
69,993 |
|
|
|
|
|
|
|
|
|
|
|
|
|
|
|
|
|
|
|
|
|
|
|
|
|
|
|
|
|
|
Reconciliation of GAAP to Non-GAAP Results of Operations |
|
|
|
|
|
Three Months Ended March 31, |
|
|
2025 |
Non-GAAP |
2025 |
2024 |
Non-GAAP |
2024 |
|
|
GAAP |
Adjustments |
Non-GAAP |
GAAP |
Adjustments |
Non-GAAP |
|
|
U.S. dollars and shares in thousands (except per share amounts) |
|
Gross profit (1) |
$ |
60,239 |
|
$ |
5,410 |
|
$ |
65,649 |
|
$ |
63,897 |
|
$ |
6,139 |
|
$ |
70,036 |
|
|
Operating income (loss) (1,2) |
(12,404) |
|
15,450 |
|
3,046 |
|
(24,453) |
|
23,254 |
|
(1,199) |
|
|
Net income (loss) (1,2,3) |
(13,054) |
|
15,932 |
|
2,878 |
|
(25,983) |
|
24,299 |
|
(1,684) |
|
|
Net income (loss) per diluted share (4) |
$ |
(0.18) |
|
$ |
0.22 |
|
$ |
0.04 |
|
$ |
(0.37) |
|
$ |
0.35 |
|
$ |
(0.02) |
|
|
|
|
|
|
|
|
|
| (1) |
Acquired intangible assets amortization expense |
|
4,488 |
|
|
|
5,084 |
|
|
|
Non-cash stock-based compensation expense |
|
708 |
|
|
|
952 |
|
|
|
Restructuring and other related costs |
|
214 |
|
|
|
103 |
|
|
|
|
|
5,410 |
|
|
|
6,139 |
|
|
|
|
|
|
|
|
|
|
| (2) |
Acquired intangible assets amortization expense |
|
940 |
|
|
|
2,459 |
|
|
|
Non-cash stock-based compensation expense |
|
5,505 |
|
|
|
7,697 |
|
|
|
Restructuring and other related costs |
|
1,132 |
|
|
|
920 |
|
|
|
Revaluation of investment |
|
— |
|
|
|
1,900 |
|
|
|
Contingent consideration |
|
645 |
|
|
|
511 |
|
|
|
Legal and other expenses |
|
1,818 |
|
|
|
3,628 |
|
|
|
|
|
10,040 |
|
|
|
17,115 |
|
|
|
|
|
15,450 |
|
|
|
23,254 |
|
|
|
|
|
|
|
|
|
|
| (3) |
Corresponding tax effect |
|
84 |
|
|
|
234 |
|
|
|
Equity method related expenses |
|
841 |
|
|
|
964 |
|
|
|
Finance income |
|
(443) |
|
|
|
(153) |
|
|
|
|
|
$ |
15,932 |
|
|
|
$ |
24,299 |
|
|
|
|
|
|
|
|
|
|
| (4) |
Weighted average number of ordinary shares outstanding- Diluted |
71,967 |
|
|
72,625 |
|
69,993 |
|
|
69,993 |
|
|
|
|
|
|
|
|
|
|
| Reconciliation of GAAP net loss to Adjusted EBITDA |
|
|
|
Three Months Ended March 31, |
|
2025 |
2024 |
|
(U.S. $ in thousands) |
| Net loss |
$ |
(13,054) |
|
$ |
(25,983) |
|
| Financial income, net |
(1,473) |
|
(1,217) |
|
| Income tax expenses |
455 |
|
716 |
|
| Share in losses of associated companies |
1,668 |
|
2,031 |
|
| Depreciation expense |
5,124 |
|
5,305 |
|
| Amortization expense |
5,428 |
|
7,543 |
|
| Non-cash stock-based compensation expense |
6,213 |
|
8,649 |
|
| Revaluation of investment |
— |
|
1,900 |
|
|
|
|
| Contingent consideration |
645 |
|
511 |
|
| Legal and other expenses |
1,818 |
|
3,628 |
|
| Restructuring and other related costs |
1,346 |
|
1,023 |
|
|
|
|
| Adjusted EBITDA |
$ |
8,170 |
|
$ |
4,106 |
|
|
|
|
|
|
|
|
|
|
|
|
|
|
|
|
|
|
|
| Reconciliation of GAAP Net Loss to Non-GAAP Net Income Forward Looking Guidance: |
|
|
| Fiscal Year 2025 |
|
|
|
|
|
| (U.S. $ in millions, except per share data) |
|
|
Low |
|
High |
|
|
|
|
|
|
| GAAP net loss |
|
|
$(64) |
to |
$(49) |
|
|
|
|
|
|
| Adjustments |
|
|
|
|
|
| Stock-based compensation expense |
|
|
$25 |
to |
$27 |
| Intangible assets amortization expense |
|
|
$22 |
to |
$24 |
| Reorganization and other |
|
|
$30 |
to |
$34 |
| Tax expense related to Non-GAAP adjustments |
|
|
$2 |
to |
$3 |
|
|
|
|
|
|
| Non-GAAP net income |
|
|
$24 |
to |
$30 |
|
|
|
|
|
|
| GAAP loss per share |
|
|
$(0.80) |
to |
$(0.61) |
|
|
|
|
|
|
| Non-GAAP diluted earnings per share |
|
|
$0.30 |
to |
$0.37 |
|
|
|
|
|
|
|
|
|
|
|
|
|
|
|
|
|
|
| Reconciliation of GAAP Net Loss to Adjusted EBITDA Forward Looking Guidance: |
|
|
| Fiscal Year 2025 |
|
|
|
|
|
| (U.S. $ in millions, except per share data) |
|
|
Low |
|
High |
|
|
|
|
|
|
| GAAP net loss |
|
|
$(64) |
to |
$(49) |
|
|
|
|
|
|
| Adjustments |
|
|
|
|
|
| Stock-based compensation expense |
|
|
$25 |
to |
$27 |
| Intangible assets amortization expense |
|
|
$22 |
to |
$24 |
| Reorganization and other |
|
|
$30 |
to |
$34 |
| Tax expense related to Non-GAAP adjustments |
|
|
$2 |
to |
$3 |
| Other non-operating expense |
|
|
$— |
to |
$— |
| Depreciation |
|
|
$20 |
to |
$20 |
|
|
|
|
|
|
| Adjusted EBITDA |
|
|
$44 |
to |
$50 |
|
|
|
|
|
|
|
|
|
|
|
|
|
|
|
|
|
|
| Reconciliation of GAAP Operating Loss to Non-GAAP Operating Income Forward Looking Guidance: |
| Fiscal Year 2025 |
|
|
|
|
|
| (U.S. $ in millions, except per share data) |
|
|
Low |
|
High |
|
|
|
|
|
|
| GAAP operating loss |
|
|
$(57) |
to |
$(43) |
| GAAP operating margins |
|
|
(10)% |
to |
(7)% |
|
|
|
|
|
|
| Adjustments |
|
|
|
|
|
| Stock-based compensation expense |
|
|
$25 |
to |
$27 |
| Intangible assets amortization expense |
|
|
$22 |
to |
$24 |
| Reorganization and other |
|
|
$26 |
to |
$30 |
|
|
|
|
|
|
| Non-GAAP operating profit |
|
|
$24 |
to |
$30 |
| Non-GAAP operating margins |
|
|
4% |
to |
5% |


