Document
Banc of California, Inc. Reports First Quarter Diluted Earnings per Share of $0.26 and Loan Growth of 6% Annualized in the First Quarter; Upsizes Stock Buyback Program to $300 Million
Company Release – 4/23/2025
|
|
|
|
|
|
|
|
|
|
|
|
|
|
|
|
|
|
|
|
|
|
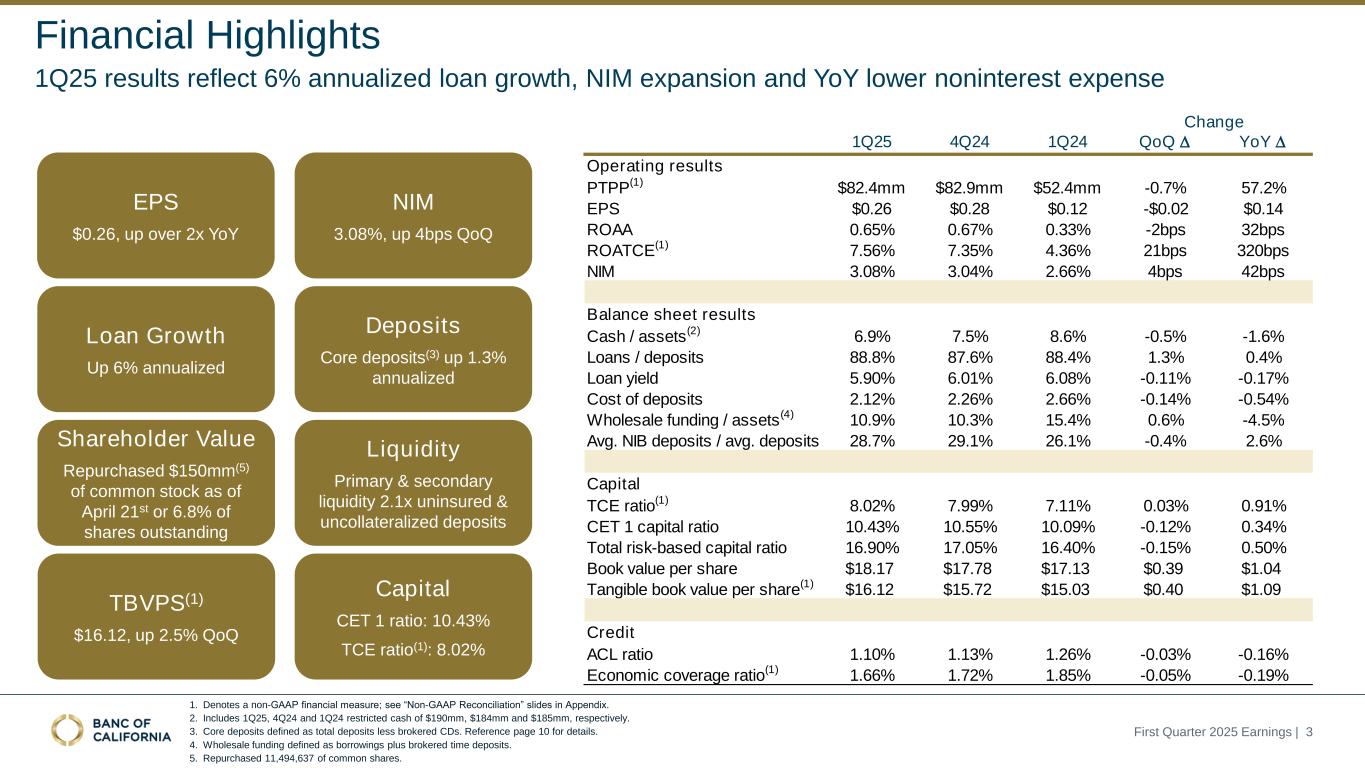
$0.26
Earnings Per Share
|
|
$18.17
Book Value Per Share
$16.12
Tangible Book Value
Per Share(1)
|
|
10.43%
CET1 Ratio
|
|
6%
Annualized Loan Growth
|
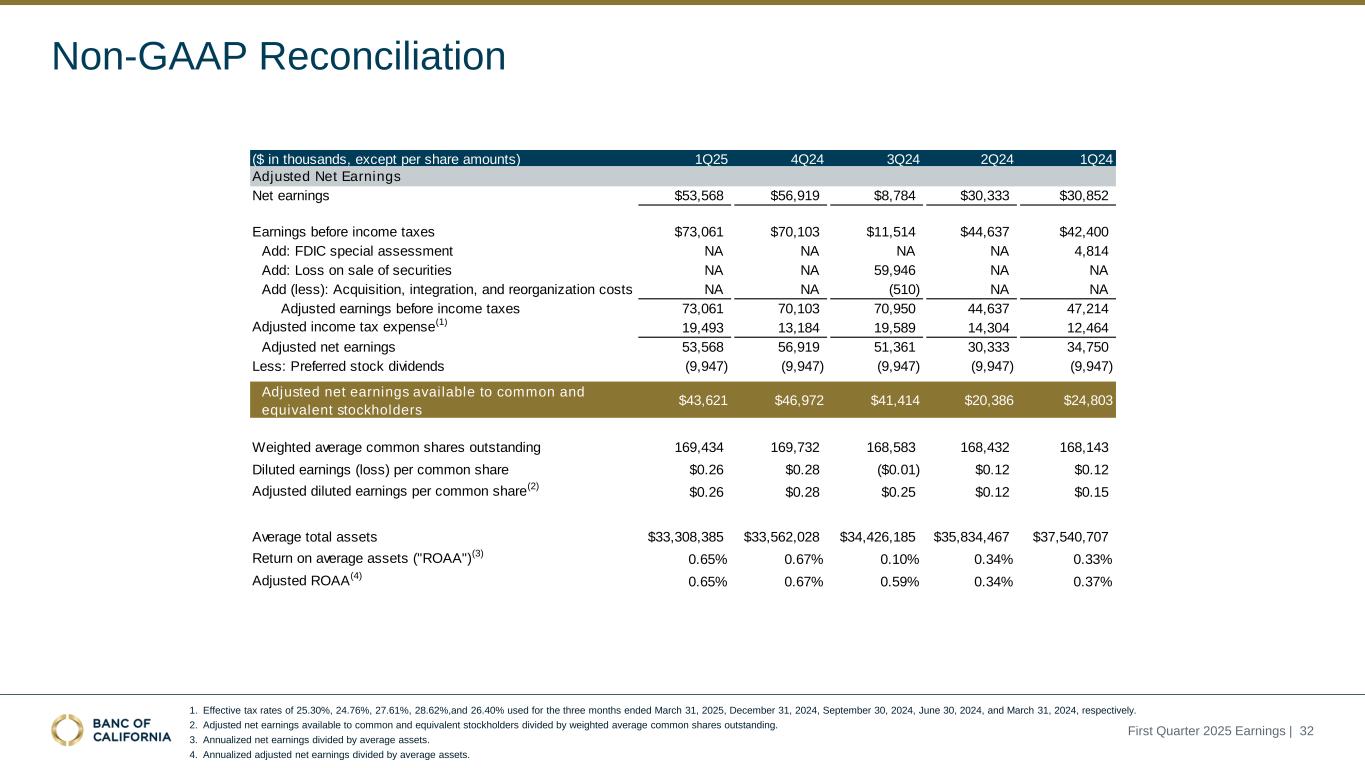
LOS ANGELES, Calif.--(BUSINESS WIRE)--Banc of California, Inc. (NYSE: BANC) (“Banc of California” or the “Company”), the parent company of wholly-owned subsidiary Banc of California (the “Bank”), today reported financial results for the first quarter ended March 31, 2025. The Company reported net earnings available to common and equivalent stockholders of $43.6 million, or $0.26 per diluted common share, for the first quarter of 2025. This compares to net earnings available to common and equivalent stockholders of $47.0 million, or $0.28 per diluted common share, for the fourth quarter of 2024.
The Company also announced today an upsize of its stock repurchase program, first announced on March 17, 2025, from $150 million to $300 million, inclusive of $150.0 million purchased through April 21, 2025, and expanded to cover both the Company's common stock and depositary shares representing its preferred stock.
First Quarter of 2025 Financial Highlights:
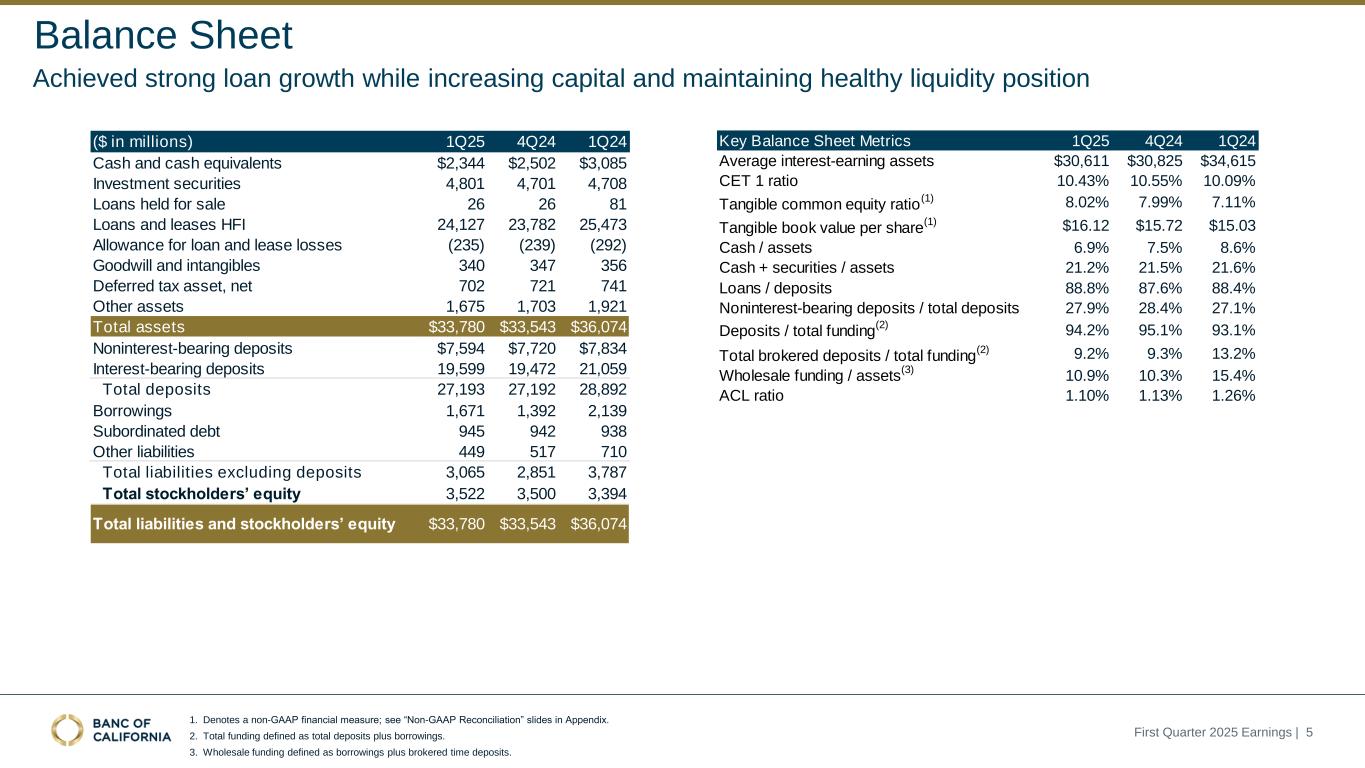
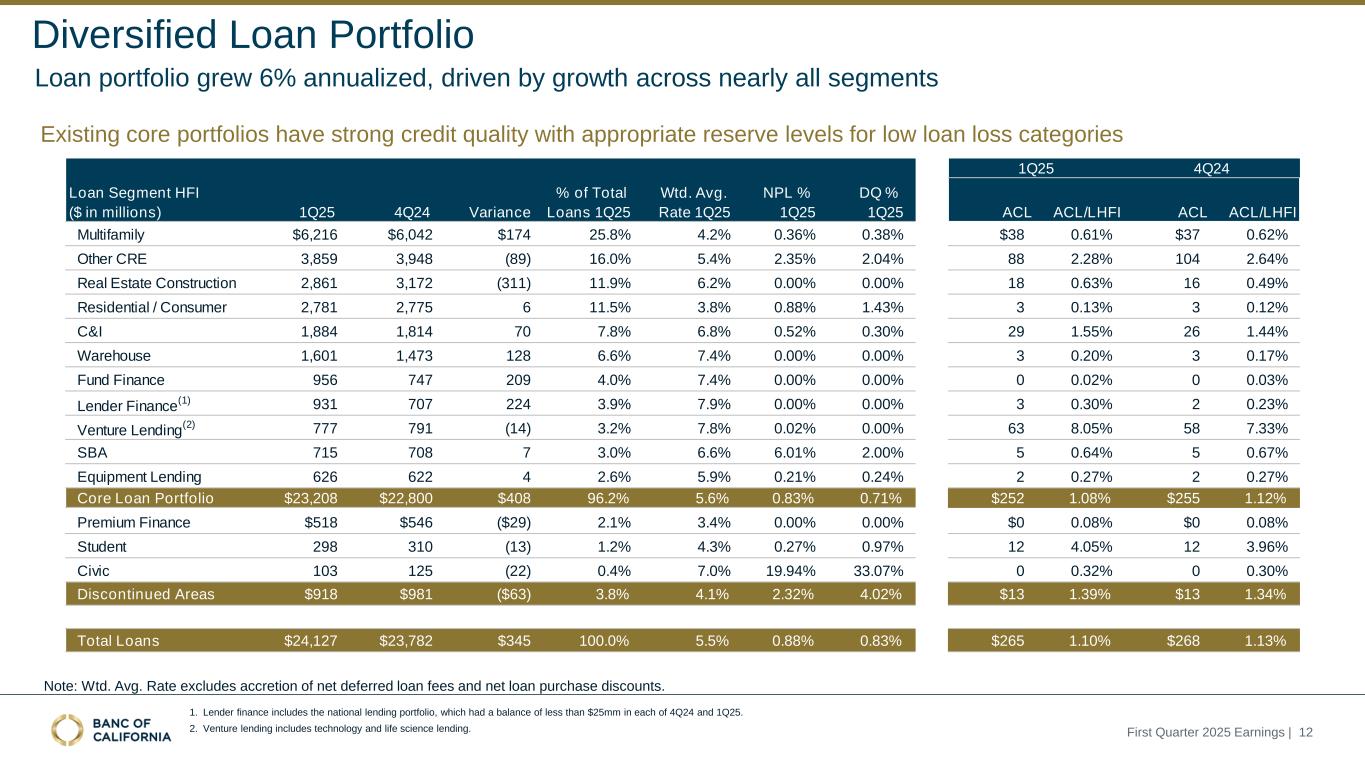
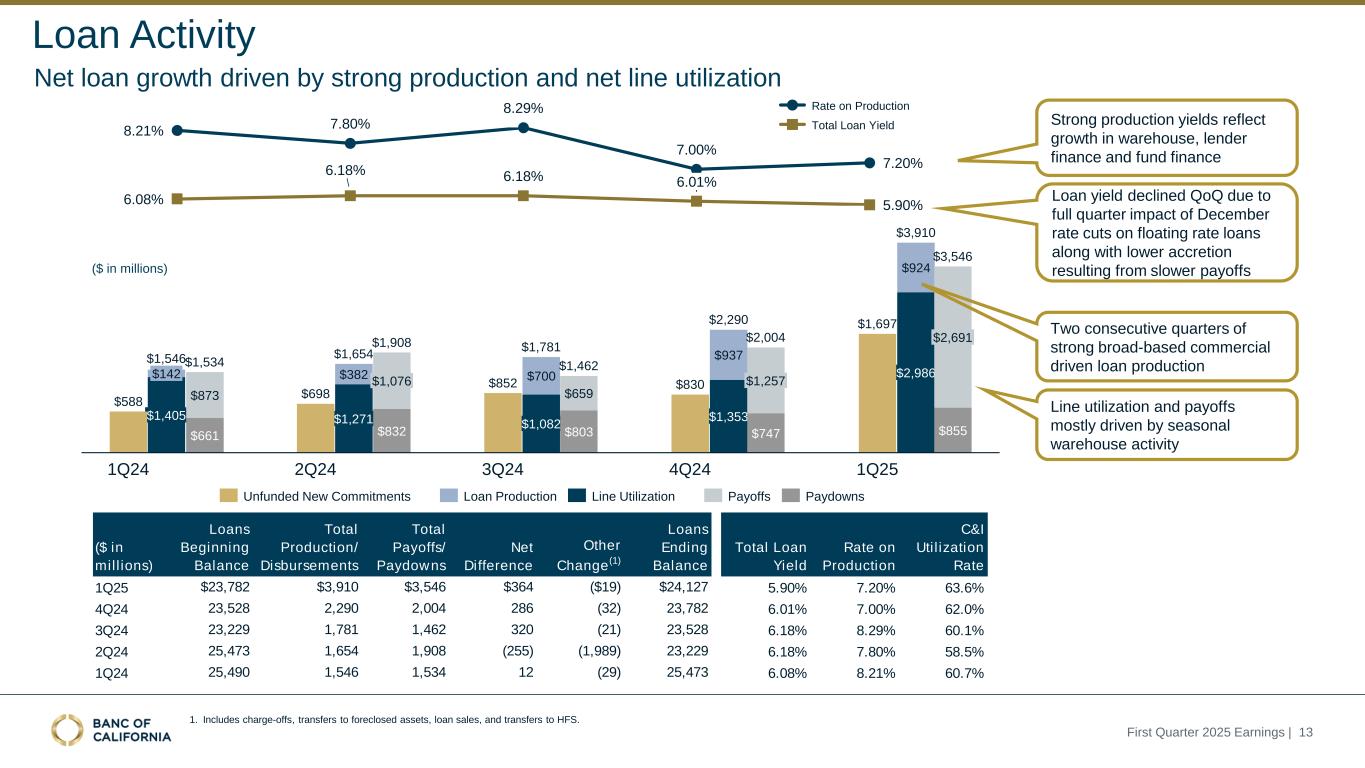
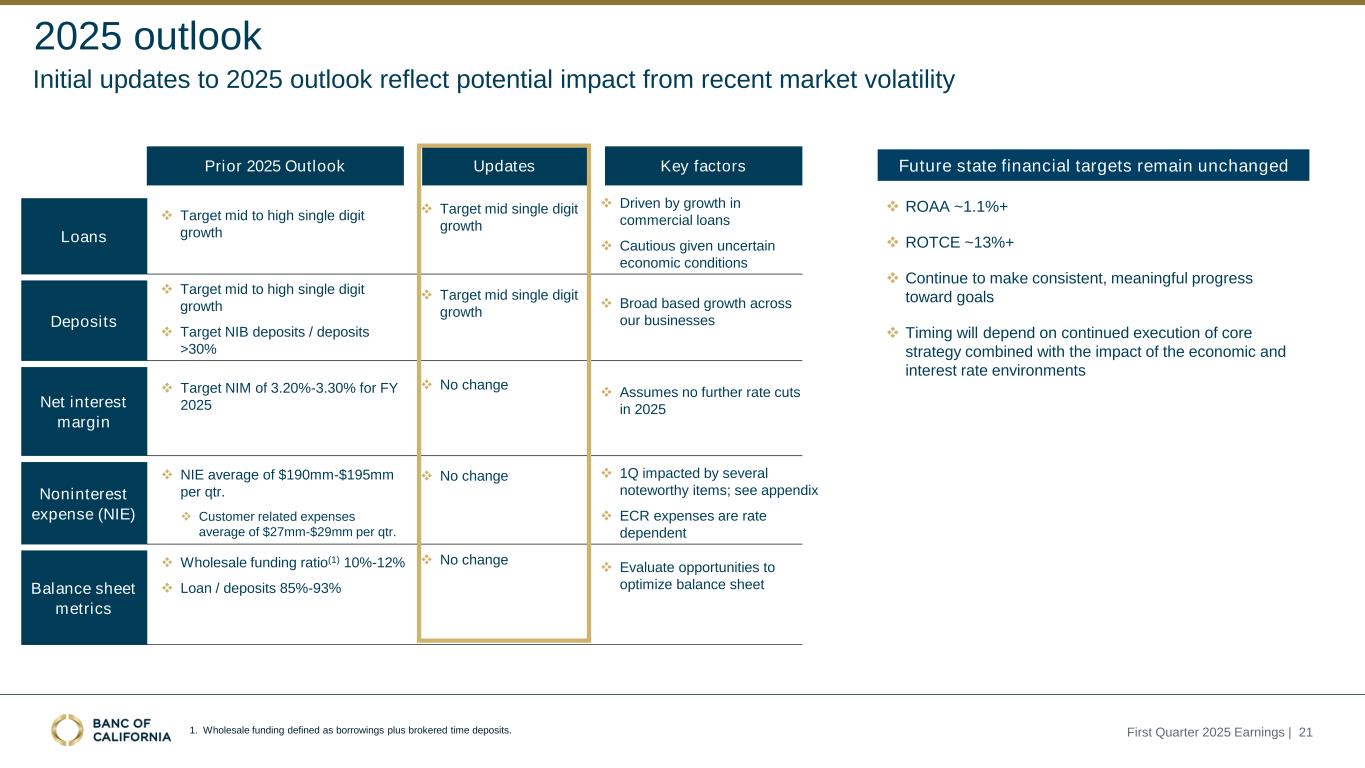
•Total loans of $24.1 billion grew by 6% annualized or $344.9 million from 4Q24 driven by increases in nearly all loan segments and highlighted by commercial and industrial ("C&I") growth in the lender finance, fund finance, and warehouse loan portfolios.
•New loan originations totaled $2.6 billion including production, purchased loans, and unfunded new commitments with a weighted average interest rate on production of 7.20%.
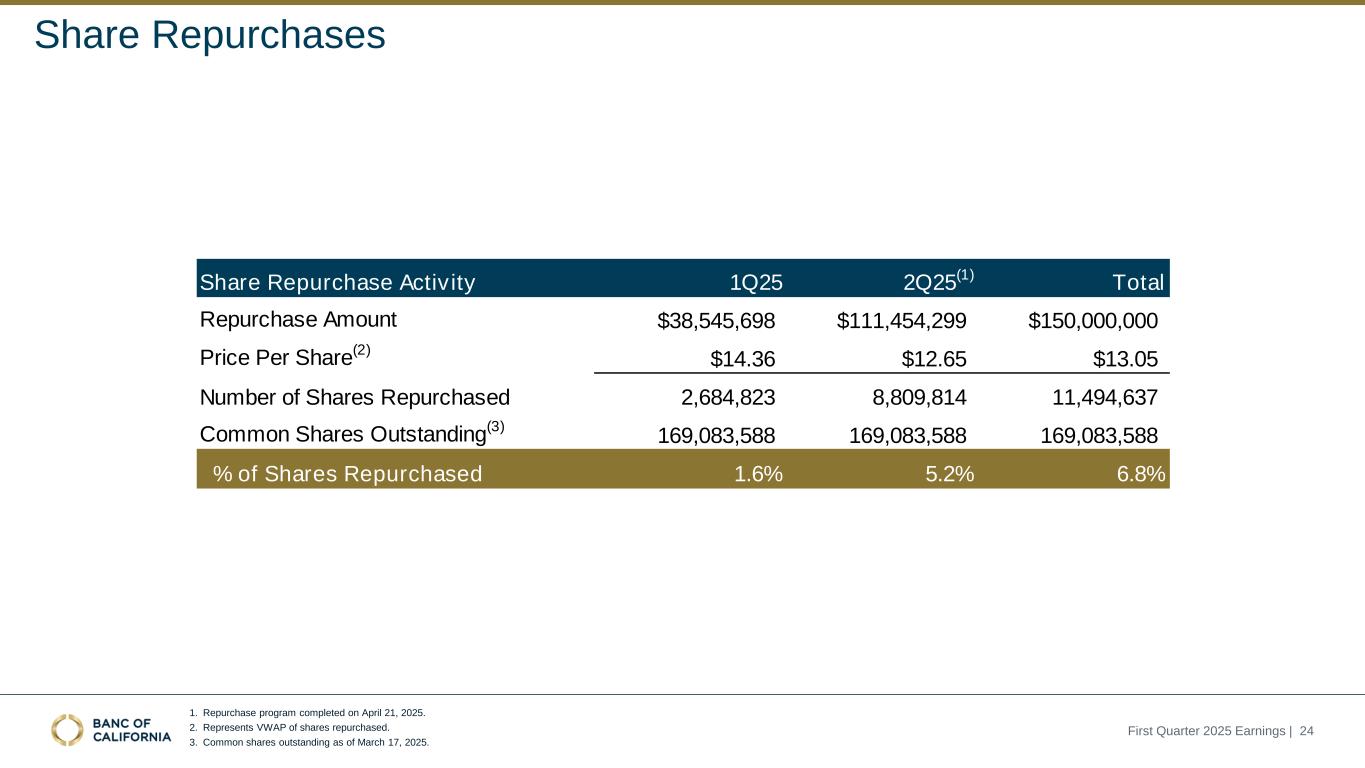
•Repurchase of $38.5 million of common stock with a weighted average price per share of $14.36 during the first quarter, and $150.0 million with a weighted average price per share of $13.05 cumulatively through April 21, 2025, or 6.8% of common shares outstanding as of March 17, 2025, the date that the $150 million authorization was announced.
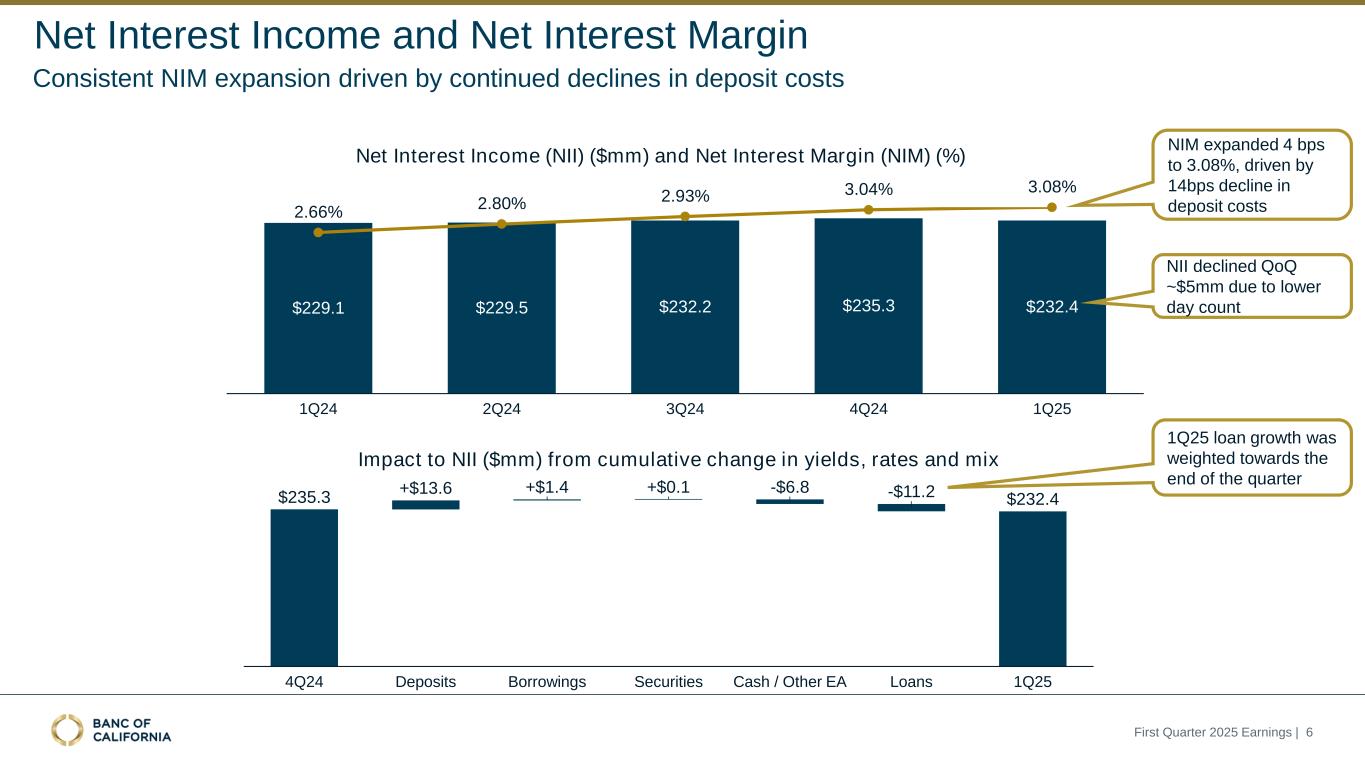
•Net interest margin up 4 basis points vs 4Q24 to 3.08% mainly driven by lower average costs of deposits.
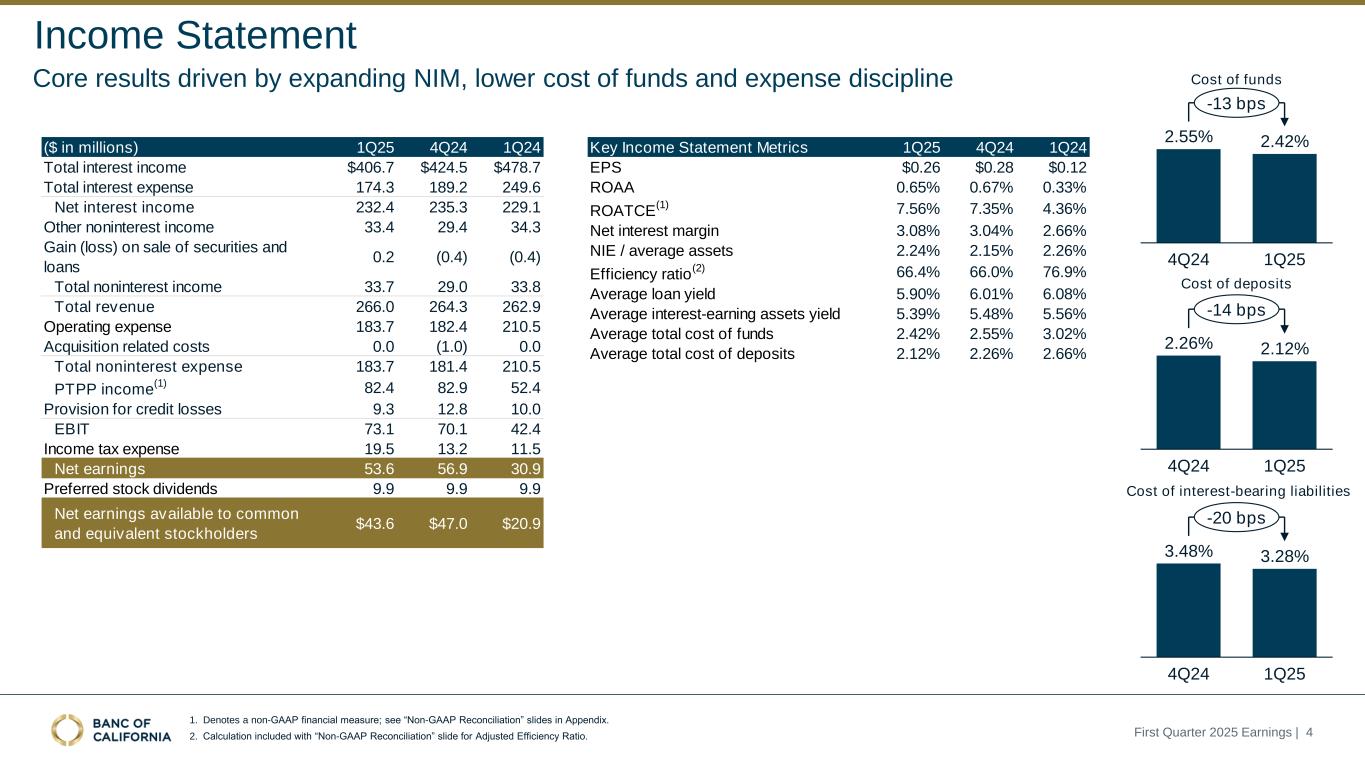
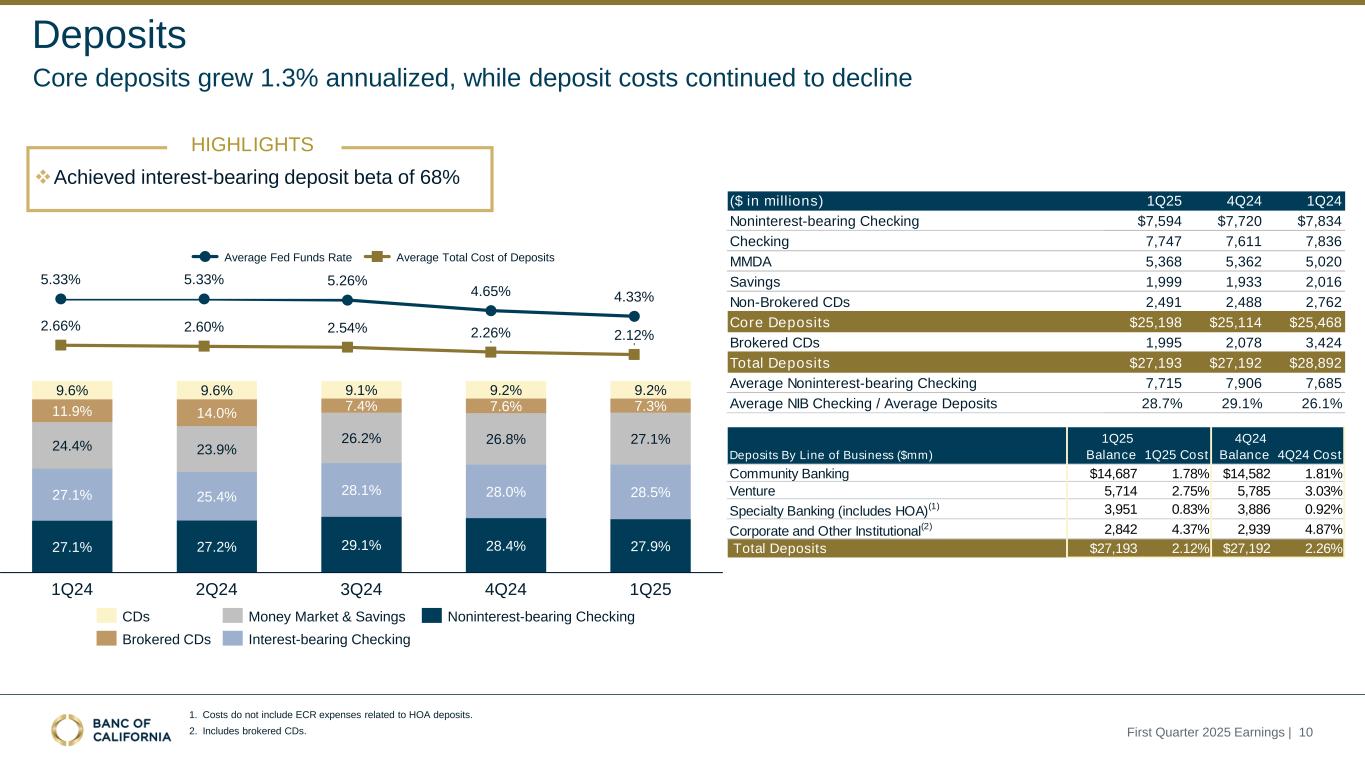
•Average total cost of deposits declined by 14 basis points to 2.12% vs 4Q24.
•Average noninterest-bearing deposits stable at 29% of average total deposits.
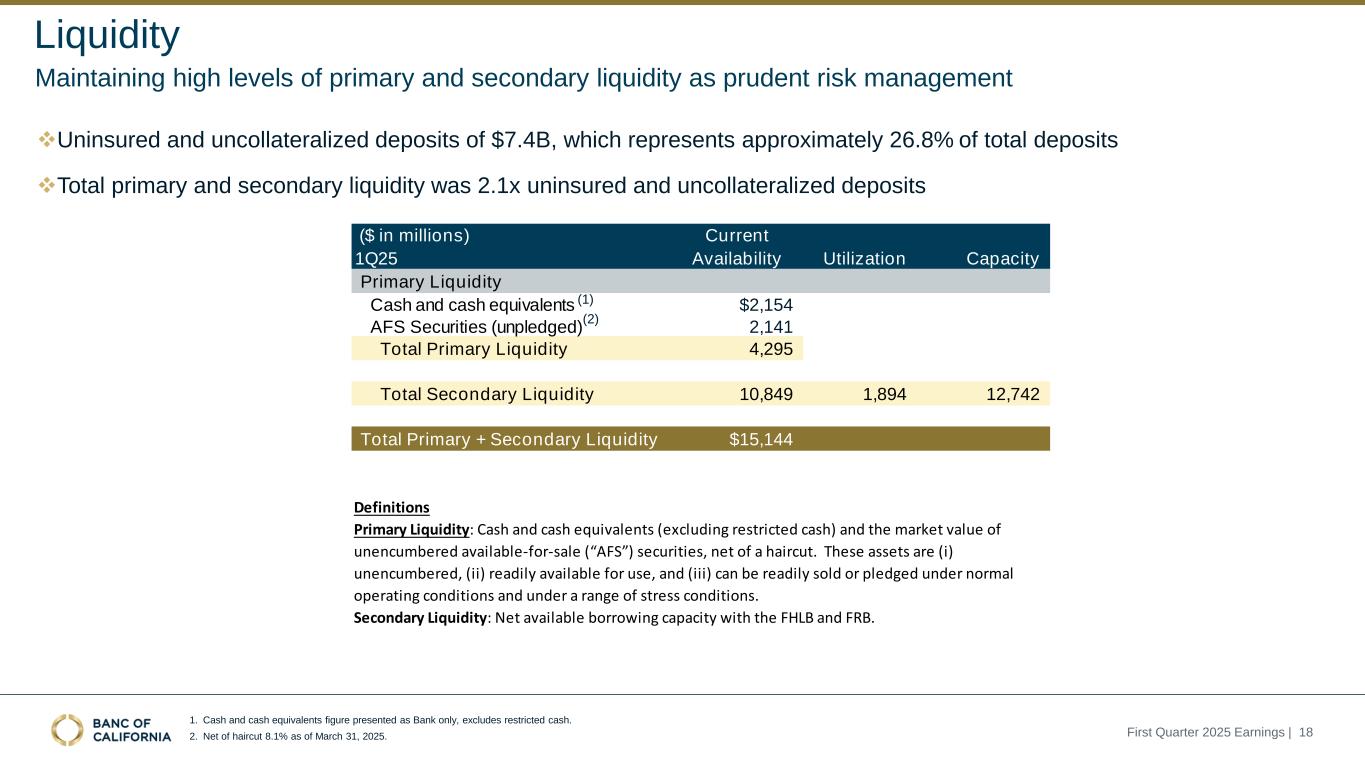
•High liquidity levels, with available on-balance sheet liquidity and unused borrowing capacity of $15.1 billion at March 31, 2025, which was 2.1 times greater than uninsured and uncollateralized deposits.
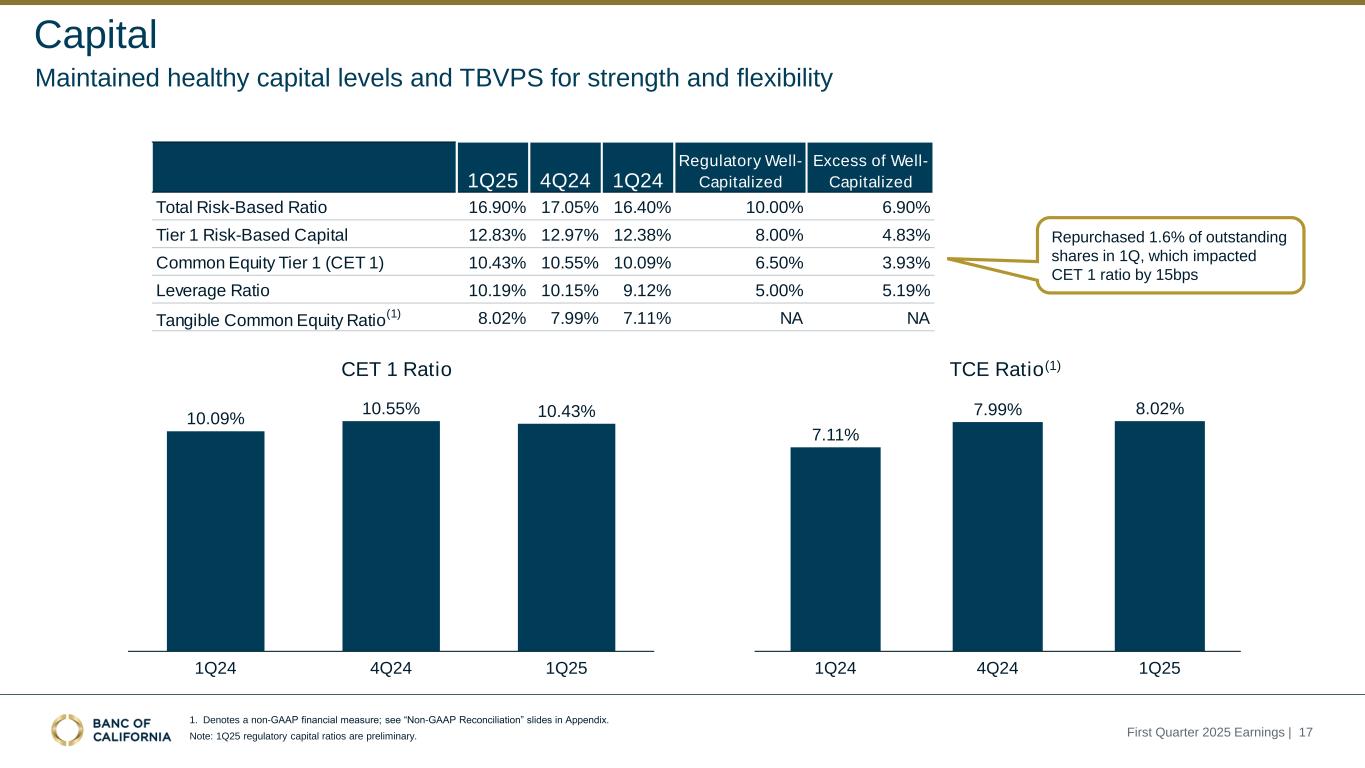
•Strong capital ratios(1) well above the regulatory thresholds for "well capitalized" banks, including an estimated 12.83% Tier 1 capital ratio and 10.43% CET 1 capital ratio.
•Continued growth in book value per share to $18.17, up 2.2% vs 4Q24 and tangible book value per share(2) to $16.12, up 2.5% vs 4Q24
•Strong credit quality with low net charge-offs at 0.24% of average loans and leases. Appropriate credit reserves with the ACL ratio mostly flat at 1.10% of total loans and leases and the economic coverage ratio(2) at 1.66%.
(1)Capital ratio for March 31, 2025 is preliminary
(2)Non-GAAP measure; refer to section 'Non-GAAP Measures'

1
Jared Wolff, President & CEO of Banc of California, commented, “Our first quarter results came in as expected, with positive trends in our core earnings drivers including net interest margin expansion, solid loan growth, and prudent expense management. We have continued to capitalize on our strong market position to bring in new attractive client relationships, providing us with high quality lending opportunities and stable deposits. As a result, both book value and tangible book value per share increased, and liquidity levels remained high. Given our healthy capital and liquidity position, and our commitment to delivering excellent, sustainable returns to our shareholders, we announced an opportunistic share buyback program in mid-March and have repurchased 6.8% of our shares as of April 21."
Mr. Wolff continued, “While the economic outlook remains uncertain, demand in our key markets continues to support expansion in our net interest margin, loan and deposit growth, and improvement in operating efficiency as we grow revenue while managing our expense levels. Our capital, liquidity, and credit loss coverage positions remain healthy, allowing us to operate comfortably under a variety of economic scenarios, including the market volatility we are currently experiencing. We remain committed to leveraging our position of strength to serve our customers and help them navigate successfully through these volatile times.”

2
INCOME STATEMENT HIGHLIGHTS
|
|
|
|
|
|
|
|
|
|
|
|
|
|
|
|
|
|
|
|
|
|
|
|
|
|
|
|
|
Three Months Ended |
|
|
|
March 31, |
|
December 31, |
|
March 31, |
|
|
|
|
|
|
|
|
| Summary Income Statement |
2025 |
|
2024 |
|
2024 |
|
|
|
|
|
|
|
|
|
(In thousands) |
| Total interest income |
$ |
406,655 |
|
|
$ |
424,519 |
|
|
$ |
478,704 |
|
|
|
|
|
|
|
|
|
| Total interest expense |
174,291 |
|
|
189,234 |
|
|
249,602 |
|
|
|
|
|
|
|
|
|
| Net interest income |
232,364 |
|
|
235,285 |
|
|
229,102 |
|
|
|
|
|
|
|
|
|
| Provision for credit losses |
9,300 |
|
|
12,801 |
|
|
10,000 |
|
|
|
|
|
|
|
|
|
| Gain (loss) on sale of loans |
211 |
|
|
20 |
|
|
(448) |
|
|
|
|
|
|
|
|
|
| Loss on sale of securities |
— |
|
|
(454) |
|
|
— |
|
|
|
|
|
|
|
|
|
| Other noninterest income |
33,439 |
|
|
29,423 |
|
|
34,264 |
|
|
|
|
|
|
|
|
|
| Total noninterest income |
33,650 |
|
|
28,989 |
|
|
33,816 |
|
|
|
|
|
|
|
|
|
| Total revenue |
266,014 |
|
|
264,274 |
|
|
262,918 |
|
|
|
|
|
|
|
|
|
| Acquisition, integration and |
|
|
|
|
|
|
|
|
|
|
|
|
|
| reorganization costs |
— |
|
|
(1,023) |
|
|
— |
|
|
|
|
|
|
|
|
|
| Other noninterest expense |
183,653 |
|
|
182,393 |
|
|
210,518 |
|
|
|
|
|
|
|
|
|
| Total noninterest expense |
183,653 |
|
|
181,370 |
|
|
210,518 |
|
|
|
|
|
|
|
|
|
| Earnings before income taxes |
73,061 |
|
|
70,103 |
|
|
42,400 |
|
|
|
|
|
|
|
|
|
| Income tax expense |
19,493 |
|
|
13,184 |
|
|
11,548 |
|
|
|
|
|
|
|
|
|
| Net earnings |
53,568 |
|
|
56,919 |
|
|
30,852 |
|
|
|
|
|
|
|
|
|
| Preferred stock dividends |
9,947 |
|
|
9,947 |
|
|
9,947 |
|
|
|
|
|
|
|
|
|
| Net earnings available to common |
|
|
|
|
|
|
|
|
|
|
|
|
|
| and equivalent stockholders |
$ |
43,621 |
|
|
$ |
46,972 |
|
|
$ |
20,905 |
|
|
|
|
|
|
|
|
|
|
|
|
|
|
|
|
|
|
|
|
|
|
|
| Diluted earnings per share |
$ |
0.26 |
|
|
$ |
0.28 |
|
|
$ |
0.12 |
|
|
|
|
|
|
|
|
|
Net Interest Income and Margin
Q1-2025 vs Q4-2024
Net interest income decreased by $2.9 million to $232.4 million for the first quarter from $235.3 million for the fourth quarter attributable primarily to the following:
•A decrease of $11.2 million in interest income from loans due primarily to lower day count, lower loan prepayments, and lower market interest rates reflective of a full quarter impact of the 50 basis points federal funds rate cuts in the fourth quarter.
•A decrease of $6.8 million in interest income from deposits in financial institutions driven by lower balances, as we maintained a lower cash target level in the first quarter, and lower market interest rates.
This was partially offset by:
•A decrease of $13.6 million in interest expense due primarily to lower interest paid on interest-bearing deposits as a result of deposit rate repricing driven by the federal funds rate cuts in the fourth quarter and lower day count.
•A decrease of $1.4 million in interest expense paid on our borrowings and subordinated debt driven by lower market interest rates.

3
The net interest margin was 3.08% for the first quarter compared to 3.04% for the fourth quarter. Our net interest margin increased by 4 basis points primarily driven by lower average total cost of funds, offset partially by lower average yield on interest-earning assets as described below:
•The average total cost of funds decreased by 13 basis points to 2.42% for the first quarter compared to 2.55% for the fourth quarter due mainly to lower market interest rates and a lower average balance of interest-bearing deposits, offset partially by a lower balance of average noninterest-bearing deposits. The average cost of deposits decreased by 14 basis points to 2.12% in the first quarter from 2.26% for the fourth quarter reflecting a full quarter impact of the federal funds rate cuts. Average total deposits decreased by $247.0 million, with average noninterest-bearing deposits decreasing by $190.9 million for the first quarter compared to the fourth quarter, and average interest-bearing deposits decreasing by $56.1 million for those same comparative periods. Average noninterest-bearing deposits represented 29% of average total deposits in both the first quarter and the fourth quarter.
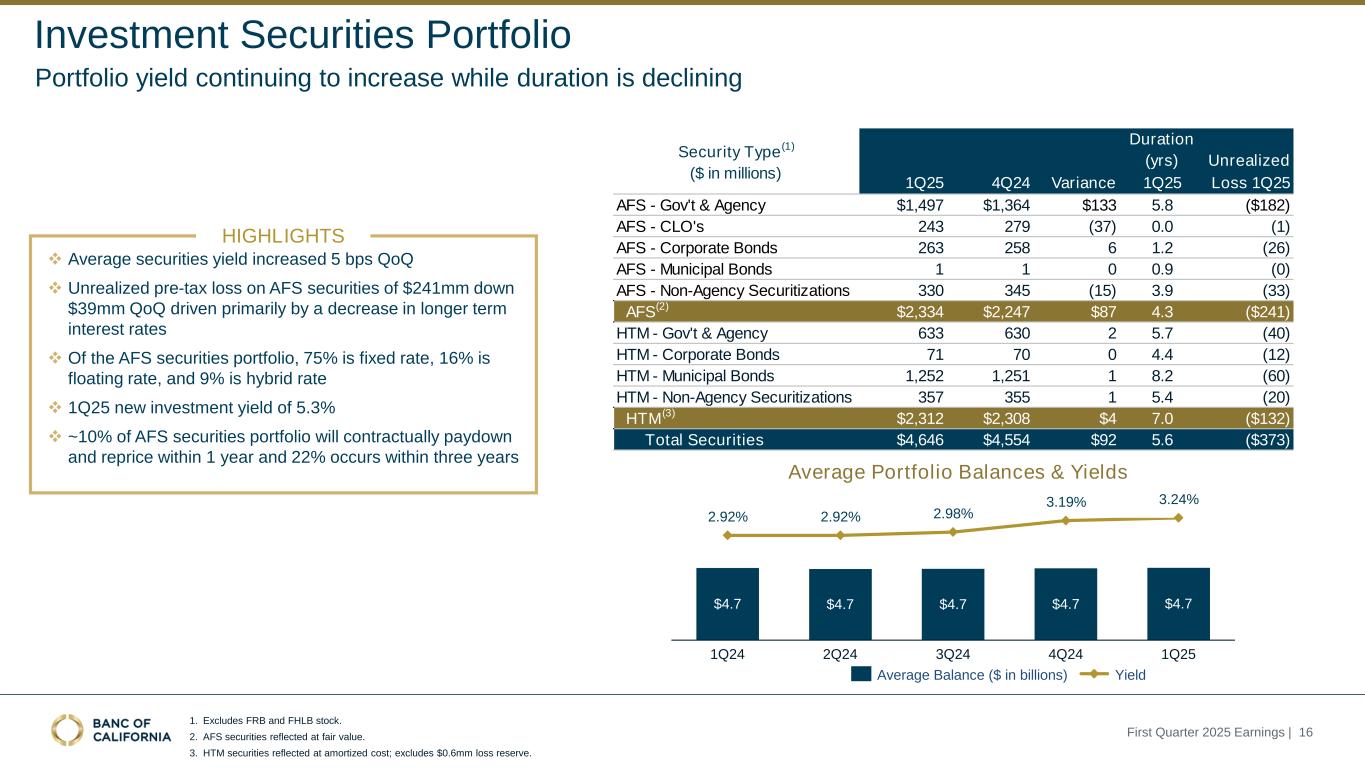
•The average yield on interest-earning assets decreased by 9 basis points to 5.39% for the first quarter compared to 5.48% for the fourth quarter due mainly to the average yield on deposits in financial institutions decreasing by 33 basis points and the average yield on loans and leases decreasing by 11 basis points, offset partially by the average yield on investment securities increasing by 5 basis points. The average yield on deposits in financial institutions was 4.41% for the first quarter compared to 4.74% for the fourth quarter, driven by the federal funds rate cuts as described above. The average yield on loans and leases was 5.90% for the first quarter compared to 6.01% for the fourth quarter due primarily to aforementioned lower loan prepayments and lower market interest rates. These decreases were partially offset by an increase in the average yield on investment securities, which was 3.24% in the first quarter compared to 3.19% in the fourth quarter as we continued to benefit from the balance sheet repositioning actions taken in 2024 and the purchase of and reinvestment into higher-yielding securities. Additionally, average deposits in financial institutions decreased by $386.6 million to $2.1 billion in the first quarter from $2.5 billion in the fourth quarter as we maintained a lower cash target level.
|
|
|
|
|
|
|
|
|
|
|
|
|
|
|
|
|
|
|
|
|
|
|
|
|
|
|
|
|
|
|
|
|
|
|
|
|
|
|
Three Months Ended |
|
Increase (Decrease) |
|
|
March 31, 2025 |
|
December 31, 2024 |
|
|
|
QoQ |
| Summary |
|
Interest |
Average |
|
|
Interest |
Average |
|
|
|
|
|
|
Average |
|
| Average Balance |
Average |
Income/ |
Yield/ |
|
Average |
Income/ |
Yield/ |
|
|
|
|
|
Average |
Yield/ |
|
| and Yield/Cost Data |
Balance |
Expense |
Cost |
|
Balance |
Expense |
Cost |
|
|
|
|
|
Balance |
Cost |
|
|
(Dollars in thousands) |
|
| Assets: |
|
|
|
|
|
|
|
|
|
|
|
|
|
|
|
Loans and leases(1) |
$ |
23,788,647 |
|
$ |
346,103 |
|
5.90 |
% |
|
$ |
23,649,271 |
|
$ |
357,303 |
|
6.01 |
% |
|
|
|
|
|
$ |
139,376 |
|
(0.11) |
% |
|
| Investment securities |
4,734,037 |
|
37,862 |
|
3.24 |
% |
|
4,700,742 |
|
37,743 |
|
3.19 |
% |
|
|
|
|
|
33,295 |
|
0.05 |
% |
|
| Deposits in financial institutions |
2,088,139 |
|
22,690 |
|
4.41 |
% |
|
2,474,732 |
|
29,473 |
|
4.74 |
% |
|
|
|
|
|
(386,593) |
|
(0.33) |
% |
|
| Total interest-earning assets |
$ |
30,610,823 |
|
$ |
406,655 |
|
5.39 |
% |
|
$ |
30,824,745 |
|
$ |
424,519 |
|
5.48 |
% |
|
|
|
|
|
$ |
(213,922) |
|
(0.09) |
% |
|
|
|
|
|
|
|
|
|
|
|
|
|
|
|
|
|
|
|
|
|
|
|
|
|
|
|
|
|
|
|
|
|
|
|
|
|
|
|
|
|
|
|
|
|
|
|
|
|
|
|
|
|
|
|
|
|
|
|
|
|
|
|
|
|
| Liabilities: |
|
|
|
|
|
|
|
|
|
|
|
|
|
|
|
|
|
|
|
|
|
|
|
|
|
|
|
|
|
|
|
|
|
|
|
|
|
|
|
|
|
|
|
|
|
|
|
|
|
|
|
|
|
|
|
|
|
|
|
|
|
|
|
|
|
|
|
|
|
|
|
|
|
|
|
|
|
|
|
| Noninterest-bearing demand |
|
|
|
|
|
|
|
|
|
|
|
|
|
|
|
| deposits |
$ |
7,714,830 |
|
|
|
|
$ |
7,905,750 |
|
|
|
|
|
|
|
|
$ |
(190,920) |
|
|
|
| Total interest-bearing deposits |
19,206,084 |
|
$ |
140,530 |
|
2.97 |
% |
|
19,262,178 |
|
$ |
154,085 |
|
3.18 |
% |
|
|
|
|
|
(56,094) |
|
(0.21) |
% |
|
|
|
|
|
|
|
|
|
|
|
|
|
|
|
|
|
|
|
|
|
|
|
|
|
|
|
|
|
|
|
|
|
| Total deposits |
$ |
26,920,914 |
|
140,530 |
|
2.12 |
% |
|
$ |
27,167,928 |
|
154,085 |
|
2.26 |
% |
|
|
|
|
|
$ |
(247,014) |
|
(0.14) |
% |
|
|
|
|
|
|
|
|
|
|
|
|
|
|
|
|
|
| Total interest-bearing liabilities |
$ |
21,546,621 |
|
$ |
174,291 |
|
3.28 |
% |
|
$ |
21,603,479 |
|
$ |
189,234 |
|
3.48 |
% |
|
|
|
|
|
$ |
(56,858) |
|
(0.20) |
% |
|
|
|
|
|
|
|
|
|
|
|
|
|
|
|
|
|
|
|
|
|
|
|
|
|
|
|
|
|
|
|
|
|
|
|
|
|
|
|
|
|
|
|
|
|
|
|
|
|
|
|
|
|
|
|
|
|
|
|
|
|
|
|
|
|
|
|
|
|
|
|
|
|
|
|
|
|
|
|
|
|
|
|
|
|
|
|
|
|
|
|
|
|
|
|
|
|
|
|
|
|
|
|
|
|
|
|
|
|
|
|
|
|
|
|
|
|
|
|
|
|
|
|
|
|
|
|
|
|
Net interest income(1) |
|
$ |
232,364 |
|
|
|
|
$ |
235,285 |
|
|
|
|
|
|
|
|
|
|
|
|
|
|
|
|
|
|
|
|
|
|
|
|
|
|
| Net interest margin |
|
|
3.08 |
% |
|
|
|
3.04 |
% |
|
|
|
|
|
|
0.04 |
% |
|
|
|
|
|
|
|
|
|
|
|
|
|
|
|
|
|
|
|
|
|
|
|
|
|
|
|
|
|
|
|
|
|
Total funds(2) |
$ |
29,261,451 |
|
$ |
174,291 |
|
2.42 |
% |
|
$ |
29,509,229 |
|
$ |
189,234 |
|
2.55 |
% |
|
|
|
|
|
$ |
(247,778) |
|
(0.13) |
% |
|
______________
(1) Includes net loan discount accretion of $16.0 million and $20.7 million for the three months ended March 31, 2025 and December 31, 2024.
(2) Total funds is the sum of total interest-bearing liabilities and noninterest-bearing demand deposits. The cost of total funds is calculated as annualized total interest expense divided by average total funds.

4
Provision For Credit Losses
Q1-2025 vs Q4-2024
The provision for credit losses was $9.3 million for the first quarter compared to $12.8 million for the fourth quarter. The first quarter provision included a $9.7 million provision for loan losses and a $0.5 million provision for unfunded loan commitments, offset partially by a $0.9 million reversal of the provision for credit losses related to held-to-maturity ("HTM") securities. The first quarter provision for loans and unfunded loan commitments was primarily driven by net charge-off activity experienced during the quarter, partially offset by lower specific reserves and changes in portfolio mix driven by growth in loan segments with low expected credit losses.
The fourth quarter provision included an $11.5 million provision for loan losses and a $1.5 million provision for unfunded loan commitments, offset partially by a $0.2 million reversal of the provision for credit losses related to available-for-sale ("AFS") securities. The fourth quarter provision for loans and unfunded loan commitments was driven primarily by net charge-off activity during the quarter.
Noninterest Income
Q1-2025 vs Q4-2024
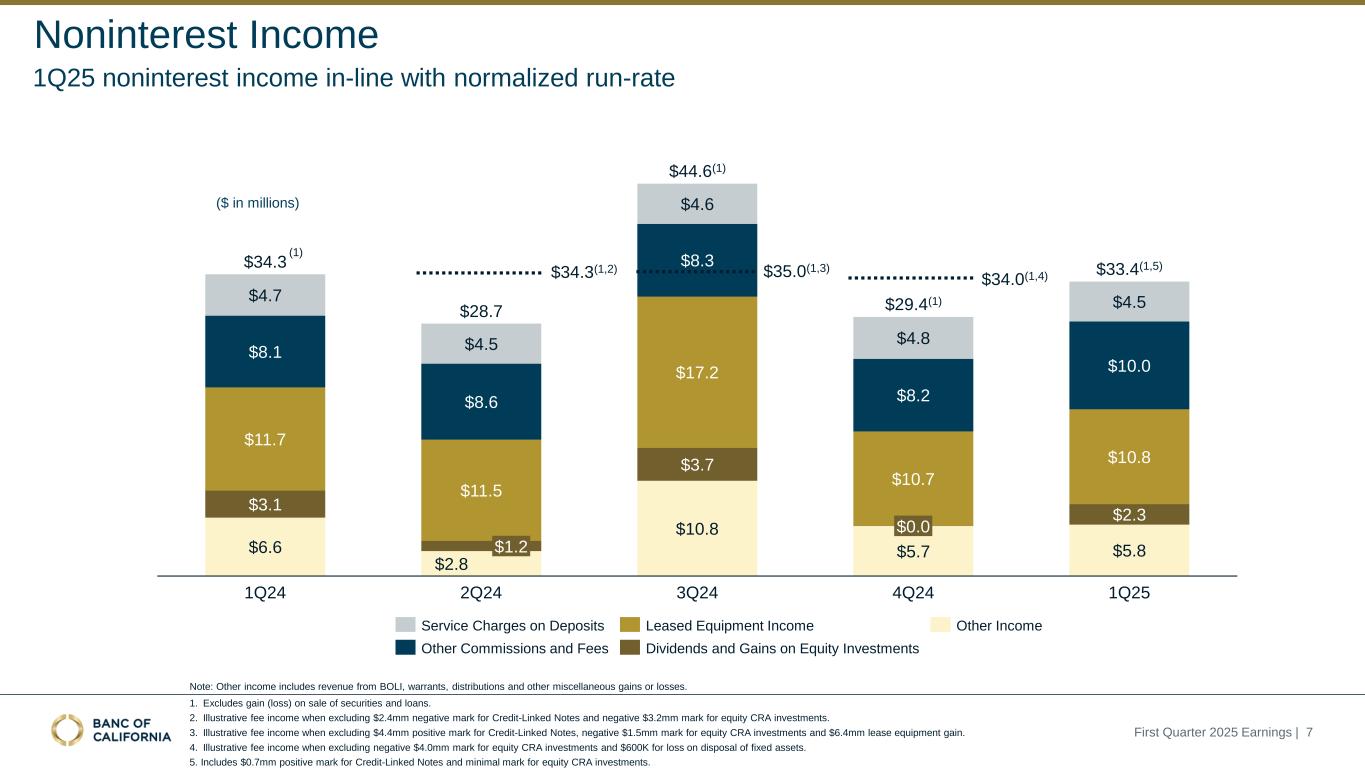
Noninterest income increased by $4.7 million to $33.7 million for the first quarter from $29.0 million for the fourth quarter due mainly to a $2.3 million increase in dividends and gains on equity investments, a $1.7 million increase in other commissions and fees, and a $0.8 million increase in other income. The increase in dividends and gains on equity investments was due to higher gains from Small Business Investment Company (“SBIC”) investments. The increase in other commissions and fees was due to higher loan-related fee income and higher customer service fees. The increase in other income was mainly driven by a $0.7 million increase in the fair value mark on credit-linked notes.
Noninterest Expense
Q1-2025 vs Q4-2024
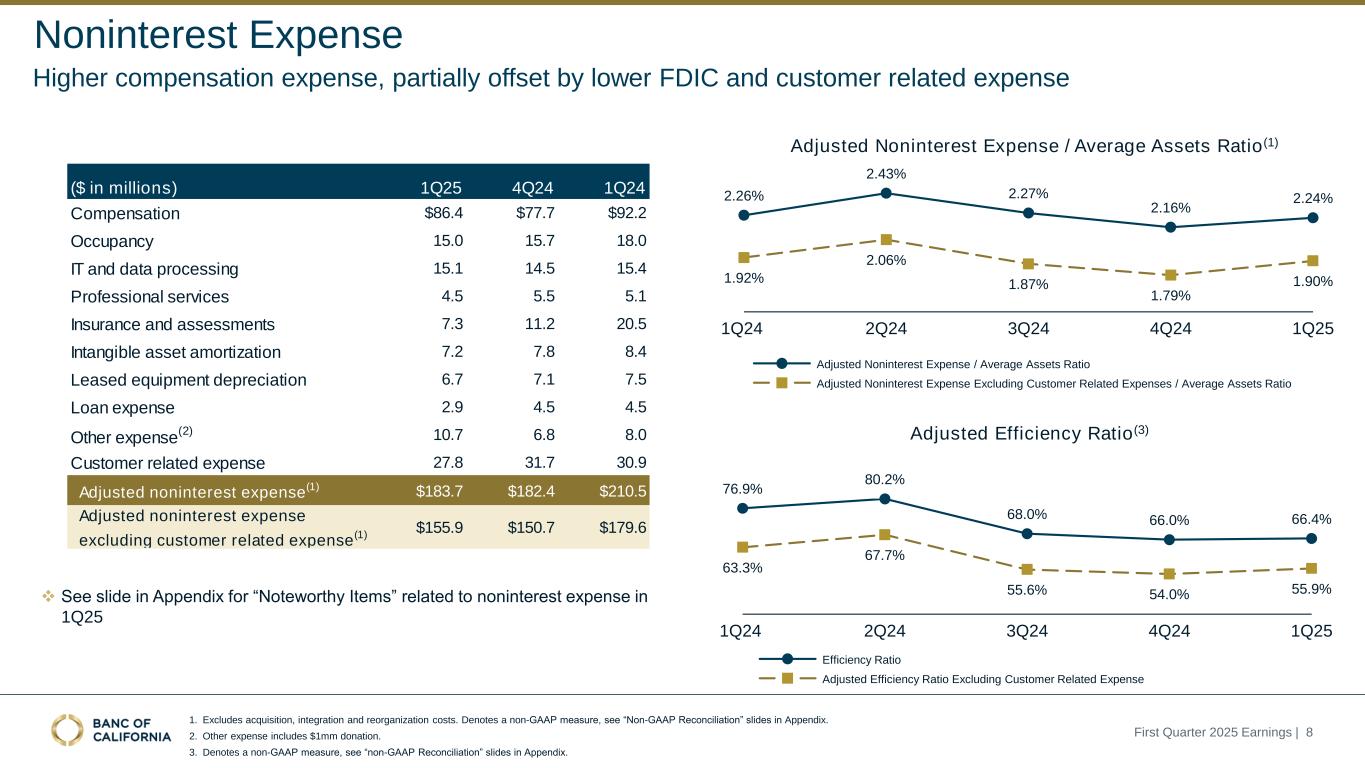
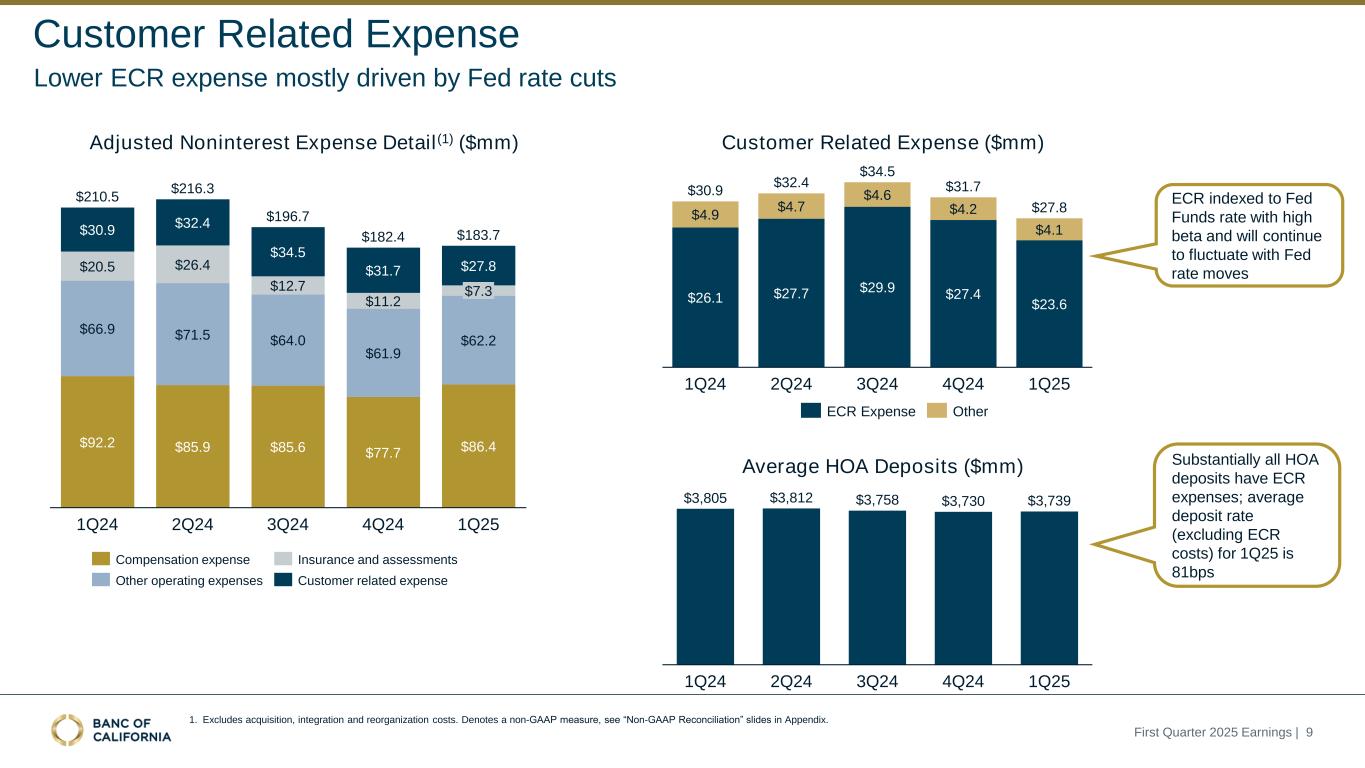
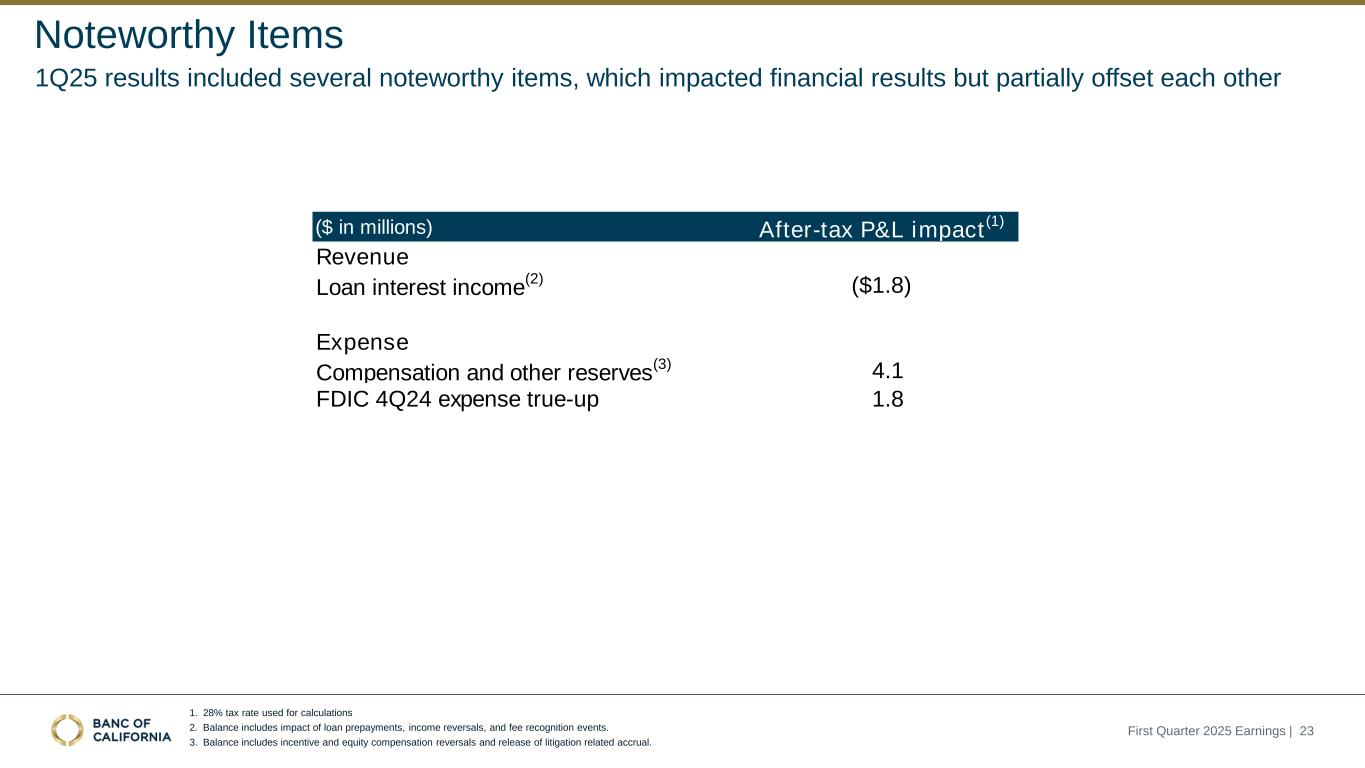
Noninterest expense increased by $2.3 million to $183.7 million for the first quarter from $181.4 million for the fourth quarter due mainly to increases of $8.8 million in compensation expenses and $3.9 million in other expenses, offset partially by decreases of $3.9 million in customer related expenses, $3.9 million in insurance and assessments expenses, and $1.6 million in loan expense. The increase in compensation was primarily due to seasonality as resets of accruals for incentive compensation, payroll taxes and benefits occur during the first quarter of the year. The increase in other expenses was primarily due to higher donations including a $1.0 million donation to the Banc of California Wildfire Relief and Recovery Fund. The decrease in customer related expenses was driven by lower earnings credit rate expenses which were impacted by the lower federal funds rate. The decrease in insurance and assessments expense was mainly due to a lower FDIC assessment and FDIC expense true-ups. The decrease in loan expenses was mostly attributable to lower legal fees driven by higher recoveries in the first quarter.
Income Taxes
Q1-2025 vs Q4-2024
Income tax expense of $19.5 million was recorded for the first quarter resulting in an effective tax rate of 26.7% compared to income tax expense of $13.2 million for the fourth quarter and an effective tax rate of 18.8%. The lower fourth quarter effective tax rate was due primarily to tax benefits resulting from recording deferred tax assets at higher state tax rates.

5
BALANCE SHEET HIGHLIGHTS
|
|
|
|
|
|
|
|
|
|
|
|
|
|
|
|
|
|
|
|
|
|
|
|
|
|
|
|
|
|
|
|
|
|
|
March 31, |
|
December 31, |
|
March 31, |
|
|
|
|
|
Increase (Decrease) |
| Selected Balance Sheet Items |
2025 |
|
2024 |
|
2024 |
|
|
|
|
|
QoQ |
|
YoY |
|
(In thousands) |
| Cash and cash equivalents |
$ |
2,343,889 |
|
|
$ |
2,502,212 |
|
|
$ |
3,085,228 |
|
|
|
|
|
|
$ |
(158,323) |
|
|
$ |
(741,339) |
|
| Securities available-for-sale |
2,334,058 |
|
|
2,246,839 |
|
|
2,286,682 |
|
|
|
|
|
|
87,219 |
|
|
47,376 |
|
| Securities held-to-maturity |
2,311,912 |
|
|
2,306,149 |
|
|
2,291,984 |
|
|
|
|
|
|
5,763 |
|
|
19,928 |
|
| Loans held for sale |
25,797 |
|
|
26,331 |
|
|
80,752 |
|
|
|
|
|
|
(534) |
|
|
(54,955) |
|
| Loans and leases held for investment |
24,126,527 |
|
|
23,781,663 |
|
|
25,473,022 |
|
|
|
|
|
|
344,864 |
|
|
(1,346,495) |
|
| Total assets |
33,779,918 |
|
|
33,542,864 |
|
|
36,073,516 |
|
|
|
|
|
|
237,054 |
|
|
(2,293,598) |
|
|
|
|
|
|
|
|
|
|
|
|
|
|
|
| Noninterest-bearing deposits |
$ |
7,593,950 |
|
|
$ |
7,719,913 |
|
|
$ |
7,833,608 |
|
|
|
|
|
|
$ |
(125,963) |
|
|
$ |
(239,658) |
|
| Total deposits |
27,193,191 |
|
|
27,191,909 |
|
|
28,892,407 |
|
|
|
|
|
|
1,282 |
|
|
(1,699,216) |
|
| Borrowings |
1,670,782 |
|
|
1,391,814 |
|
|
2,139,498 |
|
|
|
|
|
|
278,968 |
|
|
(468,716) |
|
| Total liabilities |
30,258,262 |
|
|
30,042,915 |
|
|
32,679,366 |
|
|
|
|
|
|
215,347 |
|
|
(2,421,104) |
|
| Total stockholders' equity |
3,521,656 |
|
|
3,499,949 |
|
|
3,394,150 |
|
|
|
|
|
|
21,707 |
|
|
127,506 |
|
Securities
AFS securities increased by $87.2 million during the first quarter to $2.3 billion at March 31, 2025. AFS securities had aggregate unrealized net after-tax losses in accumulated other comprehensive income (loss) ("AOCI") of $172.5 million. These AFS unrealized net losses related primarily to changes in overall interest rates and spreads and the resulting impact on valuations.
The balance of HTM securities increased by $5.8 million in the first quarter to $2.3 billion at March 31, 2025. As of March 31, 2025, HTM securities had aggregate unrealized net after-tax losses in AOCI of $151.9 million remaining from the balance established at the time of transfer from AFS on June 1, 2022.

6
Loans and Leases
The following table sets forth the composition, by loan category, of our loan and lease portfolio held for investment as of the dates indicated:
|
|
|
|
|
|
|
|
|
|
|
|
|
|
|
|
|
|
|
|
|
|
|
|
|
|
|
|
|
|
|
March 31, |
|
December 31, |
|
September 30, |
|
June 30, |
|
March 31, |
|
2025 |
|
2024 |
|
2024 |
|
2024 |
|
2024 |
|
(Dollars in thousands) |
| Composition of Loans and Leases |
|
|
|
|
|
|
|
|
|
| Real estate mortgage: |
|
|
|
|
|
|
|
|
|
| Commercial |
$ |
4,489,543 |
|
|
$ |
4,578,772 |
|
|
$ |
4,557,939 |
|
|
$ |
4,722,585 |
|
|
$ |
4,896,544 |
|
| Multi-family |
6,216,084 |
|
|
6,041,713 |
|
|
6,009,280 |
|
|
5,984,930 |
|
|
6,121,472 |
|
| Other residential |
2,787,031 |
|
|
2,807,174 |
|
|
2,767,187 |
|
|
2,866,085 |
|
|
4,949,383 |
|
| Total real estate mortgage |
13,492,658 |
|
|
13,427,659 |
|
|
13,334,406 |
|
|
13,573,600 |
|
|
15,967,399 |
|
| Real estate construction and land: |
|
|
|
|
|
|
|
|
|
| Commercial |
733,684 |
|
|
799,131 |
|
|
836,902 |
|
|
784,166 |
|
|
775,021 |
|
| Residential |
2,127,354 |
|
|
2,373,162 |
|
|
2,622,507 |
|
|
2,573,431 |
|
|
2,470,333 |
|
| Total real estate construction and land |
2,861,038 |
|
|
3,172,293 |
|
|
3,459,409 |
|
|
3,357,597 |
|
|
3,245,354 |
|
| Total real estate |
16,353,696 |
|
|
16,599,952 |
|
|
16,793,815 |
|
|
16,931,197 |
|
|
19,212,753 |
|
| Commercial: |
|
|
|
|
|
|
|
|
|
| Asset-based |
2,305,325 |
|
|
2,087,969 |
|
|
2,115,311 |
|
|
1,968,713 |
|
|
2,061,016 |
|
| Venture capital |
1,733,074 |
|
|
1,537,776 |
|
|
1,353,626 |
|
|
1,456,122 |
|
|
1,513,641 |
|
| Other commercial |
3,340,400 |
|
|
3,153,084 |
|
|
2,850,535 |
|
|
2,446,974 |
|
|
2,245,910 |
|
| Total commercial |
7,378,799 |
|
|
6,778,829 |
|
|
6,319,472 |
|
|
5,871,809 |
|
|
5,820,567 |
|
| Consumer |
394,032 |
|
|
402,882 |
|
|
414,490 |
|
|
425,903 |
|
|
439,702 |
|
| Total loans and leases held for |
|
|
|
|
|
|
|
|
|
| investment |
$ |
24,126,527 |
|
|
$ |
23,781,663 |
|
|
$ |
23,527,777 |
|
|
$ |
23,228,909 |
|
|
$ |
25,473,022 |
|
|
|
|
|
|
|
|
|
|
|
| Total unfunded loan commitments |
$ |
4,858,960 |
|
|
$ |
4,887,690 |
|
|
$ |
5,008,449 |
|
|
$ |
5,256,473 |
|
|
$ |
5,482,672 |
|
|
|
|
|
|
|
|
|
|
|
| Composition as % of Total |
|
|
|
|
|
|
|
|
|
| Loans and Leases |
|
|
|
|
|
|
|
|
|
| Real estate mortgage: |
|
|
|
|
|
|
|
|
|
| Commercial |
19 |
% |
|
19 |
% |
|
19 |
% |
|
20 |
% |
|
19 |
% |
| Multi-family |
26 |
% |
|
26 |
% |
|
25 |
% |
|
26 |
% |
|
24 |
% |
| Other residential |
11 |
% |
|
12 |
% |
|
12 |
% |
|
12 |
% |
|
19 |
% |
| Total real estate mortgage |
56 |
% |
|
57 |
% |
|
56 |
% |
|
58 |
% |
|
62 |
% |
| Real estate construction and land: |
|
|
|
|
|
|
|
|
|
| Commercial |
3 |
% |
|
3 |
% |
|
4 |
% |
|
4 |
% |
|
3 |
% |
| Residential |
9 |
% |
|
10 |
% |
|
11 |
% |
|
11 |
% |
|
10 |
% |
| Total real estate construction and land |
12 |
% |
|
13 |
% |
|
15 |
% |
|
15 |
% |
|
13 |
% |
| Total real estate |
68 |
% |
|
70 |
% |
|
71 |
% |
|
73 |
% |
|
75 |
% |
| Commercial: |
|
|
|
|
|
|
|
|
|
| Asset-based |
9 |
% |
|
9 |
% |
|
9 |
% |
|
8 |
% |
|
8 |
% |
| Venture capital |
7 |
% |
|
6 |
% |
|
6 |
% |
|
6 |
% |
|
6 |
% |
| Other commercial |
14 |
% |
|
13 |
% |
|
12 |
% |
|
11 |
% |
|
9 |
% |
| Total commercial |
30 |
% |
|
28 |
% |
|
27 |
% |
|
25 |
% |
|
23 |
% |
| Consumer |
2 |
% |
|
2 |
% |
|
2 |
% |
|
2 |
% |
|
2 |
% |
| Total loans and leases held for |
|
|
|
|
|
|
|
|
|
| investment |
100 |
% |
|
100 |
% |
|
100 |
% |
|
100 |
% |
|
100 |
% |

7
Total loans and leases held for investment increased by $344.9 million in the first quarter and totaled $24.1 billion at March 31, 2025. The increase in loans and leases held for investment was due primarily to increased balances in the asset-based, venture capital, other commercial, and multi-family loan portfolios, offset partially by a decrease in the real estate construction and land loan segment, and the commercial real estate mortgage and other residential real estate mortgage loan portfolios. Loan originations including production, purchased loans, and unfunded new commitments were $2.6 billion in the first quarter, most of which onboarded towards the end of the quarter, with a weighted average interest rate on production of 7.20%.
Credit Quality
|
|
|
|
|
|
|
|
|
|
|
|
|
|
|
|
|
|
|
|
|
|
|
|
|
|
|
|
|
|
|
March 31, |
|
December 31, |
|
September 30, |
|
June 30, |
|
March 31, |
| Asset Quality Information and Ratios |
2025 |
|
2024 |
|
2024 |
|
2024 |
|
2024 |
|
(Dollars in thousands) |
| Delinquent loans and leases held for |
|
|
|
|
|
|
|
|
|
| investment: |
|
|
|
|
|
|
|
|
|
| 30 to 89 days delinquent |
$ |
100,664 |
|
|
$ |
91,347 |
|
|
$ |
52,927 |
|
|
$ |
27,962 |
|
|
$ |
178,421 |
|
| 90+ days delinquent |
99,976 |
|
|
88,846 |
|
|
72,037 |
|
|
55,792 |
|
|
57,573 |
|
| Total delinquent loans and leases |
$ |
200,640 |
|
|
$ |
180,193 |
|
|
$ |
124,964 |
|
|
$ |
83,754 |
|
|
$ |
235,994 |
|
|
|
|
|
|
|
|
|
|
|
| Total delinquent loans and leases to |
|
|
|
|
|
|
|
|
|
| loans and leases held for investment |
0.83 |
% |
|
0.76 |
% |
|
0.53 |
% |
|
0.36 |
% |
|
0.93 |
% |
|
|
|
|
|
|
|
|
|
|
| Nonperforming assets, excluding loans |
|
|
|
|
|
|
|
|
|
| held for sale: |
|
|
|
|
|
|
|
|
|
| Nonaccrual loans and leases |
$ |
213,480 |
|
|
$ |
189,605 |
|
|
$ |
168,341 |
|
|
$ |
117,070 |
|
|
$ |
145,785 |
|
| 90+ days delinquent loans and still |
|
|
|
|
|
|
|
|
|
| accruing |
— |
|
|
— |
|
|
— |
|
|
— |
|
|
— |
|
| Total nonperforming loans and |
|
|
|
|
|
|
|
|
|
| leases ("NPLs") |
213,480 |
|
|
189,605 |
|
|
168,341 |
|
|
117,070 |
|
|
145,785 |
|
| Foreclosed assets, net |
5,474 |
|
|
9,734 |
|
|
8,661 |
|
|
13,302 |
|
|
12,488 |
|
| Total nonperforming assets ("NPAs") |
$ |
218,954 |
|
|
$ |
199,339 |
|
|
$ |
177,002 |
|
|
$ |
130,372 |
|
|
$ |
158,273 |
|
|
|
|
|
|
|
|
|
|
|
| Classified loans and leases held for |
|
|
|
|
|
|
|
|
|
| investment |
$ |
764,723 |
|
|
$ |
563,502 |
|
|
$ |
533,591 |
|
|
$ |
415,498 |
|
|
$ |
366,729 |
|
| Allowance for loan and lease losses |
$ |
234,986 |
|
|
$ |
239,360 |
|
|
$ |
254,345 |
|
|
$ |
247,762 |
|
|
$ |
291,503 |
|
| Allowance for loan and lease losses |
|
|
|
|
|
|
|
|
|
| to NPLs |
110.07 |
% |
|
126.24 |
% |
|
151.09 |
% |
|
211.64 |
% |
|
199.95 |
% |
| NPLs to loans and leases held for |
|
|
|
|
|
|
|
|
|
| investment |
0.88 |
% |
|
0.80 |
% |
|
0.72 |
% |
|
0.50 |
% |
|
0.57 |
% |
| NPAs to total assets |
0.65 |
% |
|
0.59 |
% |
|
0.53 |
% |
|
0.37 |
% |
|
0.44 |
% |
| Classified loans and leases to loans |
|
|
|
|
|
|
|
|
|
| and leases held for investment |
3.17 |
% |
|
2.37 |
% |
|
2.27 |
% |
|
1.79 |
% |
|
1.44 |
% |
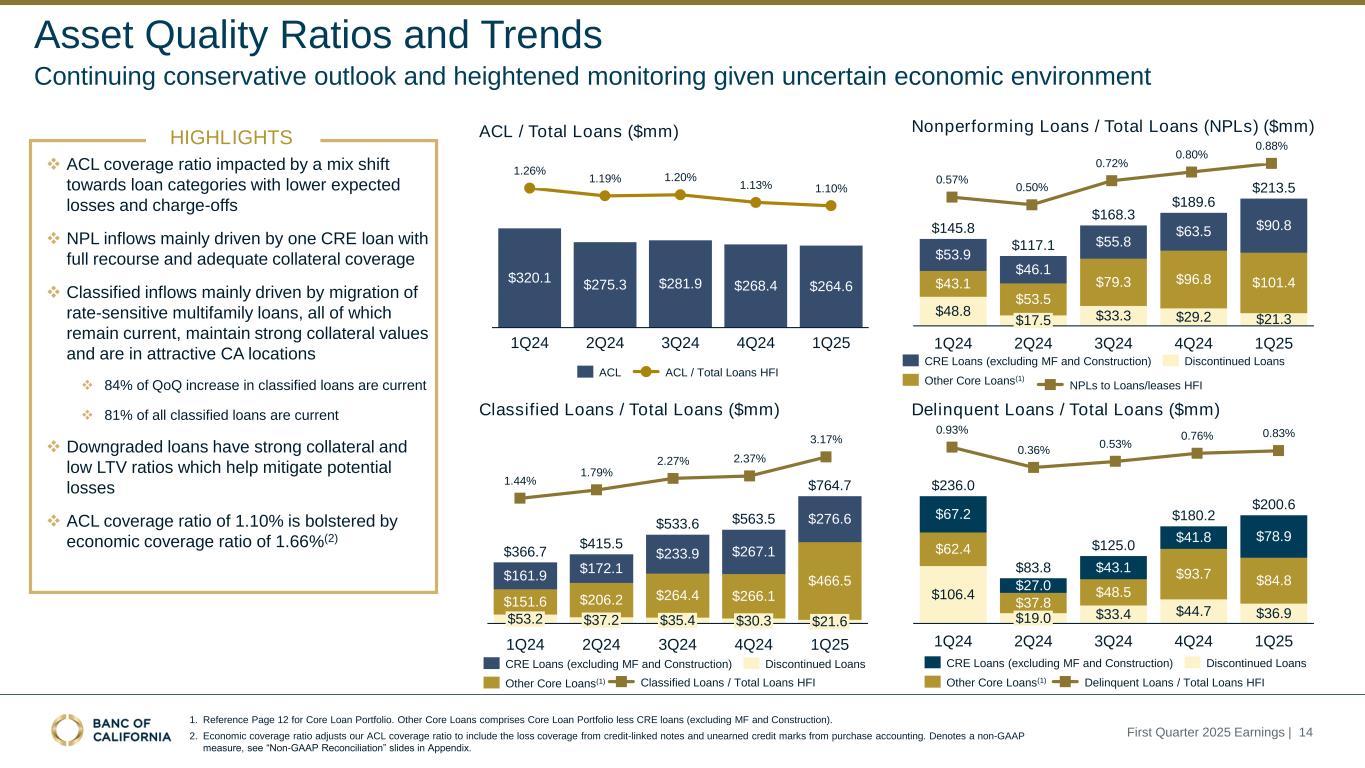
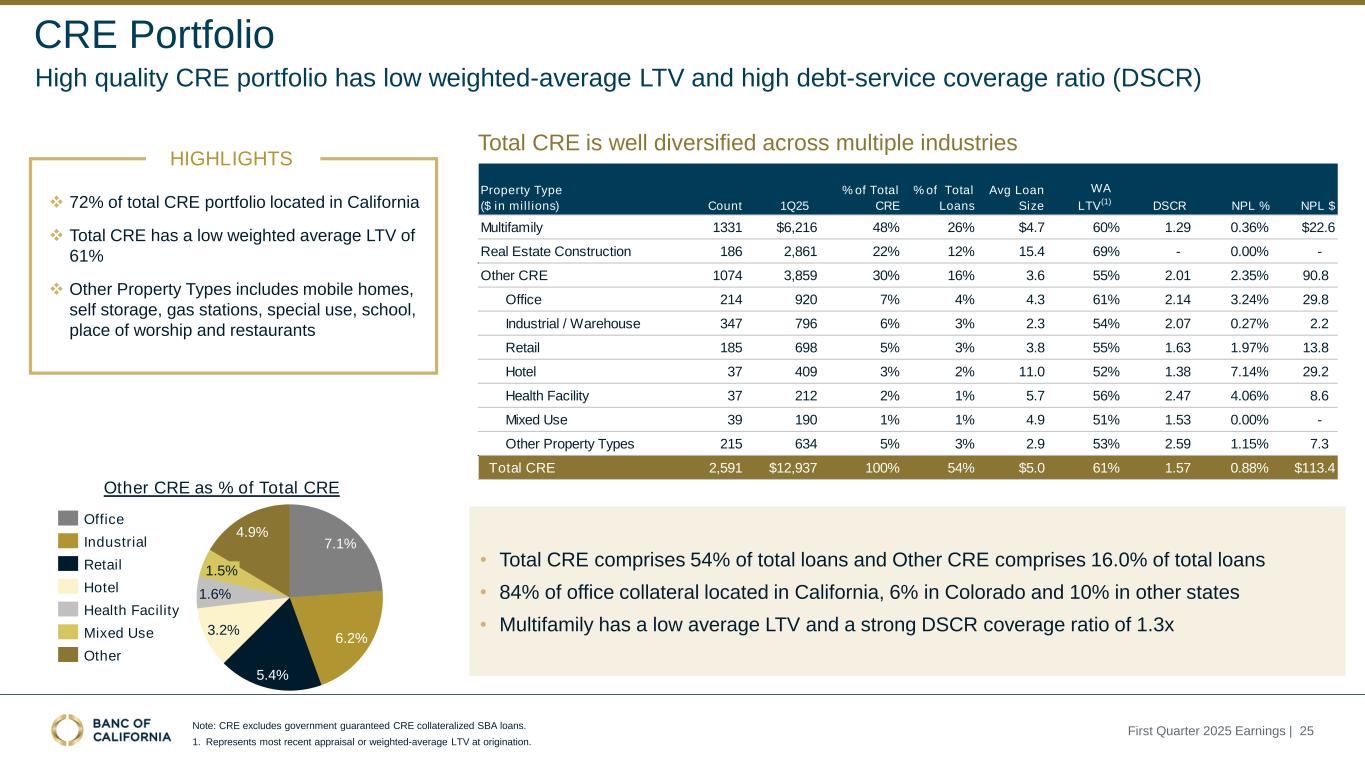
The overall quality of our loan portfolio remains strong, supported by disciplined underwriting, borrower strength, and robust credit metrics. In light of the current economic uncertainty, we enhanced our credit monitoring process to more proactively manage potential risks. In the first quarter, credit downgrades were primarily driven by rate-sensitive loans in the higher interest rate environment, although these loans are well-collateralized with low loan-to-value ("LTV") ratios that we believe mitigates the risk of potential losses. Classified inflows were mainly driven by migration of rate-sensitive multifamily loans, all of which remain current, maintain strong collateral values, and are in attractive California locations. Nonperforming and delinquent loan inflows in the quarter were mainly driven by one commercial real estate loan which is full recourse to the guarantor and we believe has adequate collateral coverage.

8
At March 31, 2025, total delinquent loans and leases were $200.6 million, compared to $180.2 million at December 31, 2024. The $20.4 million increase in total delinquent loans was due mainly to an increase in the 30 to 89 days delinquent category of $27.0 million in commercial real estate mortgage loans, offset partially by decreases of $8.6 million in multi-family real estate mortgage loans and $5.5 million in venture capital loans. In the 90 or more days delinquent category, there was a $14.9 million increase in commercial real estate mortgage loans, offset partially by decreases of $2.6 million in other residential real estate mortgage loans and $2.4 million in other commercial loans. Total delinquent loans and leases as a percentage of loans and leases held for investment increased to 0.83% at March 31, 2025, compared to 0.76% at December 31, 2024.
At March 31, 2025, nonperforming loans and leases were $213.5 million, compared to $189.6 million at December 31, 2024. During the first quarter, nonperforming loans and leases increased by $23.9 million due to additions of $67.8 million, offset partially by charge-offs of $12.6 million and payoffs, paydowns, and other reductions of $31.3 million. The addition to nonperforming loans and leases was mainly related to the one commercial real estate loan as described above.
Nonperforming loans and leases as a percentage of loans and leases held for investment increased to 0.88% at March 31, 2025 compared to 0.80% at December 31, 2024.
At March 31, 2025, nonperforming assets were $219.0 million, or 0.65% of total assets, compared to $199.3 million, or 0.59% of total assets, as of December 31, 2024. At March 31, 2025, nonperforming assets included $5.5 million of foreclosed assets, consisting primarily of single-family residences.

9
Allowance for Credit Losses – Loans
|
|
|
|
|
|
|
|
|
|
|
|
|
|
|
|
|
|
|
|
|
|
|
Three Months Ended |
|
March 31, |
|
December 31, |
|
|
|
|
|
March 31, |
| Allowance for Credit Losses - Loans |
2025 |
|
2024 |
|
|
|
|
|
2024 |
|
(Dollars in thousands) |
| Allowance for loan and lease losses |
|
|
|
|
|
|
|
|
|
| ("ALLL"): |
|
|
|
|
|
|
|
|
|
| Balance at beginning of period |
$ |
239,360 |
|
|
$ |
254,345 |
|
|
|
|
|
|
$ |
281,687 |
|
| Charge-offs |
(16,551) |
|
|
(27,696) |
|
|
|
|
|
|
(5,014) |
|
| Recoveries |
2,477 |
|
|
1,211 |
|
|
|
|
|
|
3,830 |
|
| Net charge-offs |
(14,074) |
|
|
(26,485) |
|
|
|
|
|
|
(1,184) |
|
| Provision for loan losses |
9,700 |
|
|
11,500 |
|
|
|
|
|
|
11,000 |
|
| Balance at end of period |
$ |
234,986 |
|
|
$ |
239,360 |
|
|
|
|
|
|
$ |
291,503 |
|
|
|
|
|
|
|
|
|
|
|
| Reserve for unfunded loan commitments |
|
|
|
|
|
|
|
|
|
| ("RUC"): |
|
|
|
|
|
|
|
|
|
| Balance at beginning of period |
$ |
29,071 |
|
|
$ |
27,571 |
|
|
|
|
|
|
$ |
29,571 |
|
| Provision for credit losses |
500 |
|
|
1,500 |
|
|
|
|
|
|
(1,000) |
|
| Balance at end of period |
$ |
29,571 |
|
|
$ |
29,071 |
|
|
|
|
|
|
$ |
28,571 |
|
|
|
|
|
|
|
|
|
|
|
| Allowance for credit losses ("ACL") - |
|
|
|
|
|
|
|
|
|
| Loans: |
|
|
|
|
|
|
|
|
|
| Balance at beginning of period |
$ |
268,431 |
|
|
$ |
281,916 |
|
|
|
|
|
|
$ |
311,258 |
|
| Charge-offs |
(16,551) |
|
|
(27,696) |
|
|
|
|
|
|
(5,014) |
|
| Recoveries |
2,477 |
|
|
1,211 |
|
|
|
|
|
|
3,830 |
|
| Net charge-offs |
(14,074) |
|
|
(26,485) |
|
|
|
|
|
|
(1,184) |
|
| Provision for credit losses |
10,200 |
|
|
13,000 |
|
|
|
|
|
|
10,000 |
|
| Balance at end of period |
$ |
264,557 |
|
|
$ |
268,431 |
|
|
|
|
|
|
$ |
320,074 |
|
|
|
|
|
|
|
|
|
|
|
| ALLL to loans and leases held for |
|
|
|
|
|
|
|
|
|
| investment |
0.97 |
% |
|
1.01 |
% |
|
|
|
|
|
1.14 |
% |
| ACL to loans and leases held for |
|
|
|
|
|
|
|
|
|
| investment |
1.10 |
% |
|
1.13 |
% |
|
|
|
|
|
1.26 |
% |
| ACL to NPLs |
123.93 |
% |
|
141.57 |
% |
|
|
|
|
|
219.55 |
% |
| ACL to NPAs |
120.83 |
% |
|
134.66 |
% |
|
|
|
|
|
202.23 |
% |
| Annualized net charge-offs to average |
|
|
|
|
|
|
|
|
|
| loans and leases |
0.24 |
% |
|
0.45 |
% |
|
|
|
|
|
0.02 |
% |
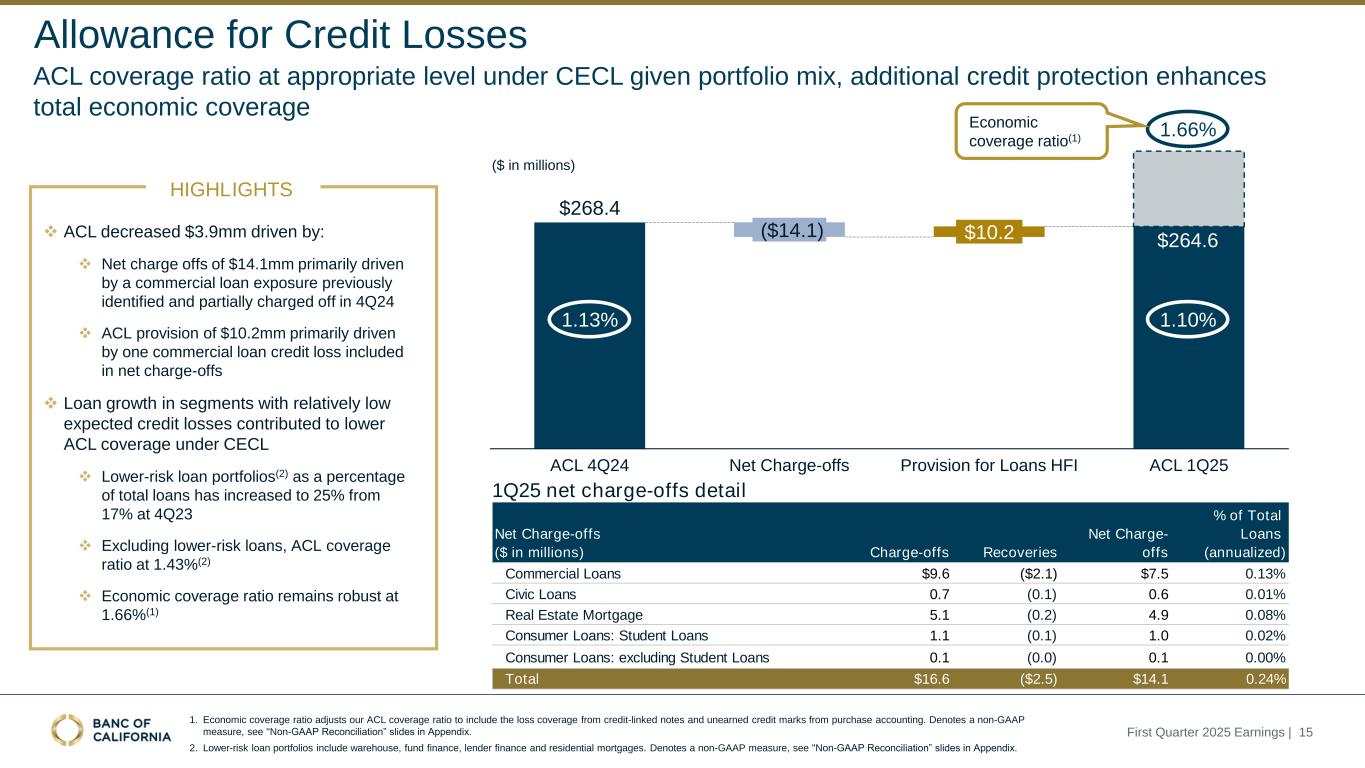
The allowance for credit losses - loans, which includes the reserve for unfunded loan commitments, totaled $264.6 million, or 1.10% of total loans and leases, at March 31, 2025, compared to $268.4 million, or 1.13% of total loans and leases, at December 31, 2024. The $3.9 million decrease in the allowance was due to net charge-offs of $14.1 million, offset partially by a $10.2 million provision. The decrease in the ACL coverage ratio was driven by improvement in the economic forecast compared to the fourth quarter, a shift in the portfolio mix driven by growth in loan categories with lower expected losses, and the impact of charge-offs, offset partially by the impact of changes in risk ratings in the venture lending and commercial construction loan portfolios.
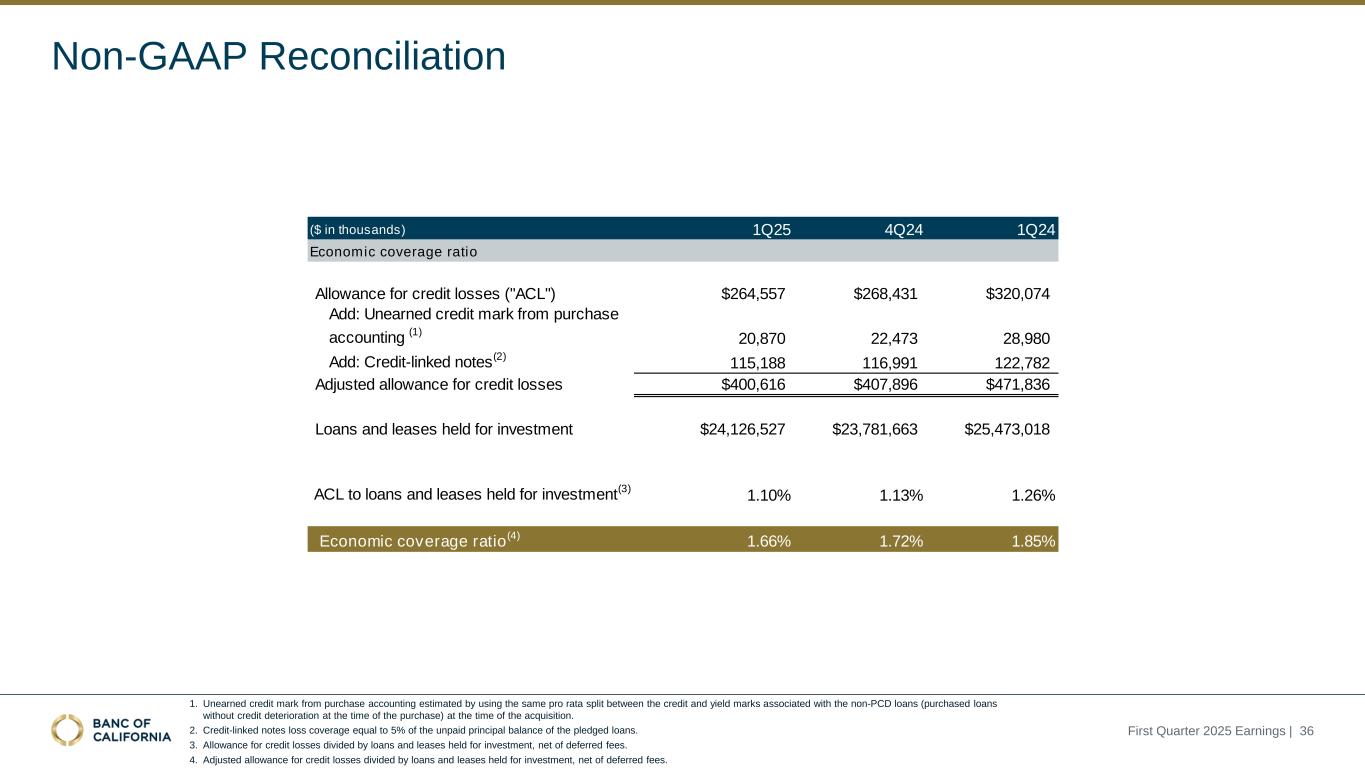
Our ability to absorb credit losses is also bolstered by (i) $115.2 million of loss coverage from the credit-linked notes, pursuant to which the bank sold the first 5% of any losses on $2.3 billion of single-family residential mortgage loans in our portfolio; and (ii) unearned credit marks of $20.9 million on approximately $1.5 billion of purchased loans without credit deterioration that were originated by Banc of California prior to the merger. When the loss coverage from the credit-linked notes and unearned credit marks is added to our allowance for credit losses, this provides additional economic coverage on top of our ACL ratio. We refer to this adjusted ACL ratio as our economic coverage ratio(1), which equaled 1.66% of total loans and leases at March 31, 2025 compared to 1.72% at December 31, 2024.
(1) Non-GAAP measure; refer to section 'Non-GAAP Measures'

10
The ACL coverage of nonperforming loans and leases was 124% at March 31, 2025 compared to 142% at December 31, 2024.
Net charge-offs were 0.24% of average loans and leases (annualized) for the first quarter, compared to 0.45% for the fourth quarter. The decrease in net charge-offs in the first quarter was attributable primarily to two commercial loans, one loan secured by an office property and another commercial real estate loan. One of the charge-offs recognized during the quarter was specifically reserved for in December 2024.
Deposits and Client Investment Funds
The following table sets forth the composition of our deposits at the dates indicated:
|
|
|
|
|
|
|
|
|
|
|
|
|
|
|
|
|
|
|
|
|
|
|
|
|
|
|
|
|
|
|
March 31, |
|
December 31, |
|
September 30, |
|
June 30, |
|
March 31, |
|
2025 |
|
2024 |
|
2024 |
|
2024 |
|
2024 |
|
(Dollars in thousands) |
| Composition of Deposits |
|
|
|
|
|
|
|
|
|
| Noninterest-bearing checking |
$ |
7,593,950 |
|
|
$ |
7,719,913 |
|
|
$ |
7,811,796 |
|
|
$ |
7,825,007 |
|
|
$ |
7,833,608 |
|
| Interest-bearing: |
|
|
|
|
|
|
|
|
|
| Checking |
7,747,051 |
|
|
7,610,705 |
|
|
7,539,899 |
|
|
7,309,833 |
|
|
7,836,097 |
|
| Money market |
5,367,788 |
|
|
5,361,635 |
|
|
5,039,607 |
|
|
4,837,025 |
|
|
5,020,110 |
|
| Savings |
1,999,062 |
|
|
1,933,232 |
|
|
1,992,364 |
|
|
2,040,461 |
|
|
2,016,398 |
|
| Time deposits: |
|
|
|
|
|
|
|
|
|
| Non-brokered |
2,490,639 |
|
|
2,488,217 |
|
|
2,451,340 |
|
|
2,758,067 |
|
|
2,761,836 |
|
| Brokered |
1,994,701 |
|
|
2,078,207 |
|
|
1,993,263 |
|
|
4,034,057 |
|
|
3,424,358 |
|
| Total time deposits |
4,485,340 |
|
|
4,566,424 |
|
|
4,444,603 |
|
|
6,792,124 |
|
|
6,186,194 |
|
| Total interest-bearing |
19,599,241 |
|
|
19,471,996 |
|
|
19,016,473 |
|
|
20,979,443 |
|
|
21,058,799 |
|
| Total deposits |
$ |
27,193,191 |
|
|
$ |
27,191,909 |
|
|
$ |
26,828,269 |
|
|
$ |
28,804,450 |
|
|
$ |
28,892,407 |
|
|
|
|
|
|
|
|
|
|
|
| Composition as % of |
|
|
|
|
|
|
|
|
|
| Total Deposits |
|
|
|
|
|
|
|
|
|
| Noninterest-bearing checking |
28 |
% |
|
28 |
% |
|
29 |
% |
|
27 |
% |
|
27 |
% |
| Interest-bearing: |
|
|
|
|
|
|
|
|
|
| Checking |
29 |
% |
|
28 |
% |
|
28 |
% |
|
25 |
% |
|
27 |
% |
| Money market |
20 |
% |
|
20 |
% |
|
19 |
% |
|
17 |
% |
|
17 |
% |
| Savings |
7 |
% |
|
7 |
% |
|
7 |
% |
|
7 |
% |
|
7 |
% |
| Time deposits: |
|
|
|
|
|
|
|
|
|
| Non-brokered |
9 |
% |
|
9 |
% |
|
9 |
% |
|
10 |
% |
|
10 |
% |
| Brokered |
7 |
% |
|
8 |
% |
|
8 |
% |
|
14 |
% |
|
12 |
% |
| Total time deposits |
16 |
% |
|
17 |
% |
|
17 |
% |
|
24 |
% |
|
22 |
% |
| Total interest-bearing |
72 |
% |
|
72 |
% |
|
71 |
% |
|
73 |
% |
|
73 |
% |
| Total deposits |
100 |
% |
|
100 |
% |
|
100 |
% |
|
100 |
% |
|
100 |
% |
Total deposits remained mostly flat in the first quarter from the fourth quarter and totaled $27.2 billion at March 31, 2025.
Noninterest-bearing checking totaled $7.6 billion and represented 28% of total deposits at March 31, 2025, compared to $7.7 billion, or 28% of total deposits, at December 31, 2024.
Uninsured and uncollateralized deposits of $7.4 billion represented 27% of total deposits at March 31, 2025 compared to uninsured and uncollateralized deposits of $7.2 billion, or 26% of total deposits, at December 31, 2024.

11
In addition to deposit products, we also offer alternative, non-depository corporate treasury solutions for select clients to invest excess liquidity. These alternative options include investments managed by BofCal Asset Management Inc. (“BAM”), our registered investment advisor subsidiary, and third-party sweep products. Total off-balance sheet client investment funds were $1.6 billion as of March 31, 2025, of which $813.2 million was managed by BAM.
Borrowings
Borrowings increased by $279.0 million to $1.7 billion at March 31, 2025 from $1.4 billion at December 31, 2024 due to higher short-term borrowings.
Equity
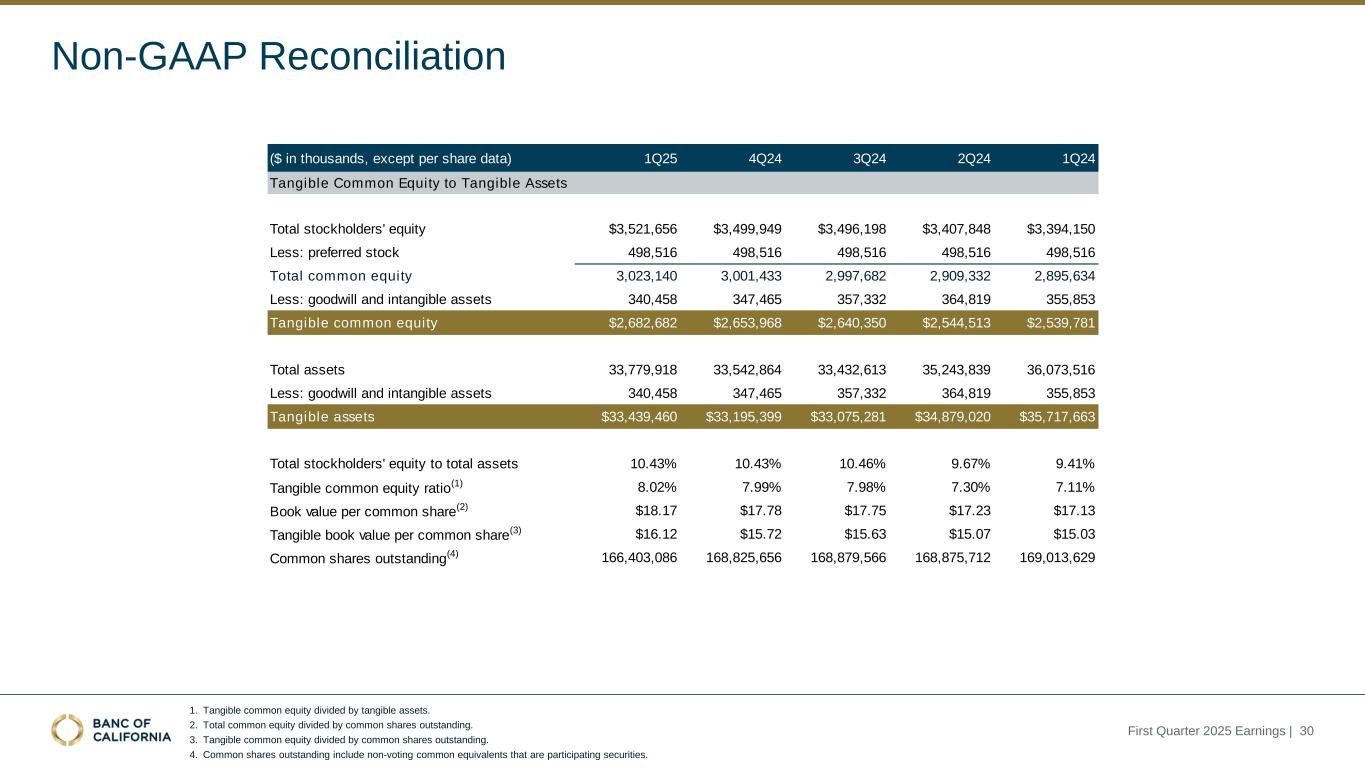
During the first quarter, total stockholders’ equity increased by $21.7 million to $3.5 billion and tangible common equity(1) increased by $28.7 million to $2.7 billion at March 31, 2025. The increase in total stockholders’ equity for the first quarter resulted primarily from net earnings of $53.6 million and a decrease in the unrealized after-tax net loss in AOCI for AFS and HTM securities of $33.5 million, offset partially by the repurchase of common stock of $38.5 million and common and preferred stock dividends of $27.3 million.
At March 31, 2025, book value per common share increased to $18.17 compared to $17.78 at December 31, 2024, and tangible book value per common share(1) increased to $16.12 compared to $15.72 at December 31, 2024.
During the first quarter of 2025, common stock repurchased under the Company's stock repurchase program authorized on March 17, 2025 totaled 2,684,823 shares at a weighted average price per share of $14.36, or $38.5 million. Through April 21, 2025, repurchases of Company common stock totaled 11,494,637 shares at a weighted average price of $13.05 per share, or $150.0 million.
The Company also announced today an upsize of its stock repurchase program, first announced on March 17, 2025, from $150 million to $300 million, inclusive of $150.0 million purchased through April 21, 2025, and expanded to cover both the Company's common stock and depositary shares representing its preferred stock. As before, the repurchase authorization expires in March 2026. Purchases may be made in open-market transactions, in block transactions on or off an exchange, in privately negotiated transactions or by other means as determined by the Company's management and in accordance with the regulations of the Securities and Exchange Commission (the "SEC"). The timing of purchases and the number of shares repurchased under the program will depend on a variety of factors including price, trading volume, market conditions, and corporate and regulatory requirements.
(1) Non-GAAP measure; refer to section 'Non-GAAP Measures'
•

12
CAPITAL AND LIQUIDITY
Capital ratios remain strong with total risk-based capital at 16.90% and a tier 1 leverage ratio of 10.19% at March 31, 2025.
The following table sets forth our regulatory capital ratios as of the dates indicated:
|
|
|
|
|
|
|
|
|
|
|
|
|
|
|
|
|
|
|
|
|
|
|
|
|
|
|
|
|
|
|
March 31, |
|
December 31, |
|
September 30, |
|
June 30, |
|
March 31, |
|
2025 |
|
2024 |
|
2024 |
|
2024 |
|
2024 |
Capital Ratios(1) |
|
|
|
|
|
|
|
|
|
| Banc of California, Inc. |
|
|
|
|
|
|
|
|
|
| Total risk-based capital ratio |
16.90 |
% |
|
17.05 |
% |
|
17.00 |
% |
|
16.57 |
% |
|
16.40 |
% |
| Tier 1 risk-based capital ratio |
12.83 |
% |
|
12.97 |
% |
|
12.88 |
% |
|
12.62 |
% |
|
12.38 |
% |
| Common equity tier 1 capital ratio |
10.43 |
% |
|
10.55 |
% |
|
10.46 |
% |
|
10.27 |
% |
|
10.09 |
% |
| Tier 1 leverage ratio |
10.19 |
% |
|
10.15 |
% |
|
9.83 |
% |
|
9.51 |
% |
|
9.12 |
% |
|
|
|
|
|
|
|
|
|
|
| Banc of California |
|
|
|
|
|
|
|
|
|
| Total risk-based capital ratio |
16.19 |
% |
|
16.65 |
% |
|
16.61 |
% |
|
16.19 |
% |
|
15.88 |
% |
| Tier 1 risk-based capital ratio |
13.72 |
% |
|
14.17 |
% |
|
14.08 |
% |
|
13.77 |
% |
|
13.34 |
% |
| Common equity tier 1 capital ratio |
13.72 |
% |
|
14.17 |
% |
|
14.08 |
% |
|
13.77 |
% |
|
13.34 |
% |
| Tier 1 leverage ratio |
10.88 |
% |
|
11.08 |
% |
|
10.74 |
% |
|
10.38 |
% |
|
9.84 |
% |
______________
(1)March 31, 2025 capital ratios are preliminary.
At March 31, 2025, cash and cash equivalents decreased by $158.3 million to $2.3 billion from $2.5 billion at December 31, 2024 as we maintained a lower cash target level in the first quarter.
Our immediately available cash and cash equivalents excluding restricted cash were $2.2 billion. Combined with total available borrowing capacity of $10.8 billion and unpledged AFS securities of $2.1 billion, total available liquidity was $15.1 billion at the end of the first quarter.

13
Conference Call
The Company will host a conference call to discuss its first quarter 2025 financial results at 10:00 a.m. Pacific Time (PT) on Thursday, April 24, 2025. Interested parties are welcome to attend the conference call by dialing (888) 317-6003 and referencing event code 8785621. A live audio webcast will also be available, and the webcast link will be posted on the Company’s Investor Relations website at www.bancofcal.com/investor. The slide presentation for the call will also be available on the Company's Investor Relations website prior to the call. A replay of the call will be made available approximately one hour after the call has ended on the Company’s Investor Relations website at www.bancofcal.com/investor or by dialing (877) 344-7529 and referencing event code 8013520.
About Banc of California, Inc.
Banc of California, Inc. (NYSE: BANC) is a bank holding company with over $33 billion in assets and the parent company of Banc of California. Banc of California is one of the nation’s premier relationship-based business banks, providing banking and treasury management services to small-, middle-market, and venture-backed businesses. Banc of California is the largest independent bank headquartered in Los Angeles and the third largest bank headquartered in California and offers a broad range of loan and deposit products and services through 80 full-service branches located throughout California and in Denver, Colorado, and Durham, North Carolina, as well as through regional offices nationwide. The bank also provides full-stack payment processing solutions through its subsidiary, Deepstack Technologies, and serves the Community Association Management industry nationwide with its technology-forward platform, SmartStreet™. The bank is committed to its local communities through the Banc of California Charitable Foundation, and by supporting organizations that provide financial literacy and job training, small business support, affordable housing, and more. For more information, please visit us at www.bancofcal.com.
Forward-Looking Statements
This press release includes forward-looking statements within the meaning of the “Safe-Harbor” provisions of the Private Securities Litigation Reform Act of 1995. These statements include, but are not limited to, statements related to our expectations regarding the performance of our business, liquidity and capital ratios and other non-historical statements. Words or phrases such as “believe,” “will,” “should,” “will likely result,” “are expected to,” “will continue,” “is anticipated,” “estimate,” “project,” “plans,” “strategy,” or similar expressions are intended to identify these forward-looking statements. You are cautioned not to place undue reliance on any forward-looking statements. These statements are necessarily subject to risk and uncertainty and actual results could differ materially from those anticipated due to various factors, including those set forth from time to time in the documents filed or furnished by the Company with the SEC. The Company undertakes no obligation to revise or publicly release any revision or update to these forward-looking statements to reflect events or circumstances that occur after the date on which such statements were made, except as required by law.

14
Factors that could cause actual results to differ materially from the results anticipated or projected include, but are not limited to: (i) changes in general economic conditions, either nationally or in our market areas, including the impact of tariffs, supply chain disruptions, and the risk of recession or an economic downturn; (ii) changes in the interest rate environment, including the recent and potential future changes in the FRB benchmark rate, which could adversely affect our revenue and expenses, the value of assets and obligations, the realization of deferred tax assets, the availability and cost of capital and liquidity, and the impacts of continuing or renewed inflation; (iii) the credit risks of lending activities, which may be affected by deterioration in real estate markets and the financial condition of borrowers, and the operational risk of lending activities, including the effectiveness of our underwriting practices and the risk of fraud, any of which may lead to increased loan delinquencies, losses, and non-performing assets, and may result in our allowance for credit losses not being adequate; (iv) fluctuations in the demand for loans, and fluctuations in commercial and residential real estate values in our market area; (v) the quality and composition of our securities portfolio; (vi) our ability to develop and maintain a strong core deposit base, including among our venture banking clients, or other low cost funding sources necessary to fund our activities particularly in a rising or high interest rate environment; (vii) the rapid withdrawal of a significant amount of demand deposits over a short period of time; (viii) the costs and effects of litigation; (ix) risks related to the Company’s acquisitions, including disruption to current plans and operations; difficulties in customer and employee retention; fees, expenses and charges related to these transactions being significantly higher than anticipated; and our inability to achieve expected revenues, cost savings, synergies, and other benefits; (x) results of examinations by regulatory authorities of the Company and the possibility that any such regulatory authority may, among other things, limit our business activities, restrict our ability to invest in certain assets, refrain from issuing an approval or non-objection to certain capital or other actions, increase our allowance for credit losses, result in write-downs of asset values, restrict our ability or that of our bank subsidiary to pay dividends, or impose fines, penalties or sanctions; (xi) legislative or regulatory changes that adversely affect our business, including changes in tax laws and policies, accounting policies and practices, privacy laws, and regulatory capital or other rules; (xii) the risk that our enterprise risk management framework may not be effective in mitigating risk and reducing the potential for losses; (xiii) errors in estimates of the fair values of certain of our assets and liabilities, which may result in significant changes in valuation; (xiv) failures or security breaches with respect to the network, applications, vendors and computer systems on which we depend, including due to cybersecurity threats; (xv) our ability to attract and retain key members of our senior management team; (xvi) the effects of climate change, severe weather events, natural disasters such as earthquakes and wildfires, pandemics, epidemics and other public health crises, acts of war or terrorism, and other external events on our business; (xvii) the impact of bank failures or other adverse developments at other banks on general depositor and investor sentiment regarding the stability and liquidity of banks; (xviii) the possibility that our recorded goodwill could become impaired, which may have an adverse impact on our earnings and capital; (xix) our existing indebtedness, together with any future incurrence of additional indebtedness, could adversely affect our ability to raise additional capital and to meet our debt obligations; (xx) the risk that we may incur significant losses on future asset sales; and (xxi) other economic, competitive, governmental, regulatory, and technological factors affecting our operations, pricing, products and services and the other risks described in our Annual Report on Form 10-K for the fiscal year ended December 31, 2024 and from time to time in other documents that we file with or furnish to the SEC.
Non-GAAP Financial Measures
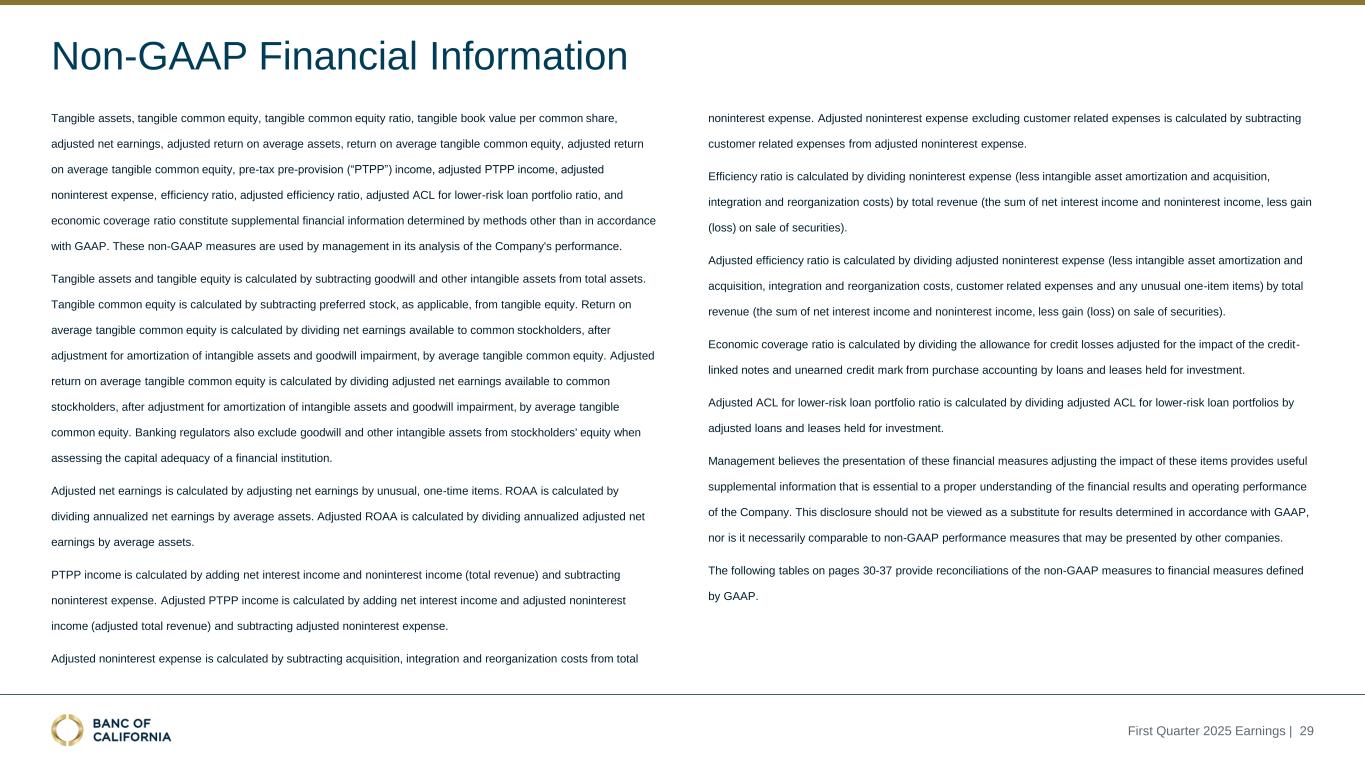
Included in this press release are certain non-GAAP financial measures, such as tangible common equity, tangible book value per common share, return on average tangible common equity, adjusted return on average tangible common equity, adjusted return on average assets, efficiency ratio, and economic coverage ratio, designed to complement the financial information presented in accordance with U.S. GAAP because management believes such measures are useful to investors. These non-GAAP financial measures should be considered only as supplemental to, and not superior to, financial measures provided in accordance with GAAP. Please refer to the “Non-GAAP Measures” section of this release for additional detail including reconciliations of the non-GAAP financial measures included in this press release to the most directly comparable financial measures prepared in accordance with GAAP.

15
|
|
|
| Investor Relations Inquiries: |
| Banc of California, Inc. |
| (855) 361-2262 |
| Jared Wolff, (310) 424-1230 |
Joe Kauder, (310) 844-5224 |
| Ann DeVries, (646) 376-7011 |
|
| Media Contact: |
| Debora Vrana, Banc of California |
| (213) 533-3122 |
| Deb.Vrana@bancofcal.com |
Source: Banc of California, Inc. |

16
|
|
|
|
|
|
|
|
|
|
|
|
|
|
|
|
|
|
|
|
|
|
|
|
|
|
|
|
|
|
| BANC OF CALIFORNIA, INC. |
|
|
|
|
|
|
|
|
|
| CONSOLIDATED STATEMENTS OF FINANCIAL CONDITION (UNAUDITED) |
|
|
|
|
|
|
|
|
|
|
|
|
|
|
|
|
|
March 31, |
|
December 31, |
|
September 30, |
|
June 30, |
|
March 31, |
|
2025 |
|
2024 |
|
2024 |
|
2024 |
|
2024 |
| ASSETS: |
(Dollars in thousands) |
| Cash and due from banks |
$ |
215,591 |
|
|
$ |
192,006 |
|
|
$ |
251,869 |
|
|
$ |
203,467 |
|
|
$ |
199,922 |
|
| Interest-earning deposits in financial |
|
|
|
|
|
|
|
|
|
| institutions |
2,128,298 |
|
|
2,310,206 |
|
|
2,302,358 |
|
|
2,495,343 |
|
|
2,885,306 |
|
| Total cash and cash equivalents |
2,343,889 |
|
|
2,502,212 |
|
|
2,554,227 |
|
|
2,698,810 |
|
|
3,085,228 |
|
|
|
|
|
|
|
|
|
|
|
| Securities available-for-sale |
2,334,058 |
|
|
2,246,839 |
|
|
2,300,284 |
|
|
2,244,031 |
|
|
2,286,682 |
|
| Securities held-to-maturity |
2,311,912 |
|
|
2,306,149 |
|
|
2,301,263 |
|
|
2,296,708 |
|
|
2,291,984 |
|
| FRB and FHLB stock |
155,330 |
|
|
147,773 |
|
|
145,123 |
|
|
132,380 |
|
|
129,314 |
|
| Total investment securities |
4,801,300 |
|
|
4,700,761 |
|
|
4,746,670 |
|
|
4,673,119 |
|
|
4,707,980 |
|
|
|
|
|
|
|
|
|
|
|
| Loans held for sale |
25,797 |
|
|
26,331 |
|
|
28,639 |
|
|
1,935,455 |
|
|
80,752 |
|
|
|
|
|
|
|
|
|
|
|
| Loans and leases held for investment |
24,126,527 |
|
|
23,781,663 |
|
|
23,527,777 |
|
|
23,228,909 |
|
|
25,473,022 |
|
| Allowance for loan and lease losses |
(234,986) |
|
|
(239,360) |
|
|
(254,345) |
|
|
(247,762) |
|
|
(291,503) |
|
| Total loans and leases held for |
|
|
|
|
|
|
|
|
|
| investment, net |
23,891,541 |
|
|
23,542,303 |
|
|
23,273,432 |
|
|
22,981,147 |
|
|
25,181,519 |
|
|
|
|
|
|
|
|
|
|
|
| Equipment leased to others under |
|
|
|
|
|
|
|
|
|
| operating leases |
295,032 |
|
|
307,188 |
|
|
314,998 |
|
|
335,968 |
|
|
339,925 |
|
| Premises and equipment, net |
140,347 |
|
|
142,546 |
|
|
143,200 |
|
|
145,734 |
|
|
144,912 |
|
| Bank owned life insurance |
342,810 |
|
|
339,517 |
|
|
343,212 |
|
|
341,779 |
|
|
341,806 |
|
| Goodwill |
214,521 |
|
|
214,521 |
|
|
216,770 |
|
|
215,925 |
|
|
198,627 |
|
| Intangible assets, net |
125,937 |
|
|
132,944 |
|
|
140,562 |
|
|
148,894 |
|
|
157,226 |
|
| Deferred tax asset, net |
702,323 |
|
|
720,587 |
|
|
706,849 |
|
|
738,534 |
|
|
741,158 |
|
| Other assets |
896,421 |
|
|
913,954 |
|
|
964,054 |
|
|
1,028,474 |
|
|
1,094,383 |
|
| Total assets |
$ |
33,779,918 |
|
|
$ |
33,542,864 |
|
|
$ |
33,432,613 |
|
|
$ |
35,243,839 |
|
|
$ |
36,073,516 |
|
|
|
|
|
|
|
|
|
|
|
| LIABILITIES: |
|
|
|
|
|
|
|
|
|
| Noninterest-bearing deposits |
$ |
7,593,950 |
|
|
$ |
7,719,913 |
|
|
$ |
7,811,796 |
|
|
$ |
7,825,007 |
|
|
$ |
7,833,608 |
|
| Interest-bearing deposits |
19,599,241 |
|
|
19,471,996 |
|
|
19,016,473 |
|
|
20,979,443 |
|
|
21,058,799 |
|
| Total deposits |
27,193,191 |
|
|
27,191,909 |
|
|
26,828,269 |
|
|
28,804,450 |
|
|
28,892,407 |
|
| Borrowings |
1,670,782 |
|
|
1,391,814 |
|
|
1,591,833 |
|
|
1,440,875 |
|
|
2,139,498 |
|
| Subordinated debt |
944,908 |
|
|
941,923 |
|
|
942,151 |
|
|
939,287 |
|
|
937,717 |
|
| Accrued interest payable and other |
|
|
|
|
|
|
|
|
|
| liabilities |
449,381 |
|
|
517,269 |
|
|
574,162 |
|
|
651,379 |
|
|
709,744 |
|
| Total liabilities |
30,258,262 |
|
|
30,042,915 |
|
|
29,936,415 |
|
|
31,835,991 |
|
|
32,679,366 |
|
|
|
|
|
|
|
|
|
|
|
| STOCKHOLDERS' EQUITY: |
|
|
|
|
|
|
|
|
|
| Preferred stock |
498,516 |
|
|
498,516 |
|
|
498,516 |
|
|
498,516 |
|
|
498,516 |
|
| Common stock |
1,561 |
|
|
1,586 |
|
|
1,586 |
|
|
1,583 |
|
|
1,583 |
|
| Class B non-voting common stock |
5 |
|
|
5 |
|
|
5 |
|
|
5 |
|
|
5 |
|
| Non-voting common stock equivalents |
98 |
|
|
98 |
|
|
98 |
|
|
101 |
|
|
101 |
|
| Additional paid-in-capital |
3,732,376 |
|
|
3,785,725 |
|
|
3,802,314 |
|
|
3,813,312 |
|
|
3,827,777 |
|
| Retained deficit |
(387,580) |
|
|
(431,201) |
|
|
(478,173) |
|
|
(477,010) |
|
|
(497,396) |
|
| Accumulated other comprehensive |
|
|
|
|
|
|
|
|
|
| loss, net |
(323,320) |
|
|
(354,780) |
|
|
(328,148) |
|
|
(428,659) |
|
|
(436,436) |
|
| Total stockholders’ equity |
3,521,656 |
|
|
3,499,949 |
|
|
3,496,198 |
|
|
3,407,848 |
|
|
3,394,150 |
|
| Total liabilities and stockholders’ |
|
|
|
|
|
|
|
|
|
| equity |
$ |
33,779,918 |
|
|
$ |
33,542,864 |
|
|
$ |
33,432,613 |
|
|
$ |
35,243,839 |
|
|
$ |
36,073,516 |
|
|
|
|
|
|
|
|
|
|
|
Common shares outstanding (1) |
166,403,086 |
|
|
168,825,656 |
|
|
168,879,566 |
|
|
168,875,712 |
|
|
169,013,629 |
|
______________
(1) Common shares outstanding include non-voting common equivalents that are participating securities.

17
|
|
|
|
|
|
|
|
|
|
|
|
|
|
|
|
|
|
|
| BANC OF CALIFORNIA, INC. |
|
|
|
|
|
|
| CONSOLIDATED STATEMENTS OF EARNINGS (UNAUDITED) |
|
|
|
|
|
|
|
|
|
|
|
Three Months Ended |
|
|
March 31, |
|
December 31, |
|
March 31, |
|
|
2025 |
|
2024 |
|
2024 |
|
|
(In thousands, except per share amounts) |
|
| Interest income: |
|
|
|
|
|
|
| Loans and leases |
$ |
346,103 |
|
|
$ |
357,303 |
|
|
$ |
385,465 |
|
|
| Investment securities |
37,862 |
|
|
37,743 |
|
|
34,303 |
|
|
| Deposits in financial institutions |
22,690 |
|
|
29,473 |
|
|
58,936 |
|
|
| Total interest income |
406,655 |
|
|
424,519 |
|
|
478,704 |
|
|
| Interest expense: |
|
|
|
|
|
|
| Deposits |
140,530 |
|
|
154,085 |
|
|
194,807 |
|
|
| Borrowings |
18,421 |
|
|
18,993 |
|
|
38,124 |
|
|
| Subordinated debt |
15,340 |
|
|
16,156 |
|
|
16,671 |
|
|
| Total interest expense |
174,291 |
|
|
189,234 |
|
|
249,602 |
|
|
| Net interest income |
232,364 |
|
|
235,285 |
|
|
229,102 |
|
|
| Provision for credit losses |
9,300 |
|
|
12,801 |
|
|
10,000 |
|
|
| Net interest income after provision |
|
|
|
|
|
|
| for credit losses |
223,064 |
|
|
222,484 |
|
|
219,102 |
|
|
| Noninterest income: |
|
|
|
|
|
|
| Service charges on deposit accounts |
4,543 |
|
|
4,770 |
|
|
4,705 |
|
|
| Other commissions and fees |
9,958 |
|
|
8,231 |
|
|
8,142 |
|
|
| Leased equipment income |
10,784 |
|
|
10,730 |
|
|
11,716 |
|
|
| Gain (loss) on sale of loans and leases |
211 |
|
|
20 |
|
|
(448) |
|
|
| Loss on sale of securities |
— |
|
|
(454) |
|
|
— |
|
|
| Dividends and gains on equity investments |
2,323 |
|
|
18 |
|
|
3,068 |
|
|
| Warrant (loss) income |
(295) |
|
|
343 |
|
|
178 |
|
|
| LOCOM HFS adjustment |
— |
|
|
(3) |
|
|
330 |
|
|
| Other income |
6,126 |
|
|
5,334 |
|
|
6,125 |
|
|
| Total noninterest income |
33,650 |
|
|
28,989 |
|
|
33,816 |
|
|
| Noninterest expense: |
|
|
|
|
|
|
| Compensation |
86,417 |
|
|
77,661 |
|
|
92,236 |
|
|
| Occupancy |
15,010 |
|
|
15,678 |
|
|
17,968 |
|
|
| Information technology and data processing |
15,099 |
|
|
14,546 |
|
|
15,418 |
|
|
| Other professional services |
4,513 |
|
|
5,498 |
|
|
5,075 |
|
|
| Insurance and assessments |
7,283 |
|
|
11,179 |
|
|
20,461 |
|
|
| Intangible asset amortization |
7,160 |
|
|
7,770 |
|
|
8,404 |
|
|
| Leased equipment depreciation |
6,741 |
|
|
7,096 |
|
|
7,520 |
|
|
| Acquisition, integration and reorganization costs |
— |
|
|
(1,023) |
|
|
— |
|
|
| Customer related expense |
27,751 |
|
|
31,672 |
|
|
30,919 |
|
|
| Loan expense |
2,930 |
|
|
4,489 |
|
|
4,491 |
|
|
|
|
|
|
|
|
|
| Other expense |
10,749 |
|
|
6,804 |
|
|
8,026 |
|
|
| Total noninterest expense |
183,653 |
|
|
181,370 |
|
|
210,518 |
|
|
| Earnings before income taxes |
73,061 |
|
|
70,103 |
|
|
42,400 |
|
|
| Income tax expense |
19,493 |
|
|
13,184 |
|
|
11,548 |
|
|
| Net earnings |
53,568 |
|
|
56,919 |
|
|
30,852 |
|
|
| Preferred stock dividends |
9,947 |
|
|
9,947 |
|
|
9,947 |
|
|
| Net earnings available to common |
|
|
|
|
|
|
| and equivalent stockholders |
$ |
43,621 |
|
|
$ |
46,972 |
|
|
$ |
20,905 |
|
|
| Earnings per common share: |
|
|
|
|
|
|
| Basic |
$ |
0.26 |
|
|
$ |
0.28 |
|
|
$ |
0.12 |
|
|
| Diluted |
$ |
0.26 |
|
|
$ |
0.28 |
|
|
$ |
0.12 |
|
|
|
|
|
|
|
|
|
Weighted average number of common shares (1) |
|
|
|
|
|
|
| outstanding: |
|
|
|
|
|
|
| Basic |
168,495 |
|
|
168,604 |
|
|
168,143 |
|
|
| Diluted |
169,434 |
|
|
169,732 |
|
|
168,143 |
|
|
|
|
|
|
|
|
|
|
|
|
|
|
|
|
|
|
|
|
|
|
|
|
|
|
|
|
|
|
|
|
|
|
|
|
|
|
|
|
|
|
|
|
|
|
|
|
|
|
|
|
|
|
|
|
|
|
|
|
|
|
|
|
|
|
|
______________
(1) Common shares outstanding include non-voting common equivalents that are participating securities.

18
|
|
|
|
|
|
|
|
|
|
|
|
|
|
|
|
|
|
| BANC OF CALIFORNIA, INC. |
|
|
|
|
|
| SELECTED FINANCIAL DATA |
|
|
|
|
|
| (UNAUDITED) |
|
|
|
|
|
|
|
|
|
|
|
|
Three Months Ended |
|
March 31, |
|
December 31, |
|
March 31, |
| Profitability and Other Ratios |
2025 |
|
2024 |
|
2024 |
Return on average assets (1) |
0.65 |
% |
|
0.67 |
% |
|
0.33 |
% |
Adjusted ROAA (1)(2) |
0.65 |
% |
|
0.67 |
% |
|
0.37 |
% |
Return on average equity (1) |
6.16 |
% |
|
6.50 |
% |
|
3.66 |
% |
| Return on average tangible common |
|
|
|
|
|
equity (1)(2) |
7.56 |
% |
|
7.35 |
% |
|
4.36 |
% |
| Adjusted return on average tangible |
|
|
|
|
|
common equity (1)(2) |
7.56 |
% |
|
7.35 |
% |
|
4.92 |
% |
Dividend payout ratio (3) |
36.46 |
% |
|
35.71 |
% |
|
83.33 |
% |
Average yield on loans and leases (1) |
5.90 |
% |
|
6.01 |
% |
|
6.08 |
% |
Average yield on interest-earning assets (1) |
5.39 |
% |
|
5.48 |
% |
|
5.56 |
% |
| Average cost of interest-bearing deposits (1) |
2.97 |
% |
|
3.18 |
% |
|
3.60 |
% |
Average total cost of deposits (1) |
2.12 |
% |
|
2.26 |
% |
|
2.66 |
% |
Average cost of interest-bearing liabilities (1) |
3.28 |
% |
|
3.48 |
% |
|
3.92 |
% |
Average total cost of funds (1) |
2.42 |
% |
|
2.55 |
% |
|
3.02 |
% |
| Net interest spread |
2.11 |
% |
|
2.00 |
% |
|
1.64 |
% |
Net interest margin (1) |
3.08 |
% |
|
3.04 |
% |
|
2.66 |
% |
Noninterest income to total revenue (4) |
12.65 |
% |
|
10.97 |
% |
|
12.86 |
% |
| Noninterest expense to average total |
|
|
|
|
|
assets (1) |
2.24 |
% |
|
2.15 |
% |
|
2.26 |
% |
| Noninterest expense to total revenue (4) |
69.04 |
% |
|
68.63 |
% |
|
80.07 |
% |
| Efficiency ratio (2)(5) |
66.35 |
% |
|
65.96 |
% |
|
76.87 |
% |
| Loans to deposits ratio |
88.82 |
% |
|
87.56 |
% |
|
88.44 |
% |
| Average loans and leases to average deposits |
88.36 |
% |
|
87.05 |
% |
|
86.65 |
% |
| Average investment securities to average |
|
|
|
|
|
| total assets |
14.21 |
% |
|
14.01 |
% |
|
12.58 |
% |
| Average stockholders' equity to average |
|
|
|
|
|
| total assets |
10.58 |
% |
|
10.39 |
% |
|
9.03 |
% |
______________
(1) Annualized.
(2) Non-GAAP measure.
(3) Ratio calculated by dividing dividends declared per common and equivalent share by basic earnings per common and equivalent share.
(4) Total revenue equals the sum of net interest income and noninterest income.
(5) Ratio calculated by dividing noninterest expense (less intangible asset amortization and acquisition, integration and reorganization costs) by total revenue (less gain (loss) on sale of securities).

19
|
|
|
|
|
|
|
|
|
|
|
|
|
|
|
|
|
|
|
|
|
|
|
|
|
|
|
|
|
|
|
|
|
|
|
|
| BANC OF CALIFORNIA, INC. |
|
|
|
|
|
|
|
|
|
|
| AVERAGE BALANCE, AVERAGE YIELD EARNED, AND AVERAGE COST PAID |
|
|
|
|
|
| (UNAUDITED) |
|
|
|
|
|
|
|
|
|
|
|
|
|
|
|
|
|
|
|
|
|
|
|
|
Three Months Ended |
|
March 31, 2025 |
|
December 31, 2024 |
|
March 31, 2024 |
|
|
Interest |
Average |
|
|
Interest |
Average |
|
|
Interest |
Average |
|
Average |
Income/ |
Yield/ |
|
Average |
Income/ |
Yield/ |
|
Average |
Income/ |
Yield/ |
|
Balance |
Expense |
Cost |
|
Balance |
Expense |
Cost |
|
Balance |
Expense |
Cost |
|
(Dollars in thousands) |
| Assets: |
|
|
|
|
|
|
|
|
|
|
|
Loans and leases (1) |
$ |
23,788,647 |
|
$ |
346,103 |
|
5.90 |
% |
|
$ |
23,649,271 |
|
$ |
357,303 |
|
6.01 |
% |
|
$ |
25,518,590 |
|
$ |
385,465 |
|
6.08 |
% |
| Investment securities |
4,734,037 |
|
37,862 |
|
3.24 |
% |
|
4,700,742 |
|
37,743 |
|
3.19 |
% |
|
4,721,556 |
|
34,303 |
|
2.92 |
% |
| Deposits in financial |
|
|
|
|
|
|
|
|
|
|
|
| institutions |
2,088,139 |
|
22,690 |
|
4.41 |
% |
|
2,474,732 |
|
29,473 |
|
4.74 |
% |
|
4,374,968 |
|
58,936 |
|
5.42 |
% |
| Total interest-earning |
|
|
|
|
|
|
|
|
|
|
|
| assets |
30,610,823 |
|
406,655 |
|
5.39 |
% |
|
30,824,745 |
|
424,519 |
|
5.48 |
% |
|
34,615,114 |
|
478,704 |
|
5.56 |
% |
| Other assets |
2,697,562 |
|
|
|
|
2,737,283 |
|
|
|
|
2,925,593 |
|
|
|
| Total assets |
$ |
33,308,385 |
|
|
|
|
$ |
33,562,028 |
|
|
|
|
$ |
37,540,707 |
|
|
|
|
|
|
|
|
|
|
|
|
|
|
|
| Liabilities and |
|
|
|
|
|
|
|
|
|
|
|
| Stockholders' Equity: |
|
|
|
|
|
|
|
|
|
|
|
| Interest checking |
$ |
7,343,451 |
|
47,879 |
|
2.64 |
% |
|
$ |
7,659,320 |
|
56,408 |
|
2.93 |
% |
|
$ |
7,883,177 |
|
61,549 |
|
3.14 |
% |
| Money market |
5,415,716 |
|
33,003 |
|
2.47 |
% |
|
5,003,118 |
|
31,688 |
|
2.52 |
% |
|
5,737,837 |
|
41,351 |
|
2.90 |
% |
| Savings |
1,948,649 |
|
12,857 |
|
2.68 |
% |
|
1,954,625 |
|
14,255 |
|
2.90 |
% |
|
2,036,129 |
|
18,030 |
|
3.56 |
% |
| Time |
4,498,268 |
|
46,791 |
|
4.22 |
% |
|
4,645,115 |
|
51,734 |
|
4.43 |
% |
|
6,108,321 |
|
73,877 |
|
4.86 |
% |
| Total interest-bearing |
|
|
|
|
|
|
|
|
|
|
|
| deposits |
19,206,084 |
|
140,530 |
|
2.97 |
% |
|
19,262,178 |
|
154,085 |
|
3.18 |
% |
|
21,765,464 |
|
194,807 |
|
3.60 |
% |
| Borrowings |
1,397,720 |
|
18,421 |
|
5.34 |
% |
|
1,399,080 |
|
18,993 |
|
5.40 |
% |
|
2,892,406 |
|
38,124 |
|
5.30 |
% |
| Subordinated debt |
942,817 |
|
15,340 |
|
6.60 |
% |
|
942,221 |
|
16,156 |
|
6.82 |
% |
|
937,005 |
|
16,671 |
|
7.16 |
% |
| Total interest-bearing |
|
|
|
|
|
|
|
|
|
|
|
| liabilities |
21,546,621 |
|
174,291 |
|
3.28 |
% |
|
21,603,479 |
|
189,234 |
|
3.48 |
% |
|
25,594,875 |
|
249,602 |
|
3.92 |
% |
| Noninterest-bearing |
|
|
|
|
|
|
|
|
|
|
|
| demand deposits |
7,714,830 |
|
|
|
|
7,905,750 |
|
|
|
|
7,685,027 |
|
|
|
| Other liabilities |
522,753 |
|
|
|
|
566,635 |
|
|
|
|
870,273 |
|
|
|
| Total liabilities |
29,784,204 |
|
|
|
|
30,075,864 |
|
|
|
|
34,150,175 |
|
|
|
| Stockholders' equity |
3,524,181 |
|
|
|
|
3,486,164 |
|
|
|
|
3,390,532 |
|
|
|
| Total liabilities and |
|
|
|
|
|
|
|
|
|
|
|
| stockholders' equity |
$ |
33,308,385 |
|
|
|
|
$ |
33,562,028 |
|
|
|
|
$ |
37,540,707 |
|
|
|
Net interest income (1) |
|
$ |
232,364 |
|
|
|
|
$ |
235,285 |
|
|
|
|
$ |
229,102 |
|
|
| Net interest spread |
|
|
2.11 |
% |
|
|
|
2.00 |
% |
|
|
|
1.64 |
% |
| Net interest margin |
|
|
3.08 |
% |
|
|
|
3.04 |
% |
|
|
|
2.66 |
% |
|
|
|
|
|
|
|
|
|
|
|
|
Total deposits (2) |
$ |
26,920,914 |
|
$ |
140,530 |
|
2.12 |
% |
|
$ |
27,167,928 |
|
$ |
154,085 |
|
2.26 |
% |
|
$ |
29,450,491 |
|
$ |
194,807 |
|
2.66 |
% |
Total funds (3) |
$ |
29,261,451 |
|
$ |
174,291 |
|
2.42 |
% |
|
$ |
29,509,229 |
|
$ |
189,234 |
|
2.55 |
% |
|
$ |
33,279,902 |
|
$ |
249,602 |
|
3.02 |
% |
______________
(1) Includes net loan discount accretion of $16.0 million, $20.7 million, and $22.4 million for the three months ended March 31, 2025, December 31, 2024, and March 31, 2024.
(2) Total deposits is the sum of total interest-bearing deposits and noninterest-bearing demand deposits. The cost of total deposits is calculated as annualized interest expense on total deposits divided by average total deposits.
(3) Total funds is the sum of total interest-bearing liabilities and noninterest-bearing demand deposits. The cost of total funds is calculated as annualized total interest expense divided by average total funds.

20
BANC OF CALIFORNIA, INC.
NON-GAAP MEASURES
We refer to certain financial measures that are not recognized under U.S. generally accepted accounting principles (“GAAP”) in this press release, including: tangible common equity, tangible book value per common share, return on average tangible common equity, adjusted return on average tangible common equity, adjusted return on average assets, efficiency ratio, and economic coverage ratio. These non-GAAP measures are used by management in its analysis of the Company's performance.
Tangible common equity is calculated by subtracting preferred stock, as applicable, from total common equity. Return on average tangible common equity is calculated by dividing net earnings available to common stockholders, after adjustment for amortization of intangible assets and any goodwill impairment, by average tangible common equity. Adjusted return on average tangible common equity is calculated by dividing adjusted net earnings available to common stockholders, after adjustment for amortization of intangible assets, any goodwill impairment, and any unusual one-time items, by average tangible common equity. Banking regulators also exclude goodwill and other intangible assets from stockholders' equity when assessing the capital adequacy of a financial institution.
Adjusted return on average assets ("Adjusted ROAA") is calculated by dividing annualized adjusted net earnings, after adjustment for any unusual one-time items, by average assets.
Efficiency ratio is calculated by dividing noninterest expense (less intangible asset amortization and acquisition, integration and reorganization costs) by total revenue (the sum of net interest income and noninterest income, less gain (loss) on sale of securities).
Economic coverage ratio is calculated by dividing the allowance for credit losses adjusted for the impact of the credit-linked notes and unearned credit mark from purchase accounting by loans and leases held for investment.
Management believes the presentation of these financial measures adjusting the impact of these items provides useful supplemental information that is essential to a proper understanding of the financial results and operating performance of the Company. This disclosure should not be viewed as a substitute for results determined in accordance with GAAP, nor is it necessarily comparable to non-GAAP performance measures that may be presented by other companies.
The following tables provide reconciliations of the non-GAAP measures to financial measures defined by GAAP.

21
|
|
|
|
|
|
|
|
|
|
|
|
|
|
|
|
|
|
|
|
|
|
|
|
|
|
|
|
|
|
| BANC OF CALIFORNIA, INC. |
|
|
|
|
|
|
|
|
|
| NON-GAAP MEASURES |
|
|
|
|
|
|
| (UNAUDITED) |
|
|
|
|
|
|
|
|
|
|
|
|
|
|
|
|
|
|
|
| Tangible Common Equity |
March 31, |
|
December 31, |
|
September 30, |
|
June 30, |
|
March 31, |
| and Tangible Book Value Per Share |
2025 |
|
2024 |
|
2024 |
|
2024 |
|
2024 |
|
(Dollars in thousands, except per share amounts) |
| Stockholders' equity |
$ |
3,521,656 |
|
|
$ |
3,499,949 |
|
|
$ |
3,496,198 |
|
|
$ |
3,407,848 |
|
|
$ |
3,394,150 |
|
| Less: Preferred stock |
498,516 |
|
|
498,516 |
|
|
498,516 |
|
|
498,516 |
|
|
498,516 |
|
| Total common equity |
3,023,140 |
|
|
3,001,433 |
|
|
2,997,682 |
|
|
2,909,332 |
|
|
2,895,634 |
|
| Less: Intangible assets |
340,458 |
|
|
347,465 |
|
|
357,332 |
|
|
364,819 |
|
|
355,853 |
|
| Tangible common equity |
2,682,682 |
|
|
2,653,968 |
|
|
2,640,350 |
|
|
2,544,513 |
|
|
2,539,781 |
|
|
|
|
|
|
|
|
|
|
|
|
|
|
|
|
|
|
|
|
|
|
|
|
|
|
|
|
|
|
|
|
|
|
|
|
|
|
|
|
|
|
|
|
|
|
|
|
|
|
|
|
|
|
|
|
|
|
|
|
|
|
|
|
|
|
|
|
|
|
|
Book value per common share (1) |
$ |
18.17 |
|
|
$ |
17.78 |
|
|
$ |
17.75 |
|
|
$ |
17.23 |
|
|
$ |
17.13 |
|
Tangible book value per common share (2) |
$ |
16.12 |
|
|
$ |
15.72 |
|
|
$ |
15.63 |
|
|
$ |
15.07 |
|
|
$ |
15.03 |
|
| Common shares outstanding (3) |
166,403,086 |
|
|
168,825,656 |
|
|
168,879,566 |
|
|
168,875,712 |
|
|
169,013,629 |
|
______________
(1) Total common equity divided by common shares outstanding.
(2) Tangible common equity divided by common shares outstanding.
(3) Common shares outstanding include non-voting common equivalents that are participating securities.

22
|
|
|
|
|
|
|
|
|
|
|
|
|
|
|
|
|
|
| BANC OF CALIFORNIA, INC. |
|
|
|
|
|
| NON-GAAP MEASURES |
|
|
| (UNAUDITED) |
|
|
|
|
|
|
|
|
|
|
|
|
Three Months Ended |
| Return on Average Tangible |
March 31, |
|
December 31, |
|
March 31, |
| Common Equity ("ROATCE") |
2025 |
|
2024 |
|
2024 |
|
(Dollars in thousands) |
| Net earnings |
$ |
53,568 |
|
|
$ |
56,919 |
|
|
$ |
30,852 |
|
|
|
|
|
|
|
| Earnings before income taxes |
$ |
73,061 |
|
|
$ |
70,103 |
|
|
$ |
42,400 |
|
| Add: Intangible asset amortization |
7,160 |
|
|
7,770 |
|
|
8,404 |
|
| Adjusted earnings before |
|
|
|
|
|
| income taxes used for ROATCE |
80,221 |
|
|
77,873 |
|
|
50,804 |
|
Adjusted income tax expense (1) |
20,296 |
|
|
19,281 |
|
|
13,412 |
|
| Adjusted net earnings for ROATCE |
59,925 |
|
|
58,592 |
|
|
37,392 |
|
| Less: Preferred stock dividends |
9,947 |
|
|
9,947 |
|
|
9,947 |
|
| Adjusted net earnings available |
|
|
|
|
|
| to common and equivalent |
|
|
|
|
|
| stockholders for ROATCE |
$ |
49,978 |
|
|
$ |
48,645 |
|
|
$ |
27,445 |
|
|
|
|
|
|
|
| Average stockholders' equity |
$ |
3,524,181 |
|
|
$ |
3,486,164 |
|
|
$ |
3,390,532 |
|
| Less: Average goodwill and intangible |
|
|
|
|
|
| assets |
344,610 |
|
|
352,907 |
|
|
360,680 |
|
| Less: Average preferred stock |
498,516 |
|
|
498,516 |
|
|
498,516 |
|
| Average tangible common equity |
$ |
2,681,055 |
|
|
$ |
2,634,741 |
|
|
$ |
2,531,336 |
|
|
|
|
|
|
|
Return on average equity (2) |
6.16 |
% |
|
6.50 |
% |
|
3.66 |
% |
ROATCE (3) |
7.56 |
% |
|
7.35 |
% |
|
4.36 |
% |
______________
(1) Effective tax rates of 25.30%, 24.76%, and 26.40% used for the three months ended March 31, 2025, December 31, 2024, and March 31, 2024, respectively.
(2) Annualized net earnings divided by average stockholders' equity.
(3) Annualized adjusted net earnings available to common and equivalent stockholders for ROATCE divided by average tangible (2) Annualized adjusted net earnings (loss) available to common and equivalent stockholders for adjusted ROATCE divided by average tangible common equity.
common equity.

23
|
|
|
|
|
|
|
|
|
|
|
|
|
|
|
|
|
|
| BANC OF CALIFORNIA, INC. |
|
|
|
|
|
| NON-GAAP MEASURES |
|
|
| (UNAUDITED) |
|
|
|
|
|
|
|
|
|
|
|
|
Three Months Ended |
| Adjusted Return on Average |
March 31, |
|
December 31, |
|
March 31, |
| Tangible Common Equity ("ROATCE") |
2025 |
|
2024 |
|
2024 |
|
(Dollars in thousands) |
| Net earnings |
$ |
53,568 |
|
|
$ |
56,919 |
|
|
$ |
30,852 |
|
|
|
|
|
|
|
| Earnings before income taxes |
$ |
73,061 |
|
|
$ |
70,103 |
|
|
$ |
42,400 |
|
| Add: Intangible asset amortization |
7,160 |
|
|
7,770 |
|
|
8,404 |
|
| Add: FDIC special assessment |
— |
|
|
— |
|
|
4,814 |
|
| Adjusted earnings before income |
|
|
|
|
|
| taxes used for adjusted ROATCE |
80,221 |
|
|
77,873 |
|
|
55,618 |
|
Adjusted income tax expense (1) |
20,296 |
|
|
19,281 |
|
|
14,683 |
|
| Adjusted net earnings for adjusted |
|
|
|
|
|
| ROATCE |
59,925 |
|
|
58,592 |
|
|
40,935 |
|
| Less: Preferred stock dividends |
9,947 |
|
|
9,947 |
|
|
9,947 |
|
| Adjusted net earnings available to |
|
|
|
|
|
| common and equivalent stockholders |
|
|
|
|
|
| for adjusted ROATCE |
$ |
49,978 |
|
|
$ |
48,645 |
|
|
$ |
30,988 |
|
|
|
|
|
|
|
| Average stockholders' equity |
$ |
3,524,181 |
|
|
$ |
3,486,164 |
|
|
$ |
3,390,532 |
|
| Less: Average goodwill and intangible |
|
|
|
|
|
| assets |
344,610 |
|
|
352,907 |
|
|
360,680 |
|
| Less: Average preferred stock |
498,516 |
|
|
498,516 |
|
|
498,516 |
|
| Average tangible common equity |
$ |
2,681,055 |
|
|
$ |
2,634,741 |
|
|
$ |
2,531,336 |
|
|
|
|
|
|
|
Adjusted ROATCE (2) |
7.56 |
% |
|
7.35 |
% |
|
4.92 |
% |
______________
(1) Effective tax rates of 25.30%, 24.76%, and 26.40% used for the three months ended March 31, 2025, December 31, 2024, and March 31, 2024, respectively.

24
|
|
|
|
|
|
|
|
|
|
|
|
|
|
|
|
|
|
| BANC OF CALIFORNIA, INC. |
|
|
|
|
|
| NON-GAAP MEASURES |
|
|
| (UNAUDITED) |
|
|
|
|
|
|
|
|
|
|
|
|
Three Months Ended |
| Return on Average Assets ("ROAA") |
March 31, |
|
December 31, |
|
March 31, |
| and Adjusted Return on Average Assets |
2025 |
|
2024 |
|
2024 |
|
(Dollars in thousands) |
| Net earnings |
$ |
53,568 |
|
|
$ |
56,919 |
|
|
$ |
30,852 |
|
|
|
|
|
|
|
| Earnings before income taxes |
$ |
73,061 |
|
|
$ |
70,103 |
|
|
$ |
42,400 |
|
| Add: FDIC special assessment |
— |
|
|
— |
|
|
4,814 |
|
| Adjusted earnings before income taxes |
73,061 |
|
|
70,103 |
|
|
47,214 |
|
| Adjusted income tax expense (1) |
19,493 |
|
|
13,184 |
|
|
12,464 |
|
| Adjusted net earnings |
53,568 |
|
|
56,919 |
|
|
34,750 |
|
|
|
|
|
|
|
|
|
|
|
|
|
|
|
|
|
|
|
|
|
|
|
|
|
|
|
|
|
|
|
|
|
|
|
|
|
|
|
|
|
|
|
|
|
|
|
|
|
|
|
|
|
|
|
| Average total assets |
$ |
33,308,385 |
|
|
$ |
33,562,028 |
|
|
$ |
37,540,707 |
|
| Return on average assets ("ROAA") (2) |
0.65 |
% |
|
0.67 |
% |
|
0.33 |
% |
| Adjusted ROAA (3) |
0.65 |
% |
|
0.67 |
% |
|
0.37 |
% |
______________
(1) Effective tax rates of 25.30%, 24.76%, and 26.40% used for the three months ended March 31, 2025, December 31, 2024, and March 31, 2024, respectively.
(2) Annualized net earnings divided by average assets.
(3) Annualized adjusted net earnings divided by average assets.

25
|
|
|
|
|
|
|
|
|
|
|
|
|
|
|
|
|
|
| BANC OF CALIFORNIA, INC. |
|
|
|
|
|
| NON-GAAP MEASURES |
|
|
|
|
|
| (UNAUDITED) |
|
|
|
|
|
|
Three Months Ended |
|
March 31, |
|
December 31, |
|
March 31, |
| Efficiency Ratio |
2025 |
|
2024 |
|
2024 |
|
(Dollars in thousands) |
| Noninterest expense |
$ |
183,653 |
|
|
$ |
181,370 |
|
|
$ |
210,518 |
|
| Less: Intangible asset amortization |
(7,160) |
|
|
(7,770) |
|
|
(8,404) |
|
| Less: Acquisition, integration, and |
|
|
|
|
|
| reorganization costs |
— |
|
|
1,023 |
|
|
— |
|
| Noninterest expense used for |
|
|
|
|
|
| efficiency ratio |
$ |
176,493 |
|
|
$ |
174,623 |
|
|
$ |
202,114 |
|
|
|
|
|
|
|
| Net interest income |
$ |
232,364 |
|
|
$ |
235,285 |
|
|
$ |
229,102 |
|
| Noninterest income |
33,650 |
|
|
28,989 |
|
|
33,816 |
|
| Total revenue |
266,014 |
|
|
264,274 |
|
|
262,918 |
|
| Add: Loss on sale of securities |
— |
|
|
454 |
|
|
— |
|
| Total revenue used for efficiency ratio |
$ |
266,014 |
|
|
$ |
264,728 |
|
|
$ |
262,918 |
|
|
|
|
|
|
|
| Noninterest expense to total revenue |
69.04 |
% |
|
68.63 |
% |
|
80.07 |
% |
| Efficiency ratio (1) |
66.35 |
% |
|
65.96 |
% |
|
76.87 |
% |
______________
(1) Noninterest expense used for efficiency ratio divided by total revenue used for efficiency ratio.

26
|
|
|
|
|
|
|
|
|
|
|
|
|
|
|
|
|
|
| BANC OF CALIFORNIA, INC. |
|
|
|
|
|
| NON-GAAP MEASURES |
|
|
|
|
|
| (UNAUDITED) |
|
|
|
|
|
|
March 31, |
|
December 31, |
|
March 31, |
| Economic Coverage Ratio |
2025 |
|
2024 |
|
2024 |
|
(Dollars in thousands) |
|
|
|
|
|
|
| Allowance for credit losses ("ACL) |
$ |
264,557 |
|
|
$ |
268,431 |
|
|
$ |
320,074 |
|
| Add: Unearned credit mark from purchase accounting (1) |
20,870 |
|
|
22,473 |
|
|
28,980 |
|
| Add: Credit-linked notes (2) |
115,188 |
|
|
116,991 |
|
|
122,782 |
|
| Adjusted allowance for credit losses |
$ |
400,615 |
|
|
$ |
407,895 |
|
|
$ |
471,836 |
|
|
|
|
|
|
|
| Loans and leases held for investment |
$ |
24,126,527 |
|
|
$ |
23,781,663 |
|
|
$ |
25,473,022 |
|
|
|
|
|
|
|
| ACL to loans and leases held for investment (3) |
1.10 |
% |
|
1.13 |
% |
|
1.26 |
% |
|
|
|
|
|
|
| Economic coverage ratio (4) |
1.66 |
% |
|
1.72 |
% |
|
1.85 |
% |
|
|
|
|
|
|
|
|
|
|
|
|
|
|
|
|
|
|
|
|
|
|
|
|
|
|
|
|
|
|
|
|
|
|
|
|
|
|
|
|
|
|
|
|
|
|
|
|
|
|
|
______________
(1) Unearned credit mark from purchase accounting estimated by using the same pro rata split between the credit and yield marks associated with non-PCD loans (purchased loans without credit deterioration at the time of purchase).
(2) Credit-linked notes loss coverage equal to 5% of the unpaid principal balance of the pledged loans.
(3) Allowance for credit losses divided by loans and leases held for investment.
(4) Adjusted allowance for credit losses divided by loans and leases held for investment.

27

 1
1 
 2
2 
 3
3 
 4
4 
 5
5 
 6
6 
 7
7 
 8
8 
 9
9 
 10
10 
 11
11 
 12
12 
 13
13 
 14
14 
 15
15 
 16
16 
 17
17 
 18
18 
 19
19 
 20
20 
 21
21 
 22
22 
 23
23 
 24
24 
 25
25 
 26
26 
 27
27 