Document
Exhibit 99.1
January 22, 2025
Fellow Shareholders,
For the fourth quarter, we earned net income to common stockholders of $3.0 million, or $0.13 per diluted share. For the full year 2024, we earned net income to common stockholders of $12.9 million, or $0.54 per diluted share.
Discussion of the Quarter
Here are a few things I think investors should note for the fourth quarter:
•As of today, we believe that more than 50% of all brokered freight transactions touch our network. This metric is important for many reasons. It is also challenging to calculate with absolute precision given the way the market moves seasonally and cyclically, but using $110 billion as the addressable truckload market, we now touch over 50% of all transactions. We expect to hit another milestone in Q1 – eclipsing over $100 billion in payments through TriumphPay since inception. It’s been a great journey that is far from over.
•Expenses were materially better than our $97 million target, but the new year will bring expense growth. Expenses declined 2.5% in Q4 from the prior quarter. This decrease was largely driven by reduced compensation expense. We expect full quarter expenses in Q1 of approximately $99 million. On a related point, it is likely that financial metrics for Q1 2025 will be under pressure. As a reminder, we do not expect to recognize material revenue from our recently announced initiatives until the back half of the year. Until that time, we will bear much of the expense of the investment without offsetting revenue, and when combined with seasonal weakness in trucking, Q1 earnings may decline from current levels.
•We have added new KPIs this quarter to help investors track our progress. We have added KPIs for LoadPay including the number of LoadPay accounts, the total dollars spent on LoadPay debit cards, and the average interchange fee earned during the quarter. These are small numbers today, but the opportunity is large.
•We completed the acquisition of Isometric Technologies and are announcing a new segment called Intelligence. I discuss this in greater detail below.
Discussion of the Past Year
The year 2024 was a year of both milestones and headwinds. We had many significant achievements, which I will unpack in this letter. Before I go into those, let’s address the obvious — our earnings are below our historical average. The primary causes for this are:
1.The longest downturn in the freight market since trucking deregulation in 1980.
2.Our credit costs were higher than they should have been.
3.We have made the conscious decision to continue to invest in our transportation technology platform.
The last three years have been the most difficult freight market of my career, and people with longer careers than mine generally feel the same. The freight market is beyond anyone’s control. Our job is to manage through up and down cycles and never lose focus on improving our products and strengthening our network. Credit expenses were higher in 2024 than we expected. The freight recession contributed to this to a degree, but it was not the primary cause. There are several small things we can and will do better. We discuss some of those in our Banking segment section below. Finally, we have chosen to invest in the continued build and improvement of our network at the expense of current earnings. These investments include enhancing our existing technology and laying the groundwork for products yet to come to market. For those who follow us – customers, investors, competitors or critics – this should not be a surprise. We have a vision of helping parties in freight transact more confidently with one another, and our commitment to that vision will not fade due to an elongated weak market.
The best businesses are often built in those kinds of circumstances.
Now, let’s talk about the many good things that happened in 2024. We added C.H. Robinson (CHRW), the world’s largest freight broker, to our network as well as others. We rolled out Factoring-as-a-Service (FaaSTM), LoadPayTM and NextGen Audit. Each of those products on their own is a heavy lift, but we did all three while staying within our expense targets.
In the fourth quarter, we continued our limited LoadPay product release. Truckers opened 109 accounts and spent $208,000 dollars on their LoadPay debit cards. We recognized an average interchange fee of 1.67% on that spend in the quarter as well. At year end, we had 192 LoadPay accounts. This is a small sample set, but the trends support or surpass the unit economic predictions we made in our shareholder letter last quarter. Lastly, our cost of funds for the full year was 1.51%, which is better than almost any banking peer.
In sum, we got far more right than wrong in 2024. We continue our pursuit of creating a network where the freight industry can transact confidently. That pursuit calls for us to continue investing in our team and our platform. Because of those investments and our market position, we will be able to roll out additional products in 2025 that we believe will strengthen and enhance the network. I will update you on those in subsequent letters.
KPIs for the Quarter
The tables below outline some of our key operating metrics.
|
|
|
|
|
|
|
|
|
|
|
|
|
|
|
|
|
|
|
|
|
|
|
|
|
|
|
|
|
|
|
|
|
|
|
As of and for the Three Months Ended |
|
|
| (Dollars in thousands) |
December 31,
2024 |
|
September 30,
2024 |
|
June 30,
2024 |
|
March 31,
2024 |
|
December 31,
2023 |
|
|
|
|
| Financial Highlights: |
|
|
|
|
|
|
|
|
|
|
|
|
|
| Loans held for investment |
$ |
4,546,960 |
|
|
$ |
4,332,967 |
|
|
$ |
4,288,417 |
|
|
$ |
4,195,120 |
|
|
$ |
4,163,100 |
|
|
|
|
|
| Deposits |
$ |
4,820,820 |
|
|
$ |
4,706,694 |
|
|
$ |
4,392,018 |
|
|
$ |
4,450,963 |
|
|
$ |
3,977,478 |
|
|
|
|
|
| Net income available to common stockholders |
$ |
3,036 |
|
|
$ |
4,546 |
|
|
$ |
1,945 |
|
|
$ |
3,357 |
|
|
$ |
8,825 |
|
|
|
|
|
| Diluted earnings per common share |
$ |
0.13 |
|
|
$ |
0.19 |
|
|
$ |
0.08 |
|
|
$ |
0.14 |
|
|
$ |
0.37 |
|
|
|
|
|
Return on average assets(1) |
0.26 |
% |
|
0.36 |
% |
|
0.19 |
% |
|
0.31 |
% |
|
0.70 |
% |
|
|
|
|
Yield on loans(1) |
8.48 |
% |
|
8.85 |
% |
|
9.10 |
% |
|
9.09 |
% |
|
9.29 |
% |
|
|
|
|
Cost of total funds(1) |
1.41 |
% |
|
1.57 |
% |
|
1.62 |
% |
|
1.45 |
% |
|
1.47 |
% |
|
|
|
|
| Non-performing assets to total assets |
2.02 |
% |
|
2.07 |
% |
|
1.60 |
% |
|
1.61 |
% |
|
1.42 |
% |
|
|
|
|
| ACL to total loans |
0.90 |
% |
|
0.95 |
% |
|
0.92 |
% |
|
0.91 |
% |
|
0.85 |
% |
|
|
|
|
Total capital to risk-weighted assets(2) |
15.23 |
% |
|
16.62 |
% |
|
16.51 |
% |
|
16.69 |
% |
|
16.75 |
% |
|
|
|
|
Common equity tier 1 capital to risk-weighted assets(2) |
11.40 |
% |
|
11.85 |
% |
|
11.71 |
% |
|
11.85 |
% |
|
11.94 |
% |
|
|
|
|
(1) Current quarter ratios are annualized
(2) Current period ratios are preliminary
|
|
|
|
|
|
|
|
|
|
|
|
|
|
|
|
|
|
|
|
|
|
|
|
|
|
|
|
|
|
|
|
|
|
|
|
|
|
|
|
|
|
|
|
|
|
|
|
|
|
|
|
|
|
|
December 31,
2024 |
|
September 30,
2024 |
|
June 30,
2024 |
|
March 31,
2024 |
|
December 31,
2023 |
|
Current Quarter Q/Q |
|
Current Year Y/Y |
| For the Qtr Ending |
|
|
|
|
|
Change |
|
% Change |
|
Change |
|
% Change |
| Factoring: |
|
|
|
|
|
|
|
|
|
|
|
|
|
|
|
|
|
| Invoice Volume |
1,524,904 |
|
|
1,480,824 |
|
|
1,432,366 |
|
|
1,367,625 |
|
|
1,404,861 |
|
|
44,080 |
|
|
3.0 |
% |
|
120,043 |
|
|
8.5 |
% |
| Purchased Volume |
$ |
2,747,351,000 |
|
|
$ |
2,610,177,000 |
|
|
$ |
2,542,327,000 |
|
|
$ |
2,469,797,000 |
|
|
$ |
2,570,442,000 |
|
|
$ |
137,174,000 |
|
|
5.3 |
% |
|
$ |
176,909,000 |
|
|
6.9 |
% |
| Average Transportation Invoice Size |
$ |
1,767 |
|
|
$ |
1,724 |
|
|
$ |
1,738 |
|
|
$ |
1,771 |
|
|
$ |
1,781 |
|
|
$ |
43 |
|
|
2.5 |
% |
|
$ |
(14) |
|
|
(0.8) |
% |
| Operating margin |
23.67 |
% |
|
20.99 |
% |
|
12.48 |
% |
|
19.48 |
% |
|
22.45 |
% |
|
2.68 |
% |
|
12.8 |
% |
|
1.22 |
% |
|
5.4 |
% |
| Payments: |
|
|
|
|
|
|
|
|
|
|
|
|
|
|
|
|
|
| Invoice Volume |
6,788,408 |
|
|
6,278,246 |
|
|
6,062,779 |
|
|
5,717,016 |
|
|
5,703,740 |
|
|
510,162 |
|
|
8.1 |
% |
|
1,084,668 |
|
|
19.0 |
% |
| Payment Volume |
$ |
7,625,735,000 |
|
|
$ |
7,091,493,000 |
|
|
$ |
6,687,587,000 |
|
|
$ |
6,379,680,000 |
|
|
$ |
6,217,323,000 |
|
|
$ |
534,242,000 |
|
|
7.5 |
% |
|
$ |
1,408,412,000 |
|
|
22.7 |
% |
| Network Invoice Volume |
567,258 |
|
|
661,628 |
|
|
701,768 |
|
|
621,209 |
|
|
442,353 |
|
|
(94,370) |
|
|
(14.3) |
% |
|
124,905 |
|
|
28.2 |
% |
| Network Payment Volume |
$ |
922,927,000 |
|
|
$ |
1,063,228,000 |
|
|
$ |
1,133,118,000 |
|
|
$ |
1,035,099,000 |
|
|
$ |
740,048,000 |
|
|
$ |
(140,301,000) |
|
|
(13.2) |
% |
|
$ |
182,879,000 |
|
|
24.7 |
% |
| EBITDA margin |
8.6 |
% |
|
0.5 |
% |
|
(10.4) |
% |
|
(13.2) |
% |
|
0.3 |
% |
|
8.1 |
% |
|
1721.0 |
% |
|
8.3 |
% |
|
2982.7 |
% |
|
|
|
|
|
|
|
|
|
|
|
|
|
|
|
|
|
|
|
|
|
|
|
|
|
|
|
|
|
|
|
|
|
|
|
|
A New Segment – Intelligence
Intelligence may be a new segment, but the building blocks that we are using to put it together have largely been at Triumph for a few years as well as some of the talented team members we are using to build it. This is largely about utilizing the data we already collect in Payments and Factoring in a way that can benefit our existing customers and help us win new business. Before I go into details of what we intend to do, I think it is important to include a bit of history.
How did our Factoring segment come to be? Triumph entered the factoring industry on January 13, 2012. There were more than a few skeptics about this move, both internally and externally. We acquired a small transportation factoring company named Advance Business Capital LLC. At the time, its balance sheet consisted of $55 million of factored receivables. It would be a lie for me to tell you that I understood the long-term strategic implications of that acquisition on the day of closing. What I observed at the time was a business model that was very good at generating short-duration, high-yield and creditworthy assets. That is a unique and potent combination in banking. What began as $55 million in 2012 is over $1 billion today. Triumph is the second largest player in transportation factoring.
How did our Payments segment come to be? Everything we learned about factoring gave rise to the creation of our Payments segment. While there is much to love about factoring (as I waxed eloquently about above), it remains a business where we must work to keep the marketing funnel full. The average client duration has historically been around 22 months, so the sales treadmill never stops. Beginning in 2019, we began with the idea of reverse factoring. Reverse factoring, also known as supply chain finance, is a financial solution designed to improve cash flow for suppliers while strengthening the relationships within a supply chain. Unlike traditional factoring, where suppliers sell their accounts receivable to a third party, reverse factoring is initiated by the buyer (payor) rather than the supplier (payee). For our purposes, this means that we provide the broker the ability to offer faster payments to its truckers in exchange for a small discount on the amount paid. To facilitate expedited payments for these payors, we built a technology solution and service that integrates directly into the payor's TMS and accounting systems. Through this, we execute carrier accounts payable, manage remittances, leverage bank-grade processes to mitigate risk, and service carriers and factors on their behalf. This, coupled with the supply chain finance options previously mentioned, brings efficiency and revenue-generating opportunities to what is typically a cost center, all while improving the carrier experience.
We did not stop at reverse factoring. After studying the industry and corollaries in other industries, we decided to pivot to an "open loop" style payments network in 2021. We continue to tweak this model, but one effect of that decision was to slow our balance sheet growth in favor of creating a network where parties can transact with each other efficiently and confidently. We have accomplished a lot since that decision. Our network now touches over 50% of all brokered freight.
How did our Intelligence segment come to be? We created our Intelligence segment to turn data into actionable insights. This means expanding the network beyond payments alone. We have thought about data for a long time at Triumph. Data revenue commands high valuations because of its scalability and durability, but doing it well requires a deep understanding of the market. Factoring taught us a lot about payments, and payments taught us a lot about data. The question is what we would do with those learnings. Let me begin with why data is important in trucking, and then let’s tackle the obvious question – does Triumph have a right to win in data?
Data is important in the trucking industry because it drives efficiency, enhances decision-making, and enables companies to operate more profitably in a competitive market. Data also plays a significant role in market strategy. If anyone doubts this, they need only to look at the number of freight-tech companies that have entered the market over the last several years. If you accept that actionable data is valuable to our customers, let's turn to the question I asked above — does Triumph have a right to win in data? First off, let's define winning. Data is not a winner-take-all proposition. There are many data and intelligence providers that serve important roles for the freight industry. For Triumph’s purposes, I define winning as creating a product offering that is scalable enough to create significant enterprise value and that has profit margins consistent with other leading information and intelligence service offerings.
As Triumph has become a trusted partner to the freight brokerage community and scaled the amount of data we capture, several of these customers have asked us to create additional products to help them drive efficiencies and unlock insights that would otherwise be unavailable. We are well positioned to do this because of the following:
•Density – While there are various data providers in the market, few have the scale of data that Triumph does, and even fewer have precise data that is validated as cleared transactions.
•Neutrality – As a bank, we cannot and do not compete with the freight customers we serve. This alleviates conflicts of interest with which other providers have struggled in the past.
•Veracity – An important distinction about Triumph’s data assets is that they are overwhelmingly focused on cleared (paid) freight transactions. Other providers often commingle real freight movement data with other less accurate sources which can cause distortions.
The Acquisition of ISO. As we have discussed in past shareholder letters, Triumph is continually looking across the market for partnership and acquisition opportunities that align with our brand promise of customers transacting confidently. In Q4, we closed on the acquisition of Isometric Technologies, or ISO for short. ISO provides service and performance scoring and benchmarking capabilities to the freight industry. A primary use case of ISO is a broker understanding objectively how they perform for their shipper customers and similarly assessing the performance of each carrier in their network. To do this, ISO aggregates, calculates and analyzes key metrics such as on-time pickup and delivery for each carrier on every lane.
On a standalone basis, this information is helpful to brokers and carriers to ensure they are delivering freight at or above their customers’ expectations. Combined with the scale of Triumph's data, customers will be able to unlock a deep understanding of their networks in ways not previously available. As we combine the two platforms and datasets, we will have more to offer the market.
Beyond this acquisition, I believe that our Intelligence segment is an exciting opportunity for growth. We absorb much of the data necessary for this offering in our Factoring and Payments segments, which enables density and improves margin. The opportunity for the network is more than just payments. That has been a significant learning for us over the last few years.
A few final points for the thoughtful investor. Upon the establishment of our Intelligence segment during the fourth quarter, we transferred certain Payments employees to this effort. In the Payments segment discussion below, we call out this impact so investors can have a clear picture of how Payments has performed. Because of what is in the pipeline, it is now time to separate Intelligence out as we are prepared to grow revenue with the acquisition of ISO and other products on which we are working. It may seem early to some, but it is how I think about the enterprise, and I think investors deserve to know about this part of our roadmap.
Taking Steps in the Right Direction - Summary of Performance Measures for Our Transportation Segments
With the announcement of Intelligence, we now have three transportation segments – Factoring, Payments and Intelligence. It is useful for investors to understand how we assess the performance of each of these segments. We believe that the best way for us (and investors) to think about each segment is by looking at (i) the EBITDA margin of the Payments segment, (ii) the operating margin of the Factoring segment, and (iii) the gross margin of the newly formed Intelligence segment. And lest people think we forget, all three of these come together with our Banking segment to generate net income for our common shareholders. That is the ultimate measure we must keep in mind as we think about Triumph at mature scale. This is the fundamental question we ask ourselves – is it worth foregoing greater profitability in the present to build something that is more valuable in the future? Our answer to this continues to be yes, and we know that we must demonstrate to our stakeholders that we are taking steps in the right direction.
For the last several years, we have talked about the EBITDA margin of our Payments segment, which just had its best quarter ever based on that measure. I believe EBITDA is useful for growth companies (or segments) because it reflects the capacity to generate cash from operations without the influence of capital structure complexities. For a business like ours that benefits from float revenue and transaction fees, continued EBITDA margin improvement also captures the returns we get from improving operational efficiency. Our aspiration is to have a 50% EBITDA margin in our Payments segment at maturity. We are a few years away from that, but we are taking steps in the right direction. LoadPay brings with it some exciting potential into the addressable market and margin of our Payments segment. We are at the very beginning of that journey.
We believe that investors should judge the success of our Factoring segment by operating margin[1] because it correlates with how efficiently we profit from delivering core factoring services. Our Factoring operating margin in Q4 was 23.7%. Longer term, as we grow the business, recognize greater efficiencies from the investments we are making in technology, and operate in a more normal freight environment, we aim to consistently achieve a 40% operating margin in the segment. We have performed at or near those levels before when the market was more in our favor; my aim is to improve our foundation so that we can take steps in the right direction even in the face of market headwinds. Factoring has not been an area of growth for us in the last few years, but with the development of FaaS and other initiatives, investors should expect to see this grow and improve margin. I believe we have the leading technology platform in the entire factoring market, and it is time to drive more volume through what we have built.
As I referenced earlier, our Intelligence segment is charged with turning data into actionable insights for our customers. We already have this data as a product of the activity in all of our transportation businesses, and the more data we collect the more valuable it becomes. As a result, the gross margins in this business should be higher than anything else we do. Data service companies are often judged by gross margin because they can rely on a digital infrastructure that allows for revenue growth without increasing the direct costs of adding additional users. Operating costs are important, but we believe that measuring the gross margin of this business in its early stages is useful because it’s a key indicator of scalability – taking steps in the right direction of creating something very valuable. In addition to maintaining a high gross margin, it is our job to grow revenue off of a very small base. That is the work in front of us, and we are excited to do it.
Payments
1.Analysis of financial and operational performance for the quarter
2.Progression towards 50% density target
3.LoadPay update
Analysis of financial and operational performance for the quarter. EBITDA margin for the quarter was 8.6% for our Payments segment[2]. We grew our volume and our profitability even though LoadPay’s revenue was de minimis while the investment expense was real. I also want to remind everyone that revenue from our partnership with CHRW will not show up materially until the back half of the year – it will lag the volume gains.
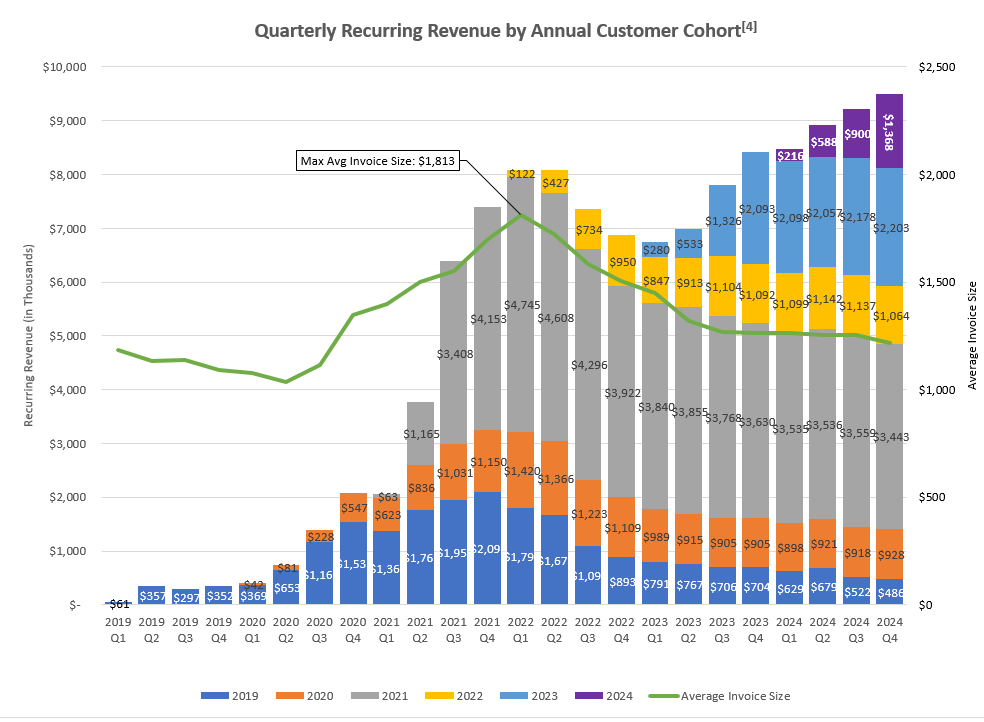
The chart on the next page provides a visual demonstration of how we continue to grow revenue in our Payments segment. In the chart, the line represents invoice sizes[3], while the bars represent revenue. The revenue bars highlight QuickPay and fee income that can be attributed to a specific customer in a specific year and excludes other supply chain finance income and float. Noninterest income in our Payments segment grew 1.4% this quarter and is up 17.4% versus Q4 2023.
Emerging View on Network Transactions. Network transactions decreased 14.3% relative to Q3, demonstrating the full quarter impact of the factoring client, mentioned in last quarter’s letter, who exited the network. That notwithstanding, network transactions were up 28.2% year-over-year. In past letters, I have emphasized the growth of network transactions as a high priority. I will not abandon that here – it is important, and I expect it to return to growth this year as I said previously. Even when it returns to growth, I think the application and revenue opportunity for network transactions is different than I previously did. Here are some thoughts on why:
Technology advances in extracting data from invoices and using AI/ML models to make instant purchase decisions have replaced some of the value of structured data for factors – or at least for our own Factoring segment. Other factors may attempt to replicate this with overseas manual labor if they do not have a form of the technology built for themselves. With the level of sophistication our Factoring segment has developed, combined with the historical data our models leverage, we can make very educated decisions almost instantly even when it is not a network transaction (and thus lacks the structured data that comes with it). I have seen first-hand that AI/ML is better than humans at recognizing patterns. The strides we have made with Instant Decision in the last 12 months are remarkable. Granted, not every factor has the same level of technology we do, but other large factors probably have a basic form of it or are working on one.
Even if a factor has an AI/ML driven decisioning model, it is still prudent to leverage a network transaction when available. It allows the factor to bounce the purchasing decision off the broker’s TMS for near absolute certainty pre-purchase. This assumes that the Factor’s tech stack has been modified to ingest this data, which is not universally true. Triumph's model (and thus, our FaaS offering) is built to prioritize structured network data first and then move on to data extraction and algorithmic techniques to complete the purchase decision process as necessary. This all happens in seconds.
Everything described above is what gets a factor to the point of deciding to purchase an invoice, but that is not the end of the journey. Network transactions also include remittance data on paid invoices to automatically close the loop, as well as the data from factors pushed back to brokers for presentment, allowing for early detection of exceptions and subsequent resolution.
All of this automation adds value to the transaction, but at a lower price point than our original thinking.
As a result of these learnings, I want to revise something I said in the Q3 2023 shareholder letter - network transactions are not the most scalable and profitable thing we will do. They have a part to play in the growth of our network, but it is not the primary driver. I think LoadPay and FaaS, neither of which were fully conceptualized at the time that shareholder letter was written, are more exciting opportunities than network transactions with a larger TAM. Some of the things we are working on in our Intelligence segment are more efficient at scale than network transactions. We learn and adapt. The network that we have built within our Payments segment enabled the creation of products for the market that did not exist a year ago.
The most important takeaway in all of this is that our network should be more than just a payments network – it needs to be a place where parties can transact more confidently. That includes, but goes beyond, using structured data in factored transactions. As we roll out our Intelligence offering, this will come more clearly into view for the industry and for investors. While I firmly believe in transparency with investors, I will be more cautious going forward in giving too much granularity or too many predictions early in the process. We will keep people informed as we go.
Returning to our quarterly numbers – our broker quickpay penetration average was 6.4%, and we generated service revenue on approximately 23.8% of our payments invoices. We also earned revenue of $2.7 million[5] on the net float generated through payments made on behalf of our clients. TriumphPay's non-interest expense this quarter was $16.7 million, down 4.4% compared to the prior quarter, related in part to my opening comments.
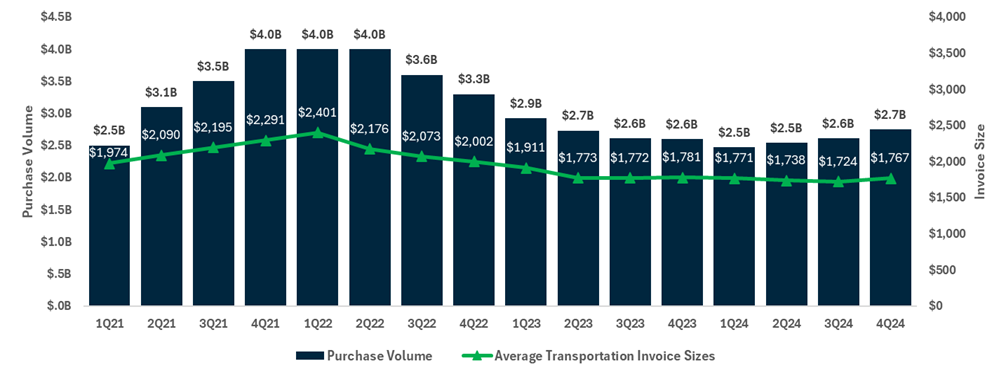
In the chart below, we highlight the continued revenue growth and its trend over the last eight quarters against the backdrop of our payment volumes. Our fourth quarter run rate was $60.1 million. We have generated a roughly 44.7% CAGR in revenue over the last two years.

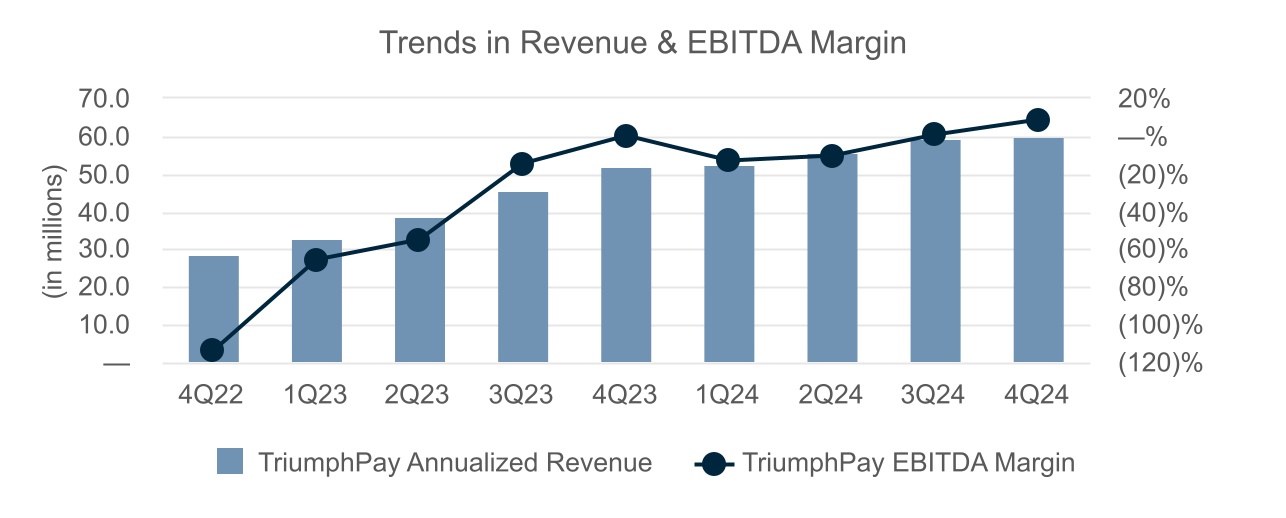
In the chart on the next page, we highlight the trend lines in EBITDA margin relative to revenue. We maintained positive EBITDA in Q4. We continue to enhance our products, leading to new revenue opportunities as we work to convert legacy clients from TriumphPay’s early days to fully engaged clients with all the benefits the network now offers. During the quarter, we upgraded 10 broker clients and three factor clients from our Legacy Audit product to NextGen Audit, upgraded one factor client to the network, cross-sold five brokers (audit to include payments or payments to include audit), and added supply chain financing to one shipper client. Together, this added about $1.6 million in incremental annual revenue. EBITDA margin growth is very important to us, and we expect it to continue (although there can be noise in any given quarter).
Progression towards 50% density in brokered freight target[6]. We are excited to announce that, since quarter-end, TriumphPay crossed the milestone we have long chased, with over 50% of brokered freight now moving through our network for payments, audit or both. Our annualized network engagement[7] in the fourth quarter was approximately $53.6 billion, or 48.7% of the $110 billion estimated size of the entire truckload (“TL”) brokered market. There was acceleration during the quarter, and December itself was very near $55 billion. We believe we have crossed that hurdle since year-end.
For the quarter, TriumphPay’s invoice volume increased 8.1%, and total payment volume increased by 7.5% to $30.5 billion, annualized. Our broker clients represent $26.7 billion of that figure, while the remaining $3.8 billion is related to shipper clients. The average invoice paid by TriumphPay decreased 0.5% in size. Our annualized unique broker audit dollar volume was down slightly from Q3 at $15.4 billion, and our annualized unique factor audit volume was also down slightly at $11.5 billion. The unique broker and factor audit volumes coupled with our broker payment volumes, represent our network engagement.
LoadPay Update. LoadPay’s beta period continues to yield learnings that inform the product roadmap as we deliver an ever-improving carrier experience. LoadPay went live on a limited internal basis in Q3, then added an equally limited roll-out with CHRW in Q4. We’ve been working closely with CHRW to ensure that the carrier experience with LoadPay is excellent before offering a broader roll-out to the market. That will begin in Q1.
On Labor Day last year, we crossed the $100,000 threshold for payments into LoadPay accounts. As of the first week of this year, roughly a quarter later, we surpassed $1 million in cumulative payments. The source of those payments, which are deposits into the noninterest bearing accounts of the carrier customers, were a combination of Triumph Factoring, TriumphPay Select Carriers, and CHRW’s Factoring powered by Delta offering. It should be noted that these deposits decay quickly. This is not a surprise. We do not yet have a sufficient sample size to be able to tell our investors what the average float will be or how many carriers are using their LoadPay account as their primary checking account, but we are highly focused on delivering a compelling product tailor-made for truckers. There are a few figures we can discuss now: as of January 17, we have 216 LoadPay accounts, and in Q4, we realized an average interchange rate at 1.67% on carrier spend through the LoadPay debit card.
Factoring
1.Analysis of financial and operational performance for the quarter
2.Transportation market update
3.Factoring as a Service (FaaS) and Technology
Analysis of financial and operational performance for the quarter. During Q4, our average transportation invoice price increased to $1,767. This is $14 below the same quarter in 2023, but up $43 from Q3 of 2024. Purchased volume increased 5.3% relative to Q3.
Factoring segment operating income was $9.0 million, or $1.1 million higher than the prior quarter. This was primarily due to a return to normal seasonal patterns and lower funding costs. Total revenue grew 0.7% as seasonal trends through most of the quarter lifted activity and results. Yield on average receivables balances was down, falling 0.21% to 13.36%. Charge-offs were higher than Q3, but still in line with historical trends at 0.26%.
Transportation Market Update. The downward trajectory in rates we witnessed in Q3 reversed in Q4. Early in the quarter, fuel and the average invoice size ticked up in lock step prior to the election. Post election, the DOE average for diesel dropped to the lowest point of the year at $3.46 and ended Q4 at $3.50. Rates continued to increase throughout the quarter, and by the last week in the quarter, we were seeing average invoice prices above $1,900, the highest level since January 2023. The DOE average at that time was $4.62. During the quarter, the transaction counts remained strong through the holidays, reaching a peak in mid-December and fading into the New Year, as normal.
Despite the strength we are seeing in spot rates ex-fuel, and the associated industry news chatter on the topic of a freight recovery, we are not yet ready to say the downturn in the freight market is over. For example, we are seeing the normal Q1 seasonal volume pullbacks we would expect to see following the holidays and fewer loads per customer. In fact, loads per customer through the first few weeks of 2025 are tracking under both Q4 and the same period in January 2024. As such, we do not expect Q1 will be materially different than historical seasonal patterns would guide us, despite strengthening spot rates. That is what we see. I hope my letter this time next year includes a mea culpa and we’ve seen a dramatic positive shift in the freight markets. In any event, we will continue to manage the business safely, soundly, and with an eye towards thoughtful investment, regardless of what the freight market does.
Not all client segments participated in the fourth quarter's rebound. Total client count in our small carrier segment continued to contract amid the minimal improvement in spot rates, while our large fleet carriers strengthened in the quarter. Historically, at the end of a cycle, larger fleet carriers, who have the capacity to run more contract freight, will participate with increased rates before small carriers in the spot market.
Our sales pipeline largely reflects where we are in the cycle. Our fleet sales pipeline is robust, as many larger fleets who previously had working capital relationships with traditional bank lenders have fallen out of favor with them, creating opportunities for our Factoring segment. This is typical in this stage of the freight cycle, where a large fleet with a revolver, or ABL facility may trip debt service coverage ratios, choking availability of the facility and potentially impacting collateral requirements. As a result, that carrier may see their advance rate drop materially. These are usually well-run companies; they have simply been impacted by industry dynamics outside their control. When that occurs, we are able to step into that situation, providing working capital solutions through factoring with higher advance rates. We can do this safely and effectively due to the inherent differences between lending or ABL facilities and factoring relationships. As a reminder, factoring looks through the carrier to the payor as the source of repayment, and the payor is usually a large shipper or freight broker. The discount rate is lower on the larger opportunities; however, we pick up operational efficiency through our investment in technology, and those larger carriers are more willing to use system integrations and our self-service toolbox.
The fuel program we launched earlier this year is gaining adoption within our client base. Having a competitive fuel program is critical to the long-term success of small and medium truckers. Our fuel partnership gives us an opportunity to help our carrier clients thrive. In 2024, we saved our carriers almost $3,500,000 and expect to triple that amount in the new year. Diesel prices continue to soften, improving carrier margins. We do not see a catalyst that would change this outcome in the near-term, but we are not in the business of predicting oil or diesel prices.
FaaS and Technology. Our Factoring-as-a-Service (FaaS) offering continues as a cornerstone of our strategic growth in factoring and an innovative solution for businesses seeking flexible financial support. As mentioned last quarter, the investments we make in technology to benefit Triumph Factoring benefit our FaaS clients as well.
Our first FaaS partner, CHRW, successfully beta tested the platform in Q4. This period allowed our product and development team to assess how the product is serviced as well as areas for optimization of the origination process. It also allowed for training and education with CHRW’s team enabling them to effectively offer the product at scale to their broader carrier base. We remain committed to enhancing the carrier experience, focusing on seamlessly onboarding carriers and an optimized origination process. By investing in technology to streamline these workflows, we ensure a faster, more efficient experience for all parties involved, and a best-in-class carrier experience for their clients. These early successes reinforce the scalability and adaptability of our FaaS solution, solidifying our position as an industry leader and driving long-term growth for our stakeholders.
In last quarter’s letter, I mentioned a strategic investment in our Instant Decision model. That tool has delivered outstanding results, enhancing efficiency and supporting our growth objectives as well as our thoughts around the scalability of our FaaS offering. We are fully ramped, now covering 100% of our small carrier segment.
The early results are impressive: Of those small carriers, 74.8% pass through the model and pay in full without dispute or human interaction. The average time to approve an invoice is nine seconds, a testament to the model’s ability to streamline operations while reducing risk during the purchase decision process. Investors should be wary of claims about “touch-free processing” that so many companies claim. Some AI tools in the market tout high percentages on easier tasks and then transfer the process back to a human for more challenging elements. When we say touchless, we mean it – from verification to validation – almost 75% of the invoices passing through our Instant Decision tool are never touched by a human in the purchase process. We continue training and improving the tools and have high expectations for the future.
Banking
1.Analysis of financial and operational performance for the quarter
2.Credit update
Analysis of financial and operational performance for the quarter. Banking segment operating income fell $2.1 million, or 7.1%, from the prior quarter due to the combined effects of lower lending fees, lower variable rates and a shift toward lower yielding assets. These effects were partially offset by lower funding costs, which declined by 16 basis points to 1.41% and lower noninterest expense. Looking forward, our modeling suggests that each 25 basis point rate cut would reduce our consolidated quarterly net interest income by $0.5 - 1.0 million.
Credit Update. In past quarters, we highlighted credit events that were concentrated in equipment finance, liquid credit and commercial real estate. These lending units continue to be the focus of our credit risk management efforts, so I’d like to update you on each.
•Liquid Credit was responsible for $2.8MM, or 62% of our credit expense this quarter. Derisking and shrinking this portfolio has taken time and been frustrating. We have learned lessons here that we will not forget.
•Equipment Finance represents the largest share of our NPAs due primarily to the continuing freight recession. As expected, the freight recession resulted in a few new delinquencies and requests for payment deferrals last quarter. We are receiving reduced payments on the vast majority of our past-due loans, which is partially offsetting the growth in delinquencies. No significant new specific reserves or charge-offs were warranted based on our collateral positions.
•Commercial real estate has been and remains the largest portion of our classified assets, but we continue to believe our loss exposure is low. Last quarter, new downgrades were partially offset by payoffs and amortization of existing classified assets resulting in relatively flat credit quality. Our historical credit expense in this type of lending is very low, and we expect it to stay that way despite the noise caused by the rate environment. A classified loan is not the same as a credit loss, but we take both seriously.
Closing Thoughts
As I noted in the opening, we expect our operating expenses to grow in 2025 after keeping them flat for the last few quarters. Given annual resets in compensation and benefits, the integration of ISO, and growth to support strategic initiatives, we currently project approximately $99 million in operating expense for Q1 2025. As an enterprise, we hit most but not all of our targets in 2024, and annual incentive accruals reflected this in both Q3 and Q4. Those targets also reset at the turn of the year.
As previously stated in my opening, we believe it is possible Q1 earnings will be lower than the quarter we just reported. Further, I would remind everyone again that many of the things we have discussed above will not generate revenue until the back half of the year. We are not blind to the benefits and responsibility of being profitable in the short-term, but we will not be distracted from our long-term vision.
Looking back, we accomplished a lot in 2024. We learned some things too. We have a lot of work to do in 2025, and we are already getting after it.
With warm regards,
Aaron P. Graft Founder, Vice Chairman & CEO
[1] Operating margin is defined as Pretax Operating Income divided by Total Revenue (interest income and noninterest income). We believe that it is appropriate to include interest expense in the numerator, as factoring is a balance sheet business and interest expense represents a core cost of the product. We exclude interest expense from the denominator as per custom in calculating Operating Margin.
[2] During the quarter we moved Intelligence related resources from TriumphPay over to the Intelligence segment. Noninterest expense moves related to this internal resources transfer had an impact in Q4 2024 of approximately $485,000 while revenue was impacted by approximately $130,000. We believe a base run-rate for noninterest expense in our Intelligence segment for Q1 2025 would be approximately $2.5 million with ISO’s addition representing approximately $1.4 million of the total. This change impacted EBITDA margin by 2.3%.
[3] Average invoice sizes in our payments segment are generally smaller than average invoice sizes in our factoring segment as a transportation factor generally will only factor long-haul trucking invoices. Less than truckload ("LTL") and parcel typically are not regularly serviced by the transportation factoring industry due to their small ticket size. Our payments business pays all transportation invoices of a freight broker and, as such, includes some LTL, parcel and shorter hauls that a transportation factor normally will not service.
[4] Recurring cohort revenue is defined as quickpay revenue and fee revenue attributable to clients onboarded in the annual cohorts shown. It does not include nonrecurring fees or gains, float revenue, or other supply chain finance income aside from quickpays.
[5] Float revenue in TriumphPay is generated on the net remaining float after funding balance sheet exposure in the payments segment. Average float balances in TriumphPay for Q4 2024 were $410 million. Average net float balances for the quarter were $235 million.
[6] This reference to brokered freight is specific to domestic truckload (“TL”) freight only. Thus, this calculation would exclude less than truckload ("LTL"), parcel, etc. It would also exclude shipper volumes. Admittedly, this is a difficult percentage to calculate with precision, and it will move from year to year. That being said, we can evaluate the number of payments received in our factoring segment as a proxy for the percentage of TL freight TriumphPay is touching and also use industry data points to make informed assumptions. In the end, this goal is not intended to be a precise measurement in the same way as we would measure earnings. It is a directional and blunt measurement of the reach of the Payments network.
[7] We define network engagement as the amount of freight touched through our payments, audit or full AP automation products. It is an indicator of our broker volume density in the market, the source for growing available network transactions, and a key value driver for factors on the network.
Conference Call Information
Aaron P. Graft, Vice Chairman and CEO, and Brad Voss, CFO, will review the financial results in a conference call with investors and analysts beginning at 9:30 a.m. central time on Thursday, January 23, 2025.
The live video conference option may be accessed directly through this link, https://triumph-financial-inc-earnings-q4fy24.open-exchange.net/ or via the Company's website at tfin.com through the News & Events, Events & Presentations links. Alternatively, a live conference call option is available by dialing 1-833-928-4610 (International: +1-800-456-1369) requesting to be joined to meeting ID 980 4524 2053 at the prompt. An archive of this conference call will subsequently be available at this same location, referenced above, on the Company’s website.
About Triumph Financial
Triumph Financial, Inc. (Nasdaq: TFIN) is a financial holding company focused on payments, factoring and banking. Headquartered in Dallas, Texas, its diversified portfolio of brands includes TriumphPay, Triumph and TBK Bank. www.tfin.com
Forward-Looking Statements
This letter to shareholders contains forward-looking statements. Any statements about our expectations, beliefs, plans, predictions, forecasts, objectives, assumptions or future events or performance are not historical facts and may be forward-looking. You can identify forward-looking statements by the use of forward-looking terminology such as “believes,” “expects,” “could,” “may,” “will,” “should,” “seeks,” “likely,” “intends,” “plans,” “pro forma,” “projects,” “estimates” or “anticipates” or the negative of these words and phrases or similar words or phrases that are predictions of or indicate future events or trends and that do not relate solely to historical matters. You can also identify forward-looking statements by discussions of strategy, plans or intentions. Forward-looking statements involve numerous risks and uncertainties and you should not rely on them as predictions of future events. Forward-looking statements depend on assumptions, data or methods that may be incorrect or imprecise and we may not be able to realize them. We do not guarantee that the transactions and events described will happen as described (or that they will happen at all). The following factors, among others, could cause actual results and future events to differ materially from those set forth or contemplated in the forward-looking statements: business and economic conditions generally and in the bank and non-bank financial services industries, nationally and within our local market areas; our ability to mitigate our risk exposures; our ability to maintain our historical earnings trends; changes in management personnel; interest rate risk; concentration of our products and services in the transportation industry; credit risk associated with our loan portfolio; lack of seasoning in our loan portfolio; deteriorating asset quality and higher loan charge-offs; time and effort necessary to resolve nonperforming assets; inaccuracy of the assumptions and estimates we make in establishing reserves for probable loan losses and other estimates; risks related to the integration of acquired businesses and any future acquisitions; our ability to successfully identify and address the risks associated with our possible future acquisitions, and the risks that our prior and possible future acquisitions make it more difficult for investors to evaluate our business, financial condition and results of operations, and impairs our ability to accurately forecast our future performance; lack of liquidity; fluctuations in the fair value and liquidity of the securities we hold for sale; impairment of investment securities, goodwill, other intangible assets or deferred tax assets; our risk management strategies; environmental liability associated with our lending activities; increased competition in the bank and non-bank financial services industries, nationally, regionally or locally, which may adversely affect pricing and terms; the accuracy of our financial statements and related disclosures; material weaknesses in our internal control over financial reporting; system failures or failures to prevent breaches of our network security; the institution and outcome of litigation and other legal proceedings against us or to which we become subject; changes in carry-forwards of net operating losses; changes in federal tax law or policy; the impact of recent and future legislative and regulatory changes, including changes in banking, securities and tax laws and regulations, such as the Dodd-Frank Act and their application by our regulators; governmental monetary and fiscal policies; changes in the scope and cost of FDIC, insurance and other coverages; failure to receive regulatory approval for future acquisitions and increases in our capital requirements.
While forward-looking statements reflect our good-faith beliefs, they are not guarantees of future performance. All forward-looking statements are necessarily only estimates of future results. Accordingly, actual results may differ materially from those expressed in or contemplated by the particular forward-looking statement, and, therefore, you are cautioned not to place undue reliance on such statements. Further, any forward-looking statement speaks only as of the date on which it is made, and we undertake no obligation to update any forward-looking statement to reflect events or circumstances after the date on which the statement is made or to reflect the occurrence of unanticipated events or circumstances, except as required by applicable law. For a discussion of such risks and uncertainties, which could cause actual results to differ from those contained in the forward-looking statements, see "Risk Factors" and the forward-looking statement disclosure contained in Triumph Financial’s Annual Report on Form 10-K, filed with the Securities and Exchange Commission on February 13, 2024.
Non-GAAP Financial Measures
This letter to shareholders includes certain non‐GAAP financial measures intended to supplement, not substitute for, comparable GAAP measures. Reconciliations of non‐GAAP financial measures to GAAP financial measures are provided at the end of this letter to shareholders.
The following table sets forth key metrics used by Triumph Financial to monitor our operations. Footnotes in this table can be found in our definitions of non-GAAP financial measures at the end of this document.
|
|
|
|
|
|
|
|
|
|
|
|
|
|
|
|
|
|
|
|
|
|
|
|
|
|
|
|
|
|
|
|
|
|
|
|
|
|
|
|
|
|
|
As of and for the Three Months Ended |
|
As of and for the Year Ended |
| (Dollars in thousands) |
December 31,
2024 |
|
September 30,
2024 |
|
June 30,
2024 |
|
March 31,
2024 |
|
December 31,
2023 |
|
December 31,
2024 |
|
December 31,
2023 |
| Financial Highlights: |
|
|
|
|
|
|
|
|
|
|
|
|
|
| Total assets |
$ |
5,948,975 |
|
|
$ |
5,866,046 |
|
|
$ |
5,783,334 |
|
|
$ |
5,575,493 |
|
|
$ |
5,347,334 |
|
|
$ |
5,948,975 |
|
|
$ |
5,347,334 |
|
| Loans held for investment |
$ |
4,546,960 |
|
|
$ |
4,332,967 |
|
|
$ |
4,288,417 |
|
|
$ |
4,195,120 |
|
|
$ |
4,163,100 |
|
|
$ |
4,546,960 |
|
|
$ |
4,163,100 |
|
| Deposits |
$ |
4,820,820 |
|
|
$ |
4,706,694 |
|
|
$ |
4,392,018 |
|
|
$ |
4,450,963 |
|
|
$ |
3,977,478 |
|
|
$ |
4,820,820 |
|
|
$ |
3,977,478 |
|
| Net income available to common stockholders |
$ |
3,036 |
|
|
$ |
4,546 |
|
|
$ |
1,945 |
|
|
$ |
3,357 |
|
|
$ |
8,825 |
|
|
$ |
12,884 |
|
|
$ |
37,875 |
|
|
|
|
|
|
|
|
|
|
|
|
|
|
|
| Performance Ratios - Annualized: |
|
|
|
|
|
|
|
|
|
|
|
|
|
| Return on average assets |
0.26 |
% |
|
0.36 |
% |
|
0.19 |
% |
|
0.31 |
% |
|
0.70 |
% |
|
0.28 |
% |
|
0.76 |
% |
| Return on average total equity |
1.70 |
% |
|
2.39 |
% |
|
1.26 |
% |
|
1.90 |
% |
|
4.40 |
% |
|
1.81 |
% |
|
4.80 |
% |
| Return on average common equity |
1.41 |
% |
|
2.14 |
% |
|
0.94 |
% |
|
1.62 |
% |
|
4.25 |
% |
|
1.53 |
% |
|
4.67 |
% |
Return on average tangible common equity (1) |
2.01 |
% |
|
3.07 |
% |
|
1.35 |
% |
|
2.33 |
% |
|
6.20 |
% |
|
2.20 |
% |
|
6.91 |
% |
Yield on loans(2) |
8.48 |
% |
|
8.85 |
% |
|
9.10 |
% |
|
9.09 |
% |
|
9.29 |
% |
|
8.87 |
% |
|
9.20 |
% |
| Cost of interest bearing deposits |
2.17 |
% |
|
2.20 |
% |
|
2.34 |
% |
|
1.99 |
% |
|
1.84 |
% |
|
2.18 |
% |
|
1.37 |
% |
| Cost of total deposits |
1.22 |
% |
|
1.23 |
% |
|
1.39 |
% |
|
1.17 |
% |
|
1.11 |
% |
|
1.25 |
% |
|
0.83 |
% |
| Cost of total funds |
1.41 |
% |
|
1.57 |
% |
|
1.62 |
% |
|
1.45 |
% |
|
1.47 |
% |
|
1.51 |
% |
|
1.21 |
% |
Net interest margin(2) |
6.65 |
% |
|
6.81 |
% |
|
7.07 |
% |
|
7.29 |
% |
|
7.55 |
% |
|
6.95 |
% |
|
7.67 |
% |
| Net noninterest expense to average assets |
5.17 |
% |
|
5.29 |
% |
|
5.67 |
% |
|
5.62 |
% |
|
5.29 |
% |
|
5.43 |
% |
|
5.58 |
% |
|
|
|
|
|
|
|
|
|
|
|
|
|
|
|
|
|
|
|
|
|
|
|
|
|
|
|
|
Asset Quality:(3) |
|
|
|
|
|
|
|
|
|
|
|
|
|
| Past due to total loans |
3.27 |
% |
|
2.62 |
% |
|
2.21 |
% |
|
1.90 |
% |
|
2.00 |
% |
|
3.27 |
% |
|
2.00 |
% |
| Non-performing loans to total loans |
2.49 |
% |
|
2.62 |
% |
|
1.94 |
% |
|
1.98 |
% |
|
1.65 |
% |
|
2.49 |
% |
|
1.65 |
% |
| Non-performing assets to total assets |
2.02 |
% |
|
2.07 |
% |
|
1.60 |
% |
|
1.61 |
% |
|
1.42 |
% |
|
2.02 |
% |
|
1.42 |
% |
| ACL to non-performing loans |
35.93 |
% |
|
36.28 |
% |
|
47.48 |
% |
|
45.93 |
% |
|
51.15 |
% |
|
35.93 |
% |
|
51.15 |
% |
| ACL to total loans |
0.90 |
% |
|
0.95 |
% |
|
0.92 |
% |
|
0.91 |
% |
|
0.85 |
% |
|
0.90 |
% |
|
0.85 |
% |
| Net charge-offs to average loans |
0.11 |
% |
|
0.08 |
% |
|
0.06 |
% |
|
0.05 |
% |
|
0.13 |
% |
|
0.31 |
% |
|
0.47 |
% |
|
|
|
|
|
|
|
|
|
|
|
|
|
|
| Capital: |
|
|
|
|
|
|
|
|
|
|
|
|
|
Tier 1 capital to average assets(4) |
12.03 |
% |
|
12.21 |
% |
|
12.38 |
% |
|
12.99 |
% |
|
12.64 |
% |
|
12.03 |
% |
|
12.64 |
% |
Tier 1 capital to risk-weighted assets(4) |
13.06 |
% |
|
13.57 |
% |
|
13.45 |
% |
|
13.62 |
% |
|
13.74 |
% |
|
13.06 |
% |
|
13.74 |
% |
Common equity tier 1 capital to risk-weighted assets(4) |
11.40 |
% |
|
11.85 |
% |
|
11.71 |
% |
|
11.85 |
% |
|
11.94 |
% |
|
11.40 |
% |
|
11.94 |
% |
| Total capital to risk-weighted assets |
15.23 |
% |
|
16.62 |
% |
|
16.51 |
% |
|
16.69 |
% |
|
16.75 |
% |
|
15.23 |
% |
|
16.75 |
% |
| Total equity to total assets |
14.98 |
% |
|
15.10 |
% |
|
15.12 |
% |
|
15.65 |
% |
|
16.17 |
% |
|
14.98 |
% |
|
16.17 |
% |
Tangible common stockholders' equity to tangible assets(1) |
10.33 |
% |
|
10.50 |
% |
|
10.39 |
% |
|
10.71 |
% |
|
11.04 |
% |
|
10.33 |
% |
|
11.04 |
% |
|
|
|
|
|
|
|
|
|
|
|
|
|
|
| Per Share Amounts: |
|
|
|
|
|
|
|
|
|
|
|
|
|
| Book value per share |
$ |
36.16 |
|
|
$ |
35.95 |
|
|
$ |
35.51 |
|
|
$ |
35.45 |
|
|
$ |
35.16 |
|
|
$ |
36.16 |
|
|
$ |
35.16 |
|
Tangible book value per share (1) |
$ |
25.13 |
|
|
$ |
25.22 |
|
|
$ |
24.60 |
|
|
$ |
24.42 |
|
|
$ |
24.12 |
|
|
$ |
25.13 |
|
|
$ |
24.12 |
|
| Basic earnings per common share |
$ |
0.13 |
|
|
$ |
0.19 |
|
|
$ |
0.08 |
|
|
$ |
0.14 |
|
|
$ |
0.38 |
|
|
$ |
0.55 |
|
|
$ |
1.63 |
|
| Diluted earnings per common share |
$ |
0.13 |
|
|
$ |
0.19 |
|
|
$ |
0.08 |
|
|
$ |
0.14 |
|
|
$ |
0.37 |
|
|
$ |
0.54 |
|
|
$ |
1.61 |
|
|
|
|
|
|
|
|
|
|
|
|
|
|
|
| Shares outstanding end of period |
23,391,411 |
|
|
23,387,522 |
|
|
23,353,519 |
|
|
23,334,997 |
|
|
23,302,414 |
|
|
23,391,411 |
|
|
23,302,414 |
|
Unaudited consolidated balance sheet as of:
|
|
|
|
|
|
|
|
|
|
|
|
|
|
|
|
|
|
|
|
|
|
|
|
|
|
|
|
|
|
| (Dollars in thousands) |
December 31,
2024 |
|
September 30,
2024 |
|
June 30,
2024 |
|
March 31,
2024 |
|
December 31,
2023 |
| ASSETS |
|
|
|
|
|
|
|
|
|
| Total cash and cash equivalents |
$ |
330,117 |
|
|
$ |
489,280 |
|
|
$ |
500,663 |
|
|
$ |
417,033 |
|
|
$ |
286,635 |
|
| Securities - available for sale |
381,561 |
|
|
403,186 |
|
|
339,661 |
|
|
320,101 |
|
|
299,644 |
|
| Securities - held to maturity, net |
1,876 |
|
|
2,121 |
|
|
2,787 |
|
|
3,010 |
|
|
2,977 |
|
| Equity securities with readily determinable fair value |
4,445 |
|
|
4,583 |
|
|
4,422 |
|
|
4,441 |
|
|
4,488 |
|
| Loans held for sale |
1,172 |
|
|
26 |
|
|
1,051 |
|
|
3,712 |
|
|
1,236 |
|
| Loans held for investment |
4,546,960 |
|
|
4,332,967 |
|
|
4,288,417 |
|
|
4,195,120 |
|
|
4,163,100 |
|
| Allowance for credit losses |
(40,714) |
|
|
(41,243) |
|
|
(39,591) |
|
|
(38,232) |
|
|
(35,219) |
|
| Loans, net |
4,506,246 |
|
|
4,291,724 |
|
|
4,248,826 |
|
|
4,156,888 |
|
|
4,127,881 |
|
| FHLB and other restricted stock |
14,054 |
|
|
7,112 |
|
|
14,040 |
|
|
4,764 |
|
|
14,278 |
|
| Premises and equipment, net |
160,737 |
|
|
156,462 |
|
|
159,588 |
|
|
162,544 |
|
|
113,457 |
|
| Capitalized software, net |
37,971 |
|
|
34,481 |
|
|
30,582 |
|
|
26,435 |
|
|
22,365 |
|
| Goodwill |
241,949 |
|
|
233,709 |
|
|
233,709 |
|
|
233,709 |
|
|
233,709 |
|
| Intangible assets, net |
16,259 |
|
|
17,316 |
|
|
20,943 |
|
|
23,842 |
|
|
23,646 |
|
| Bank-owned life insurance |
62,690 |
|
|
42,381 |
|
|
42,225 |
|
|
42,077 |
|
|
41,946 |
|
| Deferred tax asset, net |
13,581 |
|
|
10,667 |
|
|
6,641 |
|
|
7,946 |
|
|
8,800 |
|
| Other assets |
176,317 |
|
|
172,998 |
|
|
178,196 |
|
|
168,991 |
|
|
166,272 |
|
| Total assets |
$ |
5,948,975 |
|
|
$ |
5,866,046 |
|
|
$ |
5,783,334 |
|
|
$ |
5,575,493 |
|
|
$ |
5,347,334 |
|
| LIABILITIES |
|
|
|
|
|
|
|
|
|
| Noninterest bearing deposits |
$ |
1,964,457 |
|
|
$ |
2,103,092 |
|
|
$ |
1,689,531 |
|
|
$ |
1,747,544 |
|
|
$ |
1,632,022 |
|
| Interest bearing deposits |
2,856,363 |
|
|
2,603,602 |
|
|
2,702,487 |
|
|
2,703,419 |
|
|
2,345,456 |
|
| Total deposits |
4,820,820 |
|
|
4,706,694 |
|
|
4,392,018 |
|
|
4,450,963 |
|
|
3,977,478 |
|
| Federal Home Loan Bank advances |
30,000 |
|
|
30,000 |
|
|
280,000 |
|
|
30,000 |
|
|
255,000 |
|
| Subordinated notes |
69,662 |
|
|
109,072 |
|
|
108,939 |
|
|
108,807 |
|
|
108,678 |
|
| Junior subordinated debentures |
42,352 |
|
|
42,196 |
|
|
42,042 |
|
|
41,889 |
|
|
41,740 |
|
| Other liabilities |
95,222 |
|
|
92,320 |
|
|
86,086 |
|
|
71,495 |
|
|
100,038 |
|
| Total liabilities |
5,058,056 |
|
|
4,980,282 |
|
|
4,909,085 |
|
|
4,703,154 |
|
|
4,482,934 |
|
| EQUITY |
|
|
|
|
|
|
|
|
|
| Preferred Stock |
45,000 |
|
|
45,000 |
|
|
45,000 |
|
|
45,000 |
|
|
45,000 |
|
| Common stock |
291 |
|
|
291 |
|
|
291 |
|
|
290 |
|
|
290 |
|
| Additional paid-in-capital |
567,884 |
|
|
564,464 |
|
|
559,072 |
|
|
555,613 |
|
|
550,743 |
|
| Treasury stock, at cost |
(268,356) |
|
|
(268,352) |
|
|
(268,352) |
|
|
(265,119) |
|
|
(265,038) |
|
| Retained earnings |
549,215 |
|
|
546,179 |
|
|
541,633 |
|
|
539,688 |
|
|
536,331 |
|
| Accumulated other comprehensive income (loss) |
(3,115) |
|
|
(1,818) |
|
|
(3,395) |
|
|
(3,133) |
|
|
(2,926) |
|
| Total stockholders' equity |
890,919 |
|
|
885,764 |
|
|
874,249 |
|
|
872,339 |
|
|
864,400 |
|
| Total liabilities and equity |
$ |
5,948,975 |
|
|
$ |
5,866,046 |
|
|
$ |
5,783,334 |
|
|
$ |
5,575,493 |
|
|
$ |
5,347,334 |
|
Unaudited consolidated statement of income:
|
|
|
|
|
|
|
|
|
|
|
|
|
|
|
|
|
|
|
|
|
|
|
|
|
|
|
|
|
|
|
|
|
|
|
|
|
|
|
|
|
|
|
For the Three Months Ended |
|
For the Year Ended |
| (Dollars in thousands) |
December 31,
2024 |
|
September 30,
2024 |
|
June 30,
2024 |
|
March 31,
2024 |
|
December 31,
2023 |
|
December 31,
2024 |
|
December 31,
2023 |
| Interest income: |
|
|
|
|
|
|
|
|
|
|
|
|
|
| Loans, including fees |
$ |
52,493 |
|
|
$ |
52,886 |
|
|
$ |
54,900 |
|
|
$ |
53,552 |
|
|
$ |
58,963 |
|
|
$ |
213,831 |
|
|
$ |
228,428 |
|
| Factored receivables, including fees |
41,351 |
|
|
40,598 |
|
|
40,028 |
|
|
37,909 |
|
|
40,723 |
|
|
159,886 |
|
|
160,607 |
|
| Securities |
6,182 |
|
|
6,500 |
|
|
5,523 |
|
|
5,351 |
|
|
5,243 |
|
|
23,556 |
|
|
19,795 |
|
| FHLB and other restricted stock |
153 |
|
|
379 |
|
|
234 |
|
|
232 |
|
|
289 |
|
|
998 |
|
|
1,030 |
|
| Cash deposits |
5,299 |
|
|
7,712 |
|
|
6,330 |
|
|
4,903 |
|
|
3,510 |
|
|
24,244 |
|
|
12,561 |
|
| Total interest income |
105,478 |
|
|
108,075 |
|
|
107,015 |
|
|
101,947 |
|
|
108,728 |
|
|
422,515 |
|
|
422,421 |
|
| Interest expense: |
|
|
|
|
|
|
|
|
|
|
|
|
|
| Deposits |
14,522 |
|
|
14,041 |
|
|
15,520 |
|
|
12,152 |
|
|
11,765 |
|
|
56,235 |
|
|
34,318 |
|
| Subordinated notes |
1,024 |
|
|
1,227 |
|
|
1,225 |
|
|
1,224 |
|
|
1,317 |
|
|
4,700 |
|
|
5,253 |
|
| Junior subordinated debentures |
1,129 |
|
|
1,172 |
|
|
1,162 |
|
|
1,184 |
|
|
1,156 |
|
|
4,647 |
|
|
4,449 |
|
| Other borrowings |
996 |
|
|
2,936 |
|
|
1,193 |
|
|
1,352 |
|
|
2,571 |
|
|
6,477 |
|
|
10,322 |
|
| Total interest expense |
17,671 |
|
|
19,376 |
|
|
19,100 |
|
|
15,912 |
|
|
16,809 |
|
|
72,059 |
|
|
54,342 |
|
| Net interest income |
87,807 |
|
|
88,699 |
|
|
87,915 |
|
|
86,035 |
|
|
91,919 |
|
|
350,456 |
|
|
368,079 |
|
| Credit loss expense (benefit) |
4,453 |
|
|
4,263 |
|
|
4,155 |
|
|
5,896 |
|
|
6,135 |
|
|
18,767 |
|
|
12,203 |
|
| Net interest income after credit loss expense (benefit) |
83,354 |
|
|
84,436 |
|
|
83,760 |
|
|
80,139 |
|
|
85,784 |
|
|
331,689 |
|
|
355,876 |
|
| Noninterest income: |
|
|
|
|
|
|
|
|
|
|
|
|
|
| Service charges on deposits |
1,682 |
|
|
1,865 |
|
|
1,810 |
|
|
1,727 |
|
|
1,791 |
|
|
7,084 |
|
|
7,001 |
|
| Card income |
1,948 |
|
|
2,135 |
|
|
2,085 |
|
|
1,868 |
|
|
2,029 |
|
|
8,036 |
|
|
8,181 |
|
| Net gains (losses) on sale of securities |
(1) |
|
|
— |
|
|
— |
|
|
— |
|
|
97 |
|
|
(1) |
|
|
102 |
|
| Net gains (losses) on sale of loans |
(6) |
|
|
253 |
|
|
123 |
|
|
(192) |
|
|
(87) |
|
|
178 |
|
|
119 |
|
| Fee income |
9,048 |
|
|
9,129 |
|
|
8,517 |
|
|
8,683 |
|
|
8,525 |
|
|
35,377 |
|
|
30,245 |
|
| Insurance commissions |
1,338 |
|
|
1,472 |
|
|
1,505 |
|
|
1,568 |
|
|
1,058 |
|
|
5,883 |
|
|
5,028 |
|
| Other |
1,742 |
|
|
2,643 |
|
|
3,127 |
|
|
1,345 |
|
|
817 |
|
|
8,857 |
|
|
(503) |
|
| Total noninterest income |
15,751 |
|
|
17,497 |
|
|
17,167 |
|
|
14,999 |
|
|
14,230 |
|
|
65,414 |
|
|
50,173 |
|
| Noninterest expense: |
|
|
|
|
|
|
|
|
|
|
|
|
|
| Salaries and employee benefits |
53,943 |
|
|
55,447 |
|
|
56,005 |
|
|
54,185 |
|
|
50,818 |
|
|
219,580 |
|
|
210,607 |
|
| Occupancy, furniture and equipment |
8,112 |
|
|
8,701 |
|
|
8,565 |
|
|
7,636 |
|
|
7,348 |
|
|
33,014 |
|
|
28,885 |
|
| FDIC insurance and other regulatory assessments |
744 |
|
|
679 |
|
|
641 |
|
|
653 |
|
|
656 |
|
|
2,717 |
|
|
2,624 |
|
| Professional fees |
5,006 |
|
|
4,734 |
|
|
4,558 |
|
|
3,541 |
|
|
3,116 |
|
|
17,839 |
|
|
13,177 |
|
| Amortization of intangible assets |
2,799 |
|
|
3,600 |
|
|
2,869 |
|
|
2,724 |
|
|
2,754 |
|
|
11,992 |
|
|
11,454 |
|
| Advertising and promotion |
1,545 |
|
|
1,416 |
|
|
2,008 |
|
|
1,214 |
|
|
1,901 |
|
|
6,183 |
|
|
6,740 |
|
| Communications and technology |
12,299 |
|
|
12,422 |
|
|
14,307 |
|
|
11,894 |
|
|
11,645 |
|
|
50,922 |
|
|
45,679 |
|
| Software amortization |
1,831 |
|
|
1,484 |
|
|
1,357 |
|
|
1,174 |
|
|
1,399 |
|
|
5,846 |
|
|
4,453 |
|
| Travel and entertainment |
975 |
|
|
1,431 |
|
|
1,513 |
|
|
1,509 |
|
|
1,579 |
|
|
5,428 |
|
|
6,106 |
|
| Other |
6,021 |
|
|
5,732 |
|
|
5,520 |
|
|
5,841 |
|
|
6,082 |
|
|
23,114 |
|
|
23,509 |
|
| Total noninterest expense |
93,275 |
|
|
95,646 |
|
|
97,343 |
|
|
90,371 |
|
|
87,298 |
|
|
376,635 |
|
|
353,234 |
|
| Net income before income tax |
5,830 |
|
|
6,287 |
|
|
3,584 |
|
|
4,767 |
|
|
12,716 |
|
|
20,468 |
|
|
52,815 |
|
| Income tax expense |
1,992 |
|
|
940 |
|
|
837 |
|
|
609 |
|
|
3,089 |
|
|
4,378 |
|
|
11,734 |
|
| Net income |
$ |
3,838 |
|
|
$ |
5,347 |
|
|
$ |
2,747 |
|
|
$ |
4,158 |
|
|
$ |
9,627 |
|
|
$ |
16,090 |
|
|
$ |
41,081 |
|
| Dividends on preferred stock |
(802) |
|
|
(801) |
|
|
(802) |
|
|
(801) |
|
|
(802) |
|
|
(3,206) |
|
|
(3,206) |
|
| Net income available to common stockholders |
$ |
3,036 |
|
|
$ |
4,546 |
|
|
$ |
1,945 |
|
|
$ |
3,357 |
|
|
$ |
8,825 |
|
|
$ |
12,884 |
|
|
$ |
37,875 |
|
Earnings per share:
|
|
|
|
|
|
|
|
|
|
|
|
|
|
|
|
|
|
|
|
|
|
|
|
|
|
|
|
|
|
|
|
|
|
|
|
|
|
|
|
|
|
|
For the Three Months Ended |
|
Year Ended |
| (Dollars in thousands) |
December 31,
2024 |
|
September 30,
2024 |
|
June 30,
2024 |
|
March 31,
2024 |
|
December 31,
2023 |
|
December 31,
2024 |
|
December 31,
2023 |
| Basic |
|
|
|
|
|
|
|
|
|
|
|
|
|
| Net income to common stockholders |
$ |
3,036 |
|
|
$ |
4,546 |
|
|
$ |
1,945 |
|
|
$ |
3,357 |
|
|
$ |
8,825 |
|
|
$ |
12,884 |
|
|
$ |
37,875 |
|
| Weighted average common shares outstanding |
23,339,651 |
|
|
23,330,635 |
|
|
23,274,089 |
|
|
23,201,259 |
|
|
23,171,751 |
|
|
23,286,675 |
|
|
23,208,086 |
|
| Basic earnings per common share |
$ |
0.13 |
|
|
$ |
0.19 |
|
|
$ |
0.08 |
|
|
$ |
0.14 |
|
|
$ |
0.38 |
|
|
$ |
0.55 |
|
|
$ |
1.63 |
|
|
|
|
|
|
|
|
|
|
|
|
|
|
|
| Diluted |
|
|
|
|
|
|
|
|
|
|
|
|
|
| Net income to common stockholders - diluted |
$ |
3,036 |
|
|
$ |
4,546 |
|
|
$ |
1,945 |
|
|
$ |
3,357 |
|
|
$ |
8,825 |
|
|
$ |
12,884 |
|
|
$ |
37,875 |
|
| Weighted average common shares outstanding |
23,339,651 |
|
|
23,330,635 |
|
|
23,274,089 |
|
|
23,201,259 |
|
|
23,171,751 |
|
|
23,286,675 |
|
|
23,208,086 |
|
| Dilutive effects of: |
|
|
|
|
|
|
|
|
|
|
|
|
|
| Assumed exercises of stock options |
106,713 |
|
|
95,472 |
|
|
86,645 |
|
|
87,567 |
|
|
82,463 |
|
|
94,036 |
|
|
78,679 |
|
| Restricted stock awards |
43,875 |
|
|
40,259 |
|
|
60,614 |
|
|
102,417 |
|
|
90,912 |
|
|
62,074 |
|
|
98,408 |
|
| Restricted stock units |
153,326 |
|
|
130,331 |
|
|
118,919 |
|
|
137,321 |
|
|
107,933 |
|
|
135,982 |
|
|
91,454 |
|
| Performance stock units - market based |
223,173 |
|
|
128,157 |
|
|
121,907 |
|
|
119,777 |
|
|
83,821 |
|
|
198,617 |
|
|
84,869 |
|
| Employee stock purchase plan |
2,711 |
|
|
470 |
|
|
2,931 |
|
|
1,921 |
|
|
798 |
|
|
2,008 |
|
|
881 |
|
| Weighted average shares outstanding - diluted |
23,869,449 |
|
|
23,725,324 |
|
|
23,665,105 |
|
|
23,650,262 |
|
|
23,537,678 |
|
|
23,779,392 |
|
|
23,562,377 |
|
| Diluted earnings per common share |
$ |
0.13 |
|
|
$ |
0.19 |
|
|
$ |
0.08 |
|
|
$ |
0.14 |
|
|
$ |
0.37 |
|
|
$ |
0.54 |
|
|
$ |
1.61 |
|
Shares that were not considered in computing diluted earnings per common share because they were antidilutive or have not met the thresholds to be considered in the dilutive calculation are as follows:
|
|
|
|
|
|
|
|
|
|
|
|
|
|
|
|
|
|
|
|
|
|
|
|
|
|
|
|
|
|
|
|
|
|
|
|
|
|
|
|
|
|
|
For the Three Months Ended |
|
Year Ended |
|
December 31,
2024 |
|
September 30,
2024 |
|
June 30,
2024 |
|
March 31,
2024 |
|
December 31,
2023 |
|
December 31,
2024 |
|
December 31,
2023 |
| Stock options |
43,582 |
|
|
64,315 |
|
|
77,520 |
|
|
45,764 |
|
|
100,818 |
|
|
48,650 |
|
|
100,818 |
|
| Restricted stock awards |
— |
|
|
— |
|
|
— |
|
|
— |
|
|
— |
|
|
— |
|
|
— |
|
| Restricted stock units |
— |
|
|
7,500 |
|
|
7,500 |
|
|
7,500 |
|
|
7,500 |
|
|
7,500 |
|
|
7,500 |
|
| Performance stock units - market based |
23,476 |
|
|
— |
|
|
55,677 |
|
|
— |
|
|
12,020 |
|
|
15,715 |
|
|
12,020 |
|
| Employee stock purchase plan |
— |
|
|
— |
|
|
— |
|
|
— |
|
|
— |
|
|
— |
|
|
— |
|
|
|
|
|
|
|
|
|
|
|
|
|
|
|
Loans held for investment summarized as of:
|
|
|
|
|
|
|
|
|
|
|
|
|
|
|
|
|
|
|
|
|
|
|
|
|
|
|
|
|
|
| (Dollars in thousands) |
December 31,
2024 |
|
September 30,
2024 |
|
June 30,
2024 |
|
March 31,
2024 |
|
December 31,
2023 |
| Commercial real estate |
$ |
777,689 |
|
|
$ |
762,343 |
|
|
$ |
842,342 |
|
|
$ |
819,721 |
|
|
$ |
812,704 |
|
| Construction, land development, land |
203,804 |
|
|
217,148 |
|
|
216,531 |
|
|
222,859 |
|
|
136,720 |
|
| 1-4 family residential properties |
154,020 |
|
|
126,103 |
|
|
128,508 |
|
|
130,200 |
|
|
125,916 |
|
| Farmland |
56,366 |
|
|
57,621 |
|
|
58,495 |
|
|
58,431 |
|
|
63,568 |
|
| Commercial |
1,119,245 |
|
|
1,093,477 |
|
|
1,092,280 |
|
|
1,160,870 |
|
|
1,170,365 |
|
| Factored receivables |
1,204,510 |
|
|
1,201,495 |
|
|
1,207,480 |
|
|
1,154,047 |
|
|
1,116,654 |
|
| Consumer |
8,000 |
|
|
6,990 |
|
|
7,596 |
|
|
7,176 |
|
|
8,326 |
|
| Mortgage warehouse |
1,023,326 |
|
|
867,790 |
|
|
735,185 |
|
|
641,816 |
|
|
728,847 |
|
| Total loans |
$ |
4,546,960 |
|
|
$ |
4,332,967 |
|
|
$ |
4,288,417 |
|
|
$ |
4,195,120 |
|
|
$ |
4,163,100 |
|
Our banking loan portfolio consists of traditional community bank loans as well as commercial finance product lines focused on businesses that require specialized financial solutions and national lending product lines that further diversify our lending operations.
Banking loans held for investment are further summarized below:
|
|
|
|
|
|
|
|
|
|
|
|
|
|
|
|
|
|
|
|
|
|
|
|
|
|
|
|
|
|
| (Dollars in thousands) |
December 31,
2024 |
|
September 30,
2024 |
|
June 30,
2024 |
|
March 31,
2024 |
|
December 31,
2023 |
| Commercial real estate |
$ |
777,689 |
|
|
$ |
762,343 |
|
|
$ |
842,342 |
|
|
$ |
819,721 |
|
|
$ |
812,704 |
|
| Construction, land development, land |
203,804 |
|
|
217,148 |
|
|
216,531 |
|
|
222,859 |
|
|
136,720 |
|
| 1-4 family residential |
154,020 |
|
|
126,103 |
|
|
128,508 |
|
|
130,200 |
|
|
125,916 |
|
| Farmland |
56,366 |
|
|
57,621 |
|
|
58,495 |
|
|
58,431 |
|
|
63,568 |
|
| Commercial - General |
285,469 |
|
|
284,989 |
|
|
294,670 |
|
|
308,145 |
|
|
303,332 |
|
| Commercial - Agriculture |
49,365 |
|
|
52,997 |
|
|
50,604 |
|
|
46,986 |
|
|
47,059 |
|
| Commercial - Equipment |
511,855 |
|
|
488,326 |
|
|
468,661 |
|
|
440,458 |
|
|
460,008 |
|
| Commercial - Asset-based lending |
205,353 |
|
|
205,476 |
|
|
203,634 |
|
|
260,043 |
|
|
246,065 |
|
| Commercial - Liquid Credit |
65,053 |
|
|
59,539 |
|
|
74,711 |
|
|
105,238 |
|
|
113,901 |
|
| Consumer |
8,000 |
|
|
6,990 |
|
|
7,596 |
|
|
7,176 |
|
|
8,326 |
|
| Mortgage Warehouse |
1,023,326 |
|
|
867,790 |
|
|
735,185 |
|
|
641,816 |
|
|
728,847 |
|
| Total banking loans held for investment |
$ |
3,340,300 |
|
|
$ |
3,129,322 |
|
|
$ |
3,080,937 |
|
|
$ |
3,041,073 |
|
|
$ |
3,046,446 |
|
The following table presents the Company’s operating segments:
|
|
|
|
|
|
|
|
|
|
|
|
|
|
|
|
|
|
|
|
|
|
|
|
|
|
|
|
|
|
|
|
|
|
|
|
|
|
|
|
|
|
|
|
|
| (Dollars in thousands) |
|
|
|
|
|
|
|
|
|
Total |
|
Corporate |
|
|
| Three months ended December 31, 2024 |
|
Banking |
|
Factoring |
|
Payments |
|
Intelligence |
|
Segments |
|
and Other(1) |
|
Consolidated |
| Total interest income |
|
$ |
64,042 |
|
|
$ |
35,754 |
|
|
$ |
5,597 |
|
|
$ |
— |
|
|
$ |
105,393 |
|
|
$ |
85 |
|
|
$ |
105,478 |
|
| Intersegment interest allocations |
|
5,773 |
|
|
(8,503) |
|
|
2,730 |
|
|
— |
|
|
— |
|
|
— |
|
|
— |
|
| Total interest expense |
|
15,519 |
|
|
— |
|
|
— |
|
|
— |
|
|
15,519 |
|
|
2,152 |
|
|
17,671 |
|
| Net interest income (expense) |
|
54,296 |
|
|
27,251 |
|
|
8,327 |
|
|
— |
|
|
89,874 |
|
|
(2,067) |
|
|
87,807 |
|
| Credit loss expense (benefit) |
|
3,429 |
|
|
914 |
|
|
2 |
|
|
— |
|
|
4,345 |
|
|
108 |
|
|
4,453 |
|
| Net interest income after credit loss expense |
|
50,867 |
|
|
26,337 |
|
|
8,325 |
|
|
— |
|
|
85,529 |
|
|
(2,175) |
|
|
83,354 |
|
| Noninterest income |
|
6,554 |
|
|
1,594 |
|
|
6,348 |
|
|
184 |
|
|
14,680 |
|
|
1,071 |
|
|
15,751 |
|
| Noninterest expense: |
|
|
|
|
|
|
|
|
|
|
|
|
|
|
| Salaries and employee benefits |
|
15,896 |
|
|
12,176 |
|
|
8,424 |
|
|
1,457 |
|
|
37,953 |
|
|
15,990 |
|
|
53,943 |
|
| Depreciation |
|
1,646 |
|
|
527 |
|
|
243 |
|
|
4 |
|
|
2,420 |
|
|
1,544 |
|
|
3,964 |
|
| Other occupancy, furniture and equipment |
|
2,069 |
|
|
520 |
|
|
165 |
|
|
3 |
|
|
2,757 |
|
|
1,391 |
|
|
4,148 |
|
| FDIC insurance and other regulatory assessments |
|
744 |
|
|
— |
|
|
— |
|
|
— |
|
|
744 |
|
|
— |
|
|
744 |
|
| Professional fees |
|
1,089 |
|
|
1,518 |
|
|
370 |
|
|
328 |
|
|
3,305 |
|
|
1,701 |
|
|
5,006 |
|
| Amortization of intangible assets |
|
557 |
|
|
362 |
|
|
1,687 |
|
|
— |
|
|
2,606 |
|
|
193 |
|
|
2,799 |
|
| Advertising and promotion |
|
355 |
|
|
179 |
|
|
306 |
|
|
2 |
|
|
842 |
|
|
703 |
|
|
1,545 |
|
| Communications and technology |
|
5,221 |
|
|
2,475 |
|
|
2,243 |
|
|
42 |
|
|
9,981 |
|
|
2,318 |
|
|
12,299 |
|
| Software amortization |
|
58 |
|
|
584 |
|
|
1,049 |
|
|
1 |
|
|
1,692 |
|
|
139 |
|
|
1,831 |
|
| Travel and entertainment |
|
163 |
|
|
133 |
|
|
351 |
|
|
36 |
|
|
683 |
|
|
292 |
|
|
975 |
|
| Other |
|
2,754 |
|
|
812 |
|
|
982 |
|
|
7 |
|
|
4,555 |
|
|
1,466 |
|
|
6,021 |
|
| Total noninterest expense |
|
30,552 |
|
|
19,286 |
|
|
15,820 |
|
|
1,880 |
|
|
67,538 |
|
|
25,737 |
|
|
93,275 |
|
Net intersegment noninterest income (expense)(2) |
|
138 |
|
|
401 |
|
|
(539) |
|
|
— |
|
|
— |
|
|
— |
|
|
— |
|
| Operating income (loss) |
|
$ |
27,007 |
|
|
$ |
9,046 |
|
|
$ |
(1,686) |
|
|
$ |
(1,696) |
|
|
$ |
32,671 |
|
|
$ |
(26,841) |
|
|
$ |
5,830 |
|
|
|
|
|
|
|
|
|
|
|
|
|
|
|
|
|
|
|
|
|
|
|
|
|
|
|
|
|
|
|
|
|
|
|
|
|
|
|
|
|
|
|
|
|
|
| (Dollars in thousands) |
|
|
|
|
|
|
|
|
|
Total |
|
Corporate |
|
|
| Three months ended September 30, 2024 |
|
Banking |
|
Factoring |
|
Payments |
|
Intelligence |
|
Segments |
|
and Other(1) |
|
Consolidated |
| Total interest income |
|
$ |
67,390 |
|
|
$ |
34,905 |
|
|
$ |
5,693 |
|
|
$ |
— |
|
|
$ |
107,988 |
|
|
$ |
87 |
|
|
$ |
108,075 |
|
| Intersegment interest allocations |
|
6,711 |
|
|
(9,280) |
|
|
2,569 |
|
|
— |
|
|
— |
|
|
— |
|
|
— |
|
| Total interest expense |
|
16,976 |
|
|
— |
|
|
— |
|
|
— |
|
|
16,976 |
|
|
2,400 |
|
|
19,376 |
|
| Net interest income (expense) |
|
57,125 |
|
|
25,625 |
|
|
8,262 |
|
|
— |
|
|
91,012 |
|
|
(2,313) |
|
|
88,699 |
|
| Credit loss expense (benefit) |
|
3,719 |
|
|
328 |
|
|
(5) |
|
|
— |
|
|
4,042 |
|
|
221 |
|
|
4,263 |
|
| Net interest income after credit loss expense |
|
53,406 |
|
|
25,297 |
|
|
8,267 |
|
|
— |
|
|
86,970 |
|
|
(2,534) |
|
|
84,436 |
|
| Noninterest income |
|
7,538 |
|
|
2,170 |
|
|
6,322 |
|
|
— |
|
|
16,030 |
|
|
1,467 |
|
|
17,497 |
|
| Noninterest expense: |
|
|
|
|
|
|
|
|
|
|
|
|
|
|
| Salaries and employee benefits |
|
17,038 |
|
|
12,585 |
|
|
9,381 |
|
|
— |
|
|
39,004 |
|
|
16,443 |
|
|
55,447 |
|
| Depreciation |
|
1,691 |
|
|
520 |
|
|
253 |
|
|
— |
|
|
2,464 |
|
|
1,478 |
|
|
3,942 |
|
| Other occupancy, furniture and equipment |
|
2,251 |
|
|
549 |
|
|
168 |
|
|
— |
|
|
2,968 |
|
|
1,791 |
|
|
4,759 |
|
| FDIC insurance and other regulatory assessments |
|
679 |
|
|
— |
|
|
— |
|
|
— |
|
|
679 |
|
|
— |
|
|
679 |
|
| Professional fees |
|
900 |
|
|
1,759 |
|
|
517 |
|
|
— |
|
|
3,176 |
|
|
1,558 |
|
|
4,734 |
|
| Amortization of intangible assets |
|
590 |
|
|
362 |
|
|
1,687 |
|
|
— |
|
|
2,639 |
|
|
961 |
|
|
3,600 |
|
| Advertising and promotion |
|
474 |
|
|
219 |
|
|
304 |
|
|
— |
|
|
997 |
|
|
419 |
|
|
1,416 |
|
| Communications and technology |
|
5,145 |
|
|
2,374 |
|
|
2,397 |
|
|
— |
|
|
9,916 |
|
|
2,506 |
|
|
12,422 |
|
| Software amortization |
|
64 |
|
|
528 |
|
|
743 |
|
|
— |
|
|
1,335 |
|
|
149 |
|
|
1,484 |
|
| Travel and entertainment |
|
242 |
|
|
191 |
|
|
375 |
|
|
— |
|
|
808 |
|
|
623 |
|
|
1,431 |
|
| Other |
|
2,935 |
|
|
882 |
|
|
773 |
|
|
— |
|
|
4,590 |
|
|
1,142 |
|
|
5,732 |
|
| Total noninterest expense |
|
32,009 |
|
|
19,969 |
|
|
16,598 |
|
|
— |
|
|
68,576 |
|
|
27,070 |
|
|
95,646 |
|
Intersegment noninterest income (expense)(2) |
|
139 |
|
|
465 |
|
|
(604) |
|
|
— |
|
|
— |
|
|
— |
|
|
— |
|
| Operating income (loss) |
|
$ |
29,074 |
|
|
$ |
7,963 |
|
|
$ |
(2,613) |
|
|
$ |
— |
|
|
$ |
34,424 |
|
|
$ |
(28,137) |
|
|
$ |
6,287 |
|
(1) Includes revenue and expense from the Company’s holding company, which does not meet the definition of an operating segment. Also includes corporate shared service costs such as the majority of salaries and benefits expense for our executive leadership team, as well as other selling, general, and administrative shared services costs including human resources, accounting, finance, risk management and a significant amount of information technology expense.
(2) Intersegment noninterest income (expense) includes:
|
|
|
|
|
|
|
|
|
|
|
|
|
|
|
|
|
|
|
|
|
| (Dollars in thousands) |
|
Banking |
|
Factoring |
|
Payments |
| Three Months Ended December 31, 2024 |
|
|
|
|
|
|
| Factoring revenue received from Payments |
|
$ |
— |
|
|
$ |
864 |
|
|
$ |
(864) |
|
| Payments revenue received from Factoring |
|
— |
|
|
(356) |
|
|
356 |
|
| Banking revenue received from Payments and Factoring |
|
138 |
|
|
(107) |
|
|
(31) |
|
| Intersegment noninterest income (expense) |
|
$ |
138 |
|
|
$ |
401 |
|
|
$ |
(539) |
|
|
|
|
|
|
|
|
| Three Months Ended September 30, 2024 |
|
|
|
|
|
|
| Factoring revenue received from Payments |
|
$ |
— |
|
|
$ |
864 |
|
|
$ |
(864) |
|
| Payments revenue received from Factoring |
|
— |
|
|
(289) |
|
|
289 |
|
| Banking revenue received from Payments and Factoring |
|
139 |
|
|
(110) |
|
|
(29) |
|
| Intersegment noninterest income (expense) |
|
$ |
139 |
|
|
$ |
465 |
|
|
$ |
(604) |
|
Information pertaining to our factoring segment, summarized as of and for the quarters ended:
|
|
|
|
|
|
|
|
|
|
|
|
|
|
|
|
|
|
|
|
|
|
|
|
|
|
|
|
|
|
|
|
|
| Factoring |
|
December 31,
2024 |
|
September 30,
2024 |
|
June 30,
2024 |
|
March 31,
2024 |
|
December 31,
2023 |
| Factored receivable period end balance |
|
$ |
1,032,842,000 |
|
|
$ |
1,031,633,000 |
|
|
$ |
1,035,159,000 |
|
|
$ |
976,761,000 |
|
|
$ |
941,926,000 |
|
| Commercial loans period end balance |
|
$ |
2,150,000 |
|
|
$ |
2,150,000 |
|
|
$ |
— |
|
|
$ |
— |
|
|
$ |
— |
|
| Yield on average receivable balance |
|
13.36 |
% |
|
13.57 |
% |
|
14.14 |
% |
|
13.98 |
% |
|
13.71 |
% |
| Current quarter charge-off rate |
|
0.26 |
% |
|
0.07 |
% |
|
0.15 |
% |
|
0.13 |
% |
|
0.12 |
% |
| Factored receivables - transportation concentration |
|
97 |
% |
|
97 |
% |
|
97 |
% |
|
97 |
% |
|
96 |
% |
|
|
|
|
|
|
|
|
|
|
|
| Interest income, including fees |
|
$ |
35,754,000 |
|
|
$ |
34,905,000 |
|
|
$ |
34,307,000 |
|
|
$ |
32,752,000 |
|
|
$ |
35,448,000 |
|
| Noninterest income |
|
1,594,000 |
|
|
2,170,000 |
|
|
2,016,000 |
|
|
2,903,000 |
|
|
2,725,000 |
|
| Intersegment noninterest income |
|
864,000 |
|
|
864,000 |
|
|
750,000 |
|
|
750,000 |
|
|
510,000 |
|
| Factoring total revenue |
|
38,212,000 |
|
|
37,939,000 |
|
|
37,073,000 |
|
|
36,405,000 |
|
|
38,683,000 |
|
| Average net funds employed |
|
950,776,000 |
|
|
915,257,000 |
|
|
873,355,000 |
|
|
839,136,000 |
|
|
927,996,000 |
|
| Yield on average net funds employed |
|
15.99 |
% |
|
16.49 |
% |
|
17.07 |
% |
|
17.45 |
% |
|
16.54 |
% |
|
|
|
|
|
|
|
|
|
|
|
| Operating income (loss) |
|
$ |
9,046,000 |
|
|
$ |
7,963,000 |
|
|
$ |
4,627,000 |
|
|
$ |
7,091,000 |
|
|
$ |
8,686,000 |
|
| Factoring total revenue |
|
$ |
38,212,000 |
|
|
$ |
37,939,000 |
|
|
$ |
37,073,000 |
|
|
$ |
36,405,000 |
|
|
$ |
38,683,000 |
|
Operating margin(1) |
|
23.67 |
% |
|
20.99 |
% |
|
12.48 |
% |
|
19.48 |
% |
|
22.45 |
% |
|
|
|
|
|
|
|
|
|
|
|
| Accounts receivable purchased |
|
$ |
2,747,351,000 |
|
|
$ |
2,610,177,000 |
|
|
$ |
2,542,327,000 |
|
|
$ |
2,469,797,000 |
|
|
$ |
2,570,442,000 |
|
| Number of invoices purchased |
|
1,524,904 |
|
|
1,480,824 |
|
|
1,432,366 |
|
|
1,367,625 |
|
|
1,404,861 |
|
| Average invoice size |
|
$ |
1,802 |
|
|
$ |
1,763 |
|
|
$ |
1,775 |
|
|
$ |
1,806 |
|
|
$ |
1,830 |
|
| Average invoice size - transportation |
|
$ |
1,767 |
|
|
$ |
1,724 |
|
|
$ |
1,738 |
|
|
$ |
1,771 |
|
|
$ |
1,781 |
|
| Average invoice size - non-transportation |
|
$ |
4,867 |
|
|
$ |
4,940 |
|
|
$ |
4,561 |
|
|
$ |
4,099 |
|
|
$ |
5,858 |
|
(1)Operating margin is a non-GAAP financial measure used as a supplemental measure to evaluate the performance of our Factoring segment.
Information pertaining to our Payments segment, summarized as of and for the quarters ended:
|
|
|
|
|
|
|
|
|
|
|
|
|
|
|
|
|
|
|
|
|
|
|
|
|
|
|
|
|
|
|
|
|
| Payments |
|
December 31,
2024 |
|
September 30,
2024 |
|
June 30,
2024 |
|
March 31,
2024 |
|
December 31,
2023 |
| Supply chain financing factored receivables |
|
$ |
107,300,000 |
|
|
$ |
101,336,000 |
|
|
$ |
95,163,000 |
|
|
$ |
98,593,000 |
|
|
$ |
100,829,000 |
|
| Quickpay and other factored receivables |
|
64,368,000 |
|
|
68,526,000 |
|
|
77,158,000 |
|
|
78,693,000 |
|
|
73,899,000 |
|
| Total factored receivable period end balance |
|
$ |
171,668,000 |
|
|
$ |
169,862,000 |
|
|
$ |
172,321,000 |
|
|
$ |
177,286,000 |
|
|
$ |
174,728,000 |
|
|
|
|
|
|
|
|
|
|
|
|
| Total revenue |
|
|
|
|
|
|
|
|
|
|
| Supply chain finance interest income |
|
$ |
2,789,000 |
|
|
$ |
2,897,000 |
|
|
$ |
2,649,000 |
|
|
$ |
2,553,000 |
|
|
$ |
2,476,000 |
|
| Quickpay interest income |
|
2,808,000 |
|
|
2,796,000 |
|
|
3,072,000 |
|
|
2,604,000 |
|
|
2,799,000 |
|
| Intersegment interest income allocation |
|
2,730,000 |
|
|
2,569,000 |
|
|
2,010,000 |
|
|
2,161,000 |
|
|
1,951,000 |
|
| Total interest income |
|
8,327,000 |
|
|
8,262,000 |
|
|
7,731,000 |
|
|
7,318,000 |
|
|
7,226,000 |
|
| Broker noninterest income |
|
5,082,000 |
|
|
4,804,000 |
|
|
4,392,000 |
|
|
4,115,000 |
|
|
3,880,000 |
|
| Factor noninterest income |
|
1,346,000 |
|
|
1,339,000 |
|
|
1,296,000 |
|
|
1,295,000 |
|
|
1,301,000 |
|
| Other noninterest income |
|
(80,000) |
|
|
179,000 |
|
|
179,000 |
|
|
133,000 |
|
|
263,000 |
|
| Intersegment noninterest income |
|
356,000 |
|
|
289,000 |
|
|
264,000 |
|
|
265,000 |
|
|
267,000 |
|
| Total noninterest income |
|
6,704,000 |
|
|
6,611,000 |
|
|
6,131,000 |
|
|
5,808,000 |
|
|
5,711,000 |
|
|
|
$ |
15,031,000 |
|
|
$ |
14,873,000 |
|
|
$ |
13,862,000 |
|
|
$ |
13,126,000 |
|
|
$ |
12,937,000 |
|
|
|
|
|
|
|
|
|
|
|
|
| Total expense |
|
|
|
|
|
|
|
|
|
|
|
|
|
|
|
|
|
|
|
|
|
| Credit loss expense (benefit) |
|
$ |
2,000 |
|
|
$ |
(5,000) |
|
|
$ |
(9,000) |
|
|
$ |
69,000 |
|
|
$ |
5,000 |
|
| Noninterest expense |
|
15,820,000 |
|
|
16,598,000 |
|
|
17,070,000 |
|
|
16,485,000 |
|
|
14,783,000 |
|
| Intersegment noninterest expense |
|
895,000 |
|
|
893,000 |
|
|
774,000 |
|
|
775,000 |
|
|
510,000 |
|
|
|
$ |
16,717,000 |
|
|
$ |
17,486,000 |
|
|
$ |
17,835,000 |
|
|
$ |
17,329,000 |
|
|
$ |
15,298,000 |
|
|
|
|
|
|
|
|
|
|
|
|
| Pre-tax operating income (loss) |
|
$ |
(1,686,000) |
|
|
$ |
(2,613,000) |
|
|
$ |
(3,973,000) |
|
|
$ |
(4,203,000) |
|
|
$ |
(2,361,000) |
|
|
|
|
|
|
|
|
|
|
|
|
| Depreciation expense |
|
243,000 |
|
|
253,000 |
|
|
263,000 |
|
|
244,000 |
|
|
261,000 |
|
| Software amortization expense |
|
1,049,000 |
|
|
743,000 |
|
|
580,000 |
|
|
527,000 |
|
|
433,000 |
|
| Intangible amortization expense |
|
1,687,000 |
|
|
1,687,000 |
|
|
1,687,000 |
|
|
1,702,000 |
|
|
1,703,000 |
|
Earnings (losses) before interest, taxes, depreciation, and amortization(1) |
|
$ |
1,293,000 |
|
|
$ |
70,000 |
|
|
$ |
(1,443,000) |
|
|
$ |
(1,730,000) |
|
|
$ |
36,000 |
|
|
|
|
|
|
|
|
|
|
|
|
|
|
|
|
|
|
|
|
|
|
|
|
|
|
|
|
|
|
|
|
|
|
EBITDA Margin(1) |
|
8.6 |
% |
|
0.5 |
% |
|
(10.4) |
% |
|
(13.2) |
% |
|
0.3 |
% |
|
|
|
|
|
|
|
|
|
|
|
| Number of invoices processed |
|
6,788,408 |
|
6,278,246 |
|
6,062,779 |
|
5,717,016 |
|
5,703,740 |
| Amount of payments processed |
|
$7,625,735,000 |
|
$7,091,493,000 |
|
$6,687,587,000 |
|
$6,379,680,000 |
|
$6,217,323,000 |
| Network invoice volume |
|
567,258 |
|
661,628 |
|
701,768 |
|
621,209 |
|
442,353 |
| Network payment volume |
|
$922,927,000 |
|
$1,063,228,000 |
|
$1,133,118,000 |
|
$1,035,099,000 |
|
$740,048,000 |
(1)Earnings (losses) before interest, taxes, depreciation, and amortization ("EBITDA") and EBITDA margin are non-GAAP financial measures used as supplemental measures to evaluate the performance of our Payments segment.
Deposits summarized as of:
|
|
|
|
|
|
|
|
|
|
|
|
|
|
|
|
|
|
|
|
|
|
|
|
|
|
|
|
|
|
| (Dollars in thousands) |
December 31,
2024 |
|
September 30,
2024 |
|
June 30,
2024 |
|
March 31,
2024 |
|
December 31,
2023 |
| Non-interest bearing demand |
$ |
1,964,457 |
|
|
$ |
2,103,092 |
|
|
$ |
1,689,531 |
|
|
$ |
1,747,544 |
|
|
$ |
1,632,022 |
|
| Interest bearing demand |
697,949 |
|
|
700,928 |
|
|
847,387 |
|
|
744,208 |
|
|
757,455 |
|
| Individual retirement accounts |
43,937 |
|
|
46,096 |
|
|
48,991 |
|
|
50,730 |
|
|
52,195 |
|
| Money market |
629,610 |
|
|
606,321 |
|
|
592,667 |
|
|
601,685 |
|
|
568,772 |
|
| Savings |
515,545 |
|
|
533,553 |
|
|
545,807 |
|
|
547,471 |
|
|
555,047 |
|
| Certificates of deposit |
232,232 |
|
|
242,093 |
|
|
252,641 |
|
|
261,614 |
|
|
265,525 |
|
| Brokered time deposits |
490,650 |
|
|
474,611 |
|
|
414,987 |
|
|
397,645 |
|
|
146,458 |
|
| Other brokered deposits |
246,440 |
|
|
— |
|
|
7 |
|
|
100,066 |
|
|
4 |
|
| Total deposits |
$ |
4,820,820 |
|
|
$ |
4,706,694 |
|
|
$ |
4,392,018 |
|
|
$ |
4,450,963 |
|
|
$ |
3,977,478 |
|
Net interest margin summarized for the three months ended:
|
|
|
|
|
|
|
|
|
|
|
|
|
|
|
|
|
|
|
|
|
|
|
|
|
|
|
|
|
|
|
|
|
|
|
|
|
December 31, 2024 |
|
September 30, 2024 |
| (Dollars in thousands) |
Average
Balance |
|
Interest |
|
Average
Rate(4)
|
|
Average
Balance |
|
Interest |
|
Average
Rate(4)
|
| Interest earning assets: |
|
|
|
|
|
|
|
|
|
|
|
| Interest earning cash balances |
$ |
438,177 |
|
|
$ |
5,299 |
|
|
4.81 |
% |
|
$ |
563,683 |
|
|
$ |
7,712 |
|
|
5.44 |
% |
| Taxable securities |
395,891 |
|
|
6,162 |
|
|
6.19 |
% |
|
398,265 |
|
|
6,479 |
|
|
6.47 |
% |
| Tax-exempt securities |
2,979 |
|
|
20 |
|
|
2.67 |
% |
|
3,129 |
|
|
21 |
|
|
2.67 |
% |
| FHLB and other restricted stock |
8,008 |
|
|
153 |
|
|
7.60 |
% |
|
13,587 |
|
|
379 |
|
|
11.10 |
% |
Loans(1) |
4,403,989 |
|
|
93,844 |
|
|
8.48 |
% |
|
4,200,306 |
|
|
93,484 |
|
|
8.85 |
% |
| Total interest earning assets |
$ |
5,249,044 |
|
|
$ |
105,478 |
|
|
7.99 |
% |
|
$ |
5,178,970 |
|
|
$ |
108,075 |
|
|
8.30 |
% |
| Non-interest earning assets: |
|
|
|
|
|
|
|
|
|
|
|
| Other assets |
717,117 |
|
|
|
|
|
|
692,933 |
|
|
|
|
|
| Total assets |
$ |
5,966,161 |
|
|
|
|
|
|
$ |
5,871,903 |
|
|
|
|
|
| Interest bearing liabilities: |
|
|
|
|
|
|
|
|
|
|
|
| Deposits: |
|
|
|
|
|
|
|
|
|
|
|
| Interest bearing demand |
$ |
706,188 |
|
|
$ |
818 |
|
|
0.46 |
% |
|
$ |
721,482 |
|
|
$ |
987 |
|
|
0.54 |
% |
| Individual retirement accounts |
45,417 |
|
|
149 |
|
|
1.31 |
% |
|
47,397 |
|
|
158 |
|
|
1.33 |
% |
| Money market |
637,956 |
|
|
4,064 |
|
|
2.53 |
% |
|
580,281 |
|
|
4,128 |
|
|
2.83 |
% |
| Savings |
522,199 |
|
|
1,472 |
|
|
1.12 |
% |
|
538,367 |
|
|
1,609 |
|
|
1.19 |
% |
| Certificates of deposit |
235,501 |
|
|
1,677 |
|
|
2.83 |
% |
|
248,126 |
|
|
2,087 |
|
|
3.35 |
% |
| Brokered time deposits |
506,090 |
|
|
6,201 |
|
|
4.87 |
% |
|
404,537 |
|
|
5,072 |
|
|
4.99 |
% |
| Other brokered deposits |
11,919 |
|
|
141 |
|
|
4.71 |
% |
|
— |
|
|
— |
|
|
— |
% |
| Total interest bearing deposits |
2,665,270 |
|
|
14,522 |
|
|
2.17 |
% |
|
2,540,190 |
|
|
14,041 |
|
|
2.20 |
% |
| Federal Home Loan Bank advances |
83,261 |
|
|
996 |
|
|
4.76 |
% |
|
213,424 |
|
|
2,936 |
|
|
5.47 |
% |
| Subordinated notes |
94,083 |
|
|
1,024 |
|
|
4.33 |
% |
|
108,984 |
|
|
1,227 |
|
|
4.48 |
% |
| Junior subordinated debentures |
42,268 |
|
|
1,129 |
|
|
10.63 |
% |
|
42,105 |
|
|
1,172 |
|
|
11.07 |
% |
| Other borrowings |
4 |
|
|
— |
|
|
— |
% |
|
11 |
|
|
— |
|
|
— |
% |
| Total interest bearing liabilities |
$ |
2,884,886 |
|
|
$ |
17,671 |
|
|
2.44 |
% |
|
$ |
2,904,714 |
|
|
$ |
19,376 |
|
|
2.65 |
% |
| Noninterest bearing liabilities and equity: |
|
|
|
|
|
|
|
|
|
|
|
| Non-interest bearing demand deposits |
2,088,460 |
|
|
|
|
|
|
1,991,042 |
|
|
|
|
|
| Other liabilities |
93,850 |
|
|
|
|
|
|
87,712 |
|
|
|
|
|
| Total equity |
898,965 |
|
|
|
|
|
|
888,435 |
|
|
|
|
|
| Total liabilities and equity |
$ |
5,966,161 |
|
|
|
|
|
|
$ |
5,871,903 |
|
|
|
|
|
| Net interest income |
|
|
$ |
87,807 |
|
|
|
|
|
|
$ |
88,699 |
|
|
|
Interest spread(2) |
|
|
|
|
5.55 |
% |
|
|
|
|
|
5.65 |
% |
Net interest margin(3) |
|
|
|
|
6.65 |
% |
|
|
|
|
|
6.81 |
% |
(1) Loan balance totals include respective nonaccrual assets.
(2) Net interest spread is the yield on average interest earning assets less the rate on interest bearing liabilities.
(3) Net interest margin is the ratio of net interest income to average interest earning assets.
(4) Average rates have been annualized.
Additional information pertaining to our loan portfolio, including loans held for investment and loans held for sale, summarized for the quarters ended:
|
|
|
|
|
|
|
|
|
|
|
|
|
|
|
|
|
|
|
|
|
|
|
|
|
|
|
|
|
|
| (Dollars in thousands) |
December 31,
2024 |
|
September 30,
2024 |
|
June 30,
2024 |
|
March 31,
2024 |
|
December 31,
2023 |
| Average Banking loans |
$ |
3,163,999 |
|
|
$ |
3,008,767 |
|
|
$ |
3,035,612 |
|
|
$ |
2,932,646 |
|
|
$ |
3,053,526 |
|
| Average Factoring receivables |
1,064,772 |
|
|
1,023,570 |
|
|
976,087 |
|
|
942,414 |
|
|
1,025,978 |
|
| Average Payments receivables |
175,218 |
|
|
167,969 |
|
|
183,970 |
|
|
170,306 |
|
|
176,852 |
|
| Average total loans |
$ |
4,403,989 |
|
|
$ |
4,200,306 |
|
|
$ |
4,195,669 |
|
|
$ |
4,045,366 |
|
|
$ |
4,256,356 |
|
| Banking yield |
6.60 |
% |
|
6.99 |
% |
|
7.27 |
% |
|
7.34 |
% |
|
7.66 |
% |
| Factoring yield |
13.36 |
% |
|
13.57 |
% |
|
14.14 |
% |
|
13.98 |
% |
|
13.71 |
% |
| Payments yield |
12.71 |
% |
|
13.48 |
% |
|
12.51 |
% |
|
12.18 |
% |
|
11.83 |
% |
| Total loan yield |
8.48 |
% |
|
8.85 |
% |
|
9.10 |
% |
|
9.09 |
% |
|
9.29 |
% |
Metrics and non-GAAP financial:
|
|
|
|
|
|
|
|
|
|
|
|
|
|
|
|
|
|
|
|
|
|
|
|
|
|
|
|
|
|
|
|
|
|
|
|
|
|
|
|
|
|
|
|
|
|
|
As of and for the Three Months Ended |
|
As of and for the Year Ended |
(Dollars in thousands,
except per share amounts) |
|
December 31,
2024 |
|
September 30,
2024 |
|
June 30,
2024 |
|
March 31,
2024 |
|
December 31,
2023 |
|
December 31,
2024 |
|
December 31,
2023 |
|
|
|
|
|
|
|
|
|
|
|
|
|
|
|
|
|
|
|
|
|
|
|
|
|
|
|
|
|
|
|
|
|
|
|
|
|
|
|
|
|
|
|
|
|
|
|
|
|
|
|
|
|
|
|
|
|
|
|
|
|
|
|
|
|
|
|
|
|
|
|
|
|
|
|
|
|
|
|
|
|
|
|
|
|
|
|
|
|
|
|
|
|
|
|
|
|
|
|
|
|
|
|
|
|
|
|
|
|
|
|
|
|
|
|
|
|
|
|
|
|
|
|
|
|
|
|
|
|
|
|
|
|
|
|
| Average total stockholders' equity |
|
$ |
898,965 |
|
|
$ |
888,435 |
|
|
$ |
880,227 |
|
|
$ |
879,825 |
|
|
$ |
868,396 |
|
|
$ |
886,900 |
|
|
$ |
855,488 |
|
| Average preferred stock liquidation preference |
|
(45,000) |
|
|
(45,000) |
|
|
(45,000) |
|
|
(45,000) |
|
|
(45,000) |
|
|
(45,000) |
|
|
(45,000) |
|
| Average total common stockholders' equity |
|
853,965 |
|
|
843,435 |
|
|
835,227 |
|
|
834,825 |
|
|
823,396 |
|
|
841,900 |
|
|
810,488 |
|
| Average goodwill and other intangibles |
|
(253,415) |
|
|
(253,656) |
|
|
(256,552) |
|
|
(256,070) |
|
|
(258,807) |
|
|
(254,924) |
|
|
(262,552) |
|
| Average tangible common stockholders' equity |
|
$ |
600,550 |
|
|
$ |
589,779 |
|
|
$ |
578,675 |
|
|
$ |
578,755 |
|
|
$ |
564,589 |
|
|
$ |
586,976 |
|
|
$ |
547,936 |
|
|
|
|
|
|
|
|
|
|
|
|
|
|
|
|
| Net income available to common stockholders |
|
$ |
3,036 |
|
|
$ |
4,546 |
|
|
$ |
1,945 |
|
|
$ |
3,357 |
|
|
$ |
8,825 |
|
|
$ |
12,884 |
|
|
$ |
37,875 |
|
| Average tangible common equity |
|
600,550 |
|
|
589,779 |
|
|
578,675 |
|
|
578,755 |
|
|
564,589 |
|
|
586,976 |
|
|
547,936 |
|
| Return on average tangible common equity |
|
2.01 |
% |
|
3.07 |
% |
|
1.35 |
% |
|
2.33 |
% |
|
6.20 |
% |
|
2.20 |
% |
|
6.91 |
% |
|
|
|
|
|
|
|
|
|
|
|
|
|
|
|
|
|
|
|
|
|
|
|
|
|
|
|
|
|
|
|
|
|
|
|
|
|
|
|
|
|
|
|
|
|
|
|
|
|
|
|
|
|
|
|
|
|
|
|
|
|
|
|
|
|
|
|
|
|
|
|
|
|
|
|
|
|
|
|
|
|
|
|
|
|
|
|
|
|
|
|
|
|
|
|
|
|
|
|
|
|
|
|
|
|
|
|
|
|
|
|
|
|
|
|
|
|
|
|
|
|
|
|
|
|
|
|
|
|
|
|
|
|
|
|
|
|
|
|
|
|
|
|
|
|
|
|
|
|
|
|
|
|
|
|
|
|
|
|
|
|
|
|
|
|
|
|
|
|
|
|
|
|
|
|
|
|
|
|
|
| Net non-interest expense to average assets ratio: |
|
|
|
|
|
|
|
|
|
|
|
|
|
|
| Noninterest expenses |
|
$ |
93,275 |
|
|
$ |
95,646 |
|
|
$ |
97,343 |
|
|
$ |
90,371 |
|
|
$ |
87,298 |
|
|
$ |
376,635 |
|
|
$ |
353,234 |
|
| Noninterest income |
|
$ |
15,751 |
|
|
$ |
17,497 |
|
|
$ |
17,167 |
|
|
$ |
14,999 |
|
|
$ |
14,230 |
|
|
$ |
65,414 |
|
|
$ |
50,173 |
|
| Net noninterest expenses |
|
$ |
77,524 |
|
|
$ |
78,149 |
|
|
$ |
80,176 |
|
|
$ |
75,372 |
|
|
$ |
73,068 |
|
|
$ |
311,221 |
|
|
$ |
303,061 |
|
| Average total assets |
|
$ |
5,966,161 |
|
|
$ |
5,871,903 |
|
|
$ |
5,690,767 |
|
|
$ |
5,391,520 |
|
|
$ |
5,478,707 |
|
|
$ |
5,733,069 |
|
|
$ |
5,431,276 |
|
| Net noninterest expense to average assets ratio |
|
5.17 |
% |
|
5.29 |
% |
|
5.67 |
% |
|
5.62 |
% |
|
5.29 |
% |
|
5.43 |
% |
|
5.58 |
% |
|
|
|
|
|
|
|
|
|
|
|
|
|
|
|
| Total stockholders' equity |
|
$ |
890,919 |
|
|
$ |
885,764 |
|
|
$ |
874,249 |
|
|
$ |
872,339 |
|
|
$ |
864,400 |
|
|
$ |
890,919 |
|
|
$ |
864,400 |
|
| Preferred stock liquidation preference |
|
(45,000) |
|
|
(45,000) |
|
|
(45,000) |
|
|
(45,000) |
|
|
(45,000) |
|
|
(45,000) |
|
|
(45,000) |
|
| Total common stockholders' equity |
|
845,919 |
|
|
840,764 |
|
|
829,249 |
|
|
827,339 |
|
|
819,400 |
|
|
845,919 |
|
|
819,400 |
|
| Goodwill and other intangibles |
|
(258,208) |
|
|
(251,025) |
|
|
(254,652) |
|
|
(257,551) |
|
|
(257,355) |
|
|
(258,208) |
|
|
(257,355) |
|
| Tangible common stockholders' equity |
|
$ |
587,711 |
|
|
$ |
589,739 |
|
|
$ |
574,597 |
|
|
$ |
569,788 |
|
|
$ |
562,045 |
|
|
$ |
587,711 |
|
|
$ |
562,045 |
|
| Common shares outstanding |
|
23,391,411 |
|
|
23,387,522 |
|
|
23,353,519 |
|
|
23,334,997 |
|
|
23,302,414 |
|
|
23,391,411 |
|
|
23,302,414 |
|
| Tangible book value per share |
|
$ |
25.13 |
|
|
$ |
25.22 |
|
|
$ |
24.60 |
|
|
$ |
24.42 |
|
|
$ |
24.12 |
|
|
$ |
25.13 |
|
|
$ |
24.12 |
|
|
|
|
|
|
|
|
|
|
|
|
|
|
|
|
| Total assets at end of period |
|
$ |
5,948,975 |
|
|
$ |
5,866,046 |
|
|
$ |
5,783,334 |
|
|
$ |
5,575,493 |
|
|
$ |
5,347,334 |
|
|
$ |
5,948,975 |
|
|
$ |
5,347,334 |
|
| Goodwill and other intangibles |
|
(258,208) |
|
|
(251,025) |
|
|
(254,652) |
|
|
(257,551) |
|
|
(257,355) |
|
|
(258,208) |
|
|
(257,355) |
|
| Tangible assets at period end |
|
$ |
5,690,767 |
|
|
$ |
5,615,021 |
|
|
$ |
5,528,682 |
|
|
$ |
5,317,942 |
|
|
$ |
5,089,979 |
|
|
$ |
5,690,767 |
|
|
$ |
5,089,979 |
|
| Tangible common stockholders' equity ratio |
|
10.33 |
% |
|
10.50 |
% |
|
10.39 |
% |
|
10.71 |
% |
|
11.04 |
% |
|
10.33 |
% |
|
11.04 |
% |
1)Triumph Financial uses certain non-GAAP financial measures to provide meaningful supplemental information regarding Triumph Financial's operational performance and to enhance investors' overall understanding of such financial performance. The non-GAAP measures used by Triumph Financial include the following:
•"Tangible common stockholders' equity" is defined as common stockholders' equity less goodwill and other intangible assets.
•"Total tangible assets" is defined as total assets less goodwill and other intangible assets.
•"Tangible book value per share" is defined as tangible common stockholders' equity divided by total common shares outstanding. This measure is important to investors interested in changes from period-to-period in book value per share exclusive of changes in intangible assets.
•"Tangible common stockholders' equity ratio" is defined as the ratio of tangible common stockholders' equity divided by total tangible assets. We believe that this measure is important to many investors in the marketplace who are interested in relative changes from period-to period in common equity and total assets, each exclusive of changes in intangible assets.
•"Return on Average Tangible Common Equity" is defined as net income available to common stockholders divided by average tangible common stockholders' equity.
2)Performance ratios include discount accretion on purchased loans for the periods presented as follows:
|
|
|
|
|
|
|
|
|
|
|
|
|
|
|
|
|
|
|
|
|
|
|
|
|
|
|
|
|
|
|
|
|
|
|
|
|
|
|
|
|
|
|
For the Three Months Ended |
|
For the Year Ended |
| (Dollars in thousands) |
December 31,
2024 |
|
September 30,
2024 |
|
June 30,
2024 |
|
March 31,
2024 |
|
December 31,
2023 |
|
December 31,
2024 |
|
December 31,
2023 |
| Loan discount accretion |
$ |
273 |
|
|
$ |
893 |
|
|
$ |
1,127 |
|
|
$ |
471 |
|
|
$ |
1,039 |
|
|
$ |
2,764 |
|
|
$ |
5,242 |
|
3)Asset quality ratios exclude loans held for sale, except for non-performing assets to total assets.
4)Current quarter ratios are preliminary.
Source: Triumph Financial, Inc.
###
Investor Relations:
Luke Wyse
Senior Vice President, Head of Investor Relations
lwyse@tfin.com
214-365-6936
Media Contact:
Amanda Tavackoli
Senior Vice President, Director of Corporate Communication
atavackoli@tfin.com
214-365-6930