SUPPLEMENTAL FINANCIAL DATA Q3 2024
2 Disclaimer This presentation contains statements that constitute “forward-looking statements,” as such term is defined in Section 27A of the Securities Act of 1933, as amended, and Section 21E of the Securities Exchange Act of 1934, as amended, and such statements are intended to be covered by the safe harbor provided by the same. These statements are based on management’s current expectations and beliefs and are subject to a number of trends and uncertainties that could cause actual results to differ materially from those described in the forward-looking statements; Ready Capital Corporation (the “Company”) can give no assurance that its expectations will be attained. Factors that could cause actual results to differ materially from the Company’s expectations include those set forth in the Risk Factors section of the most recent Annual Report on Form 10-K filed with the SEC and other reports filed by the Company with the SEC, copies of which are available on the SEC’s website, www.sec.gov. The Company undertakes no obligation to update these statements for revisions or changes after the date of this release, except as required by law. This presentation includes certain non-GAAP financial measures, including Distributable earnings. These non-GAAP financial measures should be considered only as supplemental to, and not as superior to, financial measures in accordance with GAAP. Please refer to the Appendix for the most recent GAAP information. This presentation also contains market statistics and industry data which are subject to uncertainty and are not necessarily reflective of market conditions. These have been derived from third party sources and have not been independently verified by the Company or its affiliates. All material presented is compiled from sources believed to be reliable and current, but accuracy cannot be guaranteed. All data is as of September 30, 2024, unless otherwise noted.
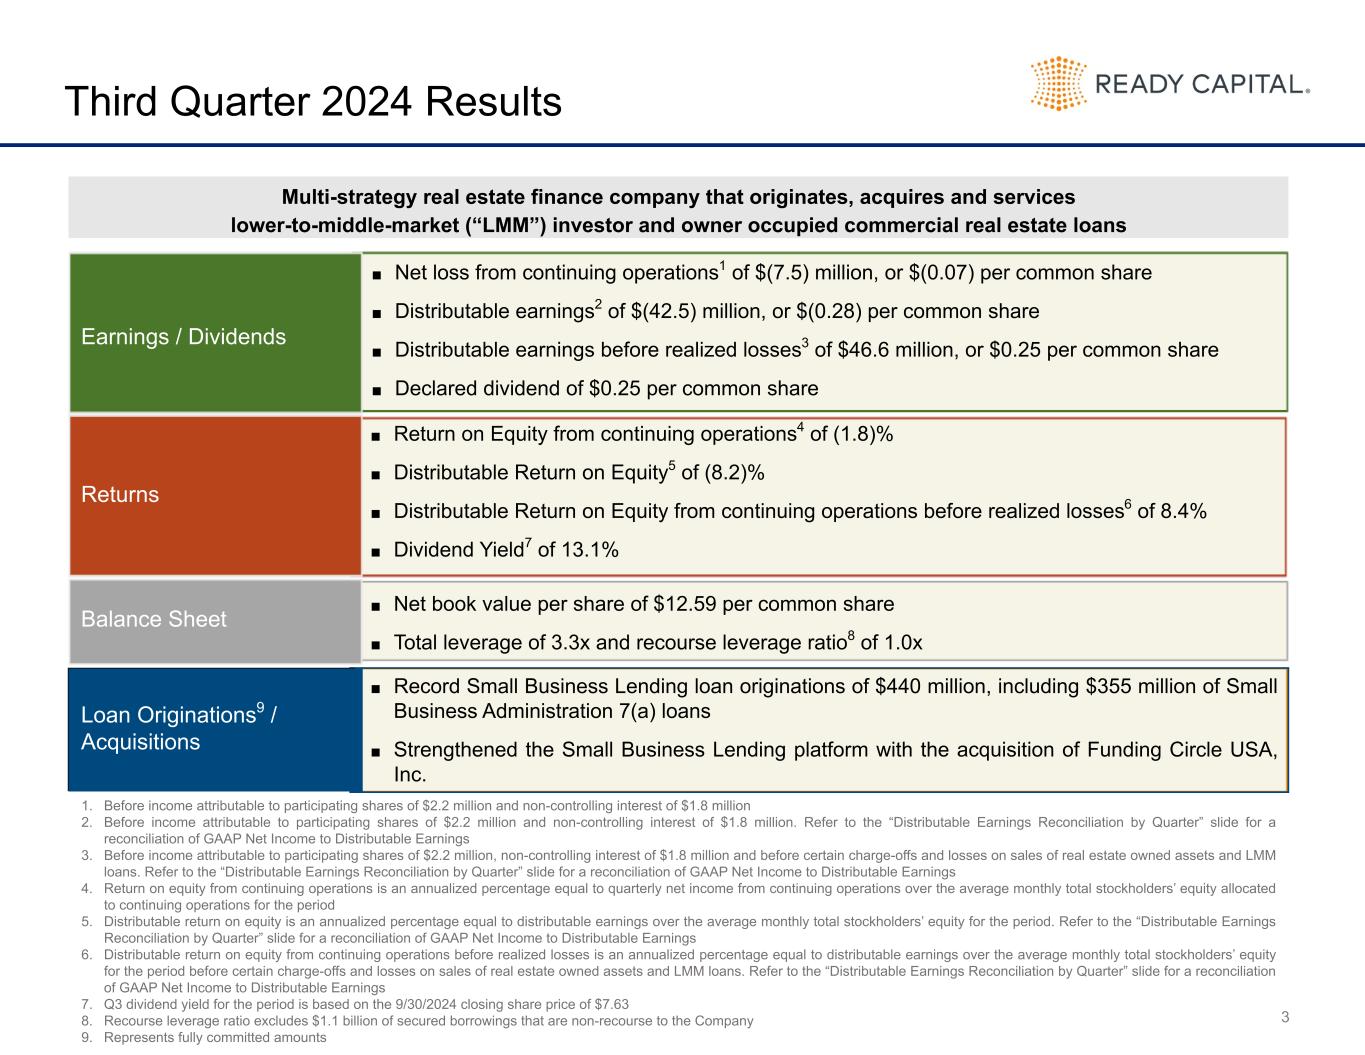
3 Third Quarter 2024 Results ■ Net loss from continuing operations1 of $(7.5) million, or $(0.07) per common share ■ Distributable earnings2 of $(42.5) million, or $(0.28) per common share ■ Distributable earnings before realized losses3 of $46.6 million, or $0.25 per common share ■ Declared dividend of $0.25 per common share Earnings / Dividends ■ Return on Equity from continuing operations4 of (1.8)% ■ Distributable Return on Equity5 of (8.2)% ■ Distributable Return on Equity from continuing operations before realized losses6 of 8.4% ■ Dividend Yield7 of 13.1% Returns Loan Originations9 / Acquisitions 1. Before income attributable to participating shares of $2.2 million and non-controlling interest of $1.8 million 2. Before income attributable to participating shares of $2.2 million and non-controlling interest of $1.8 million. Refer to the “Distributable Earnings Reconciliation by Quarter” slide for a reconciliation of GAAP Net Income to Distributable Earnings 3. Before income attributable to participating shares of $2.2 million, non-controlling interest of $1.8 million and before certain charge-offs and losses on sales of real estate owned assets and LMM loans. Refer to the “Distributable Earnings Reconciliation by Quarter” slide for a reconciliation of GAAP Net Income to Distributable Earnings 4. Return on equity from continuing operations is an annualized percentage equal to quarterly net income from continuing operations over the average monthly total stockholders’ equity allocated to continuing operations for the period 5. Distributable return on equity is an annualized percentage equal to distributable earnings over the average monthly total stockholders’ equity for the period. Refer to the “Distributable Earnings Reconciliation by Quarter” slide for a reconciliation of GAAP Net Income to Distributable Earnings 6. Distributable return on equity from continuing operations before realized losses is an annualized percentage equal to distributable earnings over the average monthly total stockholders’ equity for the period before certain charge-offs and losses on sales of real estate owned assets and LMM loans. Refer to the “Distributable Earnings Reconciliation by Quarter” slide for a reconciliation of GAAP Net Income to Distributable Earnings 7. Q3 dividend yield for the period is based on the 9/30/2024 closing share price of $7.63 8. Recourse leverage ratio excludes $1.1 billion of secured borrowings that are non-recourse to the Company 9. Represents fully committed amounts ■ Net book value per share of $12.59 per common share ■ Total leverage of 3.3x and recourse leverage ratio8 of 1.0x Balance Sheet Multi-strategy real estate finance company that originates, acquires and services lower-to-middle-market (“LMM”) investor and owner occupied commercial real estate loans ■ Record Small Business Lending loan originations of $440 million, including $355 million of Small Business Administration 7(a) loans ■ Strengthened the Small Business Lending platform with the acquisition of Funding Circle USA, Inc.
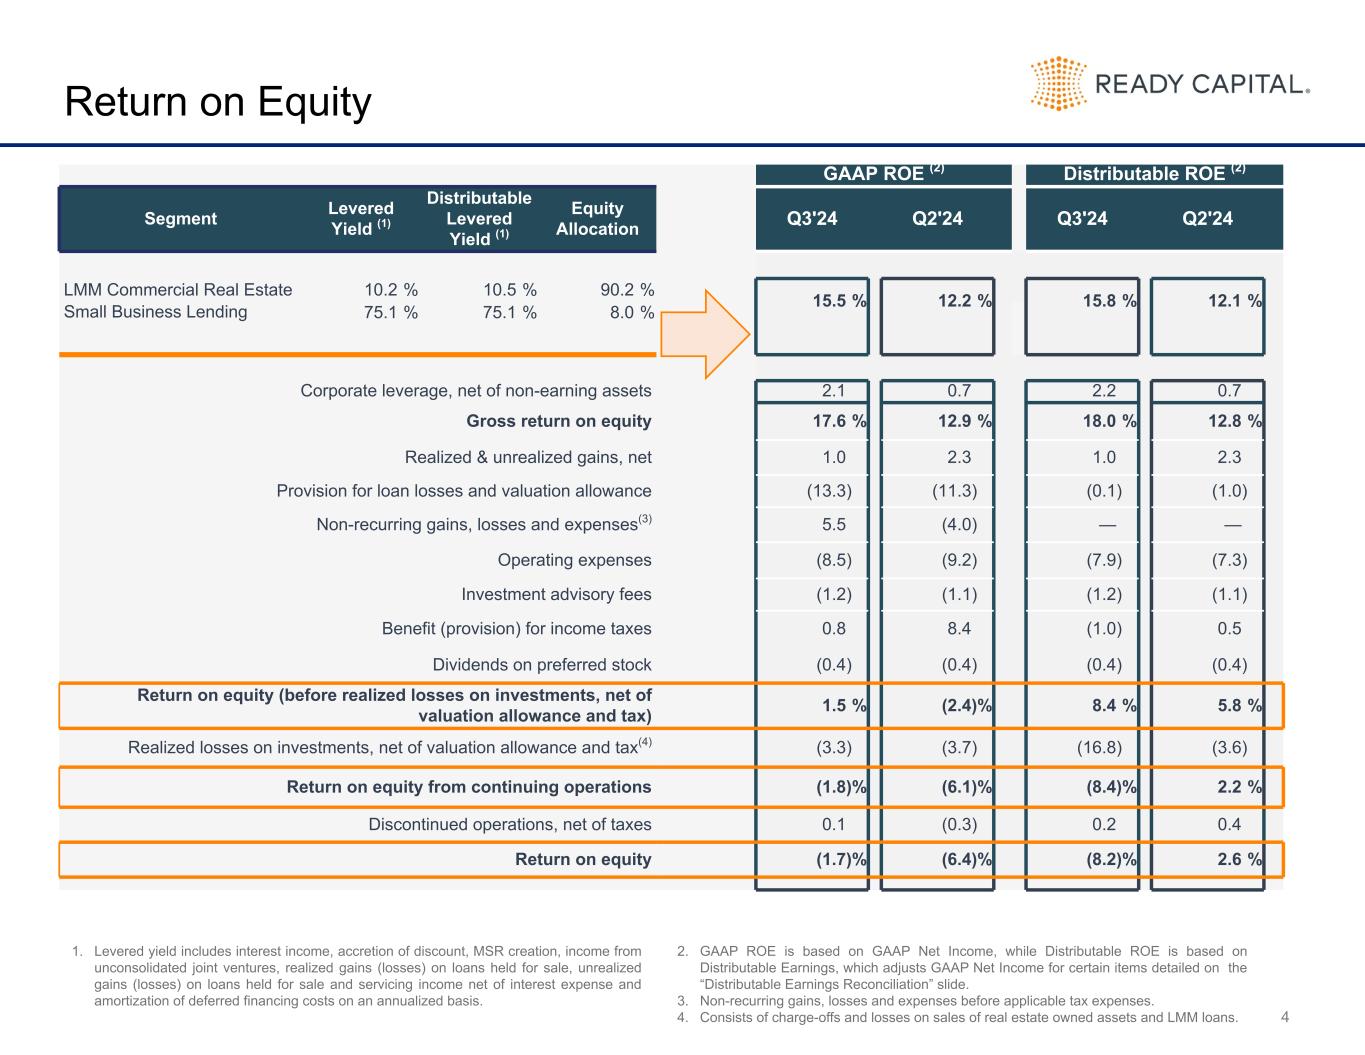
GAAP ROE (2) Distributable ROE (2) Segment Levered Yield (1) Distributable Levered Yield (1) Equity Allocation Q3'24 Q2'24 Q3'24 Q2'24 LMM Commercial Real Estate 10.2 % 10.5 % 90.2 % 15.5 % 12.2 % 15.8 % 12.1 %Small Business Lending 75.1 % 75.1 % 8.0 % Corporate leverage, net of non-earning assets 2.1 0.7 2.2 0.7 Gross return on equity 17.6 % 12.9 % 18.0 % 12.8 % Realized & unrealized gains, net 1.0 2.3 1.0 2.3 Provision for loan losses and valuation allowance (13.3) (11.3) (0.1) (1.0) Non-recurring gains, losses and expenses(3) 5.5 (4.0) — — Operating expenses (8.5) (9.2) (7.9) (7.3) Investment advisory fees (1.2) (1.1) (1.2) (1.1) Benefit (provision) for income taxes 0.8 8.4 (1.0) 0.5 Dividends on preferred stock (0.4) (0.4) (0.4) (0.4) Return on equity (before realized losses on investments, net of valuation allowance and tax) 1.5 % (2.4) % 8.4 % 5.8 % Realized losses on investments, net of valuation allowance and tax(4) (3.3) (3.7) (16.8) (3.6) Return on equity from continuing operations (1.8) % (6.1) % (8.4) % 2.2 % Discontinued operations, net of taxes 0.1 (0.3) 0.2 0.4 Return on equity (1.7) % (6.4) % (8.2) % 2.6 % 4 Return on Equity 1. Levered yield includes interest income, accretion of discount, MSR creation, income from unconsolidated joint ventures, realized gains (losses) on loans held for sale, unrealized gains (losses) on loans held for sale and servicing income net of interest expense and amortization of deferred financing costs on an annualized basis. 2. GAAP ROE is based on GAAP Net Income, while Distributable ROE is based on Distributable Earnings, which adjusts GAAP Net Income for certain items detailed on the “Distributable Earnings Reconciliation” slide. 3. Non-recurring gains, losses and expenses before applicable tax expenses. 4. Consists of charge-offs and losses on sales of real estate owned assets and LMM loans.
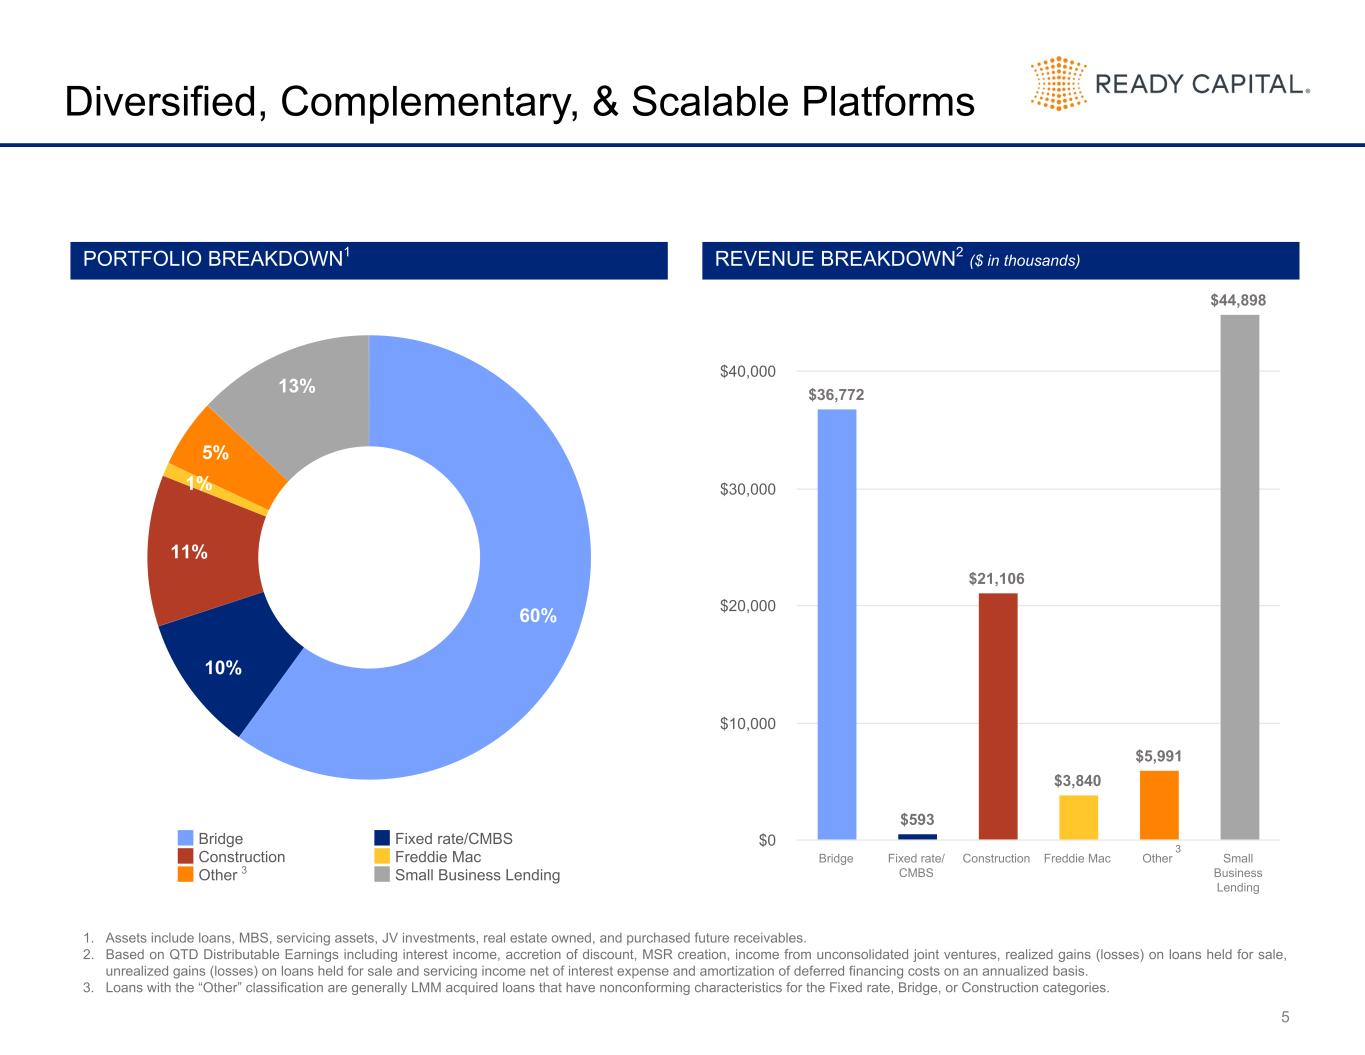
60% 10% 11% 1% 5% 13% Bridge Fixed rate/CMBS Construction Freddie Mac Other Small Business Lending 5 Diversified, Complementary, & Scalable Platforms PORTFOLIO BREAKDOWN1 REVENUE BREAKDOWN2 ($ in thousands) 1. Assets include loans, MBS, servicing assets, JV investments, real estate owned, and purchased future receivables. 2. Based on QTD Distributable Earnings including interest income, accretion of discount, MSR creation, income from unconsolidated joint ventures, realized gains (losses) on loans held for sale, unrealized gains (losses) on loans held for sale and servicing income net of interest expense and amortization of deferred financing costs on an annualized basis. 3. Loans with the “Other” classification are generally LMM acquired loans that have nonconforming characteristics for the Fixed rate, Bridge, or Construction categories. 3 $36,772 $593 $21,106 $3,840 $5,991 $44,898 Bridge Fixed rate/ CMBS Construction Freddie Mac Other Small Business Lending $0 $10,000 $20,000 $30,000 $40,000 3
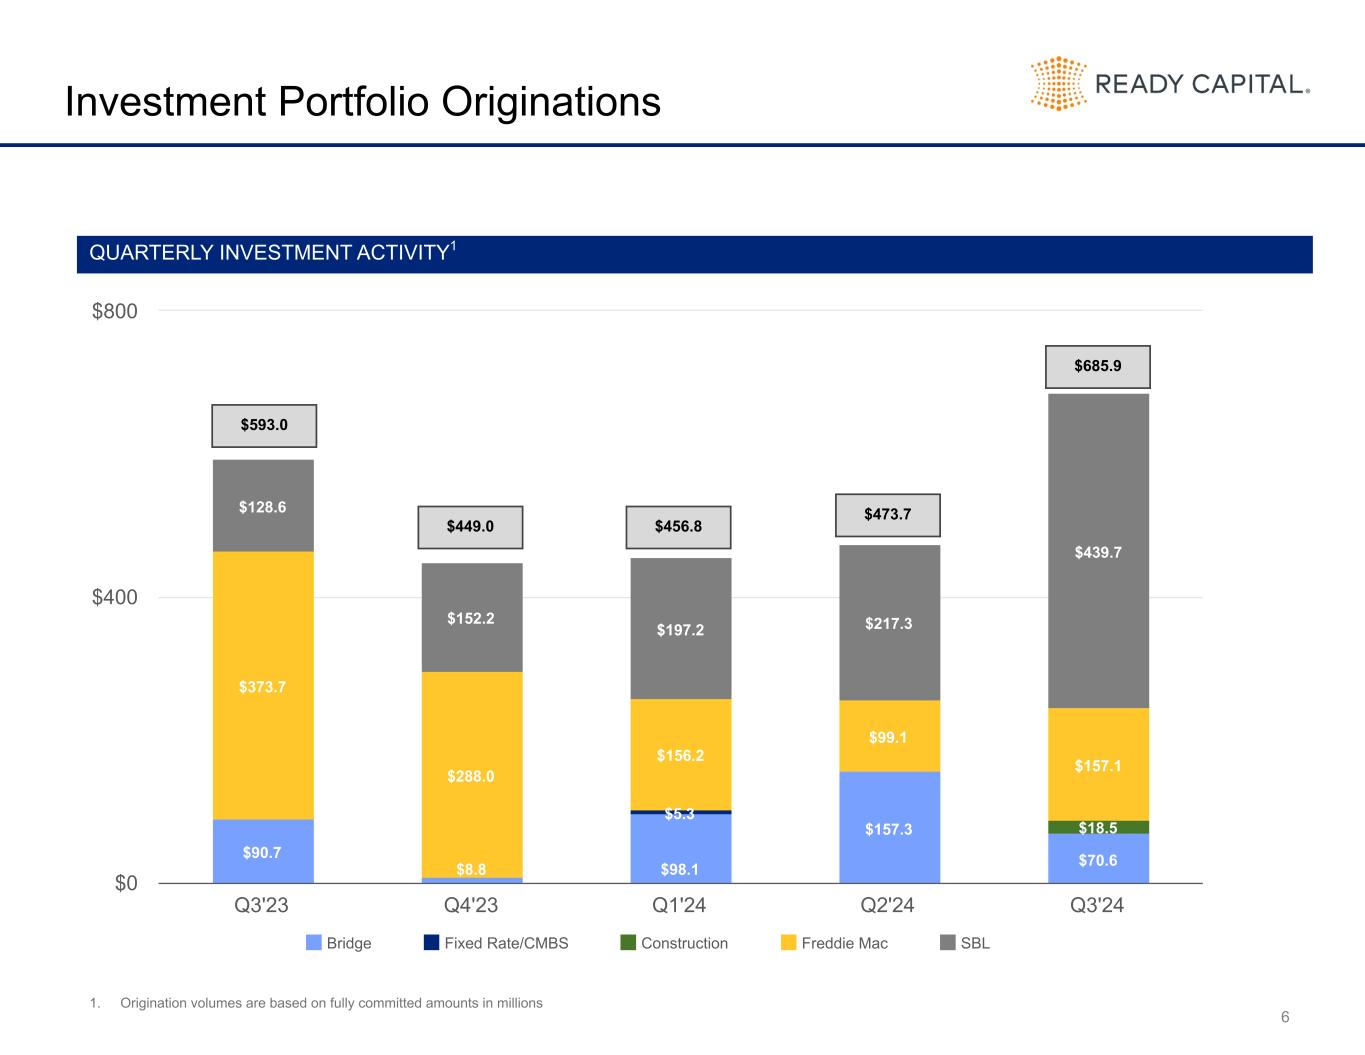
$90.7 $8.8 $98.1 $157.3 $70.6 $5.3 $18.5 $373.7 $288.0 $156.2 $99.1 $157.1 $128.6 $152.2 $197.2 $217.3 $439.7 Bridge Fixed Rate/CMBS Construction Freddie Mac SBL Q3'23 Q4'23 Q1'24 Q2'24 Q3'24 $0 $400 $800 6 Investment Portfolio Originations 1. Origination volumes are based on fully committed amounts in millions QUARTERLY INVESTMENT ACTIVITY1 $456.8$449.0 $473.7 $685.9 $593.0
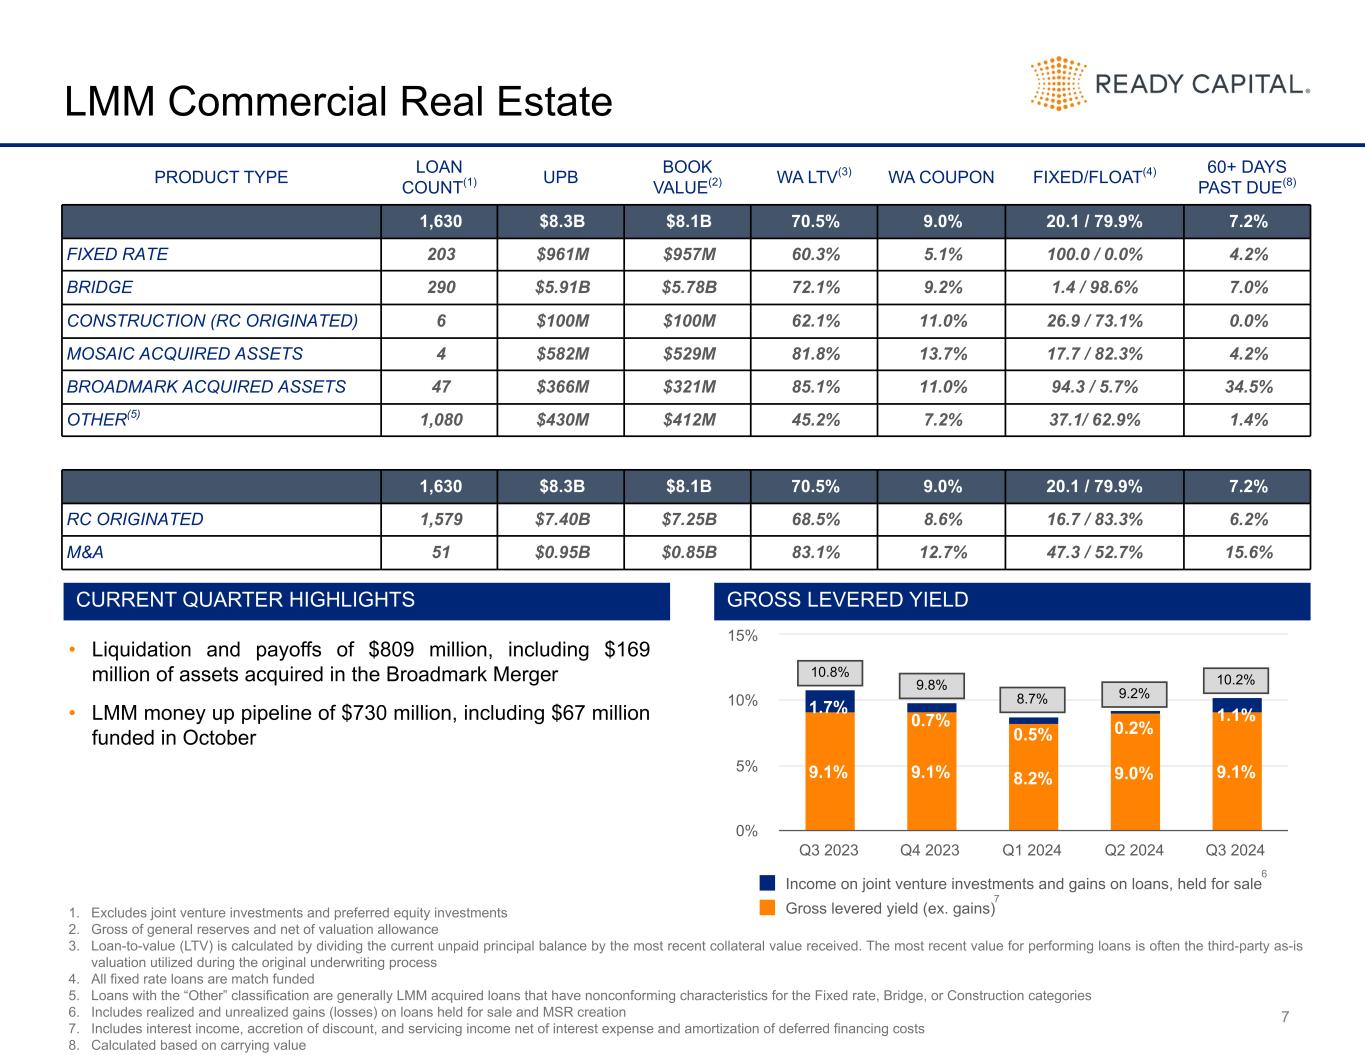
• Liquidation and payoffs of $809 million, including $169 million of assets acquired in the Broadmark Merger • LMM money up pipeline of $730 million, including $67 million funded in October 7 LMM Commercial Real Estate 1. Excludes joint venture investments and preferred equity investments 2. Gross of general reserves and net of valuation allowance 3. Loan-to-value (LTV) is calculated by dividing the current unpaid principal balance by the most recent collateral value received. The most recent value for performing loans is often the third-party as-is valuation utilized during the original underwriting process 4. All fixed rate loans are match funded 5. Loans with the “Other” classification are generally LMM acquired loans that have nonconforming characteristics for the Fixed rate, Bridge, or Construction categories 6. Includes realized and unrealized gains (losses) on loans held for sale and MSR creation 7. Includes interest income, accretion of discount, and servicing income net of interest expense and amortization of deferred financing costs 8. Calculated based on carrying value GROSS LEVERED YIELD PRODUCT TYPE LOAN COUNT(1) UPB BOOK VALUE(2) WA LTV(3) WA COUPON FIXED/FLOAT(4) 60+ DAYS PAST DUE(8) 1,630 $8.3B $8.1B 70.5% 9.0% 20.1 / 79.9% 7.2% FIXED RATE 203 $961M $957M 60.3% 5.1% 100.0 / 0.0% 4.2% BRIDGE 290 $5.91B $5.78B 72.1% 9.2% 1.4 / 98.6% 7.0% CONSTRUCTION (RC ORIGINATED) 6 $100M $100M 62.1% 11.0% 26.9 / 73.1% 0.0% MOSAIC ACQUIRED ASSETS 4 $582M $529M 81.8% 13.7% 17.7 / 82.3% 4.2% BROADMARK ACQUIRED ASSETS 47 $366M $321M 85.1% 11.0% 94.3 / 5.7% 34.5% OTHER(5) 1,080 $430M $412M 45.2% 7.2% 37.1/ 62.9% 1.4% 1,630 $8.3B $8.1B 70.5% 9.0% 20.1 / 79.9% 7.2% RC ORIGINATED 1,579 $7.40B $7.25B 68.5% 8.6% 16.7 / 83.3% 6.2% M&A 51 $0.95B $0.85B 83.1% 12.7% 47.3 / 52.7% 15.6% CURRENT QUARTER HIGHLIGHTS 9.1% 9.1% 8.2% 9.0% 9.1% 1.7% 0.7% 0.5% 0.2% 1.1% Income on joint venture investments and gains on loans, held for sale Gross levered yield (ex. gains) Q3 2023 Q4 2023 Q1 2024 Q2 2024 Q3 2024 0% 5% 10% 15% 7 6 10.8% 9.8% 8.7% 9.2% 10.2%

8 Small Business Lending GROSS LEVERED YIELD LOAN COUNT UPB BOOK VALUE(1) WA LTV(2) WA COUPON FIXED/FLOAT 60+ DAYS PAST DUE(5) 5,903 $1.34B $1.32B 99.5% 10.5% 0.7 / 99.3% 2.9% CURRENT QUARTER HIGHLIGHTS 1. Gross of general reserves 2. Loan-to-value (LTV) is calculated by dividing the current unpaid principal balance by the most recent collateral value received. The most recent value for performing loans is often the third-party as-is valuation utilized during the original underwriting process 3. Includes interest income, accretion of discount, and servicing income net of interest expense and amortization of deferred financing costs; excludes impairment 4. Includes realized and unrealized gains (losses) on loans held for sale and MSR creation 5. Calculated based on carrying value 21.2% 19.7% 18.1% 18.9% 24.0% 22.5% 24.4% 32.1% 36.2% 51.1% Gross levered yield (ex. gains) Gains on loans, held for sale Q3 2023 Q4 2023 Q1 2024 Q2 2024 Q3 2024 0% 15% 30% 45% 60% 75%• SBA net sales premiums peaking at 19.3% and averaging 11.2% net • $440 million of SBL loan originations, consisting of $355 million of Small Business Administration, or SBA 7(a), loans, $39 million of USDA loans and $46 million of small business working capital loans • Current money up pipeline of $899 million, including $102 million funded in October 3 4 43.7% 44.1% 50.2% 55.1% 75.1%
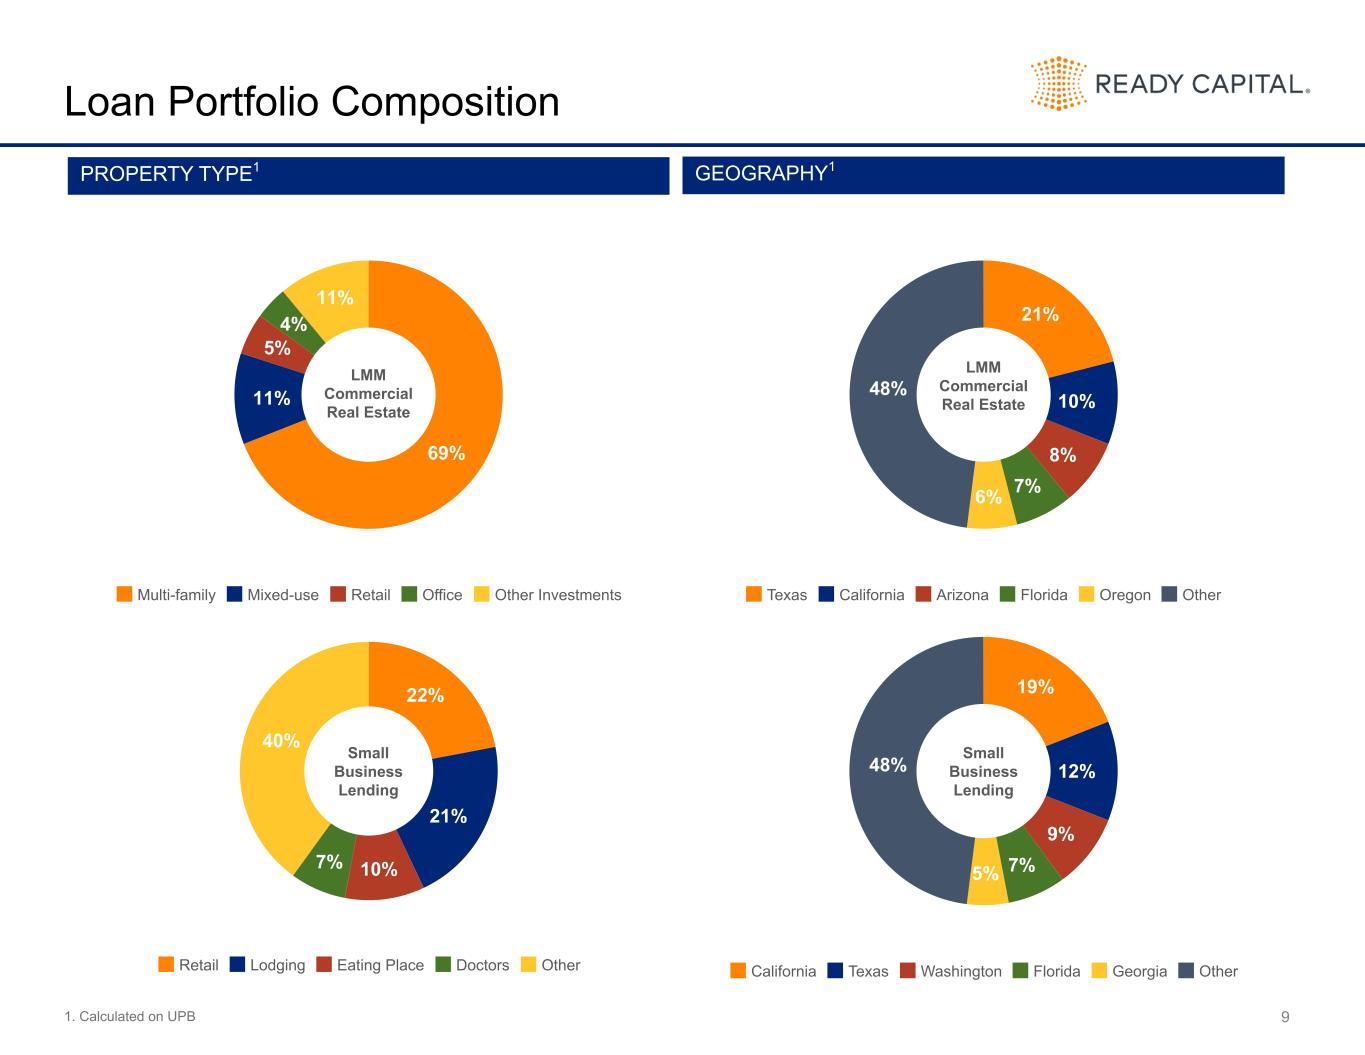
69% 11% 5% 4% 11% Multi-family Mixed-use Retail Office Other Investments 9 Loan Portfolio Composition 1. Calculated on UPB PROPERTY TYPE1 GEOGRAPHY1 LMM Commercial Real Estate 22% 21% 10%7% 40% Retail Lodging Eating Place Doctors Other Small Business Lending 21% 10% 8% 7%6% 48% Texas California Arizona Florida Oregon Other LMM Commercial Real Estate 19% 12% 9% 7%5% 48% California Texas Washington Florida Georgia Other Small Business Lending

10 Loan Portfolio – Risk Rating BUCKET 1: Very Low Risk of Loss: New origination or current with strong credit metrics (LTV/DSCR/DY). No expected losses. BUCKET 2: Low Risk of Loss: Current with maturity > 6 months. Lower credit metrics with possibility of inclusion on CREFC watchlist. No expected losses. BUCKET 3: Medium Risk of Loss: Current with near term maturities or in forbearance. Loss unlikely with no specific reserves booked. BUCKET 4: Higher Risk: Loan delinquent or in maturity default. Potential issues with sponsor or business plans. Minimal losses possible and adequately reserved in current period. BUCKET 5: Highest risk: Loan in default or special servicing. Specific losses identified and adequately reserved for in current period. LMM RISK RATING DISTRIBUTION RISK RATING CRITERIA AVERAGE RISK RATING1 62% 19% 5% 14% 66% 26% 6% 2% 91% 2% 2% 5% M&A RC Originated SBA 1 & 2 3 4 5 0% 20% 40% 60% 80% 100% 2.91 3.01 2.32 2.75 2.70 1.92 2.23 2.39 2.29 2.24 1.59 1.63 1.44 1.49 1.55 M&A RC Originated SBA Q3'23 Q4'23 Q1'24 Q2'24 Q3'24 0.00 0.50 1.00 1.50 2.00 2.50 3.00 3.50 1. Prior to Q2 2024, the M&A category included all loans acquired by the Company. Beginning in Q2 2024, the M&A category is comprised of loans acquired through mergers and acquisitions only and excludes legacy acquired loans.

11 LMM CRE Loan Portfolio - Migration CONTRACTUAL STATUS (1) TOTAL Q1’24 Q2’24 Q3’24 CURRENT 87.8% 92.8% 91.4% 30+ DAYS PAST DUE 2.3% 0.9% 1.4% 60+ DAYS PAST DUE 9.9% 6.3% 7.2% RC ORIGINATED Q1’24 Q2’24 Q3’24 CURRENT 89.9% 94.4% 92.6% 30+ DAYS PAST DUE 2.2% 0.4% 1.2% 60+ DAYS PAST DUE 7.9% 5.2% 6.2% M&A Q1’24 Q2’24 Q3’24 CURRENT 72.8% 80.7% 80.9% 30+ DAYS PAST DUE 3.1% 4.3% 3.5% 60+ DAYS PAST DUE 24.1% 15.0% 15.6% ACCRUAL STATUS (1) TOTAL Q1’24 Q2’24 Q3’24 ACCRUAL 92.8% 94.3% 95.3% NON-ACCRUAL 7.2% 5.7% 4.7% RC ORIGINATED Q1’24 Q2’24 Q3’24 ACCRUAL 94.2% 95.4% 96.6% NON-ACCRUAL 5.8% 4.6% 3.4% M&A Q1’24 Q2’24 Q3’24 ACCRUAL 82.6% 86.3% 83.9% NON-ACCRUAL 17.4% 13.7% 16.1% RISK RATING (1) TOTAL Q1’24 Q2’24 Q3’24 1 & 2 67.2% 69.5% 66.1% 3 22.1% 23.9% 25.5% 4 7.6% 3.5% 5.4% 5 3.1% 3.1% 3.0% RC ORIGINATED Q1’24 Q2’24 Q3’24 1 & 2 69.7% 71.5% 66.5% 3 20.7% 23.5% 26.2% 4 7.9% 3.1% 5.5% 5 1.7% 1.9% 1.8% M&A Q1’24 Q2’24 Q3’24 1 & 2 48.2% 54.4% 62.4% 3 32.4% 27.3% 19.1% 4 5.6% 6.0% 5.0% 5 13.8% 12.3% 13.5% 1. Calculated on carrying value

12 Financial Flexibility UNENCUMBERED ASSET POOL HIGHLIGHTS CORPORATE DEBT MATURITY PROFILE ($ in millions) 14% 35% 16% 10% 4% 21% Unrestricted cash Securities Loans Servicing rights REO Other Assets • Diversified unencumbered asset pool of $1.3 billion, including $181 million of unrestricted cash • 1.7x unencumbered assets to unsecured debt • $2.7 billion in available warehouse borrowing capacity across 12 counterparties • Limited usage of securities repo financing at 3.8% of total debt • Full mark-to-market liabilities and credit mark to market liabilities represent 22% of total debt • 90% of corporate debt maturities in 2026 or later $1.3B Total Unencumbered Assets $0 $120 $761 $100 $110 $131 2024 2025 2026 2027 2028 2029 and beyond $0 $200 $400 $600 $800

13 Debt - Leverage • Total leverage of 3.3x • Recourse leverage ratio of 1.0x • 60% of secured borrowings subject to non-recourse or limited recourse terms Recourse Leverage by Reporting Segment(1) ($ in millions) 1. Recourse leverage by reporting segment is based on the segment recourse debt balance over invested equity in the segment and excludes guaranteed loan financings Debt Balance ($ in millions) Leverage Ratio PPPLF $24 <0.1x Securitized Debt Obligations $3,960 1.8x Non-Recourse Secured Borrowings $1,077 0.5x Recourse Secured Borrowings $1,107 0.5x Corporate Debt $1,206 0.5x $859 $248 $1,206 0.3x 1.0x 0.5x Debt Recourse Leverage LMM Commercial Real Estate Small Business Lending Corporate $0 $300 $600 $900 $1,200 0.0x 1.0x 2.0x 3.0x 4.0x
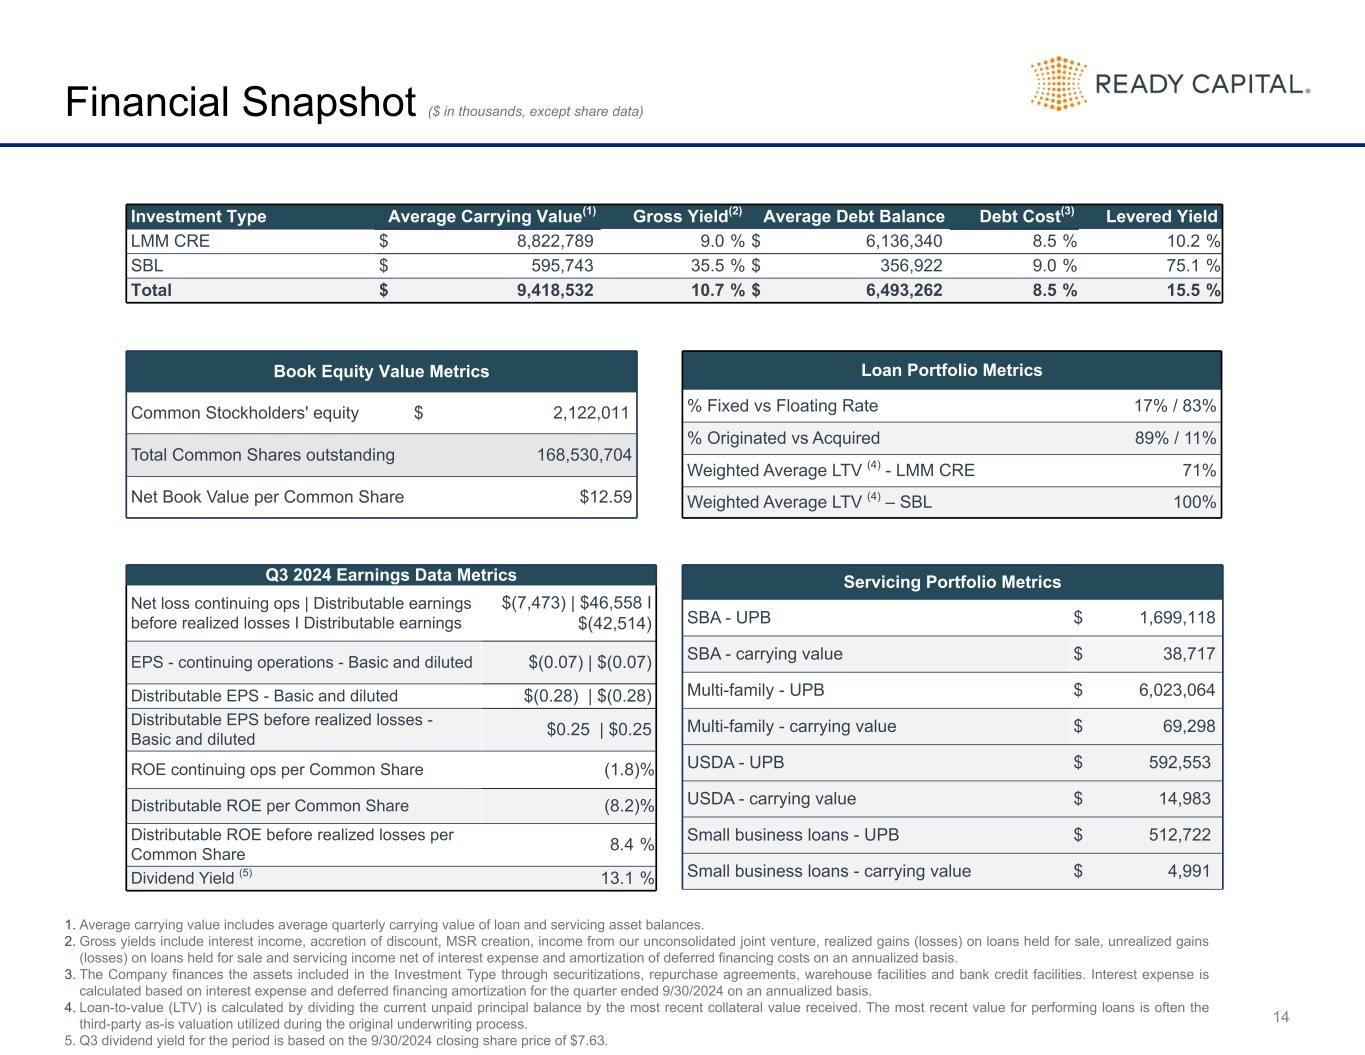
14 Financial Snapshot ($ in thousands, except share data) Investment Type Average Carrying Value(1) Gross Yield(2) Average Debt Balance Debt Cost(3) Levered Yield LMM CRE $ 8,822,789 9.0 % $ 6,136,340 8.5 % 10.2 % SBL $ 595,743 35.5 % $ 356,922 9.0 % 75.1 % Total $ 9,418,532 10.7 % $ 6,493,262 8.5 % 15.5 % Book Equity Value Metrics Common Stockholders' equity $ 2,122,011 Total Common Shares outstanding 168,530,704 Net Book Value per Common Share $12.59 Loan Portfolio Metrics % Fixed vs Floating Rate 17% / 83% % Originated vs Acquired 89% / 11% Weighted Average LTV (4) - LMM CRE 71% Weighted Average LTV (4) – SBL 100% Q3 2024 Earnings Data Metrics Net loss continuing ops | Distributable earnings before realized losses I Distributable earnings $(7,473) | $46,558 I $(42,514) EPS - continuing operations - Basic and diluted $(0.07) | $(0.07) Distributable EPS - Basic and diluted $(0.28) | $(0.28) Distributable EPS before realized losses - Basic and diluted $0.25 | $0.25 ROE continuing ops per Common Share (1.8) % Distributable ROE per Common Share (8.2) % Distributable ROE before realized losses per Common Share 8.4 % Dividend Yield (5) 13.1 % Servicing Portfolio Metrics SBA - UPB $ 1,699,118 SBA - carrying value $ 38,717 Multi-family - UPB $ 6,023,064 Multi-family - carrying value $ 69,298 USDA - UPB $ 592,553 USDA - carrying value $ 14,983 Small business loans - UPB $ 512,722 Small business loans - carrying value $ 4,991 1. Average carrying value includes average quarterly carrying value of loan and servicing asset balances. 2. Gross yields include interest income, accretion of discount, MSR creation, income from our unconsolidated joint venture, realized gains (losses) on loans held for sale, unrealized gains (losses) on loans held for sale and servicing income net of interest expense and amortization of deferred financing costs on an annualized basis. 3. The Company finances the assets included in the Investment Type through securitizations, repurchase agreements, warehouse facilities and bank credit facilities. Interest expense is calculated based on interest expense and deferred financing amortization for the quarter ended 9/30/2024 on an annualized basis. 4. Loan-to-value (LTV) is calculated by dividing the current unpaid principal balance by the most recent collateral value received. The most recent value for performing loans is often the third-party as-is valuation utilized during the original underwriting process. 5. Q3 dividend yield for the period is based on the 9/30/2024 closing share price of $7.63.

APPENDIX Additional Financial Information
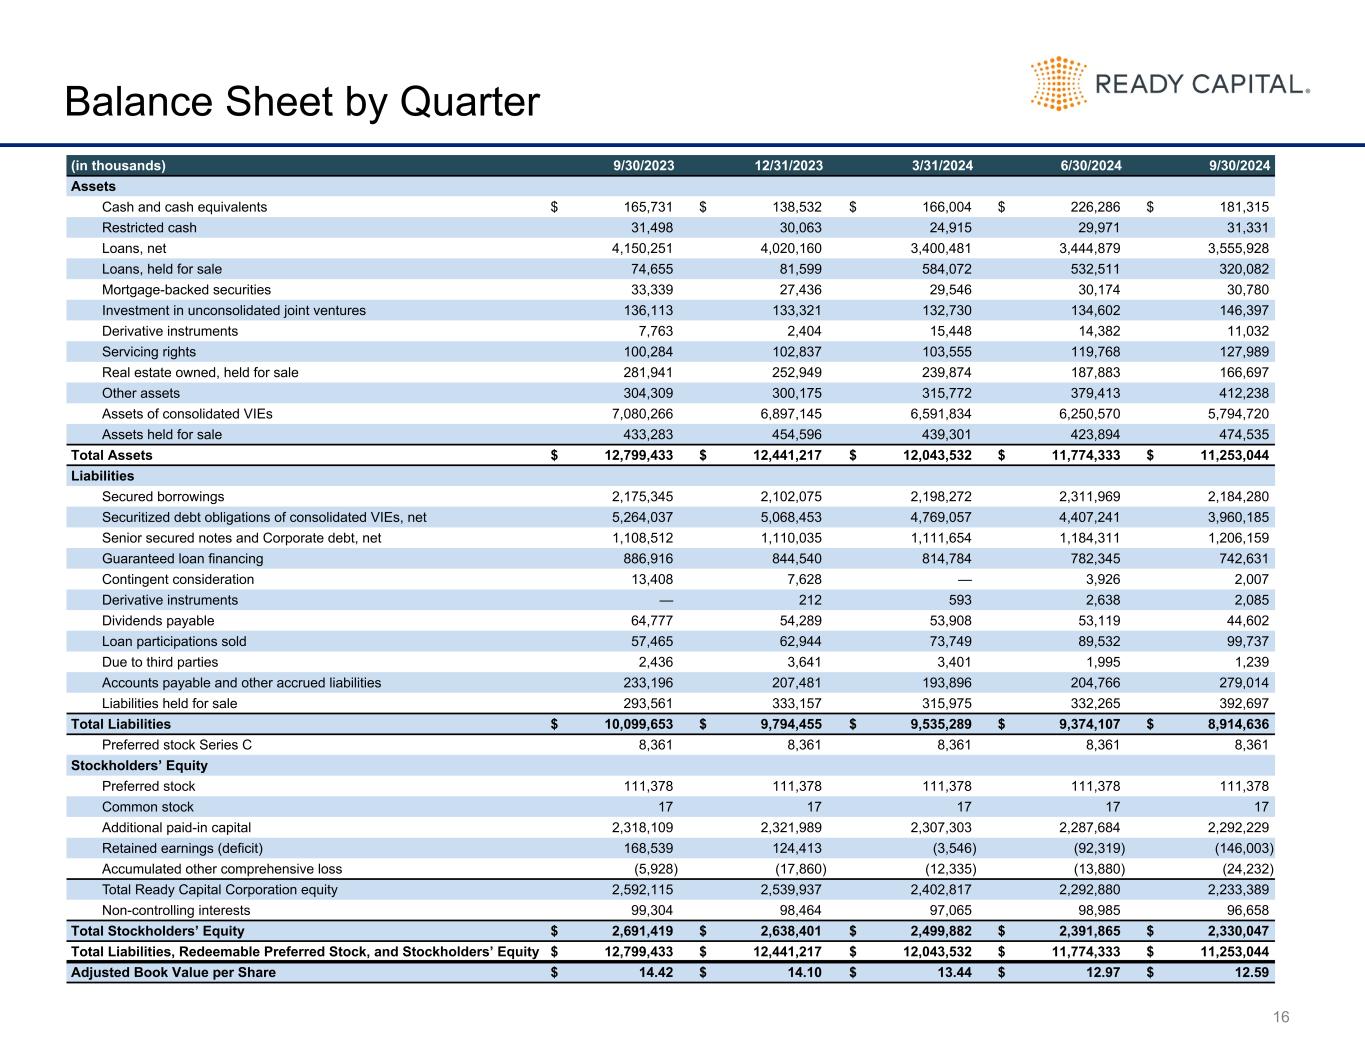
16 Balance Sheet by Quarter (in thousands) 9/30/2023 12/31/2023 3/31/2024 6/30/2024 9/30/2024 Assets Cash and cash equivalents $ 165,731 $ 138,532 $ 166,004 $ 226,286 $ 181,315 Restricted cash 31,498 30,063 24,915 29,971 31,331 Loans, net 4,150,251 4,020,160 3,400,481 3,444,879 3,555,928 Loans, held for sale 74,655 81,599 584,072 532,511 320,082 Mortgage-backed securities 33,339 27,436 29,546 30,174 30,780 Investment in unconsolidated joint ventures 136,113 133,321 132,730 134,602 146,397 Derivative instruments 7,763 2,404 15,448 14,382 11,032 Servicing rights 100,284 102,837 103,555 119,768 127,989 Real estate owned, held for sale 281,941 252,949 239,874 187,883 166,697 Other assets 304,309 300,175 315,772 379,413 412,238 Assets of consolidated VIEs 7,080,266 6,897,145 6,591,834 6,250,570 5,794,720 Assets held for sale 433,283 454,596 439,301 423,894 474,535 Total Assets $ 12,799,433 $ 12,441,217 $ 12,043,532 $ 11,774,333 $ 11,253,044 Liabilities Secured borrowings 2,175,345 2,102,075 2,198,272 2,311,969 2,184,280 Securitized debt obligations of consolidated VIEs, net 5,264,037 5,068,453 4,769,057 4,407,241 3,960,185 Senior secured notes and Corporate debt, net 1,108,512 1,110,035 1,111,654 1,184,311 1,206,159 Guaranteed loan financing 886,916 844,540 814,784 782,345 742,631 Contingent consideration 13,408 7,628 — 3,926 2,007 Derivative instruments — 212 593 2,638 2,085 Dividends payable 64,777 54,289 53,908 53,119 44,602 Loan participations sold 57,465 62,944 73,749 89,532 99,737 Due to third parties 2,436 3,641 3,401 1,995 1,239 Accounts payable and other accrued liabilities 233,196 207,481 193,896 204,766 279,014 Liabilities held for sale 293,561 333,157 315,975 332,265 392,697 Total Liabilities $ 10,099,653 $ 9,794,455 $ 9,535,289 $ 9,374,107 $ 8,914,636 Preferred stock Series C 8,361 8,361 8,361 8,361 8,361 Stockholders’ Equity Preferred stock 111,378 111,378 111,378 111,378 111,378 Common stock 17 17 17 17 17 Additional paid-in capital 2,318,109 2,321,989 2,307,303 2,287,684 2,292,229 Retained earnings (deficit) 168,539 124,413 (3,546) (92,319) (146,003) Accumulated other comprehensive loss (5,928) (17,860) (12,335) (13,880) (24,232) Total Ready Capital Corporation equity 2,592,115 2,539,937 2,402,817 2,292,880 2,233,389 Non-controlling interests 99,304 98,464 97,065 98,985 96,658 Total Stockholders’ Equity $ 2,691,419 $ 2,638,401 $ 2,499,882 $ 2,391,865 $ 2,330,047 Total Liabilities, Redeemable Preferred Stock, and Stockholders’ Equity $ 12,799,433 $ 12,441,217 $ 12,043,532 $ 11,774,333 $ 11,253,044 Adjusted Book Value per Share $ 14.42 $ 14.10 $ 13.44 $ 12.97 $ 12.59
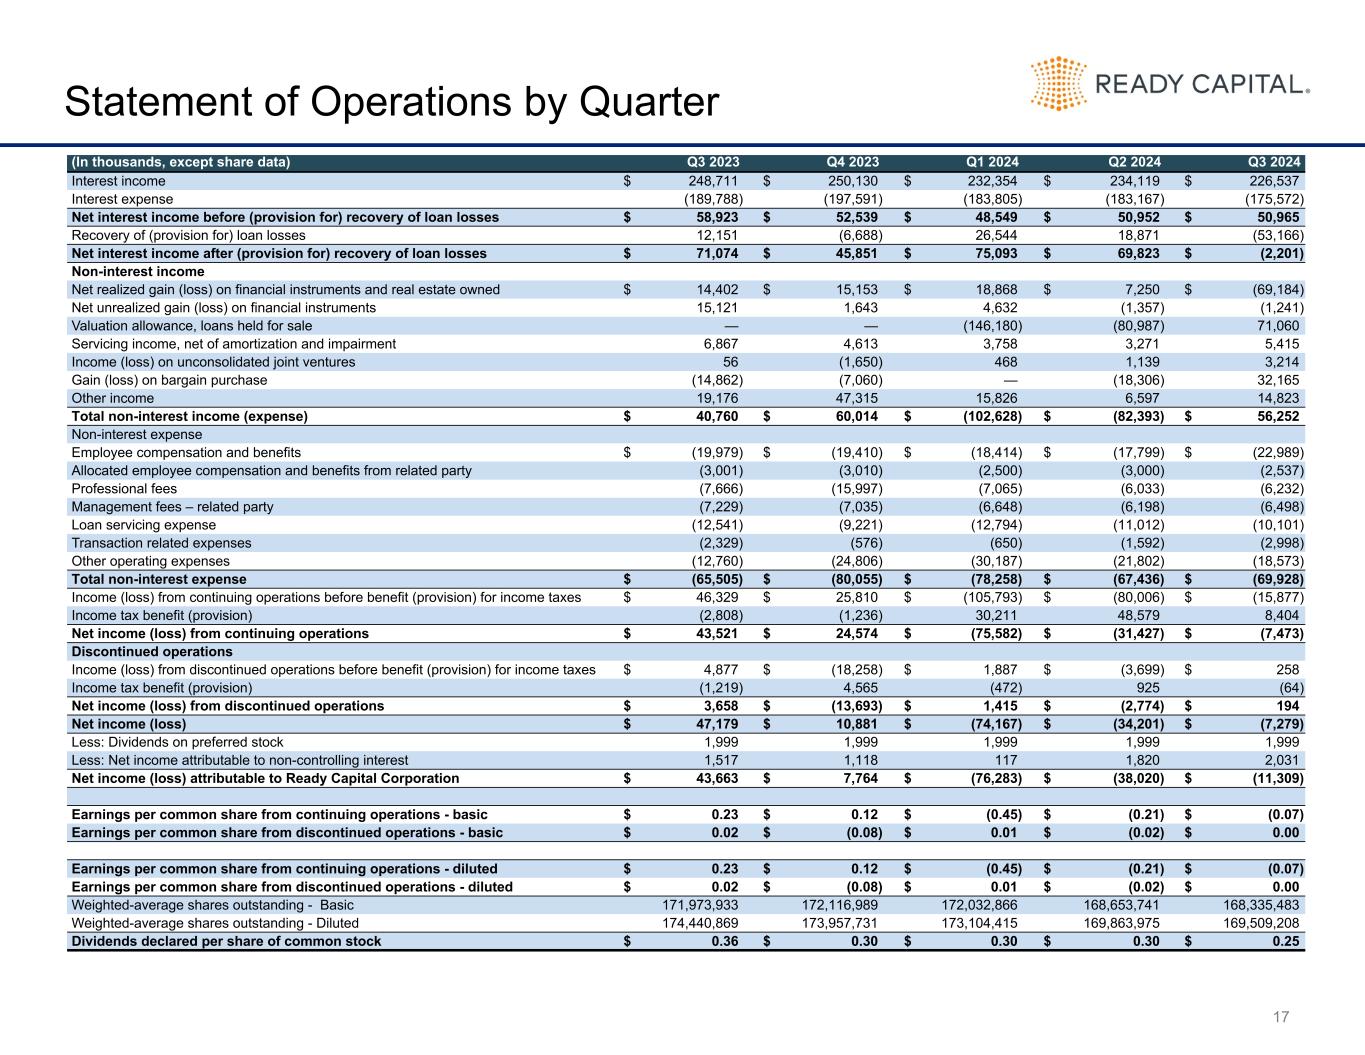
17 Statement of Operations by Quarter (In thousands, except share data) Q3 2023 Q4 2023 Q1 2024 Q2 2024 Q3 2024 Interest income $ 248,711 $ 250,130 $ 232,354 $ 234,119 $ 226,537 Interest expense (189,788) (197,591) (183,805) (183,167) (175,572) Net interest income before (provision for) recovery of loan losses $ 58,923 $ 52,539 $ 48,549 $ 50,952 $ 50,965 Recovery of (provision for) loan losses 12,151 (6,688) 26,544 18,871 (53,166) Net interest income after (provision for) recovery of loan losses $ 71,074 $ 45,851 $ 75,093 $ 69,823 $ (2,201) Non-interest income Net realized gain (loss) on financial instruments and real estate owned $ 14,402 $ 15,153 $ 18,868 $ 7,250 $ (69,184) Net unrealized gain (loss) on financial instruments 15,121 1,643 4,632 (1,357) (1,241) Valuation allowance, loans held for sale — — (146,180) (80,987) 71,060 Servicing income, net of amortization and impairment 6,867 4,613 3,758 3,271 5,415 Income (loss) on unconsolidated joint ventures 56 (1,650) 468 1,139 3,214 Gain (loss) on bargain purchase (14,862) (7,060) — (18,306) 32,165 Other income 19,176 47,315 15,826 6,597 14,823 Total non-interest income (expense) $ 40,760 $ 60,014 $ (102,628) $ (82,393) $ 56,252 Non-interest expense Employee compensation and benefits $ (19,979) $ (19,410) $ (18,414) $ (17,799) $ (22,989) Allocated employee compensation and benefits from related party (3,001) (3,010) (2,500) (3,000) (2,537) Professional fees (7,666) (15,997) (7,065) (6,033) (6,232) Management fees – related party (7,229) (7,035) (6,648) (6,198) (6,498) Loan servicing expense (12,541) (9,221) (12,794) (11,012) (10,101) Transaction related expenses (2,329) (576) (650) (1,592) (2,998) Other operating expenses (12,760) (24,806) (30,187) (21,802) (18,573) Total non-interest expense $ (65,505) $ (80,055) $ (78,258) $ (67,436) $ (69,928) Income (loss) from continuing operations before benefit (provision) for income taxes $ 46,329 $ 25,810 $ (105,793) $ (80,006) $ (15,877) Income tax benefit (provision) (2,808) (1,236) 30,211 48,579 8,404 Net income (loss) from continuing operations $ 43,521 $ 24,574 $ (75,582) $ (31,427) $ (7,473) Discontinued operations Income (loss) from discontinued operations before benefit (provision) for income taxes $ 4,877 $ (18,258) $ 1,887 $ (3,699) $ 258 Income tax benefit (provision) (1,219) 4,565 (472) 925 (64) Net income (loss) from discontinued operations $ 3,658 $ (13,693) $ 1,415 $ (2,774) $ 194 Net income (loss) $ 47,179 $ 10,881 $ (74,167) $ (34,201) $ (7,279) Less: Dividends on preferred stock 1,999 1,999 1,999 1,999 1,999 Less: Net income attributable to non-controlling interest 1,517 1,118 117 1,820 2,031 Net income (loss) attributable to Ready Capital Corporation $ 43,663 $ 7,764 $ (76,283) $ (38,020) $ (11,309) Earnings per common share from continuing operations - basic $ 0.23 $ 0.12 $ (0.45) $ (0.21) $ (0.07) Earnings per common share from discontinued operations - basic $ 0.02 $ (0.08) $ 0.01 $ (0.02) $ 0.00 Earnings per common share from continuing operations - diluted $ 0.23 $ 0.12 $ (0.45) $ (0.21) $ (0.07) Earnings per common share from discontinued operations - diluted $ 0.02 $ (0.08) $ 0.01 $ (0.02) $ 0.00 Weighted-average shares outstanding - Basic 171,973,933 172,116,989 172,032,866 168,653,741 168,335,483 Weighted-average shares outstanding - Diluted 174,440,869 173,957,731 173,104,415 169,863,975 169,509,208 Dividends declared per share of common stock $ 0.36 $ 0.30 $ 0.30 $ 0.30 $ 0.25

18 Distributable Earnings Reconciliation by Quarter The Company believes that this non-U.S. GAAP financial information, in addition to the related U.S. GAAP measures, provides investors greater transparency into the information used by management in its financial and operational decision- making, including the determination of dividends. However, because Distributable Earnings is an incomplete measure of the Company's financial performance and involves differences from net income computed in accordance with U.S. GAAP, it should be considered along with, but not as an alternative to, the Company's net income computed in accordance with U.S. GAAP as a measure of the Company's financial performance. In addition, because not all companies use identical calculations, the Company's presentation of Distributable Earnings may not be comparable to other similarly-titled measures of other companies. We calculate Distributable earnings as GAAP net income (loss) excluding the following: i) any unrealized gains or losses on certain MBS not retained by us as part of our loan origination businesses ii) any realized gains or losses on sales of certain MBS iii) any unrealized gains or losses on Residential MSRs from discontinued operations iv) any unrealized change in current expected credit loss reserve and valuation allowances v) any unrealized gains or losses on de-designated cash flow hedges vi) any unrealized gains or losses on foreign exchange hedges vii) any unrealized gains or losses on certain unconsolidated joint ventures viii) any non-cash compensation expense related to stock-based incentive plan ix) one-time non-recurring gains or losses, such as gains or losses on discontinued operations, bargain purchase gains, or merger related expenses In calculating Distributable Earnings, Net Income (in accordance with U.S. GAAP) is adjusted to exclude unrealized gains and losses on MBS acquired by the Company in the secondary market but is not adjusted to exclude unrealized gains and losses on MBS retained by Ready Capital as part of its loan origination businesses, where the Company transfers originated loans into an MBS securitization and the Company retains an interest in the securitization. In calculating Distributable Earnings, the Company does not adjust Net Income (in accordance with U.S. GAAP) to take into account unrealized gains and losses on MBS retained by us as part of the loan origination businesses because the unrealized gains and losses that are generated in the loan origination and securitization process are considered to be a fundamental part of this business and an indicator of the ongoing performance and credit quality of the Company’s historical loan originations. In calculating Distributable Earnings, Net Income (in accordance with U.S. GAAP) is adjusted to exclude realized gains and losses on certain MBS securities considered to be non-distributable. Certain MBS positions are considered to be non-distributable due to a variety of reasons which may include collateral type, duration, and size. In addition, in calculating Distributable Earnings, Net Income (in accordance with U.S. GAAP) is adjusted to exclude unrealized gains or losses on residential MSRs, held at fair value from discontinued operations. In calculating Distributable Earnings, the Company does not exclude realized gains or losses on either commercial MSRs as servicing income is a fundamental part of Ready Capital’s business and is an indicator of the ongoing performance. To qualify as a REIT, the Company must distribute to its stockholders each calendar year at least 90% of its REIT taxable income (including certain items of non-cash income), determined without regard to the deduction for dividends paid and excluding net capital gain. There are certain items, including net income generated from the creation of MSRs, that are included in distributable earnings but are not included in the calculation of the current year’s taxable income. These differences may result in certain items that are recognized in the current period’s calculation of distributable earnings not being included in taxable income, and thus not subject to the REIT dividend distribution requirement until future years. (In thousands, except share data) Q3 2023 Q4 2023 Q1 2024 Q2 2024 Q3 2024 Net Income (loss) $ 47,179 $ 10,881 $ (74,167) $ (34,201) $ (7,279) Reconciling items: Unrealized (gain) loss on MSR - discontinued operations $ (2,563) $ 20,715 $ — $ 7,219 $ — Unrealized (gain) loss on joint ventures — 2,214 (35) (626) 2,173 Unrealized loss on foreign exchange hedges — 1,582 — — — Increase (decrease) in CECL reserve (12,151) 3,195 (32,181) (24,574) 52,442 Increase (decrease) in valuation allowance — — 146,180 80,987 (71,060) Non-recurring REO impairment — — 15,512 8,474 525 Non-cash compensation 2,275 1,360 1,877 1,891 1,916 Merger transaction costs and other non-recurring expenses 2,536 7,361 1,931 4,852 4,070 Bargain purchase (gain) loss 14,862 7,060 — 18,306 (32,165) Realized losses on sale of investments — — — 22,355 109,675 Total reconciling items $ 4,959 $ 43,397 $ 133,284 $ 118,884 $ 67,576 Income tax adjustments 26 $ (5,754) $ (5,141) $ (47,799) $ (13,739) Distributable earnings before realized losses $ 52,164 $ 48,524 $ 53,976 $ 36,884 $ 46,558 Realized losses on sale of investments, net of tax — — — (20,253) (89,072) Distributable earnings $ 52,164 $ 48,524 $ 53,976 $ 16,631 $ (42,514) Less: Distributable earnings attributable to non-controlling interests $ 1,566 $ 1,358 $ 1,108 $ 2,206 $ 1,766 Less: Income attributable to participating shares 335 207 336 302 242 Less: Dividends on preferred stock 1,999 1,999 1,999 1,999 1,999 Distributable earnings attributable to Common Stockholders $ 48,264 $ 44,960 $ 50,533 $ 12,124 $ (46,521) Distributable earnings before realized losses on investments, net of tax per common share - basic $ 0.28 $ 0.26 $ 0.29 $ 0.19 $ 0.25 DIstributable earnings per common share - basic $ 0.28 $ 0.26 $ 0.29 $ 0.07 $ (0.28) Weighted average common shares outstanding 171,973,933 172,116,989 172,032,866 168,653,741 168,335,483


