Document
NOBLE CORPORATION PLC ANNOUNCES THIRD QUARTER 2024 RESULTS AND ADDITIONAL SHARE REPURCHASE AUTHORIZATION
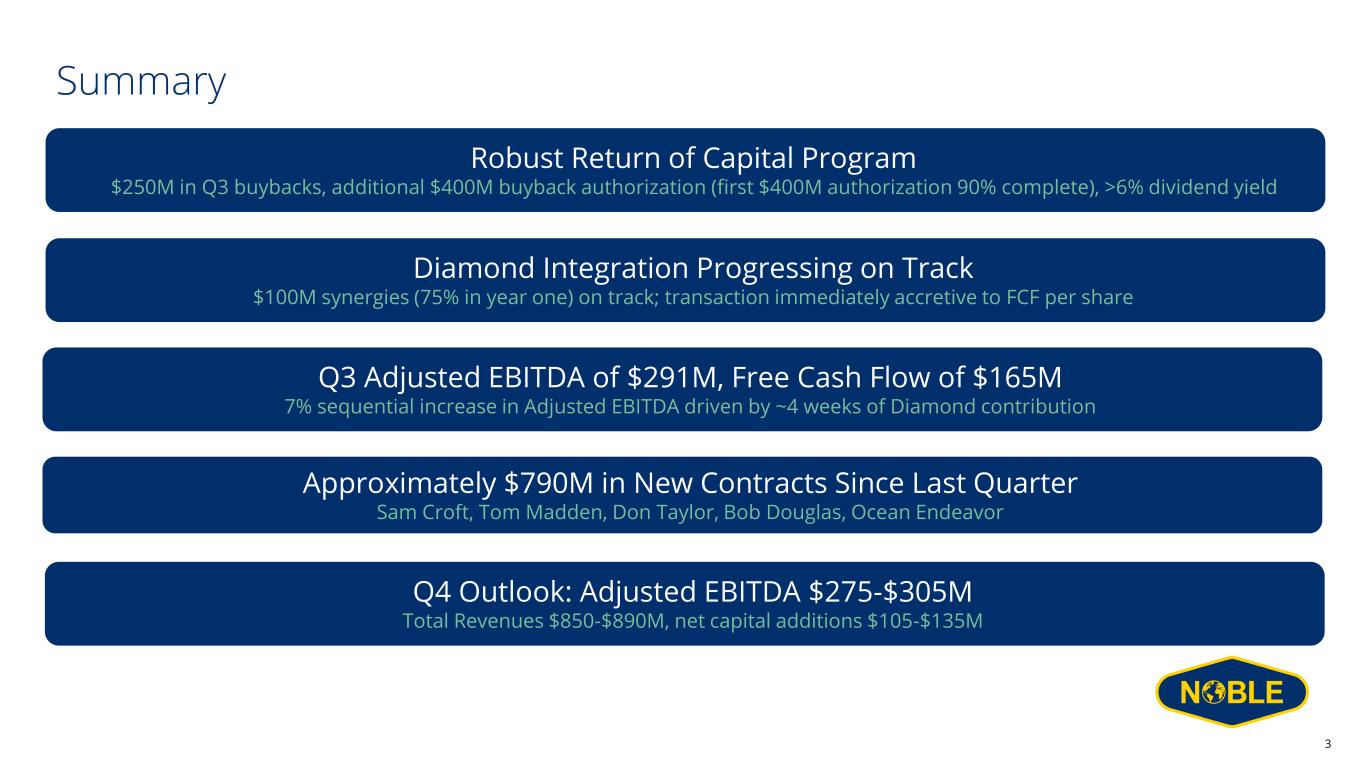
•Closed Diamond acquisition on September 4th
•Increased capital return program with additional share repurchase authorization of $400 million
•Repurchased 6.9 million of shares in Q3 2024, $0.50 per share dividend declared for Q4 2024, bringing total FY 2024 cash returns to shareholders to over $525 million, including Q4 dividend
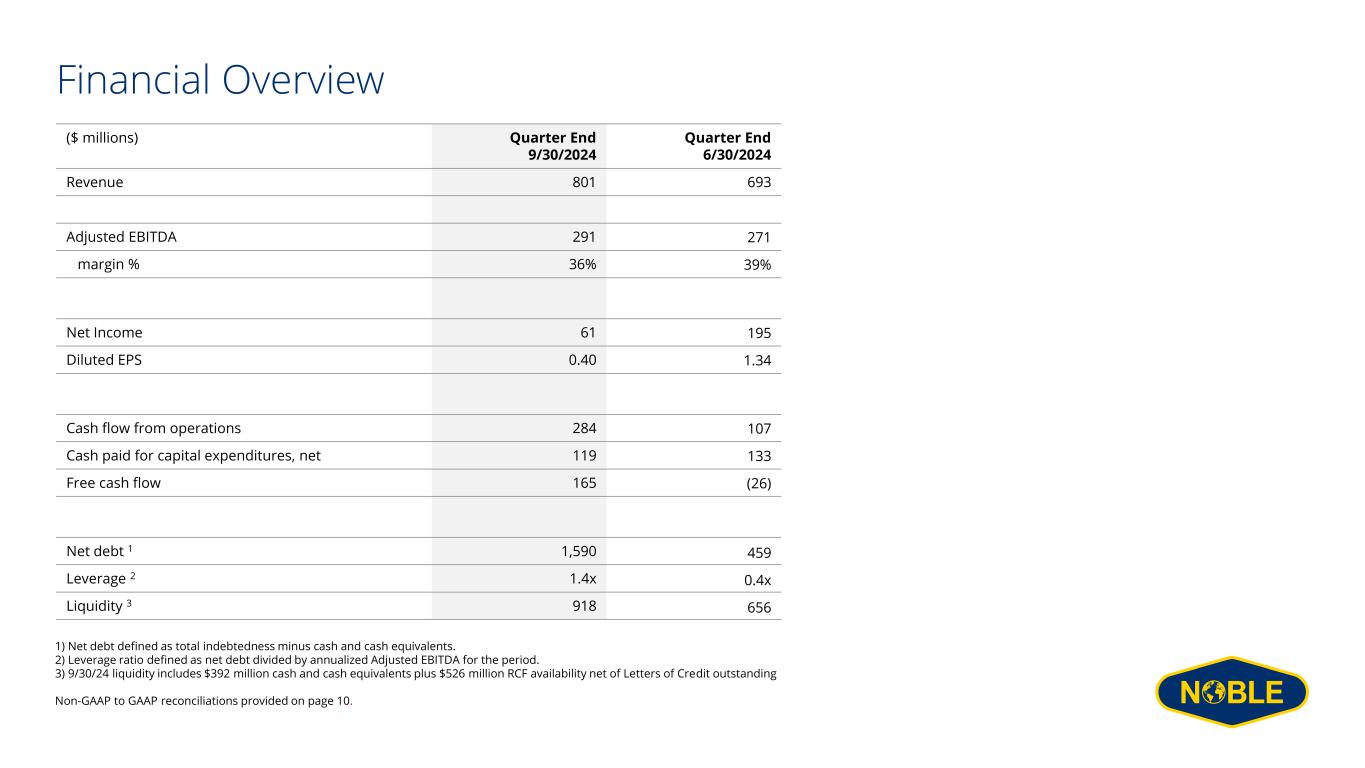
•Q3 Net Income of $61 million, Diluted Earnings Per Share of $0.40, Adjusted EBITDA of $291 million, net cash provided by operating activities of $284 million, and Free Cash Flow of $165 million
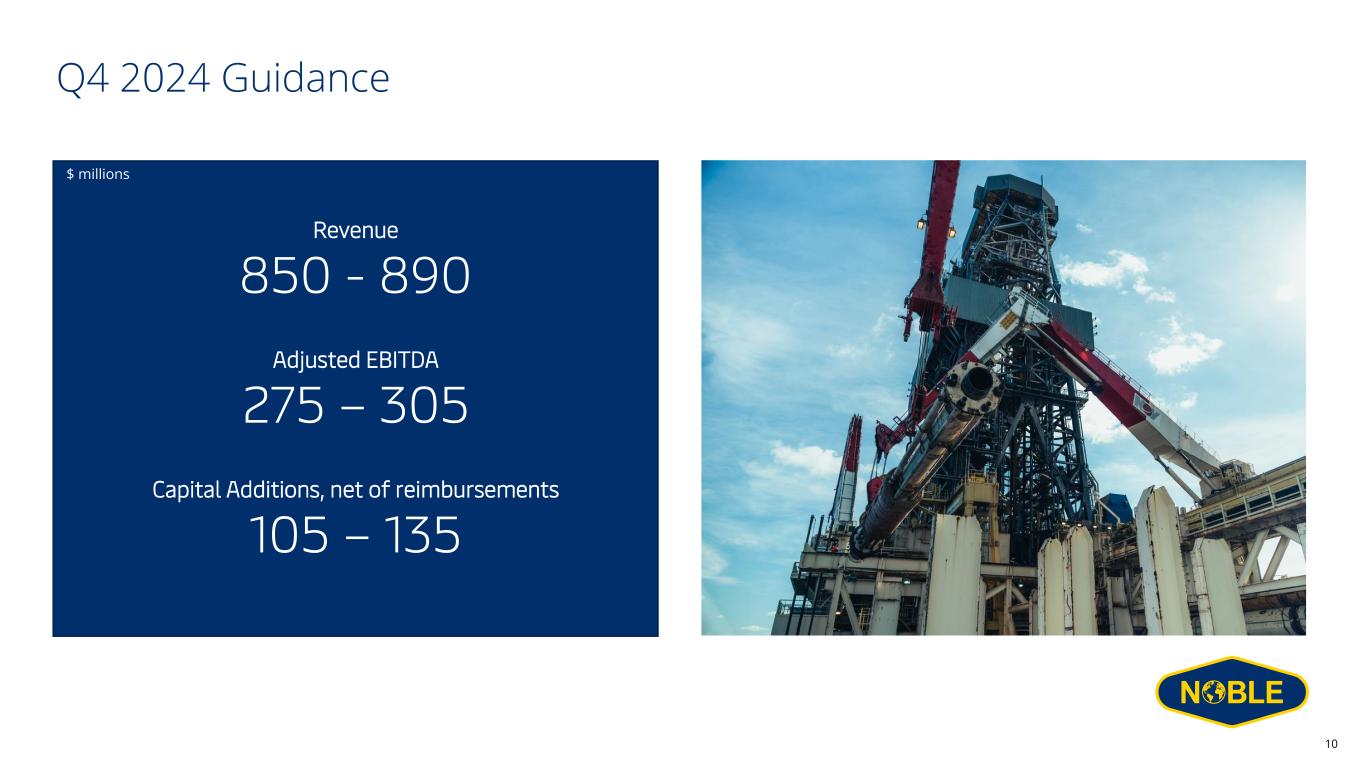
•Q4 2024 Guidance provided as follows: Total Revenue $850 to $890 million, Adjusted EBITDA $275 to $305 million, Capital Additions (net of reimbursements) $105 to $135 million
SUGAR LAND, TEXAS, November 5, 2024 - Noble Corporation plc (NYSE: NE, CSE: NOBLE, “Noble” or the “Company”) today reported third quarter 2024 results.
|
|
|
|
|
|
|
|
|
|
|
|
|
|
|
|
|
|
|
|
|
|
|
Three Months Ended |
| (in millions, except per share amounts) |
|
September 30, 2024 |
|
September 30, 2023 |
|
June 30,
2024 |
| Total Revenue |
|
$ |
801 |
|
|
$ |
697 |
|
|
$ |
693 |
|
| Contract Drilling Services Revenue |
|
764 |
|
|
671 |
|
|
661 |
|
| Net Income (Loss) |
|
61 |
|
|
158 |
|
|
195 |
|
| Adjusted EBITDA* |
|
291 |
|
|
283 |
|
|
271 |
|
| Adjusted Net Income (Loss)* |
|
89 |
|
|
127 |
|
|
105 |
|
| Basic Earnings (Loss) Per Share |
|
0.41 |
|
|
1.14 |
|
|
1.37 |
|
| Diluted Earnings (Loss) Per Share |
|
0.40 |
|
|
1.09 |
|
|
1.34 |
|
| Adjusted Diluted Earnings (Loss) Per Share* |
|
0.58 |
|
|
0.87 |
|
|
0.72 |
|
|
|
|
|
|
|
|
| * A Non-GAAP supporting schedule is included with the statements and schedules in this press release. |
Robert W. Eifler, President and Chief Executive Officer of Noble Corporation plc, stated “We are excited to have closed on the Diamond acquisition during the third quarter, enabling us to start capturing the value from the transaction earlier than expected. Our strategy of pursuing rational and accretive growth in the high-end deepwater segment toward an ultimate objective of maximizing cash returns to shareholders is yielding tangible results, as evidenced by robust third quarter free cash flow and a sector leading dividend and buyback program. Despite a more muted near-term demand environment than we had envisioned coming into this year, Noble is uniquely well positioned to deliver customer and shareholder value through various market conditions.”
Third Quarter Results
Contract drilling services revenue for the third quarter of 2024 totaled $764 million compared to $661 million in the second quarter of 2024, with the sequential increase driven primarily by an approximate four weeks of contribution from the legacy Diamond fleet. Marketed fleet utilization was 82% in the three months ended September 30, 2024, compared to 78% in the previous quarter.
Contract drilling services costs for the third quarter of 2024 were $434 million, up from $336 million for the second quarter of 2024, with the sequential increase driven by the legacy Diamond fleet and partially offset by lower contract preparation and mobilization expenses. Net income decreased to $61 million in the third quarter of 2024, down from $195 million in the second quarter of 2024, and Adjusted EBITDA increased to $291 million in the third quarter of 2024, up from $271 million in the second quarter of 2024. Net cash provided by operating activities in the third quarter of 2024 was $284 million, net capital expenditures were $119 million, and free cash flow (non-GAAP) was $165 million.
Balance Sheet, Capital Allocation, and Increased Shareholder Return Authorization
The Company's balance sheet as of September 30, 2024, reflected total debt principal value of approximately $2.0 billion and cash (and cash equivalents) of $392 million.
The Company repurchased approximately 6.9 million shares in the third quarter for $250 million, bringing total repurchases executed under the original $400 million program to $360 million. On October 22, 2024, Noble’s Board of Directors authorized an increased share repurchase authorization of up to an additional $400 million, subject to any applicable shareholder approval limits. This authorization does not have a fixed expiration, and may be modified, suspended or discontinued at any time. The program does not obligate the Company to acquire any particular amount of shares.
On November 5, 2024, Noble’s Board of Directors approved an interim quarterly cash dividend on our ordinary shares of $0.50 per share for the fourth quarter of 2024. The $0.50 dividend is expected to be paid on December 19, 2024, to shareholders of record at close of business on December 5, 2024. The Company intends to continue to pay dividends on a quarterly basis, and the fourth quarter dividend represents $2.00 on an annualized basis. Future quarterly dividends and other shareholder returns will be subject to, amongst other things, approval by the Board of Directors and may be modified as market conditions dictate.
Operating Highlights and Backlog
Noble's marketed fleet of twenty-five floaters was 81% contracted during the third quarter (including nine marketed floaters from the legacy Diamond fleet on a partial quarter basis from September 4, 2024), compared with 78% in the prior quarter. Industry leading edge dayrates for tier-1 drillships remain in the mid $400,000s to low $500,000s per day range. Contract fixtures for lower specification floaters have been limited in 2024, and are expected to reflect a softer utilization environment throughout 2025 due to continuing white space risk that is impacting all floater segments.
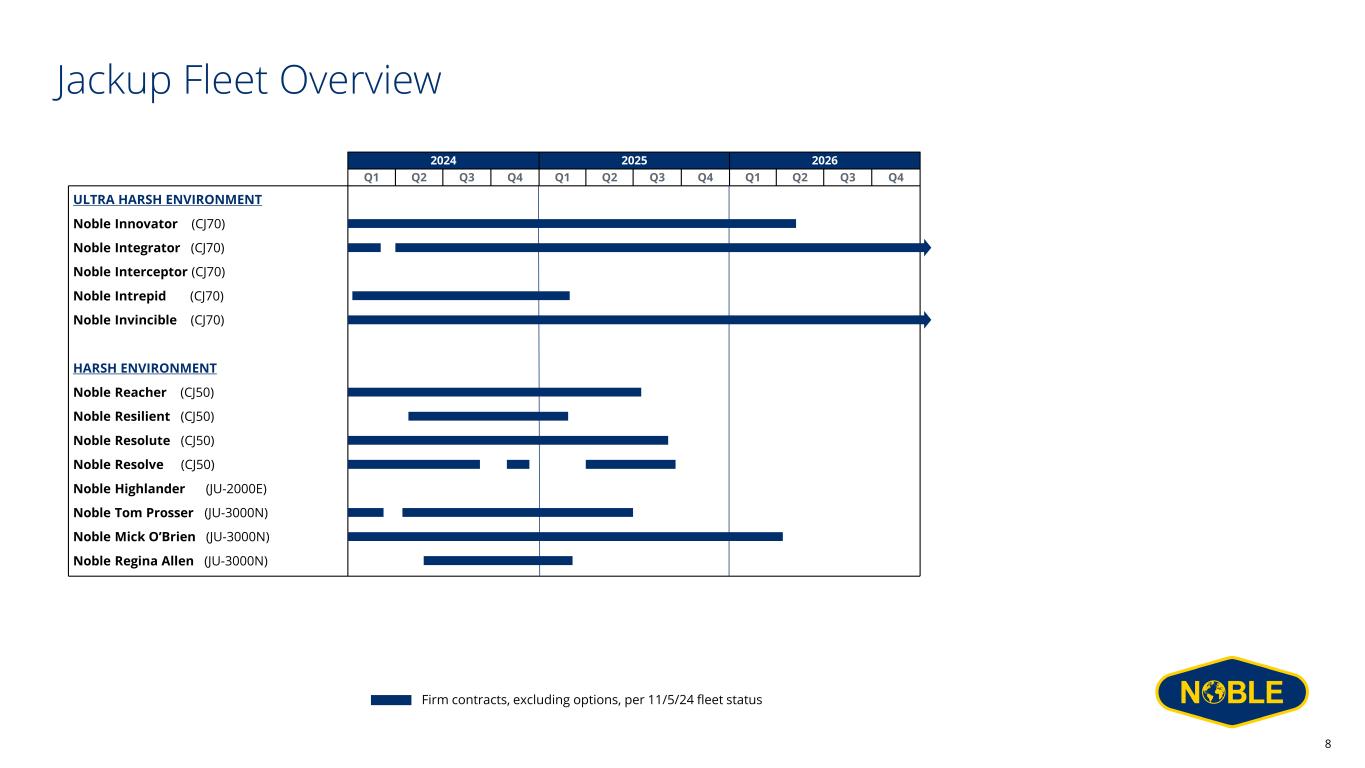
Utilization of Noble's thirteen marketed jackups improved to 83% in the third quarter, compared with 77% in the prior quarter. Leading edge harsh environment jackup dayrates remain in the mid $200,000s per day in Norway and $130,000 to $150,000 per day in the rest of the North Sea. The Northern Europe jackup market continues to indicate potential for a slight demand improvement in Norway for 2025, while policy and permitting factors present potential headwinds for the Southern North Sea.
Subsequent to last quarter’s earnings press release, ExxonMobil Guyana awarded an additional 4.8 years of backlog under the Commercial Enabling Agreement (CEA), intended to extend the contract duration for each of our four drillships operating under the CEA from Q2 2027 to Q3 2028. Additionally, the Ocean Endeavor has been awarded an additional 130 days with Shell in the UK North Sea.
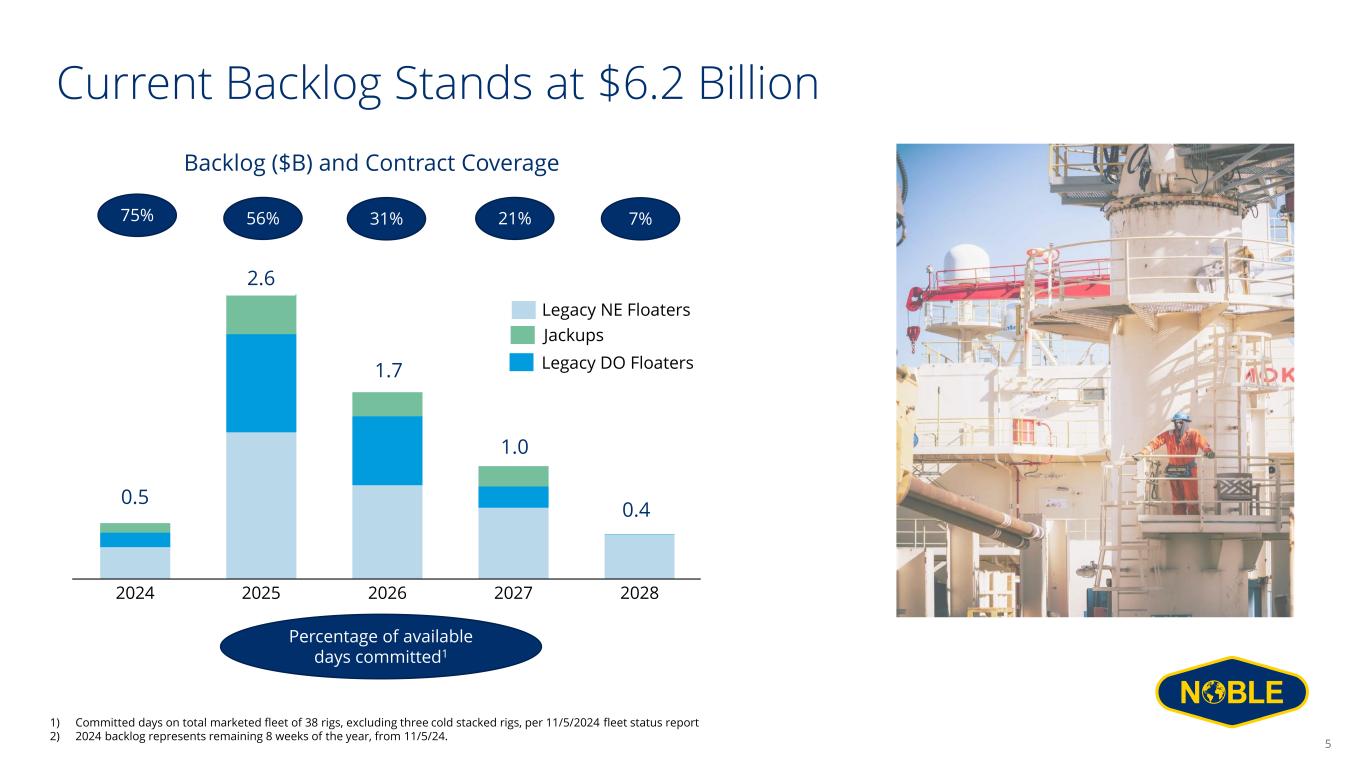
Noble’s current backlog as of November 5, 2024, stands at $6.2 billion.
Outlook
For the fourth quarter of 2024, Noble is providing guidance as follows: Total revenue in the range of $850 to $890 million; Adjusted EBITDA in the range of $275 to $305 million, and capital additions (net of reimbursements) in the range of $105 to $135 million.
Commenting on Noble’s outlook, Mr. Eifler stated, “We remain encouraged by the high level of tangible contract opportunities in our commercial pipeline which is expected to drive a backlog inflection sometime next year. In the meantime, Noble is poised to generate robust cash flow amid sub-optimal utilization over the near term. We remain committed to returning essentially all free cash flow to shareholders and are pleased to announce a second $400 million share repurchase authorization.”
Due to the forward-looking nature of Adjusted EBITDA, management cannot reliably predict certain of the necessary components of the most directly comparable forward-looking GAAP measure. Accordingly, the Company is unable to present a quantitative reconciliation of such forward-looking non-GAAP financial measure to the most directly comparable forward-looking GAAP financial measure without unreasonable effort. The unavailable information could have a significant effect on Noble's fourth quarter 2024 GAAP financial results.
Conference Call
Noble will host a conference call related to its third quarter 2024 results on Wednesday, November 6th, 2024, at 8:00 a.m. U.S. Central Time. Interested parties may dial +1 800-715-9871 and refer to conference ID 31391 approximately 15 minutes prior to the scheduled start time. Additionally, a live webcast link will be available on the Investor Relations section of the Company’s website. A webcast replay will be accessible for a limited time following the call.
For additional information, visit www.noblecorp.com or email investors@noblecorp.com.
Contact Noble Corporation plc
Ian Macpherson
Vice President - Investor Relations
+1 713-239-6019
imacpherson@noblecorp.com
About Noble Corporation plc
Noble is a leading offshore drilling contractor for the oil and gas industry. The Company owns and operates one of the most modern, versatile, and technically advanced fleets in the offshore drilling industry. Noble and its predecessors have been engaged in the contract drilling of oil and gas wells since 1921. Noble performs, through its subsidiaries, contract drilling services with a fleet of offshore drilling units focused largely on ultra-deepwater and high specification jackup drilling opportunities in both established and emerging regions worldwide. Additional information on Noble is available at www.noblecorp.com.
Dividend Details and Return of Capital Disclaimers
Dividends payable to Noble shareholders will generally be paid in U.S. dollars (USD). However, holders of shares in the form of share entitlements admitted to trading on NASDAQ Copenhagen will receive an equivalent dividend payment in Danish krone (DKK) as determined by the exchange rate on a specified date. The holders of such share entitlements bear the risk of fluctuations in USD and DKK exchange rates.
On October 22, 2024, the Board of Directors approved a share repurchase program of up to $400 million commencing immediately after completion of the prior $400 million share repurchase. All shares purchased under the share repurchase programs are cancelled. The share repurchase programs take place within the limitations of the general authority previously granted by shareholders, or any authorization to be granted at a future general meeting of the Company. As of today, the repurchase programs do not have fixed expirations, and may be modified, suspended or discontinued at any time. The programs do not obligate the Company to acquire any particular amount of shares.
Forward-looking Statements
This communication includes “forward-looking statements” within the meaning of Section 27A of the Securities Act and Section 21E of the Exchange Act, as amended. All statements other than statements of historical facts included in this communication are forward looking statements, including those regarding future guidance, including revenue, adjusted EBITDA, the offshore drilling market and demand fundamentals, realization and timing of integration synergies, costs, the benefits or results of acquisitions or dispositions such as the acquisition of Diamond Offshore Drilling, Inc. (the “Diamond Transaction”), free cash flow expectations, capital expenditures, capital additions, capital allocation expectations, including planned dividends and share repurchases, contract backlog, rig demand, expected future contracts, anticipated contract start dates, major project schedules, dayrates and duration, any asset sales, access to capital, fleet condition and utilization, timing and amount of insurance recoveries and 2024 financial guidance. Forward-looking statements involve risks, uncertainties and assumptions, and actual results may differ materially from any future results expressed or implied by such forward-looking statements. When used in this communication, or in the documents incorporated by reference, the words “guidance,” “anticipate,” “believe,” “continue,” “could,” “estimate,” “expect,” “intend,” “may,” “might,” “on track,” “plan,” “possible,” “potential,” “predict,” “project,” “should,” “would,” “achieve,” “shall,” “target,” “will” and similar expressions are intended to be among the statements that identify forward-looking statements. Although we believe that the expectations reflected in such forward-looking statements are reasonable, we cannot assure you that such expectations will prove to be correct. These forward-looking statements speak only as of the date of this communication and we undertake no obligation to revise or update any forward-looking statement for any reason, except as required by law. Risks and uncertainties include, but are not limited to, those detailed in Noble’s most recent Annual Report on Form 10-K, Quarterly Reports Form 10-Q and other filings with the U.S. Securities and Exchange Commission, including, but not limited to, risks related to the recently completed Diamond Transaction, including the risk that the benefits of the transaction may not be fully realized or may take longer to realize than expected. We cannot control such risk factors and other uncertainties, and in many cases, we cannot predict the risks and uncertainties that could cause our actual results to differ materially from those indicated by the forward-looking statements.
You should consider these risks and uncertainties when you are evaluating us. With respect to our capital allocation policy, distributions to shareholders in the form of either dividends or share buybacks are subject to the Board of Directors’ assessment of factors such as business development, growth strategy, current leverage and financing needs. There can be no assurance that a dividend or buyback program will be declared or continued.
NOBLE CORPORATION plc AND SUBSIDIARIES
CONDENSED CONSOLIDATED STATEMENTS OF OPERATIONS
(In thousands, except per share amounts)
|
|
|
|
|
|
|
|
|
|
|
|
|
|
|
|
|
|
|
|
|
|
|
|
|
|
|
|
|
Three Months Ended September 30, |
|
Nine Months Ended September 30, |
|
|
2024 |
|
2023 |
|
2024 |
|
2023 |
| Operating revenues |
|
|
|
|
|
|
|
|
| Contract drilling services |
|
$ |
763,543 |
|
|
$ |
671,004 |
|
|
$ |
2,036,678 |
|
|
$ |
1,852,474 |
|
| Reimbursables and other |
|
37,006 |
|
|
26,446 |
|
|
93,799 |
|
|
93,565 |
|
|
|
800,549 |
|
|
697,450 |
|
|
2,130,477 |
|
|
1,946,039 |
|
| Operating costs and expenses |
|
|
|
|
|
|
|
|
| Contract drilling services |
|
434,192 |
|
|
354,199 |
|
|
1,159,913 |
|
|
1,078,521 |
|
| Reimbursables |
|
28,185 |
|
|
16,682 |
|
|
69,196 |
|
|
67,484 |
|
| Depreciation and amortization |
|
109,879 |
|
|
77,146 |
|
|
287,347 |
|
|
218,412 |
|
| General and administrative |
|
43,596 |
|
|
33,039 |
|
|
109,226 |
|
|
95,428 |
|
| Merger and integration costs |
|
69,214 |
|
|
12,966 |
|
|
89,163 |
|
|
47,049 |
|
(Gain) loss on sale of operating assets, net |
|
— |
|
|
— |
|
|
(17,357) |
|
|
— |
|
| Hurricane losses and (recoveries), net |
|
— |
|
|
2,642 |
|
|
— |
|
|
22,120 |
|
|
|
685,066 |
|
|
496,674 |
|
|
1,697,488 |
|
|
1,529,014 |
|
| Operating income (loss) |
|
115,483 |
|
|
200,776 |
|
|
432,989 |
|
|
417,025 |
|
| Other income (expense) |
|
|
|
|
|
|
|
|
| Interest expense, net of amounts capitalized |
|
(24,951) |
|
|
(13,005) |
|
|
(54,491) |
|
|
(44,539) |
|
| Gain on bargain purchase |
|
— |
|
|
5,005 |
|
|
— |
|
|
5,005 |
|
| Gain (loss) on extinguishment of debt, net |
|
— |
|
|
— |
|
|
— |
|
|
(26,397) |
|
| Interest income and other, net |
|
2,292 |
|
|
17,206 |
|
|
(10,626) |
|
|
16,292 |
|
| Income (loss) before income taxes |
|
92,824 |
|
|
209,982 |
|
|
367,872 |
|
|
367,386 |
|
| Income tax benefit (provision) |
|
(31,608) |
|
|
(51,659) |
|
|
(16,167) |
|
|
(35,184) |
|
| Net income (loss) |
|
$ |
61,216 |
|
|
$ |
158,323 |
|
|
$ |
351,705 |
|
|
$ |
332,202 |
|
| Per share data |
|
|
|
|
|
|
|
|
| Basic: |
|
|
|
|
|
|
|
|
| Net income (loss) |
|
$ |
0.41 |
|
|
$ |
1.14 |
|
|
$ |
2.43 |
|
|
$ |
2.42 |
|
| Diluted: |
|
|
|
|
|
|
|
|
| Net income (loss) |
|
$ |
0.40 |
|
|
$ |
1.09 |
|
|
$ |
2.37 |
|
|
$ |
2.29 |
|
NOBLE CORPORATION plc AND SUBSIDIARIES
CONDENSED CONSOLIDATED BALANCE SHEETS
(In thousands)
(Unaudited)
|
|
|
|
|
|
|
|
|
|
|
|
|
|
|
|
|
September 30, 2024 |
|
December 31, 2023 |
| ASSETS |
|
|
|
|
| Current assets |
|
|
|
|
| Cash and cash equivalents |
|
$ |
391,858 |
|
|
$ |
360,794 |
|
| Accounts receivable, net |
|
752,270 |
|
|
548,844 |
|
| Prepaid expenses and other current assets |
|
266,563 |
|
|
152,110 |
|
| Total current assets |
|
1,410,691 |
|
|
1,061,748 |
|
| Intangible assets |
|
1,580 |
|
|
10,128 |
|
| Property and equipment, at cost |
|
6,795,699 |
|
|
4,591,936 |
|
| Accumulated depreciation |
|
(746,262) |
|
|
(467,600) |
|
| Property and equipment, net |
|
6,049,437 |
|
|
4,124,336 |
|
|
|
|
|
|
| Other assets |
|
573,436 |
|
|
311,225 |
|
| Total assets |
|
$ |
8,035,144 |
|
|
$ |
5,507,437 |
|
| LIABILITIES AND EQUITY |
|
|
|
|
| Current liabilities |
|
|
|
|
|
|
|
|
|
| Accounts payable |
|
$ |
405,907 |
|
|
$ |
395,165 |
|
| Accrued payroll and related costs |
|
119,665 |
|
|
97,313 |
|
| Other current liabilities |
|
374,893 |
|
|
149,202 |
|
| Total current liabilities |
|
900,465 |
|
|
641,680 |
|
| Long-term debt |
|
1,981,237 |
|
|
586,203 |
|
| Other liabilities |
|
445,096 |
|
|
307,451 |
|
| Noncurrent contract liabilities |
|
23,397 |
|
|
50,863 |
|
| Total liabilities |
|
3,350,195 |
|
|
1,586,197 |
|
| Commitments and contingencies |
|
|
|
|
| Total shareholders’ equity |
|
4,684,949 |
|
|
3,921,240 |
|
| Total liabilities and equity |
|
$ |
8,035,144 |
|
|
$ |
5,507,437 |
|
NOBLE CORPORATION plc AND SUBSIDIARIES
CONDENSED CONSOLIDATED STATEMENTS OF CASH FLOWS
(In thousands)
(Unaudited)
|
|
|
|
|
|
|
|
|
|
|
|
|
|
|
|
|
Nine Months Ended September 30, |
|
|
2024 |
|
2023 |
| Cash flows from operating activities |
|
|
|
|
| Net income (loss) |
|
$ |
351,705 |
|
|
$ |
332,202 |
|
| Adjustments to reconcile net income (loss) to net cash flow from operating activities: |
|
|
|
|
| Depreciation and amortization |
|
287,347 |
|
|
218,412 |
|
| Amortization of intangible assets and contract liabilities, net |
|
(46,580) |
|
|
(95,540) |
|
Gain on bargain purchase |
|
— |
|
|
(5,005) |
|
| (Gain) loss on extinguishment of debt, net |
|
— |
|
|
26,397 |
|
| (Gain) loss on sale of operating assets, net |
|
(17,357) |
|
|
— |
|
Changes in components of working capital and other operating activities |
|
(55,854) |
|
|
(189,618) |
|
| Net cash provided by (used in) operating activities |
|
519,261 |
|
|
286,848 |
|
| Cash flows from investing activities |
|
|
|
|
| Capital expenditures |
|
(434,653) |
|
|
(268,131) |
|
Proceeds from insurance claims |
|
16,426 |
|
|
— |
|
| Cash paid in stock-based business combination, net |
|
(400,458) |
|
|
— |
|
| Proceeds from disposal of assets, net |
|
4,885 |
|
|
— |
|
| Net cash provided by (used in) investing activities |
|
(813,800) |
|
|
(268,131) |
|
| Cash flows from financing activities |
|
|
|
|
| Issuance of debt |
|
824,000 |
|
|
600,000 |
|
| Borrowings on credit facilities |
|
35,000 |
|
|
— |
|
| Repayments of credit facilities |
|
(35,000) |
|
|
— |
|
| Repayments of debt |
|
— |
|
|
(673,411) |
|
| Debt extinguishment costs |
|
— |
|
|
(25,697) |
|
| Debt issuance costs |
|
(10,002) |
|
|
(24,914) |
|
| Warrants exercised |
|
628 |
|
|
156 |
|
| Share repurchases |
|
(250,000) |
|
|
(80,000) |
|
| Dividend payments |
|
(198,150) |
|
|
(42,369) |
|
| Taxes withheld on employee stock transactions |
|
(57,167) |
|
|
(8,612) |
|
| Other |
|
22,578 |
|
|
— |
|
| Net cash provided by (used in) financing activities |
|
331,887 |
|
|
(254,847) |
|
| Net increase (decrease) in cash, cash equivalents and restricted cash |
|
37,348 |
|
|
(236,130) |
|
| Cash, cash equivalents and restricted cash, beginning of period |
|
367,745 |
|
|
485,707 |
|
| Cash, cash equivalents and restricted cash, end of period |
|
$ |
405,093 |
|
|
$ |
249,577 |
|
NOBLE CORPORATION plc AND SUBSIDIARIES
OPERATIONAL INFORMATION
(Unaudited)
|
|
|
|
|
|
|
|
|
|
|
|
|
|
|
|
|
|
|
Average Rig Utilization (1) |
|
Three Months Ended |
|
Three Months Ended |
|
Three Months Ended |
|
September 30, 2024 |
|
June 30, 2024 |
|
September 30, 2023 |
| Floaters |
72 |
% |
|
70 |
% |
|
77 |
% |
| Jackups |
83 |
% |
|
77 |
% |
|
64 |
% |
| Total |
76 |
% |
|
73 |
% |
|
72 |
% |
|
|
|
|
|
|
|
|
|
|
|
|
|
Operating Days |
|
Three Months Ended |
|
Three Months Ended |
|
Three Months Ended |
|
September 30, 2024 |
|
June 30, 2024 |
|
September 30, 2023 |
| Floaters |
1,418 |
|
|
1,138 |
|
|
1,348 |
|
| Jackups |
991 |
|
|
914 |
|
|
824 |
|
| Total |
2,409 |
|
|
2,052 |
|
|
2,172 |
|
|
|
|
|
|
|
|
|
|
|
|
|
|
Average Dayrates |
|
Three Months Ended |
|
Three Months Ended |
|
Three Months Ended |
|
September 30, 2024 |
|
June 30, 2024 |
|
September 30, 2023 |
| Floaters |
$ |
424,199 |
|
|
$ |
435,677 |
|
|
$ |
403,813 |
|
| Jackups |
159,444 |
|
|
155,585 |
|
|
140,775 |
|
| Total |
$ |
315,295 |
|
|
$ |
310,962 |
|
|
$ |
304,040 |
|
(1) Average Rig Utilization statistics include all marketed and cold stacked rigs.
NOBLE CORPORATION plc AND SUBSIDIARIES
CALCULATION OF BASIC AND DILUTED NET INCOME/(LOSS) PER SHARE
(In thousands, except per share amounts)
(Unaudited)
The following tables presents the computation of basic and diluted income (loss) per share:
|
|
|
|
|
|
|
|
|
|
|
|
|
|
|
|
|
|
|
|
|
|
|
|
|
|
|
|
|
Three Months Ended
September 30, |
|
Nine Months Ended
September 30, |
|
|
2024 |
|
2023 |
|
2024 |
|
2023 |
| Numerator: |
|
|
|
|
|
|
|
|
|
|
|
|
|
|
|
|
|
| Net income (loss) |
|
$ |
61,216 |
|
|
$ |
158,323 |
|
|
$ |
351,705 |
|
|
$ |
332,202 |
|
|
|
|
|
|
|
|
|
|
|
|
|
|
|
|
|
|
|
| Denominator: |
|
|
|
|
|
|
|
|
| Weighted average shares outstanding - basic |
|
149,727 |
|
|
139,400 |
|
|
144,863 |
|
|
137,478 |
|
| Dilutive effect of share-based awards |
|
1,877 |
|
|
3,204 |
|
|
1,877 |
|
|
3,204 |
|
| Dilutive effect of warrants |
|
1,334 |
|
|
3,117 |
|
|
1,502 |
|
|
4,339 |
|
| Weighted average shares outstanding - diluted |
|
152,938 |
|
|
145,721 |
|
|
148,242 |
|
|
145,021 |
|
| Per share data |
|
|
|
|
|
|
|
|
| Basic: |
|
|
|
|
|
|
|
|
| Net income (loss) |
|
$ |
0.41 |
|
|
$ |
1.14 |
|
|
$ |
2.43 |
|
|
$ |
2.42 |
|
| Diluted: |
|
|
|
|
|
|
|
|
| Net income (loss) |
|
$ |
0.40 |
|
|
$ |
1.09 |
|
|
$ |
2.37 |
|
|
$ |
2.29 |
|
NOBLE CORPORATION plc AND SUBSIDIARIES
NON-GAAP MEASURES AND RECONCILIATION
Certain non-GAAP measures and corresponding reconciliations to GAAP financial measures for the Company have been provided for meaningful comparisons between current results and prior operating periods. Generally, a non-GAAP financial measure is a numerical measure of a company’s performance, financial position, or cash flows that excludes or includes amounts that are not normally included or excluded in the most directly comparable measure calculated and presented in accordance with generally accepted accounting principles.
The Company defines “Adjusted EBITDA” as net income (loss) adjusted for interest expense, net of amounts capitalized; interest income and other, net; income tax benefit (provision); and depreciation and amortization expense, as well as, if applicable, gain (loss) on extinguishment of debt, net; losses on economic impairments; amortization of intangible assets and contract liabilities, net; restructuring and similar charges; costs related to mergers and integrations; and certain other infrequent operational events. We believe that the Adjusted EBITDA measure provides greater transparency of our core operating performance. We prepare Adjusted Net Income (Loss) by eliminating from Net Income (Loss) the impact of a number of non-recurring items we do not consider indicative of our on-going performance. We prepare Adjusted Diluted Earnings (Loss) per Share by eliminating from Diluted Earnings per Share the impact of a number of non-recurring items we do not consider indicative of our on-going performance. Similar to Adjusted EBITDA, we believe these measures help identify underlying trends that could otherwise be masked by the effect of the non-recurring items we exclude in the measure.
The Company also discloses free cash flow as a non-GAAP liquidity measure. Free cash flow is calculated as Net cash provided by (used in) operating activities less cash paid for capital expenditures. We believe Free Cash Flow is useful to investors because it measures our ability to generate or use cash. Once business needs and obligations are met, this cash can be used to reinvest in the company for future growth or to return to shareholders through dividend payments or share repurchases. We may have certain obligations such as non-discretionary debt service that are not deducted from the measure. Such business needs, obligations, and other non-discretionary expenditures that are not deducted from Free Cash Flow would reduce cash available for other uses including return of capital.
We believe that these non-GAAP financial measures provide useful information about our financial performance, enhance the overall understanding of our past performance and future prospects, and allow for greater transparency with respect to key metrics used by our management team for financial and operational decision-making. We are presenting these non-GAAP financial measures to assist investors in seeing our financial performance through the eyes of management, and because we believe that these measures provide an additional tool for investors to use in comparing our core financial performance over multiple periods with other companies in our industry.
These non-GAAP adjusted measures should be considered in addition to, and not as a substitute for, or superior to, contract drilling revenue, contract drilling costs, contract drilling margin, average daily revenue, operating income, cash flows from operations, or other measures of financial performance prepared in accordance with GAAP. Please see the following non-GAAP Financial Measures and Reconciliations for a complete description of the adjustments.
NOBLE CORPORATION plc AND SUBSIDIARIES
NON-GAAP MEASURES AND RECONCILIATION
(In thousands, except per share amounts)
(Unaudited)
|
|
|
|
|
|
|
|
|
|
|
|
|
|
|
|
|
|
|
|
|
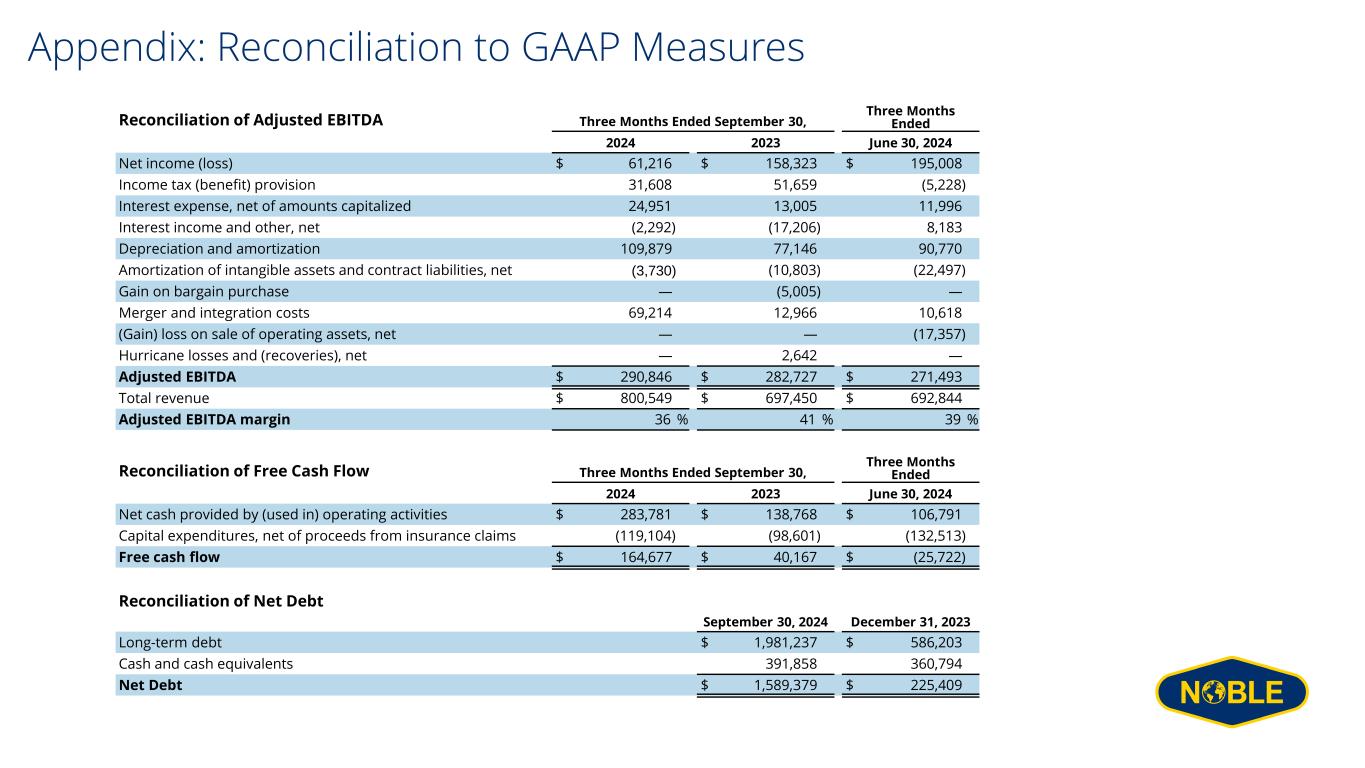
| Reconciliation of Adjusted EBITDA |
|
|
|
|
Three Months Ended September 30, |
|
Three Months Ended |
|
|
2024 |
|
2023 |
|
June 30, 2024 |
| Net income (loss) |
|
$ |
61,216 |
|
|
$ |
158,323 |
|
|
$ |
195,008 |
|
| Income tax (benefit) provision |
|
31,608 |
|
|
51,659 |
|
|
(5,228) |
|
| Interest expense, net of amounts capitalized |
|
24,951 |
|
|
13,005 |
|
|
11,996 |
|
| Interest income and other, net |
|
(2,292) |
|
|
(17,206) |
|
|
8,183 |
|
| Depreciation and amortization |
|
109,879 |
|
|
77,146 |
|
|
90,770 |
|
Amortization of intangible assets and contract liabilities, net |
|
(3,730) |
|
|
(10,803) |
|
|
(22,497) |
|
Gain on bargain purchase |
|
— |
|
|
(5,005) |
|
|
— |
|
|
|
|
|
|
|
|
|
|
|
|
|
|
|
| Merger and integration costs |
|
69,214 |
|
|
12,966 |
|
|
10,618 |
|
(Gain) loss on sale of operating assets, net |
|
— |
|
|
— |
|
|
(17,357) |
|
| Hurricane losses and (recoveries), net |
|
— |
|
|
2,642 |
|
|
— |
|
| Adjusted EBITDA |
|
$ |
290,846 |
|
|
$ |
282,727 |
|
|
$ |
271,493 |
|
|
|
|
|
|
|
|
|
|
|
|
|
|
|
|
|
|
|
|
|
|
Reconciliation of Income Tax Benefit (Provision) |
|
|
|
|
|
|
Three Months Ended September 30, |
|
Three Months Ended |
|
|
2024 |
|
2023 |
|
June 30, 2024 |
| Income tax benefit (provision) |
|
$ |
(31,608) |
|
|
$ |
(51,659) |
|
|
$ |
5,228 |
|
| Adjustments |
|
|
|
|
|
|
Amortization of intangible assets and contract liabilities, net |
|
90 |
|
|
6,079 |
|
|
101 |
|
| Joint taxation scheme compensation |
|
— |
|
|
(1,981) |
|
|
— |
|
Gain (loss) on sale of operating assets, net |
|
— |
|
|
— |
|
|
2,500 |
|
|
|
|
|
|
|
|
| Discrete tax items |
|
(37,688) |
|
|
(17,088) |
|
|
(63,067) |
|
| Total Adjustments |
|
(37,598) |
|
|
(12,990) |
|
|
(60,466) |
|
| Adjusted income tax benefit (provision) |
|
$ |
(69,206) |
|
|
$ |
(64,649) |
|
|
$ |
(55,238) |
|
NOBLE CORPORATION plc AND SUBSIDIARIES
NON-GAAP MEASURES AND RECONCILIATION
(In thousands, except per share amounts)
(Unaudited)
|
|
|
|
|
|
|
|
|
|
|
|
|
|
|
|
|
|
|
|
|
| Reconciliation of Net Income (Loss) |
|
|
|
|
|
|
|
|
Three Months Ended September 30, |
|
Three Months Ended |
|
|
2024 |
|
2023 |
|
June 30, 2024 |
| Net income (loss) |
|
$ |
61,216 |
|
|
$ |
158,323 |
|
|
$ |
195,008 |
|
| Adjustments |
|
|
|
|
|
|
| Amortization of intangible assets and contract liabilities, net |
|
(3,640) |
|
|
(4,724) |
|
|
(22,396) |
|
Joint taxation scheme compensation |
|
— |
|
|
(19,837) |
|
|
— |
|
Gain on bargain purchase |
|
— |
|
|
(5,005) |
|
|
— |
|
|
|
|
|
|
|
|
| Merger and integration costs |
|
69,214 |
|
|
12,966 |
|
|
10,618 |
|
(Gain) loss on sale of operating assets, net |
|
— |
|
|
— |
|
|
(14,857) |
|
| Hurricane losses and (recoveries), net |
|
— |
|
|
2,642 |
|
|
— |
|
|
|
|
|
|
|
|
| Discrete tax items |
|
(37,688) |
|
|
(17,088) |
|
|
(63,067) |
|
| Total Adjustments |
|
27,886 |
|
|
(31,046) |
|
|
(89,702) |
|
| Adjusted net income (loss) |
|
$ |
89,102 |
|
|
$ |
127,277 |
|
|
$ |
105,306 |
|
|
|
|
|
|
|
|
| Reconciliation of Diluted EPS |
|
|
|
|
|
|
|
|
Three Months Ended September 30, |
|
Three Months Ended |
|
|
2024 |
|
2023 |
|
June 30, 2024 |
| Unadjusted diluted EPS |
|
$ |
0.40 |
|
|
$ |
1.09 |
|
|
$ |
1.34 |
|
| Adjustments |
|
|
|
|
|
|
| Amortization of intangible assets and contract liabilities, net |
|
(0.02) |
|
|
(0.03) |
|
|
(0.15) |
|
Joint taxation scheme compensation |
|
— |
|
|
(0.14) |
|
|
— |
|
| Gain on bargain purchase |
|
— |
|
|
(0.03) |
|
|
— |
|
|
|
|
|
|
|
|
| Merger and integration costs |
|
0.45 |
|
|
0.08 |
|
|
0.06 |
|
(Gain) loss on sale of operating assets, net |
|
— |
|
|
— |
|
|
(0.10) |
|
| Hurricane losses and (recoveries), net |
|
— |
|
|
0.02 |
|
|
— |
|
|
|
|
|
|
|
|
| Discrete tax items |
|
(0.25) |
|
|
(0.12) |
|
|
(0.43) |
|
| Total Adjustments |
|
0.18 |
|
|
(0.22) |
|
|
(0.62) |
|
| Adjusted diluted EPS |
|
$ |
0.58 |
|
|
$ |
0.87 |
|
|
$ |
0.72 |
|
|
|
|
|
|
|
|
| Reconciliation of Free Cash Flow |
|
|
|
|
|
|
|
|
Three Months Ended September 30, |
|
Three Months Ended |
|
|
2024 |
|
2023 |
|
June 30, 2024 |
| Net cash provided by (used in) operating activities |
|
$ |
283,781 |
|
|
$ |
138,768 |
|
|
$ |
106,791 |
|
| Capital expenditures, net of proceeds from insurance claims |
|
(119,104) |
|
|
(98,601) |
|
|
(132,513) |
|
| Free cash flow |
|
$ |
164,677 |
|
|
$ |
40,167 |
|
|
$ |
(25,722) |
|
NOBLE OFFSHORE DRILLING, INC.
UNAUDITED SELECTED FINANCIALS
On the Merger Effective Date, Diamond Offshore Drilling, Inc. merged into Noble Offshore Drilling, Inc. with Noble Offshore Drilling, Inc. being the surviving entity.
The indenture governing the 8.500% Senior Secured Second Lien Notes due October 2030 issued by Diamond Foreign Asset Company and Diamond Finance, LLC (“Diamond Second Lien Notes”) contains a covenant that requires Noble Offshore Drilling, Inc., as a successor Guarantor, to furnish to holders of the Diamond Second Lien Notes certain financial information relating to Noble Offshore Drilling, Inc. and its restricted subsidiaries.
|
|
|
|
|
|
|
|
|
|
|
September 30, 2024 |
| Balance Sheet |
|
|
| Cash and cash equivalents |
|
$ |
179,801 |
|
| Total current assets |
|
455,946 |
|
| Total current liabilities |
|
298,270 |
|
| Total debt |
|
1,171,316 |
|
| Total shareholder’s equity |
|
864,444 |
|
|
|
|
|
|
|
|
|
|
|
|
|
|
|
|
|
|
Consolidated Diamond Offshore Drilling, Inc. |
|
Consolidated Noble Offshore Drilling, Inc. |
|
|
Period from
July 1, 2024
through
September 3, 2024 |
|
Period from
September 4, 2024
through
September 30, 2024 |
| Statements of Operations |
|
|
|
|
| Operating revenues |
|
$ |
197,013 |
|
|
$ |
94,380 |
|
| Operating costs and expenses |
|
142,917 |
|
|
95,246 |
|
| Depreciation and amortization |
|
22,210 |
|
|
11,357 |
|
|
|
|
|
|
| Statements of Cash Flows |
|
|
|
|
| Net cash provided by (used in) operating activities |
|
$ |
56,867 |
|
|
$ |
(8,887) |
|
| Capital expenditures |
|
(17,434) |
|
|
(10,562) |
|
| Proceeds from disposal of assets, net |
|
8,910 |
|
|
5,575 |
|
| Dividend payments |
|
— |
|
|
— |
|
