
Insight Proprietary & Confidential. Do Not Copy or Distribute. © 2024 Insight Direct USA, Inc. All Rights Reserved. 1 Insight Enterprises, Inc. Third Quarter 2024 Earnings Conference Call and Webcast
Insight Proprietary & Confidential. Do Not Copy or Distribute. © 2022 Insight Direct USA, Inc. All Rights Reserved. 24 Disclosures ◦ Safe harbor statement This presentation includes “forward-looking statements” within the meaning of the Private Securities Litigation Reform Act of 1995 related to Insight’s plans and expectations. Statements that are not historical facts, including those related to our expectations about future financial results and the assumptions related thereto, including expectations related to SADA, our expectations regarding supply constraints, our expectations regarding backlog shipments, our expectations regarding future expected trends in the IT market and our opportunities for growth, are forward-looking statements. These forward-looking statements are subject to assumptions, risks and uncertainties which could cause actual results or future events to differ materially from such statements. Insight Enterprises, Inc. (the "Company") undertakes no obligation to update publicly or revise any of the forward-looking statements, except as otherwise required by law. More detailed information about forward-looking statements and risk factors is included in today’s press release and discussed in the Company’s most recently filed periodic reports and subsequent filings with the Securities and Exchange Commission. ◦ Non-GAAP measures This presentation will reference certain non-GAAP financial information as ‘Adjusted’. A reconciliation of non-GAAP financial measures presented in this document to our actual GAAP results is attached to the back of this presentation and included in the press release issued today, which you may find on the Investor Relations section of our website at investor.insight.com. These non-GAAP measures are used by the Company and its management to evaluate financial performance against budgeted amounts, to calculate incentive compensation, to assist in forecasting future performance and to compare the Company’s results to those of the Company’s competitors. The Company believes that these non-GAAP financial measures are useful to investors because they allow for greater transparency, facilitate comparisons to prior periods and the Company’s competitors’ results and assist in forecasting performance for future periods. These non-GAAP financial measures are not prepared in accordance with GAAP and may be different from non-GAAP financial measures presented by other companies. Non-GAAP financial measures should not be considered as a substitute for, or superior to, measures of financial performance prepared in accordance with GAAP. ◦ Constant currency In some instances, the Company refers to changes in net sales, gross profit, earnings from operations and Adjusted earnings from operations on a consolidated basis and in North America, EMEA and APAC excluding the effects of fluctuating foreign currency exchange rates. In addition, the Company refers to changes in Adjusted diluted earnings per share on a consolidated basis excluding the effects of fluctuating foreign currency exchange rates. These are also considered to be non-GAAP measures. The Company believes providing this information excluding the effects of fluctuating foreign currency exchange rates provides valuable supplemental information to investors regarding its underlying business and results of operations, consistent with how the Company and its management evaluate the Company’s performance. In computing these changes and percentages, the Company compares the current year amount as translated into U.S. dollars under the applicable accounting standards to the prior year amount in local currency translated into U.S. dollars utilizing the weighted average translation rate for the current period.
Insight Proprietary & Confidential. Do Not Copy or Distribute. © 2022 Insight Direct USA, Inc. All Rights Reserved. 34 Table of Contents ◦ Solutions Integrator Strategy ◦ Solutions at Work ◦ Awards and Recognitions ◦ Third Quarter 2024 Highlights and Performance ◦ 2027 KPIs for Success ◦ 2024 Outlook ◦ Appendix
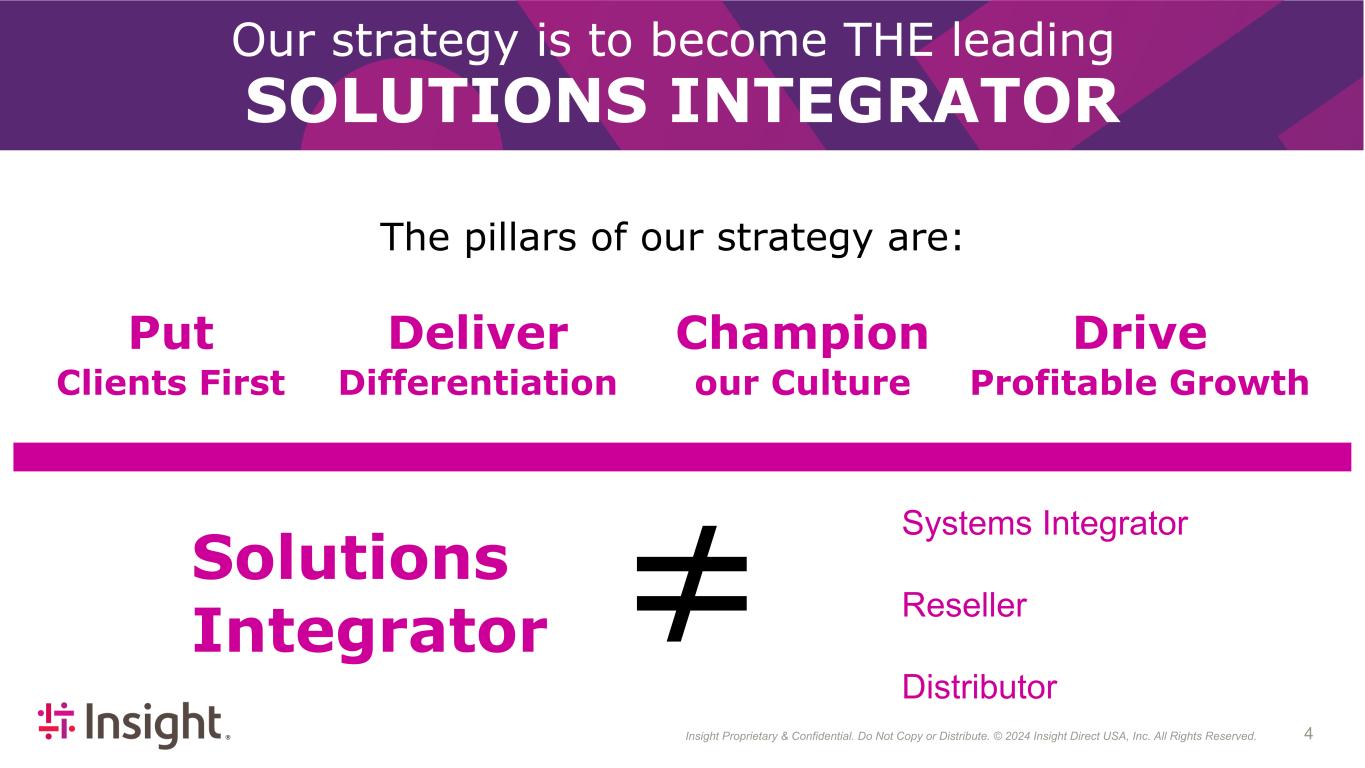
Insight Proprietary & Confidential. Do Not Copy or Distribute. © 2022 Insight Direct USA, Inc. All Rights Reserved. 44 Put clients first We put our clients first, delivering essential value that contributes to their success and making us the partner they can't live without. Deliver differentiation Our combination of innovative and scalable solutions, exceptional talent and unique portfolio strategy gives us a differentiated advantage. Champion culture Our teammates and our culture are our biggest assets. We champion them to deliver the best. Put Clients First Deliver Differentiation Champion our Culture Drive Profitable Growth Solutions Int grator ≠ Systems Integrator Reseller Distributor Our strategy is to become THE leading SOLUTIONS INTEGRATOR The pillars of our strategy are:
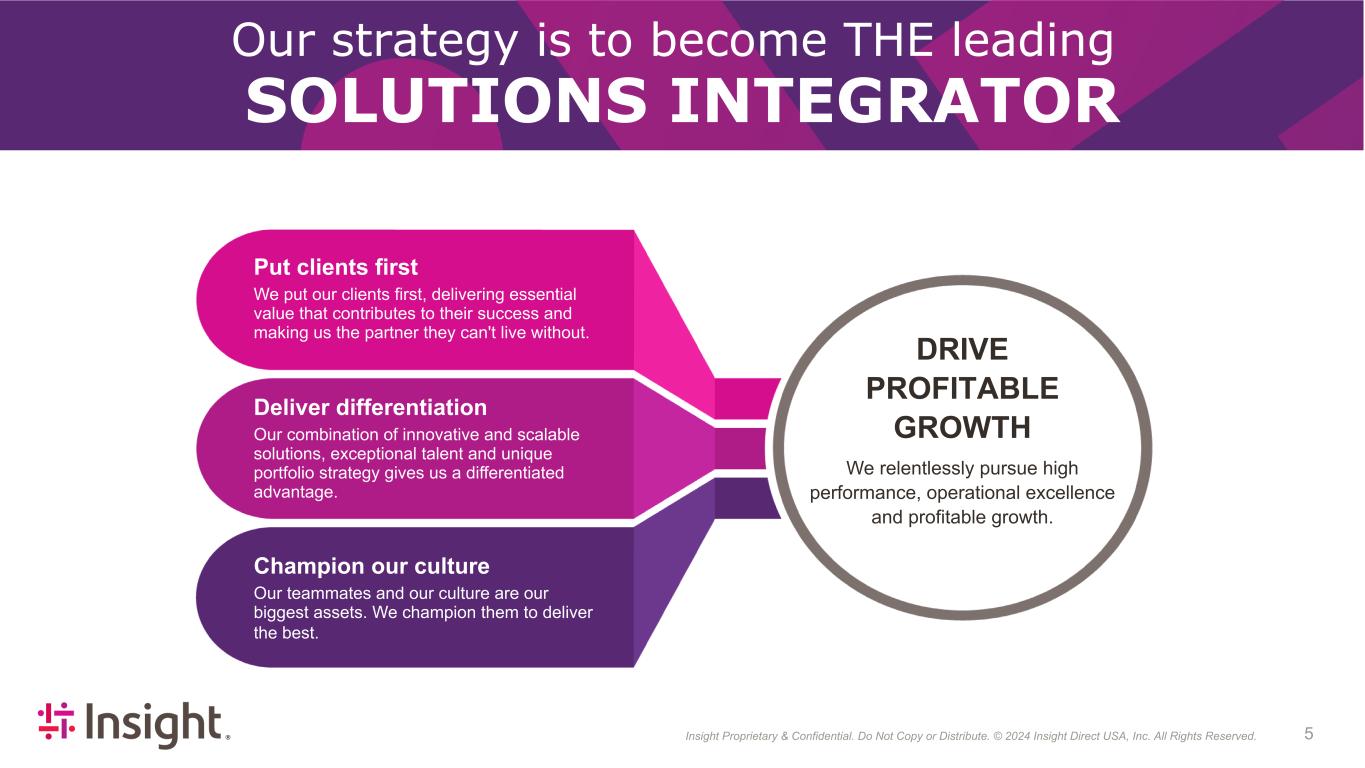
Insight Proprietary & Confidential. Do Not Copy or Distribute. © 2022 Insight Direct USA, Inc. All Rights Reserved. 54 Our strategy is to become THE leading SOLUTIONS INTEGRATOR DRIVE PROFITABLE GROWTH We relentlessly pursue high performance, operational excellence and profitable growth. Put clients first We put our clients first, delivering essential value that contributes to their success and making us the partner they can't live without. Deliver differentiation Our combination of innovative and scalable solutions, exceptional talent and unique portfolio strategy gives us a differentiated advantage. Champion our culture Our teammates and our culture are our biggest assets. We champion them to deliver the best.

Insight Proprietary & Confidential. Do Not Copy or Distribute. © 2022 Insight Direct USA, Inc. All Rights Reserved. 64 The challenge: The results: • As part of its ambition for economic diversification, the Royal Kingdom of Saudi Arabia announced its intent to turn the Kingdom into a tourism powerhouse, creating 50,000 new jobs and competing with well established, regional hotspots such as Dubai, alongside global favorites • A modern, scalable and flexible private cloud enabling critical systems to provide the digital foundation for a world class guest experience, aboard its luxury cruise liner and critical shipping systems • Modern, scalable and highly flexible private cloud powering: ◦ Outstanding Guest Experience ◦ Increased Operational Efficiency ◦ Enhanced Cybersecurity ◦ Greater Data Visibility and Business Analytics • Insight was commissioned to define and design a state of the art infrastructure, with the purpose of supporting critical ship management applications and bringing to life a best-in-class digital experience for all guests • Deliver an integrated private cloud solution consisting of technologies from a variety of partners, coupled with Insight Professional Services and its Client Fulfilment Centers across EMEA, to design, test and deploy a purpose built datacenter on the sea • Partnered with multiple ISVs and others to form a partner ecosystem The solution: Modernizing Cruise Liner’s IT Infrastructure
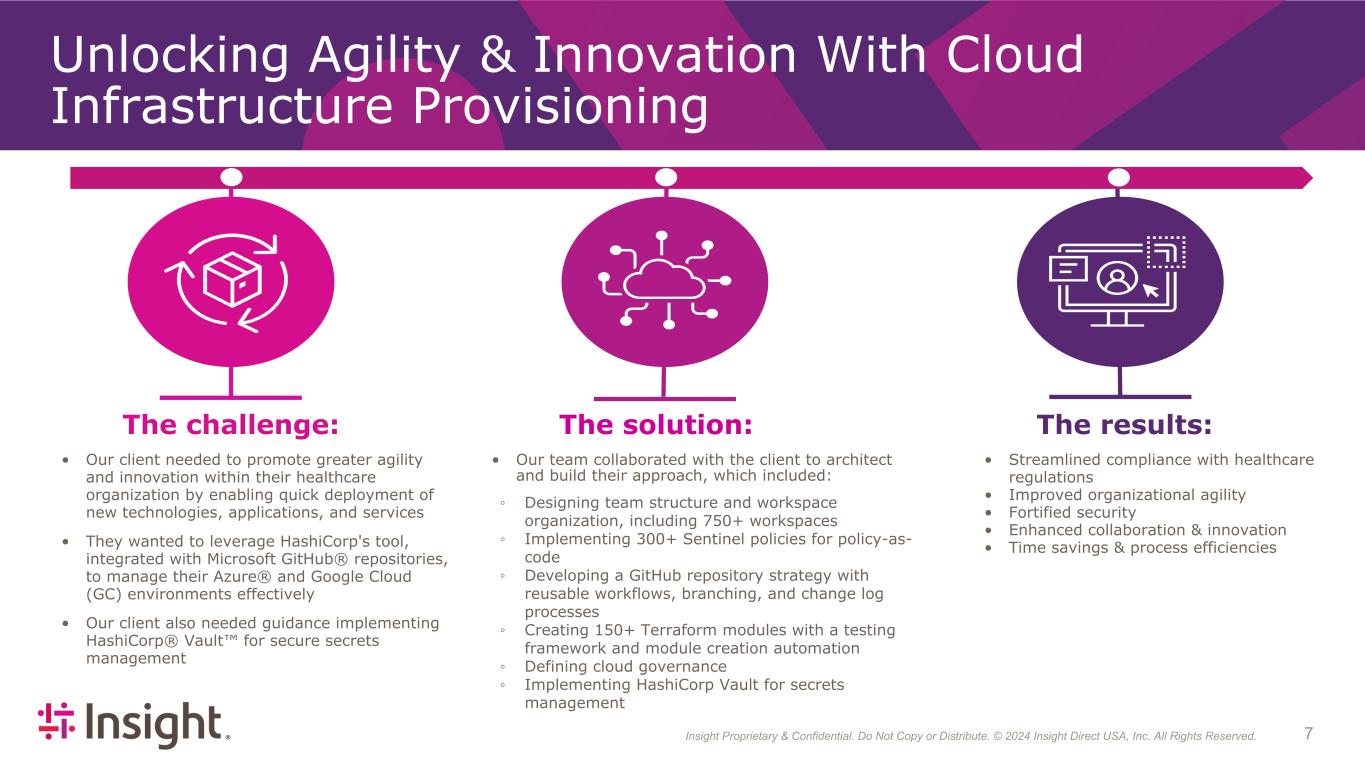
Insight Proprietary & Confidential. Do Not Copy or Distribute. © 2022 Insight Direct USA, Inc. All Rights Reserved. 74 The challenge: The results: • Our client needed to promote greater agility and innovation within their healthcare organization by enabling quick deployment of new technologies, applications, and services • They wanted to leverage HashiCorp's tool, integrated with Microsoft GitHub® repositories, to manage their Azure® and Google Cloud (GC) environments effectively • Our client also needed guidance implementing HashiCorp® Vault™ for secure secrets management • Streamlined compliance with healthcare regulations • Improved organizational agility • Fortified security • Enhanced collaboration & innovation • Time savings & process efficiencies The solution: Unlocking Agility & Innovation With Cloud Infrastructure Provisioning • Our team collaborated with the client to architect and build their approach, which included: ◦ Designing team structure and workspace organization, including 750+ workspaces ◦ Implementing 300+ Sentinel policies for policy-as- code ◦ Developing a GitHub repository strategy with reusable workflows, branching, and change log processes ◦ Creating 150+ Terraform modules with a testing framework and module creation automation ◦ Defining cloud governance ◦ Implementing HashiCorp Vault for secrets management

Insight Proprietary & Confidential. Do Not Copy or Distribute. © 2022 Insight Direct USA, Inc. All Rights Reserved. 84 Awards and Recognitions U.S. Best Places to Work International Best Places to Work No. 1 | Inland Northwest No. 3 | Phoenix Business Journal No. 9 | Phoenix Healthiest Workplaces No. 13 | Forbes Best Employers in Ohio Montréal's Top Employers No. 5 | Italy Best Workplaces No. 16 | UK Best Workplaces for Wellbeing No. 17 | Spain Best Workplaces No. 28 | UK Best Workplaces No. 33 | UK Best Workplaces for Women UK Best Workplaces in Tech No. 2 | Singapore Best Workplaces No. 8 | Australia Best Workplaces in Tech No. 15 | Australia Best Workplaces No. 27 | Australia Best Workplaces for Women Certified | Great Place to Work in Australia, China, Hong Kong, New Zealand, Philippines, India AWS Premier Tier Service Partner 2024 Gartner Magic Quadrant for Software Asset Management Managed Services 2024 Keystone Partner of the Year 2024 Acquisition Partner of the Year • 2024 Infrastructure Solutions Group US Partner of the Year • 2024 Services and Solutions Canada Partner of the Year • Global Customer Experiences Partner of the Year • Americas Enterprise Partner of the Year • US Partner of the Year
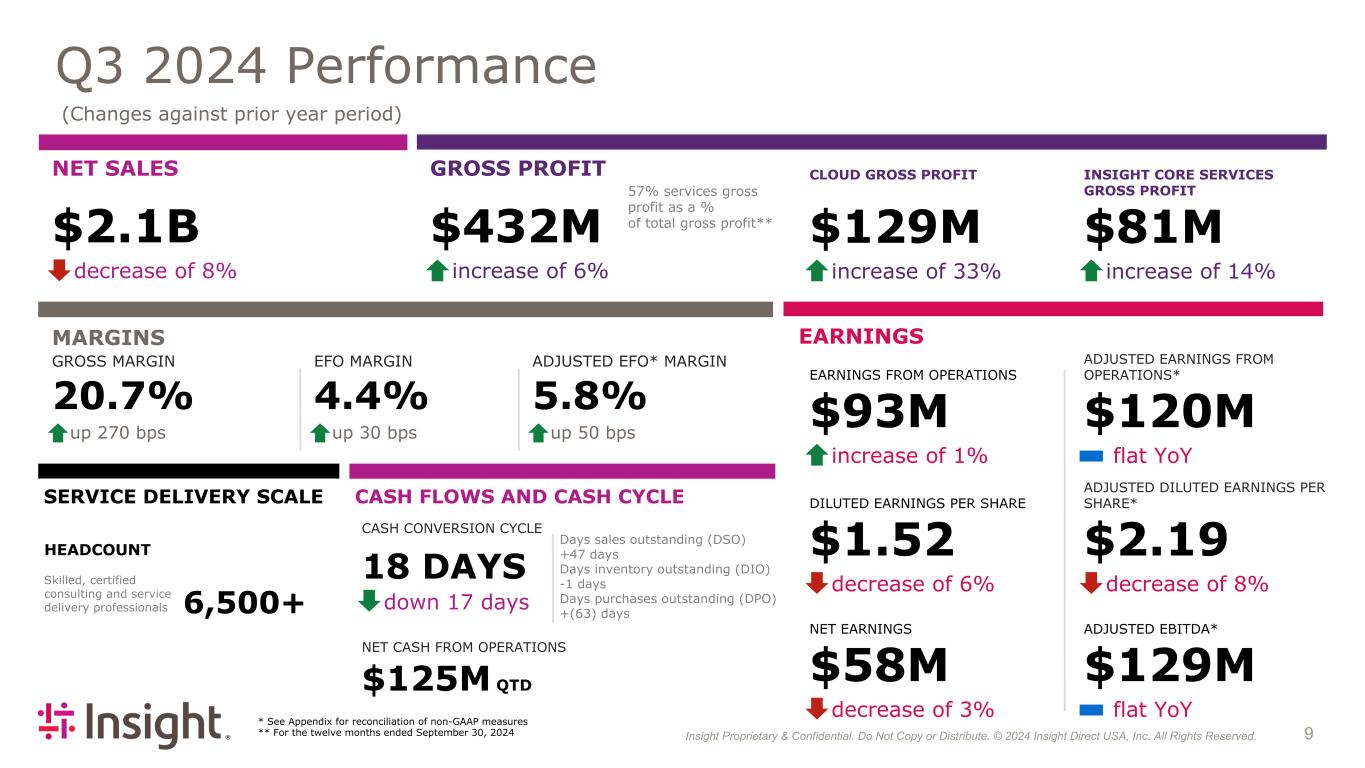
Insight Proprietary & Confidential. Do Not Copy or Distribute. © 2022 Insight Direct USA, Inc. All Rights Reserved. 94 Q3 2024 Performance (Changes against prior year period) * See Appendix for reconciliation of non-GAAP measures ** For the twelve months ended September 30, 2024 NET SALES $2.1B decrease of 8% GROSS PROFIT $432M increase of 6% MARGINS GROSS MARGIN 20.7% up 270 bps EFO MARGIN 4.4% up 30 bps ADJUSTED EFO* MARGIN 5.8% up 50 bps EARNINGS CLOUD GROSS PROFIT CLOUD $129M increase of 33% 57% services gross profit as a % of total gross profit** INSIGHT CORE SERVICES GROSS PROFIT $81M increase of 14% EARNINGS FROM OPERATIONS EARNINGS FROM OPERATIONS $93M increase of 1% DILUTED EARNINGS PER SHARE DILUTED EARNINGS PER SHARE $1.52 decrease of 6% NET EARNINGS NET EARNINGS $58M decrease of 3% ADJUSTED EARNINGS FROM OPERATIONS* $120M flat YoY ADJUSTED DILUTED EARNINGS PER SHARE* $2.19 decrease of 8% ADJUSTED EBITDA* NET EARNINGS ADJUSTED EBITDA* $129M flat YoY CASH FLOWS AND CASH CYCLE CASH CONVERSION CYCLE 18 DAYS down 17 days Days sales outstanding (DSO) +47 days Days inventory outstanding (DIO) -1 days Days purchases outstanding (DPO) +(63) days NET CASH FROM OPERATIONS $125M QTD SERVICE DELIVERY SCALE HEADCOUNT Skilled, certified consulting and service delivery professionals 6,500+
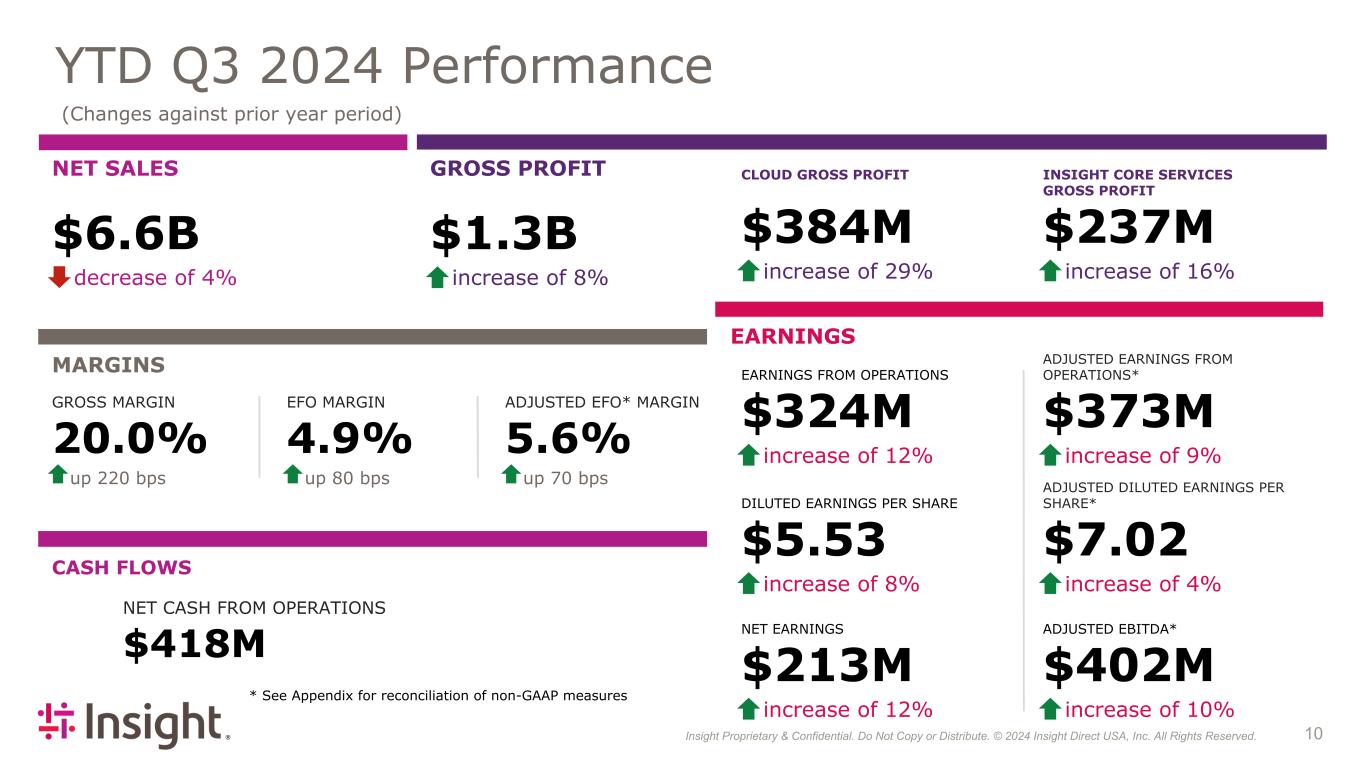
Insight Proprietary & Confidential. Do Not Copy or Distribute. © 2022 Insight Direct USA, Inc. All Rights Reserved. 104 YTD Q3 2024 Performance (Changes against prior year period) * See Appendix for reconciliation of non-GAAP measures NET SALES $6.6B decrease of 4% GROSS PROFIT $1.3B increase of 8% MARGINS GROSS MARGIN 20.0% up 220 bps EFO MARGIN 4.9% up 80 bps ADJUSTED EFO* MARGIN 5.6% up 70 bps EARNINGS CLOUD GROSS PROFIT CLOUD $384M increase of 29% INSIGHT CORE SERVICES GROSS PROFIT $237M increase of 16% EARNINGS FROM OPERATIONS EARNINGS FROM OPERATIONS $324M increase of 12% DILUTED EARNINGS PER SHARE DILUTED EARNINGS PER SHARE $5.53 increase of 8% NET EARNINGS NET EARNINGS $213M increase of 12% ADJUSTED EARNINGS FROM OPERATIONS* $373M increase of 9% ADJUSTED DILUTED EARNINGS PER SHARE* $7.02 increase of 4% ADJUSTED EBITDA* NET EARNINGS ADJUSTED EBITDA* $402M increase of 10% CASH FLOWS NET CASH FROM OPERATIONS $418M

Insight Proprietary & Confidential. Do Not Copy or Distribute. © 2022 Insight Direct USA, Inc. All Rights Reserved. 114 Debt US Dollars in millions Description Net payments SADA (December 2023) $424 InfoCenter (May 2024) $265 NWT* (July 2024) $5 Total payments for acquisitions** $694 Total share repurchases $200 Cash from operations used to pay down debt $480 Increase in total debt $414 • In May 2024, raised $500 million aggregate principal of senior notes due 2032 • Total debt balance at September 30, 2024 - $1.1 billion • Total debt balance at September 30, 2023 - $673 million • YoY increase in total debt of $414 million * Acquired entity in our EMEA segment ** Cash paid, net of cash and cash equivalents acquired (from Statement of Cash Flows)
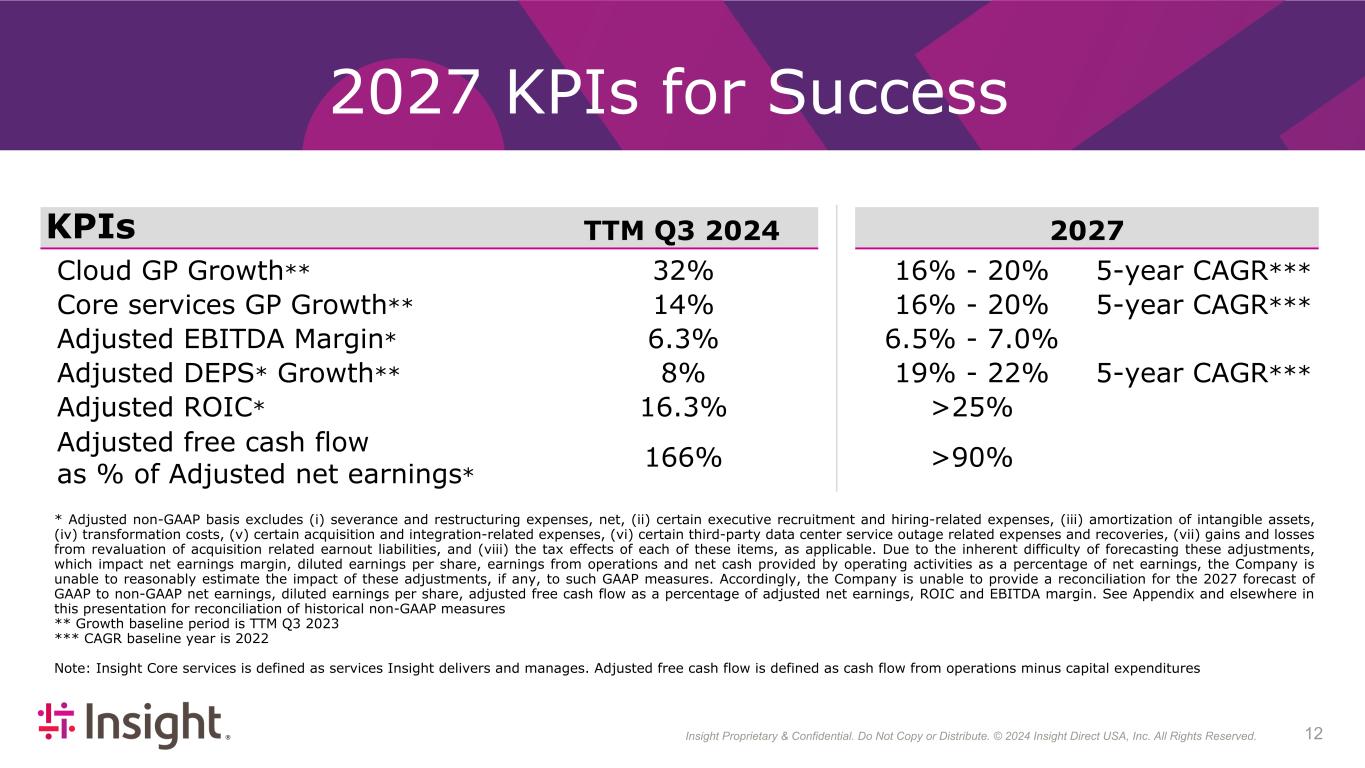
Insight Proprietary & Confidential. Do Not Copy or Distribute. © 2022 Insight Direct USA, Inc. All Rights Reserved. 124 2027 KPIs for Success KPIs TTM Q3 2024 2027 Cloud GP Growth** 32% 16% - 20% 5-year CAGR*** Core services GP Growth** 14% 16% - 20% 5-year CAGR*** Adjusted EBITDA Margin* 6.3% 6.5% - 7.0% Adjusted DEPS* Growth** 8% 19% - 22% 5-year CAGR*** Adjusted ROIC* 16.3% >25% Adjusted free cash flow as % of Adjusted net earnings* 166% >90% * Adjusted non-GAAP basis excludes (i) severance and restructuring expenses, net, (ii) certain executive recruitment and hiring-related expenses, (iii) amortization of intangible assets, (iv) transformation costs, (v) certain acquisition and integration-related expenses, (vi) certain third-party data center service outage related expenses and recoveries, (vii) gains and losses from revaluation of acquisition related earnout liabilities, and (viii) the tax effects of each of these items, as applicable. Due to the inherent difficulty of forecasting these adjustments, which impact net earnings margin, diluted earnings per share, earnings from operations and net cash provided by operating activities as a percentage of net earnings, the Company is unable to reasonably estimate the impact of these adjustments, if any, to such GAAP measures. Accordingly, the Company is unable to provide a reconciliation for the 2027 forecast of GAAP to non-GAAP net earnings, diluted earnings per share, adjusted free cash flow as a percentage of adjusted net earnings, ROIC and EBITDA margin. See Appendix and elsewhere in this presentation for reconciliation of historical non-GAAP measures ** Growth baseline period is TTM Q3 2023 *** CAGR baseline year is 2022 Note: Insight Core services is defined as services Insight delivers and manages. Adjusted free cash flow is defined as cash flow from operations minus capital expenditures

Insight Proprietary & Confidential. Do Not Copy or Distribute. © 2022 Insight Direct USA, Inc. All Rights Reserved. 134 Full Year 2024 Outlook Assumptions: As of October 31, 2024 As of August 1, 2024 Gross profit growth mid single-digit low double-digit Gross margin 19% - 20% range 19% - 20% range Adjusted diluted EPS* $9.40 - $9.70 $10.60 - $10.90 Interest expense $58 - $60 million $60 - $62 million Effective tax rate approximately 25.5% 26% Capital expenditures $35 - $40 million $35 - $40 million Average share count 35.1 million 35.1 million Other Exclusions and Assumptions: • Excludes acquisition-related intangibles amortization expense of approximately $70 million (posted on website) • Assumes no acquisition or integration-related, transformation or severance and restructuring expenses, net • Assumes no significant change in our debt instruments or the macroeconomic environment * Adjusted diluted earnings per share excludes severance and restructuring expense, net and other unique items as well as amortization expense related to acquired intangibles. Due to the inherent difficulty of forecasting some of these types of expenses, which impact net earnings, diluted earnings per share and selling and administrative expenses, the Company is unable to reasonably estimate the impact of such expenses, if any, to net earnings, diluted earnings per share and selling and administrative expenses. Accordingly, the Company is unable to provide a reconciliation of GAAP to non-GAAP diluted earnings per share for the full year 2024 forecast
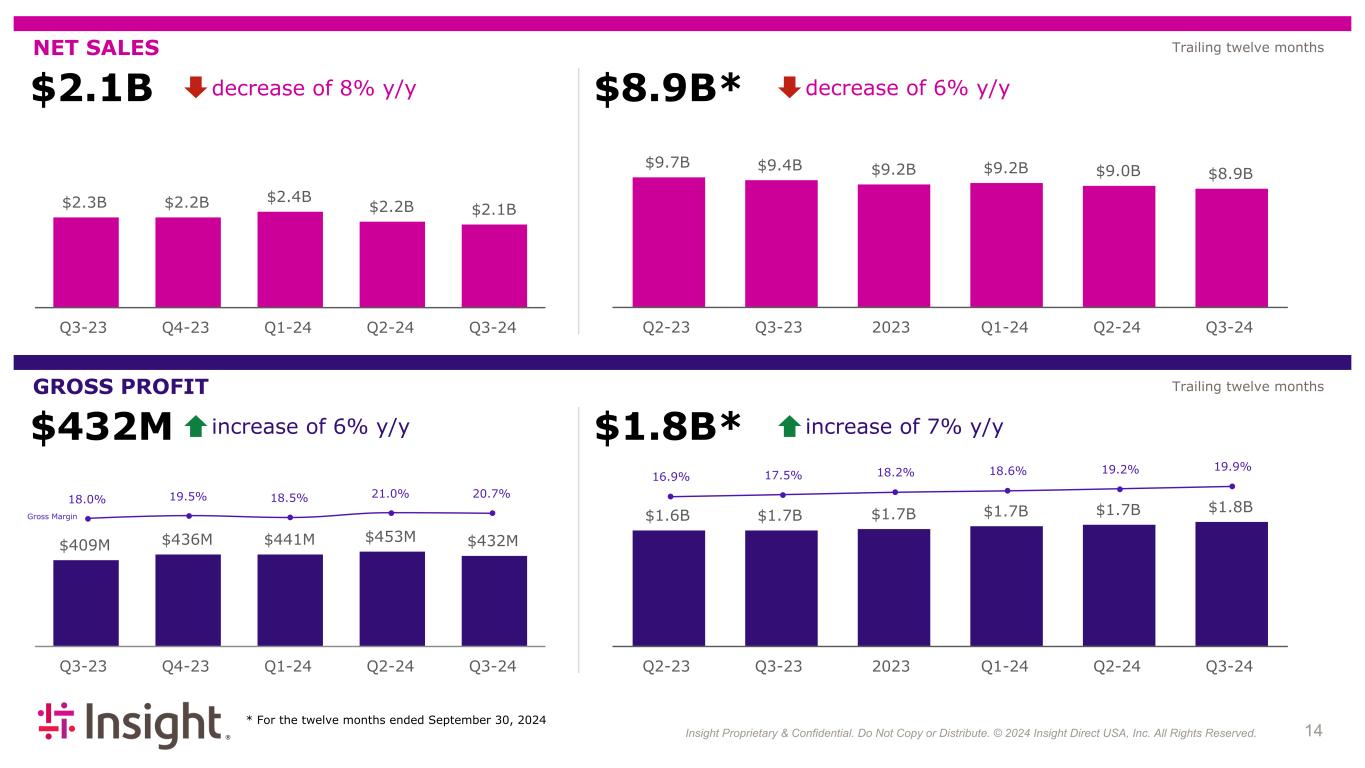
Insight Proprietary & Confidential. Do Not Copy or Distribute. © 2022 Insight Direct USA, Inc. All Rights Reserved. 144 NET SALES GROSS PROFIT * For the twelve months ended September 30, 2024 Trailing twelve months Trailing twelve months $2.1B decrease of 8% y/y $2.3B $2.2B $2.4B $2.2B $2.1B Q3-23 Q4-23 Q1-24 Q2-24 Q3-24 $9.7B $9.4B $9.2B $9.2B $9.0B $8.9B Q2-23 Q3-23 2023 Q1-24 Q2-24 Q3-24 $8.9B* decrease of 6% y/y $432M increase of 6% y/y 18.0% 19.5% 18.5% 21.0% 20.7% $409M $436M $441M $453M $432M Q3-23 Q4-23 Q1-24 Q2-24 Q3-24 $1.8B* increase of 7% y/y 16.9% 17.5% 18.2% 18.6% 19.2% 19.9% $1.6B $1.7B $1.7B $1.7B $1.7B $1.8B Q2-23 Q3-23 2023 Q1-24 Q2-24 Q3-24 Gross Margin
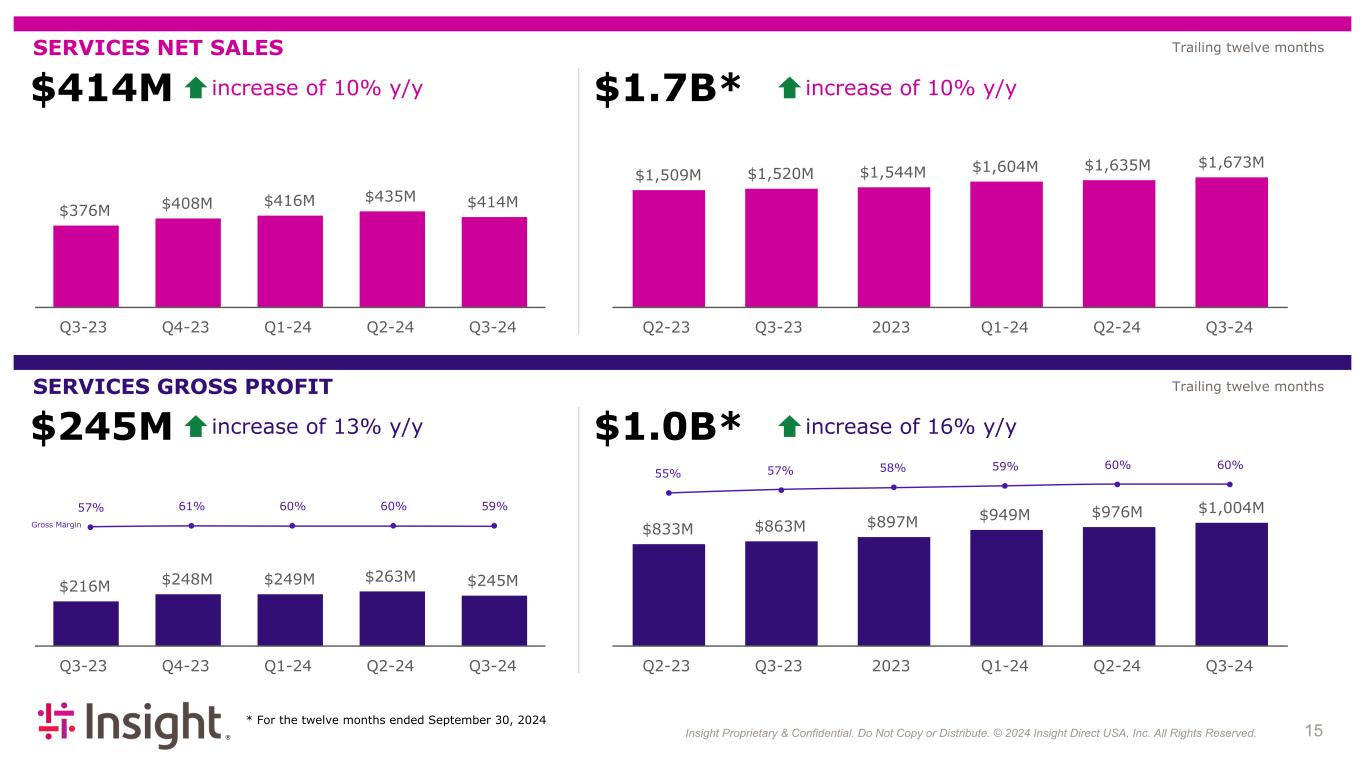
Insight Proprietary & Confidential. Do Not Copy or Distribute. © 2022 Insight Direct USA, Inc. All Rights Reserved. 154 Gross Margin SERVICES NET SALES SERVICES GROSS PROFIT * For the twelve months ended September 30, 2024 Trailing twelve months Trailing twelve months $414M increase of 10% y/y $376M $408M $416M $435M $414M Q3-23 Q4-23 Q1-24 Q2-24 Q3-24 $1,509M $1,520M $1,544M $1,604M $1,635M $1,673M Q2-23 Q3-23 2023 Q1-24 Q2-24 Q3-24 $1.7B* increase of 10% y/y $216M $248M $249M $263M $245M Q3-23 Q4-23 Q1-24 Q2-24 Q3-24 57% 61% 60% 60% 59% $245M increase of 13% y/y $833M $863M $897M $949M $976M $1,004M Q2-23 Q3-23 2023 Q1-24 Q2-24 Q3-24 $1.0B* increase of 16% y/y 55% 57% 58% 59% 60% 60%
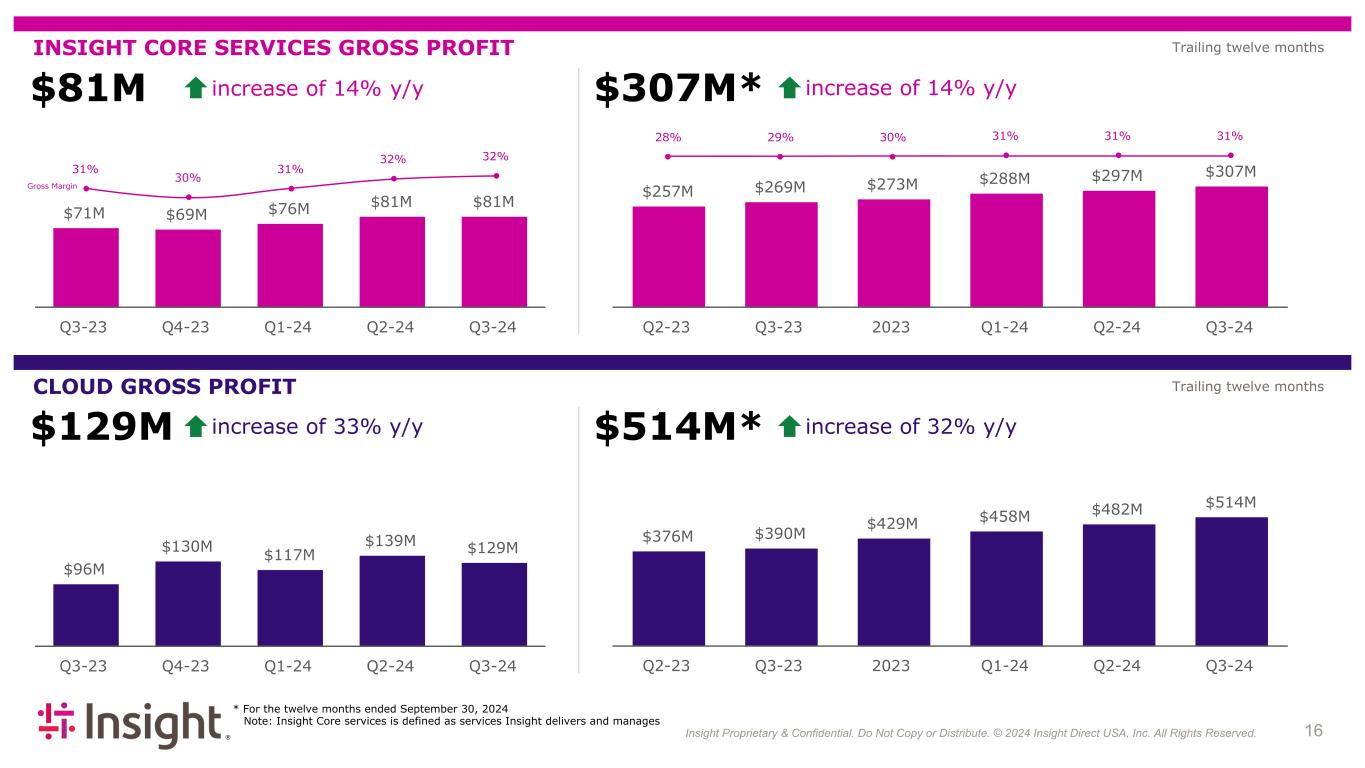
Insight Proprietary & Confidential. Do Not Copy or Distribute. © 2022 Insight Direct USA, Inc. All Rights Reserved. 164 INSIGHT CORE SERVICES GROSS PROFIT CLOUD GROSS PROFIT * For the twelve months ended September 30, 2024 Note: Insight Core services is defined as services Insight delivers and manages Trailing twelve months Trailing twelve months $71M $69M $76M $81M $81M Q3-23 Q4-23 Q1-24 Q2-24 Q3-24 31% 30% 31% 32% 32% $81M increase of 14% y/y Gross Margin $257M $269M $273M $288M $297M $307M Q2-23 Q3-23 2023 Q1-24 Q2-24 Q3-24 28% 29% 30% 31% 31% 31% $307M* increase of 14% y/y $96M $130M $117M $139M $129M Q3-23 Q4-23 Q1-24 Q2-24 Q3-24 $376M $390M $429M $458M $482M $514M Q2-23 Q3-23 2023 Q1-24 Q2-24 Q3-24 $129M increase of 33% y/y $514M* increase of 32% y/y

Insight Proprietary & Confidential. Do Not Copy or Distribute. © 2022 Insight Direct USA, Inc. All Rights Reserved. 174 EARNINGS FROM OPERATIONS ADJUSTED EARNINGS FROM OPERATIONS** * For the twelve months ended September 30, 2024 ** See Appendix for reconciliation of non-GAAP measures Trailing twelve months Trailing twelve months $92M $132M $100M $131M $93M Q3-23 Q4-23 Q1-24 Q2-24 Q3-24 $400M $402M $420M $442M $455M $456M Q2-23 Q3-23 2023 Q1-24 Q2-24 Q3-24 $93M increase of 1% y/y $456M* increase of 13% y/y $120M $149M $122M $131M $120M Q3-23 Q4-23 Q1-24 Q2-24 Q3-24 $120M flat y/y $459M $472M $492M $520M $521M $522M Q2-23 Q3-23 2023 Q1-24 Q2-24 Q3-24 $522M* increase of 11% y/y
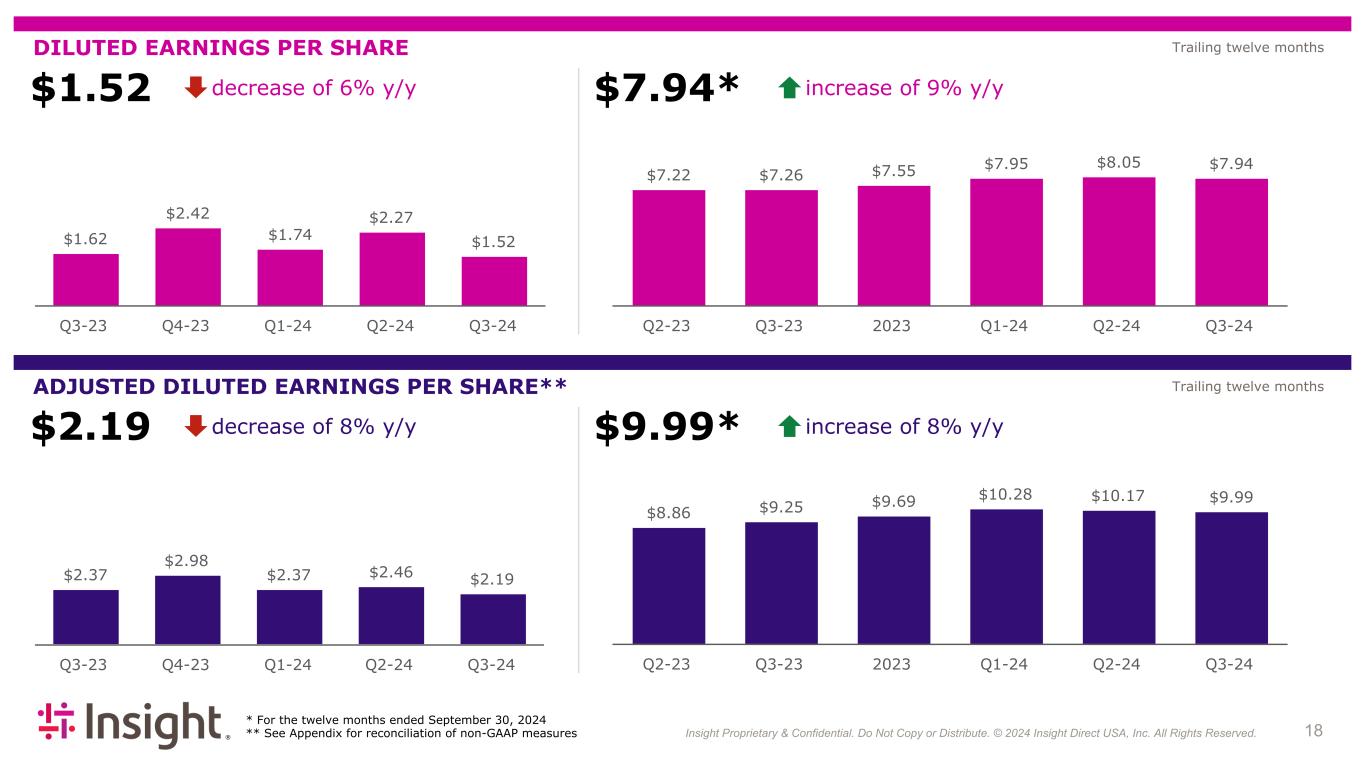
Insight Proprietary & Confidential. Do Not Copy or Distribute. © 2022 Insight Direct USA, Inc. All Rights Reserved. 184 DILUTED EARNINGS PER SHARE ADJUSTED DILUTED EARNINGS PER SHARE** * For the twelve months ended September 30, 2024 ** See Appendix for reconciliation of non-GAAP measures Trailing twelve months Trailing twelve months $1.62 $2.42 $1.74 $2.27 $1.52 Q3-23 Q4-23 Q1-24 Q2-24 Q3-24 $7.22 $7.26 $7.55 $7.95 $8.05 $7.94 Q2-23 Q3-23 2023 Q1-24 Q2-24 Q3-24 $2.37 $2.98 $2.37 $2.46 $2.19 Q3-23 Q4-23 Q1-24 Q2-24 Q3-24 $8.86 $9.25 $9.69 $10.28 $10.17 $9.99 Q2-23 Q3-23 2023 Q1-24 Q2-24 Q3-24 $1.52 decrease of 6% y/y $7.94* increase of 9% y/y $2.19 decrease of 8% y/y $9.99* increase of 8% y/y

Insight Proprietary & Confidential. Do Not Copy or Distribute. © 2024 Insight Direct USA, Inc. All Rights Reserved. 19 Appendix
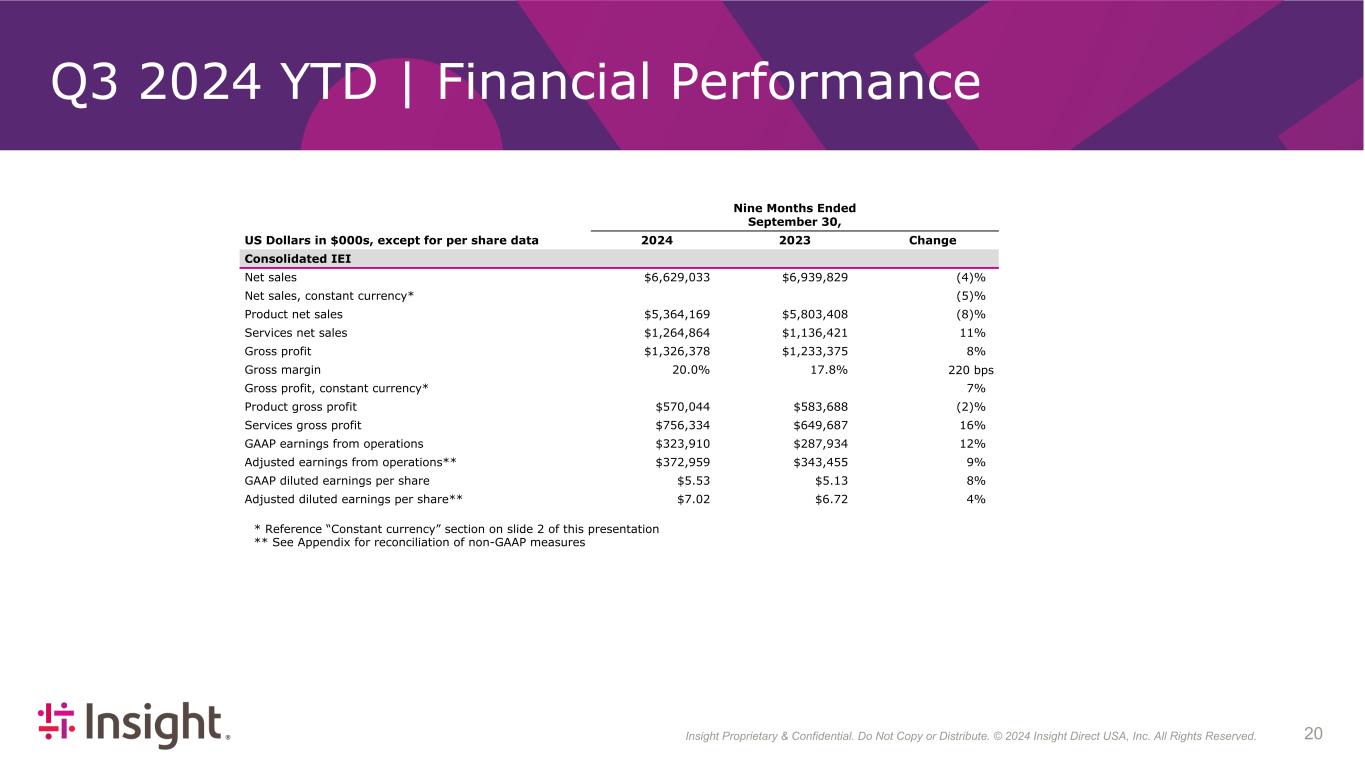
Insight Proprietary & Confidential. Do Not Copy or Distribute. © 2022 Insight Direct USA, Inc. All Rights Reserved. 204 Q3 2024 YTD | Financial Performance Nine Months Ended September 30, US Dollars in $000s, except for per share data 2024 2023 Change Consolidated IEI Net sales $6,629,033 $6,939,829 (4) % Net sales, constant currency* (5) % Product net sales $5,364,169 $5,803,408 (8) % Services net sales $1,264,864 $1,136,421 11 % Gross profit $1,326,378 $1,233,375 8 % Gross margin 20.0 % 17.8 % 220 bps Gross profit, constant currency* 7 % Product gross profit $570,044 $583,688 (2) % Services gross profit $756,334 $649,687 16 % GAAP earnings from operations $323,910 $287,934 12 % Adjusted earnings from operations** $372,959 $343,455 9 % GAAP diluted earnings per share $5.53 $5.13 8 % Adjusted diluted earnings per share** $7.02 $6.72 4 % * Reference “Constant currency” section on slide 2 of this presentation ** See Appendix for reconciliation of non-GAAP measures
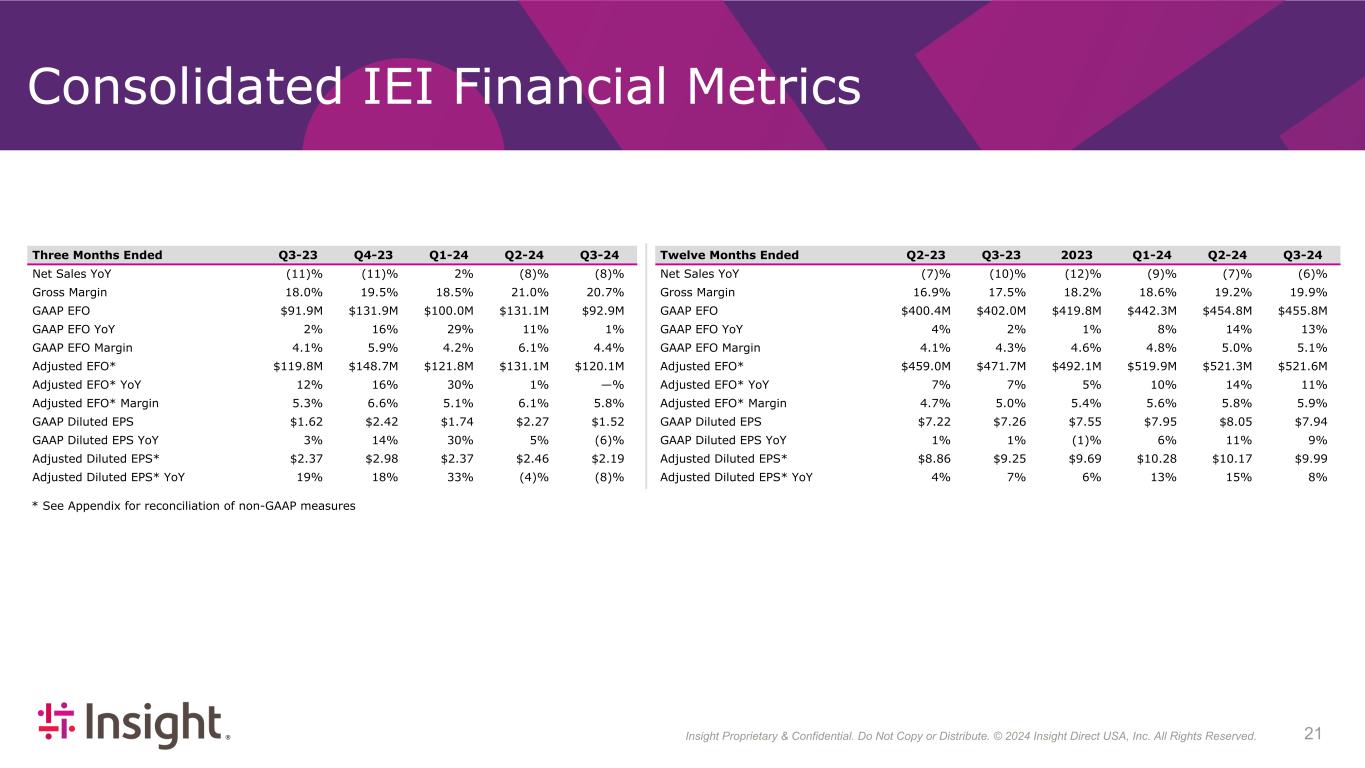
Insight Proprietary & Confidential. Do Not Copy or Distribute. © 2022 Insight Direct USA, Inc. All Rights Reserved. 214 * See Appendix for reconciliation of non-GAAP measures Consolidated IEI Financial Metrics Three Months Ended Q3-23 Q4-23 Q1-24 Q2-24 Q3-24 Net Sales YoY (11) % (11) % 2 % (8) % (8) % Gross Margin 18.0 % 19.5 % 18.5 % 21.0 % 20.7 % GAAP EFO $91.9M $131.9M $100.0M $131.1M $92.9M GAAP EFO YoY 2 % 16 % 29 % 11 % 1 % GAAP EFO Margin 4.1 % 5.9 % 4.2 % 6.1 % 4.4 % Adjusted EFO* $119.8M $148.7M $121.8M $131.1M $120.1M Adjusted EFO* YoY 12 % 16 % 30 % 1 % — % Adjusted EFO* Margin 5.3 % 6.6 % 5.1 % 6.1 % 5.8 % GAAP Diluted EPS $1.62 $2.42 $1.74 $2.27 $1.52 GAAP Diluted EPS YoY 3 % 14 % 30 % 5 % (6) % Adjusted Diluted EPS* $2.37 $2.98 $2.37 $2.46 $2.19 Adjusted Diluted EPS* YoY 19 % 18 % 33 % (4) % (8) % Twelve Months Ended Q2-23 Q3-23 2023 Q1-24 Q2-24 Q3-24 Net Sales YoY (7) % (10) % (12) % (9) % (7) % (6) % Gross Margin 16.9 % 17.5 % 18.2 % 18.6 % 19.2 % 19.9 % GAAP EFO $400.4M $402.0M $419.8M $442.3M $454.8M $455.8M GAAP EFO YoY 4 % 2 % 1 % 8 % 14 % 13 % GAAP EFO Margin 4.1 % 4.3 % 4.6 % 4.8 % 5.0 % 5.1 % Adjusted EFO* $459.0M $471.7M $492.1M $519.9M $521.3M $521.6M Adjusted EFO* YoY 7 % 7 % 5 % 10 % 14 % 11 % Adjusted EFO* Margin 4.7 % 5.0 % 5.4 % 5.6 % 5.8 % 5.9 % GAAP Diluted EPS $7.22 $7.26 $7.55 $7.95 $8.05 $7.94 GAAP Diluted EPS YoY 1 % 1 % (1) % 6 % 11 % 9 % Adjusted Diluted EPS* $8.86 $9.25 $9.69 $10.28 $10.17 $9.99 Adjusted Diluted EPS* YoY 4 % 7 % 6 % 13 % 15 % 8 %
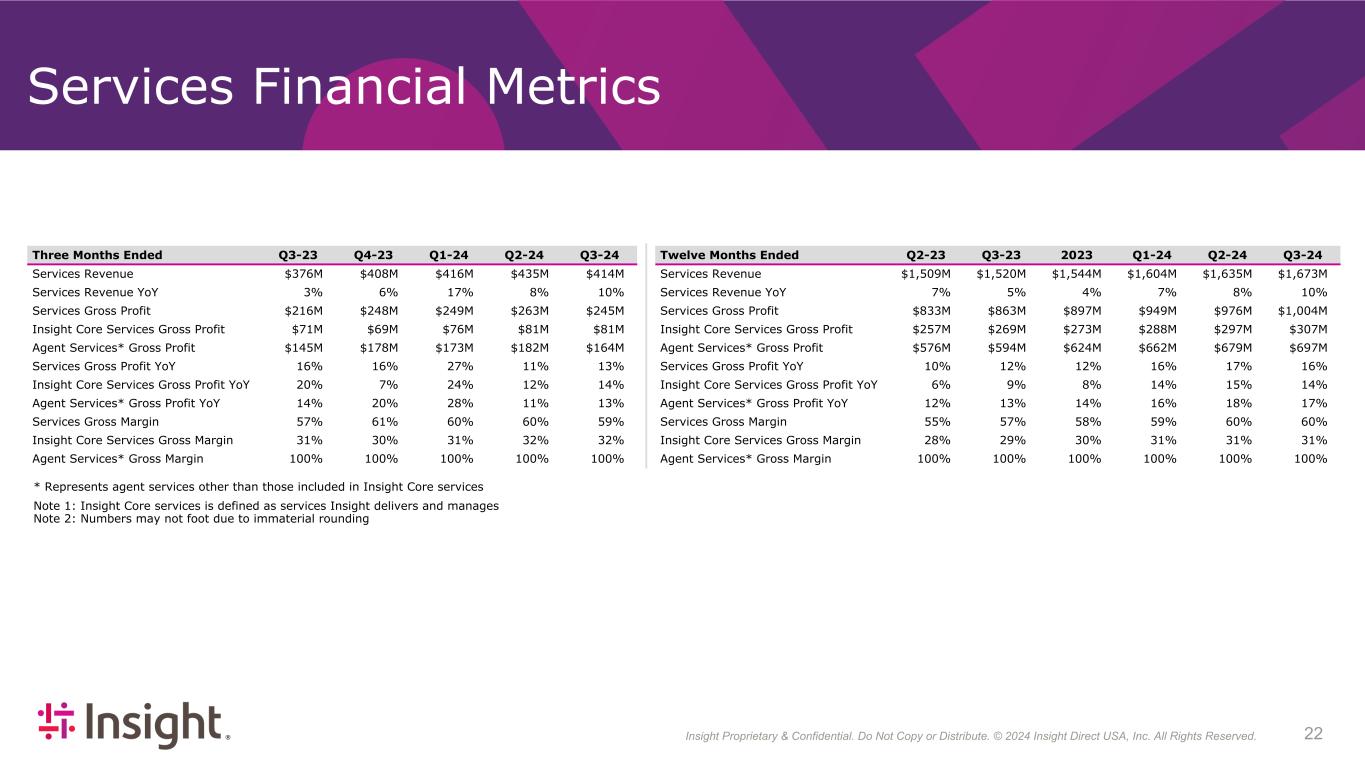
Insight Proprietary & Confidential. Do Not Copy or Distribute. © 2022 Insight Direct USA, Inc. All Rights Reserved. 224 Services Financial Metrics Three Months Ended Q3-23 Q4-23 Q1-24 Q2-24 Q3-24 Services Revenue $376M $408M $416M $435M $414M Services Revenue YoY 3% 6% 17% 8% 10% Services Gross Profit $216M $248M $249M $263M $245M Insight Core Services Gross Profit $71M $69M $76M $81M $81M Agent Services* Gross Profit $145M $178M $173M $182M $164M Services Gross Profit YoY 16% 16% 27% 11% 13% Insight Core Services Gross Profit YoY 20% 7% 24% 12% 14% Agent Services* Gross Profit YoY 14% 20% 28% 11% 13% Services Gross Margin 57% 61% 60% 60% 59% Insight Core Services Gross Margin 31% 30% 31% 32% 32% Agent Services* Gross Margin 100% 100% 100% 100% 100% Twelve Months Ended Q2-23 Q3-23 2023 Q1-24 Q2-24 Q3-24 Services Revenue $1,509M $1,520M $1,544M $1,604M $1,635M $1,673M Services Revenue YoY 7% 5% 4% 7% 8% 10% Services Gross Profit $833M $863M $897M $949M $976M $1,004M Insight Core Services Gross Profit $257M $269M $273M $288M $297M $307M Agent Services* Gross Profit $576M $594M $624M $662M $679M $697M Services Gross Profit YoY 10% 12% 12% 16% 17% 16% Insight Core Services Gross Profit YoY 6% 9% 8% 14% 15% 14% Agent Services* Gross Profit YoY 12% 13% 14% 16% 18% 17% Services Gross Margin 55% 57% 58% 59% 60% 60% Insight Core Services Gross Margin 28% 29% 30% 31% 31% 31% Agent Services* Gross Margin 100% 100% 100% 100% 100% 100% * Represents agent services other than those included in Insight Core services Note 1: Insight Core services is defined as services Insight delivers and manages Note 2: Numbers may not foot due to immaterial rounding
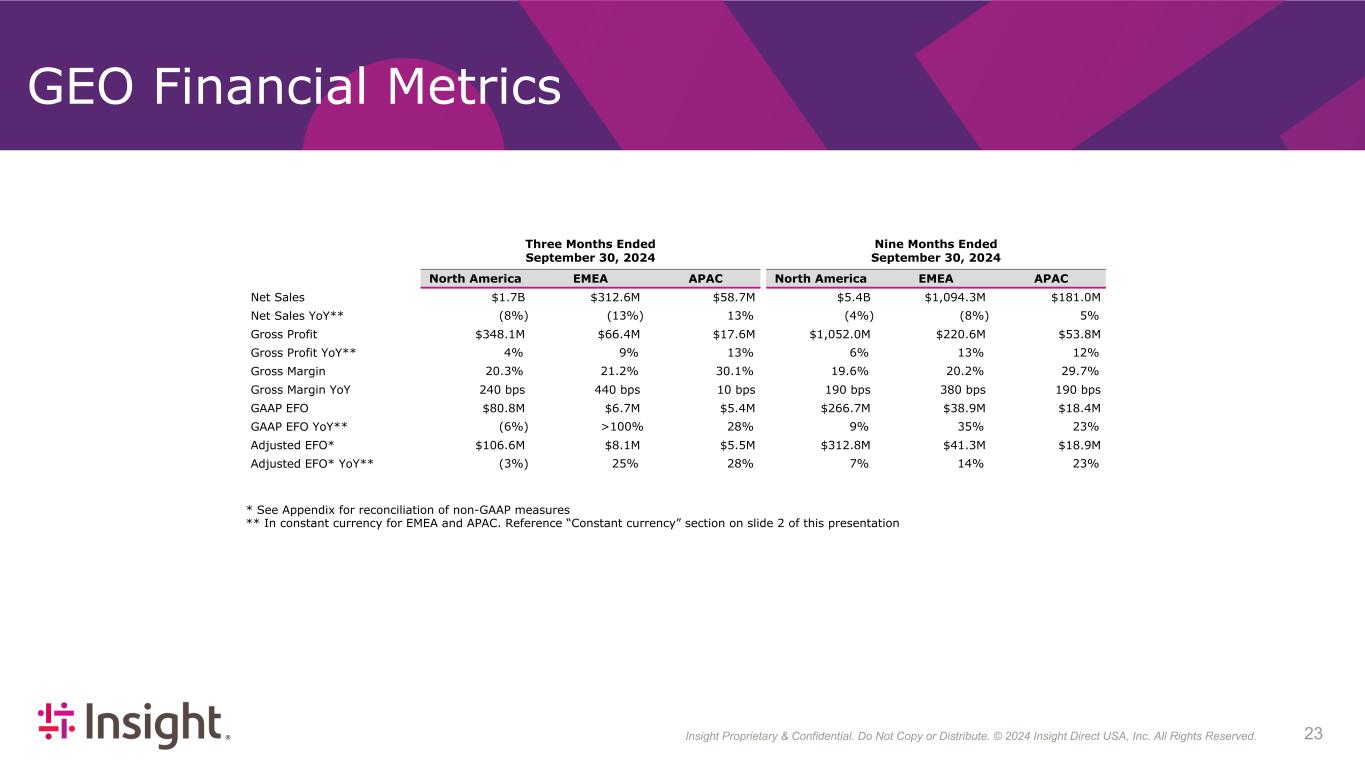
Insight Proprietary & Confidential. Do Not Copy or Distribute. © 2022 Insight Direct USA, Inc. All Rights Reserved. 234 * See Appendix for reconciliation of non-GAAP measures ** In constant currency for EMEA and APAC. Reference “Constant currency” section on slide 2 of this presentation GEO Financial Metrics Three Months Ended September 30, 2024 Nine Months Ended September 30, 2024 North America EMEA APAC North America EMEA APAC Net Sales $1.7B $312.6M $58.7M $5.4B $1,094.3M $181.0M Net Sales YoY** (8%) (13%) 13% (4%) (8%) 5% Gross Profit $348.1M $66.4M $17.6M $1,052.0M $220.6M $53.8M Gross Profit YoY** 4% 9% 13% 6% 13% 12% Gross Margin 20.3% 21.2% 30.1% 19.6% 20.2% 29.7% Gross Margin YoY 240 bps 440 bps 10 bps 190 bps 380 bps 190 bps GAAP EFO $80.8M $6.7M $5.4M $266.7M $38.9M $18.4M GAAP EFO YoY** (6%) >100% 28% 9% 35% 23% Adjusted EFO* $106.6M $8.1M $5.5M $312.8M $41.3M $18.9M Adjusted EFO* YoY** (3%) 25% 28% 7% 14% 23%
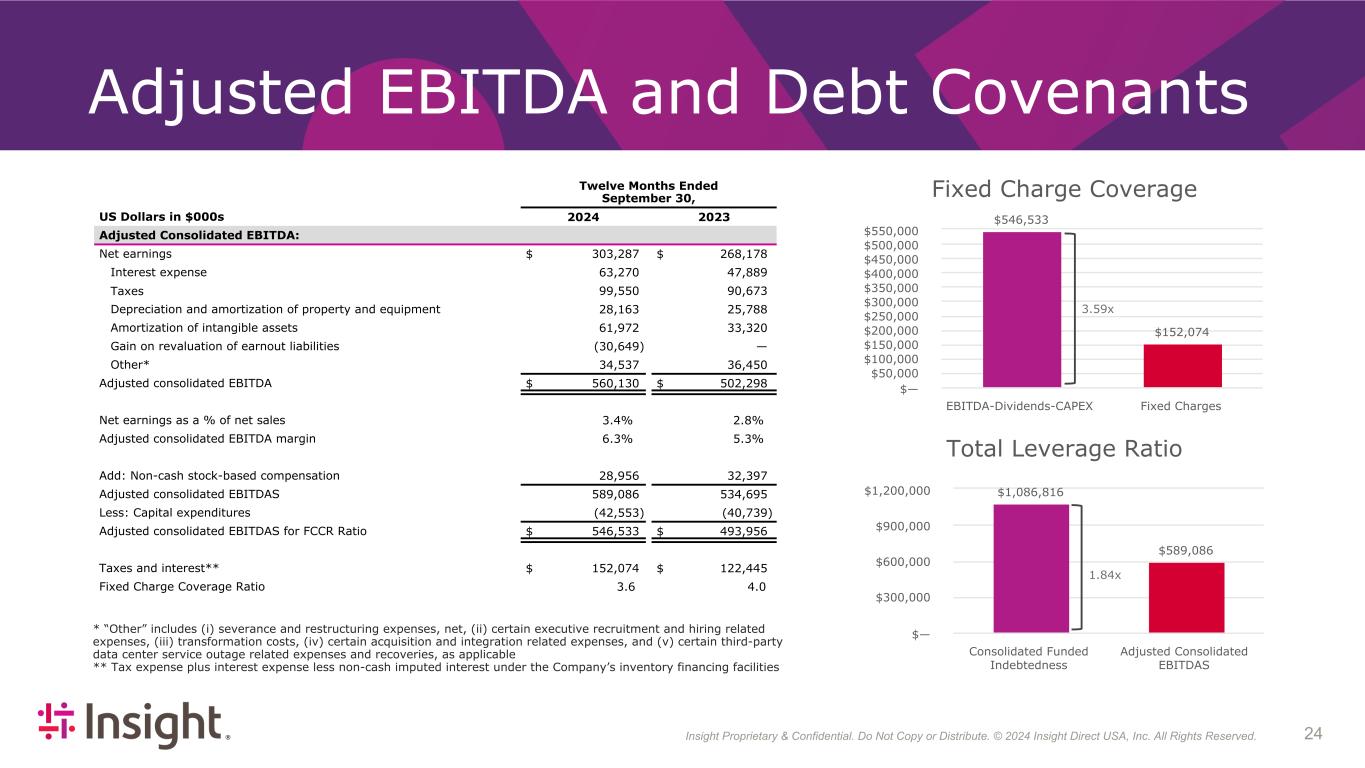
Insight Proprietary & Confidential. Do Not Copy or Distribute. © 2022 Insight Direct USA, Inc. All Rights Reserved. 244 Adjusted EBITDA and Debt Covenants Twelve Months Ended September 30, US Dollars in $000s 2024 2023 Adjusted Consolidated EBITDA: Net earnings $ 303,287 $ 268,178 Interest expense 63,270 47,889 Taxes 99,550 90,673 Depreciation and amortization of property and equipment 28,163 25,788 Amortization of intangible assets 61,972 33,320 Gain on revaluation of earnout liabilities (30,649) — Other* 34,537 36,450 Adjusted consolidated EBITDA $ 560,130 $ 502,298 Net earnings as a % of net sales 3.4 % 2.8 % Adjusted consolidated EBITDA margin 6.3 % 5.3 % Add: Non-cash stock-based compensation 28,956 32,397 Adjusted consolidated EBITDAS 589,086 534,695 Less: Capital expenditures (42,553) (40,739) Adjusted consolidated EBITDAS for FCCR Ratio $ 546,533 $ 493,956 Taxes and interest** $ 152,074 $ 122,445 Fixed Charge Coverage Ratio 3.6 4.0 Fixed Charge Coverage $546,533 $152,074 EBITDA-Dividends-CAPEX Fixed Charges $— $50,000 $100,000 $150,000 $200,000 $250,000 $300,000 $350,000 $400,000 $450,000 $500,000 $550,000 Total Leverage Ratio $1,086,816 $589,086 Consolidated Funded Indebtedness Adjusted Consolidated EBITDAS $— $300,000 $600,000 $900,000 $1,200,000 * “Other” includes (i) severance and restructuring expenses, net, (ii) certain executive recruitment and hiring related expenses, (iii) transformation costs, (iv) certain acquisition and integration related expenses, and (v) certain third-party data center service outage related expenses and recoveries, as applicable ** Tax expense plus interest expense less non-cash imputed interest under the Company’s inventory financing facilities 3.59x 1.84x

Insight Proprietary & Confidential. Do Not Copy or Distribute. © 2022 Insight Direct USA, Inc. All Rights Reserved. 254 Reconciliation of GAAP to Non-GAAP Financial Measures* Three Months Ended September 30, Nine Months Ended September 30, US Dollars in $000s 2024 2023 2022 2024 2023 Adjusted Consolidated Earnings from Operations: GAAP consolidated EFO $ 92,851 $ 91,862 $ 90,279 $ 323,910 $ 287,934 Amortization of intangible assets 18,702 8,648 8,986 50,984 25,243 Gain on revaluation of earnout liabilities (6,442) — — (30,649) — Other** 15,006 19,280 7,829 28,714 30,278 Adjusted non-GAAP consolidated EFO $ 120,117 $ 119,790 $ 107,094 $ 372,959 $ 343,455 GAAP EFO as a percentage of net sales 4.4 % 4.1 % 3.6 % 4.9 % 4.1 % Adjusted non-GAAP EFO as a percentage of net sales 5.8 % 5.3 % 4.2 % 5.6 % 4.9 % * The non-GAAP financial measures are referred to as “Adjusted”. Adjusted earnings from operations, Adjusted net earnings and Adjusted diluted earnings per share exclude (i) severance and restructuring expenses, net, (ii) certain executive recruitment and hiring-related expenses, (iii) amortization of intangible assets, (iv) transformation costs, (v) certain acquisition and integration-related expenses, (vi) gains and losses from revaluation of acquisition related earnout liabilities, (vii) certain third-party data center service outage related expenses and recoveries, and (viii) the tax effects of each of these items, as applicable ** Includes transformation costs of $5.1 million and $3.7 million for the three months ended September 30, 2024 and 2023, respectively, and $13.0 million and $14.0 million for the nine months ended September 30, 2024 and 2023, respectively. Includes certain third-party data center service outage expenses of $8.0 million for both the three and nine months ended September 30, 2023 and related recoveries of $3.4 million for the nine months ended September 30, 2024

Insight Proprietary & Confidential. Do Not Copy or Distribute. © 2022 Insight Direct USA, Inc. All Rights Reserved. 264 Reconciliation of GAAP to Non-GAAP Financial Measures* (continued) Three Months Ended September 30, Nine Months Ended September 30, US Dollars in $000s, except per share data 2024 2023 2022 2024 2023 Adjusted Consolidated Net Earnings: GAAP consolidated net earnings $ 58,208 $ 60,247 $ 57,316 $ 212,679 $ 190,701 Amortization of intangible assets 18,702 8,648 8,986 50,984 25,243 Gain on revaluation of earnout liabilities (6,442) — — (30,649) — Other** 15,006 19,280 7,829 28,714 30,278 Income taxes on non-GAAP adjustments (8,505) (6,496) (4,295) (14,678) (13,729) Adjusted non-GAAP consolidated net earnings $ 76,969 $ 81,679 $ 69,836 $ 247,050 $ 232,493 Adjusted Diluted Earnings Per Share: GAAP diluted EPS $ 1.52 $ 1.62 $ 1.58 $ 5.53 $ 5.13 Amortization of intangible assets 0.49 0.23 0.25 1.33 0.68 Gain on revaluation of earnout liabilities (0.17) — — (0.80) — Other 0.39 0.52 0.22 0.75 0.82 Income taxes on non-GAAP adjustments (0.22) (0.17) (0.12) (0.38) (0.37) Impact of benefit from note hedge 0.18 0.17 0.06 0.59 0.46 Adjusted non-GAAP diluted EPS $ 2.19 $ 2.37 $ 1.99 $ 7.02 $ 6.72 Shares used in diluted EPS calculation 38,331 37,203 36,340 38,445 37,149 Impact of benefit from note hedge (3,258) (2,774) (1,187) (3,269) (2,533) Shares used in Adjusted non-GAAP diluted EPS calculation 35,073 34,429 35,153 35,176 34,616 * The non-GAAP financial measures are referred to as “Adjusted”. Adjusted earnings from operations, Adjusted net earnings and Adjusted diluted earnings per share exclude (i) severance and restructuring expenses, net, (ii) certain executive recruitment and hiring-related expenses, (iii) amortization of intangible assets, (iv) transformation costs, (v) certain acquisition and integration-related expenses, (vi) gains and losses from revaluation of acquisition related earnout liabilities, (vii) certain third-party data center service outage related expenses and recoveries, and (viii) the tax effects of each of these items, as applicable ** Includes transformation costs of $5.1 million and $3.7 million for the three months ended September 30, 2024 and 2023, respectively, and $13.0 million and $14.0 million for the nine months ended September 30, 2024 and 2023, respectively. Includes certain third-party data center service outage expenses of $8.0 million for both the three and nine months ended September 30, 2023 and related recoveries of $3.4 million for the nine months ended September 30, 2024
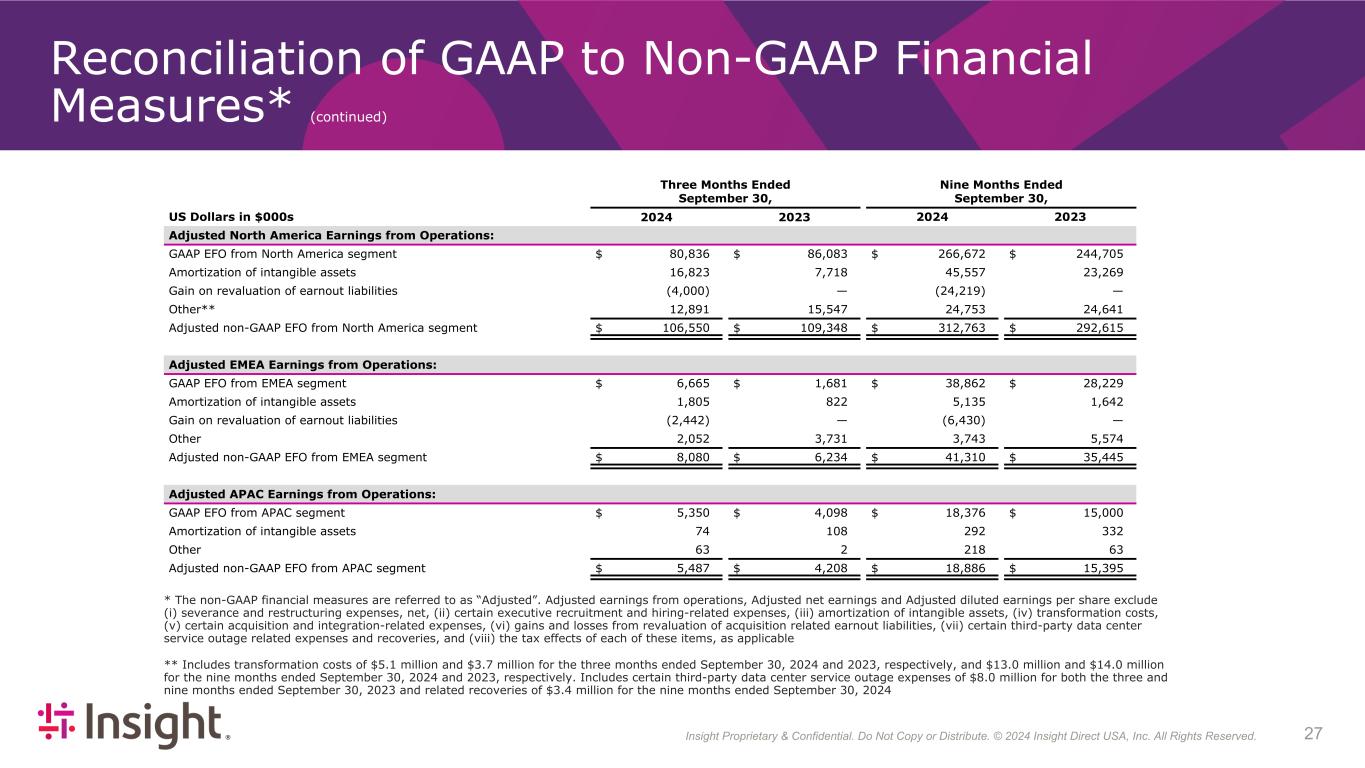
Insight Proprietary & Confidential. Do Not Copy or Distribute. © 2022 Insight Direct USA, Inc. All Rights Reserved. 274 Reconciliation of GAAP to Non-GAAP Financial Measures* (continued) Three Months Ended September 30, Nine Months Ended September 30, US Dollars in $000s 2024 2023 2024 2023 Adjusted North America Earnings from Operations: GAAP EFO from North America segment $ 80,836 $ 86,083 $ 266,672 $ 244,705 Amortization of intangible assets 16,823 7,718 45,557 23,269 Gain on revaluation of earnout liabilities (4,000) — (24,219) — Other** 12,891 15,547 24,753 24,641 Adjusted non-GAAP EFO from North America segment $ 106,550 $ 109,348 $ 312,763 $ 292,615 Adjusted EMEA Earnings from Operations: GAAP EFO from EMEA segment $ 6,665 $ 1,681 $ 38,862 $ 28,229 Amortization of intangible assets 1,805 822 5,135 1,642 Gain on revaluation of earnout liabilities (2,442) — (6,430) — Other 2,052 3,731 3,743 5,574 Adjusted non-GAAP EFO from EMEA segment $ 8,080 $ 6,234 $ 41,310 $ 35,445 Adjusted APAC Earnings from Operations: GAAP EFO from APAC segment $ 5,350 $ 4,098 $ 18,376 $ 15,000 Amortization of intangible assets 74 108 292 332 Other 63 2 218 63 Adjusted non-GAAP EFO from APAC segment $ 5,487 $ 4,208 $ 18,886 $ 15,395 * The non-GAAP financial measures are referred to as “Adjusted”. Adjusted earnings from operations, Adjusted net earnings and Adjusted diluted earnings per share exclude (i) severance and restructuring expenses, net, (ii) certain executive recruitment and hiring-related expenses, (iii) amortization of intangible assets, (iv) transformation costs, (v) certain acquisition and integration-related expenses, (vi) gains and losses from revaluation of acquisition related earnout liabilities, (vii) certain third-party data center service outage related expenses and recoveries, and (viii) the tax effects of each of these items, as applicable ** Includes transformation costs of $5.1 million and $3.7 million for the three months ended September 30, 2024 and 2023, respectively, and $13.0 million and $14.0 million for the nine months ended September 30, 2024 and 2023, respectively. Includes certain third-party data center service outage expenses of $8.0 million for both the three and nine months ended September 30, 2023 and related recoveries of $3.4 million for the nine months ended September 30, 2024
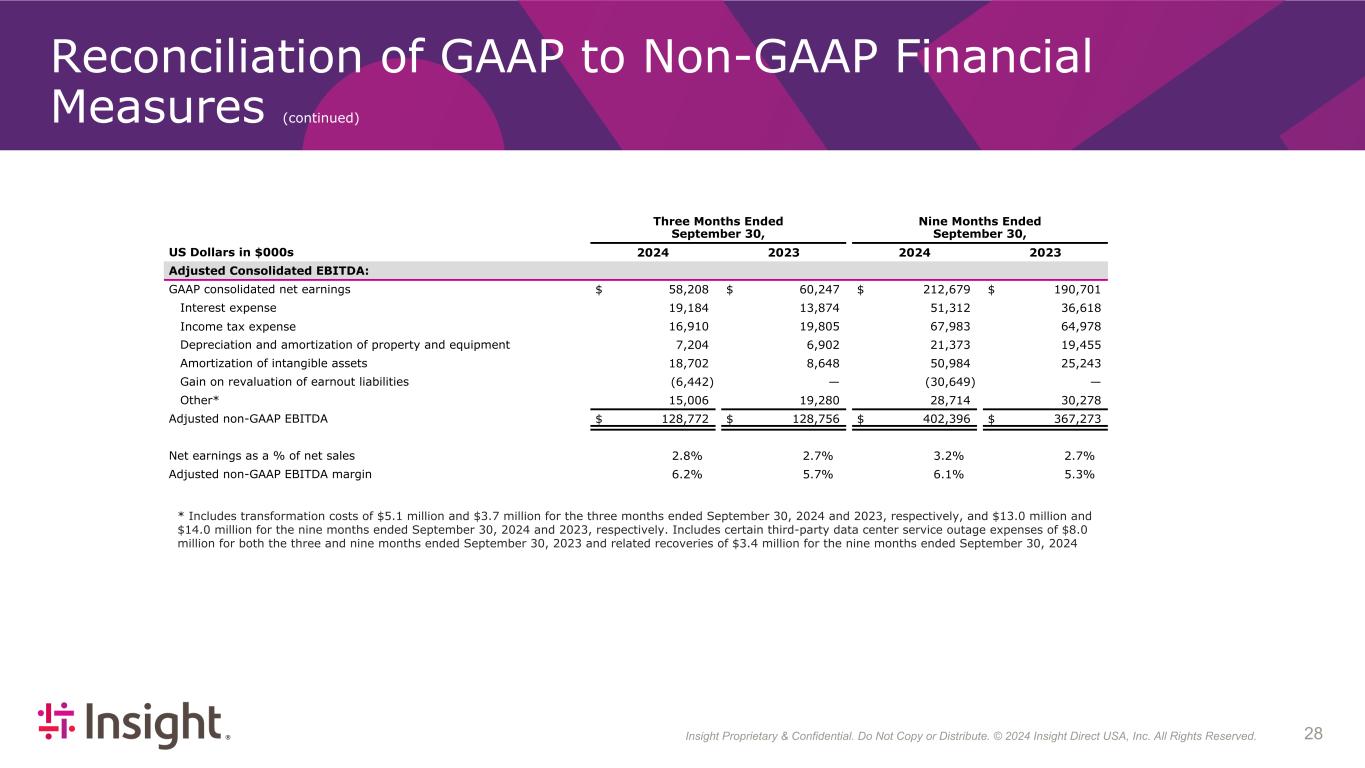
Insight Proprietary & Confidential. Do Not Copy or Distribute. © 2022 Insight Direct USA, Inc. All Rights Reserved. 284 Three Months Ended Nine Months Ended September 30, September 30, US Dollars in $000s 2024 2023 2024 2023 Adjusted Consolidated EBITDA: GAAP consolidated net earnings $ 58,208 $ 60,247 $ 212,679 $ 190,701 Interest expense 19,184 13,874 51,312 36,618 Income tax expense 16,910 19,805 67,983 64,978 Depreciation and amortization of property and equipment 7,204 6,902 21,373 19,455 Amortization of intangible assets 18,702 8,648 50,984 25,243 Gain on revaluation of earnout liabilities (6,442) — (30,649) — Other* 15,006 19,280 28,714 30,278 Adjusted non-GAAP EBITDA $ 128,772 $ 128,756 $ 402,396 $ 367,273 Net earnings as a % of net sales 2.8 % 2.7 % 3.2 % 2.7 % Adjusted non-GAAP EBITDA margin 6.2 % 5.7 % 6.1 % 5.3 % * Includes transformation costs of $5.1 million and $3.7 million for the three months ended September 30, 2024 and 2023, respectively, and $13.0 million and $14.0 million for the nine months ended September 30, 2024 and 2023, respectively. Includes certain third-party data center service outage expenses of $8.0 million for both the three and nine months ended September 30, 2023 and related recoveries of $3.4 million for the nine months ended September 30, 2024 Reconciliation of GAAP to Non-GAAP Financial Measures (continued)
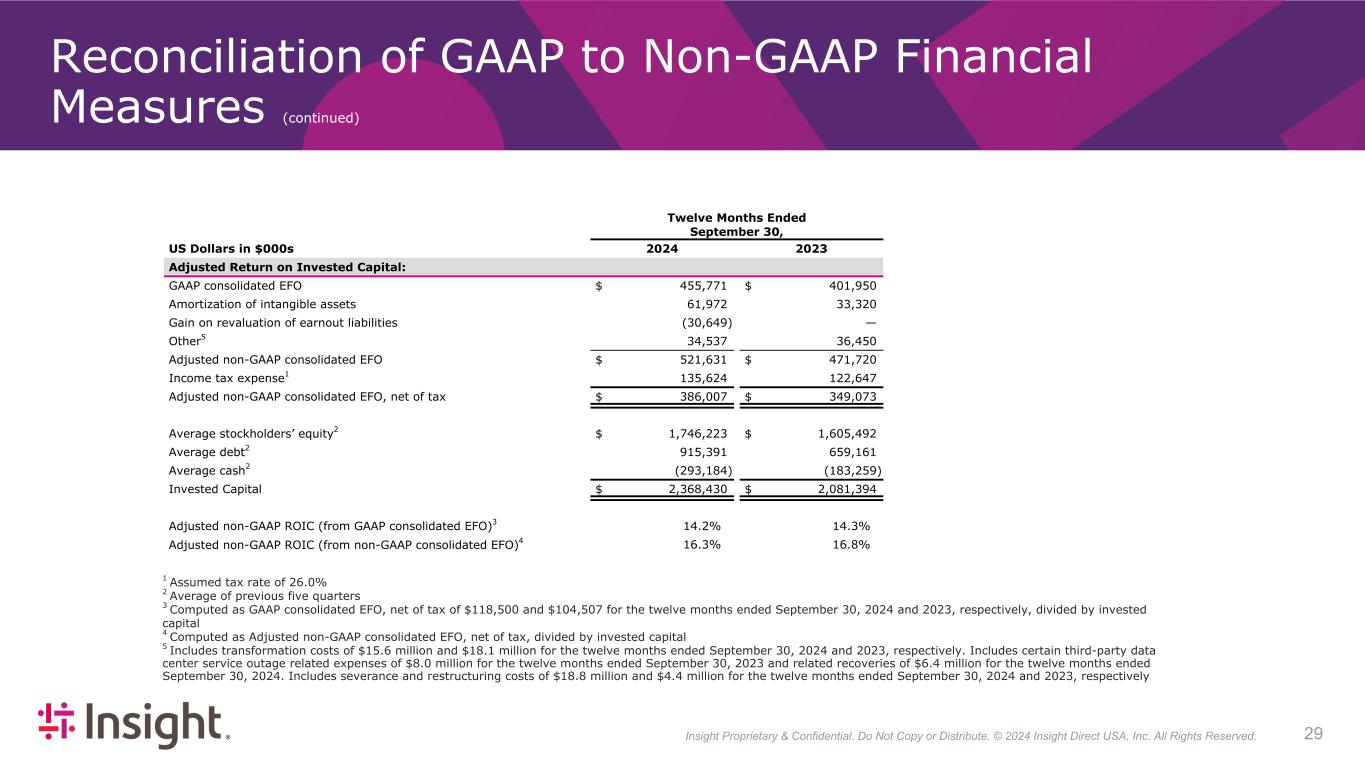
Insight Proprietary & Confidential. Do Not Copy or Distribute. © 2022 Insight Direct USA, Inc. All Rights Reserved. 294 Reconciliation of GAAP to Non-GAAP Financial Measures (continued) 1 Assumed tax rate of 26.0% 2 Average of previous five quarters 3 Computed as GAAP consolidated EFO, net of tax of $118,500 and $104,507 for the twelve months ended September 30, 2024 and 2023, respectively, divided by invested capital 4 Computed as Adjusted non-GAAP consolidated EFO, net of tax, divided by invested capital 5 Includes transformation costs of $15.6 million and $18.1 million for the twelve months ended September 30, 2024 and 2023, respectively. Includes certain third-party data center service outage related expenses of $8.0 million for the twelve months ended September 30, 2023 and related recoveries of $6.4 million for the twelve months ended September 30, 2024. Includes severance and restructuring costs of $18.8 million and $4.4 million for the twelve months ended September 30, 2024 and 2023, respectively Twelve Months Ended September 30, US Dollars in $000s 2024 2023 Adjusted Return on Invested Capital: GAAP consolidated EFO $ 455,771 $ 401,950 Amortization of intangible assets 61,972 33,320 Gain on revaluation of earnout liabilities (30,649) — Other5 34,537 36,450 Adjusted non-GAAP consolidated EFO $ 521,631 $ 471,720 Income tax expense1 135,624 122,647 Adjusted non-GAAP consolidated EFO, net of tax $ 386,007 $ 349,073 Average stockholders’ equity2 $ 1,746,223 $ 1,605,492 Average debt2 915,391 659,161 Average cash2 (293,184) (183,259) Invested Capital $ 2,368,430 $ 2,081,394 Adjusted non-GAAP ROIC (from GAAP consolidated EFO)3 14.2 % 14.3 % Adjusted non-GAAP ROIC (from non-GAAP consolidated EFO)4 16.3 % 16.8 %
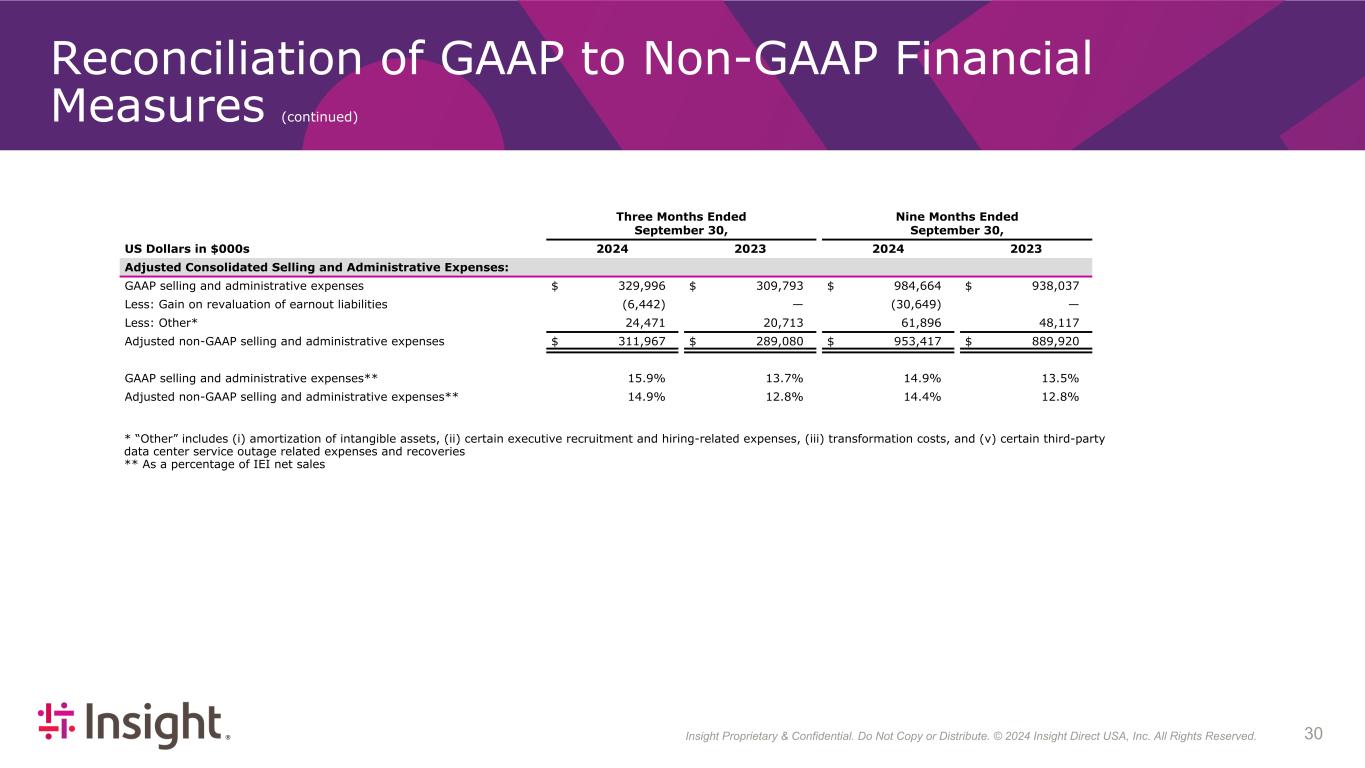
Insight Proprietary & Confidential. Do Not Copy or Distribute. © 2022 Insight Direct USA, Inc. All Rights Reserved. 304 Reconciliation of GAAP to Non-GAAP Financial Measures (continued) Three Months Ended September 30, Nine Months Ended September 30, US Dollars in $000s 2024 2023 2024 2023 Adjusted Consolidated Selling and Administrative Expenses: GAAP selling and administrative expenses $ 329,996 $ 309,793 $ 984,664 $ 938,037 Less: Gain on revaluation of earnout liabilities (6,442) — (30,649) — Less: Other* 24,471 20,713 61,896 48,117 Adjusted non-GAAP selling and administrative expenses $ 311,967 $ 289,080 $ 953,417 $ 889,920 GAAP selling and administrative expenses** 15.9 % 13.7 % 14.9 % 13.5 % Adjusted non-GAAP selling and administrative expenses** 14.9 % 12.8 % 14.4 % 12.8 % $ 6,629,033 $ 6,939,829 * “Other” includes (i) amortization of intangible assets, (ii) certain executive recruitment and hiring-related expenses, (iii) transformation costs, and (v) certain third-party data center service outage related expenses and recoveries ** As a percentage of IEI net sales

Insight Proprietary & Confidential. Do Not Copy or Distribute. © 2022 Insight Direct USA, Inc. All Rights Reserved. 314 Reconciliation of GAAP to Non-GAAP Financial Measures* (continued) Twelve Months Ended September 30, US Dollars in $000s 2024 Adjusted Free Cash Flow: Net cash provided by operating activities $ 623,520 Less: Purchases of property and equipment 42,553 Adjusted non-GAAP free cash flow $ 580,967 Net cash used in investing activities $ (697,639) Net cash provided by financing activities $ 136,393 Adjusted Consolidated Net Earnings: GAAP consolidated net earnings $ 303,287 Amortization of intangible assets 61,972 Gain on revaluation of earnout liabilities (30,649) Other 34,537 Income taxes on non-GAAP adjustments (18,965) Adjusted non-GAAP consolidated net earnings $ 350,182 Net cash provided by operating activities as % net earnings 206 % Adjusted free cash flow as % of adjusted net earnings 166 % * The non-GAAP financial measures are referred to as “Adjusted”. Adjusted earnings from operations, Adjusted net earnings and Adjusted diluted earnings per share exclude (i) severance and restructuring expenses, net, (ii) certain executive recruitment and hiring-related expenses, (iii) amortization of intangible assets, (iv) transformation costs, (v) certain acquisition and integration-related expenses, (vi) gains and losses from revaluation of acquisition related earnout liabilities, (vii) certain third-party data center service outage related expenses and recoveries, and (viii) the tax effects of each of these items, as applicable
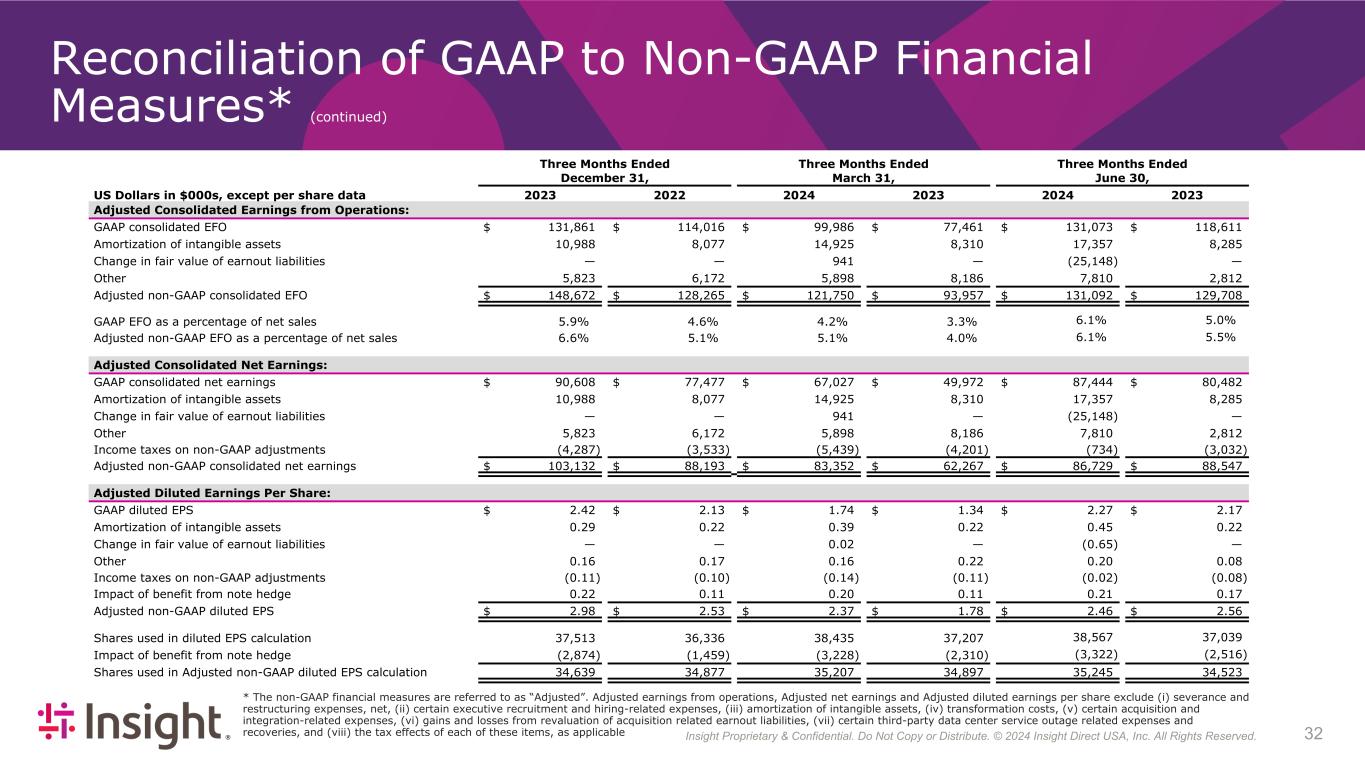
Insight Proprietary & Confidential. Do Not Copy or Distribute. © 2022 Insight Direct USA, Inc. All Rights Reserved. 324 Reconciliation of GAAP to Non-GAAP Financial Measures* (continued) Three Months Ended Three Months Ended Three Months Ended December 31, March 31, June 30, US Dollars in $000s, except per share data 2023 2022 2024 2023 2024 2023 Adjusted Consolidated Earnings from Operations: GAAP consolidated EFO $ 131,861 $ 114,016 $ 99,986 $ 77,461 $ 131,073 $ 118,611 Amortization of intangible assets 10,988 8,077 14,925 8,310 17,357 8,285 Change in fair value of earnout liabilities — — 941 — (25,148) — Other 5,823 6,172 5,898 8,186 7,810 2,812 Adjusted non-GAAP consolidated EFO $ 148,672 $ 128,265 $ 121,750 $ 93,957 $ 131,092 $ 129,708 GAAP EFO as a percentage of net sales 5.9 % 4.6 % 4.2 % 3.3 % 6.1% 5.0% Adjusted non-GAAP EFO as a percentage of net sales 6.6 % 5.1 % 5.1 % 4.0 % 6.1% 5.5% Adjusted Consolidated Net Earnings: GAAP consolidated net earnings $ 90,608 $ 77,477 $ 67,027 $ 49,972 $ 87,444 $ 80,482 Amortization of intangible assets 10,988 8,077 14,925 8,310 17,357 8,285 Change in fair value of earnout liabilities — — 941 — (25,148) — Other 5,823 6,172 5,898 8,186 7,810 2,812 Income taxes on non-GAAP adjustments (4,287) (3,533) (5,439) (4,201) (734) (3,032) Adjusted non-GAAP consolidated net earnings $ 103,132 $ 88,193 $ 83,352 $ 62,267 $ 86,729 $ 88,547 Adjusted Diluted Earnings Per Share: GAAP diluted EPS $ 2.42 $ 2.13 $ 1.74 $ 1.34 $ 2.27 $ 2.17 Amortization of intangible assets 0.29 0.22 0.39 0.22 0.45 0.22 Change in fair value of earnout liabilities — — 0.02 — (0.65) — Other 0.16 0.17 0.16 0.22 0.20 0.08 Income taxes on non-GAAP adjustments (0.11) (0.10) (0.14) (0.11) (0.02) (0.08) Impact of benefit from note hedge 0.22 0.11 0.20 0.11 0.21 0.17 Adjusted non-GAAP diluted EPS $ 2.98 $ 2.53 $ 2.37 $ 1.78 $ 2.46 $ 2.56 Shares used in diluted EPS calculation 37,513 36,336 38,435 37,207 38,567 37,039 Impact of benefit from note hedge (2,874) (1,459) (3,228) (2,310) (3,322) (2,516) Shares used in Adjusted non-GAAP diluted EPS calculation 34,639 34,877 35,207 34,897 35,245 34,523 * The non-GAAP financial measures are referred to as “Adjusted”. Adjusted earnings from operations, Adjusted net earnings and Adjusted diluted earnings per share exclude (i) severance and restructuring expenses, net, (ii) certain executive recruitment and hiring-related expenses, (iii) amortization of intangible assets, (iv) transformation costs, (v) certain acquisition and integration-related expenses, (vi) gains and losses from revaluation of acquisition related earnout liabilities, (vii) certain third-party data center service outage related expenses and recoveries, and (viii) the tax effects of each of these items, as applicable
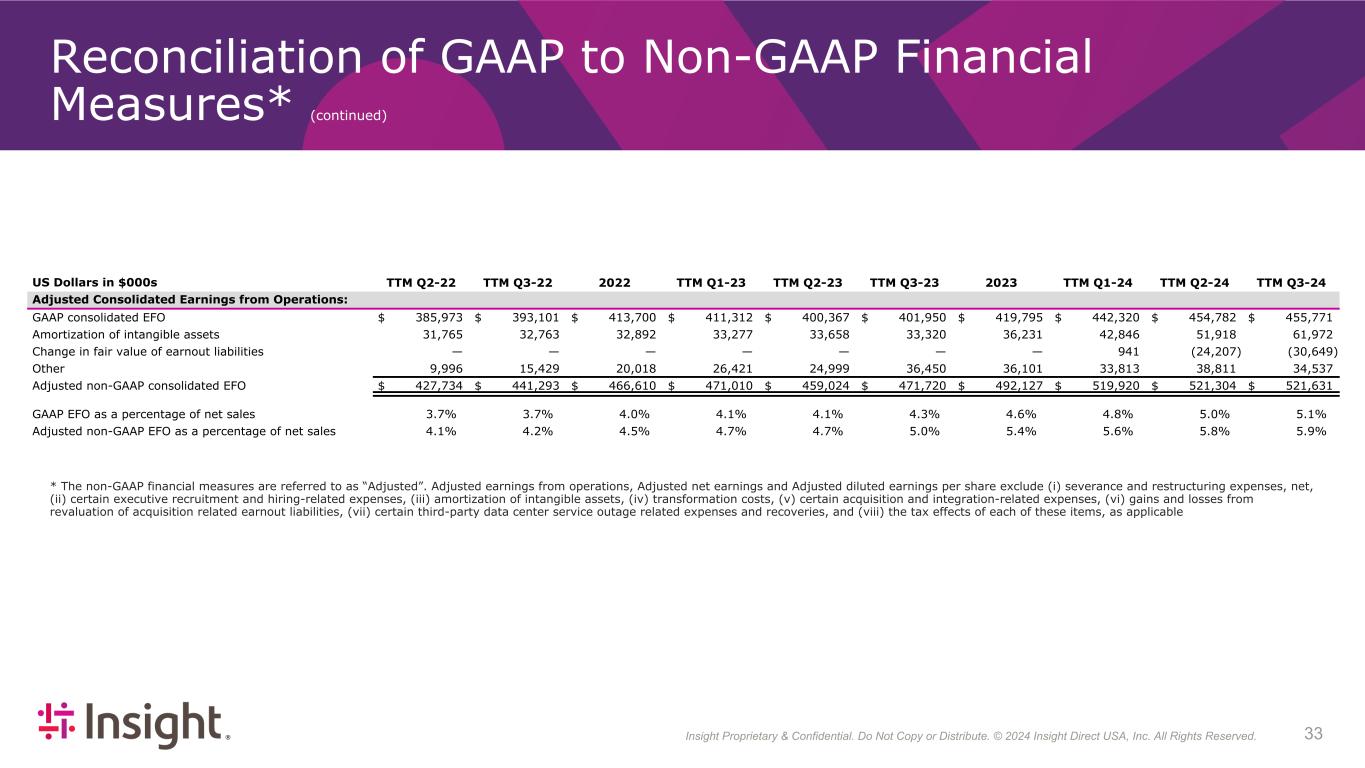
Insight Proprietary & Confidential. Do Not Copy or Distribute. © 2022 Insight Direct USA, Inc. All Rights Reserved. 334 Reconciliation of GAAP to Non-GAAP Financial Measures* (continued) * The non-GAAP financial measures are referred to as “Adjusted”. Adjusted earnings from operations, Adjusted net earnings and Adjusted diluted earnings per share exclude (i) severance and restructuring expenses, net, (ii) certain executive recruitment and hiring-related expenses, (iii) amortization of intangible assets, (iv) transformation costs, (v) certain acquisition and integration-related expenses, (vi) gains and losses from revaluation of acquisition related earnout liabilities, (vii) certain third-party data center service outage related expenses and recoveries, and (viii) the tax effects of each of these items, as applicable US Dollars in $000s TTM Q2-22 TTM Q3-22 2022 TTM Q1-23 TTM Q2-23 TTM Q3-23 2023 TTM Q1-24 TTM Q2-24 TTM Q3-24 Adjusted Consolidated Earnings from Operations: GAAP consolidated EFO $ 385,973 $ 393,101 $ 413,700 $ 411,312 $ 400,367 $ 401,950 $ 419,795 $ 442,320 $ 454,782 $ 455,771 Amortization of intangible assets 31,765 32,763 32,892 33,277 33,658 33,320 36,231 42,846 51,918 61,972 Change in fair value of earnout liabilities — — — — — — — 941 (24,207) (30,649) Other 9,996 15,429 20,018 26,421 24,999 36,450 36,101 33,813 38,811 34,537 Adjusted non-GAAP consolidated EFO $ 427,734 $ 441,293 $ 466,610 $ 471,010 $ 459,024 $ 471,720 $ 492,127 $ 519,920 $ 521,304 $ 521,631 GAAP EFO as a percentage of net sales 3.7 % 3.7 % 4.0 % 4.1 % 4.1 % 4.3 % 4.6 % 4.8 % 5.0 % 5.1 % Adjusted non-GAAP EFO as a percentage of net sales 4.1 % 4.2 % 4.5 % 4.7 % 4.7 % 5.0 % 5.4 % 5.6 % 5.8 % 5.9 %
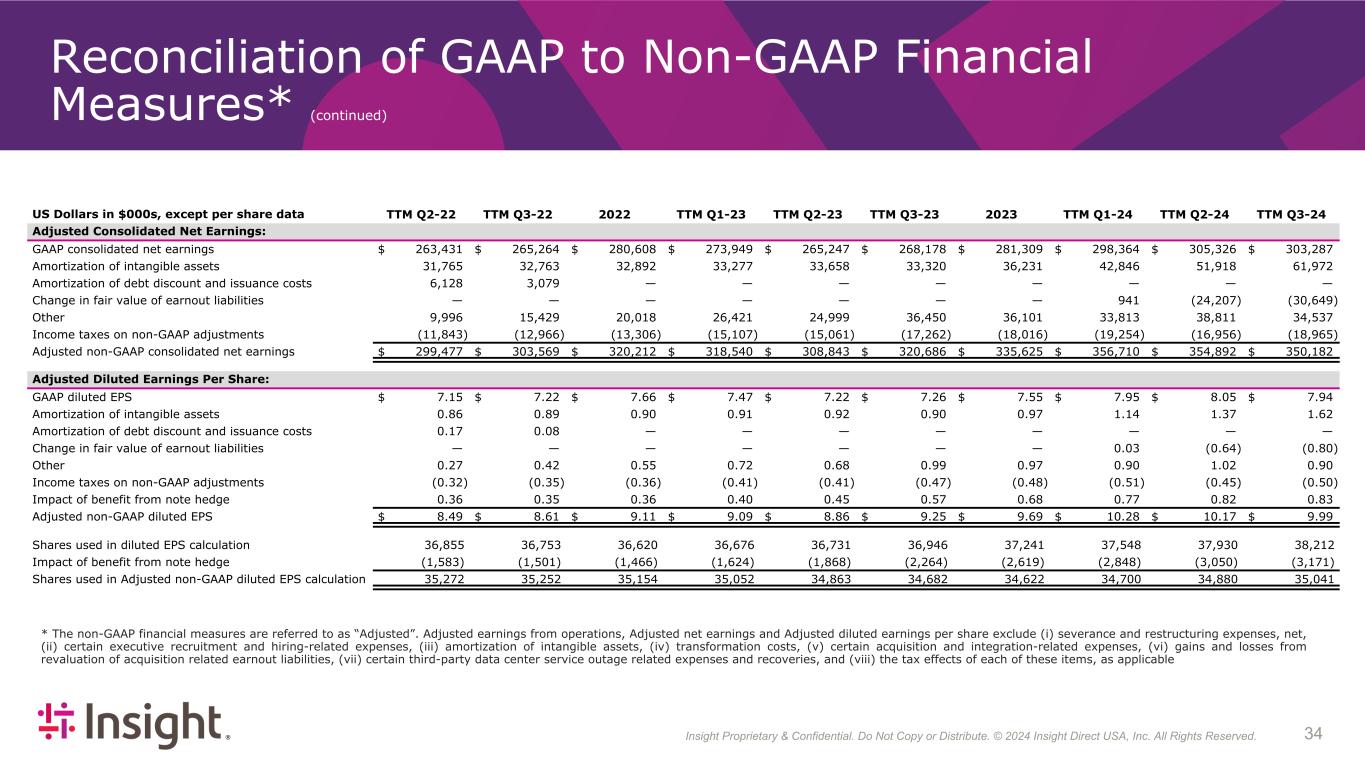
Insight Proprietary & Confidential. Do Not Copy or Distribute. © 2022 Insight Direct USA, Inc. All Rights Reserved. 344 Reconciliation of GAAP to Non-GAAP Financial Measures* (continued) * The non-GAAP financial measures are referred to as “Adjusted”. Adjusted earnings from operations, Adjusted net earnings and Adjusted diluted earnings per share exclude (i) severance and restructuring expenses, net, (ii) certain executive recruitment and hiring-related expenses, (iii) amortization of intangible assets, (iv) transformation costs, (v) certain acquisition and integration-related expenses, (vi) gains and losses from revaluation of acquisition related earnout liabilities, (vii) certain third-party data center service outage related expenses and recoveries, and (viii) the tax effects of each of these items, as applicable US Dollars in $000s, except per share data TTM Q2-22 TTM Q3-22 2022 TTM Q1-23 TTM Q2-23 TTM Q3-23 2023 TTM Q1-24 TTM Q2-24 TTM Q3-24 Adjusted Consolidated Net Earnings: GAAP consolidated net earnings $ 263,431 $ 265,264 $ 280,608 $ 273,949 $ 265,247 $ 268,178 $ 281,309 $ 298,364 $ 305,326 $ 303,287 Amortization of intangible assets 31,765 32,763 32,892 33,277 33,658 33,320 36,231 42,846 51,918 61,972 Amortization of debt discount and issuance costs 6,128 3,079 — — — — — — — — Change in fair value of earnout liabilities — — — — — — — 941 (24,207) (30,649) Other 9,996 15,429 20,018 26,421 24,999 36,450 36,101 33,813 38,811 34,537 Income taxes on non-GAAP adjustments (11,843) (12,966) (13,306) (15,107) (15,061) (17,262) (18,016) (19,254) (16,956) (18,965) Adjusted non-GAAP consolidated net earnings $ 299,477 $ 303,569 $ 320,212 $ 318,540 $ 308,843 $ 320,686 $ 335,625 $ 356,710 $ 354,892 $ 350,182 Adjusted Diluted Earnings Per Share: GAAP diluted EPS $ 7.15 $ 7.22 $ 7.66 $ 7.47 $ 7.22 $ 7.26 $ 7.55 $ 7.95 $ 8.05 $ 7.94 Amortization of intangible assets 0.86 0.89 0.90 0.91 0.92 0.90 0.97 1.14 1.37 1.62 Amortization of debt discount and issuance costs 0.17 0.08 — — — — — — — — Change in fair value of earnout liabilities — — — — — — — 0.03 (0.64) (0.80) Other 0.27 0.42 0.55 0.72 0.68 0.99 0.97 0.90 1.02 0.90 Income taxes on non-GAAP adjustments (0.32) (0.35) (0.36) (0.41) (0.41) (0.47) (0.48) (0.51) (0.45) (0.50) Impact of benefit from note hedge 0.36 0.35 0.36 0.40 0.45 0.57 0.68 0.77 0.82 0.83 Adjusted non-GAAP diluted EPS $ 8.49 $ 8.61 $ 9.11 $ 9.09 $ 8.86 $ 9.25 $ 9.69 $ 10.28 $ 10.17 $ 9.99 Shares used in diluted EPS calculation 36,855 36,753 36,620 36,676 36,731 36,946 37,241 37,548 37,930 38,212 Impact of benefit from note hedge (1,583) (1,501) (1,466) (1,624) (1,868) (2,264) (2,619) (2,848) (3,050) (3,171) Shares used in Adjusted non-GAAP diluted EPS calculation 35,272 35,252 35,154 35,052 34,863 34,682 34,622 34,700 34,880 35,041
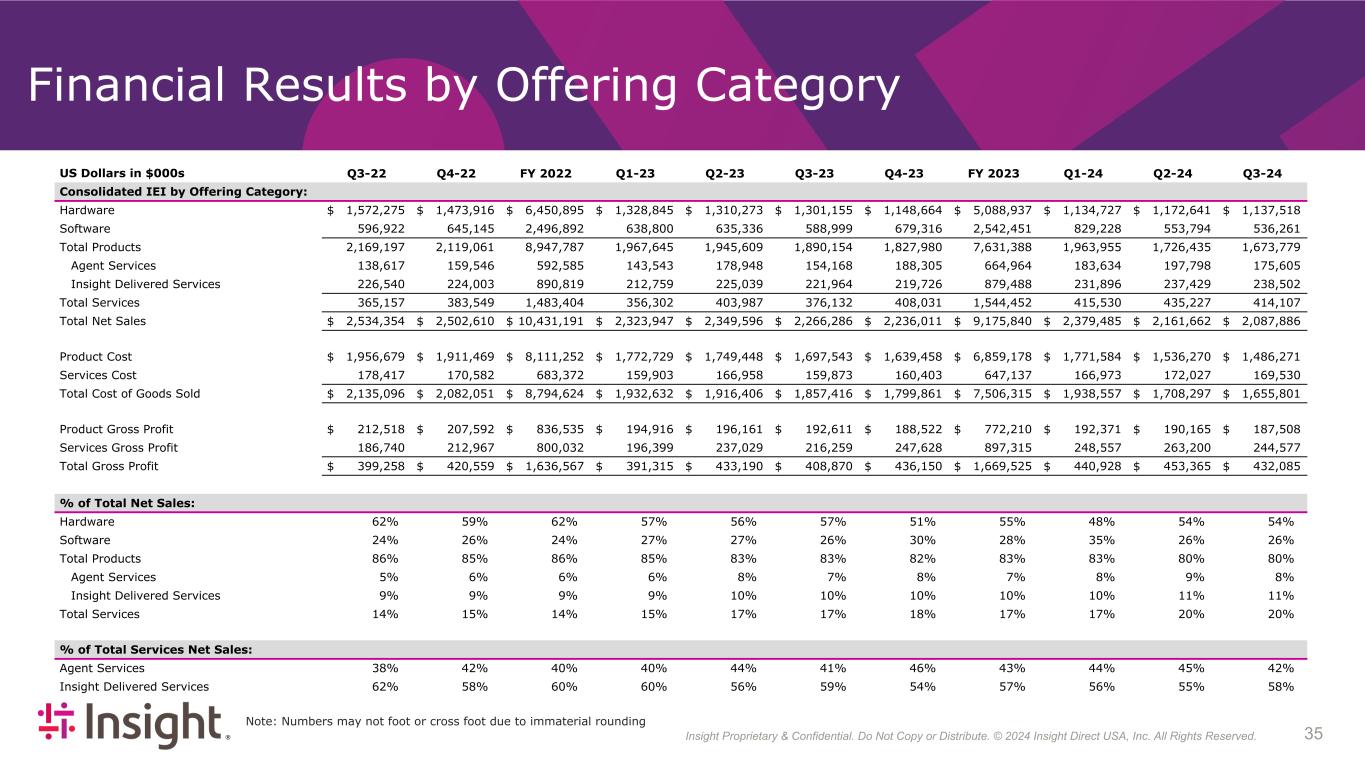
Insight Proprietary & Confidential. Do Not Copy or Distribute. © 2022 Insight Direct USA, Inc. All Rights Reserved. 354 Financial Results by Offering Category US Dollars in $000s Q3-22 Q4-22 FY 2022 Q1-23 Q2-23 Q3-23 Q4-23 FY 2023 Q1-24 Q2-24 Q3-24 Consolidated IEI by Offering Category: Hardware $ 1,572,275 $ 1,473,916 $ 6,450,895 $ 1,328,845 $ 1,310,273 $ 1,301,155 $ 1,148,664 $ 5,088,937 $ 1,134,727 $ 1,172,641 $ 1,137,518 Software 596,922 645,145 2,496,892 638,800 635,336 588,999 679,316 2,542,451 829,228 553,794 536,261 Total Products 2,169,197 2,119,061 8,947,787 1,967,645 1,945,609 1,890,154 1,827,980 7,631,388 1,963,955 1,726,435 1,673,779 Agent Services 138,617 159,546 592,585 143,543 178,948 154,168 188,305 664,964 183,634 197,798 175,605 Insight Delivered Services 226,540 224,003 890,819 212,759 225,039 221,964 219,726 879,488 231,896 237,429 238,502 Total Services 365,157 383,549 1,483,404 356,302 403,987 376,132 408,031 1,544,452 415,530 435,227 414,107 Total Net Sales $ 2,534,354 $ 2,502,610 $ 10,431,191 $ 2,323,947 $ 2,349,596 $ 2,266,286 $ 2,236,011 $ 9,175,840 $ 2,379,485 $ 2,161,662 $ 2,087,886 Product Cost $ 1,956,679 $ 1,911,469 $ 8,111,252 $ 1,772,729 $ 1,749,448 $ 1,697,543 $ 1,639,458 $ 6,859,178 $ 1,771,584 $ 1,536,270 $ 1,486,271 Services Cost 178,417 170,582 683,372 159,903 166,958 159,873 160,403 647,137 166,973 172,027 169,530 Total Cost of Goods Sold $ 2,135,096 $ 2,082,051 $ 8,794,624 $ 1,932,632 $ 1,916,406 $ 1,857,416 $ 1,799,861 $ 7,506,315 $ 1,938,557 $ 1,708,297 $ 1,655,801 Product Gross Profit $ 212,518 $ 207,592 $ 836,535 $ 194,916 $ 196,161 $ 192,611 $ 188,522 $ 772,210 $ 192,371 $ 190,165 $ 187,508 Services Gross Profit 186,740 212,967 800,032 196,399 237,029 216,259 247,628 897,315 248,557 263,200 244,577 Total Gross Profit $ 399,258 $ 420,559 $ 1,636,567 $ 391,315 $ 433,190 $ 408,870 $ 436,150 $ 1,669,525 $ 440,928 $ 453,365 $ 432,085 % of Total Net Sales: Hardware 62 % 59 % 62 % 57 % 56 % 57 % 51 % 55 % 48 % 54 % 54 % Software 24 % 26 % 24 % 27 % 27 % 26 % 30 % 28 % 35 % 26 % 26 % Total Products 86 % 85 % 86 % 85 % 83 % 83 % 82 % 83 % 83 % 80 % 80 % Agent Services 5 % 6 % 6 % 6 % 8 % 7 % 8 % 7 % 8 % 9 % 8 % Insight Delivered Services 9 % 9 % 9 % 9 % 10 % 10 % 10 % 10 % 10 % 11 % 11 % Total Services 14 % 15 % 14 % 15 % 17 % 17 % 18 % 17 % 17 % 20 % 20 % % of Total Services Net Sales: Agent Services 38 % 42 % 40 % 40 % 44 % 41 % 46 % 43 % 44 % 45 % 42 % Insight Delivered Services 62 % 58 % 60 % 60 % 56 % 59 % 54 % 57 % 56 % 55 % 58 % Note: Numbers may not foot or cross foot due to immaterial rounding

Insight Proprietary & Confidential. Do Not Copy or Distribute. © 2022 Insight Direct USA, Inc. All Rights Reserved. 364 Cloud Gross Profit Reconciliation US Dollars in $000s Q3-22 Q4-22 FY 2022 Q1-23 Q2-23 Q3-23 Q4-23 FY 2023 Q1-24 Q2-24 Q3-24 Cloud Gross Profit Reconciliation: Agency Cloud Gross Profit* $ 75,611 $ 85,651 $ 315,528 $ 84,132 $ 105,210 $ 89,005 $ 121,478 $ 399,825 $ 106,993 $ 129,933 $ 122,310 Cloud Services Gross Profit** 6,827 5,238 24,465 3,639 9,536 7,392 8,412 28,979 9,703 9,013 6,218 Total Cloud Gross Profit*** $ 82,438 $ 90,889 $ 339,993 $ 87,771 $ 114,746 $ 96,397 $ 129,890 $ 428,804 $ 116,696 $ 138,946 $ 128,528 * Reported in agent services gross profit - includes SaaS, IaaS and partner program fees ** Includes managed cloud services and certain partner cloud incentive fees and reported in Insight Core services gross profit *** Reported in services gross profit

Insight Proprietary & Confidential. Do Not Copy or Distribute. © 2022 Insight Direct USA, Inc. All Rights Reserved. 374 Convertible Senior Notes (Illustrative example) • Insight Convertible Senior Notes - $350 million principal • Required to settle the convertible notes principal/par value in cash • Excess required to be settled in shares resulting in dilution in GAAP reported Diluted Earnings Per Share (“DEPS”) • DEPS incremental shares for GAAP reporting purposes are not issued at the time of reporting and are a non-GAAP exclusion for the Company (up to the strike price of the warrants of $103.12) • The bond hedge effectively raises the potential dilution point of the convertible notes and call spread from $68.32 up to $103.12, as illustrated below: NSIT stock price Relevance of stock price Net shares owed on Convertible Notes Net shares received from bond hedge Net shares owed on Warrants GAAP additional dilution* Non-GAAP additional dilution* $ 51.56 Price at issuance of Notes — — — — — $ 68.32 Conversion price of Notes — — — — — $ 88.82 Market trigger price 1,182,606 (1,182,606) — 1,182,606 — $ 103.12 Warrants strike price 1,729,056 (1,729,056) — 1,729,056 — $ 120.00 Example average quarterly stock price 2,206,493 (2,206,493) 720,658 2,927,151 720,658 $ 140.00 Example average quarterly stock price 2,623,160 (2,623,160) 1,349,587 3,972,747 1,349,587 $ 150.00 Example average quarterly stock price 2,789,827 (2,789,827) 1,601,158 4,390,985 1,601,158 Example calculation - net shares owed on Warrants Warrants issued [a] Excess ave. share price [b] Value of excess [c = a x b] Dilutive shares [d = c / $120] $120 average share price for quarter 5,123,160 $ 16.88 $ 86,478,941 720,658 *Additional shares to be included in our weighted average shares outstanding calculation for each quarter
