| Delaware | |||||||||||
| (State or other jurisdiction of incorporation or organization) | |||||||||||
| 033-90866 | 25-1615902 | ||||||||||
| (Commission File No.) |
(I.R.S. Employer Identification No.) |
||||||||||
| 30 Isabella Street | 15212 | ||||||||||
Pittsburgh, PA |
(Zip code) | ||||||||||
| (Address of principal executive offices) | |||||||||||
| ☐ | Written communications pursuant to Rule 425 under the Securities Act (17 CFR 230.425) | ||||
| ☐ | Soliciting material pursuant to Rule 14a-12 under the Exchange Act (17 CFR 240.14a-12) | ||||
| ☐ | Pre-commencement communications pursuant to Rule 14d-2(b) under the Exchange Act (17 CFR 240.14d-2(b)) | ||||
| ☐ | Pre-commencement communications pursuant to Rule 13e-4(c) under the Exchange Act (17 CFR 240.13e-4(c)) | ||||
Class |
Trading Symbol(s) |
Name of each exchange on which registered | ||||||
Common Stock, $.01 par value per share |
WAB |
New York Stock Exchange | ||||||
| Item 2.02 | Results of Operations and Financial Condition | ||||
| Item 7.01. | Regulation FD Disclosure | ||||
| Item 9.01. | Financial Statements and Exhibits | ||||
| Exhibit No. | Description | ||||
| 99.1 | |||||
| 99.2 | |||||
| 104 | Cover Page Interactive Data File (embedded within the Inline XBRL document) | ||||
| WESTINGHOUSE AIR BRAKE TECHNOLOGIES CORPORATION | |||||
| By: | /s/ JOHN A. OLIN | ||||
| John A. Olin | |||||
| Executive Vice President and Chief Financial Officer |
|||||
| (Duly Authorized Officer and Principal Financial Officer) | |||||
| DATE: | October 23, 2024 | ||||

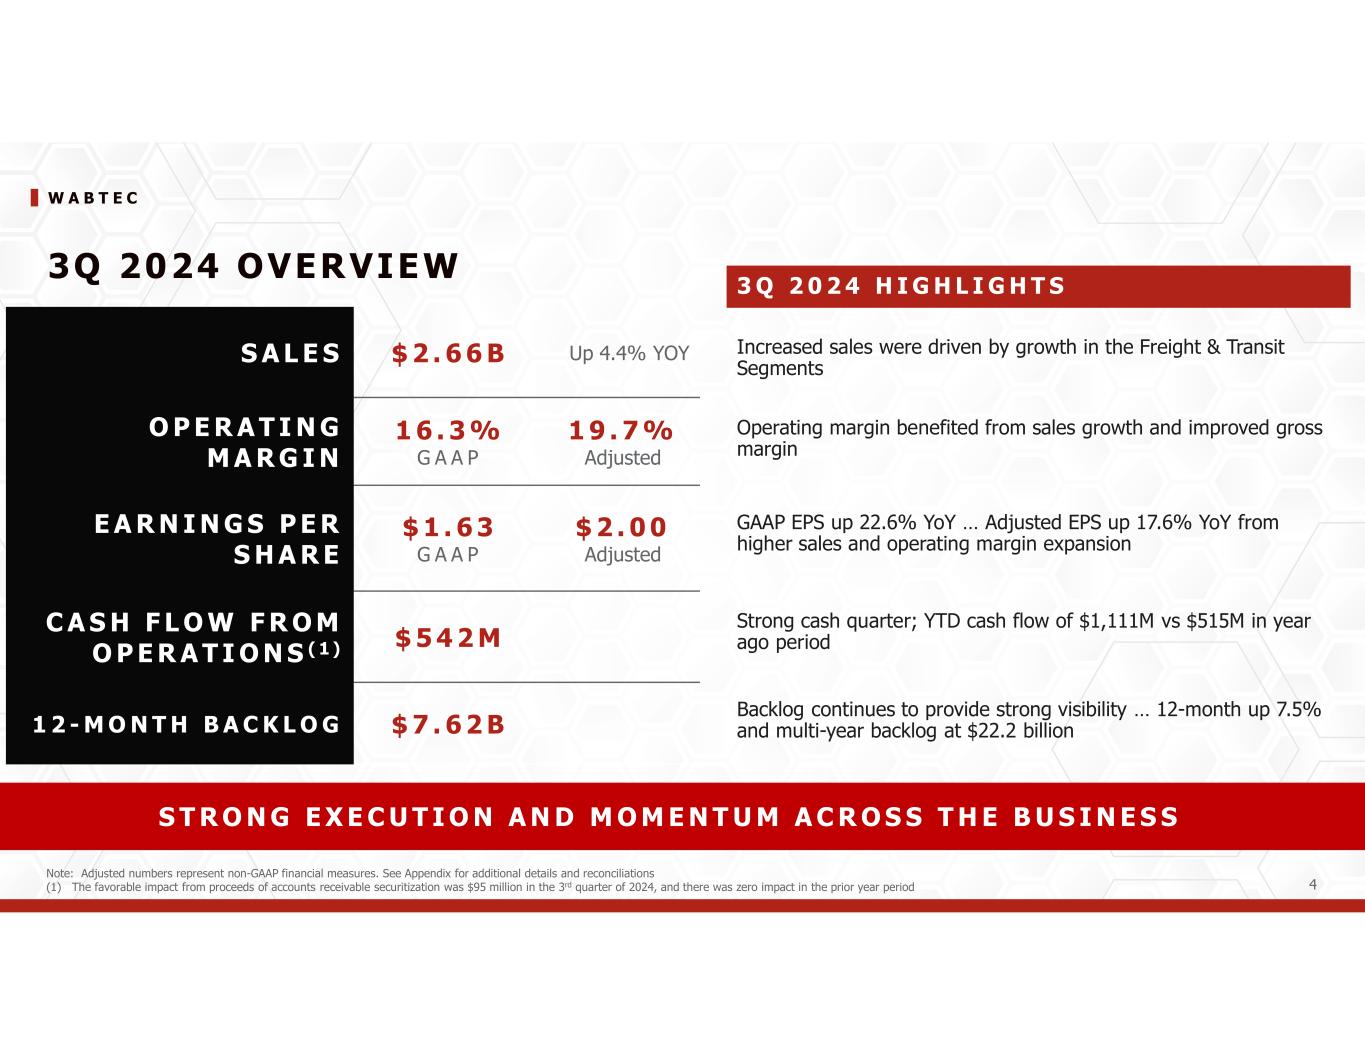
| SALES | GAAP DILUTED EARNINGS PER SHARE |
ADJUSTED DILUTED EARNINGS PER SHARE | ||||||||||||
| 3Q’24 | 3Q YTD ’24 | 3Q’24 | 3Q YTD ’24 | 3Q’24 | 3Q YTD ’24 | |||||||||||||||||||||||||||
| $2.66B | $7.80B | $1.63 | $4.80 | $2.00 | $5.86 | ||||||||||||
| +4.4% YOY | +9.1% YOY | +22.6% YOY | +44.1% YOY | +17.6% YOY | +33.8% YOY | ||||||||||||
| “The Wabtec team delivered another strong quarter, evidenced by continued growth in sales, margin, earnings and operating cash flow,” said Rafael Santana, Wabtec’s President and CEO. | ||
| “Demand for products and services has remained strong, and our pipeline of opportunities is robust, especially in our international markets. Our team’s continued focus on product innovation, cost management, and relentless execution for our customers, along with our continued strong results, gives us confidence to raise our full year guidance again this quarter.” | ||
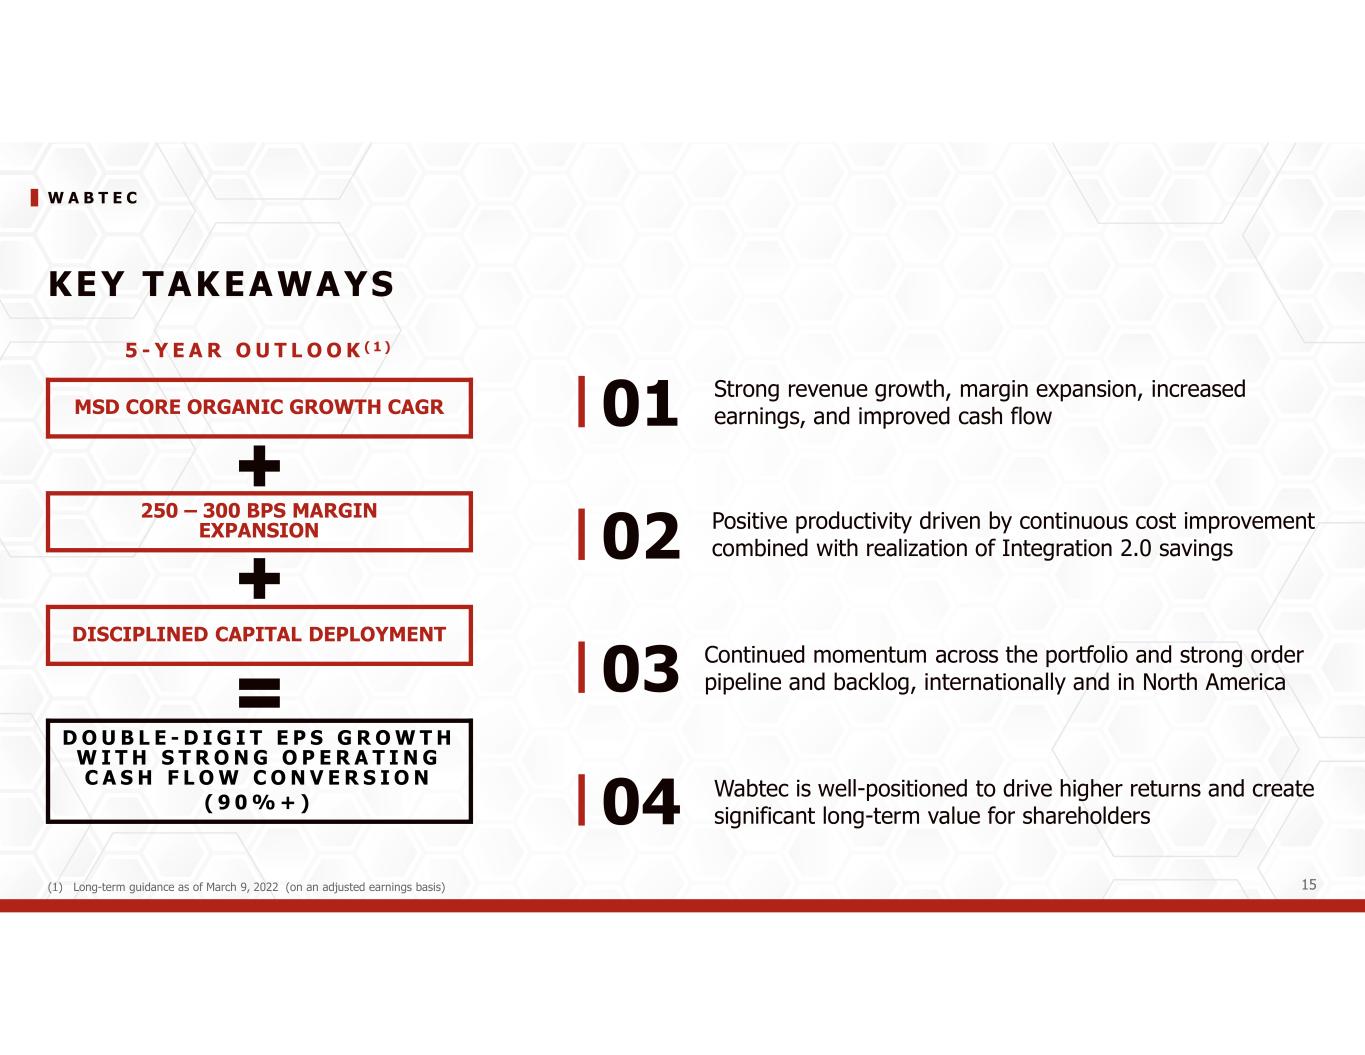
| “Our continued progress on expanding our backlog reinforces our ability to drive profitable growth ahead, consistent with our long term guidance.” | ||
| Rafael Santana President and CEO | ||
| Wabtec Corporation Consolidated Financial Results | ||||||||||||||
| $ in millions except earnings per share and percentages; margin change in percentage points (pts) | Third Quarter | |||||||||||||
| 2024 | 2023 | Change | ||||||||||||
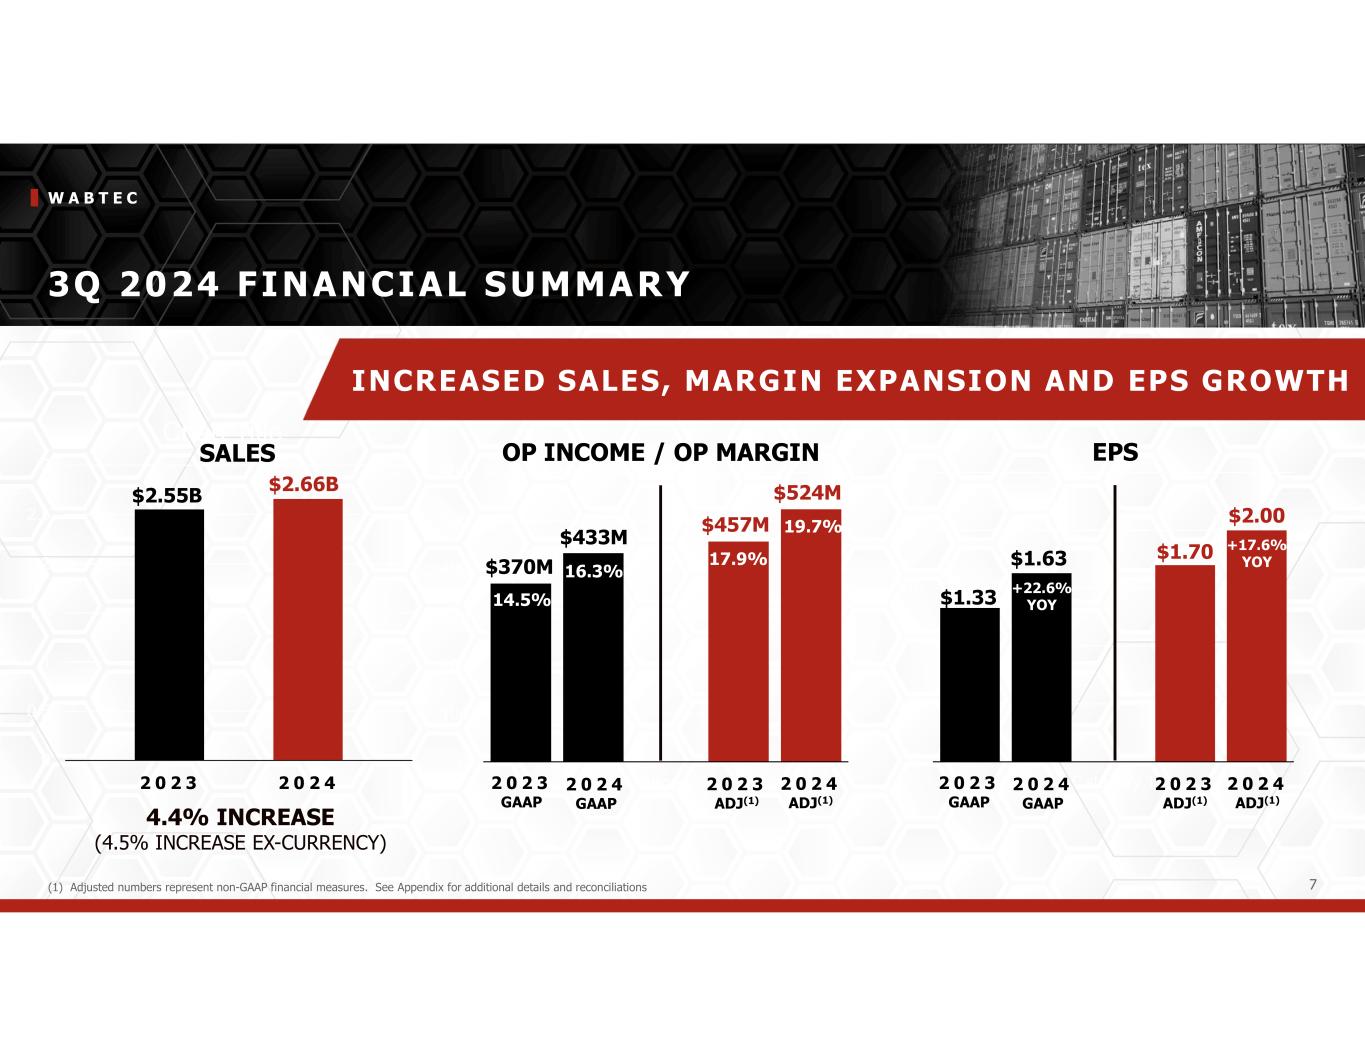
| Net Sales | $2,663 | $2,550 | 4.4 | % | ||||||||||
| GAAP Gross Margin | 33.0 | % | 31.0 | % | 2.0 pts | |||||||||
| Adjusted Gross Margin | 33.3 | % | 31.5 | % | 1.8 pts | |||||||||
| GAAP Operating Margin | 16.3 | % | 14.5 | % | 1.8 pts | |||||||||
| Adjusted Operating Margin | 19.7 | % | 17.9 | % | 1.8 pts | |||||||||
| GAAP Diluted EPS | $1.63 | $1.33 | 22.6 | % | ||||||||||
| Adjusted Diluted EPS | $2.00 | $1.70 | 17.6 | % | ||||||||||
| Cash Flow from Operations | $542 | $425 | $117 | |||||||||||
| Operating Cash Flow Conversion | 129 | % | 116 | % | ||||||||||
| Wabtec Corporation Freight Segment Financial Results | |||||||||||
| Net sales $ in millions; margin change in percentage points (pts) | Third Quarter | ||||||||||
| 2024 | 2023 | Change | |||||||||
| Net Sales | $1,930 | $1,881 | 2.6 | % | |||||||
| GAAP Gross Margin | 35.0 | % | 32.4 | % | 2.6 pts | ||||||
| Adjusted Gross Margin | 35.1 | % | 32.5 | % | 2.6 pts | ||||||
| GAAP Operating Margin | 20.2 | % | 17.3 | % | 2.9 pts | ||||||
| Adjusted Operating Margin | 24.1 | % | 21.2 | % | 2.9 pts | ||||||
| Wabtec Corporation Transit Segment Financial Results | |||||||||||
| Net sales $ in millions; margin change in percentage points (pts) | Third Quarter | ||||||||||
| 2024 | 2023 | Change | |||||||||
| Net Sales | $733 | $669 | 9.6 | % | |||||||
| GAAP Gross Margin | 28.2 | % | 27.2 | % | 1.0 pts | ||||||
| Adjusted Gross Margin | 28.8 | % | 28.9 | % | (0.1) pts | ||||||
| GAAP Operating Margin | 10.8 | % | 10.3 | % | 0.5 pts | ||||||
| Adjusted Operating Margin | 12.8 | % | 12.5 | % | 0.3 pts | ||||||
| Wabtec Corporation Consolidated Backlog Comparison | |||||||||||
| Backlog $ in millions | September 30, | ||||||||||
| 2024 | 2023 | Change | |||||||||
| 12-Month Backlog | $7,624 | $7,091 | 7.5 | % | |||||||
| Total Backlog | $22,234 | $21,483 | 3.5 | % | |||||||
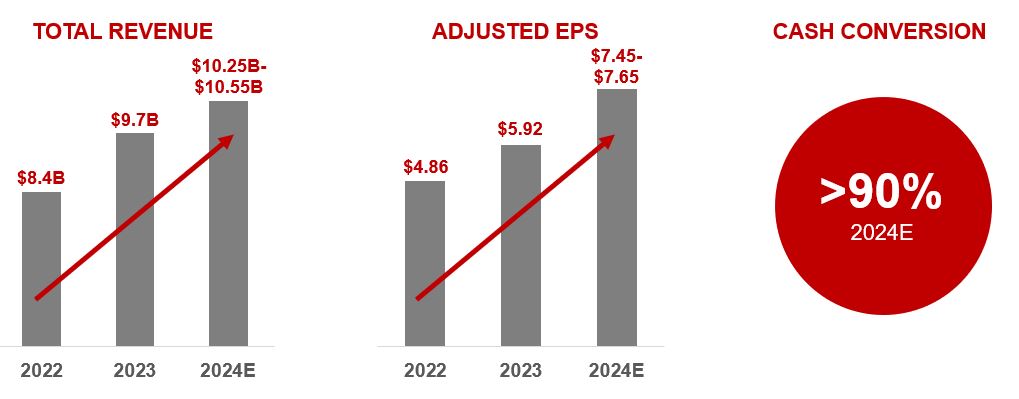
| Appendix A | ||||||||
| Three Months Ended September 30, |
Nine Months Ended September 30, |
||||||||||||||||||||||
| 2024 | 2023 | 2024 | 2023 | ||||||||||||||||||||
| Net sales | $ | 2,663 | $ | 2,550 | $ | 7,804 | $ | 7,151 | |||||||||||||||
| Cost of sales | (1,783) | (1,758) | (5,235) | (4,971) | |||||||||||||||||||
| Gross profit | 880 | 792 | 2,569 | 2,180 | |||||||||||||||||||
| Gross profit as a % of Net sales | 33.0 | % | 31.0 | % | 32.9 | % | 30.5 | % | |||||||||||||||
| Selling, general and administrative expenses | (318) | (295) | (915) | (843) | |||||||||||||||||||
| Engineering expenses | (50) | (53) | (155) | (157) | |||||||||||||||||||
| Amortization expense | (79) | (74) | (224) | (222) | |||||||||||||||||||
| Total operating expenses | (447) | (422) | (1,294) | (1,222) | |||||||||||||||||||
| Operating expenses as a % of Net sales | 16.8 | % | 16.5 | % | 16.6 | % | 17.1 | % | |||||||||||||||
| Income from operations | 433 | 370 | 1,275 | 958 | |||||||||||||||||||
| Income from operations as a % of Net sales | 16.3 | % | 14.5 | % | 16.3 | % | 13.4 | % | |||||||||||||||
| Interest expense, net | (52) | (60) | (148) | (163) | |||||||||||||||||||
| Other (expense) income, net | (3) | 10 | (1) | 17 | |||||||||||||||||||
| Income before income taxes | 378 | 320 | 1,126 | 812 | |||||||||||||||||||
| Income tax expense | (92) | (78) | (272) | (204) | |||||||||||||||||||
| Effective tax rate | 24.2 | % | 24.5 | % | 24.1 | % | 25.1 | % | |||||||||||||||
| Net income | 286 | 242 | 854 | 608 | |||||||||||||||||||
| Less: Net income attributable to noncontrolling interest | (3) | (2) | (10) | (8) | |||||||||||||||||||
| Net income attributable to Wabtec shareholders | $ | 283 | $ | 240 | $ | 844 | $ | 600 | |||||||||||||||
| Earnings Per Common Share | |||||||||||||||||||||||
| Basic | |||||||||||||||||||||||
| Net income attributable to Wabtec shareholders | $ | 1.63 | $ | 1.34 | $ | 4.81 | $ | 3.34 | |||||||||||||||
| Diluted | |||||||||||||||||||||||
| Net income attributable to Wabtec shareholders | $ | 1.63 | $ | 1.33 | $ | 4.80 | $ | 3.33 | |||||||||||||||
| Weighted average shares outstanding | |||||||||||||||||||||||
| Basic | 173.4 | 178.6 | 175.1 | 179.1 | |||||||||||||||||||
| Diluted | 174.1 | 179.2 | 175.7 | 179.7 | |||||||||||||||||||
| Appendix A | ||||||||
| Three Months Ended September 30, |
Nine Months Ended September 30, |
||||||||||||||||||||||
| 2024 | 2023 | 2024 | 2023 | ||||||||||||||||||||
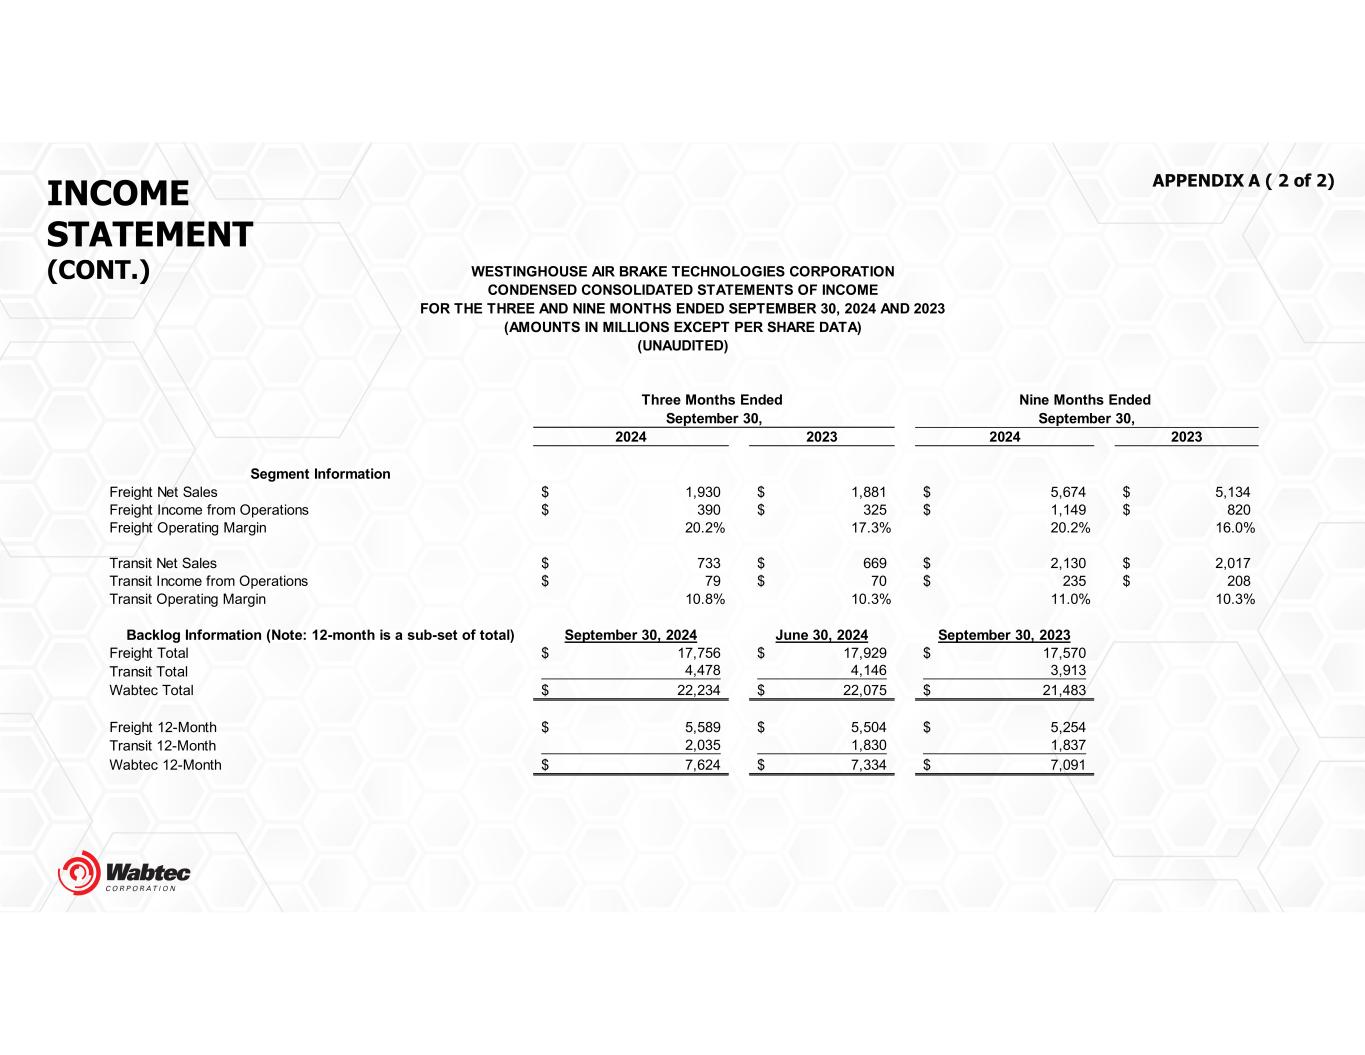
| Segment Information | |||||||||||||||||||||||
| Freight Net sales | $ | 1,930 | $ | 1,881 | $ | 5,674 | $ | 5,134 | |||||||||||||||
| Freight Income from operations | $ | 390 | $ | 325 | $ | 1,149 | $ | 820 | |||||||||||||||
| Freight Operating margin | 20.2 | % | 17.3 | % | 20.2 | % | 16.0 | % | |||||||||||||||
| Transit Net sales | $ | 733 | $ | 669 | $ | 2,130 | $ | 2,017 | |||||||||||||||
| Transit Income from operations | $ | 79 | $ | 70 | $ | 235 | $ | 208 | |||||||||||||||
| Transit Operating margin | 10.8 | % | 10.3 | % | 11.0 | % | 10.3 | % | |||||||||||||||
| Backlog Information (Note: 12-month is a sub-set of total) | September 30, 2024 | June 30, 2024 | September 30, 2023 | ||||||||||||||||||||
| Freight Total | $ | 17,756 | $ | 17,929 | $ | 17,570 | |||||||||||||||||
| Transit Total | 4,478 | 4,146 | 3,913 | ||||||||||||||||||||
| Wabtec Total | $ | 22,234 | $ | 22,075 | $ | 21,483 | |||||||||||||||||
| Freight 12-month | $ | 5,589 | $ | 5,504 | $ | 5,254 | |||||||||||||||||
| Transit 12-month | 2,035 | 1,830 | 1,837 | ||||||||||||||||||||
| Wabtec 12-month | $ | 7,624 | $ | 7,334 | $ | 7,091 | |||||||||||||||||
| Appendix B | ||||||||
| September 30, 2024 | December 31, 2023 | ||||||||||
| In millions | |||||||||||
| Cash, cash equivalents and restricted cash | $ | 410 | $ | 620 | |||||||
| Receivables, net | 1,782 | 1,684 | |||||||||
| Inventories, net | 2,380 | 2,284 | |||||||||
| Other current assets | 202 | 267 | |||||||||
| Total current assets | 4,774 | 4,855 | |||||||||
| Property, plant and equipment, net | 1,439 | 1,485 | |||||||||
| Goodwill | 8,786 | 8,780 | |||||||||
| Other intangible assets, net | 2,996 | 3,205 | |||||||||
| Other noncurrent assets | 649 | 663 | |||||||||
| Total Assets | $ | 18,644 | $ | 18,988 | |||||||
| Current liabilities | $ | 3,681 | $ | 4,056 | |||||||
| Long-term debt | 3,517 | 3,288 | |||||||||
| Other long-term liabilities | 1,155 | 1,120 | |||||||||
| Total Liabilities | 8,353 | 8,464 | |||||||||
| Shareholders' equity | 10,250 | 10,487 | |||||||||
| Noncontrolling interest | 41 | 37 | |||||||||
| Total Equity | 10,291 | 10,524 | |||||||||
| Total Liabilities and Equity | $ | 18,644 | $ | 18,988 | |||||||
| Appendix C | ||||||||
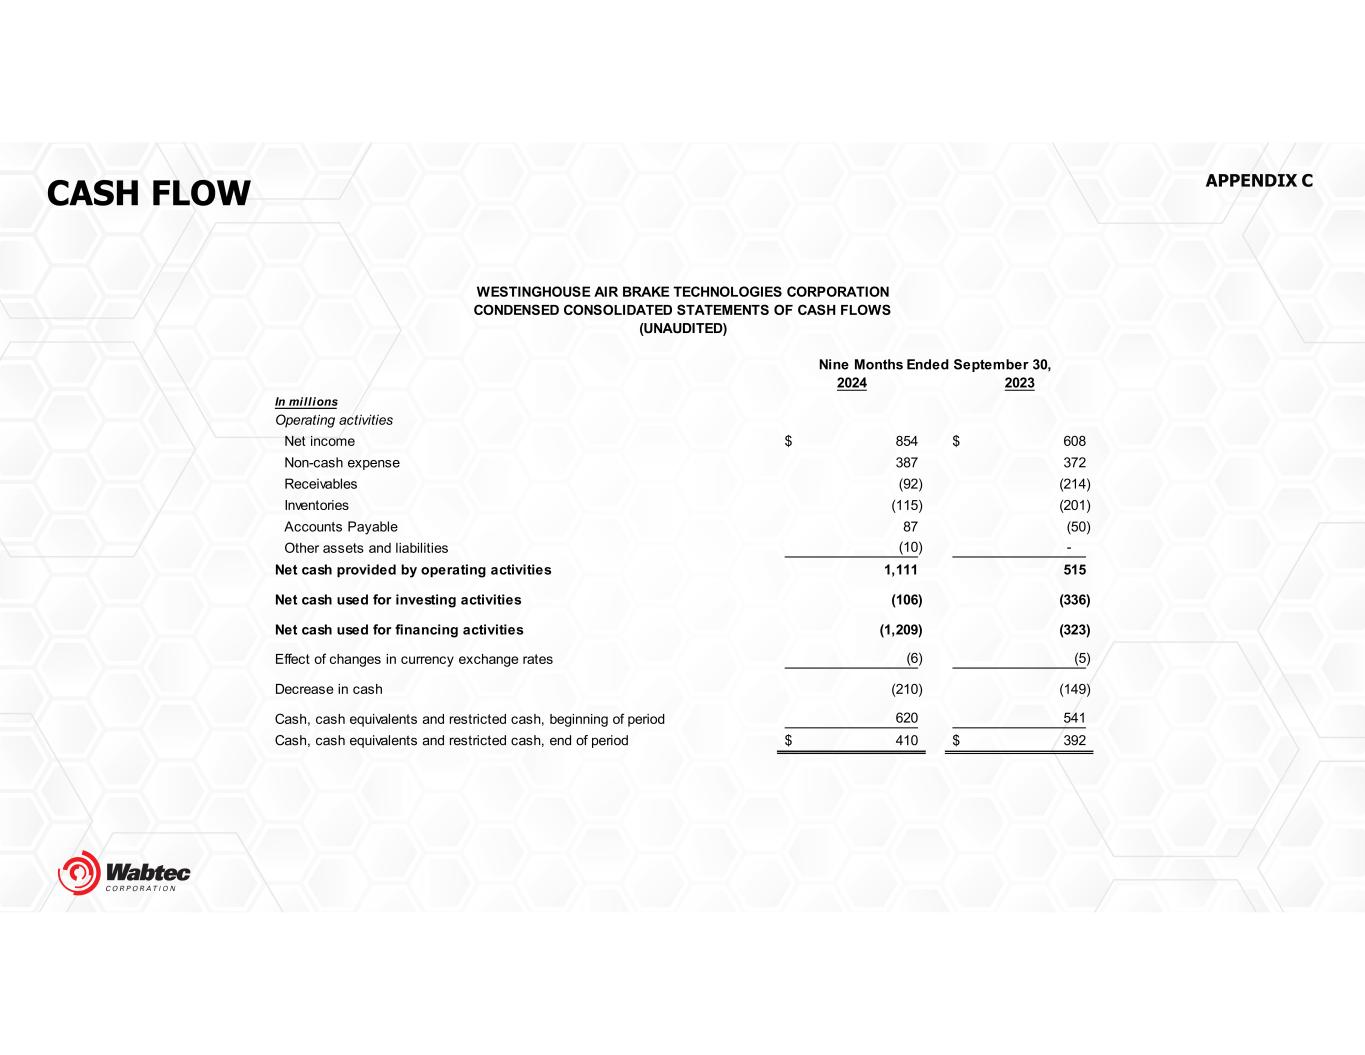
| Nine Months Ended September 30, | |||||||||||
| 2024 | 2023 | ||||||||||
| In millions | |||||||||||
| Operating activities | |||||||||||
| Net income | $ | 854 | $ | 608 | |||||||
| Non-cash expense | 387 | 372 | |||||||||
| Receivables | (92) | (214) | |||||||||
| Inventories | (115) | (201) | |||||||||
| Accounts payable | 87 | (50) | |||||||||
| Other assets and liabilities | (10) | — | |||||||||
| Net cash provided by operating activities | 1,111 | 515 | |||||||||
| Net cash used for investing activities | (106) | (336) | |||||||||
| Net cash used for financing activities | (1,209) | (323) | |||||||||
| Effect of changes in currency exchange rates | (6) | (5) | |||||||||
| Decrease in cash | (210) | (149) | |||||||||
| Cash, cash equivalents and restricted cash, beginning of period | 620 | 541 | |||||||||
| Cash, cash equivalents and restricted cash, end of period | $ | 410 | $ | 392 | |||||||
| Appendix D | ||||||||
| Wabtec Corporation | |||||||||||||||||||||||||||||||||||||||||||||||||||||||||||||||||
| Reconciliation of Reported Results to Adjusted Results | |||||||||||||||||||||||||||||||||||||||||||||||||||||||||||||||||
| (in millions) | Third Quarter 2024 Actual Results |
||||||||||||||||||||||||||||||||||||||||||||||||||||||||||||||||
| Net | Gross | Operating | Income from | Interest & | Net | Noncontrolling | Wabtec | ||||||||||||||||||||||||||||||||||||||||||||||||||||||||||
| Sales | Profit | Expenses | Operations | Other Exp | Tax | Income | Interest | Net Income | EPS | ||||||||||||||||||||||||||||||||||||||||||||||||||||||||
| Reported Results | $ | 2,663 | $ | 880 | $ | (447) | $ | 433 | $ | (55) | $ | (92) | $ | 286 | $ | (3) | $ | 283 | $ | 1.63 | |||||||||||||||||||||||||||||||||||||||||||||
| Restructuring and Portfolio Optimization costs | — | 7 | 11 | 18 | — | (4) | 14 | — | 14 | $ | 0.07 | ||||||||||||||||||||||||||||||||||||||||||||||||||||||
| Non-cash Amortization expense | — | — | 73 | 73 | — | (19) | 54 | — | 54 | $ | 0.30 | ||||||||||||||||||||||||||||||||||||||||||||||||||||||
| Adjusted Results | $ | 2,663 | $ | 887 | $ | (363) | $ | 524 | $ | (55) | $ | (115) | $ | 354 | $ | (3) | $ | 351 | $ | 2.00 | |||||||||||||||||||||||||||||||||||||||||||||
| Fully Diluted Shares Outstanding | 174.1 | ||||||||||||||||||||||||||||||||||||||||||||||||||||||||||||||||
| Wabtec Corporation | |||||||||||||||||||||||||||||||||||||||||||||||||||||||||||||||||
| Reconciliation of Reported Results to Adjusted Results | |||||||||||||||||||||||||||||||||||||||||||||||||||||||||||||||||
| (in millions) | Third Quarter Year-to-Date 2024 Actual Results |
||||||||||||||||||||||||||||||||||||||||||||||||||||||||||||||||
| Net | Gross | Operating | Income from | Interest & | Net | Noncontrolling | Wabtec | ||||||||||||||||||||||||||||||||||||||||||||||||||||||||||
| Sales | Profit | Expenses | Operations | Other Exp | Tax | Income | Interest | Net Income | EPS | ||||||||||||||||||||||||||||||||||||||||||||||||||||||||
| Reported Results | $ | 7,804 | $ | 2,569 | $ | (1,294) | $ | 1,275 | $ | (149) | $ | (272) | $ | 854 | $ | (10) | $ | 844 | $ | 4.80 | |||||||||||||||||||||||||||||||||||||||||||||
| Restructuring and Portfolio Optimization costs | — | 19 | 19 | 38 | (4) | (8) | 26 | — | 26 | $ | 0.14 | ||||||||||||||||||||||||||||||||||||||||||||||||||||||
| Non-cash Amortization expense | — | — | 216 | 216 | — | (53) | 163 | — | 163 | $ | 0.92 | ||||||||||||||||||||||||||||||||||||||||||||||||||||||
| Adjusted Results | $ | 7,804 | $ | 2,588 | $ | (1,059) | $ | 1,529 | $ | (153) | $ | (333) | $ | 1,043 | $ | (10) | $ | 1,033 | $ | 5.86 | |||||||||||||||||||||||||||||||||||||||||||||
| Fully Diluted Shares Outstanding | 175.7 | ||||||||||||||||||||||||||||||||||||||||||||||||||||||||||||||||
| Appendix D | ||||||||
| Wabtec Corporation | |||||||||||||||||||||||||||||||||||||||||||||||||||||||||||||||||
| Reconciliation of Reported Results to Adjusted Results | |||||||||||||||||||||||||||||||||||||||||||||||||||||||||||||||||
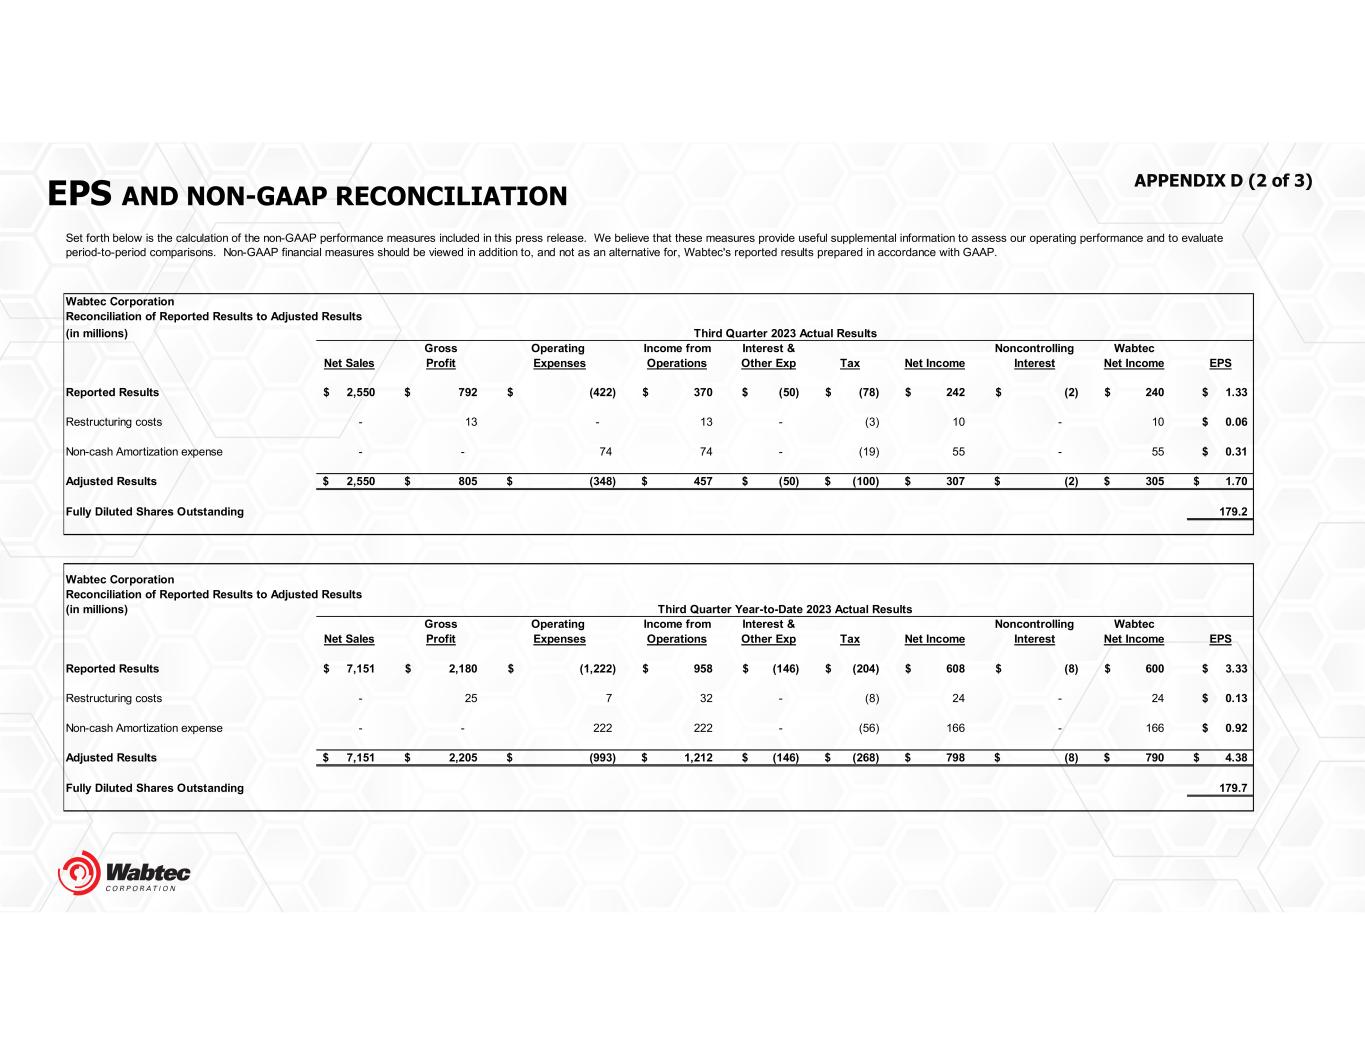
| (in millions) | Third Quarter 2023 Actual Results |
||||||||||||||||||||||||||||||||||||||||||||||||||||||||||||||||
| Net | Gross | Operating | Income from | Interest & | Net | Noncontrolling | Wabtec | ||||||||||||||||||||||||||||||||||||||||||||||||||||||||||
| Sales | Profit | Expenses | Operations | Other Exp | Tax | Income | Interest | Net Income | EPS | ||||||||||||||||||||||||||||||||||||||||||||||||||||||||
| Reported Results | $ | 2,550 | $ | 792 | $ | (422) | $ | 370 | $ | (50) | $ | (78) | $ | 242 | $ | (2) | $ | 240 | $ | 1.33 | |||||||||||||||||||||||||||||||||||||||||||||
| Restructuring costs | — | 13 | — | 13 | — | (3) | 10 | — | 10 | $ | 0.06 | ||||||||||||||||||||||||||||||||||||||||||||||||||||||
| Non-cash Amortization expense | — | — | 74 | 74 | — | (19) | 55 | — | 55 | $ | 0.31 | ||||||||||||||||||||||||||||||||||||||||||||||||||||||
| Adjusted Results | $ | 2,550 | $ | 805 | $ | (348) | $ | 457 | $ | (50) | $ | (100) | $ | 307 | $ | (2) | $ | 305 | 1.70 | ||||||||||||||||||||||||||||||||||||||||||||||
| Fully Diluted Shares Outstanding | 179.2 | ||||||||||||||||||||||||||||||||||||||||||||||||||||||||||||||||
| Wabtec Corporation | |||||||||||||||||||||||||||||||||||||||||||||||||||||||||||||||||
| Reconciliation of Reported Results to Adjusted Results | |||||||||||||||||||||||||||||||||||||||||||||||||||||||||||||||||
| (in millions) | Third Quarter Year-to-Date 2023 Actual Results |
||||||||||||||||||||||||||||||||||||||||||||||||||||||||||||||||
| Net | Gross | Operating | Income from | Interest & | Net | Noncontrolling | Wabtec | ||||||||||||||||||||||||||||||||||||||||||||||||||||||||||
| Sales | Profit | Expenses | Operations | Other Exp | Tax | Income | Interest | Net Income | EPS | ||||||||||||||||||||||||||||||||||||||||||||||||||||||||
| Reported Results | $ | 7,151 | $ | 2,180 | $ | (1,222) | $ | 958 | $ | (146) | $ | (204) | $ | 608 | $ | (8) | $ | 600 | $ | 3.33 | |||||||||||||||||||||||||||||||||||||||||||||
| Restructuring costs | — | 25 | 7 | 32 | — | (8) | 24 | — | 24 | $ | 0.13 | ||||||||||||||||||||||||||||||||||||||||||||||||||||||
| Non-cash Amortization expense | — | — | 222 | 222 | — | (56) | 166 | — | 166 | $ | 0.92 | ||||||||||||||||||||||||||||||||||||||||||||||||||||||
| Adjusted Results | $ | 7,151 | $ | 2,205 | $ | (993) | $ | 1,212 | $ | (146) | $ | (268) | $ | 798 | $ | (8) | $ | 790 | $ | 4.38 | |||||||||||||||||||||||||||||||||||||||||||||
| Fully Diluted Shares Outstanding | 179.7 | ||||||||||||||||||||||||||||||||||||||||||||||||||||||||||||||||
| Appendix D | ||||||||
| Wabtec Corporation | |||||||||||||||||||||||||||||||||||||||||||||||||||||||||||||||||
| Reconciliation of Reported Results to Adjusted Results | |||||||||||||||||||||||||||||||||||||||||||||||||||||||||||||||||
| (in millions) | Fourth Quarter Year-to-Date 2023 Actual Results | ||||||||||||||||||||||||||||||||||||||||||||||||||||||||||||||||
| Net | Gross | Operating | Income from | Interest & | Net | Noncontrolling | Wabtec | ||||||||||||||||||||||||||||||||||||||||||||||||||||||||||
| Sales | Profit | Expenses | Operations | Other Exp | Tax | Income | Interest | Net Income | EPS | ||||||||||||||||||||||||||||||||||||||||||||||||||||||||
| Reported Results | $ | 9,677 | $ | 2,944 | $ | (1,678) | $ | 1,266 | $ | (174) | $ | (267) | $ | 825 | $ | (10) | $ | 815 | $ | 4.53 | |||||||||||||||||||||||||||||||||||||||||||||
| Restructuring and Portfolio Optimization costs | — | 38 | 41 | 79 | — | (17) | 62 | — | 62 | $ | 0.34 | ||||||||||||||||||||||||||||||||||||||||||||||||||||||
| Gain on LKZ investment | — | — | — | — | (35) | — | (35) | — | (35) | $ | (0.19) | ||||||||||||||||||||||||||||||||||||||||||||||||||||||
| Non-cash Amortization expense | — | — | 298 | 298 | — | (74) | 224 | — | 224 | $ | 1.24 | ||||||||||||||||||||||||||||||||||||||||||||||||||||||
| Adjusted Results | $ | 9,677 | $ | 2,982 | $ | (1,339) | $ | 1,643 | $ | (209) | $ | (358) | $ | 1,076 | $ | (10) | $ | 1,066 | $ | 5.92 | |||||||||||||||||||||||||||||||||||||||||||||
| Fully Diluted Shares Outstanding | 179.5 | ||||||||||||||||||||||||||||||||||||||||||||||||||||||||||||||||
| Wabtec Corporation | |||||||||||||||||||||||||||||||||||||||||||||||||||||||||||||||||
| Reconciliation of Reported Results to Adjusted Results | |||||||||||||||||||||||||||||||||||||||||||||||||||||||||||||||||
| (in millions) | Fourth Quarter Year-to-Date 2022 Actual Results | ||||||||||||||||||||||||||||||||||||||||||||||||||||||||||||||||
| Net | Gross | Operating | Income from | Interest & | Net | Noncontrolling | Wabtec | ||||||||||||||||||||||||||||||||||||||||||||||||||||||||||
| Sales | Profit | Expenses | Operations | Other Exp | Tax | Income | Interest | Net Income | EPS | ||||||||||||||||||||||||||||||||||||||||||||||||||||||||
| Reported Results | $ | 8,362 | $ | 2,540 | $ | (1,529) | $ | 1,011 | $ | (157) | $ | (213) | $ | 641 | $ | (8) | $ | 633 | $ | 3.46 | |||||||||||||||||||||||||||||||||||||||||||||
| Restructuring costs | — | 43 | 9 | 52 | — | (13) | 39 | — | 39 | $ | 0.21 | ||||||||||||||||||||||||||||||||||||||||||||||||||||||
| Non-cash Amortization expense | — | — | 291 | 291 | — | (73) | 218 | — | 218 | $ | 1.19 | ||||||||||||||||||||||||||||||||||||||||||||||||||||||
| Adjusted Results | $ | 8,362 | $ | 2,583 | $ | (1,229) | $ | 1,354 | $ | (157) | $ | (299) | $ | 898 | $ | (8) | $ | 890 | $ | 4.86 | |||||||||||||||||||||||||||||||||||||||||||||
| Fully Diluted Shares Outstanding | 182.8 | ||||||||||||||||||||||||||||||||||||||||||||||||||||||||||||||||
| Wabtec Corporation | |||||||||||||||||||||||||||||||||||||||||
Third Quarter 2024 EBITDA Reconciliation |
|||||||||||||||||||||||||||||||||||||||||
| (in millions) | |||||||||||||||||||||||||||||||||||||||||
| Reported Income | + | Other Income | + | Depreciation & | = | EBITDA | + | Restructuring | = | Adjusted | |||||||||||||||||||||||||||||||
| from Operations | (Expense) | Amortization | Costs | EBITDA | |||||||||||||||||||||||||||||||||||||
| Consolidated Results | $ | 433 | $ | (3) | $ | 133 | $ | 563 | $ | 4 | $ | 567 | |||||||||||||||||||||||||||||
| Wabtec Corporation | |||||||||||||||||||||||||||||||||||||||||
Third Quarter 2024 YTD EBITDA Reconciliation |
|||||||||||||||||||||||||||||||||||||||||
| (in millions) | |||||||||||||||||||||||||||||||||||||||||
| Reported Income | + | Other Income | + | Depreciation & | = | EBITDA | + | Restructuring | = | Adjusted | |||||||||||||||||||||||||||||||
| from Operations | (Expense) | Amortization | Costs | EBITDA | |||||||||||||||||||||||||||||||||||||
| Consolidated Results | $ | 1,275 | $ | (1) | $ | 371 | $ | 1,645 | $ | 17 | $ | 1,662 | |||||||||||||||||||||||||||||
| Wabtec Corporation | |||||||||||||||||||||||||||||||||||||||||
Third Quarter 2023 EBITDA Reconciliation |
|||||||||||||||||||||||||||||||||||||||||
| (in millions) | |||||||||||||||||||||||||||||||||||||||||
| Reported Income | + | Other Income | + | Depreciation & | = | EBITDA | + | Restructuring | = | Adjusted | |||||||||||||||||||||||||||||||
| from Operations | (Expense) | Amortization | Costs | EBITDA | |||||||||||||||||||||||||||||||||||||
| Consolidated Results | $ | 370 | $ | 10 | $ | 124 | $ | 504 | $ | 10 | $ | 514 | |||||||||||||||||||||||||||||
| Wabtec Corporation | |||||||||||||||||||||||||||||||||||||||||
Third Quarter 2023 YTD EBITDA Reconciliation |
|||||||||||||||||||||||||||||||||||||||||
| (in millions) | |||||||||||||||||||||||||||||||||||||||||
| Reported Income | + | Other Income | + | Depreciation & | = | EBITDA | + | Restructuring | = | Adjusted | |||||||||||||||||||||||||||||||
| from Operations | (Expense) | Amortization | Costs | EBITDA | |||||||||||||||||||||||||||||||||||||
| Consolidated Results | $ | 958 | $ | 17 | $ | 367 | $ | 1,342 | $ | 24 | $ | 1,366 | |||||||||||||||||||||||||||||
| Three Months Ended September 30, | |||||||||||
| In millions | 2024 | 2023 | |||||||||
| Freight Segment | |||||||||||
| Services | $ | 917 | $ | 787 | |||||||
| Equipment | 513 | 620 | |||||||||
| Components | 296 | 293 | |||||||||
| Digital Intelligence | 204 | 181 | |||||||||
| Total Freight Segment | $ | 1,930 | $ | 1,881 | |||||||
| Transit Segment | |||||||||||
| Original Equipment Manufacturer | $ | 349 | $ | 308 | |||||||
| Aftermarket | 384 | 361 | |||||||||
| Total Transit Segment | $ | 733 | $ | 669 | |||||||
Nine Months Ended September 30, |
|||||||||||
| In millions | 2024 | 2023 | |||||||||
| Freight Segment | |||||||||||
| Services | $ | 2,575 | $ | 2,304 | |||||||
| Equipment | 1,609 | 1,442 | |||||||||
| Components | 911 | 825 | |||||||||
| Digital Intelligence | 579 | 563 | |||||||||
| Total Freight Segment | $ | 5,674 | $ | 5,134 | |||||||
| Transit Segment | |||||||||||
| Original Equipment Manufacturer | $ | 969 | $ | 931 | |||||||
| Aftermarket | 1,161 | 1,086 | |||||||||
| Total Transit Segment | $ | 2,130 | $ | 2,017 | |||||||
| Three Months Ended September 30, | Nine Months Ended September 30, | ||||||||||||||||||||||||||||||||||||||||||||||
| 2024 | 2023 | 2024 | 2023 | ||||||||||||||||||||||||||||||||||||||||||||
| In millions | Gross Profit | Income from Operations | Gross Profit | Income from Operations | Gross Profit | Income from Operations | Gross Profit | Income from Operations | |||||||||||||||||||||||||||||||||||||||
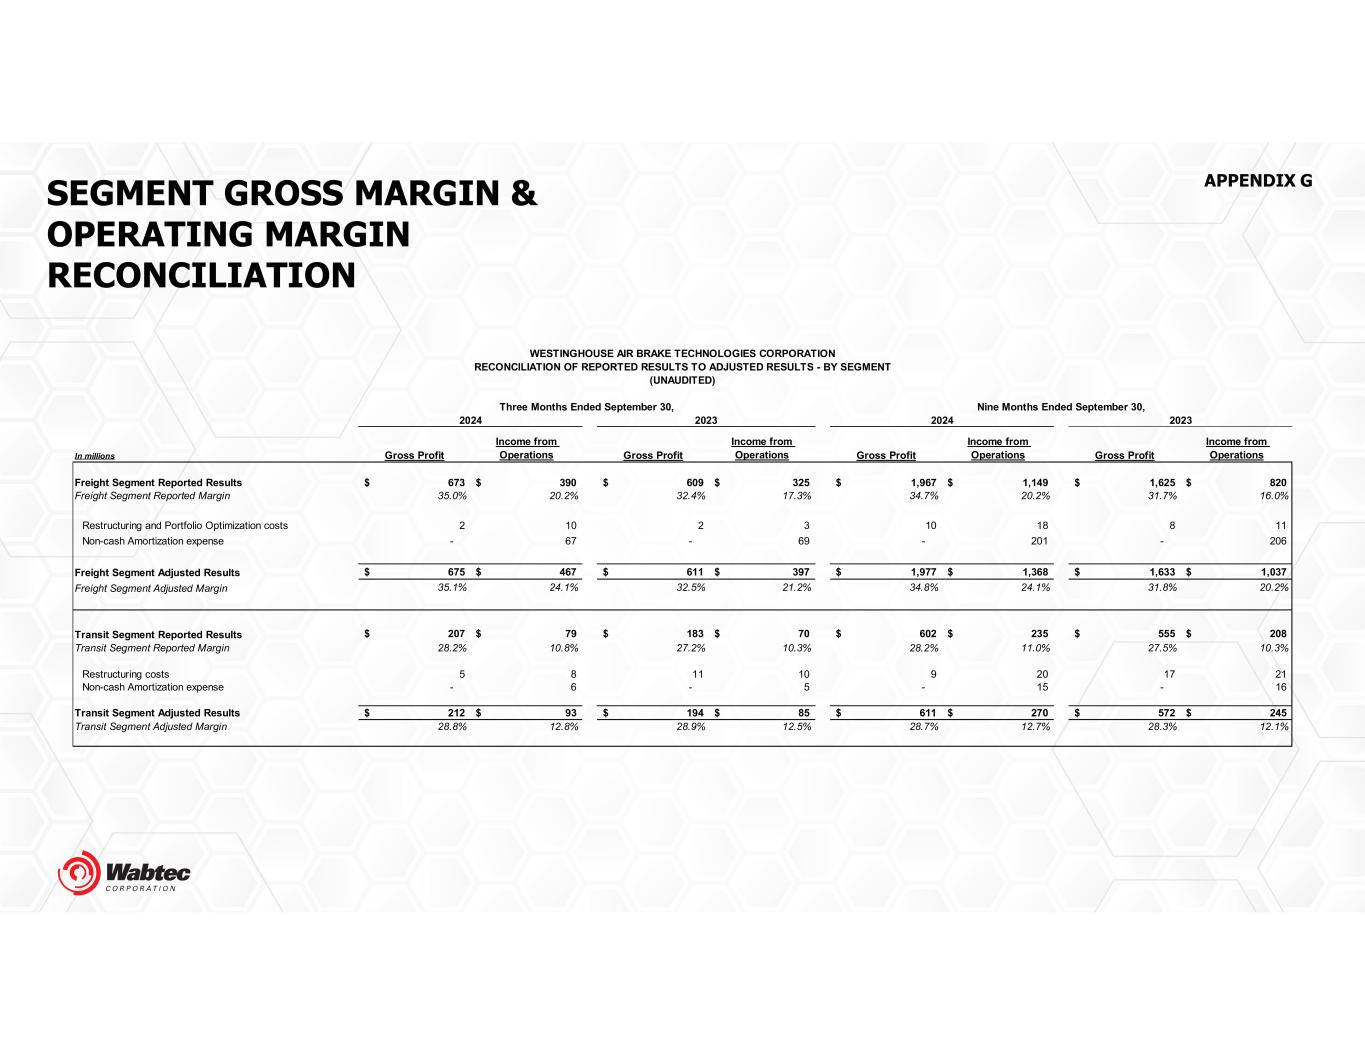
| Freight Segment Reported Results | $ | 673 | $ | 390 | $ | 609 | $ | 325 | $ | 1,967 | $ | 1,149 | $ | 1,625 | $ | 820 | |||||||||||||||||||||||||||||||
| Freight Segment Reported Margin | 35.0 | % | 20.2 | % | 32.4 | % | 17.3 | % | 34.7 | % | 20.2 | % | 31.7 | % | 16.0 | % | |||||||||||||||||||||||||||||||
| Restructuring and Portfolio Optimization costs | 2 | 10 | 2 | 3 | 10 | 18 | 8 | 11 | |||||||||||||||||||||||||||||||||||||||
| Non-cash Amortization expense | — | 67 | — | 69 | — | 201 | — | 206 | |||||||||||||||||||||||||||||||||||||||
| Freight Segment Adjusted Results | $ | 675 | $ | 467 | $ | 611 | $ | 397 | $ | 1,977 | $ | 1,368 | $ | 1,633 | $ | 1,037 | |||||||||||||||||||||||||||||||
| Freight Segment Adjusted Margin | 35.1 | % | 24.1 | % | 32.5 | % | 21.2 | % | 34.8 | % | 24.1 | % | 31.8 | % | 20.2 | % | |||||||||||||||||||||||||||||||
| Transit Segment Reported Results | $ | 207 | $ | 79 | $ | 183 | $ | 70 | $ | 602 | $ | 235 | $ | 555 | $ | 208 | |||||||||||||||||||||||||||||||
| Transit Segment Reported Margin | 28.2 | % | 10.8 | % | 27.2 | % | 10.3 | % | 28.2 | % | 11.0 | % | 27.5 | % | 10.3 | % | |||||||||||||||||||||||||||||||
| Restructuring costs | 5 | 8 | 11 | 10 | 9 | 20 | 17 | 21 | |||||||||||||||||||||||||||||||||||||||
| Non-cash Amortization expense | — | 6 | — | 5 | — | 15 | — | 16 | |||||||||||||||||||||||||||||||||||||||
| Transit Segment Adjusted Results | $ | 212 | $ | 93 | $ | 194 | $ | 85 | $ | 611 | $ | 270 | $ | 572 | $ | 245 | |||||||||||||||||||||||||||||||
| Transit Segment Adjusted Margin | 28.8 | % | 12.8 | % | 28.9 | % | 12.5 | % | 28.7 | % | 12.7 | % | 28.3 | % | 12.1 | % | |||||||||||||||||||||||||||||||
| Three Months Ended September 30, | ||||||||||||||||||||
| In millions | Freight | Transit | Consolidated | |||||||||||||||||
2023 Net sales |
$ | 1,881 | $ | 669 | $ | 2,550 | ||||||||||||||
| Acquisitions | 2 | — | 2 | |||||||||||||||||
| Foreign Exchange | (11) | 8 | (3) | |||||||||||||||||
| Organic | 58 | 56 | 114 | |||||||||||||||||
2024 Net sales |
$ | 1,930 | $ | 733 | $ | 2,663 | ||||||||||||||
| Change ($) | 49 | 64 | 113 | |||||||||||||||||
| Change (%) | 2.6 | % | 9.6 | % | 4.4 | % | ||||||||||||||
| Nine Months Ended September 30, | ||||||||||||||||||||
2023 Net sales |
$ | 5,134 | $ | 2,017 | $ | 7,151 | ||||||||||||||
| Acquisitions | 72 | — | 72 | |||||||||||||||||
| Foreign Exchange | (18) | 2 | (16) | |||||||||||||||||
| Organic | 486 | 111 | 597 | |||||||||||||||||
2024 Net sales |
$ | 5,674 | $ | 2,130 | $ | 7,804 | ||||||||||||||
| Change ($) | 540 | 113 | 653 | |||||||||||||||||
| Change (%) | 10.5 | % | 5.6 | % | 9.1 | % | ||||||||||||||
| Wabtec Corporation | |||||||||||||||||||||||||||||
2024 Third Quarter Cash Conversion Calculation |
|||||||||||||||||||||||||||||
| (in millions) | |||||||||||||||||||||||||||||
| Reported Cash from Operations | ÷ | (Net Income | + | Depreciation & Amortization) | = | Cash Conversion | |||||||||||||||||||||||
| Consolidated Results | $542 | $286 | $134 | 129% | |||||||||||||||||||||||||
| Wabtec Corporation | |||||||||||||||||||||||||||||
2024 Third Quarter YTD Cash Conversion Calculation |
|||||||||||||||||||||||||||||
| (in millions) | |||||||||||||||||||||||||||||
| Reported Cash from Operations | ÷ | (Net Income | + | Depreciation & Amortization) | = | Cash Conversion | |||||||||||||||||||||||
| Consolidated Results | $1,111 | $854 | $375 | 90% | |||||||||||||||||||||||||
| Wabtec Corporation | |||||||||||||||||||||||||||||
2023 Third Quarter Cash Conversion Calculation |
|||||||||||||||||||||||||||||
| (in millions) | |||||||||||||||||||||||||||||
| Reported Cash from Operations | ÷ | (Net Income | + | Depreciation & Amortization) | = | Cash Conversion | |||||||||||||||||||||||
| Consolidated Results | $425 | $242 | $125 | 116% | |||||||||||||||||||||||||
| Wabtec Corporation | |||||||||||||||||||||||||||||
2023 Third Quarter YTD Cash Conversion Calculation |
|||||||||||||||||||||||||||||
| (in millions) | |||||||||||||||||||||||||||||
| Reported Cash from Operations | ÷ | (Net Income | + | Depreciation & Amortization) | = | Cash Conversion | |||||||||||||||||||||||
| Consolidated Results | $515 | $608 | $371 | 53% | |||||||||||||||||||||||||
