Document
Management’s Discussion and Analysis
Exhibit 99.2
Index
|
|
|
|
|
|
|
|
|
|
|
|
| 6 |
Overview of the Business
|
34 |
Critical Accounting Estimates
|
| 8 |
Our Strategy
|
37 |
Adoption of New Accounting Standards |
| 10 |
Financial Highlights
|
37 |
Anticipated Changes to International Financial Reporting Standards |
| 10 |
Production Summary
|
37 |
Non-GAAP Measures
|
| 12 |
How We Analyze Our Business
|
39 |
Quarterly Financial Data (Unaudited)
|
| 12 |
Financial Results
|
39 |
Selected Annual Information
|
| 18 |
Liquidity and Capital Resources
|
40 |
Controls and Procedures
|
| 24 |
Risk Factors and Risk Management
|
41 |
Forward-Looking Statements
|
This Management’s Discussion and Analysis ("MD&A") is dated March 8, 2024, and should be read in conjunction with our consolidated financial statements and the accompanying notes for the year ended December 31, 2023. Except where otherwise noted, the financial information presented in this MD&A is prepared in accordance with International Financial Reporting Standards ("IFRS") as issued by the International Accounting Standards Board (the "IASB"). We use the United States dollar as our reporting currency and, except where otherwise noted, all currency amounts are stated in United States dollars. In this MD&A, a reference to the "Company" refers to Methanex Corporation and a reference to "Methanex," "we," "our" and "us" refers to the Company and its subsidiaries or any one of them as the context requires, as well as their respective interests in joint ventures and partnerships.
Throughout this document we use non-GAAP measures and ratios that do not have any standardized meaning prescribed by GAAP and therefore are unlikely to be comparable to similar measures presented by other companies. Refer to the Non-GAAP Measures section on page 37 for a description of each non-GAAP measure and reconciliations to the most comparable GAAP measures.
Some of the historical price data and supply and demand statistics for methanol and certain other industry data contained in this MD&A are derived by the Company from industry consultants or from recognized industry reports regularly published by independent consulting and data compilation organizations in the methanol industry, including Chemical Market Analytics by OPIS, a Dow Jones company, Tecnon OrbiChem Ltd., Argus, ICIS, S&P Global Platts and Methanol Market Services Asia. Industry consultants and industry publications generally state that the information provided has been obtained from sources believed to be reliable. We have not independently verified any of the data from third-party sources nor have we ascertained the underlying economic assumptions relied upon in these reports.
As at March 7, 2024 we had 67,387,492 common shares issued and outstanding and stock options exercisable for 1,478,353 additional common shares.
Additional information relating to Methanex, including our Annual Information Form, is available on our website at www.methanex.com, the Canadian Securities Administrators’ SEDAR+ website at www.sedarplus.ca and on the United States Securities and Exchange Commission’s EDGAR website at www.sec.gov.
OVERVIEW OF THE BUSINESS
Methanol is a clear liquid commodity chemical that is produced from natural gas and is also produced from coal, particularly in China. Traditional chemical demand, which represents approximately 50% of global methanol demand, is used to produce traditional chemical derivatives, including formaldehyde, acetic acid and a variety of other chemicals that form the basis of a wide variety of industrial and consumer products. Demand for energy-related applications, which represents over 30% of global methanol demand, includes several applications including methyl tertiary-butyl ether ("MTBE"), fuel applications (including vehicle fuel, marine fuel and other thermal applications), di-methyl ether and biodiesel. Demand into methanol-to-olefins ("MTO") represents over 15% of global methanol demand. MTO plants produce light olefins which have wide applications in packaging, textiles, plastic parts and automotive components.
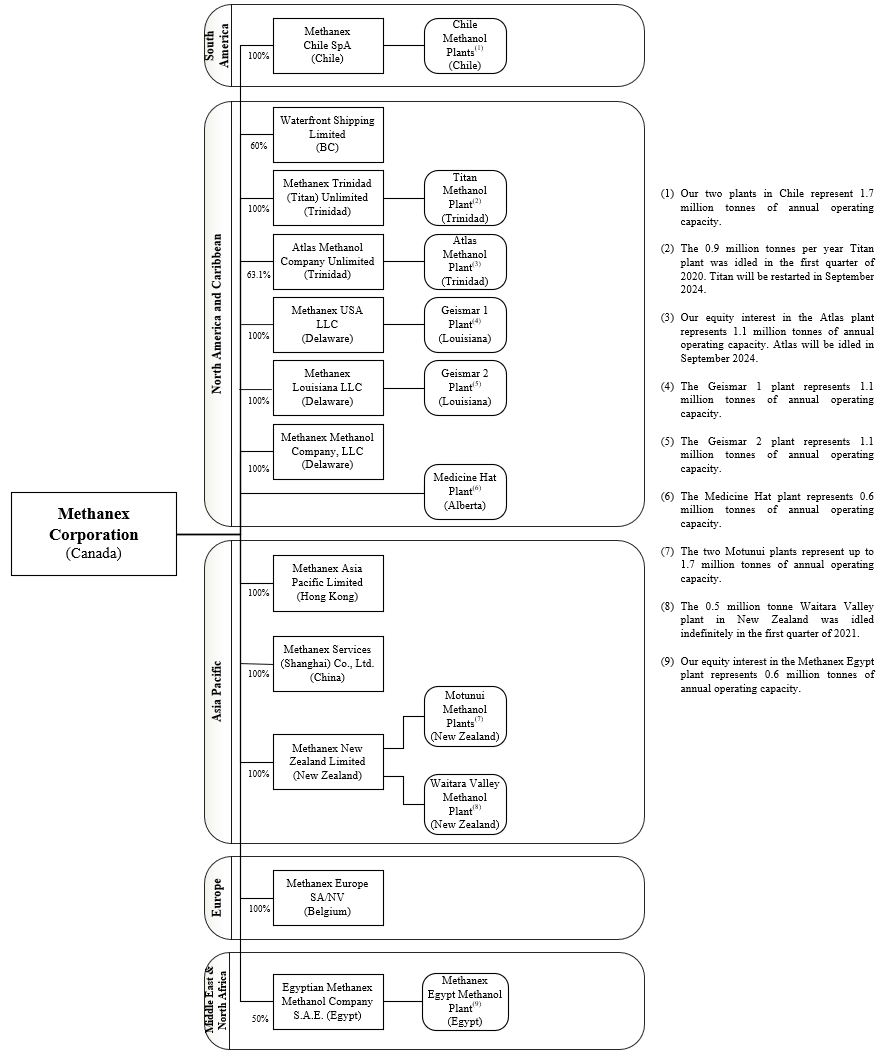
We are the world’s largest producer and supplier of methanol to the major international markets in Asia Pacific, North America, Europe and South America. Our total annual operating capacity, including Methanex's interests in jointly owned plants, is currently 9.3 million tonnes and is located in the United States, New Zealand, Trinidad and Tobago, Chile, Egypt, and Canada. In addition to the methanol produced at our sites, we purchase methanol produced by others under methanol offtake contracts and on the spot market. This gives us flexibility in managing our supply chain while continuing to meet customer needs and support our marketing efforts.
We have marketing rights for 100% of the production from the jointly-owned plants in Trinidad and Tobago and in Egypt, which provides us with an additional 1.3 million tonnes per year of methanol offtake supply when the plants are operating at full capacity.
Refer to the Production Summary section on page 10 for more information.
2023 Industry Overview & Outlook
Methanol is a global commodity and our earnings are significantly affected by fluctuations in the price of methanol, which is directly impacted by changes in methanol supply and demand. Based on the diversity of end products in which methanol is used, demand for methanol is driven by a number of factors, including: the strength of global and regional economies, industrial production levels, energy prices, pricing of end products, downstream capacity additions and government regulations and policies. Methanol industry supply is impacted by the cost of production, methanol industry operating rates and new methanol industry capacity additions.
Demand
We estimate that global methanol demand increased to approximately 91 million tonnes in 2023 driven primarily by growth in China. Outside of China, traditional demand decreased slightly due to ongoing macro-economic headwinds and the impact of inflation and the resulting monetary policy actions on the rate of industrial activity. This was offset by growing demand in China from traditional chemical derivatives driven by higher GDP growth as compared to 2022, higher demand from energy-related applications with increased global mobility, and strong operating rates in the second half of the year from the methanol-to-olefins (MTO) sector.
Over the long term, we believe that traditional chemical demand is influenced by the strength of global and regional economies and industrial production levels. We believe that demand for energy-related applications will be influenced by energy prices, pricing of end products, and government policies that are playing an increasing role in encouraging new applications for methanol due to its emissions benefits as a fuel. The future operating rates and methanol consumption of MTO producers will depend on a number of factors, including pricing for their various final products, the degree of downstream integration of these units with other products, the impact of olefin industry feedstock costs, including naphtha, on relative competitiveness and plant maintenance schedules.
Ongoing regulatory changes as part of the global energy transition along with other factors have led to a growing interest in methanol as a fuel due to its cleaner-burning attributes and potential to reduce greenhouse gas emissions.
There is growing interest in methanol as a marine fuel given its environmental benefits, wide availability, cost competitiveness and ease of use. When made from renewable sources, methanol can be carbon neutral on a life-cycle basis, providing a future-proof pathway to meet the decarbonization goals of the shipping industry. The demand outlook for methanol as marine fuel continues to grow with orders for dual-fueled vessels and retrofits. The current vessels operating coupled with the order book for new builds and retrofits represents over 250 dual-fueled ships. Actual methanol consumption from marine applications will depend on regulations, relative economics versus other fuels, and other factors.
Methanol is also being used as a vehicle fuel in China. Methanol can be blended with gasoline in low quantities and used in existing vehicles and can be used in high-proportion blends such as M85 in flex-fuel vehicles or M100 in dedicated methanol-fueled vehicles. There is significant interest in high-level methanol fuel blends for M100 taxis and trucks (able to run on 100% methanol fuel) in China. There are approximately 30,000 taxis and methanol hybrid passenger cars and 4,000 heavy-duty trucks in China, running on M100 fuel, representing approximately one million tonnes of annual methanol demand. Other countries are in the assessment or near-commercial stage for using methanol as a vehicle fuel.
In China, stricter air quality emissions regulations in several provinces are leading to a phase-out of coal-fueled commercial boilers, kilns, and cooking stoves in favour of cleaner fuels, creating a growing market for methanol as an alternative fuel. We estimate that this demand segment represents approximately seven million tonnes of methanol demand. We continue to support various pilot projects and the development of operational and safety standards to support the commercialization of methanol as a thermal fuel for industrial boilers, kilns and cooking stoves.
Supply
Methanol is predominantly produced from natural gas and is also produced from coal, particularly in China. The cost of production is influenced by the availability and cost of raw materials, including coal and natural gas, freight costs, other operating and maintenance costs and government policies. An increase in economically competitive methanol supply, all else equal, can displace supply from higher cost producers and have a negative impact on methanol price.
In 2023, approximately two to three million tonnes of new production capacity was added in China. In Iran, a new plant was commissioned at the end of 2023 but plant operating rates continue to be uncertain and challenged due to the impact of sanctions, plant technical issues and seasonal natural gas constraints. The methanol industry ran at similar rates in 2023 compared to 2022.
In North America, we expect our new 1.8 million tonne Geismar 3 facility, which will be our third plant in Louisiana, to reach commercial production in 2024. In Malaysia, a 1.8 million tonne plant is under construction with a scheduled start up in 2024. We expect to see increased supply from new capacities to be partially offset by rationalization of existing supply in the market in 2024.
With the shut down of Atlas and the restart of Titan in September 2024 the overall production in Trinidad will be lower by approximately 1 million tonnes annually and we continue to monitor other factors that could further impact supply such as the announced gas diversion from methanol to LNG in Equatorial Guinea. In China, there are planned capacity additions over the near-to-medium term which we expect will be somewhat offset by the closure of some small-scale, inefficient and older plants. New capacity built in China is expected to be consumed domestically as China requires methanol imports to meet growing demand.
Price
The methanol business is a highly competitive commodity industry and future methanol prices will ultimately depend on the strength of global demand and methanol industry supply. Methanol demand and industry supply are driven by several factors as described above. Methanol prices have historically been, and are expected to continue to be, characterized by cyclicality.
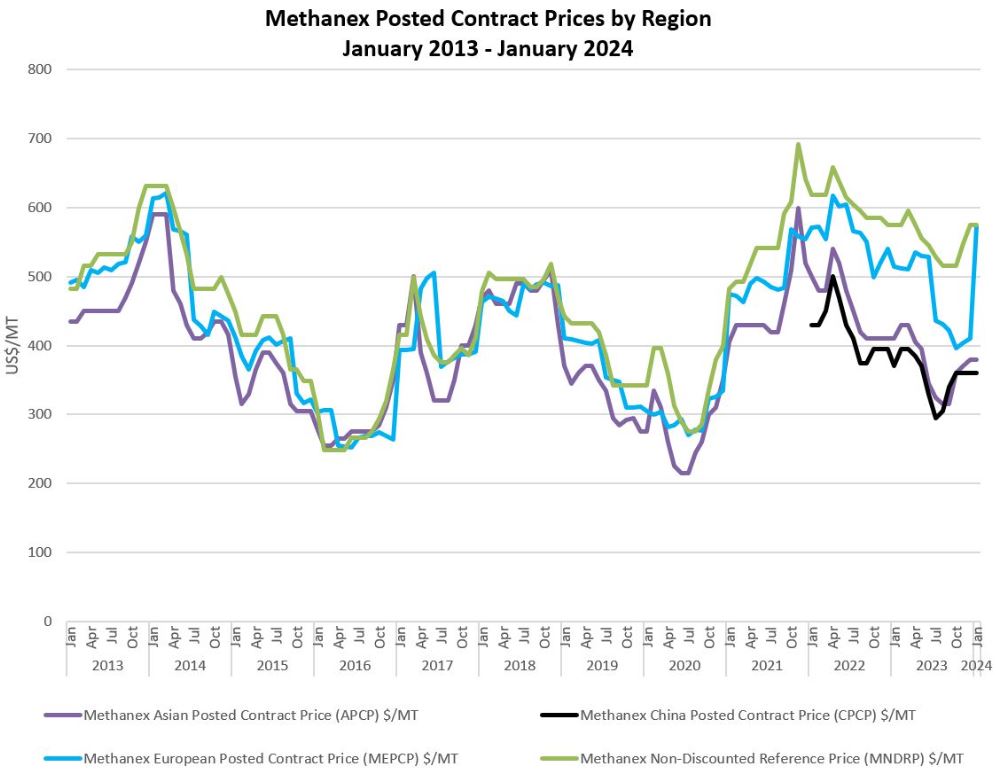
Methanex’s average realized price in 2023 was $333 per tonne compared to $397 per tonne in 2022.
OUR STRATEGY
Our primary objective is to create value through our leadership in the global production, marketing and delivery of methanol to customers. To achieve this objective we have a simple, clearly defined strategy: leadership, low cost and operational excellence. We pride ourselves in being a leader in Responsible Care (an operating ethic and set of principles for sustainability developed by the Chemistry Industry Association of Canada and recognized by the United Nations) and having a strategic focus on managing risks and proactive plans relating to personnel health and safety, environmental protection, community involvement, social responsibility, sustainability, security and emergency preparedness. Our brand differentiator "The Power of Agility®" defines our culture of flexibility, responsiveness and creativity that allows us to capitalize on opportunities quickly as they arise, and swiftly respond to customer needs.
Leadership
Leadership is a key element of our strategy. We are focused on creating value through our position as the leading producer and supplier in the global methanol industry, improving our ability to cost-effectively deliver methanol to customers and supporting both traditional and energy-related global methanol demand growth.
We are the leading producer and supplier of methanol to the major international markets in Asia Pacific, North America, Europe and South America. Our 2023 sales volume of 11.2 million tonnes of methanol represented approximately 12% of global methanol demand. This scale allows us the flexibility to meet customer needs across international markets. Our leadership position has also enabled us to play an important role in the methanol industry, which includes publishing Methanex reference prices that are used in each major market as the basis of pricing for our customer contracts.
The geographically diverse locations of our production sites allow us to deliver methanol cost-effectively to customers in all major global markets. We continue to invest in global distribution and supply infrastructure, which includes the world's largest methanol ocean tanker fleet and terminal capacity in all major international markets, enabling us to enhance value to customers by providing reliable and secure supply.
Another key component of our global leadership strategy is our ability to supplement methanol production with methanol purchased from third parties to give us flexibility in our supply chain to meet customer commitments. We purchase methanol through a combination of methanol offtake contracts and spot purchases. We manage the cost of purchased methanol by taking advantage of our global supply chain infrastructure, which allows us to purchase methanol in the most cost-effective region while still maintaining overall security of supply.
China and Asia continue to lead global methanol demand growth. We have storage capacity in China, South Korea, Japan and Singapore that allows us to cost-effectively manage supply to customers and we have offices in Shanghai, Beijing, Hong Kong, Tokyo, and Seoul to ensure customer service and industry positioning in the region. This enables us to participate in and improve our knowledge of the evolving and growing methanol markets in China and other Asian countries including the use of methanol as a cleaner burning fuel.
Low Cost
A low cost structure is an important competitive advantage in a commodity industry and is a key element of our strategy. Our approach to major business decisions is guided by a drive to improve our cost structure and create value for shareholders. The most significant components of total costs are natural gas for feedstock and distribution costs associated with delivering methanol to customers.
We manage our natural gas costs in two ways: through gas contracts linked to methanol price and through fixed price contracts. Our production facilities outside North America are largely underpinned by natural gas purchase agreements where the natural gas price is linked to methanol prices. This pricing relationship enables these facilities to be competitive throughout the methanol price cycle. In North America, we have fixed price contracts and hedges in place targeting minimum operating rate requirements of approximately 70% in the near term.
We purchase our remaining North American gas requirements through the spot market.
Our production facilities are well located to supply global methanol markets and we take a long-term approach to contracting shipping capacity to meet customer needs. Nonetheless, the cost to distribute methanol from production locations to customers is a significant component of total operating costs. These include costs for ocean shipping, in-market storage facilities and in-market distribution. We focus on identifying initiatives to reduce these costs, including optimizing the use of our shipping fleet, third-party backhaul arrangements and taking advantage of prevailing conditions in the shipping market by varying the type and term of ocean vessel contracts. We also look for opportunities to leverage our global asset position by entering into geographic product exchanges with other methanol producers to reduce distribution and transportation costs.
Operational Excellence
We maintain a focus on operational excellence in all aspects of our business. This includes excellence in manufacturing and supply chain processes, marketing and sales, Responsible Care and financial management.
To differentiate ourselves from competitors, we strive to be the best operator and the preferred supplier to customers. We believe that reliability of supply is critical to the success of our customers’ businesses and our goal is to deliver methanol reliably and cost-effectively. Our commitment to Responsible Care drives our adherence to the highest principles of health, safety, environmental stewardship, and social responsibility. We believe this commitment helps us achieve an excellent overall environmental and safety record and aligns our community involvement and social investments with our core values.
Product stewardship is a vital component of a Responsible Care culture and guides our actions through the complete life cycle of our product. We aim for the highest safety standards to minimize risk to employees, customers and suppliers as well as to the environment and the communities in which we do business. We promote the proper use and safe handling of methanol at all times through a variety of internal and external health, safety and environmental initiatives, and we work with industry colleagues to improve safety standards. We readily share technical and safety expertise with key stakeholders (including customers, end-users, suppliers, and logistics providers) through direct communication and active participation in local and international industry associations, seminars and conferences and online education initiatives.
In 2023, our strategy of operational excellence in financial management supported the construction of the Geismar 3 project to be funded from our cash balance, while continuing to allocate any excess cash to shareholders through share repurchases and a regular dividend. At December 31, 2023, we remain in a strong liquidity position with $458 million in cash and $300 million of undrawn back-up liquidity through our revolving credit facility, leaving us in position to fund the remaining costs for the Geismar 3 project fully with cash on hand. Our intent remains to repay rather than re-finance the $300 million bond due at the end of 2024. We have no other significant debt maturities in the near term. We actively manage our liquidity and capital structure in light of changes to economic conditions, the underlying risks inherent in our operations and the capital requirements of our business.
Sustainability
We have embedded sustainability into our long-term strategy alongside our commitment to Responsible Care. We prioritize the sustainability topics that are most relevant to our business and stakeholders. In a sustainability context, material topics are those environmental, social or governance topics that can significantly impact our business success and are of interest to our key stakeholders. In 2023, we conducted a materiality assessment with external stakeholder outreach to inform whether we were prioritizing the right topics. Our top material sustainability topics were confirmed as greenhouse gas ("GHG") emissions, transition to a low-carbon economy, employee and contractor safety and process safety.
Our executive leadership team has overall responsibility for ensuring our material sustainability topics are being effectively evaluated and managed. These include climate-related risks and opportunities associated with our GHG emissions and the transition to a low-carbon economy. The Executive Leadership Team incorporates these matters into our strategic and business planning activities to support the long-term sustainability of our business.
We believe that having a diverse team, equitable people practices and an inclusive workplace leads to a better culture, better decisions and a better company. Our Equity, Diversity and Inclusion (EDI) Vision is to have an inclusive culture where diversity is valued, differences are embraced and everyone has the opportunity to contribute, develop and advance. The Global EDI Council, made up of senior leaders from around the globe, supports the development and execution of our EDI strategy and its integration into the business. In 2023, we made significant strides towards achieving our vision, including a global roll-out of our foundational EDI learning module to all team members, the development of a Guide to Equitable Succession Planning, and the launch of an Employee Resource Group (ERG) Toolkit to support team members in forming new ERGs.
In March 2024, we issued our 2023 Sustainability Report, aligned with the Sustainability Accounting Standards Board (SASB) and the Task-Force on Climate-related Financial Disclosures (TCFD). Our 2023 Sustainability Report is available at https://www.methanex.com/sustainability.
FINANCIAL HIGHLIGHTS
|
|
|
|
|
|
|
|
|
($ Millions, except as noted) |
2023 |
2022 |
Production (thousands of tonnes) (attributable to Methanex shareholders) |
6,642 |
|
6,118 |
|
Sales volume (thousands of tonnes) |
|
|
Methanex-produced methanol |
6,455 |
|
6,141 |
|
Purchased methanol |
3,527 |
|
3,688 |
|
Commission sales |
1,187 |
|
945 |
|
Total sales volume 1 |
11,169 |
|
10,774 |
|
|
|
|
Methanex average non-discounted posted price ($ per tonne) 2 |
434 |
|
503 |
|
Average realized price ($ per tonne) 3 4 |
333 |
|
397 |
|
|
|
|
Revenue |
3,723 |
|
4,311 |
|
Net income (attributable to Methanex shareholders) |
174 |
|
354 |
|
Adjusted net income 4 |
153 |
|
343 |
|
Adjusted EBITDA 4 |
622 |
|
932 |
|
Cash flows from operating activities |
660 |
|
987 |
|
|
|
|
Basic net income per common share ($ per share) |
2.57 |
|
4.95 |
|
Diluted net income per common share ($ per share) |
2.57 |
|
4.86 |
|
Adjusted net income per common share ($ per share) 4 |
2.25 |
|
4.79 |
|
|
|
|
Common share information (millions of shares) |
|
|
Weighted average number of common shares |
68 |
|
71 |
|
Diluted weighted average number of common shares |
68 |
|
72 |
|
Number of common shares outstanding, end of year |
67 |
|
69 |
|
1 Methanex-produced methanol represents our equity share of volume produced at our facilities and excludes volume marketed on a commission basis related to 36.9% of the Atlas facility and 50% of the Egypt facility that we do not own.
2 Methanex average non-discounted posted price represents the average of our non-discounted posted prices in North America, Europe, China and Asia Pacific weighted by sales volume. Current and historical pricing information is available at www.methanex.com.
3 The Company has used Average realized price ("ARP") throughout this document. ARP is calculated as revenue divided by the total sales volume. It is used by management to assess the realized price per unit of methanol sold, and is relevant in a cyclical commodity environment where revenue can fluctuate widely in response to market prices.
4 The Company has used the terms Adjusted net income, Adjusted net income per common share, and Adjusted EBITDA throughout this document. These items are non-GAAP measures and ratios that do not have any standardized meaning prescribed by GAAP and therefore are unlikely to be comparable to similar measures presented by other companies. Refer to the Non-GAAP Measures section on page 37 for a description of each non-GAAP measure and reconciliations to the most comparable GAAP measures.
PRODUCTION SUMMARY
The following table details the annual operating capacity and actual production at our facilities in 2023 and 2022:
|
|
|
|
|
|
|
|
|
|
|
|
(Thousands of tonnes) |
Annual operating
capacity 1 |
2023
Production |
2022
Production |
USA (Geismar) 2 |
2,200 |
|
2,142 |
|
2,041 |
|
New Zealand 3 |
2,200 |
|
1,381 |
|
1,230 |
|
Trinidad (Methanex interest) 4 |
1,960 |
|
1,074 |
|
981 |
|
Chile |
1,700 |
|
993 |
|
888 |
|
Egypt (50% interest) |
630 |
|
504 |
|
385 |
|
Canada (Medicine Hat) |
600 |
|
548 |
|
593 |
|
|
9,290 |
|
6,642 |
|
6,118 |
|
1 The annual operating capacity of our production facilities may be higher or lower than original nameplate capacity as, over time, these figures have been adjusted to reflect ongoing operating efficiencies. Actual production for a facility in any given year may be higher or lower than operating capacity due to a number of factors, including natural gas availability, feedstock composition, the age of the facility's catalyst, turnarounds and access to CO2 from external suppliers for certain facilities. We review and update the operating capacity of our production facilities on a regular basis based on historical performance.
2 The operating capacity of USA (Geismar) does not include the incremental capacity from the Geismar 3 plant (1.8 million tonnes) that is starting up in 2024.
3 The operating capacity of New Zealand is made up of the two Motunui facilities and the Waitara Valley facility. The Waitara Valley facility is idled indefinitely due to natural gas constraints.(Refer to the New Zealand section below.)
4 The operating capacity of Trinidad is made up of the Titan (100% interest) and Atlas (63.1% interest) facilities. (Refer to the Trinidad and Tobago section below.)
United States
Our Geismar plants in Louisiana produced 2.1 million tonnes of methanol in 2023, compared with 2.0 million in 2022. Production at the Geismar site was higher in 2023 due an unplanned outage in late 2022 as the utilities supplier for the Geismar site experienced a loss of power due to a failed transformer. Refer to the Risk Factors and Risk Management – United States section on page 28 for more information.
New Zealand
In New Zealand, we produced 1.4 million tonnes of methanol in 2023 compared with 1.2 million tonnes in 2022. Production for 2023 was higher than 2022 due to higher gas deliveries in 2023. We operate the two Motunui plants in New Zealand with our smaller Waitara Valley plant idled indefinitely since the beginning of 2021 due to natural gas constraints.
We estimate production for 2024 to be between 1.0 - 1.1 million tonnes. 2024 natural gas supply is expected to be impacted by a combination of our suppliers' planned natural gas infrastructure maintenance outages as well as lower than expected output from existing wells. While upstream investment has been made by our gas suppliers in New Zealand over the past two years, recent gas production results have been lower than originally expected which has contributed to the revised forecast for lower production in 2024 as compared to 2023. Refer to the Risk Factors and Risk Management – New Zealand section on page 28 for more information.
Trinidad and Tobago
We operate our fully-owned Titan facility, which is currently idled, and the Atlas facility, in which we have a 63.1% economic interest and marketing rights for 100% of the production. Together, the two facilities represent 2.0 million tonnes of annual operating capacity. The Atlas facility produced 1.1 million tonnes of methanol (Methanex share) in 2023, compared with 1.0 million tonnes in 2022. Production in Trinidad was higher in 2023 due to unplanned outages in the fourth quarter of 2022. In October, Methanex signed a two-year natural gas supply agreement with the National Gas Company of Trinidad and Tobago (NGC) for its currently idled, wholly owned, Titan methanol plant (875,000 tonnes per year capacity) to restart operations in September 2024. Simultaneously, the Atlas plant (Methanex interest 63.1% or 1,085,000 tonnes per year capacity) will be idled in September 2024, when its legacy 20-year natural gas supply agreement expires. Refer to the Risk Factors and Risk Management – Trinidad and Tobago section on page 28 for more information.
Chile
The Chile facilities produced 1.0 million tonnes of methanol in 2023 compared with 0.9 million tonnes in 2022. Production in Chile was higher in 2023 due to higher gas availability from Argentina. Both plants are expected to run at full rates from the end of September 2023 through April 2024, the Southern hemisphere summer months. We estimate production for 2024 will be between 1.1 - 1.2 million tonnes. This production is underpinned by year-round natural gas supply from Chile for about 30 – 35% of our requirements with the remaining 65 – 70% from Argentina during the non-winter period allowing us to operate both plants at full rates. Natural gas development and related infrastructure investments in Argentina continue to progress and we are working with our Argentine natural gas suppliers on extending the period of full gas availability to our plants. Refer to the Risk Factors and Risk Management – Chile section on page 28 for more information.
Egypt
We operate the 1.3 million tonne per year methanol facility in Egypt, in which we have a 50% economic interest and marketing rights for 100% of the production. We produced 1.0 million tonnes of methanol (Methanex share of 0.5 million) in Egypt in 2023 compared to 0.8 million tonnes (Methanex share of 0.4 million) in 2022. We had lower levels of production from Egypt in 2022 as we completed an extended planned turnaround. 2023 production in Egypt was impacted by an unplanned outage in mid-October caused by a mechanical failure in the synthesis gas compressor. The unit was removed from service and repaired on an expedited schedule at the manufacturer overseas. The repairs were completed and the plant restarted in February 2024. Refer to the Risk Factors and Risk Management – Egypt section on page 29 for more information.
Canada
Medicine Hat produced 0.5 million tonnes of methanol in 2023 compared with 0.6 million tonnes in 2022. Production was lower in 2023 compared to 2022 due to unplanned outages in 2023. Refer to the Risk Factors and Risk Management – Canada section on page 29 for more information.
HOW WE ANALYZE OUR BUSINESS
Our operations consist of a single operating segment: the production and sale of methanol. We review our financial results by analyzing changes in the components of Adjusted EBITDA, mark-to-market impact of share-based compensation, depreciation and amortization, finance costs, finance income and other, and income taxes.
The Company has used the terms Adjusted net income, Adjusted net income per common share, and Adjusted EBITDA throughout this document. These items are non-GAAP measures and ratios that do not have any standardized meaning prescribed by GAAP and therefore are unlikely to be comparable to similar measures presented by other companies. Refer to the Non-GAAP Measures section on page 37 for a description of each non-GAAP measure and reconciliations to the most comparable GAAP measures.
In addition to the methanol that we produce at our facilities, we also purchase and resell methanol produced by others and we sell methanol on a commission basis. We analyze the results of all methanol sales together, excluding commission sales volume. The key drivers of changes in Adjusted EBITDA are average realized price, cash costs and sales volume, which are defined and calculated as follows:
|
|
|
|
|
|
| PRICE |
The change in Adjusted EBITDA as a result of changes in average realized price is calculated as the difference from period to period in the selling price of methanol multiplied by the current period total methanol sales volume, excluding commission sales volume. |
CASH
COSTS |
The change in Adjusted EBITDA as a result of changes in cash costs is calculated as the difference from period to period in cash costs per tonne multiplied by the current period total methanol sales volume, excluding commission sales volume in the current period. The cash costs per tonne is the weighted average of the cash cost per tonne of Methanex-produced methanol and the cash cost per tonne of purchased methanol. The cash cost per tonne of Methanex-produced methanol includes absorbed fixed cash costs per tonne and variable cash costs per tonne. The cash cost per tonne of purchased methanol consists principally of the cost of methanol itself. In addition, the change in Adjusted EBITDA as a result of changes in cash costs includes the changes from period to period in unabsorbed fixed production costs, consolidated selling, general and administrative expenses and fixed storage and handling costs. |
| SALES VOLUME |
The change in Adjusted EBITDA as a result of changes in sales volume is calculated as the difference from period to period in total methanol sales volume, excluding commission sales volume, multiplied by the margin per tonne for the prior period. The margin per tonne for the prior period is the weighted average margin per tonne of Methanex-produced methanol and margin per tonne of purchased methanol. The margin per tonne for Methanex-produced methanol is calculated as the selling price per tonne of methanol less absorbed fixed cash costs per tonne and variable cash costs per tonne. The margin per tonne for purchased methanol is calculated as the selling price per tonne of methanol less the cost of purchased methanol per tonne. |
We own 63.1% of the Atlas methanol facility and market the remaining 36.9% of its production through a commission offtake agreement, both of which we recognize as revenue on a gross basis. A contractual agreement between us and our partners establishes joint control over Atlas. As a result, we account for this investment using the equity method of accounting, which results in 63.1% of the net assets and net earnings of Atlas being presented separately in the consolidated statements of financial position and consolidated statements of income, respectively. For the purpose of analyzing our business, Adjusted EBITDA, Adjusted net income and Adjusted net income per common share include an amount representing our 63.1% equity share in Atlas. Our analysis of depreciation and amortization, finance costs, finance income and other, and income taxes is consistent with the presentation of our consolidated statements of income and excludes amounts related to Atlas.
We own 50% of the Egypt methanol facility and market the remaining 50% of its production through a commission offtake agreement. We own 60% of Waterfront Shipping, which provides service to Methanex for the ocean freight component of our distribution and logistics costs. We consolidate both Egypt and Waterfront Shipping, which results in 100% of the financial results being included in our financial statements. Non-controlling interests are included in the Company’s consolidated financial statements and represent the non-controlling shareholders’ interests in the Egypt methanol facility and Waterfront Shipping. For the purpose of analyzing our business, Adjusted EBITDA, Adjusted net income and Adjusted net income per common share exclude the amounts associated with non-controlling interests.
FINANCIAL RESULTS
For the year ended December 31, 2023, we reported a net income attributable to Methanex shareholders of $174 million ($2.57 net income per common share on a diluted basis), compared with a net income attributable to Methanex shareholders of $354 million ($4.86 net income per common share on a diluted basis) for the year ended December 31, 2022. Net income attributable to Methanex shareholders for the year ended December 31, 2023 is lower compared to the year ended December 31, 2022, primarily due to a lower average realized price and the non-recurring Egypt gas redirection and sale proceeds which occurred in 2022, partially offset by higher sales of Methanex-produced methanol and proceeds from a gas contract settlement that occurred in 2023.
For the year ended December 31, 2023, we reported Adjusted EBITDA of $622 million and Adjusted net income of $153 million ($2.25 Adjusted net income per common share), compared with Adjusted EBITDA of $932 million and Adjusted net income of $343 million ($4.79 Adjusted net income per common share) for the year ended December 31, 2022.
We calculate Adjusted EBITDA and Adjusted net income by including amounts related to our equity share of the Atlas facility (63.1% interest) and by excluding the non-controlling interests' share, the mark-to-market impact of share-based compensation as a result of changes in our share price, the impact of the Egypt gas contract revaluation included in finance income and other and the impact of certain items associated with specific identified events. For 2023, the settlement of a historical dispute under an existing gas contract was excluded from Adjusted EBITDA and Adjusted net income due to the one-time nature of the settlement and to better reflect the operating performance of the Company's business. For 2022, there were no specifically identified events impacting Adjusted EBITDA or Adjusted net income.
A reconciliation from net income attributable to Methanex shareholders to Adjusted net income and the calculation of Adjusted diluted net income per common share is as follows:
|
|
|
|
|
|
|
|
|
($ Millions, except number of shares and per share amounts) |
2023 |
2022 |
Net income attributable to Methanex shareholders |
$ |
174 |
|
$ |
354 |
|
Mark-to-market impact of share-based compensation, net of tax |
13 |
|
(6) |
|
Gas contract settlement, net of tax |
(31) |
|
— |
|
Impact of Egypt gas contract revaluation, net of tax |
(3) |
|
(5) |
|
Adjusted net income |
$ |
153 |
|
$ |
343 |
|
Diluted weighted average shares outstanding (millions) |
68 |
|
72 |
|
Adjusted net income per common share |
$ |
2.25 |
|
$ |
4.79 |
|
A summary of our consolidated statements of income for 2023 and 2022 is as follows:
|
|
|
|
|
|
|
|
|
($ Millions) |
2023 |
2022 |
Consolidated statements of income: |
|
|
Revenue |
$ |
3,723 |
|
$ |
4,311 |
|
Cost of sales and operating expenses |
(3,068) |
|
(3,446) |
|
Egypt gas redirection and sale proceeds |
— |
|
118 |
|
Mark-to-market impact of share-based compensation |
16 |
|
(7) |
|
| Adjusted EBITDA attributable to associate |
135 |
|
151 |
|
Amounts excluded from Adjusted EBITDA attributable to non-controlling interests |
(184) |
|
(195) |
|
| Adjusted EBITDA |
622 |
|
932 |
|
|
|
|
Mark-to-market impact of share-based compensation |
(16) |
|
7 |
|
Depreciation and amortization |
(392) |
|
(372) |
|
| Gas contract settlement, net of tax |
31 |
|
— |
|
Finance costs |
(117) |
|
(131) |
|
Finance income and other |
40 |
|
25 |
|
Income tax expense |
(1) |
|
(120) |
|
Earnings of associate adjustment 1 |
(67) |
|
(74) |
|
Non-controlling interests adjustment 1 |
74 |
|
87 |
|
Net income attributable to Methanex shareholders |
$ |
174 |
|
$ |
354 |
|
Net income |
$ |
284 |
|
$ |
462 |
|
1 These adjustments represent depreciation and amortization, finance costs, finance income and other and income taxes associated with our 63.1% interest in the Atlas methanol facility and the non-controlling interests.
Revenue
There are many factors that impact our global and regional revenue. The methanol business is a global commodity industry affected by supply and demand fundamentals. Based on the diversity of end products in which methanol is used, demand for methanol is driven by a number of factors, including: strength of global and regional economies, industrial production levels, energy prices, pricing of end products and government regulations and policies. Revenue was $3.7 billion in 2023 compared to $4.3 billion in 2022. The lower revenue reflects a lower average realized price, partially offset by higher sales volume in 2023 compared to 2022.
We publish regional non-discounted reference prices for each major methanol market and these posted prices are reviewed and revised monthly or quarterly based on industry fundamentals and market conditions. Most of our customer contracts use published Methanex reference prices as a basis for pricing, and we offer discounts to customers based on various factors. Our average non-discounted published reference price in 2023 was $434 per tonne compared with $503 per tonne in 2022.
Our average realized price in 2023 was $333 per tonne compared to $397 per tonne in 2022.
Distribution of Revenue
The geographic distribution of revenue by customer location for 2023 was comparable to 2022. Details are as follows:
|
|
|
|
|
|
|
|
|
|
|
|
|
|
|
|
|
|
|
($ Millions, except where noted) |
2023 |
2022 |
|
|
|
|
China |
$ |
1,043 |
28% |
$ |
1,106 |
26% |
|
|
|
|
Europe |
722 |
19% |
830 |
19% |
|
|
|
|
United States |
575 |
15% |
657 |
15% |
|
|
|
|
South America |
429 |
12% |
459 |
11% |
|
|
|
|
South Korea |
392 |
11% |
543 |
13% |
|
|
|
|
| Other Asia |
387 |
10% |
519 |
12% |
|
|
|
|
Canada |
175 |
5% |
197 |
4% |
|
|
|
|
|
$ |
3,723 |
100% |
$ |
4,311 |
100% |
|
|
|
|
Adjusted EBITDA (Attributable to Methanex Shareholders)
2023 Adjusted EBITDA was $622 million compared with 2022 Adjusted EBITDA of $932 million, a decrease of $310 million. The key drivers of change in our Adjusted EBITDA are average realized price, sales volume and cash costs as described below (refer to the How We Analyze Our Business section on page 12 for more information).
|
|
|
|
|
|
($ Millions) |
2023 vs. 2022 |
Average realized price |
$ |
(657) |
|
Sales volume |
16 |
|
Total cash costs |
331 |
|
|
|
Decrease in Adjusted EBITDA |
$ |
(310) |
|
Average Realized Price
Our average realized price for the year ended December 31, 2023, was $333 per tonne compared to $397 per tonne for 2022, and this decreased Adjusted EBITDA by $657 million (refer to the Financial Results – Revenue section on page 13 for more information).
Sales Volume
Methanol sales volume, excluding commission sales volume, for the year ended December 31, 2023, increased to 10.0 million tonnes from 9.8 million tonnes in 2022, and this increased Adjusted EBITDA by $16 million. Including commission sales volume from the Atlas and Egypt facilities, our total methanol sales volume was 11.2 million tonnes in 2023 compared with 10.8 million tonnes in 2022. Sales volume may vary year to year depending on customer requirements and inventory levels as well as the available commission sales volume.
Total Cash Costs
The primary drivers of change in our total cash costs are changes in the cost of Methanex-produced methanol and changes in the cost of methanol we purchase from others ("purchased methanol"). We supplement our production with methanol produced by others through methanol offtake contracts and purchases on the spot market to meet customer needs and support our marketing efforts in major global markets.
We apply the first-in, first-out method of accounting for inventories and it generally takes between 30 and 60 days to sell the methanol we produce or purchase. Accordingly, the changes in Adjusted EBITDA as a result of changes in Methanex-produced and purchased methanol costs primarily depend on changes in methanol pricing and the timing of inventory flows.
In a rising price environment, our margins at a given price are higher than in a stable price environment as a result of methanol purchases and production versus sales. Generally, the opposite applies when methanol prices are decreasing.
The changes in Adjusted EBITDA due to changes in total cash costs for 2023 compared with 2022 were due to the following:
|
|
|
|
|
|
($ Millions) |
2023 vs. 2022 |
Methanex-produced methanol costs |
$ |
199 |
|
Proportion of Methanex-produced methanol sales |
18 |
|
Purchased methanol costs |
207 |
|
Logistics costs |
(18) |
|
Egypt gas redirection and sale proceeds |
(58) |
|
Other, net |
(17) |
|
Increase in Adjusted EBITDA due to changes in total cash costs |
$ |
331 |
|
Methanex-Produced Methanol Costs
Natural gas is the primary feedstock at our methanol facilities and is the most significant component of Methanex-produced methanol costs. Through 2023, we purchased natural gas for more than half of our production under natural gas purchase agreements where the unique terms of each contract include a base price and a variable price component linked to methanol price to reduce our commodity price risk exposure. The variable price component of each gas contract is adjusted by a formula linked to methanol sales prices above a certain level. We also purchase natural gas in North America and are exposed to natural gas spot price fluctuations for the unhedged portion of our gas needs in the region. Methanex-produced methanol costs were lower in 2023 compared with 2022 by $199 million, primarily due to the impact of changes in realized methanol prices on the variable portion of our natural gas cost, changes in spot gas prices which impact the unhedged portion of our North American operations, timing of inventory flows and changes in the mix of production sold from inventory. For additional information regarding our natural gas supply agreements, refer to the Liquidity and Capital Resources – Summary of Contractual Obligations and Commercial Commitments section on page 21.
Proportion of Methanex-Produced Methanol Sales
The cost of purchased methanol is directly linked to the selling price for methanol at the time of purchase and the cost of purchased methanol is generally higher than the cost of Methanex-produced methanol. Accordingly, an increase in the proportion of Methanex-produced methanol sales results in a decrease in our overall cost structure for a given period, while a decrease in the proportion of Methanex-produced methanol will increase our cost structure. The proportion of Methanex-produced methanol sales increased in 2023 due to higher production and this decreased costs and increased Adjusted EBITDA by $18 million for 2023 compared with 2022.
Purchased Methanol Costs
A key element of our corporate strategy is global leadership and, as such, we have built a leading market position in each of the major global markets where methanol is sold. We supplement our production with purchased methanol through methanol offtake contracts and on the spot market to meet customer needs and support our marketing efforts within the major global markets. In structuring purchase agreements, we look for opportunities that provide synergies with our existing supply chain that allow us to purchase methanol in the most cost-effective region. The cost of purchased methanol consists principally of the cost of the methanol itself, which is directly related to the price of methanol at the time of purchase. Lower methanol prices in 2023 and the timing of inventory flows and purchases decreased the cost of purchased methanol per tonne and this increased Adjusted EBITDA by $207 million compared with 2022.
Logistics Costs
Our investment in global distribution and supply infrastructure includes a dedicated fleet of ocean-going vessels. We utilize these vessels to enhance value to customers by providing reliable and secure methanol supply. Additionally we carry third-party backhaul cargoes, when available, to optimize supply chain costs overall. Logistics costs can also vary from period to period primarily depending on the levels of production from each of our production facilities, the resulting impact on our supply chain, and variability in bunker fuel costs. Higher logistics costs in 2023 decreased Adjusted EBITDA by $18 million compared to 2022. Logistics costs increased in 2023 compared to 2022 primarily due to the mix of production from various plants and the impact of longer supply routes, with the outage in Egypt and preparation for Geismar 3 causing increased costs in the fourth quarter of 2023.
Egypt Gas Redirection and Sale Proceeds
In the third quarter of 2022, we entered into an agreement to redirect and sell the Egypt plant's contracted natural gas during an extended turnaround for a three-month period. Adjusted EBITDA for the year ended December 31, 2022 includes $58 million (attributable to Methanex) from this transaction which did not recur in 2023.
Other, Net
Other, net relates to unabsorbed fixed costs, selling, general and administrative expenses and other operational items. For the year ended December 31, 2023 compared with the same period in 2022, other costs were higher by $17 million mainly due to the organization build-up of costs relating to the start-up of Geismar 3 plant.
Mark-to-Market Impact of Share-Based Compensation
We grant share-based awards as an element of compensation. Share-based awards granted include stock options, share appreciation rights, tandem share appreciation rights, deferred share units, restricted share units and performance share units. For all share-based awards, share-based compensation is recognized over the related vesting period for the proportion of the service that has been rendered at each reporting date. Share-based compensation includes an amount related to the grant date value and a mark-to-market impact as a result of subsequent changes in the fair value of the share-based awards primarily driven by the Company’s share price. The grant date value amount is included in Adjusted EBITDA and Adjusted net income. The mark-to-market impact of share-based compensation as a result of changes in our share price is excluded from Adjusted EBITDA and Adjusted net income and is analyzed separately.
|
|
|
|
|
|
|
|
|
($ Millions, except share price) |
2023 |
2022 |
Methanex Corporation share price 1 |
$ |
47.36 |
|
$ |
37.86 |
|
Grant date fair value expense included in Adjusted EBITDA and Adjusted net income |
19 |
|
22 |
|
Mark-to-market impact 2 |
16 |
|
(7) |
|
Total share-based compensation expense, before tax |
$ |
35 |
|
$ |
15 |
|
1 U.S. dollar share price of Methanex Corporation as quoted on the NASDAQ Global Select Market on the last trading day of the respective period.
2 For the periods presented, the mark-to-market impact on share-based compensation is primarily due to changes in the Methanex Corporation share price.
For stock options, the cost is measured based on an estimate of the fair value at the grant date using the Black-Scholes option pricing model, and this grant date fair value is recognized as compensation expense over the related vesting period with no subsequent re-measurement to fair value.
Share appreciation rights ("SARs") are non-dilutive units that grant the holder the right to receive a cash payment upon exercise for the difference between the market price of the Company’s common shares and the exercise price that is determined at the grant date. Tandem share appreciation rights ("TSARs") give the holder the choice between exercising a regular stock option or a SAR. The fair value of SARs and TSARs are re-measured each quarter using the Black-Scholes option pricing model, which considers the market value of the Company’s common shares on the last trading day of each quarter.
Deferred, restricted and performance share units are grants of notional common shares that are redeemable for cash based on the market value of the Company’s common shares and are non-dilutive to shareholders. Performance share units granted annually reflect a long-term incentive plan where units are redeemable for cash based on the market value of the Company's common shares and are non-dilutive to shareholders. Units vest over three years and include two performance factors: (i) relative total shareholder return of Methanex shares versus a specific market index, and (ii) the three-year average return on capital employed. The relative total shareholder performance factor is measured by the Company at the grant date and each reporting date using a Monte-Carlo simulation model to determine fair value. The three-year average return on capital employed performance factor reflects the actual return on capital employed for historical periods and management's best estimate for forecast periods to determine the expected number of units to vest.
For deferred, restricted and performance share units, the cost of the service received as consideration is initially measured based on the market value of the Company’s common shares at the date of grant. The grant date fair value is recognized as compensation expense over the vesting period with a corresponding increase in liabilities. Deferred, restricted and performance share units are re-measured at each reporting date based on the market value of the Company’s common shares with changes in fair value recognized as compensation expense for the proportion of the service that has been rendered at that date.
The price of the Company’s common shares as quoted on the NASDAQ Global Select Market Composite increased from $37.86 per share at December 31, 2022, to $47.36 per share at December 31, 2023. As a result of the increase in the share price and the resulting impact on the fair value of the outstanding units, we recorded a $16 million mark-to-market expense related to share-based compensation during 2023.
Depreciation and Amortization
Depreciation and amortization was $392 million for the year ended December 31, 2023, and is higher than $372 million for the year ended December, 31 2022 due to the higher cost base of depreciable property, plant and equipment driven by additional capitalized maintenance costs and ocean going vessel additions.
Finance Costs
|
|
|
|
|
|
|
|
|
($ Millions) |
2023 |
2022 |
Finance costs before capitalized interest |
$ |
173 |
|
$ |
167 |
|
|
|
|
Less capitalized interest |
(55) |
|
(36) |
|
Finance costs |
$ |
117 |
|
$ |
131 |
|
Finance costs are primarily comprised of interest on borrowings and lease obligations and were $117 million for the year ended December 31, 2023, compared to $131 million for the year ended December 31, 2022. Finance costs are lower primarily due to higher capitalized interest. Capitalized interest relates to interest costs capitalized for the Geismar 3 project. Refer to the Liquidity and Capital Resources section of page 18 for more information.
Finance Income and Other
Finance income and other were $40 million for the year ended December 31, 2023, compared to $25 million for the year ended December 31, 2022. Finance income and other were higher during the year ended December 31, 2023 compared to the same period in 2022 primarily due to higher interest income.
Income Taxes
A summary of our income taxes for 2023 compared with 2022 is as follows:
|
|
|
|
|
|
|
|
|
|
|
|
|
|
|
($ Millions, except where noted) |
2023 |
2022 |
|
|
|
|
|
|
Per consolidated statement of income |
Adjusted 1 2 3 4 |
Per consolidated statement of income |
Adjusted 1 2 3 4 |
Net income before income tax |
$ |
286 |
|
$ |
199 |
|
$ |
582 |
|
$ |
482 |
|
Income tax expense |
(2) |
|
(46) |
|
(120) |
|
(139) |
|
Net income after income tax |
$ |
284 |
|
$ |
153 |
|
$ |
462 |
|
$ |
343 |
|
Effective tax rate |
1% |
23% |
21% |
29% |
1 Adjusted net income before income tax reflects amounts required for the inclusion of 63.1% of Atlas income, 50% of Egypt and 60% of Waterfront Shipping, as well as amounts required to exclude the mark-to-market impact of share-based-compensation expense or recovery, the impact of the Egypt gas contract revaluation, and the impact of the settlement of a historical dispute under an existing gas contract. The most directly comparable measure in the financial statements is net income before tax.
2 Adjusted income tax expense reflects amounts required for the inclusion of 63.1% of Atlas income, 50% of Egypt and 60% of Waterfront Shipping, as well as amounts required to exclude the tax impact of mark-to-market impact of share-based-compensation expense or recovery, the impact of the Egypt gas contract revaluation, and the impact of the settlement of a historical dispute under an existing gas contract calculated at the appropriate applicable tax rate for their respective jurisdictions. The most directly comparable measure in the financial statements is income tax expense.
3 Adjusted effective tax rate is a non-GAAP ratio and is calculated as adjusted income tax expense or recovery, divided by adjusted net income before tax.
4 Adjusted net income before income tax and Adjusted income tax (expense) recovery are non-GAAP measures. Adjusted effective tax rate is a non-GAAP ratio. These do not have any standardized meaning prescribed by GAAP and therefore are unlikely to be comparable to similar measures presented by other companies. Management uses these to assess the effective tax rate. These measures and ratios are useful as they are a better measure of our underlying tax rate across the jurisdictions in which we operate.
We earn the majority of our income in the United States, New Zealand, Trinidad and Tobago, Chile, Egypt and Canada. Including applicable withholding taxes, the statutory tax rate applicable to Methanex in the United States is 23%, New Zealand is 28%, Trinidad and Tobago is 38%, Chile is 35%, Egypt is 30% and Canada is 24.5%. We accrue for taxes that will be incurred upon distributions from our subsidiaries when it is probable that the earnings will be repatriated. As the Atlas entity is accounted for using the equity method, any income taxes related to Atlas are included in earnings of associate and therefore excluded from total income taxes but included in the calculation of Adjusted net income.
The effective tax rate based on Adjusted net income was an expense of 23% for the year ended December 31, 2023, compared to 29% for the year ended December 31, 2022. Adjusted net income represents the amount that is attributable to Methanex shareholders and excludes the mark-to-market impact of share-based compensation and the impact of certain items associated with specific identified events. The effective tax rate differs from period to period depending on the source of earnings (losses) and the impact of foreign exchange fluctuations against the United States dollar on our tax balances. In periods with low income levels or losses, the distribution of income and loss between jurisdictions can result in income tax rates that are not indicative of the longer-term corporate tax rate. In addition, the effective tax rate is impacted by changes in tax legislation in the jurisdictions in which we operate.
The following table shows a reconciliation of Net income to Adjusted net income before tax, and of Income tax expense to Adjusted income tax expense:
|
|
|
|
|
|
|
|
|
($ Millions, except where noted) |
2023 |
2022 |
| Net income |
$ |
284 |
|
$ |
462 |
|
| Adjusted for: |
|
|
| Income tax expense |
1 |
|
120 |
|
| Earnings from associate |
(99) |
|
(77) |
|
| Share of associate's income before tax |
152 |
|
120 |
|
| Net income before tax of non-controlling interests |
(103) |
|
(130) |
|
| Mark-to-market impact of share-based compensation |
16 |
|
(7) |
|
| Gas contract settlement |
(47) |
|
— |
|
| Impact of Egypt gas contract revaluation |
(5) |
|
(6) |
|
| Adjusted net income before tax |
$ |
199 |
|
$ |
482 |
|
|
|
|
| Income tax expense |
$ |
(1) |
|
$ |
(120) |
|
| Adjusted for: |
|
|
| Inclusion of our share of associate's adjusted tax expense |
(37) |
|
(43) |
|
| Removal of non-controlling interest's share of tax (recovery) expense |
(7) |
|
22 |
|
| Tax (recovery) expense on mark-to-market impact of share-based compensation |
(3) |
|
1 |
|
| Tax on impact of Egypt gas contract revaluation |
2 |
|
1 |
|
| Adjusted income tax expense |
$ |
(46) |
|
$ |
(139) |
|
For additional information regarding income taxes, refer to note 16 of our 2023 consolidated financial statements.
LIQUIDITY AND CAPITAL RESOURCES
A summary of our consolidated statements of cash flows is as follows:
|
|
|
|
|
|
|
|
|
($ Millions) |
2023 |
2022 |
Cash flows from/(used in) operating activities: |
|
|
Cash flows from operating activities before changes in non-cash working capital |
$ |
719 |
|
$ |
933 |
|
Changes in non-cash working capital related to operating activities |
(59) |
|
54 |
|
|
660 |
|
987 |
|
Cash flows from/(used in) financing activities: |
|
|
Payments for the repurchase of shares |
(86) |
|
(253) |
|
Dividend payments to Methanex Corporation shareholders |
(49) |
|
(44) |
|
Interest paid |
(169) |
|
(162) |
|
| Repayment of long-term debt and financing fees |
(12) |
|
(9) |
|
| Repayment of lease obligations |
(118) |
|
(106) |
|
|
|
|
| Distributions to non-controlling interests |
(185) |
|
(85) |
|
Proceeds on issue of shares on exercise of stock options |
1 |
|
1 |
|
|
|
|
| Restricted cash for debt service accounts |
(1) |
|
(1) |
|
| Sale of partial interest in subsidiary |
— |
|
149 |
|
Changes in non-cash working capital relating to financing activities |
69 |
|
2 |
|
|
|
|
|
(551) |
|
(508) |
|
Cash flows from/(used in) investing activities: |
|
|
Property, plant and equipment |
(178) |
|
(146) |
|
Geismar plant under construction |
(270) |
|
(432) |
|
|
|
|
|
|
|
|
|
|
Changes in non-cash working capital relating to investing activities |
(60) |
|
24 |
|
|
(509) |
|
(553) |
|
Decrease in cash and cash equivalents |
(400) |
|
(74) |
|
Cash and cash equivalents, end of year |
$ |
458 |
|
$ |
858 |
|
Cash Flow Highlights
Cash Flows from Operating Activities
Cash flows from operating activities for the year ended December 31, 2023 were $660 million compared with $987 million for the year ended December 31, 2022. The decrease in cash flows from operating activities is primarily due to lower earnings and differences in non-cash working capital changes, offset by lower tax payments and higher dividends received from the Atlas joint venture.
The following table provides a summary of these items for 2023 and 2022:
|
|
|
|
|
|
|
|
|
($ Millions) |
2023 |
2022 |
Net income |
$ |
284 |
|
$ |
462 |
|
Deduct earnings of associate |
(99) |
|
(77) |
|
Add dividends received from associate |
112 |
|
97 |
|
Add (deduct) non-cash items: |
|
|
Depreciation and amortization |
392 |
|
372 |
|
| Income tax expense |
1 |
|
120 |
|
Share-based compensation expense |
35 |
|
15 |
|
Finance costs |
117 |
|
131 |
|
Interest received |
22 |
|
10 |
|
Income taxes paid |
(82) |
|
(164) |
|
Other |
(63) |
|
(33) |
|
Cash flows from operating activities before changes in non-cash working capital |
719 |
|
933 |
|
Changes in non-cash working capital: |
|
|
Trade and other receivables |
(33) |
|
38 |
|
Inventories |
16 |
|
33 |
|
Prepaid expenses |
(19) |
|
(3) |
|
Accounts payable and accrued liabilities |
(23) |
|
(14) |
|
|
(59) |
|
54 |
|
Cash flows from operating activities |
$ |
660 |
|
$ |
987 |
|
For a discussion of the changes in net income, depreciation and amortization, income tax expense, share-based compensation expense (recovery) and finance costs, refer to the Financial Results section on page 12.
Changes in non-cash working capital decreased cash flows from operating activities by $59 million for the year ended December 31, 2023, compared with an increase of $54 million for the year ended December 31, 2022. Trade and other receivables increased in 2023 and this decreased cash flows from operating activities by $33 million, primarily due to timing of invoices and payments by customers by the end of 2023 compared to 2022. Inventories decreased primarily due to the lower cost of production in the fourth quarter of 2023 compared to the fourth quarter of 2022 driven by the impact of lower methanol prices on our natural gas costs, which increased cash flows from operating activities by $16 million. Accounts payable and accrued liabilities decreased in 2023 compared to 2022 due to the impact of lower gas costs and lower methanol prices on purchased methanol at the end of 2023 compared to at the end of 2022, which decreased cash flows from operating activities by $23 million.
Cash Flows from Financing Activities
In 2023, we repurchased 1,894,711 common shares under a normal course issuer bid for approximately $86 million, compared to 5,551,751 common shares repurchased in 2022 for approximately $253 million.
Total dividend payments in 2023 were $49 million compared with $44 million in 2022 as a result of an increase in quarterly dividends in 2023. Our quarterly dividend was increased from $0.175 per share to $0.185 per share in April of 2023.
Total interest payments increased from $162 million in 2022 to $169 million in 2023 as a result of an increase in leases held in 2023. The Company has no debt maturities until December 2024, other than normal course obligations for principal repayments related to our other limited recourse debt facilities.
Distributions to non-controlling interests, including the 50% ownership of the Egypt entity and the 40% ownership of Waterfront Shipping not attributable to Methanex, were $185 million in 2023 compared to $85 million in 2022 and include amounts accrued but unpaid during 2023. The higher distributions to non-controlling interests for 2023 compared to 2022 were primarily due to the timing of distribution accruals and changes in earnings of Egypt and Waterfront Shipping.
In 2022, the Company completed the sale of a 40% equity interest in Waterfront Shipping Limited for cash proceeds of $145 million, excluding final purchase price adjustments.
Cash Flows from Investing Activities
During 2023, we incurred cash outflows on capital expenditures relating to our consolidated operations of $178 million (2022 - $146 million) primarily related to planned turnarounds in Geismar, New Zealand and Chile. The 2022 capital expenditures were primarily related to planned turnarounds in New Zealand and Egypt as well as refurbishment work in Chile. In addition, we incurred cash outflows on capital expenditures of $270 million (2022 - $432 million) related to the construction of the Geismar 3 project.
Liquidity and Capitalization
Our objective in 2023 in managing liquidity and capital was to provide financial capacity and flexibility to meet our strategic objectives, with a focus on cash preservation and liquidity. Our intent remains to repay rather than re-finance the $300 million bond due at the end of 2024 and under current market conditions and pricing levels we will be prioritizing excess cash towards this repayment.
The following table provides information on our liquidity and capitalization position as at December 31, 2023, and December 31, 2022:
|
|
|
|
|
|
|
|
|
($ Millions, except where noted) |
2023 |
2022 |
Liquidity: |
|
|
Cash and cash equivalents |
$ |
458 |
|
$ |
858 |
|
Undrawn credit facility |
300 |
|
300 |
|
Undrawn G3 construction facility |
— |
|
300 |
|
Total liquidity 1 |
$ |
758 |
|
$ |
1,458 |
|
Capitalization: |
|
|
Unsecured notes, including current portion |
1,986 |
|
1,983 |
|
Other limited recourse debt facilities, including current portion |
156 |
|
168 |
|
Total debt |
2,142 |
|
2,151 |
|
Non-controlling interests |
242 |
|
317 |
|
Shareholders’ equity |
1,931 |
|
2,112 |
|
Total capitalization |
$ |
4,315 |
|
$ |
4,580 |
|
Total debt to capitalization 2 |
50% |
47% |
Net debt to capitalization 3 |
44% |
35% |
1 Total liquidity consists of cash and cash equivalents, as well as any undrawn amounts from facilities. Total liquidity is a non-GAAP capital management measure, see Non-GAAP Measures on page 37 for more information.
2 Defined as total debt (including other limited recourse debt facilities) divided by total capitalization.
3 Net debt to capitalization is defined as total debt (including other limited recourse debt facilities) less cash and cash equivalents divided by total capitalization less cash and cash equivalents. Net debt to capitalization is a non-GAAP capital management measure. See Non-GAAP Measures on page 37 for more information.
We manage our liquidity and capital structure in light of changes to economic conditions, the underlying risks inherent in our operations and the capital requirements for the business. Total liquidity is useful because it illustrates the extent to which management has immediate access to cash for operational and construction purposes, and is indicative of our flexibility should uses for these facilities immediately arise. Net debt to capitalization is useful because it illustrates the relative risk of our financing structure to potential lenders and investors. The strategies we have employed in managing our liquidity and capital structure include the issue or repayment of general corporate debt, the issue of project debt, the payment of dividends and the repurchase of shares.
We are not subject to any statutory capital requirements and have no commitments to sell or otherwise issue common shares except pursuant to outstanding employee stock options and TSARs.
We operate in a highly competitive commodity industry and believe that it is appropriate to maintain a strong balance sheet and maintain financial flexibility. As at December 31, 2023, we had a cash balance of $458 million, including $79 million of cash related to Egypt and $46 million of cash related to Waterfront Shipping entities consolidated on a 100% basis. We invest our cash only in highly rated instruments that have maturities of three months or less to ensure preservation of capital and appropriate liquidity.
As at December 31, 2023, we have access to a $300 million committed revolving credit facility expiring in July 2026. The facility is with a syndicate of highly rated financial institutions. During the year ended December 31, 2023, we cancelled the non-revolving construction facility for the Geismar 3 project. At the time of cancellation, the construction facility was undrawn.
We have covenant and default provisions under our long-term debt obligations and we also have certain covenants that could restrict access to our credit facilities. The covenants governing the unsecured notes, which are specified in an indenture, apply to the Company and its subsidiaries, excluding the Egypt entity and the Atlas joint venture entity, and include restrictions on liens, sale and lease-back transactions, a merger or consolidation with another corporation or sale of all or substantially all of our assets. The indenture also contains customary default provisions. The significant covenants and default provisions under the credit facility include:
a) the obligation to maintain an EBITDA to interest coverage ratio of greater than or equal to 2:1 calculated on a four-quarter trailing basis and a debt to capitalization ratio of less than or equal to 60%, both calculated in accordance with definitions in the credit agreement that include adjustments related to the limited recourse subsidiaries;
b) a default if payment is accelerated by a creditor on any indebtedness of $50 million or more of the Company and its subsidiaries, except for the limited recourse subsidiaries; and
c) a default if a default occurs that permits a creditor to demand repayment on any other indebtedness of $50 million or more of the Company and its subsidiaries, except for the limited recourse subsidiaries.
The credit facility is secured by certain assets of the Company, and also includes other customary covenants including restrictions on the incurrence of additional indebtedness.
Other limited recourse debt facilities relate to financing for certain of our ocean going vessels which we own through less than wholly-owned entities under the Company's control. The limited recourse debt facilities are described as limited recourse as they are secured only by the assets of the entity that carries the debt. Accordingly, the lenders to the limited recourse debt facilities have no recourse to the Company or its other subsidiaries.
Failure to comply with any of the covenants or default provisions of the long-term debt facilities described above could result in a default under the applicable credit agreement that would allow the lenders to not fund future loan requests, accelerate the due date of the principal and accrued interest on any outstanding loans or restrict the payment of cash or other distributions.
As at December 31, 2023, management believes the Company was in compliance with all covenants related to its long-term debt obligations.
Capital Projects
The Geismar 3 project is a 1.8 million tonne methanol plant, in Geismar, Louisiana adjacent to our Geismar 1 and Geismar 2 plants with significant capital and operating cost advantages. We expect the plant to start up in 2024 with total capital costs expected to not significantly exceed the upper end of the capital cost guidance of $1.3 billion.
We have capitalized $1,205 million on the project, before capitalized interest and finance charges. Assuming a total capital cost of $1.3 billion, we estimate that as of December 31, 2023, there is approximately $110 million of remaining capital expenditure, including approximately $20 million of spending accrued in accounts payable, which is fully funded with cash on hand.
Geismar 3 is expected to significantly enhance our cash generation capability and help us meet our commitment to reduce our greenhouse gas emissions intensity.
Summary of Contractual Obligations and Commercial Commitments
A summary of the amount and estimated timing of cash flows related to our contractual obligations and minimum commercial commitments as at December 31, 2023, is as follows:
|
|
|
|
|
|
|
|
|
|
|
|
|
|
|
|
|
|
|
|
|
($ Millions) |
2024 |
2025-2026 |
2027-2028 |
After 2028 |
|
Total |
Long-term debt repayments |
$ |
315 |
$ |
27 |
$ |
731 |
$ |
1,085 |
|
$ |
2,158 |
Long-term debt interest obligations |
111 |
194 |
148 |
322 |
|
775 |
Lease obligations |
172 |
266 |
221 |
515 |
|
1,174 |
Repayments of other long-term liabilities |
96 |
56 |
14 |
83 |
|
249 |
Natural gas and other |
438 |
842 |
470 |
923 |
|
2,673 |
Other commitments |
95 |
6 |
1 |
1 |
|
103 |
|
$ |
1,227 |
$ |
1,391 |
$ |
1,585 |
$ |
2,929 |
|
$ |
7,132 |
Long-Term Debt Repayments and Long-Term Debt Interest Obligations
We have $300 million of unsecured notes that mature in December 2024, $700 million of unsecured notes that mature in 2027, $700 million of unsecured notes that mature in 2029, and $300 million of unsecured notes that mature in 2044. The remaining debt repayments represent the normal course obligations for principal repayments related to our limited recourse debt facilities. For additional information, refer to note 8 of our 2023 consolidated financial statements.
Lease obligations
Lease obligations represent contractual payment dates and amounts for right-of-use assets recognized on balance sheet. The majority of lease obligations are for ocean-going vessels.
Repayments of Other Long-Term Liabilities
Repayments of other long-term liabilities represent contractual payment dates or, if the timing is not known, we have estimated the timing of repayment based on management’s expectations.
Natural Gas and Other
We have commitments under take-or-pay contracts to purchase natural gas, to pay for transportation capacity related to the delivery of natural gas and to purchase oxygen and other feedstock requirements for our operating plants and Geismar 3 project. Take-or-pay means that we are obliged to pay for the supplies regardless of whether we take delivery. Such commitments are common in the methanol industry. These contracts generally provide a quantity that is subject to take-or-pay terms that is lower than the maximum quantity that we are entitled to purchase. The amounts disclosed in the table above represent only the minimum take-or-pay quantity.
The natural gas supply contracts for our facilities in New Zealand, Trinidad and Tobago, Egypt and certain contracts in Chile are take-or-pay contracts denominated in United States dollars and include base and variable price components to manage our commodity price risk exposure. The variable price component of each natural gas contract is adjusted by a formula linked to methanol prices. We believe this pricing relationship enables these facilities to be competitive throughout the methanol price cycle. The amounts disclosed in the table for these contracts represent only the base price component representative of the minimum take-or-pay commitment.
We also have multi-year fixed price natural gas contracts and hedges to manage exposure to natural gas price risk and supply our production facilities in Geismar and Medicine Hat. We believe that the fixed price contracts, hedges and long-term natural gas dynamics in North America support the long-term operation of these facilities. In the above table, we have included natural gas commitments, not accounted for as financial instruments, in North America for Geismar and Medicine Hat at the contractual volume and fixed prices.
We have marketing rights for 100% of the production from our jointly owned Atlas and Egypt plants that results in purchase commitments of up to an additional 0.6 million tonnes per year of methanol offtake supply when Egypt operates at capacity and 0.6 million tonnes per year of methanol offtake supply for Atlas. The offtake commitment for Atlas for 2024 will be reduced to 0.4 million tonnes of supply due to the facility running only until September 2024, when the legacy gas supply agreement expires. As at December 31, 2023, the Company also had commitments to purchase methanol from other suppliers for approximately 0.8 million tonnes for 2024. The pricing under these purchase commitments is referenced to pricing at the time of purchase or sale, and accordingly, no amounts have been included in the table above.
The above table does not include costs for planned capital maintenance or expansion expenditures, as these expenditures may change, or any obligations with original maturities of less than one year.
Other Commitments
We have future minimum lease payments under leases relating primarily to vessel charter, terminal facilities, office space and equipment that are outside the scope of IFRS 16. For additional information, refer to note 22 of our 2023 consolidated financial statements.
Off-Balance Sheet Arrangements
As at December 31, 2023, we did not have any off-balance sheet arrangements, as defined by applicable securities regulators in Canada and the United States, that have, or are reasonably likely to have, a current or future material effect on our results of operations or financial condition.
Financial Instruments
A financial instrument is any contract that gives rise to a financial asset of one party and a financial liability or equity instrument of another party. Financial instruments are either measured at amortized cost or fair value.
In the normal course of business, the Company's assets, liabilities and forecasted transactions, as reported in U.S. dollars, are impacted by various market risks including, but not limited to, natural gas prices and currency exchange rates. The time frame and manner in which the Company manages those risks varies for each item based on the Company's assessment of the risk and the available alternatives for mitigating risks.
The Company uses derivatives as part of its risk management program to mitigate variability associated with changing market values. Changes in the fair value of derivative financial instruments are recorded in earnings unless the instruments are designated as cash flow hedges, in which case the changes in fair value are recorded in other comprehensive income and are reclassified to profit or loss or accumulated other comprehensive income when the underlying hedged transaction is recognized in earnings or inventory.
The Company designates as cash flow hedges certain derivative financial instruments to hedge its risk exposure to fluctuations in natural gas prices and to hedge its risk exposure to fluctuations on certain foreign-currency-denominated transactions.
Until settled, the fair value of Level 2 derivative financial instruments will fluctuate based on changes in commodity prices or foreign currency exchange rates and the fair value of Level 3 derivative financial instruments will fluctuate based on changes in the observable and unobservable valuation model inputs.
The following table shows the carrying value of each of our categories of financial assets and liabilities and the related balance sheet items as at December 31, 2023 and December 31, 2022:
|
|
|
|
|
|
|
|
|
($ Millions) |
2023 |
2022 |
Financial assets: |
|
|
Financial assets measured at fair value: |
|
|
Derivative instruments designated as cash flow hedges 1 |
$ |
121 |
|
$ |
323 |
|
Fair value of Egypt gas supply contract derivative 2 |
20 |
|
11 |
|
Financial assets not measured at fair value: |
|
|
Cash and cash equivalents |
458 |
|
858 |
|
Trade and other receivables, excluding tax receivable |
515 |
|
488 |
|
Restricted cash included in other assets |
16 |
|
14 |
|
|
|
|
Total financial assets 3 |
$ |
1,130 |
|
$ |
1,694 |
|
Financial liabilities: |
|
|
Financial liabilities measured at fair value: |
|
|
Derivative instruments designated as cash flow hedges 1 |
$ |
92 |
|
$ |
8 |
|
Financial liabilities not measured at fair value: |
|
|
Trade, other payables and accrued liabilities, excluding tax payable |
672 |
|
656 |
|
| Lease obligations, including current portion |
872 |
|
870 |
|
Long-term debt, including current portion |
2,142 |
|
2,152 |
|
| Land mortgage |
28 |
|
29 |
|
Total financial liabilities |
$ |
3,806 |
|
$ |
3,715 |
|
1 Geismar natural gas hedges and euro foreign currency hedges designated as cash flow hedges are measured at fair value based on industry-accepted valuation models and inputs obtained from active markets.
2 The Egypt natural gas supply contract is measured at fair value using a Monte-Carlo model classified within Level 3 of the fair value hierarchy.
3 The carrying amount of the financial assets represents the maximum exposure to credit risk at the respective reporting periods.
As at December 31, 2023, all of the financial instruments were recorded on the consolidated statements of financial position at amortized cost with the exception of derivative financial instruments, which were recorded at fair value unless exempted.
The fair value of derivative instruments is determined based on industry-accepted valuation models using market observable inputs and are classified within Level 2 of the fair value hierarchy and those using significant unobservable inputs classified as Level 3. The fair value of all of the Company's derivative contracts as presented in the consolidated statements of financial position are determined based on present values and the discount rates used are adjusted for credit risk. The effective portion of the changes in fair value of derivative financial instruments designated as cash flow hedges is recorded in other comprehensive income. The spot element of forward contracts in the hedging relationships is recorded in other comprehensive income as the change in fair value of cash flow hedges. The change in the fair value of the forward element of forward contracts is recorded in other comprehensive income as the forward element excluded from the hedging relationships. Once a commodity hedge settles, the amount realized during the period and not recognized immediately in the statement of income is reclassified from accumulated other comprehensive income (equity) to inventory and ultimately through cost of goods sold. Foreign currency hedges settled, are realized during the period directly to the statement of income reclassified from the statement of other comprehensive income.
The Company has entered into forward contracts designated as cash flow hedges to manage its exposure to changes in natural gas prices for Geismar. Natural gas is fungible across the Geismar plants.
The Company manages its foreign currency exposure to euro denominated sales by executing a number of forward contracts which it has designated as cash flow hedges for its highly probable forecast euro collections.
Related Party Transactions
We own 63.1% of the Atlas methanol facility and a contractual agreement with our partners establishes joint control which results in our accounting for Atlas as an equity investment. As our equity investee, Atlas is our most significant related party. Refer to note 23 to the 2023 consolidated financial statements for information on our related party transactions.
RISK FACTORS AND RISK MANAGEMENT
We are subject to risks that require prudent risk management. We believe the following risks, in addition to those described in the Critical Accounting Estimates section on page 34, to be among the most important for understanding the issues that face our business and our approach to risk management. Our strategic risk management process drives the identification, measurement, prioritization and management of our principal strategic risks. The Audit, Finance and Risk Committee of the Board provides oversight to the Company's risk management process.
Methanol Market Fundamentals
Methanol Price
The methanol business is a highly competitive commodity industry and future methanol prices will ultimately depend on the strength of global demand and methanol industry supply but can also be impacted by other factors such as global trade disputes and government sanctions. Methanol demand and industry supply are driven by several factors as described below. Methanol prices have historically been, and are expected to continue to be, characterized by cyclicality. We are not able to predict future methanol prices, which are driven by several factors that are beyond our control. Since methanol is the only product we produce and market, a decline in the price of methanol has a significant negative effect on our results of operations and financial condition.
Methanol Demand
Based on the diversity of end products in which methanol is used, demand for methanol is driven by a number of factors, including: the strength of global and regional economies, industrial production levels, energy prices, pricing of end products, downstream capacity additions and government regulations and policies. In addition, increasing focus on climate change and the timing and pace of the transition to a lower-carbon economy could impact the demand for methanol that is manufactured in a manner that produces GHG emissions. Changes in methanol demand based on availability of substitute products, consumer preference (including preference for low-or-zero-carbon emission products), government regulation, or other factors may have a significant negative effect on our results of operations and financial condition irrespective of energy prices or economic growth rates. We cannot provide assurance that methanol demand will not be negatively impacted and this could have an adverse effect on our results of operations and financial condition.
Energy Prices
Demand for energy-related applications, which represents over 30% of global methanol demand, includes several applications including methyl tertiary-butyl ether ("MTBE"), fuel applications (including vehicle fuel, marine fuel and other thermal applications), di-methyl ether and biodiesel. Demand into methanol-to-olefins ("MTO") represents over 15% of global methanol demand. MTO plants produce light olefins which have wide applications in packaging, textiles, plastic parts and automotive components.
Methanol is an alternative feedstock for the production of light olefins in the methanol-to-olefins application. MTO competes with olefins made from ethane, propane and naptha, which are typically derived from natural gas and oil-based feedstocks. The price of methanol relative to the price of ethane, propane and naptha can impact the competitiveness of methanol in this application. The price of olefins and downstream derivative products are also affected by their industry supply and demand fundamentals. In a low olefin product price environment, methanol could be a less competitive feedstock in the production of olefins, which could reduce demand for methanol or contribute to negative pressure on methanol prices.
Methanol can also be used to produce MTBE (an oxygenate blended into gasoline to improve air quality), blended directly with gasoline and used to produce di-methyl ether which can be blended with liquefied petroleum gas (propane). Because of this relationship, methanol demand is sensitive to the pricing of these energy products, which in turn are generally linked to global energy prices.
We cannot provide assurance that energy prices will not negatively impact methanol demand, which could have an adverse effect on our results of operations and financial condition.
Global Economic Growth Rates
Traditional chemical demand, which represents approximately 50% of global methanol demand, is used to produce traditional chemical derivatives, including formaldehyde, acetic acid and a variety of other chemicals that form the basis of a wide variety of industrial and consumer products. Over the long term, we believe that traditional chemical demand is influenced by the strength of global and regional economies and industrial production levels. Any slowdown in the global or regional economies, specifically manufacturing and industrial economies, can negatively impact demand for methanol and have a detrimental impact on methanol prices.
Methanol Supply
Methanol industry supply is impacted by the cost of production, methanol industry operating rates and new methanol industry capacity additions. Methanol is predominantly produced from natural gas and is also produced from coal, particularly in China. The cost of production is influenced by the availability and cost of raw materials, including coal and natural gas, freight costs, other operating and maintenance costs and government policies. An increase in economically competitive methanol supply, all else equal, can displace supply from higher cost producers and have a negative impact on methanol price. The industry has historically operated below stated capacity on a consistent basis, even in periods of high methanol prices, primarily due to shutdowns for planned or unplanned maintenance and feedstock shortages and/or uneconomical feedstock costs. Methanol industry supply can increase through improving operating rates of existing methanol plants. Methanol industry capacity can increase through the construction of new methanol plants, by restarting idle methanol plants, or by expanding or debottlenecking existing plants to increase their operating capacity. There is typically a span of four to six years to plan and construct a new world-scale methanol plant. Typical of most commodity chemicals, periods of high methanol prices encourage high-cost producers to operate at maximum rates and encourage the construction of new plants and expansion projects, leading to the possibility of oversupply in the market. However, historically, many of the announced capacity additions have not been constructed for a variety of reasons. There are significant barriers to entry in this industry. The construction of world-scale methanol facilities requires significant capital over a long lead time, a location with access to significant natural gas or coal feedstock with appropriate pricing, and an ability to market and deliver methanol cost-effectively and reliably to customers.
In 2023, approximately two to three million tonnes of new production capacity was added in China. In Iran, a new plant was commissioned at the end of 2023 but plant operating rates continue to be uncertain and challenged due to the impact of sanctions, plant technical issues and seasonal natural gas constraints. The methanol industry ran at similar rates in 2023 compared to 2022.
In North America, we expect our new 1.8 million tonne Geismar 3 facility, which will be our third plant in Louisiana, to reach commercial production in 2024. In Malaysia, a 1.8 million tonne plant is under construction with a scheduled start up in 2024. We expect to see increased supply from new capacities to be partially offset by rationalization of existing supply in the market in 2024. With the shut down of Atlas and the restart of Titan in September 2024 the overall production in Trinidad will be lower by approximately 1 million tonnes annually and we continue to monitor other factors that could further impact supply such as the announced gas diversion from methanol to LNG in Equatorial Guinea. In China, there are planned capacity additions over the near-to-medium term which we expect will be somewhat offset by the closure of some small-scale, inefficient and older plants. New capacity built in China is expected to be consumed domestically as China requires methanol imports to meet growing demand.
We cannot provide assurance that increases in methanol supply will not outpace the level of future demand growth thereby contributing to negative pressure on methanol price.
Macroeconomic Risks
Pandemic Risk
Should a pandemic arise, measures introduced in response by governments and health authorities could lead to greater uncertainty in our business, commodity industries, energy markets and the broader global economy. Pandemic responses could lead to substantial reduction in global manufacturing and general economic activity, which in turn leads to supply constraints and supply chain disruptions, impacting the supply-demand balance and inventory levels across many industries.
A pandemic may increase our exposure to, and the magnitude of, each of the risks identified, whether they be methanol specific, macroeconomic, financial, or operational. The magnitude of the impact will depend on future developments that cannot be predicted and therefore we cannot provide assurance that a deterioration in economic conditions related to a pandemic will not have an adverse impact on our results of operations and financial condition.
Global Economic Conditions
In addition to the potential influence of global economic activity levels on methanol demand and price, changing global economic conditions can also result in changes in capital markets. A deterioration in economic conditions could have a negative impact on supply or demand for methanol, our investments, diminish our ability to access existing or future credit, and it could increase the risk of defaults by customers, suppliers, insurers and other counterparties. Also, inflationary pressures associated with buoyant economic activity, supply chain challenges or geopolitical events such as war or international trade relations, could have a negative impact on our cost structure or access to feedstock or logistics services. Considering these potential impacts, we cannot provide assurance that a deterioration in economic conditions or inflationary pressures associated with buoyant economic activity will not have an adverse impact on our results of operations and financial condition.
Global Operations
Our operations and investments are primarily located in North America, New Zealand, Trinidad and Tobago, Egypt, Chile, Europe and Asia.
We are subject to risks inherent in global operations which are more significant in certain jurisdictions, such as loss of revenue, property and equipment as a result of expropriation; import or export restrictions; anti-dumping measures; nationalization, war, insurrection, civil unrest, social activism, sabotage, terrorism and other political risks; increases in duties, taxes and governmental royalties; renegotiation of contracts with governmental entities; as well as changes in laws or policies or other actions by governments that may adversely affect our operations, including lack of certainty with respect to foreign legal systems, corruption and other factors inconsistent with the rule of law. Many of the foregoing risks related to foreign operations may also exist for our domestic operations in North America. We are also subject to potential risks associated with geopolitical disputes including: (i) those between countries in which we operate, buy, sell or transport methanol, (ii) those that border such countries such as over rights to water flowing across political boundaries including the Nile river which supplies water to our Egypt plant, and (iii) significant geopolitical disputes including wars, such as the invasion of Ukraine by Russia or the Israel-Palestinian conflict where the globalized nature of our operations and the commodity we sell could be negatively impacted by the actions of multiple countries and stakeholders.
The Company is committed to doing business in accordance with all applicable laws and its code of business conduct, but there is a risk that it, its subsidiaries or affiliated entities or their respective officers, directors, employees or agents could act in violation of its codes and applicable laws. Any such violation could severely damage our reputation and could result in substantial civil and criminal fines or penalties. Such damage to our reputation and fines and penalties could materially affect the Company's business and have an adverse impact on our results of operations and financial condition.
Because we derive a significant portion of our revenues from production and sales by subsidiaries outside of Canada, the payment of dividends or the making of other cash payments or advances by these subsidiaries may be subject to restrictions or exchange controls on the transfer of funds in or out of the respective countries or result in the imposition of taxes on such payments or advances.
Global Trade
Methanol is a globally traded commodity produced at facilities located around the world. Trade in methanol is subject to duty in a number of jurisdictions. Methanol sold in certain markets from the countries in which we produce methanol is currently subject to import duties ranging from 0% to 6%. As well, there is currently an additional 25% duty on methanol imported from the US to China. Over the past number of years, methanol demand has grown faster in China compared to other markets. This growth has resulted in China currently representing approximately 60% of total methanol demand, which is supplied by both local and imported methanol. This concentration of industry demand creates a risk of market access from any production source as China may increase duties, restrict imports or take other measures to prevent or limit the import of methanol from a particular producing country. There can be no assurance that the countries where we produce methanol will continue to have access to all markets, including China, that duties will not increase, that duties will not be levied in other jurisdictions in the future or that we will be able to mitigate the impact of future duties, if levied, or that future duties will not have a significant negative effect.
Some producers and marketers of methanol may have direct or indirect contacts with countries that may, from time to time, be subject to international trade sanctions or other similar prohibitions ("sanctioned countries"). Methanol produced in sanctioned countries may sell at a lower price to methanol produced in non-sanctioned countries creating competitive price pressure for the methanol we produce. In addition to the methanol we produce, we purchase methanol from third parties under purchase contracts or on the spot market in order to meet our commitments to customers, and we also engage in product exchanges with other producers and marketers. We believe that we are in compliance with all applicable laws with respect to sales and purchases of methanol and product exchanges. However, as a result of the participation of sanctioned countries in our industry, we cannot provide assurance that we will not be exposed to reputational or other risks that could have an adverse impact on our results of operations and financial condition.
Financial Risks
Taxation Risk
The Company is subject to taxes, duties, levies, governmental royalties and other government-imposed compliance costs in numerous jurisdictions. New taxes and/or increases to the rates at which these amounts are determined could have an adverse impact on our results of operations and financial condition.
We have organized our foreign operations in part based on certain assumptions about various tax laws (including capital gains, withholding taxes and transfer pricing), foreign currency exchange and capital repatriation laws and other relevant laws of a variety of foreign jurisdictions. While we believe that such assumptions are reasonable, we cannot provide assurance that foreign taxation or other authorities will reach the same conclusion. The results of audit of prior tax filings and the final determination of these events may have a material impact on the Company. Refer to Litigation Risk and Legal Proceedings on page 33 for more information related to current legal matters. Further, if such foreign jurisdictions were to change or modify such laws, we could suffer adverse tax and financial consequences.
Liquidity Risk
As at December 31, 2023, we had a cash balance of $458 million, as well as an undrawn $300 million revolving credit facility with a syndicate of highly rated financial institutions expiring in July 2026. Our ability to maintain access to the facility is subject to meeting certain financial covenants, including an EBITDA to interest coverage ratio and a debt to capitalization ratio. Both ratios are calculated in accordance with definitions in the credit agreement that include adjustments related to the Company's limited recourse subsidiaries.
As at December 31, 2023, our long-term debt obligations include $1,986 million in unsecured notes and $156 million related to other limited recourse debt for ocean-going vessels (100% basis).
The covenants governing the unsecured notes, which are specified in an indenture, apply to the Company and its subsidiaries, excluding the Egypt entity and the Atlas joint venture entity, and include restrictions on liens, sale and lease-back transactions, a merger or consolidation with another corporation or a sale of all or substantially all of the Company’s assets. The indenture also contains customary default provisions.
For additional information regarding long-term debt, refer to note 8 of our 2023 consolidated financial statements.
We cannot provide assurance that we will have sufficient liquidity to fund future capital projects without incurring additional debt. Additionally, we cannot provide assurance that we will be able to access capital in the future on commercially acceptable terms or at all, or that the financial institutions providing the credit facilities will have the ability to honour future draws. Additionally, failure to comply with any of the covenants or default provisions of the long-term debt facilities described above could result in a default under the applicable credit agreement that would allow the lenders to not fund future loan requests, accelerate the due date of the principal and accrued interest on any outstanding loans or restrict the payment of cash or other distributions. Any of these factors could have a significant negative effect on our results of operations, our ability to pursue and complete strategic initiatives or on our financial condition.
Foreign Currency Risk
The dominant currency in which we conduct business is the United States dollar, which is also our reporting currency. The most significant components of our costs are natural gas feedstock and ocean-shipping costs and substantially all of these costs are incurred in United States dollars. Some of our underlying operating costs, capital expenditures and purchases of methanol, however, are incurred in currencies other than the United States dollar, principally the Canadian dollar, the Chilean peso, the Trinidad and Tobago dollar, the New Zealand dollar, the euro, the Egyptian pound, the Chinese yuan and Korean won. We are exposed to increases in the value of these currencies that could have the effect of increasing the United States dollar equivalent of cost of sales, operating expenses and capital expenditures. A portion of our revenue is earned in Chinese yuan, euros, Canadian dollars and, to a lesser extent, other currencies. We are exposed to declines in the value of these currencies compared to the United States dollar, which could have the effect of decreasing the United States dollar equivalent of our revenue.
Customer Credit Risk
Our customers are large global or regional petrochemical manufacturers or distributors and a number are highly leveraged, though we have not experienced significant credit losses in the past. We monitor our customers’ financial status closely; however, some customers may not have the financial ability to pay for methanol in the future and this could have an adverse effect on our results from operations and financial condition.
Insurance Risks
Although we maintain operational and construction insurance, including business interruption insurance, we cannot provide assurance that we will not incur losses beyond the limits of, or outside the coverage of, such insurance or that insurers will be financially capable of honouring future claims. From time to time, various types of insurance for companies in the chemical and petrochemical industries have not been available on commercially acceptable terms or, in some cases, have been unavailable. We cannot provide assurance that in the future we will be able to maintain existing coverage or that premiums will not increase substantially.
Operational Risks
Security of Natural Gas Supply and Price
Natural gas is the principal feedstock for producing methanol and it accounts for a significant portion of our operating costs. Accordingly, our results from operations depend in large part on the availability and security of supply and the price of natural gas. If, for any reason, we are unable to obtain sufficient natural gas for any of our plants on commercially acceptable terms or we experience interruptions in the supply of contracted natural gas, we could be forced to curtail production or close such plants, which could have an adverse effect on our results of operations and financial condition.
United States
We expect our new 1.8 million tonne Geismar 3 facility to reach commercial production in 2024. Subsequent to the start-up, we will have three plants in Geismar, Louisiana with an annual operating capacity of 4.0 million tonnes.
We utilize a combination of fixed price financial hedges and fixed price physical gas supply agreements to manage natural gas price risk for our Geismar facilities. In North America, we have fixed price gas supply contracts and hedges in place targeting minimum operating rate requirements of approximately 70% in the near-term, declining over time. The balance of our gas requirements are purchased at spot prices.
We believe that the long-term natural gas dynamics in North America will support the long-term operations of these facilities; however, we cannot provide assurance that our contracted suppliers will be able to meet their commitments or that we will be able to secure additional natural gas on commercially acceptable terms and this could have an adverse impact on our results of operations and financial condition.
New Zealand
We have three plants in New Zealand with a total operating capacity of 2.2 million tonnes of methanol per year. Two plants are located at Motunui and can produce 1.7 million tonnes per year and the third is located at nearby Waitara Valley and can produce 0.5 million tonnes. The Waitara Valley Plant was idled indefinitely in the first quarter of 2021 due to a lack of available gas supply. We have entered into several agreements with various natural gas suppliers with terms that range in length up to 2029. All gas supply agreements in New Zealand are take-or-pay agreements and include U.S. dollar base and variable price components where the variable price component is adjusted by a formula linked to methanol prices above a certain level. We believe this pricing relationship enables these facilities to be competitive at all points in the methanol price cycle. Certain contracts require the supplier to deliver a minimum amount of natural gas with additional volume dependent on the success of exploring and developing the related natural gas field.
The future operation of our New Zealand facilities depends on the ability of our contracted suppliers to meet their commitments and the success of ongoing exploration and development activities in the region. We cannot provide assurance that our contracted suppliers will be able to meet their commitments or that exploration and development activities in New Zealand will be successful to enable us to operate at capacity or at all. We cannot provide assurance that we will be able to secure additional natural gas on commercially acceptable terms. These factors could have an adverse impact on our results of operations and financial condition.
Trinidad and Tobago
We have two plants in Trinidad and Tobago, Atlas (Methanex interest 63.1%) and Titan, with Methanex's interest in Trinidad and Tobago representing an operating capacity of 2.0 million tonnes per year. Natural gas for our Atlas methanol production facility in Trinidad and Tobago, with our share of total production capacity being 1.1 million tonnes per year, is supplied under a take-or-pay contract with the National Gas Company of Trinidad and Tobago Limited ("NGC"), which purchases the natural gas from upstream gas producers. The contract for Atlas has a U.S. dollar base and variable price components, where the variable portion is adjusted by a formula linked to methanol prices above a certain level and expires in September 2024.
In October 2023, Methanex signed a two-year natural gas agreement with NGC for its Titan plant, which has been idled since the first quarter of 2020, to restart operations in September 2024. The natural gas agreement for Titan is a take-or-pay contract with a U.S. dollar base and variable price components, where the variable portion is adjusted by a formula linked to methanol prices. Simultaneously, the Company plans to idle Atlas in September 2024, when its legacy 20-year natural gas agreement expires.
We cannot provide assurance that our contracted supplier will be able to meet their commitments, that we will be able to secure additional natural gas on commercially acceptable terms or that exploration and development activities in Trinidad and Tobago will be successful to enable us to operate at capacity or at all. These factors could have an adverse impact on our results of operations and financial condition.
Chile
Natural gas for our two plants in Chile is supplied by various producers in Chile and Argentina. A portion of the contracted gas is subject to deliver-or-pay and take-or-pay provisions. Our current gas agreements and gas export permits from Argentina provide for sufficient gas to allow for a two-plant operation in Chile during the Southern hemisphere summer months. In 2023, one plant operated throughout the year and a second plant operated for seven months.
Our primary Chilean natural gas supplier is Empresa Nacional del Petróleo ("ENAP"). ENAP has made significant investments over the past several years in the development of natural gas from unconventional reservoirs, which has resulted in stable gas deliveries from ENAP to our facilities. The agreements for natural gas supply with ENAP underpin approximately 25% of the 1.7 million tonnes of annual operating capacity for 2023 through 2025.
In 2023, we received natural gas from Argentina from four different natural gas suppliers pursuant to firm supply agreements from September through December 2023. We also received Argentine natural gas in 2023 from a fifth supplier, YPF S.A., from January until April 2023 and from October through December 2023.
We have a gas supply agreement with YPF S.A. that expires at the end of 2025. The price paid for natural gas for our Chilean facilities from our Chilean and Argentine suppliers is a U.S. dollar base price plus a variable price component that is adjusted by a formula linked to methanol prices above a certain level.
While we continue to work with gas suppliers in Chile and Argentina to secure sufficient natural gas to sustain our Chile operations, we cannot provide assurance that our contracted suppliers will be able to meet their commitments, that we will be able to secure additional natural gas on commercially acceptable terms, that Argentina will grant future export permits for natural gas to be delivered to Chile or that exploration and development activities in Chile and Argentina will be successful to enable us to operate at capacity or at all. These factors could have an adverse impact on our results of operations or financial condition.
Egypt
We have a 25-year, take-or-pay natural gas supply agreement expiring in 2035 for the 1.3 million tonne per year methanol plant in Egypt in which we have a 50% equity interest. The price paid for gas is based on a U.S. dollar base price plus a variable price component that is adjusted by a formula linked to methanol prices above a certain level. Under the contract, the gas supplier is obligated to supply, and we are obliged to take or pay for, a specified annual quantity of natural gas. In addition, the natural gas supply agreement has a mechanism whereby we are partially compensated when gas delivery shortfalls in excess of a certain threshold occur. Natural gas is supplied to this facility from the same gas delivery grid infrastructure that supplies other industrial users in Egypt, as well as the general Egyptian population.
Our Egypt facility has experienced gas restrictions in the past during periods of significant social unrest and government transition and we believe this contributed to past constraints in the development of natural gas reserves. More recently, domestic gas needs in periods of extreme weather have also contributed to potential gas shortage. The restrictions experienced in past years may occur in the future. We cannot provide assurance that our contracted supplier will be able to meet its commitments or that exploration and development activities in Egypt will be successful to enable us to operate at capacity or at all. These factors could have an adverse impact on our results of operations and financial condition.
Canada
We have entered into fixed price contracts to supply 80-90% of our natural gas requirements for our Medicine Hat facility through 2031. The balance of our gas requirements is purchased under contracts at spot prices.
We cannot provide assurance that our contracted suppliers will be able to meet their commitments or that we will be able to secure additional natural gas for our Medicine Hat facility on commercially acceptable terms and this could have an adverse impact on our results of operations and financial condition.
Production Risks
Most of our earnings are derived from the sale of methanol produced at our plants. Many of our methanol plants have been in operation for multiple decades and with appropriate maintenance they are still capable of operating efficiently and cost-effectively today. Our business is subject to the risks of operating methanol production facilities, such as a process safety event, equipment breakdowns, interruptions in the supply of natural gas and other feedstocks, including oxygen and utilities such as water and steam, power failures, longer-than-anticipated planned maintenance activities, loss of port facilities, natural disasters or any other event, including unanticipated events beyond our control, that could result in a prolonged shutdown of any of our plants or impede our ability to produce and deliver methanol to customers. A prolonged plant shutdown at any of our major facilities could have an adverse effect on our results of operations and financial condition.
Capital Projects
Our ability to effectively allocate capital, including successfully identifying, developing, and completing capital projects is subject to a number of risks, including finding and selecting favourable locations for new facilities where sufficient natural gas and other feedstock is available with acceptable commercial terms, obtaining project or other financing on satisfactory terms, constructing and completing the projects within the contemplated budgets and schedules, and other risks commonly associated with the design, construction and startup of large complex industrial projects. Further risks include the impact of evolving government regulation relating to carbon intensive industries and evaluating the technological feasibility and anticipated operation of new plant designs such as those with lower carbon intensity.
We cannot provide assurance that we will be able to effectively allocate capital to identify or develop methanol projects or that any changes to the targeted timing of completion or estimated cost or ability to complete capital projects or future ability to operate at production capacity, due to a number of factors, which could have an adverse impact on our results of operations and financial condition.
Technological Risks
New technologies for natural-gas-based methanol production have been primarily incremental rather than transformational. Alternative feedstocks and methods for methanol production, including producing methanol from renewable resources exist today, but are not currently economically competitive at scale. The adoption of new technologies for methanol production or methanol derivatives, including those that reduce the GHG emissions intensity, may make our plants less competitive or obsolete over time. In addition, implementing technologies to reduce GHG emissions, including carbon capture and storage, could result in significant capital expenditures.
As a result, we cannot provide assurance that new technologies in methanol production will not have an adverse effect on our results of operations and financial condition.
Joint Arrangement Risk
Certain Methanex assets are jointly held and are governed by partnership and shareholder agreements. As a result, certain decisions regarding these assets require a simple majority, while others require 100 percent approval of the owners. In addition, certain of these assets (ocean-going vessels) are operated by unrelated third-party entities. The operating results of these assets is to some extent dependent on the effectiveness of the business relationship and decision making among Methanex and the other joint owner(s) and the expertise and ability of these third-party operators to successfully operate and maintain the assets. While Methanex believes that there are prudent governance and contractual rights in place, there can be no assurance that Methanex will not encounter disputes with partners. Such events could impact operations or cash flows of these assets which, in turn, could have an adverse effect on our results of operations and financial condition.
Purchased Product Price Risk
In addition to the sale of methanol produced at our plants, we also purchase methanol produced by others on the spot market and through purchase contracts to meet our customer commitments and support our marketing efforts. We have adopted the first-in, first-out method of accounting for inventories and it generally takes between 30 and 60 days to sell the methanol we purchase. Consequently, we have the risk of holding losses on the resale of this product to the extent that methanol prices decrease from the date of purchase to the date of sale. Holding losses, if any, on the resale of purchased methanol could have an adverse effect on our results of operations and financial condition.
Supply Chain Risks
Our production is transported through various pipelines, terminals, marine, rail and road networks making up our integrated supply chain. These networks, and ultimately our supply chain, may be interrupted by means outside of our control or have operational constraints or restrictions that could prohibit the safe and timely transportation and distribution of methanol to our customers and prolonged disruptions could have an adverse effect on our results of operations, financial condition and leadership position.
Shipping Capacity Risks
Excess capacity within our fleet of ocean vessels resulting from a prolonged plant shutdown or other event could have an adverse effect on our results of operations and financial condition as our vessel fleet is subject to fixed time charter costs. In the event we have excess shipping capacity, we may be able to mitigate some of the excess costs by entering into sub-charters or third-party backhaul arrangements, although the success of this mitigation is dependent on conditions within the broader global shipping industry. If we suffer any disruptions in our distribution system and are unable to mitigate these costs, this could have an adverse effect on our results from operations and financial condition.
Talent Attraction and Retention Risks
The safe and reliable operation of our methanol plants, logistics and supporting functions rely on a skilled and experienced workforce. We compete for skilled employees in various locations globally where labour market conditions can be highly competitive. If we are unable to attract, develop, and retain a skilled and experienced workforce or effectively manage succession in key roles, this may be an impediment to the operations of our methanol plants, the optimization of logistics and impact our daily operations which could have an adverse impact on our results of operations and financial condition.
Cybersecurity Risks
Our business processes rely on Information Technology ("IT") systems that are interconnected with external networks and increasingly hosted by third parties in the cloud. The interconnection of external networks increases the threat of cyberattack and the importance of cybersecurity. In particular, if a cyberattack was targeted at our production facilities, our supply chain or other key infrastructure networks, the result could harm our plants, customers, environment, people and our ability to meet customer commitments for a period of time. In addition, targeted attacks on our systems (or third parties that we rely on), failure of a key IT system or a breach in security measures designed to protect our IT systems, including attempts to divert financial assets or introduce ransomware to extract payment could have an adverse impact on our results of operations, financial condition and reputation.
We have previously been the subject of cyber attacks on our internal systems, but these incidents have not had a significant negative impact on our results of operations.
We have a comprehensive program in place to protect our assets, detect malicious activity and respond in the event of a cybersecurity incident. This includes: cyber education for our staff; risk-prioritized controls to protect against known and emerging threats; segregating core operating systems from our corporate systems; tools to provide automated monitoring and alerting; incident response planning and testing to ensure an agile response and backup and recovery procedures to restore systems and return to normal operations. We may be required to commit additional resources to continue to modify or enhance our protective measures or to investigate and remediate any vulnerabilities to cyberattacks. The Audit, Finance and Risk Committee is responsible for overseeing our cybersecurity mitigation efforts and the program is reviewed periodically by an independent third party.
As the cyberthreat landscape continues to evolve, we pivot to adjust or add to our existing controls to protect the organization. We collect, use and store sensitive data in the normal course of business, including intellectual property, proprietary business information and personal information of our employees and third parties. Despite our security measures in place, our IT systems may be vulnerable to cyberattacks or breaches. Any such breach could compromise information used or stored on our IT systems and/or networks and, as a result, the information could be accessed, publicly disclosed, lost or stolen. Any such access, disclosure or other loss of information could result in legal claims or proceedings, liability under laws that protect the privacy of personal information, regulatory penalties or other negative consequences, including disruption to our operations and damage to our reputation, which could have an adverse impact on our results of operations and financial condition.
Reputational Risk
Damage to our reputation could result from the actual or perceived occurrence of any number of events, and could include any negative publicity (for example, with respect to our handling of environmental, GHG emissions, employment, health or safety, or process safety matters), whether true or not. There is a risk of increasing stakeholder expectations around climate change and transition to a lower-carbon economy. Further risks arise from these changing stakeholder perceptions related to the way in which we are viewed as contributing to (or hindering) a transition to a low-carbon economy and responding to climate change. In March 2024, we issued our 2023 Sustainability Report, aligned with the Sustainability Accounting Standards Board (SASB) and the Task-Force on Climate-related Financial Disclosures (TCFD). Our 2023 Sustainability Report is available at https://www.methanex.com/sustainability. Our reputation could be impacted by evolving perceptions of carbon-intensive industries, petrochemical industries and, most specifically, the methanol industry and its associated downstream derivatives. Although we believe that we conduct our operations in a prudent manner and that we take care in protecting our reputation, we do not ultimately have direct control over how we are perceived by others. Reputation loss may result in decreased access to capital and insurance coverage, decreased investor confidence, challenges with employee retention and talent attraction, an impediment to our overall ability to advance our projects, difficulty in obtaining permits, or increased challenges in maintaining our social license to operate, which could have an adverse impact on our results of operations and financial condition.
Climate Related Risks
Transition Risks - Regulatory
GHG Legislation
We generate GHG emissions, primarily as carbon dioxide ("CO2"), directly and indirectly through the production, distribution and use of its products. GHG emissions are a byproduct of the development and extraction of hydrocarbons, including natural gas used as a feedstock in methanol production, as well as the methanol production process. GHG emissions are also generated when fuel is consumed during the global transport of methanol. The GHG Protocol Corporate Standard classifies a company’s GHG emissions into three ‘scopes’. Scope 1 emissions are direct emissions from owned or controlled sources. Scope 2 emissions are indirect emissions from the generation of purchased energy. Scope 3 emissions are all indirect emissions (not included in Scope 2) that occur in the value chain, including both upstream and downstream emissions.
We monitor and manage our GHG emissions intensity for Scope 1 and Scope 2 emissions, defined as the equivalent quantity of CO2 released per unit of production or transported tonne, relating to both methanol equity production and our owned marine operations. The amount of GHG emissions generated by the methanol production process is highly dependent on a number of factors including the design of the methanol plant, plant reliability and availability of natural gas. Similarly, the distance of trade routes for transported cargo, as well as ship technology and operating efficiency, influence the emissions intensity of our marine operations. Accordingly, GHG emissions may vary from year to year depending on the mix of production assets and vessels in operation.
Public attitudes around climate change and the transition to a lower-carbon economy continue to evolve. Under the Paris Agreement within the United Nations Framework Convention on Climate Change, many of the countries we operate in have agreed to put forth substantial efforts and commitments to reduce GHG emissions that they are implementing through GHG regulations that include carbon prices.
We are currently subject to GHG regulations in New Zealand, Canada and Chile, while our production in the United States, Trinidad and Tobago, and Egypt is currently not subject to such regulations. These regulations result in additional costs to produce methanol. Many of our competitors produce methanol in countries with no imposed GHG regulations or carbon taxes and as such, further increases in regulations or carbon taxes in the countries in which we operate may negatively impact our competitive position within the methanol industry. In addition, as of January 2024, Waterfront Shipping is subject to the EU’s Emissions Trading System (ETS) for fifty percent of emissions from voyages where the point of origin or the point of destination is within the EU and 100 percent of emissions that occur for voyages between two EU ports and when ships are within EU ports. EU ETS emissions allowances will need to be purchased and surrendered for 40 percent of reported CO2 emissions in 2024, 70 percent in 2025 and 100 percent in 2027. There are ongoing reviews and potential changes to government GHG regulations in countries where we have operations or conduct business, including potential carbon border adjustment mechanisms that could impact the efficient management of our global supply chain.
We cannot provide assurance that changes in existing or the introduction of new GHG regulations, carbon taxes, or other initiatives related to climate change in jurisdictions where we have operations or conduct business will not have an adverse impact on our results of operations and financial condition.
Marine Demand
Europe and the International Maritime Organization (IMO) have moved to measuring GHG emissions impact of marine fuels to on a lifecycle basis, which includes upstream feedstock production. They have also set decarbonization targets that require decreasing emissions intensity over time, which come into effect in 2025 and 2027, respectively. Low-carbon methanol is one of several potential fuels that could be used to comply with these regulations. We cannot provide assurance that low-carbon methanol will be the preferred fuel for demand under shipping or clean fuel regulations.
Physical Impacts
Climate change poses a number of potential risks and impacts to Methanex that may increase over time. The prospective impact of climate change may have an adverse impact on our operations, our suppliers or customers. The physical impacts of climate change may include water scarcity, changing sea or river levels, changing storm patterns and intensities, and changing temperature levels, and the impact of any of these changes could be severe.
The New Zealand, Geismar, Medicine Hat and Egypt facilities rely on access to fresh water in the methanol production process. Potential shortages or constraints in fresh water supply could impact methanol production at these sites and may impact considerations of future growth locations. Our other two sites, Trinidad and Chile, rely on ocean water and have equipment to desalinate water for the methanol production process.
Our transport of methanol relies primarily on vessels to ship methanol from our production sites to customers around the world. We have, at times, experienced logistics delays in our supply chain due to high and low river or canal levels in exporting methanol from a production site or delivering methanol by vessel or barge to customers. High or low river levels impacting our production assets and supply chain, more severe and frequent storms and weather events could have a material adverse impact on our operating capacity and supply chain. We cannot predict, at this time, the prospective impact of climate change on our operations, suppliers or customers, which could have an adverse impact on our results of operations and financial condition.
Regulatory and Compliance Risks
Environmental Regulation
The countries in which we operate and international and jurisdictional waters in which our vessels operate have laws, regulations, treaties and conventions in force to which we are subject, governing the environment and the management of natural resources as well as the handling, storage, transportation and disposal of hazardous or waste materials. We are also subject to laws and regulations governing emissions and the import, export, use, discharge, storage, disposal and transportation of toxic substances. The products we use and produce are subject to regulation under various health, safety and environmental laws. Non-compliance with these laws and regulations may give rise to compliance orders, fines, injunctions, civil liability and criminal sanctions.
Laws and regulations with respect to protecting the environment have become more stringent over time and may, in certain circumstances, impose absolute liability rendering a person liable for environmental damage without regard to negligence or fault on the part of such person. Such laws and regulations may also expose us to liability for the conduct of, or conditions caused by others or for our own acts even if we complied with applicable laws at the time such acts were performed. To date, environmental laws and regulations have not had a significant adverse effect on our capital expenditures, earnings or competitive position. However, operating petrochemical manufacturing plants and distributing methanol exposes us to risks in connection with compliance with such laws and we cannot provide assurance that we will not incur significant costs or liabilities in the future.
Although we have formal and proactive compliance management systems in place, we cannot provide assurance over ongoing compliance with existing legislation or that future laws and regulations to which we are subject governing the environment and the management of natural resources as well as the handling, storage, transportation and disposal of hazardous or waste materials will not have an adverse effect on our results of operations and financial condition.
Government Regulations and Policies – Methanol
Changes in environmental, health and safety laws, regulations or requirements in any country where methanol is produced or consumed could impact methanol demand. Methanol is subject to the chemical control laws of the countries in which they are located. These laws include the regulation of chemical substances and inventories under the Toxic Substances Control Act (“TSCA”) in the U.S. and the Registration, Evaluation and Authorization of Chemicals (“REACH”) and the Classification, Labeling and Packaging of substances and mixtures (“CLP”) regulations in Europe.
Above certain inhalation and ingestion levels, methanol is toxic to humans. In past years, the United States Environmental Protection Agency ("EPA") had assessed methanol for carcinogenicity and issued levels of maximum ingestion and inhalation that it claims will not result in adverse health impacts. While methanol is not currently on the priority list of chemicals to be evaluated under the Toxic Substances Control Act, we are unable to determine whether the current classifications relating to the carcinogenicity of methanol will be maintained or if other government agencies will take actions related to methanol. Any further action or reclassification of methanol could reduce future methanol demand, which could have an adverse effect on our results of operations and financial condition.
Government Regulations and Policies – Methanol-Derived Products
Similar to methanol, methanol-derived chemical products are subject to the chemical control laws of the countries in which they are located. These laws include the regulation of chemical substances and inventories under the Toxic Substances Control Act (“TSCA”) in the U.S. and the Registration, Evaluation and Authorization of Chemicals (“REACH”) and the Classification, Labeling and Packaging of substances and mixtures (“CLP”) regulations in Europe. Analogous regimes exist in other parts of the world, including China, South Korea, and Taiwan. In addition, a number of countries where our customers operate, including the U.K., have adopted rules to conform chemical labeling in accordance with the globally harmonized system. Many of these foreign regulatory regimes are in the process of a multi-year implementation period for these rules.
In the US, changes to the US Environmental Protection Agency's risk evaluation process under the TSCA could also result in additional restrictions or bans of methanol-derived products, such as formaldehyde which is currently being reassessed by the EPA.
In 2023, global methanol demand for the production of formaldehyde represented approximately 25% of global methanol demand and is the largest demand segment. The largest use for formaldehyde is as a component of urea-formaldehyde and phenol-formaldehyde resins, which are used in adhesives for plywood, particleboard, oriented strand board, medium-density fibreboard and other reconstituted or engineered wood products. There is also demand for formaldehyde as a raw material for engineering plastics and in the manufacture of a variety of other products, including elastomers, paints, building products, foams, polyurethane and automotive products.
Assessments under TSCA may result in heightened concerns about methanol-derived products and may result in additional requirements or bans being placed on the production, handling, labeling or use of those chemicals. Any such actions could reduce future methanol demand for use in producing methanol-derived products and could have an adverse effect on our results of operations and financial condition
Litigation and Legal Proceedings
The Company is subject, from time to time, to litigation and may be involved in disputes with other parties in the future, which may result in litigation and claims under such litigation may be material. Various types of claims may be raised in these proceedings, including, but not limited to breach of contract, product liability, tax, employment matters and in relation to an attack, breach or unauthorized access to Methanex's information technology and infrastructure, environmental damage, climate change and the impact thereof, antitrust, bribery, and other forms of corruption. The Company cannot predict the outcome of any litigation. Defense and settlement costs may be substantial, even with respect to claims that have no merit. If the Company cannot resolve these disputes favourably, its business, financial condition, results of operations and future prospects may be materially adversely affected.
Trinidad and Tobago
The Board of Inland Revenue of Trinidad and Tobago has audited and issued assessments against our 63.1% owned joint venture, Atlas, in respect of the 2005 to 2017 financial years. All subsequent tax years remain open to assessment. The assessments relate to the pricing arrangements of certain long-term fixed-price sales contracts with affiliates that commenced in 2005 and continued with affiliates through 2014 and with an unrelated third party through 2019. The long-term fixed-price sales contracts with affiliates were established as part of the formation of Atlas and management believes these were reflective of market considerations at that time.
During the periods under assessment and continuing through 2014, approximately 50% of Atlas-produced methanol was sold under these fixed-price contracts. From late 2014 through 2019 fixed-prices sales to an unrelated third party represented approximately 10% of Atlas-produced methanol. Atlas had partial relief from corporation income tax until late July 2014.
The Company believes it is impractical to disclose a reasonable estimate of the potential contingent liability due to the wide range of assumptions and interpretations implicit in the assessments.
The Company has lodged objections to the assessments. No deposits have been required to lodge objections. Although there can be no assurance that these tax assessments will not have a material adverse impact, based on the merits of the case and advice from legal counsel, we believe our position should be sustained, that Atlas has filed its tax returns and paid applicable taxes in compliance with Trinidadian tax law, and as such has not accrued for any amounts relating to these assessments. Contingencies inherently involve the exercise of significant judgment, and as such the outcomes of these assessments and the financial impact to the Company could be material.
We anticipate the resolution of this matter through the court systems to be lengthy and, at this time, cannot predict a date as to when we expect this matter to be ultimately resolved.
CRITICAL ACCOUNTING ESTIMATES
We believe the following selected accounting policies and issues are critical to understanding the estimates, assumptions and uncertainties that affect the amounts reported and disclosed in our consolidated financial statements and related notes. Certain of our accounting policies, including depreciation and amortization, recoverability of asset carrying values, leases, income taxes and fair value measurement of financial instruments require us to make assumptions relating to operations and about the price and availability of natural gas feedstock. See additional discussion of the risk factors and risk management by region in the Security of Natural Gas Supply and Price section on page 27. See note 2 to our 2023 consolidated financial statements for our material accounting policies.
Property, Plant and Equipment
Our business is capital intensive and has required, and will continue to require, significant investments in property, plant and equipment. As at December 31, 2023, the net book value of our property, plant and equipment was $4.4 billion.
Capitalization
Property, plant and equipment are initially recorded at cost. The cost of purchased equipment includes expenditures that are directly attributable to the purchase price, delivery and installation. The cost of self-constructed assets includes the cost of materials and direct labour, any other costs directly attributable to bringing the assets to the location and condition for their intended use, the costs of dismantling and removing the items and restoring the site on which they are located, and borrowing costs on self-constructed assets that meet certain criteria. Routine repairs and maintenance costs are expensed as incurred.
As at December 31, 2023, we had accrued $33 million for site restoration costs relating to the decommissioning and reclamation of our methanol production sites. Inherent uncertainties exist in this estimate because the restoration activities will take place in the future and there may be changes in governmental and environmental regulations and changes in removal technology and costs. It is difficult to estimate the future costs of these activities as our estimate of fair value is based on current regulations and technology. Because of uncertainties related to estimating the cost and timing of future site restoration activities, future costs could differ materially from the amounts estimated.
Depreciation and Amortization
Depreciation and amortization is generally provided on a straight-line basis at rates calculated to amortize the cost of property, plant and equipment from the commencement of commercial operations over their estimated useful lives to estimated residual value.
The estimated useful lives of the Company’s buildings, plant installations and machinery at installation, excluding costs related to turnarounds, initially range up to 25 years depending on the specific asset component and the production facility to which it is related. The Company determines the estimated useful lives of individual asset components based on the shorter of its physical life or economic life. The physical life of these assets is generally longer than the economic life. The economic life is primarily determined by the nature of the natural gas feedstock available to our various production facilities. The estimated useful life of production facilities may be adjusted from time-to-time based on turnarounds, plant refurbishments and gas availability. Factors that influence the nature of natural gas feedstock availability include the terms of individual natural gas supply contracts, access to natural gas supply through open markets, regional factors influencing the exploration and development of natural gas and the expected price of securing natural gas supply. We review the factors related to each production facility on an annual basis to determine if changes are required to the estimated useful lives.
Recoverability of Asset Carrying Values
Long-lived assets are tested for recoverability whenever events or changes in circumstances, either internal or external, indicate that the carrying amount may not be recoverable ("triggering events").
Examples of such triggering events related to our long-lived assets include, but are not restricted to: a significant adverse change in the extent or manner in which the asset is being used or in its physical condition; a change in management's intention or strategy for the asset, which includes a plan to dispose of the asset or idle the asset for a significant period of time; a significant adverse change in our long-term methanol price assumption or in the price or availability of natural gas feedstock required to manufacture methanol; a significant adverse change in legal factors or in the business climate that could affect the asset’s value, including an adverse action or assessment by a foreign government that impacts the use of the asset; or a current period operating or cash flow loss combined with a history of operating or cash flow losses, or a projection or forecast that demonstrates continuing losses associated with the asset’s use.
When a triggering event is identified, recoverability of long-lived assets is measured by comparing the carrying value of an asset or cash-generating unit to the estimated recoverable amount, which is the higher of its estimated fair value less costs to sell or its value in use. Fair value less costs of disposal is determined by ascertaining the price that would be received to sell an asset in an orderly transaction between market participants under current market conditions, less incremental costs directly attributable to the disposal, excluding finance costs and income tax expense. Value in use is determined by measuring the pre-tax cash flows expected to be generated from the cash-generating unit over its estimated useful life discounted by a pre-tax discount rate. An impairment writedown is recorded if the carrying value exceeds the estimated recoverable amount. An impairment writedown recognized in prior periods for an asset or cash-generating unit is reversed if there has been a subsequent recovery in the value of the asset or cash-generating unit due to changes in events and circumstances. For the purposes of recognition and measurement of an impairment writedown or reversal, we group our long-lived assets with other assets and liabilities to form a cash-generating unit at the lowest level for which identifiable cash flows are largely independent of the cash flows of other assets and liabilities. To the extent that our methanol facilities in a particular location are interdependent as a result of common infrastructure and/or feedstock from shared sources that can be shared within a facility location, we group our assets based on site locations for the purpose of determining impairment.
When impairment indicators exist, there are two key variables that impact our estimate of future cash flows from producing assets: (1) the methanol price and (2) the price and availability of natural gas feedstock. Short-term methanol price estimates are based on current supply and demand fundamentals and current methanol prices. Long-term methanol price estimates are based on our view of long-term supply and demand, incorporating third-party assumptions, forecasts and market-observable prices when appropriate. Consideration is given to many factors, including, but not limited to, estimates of global industrial production rates, energy prices, changes in general economic conditions, the ability for the industry to add further global methanol production capacity and earn an appropriate return on capital, industry operating rates and the global industry cost structure. Our estimate of the price and availability of natural gas takes into consideration the current contracted terms, as well as factors that we believe are relevant to supply under these contracts and supplemental natural gas sources. Other assumptions included in our estimate of future cash flows include the estimated cost incurred to maintain the facilities, estimates of transportation costs and other variable costs incurred in producing methanol in each period. Changes in these assumptions will impact our estimates of future cash flows when testing for impairment and could impact our estimates of the useful lives of property, plant and equipment. Consequently, it is possible that our future operating results could be adversely affected by further asset impairment charges or by changes in depreciation and amortization rates related to property, plant and equipment. In relation to previous impairment charges, we do not believe that there are significant changes in events or circumstances that would support their reversal.
In Trinidad we announced our intention to idle the Atlas plant when its 20-year legacy natural gas supply arrangement expires in September 2024. The expected idling of the Atlas plant has been identified as an impairment indicator for the Atlas cash generating unit ("Atlas CGU"). The impairment test performed on the Atlas CGU resulted in no impairment provision recognized as the estimated recoverable value, determined on a fair value less costs of disposal methodology, exceeded the carrying value. The estimated recoverable value was based on an assumed restart date and an operating period for Atlas aligned to natural gas reserves estimates in Trinidad and Tobago with no terminal value, discounted at an after-tax rate of 16%.
The following table indicates the percentages by which key assumptions would need to change individually for the estimated Atlas CGU recoverable value to be equal to the carrying value:
|
|
|
|
|
|
| Key Assumptions |
Change Required for Carrying Value to Equal Recoverable Value |
| Long-term average realized methanol price |
10 percent decrease |
| Production volumes |
15 percent decrease |
| Gas price |
10 percent increase |
| Discount rate (after-tax) |
800 basis points increase |
The sensitivity above has been prepared considering each variable independently. Historically, our natural gas contracts in Trinidad and Tobago have included terms whereby a change in methanol price results in a change in natural gas price, protecting margins should revenue decrease.
Leases
At inception of a contract, the Company assesses whether a contract is, or contains, a lease. A contract is, or contains, a lease if the contract conveys the right to control the use of an identified asset for a period of time in exchange for consideration.
In determining the lease term, the Company considers all facts and circumstances that create an economic incentive to exercise an extension option, or not exercise a termination option. The assessment is reviewed upon a trigger by an event or a significant change in circumstances.
Certain leases contain non-lease components, excluded from the right-of-use asset and lease liability, related to operating charges for ocean vessels and terminal facilities. Judgment is applied in the determination of the stand-alone price of the lease and non-lease components. All related operating charges are classified as variable payments and all such costs are accounted for as a non-lease component charged to the consolidated statement of operations as incurred.
The lease liability is measured at amortized cost using the effective interest method. It is remeasured when there is a change in future lease payments arising from a change in an index or rate, if there is a change in the Company’s estimate of the amount expected to be payable under a residual value guarantee or if the Company changes its assessment of whether it will exercise a purchase, extension or termination option. In measuring lease liabilities, the Company discounts lease payments using the incremental borrowing rate applicable at lease inception. The incremental borrowing rate is determined using a credit rating specific to the entity, location, asset security and term of the lease.
Income Taxes
We calculate current and deferred tax provisions for each of the jurisdictions in which we operate. Actual amounts of income tax expense or recoveries are not final until tax returns are filed and accepted by the relevant tax authorities and as a result, the ultimate amount of taxes the Company may owe could differ from the amounts recognized in the consolidated financial statements. The filing of annual tax returns primarily occurs subsequent to the issuance of the financial statements and the final determination of actual amounts may not be completed for a number of years. Transactions may be challenged by tax authorities and the Company's operations may be assessed in subsequent periods, which could result in significant additional taxes, penalties and interest. Uncertain tax positions derive from the complexity of tax law and its interpretation by tax authorities and ultimately the judicial system in place in each jurisdiction. Uncertain tax positions, including interest and penalties, are recognized and measured applying management estimates. Given the complexity, management engages third-party experts as required, for the interpretation of tax law, transfer pricing regulations and determination of the ultimate resolution of its tax positions. The Company is subject to various taxation authorities who may interpret tax legislation differently, and resolve matters over longer periods of time. The differences in judgement in assessing uncertain tax positions may result in material differences in the final amount or timing of the payment of taxes or settlement of tax assessments.
Deferred income tax assets and liabilities are determined using enacted or substantially enacted tax rates for the effects of net operating losses and temporary differences between the book and tax bases of assets and liabilities. We recognize deferred tax assets to the extent it is probable that taxable profit will be available against which the asset can be utilized. In making this determination, certain judgments are made relating to the level of expected future taxable income and to available tax-planning strategies and their impact on the use of existing loss carryforwards and other income tax deductions. We also consider historical profitability and volatility to assess whether we believe it is probable that the existing loss carryforwards and other income tax deductions will be used to offset future taxable income otherwise calculated. Management routinely reviews these judgments. As at December 31, 2023, we had recognized deferred tax assets of $152 million primarily relating to non-capital loss carryforwards and other temporary differences in the United States and Trinidad and Tobago. As at December 31, 2023, the Company had $201 million of unrecognized deductible temporary differences in the United States. If judgments or estimates in the determination of our current and deferred tax provision prove to be inaccurate, or if certain tax rates or laws change, or new interpretations or guidance emerge on the application of tax legislation, our results from operations and financial position could be materially impacted.
Financial Instruments Measured at Fair Value
The Company uses derivatives as part of its risk management program to mitigate variability associated with changing market values. Changes in the fair value of derivative financial instruments are recorded in earnings unless the instruments are designated as cash flow hedges, in which case the changes in fair value are recorded in other comprehensive income and are reclassified to profit or loss or accumulated other comprehensive income when the underlying hedged transaction is recognized in earnings or inventory. The Company designates as cash flow hedges certain derivative financial instruments to hedge its risk exposure to fluctuations in natural gas prices and to hedge its risk exposure to fluctuations on certain foreign-currency-denominated transactions. Assessment of contracts as derivative instruments, applicability of the own use exemption, determination of whether contracts contain embedded derivatives to be separated, the valuation of financial instruments and derivatives and hedge effectiveness assessments require a high degree of judgment and are considered critical accounting estimates due to their complex nature and the potential impact on our financial statements.
The Company holds a long-term natural gas supply contract expiring in 2035 with the Egyptian Natural Gas Holding Company, a State-Owned enterprise in Egypt. The natural gas supply contract includes a base fixed price plus a premium based on the realized price of methanol for the full volume of natural gas to supply the plant for the remainder of its useful life. As a result of the amendment in 2022, the contract is being treated as a derivative measured at fair value.
There is no observable, liquid spot market or forward curve for natural gas in Egypt. In addition, there are limited observable prices for natural gas in Egypt as all natural gas purchases and sales are controlled by the government and the observed prices differ based on the produced output or usage.
Due to the absence of an observable market price for an equivalent or similar contract to measure fair value, the contract's fair value is estimated using a Monte-Carlo model. We consider market participant assumptions in establishing the model inputs and determining fair value, including adjusting the base fixed price and methanol based premium at the valuation date to consider estimates of inflation since contract inception.
Refer to note 19 to our 2023 consolidated financial statements for more information.
ADOPTION OF NEW ACCOUNTING STANDARDS
The Company has adopted the amendments to IAS 1 Presentation of Financial Statements as well as IAS 8 Changes in Accounting Estimates and Errors regarding the disclosure of accounting policies and accounting estimates, and IAS 12, Income Taxes ("IAS 12") regarding deferred tax related to assets and liabilities arising from a single transaction, which were effective for annual periods beginning on January 1, 2023. The amendments did not have a material impact on the Company's consolidated financial statements.
In May 2023, the IASB issued a further amendment to IAS 12, establishing a mandatory exception for recognition and disclosure of deferred taxes related to the Pillar Two model rules published by the Organization for Economic Co-operation and Development (“Pillar Two rules”). The Pillar Two rules establish a global minimum fifteen percent top-up tax regime and are expected to apply to Methanex beginning in 2024. The Company has applied this mandatory exception in the current period. Refer to note 16 to our 2023 consolidated financial statements for further disclosure on the expected impact of Pillar Two rules.
ANTICIPATED CHANGES TO INTERNATIONAL FINANCIAL REPORTING STANDARDS
The following new or amended standards or interpretations that are effective for annual periods beginning on or after January 1, 2024 are being reviewed to determine the potential impact: amendments to IAS 1, Presentation of Financial Statements regarding the classification of liabilities as current or non-current, IFRS 16, Leases regarding sale-and-leaseback transactions and IAS 7, Statement of Cash Flows regarding supplier finance arrangements.
NON-GAAP MEASURES
In addition to providing measures prepared in accordance with IFRS, we present certain supplemental measures that are not defined terms under IFRS (non-GAAP measures or ratios). These are Adjusted EBITDA, Adjusted net income (loss), Adjusted net income (loss) per common share, Adjusted net income (loss) before income tax, Adjusted income tax expense, and Adjusted effective tax rate. These non-GAAP financial measures and ratios reflect our 63.1% economic interest in the Atlas facility, 50% economic interest in the Egypt facility and our 60% economic interest in Waterfront Shipping, and are useful as they are a better measure of our underlying performance and assist in assessing the operating performance of the Company’s business. These measures, at our economic share, are a better measure of our underlying performance, as we fully run the operations on our partners' behalf, despite having less than full share of the economic interest. Adjusted EBITDA is also frequently used by securities analysts and investors when comparing our results with those of other companies.
In addition, the Company also presents non-GAAP capital management measures, specifically, Net debt to capitalization and Total liquidity, which are useful in assessing the liquidity of the Company’s ongoing business. Total liquidity is useful because it illustrates the extent to which management has immediate access to cash for operational and construction purposes, and is indicative of our flexibility should uses for these facilities immediately arise. Net debt to capitalization is useful because it illustrates the relative risk of our financing structure to potential lenders and investors.These measures and ratios do not have any standardized meaning prescribed by IFRS and therefore are unlikely to be comparable to similar measures presented by other companies.
These measures should be considered in addition to, and not as a substitute for, net income, cash flows and other measures of financial performance and liquidity reported in accordance with IFRS.
Adjusted EBITDA
Adjusted EBITDA is a non-GAAP financial measure and differs from the most comparable GAAP measure, net income attributable to Methanex shareholders, because it excludes finance costs, finance income and other, income tax expense, depreciation and amortization and mark-to-market impact of share-based compensation. Adjusted EBITDA includes an amount representing our 63.1% share of the Atlas facility and excludes the non-controlling shareholders' interests in entities which we control but do not fully own.
Adjusted EBITDA and Adjusted net income exclude the mark-to-market impact of share-based compensation related to the impact of changes in our share price on SARs, TSARs, deferred share units, restricted share units and performance share units. The mark-to-market impact related to share-based compensation that is excluded from Adjusted EBITDA and Adjusted net income is calculated as the difference between the grant date value and the fair value recorded at each period-end. As share-based awards will be settled in future periods, the ultimate value of the units is unknown at the date of grant and therefore the grant date value recognized in Adjusted EBITDA and Adjusted net income may differ from the total settlement cost.
The following table shows a reconciliation from net income attributable to Methanex shareholders to Adjusted EBITDA:
|
|
|
|
|
|
|
|
|
($ Millions) |
2023 |
2022 |
Net income attributable to Methanex shareholders |
$ |
174 |
|
$ |
354 |
|
Mark-to-market impact of share-based compensation |
16 |
|
(7) |
|
| Gas contract settlement, net of tax |
(31) |
|
— |
|
Depreciation and amortization |
392 |
|
372 |
|
Finance costs |
117 |
|
131 |
|
Finance income and other |
(40) |
|
(25) |
|
Income tax expense |
1 |
|
120 |
|
Earnings of associate adjustment 1 |
67 |
|
74 |
|
Non-controlling interests adjustment 1 |
(74) |
|
(87) |
|
Adjusted EBITDA (attributable to Methanex shareholders) |
$ |
622 |
|
$ |
932 |
|
1 These adjustments represent depreciation and amortization, finance costs, finance income and other and income taxes associated with our 63.1% interest in the Atlas methanol facility and the non-controlling interests.
Adjusted Net Income and Adjusted Net Income per Common Share
Adjusted net income and Adjusted net income per common share are a non-GAAP measure and ratio, respectively, because they exclude the mark-to-market impact of share-based compensation, the impact of the Egypt gas contract revaluation included in finance income and other and the impact of certain items associated with specific identified events. The following table shows a reconciliation from net income attributable to Methanex shareholders to Adjusted net income and the calculation of Adjusted diluted net income per common share:
|
|
|
|
|
|
|
|
|
($ Millions, except number of shares and per share amounts) |
2023 |
2022 |
Net income attributable to Methanex shareholders |
$ |
174 |
|
$ |
354 |
|
Mark-to-market impact of share-based compensation, net of tax |
13 |
|
(6) |
|
Gas contract settlement, net of tax |
(31) |
|
— |
|
Impact of Egypt gas contract revaluation, net of tax |
(3) |
|
(5) |
|
Adjusted net income |
$ |
153 |
|
$ |
343 |
|
Diluted weighted average shares outstanding (millions) |
68 |
|
72 |
|
Adjusted net income per common share |
$ |
2.25 |
|
$ |
4.79 |
|
Management uses these measures to analyze net income and net income per common share after adjusting for our economic interest in the Atlas and Egypt facilities and Waterfront Shipping, for reasons as described above. The exclusion of the mark-to-market portion of the impact of shared-based compensation is due to these amounts not being seen as indicative of the operational performance and can fluctuate in the intervening periods until settlement. The exclusion of the impact of the Egypt gas contract revaluation is due to the change in the derivative being unrealized with the fair value of the derivative expected to fluctuate in the intervening periods until settlement.
QUARTERLY FINANCIAL DATA (UNAUDITED)
Our operations consist of a single operating segment – the production and sale of methanol. Quarterly results vary due to the average realized price of methanol, sales volume and total cash costs.
A summary of selected financial information is as follows:
|
|
|
|
|
|
|
|
|
|
|
|
|
|
|
|
Three months ended |
($ Millions, except per share amounts) |
Dec 31 |
Sep 30 |
Jun 30 |
Mar 31 |
| 2023 |
|
|
|
|
Revenue |
$ |
922 |
$ |
823 |
$ |
939 |
$ |
1,038 |
Cost of sales and operating expenses |
(772) |
|
(730) |
|
(724) |
|
(841) |
|
Net income (attributable to Methanex shareholders) |
33 |
24 |
57 |
60 |
Basic net income per common share |
0.50 |
0.36 |
0.84 |
0.87 |
Diluted net income per common share |
0.50 |
0.36 |
0.73 |
0.87 |
Adjusted EBITDA 1 |
148 |
105 |
160 |
209 |
Adjusted net income 1 |
35 |
1 |
41 |
76 |
Adjusted net income per common share 1 |
0.52 |
0.02 |
0.60 |
1.11 |
|
|
|
|
|
| 2022 |
|
|
|
|
Revenue |
$ |
986 |
$ |
1,012 |
$ |
1,137 |
$ |
1,176 |
Cost of sales and operating expenses |
(841) |
|
(861) |
|
(852) |
|
(892) |
|
Net income (attributable to Methanex shareholders) |
41 |
69 |
125 |
119 |
Basic net income per common share |
0.59 |
0.99 |
1.74 |
1.60 |
Diluted net income per common share |
0.59 |
0.87 |
1.41 |
1.60 |
Adjusted EBITDA 1 |
160 |
192 |
243 |
337 |
Adjusted net income 1 |
51 |
49 |
84 |
159 |
Adjusted net income per common share 1 |
0.73 |
0.69 |
1.16 |
2.16 |
1 The Company has used the terms Adjusted EBITDA, Adjusted net income, and Adjusted net income per common share, throughout this document. These items are non-GAAP measures and ratios that do not have any standardized meaning prescribed by GAAP and therefore are unlikely to be comparable to similar measures presented by other companies. Refer to the Non-GAAP Measures section on page 37 for a description of each non-GAAP measure and reconciliations to the most comparable GAAP measures.
A discussion and analysis of our results for the fourth quarter of 2023 is set out in our fourth quarter of 2023 Management’s Discussion and Analysis filed with the Canadian Securities Administrators on SEDAR+ at www.sedarplus.ca and the U.S. Securities and Exchange Commission on EDGAR at www.sec.gov and is incorporated herein by reference.
SELECTED ANNUAL INFORMATION
|
|
|
|
|
|
|
|
|
|
|
|
($ Millions, except per share amounts) |
2023 |
2022 |
2021 |
Total assets |
$ |
6,427 |
|
$ |
6,631 |
|
$ |
6,090 |
|
Total long-term liabilities (excluding deferred income tax) |
2,733 |
|
3,032 |
|
2,959 |
|
Revenue |
3,723 |
|
4,311 |
|
4,415 |
|
Net income (attributable to Methanex shareholders) |
174 |
|
354 |
|
482 |
|
Adjusted net income 1 |
153 |
|
343 |
|
460 |
|
Adjusted EBITDA 1 |
622 |
|
932 |
|
1,108 |
|
Basic net income per common share |
2.57 |
|
4.95 |
|
6.34 |
|
Diluted net income per common share |
2.57 |
|
4.86 |
|
6.13 |
|
Adjusted net income per common share 1 |
2.25 |
|
4.79 |
|
6.03 |
|
Cash dividends declared per common share |
0.730 |
|
0.620 |
|
0.325 |
|
1 The Company has used the terms Adjusted EBITDA, Adjusted net income, and Adjusted net income per common share,throughout this document. These items are non-GAAP measures and ratios that do not have any standardized meaning prescribed by GAAP and therefore are unlikely to be comparable to similar measures presented by other companies. Refer to the Non-GAAP Measures section on page 37 for a description of each non-GAAP measure and reconciliations to the most comparable GAAP measures.
CONTROLS AND PROCEDURES
Disclosure Controls and Procedures
Disclosure controls and procedures (as defined in Rules 13a-15(f) and 15d-15(f) under the Securities Exchange Act of 1934, as amended (the "Exchange Act")), and NI 52-109, are those controls and procedures that are designed to ensure that the information required to be disclosed in the filings under applicable securities regulations is recorded, processed, summarized and reported within the time periods specified. As of December 31, 2023, under the supervision and with the participation of our management, including our Chief Executive Officer and Chief Financial Officer, we conducted an evaluation of the effectiveness of the design and operation of the Company’s disclosure controls and procedures. Based on this evaluation, the Chief Executive Officer and Chief Financial Officer have concluded that our disclosure controls and procedures are effective as of that date.
Management’s Annual Report on Internal Control over Financial Reporting
Management is responsible for establishing and maintaining adequate internal control over financial reporting. Internal control over financial reporting is a process designed to provide reasonable assurance regarding the reliability of financial reporting and the preparation of financial statements for external purposes in accordance with generally accepted accounting principles. Internal control over financial reporting includes those policies and procedures that: (1) pertain to the maintenance of records that, in reasonable detail, accurately and fairly reflect the transactions and dispositions of our assets; (2) provide reasonable assurance that transactions are recorded as necessary to permit preparation of financial statements in accordance with generally accepted accounting principles, and that our receipts and expenditures are being made only in accordance with authorizations of our management and directors; and (3) provide reasonable assurance regarding prevention or timely detection of unauthorized acquisition, use or disposition of our assets that could have a material effect on the financial statements.
Internal control over financial reporting has inherent limitations. Internal control over financial reporting is a process that involves human diligence and compliance and is subject to lapses in judgment and breakdowns resulting from human failures. Internal control over financial reporting also can be circumvented by collusion or improper management override. Because of such limitations, there is a risk that material misstatements will not be prevented or detected on a timely basis by internal control over financial reporting. However, these inherent limitations are known features of the financial reporting process. Therefore, it is possible to design into the process safeguards to reduce, though not eliminate, this risk.
Under the supervision and with the participation of our Chief Executive Officer and our Chief Financial Officer, management conducted an evaluation of the effectiveness of our internal control over financial reporting, as of December 31, 2023, based on the framework set forth in Internal Control – Integrated Framework issued in 2013 by the Committee of Sponsoring Organizations of the Treadway Commission (the "COSO framework"). Based on its evaluation under this framework, management concluded that our internal control over financial reporting was effective as of that date.
KPMG LLP, an independent registered public accounting firm that audited and reported on our consolidated financial statements, has issued an attestation report on the effectiveness of our internal control over financial reporting as of December 31, 2023. The attestation report is included in our consolidated financial statements on page 46.
Changes in Internal Control over Financial Reporting
There have been no changes in the Company’s internal control over financial reporting that occurred during the most recent interim period and year ended December 31, 2023, that has materially affected, or is reasonably likely to materially affect, the Company’s internal control over financial reporting.
FORWARD-LOOKING STATEMENTS
This 2023 Management’s Discussion and Analysis ("MD&A") contains forward-looking statements with respect to us and our industry. These statements relate to future events or our future performance. All statements other than statements of historical fact are forward-looking statements. Statements that include the words "believes," "expects," "may," "will," "should," "potential," "estimates," "anticipates," "aim", "goal," "targets," "plan," "predict" or other comparable terminology and similar statements of a future or forward-looking nature identify forward-looking statements.
More particularly, and without limitation, any statements regarding the following are forward-looking statements:
▪expected demand for methanol, including demand for methanol for energy uses, and its derivatives,
▪expected new methanol supply or restart of idled capacity and timing for startup of the same,
▪expected shutdowns (either temporary or permanent) or restarts of existing methanol supply (including our own facilities), including, without limitation, the timing and length of planned maintenance outages,
▪expected methanol and energy prices,
▪expected levels of methanol purchases from traders or other third parties,
▪expected levels, timing and availability of economically priced natural gas supply to each of our plants,
▪capital committed by third parties towards future natural gas exploration and development in the vicinity of our plants,
▪our expected capital expenditures and anticipated timing and rate of return of such capital expenditures,
▪anticipated operating rates of our plants,
▪expected operating costs, including natural gas feedstock costs and logistics costs,
▪expected tax rates or resolutions to tax disputes,
▪expected cash flows, cash balances, earnings capability, debt levels and share price,
▪availability of committed credit facilities and other financing,
▪our ability to meet covenants associated with our long-term debt obligations,
▪our shareholder distribution strategy and anticipated distributions to shareholders,
▪commercial viability and timing of, or our ability to execute future projects, plant restarts, capacity expansions, plant relocations or other business initiatives or opportunities, including our Geismar 3 project,
▪our financial strength and ability to meet future financial commitments,
▪expected global or regional economic activity (including industrial production levels) and GDP growth,
▪expected outcomes of litigation or other disputes, claims and assessments, and
▪expected actions of governments, governmental agencies, gas suppliers, courts, tribunals or other third parties.
We believe that we have a reasonable basis for making such forward-looking statements. The forward-looking statements in this document are based on our experience, our perception of trends, current conditions and expected future developments as well as other factors. Certain material factors or assumptions were applied in drawing the conclusions or making the forecasts or projections that are included in these forward-looking statements, including, without limitation, future expectations and assumptions concerning the following:
▪the supply of, demand for and price of methanol, methanol derivatives, natural gas, coal, oil and oil derivatives,
▪our ability to procure natural gas feedstock on commercially acceptable terms,
▪operating rates of our facilities,
▪receipt or issuance of third-party consents or approvals or governmental approvals related to rights to purchase natural gas,
▪the establishment of new fuel standards,
▪operating costs, including natural gas feedstock and logistics costs, capital costs, tax rates, cash flows, foreign exchange rates and interest rates,
▪the availability of committed credit facilities and other financing,
▪the expected timing and capital cost of our Geismar 3 project,
▪global and regional economic activity (including industrial production levels) and GDP growth,
▪absence of a material negative impact from major natural disasters,
▪absence of a material negative impact from changes in laws or regulations,
▪absence of a material negative impact from political instability in the countries in which we operate, and
▪enforcement of contractual arrangements and ability to perform contractual obligations by customers, natural gas and other suppliers and other third parties.
However, forward-looking statements, by their nature, involve risks and uncertainties that could cause actual results to differ materially from those contemplated by the forward-looking statements. The risks and uncertainties primarily include those attendant with producing and marketing methanol and successfully carrying out major capital expenditure projects in various jurisdictions, including, without limitation:
▪conditions in the methanol and other industries, including fluctuations in the supply, demand and price for methanol and its derivatives, including demand for methanol for energy uses,
▪the price of natural gas, coal, oil and oil derivatives,
▪our ability to obtain natural gas feedstock on commercially acceptable terms to underpin current operations and future production growth opportunities,
▪the ability to carry out corporate initiatives and strategies,
▪actions of competitors, suppliers and financial institutions,
▪conditions within the natural gas delivery systems that may prevent delivery of our natural gas supply requirements,
▪our ability to meet timeline and budget targets for the Geismar 3 project, including the impact of any cost pressures arising from tightening construction labour market conditions,
▪competing demand for natural gas, especially with respect to any domestic needs for gas and electricity,
▪actions of governments and governmental authorities, including, without limitation, implementation of policies or other measures that could impact the supply of or demand for methanol or its derivatives,
▪changes in laws or regulations,
▪import or export restrictions, anti-dumping measures, increases in duties, taxes and government royalties and other actions by governments that may adversely affect our operations or existing contractual arrangements,
▪worldwide economic conditions, and
▪other risks described in this 2023 MD&A.
Having in mind these and other factors, investors and other readers are cautioned not to place undue reliance on forward-looking statements. They are not a substitute for the exercise of one’s own due diligence and judgment. The outcomes implied in forward-looking statements may not occur and we do not undertake to update forward-looking statements except as required by applicable securities laws.