Document
Exhibit 99.1
CRESCENT POINT ENERGY CORP.
ANNUAL INFORMATION FORM
For the Year Ended December 31, 2023
Dated February 28, 2024
|
|
|
|
|
|
Section |
Page |
|
|
| SPECIAL NOTES TO READER |
|
| GLOSSARY |
|
| SELECTED ABBREVIATIONS |
|
| CURRENCY OF INFORMATION |
|
| OUR ORGANIZATIONAL STRUCTURE |
|
| GENERAL DEVELOPMENT OF THE BUSINESS OF THE CORPORATION |
|
| DESCRIPTION OF OUR BUSINESS |
|
| STATEMENT OF RESERVES DATA AND OTHER OIL AND GAS INFORMATION |
|
| ADDITIONAL INFORMATION RESPECTING CRESCENT POINT |
|
| INDUSTRY CONDITIONS |
|
| RISK FACTORS |
|
| DIVIDENDS AND SHARE REPURCHASES |
|
| MARKET FOR SECURITIES |
|
| CONFLICTS OF INTEREST |
|
| LEGAL PROCEEDINGS |
|
| AUDIT COMMITTEE |
|
| TRANSFER AGENT AND REGISTRARS |
|
| AUDITOR |
|
| MATERIAL CONTRACTS |
|
| INTERESTS OF EXPERTS |
|
| ADDITIONAL INFORMATION |
|
APPENDIX A - AUDIT COMMITTEE MANDATE
APPENDIX B - RESERVES COMMITTEE MANDATE
APPENDIX C - REPORTS ON RESERVES DATA BY INDEPENDENT QUALIFIED RESERVES EVALUATOR OR AUDITOR
APPENDIX D - REPORT OF MANAGEMENT AND DIRECTORS ON RESERVES DATA AND OTHER INFORMATION Any "financial outlook" or "future oriented financial information" in this annual information form, as defined by applicable securities legislation, has been approved by management of Crescent Point (as defined herein).
SPECIAL NOTES TO READER
Such financial outlook or future oriented financial information is provided for the purpose of providing information about management's current expectations and plans relating to the future. Readers are cautioned that reliance on such information may not be appropriate for other purposes.
This AIF (as defined herein) and other reports and filings made with the securities regulatory authorities include certain statements that constitute "forward-looking statements" within the meaning of section 27A of the Securities Act of 1933, section 21E of the Securities Exchange Act of 1934 and the United States Private Securities Litigation Reform Act of 1995 and "forward-looking information" for the purposes of Canadian securities regulation (collectively, "forward-looking statements"). All forward-looking statements are based on our beliefs and assumptions based on information available at the time the assumption was made. Crescent Point has tried to identify such forward-looking statements by use of such words as "could", "should", "can", "anticipate", "expect", "believe", "will", "may", "plan", "forecast", "intend", "projected", "sustain", "continues", "strategy", "potential", "projects", "grow", "take advantage", "estimate", "well-positioned" and similar expressions, but these words are not the exclusive means of identifying such statements. These forward-looking statements involve known and unknown risks, uncertainties and other factors that may cause actual results or events to differ materially from those anticipated in such forward-looking statements. Crescent Point believes the expectations reflected in those forward-looking statements are reasonable but no assurance can be given that these expectations will prove to be correct and such forward-looking statements should not be unduly relied upon. These statements speak only as of the date of this AIF or, if applicable, as of the date specified in this AIF.
In particular, this AIF contains forward-looking statements pertaining, among other things, to the following:
•corporate strategy and anticipated financial and operational performance;
•forecast prices and the expected impact of commodity price fluctuations on cash available to pay dividends and return capital to shareholders;
•return of capital framework that targets the return of 60% of Crescent Point's excess cash flow;
•hedging strategy, including expected outcomes, and the approach to managing physical delivery contracts;
•risk mitigation strategy and the expected outcomes;
•the potential impact of competition and our working relationships with industry partners and joint operators on Crescent Point's business;
•business prospects;
•the performance characteristics of Crescent Point's oil and natural gas properties, including but not limited to oil and natural gas production levels;
•anticipated future cash flows and oil and natural gas production levels;
•projected returns and exploration potential of our assets;
•the potential of Crescent Point's plays;
•future development plans, including focus areas;
•forecast costs and expenses associated with Crescent Point's business, including capital expenditure programs and how they will be funded;
•leverage objectives;
•corporate and asset acquisitions and dispositions;
•work commitments and drilling programs;
•expected location inventory development timing;
•expected production breakdown by area on a Proved and Proved plus Probable production basis;
•expected development time frame of the Proved and Proved plus Probable locations;
•the quantity of oil and natural gas reserves;
•projections of commodity prices and costs;
•Crescent Point's decline mitigation efforts;
•future enhanced oil recovery and waterflood programs;
•the possible impacts of curtailment on Crescent Point;
•the impacts of the Redwater decision and other legal decisions;
•expected decommissioning, abandonment, remediation and reclamation costs;
•Crescent Point's tax horizon;
•the impact of the Canada-United States-Mexico Agreement;
•expected trends in environmental regulation, including the anticipated impact the trends may have on operations and compliance costs;
•the impact, and projected long-term impacts, of the pricing of carbon and greenhouse gases;
•payment of dividends, including special dividends, and the repurchase of Common Shares (as defined herein) by Crescent Point, including pursuant to its normal course issuer bid;
•supply and demand for oil and natural gas;
•the actions of OPEC+;
•expectations of legal and regulatory changes and implementations and change in governmental and regulatory bodies;
•expectations regarding the ability to raise capital and to continually add to reserves through acquisitions and development;
•treatment under governmental regulatory regimes, including royalty regimes applicable to natural resources;
•stock option intentions;
•the impacts of the wars in Ukraine and the Middle East;
•the impacts of pandemics;
•the risks and impacts of droughts and wildfires; and
•risks related to the regulatory, social and market efforts to address climate change.
By their nature, such forward-looking statements are subject to a number of risks, uncertainties and assumptions, which could cause actual results or other expectations to differ materially from those anticipated, expressed or implied by such statements, including those material risks discussed in our Management's Discussion and Analysis for the year ended December 31, 2023, under the headings "Risk Factors" and "Forward-Looking Information" and as disclosed in this AIF. The material assumptions and factors in making forward-looking statements are disclosed in the Management's Discussion and Analysis for the year ended December 31, 2023, under the headings "Overview", "Development Capital Expenditures", "Commodity Derivatives", "Liquidity and Capital Resources", "Critical Accounting Estimates", "Risk Factors", "Changes in Accounting Policies" and "Guidance".
This information contains certain forward-looking estimates that involve substantial known and unknown risks and uncertainties, certain of which are beyond Crescent Point's control. Such risks and uncertainties include, but are not limited to: financial risk of marketing reserves at an acceptable price given market conditions; volatility in market prices for oil and natural gas; delays in business operations, pipeline restrictions and blowouts; the impacts of the wars in Ukraine and the Middle East; the actions of OPEC+; the risk of carrying out operations with minimal environmental impact; industry conditions, including changes in laws and regulations, the adoption of new environmental laws and regulations, and changes in how environmental laws and regulations are interpreted and enforced; uncertainties associated with estimating oil and natural gas reserves; economic risk of finding and producing reserves at a reasonable cost; uncertainties associated with partner plans and approvals; operational matters related to non-operated properties; increased competition for, among other things, capital, acquisitions of reserves and undeveloped lands; competition for and availability of qualified personnel or management; incorrect assessments of the value of acquisitions and exploration and development programs and of dispositions and monetization; unexpected geological, technical, drilling, construction and processing problems; availability of insurance; the impacts of pandemics, drought and wildfires; fluctuations in foreign exchange and interest rates; stock market volatility; failure to realize the anticipated benefits of acquisitions and dispositions; general economic, market and business conditions; inflation; uncertainties associated with regulatory approvals; uncertainty of government policy changes; uncertainties associated with credit facilities and counterparty credit risk; tax laws and changes thereto, crown royalty rates and incentive programs relating to the oil and gas industry; and other factors, many of which are outside the control of Crescent Point, including those listed under "Risk Factors" in this AIF. The impact of any one risk, uncertainty or factor on a particular forward-looking statement is not determinable with certainty as each of these are interdependent and Crescent Point's future course of action depends on management's assessment of all information available at the relevant time.
Statements relating to "reserves" and "resources" are deemed to be forward-looking statements, as they involve the implied assessment, based on certain estimates and assumptions, that the reserves described exist in the quantities predicted or estimated and that the reserves can be profitably produced in the future. Actual reserve values may be greater than or less than the estimates provided herein.
There are numerous uncertainties inherent in estimating quantities of crude oil, natural gas and natural gas liquids reserves and the future cash flows attributed to such reserves. The reserve and associated cash flow information set forth herein are estimates only. In general, estimates of economically recoverable crude oil, natural gas and natural gas liquids reserves and the future net cash flows therefrom are based upon a number of variable factors and assumptions, such as historical production from the properties, production rates, ultimate reserve recovery, timing and amount of capital expenditures, marketability of oil and natural gas, royalty rates, the assumed effects of regulation by governmental agencies and future operating costs, all of which may vary materially. For these reasons, estimates of the economically recoverable crude oil, natural gas liquids and natural gas reserves attributable to any particular group of properties, classification of such reserves based on risk of recovery and estimates of future net revenues associated with reserves prepared by different engineers, or by the same engineers at different times, may vary. Crescent Point's actual production, revenues, taxes and development and operating expenditures with respect to its reserves will vary from estimates thereof and such variations could be material. In addition, the discounted and undiscounted net present value of future net revenues attributable to reserves do not represent fair market value; and the estimates of reserves and future net revenue for individual properties may not reflect the same confidence level as estimates of reserves and future net revenue for all properties, due to the effects of aggregation. Crescent Point's actual results, performance or achievements could differ materially from those expressed in, or implied by, these forward-looking estimates and if such actual results, performance or achievements transpire or occur, or if any of them do so, there can be no certainty as to what benefits, if any, Crescent Point will derive therefrom.
Barrels of oil equivalent ("boe") may be misleading, particularly if used in isolation. A boe conversion ratio of 6 Mcf: 1 Bbl is based on an energy equivalency conversion method primarily applicable at the burner tip and does not represent a value equivalency at the wellhead.
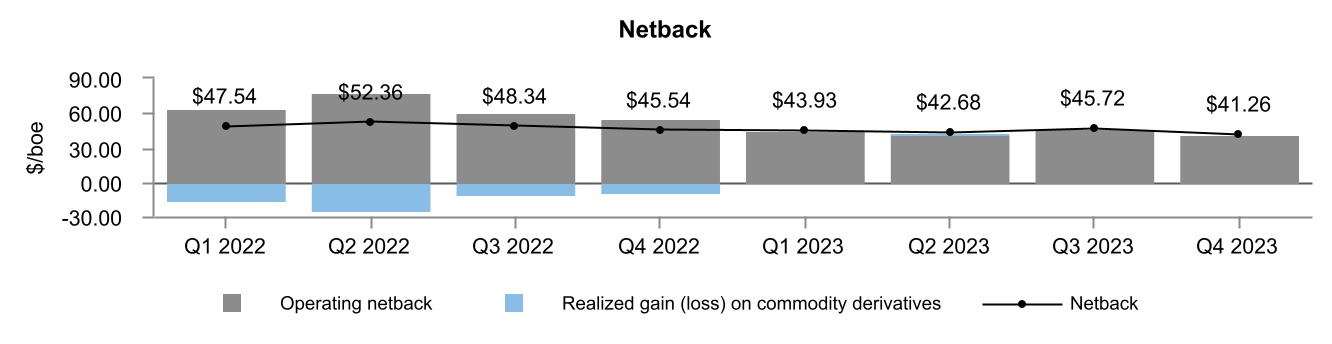
Netback received is calculated on a per boe basis as oil and gas sales, less royalties, operating and transportation expenses. Netback received excludes realized commodity derivative gains and losses. Netback received is used by management to measure operating results on a per boe basis to better analyze performance against prior periods on a comparable basis. Netback received is equivalent to "operating netback" referenced in the MD&A. The calculation of netback received is shown in the Production History section of this AIF.
The aggregate of the exploration and development costs incurred in the most recent financial year and the change during the year in estimated future development costs generally will not reflect total finding and development costs related to reserves additions for the year.
Additional information on these and other factors that could affect Crescent Point's operations or financial results are included in Crescent Point's reports on file with Canadian and U.S. securities regulatory authorities (including our Annual Report on Form 40-F and Management's Discussion and Analysis). Readers are cautioned not to place undue reliance on the forward-looking information, which is given as of the date it is expressed in this AIF or otherwise. We do not undertake any obligation to publicly update or revise any forward-looking statements, whether as a result of new information, future events or otherwise, except as required pursuant to applicable law. All subsequent forward-looking statements, whether written or oral, attributable to Crescent Point or persons acting on the Corporation's behalf are expressly qualified in their entirety by these cautionary statements.
Currency Presentation
All references to "dollars" and "$" are to the currency of Canada, unless otherwise indicated. The daily rate of exchange on December 31, 2023, as reported by the Bank of Canada for the conversion of Canadian dollars into United States dollars was Cdn.$1.00 equals U.S.$0.7561 and for the conversion of United States dollars into Canadian dollars was U.S.$1.00 equals Cdn.$1.3226. The following table sets forth, for 2023 and 2022, the high, low and average of the daily exchange rates for that year, each for one U.S. dollar expressed in Canadian dollars as reported by the Bank of Canada.
|
|
|
|
|
|
|
|
|
|
Year ended December 31, 2023 (Cdn$/Usd) |
Year ended December 31, 2022 (Cdn$/Usd) |
High |
0.7617 |
0.8031 |
Low |
0.7207 |
0.7217 |
Average |
0.7410 |
0.7692 |
Presentation of our Reserve and Resource Information
Current SEC reporting requirements permit oil and gas companies to disclose Probable reserves (as defined herein), in addition to the required disclosure of Proved reserves. Under current SEC requirements, net quantities of reserves are required to be disclosed, which requires disclosure on an after-royalties basis and does not include reserves relating to the interests of others. For a description of these and additional differences between Canadian and U.S. standards of reporting reserves, see "Risk Factors — Canadian and United States practices differ in reporting reserves and production and our estimates may not be comparable to those of companies in the United States".
New York Stock Exchange
As a Canadian corporation listed on the NYSE (as defined herein), we are not required to comply with most of the NYSE's corporate governance standards and, instead, may comply with Canadian corporate governance practices. We are, however, required to disclose the significant differences between our corporate governance practices and the requirements applicable to U.S. domestic companies listed on the NYSE. Except as summarized on our website at www.crescentpointenergy.com, we are in compliance with the NYSE corporate governance standards.
GLOSSARY
In this AIF, the capitalized terms set forth below have the following meanings:
"ABCA" means the Business Corporations Act, R.S.A. 2000, c. B-9, as amended, including the regulations promulgated thereunder.
"AER" means the Alberta Energy Regulator.
"Alberta EPA" means the Alberta Ministry of Environment and Protected Areas.
"AIF" means this annual information form of the Corporation dated February 28, 2024 for the year ended December 31, 2023.
"Board" or "Board of Directors" means the board of directors of the Corporation.
"Common Shares" means common shares in the capital of the Corporation.
"Conversion Arrangement" means the plan of arrangement under Section 193 of the ABCA, completed on July 2, 2009 pursuant to which the Trust effectively converted from an income trust to a corporate structure.
"CPEUS" means Crescent Point Energy U.S. Corp.
"CPHL" means Crescent Point Holdings Ltd.
"CPUSH" means Crescent Point U.S. Holdings Corp.
"Crescent Point" or the "Corporation" means Crescent Point Energy Corp., formerly Wild River Resources Ltd., a corporation amalgamated under the ABCA and, where applicable, includes its subsidiaries and affiliates.
"DRIP" means the Premium DividendTM and Dividend Reinvestment Plan of the Corporation.
"DSU Plan" means the Deferred Share Unit Plan of the Corporation.
"ESVP" means the Employee Share Value Plan of the Corporation.
"Greenhouse Gases" or "GHGs" means any or all of, including but not limited to, carbon dioxide (CO2), methane (CH4), nitrous oxide (N2O), hydrofluorocarbons (HFCs), perfluorocarbons (PFCs), and sulphur hexafluoride (SF6).
"HEI" means Hammerhead Energy Inc.
"HRULC" means Hammerhead Resources ULC.
"IFRS" means the standards and interpretations adopted by the International Accounting Standards Board, as amended from time to time.
"McDaniel" means McDaniel & Associates Consultants Ltd.
"MD&A" means the management's discussion and analysis of financial condition and results of operations of the Corporation for the year ended December 31, 2023.
"NCIB" means normal course issuer bid.
"NI 51-101" means "National Instrument 51-101 – Standards for Disclosure for Oil and Gas Activities".
"NYSE" means the New York Stock Exchange.
"OPEC+" means the Organization of the Petroleum Exporting Countries and cooperating oil-exporting nations.
"Partnership" means Crescent Point Resources Partnership, a general partnership formed under the laws of the Province of Alberta, having CPHL and the Corporation as partners.
"PSU Plan" means the Performance Share Unit Plan of the Corporation.
"Restricted Share Bonus Plan" means the Restricted Share Bonus Plan of the Corporation.
"SDP" means the Share Dividend Plan of the Corporation.
"SEC" means the U.S. Securities and Exchange Commission.
"Shareholders" means the holders from time to time of Common Shares.
"Stock Option Plan" means the Stock Option Plan of the Corporation.
"Tax Act" means the Income Tax Act (Canada), R.S.C. 1985, c. 1 (5th Supp.), and the regulations promulgated thereunder, each as amended from time to time.
"Trust" means Crescent Point Energy Trust, an unincorporated open ended investment trust governed by the laws of the Province of Alberta that was dissolved pursuant to the Conversion Arrangement.
"Trust Units" means the trust units of the Trust.
"TSX" means the Toronto Stock Exchange.
"U.S." means the United States of America.
"Unitholders" means holders of Trust Units.
For additional definitions used in this AIF, please see "Statement of Reserves Data and Other Oil and Gas Information - Notes and Definitions".
SELECTED ABBREVIATIONS
In this AIF, the abbreviations set forth below have the following meanings:
|
|
|
|
|
|
|
|
|
|
|
|
| Oil and Natural Gas Liquids |
Natural Gas |
| bbl |
barrel |
Mcf |
thousand cubic feet |
| bbls |
barrels |
Mcf/d |
thousand cubic feet per day |
| bbls/d |
barrels per day |
Mcfe |
thousand cubic feet of gas equivalent converting one barrel of oil to 6 Mcf of natural gas equivalent |
| Mbbls |
thousand barrels |
| NGLs |
natural gas liquids |
|
|
MMcf |
million cubic feet |
|
|
MMcf/d |
million cubic feet per day |
|
|
MMBTU |
million British Thermal Units |
|
|
MMBTU/d |
million British Thermal Units per day |
|
|
|
|
|
|
| Other |
|
| AECO |
the natural gas storage facility located at Suffield, Alberta |
| boe or BOE |
barrels of oil equivalent may be misleading, particularly if used in isolation. A boe conversion ratio of 6 Mcf: 1 Bbl is based on an energy equivalency conversion method primarily applicable at the burner tip and does not represent a value equivalency at the wellhead. |
| boe/d |
barrel of oil equivalent per day |
| m³ |
cubic metres |
| M$ |
thousand dollars |
| Mboe |
thousand barrels of oil equivalent |
| MMboe |
million barrels of oil equivalent |
| MM$ |
million dollars |
| NYMEX |
New York Mercantile Exchange natural gas price |
| tCO2e/boe |
tonnes of carbon dioxide equivalent per barrel of oil equivalent |
| WTI |
West Texas Intermediate, the reference price paid in U.S. dollars at Cushing, Oklahoma for crude oil of standard grade |
CURRENCY OF INFORMATION
The information set out in this AIF is stated as at December 31, 2023, unless otherwise indicated. Capitalized terms used but not defined in the text are defined in the Glossary.
OUR ORGANIZATIONAL STRUCTURE
The Corporation
Crescent Point Energy Corp. ("Crescent Point" or the "Corporation" and, together with its direct and indirect subsidiaries and partnerships, where appropriate, "we", "our" or "us") is the corporation resulting from the January 1, 2024 amalgamation of Crescent Point and HRULC under the ABCA following Crescent Point's acquisition of HEI and its subsidiary, HRULC. The Corporation is the successor to Crescent Point Energy Ltd. which was founded in 2001, and to the Trust, following the completion of the "conversion" of the Trust from an income trust to a corporate structure in accordance with the Conversion Agreement.
The head and principal office of the Corporation is located at Suite 2000, 585 – 8th Avenue S.W., Calgary, Alberta, T2P 1G1 and its registered office is located at Suite 3700, 400 – 3rd Avenue S.W., Calgary, Alberta, T2P 4H2.
The Corporation is a conventional oil and gas producer with assets strategically focused in properties comprised of high quality, long life, operated, light and medium crude oil, natural gas liquids and natural gas reserves in Western Canada. We make regular cash dividends to Shareholders from our net cash flow.
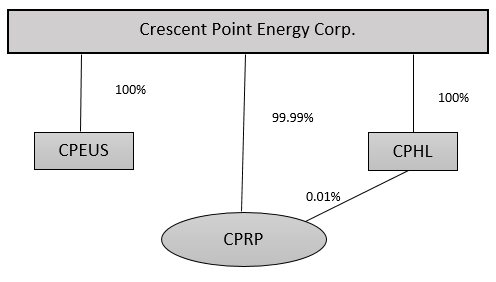
Partnership
The Partnership is a general partnership governed by the laws of the Province of Alberta. As set forth in the diagram below under "Organizational Structure of the Corporation", the partners of the Partnership are CPHL and the Corporation.
The existing business of the Corporation is carried on through the Partnership and through CPEUS. The Partnership holds all the Corporation's Canadian operating assets and CPEUS holds all of the Corporation’s U.S. assets.
CPHL
CPHL is a wholly-owned subsidiary of the Corporation. CPHL is a partner of the Partnership.
CPEUS
CPEUS is a wholly-owned indirect subsidiary of the Corporation.
Relationships
The following table provides the name, the percentage of voting securities owned by the Corporation and the jurisdiction of incorporation, continuance or formation of the Corporation's material subsidiaries as at the date hereof.
|
|
|
|
|
|
|
|
|
|
Percentage of Voting Securities (Directly or Indirectly) |
Jurisdiction of Incorporation/Formation |
CPHL |
100% |
Alberta |
Partnership |
100% |
Alberta |
CPEUS |
100% |
Delaware |
Organizational Structure of the Corporation
The following diagram describes the inter-corporate relationships among the Corporation and its material direct and indirect subsidiaries described above as at December 31, 2023 and current to February 28, 2024. Reference should be made to the appropriate sections of this AIF for a complete description of the structure of the Corporation.
HRULC (incorporated in Alberta) was a wholly owned subsidiary of Crescent Point on December 31, 2023, and amalgamated with Crescent Point on January 1, 2024.
GENERAL DEVELOPMENT OF THE BUSINESS OF THE CORPORATION
History
The following is a description of the general development of the business of Crescent Point over the past three years.
2021
On February 17, 2021, the Corporation entered into an agreement with Shell Canada Energy (Shell), an affiliate of Royal Dutch Shell plc (formerly, Royal Dutch Shell plc), to acquire Shell’s Kaybob Duvernay assets in Alberta for $900 million. The total consideration consisted of $700 million in cash and 50 million Common Shares. The acquisition closed in April 2021.
On March 5, 2021, the Corporation announced the approval by the TSX of its notice to implement a NCIB (the "2021 NCIB") to purchase, for cancellation, 26,462,509 Common Shares, or five percent of the Corporation's public float, as at February 26, 2021. The NCIB commenced on March 9, 2021 and expired on March 8, 2022. In 2021, the Corporation purchased a total of 2,817,000 Common Shares under its NCIB program.
On June 7, 2021 the Corporation completed the disposition of certain non-core southeast Saskatchewan conventional assets, for cash proceeds of $93 million. As a result of the transaction, Crescent Point also reduced its asset retirement obligations by approximately $220 million, or nearly 25 percent of its asset retirement obligations balance as at March 31, 2021.
On September 13, 2021, the Corporation announced that it was increasing its quarterly dividend from $0.0025 per share payable every quarter to $0.03 per share payable every quarter, commencing with the fourth quarter of 2021.
On December 6, 2021, the Corporation announced that it was increasing its quarterly dividend from $0.03 per share payable every quarter to $0.045 per share payable every quarter, commencing with the first quarter of 2022.
CPHI, a former partner of the Partnership, was dissolved effective December 31, 2021.
2022
On March 4, 2022, the Corporation announced the approval by the TSX of its notice to implement a NCIB (the "2022 NCIB") to purchase, for cancellation, up to 57,309,975 Common Shares, or ten percent of the Corporation's public float, as at February 28, 2022. The NCIB commenced on March 9, 2022 and expired on March 8, 2023. In 2022, the Corporation purchased a total of 31,347,100 Common Shares under its NCIB programs.
On May 12, 2022, the Corporation announced that it was increasing its quarterly dividend from $0.045 per share payable every quarter to $0.065 per share payable every quarter, commencing with the second quarter of 2022.
On May 19, 2022, Mindy Wight was elected to the Board. See "Additional Information Respecting Crescent Point - Directors and Officers".
On October 26, 2022, the Corporation announced a special dividend of $0.035 per share payable on November 14, 2022.
On December 9, 2022, the Corporation announced that it was increasing its quarterly dividend from $0.065 per share payable every quarter to $0.10 per share payable every quarter, commencing with the first quarter of 2023.
2023
On January 11, 2023, Crescent Point completed the acquisition of certain Kaybob Duvernay assets in Alberta for cash consideration of $370.4 million, including closing adjustments.
On March 2, 2023, the Corporation announced a special dividend of $0.032 per share payable on March 17, 2023.
On March 7, 2023, the Corporation announced the approval by the TSX of its notice to implement a NCIB (the "2023 NCIB") to purchase, for cancellation, up to 54,605,659 Common Shares, or ten percent of the Corporation's public float, as at February 23, 2023. The NCIB commenced on March 9, 2023 and is due to expire on March 8, 2024. In 2023, the Corporation purchased a total of 34,611,900 Common Shares under its NCIB programs.
On March 28, 2023, Crescent Point entered into an agreement with Spartan Delta Corp. ("Spartan Delta") to acquire Spartan Delta's Montney assets in Alberta for cash consideration of $1.7 billion. Cash consideration was funded through the Corporation's existing credit facility. The acquisition closed on May 10, 2023.
On May 10, 2023, concurrent with the closing of the Spartan Delta acquisition, the Company entered into the Syndicated Liquidity Facility (as defined below) with ten banks that matures on May 10, 2025.
On July 26, 2023, the Corporation announced a special dividend of $0.035 per share payable on August 15, 2023.
On August 24, 2023, Crescent Point and CPEUS entered into an agreement with a private operator to sell substantially all its North Dakota assets for US$432.7 million including closing adjustments and US$60.0 million of deferred consideration. The acquisition closed on October 24, 2023. Following completion of the acquisition, Crescent Point ceased to hold any operating assets in the United States.
On November 2, 2023, the Corporation announced a special dividend of $0.02 per share payable on November 22, 2023.
On November 6, 2023, Crescent Point announced that it entered into an arrangement agreement to acquire, by a statutory arrangement, HEI, and its subsidiary, HRULC, for total consideration of approximately $2.52 billion (the "Hammerhead Acquisition"). The consideration included $1.54 billion in cash, the issuance of 53.2 million Common Shares and $480.2 million of net debt.
On November 6, 2023, Crescent Point announced that it entered into an agreement with a syndicate of underwriters co-led by BMO Capital Markets and RBC Capital Markets (collectively the "Underwriters") under which the Underwriters agreed to purchase, on a bought deal basis 48,550,000 Common Shares at $10.30 per common share for aggregate gross proceeds of approximately $500 million (the "Offering"). The Offering closed on November 10, 2023.
On December 21, 2023, Crescent Point completed the Hammerhead Acquisition.
On December 21, 2023, concurrent with the closing of the Hammerhead Acquisition, the Company entered into the Term Loan (as defined below) with twelve banks that matures on November 26, 2026.
On December 31, 2023, HEI was wound-up into the Corporation.
CPUSH, a wholly-owned direct subsidiary of the Corporation was dissolved effective December 31, 2023.
2024
On January 1, 2024, HRULC was amalgamated with Crescent Point.
On January 26, 2024, the Corporation completed the disposition of its Southern Alberta assets for total consideration of approximately $38.1 million, including interim closing adjustments. Total consideration includes $25.0 million of deferred consideration receivable. Due to significant decommissioning liabilities associated with these assets, this transaction reduces the Company's decommissioning liability balance by $92.4 million.
DESCRIPTION OF OUR BUSINESS
General
The Corporation is an oil and gas exploration, development and production company. The Corporation is a conventional oil and gas producer with assets strategically focused in properties comprised of high quality, long life, operated, light and medium crude oil, natural gas liquids and natural gas reserves in Western Canada. The primary assets of the Corporation are currently its interest in the Partnership and shares in CPHL.
The crude oil and natural gas properties and related assets generating income for the benefit of the Corporation are located in the provinces of Saskatchewan and Alberta. The properties and assets consist of producing crude oil, natural gas liquids and natural gas reserves and Proved plus Probable (as defined herein) crude oil, natural gas liquids and natural gas reserves not yet on production, and land holdings.
We pay regular cash dividends to Shareholders from our net cash flow in accordance with our dividend policy. Our primary sources of cash flow are distributions from the Partnership. During the year ended December 31, 2023, dividends declared to shareholders, including both base dividends and special dividends, were $0.387 per Common Share. See "Dividends".
Strategy
Our strategy is to deliver lasting market-leading value to our stakeholders as a trusted, ethical and environmentally responsible source for energy. We will maintain a resilient, balanced and sustainable portfolio, and apply our agile, diverse, learning mindset to optimize all aspects of our business.
We strive to enhance shareholder returns by cost effectively developing a focused asset base in a responsible and sustainable manner. The Corporation employs a disciplined capital allocation framework centered around returns and balance sheet strength, in order to create value for shareholders through a combination of significant return of capital, returns-based growth and balance sheet strength.
We strategically develop our properties through detailed technical analysis including reservoir characteristics, petroleum initially in place, recovery factors and the applicability of enhanced recovery techniques. Our development strategies include, multi-stage fracture stimulation of horizontal wells, infill and step-out wells, re-completion of existing wells along with the application of secondary and enhanced oil recovery techniques, including waterflood programs.
Risk Management and Marketing
Factors outside our control impact, to varying degrees, the prices we receive for production. These include, but are not limited to:
(a) world market forces, including world supply and consumption levels and the ability of OPEC+ and others to set and maintain production levels and prices for crude oil;
(b) political conditions, including the risk of hostilities in the Middle East, South America, Eastern Europe and other regions throughout the world;
(c) availability, proximity and capacity of take-away alternatives, including oil and gas gathering systems, pipelines, processing facilities, railcars and railcar loading facilities;
(d) increases or decreases in crude oil differentials and their implications for prices received by us;
(e) the impact of changes in the exchange rate between Canadian and U.S. dollars on prices received by us for our crude oil and natural gas;
(f) North American market forces, most notably shifts in the balance between supply and demand for crude oil and natural gas and the implications for the prices of crude oil and natural gas;
(g) global and domestic economic and weather conditions and changes in demand as a result of outbreaks, pandemics, such as the COVID-19 health emergency, or other health emergencies;
(h) price and availability of alternative energy sources;
(i) the effect of energy conservation measures and government regulations; and
(j) U.S. and Canada tax policy.
Fluctuations in commodity prices, differentials and foreign exchange and interest rates, among other factors, are outside of our control and yet can have a significant impact on the level of cash we have available for return of capital to our shareholders, including payment of dividends and the acquisition of Common Shares.
To mitigate a portion of these risks, we actively initiate, manage and disclose the effects of our hedging activities. Our strategy for crude oil and natural gas production is to hedge up to 65%, or as otherwise approved by the Board of Directors, of our net of royalty production up to a rolling three and a half year basis, at the discretion of management. The Corporation also uses a combination of financial derivatives and fixed-differential physical contracts to hedge price differentials. For oil differential hedging, Crescent Point's risk management program allows for hedging a forward profile of up to three and a half years, and up to 35% net of royalty production. For gas differential hedging, Crescent Point's risk management program allows for hedging a forward profile of up to three and a half years, and up to 50% net of royalty production. All hedging activities are governed by our Risk Management and Counterparty Credit Policy and are regularly reviewed by the Board of Directors.
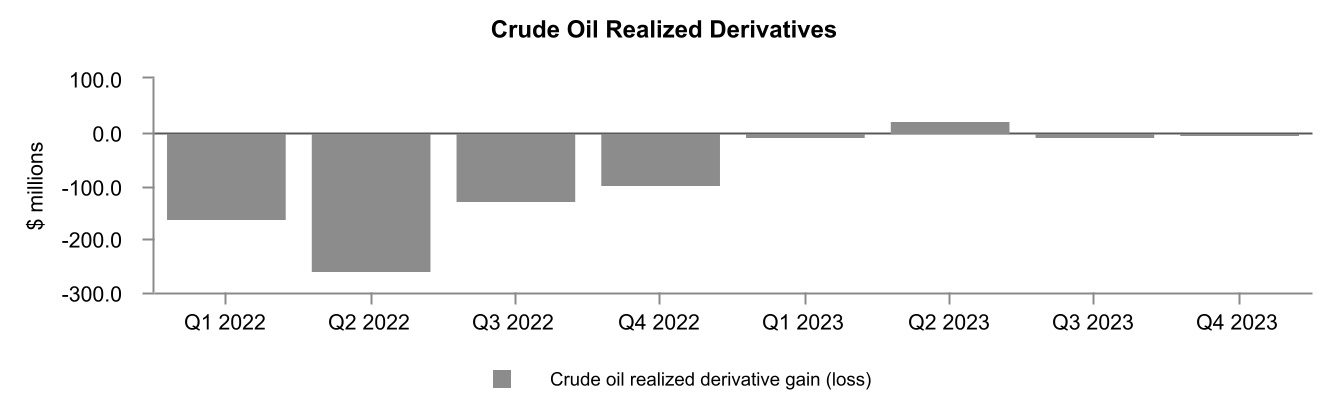
As part of our risk management program, benchmark oil prices are hedged using financial WTI-based instruments transacted in Canadian and U.S. dollars, benchmark natural gas prices are hedged using financial AECO and NYMEX based instruments transacted in Canadian and U.S. dollars, respectively. Total financial oil and gas hedges in 2023 amounted to approximately 27% of annual production, net of royalties, consisting of approximately 28% of annual liquids production and approximately 25% of annual natural gas production, net of royalties. The Corporation recorded a realized derivative gain on crude oil, NGL and natural gas hedge contracts of $15.5 million in 2023.
Crescent Point also enters into physical delivery and derivative WTI price differential contracts which manage the spread between US$ WTI and various stream prices on a portion of its production. The Corporation manages physical delivery contracts on a month-to-month spot and term contract basis. From January to December 2023, approximately 5,000 bbls/d of liquids production was contracted with fixed price differentials off WTI. Crescent Point also enters into derivative NYMEX price differential contracts which manage the spread between US$ NYMEX and AECO-based pricing on a portion of its natural gas production. From January to December 2023, the Company had approximately 27,700 MMBTU/d of natural gas financial derivatives with fixed price differentials off NYMEX.
Refer to the annual financial statements for our commitments under all hedging agreements as at December 31, 2023.
In addition to hedging benchmark crude oil and natural gas prices with financial instruments, we also have the ability to mitigate crude oil basis risk by delivering a portion of our crude oil production into diversified refinery markets using rail transportation when it is economically beneficial to do so. Crescent Point operates two railcar loading facilities, serving its key producing areas of southeast Saskatchewan and southwest Saskatchewan. Crude oil and NGL volumes loaded at these facilities are sold at the loading facilities and our buyers are responsible for providing railcars and managing transportation logistics from that point until delivery.
We mitigate credit risk by having a well-diversified marketing portfolio for our commodity sales. Credit risk associated with the Corporation's product sales and with the Corporation's financial hedging portfolio is managed by Crescent Point's Risk Management Committee and is governed by a board-approved Risk Management and Counterparty Credit Policy that is reviewed annually by the Board of Directors. The Policy requires annual credit reviews of all trade counterparties. Credit limits are required to be set for all trade counterparties, which are based on either a fixed dollar amount which is set annually, at a minimum, or a percentage of the Corporation's portfolio calculated monthly. Crescent Point utilizes a diversified approach in both its physical sales portfolio and its financial hedging portfolio. The physical sales portfolio consists of 82 purchasers and its financial hedging portfolio consists of 12 counterparties. The Corporation's portfolio of counterparty exposures is monitored on a monthly basis.
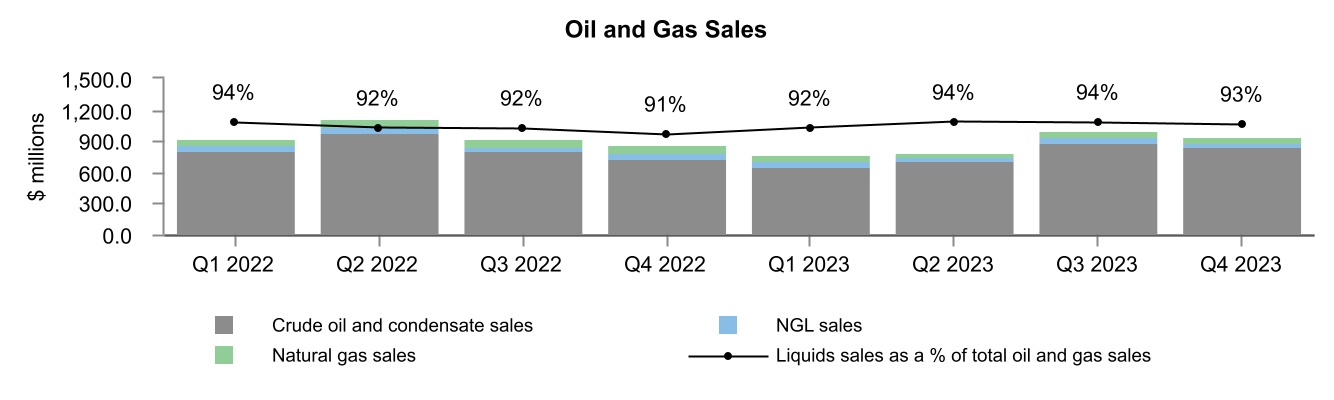
To further mitigate credit risk associated with its physical sales portfolio, Crescent Point may obtain financial assurances such as parental guarantees, prepayments, letters of credit and third party credit insurance. Including these assurances, approximately 98% of the Corporation's oil and gas sales are with entities considered investment grade.
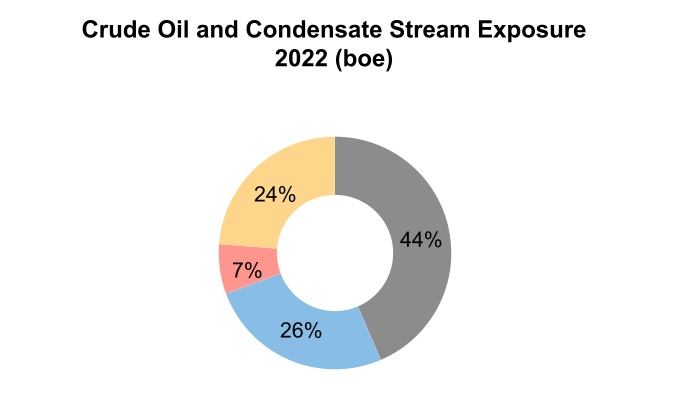
Revenue Sources
Our crude oil and natural gas volumes are sold in Alberta, Saskatchewan, British Columbia and the United States. During 2023, approximately 48% of our liquids volumes were sold in Saskatchewan, 37% in Alberta, 14% in the U.S. and less than 1% in British Columbia. Approximately 82% of our natural gas volumes were sold in Alberta, 11% in Saskatchewan, 6% in the United States and less than 1% in British Columbia.
For 2023, our commodity production mix was approximately 40% tight oil, 26% NGLs, 22% shale gas, 8% light and medium oil, 3% heavy oil and 1% conventional natural gas.
The following table summarizes our revenue sources by product before hedging and royalties:
|
|
|
|
|
|
|
|
|
|
|
|
|
|
|
|
|
|
|
|
|
| For Year Ended |
Light and Medium Crude Oil |
Heavy
Crude Oil |
Tight Oil |
NGLs(1) |
Shale Gas |
Conventional Natural Gas |
2023 |
10.5% |
2.6% |
55.9% |
24.9% |
5.8% |
0.3% |
2022 |
13.2% |
3.2% |
51.1% |
24.9% |
7.1% |
0.5% |
2021 |
15.4% |
3.4% |
55.8% |
19.6% |
5.3% |
0.5% |
Notes:
(1) Within our NGL mix, approximately 80% of our 2023 revenue came from condensate sales (2022 - 75%, 2021 - 56%).
Competition
We actively compete for reserve acquisitions, exploration leases, licenses and concessions and skilled industry personnel with a substantial number of other oil and gas companies, many of which have significantly greater financial resources than we do. Our competitors include major integrated oil and natural gas companies, numerous other independent oil and natural gas entities and individual producers and operators. Similarly, we face a competitive market when we attempt to divest of non-core assets.
Certain of our customers and potential customers are themselves exploring for crude oil and natural gas, and the results of such exploration efforts could affect our ability to sell or supply crude oil or natural gas to these customers in the future. Our ability to successfully bid on and acquire additional property rights, divest property rights, to discover reserves, to participate in drilling opportunities and to identify and enter into commercial arrangements with customers is dependent upon developing and maintaining close working relationships with our industry partners and joint operators, our ability to select and evaluate suitable properties, and our ability to consummate transactions in a highly competitive environment.
Seasonal Factors
The production of crude oil and natural gas is dependent on access to areas where development of reserves is to be conducted. Seasonal weather variations, including freeze-up and break-up, affect access in certain circumstances.
Personnel
As of December 31, 2023, the Corporation had 777 permanent employees: 394 employees at the head office in Calgary and 383 field employees.
STATEMENT OF RESERVES DATA AND OTHER OIL AND GAS INFORMATION
Disclosure of Reserves Data
In accordance with NI 51-101, the reserves data of the Corporation set forth below (the "Reserves Data") is based upon evaluations conducted by McDaniel with an effective date of December 31, 2023 (the "Crescent Point Reserve Report"). The tables below are a combined summary of our crude oil, natural gas liquids, and natural gas reserves and the net present value of future net revenue attributable to such reserves as evaluated in the Crescent Point Reserve Report based on December 31, 2023 forecast price and cost assumptions using the average of three Independent Reserve Evaluators (McDaniel, GLJ Ltd. and Sproule Associates Ltd.). McDaniel evaluated the Corporation's total Proved plus Probable reserves and total Proved plus Probable value discounted at 10% and evaluated all of the Corporation's properties to prepare the Crescent Point Reserve Report. The tables below summarize the data contained in the Crescent Point Reserve Report. Subsequent to December 31, 2023, the Company disposed of its Southern Alberta assets.
The net present value of future net revenue attributable to our reserves is stated without provision for interest costs, and general and administrative costs, but after providing for estimated royalties, production costs, capital taxes, development costs, other income, future capital expenditures, projected carbon emission costs, and well and location abandonment costs. The reserve assessments also include costs associated with wells that have not been assessed values in the reserve reports and facilities and gathering systems associated with the ongoing production for the Corporation. It should not be assumed that the undiscounted or discounted net present value of future net revenue attributable to our reserves estimated by McDaniel represent the fair market value of those reserves. Other assumptions and qualifications relating to costs, prices for future production and other matters are summarized herein. The recovery and reserve estimates of our crude oil, NGL and natural gas reserves provided herein are estimates only and there is no guarantee that the estimated reserves will be recovered. Actual reserves may be greater than or less than the estimates provided herein.
The Corporation continuously monitors and reviews legislation concerning greenhouse gas emissions and the impact on operations. Legislation adopted in 2019 has allowed Crescent Point to reduce anticipated negative financial impacts from the production of oil and gas products through the Output-Based Performance Standard ("OBPS") program in Saskatchewan and the Technology Innovation and Emission Reduction ("TIER") program in Alberta. The carbon emission costs related to government programs are fully integrated into the operating costs and capital unit costs in the reserve evaluation.
The Crescent Point Reserve Report includes the abandonment, decommissioning, and reclamation costs for both the active and inactive locations, including all non-producing and suspended wells, facilities and pipelines. The incremental liabilities from the inactive locations on the total Proved plus Probable reserves is estimated at $235 million of value discounted at 10%. The total impact in the Crescent Point Reserve Report from the combined active and inactive liabilities on total Proved plus Probable reserves is estimated at $328 million of value discounted at 10%. Subsequent to December 31, 2023, the Corporation closed a disposition of certain non-core assets in South Alberta, which carried combined active and inactive liabilities, estimated at $54 million, discounted at 10%.
The Crescent Point Reserve Report is based on certain factual data supplied by Crescent Point as well as McDaniel's opinion of reasonable practice in the industry. The extent and character of ownership and all factual data pertaining to Crescent Point's petroleum properties and contracts were supplied by the Corporation to McDaniel, and were accepted without any further investigation. McDaniel accepted this data as presented and neither title searches nor field inspections were conducted.
Reserves Data – Forecast Prices and Costs
Summary of Oil and Gas Reserves(1)
|
|
|
|
|
|
|
|
|
|
|
|
|
|
|
|
|
|
|
|
|
|
|
|
|
|
|
|
|
|
|
|
|
|
|
|
|
|
|
|
|
|
|
|
|
|
Light and Medium Crude Oil |
Heavy Crude Oil |
Tight Oil |
Natural Gas Liquids |
Shale Gas |
Conventional
Natural Gas |
Total |
| Reserves Category |
Company Gross
(Mbbls)
|
Company
Net
(Mbbls)
|
Company
Gross
(Mbbls)
|
Company
Net
(Mbbls)
|
Company
Gross
(Mbbls)
|
Company
Net
(Mbbls)
|
Company
Gross
(Mbbls)
|
Company
Net
(Mbbls)
|
Company Gross
(MMcf)
|
Company
Net
(MMcf)
|
Company Gross
(MMcf)
|
Company
Net
(MMcf)
|
Company
Gross
(Mboe)
|
Company
Net
(Mboe)
|
| Proved Developed Producing |
|
|
|
|
|
|
|
|
|
|
|
|
|
|
| Canada |
37,020 |
|
33,181 |
|
17,173 |
|
14,417 |
|
131,979 |
|
118,448 |
|
82,447 |
|
69,988 |
|
636,829 |
|
584,298 |
|
38,074 |
|
34,551 |
|
381,103 |
|
339,176 |
|
| United States |
— |
|
— |
|
— |
|
— |
|
— |
|
— |
|
— |
|
— |
|
— |
|
— |
|
— |
|
— |
|
— |
|
— |
|
| Total |
37,020 |
|
33,181 |
|
17,173 |
|
14,417 |
|
131,979 |
|
118,448 |
|
82,447 |
|
69,988 |
|
636,829 |
|
584,298 |
|
38,074 |
|
34,551 |
|
381,103 |
|
339,176 |
|
| Proved Developed Non-Producing |
|
|
|
|
|
|
|
|
|
|
|
|
|
|
| Canada |
252 |
|
244 |
|
2,260 |
|
2,089 |
|
587 |
|
539 |
|
149 |
|
134 |
|
1,603 |
|
1,510 |
|
64 |
|
54 |
|
3,527 |
|
3,267 |
|
| United States |
— |
|
— |
|
— |
|
— |
|
— |
|
— |
|
— |
|
— |
|
— |
|
— |
|
— |
|
— |
|
— |
|
— |
|
| Total |
252 |
|
244 |
|
2,260 |
|
2,089 |
|
587 |
|
539 |
|
149 |
|
134 |
|
1,603 |
|
1,510 |
|
64 |
|
54 |
|
3,527 |
|
3,267 |
|
| Proved Undeveloped |
|
|
|
|
|
|
|
|
|
|
|
|
|
|
| Canada |
9,551 |
|
8,892 |
|
1,729 |
|
1,582 |
|
106,423 |
|
91,180 |
|
107,124 |
|
90,233 |
|
949,769 |
|
860,513 |
|
3,013 |
|
2,834 |
|
383,624 |
|
335,779 |
|
| United States |
— |
|
— |
|
— |
|
— |
|
— |
|
— |
|
— |
|
— |
|
— |
|
— |
|
— |
|
— |
|
— |
|
— |
|
| Total |
9,551 |
|
8,892 |
|
1,729 |
|
1,582 |
|
106,423 |
|
91,180 |
|
107,124 |
|
90,233 |
|
949,769 |
|
860,513 |
|
3,013 |
|
2,834 |
|
383,624 |
|
335,779 |
|
| Total Proved |
|
|
|
|
|
|
|
|
|
|
|
|
|
|
| Canada |
46,823 |
|
42,318 |
|
21,163 |
|
18,088 |
|
238,989 |
|
210,168 |
|
189,720 |
|
160,355 |
|
1,588,202 |
|
1,446,322 |
|
41,151 |
|
37,440 |
|
768,254 |
|
678,222 |
|
| United States |
— |
|
— |
|
— |
|
— |
|
— |
|
— |
|
— |
|
— |
|
— |
|
— |
|
— |
|
— |
|
— |
|
— |
|
| Total |
46,823 |
|
42,318 |
|
21,163 |
|
18,088 |
|
238,989 |
|
210,168 |
|
189,720 |
|
160,355 |
|
1,588,202 |
|
1,446,322 |
|
41,151 |
|
37,440 |
|
768,254 |
|
678,222 |
|
| Total Probable |
|
|
|
|
|
|
|
|
|
|
|
|
|
|
| Canada |
33,119 |
|
29,445 |
|
6,677 |
|
5,671 |
|
142,434 |
|
119,830 |
|
93,735 |
|
73,064 |
|
917,729 |
|
805,980 |
|
24,721 |
|
22,440 |
|
433,040 |
|
366,080 |
|
| United States |
— |
|
— |
|
— |
|
— |
|
— |
|
— |
|
— |
|
— |
|
— |
|
— |
|
— |
|
— |
|
— |
|
— |
|
| Total |
33,119 |
|
29,445 |
|
6,677 |
|
5,671 |
|
142,434 |
|
119,830 |
|
93,735 |
|
73,064 |
|
917,729 |
|
805,980 |
|
24,721 |
|
22,440 |
|
433,040 |
|
366,080 |
|
| Total Proved Plus Probable |
|
|
|
|
|
|
|
|
|
|
|
|
|
|
| Canada |
79,942 |
|
71,763 |
|
27,840 |
|
23,760 |
|
381,422 |
|
329,998 |
|
283,455 |
|
233,418 |
|
2,505,931 |
|
2,252,302 |
|
65,872 |
|
59,879 |
|
1,201,294 |
|
1,044,302 |
|
| United States |
— |
|
— |
|
— |
|
— |
|
— |
|
— |
|
— |
|
— |
|
— |
|
— |
|
— |
|
— |
|
— |
|
— |
|
| Total |
79,942 |
|
71,763 |
|
27,840 |
|
23,760 |
|
381,422 |
|
329,998 |
|
283,455 |
|
233,418 |
|
2,505,931 |
|
2,252,302 |
|
65,872 |
|
59,879 |
|
1,201,294 |
|
1,044,302 |
|
Note:
(1) Numbers may not add due to rounding.
Net Present Value of Future Net Revenue of Oil and Gas Reserves(1)
|
|
|
|
|
|
|
|
|
|
|
|
|
|
|
|
|
|
|
|
|
|
|
|
|
|
|
|
|
|
|
|
|
|
|
|
|
|
|
|
|
|
|
Before Income Taxes Discounted at
(%/year) |
|
After Income Taxes Discounted at
(%/year) |
| Reserves Category |
0%
(MM$) |
5%
(MM$) |
8%
(MM$) |
10%
(MM$) |
15%
(MM$) |
20%
(MM$) |
|
0%
(MM$) |
5%
(MM$) |
8%
(MM$) |
10%
(MM$) |
15%
(MM$) |
20%
(MM$) |
| Proved Developed Producing |
|
|
|
|
|
|
|
|
|
|
|
|
|
| Canada |
10,035 |
|
8,130 |
|
7,266 |
|
6,792 |
|
5,868 |
|
5,201 |
|
|
8,195 |
|
6,719 |
|
6,035 |
|
5,659 |
|
4,928 |
|
4,401 |
|
| United States |
— |
|
— |
|
— |
|
— |
|
— |
|
— |
|
|
— |
|
— |
|
— |
|
— |
|
— |
|
— |
|
Total |
10,035 |
|
8,130 |
|
7,266 |
|
6,792 |
|
5,868 |
|
5,201 |
|
|
8,195 |
|
6,719 |
|
6,035 |
|
5,659 |
|
4,928 |
|
4,401 |
|
| Proved Developed Non-Producing |
|
|
|
|
|
|
|
|
|
|
|
|
|
| Canada |
129 |
|
88 |
|
74 |
|
66 |
|
53 |
|
44 |
|
|
114 |
|
77 |
|
64 |
|
58 |
|
46 |
|
38 |
|
| United States |
— |
|
— |
|
— |
|
— |
|
— |
|
— |
|
|
— |
|
— |
|
— |
|
— |
|
— |
|
— |
|
Total |
129 |
|
88 |
|
74 |
|
66 |
|
53 |
|
44 |
|
|
114 |
|
77 |
|
64 |
|
58 |
|
46 |
|
38 |
|
| Proved Undeveloped |
|
|
|
|
|
|
|
|
|
|
|
|
|
| Canada |
7,889 |
|
5,490 |
|
4,490 |
|
3,950 |
|
2,913 |
|
2,185 |
|
|
7,193 |
|
5,045 |
|
4,145 |
|
3,657 |
|
2,721 |
|
2,062 |
|
| United States |
— |
|
— |
|
— |
|
— |
|
— |
|
— |
|
|
— |
|
— |
|
— |
|
— |
|
— |
|
— |
|
Total |
7,889 |
|
5,490 |
|
4,490 |
|
3,950 |
|
2,913 |
|
2,185 |
|
|
7,193 |
|
5,045 |
|
4,145 |
|
3,657 |
|
2,721 |
|
2,062 |
|
| Total Proved |
|
|
|
|
|
|
|
|
|
|
|
|
|
| Canada |
18,053 |
|
13,709 |
|
11,830 |
|
10,808 |
|
8,834 |
|
7,430 |
|
|
15,503 |
|
11,841 |
|
10,244 |
|
9,374 |
|
7,695 |
|
6,501 |
|
| United States |
— |
|
— |
|
— |
|
— |
|
— |
|
— |
|
|
— |
|
— |
|
— |
|
— |
|
— |
|
— |
|
Total |
18,053 |
|
13,709 |
|
11,830 |
|
10,808 |
|
8,834 |
|
7,430 |
|
|
15,503 |
|
11,841 |
|
10,244 |
|
9,374 |
|
7,695 |
|
6,501 |
|
| Total Probable |
|
|
|
|
|
|
|
|
|
|
|
|
|
| Canada |
13,413 |
|
7,925 |
|
6,103 |
|
5,216 |
|
3,693 |
|
2,755 |
|
|
10,265 |
|
5,964 |
|
4,552 |
|
3,868 |
|
2,703 |
|
1,992 |
|
| United States |
— |
|
— |
|
— |
|
— |
|
— |
|
— |
|
|
— |
|
— |
|
— |
|
— |
|
— |
|
— |
|
Total |
13,413 |
|
7,925 |
|
6,103 |
|
5,216 |
|
3,693 |
|
2,755 |
|
|
10,265 |
|
5,964 |
|
4,552 |
|
3,868 |
|
2,703 |
|
1,992 |
|
| Total Proved Plus Probable |
|
|
|
|
|
|
|
|
|
|
|
|
|
| Canada |
31,466 |
|
21,634 |
|
17,933 |
|
16,024 |
|
12,527 |
|
10,185 |
|
|
25,768 |
|
17,805 |
|
14,795 |
|
13,242 |
|
10,397 |
|
8,493 |
|
| United States |
— |
|
— |
|
— |
|
— |
|
— |
|
— |
|
|
— |
|
— |
|
— |
|
— |
|
— |
|
— |
|
Total |
31,466 |
|
21,634 |
|
17,933 |
|
16,024 |
|
12,527 |
|
10,185 |
|
|
25,768 |
|
17,805 |
|
14,795 |
|
13,242 |
|
10,397 |
|
8,493 |
|
Note:
(1) Numbers may not add due to rounding.
Additional Information Concerning Future Net Revenue – (Undiscounted)(1)
|
|
|
|
|
|
|
|
|
|
|
|
|
|
|
|
|
|
|
|
|
|
|
|
|
|
|
| Reserves Category |
Revenue
(MM$) |
Royalties & Burdens(2)
(MM$)
|
Operating
Costs
(MM$) |
Development
Costs
(MM$) |
Abandonment and Reclamation
Costs(3)
(MM$)
|
Future Net
Revenue Before
Income Taxes
(MM$) |
Income Tax
(MM$) |
Future Net
Revenue After
Income Taxes
(MM$) |
| Proved |
|
|
|
|
|
|
|
|
| Canada |
50,928 |
|
6,700 |
|
18,098 |
|
6,356 |
|
1,721 |
|
18,053 |
|
2,551 |
|
15,503 |
|
| United States |
— |
|
— |
|
— |
|
— |
|
— |
|
— |
|
— |
|
— |
|
| Total |
50,928 |
|
6,700 |
|
18,098 |
|
6,356 |
|
1,721 |
|
18,053 |
|
2,551 |
|
15,503 |
|
| Proved Plus Probable |
|
|
|
|
|
|
|
|
| Canada |
82,849 |
|
12,059 |
|
27,739 |
|
9,665 |
|
1,921 |
|
31,466 |
|
5,698 |
|
25,768 |
|
| United States |
— |
|
— |
|
— |
|
— |
|
— |
|
— |
|
— |
|
— |
|
| Total |
82,849 |
|
12,059 |
|
27,739 |
|
9,665 |
|
1,921 |
|
31,466 |
|
5,698 |
|
25,768 |
|
|
|
|
|
|
|
|
|
|
Notes:
(1) Numbers may not add due to rounding.
(2) Saskatchewan Capital Resource Surcharge has been included under the royalties and burdens column.
(3) In accordance with the Canadian Oil and Gas Evaluation Handbook, abandonment and reclamation costs include: (i) entities with associated reserves included in the Crescent Point Reserve Report, the undiscounted abandonment and reclamation costs associated with these amounts are $931 million and $1.13 billion for Proved and Proved plus Probable, respectively; and (ii) non-reserve entities that include wells with no reserves assigned, suspended wells, pipeline, and facilities, the undiscounted abandonment and reclamation costs associated with these are estimated at $789 million.
Future Net Revenue by Production Type(1)
|
|
|
|
|
|
|
|
|
|
|
|
|
|
|
|
Future Net Revenue
Before Income Taxes(2)
(Discounted at 10% per year)
|
Percentage |
Unit Value |
|
(MM$) |
(%) |
($/boe) |
($/Mcfe) |
| Proved |
|
|
|
|
| CANADA |
|
|
|
|
Light and Medium Crude Oil(3) |
911 |
|
8.4 |
|
18.44 |
|
3.07 |
|
Heavy Crude Oil(3) |
351 |
|
3.2 |
|
19.29 |
|
3.21 |
|
Tight Oil(5) |
6,276 |
|
58.1 |
|
14.74 |
|
2.46 |
|
Shale Gas(6) |
3,227 |
|
29.9 |
|
18.01 |
|
3.00 |
|
Conventional Natural Gas(4) |
44 |
|
0.4 |
|
7.54 |
|
1.26 |
|
| Total Canada |
10,808 |
|
100 |
|
15.94 |
|
2.66 |
|
| UNITED STATES |
|
|
|
|
Light and Medium Crude Oil(3) |
— |
|
— |
|
— |
|
— |
|
Heavy Crude Oil(3) |
— |
|
— |
|
— |
|
— |
|
Tight Oil(5) |
— |
|
— |
|
— |
|
— |
|
Shale Gas(4)(6) |
— |
|
— |
|
— |
|
— |
|
Conventional Natural Gas(4) |
— |
|
— |
|
— |
|
— |
|
| Total United States |
— |
|
— |
|
— |
|
— |
|
| TOTAL |
|
|
|
|
Light and Medium Crude Oil(3) |
911 |
|
8.4 |
|
18.44 |
|
3.07 |
|
Heavy Crude Oil(3) |
351 |
|
3.2 |
|
19.29 |
|
3.21 |
|
Tight Oil(5) |
6,276 |
|
58.1 |
|
14.74 |
|
2.46 |
|
Shale Gas(4)(6) |
3,227 |
|
29.9 |
|
18.01 |
|
3.00 |
|
Conventional Natural Gas(4) |
44 |
|
0.4 |
|
7.54 |
|
1.26 |
|
| Total Proved |
10,808 |
|
100 |
|
15.94 |
|
2.66 |
|
Notes:
(1) Numbers may not add due to rounding.
(2) Other company revenue and costs not related to a specific production type have been allocated proportionately to production types. Unit values are based on Company Net Reserves.
(3) Including solution gas and other by-products.
(4) Including by-products, but excluding solution gas.
(5) Including solution gas (categorized as "Shale Gas") and other by-products.
(6) Shale Gas includes the majority of Natural Gas Liquids.
|
|
|
|
|
|
|
|
|
|
|
|
|
|
|
|
Future Net Revenue
Before Income Taxes(2)
(Discounted at 10% per year)
|
Percentage |
Unit Value |
|
(MM$) |
(%) |
($/boe) |
($/Mcfe) |
| Proved Plus Probable |
|
|
|
|
| CANADA |
|
|
|
|
Light and Medium Crude Oil(3) |
1,474 |
|
9.2 |
|
17.02 |
|
2.84 |
|
Heavy Crude Oil(3) |
438 |
|
2.7 |
|
18.32 |
|
3.05 |
|
Tight Oil(5) |
9,661 |
|
60.3 |
|
14.67 |
|
2.44 |
|
Shale Gas(6) |
4,400 |
|
27.5 |
|
16.44 |
|
2.74 |
|
Conventional Natural Gas(4) |
51 |
|
0.3 |
|
6.99 |
|
1.16 |
|
| Total Canada |
16,024 |
|
100 |
|
15.34 |
|
2.56 |
|
| UNITED STATES |
|
|
|
|
Light and Medium Crude Oil(3) |
— |
|
— |
|
— |
|
— |
|
Heavy Crude Oil(3) |
— |
|
— |
|
— |
|
— |
|
Tight Oil(5) |
— |
|
— |
|
— |
|
— |
|
Shale Gas(4)(6) |
— |
|
— |
|
— |
|
— |
|
Conventional Natural Gas(4) |
— |
|
— |
|
— |
|
— |
|
| Total United States |
— |
|
— |
|
— |
|
— |
|
| TOTAL |
|
|
|
|
Light and Medium Crude Oil(3) |
1,474 |
|
9.2 |
|
17.02 |
|
2.84 |
|
Heavy Crude Oil(3) |
438 |
|
2.7 |
|
18.32 |
|
3.05 |
|
Tight Oil(5) |
9,661 |
|
60.3 |
|
14.67 |
|
2.44 |
|
Shale Gas(4)(6) |
4,400 |
|
27.5 |
|
16.44 |
|
2.74 |
|
Conventional Natural Gas(4) |
51 |
|
0.3 |
|
6.99 |
|
1.16 |
|
| Total Proved Plus Probable |
16,024 |
|
100 |
|
15.34 |
|
2.56 |
|
Notes:
(1) Numbers may not add due to rounding.
(2) Other company revenue and costs not related to a specific production type have been allocated proportionately to production types. Unit values are based on Company Net Reserves.
(3) Including solution gas and other by-products.
(4) Including by-products, but excluding solution gas.
(5) Including solution gas (categorized as "Shale Gas") and other by-products.
(6) Shale Gas includes the majority of Natural Gas Liquids.
Notes and Definitions
In the tables set forth above in "Disclosure of Reserves Data" and elsewhere in this AIF, the following notes and other definitions are applicable.
Reserve Categories
The determination of oil and gas reserves involves the preparation of estimates that have an inherent degree of associated uncertainty. Categories of Proved and Probable reserves have been established in accordance with NI 51-101 to reflect the level of these uncertainties and to provide an indication of the probability of recovery.
The estimation and classification of reserves requires the application of professional judgment combined with geological and engineering knowledge to assess whether or not specific reserves classification criteria have been satisfied. Knowledge of concepts including uncertainty and risk, probability and statistics, and deterministic and probabilistic estimation methods is required to properly use and apply reserves definitions.
(a) "Reserves" are estimated remaining economic quantities of oil and natural gas and related substances anticipated to be recoverable from known accumulations, as of a given date, based on (a) analysis of drilling, geological, geophysical, and engineering data; (b) the use of established technology; and (c) specified economic conditions, which are generally accepted as being reasonable and shall be disclosed. Reserves are classified according to the degree of certainty associated with the estimates.
(b) "Proved" reserves are those reserves that can be estimated with a high degree of certainty to be recoverable. It is likely that the actual remaining quantities recovered will exceed the estimated proved reserves.
(c) "Developed Producing" reserves are those reserves that are expected to be recovered from completion intervals open at the time of the estimate. These reserves may be currently producing or, if shut-in, they must have previously been on production, and the date of resumption of production must be known with reasonable certainty.
(d) "Developed Non-Producing" reserves are those reserves that either have not been on production, or have previously been on production, but are shut-in, and the date of resumption of production is unknown.
(e) "Undeveloped" reserves are those reserves expected to be recovered from known accumulations where a significant expenditure (e.g., when compared to the cost of drilling a well) is required to render them capable of production. They must fully meet the requirements of the reserves category (proved, probable, possible) to which they are assigned. In multi-well pools, it may be appropriate to allocate total pool reserves between the developed and undeveloped categories or to sub-divide the developed reserves for the pool between developed producing and developed non-producing. This allocation should be based on the estimator's assessment as to the reserves that will be recovered from specific wells, facilities and completion intervals in the pool and their respective development and production status.
(f) "Probable" reserves are those additional reserves that are less certain to be recovered than Proved reserves. It is equally likely that the actual remaining quantities recovered will be greater or less than the sum of the estimated Proved plus Probable reserves.
Levels of Certainty for Reported Reserves
The qualitative certainty levels referred to in the definitions above are applicable to individual reserve entities (which refers to the lowest level at which reserves calculations are performed) and to reported reserves (which refers to the highest level sum of individual entity estimates for which reserves are presented). Reported reserves should target the following levels of certainty under a specific set of economic conditions:
•at least a 90% probability that the quantities actually recovered will equal or exceed the estimated Proved reserves; and
•at least a 50% probability that the quantities actually recovered will equal or exceed the sum of the estimated Proved plus Probable reserves.
A quantitative measure of the certainty levels pertaining to estimates prepared for the various reserves categories is desirable to provide a clearer understanding of the associated risks and uncertainties. However, the majority of reserves estimates will be prepared using deterministic methods that do not provide a mathematically derived quantitative measure of probability. In principle, there should be no difference between estimates prepared using probabilistic or deterministic methods.
Additional Definitions
The following terms, used in the preparation of the Crescent Point Reserve Report and this AIF, have the following meanings:
(a) "associated gas" means the gas cap overlying a crude oil accumulation in a reservoir.
(b) "crude oil" or "oil" means a mixture that consists mainly of pentanes and heavier hydrocarbons, which may contain small amounts of sulphur and other non-hydrocarbons, that exists in the liquid phase in reservoirs and remains liquid at atmospheric pressure and temperature. It does not include liquids obtained from the processing of natural gas.
(c) "development costs" means costs incurred to obtain access to reserves and to provide facilities for extracting, treating, gathering and storing the oil and gas from the reserves. More specifically, development costs, including applicable operating costs of support equipment and facilities and other costs of development activities, are costs incurred to:
(i) gain access to and prepare well locations for drilling, including surveying well locations for the purpose of determining specific development drilling sites, clearing ground, draining, road building, and relocating public roads, gas lines and power lines, to the extent necessary in developing the reserves;
(ii) drill and equip development wells, development type stratigraphic test wells and service wells, including the costs of platforms and of well equipment such as casing, tubing, pumping equipment and the wellhead assembly;
(iii) acquire, construct and install production facilities such as flow lines, separators, treaters, heaters, manifolds measuring devices and production storage, natural gas cycling and processing plants, and central utility and waste disposal system; and
(iv) provide improved recovery systems.
(d) "development well" means a well drilled inside the established limits of an oil or gas reservoir, or in close proximity to the edge of the reservoir, to the depth of a stratigraphic horizon known to be productive.
(e) "exploration costs" means costs incurred in identifying areas that may warrant examination and in examining specific areas that are considered to have prospects that may contain oil and gas reserves, including costs of drilling exploratory wells and exploratory type stratigraphic test wells. Exploration costs may be incurred both before acquiring the related property (sometimes referred to in part as "prospecting costs") and after acquiring the property. Exploration costs, which include applicable operating costs of support equipment and facilities and other costs of exploration activities, are:
(i) costs of topographical, geochemical, geological and geophysical studies, rights of access to properties to conduct those studies, and salaries and other expenses of geologists, geophysical crews and others conducting those studies (collectively sometimes referred to as "geological and geophysical costs");
(ii) costs of carrying and retaining unproved properties, such as delay rentals, taxes (other than income and capital taxes) on properties, legal costs for title defense, and the maintenance of land and lease records;
(iii) dry hole contributions and bottom hole contributions;
(iv) costs of drilling and equipping exploratory wells; and
(v) costs of drilling exploratory type stratigraphic test wells.
(f) "exploratory well" means a well that is not a development well, a service well or a development type stratigraphic test well.
(g) "field" means an area consisting of a single reservoir or multiple reservoirs all grouped on or related to the same individual geological structural feature and/or stratigraphic condition. There may be two or more reservoirs in a field that are separated vertically by intervening impervious strata or laterally by local geologic barriers, or both. Reservoirs that are associated by being in overlapping or adjacent fields may be treated as a single or common operational field. The geological terms "structural feature" and "stratigraphic condition" are intended to denote localized geological features, in contrast to broader terms such as "basin", "trend", "province", "play" or "area of interest".
(h) "future prices and costs" means future prices and costs that are:
(i) generally accepted as being a reasonable outlook of the future; and
(ii) if, and only to the extent that, there are fixed or presently determinable future prices or costs to which the Corporation is legally bound by a contractual or other obligation to supply a physical product, including those for an extension period of a contract that is likely to be extended, those prices or costs rather than the prices and costs referred to in paragraph (i).
(i) "future income tax expenses" means future income tax expenses estimated (generally, year-by-year):
(i) making appropriate allocations of estimated unclaimed costs and losses carried forward for tax purposes, between oil and gas activities and other business activities;
(ii) without deducting estimated future costs that are not deductible in computing taxable income;
(iii) taking into account estimated tax credits and allowances (for example, royalty tax credits); and
(iv) applying to the future pre-tax net cash flows relating to the Corporation's oil and gas activities the appropriate year end statutory tax rates, taking into account future tax rates already legislated.
(j) "future net revenue" means the estimated net amount to be received with respect to the anticipated development and production of reserves (including synthetic oil, coal bed methane and other non-conventional reserves) estimated using future prices and costs.
(k) "gross" means:
(i) in relation to the Corporation's interest in production or reserves, its "company gross reserves", which are its working interest (operated or non-operated) share before deduction of royalties and without including any royalty interests of the Corporation;
(ii) in relation to wells, the total number of wells in which the Corporation has an interest; and
(iii) in relation to properties, the total area of properties in which the Corporation has an interest.
(l) "natural gas" means a naturally occurring mixture of hydrocarbon gases and other gases.
(m) "natural gas liquids" means those hydrocarbon components that can be recovered from natural gas as liquids including, but not limited to, ethane, propane, butanes, pentanes plus, condensate and small quantities of non-hydrocarbons.
(n) "net" means:
(i) in relation to the Corporation's interest in production or reserves, its working interest (operated or non-operated) share after deduction of royalty obligations, plus its royalty interests in production or reserves;
(ii) in relation to the Corporation's interest in wells, the number of wells obtained by aggregating the Corporation's working interest in each of its gross wells; and
(iii) in relation to the Corporation's interest in a property, the total area in which the Corporation has an interest multiplied by the working interest owned by the Corporation.
(o) "non-associated gas" means an accumulation of natural gas in a reservoir where there is no crude oil.
(p) "operating costs" or "production costs" means costs incurred to operate and maintain wells and related equipment and facilities, including applicable operating costs of support equipment and facilities as well as other costs of operating and maintaining those wells and related equipment and facilities.
(q) "production" means recovering, gathering, treating, field or plant processing (for example, processing gas to extract natural gas liquids) and field storage of oil and gas.
(r) "property" includes:
(i) fee ownership or a lease, concession, agreement, permit, license or other interest representing the right to extract oil or gas subject to such terms as may be imposed by the conveyance of that interest;
(ii) royalty interests, production payments payable in oil or gas, and other non-operated interests in properties operated by others; and
(iii) an agreement with a foreign government or authority under which the Corporation participates in the operation of properties or otherwise serves as "producer" of the underlying reserves (in contrast to being an independent purchaser, broker, dealer or importer).
A property does not include supply agreements, or contracts that represent a right to purchase, rather than extract, oil or gas.
(s) "property acquisition costs" means costs incurred to acquire a property (directly by purchase or lease, or indirectly by acquiring another corporate entity with an interest in the property), including:
(i) costs of lease bonuses and options to purchase or lease a property;
(ii) the portion of the costs applicable to hydrocarbons when land including rights to hydrocarbons is purchased in fee; and
(iii) brokers' fees, recording and registration fees, legal costs and other costs incurred in acquiring properties.
(t) "proved property" means a property or part of a property to which reserves have been specifically attributed.
(u) "reservoir" means a subsurface rock unit that contains an accumulation of petroleum.
(v) "service well" means a well drilled or completed for the purpose of supporting production in an existing field. Wells in this class are drilled for the following specific purposes: gas injection (natural gas, propane, butane or flue gas), water injection, steam injection, air injection, salt-water disposal, water supply for injection, observation, or injection for combustion.
(w) "solution gas" means natural gas dissolved in crude oil.
(x) "stratigraphic test well" means a drilling effort, geologically directed, to obtain information pertaining to a specific geologic condition. Ordinarily, such wells are drilled without the intention of being completed for hydrocarbon production. They include wells for the purpose of core tests and all types of expendable holes related to hydrocarbon exploration. Stratigraphic test wells are classified as (i) "exploratory type" if not drilled into a proved property; or (ii) "development type", if drilled into a proved property. Development type stratigraphic wells are also referred to as "evaluation wells".
(y) "support equipment and facilities" means equipment and facilities used in oil and gas activities, including seismic equipment, drilling equipment, construction and grading equipment, vehicles, repair shops, warehouses, supply points, camps, and division, district or field offices.
(z) "unproved property" means a property or part of a property to which no reserves have been specifically attributed.
(aa) "well abandonment and reclamation costs" means costs of abandoning a well (net of salvage value) and of disconnecting the well from the surface gathering system and remediating and reclaiming the site to original conditions. They do not include costs of abandoning the gathering system.
Pricing Assumptions – Forecast Prices and Costs
The average of the three independent reserve evaluator price decks (McDaniel, GLJ Ltd. and Sproule Associates Ltd.) resulted in the following pricing, exchange rate and inflation rate assumptions as of December 31, 2023 in estimating our reserves data using forecast prices and costs.
|
|
|
|
|
|
|
|
|
|
|
|
|
|
|
|
|
|
|
|
|
|
|
|
|
|
|
|
|
|
|
|
|
| Year |
Crude Oil |
Conventional Natural Gas |
NGLs |
|
|
|
|
WTI at
Cushing
Oklahoma
($US/bbl)
|
Edmonton
($Cdn/bbl)
|
Henry Hub
NYMEX
($US/MMBTU)
|
AECO/NIT
Spot
($Cdn/MMBTU)
|
Pentane
Plus
Edmonton
($Cdn/bbl)
|
Butane
Edmonton
($Cdn/bbl)
|
Propane
Edmonton
($Cdn/bbl)
|
Operating Cost Inflation Rate
(%/yr)
|
Capital Cost Inflation Rate
(%/yr)
|
Exchange
Rate
($US/$Cdn)
|
| Forecast |
|
|
|
|
|
|
|
|
|
|
| 2024 |
73.67 |
|
92.91 |
|
2.75 |
|
2.20 |
96.79 |
|
47.69 |
|
29.65 |
|
0.00% |
0.00% |
0.752 |
| 2025 |
74.98 |
95.04 |
3.64 |
3.37 |
98.75 |
48.83 |
35.13 |
2.00% |
2.00% |
0.752 |
| 2026 |
76.14 |
|
96.07 |
|
4.02 |
|
4.05 |
|
100.71 |
|
49.36 |
|
35.43 |
|
2.00% |
2.00% |
0.755 |
| 2027 |
77.66 |
97.99 |
4.10 |
4.13 |
102.72 |
50.35 |
36.14 |
2.00% |
2.00% |
0.755 |
| 2028 |
79.22 |
|
99.95 |
|
4.18 |
|
4.21 |
|
104.78 |
|
51.35 |
|
36.86 |
|
2.00% |
2.00% |
0.755 |
| 2029 |
80.80 |
101.94 |
4.27 |
4.30 |
106.87 |
52.38 |
37.60 |
2.00% |
2.00% |
0.755 |
| 2030 |
82.42 |
|
103.98 |
|
4.35 |
|
4.38 |
|
109.01 |
|
53.43 |
|
38.35 |
|
2.00% |
2.00% |
0.755 |
| 2031 |
84.06 |
106.06 |
4.44 |
4.47 |
111.19 |
54.50 |
39.12 |
2.00% |
2.00% |
0.755 |
| 2032 |
85.74 |
|
108.18 |
|
4.53 |
|
4.56 |
|
113.41 |
|
55.58 |
|
39.90 |
2.00% |
2.00% |
0.755 |
| 2033 |
87.46 |
110.35 |
4.62 |
4.65 |
115.67 |
56.70 |
40.70 |
2.00% |
2.00% |
0.755 |
| 2034 |
89.21 |
|
112.56 |
|
4.71 |
|
4.74 |
|
117.98 |
|
57.83 |
|
41.51 |
|
2.00% |
2.00% |
0.755 |
| 2035+ |
+2%/yr |
+2%/yr |
+2%/yr |
+2%/yr |
+2%/yr |
+2%/yr |
+2%/yr |
2.00% |
2.00% |
0.755 |
Reconciliations of Changes in Reserves(1)
The following table sets forth a reconciliation of the Corporation's working interest reserves by total Proved, total Probable and total Proved plus Probable reserves as at December 31, 2023, against such reserves as at December 31, 2022, based on forecast price and cost assumptions.
|
|
|
|
|
|
|
|
|
|
|
|
|
|
|
|
|
|
|
|
|
|
|
|
|
|
|
|
|
|
|
|
|
|
|
|
|
|
|
| CANADA |
Light and Medium Crude Oil (Mbbls) |
Heavy Crude Oil
(Mbbls)
|
Tight Oil
(Mbbls)
|
Natural Gas Liquids
(Mbbls)
|
| Factors |
Proved |
Probable |
Proved
+
Probable |
Proved |
Probable |
Proved
+
Probable |
Proved |
Probable |
Proved
+
Probable |
Proved |
Probable |
Proved
+
Probable |
| December 31, 2022 |
49,197 |
|
36,550 |
|
85,747 |
|
23,039 |
|
7,230 |
|
30,268 |
|
138,419 |
|
75,590 |
|
214,009 |
|
135,264 |
|
44,562 |
|
179,827 |
|
| Discoveries |
— |
|
— |
|
— |
|
— |
|
— |
|
— |
|
— |
|
— |
|
— |
|
— |
|
— |
|
— |
|
Extensions and Improved Recovery (2) |
388 |
|
(149) |
|
239 |
|
— |
|
— |
|
— |
|
4,922 |
|
(228) |
|
4,694 |
|
17,384 |
|
29,323 |
|
46,707 |
|
Technical Revisions (3) |
1,643 |
|
(3,370) |
|
(1,727) |
|
(675) |
|
(580) |
|
(1,255) |
|
2,183 |
|
(4,415) |
|
(2,232) |
|
(4,919) |
|
(5,213) |
|
(10,132) |
|
Acquisitions (4) |
126 |
|
22 |
|
148 |
|
— |
|
— |
|
— |
|
111,332 |
|
74,357 |
|
185,689 |
|
55,257 |
|
25,209 |
|
80,466 |
|
Dispositions (5) |
(376) |
|
(190) |
|
(565) |
|
— |
|
— |
|
— |
|
(859) |
|
(3,102) |
|
(3,961) |
|
(120) |
|
(300) |
|
(420) |
|
Economic Factors (6) |
468 |
|
255 |
|
723 |
|
193 |
|
27 |
|
220 |
|
1,161 |
|
232 |
|
1,393 |
|
305 |
|
153 |
|
458 |
|
Production (7) |
(4,623) |
|
— |
|
(4,623) |
|
(1,394) |
|
— |
|
(1,394) |
|
(18,169) |
|
— |
|
(18,169) |
|
(13,451) |
|
— |
|
(13,451) |
|
| December 31, 2023 |
46,823 |
|
33,119 |
|
79,942 |
|
21,163 |
|
6,677 |
|
27,840 |
|
238,989 |
|
142,434 |
|
381,422 |
|
189,720 |
|
93,735 |
|
283,455 |
|
|
|
|
|
|
|
|
|
|
|
|
|
|
|
|
|
|
|
|
|
|
|
|
|
|
|
|
|
|
|
| CANADA |
Shale Gas
(Natural Gas) (MMcf) |
Conventional Natural Gas
(Natural Gas) (MMcf) |
Total BOE
(Mboe)
|
| Factors |
Proved |
Probable |
Proved
+
Probable |
Proved |
Probable |
Proved
+
Probable |
Proved |
Probable |
Proved
+
Probable |
| December 31, 2022 |
486,076 |
|
149,035 |
|
635,111 |
|
39,279 |
|
23,599 |
|
62,877 |
|
433,478 |
|
192,705 |
|
626,182 |
|
| Discoveries |
— |
|
— |
|
— |
|
— |
|
— |
|
— |
|
— |
|
— |
|
— |
|
Extensions and Improved Recovery (2) |
78,189 |
|
197,826 |
|
276,015 |
|
158 |
|
(157) |
|
— |
|
35,751 |
|
61,891 |
|
97,643 |
|
Technical Revisions (3) |
15,063 |
|
(5,454) |
|
9,609 |
|
4,034 |
|
58 |
|
4,092 |
|
1,415 |
|
(14,477) |
|
(13,062) |
|
Acquisitions (4) |
1,082,973 |
|
581,238 |
|
1,664,211 |
|
2,684 |
|
927 |
|
3,610 |
|
347,657 |
|
196,616 |
|
544,273 |
|
Dispositions (5) |
(2,077) |
|
(5,247) |
|
(7,324) |
|
(176) |
|
(38) |
|
(215) |
|
(1,730) |
|
(4,473) |
|
(6,203) |
|
Economic Factors (6) |
1,165 |
|
331 |
|
1,497 |
|
(899) |
|
333 |
|
(566) |
|
2,172 |
|
778 |
|
2,949 |
|
Production (7) |
(73,188) |
|
— |
|
(73,188) |
|
(3,928) |
|
— |
|
(3,928) |
|
(50,489) |
|
— |
|
(50,489) |
|
| December 31, 2023 |
1,588,202 |
|
917,729 |
|
2,505,931 |
|
41,151 |
|
24,721 |
|
65,872 |
|
768,254 |
|
433,040 |
|
1,201,294 |
|
|
|
|
|
|
|
|
|
|
|
|
|
|
|
|
|
|
|
|
|
|
|
|
|
|
|
|
|
|
|
|
|
|
|
|
|
|
|
|
| UNITED STATES |
Light and Medium Crude Oil (Mbbls) |
Heavy Crude Oil
(Mbbls)
|
Tight Oil
(Mbbls)
|
Natural Gas Liquids
(Mbbls)
|
| Factors |
Proved |
Probable |
Proved
+
Probable |
Proved |
Probable |
Proved
+
Probable |
Proved |
Probable |
Proved
+
Probable |
Proved |
Probable |
Proved
+
Probable |
| December 31, 2022 |
— |
|
— |
|
— |
|
— |
|
— |
|
— |
|
31,238 |
|
25,788 |
|
57,026 |
|
11,218 |
|
8,330 |
|
19,548 |
|
| Discoveries |
— |
|
— |
|
— |
|
— |
|
— |
|
— |
|
— |
|
— |
|
— |
|
— |
|
— |
|
— |
|
| Extensions and Improved Recovery |
— |
|
— |
|
— |
|
— |
|
— |
|
— |
|
2,060 |
|
(1,289) |
|
772 |
|
634 |
|
(373) |
|
261 |
|
Technical Revisions (3) |
— |
|
— |
|
— |
|
— |
|
— |
|
— |
|
— |
|
— |
|
— |
|
— |
|
— |
|
— |
|
| Acquisitions |
— |
|
— |
|
— |
|
— |
|
— |
|
— |
|
— |
|
— |
|
— |
|
— |
|
— |
|
— |
|
| Dispositions |
— |
|
— |
|
— |
|
— |
|
— |
|
— |
|
(28,142) |
|
(24,499) |
|
(52,641) |
|
(10,142) |
|
(7,957) |
|
(18,099) |
|
Economic Factors (6) |
— |
|
— |
|
— |
|
— |
|
— |
|
— |
|
— |
|
— |
|
— |
|
— |
|
— |
|
— |
|
Production (7) |
— |
|
— |
|
— |
|
— |
|
— |
|
— |
|
(5,156) |
|
— |
|
(5,156) |
|
(1,709) |
|
— |
|
(1,709) |
|
| December 31, 2023 |
— |
|
— |
|
— |
|
— |
|
— |
|
— |
|
— |
|
— |
|
— |
|
— |
|
— |
|
— |
|
|
|
|
|
|
|
|
|
|
|
|
|
|
|
|
|
|
|
|
|
|
|
|
|
|
|
|
|
|
|
| UNITED STATES |
Shale Gas
(Natural Gas) (MMcf) |
Conventional Natural Gas
(Natural Gas) (MMcf) |
Total BOE
(Mboe)
|
| Factors |
Proved |
Probable |
Proved
+
Probable |
Proved |
Probable |
Proved
+
Probable |
Proved |
Probable |
Proved
+
Probable |
| December 31, 2022 |
35,611 |
|
26,445 |
|
62,056 |
|
— |
|
— |
|
— |
|
48,391 |
|
38,525 |
|
86,916 |
|
| Discoveries |
— |
|
— |
|
— |
|
— |
|
— |
|
— |
|
— |
|
— |
|
— |
|
| Extensions and Improved Recovery |
1,810 |
|
(1,065) |
|
746 |
|
— |
|
— |
|
— |
|
2,996 |
|
(1,839) |
|
1,157 |
|
Technical Revisions (3) |
— |
|
— |
|
— |
|
— |
|
— |
|
— |
|
— |
|
— |
|
— |
|
| Acquisitions |
— |
|
— |
|
— |
|
— |
|
— |
|
— |
|
— |
|
— |
|
— |
|
| Dispositions |
(32,439) |
|
(25,380) |
|
(57,819) |
|
— |
|
— |
|
— |
|
(43,690) |
|
(36,686) |
|
(80,377) |
|
Economic Factors (6) |
— |
|
— |
|
— |
|
— |
|
— |
|
— |
|
— |
|
— |
|
— |
|
Production (7) |
(4,983) |
|
— |
|
(4,983) |
|
|
|
|
(7,696) |
|
— |
|
(7,696) |
|
| December 31, 2023 |
— |
|
— |
|
— |
|
— |
|
— |
|
— |
|
— |
|
— |
|
— |
|
|
|
|
|
|
|
|
|
|
|
|
|
|
|
|
|
|
|
|
|
|
|
|
|
|
|
|
|
|
|
|
|
|
|
|
|
|
|
|
| TOTAL |
Light and Medium Crude Oil (Mbbls) |
Heavy Crude Oil
(Mbbls)
|
Tight Oil
(Mbbls)
|
Natural Gas Liquids
(Mbbls)
|
| Factors |
Proved |
Probable |
Proved
+
Probable |
Proved |
Probable |
Proved
+
Probable |
Proved |
Probable |
Proved
+
Probable |
Proved |
Probable |
Proved
+
Probable |
| December 31, 2022 |
49,197 |
|
36,550 |
|
85,747 |
|
23,039 |
|
7,230 |
|
30,268 |
|
169,657 |
|
101,378 |
|
271,034 |
|
146,482 |
|
52,892 |
|
199,374 |
|
| Discoveries |
— |
|
— |
|
— |
|
— |
|
— |
|
— |
|
— |
|
— |
|
— |
|
— |
|
— |
|
— |
|
Extensions and Improved Recovery (2) |
388 |
|
(149) |
|
239 |
|
— |
|
— |
|
— |
|
6,982 |
|
(1,517) |
|
5,465 |
|
18,017 |
|
28,950 |
|
46,968 |
|
Technical Revisions (3) |
1,643 |
|
(3,370) |
|
(1,727) |
|
(675) |
|
(580) |
|
(1,255) |
|
2,183 |
|
(4,415) |
|
(2,232) |
|
(4,919) |
|
(5,213) |
|
(10,132) |
|
Acquisitions (4) |
126 |
|
22 |
|
148 |
|
— |
|
— |
|
— |
|
111,332 |
|
74,357 |
|
185,689 |
|
55,257 |
|
25,209 |
|
80,466 |
|
Dispositions (5) |
(376) |
|
(190) |
|
(565) |
|
— |
|
— |
|
— |
|
(29,001) |
|
(27,601) |
|
(56,602) |
|
(10,262) |
|
(8,257) |
|
(18,519) |
|
Economic Factors (6) |
468 |
|
255 |
|
723 |
|
193 |
|
27 |
|
220 |
|
1,161 |
|
232 |
|
1,393 |
|
305 |
|
153 |
|
458 |
|
Production (7) |
(4,623) |
|
— |
|
(4,623) |
|
(1,394) |
|
— |
|
(1,394) |
|
(23,326) |
|
— |
|
(23,326) |
|
(15,160) |
|
— |
|
(15,160) |
|
| December 31, 2023 |
46,823 |
|
33,119 |
|
79,942 |
|
21,163 |
|
6,677 |
|
27,840 |
|
238,989 |
|
142,434 |
|
381,422 |
|
189,720 |
|
93,735 |
|
283,455 |
|
|
|
|
|
|
|
|
|
|
|
|
|
|
|
|
|
|
|
|
|
|
|
|
|
|
|
|
|
|
|
| TOTAL |
Shale Gas
(Natural Gas) (MMcf) |
Conventional Natural Gas
(Natural Gas) (MMcf) |
Total BOE
(Mboe)
|
| Factors |
Proved |
Probable |
Proved
+
Probable |
Proved |
Probable |
Proved
+
Probable |
Proved |
Probable |
Proved
+
Probable |
| December 31, 2022 |
521,688 |
|
175,480 |
|
697,167 |
|
39,279 |
|
23,599 |
|
62,877 |
|
481,868 |
|
231,230 |
|
713,098 |
|
| Discoveries |
— |
|
— |
|
— |
|
— |
|
— |
|
— |
|
— |
|
— |
|
— |
|
Extensions and Improved Recovery (2) |
80,000 |
|
196,761 |
|
276,761 |
|
158 |
|
(157) |
|
— |
|
38,747 |
|
60,052 |
|
98,799 |
|
Technical Revisions (3) |
15,063 |
|
(5,454) |
|
9,609 |
|
4,034 |
|
58 |
|
4,092 |
|
1,415 |
|
(14,477) |
|
(13,062) |
|
Acquisitions (4) |
1,082,973 |
|
581,238 |
|
1,664,211 |
|
2,684 |
|
927 |
|
3,610 |
|
347,657 |
|
196,616 |
|
544,273 |
|
Dispositions (5) |
(34,516) |
|
(30,627) |
|
(65,143) |
|
(176) |
|
(38) |
|
(215) |
|
(45,420) |
|
(41,159) |
|
(86,579) |
|
Economic Factors (6) |
1,165 |
|
331 |
|
1,497 |
|
(899) |
|
333 |
|
(566) |
|
2,172 |
|
778 |
|
2,949 |
|
Production (7) |
(78,170) |
|
— |
|
(78,170) |
|
(3,928) |
|
— |
|
(3,928) |
|
(58,185) |
|
— |
|
(58,185) |
|
| December 31, 2023 |
1,588,202 |
|
917,729 |
|
2,505,931 |
|
41,151 |
|
24,721 |
|
65,872 |
|
768,254 |
|
433,040 |
|
1,201,294 |
|
Notes:
(1) Numbers may not add due to rounding.
(2) The Corporation's Canadian development strategy focused on development of its Kaybob Duvernay and newly acquired Alberta Montney assets, along with low risk, infill and development, primarily in the Viewfield Bakken and Shaunavon resource plays. The Corporation continues its decline mitigation efforts through implementation of waterflood development within its Saskatchewan assets. The majority of the extensions in 2023 were in the Kaybob Duvernay asset.
(3) The Corporation realized minor negative revisions primarily due to increased operating expenses, as a result of inflationary pressures on costs. Overall, total revisions made up a minor portion of the year-over-year changes.
(4) During the year, the Corporation closed on several material acquisitions:
i) Certain Duvernay assets in the Kaybob Duvernay area, which closed on January 11, 2023.
ii) Certain Montney assets, within the Corporation's newly formed Montney DU, which closed on May 10, 2023.
iii) Corporate acquisition of Hammerhead Energy Inc., including Montney assets offsetting the earlier acquisition, which closed on December 21, 2023.
(5) The Corporation completed dispositions of non-core assets including portions of its East Shale Basin Duvernay asset, as well as the complete disposition of its North Dakota assets in the United States.
(6) Increases in reserves are due to slight increases in long term forecast commodity prices, determined by prior year end reserves calculated on current year end price forecasts.
(7) The Corporation produced an average of 138,326 boe per day in Canada and 21,085 boe per day in the United States for a total of 159,411 boe per day.
Undeveloped Reserves
The following discussion generally describes the basis on which we attribute Proved and Probable undeveloped reserves. Our near-term plans for developing our undeveloped reserves are described in the section "Major Oil and Gas Properties".
Proved Undeveloped Reserves
Proved Undeveloped reserves are those reserves expected to be recovered from known accumulations where a significant expenditure is required to render them capable of production. These reserves represent a high degree of certainty to be recoverable, and mostly relate to planned infill drilling and proximal offset locations to current producing entities.
The Corporation has extensive Proved development opportunities that are prioritized based on a disciplined set of criteria including, but not limited to, time for payout, rate of return, maturity of land tenure, reserve booking opportunities, proximity to transportation and marketing, as well as anticipated production rates. With this extensive portfolio of opportunities, it would be unrealistic, both from a cash flow as well as a physical ability, to completely execute on the entire portfolio of booked opportunities within two years, however, approximately 39% of the development spending occurs within this time frame.
The development of these reserves have been based on current and planned capital activity levels, with no material deferrals of development opportunities beyond these normal budgetary constraints. The majority of these reserves are planned to be developed within a three year time frame, which represents approximately 56% of the net undeveloped location count, as well as 62% of the net total future development capital. These development activities are directed mostly to the Corporation's core focus areas of the Montney, Kaybob Duvernay, Viewfield Bakken and Shaunavon resource plays. The current market environment has resulted in long term sustainability. When combined with an extensive location inventory, this results in an extended time period for full development.
The following table provides the timing of the initial reserve assignments for the Corporation's gross Proved Undeveloped reserves.
Timing of Initial Proved Undeveloped Reserve Assignment
|
|
|
|
|
|
|
|
|
|
|
|
|
|
|
|
|
|
|
|
|
|
|
|
|
|
|
|
|
|
|
|
|
|
|
|
|
|
|
|
|
|
|
|
|
|
Light & Medium Crude Oil (Mbbl) |
Heavy Crude Oil (Mbbl) |
Tight Oil
(Mbbl) |
Natural Gas Liquids
(Mbbl) |
Shale Gas
(MMcf) |
Conventional
Natural Gas (MMcf) |
Oil Equivalent
(Mboe) |
|
First
Attributed(1)
|
Total at
Year-End |
First
Attributed(1) |
Total at
Year-End |
First
Attributed(1) |
Total at
Year-End |
First
Attributed(1) |
Total at
Year-End |
First
Attributed(1) |
Total at
Year-End |
First
Attributed(1) |
Total at
Year-End |
First
Attributed(1) |
Total at
Year-End |
| 2021 |
4,784 |
|
14,353 |
|
404 |
|
1,677 |
|
8,960 |
|
61,755 |
|
44,358 |
|
57,577 |
|
137,175 |
|
183,576 |
|
987 |
|
3,468 |
|
81,533 |
|
166,536 |
|
| 2022 |
1,108 |
|
10,757 |
|
— |
|
1,731 |
|
167 |
|
48,806 |
|
25,624 |
|
69,253 |
|
117,568 |
|
235,901 |
|
528 |
|
3,491 |
|
46,581 |
|
170,446 |
|
| 2023 |
21 |
|
9,551 |
|
— |
|
1,729 |
|
74,385 |
|
106,423 |
|
51,082 |
|
107,124 |
|
737,162 |
|
949,769 |
|
— |
|
3,013 |
|
248,349 |
|
383,624 |
|
Note:
(1) "First attributed" refers to reserves first attributed at year-end to corresponding fiscal year.
Probable Undeveloped Reserves
Probable Undeveloped reserves are generally those reserves tested or indicated by analogy to be productive, and lands contiguous to production. These reserves represent quantities that are less certain to be recovered than Proved reserves.
In the reserve evaluation, development of these reserves is balanced across a five to seven year time-frame to closely match the aggregate internal development schedule and represent a practicable development program. A large portion of these reserves are planned to be developed within a three year time frame, representing approximately 41% of the net undeveloped location count, as well as 45% of the total net future development costs. The current market environment has resulted in long term sustainability. When combined with extensive location inventory, this results in an extended full development time period.
This broader distribution of development activities continues to focus on the Corporation's core areas, while reclassifying current Probable locations to Proved locations during the early years of development. These development activities are directed mostly to the Corporation's core focus areas of the Montney, Kaybob Duvernay, Viewfield Bakken and Shaunavon resource plays.
The following table provides the timing of the initial reserve assignments for the Corporation's Probable Undeveloped reserves.
Timing of Initial Probable Undeveloped Reserves Assignment
|
|
|
|
|
|
|
|
|
|
|
|
|
|
|
|
|
|
|
|
|
|
|
|
|
|
|
|
|
|
|
|
|
|
|
|
|
|
|
|
|
|
|
|
|
|
Light & Medium Crude Oil (Mbbl) |
Heavy Crude Oil (Mbbl) |
Tight Oil
(Mbbl) |
Natural Gas Liquids
(Mbbl) |
Shale Gas
(MMcf) |
Conventional
Natural Gas (MMcf) |
Oil Equivalent
(Mboe) |
|
First
Attributed(1)
|
Total at
Year-End |
First
Attributed(1) |
Total at
Year-End |
First
Attributed(1) |
Total at
Year-End |
First
Attributed(1) |
Total at
Year-End |
First
Attributed(1) |
Total at
Year-End |
First
Attributed(1) |
Total at
Year-End |
First
Attributed(1) |
Total at
Year-End |
| 2021 |
1,190 |
|
24,862 |
|
693 |
|
1,447 |
|
1,466 |
|
66,758 |
|
9,084 |
|
27,067 |
|
26,750 |
|
80,377 |
|
640 |
|
14,767 |
|
16,998 |
|
135,991 |
|
| 2022 |
470 |
|
23,332 |
|
— |
|
1,481 |
|
57 |
|
60,050 |
|
6,384 |
|
29,544 |
|
29,397 |
|
91,012 |
|
236 |
|
14,877 |
|
11,849 |
|
132,055 |
|
| 2023 |
8 |
|
22,131 |
|
— |
|
1,481 |
|
66,300 |
|
100,756 |
|
50,021 |
|
70,098 |
|
687,435 |
|
752,281 |
|
— |
|
14,694 |
|
230,901 |
|
322,295 |
|
Note:
(1) "First attributed" refers to reserves first attributed at year end of the corresponding fiscal year.
Significant Factors or Uncertainties Affecting Reserves Data
The process of estimating reserves is complex. It requires significant judgments and decisions based on available geological, geophysical, engineering and economic data. These estimates may change substantially as additional data from ongoing development activities and production performance becomes available and as economic conditions impacting oil and gas prices and costs change. The reserve estimates contained herein are based on current production forecasts, prices and economic conditions. Our reserves are evaluated by McDaniel, an independent engineering firm. Different reserve engineers may make different estimates of reserve quantities based on the same data.
As circumstances change and additional data becomes available, reserve estimates also change. Estimates made are reviewed and revised, either upward or downward, as warranted by the new information. Revisions are often required due to changes in well performance, prices, economic conditions and governmental regulations.
Although every reasonable effort is made to ensure that reserve estimates are accurate, reserve estimation is an inferential science. As a result, the subjective decisions and judgments, new geological or production information and a changing environment may impact these estimates. Revisions to reserve estimates can arise from numerous factors including, but not limited to, additional development activity, evolving production history, continual reassessment of the viability of production under varying economic conditions, changes in forecast prices, and reservoir performance. Such revisions can be substantial and can be either positive or negative.
Future Development Costs
The table below sets out the development costs deducted in the estimation of future net revenue attributable to total Proved reserves and total Proved plus Probable reserves (using forecast prices and costs).
|
|
|
|
|
|
|
|
|
|
|
|
|
|
|
|
|
|
|
|
|
| Company Annual Capital Expenditures (MM$) |
|
Canada (2) |
United States (3) |
Total (1) |
| Year |
Total Proved |
Total Proved
Plus Probable |
Total Proved |
Total Proved Plus Probable |
Total
Proved |
Total Proved Plus Probable |
| 2024 |
1,233 |
|
1,372 |
|
— |
|
— |
|
1,233 |
|
1,372 |
|
| 2025 |
1,240 |
|
1,437 |
|
— |
|
— |
|
1,240 |
|
1,437 |
|
| 2026 |
1,462 |
|
1,585 |
|
— |
|
— |
|
1,462 |
|
1,585 |
|
| 2027 |
1,429 |
|
1,738 |
|
— |
|
— |
|
1,429 |
|
1,738 |
|
| 2028 |
888 |
|
1,708 |
|
— |
|
— |
|
888 |
|
1,708 |
|
| 2029 |
26 |
|
1,095 |
|
— |
|
— |
|
26 |
|
1,095 |
|
| 2030 |
11 |
|
603 |
|
— |
|
— |
|
11 |
|
603 |
|
| 2031 |
12 |
|
19 |
|
— |
|
— |
|
12 |
|
19 |
|
| 2032 |
13 |
|
19 |
|
— |
|
— |
|
13 |
|
19 |
|
| 2033 |
9 |
|
9 |
|
— |
|
— |
|
9 |
|
9 |
|
| 2034 |
7 |
|
9 |
|
— |
|
— |
|
7 |
|
9 |
|
| 2035 |
6 |
|
9 |
|
— |
|
— |
|
6 |
|
9 |
|
| Subtotal |
6,336 |
|
9,603 |
|
— |
|
— |
|
6,336 |
|
9,603 |
|
| Remainder |
21 |
|
62 |
|
— |
|
— |
|
21 |
|
62 |
|
| Total |
6,356 |
|
9,665 |
|
— |
|
— |
|
6,356 |
|
9,665 |
|
| 10% Discounted |
5,076 |
|
7,196 |
|
— |
|
— |
|
5,076 |
|
7,196 |
|
Notes:
(1) Numbers may not add due to rounding.
(2) Due to the nature of the resource style plays that Crescent Point is focused on, with large contiguous blocks of land, a large number of Proved as well as Proved plus Probable locations have been booked. The scheduling of locations in the reserve report have a similar drilling timing as the Corporation's long-term development plan, with development drilling scheduled to occur within a five year period for Proved reserves, extending up to seven year for Probable reserves.
We estimate that our internally generated cash flow will be sufficient to fund the future development costs ("FDC") disclosed above. In addition, we have access to debt financing through our bank credit facilities and through debt capital markets, if available on terms acceptable to us.
Major Oil and Gas Properties
The following is a description of the major oil and natural gas producing properties in which Crescent Point has an interest and that are material to the Corporation's operations and activities. All of the Corporation's assets are located onshore within North America. The Corporation holds no interests in any plants, facilities or installations that are significant beyond normal oil and gas operating practices. Unless otherwise noted, reserve amounts are Company Gross, based on escalating cost and price assumptions as evaluated in the Crescent Point Reserve Report as at December 31, 2023.
Alberta Montney Area
In 2023, the Corporation acquired Montney assets from Spartan Delta and also acquired HEI. The Corporation's Montney production is a combination of tight oil, natural gas, and natural gas liquids, weighted approximately 57% to oil and natural gas liquids. The Corporation is developing the play using pad based multi-staged fractured horizontal wells. In 2023, Crescent Point's production from the Montney averaged approximately 25,000 boe per day.
In the Montney, the Corporation spent $219 million, representing 19% of its 2023 capital program, drilling 18 (17.8 net) horizontal wells.
At year-end 2023, the Corporation's total Proved plus Probable reserves in the Montney were 499.6 MMboe, with 410 (383.3 net) drilling locations booked, representing approximately 42% of the Corporation's total Proved plus Probable reserves. It is expected the total Proved as well as the total Proved plus Probable locations will be developed within seven years.
As at December 31, 2023, Crescent Point has allocated approximately 45% of the Corporation's 2024 capital budget to developing the Montney resources play in Alberta.
Kaybob Duvernay Area
The Corporation's Kaybob Duvernay production is a combination of natural gas liquids, weighted towards condensate, and natural gas, weighted approximately 58% to natural gas liquids. The Corporation is developing the play using multi-staged fractured horizontal wells. In 2023, Crescent Point's production averaged approximately 44,500 boe per day. In 2023, the Corporation expanded its Kaybob Duvernay assets by acquiring assets from Paramount Resources Ltd.
In Kaybob Duvernay, the Corporation spent $303 million, representing 26% of its 2023 capital program, drilling 22 (22.0 net) horizontal wells.
At year-end 2023, the Corporation's total Proved plus Probable reserves in Kaybob Duvernay were 313.3 MMboe, with 213 (213.0 net) drilling locations booked, representing approximately 26% of the Corporation's total Proved plus Probable reserves. It is expected the total Proved as well as the total Proved plus Probable locations will be developed within six years.
As of December 31, 2023, Crescent Point has allocated approximately 35% of the Corporation's 2024 capital budget to developing the Duvernay resource play in Kaybob Duvernay.
Viewfield Area
In the Viewfield resource area, located in southeastern Saskatchewan, the Corporation has development in the Bakken resource play, as well as conventional plays including the Frobisher and Midale. In 2023, Crescent Point's production averaged approximately 29,300 boe per day in the area. The majority of the production is from the Bakken resource which is a high-quality light oil and exploited using multi-stage fractured horizontal wells. The core area of the Bakken resource has mostly been unitized, which has allowed for the implementation of various waterflood projects.
Crescent Point spent $169 million, representing approximately 14% of its 2023 capital development program, in the Viewfield area including drilling 62 (60.7 net) additional oil wells. The Corporation also continued to focus on waterflood development expansion.
At year-end 2023, the Corporation's total Proved plus Probable reserves in the Viewfield area were 172.7 MMboe, with 593 (555.0 net) locations booked to these reserves. This represents approximately 14% of the Corporation's total Proved plus Probable reserves. Crescent Point expects to fully develop this location inventory within five years for Proved reserves, extending to six years for Probable reserves.
As of December 31, 2023, Crescent Point has allocated approximately 9% of the Corporation's 2024 capital budget to development of the Viewfield area, focused on the Bakken resource play and conventional Frobisher and Midale drilling, as well as additional waterflood development.
Shaunavon Area
In the Shaunavon resource area, located in southwest Saskatchewan, the Corporation has development occurring in the Upper and Lower Shaunavon resource zones, as well as conventional Upper Shaunavon pools, all of which are medium quality oil. The Corporation has developed tight oil Upper and Lower resource plays using multi-stage fracture stimulated horizontal wells. In 2023, Crescent Point's production averaged approximately 18,700 boe per day.
Crescent Point spent $134 million, representing approximately 11% of its 2023 capital development program, in the Shaunavon area including drilling 40 (38.2 net) additional wells. The Corporation has also continued to focus on waterflood expansion and has continued its enhanced oil recovery project in a conventional Upper Shaunavon pool.
As of year-end 2023, the Corporation's total Proved plus Probable reserves in the Shaunavon area were 97.1 MMboe, with 475 (461.5 net) locations booked to these reserves. This represents approximately 8% of the Corporation's total Proved plus Probable reserves. Crescent Point expects to fully develop this location inventory within five years for Proved reserves, extending to seven years for Probable reserves.
As of December 31, 2023, Crescent Point has allocated approximately 7% of the Corporation's 2024 capital budget to development of the Shaunavon area, focused on both Upper and Lower Shaunavon drilling, as well as continued expansion of waterflood and polymer enhanced oil recovery projects.
Oil and Gas Wells
|
|
|
|
|
|
|
|
|
|
|
|
|
|
|
| Producing Wells |
| Area |
Oil |
Gas |
|
Gross |
Net |
Gross |
Net |
| CANADA |
|
|
|
|
| Saskatchewan |
5,274 |
|
4,702 |
|
55 |
|
17 |
|
| Alberta |
614 |
|
565 |
|
523 |
|
453 |
|
| British Columbia |
— |
|
— |
|
— |
|
— |
|
| TOTAL CANADA |
5,888 |
|
5,267 |
|
578 |
|
470 |
|
| U.S. |
|
|
|
|
| North Dakota |
— |
|
— |
|
— |
|
— |
|
|
|
|
|
|
| TOTAL U.S. |
— |
|
— |
|
— |
|
— |
|
| Total |
5,888 |
|
5,267 |
|
578 |
|
470 |
|
|
|
|
|
|
|
|
|
|
|
|
|
|
|
|
Non-Producing Wells |
Area |
Oil |
Gas |
|
Gross |
Net |
Gross |
Net |
| CANADA |
|
|
|
|
| Saskatchewan |
3,157 |
|
2,629 |
|
333 |
|
91 |
|
| Alberta |
459 |
|
349 |
|
312 |
|
239 |
|
| British Columbia |
— |
|
— |
|
— |
|
— |
|
| TOTAL CANADA |
3,616 |
|
2,978 |
|
645 |
|
330 |
|
| U.S. |
|
|
|
|
| North Dakota |
— |
|
— |
|
— |
|
— |
|
|
|
|
|
|
| TOTAL U.S. |
— |
|
— |
|
— |
|
— |
|
| Total |
3,616 |
|
2,978 |
|
645 |
|
330 |
|
Notes:
(1) Gross and net producing and non-producing oil and gas counts include both reserve assigned and non-reserve assigned wells.
(2) Active injection wells are reflected in the non-producing well count.
All of the Corporation's oil and gas wells are onshore. The Corporation's non-producing wells are generally situated within defined developed areas and include recent drills awaiting final preparation prior to being placed on production; existing wells that may be waiting on improved economic conditions to restart; wells currently in use for observation or monitoring; wells awaiting recompletion in secondary zones or as injectors; or wells scheduled for abandonment. These non-producing entities include wells with reserve assignments as well as currently non-booked wells, which will have various terms of being non-producing from recent to longer-term.
Developed non-producing reserves represent only 0.5% of the Corporation's total Proved reserve category, and 0.3% of the total Proved plus Probable reserve category. The Corporation's wells in the developed non-producing category exist across most of the Corporation's areas and mostly represent wells awaiting final preparation for production, plus those awaiting well reactivation.
Properties With No Attributed Reserves
The following table summarizes the gross and net acres of unproved properties in which we have an interest and also the number of net acres for which our rights to develop or exploit will, absent further action, expire within one year.
|
|
|
|
|
|
|
|
|
|
|
|
|
December 31, 2023 |
|
Gross Acres |
Net Acres |
Net Acres Expiring
Within One Year |
| CANADA |
|
|
|
| Alberta |
676,722 |
|
601,318 |
|
44,273 |
|
| Saskatchewan |
577,471 |
|
548,854 |
|
51,117 |
|
| Manitoba |
2,475 |
|
2,475 |
|
— |
|
| British Columbia |
— |
|
— |
|
— |
|
| Total |
1,256,668 |
|
1,152,647 |
|
95,390 |
|
| U.S. |
|
|
|
| North Dakota |
— |
|
— |
|
— |
|
| Total |
— |
|
— |
|
— |
|
| Total |
1,256,668 |
|
1,152,647 |
|
95,390 |
|
The Corporation has no material drilling commitments relating to unproved properties.
Drilling Activity
The following table summarizes the gross and net exploration and development wells we participated in during the year ended December 31, 2023, in each of Canada and the United States.
|
|
|
|
|
|
|
|
|
|
|
|
|
|
|
|
|
|
|
|
|
|
Development Wells |
Exploration Wells (2) |
Total Wells |
|
Gross |
Net |
Gross |
Net |
Gross |
Net |
| CANADA |
|
|
|
|
|
|
| Oil wells |
125 |
122 |
— |
— |
125 |
122 |
Natural Gas wells (3) |
22 |
22 |
— |
— |
22 |
22 |
| Service wells |
3 |
3 |
— |
— |
3 |
3 |
| Stratigraphic test |
— |
— |
4 |
4 |
4 |
4 |
Dry Holes |
— |
— |
— |
— |
— |
— |
Total (1) |
150 |
147 |
4 |
4 |
154 |
151 |
|
|
|
|
|
|
|
|
|
|
|
|
|
|
|
|
|
|
|
|
|
|
Development Wells |
Exploration Wells (2) |
Total Wells |
|
Gross |
Net |
Gross |
Net |
Gross |
Net |
| U.S. |
|
|
|
|
|
|
| Oil wells |
24 |
23 |
— |
— |
24 |
23 |
| Natural Gas wells |
— |
— |
— |
— |
— |
— |
| Service wells |
2 |
2 |
— |
— |
2 |
2 |
| Stratigraphic Test |
— |
— |
— |
— |
— |
— |
| Dry Holes |
— |
— |
— |
— |
— |
— |
Total (1) |
26 |
25 |
— |
— |
26 |
25 |
Notes:
(1) Numbers may not add due to rounding.
(2) Exploration wells in this grouping are based on the well license classification at the time of drilling.
(3) Kaybob Duvernay wells where the primary product is condensate.
For details on important exploration and development activities during 2023, see "Statement of Reserves Data and Other Oil and Gas Information – Major Oil and Gas Properties".
The Corporation has no work commitments for its proved properties (including drilling commitments) in Canada or the U.S. for the next three years.
Tax Horizon
Crescent Point had tax pools of approximately $8.3 billion at December 31, 2023, which are deductible against future taxable income. Based on this tax pool balance and forecast cash flows using December 31, 2023 forecast prices from the average of three Independent Reserve Evaluators (McDaniel, GLJ Ltd. and Sproule Associates Ltd.), with the Corporation's development capital plans, Crescent Point does not expect to be taxable until 2026. Crescent Point is subject to other taxes, such as payroll taxes, property taxes, carbon taxes, sales taxes and foreign withholding taxes as part of its ongoing business.
Costs Incurred(1)
The following table summarizes our property acquisition costs, exploration costs and development costs for the year ended December 31, 2023. Our total capital costs were approximately $5,148.5 million in 2023.
|
|
|
|
|
|
|
|
|
|
|
|
|
|
|
| ($ millions) |
Acquisition Costs (2) |
|
|
|
Proved Properties |
Unproved Properties |
Exploration Costs |
Development Costs |
| Canada |
4,074.4 |
|
515.2 |
|
26.6 |
|
849.5 |
|
| U.S. |
0.1 |
|
— |
|
0.1 |
|
296.2 |
|
| Total |
4,074.5 |
|
515.2 |
|
26.7 |
|
1,145.7 |
|
|
|
|
|
|
Notes:
(1) Costs incurred exclude capitalized administration.
(2) Excludes disposition proceeds of $611.7 million and $1.9 million for proved and unproved properties, respectively.
Production Estimates
The following table discloses the gross volume of production for each product type estimated by McDaniel for 2024 in the estimates of future net revenue with forecast pricing from Proved reserves disclosed above under the heading "Reserves Data – Forecast Prices and Costs".
|
|
|
|
|
|
|
|
|
|
|
|
|
|
|
|
|
|
|
|
|
|
|
|
|
Light and Medium
Crude Oil |
Heavy Crude Oil |
Tight Oil |
NGLs |
Shale Gas |
Conventional Natural Gas |
Total |
|
(bbls/d) |
(bbls/d) |
(bbls/d) |
(bbls/d) |
(Mcf/d) |
(Mcf/d) |
(boe/d) |
| CANADA |
|
|
|
|
|
|
|
| Alberta |
3,010 |
|
— |
|
34,031 |
|
39,753 |
|
366,653 |
|
7,541 |
|
139,160 |
|
| Southwest Saskatchewan |
2,656 |
|
3,753 |
|
11,765 |
|
317 |
|
9,496 |
|
552 |
|
20,167 |
|
| Southeast Saskatchewan |
6,783 |
|
— |
|
21,189 |
|
6,231 |
|
12,519 |
|
1,820 |
|
36,593 |
|
Total CANADA(1) |
12,449 |
|
3,753 |
|
66,985 |
|
46,302 |
|
388,668 |
|
9,913 |
|
195,919 |
|
| U.S. |
|
|
|
|
|
|
|
| North Dakota |
— |
|
— |
|
— |
|
— |
|
— |
|
— |
|
— |
|
Total U.S.(1) |
— |
|
— |
|
— |
|
— |
|
— |
|
— |
|
— |
|
Total Corporate(1) |
12,449 |
|
3,753 |
|
66,985 |
|
46,302 |
|
388,668 |
|
9,913 |
|
195,919 |
|
Note:
(1) Numbers may not add due to rounding.
In 2024, production in the Montney in Alberta is estimated at 87,151 boe per day (comprised of 34,031 bbl/d Tight Oil; 11 bbl/d Light & Medium Oil; 10,249 bbl/d NGLs; 256,669 Mcf/d Shale Gas; and 496 Mcf/d Conventional Natural Gas). Production in the Kaybob Duvernay area of Alberta is estimated at 46,737 boe per day (comprised of 28,365 bbl/d NGLs; 109,984 Mcf/d Shale Gas; and 251 Mcf/d Conventional Natural Gas). Condensate is estimated to make up 45% of 2024 total production from Kaybob Duvernay. The Montney and Kaybob Duvernay areas make up 44% and 24% of the Corporation's Proved production estimate in the Crescent Point Reserve Report, respectively. Remaining areas each account for a smaller portion of the Corporation's production estimates for 2024.
The following table discloses, for each product type, the gross volume of production estimated by McDaniel for 2024 in the estimates of future net revenue with forecast pricing from Proved plus Probable reserves disclosed above under the heading "Reserves Data – Forecast Prices and Costs".
|
|
|
|
|
|
|
|
|
|
|
|
|
|
|
|
|
|
|
|
|
|
|
|
| Region |
Light and Medium
Crude Oil |
Heavy Crude Oil |
Tight Oil |
NGLs |
Shale Gas |
Conventional Natural Gas |
Total |
|
(bbls/d) |
(bbls/d) |
(bbls/d) |
(bbls/d) |
(Mcf/d) |
(Mcf/d) |
(boe/d) |
| CANADA |
|
|
|
|
|
|
|
| Alberta |
3,132 |
|
— |
|
38,160 |
|
41,920 |
|
392,626 |
|
7,994 |
|
149,982 |
|
| Southwest Saskatchewan |
2,809 |
|
3,864 |
|
12,954 |
|
340 |
|
10,197 |
|
579 |
|
21,763 |
|
| Southeast Saskatchewan |
7,251 |
|
— |
|
22,718 |
|
6,594 |
|
13,206 |
|
1,993 |
|
39,096 |
|
Total CANADA(1) |
13,192 |
|
3,864 |
|
73,832 |
|
48,853 |
|
416,029 |
|
10,567 |
|
210,841 |
|
| U.S. |
|
|
|
|
|
|
|
| North Dakota |
— |
|
— |
|
— |
|
— |
|
— |
|
— |
|
— |
|
Total U.S.(1) |
— |
|
— |
|
— |
|
— |
|
— |
|
— |
|
— |
|
Total Corporate(1) |
13,192 |
|
3,864 |
|
73,832 |
|
48,853 |
|
416,029 |
|
10,567 |
|
210,841 |
|
Note:
(1) Numbers may not add due to rounding.
In 2024, production in the Montney in Alberta is estimated at 95,906 boe per day (comprised of 38,160 bbl/d Tight Oil; 11 bbl/d Light & Medium Oil; 11,138 bbl/d NGLs; 279,081 Mcf/d Shale Gas; and 507 Mcf/d Conventional Natural Gas). Production in the Kaybob Duvernay area of Alberta is estimated at 48,585 boe per day (comprised of 29,590 bbl/d NGLs; 113,545 Mcf/d Shale Gas; and 424 Mcf/d Conventional Natural Gas). Condensate is estimated to make up 46% of 2024 total production from Kaybob Duvernay. The Montney and Kaybob Duvernay areas make up 45% and 23% of the Corporation's Proved plus Probable production estimate in the Crescent Point Reserve Report, respectively. Remaining areas each account for a smaller portion of the Corporation's production estimates for 2024.
Production History
The following tables disclose, on a quarterly and annual basis for the year ended December 31, 2023, our share of average daily production volume (prior to deducting royalties), and the prices received, royalties, production costs and transportation costs incurred and netbacks received on a per unit of volume basis for each product type.
Average Daily Production Volume(1)
|
|
|
|
|
|
|
|
|
|
|
|
|
|
|
|
|
|
|
Three Months Ended |
Year Ended |
|
March 31, 2023 |
June 30, 2023 |
Sept. 30, 2023 |
Dec. 31, 2023 |
2023 |
| CANADA |
|
|
|
|
|
| Light and Medium Crude Oil (bbls/d) |
12,879 |
|
13,188 |
|
12,405 |
|
12,198 |
|
12,665 |
|
| Heavy Crude Oil (bbls/d) |
4,010 |
|
3,857 |
|
3,617 |
|
3,795 |
|
3,818 |
|
| Tight Oil (bbls/d) |
39,464 |
|
48,151 |
|
54,605 |
|
56,657 |
|
49,779 |
|
| NGLs (bbls/d) |
35,401 |
|
34,108 |
|
38,316 |
|
39,517 |
|
36,851 |
|
| Shale Gas (Mcf/d) |
147,458 |
|
184,105 |
|
232,235 |
|
236,926 |
|
200,514 |
|
| Conventional Natural Gas (Mcf/d) |
10,233 |
|
8,859 |
|
12,542 |
|
11,380 |
|
10,761 |
|
| Total (boe/d) |
118,036 |
|
131,465 |
|
149,739 |
|
153,551 |
|
138,326 |
|
| U.S. |
|
|
|
|
|
| Light and Medium Crude Oil (bbls/d) |
— |
|
— |
|
— |
|
— |
|
— |
|
| Heavy Crude Oil (bbls/d) |
— |
|
— |
|
— |
|
— |
|
— |
|
| Tight Oil (bbls/d) |
13,720 |
|
15,662 |
|
21,277 |
|
5,855 |
|
14,127 |
|
| NGLs (bbls/d) |
5,191 |
|
5,291 |
|
6,412 |
|
1,856 |
|
4,683 |
|
| Shale Gas (Mcf/d) |
14,001 |
|
15,676 |
|
18,917 |
|
6,039 |
|
13,651 |
|
| Conventional Natural Gas (Mcf/d) |
— |
|
— |
|
— |
|
— |
|
— |
|
| Total (boe/d) |
21,245 |
|
23,566 |
|
30,842 |
|
8,718 |
|
21,085 |
|
| TOTAL |
|
|
|
|
|
| Light and Medium Crude Oil (bbls/d) |
12,879 |
|
13,188 |
|
12,405 |
|
12,198 |
|
12,665 |
|
| Heavy Crude Oil (bbls/d) |
4,010 |
|
3,857 |
|
3,617 |
|
3,795 |
|
3,818 |
|
| Tight Oil (bbls/d) |
53,184 |
|
63,813 |
|
75,882 |
|
62,512 |
|
63,906 |
|
NGLs (bbls/d) (2) |
40,592 |
|
39,399 |
|
44,728 |
|
41,373 |
|
41,534 |
|
| Shale Gas (Mcf/d) |
161,459 |
|
199,781 |
|
251,152 |
|
242,965 |
|
214,165 |
|
| Conventional Natural Gas (Mcf/d) |
10,233 |
|
8,859 |
|
12,542 |
|
11,380 |
|
10,761 |
|
| Total (boe/d) |
139,280 |
|
155,031 |
|
180,581 |
|
162,269 |
|
159,411 |
|
Notes:
(1) Numbers may not add due to rounding.
(2) For the year ended December 31, 2023, the Company's average condensate production was 22,517 bbl/s, which is included in NGLs production.
Prices Received, Royalties, Production Costs and Transportation Costs Incurred – Light and Medium Crude Oil
|
|
|
|
|
|
|
|
|
|
|
|
|
|
|
|
|
|
|
Three Months Ended |
Year Ended |
| ($ per bbl) |
March 31, 2023 |
June 30, 2023 |
Sept. 30, 2023 |
Dec. 31, 2023 |
2023 |
| CANADA |
|
|
|
|
|
| Prices Received |
88.35 |
|
89.45 |
|
95.42 |
|
100.09 |
|
93.23 |
|
| Royalties |
(15.49) |
|
(15.10) |
|
(16.83) |
|
(18.39) |
|
(16.42) |
|
Production Costs(1) |
(24.41) |
|
(23.39) |
|
(22.61) |
|
(24.12) |
|
(23.63) |
|
Transportation Costs(1) |
(0.70) |
|
(1.24) |
|
(1.39) |
|
(1.34) |
|
(1.17) |
|
| Netback Received |
47.75 |
|
49.72 |
|
54.59 |
|
56.24 |
|
52.01 |
|
| U.S. |
|
|
|
|
|
| Prices Received |
— |
|
— |
|
— |
|
— |
|
— |
|
| Royalties |
— |
|
— |
|
— |
|
— |
|
— |
|
Production Costs(1) |
— |
|
— |
|
— |
|
— |
|
— |
|
Transportation Costs(1) |
— |
|
— |
|
— |
|
— |
|
— |
|
| Netback Received |
— |
|
— |
|
— |
|
— |
|
— |
|
| TOTAL |
|
|
|
|
|
| Prices Received |
88.35 |
|
89.45 |
|
95.42 |
|
100.09 |
|
93.23 |
|
| Royalties |
(15.49) |
|
(15.10) |
|
(16.83) |
|
(18.39) |
|
(16.42) |
|
Production Costs(1) |
(24.41) |
|
(23.39) |
|
(22.61) |
|
(24.12) |
|
(23.63) |
|
Transportation Costs(1) |
(0.70) |
|
(1.24) |
|
(1.39) |
|
(1.34) |
|
(1.17) |
|
| Netback Received |
47.75 |
|
49.72 |
|
54.59 |
|
56.24 |
|
52.01 |
|
Note:
(1) Production costs and transportation costs consist of direct costs incurred to operate both oil and gas wells. Costs are allocated between all product types based on a number of assumptions.
Prices Received, Royalties, Production Costs and Transportation Costs Incurred – Heavy Crude Oil
|
|
|
|
|
|
|
|
|
|
|
|
|
|
|
|
|
|
|
Three Months Ended |
Year Ended |
| ($ per bbl) |
March 31, 2023 |
June 30, 2023 |
Sept. 30, 2023 |
Dec. 31, 2023 |
2023 |
| CANADA |
|
|
|
|
|
| Prices Received |
66.80 |
|
72.89 |
|
91.59 |
|
74.48 |
|
76.19 |
|
| Royalties |
(14.87) |
|
(18.37) |
|
(22.14) |
|
(17.23) |
|
(18.08) |
|
Production Costs(1) |
(18.46) |
|
(19.06) |
|
(21.70) |
|
(17.95) |
|
(19.26) |
|
Transportation Costs(1) |
(2.35) |
|
(2.41) |
|
(2.40) |
|
(2.40) |
|
(2.39) |
|
| Netback Received |
31.12 |
|
33.05 |
|
45.35 |
|
36.90 |
|
36.46 |
|
| U.S. |
|
|
|
|
|
| Prices Received |
— |
|
— |
|
— |
|
— |
|
— |
|
| Royalties |
— |
|
— |
|
— |
|
— |
|
— |
|
Production Costs(1) |
— |
|
— |
|
— |
|
— |
|
— |
|
Transportation Costs(1) |
— |
|
— |
|
— |
|
— |
|
— |
|
| Netback Received |
— |
|
— |
|
— |
|
— |
|
— |
|
| TOTAL |
|
|
|
|
|
| Prices Received |
66.80 |
|
72.89 |
|
91.59 |
|
74.48 |
|
76.19 |
|
| Royalties |
(14.87) |
|
(18.37) |
|
(22.14) |
|
(17.23) |
|
(18.08) |
|
Production Costs(1) |
(18.46) |
|
(19.06) |
|
(21.70) |
|
(17.95) |
|
(19.26) |
|
Transportation Costs(1) |
(2.35) |
|
(2.41) |
|
(2.40) |
|
(2.40) |
|
(2.39) |
|
| Netback Received |
31.12 |
|
33.05 |
|
45.35 |
|
36.90 |
|
36.46 |
|
Note:
(1) Production costs and transportation costs consist of direct costs incurred to operate both oil and gas wells. Costs are allocated between all product types based on a number of assumptions.
Prices Received, Royalties, Production Costs and Transportation Costs Incurred – Tight Oil
|
|
|
|
|
|
|
|
|
|
|
|
|
|
|
|
|
|
|
|
|
|
|
Three Months Ended |
Year Ended |
|
|
|
|
| ($ per bbl) |
March 31, 2023 |
June 30, 2023 |
Sept. 30, 2023 |
Dec. 31, 2023 |
2023 |
|
|
|
|
| CANADA |
|
|
|
|
|
|
|
|
|
| Prices Received |
91.04 |
|
91.05 |
|
107.80 |
|
92.57 |
|
96.12 |
|
|
|
|
|
| Royalties |
(8.96) |
|
(9.32) |
|
(10.03) |
|
(9.97) |
|
(9.63) |
|
|
|
|
|
Production Costs(1) |
(25.16) |
|
(23.81) |
|
(25.54) |
|
(22.31) |
|
(24.12) |
|
|
|
|
|
Transportation Costs(1) |
(5.07) |
|
(4.70) |
|
(5.11) |
|
(5.45) |
|
(5.10) |
|
|
|
|
|
| Netback Received |
51.85 |
|
53.22 |
|
67.12 |
|
54.84 |
|
57.27 |
|
|
|
|
|
| U.S. |
|
|
|
|
|
|
|
|
|
| Prices Received |
103.98 |
|
99.72 |
|
111.29 |
|
115.07 |
|
106.74 |
|
|
|
|
|
| Royalties |
(28.46) |
|
(26.72) |
|
(29.62) |
|
(30.37) |
|
(28.62) |
|
|
|
|
|
Production Costs(1) |
(15.94) |
|
(12.95) |
|
(13.14) |
|
(13.84) |
|
(13.83) |
|
|
|
|
|
Transportation Costs(1) |
(1.85) |
|
(2.38) |
|
(2.08) |
|
(1.68) |
|
(2.07) |
|
|
|
|
|
| Netback Received |
57.73 |
|
57.67 |
|
66.45 |
|
69.18 |
|
62.22 |
|
|
|
|
|
| TOTAL |
|
|
|
|
|
|
|
|
|
| Prices Received |
94.38 |
|
93.18 |
|
108.78 |
|
94.68 |
|
98.46 |
|
|
|
|
|
| Royalties |
(13.99) |
|
(13.59) |
|
(15.52) |
|
(11.88) |
|
(13.83) |
|
|
|
|
|
Production Costs(1) |
(22.78) |
|
(21.14) |
|
(22.07) |
|
(21.51) |
|
(21.85) |
|
|
|
|
|
Transportation Costs(1) |
(4.24) |
|
(4.13) |
|
(4.26) |
|
(5.10) |
|
(4.43) |
|
|
|
|
|
| Netback Received |
53.37 |
|
54.32 |
|
66.93 |
|
56.19 |
|
58.35 |
|
|
|
|
|
Note:
(1) Production costs and transportation costs consist of direct costs incurred to operate both oil and gas wells. Costs are allocated between all product types based on a number of assumptions.
Prices Received, Royalties, Production Costs and Transportation Costs Incurred – NGLs
|
|
|
|
|
|
|
|
|
|
|
|
|
|
|
|
|
|
|
Three Months Ended |
Year Ended |
| ($ per bbl) |
March 31, 2023 |
June 30, 2023 |
Sept. 30, 2023 |
Dec. 31, 2023 |
2023 |
| CANADA |
|
|
|
|
|
| Prices Received |
79.37 |
|
67.95 |
|
72.10 |
|
71.86 |
|
72.80 |
|
| Royalties |
(9.49) |
|
(7.93) |
|
(7.44) |
|
(8.90) |
|
(8.43) |
|
Production Costs(1) |
(11.12) |
|
(11.14) |
|
(11.77) |
|
(11.88) |
|
(11.50) |
|
Transportation Costs(1) |
(2.27) |
|
(3.41) |
|
(2.70) |
|
(3.41) |
|
(2.95) |
|
| Netback Received |
56.49 |
|
45.47 |
|
50.19 |
|
47.67 |
|
49.92 |
|
| U.S. |
|
|
|
|
|
| Prices Received |
35.55 |
|
24.06 |
|
26.14 |
|
18.46 |
|
27.05 |
|
| Royalties |
(4.63) |
|
(2.40) |
|
(3.28) |
|
3.18 |
|
(2.75) |
|
Production Costs(1) |
(5.47) |
|
(3.00) |
|
(3.08) |
|
(2.33) |
|
(3.63) |
|
Transportation Costs(1) |
(0.48) |
|
(0.54) |
|
(0.46) |
|
(0.43) |
|
(0.49) |
|
| Netback Received |
24.97 |
|
18.12 |
|
19.32 |
|
18.88 |
|
20.18 |
|
| TOTAL |
|
|
|
|
|
| Prices Received |
73.77 |
|
62.71 |
|
66.88 |
|
70.99 |
|
67.64 |
|
| Royalties |
(8.87) |
|
(7.18) |
|
(6.85) |
|
(8.35) |
|
(7.79) |
|
Production Costs(1) |
(10.40) |
|
(10.05) |
|
(10.52) |
|
(11.45) |
|
(10.61) |
|
Transportation Costs(1) |
(2.04) |
|
(3.03) |
|
(2.38) |
|
(3.27) |
|
(2.68) |
|
| Netback Received |
52.46 |
|
42.45 |
|
47.13 |
|
47.92 |
|
46.56 |
|
Note:
(1) Production costs and transportation costs consist of direct costs incurred to operate both oil and gas wells. Costs are allocated between all product types based on a number of assumptions.
Prices Received, Royalties, Production Costs and Transportation Costs Incurred – Shale Gas
|
|
|
|
|
|
|
|
|
|
|
|
|
|
|
|
|
|
|
Three Months Ended |
Year Ended |
| ($ per Mcf) |
March 31, 2023 |
June 30, 2023 |
Sept. 30, 2023 |
Dec. 31, 2023 |
2023 |
| CANADA |
|
|
|
|
|
| Prices Received |
4.15 |
|
2.78 |
|
2.84 |
|
2.84 |
|
3.06 |
|
Royalties(2) |
(0.07) |
|
0.29 |
|
0.14 |
|
0.19 |
|
0.15 |
|
Production Costs(1) |
(0.65) |
|
(0.52) |
|
(0.51) |
|
(0.51) |
|
(0.54) |
|
Transportation Costs(1) |
(0.42) |
|
(0.36) |
|
(0.37) |
|
(0.58) |
|
(0.44) |
|
| Netback Received |
3.01 |
|
2.19 |
|
2.10 |
|
1.94 |
|
2.23 |
|
| U.S. |
|
|
|
|
|
| Prices Received |
5.22 |
|
3.12 |
|
2.68 |
|
1.08 |
|
3.27 |
|
| Royalties |
(0.92) |
|
(0.70) |
|
(0.71) |
|
(0.42) |
|
(0.73) |
|
Production Costs(1) |
(0.80) |
|
(0.39) |
|
(0.33) |
|
(0.14) |
|
(0.45) |
|
Transportation Costs(1) |
(0.18) |
|
(0.17) |
|
(0.13) |
|
(0.13) |
|
(0.16) |
|
| Netback Received |
3.32 |
|
1.86 |
|
1.51 |
|
0.39 |
|
1.93 |
|
| TOTAL |
|
|
|
|
|
| Prices Received |
4.25 |
|
2.81 |
|
2.82 |
|
2.79 |
|
3.07 |
|
Royalties(2) |
(0.15) |
|
0.21 |
|
0.08 |
|
0.18 |
|
0.10 |
|
Production Costs(1) |
(0.67) |
|
(0.51) |
|
(0.49) |
|
(0.50) |
|
(0.53) |
|
Transportation Costs(1) |
(0.40) |
|
(0.34) |
|
(0.35) |
|
(0.57) |
|
(0.42) |
|
| Netback Received |
3.03 |
|
2.17 |
|
2.06 |
|
1.90 |
|
2.22 |
|
Notes:
(1) Production costs and transportation costs consist of direct costs incurred to operate both oil and gas wells. Costs are allocated between all product types based on a number of assumptions.
(2) In Canada, royalties include the impact of the gas cost allowance.
Prices Received, Royalties, Production Costs and Transportation Costs Incurred – Conventional Natural Gas
|
|
|
|
|
|
|
|
|
|
|
|
|
|
|
|
|
|
|
Three Months Ended |
Year Ended |
| ($ per Mcf) |
March 31, 2023 |
June 30, 2023 |
Sept. 30, 2023 |
Dec. 31, 2023 |
2023 |
| CANADA |
|
|
|
|
|
| Prices Received |
4.49 |
|
2.81 |
|
2.62 |
|
2.67 |
|
3.11 |
|
Royalties(2) |
0.32 |
|
1.70 |
|
0.57 |
|
0.68 |
|
0.77 |
|
Production Costs(1) |
(0.71) |
|
(0.53) |
|
(0.47) |
|
(0.48) |
|
(0.54) |
|
Transportation Costs(1) |
(0.36) |
|
(0.34) |
|
(0.23) |
|
(0.25) |
|
(0.29) |
|
| Netback Received |
3.74 |
|
3.64 |
|
2.49 |
|
2.62 |
|
3.05 |
|
| U.S. |
|
|
|
|
|
| Prices Received |
— |
|
— |
|
— |
|
— |
|
— |
|
| Royalties |
— |
|
— |
|
— |
|
— |
|
— |
|
Production Costs(1) |
— |
|
— |
|
— |
|
— |
|
— |
|
Transportation Costs(1) |
— |
|
— |
|
— |
|
— |
|
— |
|
| Netback Received |
— |
|
— |
|
— |
|
— |
|
— |
|
| TOTAL |
|
|
|
|
|
| Prices Received |
4.49 |
|
2.81 |
|
2.62 |
|
2.67 |
|
3.11 |
|
Royalties(2) |
0.32 |
|
1.70 |
|
0.57 |
|
0.68 |
|
0.77 |
|
Production Costs(1) |
(0.71) |
|
(0.53) |
|
(0.47) |
|
(0.48) |
|
(0.54) |
|
Transportation Costs(1) |
(0.36) |
|
(0.34) |
|
(0.23) |
|
(0.25) |
|
(0.29) |
|
| Netback Received |
3.74 |
|
3.64 |
|
2.49 |
|
2.62 |
|
3.05 |
|
Notes:
(1) Production costs and transportation costs consist of direct costs incurred to operate both oil and gas wells. Costs are allocated between all product types based on a number of assumptions.
(2) In Canada, royalties include the impact of the gas cost allowance.
Production Volume by Field
The following table discloses for each important field, and in total, our production volumes for the year ended December 31, 2023 for each product type.
|
|
|
|
|
|
|
|
|
|
|
|
|
|
|
|
|
|
|
|
|
|
|
|
| Region |
Light and
Medium
Crude Oil |
Heavy Crude Oil |
Tight Oil |
NGLs |
Shale Gas |
Conventional Natural Gas |
Total |
|
(bbls/d) |
(bbls/d) |
(bbls/d) |
(bbls/d) |
(Mcf/d) |
(Mcf/d) |
(boe/d) |
| CANADA |
|
|
|
|
|
|
|
| Kaybob Duvernay |
— |
— |
|
6 |
25,712 |
112,430 |
307 |
44,508 |
| Viewfield |
3,787 |
— |
|
18,344 |
5,258 |
10,278 |
1,112 |
29,287 |
| Montney |
4 |
— |
|
11,466 |
2,779 |
64,132 |
361 |
24,998 |
| Shaunavon |
2,357 |
— |
|
14,171 |
361 |
10,535 |
356 |
18,704 |
| Flat Lake |
3,418 |
— |
|
5,090 |
1,482 |
2,274 |
1,095 |
10,552 |
Other Canada (2) |
3,099 |
3,818 |
|
702 |
1,259 |
865 |
7,530 |
10,277 |
Total CANADA(1) |
12,665 |
3,818 |
49,779 |
36,851 |
200,514 |
10,761 |
138,326 |
| U.S. |
|
|
|
|
|
|
|
| North Dakota |
— |
|
— |
|
14,127 |
4,683 |
13,651 |
— |
|
21,085 |
Total U.S.(1) |
— |
|
— |
|
14,127 |
|
4,683 |
|
13,651 |
|
— |
|
21,085 |
|
Total(1) |
12,665 |
3,818 |
63,906 |
41,534 |
214,165 |
10,761 |
159,411 |
Notes:
(1) Numbers may not add due to rounding.
(2) Includes all remaining assets in Canada.
ADDITIONAL INFORMATION RESPECTING CRESCENT POINT
Directors and Officers
Crescent Point has a board of directors currently consisting of nine individuals. The directors are elected by Shareholders and hold office until the next annual meeting of the Corporation.
The name, municipality of residence and principal occupation during the last five years of each of the directors and executive officers of the Corporation are as follows:
|
|
|
|
|
|
|
|
|
Name and Municipality of Residence |
Position Held with the Corporation |
Date First Elected or Appointed as Director |
Craig Bryksa (4)
Calgary, Alberta |
President, Chief Executive Officer and Director |
2018 |
Kenneth R. Lamont
Calgary, Alberta |
Chief Financial Officer |
Not applicable |
Ryan Gritzfeldt
Calgary, Alberta |
Chief Operating Officer |
Not applicable |
Mark G. Eade
Calgary, Alberta |
Senior Vice President, General Counsel and Corporate Secretary |
Not applicable |
|
Garret Holt
Calgary, Alberta
|
Senior Vice President, Strategy and Planning |
Not applicable |
|
Michael Politeski
Calgary, Alberta
|
Senior Vice President, Finance and Treasurer |
Not applicable |
|
Shelly Witwer
Calgary, Alberta
|
Senior Vice President, Business Development |
Not applicable |
|
Justin Foraie
Calgary, Alberta
|
Vice President, Operations and Marketing |
Not applicable |
Barbara Munroe (6)
Calgary, Alberta |
Director and Chair of the Board |
2016 |
James E. Craddock(2) (3) (5)
Whitney, Texas |
Director |
2019 |
John P. Dielwart (3) (4)
Calgary, Alberta |
Director |
2019 |
Mike Jackson (1) (5)
Calgary, Alberta |
Director |
2016 |
|
Jennifer F. Koury (2) (5)
Calgary, Alberta
|
Director |
2019 |
Francois Langlois (1) (3) (4)
Calgary, Alberta |
Director |
2018 |
|
Myron M. Stadnyk (1) (2) (4)
Calgary, Alberta
|
Director |
2020 |
Mindy Wight (1) (2)
Prince George, British Columbia |
Director |
2022 |
Notes:
(1) Member of the Audit Committee.
(2) Member of the Human Resources and Compensation Committee.
(3) Member of the Reserves Committee.
(4) Member of the Environmental, Safety and Sustainability Committee.
(5) Member of Corporate Governance and Nominating Committee.
(6) Chair of the Board serves in an ex officio capacity on each Committee.
As at February 16, 2024, the directors and executive officers as a group beneficially owned, directly or indirectly, or exercised control or direction over 3,045,632 Common Shares, representing approximately 0.5% of the issued and outstanding Common Shares. Including restricted shares and options, ownership increased to 0.9% on a fully diluted basis.
Craig Bryksa, President, Chief Executive Officer and Director
Craig Bryksa is the President, Chief Executive Officer and a Director of Crescent Point, roles he has held since September 2018. Prior to his current position, Mr. Bryksa was Vice President, Engineering West and has held a number of senior management roles with Crescent Point since joining the Corporation in 2006, directly overseeing the development and operations of each of Crescent Point's core assets.
Mr. Bryksa is the past Chair of the Board of Governors at the Canadian Association of Petroleum Producers ("CAPP"). He has significant experience as a professional engineer in the oil and gas industry, working with companies such as Enerplus Resources Fund and McDaniel & Associates Consultants. Mr. Bryksa is a member of the Association of Professional Engineers and Geoscientists of Alberta ("APEGA") and Association of Professional Engineers and Geoscientists of Saskatchewan ("APEGS"). He holds a Bachelor of Applied Science degree in petroleum engineering from the University of Regina.
Ken Lamont, Chief Financial Officer
Ken Lamont is the Chief Financial Officer of Crescent Point, a role he has held since January 2016. Prior to that, he was Vice President, Finance and Treasurer for Crescent Point. Mr. Lamont has worked in the oil and gas industry since 2001, having held a variety of roles with companies such as Shelter Bay Energy Inc., Direct Energy Marketing Ltd. and Shell Trading Gas and Power Canada Ltd. Prior to 2001, he was a Senior Manager at PricewaterhouseCoopers LLP.
Mr. Lamont holds a Bachelor of Commerce degree (with distinction) from the University of Alberta, is a Chartered Professional Accountant and holds the ICD.D designation. He is a member of the Chartered Professional Accountants of Alberta and a member of the Institute of Corporate Directors.
Ryan Gritzfeldt, Chief Operating Officer
Ryan Gritzfeldt is the Chief Operating Officer of Crescent Point, a role he has held since 2018. Prior to that, he was Vice President, Marketing and Innovation and Vice President, Engineering and Business Development East for Crescent Point from 2010 until 2018. Mr. Gritzfeldt has worked in the oil and gas industry since 1998, having held a variety of roles with companies such as Shelter Bay Energy Inc. and Talisman Energy Inc. in addition to Crescent Point.
Mr. Gritzfeldt is a member of APEGA and APEGS. He holds a Bachelor of Applied Science degree (with great distinction) in industrial systems engineering from the University of Regina.
Mark Eade, Senior Vice President, General Counsel and Corporate Secretary
Mark Eade is the Senior Vice President, General Counsel and Corporate Secretary at Crescent Point. Mr. Eade has served as Corporate Secretary since 2004 and was formerly Vice President, General Counsel and Corporate Secretary. Prior to being named Vice President at Crescent Point in September 2015, he was a partner with Norton Rose Fulbright Canada LLP from August 2011 to August 2015. Prior thereto, Mr. Eade was a partner at McCarthy Tétrault LLP. Mr. Eade has over 30 years of experience in corporate governance, securities and mergers and acquisitions law and has represented clients in a number of significant acquisitions and public offerings.
Mr. Eade holds a Bachelor of Commerce degree (with honors) and a LL.B. degree from the University of Saskatchewan and was called to the Alberta bar in 1994. He is a member of the Law Society of Alberta and the Canadian Bar Association.
Garret Holt, Senior Vice President, Strategy and Planning
Garret Holt is Crescent Point's Senior Vice President, Strategy and Planning, and has been on the company's executive team since 2019. Mr. Holt has over 30 years of experience in the oil and gas industry. Most recently, he was an Executive Director in Energy Investment Banking with JPMorgan. Prior to that, Mr. Holt held senior executive positions with Wapiti Energy, LLC as Chief Operating Officer and Fairways E&P, LLC as Senior Vice President of Exploration and Production.
He graduated from the University of Tulsa with a Bachelor of Science, Petroleum Engineering (Magna Cum Laude) and is a Registered Professional Engineer.
Michael Politeski, Senior Vice President, Finance and Treasurer
Michael Politeski is the Senior Vice President, Finance and Treasurer. He has held an executive role with the Corporation since joining Crescent Point in March 2015. Mr. Politeski has worked in the oil and gas industry since 2003 in various areas, including treasury and debt capital markets, tax, risk management and insurance, corporate reporting, operational accounting and supply chain management. Prior to joining Crescent Point, Mr. Politeski was the Treasurer and Corporate Controller of Enerplus Corporation and held various management roles with Halliburton Canada and KPMG LLP.
Mr. Politeski is a Chartered Professional Accountant and holds a Bachelor of Commerce degree (with distinction) from the University of Saskatchewan. He is a member of the Institute of Chartered Professional Accountants of Alberta.
Shelly Witwer, Senior Vice President, Business Development
Shelly Witwer is Crescent Point's Senior Vice President, Business Development. Since joining the Corporation in 2007, she has held a number of senior management roles, including Vice President, Land and Vice President, Business Development. Ms. Witwer has significant experience in land and business development roles, having worked for companies such as BP Energy, Burlington Resources and Bear Ridge Resources.
Ms. Witwer is a member of the Canadian Association of Petroleum Landmen and the Petroleum Acquisition and Divestment Association. She holds a Bachelor of Commerce degree and a Bachelor of Arts degree in Energy Economics from the University of Calgary.
Justin Foraie, Vice President, Operations and Marketing
Justin Foraie is Crescent Point's Vice President, Operations and Marketing. Mr. Foraie has been with the Corporation since 2009 and has held engineering roles of increasing responsibility, primarily focused on developing the Corporation's United States properties, where he previously served as Vice President, U.S. Operations for CPEUS. Prior to joining Crescent Point, Mr. Foraie worked for Talisman Energy, Inc..
Mr. Foraie has a Bachelor of Applied Science degree in Petroleum Systems Engineering from the University of Regina and is a graduate of the Stanford Graduate School of Business LEAD program. Mr. Foraie became a Registered Professional Engineer in 2008 and is a member of APEGA and Saskatchewan APEGS.
Barbara Munroe, Chair of the Board
Ms. Barbara Munroe was admitted to the Law Society of Alberta in 1991 and brings over 30 years of legal experience and industry diversification to the Board. Prior to retiring in March 2019, Ms. Munroe served as Executive Vice President, Corporate Services and General Counsel for WestJet Airlines, a position she held since November 2016. Ms. Munroe joined WestJet in November 2011 as Vice President & General Counsel and was promoted to Senior Vice President, Corporate Services & General Counsel in June 2015. She was the Assistant General Counsel, Upstream at Imperial Oil Ltd. from 2008 to 2011 and the Senior Vice President, Legal/IP & General Counsel, Corporate Secretary for SMART Technologies Inc. from 2000 to 2008. Ms. Munroe additionally serves as a Director of ENMAX Corporation, as well as a trustee of the Alberta Cancer Foundation.
Ms. Munroe holds the ICD.D designation and is a member of the Institute of Corporate Directors. She holds a Bachelor of Commerce, Finance degree and a Bachelor of Law degree, both from the University of Calgary. As Chair of the Board, Ms. Munroe serves on each committee in an ex officio capacity.
James E. Craddock, Director
Mr. James E. Craddock is a seasoned upstream executive who possesses broad-based technical knowledge with over 30 years of experience. He served on Noble Energy Inc.'s Board of Directors since its merger with Rosetta Resources Inc. from 2015 to 2020 and served as the Chairman, Chief Executive Officer and President of Rosetta from 2013 to 2015. Previously, he was the Executive Director and Chief Operating Officer for BPI Industries Inc. and held several positions of increasing responsibility over a 20-year career at Burlington Resources Inc. Mr. Craddock additionally serves as director of Amplify Energy Corp. and Callon Petroleum Company.
Mr. Craddock holds a Bachelor of Science in Mechanical Engineering from Texas A&M University and previously served on the Boards of Templar Energy and the Texas Railroad Commission's Eagle Ford Task Force.
John P. Dielwart, Director
Mr. John P. Dielwart brings a wealth of experience and knowledge to Crescent Point's Board, developed through his varied 40-year career in the oil and gas sector. Most notably, Mr. Dielwart is a founding member of ARC Resources Ltd., holding the position of Chief Executive Officer from 2001 to 2013. He is also a Partner in ARC Financial Corp., sitting on its Investment and Governance committees where he provides leadership support on various complex issues, including internal governance and investment decision-making. Mr. Dielwart is also Chairman of the Board of TransAlta Corporation. Prior to joining ARC in 1996, Mr. Dielwart spent 12 years with a major Calgary based oil and natural gas engineering consulting firm, as Senior Vice-President and a Director, where he gained extensive technical knowledge of oil and natural gas properties in Western Canada.
Mr. Dielwart has a Bachelor of Science in Civil Engineering with Distinction from the University of Calgary. He is a professional engineer, holds the ICD.D designation granted by the Institute of Corporate Directors and has served two three-year terms as a Governor of CAPP, including 18 months as Chair.
Mike Jackson, Director
Mr. Mike Jackson worked in the banking industry from 1984 to 2016 and brings more than 30 years of financial experience in corporate and investment banking. Most recently, he was Managing Director - Investment Banking, Scotiabank Global Banking and Markets, with a focus on the oil and gas industry from 2008 until his retirement in 2016. Prior to that, Mr. Jackson held several senior management roles at Scotiabank, including Managing Director, Oil & Gas Industry Head & Calgary Office Head from 1999 to 2007 and Vice President & Office Head, Corporate Banking Calgary from 1997 to 1999.
Mr. Jackson holds a Bachelor of Science degree and a Master of Business Administration, both from Dalhousie University. Additionally, Mr. Jackson completed the Executive Management Program at Queen's University and holds the ICD.D designation granted by the Institute of Corporate Directors.
Jennifer F. Koury, Director
Ms. Jennifer F. Koury has over 35 years of professional experience, holding various senior executive positions with BHP Biliton from 2011 to 2017. Part of her responsibilities included the development of BHP Billiton's total rewards program for executives and employees of the Petroleum World-Wide Business. Prior to that, she was Vice President of Corporate Services for Enerplus Corp. from 2006 to 2011 and also held senior management positions with Imperial Oil/Exxon Mobil.
Ms. Koury serves as the Vice-Chair of the Board for the Calgary Zoo, Director for Board Ready Women and Director for Bird Construction. She holds a Bachelor of Commerce degree from the University of Alberta and the ICD.D designation granted by the Institute of Corporate Directors.
François Langlois, Director
Mr. Langlois is an oil and gas executive who brings over 35 years of domestic and international experience to the Crescent Point Board, most recently from his role as Senior Vice President, Exploration & Production with Suncor Energy Inc., where he was responsible for the financial and operating performance of the group from 2011 until his retirement in 2016. Prior thereto, he was Vice President, Unconventional Gas from 2009 to 2010 and held various roles with Petro-Canada from 1982 to 2009, most recently as Vice President, Western Canada Production & North American Exploration.
Mr. Langlois holds a Bachelor of Geological Engineering from Laval University (Quebec City) and the ICD.D designation granted by the Institute of Corporate Directors.
Myron M. Stadnyk, Director
Mr. Myron M. Stadnyk has over 35 years of oil and gas experience and is the former President and CEO of ARC Resources Ltd., retiring in 2020. During his tenure as CEO, and prior to that as COO, Mr. Stadnyk played a pivotal role in ARC’s transformation from a Royalty trust to a leading Canadian producer. His extensive career also includes working for a major oil and gas company in both domestic and international operations.
Mr. Stadnyk earned a Bachelor of Science in Mechanical Engineering from the University of Saskatchewan and is a graduate of the Harvard Business School Advanced Management Program. He holds an ICD.D designation and is a member of APEGA.
Mr. Stadnyk formerly held a position on the Board of Directors at PrairieSky Royalty Ltd. and served as a Governor for CAPP for over a decade. Currently, Mr. Stadnyk is a board member of Vermilion Energy Inc. and serves on the Board of Trustees for the University of Saskatchewan Engineering Advancement Trust.
Mindy Wight, Director
Ms. Mindy Wight brings over 15 years of tax and financial expertise from her current role of Chief Executive Officer for the Nch'kay Development Corporation. She previously held the role of Chief Financial Officer, as well as holding the role as Treasurer of the Board of Directors.
Prior to joining Nch'kay Development Corporation in November 2021, Ms. Wight held progressive tax roles at MNP LLP from 2016 to 2021 and most recently was a partner and National Leader of Indigenous Tax Services for the firm. Ms. Wight has also worked for two of the Big Four National accounting firms, the Chartered Accounting School of Business and the Canada Revenue Agency since graduating from the University of Northern British Columbia with a Bachelor of Commerce Degree, Accounting in 2007. Ms. Wight also possesses Chartered Professional Accountant, Chartered Accountant, and Certified Aboriginal Financial Manager designations.
Ms. Wight has historically held Board positions as the Chair of the Board of Directors and Chair of the Finance and Audit Committee for the Nch'kay Development Corporation and was an Advisory Committee Member of the Budget and Financial Committee to the Squamish Nation.
Bankruptcies and Cease Trade Orders
No director, executive officer or shareholder holding a sufficient number of securities to affect materially the control of the Corporation is, as of the date of this AIF, or has been, within the last 10 years, been a director or executive officer of any company (including the Corporation) that, while such person was acting in that capacity, was the subject of a cease trade or similar order or an order that denied the Corporation access to any statutory exemption for a period of more than 30 consecutive days or was declared a bankrupt or made a voluntary assignment in bankruptcy, made a proposal under any legislation relating to bankruptcy or been subject to or instituted any proceedings, arrangement or compromise with creditors or had a receiver, receiver-manager or trustee appointed to hold the assets of that person, except for Mr. Dielwart, who was a director of Denbury Resources Inc. when it entered into Chapter 11 proceedings in the United States on July 30, 2020. Denbury Resources Inc. subsequently emerged from Chapter 11 proceedings on September 18, 2020 and Mr. Dielwart resigned as a director of Denbury Resources Inc. at that time.
Penalties or Sanctions
No director, executive officer or shareholder holding a sufficient number of securities to affect materially the control of the Corporation, within the last 10 years, has been subject to any penalties or sanctions imposed by a court or securities regulatory authority relating to trading in securities, promotion or management of a publicly traded issuer or theft or fraud.
Personal Bankruptcies
No director, executive officer or shareholder holding a sufficient number of securities to affect materially the control of the Corporation, or a personal holding company of any such persons, has, within the 10 years preceding the date of this AIF, become bankrupt, made a proposal under any legislation relating to bankruptcy or insolvency, or being subject to or instituted any proceedings, arrangement or compromise with creditors or had a receiver, receiver manager or trustee appointed to hold the assets of the individual.
Share Capital
The Corporation is authorized to issue an unlimited number of Common Shares.
Common Shares
Each Common Share entitles its holder to receive notice of and to attend all meetings of the Shareholders of the Corporation and to one vote at such meetings. The holders of Common Shares are, at the discretion of the Board of Directors and subject to applicable legal restrictions, entitled to receive any dividends declared by the Board of Directors. The holders of Common Shares are entitled to share equally in any distribution of the assets of the Corporation upon the liquidation, dissolution, bankruptcy or winding up of the Corporation or other distribution of its assets among its Shareholders for the purpose of winding up its affairs. Such participation is subject to the rights, privileges, restrictions and conditions attaching to any other shares having priority over the Common Shares.
Premium DividendTM and Dividend Reinvestment Plan
The DRIP was in effect from 2010 until August 2015, when it was suspended.
Under the Corporation's DRIP, eligible Shareholders may, at their option, reinvest their cash dividends to purchase additional Common Shares at 95% of the average market price (as defined in the DRIP) of a Common Share on the applicable distribution date. The DRIP also provides an alternative where eligible Shareholders may elect, under the premium dividend component, to receive a premium cash distribution equal to 102% of the reinvested cash dividends that such Shareholders would have otherwise been entitled to receive on the applicable dividend date. Generally, no commissions, service charges or brokerage fees will be payable by Shareholders who participate in the DRIP. We have reserved the right to determine how much new equity is available under the Plan on any particular distribution date. Accordingly, participation in the DRIP may be pro-rated in certain circumstances.
Registered and beneficial owners of Common Shares who are not resident in Canada are not eligible to participate in the DRIP.
Share Dividend Plan
The SDP was in effect from May 9, 2014 until it was suspended on August 12, 2015.
Under the terms of the SDP, eligible Shareholders may, at their option, elect to receive dividends declared on Common Shares as share dividends rather than cash dividends, where such share dividends are declared by the Board of Directors, to be payable in either cash or Common Shares at the election of the Shareholder. Share dividends are satisfied through the issuance of new Common Shares equal to the amount obtained by dividing the dollar amount of the dividend per Common Share by 95% of the average market price (as defined in the SDP) on the TSX. Generally, no commissions, service charges or brokerage fees will be payable by Shareholders who participate in the SDP. Under the SDP, we have reserved the right to determine how much new equity is available under the SDP on any particular distribution date. Accordingly, participation in the SDP may be pro-rated in certain circumstances.
Unlike the dividend reinvestment component of the DRIP, which gives only Shareholders resident in Canada the option to reinvest cash dividends into Common Shares at a 5% discount to market prices, the SDP provides all Shareholders with the option to receive dividends in the form of Common Shares at a 5% discount to current market prices.
Restricted Share Bonus Plan
Under the terms of the Corporation's Restricted Share Bonus Plan, any director, officer or employee of the Corporation who, in each case, in the opinion of the Board of Directors, hold an appropriate position with the Corporation to warrant participation in the Restricted Share Bonus Plan (collectively, the "RSBP Participants") may be granted restricted shares ("Restricted Shares") which vest over time and, upon vesting, can be redeemed by the holder for cash or Common Shares at the option of the Corporation. The Restricted Share Bonus Plan is administered by the Board of Directors. Under the Restricted Share Bonus Plan at December 31, 2023 the Corporation is authorized to issue up to 9,774,533 Common Shares, of which the Corporation had 1,380,685 Restricted Shares outstanding at December 31, 2023.
The Restricted Shares vest on terms up to three years from the grant date as determined by the Board of Directors. Upon redemption, the Corporation will be required to pay to the RSBP Participant the fair market value of the redeemed Restricted Shares, based on the weighted average of the prices at which the Common Shares traded on the TSX for the five trading days immediately preceding the redemption date, plus any accrued but unpaid dividend amounts in respect of such Restricted Shares (the "Payout Amount"). The Payout Amount may be satisfied by the Corporation making a cash payment, the Corporation purchasing Common Shares in the market and delivering such Common Shares to the RSBP Participant or by issuing Common Shares from treasury.
DSU Plan
In 2012, the Corporation established a deferred share unit plan (the "DSU Plan") to enhance its ability to attract and retain key personnel (namely, selected officers and employees and non-employee directors) and reward significant performance achievements. Under the terms of the DSU Plan, Designated Employees and Directors (as defined in the DSU Plan), who, in the opinion of the Board of Directors, warrant participation in the DSU Plan (the "Participants"), may be granted deferred share units ("Units"). As at the date hereof, only non-employee directors have been granted DSUs.
Participants that are directors must elect to receive Units in lieu of a cash retainer prior to the year in which the retainer will be earned, unless they are elected or appointed part way through a year, in which case they must elect within 30 days of being elected or appointed to receive Units for that year. Participants that are Designated Employees must elect to receive Units in lieu of all or a portion of their annual bonus entitlement or profit share for the year within 30 days after such Designated Employee has been notified by the Corporation of such individual's bonus entitlement or profit share for such year.
The Corporation establishes an account for each Participant and all Units are credited to the applicable account as of the award date. The number of Units to be credited to an account is determined by dividing the dollar amount elected by the Participant by the five day weighted average closing price of the Common Shares on the TSX immediately prior to the award date. On the last day of each fiscal quarter of the Corporation or as soon as possible thereafter, the Corporation determines whether any dividend has been paid on Common Shares during such fiscal quarter and, if so, the rate thereof per Common Share (the "Dividend Rate") and, within 10 business days of the applicable fiscal month end, the Corporation credits each applicable account with an additional number of Units equal to (i) the number of Units in the applicable account on the record date for such dividend multiplied by (ii) the Dividend Rate. All Units vest immediately upon being credited to a Participant's account.
A Participant is not entitled to any payment of any amount in respect of Units until such Participant ceases to be an employee or director of the Corporation, as the case may be, for any reason whatsoever. Upon the Participant ceasing to be an employee or director of the Corporation, the Participant is entitled to receive a lump sum cash payment, net of applicable withholding taxes, equal to the product of (i) the number of Units in such Participant's account on the date the Participant ceased to be an employee or director and (ii) the five day weighted average closing price of the Common Shares on the TSX immediately prior to such date, unless the redemption event occurs during a black out period, in which case the amount of such payment will be calculated with reference to the five day weighted average closing price of the Common Shares on the TSX on the fifth business day following the end of such black out period. The Corporation will make such lump sum cash payment by the end of the calendar year following the year in which the Participant ceased to be an employee or director.
On March 10, 2015, the Board amended the DSU Plan to include provisions that govern citizens and residents in conformity with Section 409A of the U.S. Internal Revenue Code. This amendment was made to clarify and explicitly disclose certain tax consequences associated with participation in the DSU Plan by eligible U.S. citizens and U.S. residents.
The Corporation had 1,728,423 DSUs outstanding at December 31, 2023.
PSU Plan
In 2017, the Corporation adopted the PSU Plan, which is administered by the Board of Directors. The purposes of the PSU Plan are: (i) to promote alignment of interests between participants in the PSU Plan and Shareholders by providing the participants with an opportunity to participate in an increase in the equity value of the Corporation, taking into account the performance of the Corporation relative to its peers and targets established by the Board; (ii) to provide participants in the PSU Plan with compensation reflective of their responsibility, commitment and risk accompanying their role over the long-term; and (iii) to provide a retention incentive to participants in the PSU Plan over the long-term. Under the terms of the PSU Plan, the Compensation Committee may designate employees of the Corporation or its affiliates who are eligible to receive performance share units ("PSUs"). PSUs are notional grants of share-based compensation units that entitle the holder to a cash payment upon redemption of the PSU.
Unlike Restricted Shares, PSUs do not automatically vest over time. Instead, vesting is dependent on the achievement of various corporate performance metrics over a three year performance period.
The vested number of PSUs relating to a given performance period are paid out in cash based on the volume weighted average trading price of the Common Shares on the TSX over the five business days subsequent to the end of the performance period for the applicable PSUs, plus the dividends paid during the applicable performance period. For PSUs that were granted in 2023 or later, the vested number of PSUs relating to a given performance period are paid out in cash based on the volume weighted average trading price of the Common Shares on the TSX over the five business days subsequent to the end of the performance period for the applicable PSUs. Dividends paid during the applicable performance period are reinvested in additional PSUs, which vest on the vest date of the original grant.
Based on underlying units prior to any effect of the performance multiplier, the Corporation had 1,623,248 PSUs outstanding at December 31, 2023.
Stock Option Plan
The Corporation has made no stock option ("Options") grants since 2021 and does not intend to grant Options in the future.
The Corporation adopted the Stock Option Plan in early 2018, with the purpose of rewarding those persons who promote the growth and success of the Corporation and assisting the Corporation in attracting, motivating and retaining personnel. The Stock Option Plan was approved by the Shareholders at the Corporation's annual meeting of shareholders on May 4, 2018 and amended to reduce the maximum number of Common Shares issuable under the Stock Option Plan at the Corporation's annual meeting of shareholders on May 14, 2020.
Pursuant to the terms of the Stock Option Plan, a maximum of 10,000,000 Common Shares may be issuable upon the exercise of Options granted under the Stock Option Plan (subject to adjustment for any subdivision or consolidation of the Common Shares). As at December 31, 2023, there were 3,224,260 Options to purchase Common Shares outstanding. Additionally, the number of Common Shares issuable to insiders of the Corporation (as defined in the Company Manual of the TSX) in any one year period, or at any time when combined with Common Shares issued or issuable under any of the Corporation's other security-based compensation plans, may not exceed 10% of the issued and outstanding Common Shares, and no one insider (or associates of that insider, as defined in the Company Manual of the TSX) may be issued more than 5% of the issued and outstanding Common Shares in any one year period. Non-employee directors are not entitled to participate in the Stock Option Plan. No Options shall be granted to any participant if the total number of Common Shares issuable to or on behalf of such participant under the Stock Option Plan, together with any Common Shares reserved for issuance to such participant under any other share compensation or incentive mechanism of the Corporation (which includes RSUs issued under the Restricted Share Bonus Plan) would exceed 5% of the aggregate issued and outstanding Common Shares.
The Board of Directors administer the Stock Option Plan, and will from time to time designate officers and employees of the Corporation who are entitled to participate in the Stock Option Plan, and determine the number and exercise price of Options to be granted to such participants. Non-employee directors are prohibited from participating in the Stock Option Plan. Under the Stock Option Plan, the exercise price of Options is determined by the Board of Directors at the time of grant, but will not be less than permitted by the applicable rules and policies of the TSX. Subject to the vesting provisions of the Stock Option Plan, Options may be: (i) exercised by paying the Corporation the exercise price in exchange for Common Shares; (ii) surrendered to the Corporation in exchange for a cash payment representing the aggregate difference between the market price of the Common Shares and the exercise price of the Options surrendered; or (iii) surrendered to the Corporation in exchange for a number of Common Shares equivalent in value (based on the market price) to the aggregate difference between market price of the Common Shares and the exercise price of the Options surrendered.
Unless the Board of Directors determine otherwise, Options granted pursuant to the Stock Option Plan will have a term of seven years, subject to early expiry in accordance with the change in control and other provisions of the Stock Option Plan. All Options are granted pursuant to stock option agreements executed at the time of grant by the Corporation and the grantee.
Employee Share Value Plan
In early 2020, the Corporation adopted an Employee Share Value Plan ("ESVP") for certain employees in lieu of grants that would have previously been made under the Restricted Share Bonus Plan. Under the terms of the ESVP, any employee of the Corporation who, in each case, in the opinion of the Board of Directors, holds an appropriate position with the Corporation to warrant participation in the ESVP (collectively, the "ESVP Participants") may be granted rights ("Awards") which vest over time and, upon vesting, entitle the participant to receive a cash payment for each Award equal to the five day weighted average trading price on the TSX of the Common Shares immediately preceding the vesting date plus an amount equal to the aggregate amount paid by the Corporation in dividends per Common Share from the grant date of an Award to and including the vesting date (collectively, the "Payout Value"). ESVP Participants do not have any right to receive Common Shares in respect of vested Awards.
Awards vest as to 33 1/3% on each of the first, second and third anniversaries of the grant date as determined by the Board of Directors. Upon vesting of an Award, the Corporation is required to pay to an ESVP Participant the Payout Value within 15 business days of vesting and, in all cases, prior to December 31 of the year of vesting.
The Employee Share Value Plan is administered by the Board of Directors. At December 31, 2023, there were 2,660,066 awards outstanding.
Long-Term Debt - Bank Debt
At December 31, 2023, the Company had combined revolving facilities (the “Credit Facilities”) of $2.76 billion and a $750.0 million syndicated term loan (the “Term Loan”).
The revolving Credit Facilities include a $2.26 billion syndicated unsecured credit facility (the “Syndicated Credit Facility”) with eleven banks and a $100 million unsecured operating credit facility with one Canadian chartered bank (the "Bi-Lateral Credit Facility"), both with a current maturity date of November 26, 2026. On May 10, 2023, concurrent with the closing of the Alberta Montney acquisition, Crescent Point entered into an additional $400.0 million syndicated unsecured revolving credit facility (the “Syndicated Liquidity Credit Facility”) with ten banks that matures on May 10, 2025.
The Syndicated Credit Facility and the Bi-Lateral Credit Facility's interest rate is based on either Canadian prime rate, U.S. base rate, Secured Overnight Financing Rate or bankers' acceptance rates at the Corporation's option subject to certain basis point or stamping fee adjustments ranging from 0.25% to 3.15%, depending on the Corporation's senior debt to earnings before interest, taxes, depreciation and amortization, adjusted for certain non-cash items ("adjusted EBITDA") ratio. The Syndicated Liquidity Credit Facility’s adjustments for its interest rate is subject to certain basis point or stamping fee adjustments ranging from 0.45% to 4.00%. The Credit Facilities are guaranteed by certain restricted subsidiaries currently being CPEUS, CPHL and the Partnership. Various borrowing options are available under the Credit Facilities, including Canadian prime rate-based advances, U.S. base rate-based advances, Secured Overnight Financing Rate loans and bankers' acceptance loans. The Syndicated Credit Facility and Bi-Lateral Credit Facility constitute revolving credit facilities and are extendible annually. The Credit Facilities contain standard commercial covenants for facilities of this nature. Distributions to Shareholders and share repurchases are not permitted if the Corporation is in default of the Credit Facilities or if the making of such distribution would cause an event of default. The Corporation does not have a borrowing base restriction respecting its Credit Facilities.
On December 21, 2023, concurrent with the closing of the Hammerhead Acquisition, the Company entered into the Term Loan with twelve banks that matures on November 26, 2026 and is repayable at any time with no penalty, provided that prepayments using the proceeds of advances under the Credit Facilities may only be made if no less than 15% of total commitments thereunder will remain undrawn on a pro forma basis after giving effective to any and all such prepayments. The Term Loan interest rate is based on either the Canadian prime rate or Canadian Overnight Repo Rate Average at the Corporation's option subject to certain basis points adjustments ranging from 2.00% to 3.00%. The Term Loan is guaranteed by certain restricted subsidiaries currently being CPEUS, CPHL and the Partnership. The Term Loan has financial covenants similar to those of the Credit Facilities described above and includes certain mandatory repayment provisions with cash proceeds received from future issuances of equity securities, debt securities and proceeds received from property dispositions.
At December 31, 2023, the Corporation had approximately $2.72 billion drawn under its Credit Facilities and Term Loan.
Long-Term Debt - Senior Guaranteed Notes
At December 31, 2023, the Corporation had approximately $883.4 million of senior guaranteed notes (the “Senior Guaranteed Notes") outstanding of which $380.0 million become due within one year excluding the value of underlying cross currency swaps. The Senior Guaranteed Notes are unsecured and rank pari passu with the Corporation’s Credit Facilities and carry a bullet repayment on maturity. The Senior Guaranteed Notes have financial covenants similar to those of the Credit Facilities described above. Concurrent with the issuance of US$517.0 million Senior Guaranteed Notes, the Corporation entered into cross currency swaps to hedge its foreign exchange exposure, fixing a notional amount of $606.9 million for the purpose of interest and principal repayments.
INDUSTRY CONDITIONS
The oil and natural gas industry is subject to extensive controls and regulations imposed by various levels of government. It is not expected that any of these controls or regulations will affect our operations in a manner materially different than they would affect other oil and gas entities of similar size. All current legislation is a matter of public record, and we are unable to predict what additional legislation or amendments may be enacted.
Pricing and Marketing - Oil
In Canada, producers of oil negotiate sales contracts directly with oil purchasers. Oil prices are primarily based on worldwide and North American supply and demand. The specific price paid depends in part on oil quality, prices of competing fuels, distance to market, the value of refined products and the supply/demand balance.
Oil exports from Canada may be made pursuant to an export contract with a term not exceeding one year in the case of light crude oil, and not exceeding two years in the case of heavy crude oil, provided that an order approving any such export has been obtained from the Canada Energy Regulator (the "CER"). Any oil export to be made pursuant to a contract of longer duration (to a maximum of 25 years) requires an exporter to obtain an export license from the CER and the issue of such a license requires the approval of the Governor in Council.
In the United States, transportation of crude oil is subject to rate and access regulation. The Federal Energy Regulatory Commission (the "FERC") regulates interstate crude oil pipeline transportation rates under the Interstate Commerce Act of 1887 (the "ICA"). In general, such pipeline rates must be cost-based. The FERC requires that pipelines regulated under the ICA file tariffs setting forth the rates and terms and conditions of service. Such rates and terms and conditions may not be discriminatory or preferential. A pipeline may also file cost-of-service based rates if rate indexing will be insufficient to allow the pipeline to recover its costs. Intrastate crude oil pipeline transportation rates may be subject to regulation by state regulatory commissions. The basis for intrastate pipeline regulation, and the degree of regulatory oversight and scrutiny given to intrastate crude oil pipeline rates, varies from state to state.
On December 18, 2015, the U.S. Congress passed, and the President signed, legislation into law which repealed the 40-year old ban on exports of crude oil produced in the United States. Accordingly, most exports of domestically-produced crude oil may be made without an export license. Only exports to embargoed or sanctioned countries continue to require authorization from the U.S. Department of Commerce.
Pricing and Marketing - Natural Gas
In Canada, the price of natural gas sold intra-provincially or to the United States is determined by negotiation between buyers and sellers. In the United States, the price of inter-state or international sales is determined by negotiation between buyers and sellers based upon factors normally considered in the industry such as distance from well to pipeline, pressure, and quality. Natural gas exported from Canada is subject to regulation by the CER and the Government of Canada, and in the United States is regulated principally by the FERC and the United States Department of Energy (the "DOE"). The FERC, which has the authority under the Natural Gas Act of 1938 (the "NGA") to regulate prices, terms and conditions for the sale of natural gas for resale in interstate commerce, has issued blanket authorizations for all gas resellers subject to FERC regulation, except interstate pipelines, to resell natural gas at market prices. In addition, under the provisions of the Energy Policy Act of 2005, the NGA was amended to prohibit market manipulation in connection with the purchase or sale of natural gas and the FERC established regulations to increase natural gas pricing transparency by requiring certain market participants to report their gas sales transactions annually to the FERC. Facilities used in the production or gathering of natural gas in interstate commerce are generally exempted from FERC jurisdiction. Although FERC has set forth a general test to determine whether facilities are exempt from FERC jurisdiction as "gathering" facilities, FERC's determinations as to the classification of facilities are performed on a case-by-case basis and FERC has the authority to reclassify facilities previously thought to be non-jurisdictional. The FERC regulates interstate natural gas transportation rates and service conditions under the NGA and the Natural Gas Policy Act of 1978 (the "NGPA"), which affects the marketing of natural gas, as well as revenues we may receive for sales of our natural gas. Intrastate natural gas transportation service is also subject to regulation by state regulatory agencies.
In both Canada and the United States, exporters are free to negotiate prices and other terms with purchasers, provided that the export contract meets certain criteria prescribed by the CER and the Government of Canada or, in relation to United States exports, restrictions on export licenses imposed by the DOE. Natural gas may not be exported from Canada without a license or order from the CER or imported into the United States or exported from the United States without a license from the DOE. Licenses to export or import natural gas may include various terms and conditions with respect to duration, quantity, tolerance levels, points of exportation or importation, environmental requirements, among other factors and, in Canada, for export, may be obtained for a period that does not exceed 40 years. In Canada the approval of the Minister of Natural Resources and the Governor in Council is currently required prior to the issuance of a license to export natural gas. Alternatively, natural gas may be exported from Canada pursuant to an order from the CER. Orders may be obtained for a period of two years or less or for a period greater than two years but less than 20 years, where the quantity is not more than 30,000 m3/day. Orders do not require the approval of the Governor in Council or the Minister of Natural Resources. Any person who imports oil or gas into Canada must provide prescribed information in the prescribed form and manner to the CER, but does not require a license. In the United States, the DOE regulates the exportation and importation of natural gas, including liquefied natural gas. U.S. law provides for very limited regulation of exports to and imports from any country that has entered into a free trade agreement with the United States that provides for national treatment of trade in natural gas, however, the DOE's regulation of imports and exports from and to countries without such free trade agreements is more comprehensive. The FERC also regulates the construction and operation of import and export facilities.
The Canada-United States-Mexico Agreement and The North American Free Trade Agreement
On July 1, 2020, the Canada-United States-Mexico Agreement ("CUSMA") came into force replacing the North American Free Trade Agreement ("NAFTA").
Relevant to the energy industry, CUSMA does not contain the proportionality rules found in NAFTA's Article 605 whereby Canada remained free to restrict exports to the U.S. or Mexico provided that such export restrictions did not: (i) reduce the proportion of the energy resource exported relative to the total supply of that energy resource in Canada as compared to the proportion prevailing in the most recent 36-month period; (ii) impose an export price higher than the domestic price; and (iii) disrupt normal channels of supply.
CUSMA also eliminated certain tariffs on some diluents used to transport heavy oil from Canada to the U.S.
There has been little to no effect on Canada's energy industry by the ratification of CUSMA and Crescent Point has experienced little to no change to its operations or marketing activities as a result of the ratification of CUSMA.
Royalties and Incentives
In addition to federal regulation, each province has legislation with respect to oil and gas activities, governing matters such as land tenure, royalties, production rates, environmental protection and other matters. In all Canadian jurisdictions where we operate, producers of oil and natural gas are required to pay annual rental payments in respect of Crown leases and royalties and freehold production taxes in respect of oil and natural gas produced from Crown and freehold lands, respectively. The royalty regime is a significant factor in the profitability of oil and natural gas production. Royalties payable on production from lands other than Crown lands are determined by negotiations between the mineral owner and the lessee. Crown royalties are determined by governmental regulation and are generally calculated as a percentage of the value of the gross production, and the rate of royalties payable generally depends in part on prescribed reference prices, well productivity and depth, geographical location, field discovery date and the type or quality of the petroleum product produced.
From time to time, the governments of Canada, Alberta and Saskatchewan have established incentive programs which have included royalty rate reductions, royalty holidays and tax credits for the purpose of encouraging oil and natural gas exploration or enhanced production projects. Such programs are generally introduced when commodity prices are low, and are designed to encourage exploration and development activity by improving earnings and cash flow within the industry. These programs reduce the amount of Crown royalties otherwise payable.
Alberta
In terms of oil or natural gas production from Crown lands, royalties are payable to the Province of Alberta. In respect of freehold lands, royalties are payable to the mineral owner and taxes are payable to the Province of Alberta. The Government of Alberta's approach to the royalty and tax regime is regularly reviewed for compliance with the purpose of the regimes to ensure that Albertans are receiving a fair share from energy development through royalties, taxes and fees.
On January 1, 2017, Alberta adopted a new, modernized Alberta royalty framework (the "Modernized Framework") that applies to all wells drilled after December 31, 2016. The previous royalty framework (the "Old Framework") continues to apply to wells drilled prior to January 1, 2017 for a period of ten years ending on December 31, 2026. After the expiry of this ten-year period, these older wells will become subject to the Modernized Framework.
The Modernized Framework applies to all hydrocarbons other than oil sands, which remain subject to their pre-existing royalty regime. Royalties on production from non-oil sands wells under the Modernized Framework are determined on a "revenue-minus-costs" basis with the cost component based on a Drilling and Completion Cost Allowance formula for each well, depending on its vertical depth and horizontal length. The formula is based on the industry's average drilling and completion costs as determined by the AER on an annual basis.
Producers pay a flat royalty rate of 5% of gross revenue from each well that is subject to the Modernized Framework until the well reaches payout. Payout for a well is the point at which cumulative gross revenues from the well equals the Drilling and Completion Cost Allowance for the well set by the AER. After payout, producers pay an increased post-payout royalty on revenues determined by reference to the then current commodity prices of the various hydrocarbons. Similar to the Old Framework, the post-payout royalty rate under the Modernized Framework varies with commodity prices. Once production in a mature well drops below a threshold level where the rate of production is too low to sustain the full royalty burden, its royalty rate is adjusted downward as the mature well's production declines.
As the Modernized Framework uses deemed drilling and completion costs in calculating the royalty and not the actual drilling and completion costs incurred by a producer, low cost producers benefit if their well costs are lower than the Drilling and Completion Cost Allowance and, accordingly, they continue to pay the lower 5% royalty rate for a period of time after their wells achieve actual payout.
The Old Framework is applicable to all conventional oil and natural gas wells drilled prior to January 1, 2017 and bitumen production. Subject to certain available incentives, effective from the January 2011 production month, royalty rates for conventional oil production under the Old Framework range from a base rate of zero to a cap of 40%.
The Old Framework also includes a natural gas royalty formula, which formula provides for a reduction based on the measured depth of the well below 2,000 metres deep, as well as the acid gas content of the produced gas. Subject to certain available incentives, effective from the January 2011 production month, royalty rates for natural gas production under the Old Framework range from a base rate of 5% to a cap of 36%.
Under the Old Framework, the royalty rate applicable to natural gas liquids is a flat rate of 40% for pentanes and 30% for butanes and propane.
In terms of oil and natural gas production obtained from lands other than Crown lands, taxes are payable to the Province of Alberta. Approximately 19% of the mineral rights in the Province of Alberta are freehold mineral rights not owned by the Alberta Crown. The tax levied in respect of freehold oil and gas production in the Province of Alberta is calculated annually based on a rate dependent on the prescribed tax rate, the quantity of produced oil or gas, and the unit value of the produced oil or gas.
Incentive Programs
A number of incentive programs, including the Enhanced Oil Recovery Royalty Program (the "EOR Program") were created pursuant to the Old Framework.
Under the EOR Program, Alberta Energy may approve royalty reductions for qualifying enhanced oil recovery projects. Applications under the EOR Program ceased being accepted as of December 31, 2016, however, the EOR Program continues to apply to schemes previously approved thereunder, and will continue to so apply until December 31, 2026.
Under the Modernized Framework, two strategic programs were introduced with the intention of promoting expanded production potential and generating long-term returns to the Province of Alberta.
The Enhanced Hydrocarbon Recovery Program (the "EHR Program") began January 1, 2017, and replaced the EOR Program. The EHR Program is intended to promote incremental production through enhanced recovery methods and consists of two main components. The first component targets tertiary recovery schemes which enhance recovery of hydrocarbons from an oil or gas pool by miscible flooding, immiscible flooding, solvent flooding, chemical flooding or other approved methods. The second component targets secondary recovery schemes which enhance recovery of hydrocarbons from an oil or gas pool by waterflooding, gas cycling, gas flooding, polymer flooding or other approved methods. Under both components of the program, a company pays a flat royalty of 5% on crude oil, natural gas and natural gas liquids produced from wells in an approved scheme for a limited benefit period. After the benefit period ends, wells in these schemes are subject to normal royalty rates under the Modernized Framework.
The Emerging Resources Program (the "ERP") began January 1, 2017. The ERP is intended to encourage industry to open up new oil and gas resources in higher-risk and higher-cost areas that have large resource potential. For the purposes of the ERP, a project consists of a defined geographic area, target formation, set of wells and associated infrastructure. Wells that receive program benefits pay a flat royalty rate of 5% on revenues until their combined revenue equals their combined program specific cost allowances established under the ERP, which replace the standard Drilling and Completion Cost Allowance under the Modernized Framework in respect of such wells. After achieving payout of the specific cost allowance, wells are subject to normal royalty rates under the Modernized Framework.
Saskatchewan
With respect to production obtained from provincial Crown lands in the Province of Saskatchewan, the amount payable as a royalty in respect of crude oil depends on the vintage of the oil, the type of oil, the quantity of oil produced in a month and the price of the oil. For both Crown royalty and freehold production tax purposes, crude oil is categorized by oil type as "heavy oil", "southwest designated oil" or "non-heavy oil other than southwest designated oil". Additionally, the oil in each category is subdivided according to the conventional royalty and production tax classifications as "fourth tier oil", "third tier oil", "new oil", or "old oil". The royalty reserved to the Crown depends on the categorization and classification of the oil, monthly production, and a prescribed reference price determined monthly by the Saskatchewan Ministry of Energy and Resources ("SMER").
Similarly, the amount payable as a royalty in respect of natural gas in the Province of Saskatchewan depends on the vintage of the gas, the type of gas production, the quantity of gas produced in a month, and the price of the gas. For both provincial Crown royalty and freehold production tax purposes, natural gas is categorized as either non-associated gas or associated gas, the former being gas produced from gas wells and the latter being gas produced from oil wells. Additionally, the gas is divided according to the royalty and production tax classifications as "fourth tier gas", "third tier gas", "new gas", or "old gas". The royalty reserved to the Crown depends on the categorization and classification of the natural gas, monthly production, and a reference price prescribed by the SMER. As an incentive for the production and marketing of natural gas which may otherwise have been flared, the royalty rate on associated gas is less than on non-associated natural gas.
Approximately 17% of the mineral rights in the Province of Saskatchewan are freehold mineral rights not owned by the provincial Crown. With respect to production from freehold lands, the tax levied on oil and gas production in the Province of Saskatchewan will depend on the classification of the oil or gas and the relevant Crown royalty rate.
Incentive Programs
On October 1, 2002, a modified system of incentive volumes and maximum royalty/tax rates applicable to the initial production from qualifying oil wells and gas wells in the Province of Saskatchewan with a finished drilling date on or after October 1, 2002, was introduced. The incentive volumes are applicable to various well types and are subject to a maximum royalty rate of 2.5% and a freehold production tax rate of 0%. In addition, oil produced from Enhanced Oil Recovery ("EOR") projects that commenced operation prior to April 1, 2005 are subject to a cost sensitive royalty regime determined by prescribed formulas which include a number of variables and which differentiate between pre- and post-project payout. EOR projects that commenced operation on or after April 1, 2005 are also subject to a cost sensitive royalty regime that provides a royalty of 1% of gross EOR revenues prior to project payout and 20% of EOR operating income after project payout and a freehold production tax rate of 0% prior to payout and 8% of EOR operating income after payout. In respect of new waterflood projects, or expansions of existing waterflood projects, that have been approved by the minister and that commenced operation on or after October 1, 2002, the incremental oil produced from the project as a result of the waterflood operations qualifies for the "fourth tier oil" Crown royalty and freehold production tax rates.
In April of 2013, the SMER announced three new drilling incentives for wells drilled on or after October 1, 2002: the vertical well drilling incentive (the "VWDI"); the horizontal well drilling incentive (the "HWDI"); and the exploratory gas well drilling incentive (the "EGWDI"). The VWDI provides a royalty reduction to 2.5% and a freehold production tax rate of 0% for fixed volumes drilled from exploratory vertical oil wells and deep development vertical oil wells. Exploratory vertical oil wells are wells that meet certain prescribed criteria showing the well produces oil from an area which has not generally seen production. The incentive for exploratory vertical oil wells applies to the produced volume up to 16,000m³, depending on depth. Deep development vertical oil wells are deep or deepened wells, that are not exploratory oil wells, drilled to certain prescribed zones. The incentive for these wells applies to the produced volume up to 8,000 m³. The HWDI is very similar to the VWDI, but applies to non-exploratory horizontal wells drilled on or after October 1, 2002 and provides the incentive to produced volumes up to 16,000 m³, depending on depth. Finally, the EGWDI provides a royalty reduction of the lesser of the fourth tier gas royalty rate (between 0%-5%) or 2.5% and a 0% freehold production tax rate. The incentive applies to wells that meet certain prescribed criteria which show that the well produces gas from an area from which gas has not generally been produced. The incentive applies to the produced volume up to 25,000,000 m³.
In December 2018, the Government of Saskatchewan introduced the Waterflood Development Program (the "WDP"), which program offers repayable royalty and freehold production tax deferrals for eligible wells that have been converted to injection wells or newly drilled injection wells for the purpose of waterflooding an oil reservoir. Under the WDP, royalty and freehold production taxes can be deferred for a period of three years and can be used alongside other incentive grant programs available in Saskatchewan.
In June of 2019, the Government of Saskatchewan introduced the Saskatchewan Petroleum Innovation Incentive ("SPII"). SPII offers transferable royalty and freehold production tax credits for qualified innovation commercialization projects at a rate of 25% of eligible project costs, targeting a broad range of innovations across all segments of Saskatchewan's oil and gas industry.
On August 1, 2019 the Government of Saskatchewan introduced the Oil and Gas Processing Investment Incentive ("OGPII"). OGPII offers transferable royalty and freehold production tax credits for qualified greenfield or brownfield value-added projects at a rate of 15% of eligible project costs.
In March 2020, the Government of Saskatchewan introduced the Oil Infrastructure Investment Program ("OIIP"), which program offers transferable oil and gas royalty and freehold production tax credits for qualified projects at a rate of 20 percent of eligible project costs (with a minimum $10 million investment). OIIP is open to new or expanded oil, refined petroleum products or natural gas liquids, including transmission pipelines, feeder pipeline and pipeline terminals. As of November 4, 2021, carbon dioxide pipeline projects became eligible for OIIP, including pipeline projects to be used for transporting carbon dioxide for carbon capture and storage or for EOR projects.
Effective April 1, 2021, Saskatchewan amended the High Water-Cut Oil Well Program, which program provides a royalty status re-assignment for qualifying high water-cut oil wells that incur an average minimum investment of $20,000 per well, made on or after April 1, 2021, to directly improve water handling capabilities and extend the producing life of the well. Such eligible wells drilled before October 1, 2002 will receive fourth tier royalties on all future incremental high water-cut oil production, and wells drilled on or after October 1, 2002 will obtain a 2 percent royalty rate reduction on all future oil production.
On April 6, 2021, the Government of Saskatchewan introduced the Associated Gas Royalty Moratorium, which is a moratorium on the collection of Crown royalty and freehold production tax on associated gas produced from wells other than gas wells, including natural gas produced from oil wells. The moratorium has been implemented as part of Saskatchewan's Methane Action Plan to assist producers in meeting regulatory obligations to reduce methane-based greenhouse gas emissions by 40-45 percent between 2020 and 2025. The moratorium applies to associated natural gas produced on or after April 1, 2021, and before April 1, 2026.
Environmental Regulation and Protection Requirements
All phases of the oil and natural gas business present environmental risks and hazards and are subject to environmental regulation pursuant to international conventions and national, provincial, state, territorial and municipal laws. Environmental legislation provides for, among other things, restrictions and prohibitions on spills, releases, discharges, or emissions of various substances produced or used in association with oil and gas operations, as well as requirements with respect to oilfield waste handling, storage and disposal, land reclamation, habitat and endangered species protection, and minimum setbacks of oil and gas activities from sensitive receptors.
Provincial environmental legislation in the Province of Alberta for the oil and gas industry is, for the most part, set out in the Environmental Protection and Enhancement Act, the Oil and Gas Conservation Act, the Pipeline Act, the Water Act and the Technology and Emissions Reductions Implementation Act, 2019, which impose strict environmental standards with respect to releases of effluents and emissions, including monitoring and reporting obligations, and impose significant penalties for non-compliance. Provincial environmental legislation in the Province of Saskatchewan is, for the most part, set out in The Environmental Management and Protection Act, 2010, The Saskatchewan Environmental Code, The Oil and Gas Conservation Act, The Pipeline Act, 1998 and The Management and Reduction of Greenhouse Gases Act which regulate harmful or potentially harmful activities and substances and GHGs, any release of such substances, and remediation and abandonment obligations in Saskatchewan. Certain development activities in Saskatchewan, depending on the location and potential environmental impact, may require an environmental impact assessment under the provincial Environmental Assessment Act. Provincial environmental legislation in the Province of Manitoba is, for the most part, set out in the Environment Act and the Oil and Gas Act.
Environmental legislation also requires that wells, pipelines and facility sites be constructed, operated, maintained, abandoned, and reclaimed to the satisfaction of applicable regulatory authorities. Compliance with such legislation can require significant expenditures and a breach may result in the imposition of fines and penalties, some of which may be material, or in the suspension or revocation of necessary licenses and approvals. Crescent Point may also be subject to civil liability for damage caused by pollution. Certain environmental protection legislation may subject Crescent Point to statutory strict liability in the event of an accidental spill or discharge from a well, pipeline or facility, meaning that fault on the part of Crescent Point need not be established if such a spill or discharge is found to have occurred.
Crescent Point estimates abandonment and reclamation costs by taking into consideration the costs associated with decommissioning, abandonment, remediation and reclamation, all adjusted according to its working interest and discounted in accordance with NI 51-101. Decommissioning liability cost estimates are based on information published by the AER with respect to the AER liability management programs in Alberta and published by SMER in Directive PNG025 Financial Security Requirements Saskatchewan. Crescent Point has procedures in place which address various matters including: spill prevention, response, notification, reporting, remediation and reclamation; environmental monitoring; government inspections; surface equipment spacing requirements; facility protection/security; vegetation management; surface water run-off/run-on management; groundwater; noise control; atmospheric emissions; wellsite reclamation; earthen pits; storage tanks; naturally occurring radioactive materials; disposal wells; suspended or shut-in wells; waste management; and communications.
Environmental legislation is evolving in a manner expected to result in stricter standards and enforcement, larger fines and liability, and potentially increased capital expenditures and operating costs. The discharge of oil, natural gas or other pollutants into the air, soil, or water may give rise to liabilities to third parties or regulators or result in the suspension or revocation of regulatory approvals and may require Crescent Point to incur costs to remedy such a discharge in an event not covered by Crescent Point's insurance, which insurance is in line with industry practice. Furthermore, Crescent Point expects incremental future costs associated with compliance with increasingly complex environmental protection requirements with respect to GHG emissions or otherwise, some of which may require the installation of emissions monitoring and measuring devices, the verification and reporting of emissions data and additional financial expenditures to comply with GHG emissions reduction requirements.
Greenhouse Gas Emissions
Carbon Policy
In November 2015, Canada participated in the twenty first session of the Conference of the Parties of the United Nations Framework Convention on Climate Change ("COP 21") in Paris, France, the goal of which was to reach a new agreement for fighting global climate change. COP 21 resulted in the adoption of the Paris Agreement which made several recommendations, including: (i) holding the increase in the global average temperature to well below 2 °C above pre-industrial levels and pursuing efforts to limit the temperature increase to 1.5 °C above pre-industrial levels, recognizing that this would significantly reduce the risks and impacts of climate change; (ii) increasing the ability to adapt to the adverse impacts of climate change and fostering climate resilience and low greenhouse gas emissions development, in a manner that does not threaten food production; and (iii) making finance flows consistent with a pathway towards low greenhouse gas emissions and climate-resilient development. The Paris Agreement came into force on November 4, 2016.
Over the last several years, the federal government has undertaken a number of initiatives to achieve domestic GHG reductions that align with its commitments made under the Paris Agreement. These measures include regulations, codes and standards, targeted investments, incentives, tax measures and programs intended to directly and indirectly reduce GHG emissions.
On June 21, 2018, the Government of Canada brought into force a pan-Canadian approach to the pricing of GHG emissions under the Greenhouse Gas Pollution Pricing Act ("GGPPA"). The federal carbon pollution pricing system has two parts: (i) an emission reduction and trading system for large industry, known as the output-based pricing system ("OBPS"); and (ii) a regulatory charge on 21 types of fuel, commonly known as the carbon tax. Each province was given the choice to either accept the federal requirement in full; create their own carbon pricing policies that meet federal standards; or a hybrid approach. Both Saskatchewan and Alberta have opted for the hybrid approach, where they have committed to develop province specific output-based pricing systems but are subject to the federal carbon tax on fuel. The federal carbon tax is applied on a broad set of fuels at $65 per tonne of GHG emissions in 2023 and will increase to $80 per tonne in 2024 and then by $15 per tonne per year until it reaches $170 per tonne in 2030.
The federal government also has a GHG emission reporting requirement under the Canadian Environmental Protection Act, 1999 ("CEPA") whereby facilities that emitted 10,000 tonnes or more of GHGs per year must report their emissions to Environment and Climate Change Canada. On June 21, 2022, the federal government also brought into force the Clean Fuel Regulations which set emission limits on a variety of liquid fuels, including gasoline and diesel.
On December 7, 2023, the Government of Canada published a proposed Regulatory Framework for an Oil and Gas Sector Greenhouse Gas Emissions Cap that will, if enacted, set emissions limits from upstream oil and gas facilities that will be phased in between 2026 and 2030. The proposed Regulatory Framework includes a proposed cap and trade system whereby emission allowances issued or auctioned by the federal government will be tradeable among upstream oil and gas facilities. In addition, it is proposed that facilities will be able to use both emission offset credits created under other federal or provincial emission reduction systems and payments made to a decarbonization fund to meet the emissions cap. The proposed framework would allow up to a maximum of 20% over the emissions allowance cap to be offset by credits or paying into the decarbonization fund. Draft regulations setting the emissions cap system are expected to be published in mid-2024.
In Alberta, GHG emissions are regulated under the Emissions Management and Climate Resilience Act and the TIER Regulation, which came into effect January 1, 2020. The TIER system is mandatory for large emitters, being those that emit 100,000 tonnes or more of GHGs per year, however, facilities with less than 100,000 tonnes per year can voluntarily opt into the system by aggregating two or more smaller facilities together. Registered facilities are required to reduce their emission intensity (tCO2e/boe) by 10% based on a historical benchmark. Companies may meet these required reductions through improvements to their operations; by purchasing and retiring Alberta-based emission reduction or offset credits; by contributing to the provincial TIER Compliance Fund; or by a combination of these actions. Any facility registered into the TIER system can apply to the Canadian Revenue Agency and receive an exemption from the federal fuel surcharge (carbon tax) on applicable fuel combustion and flaring. Crescent Point has two aggregate facilities registered in the TIER system.
On December 15, 2022, the Government of Alberta announced amendments to TIER which became effective on January 1, 2023, which amendments include meeting federal emission reduction requirements for 2023 through 2030, compliance flexibility and increasing the regulator stringency.
On January 1, 2019, the Government of Saskatchewan brought into force The Management and Reduction of Greenhouse Gases (Standards and Compliance) Regulations (the "MRGHGR") to regulate greenhouse gas emissions in the province. As part of the MRGHGR, the Output-Based Performance Standards ("the Saskatchewan OBPS") were developed to reduce emissions intensity associated with stationary fuel combustion by 15% by 2030, however, subsequently, effective January 1, 2023, emissions intensity associated with stationary fuel combustion and flaring were reduced by 20% by 2030. Under the Saskatchewan OBPS program operators of certain large facilities that emit 25,000 tonnes or more of GHGs per year must register. Additionally, a voluntary aggregated facility (two or more smaller facilities grouped together) can also register in the OBPS program. Operators must reduce their emissions per unit of production from their historical emissions and may meet these required reductions through improvements to their operations; by purchasing and retiring emission reduction or offset credits; by contributing to the provincial Technology Fund; or by a combination of these actions. Any facility registered in the Saskatchewan OBPS can apply to the Canadian Revenue Agency and receive an exemption from the federal fuel surcharge (carbon tax) on applicable fuel combustion. Crescent Point has large emitter and aggregate facilities registered in the Saskatchewan OBPS program.
On November 22, 2022, the Government of Saskatchewan announced amendments to the Saskatchewan OBPS to meet the requirements of the 2023-2030 national carbon pricing benchmark. Effective January 1, 2023, the regulated emissions under the Saskatchewan OBPS were expanded to include flaring and the emission intensity reduction was increased to 20%.
Methane Policy
On June 29, 2016, Canada joined the United States and Mexico in agreeing to reduce methane emissions from the oil and gas sector by up to 45% by 2025 from 2014 levels by developing and implementing federal regulations for both existing and new sources of venting and fugitive methane emissions. Previously, on March 10, 2016, Canada and the United States committed to take action on methane emissions through federal regulations as expeditiously as possible. The United States has since cancelled their participation in this initiative.
On January 1, 2020, the Canadian federal government implemented the Regulations Respecting Reduction in the Release of Methane and Certain Volatile Organic Compounds (Upstream Oil and Gas Sector).
The federal regulations that apply to methane in the upstream oil and gas sector aim to control methane emissions and also reduce the amount of volatile organic compounds released into the air. These regulations apply generally to facilities that handle significant volumes of gas (facilities that produce or receive a combined volume of 60,000 m3 of hydrocarbon gas or greater annually in any of the past five years). The regulations outline regulatory requirements for fugitive equipment leaks, venting from well completions, and compressors, which came into force on January 1, 2020, and requirements for facility production venting restrictions and venting limits for pneumatic equipment, which come into force on January 1, 2023.
Operators of upstream oil and gas facilities are required to: implement a leak detection and repair program to stop natural gas leaks three times per year on facilities that produce or receive a combined volume of 60,000 m3 of hydrocarbon gas or greater annually; complete annual measurements of emissions from natural gas compressor vents to ensure emissions are under the applicable limit; and eliminate venting from well completions involving hydraulic fracturing.
Beginning in 2023, operators of upstream oil and gas facilities were required to: meet a venting limit of 15,000 m3 of gas per year at facilities that produce and/or receive more than 60,000 m3 of gas per year, and limit venting from pneumatic devices to a maximum threshold.
All upstream oil and gas facilities to which the federal regulations apply are required to register and to keep records in order to demonstrate compliance with the proposed regulations. Facility operators are also required to submit reports at the request of the federal Minister of Environment.
On October 11, 2021, the Canadian federal government announced its support for the Global Methane Pledge, which aims to reduce global methane emissions by 30 percent below 2020 levels by 2030. In support of the Global Methane Pledge, Canada announced its commitment to developing a plan to reduce methane emissions across the broader Canadian economy and to reducing oil and gas methane emissions by at least 75 percent below 2012 levels by 2030, and that these goals will be achieved through an approach that will include regulation.
In September 2022, the Government of Canada released Canada's Methane Strategy with the aim of reducing domestic methane emissions, including a new target of reducing absolute methane emissions from the oil and gas sector by 75% by 2030 relative to 2012. In November 2022, the Government of Canada released a Proposed Regulatory Framework for Reducing Oil and Gas Methane Emissions to Achieve 2030 Target. The proposed changes will expand the scope of the existing regulations to apply to a wider set of sources, including all facilities handling natural gas, increasing the scope and frequency of inspection programs, requiring certain non-emitting equipment when feasible, prohibiting flaring at oil sites, limiting venting of methane and requiring fugitive methane emissions management plans.
On December 16, 2023, the Government of Canada published draft Regulations Amending the Regulations Respecting the Reduction in the Release of Methane and Certain Volatile Organic Compounds (Upstream Oil and Gas Sectors) for public consultation. The proposed amendments would prohibit flaring and venting, other than to avoid serious risk to human health or safety, at new facilities starting in 2027 and at all facilities in 2030. Alternatively, a facility may install continuous monitoring systems to detect for methane emissions, and then take mandating mitigation measures within set time lines. Further, with respect to fugitive emissions, the proposed regulations distinguish between facilities more likely to emit methane from facilities less likely to emit methane.
Facilities more likely to emit methane must be inspected quarterly while facilities less likely to emit methane must be inspected annually. Mandatory repair timelines are included in the proposed Regulations upon the detection of an emission. Finally, new equipment standards are mandatory efficiency requirements are proposed.
Currently the federal regulations do not apply in provinces which the federal government deems to have equivalent methane reduction regulations. Alberta, Saskatchewan and British Columbia have each reached equivalency agreements with the federal government and currently operators in these provinces are subject to only the provincial methane reduction requirements.
In Alberta, design specifications have been put in place by the AER for oil and gas wells, pipelines and facilities as well as standards for key equipment and operational best practices. Fugitive emission standards are also included in the regulatory requirements and will raise current standards for performance, monitoring, measurement and reporting. The AER has published directives requiring methane emission reductions.
On January 1, 2019, the Government of Saskatchewan brought into force The Oil and Gas Emissions Management Regulations to reduce methane emissions from upstream oil and gas companies with emissions of more than 50,000 tonnes of GHGs per year from oil facilities. Every company subject to the regulation must ensure GHG emissions from flaring and venting are below provincial limits or pay an administrative penalty if they fail to do so.
Crescent Point's operations are subject to costs being incurred to comply with carbon taxes, GHG emission reduction requirements, including methane emission reductions, and to preform necessary monitoring, measurement, verification and reporting of GHG emissions.
Crescent Point anticipates current and future environmental legislation will require reductions in emissions from its operations and result in increased capital and operational expenditures. Further changes in environmental legislation could occur, which may result in stricter standards and enforcement, larger fines and liability and increased capital expenditures and operating costs, which could have a material adverse effect on our financial condition and results of operations.
We are committed to meeting our responsibilities to protect the environment wherever we operate and anticipate making increased expenditures as a result of the increasingly stringent laws relating to the protection of the environment. Our internal procedures are designed to ensure that the environmental aspects of new developments are taken into account prior to proceeding.
Abandonment and Reclamation Costs
As at December 31, 2023, Crescent Point owned approximately 14,493 gross (12,041.4 net) producing, non-producing and abandoned wells for which abandonment and/or reclamation costs are expected to be incurred. During 2023, Crescent Point spent approximately $45.4 million on well abandonment and environmental reclamation activities, of which $5.4 million was received from government grant programs. In 2024, Crescent Point expects to carry out abandonment and reclamation operations that will total approximately $40.0 million. Crescent Point has estimated the net present value (discounted at approximately 3.02% per annum) of its total decommissioning liability (wells and facilities) to be approximately $738.8 million as at December 31, 2023, including liabilities associated with assets held for sale, based on estimated undiscounted and uninflated cash flows of approximately $1.03 billion.
On July 30, 2020, the Government of Alberta announced a new liability management program that overhauls and modernizes the previous liability management program, known as the Liability Management Ratio ("LMR") which uses a licensee's ratio of deemed asset value to deemed liability value to determine the risk that the licensee poses to the Orphan Well Association and to determine if a security deposit is required to mitigate that risk. The LMR was replaced by Directive 088: Licensee Life-Cycle Management ("LLCM"), which directive was released and became effective on December 1, 2021. Unlike the LMR, which measures two metrics to determine a licensee's risk, the LLCM assesses more than 30 additional metrics, such as the licensee's financial capability, previous closure activity, operational performance and regulatory compliance. Additionally, the new liability framework includes an Inactive Inventory Reduction Program which introduced annual mandatory liability reduction spending targets for each licensee. The new framework also includes the development of a program to address legacy sites that were abandoned, remediated or reclaimed before current requirements were introduced. In September 2022, the AER introduced the Closure Nomination Program as part of LLCM. This program allows for specific, direct stakeholders to nominate inactive sites for abandonment and/or reclamation.
Like the Alberta Government, the Government of Saskatchewan also announced enhancements to its Liability Management Program framework in 2020. This framework includes using licensee-specific data to better reflect the actual deemed asset and liability values, which is expected to improve the accuracy of License Liability Ratings; an Inactive Liability Reduction Program that requires an annual spending target on closure activities; completing the Proportional Risk Transfer model that will assess security deposit requirements for license transfers with a high amount of inactive infrastructure; and addressing regulatory gaps related to new entrants and the acceptable forms of security deposits. To support these new initiatives, the Government of Saskatchewan has enacted The Financial Security and Site Closure Regulation, which came into force on January 1, 2023.
Health, Safety and Environment
The health and safety of employees, contractors, visitors and the public, as well as the protection of the environment, is of the utmost importance to Crescent Point. The Corporation endeavors to conduct its operations in a manner that will minimize both adverse environmental effects and consequences of emergency situations by:
•Complying with all applicable government regulations and standards;
•Operating in a manner consistent with industry codes, practices and guidelines;
•Ensuring prompt and effective response and repair to emergency situations and environmental incidents;
•Providing training to ensure compliance with Crescent Point's Operations Management System;
•Careful planning, good judgment and prudent monitoring of the Corporation's activities;
•Communicating openly with all stakeholders regarding our activities; and
•Amending Crescent Point's policies and procedures, as may be required from time to time.
Crescent Point believes that it is in material compliance with environmental legislation in the jurisdictions in which it operates at this time. Crescent Point's practice is to do all that it reasonably can to ensure that it remains in material compliance with applicable environmental protection legislation. Crescent Point also believes that it is reasonably likely that the trend towards stricter standards in environmental regulation will continue. Crescent Point is committed to meeting its responsibilities to protect the environment wherever it operates and will take such steps as required to ensure compliance with environmental legislation. Crescent Point anticipates increased capital and operating expenditures as a result of increasingly stringent laws relating to the protection of the environment. No assurance can be given that environmental laws will not result in a curtailment of production or a material increase in the costs of production, the development or exploration activities, or otherwise adversely affect Crescent Point's financial condition, capital expenditures, results of operations, competitive position or prospects.
RISK FACTORS
Each of the risks described below should be carefully considered, together with all of the other information contained herein, before making an investment decision with respect to our Common Shares. If any of the following risks develop into actual events, our business, financial condition or results of operations could be materially and adversely affected, and you could lose all or part of your investment.
Risks Relating to Our Business
Our estimated Proved and Proved plus Probable reserves are based on many assumptions that may turn out to be inaccurate. Any significant inaccuracies in these reserve estimates or underlying assumptions may materially affect the quantities and present value of our reserves.
The reserve and recovery information contained in the Crescent Point Reserve Report are only estimates and the actual production and ultimate reserves from our properties may be greater or less than the estimates prepared by McDaniel. Ultimately, actual reserves attributable to our properties will vary from estimates, and those variations may be material. The reserve figures contained herein are only estimates. The estimation of reserves is an inherently complex process requiring significant judgment. A number of factors are considered and a number of assumptions are made when estimating reserves. These factors and assumptions include, among others:
•historical production in the area compared with production rates from similar producing areas;
•future commodity prices, production and development costs, royalties and capital expenditures;
•initial production rates;
•production decline rates;
•ultimate recovery of reserves;
•success of future development activities;
•marketability of production;
•availability, proximity and capacity of oil and gas gathering systems, pipelines and processing facilities;
•effects of government regulation; and
•other government levies that may be imposed over the producing life of reserves.
Reserve estimates are based on the relevant factors, assumptions and prices on the date the relevant evaluations were prepared. These estimates are expected to be revised upward or downward over time, as additional information such as reservoir performance becomes available, or as economic conditions change. See "Special Notes to Reader". Many of these factors are subject to change and are beyond our control. If these factors, assumptions and prices prove to be inaccurate, actual results may vary materially from reserve estimates and such variations may affect the market price of our Common Shares and return of capital (which, for purposes of this AIF, includes dividends and share repurchases) to Shareholders.
The amount of oil and natural gas that we can produce and sell is subject to the accessibility, availability, proximity and capacity of gathering, processing and pipeline systems.
Our business depends in part upon the availability, proximity and capacity of oil and gas gathering systems, pipelines and processing facilities and rail loading facilities and railcars. Canadian federal and provincial, as well as U.S. federal, state and local, regulation of oil and gas production, processing and transportation, tax and energy policies, general economic conditions, changes in supply and demand and changes in pipeline ownership or operation could adversely affect our ability to produce or market oil and natural gas. If market factors change and inhibit the marketing of our production, overall production or realized prices may decline, which may affect the market price of our Common Shares and reduce our return of capital to our Shareholders.
Our future performance depends on our ability to acquire additional natural gas and oil reserves that are economically recoverable.
If we are unable to acquire additional reserves, the value of our Common Shares and our return of capital to Shareholders may decline. We add to our oil and natural gas reserves primarily through development, exploitation and acquisitions including those with large resource potential. As a result, future oil and natural gas reserves are highly dependent on our success in exploiting existing properties and acquiring additional reserves. We cannot guarantee that we will be successful in developing additional reserves or acquiring additional reserves on terms that meet our investment objectives. Without these reserve additions, our reserves will deplete and, as a consequence, either production from, or the average reserve life of, our properties may decline. Either decline may result in a reduction in the value of our Common Shares and in a reduction in cash available for return of capital to Shareholders.
The properties we acquire may not produce as projected, and we may be unable to determine reserve potential, identify liabilities associated with the acquired properties or obtain protection from sellers against such liabilities.
The properties we acquire may not produce as expected, may be in an unexpected condition and we may be subject to increased costs and liabilities, including environmental liabilities. Although we review properties prior to acquisition in a manner consistent with industry practices, such reviews are not always capable of identifying all potential adverse conditions. Furthermore, we may not be able to subject the preparation of reserve estimates for acquired properties to the same internal controls we have for the preparation of reserve estimates for our existing properties. Generally, it is not feasible to review in depth every individual property involved in each acquisition. We focus our review efforts on the higher-value properties or properties with known adverse conditions and will sample the remainder. However, even a detailed review of records and properties and preparation of reserve reports in accordance with our internal controls may not necessarily reveal existing or potential problems or permit us to become sufficiently familiar with the properties to fully assess their condition, any deficiencies, and development potential.
Failure to realize anticipated benefits of prior acquisitions and dispositions may have a material adverse effect on our business.
The Corporation has completed a number of acquisitions and dispositions in order to strengthen its position in the oil and natural gas industry and to create the opportunity to realize certain benefits, including, among other things, potential cost savings. In order to achieve the benefits of these and future acquisitions, the Corporation is dependent upon its ability to successfully consolidate functions and integrate operations, procedures and personnel in a timely and efficient manner and to realize the anticipated growth opportunities and synergies from combining the acquired assets and operations with those of the Corporation. The integration of acquired assets and operations requires the dedication of management effort, time and resources, which may divert management's focus and resources from other strategic opportunities and from operational matters during this process. The integration process may result in the disruption of ongoing business and customer relationships that may adversely affect the Corporation's ability to achieve the anticipated benefits of such prior acquisitions. Dispositions may fail to provide anticipated benefits as the employment of capital received from any such dispositions will be subject to the risks the Corporation faces. Such capital may fail to deliver a return commensurate or greater than the return formerly garnered from the disposed assets.
Increases in costs could adversely affect our business, financial condition and results of operations.
An increase in costs could have a material adverse effect on our results of operations and financial condition and, therefore, could reduce our ability to pay down debt, reduce dividends to Shareholders as well as affect the market price of the Common Shares.
Current and future inflationary effects may be driven by, among other things, supply chain disruptions and governmental stimulus or fiscal policies, and geopolitical instability, including the ongoing conflict between the Ukraine and Russia and in the Middle East. Continuing increases in inflation could increase our costs of labor and other costs related to our business, which could have an adverse impact on our business, financial position, results of operations and cash flows.
Higher operating and capital costs for our underlying properties will directly decrease the amount of cash flow received by the Corporation and, therefore, may reduce return of capital to our Shareholders.
The conflicts in Ukraine and the Middle East and related price volatility and geopolitical instability could negatively impact our business.
In late February 2022, Russia launched significant military action against Ukraine and in October 2023, Israel declared war and mobilized troops to the Gaza Strip. The conflicts and other events causing geopolitical instability, have caused, and could intensify, volatility in natural gas, oil and NGL prices, and the extent and duration of the military actions, sanctions and resulting market disruptions could be significant and could potentially have a substantial negative impact on the global economy and/or our business for an unknown period of time. There is evidence that recent volatility in crude oil prices is partially due to the impact of geopolitical instability, including the conflict between Russia and Ukraine and in the Middle East, on the global commodity and financial markets, and in response to economic and trade sanctions that certain countries have imposed on Russia. Any such volatility and disruptions may also magnify the impact of other risks described in this "Risk Factors" section.
The operation of a portion of our properties is largely dependent on the ability of third party operators.
Some of our properties are not operated by us and, therefore, results of operations may be adversely affected by the failure of third-party operators, which could affect the market price of our Common Shares and return of capital to Shareholders.
The continuing production from a property, and to some extent the marketing of that production, is dependent upon the ability of the operators of those properties. At December 31, 2023, approximately 9% of our daily production was from properties operated by third parties. To the extent a third-party operator fails to perform its functions efficiently or becomes insolvent, our revenue may be reduced. Third party operators also make estimates of future capital expenditures more difficult.
Further, the operating agreements which govern the properties not operated by us typically require the operator to conduct operations in a good and "workmanlike" manner. These operating agreements generally provide, however, that the operator has no liability to the other non-operated working interest owners for losses sustained or liabilities incurred, except for liabilities that may result from gross negligence or willful misconduct.
Delays in business operations could adversely affect our income and financial condition.
Delays in business operations could adversely affect return of capital to Shareholders, our income, our financial condition and the market price of our Common Shares. In addition to the usual delays in payment by purchasers of oil and natural gas to the operators of our properties, and the delays of those operators in remitting payment to us, payments between any of these parties may also be delayed by:
•restrictions imposed by lenders;
•delays in the sale or delivery of products;
•delays in the connection of wells to a gathering system;
•restrictions due to limited pipeline, railcar, trucking or refinery capacity;
•extreme weather events, including severe cold, wildfires and floods, which may damage or destroy infrastructure;
•droughts, which may impact the availability and usage of water;
•blowouts or other accidents;
•public health crises, epidemics or pandemics, including the effects of, and response to, COVID-19;
•blockades and social unrest;
•accounting delays;
•adjustments for prior periods;
•recovery by the operator of expenses incurred in the operation of the properties;
•the establishment by the operator of reserves for these expenses; or
•delays in receiving government approvals and licenses.
Any of these or other delays in our business operations could reduce our income, the amount of cash available for return of capital to Shareholders in a given period, our financial condition and could expose us to additional third party credit risks.
Failure of third parties to meet their contractual obligations to us may have a material adverse effect on our financial condition.
Although the Corporation monitors the credit worthiness of third parties it contracts with and manages its exposures through a formal Risk Management and Counterparty Credit Policy, there can be no assurance that the Corporation will not experience a loss for non-performance by any counterparty with whom it has a commercial relationship. Such events may have material adverse consequences on the business of the Corporation and may limit the timing or amount of return of capital to Shareholders and could affect the market price of our Common Shares.
Our debt level and the covenants in the agreements governing our debt could negatively impact our financial condition, ability to return capital to shareholders, results of operations, cash flows and business prospects.
We may, from time to time, finance a significant portion of our operations through debt. Our indebtedness may limit the timing or amount of capital returns to Shareholders, and could affect the market price of our Common Shares and our return of capital to Shareholders.
The payments of interest and principal, and other costs, expenses and disbursements to our lenders reduces amounts available for return to Shareholders. Variations in interest rates and scheduled principal repayments could result in significant changes to the amount of the cash flow required to be applied to the debt before payment of any amounts to the Shareholders. The agreements governing our long-term debt provide that, if we are in default or fail to comply with certain covenants, we must repay the indebtedness at an accelerated rate, and the ability to return capital to Shareholders may be restricted. Additionally, the Term Loan has certain mandatory repayment provisions applicable to cash proceeds received from future issuances of equity securities, debt securities and proceeds received from property dispositions that may limit our ability to pay dividends or return capital to shareholders. Significant reductions to cash flow or increases in drawn amounts under the Credit Facilities may result in the Corporation breaching its debt covenants under the agreements governing its debt. If a breach occurs, there is a risk that the Corporation may not be able to negotiate covenant relief with one or more of its debt counterparties. Failure to comply with debt covenants or negotiate relief may result in its indebtedness under the Credit Facilities, Term Loan or Senior Guaranteed Notes becoming immediately due and payable, which may have a material adverse effect on the Corporation’s operations and financial condition.
Increased costs of capital could adversely affect our business.
Our business and operating results could be harmed by factors such as the availability, terms and cost of capital, increases in interest rates or a reduction in our credit rating. Changes in any one or more of these factors could cause our cost of doing business to increase, limit our access to capital, limit our ability to pursue acquisition opportunities, reduce our cash flows and place us at a competitive disadvantage. Disruptions and volatility in the global financial markets may lead to an increase in interest rates or a contraction in credit availability impacting our ability to finance our operations. We require continued access to capital. A significant reduction in the availability of credit could have a material adverse effect on the Corporation's operations and financial condition.
Pandemics could adversely affect the Corporation's financial condition, operations and results from operations.
A pandemic and the actions taken in response, could result in a similar contraction in the global economy as experienced in response to COVID-19. Another pandemic could cause periods of unprecedented disruption in the oil and gas industry and negatively impacted the demand for, and pricing of, energy products, including crude oil, NGLs and natural gas produced by the Corporation. A consequence of this disruption is that the oil and gas industry could again experience a period of market contraction. Furthermore, the oil and gas industry could experience an increased risk of counterparty bankruptcy and insolvency.
In response to a pandemic, the Corporation may need to implement additional health and safety protocols within its Calgary office and field operations and may be required to make adjustments to its health and safety protocols.
There were many variables and uncertainties associated with COVID-19 that could return with the onset of another pandemic. For example, during and following the COVID-19 pandemic, inflation has been driven by many factors, including disruptions to local and global supply chain and transportation services. Additionally, pandemics, including COVID-19 and its variants, have the potential to directly affect the health of our employees. Inflation, disruptions to supply chain and transportation services and employee health have the potential to disrupt or impact the Corporation's operations, projects and financial condition. The extent of the impact of a pandemic on our operational and financial performance will depend on future developments, the pandemic's severity, government actions to contain the disease or mitigate its impact and the effectiveness of treatments and vaccines, all of which are highly uncertain and cannot be predicted with certainty at this time.
Our existing Credit Facilities and any replacement credit facilities may not provide sufficient liquidity.
Our current Credit Facilities and any replacement credit facilities may not provide sufficient liquidity. The amounts available under our existing Credit Facilities may not be sufficient for future operations, or we may not be able to obtain additional financing on economic terms attractive to us, if at all. The interest charged on our Credit Facilities is calculated based on a sliding scale ratio of the Corporation's senior debt to adjusted EBITDA ratio. Repayment of all outstanding amounts under the Credit Facilities may be demanded on relatively short notice if an event of default occurs and is continuing. If this occurs, we may need to obtain alternate financing. Any failure to obtain suitable replacement financing may have a material adverse effect on our business, and return of capital to Shareholders may be materially reduced.
Dividends on the Corporation's Common Shares and Common Share repurchases are variable.
Dividends may be reduced or eliminated in the sole discretion of the Board of Directors. For example, dividends may be reduced or eliminated during periods in which we make capital expenditures or debt repayments using cash flow, which could also affect the market price of our Common Shares. To the extent that we use cash flow to finance acquisitions, development costs and other significant expenditures, the net cash flow the Corporation receives that is available for dividends to Shareholders, or to repurchase Common Shares will be reduced. Furthermore, the availability of net cash flow is dependent upon commodity prices which are variable. Hence, the timing and amount of capital expenditures and the variability of commodity prices, may affect the amount of net cash flow received by the Corporation and, as a consequence, the amount of cash available to distribute to Shareholders or to repurchase Common Shares. Therefore, dividends or share buybacks may be reduced, or even eliminated, at times when significant capital or other expenditures are made, or when commodity prices vary.
The Board of Directors has the discretion to determine the extent to which cash flow from Crescent Point will be allocated to the payment of debt service charges as well as the repayment of outstanding debt, including under the Credit Facilities, the Term Loan and Senior Guarantee Notes. As a consequence, the amount of funds used to pay debt service charges or reduce debt will reduce the amount of cash available for dividends to Shareholders or to repurchase Common Shares during those periods in which funds are so retained.
We have been historically reliant on external sources of capital, which may dilute Shareholders' ownership interests.
There may be future dilution to our Shareholders. One of our objectives is to continually add to our reserves through development, and where warranted, through acquisitions. Since we pay a dividend, our success in growth from development and acquisitions may, in part, depend on our ability to raise capital from time to time by selling additional Common Shares. Shareholders will suffer dilution as a result of these offerings if, for example, the cash flow, production or reserves from the acquired assets do not reflect the additional number of Common Shares issued to develop or acquire assets. Shareholders may also suffer dilution in connection with future issuances of Common Shares to effect acquisitions.
Indigenous claims could have an adverse effect on us and our operations.
The economic impact on us of claims of indigenous title or rights is unknown. Indigenous people have claimed indigenous title and rights to a substantial portion of western Canada. We are unable to assess the effect, if any, that any such claim would have on our business and operations. Protests that affect transportation and other infrastructure in Canada, may have a negative impact on the Corporation's ability to sell its products.
Hedging limits participation in commodity price increases and increases counterparty credit risk exposure.
We periodically enter into hedging activities with respect to a portion of our production to manage our exposure to oil and gas price volatility. To the extent that we engage in price risk management activities to protect ourselves from commodity price declines, we may be prevented from fully realizing the benefits of commodity price increases above the prices established by our hedging contracts. In addition, our hedging arrangements may expose us to the risk of financial loss in certain circumstances, including instances in which the contract counterparties fail to perform under the contracts.
We may incur losses as a result of title defects in the properties in which we invest.
Unforeseen title defects may result in a loss of entitlement to production and reserves. Although we conduct title reviews in accordance with industry practice prior to any purchase of resource assets, such reviews do not guarantee that an unforeseen defect in the chain of title will not arise and defeat our title to the purchased assets. If such a defect were to occur, our entitlement to the production from such purchased assets could be jeopardized and, as a result, return of capital to Shareholders may be reduced.
Our information assets and critical infrastructure may be subject to cyber security risks.
The Corporation is subject to a variety of information technology and system risks as a part of its normal course operations, including potential breakdown, invasion, virus, cyber-attack, cyber-fraud, security breach, and destruction or interruption of the Corporation's information technology systems by third parties or insiders. Although the Corporation has security measures and controls in place that are designed to mitigate these risks, a breach of its security measures and/or a loss of information could occur and result in a loss of material and confidential information and reputation, breach of privacy laws and a disruption to its business activities. The significance of any such event is difficult to quantify, but may in certain circumstances be material and could have a material adverse effect on the Corporation's business, financial condition and results of operations.
Crescent Point relies heavily on information technology, such as computer hardware and software systems, in order to properly operate its business. In the event the Corporation is unable to regularly deploy software and hardware, effectively upgrade systems and network infrastructure, and take other steps to maintain or improve the efficiency and efficacy of systems, the operation of such systems could be interrupted or result in the loss, corruption, or release of data. In addition, information systems could be damaged or interrupted by natural disasters, force majeure events, telecommunications failures, power loss, acts of war or terrorism, computer viruses, malicious code, physical or electronic security breaches, intentional or inadvertent user misuse or error, or similar events or disruptions. Any of these or other events could cause interruptions, delays, loss of critical or sensitive data or similar effects, which could have a material adverse impact on the protection of intellectual property, and confidential and proprietary information, and on Crescent Point's business, financial condition, results of operations and cash flows.
We depend upon our management team and our operations require us to attract and retain experienced technical personnel.
Shareholders are entirely dependent on our management with respect to the acquisition of oil and gas properties and assets, the development and acquisition of additional reserves and the management and administration of all matters relating to our oil and natural gas properties. The loss of the services of key individuals who currently comprise the management team could have a detrimental effect on the Corporation. .
We operate only in western Canada and expansion outside of these areas may increase our risk exposure.
If we expand our operations beyond oil and natural gas production in western Canada, we may face new challenges and risks. If we were to be unsuccessful in managing these challenges and risks, our results of operations and financial condition could be adversely affected, which could affect the market price of our Common Shares and return of capital to Shareholders.
Our operations and expertise are currently deployed on conventional oil and gas production and development in the Western Canadian Sedimentary Basin. In the future, we may acquire oil and gas properties outside this geographic area. In addition, we could acquire other energy related assets, such as oil and natural gas processing plants or pipelines. Expansion of our activities into new areas may present challenges and risks that we have not faced in the past. If we do not manage these challenges and risks successfully, our results of operations and financial condition could be adversely affected.
We may be the subject of litigation.
From time to time, the Corporation may be the subject of litigation. Claims under such litigation may be material. The types of claims the Corporation may face include, without limitation, claims for breach of contract, environmental damage, negligence, product liability, tax, patent infringement and employment matters. The outcome of any such litigation is not certain, but may materially impact Crescent Point's financial condition or results of operations. Crescent Point may also be subject to adverse publicity related to such claims, regardless whether Crescent Point is ultimately found responsible. In addition, the Corporation may be required to incur significant expenses or devote significant resources defending any such litigation.
The Corporation relies on surface and groundwater licenses, which, if rescinded or the conditions of which are amended, could disrupt its business and have a material adverse effect on its business, financial condition, results of operations and prospects.
The Corporation relies on access to both surface and groundwater, which is obtained under government licenses, to provide the substantial quantities of water required for certain of its operations. The licenses to withdraw water may be rescinded and additional conditions may be added to these licenses. Further, the Corporation may have to pay increased fees for the use of water in the future and any such fees may be uneconomic. Finally, new projects or the expansion of existing projects may be dependent on securing licenses for additional water withdrawal, and these licenses may be granted on terms not favorable to the Corporation, or at all, and such additional water may not be available to divert under such licenses. Any prolonged droughts in our operating areas could result in the Corporation's surface and groundwater licenses being subject to additional conditions or rescission. The Corporation's inability to secure surface and groundwater licenses in the future and any amendment to or rescission of, its current licenses may disrupt its business and have a material adverse effect on the Corporation's business, financial condition, results of operations and prospects.
Wildfire Risk
Wildfires may restrict the Corporation's ability to access and operate its properties and cause operational difficulties, including damage to equipment and infrastructure. Wildfires also increase the risk of personnel injury as a result of dangerous working conditions. Certain of the Corporation's assets are located near forests and a wildfire may lead to significant downtime and/or damage to the Corporation's assets or cause disruptions to the production and transport of its products or the delivery of goods and services in its supply chain.
Restrictions on operational activities intended to protect certain species of wildlife may adversely affect the Corporation's ability to conduct drilling and other operational activities in some of the areas where it operates.
Oil, condensate and other NGLs and natural gas operations in the Corporation's operating areas can be adversely affected by seasonal or permanent restrictions on construction, drilling and well completions activities designed to protect various wildlife. Seasonal restrictions may limit the Corporation's ability to operate in protected areas and can intensify competition for drilling rigs, oilfield equipment, services, supplies and qualified personnel, which may lead to periodic shortages when drilling and completions activities are allowed. These constraints and the resulting shortages or high costs could delay the Corporation's operations and materially increase the Corporation's operating and capital costs. Permanent restrictions imposed to protect endangered species could prohibit development in certain areas or require the implementation of expensive mitigation measures. The designation of previously unprotected species as threatened or endangered in areas where the Corporation operates could cause the Corporation to incur increased costs arising from species protection measures or could result in limitations on the Corporation's exploration and production activities that could have an adverse impact on the Corporation's ability to develop and produce its reserves.
Risks Relating to the Oil and Gas Industry
Oil and natural gas prices fluctuate widely, and low prices for an extended period would likely have a material adverse impact on our business.
Our revenues, operating results, financial condition and ability to borrow funds or obtain additional capital depend substantially on prevailing prices for oil and natural gas. Lower commodity prices may reduce the amount of oil and natural gas that we can produce economically. Historically, oil and natural gas prices and markets have been volatile, with prices fluctuating widely, and they are likely to continue to be volatile. Depressed prices in the future would have a negative impact on our future financial results and could result in impairment charges.
Prices for oil and natural gas are subject to wide fluctuations in response to relatively minor changes in the supply of and demand for oil and natural gas, market uncertainty and a variety of additional factors that are beyond our control. These factors include but are not limited to the following:
•the levels and location of oil and natural gas supply and demand and expectations regarding supply and demand, both domestically and abroad;
•the level of consumer product demand;
•extreme weather events, such as severe cold, wildfires and floods;
•political conditions, social unrest, sanctions, hostilities or war in, or relating to, oil and natural gas producing regions, including the Middle East, Africa, Eastern Europe (including the conflict between Ukraine and Russia) and South America;
•the ability of the members of the Organization of Petroleum Exporting Countries and other exporting nations to agree to and maintain oil price and production controls;
•the price level and quantity of foreign imports;
•actions of governmental authorities;
•the availability, proximity and capacity of gathering, transportation, processing and/or refining facilities in regional or localized areas that may affect the realized price for oil and natural gas;
•blockades of transportation infrastructure and civil unrest;
•inventory storage levels;
•the nature and extent of domestic and foreign governmental regulations and taxation, including environmental and climate change regulation;
•conservation and environmental protection efforts;
•the price, availability and acceptance of alternative energy sources;
•technological advances affecting energy usage and consumption and energy supply;
•speculation by investors in oil and natural gas;
•public health crises, epidemics or pandemics, including the impacts of and response to COVID-19;
•weather conditions;
•variations between product prices at sales points and applicable index prices; and
•overall domestic and worldwide economic conditions, including the value of the U.S. dollar relative to Canadian and other major currencies.
These factors and the volatile nature of the energy markets make it extremely difficult to predict with any certainty the future prices of crude oil and natural gas. If crude oil and natural gas prices remain significantly depressed for a sustained period of time, the lower prices may adversely affect our ability to make planned expenditures, raise additional capital, meet our financial obligations or provide return of capital to shareholders through dividends or share repurchases.
Variations in interest rates, foreign exchange rates, and inflation could adversely affect our financial condition.
There is a risk that interest rates will continue to increase in response to inflation in Canada and the United States. An increase in interest rates could result in a significant increase in the amount we pay to service debt, while rising inflation could cause us to incur additional expense and, either or both, could have an adverse effect on our financial condition, results of operations and future growth, potentially resulting in a decrease in a decrease in the return of capital to Shareholders and/or the market price of the Common Shares.
Fluctuations in foreign currency exchange rates could adversely affect our business, and could affect the market price of our Common Shares and return of capital to Shareholders. The price that we receive for a majority of our oil and natural gas is based on U.S. dollar denominated benchmarks and, therefore, the price that we receive in Canadian dollars is affected by the exchange rate between the two currencies. A material increase in the value of the Canadian dollar relative to the U.S. dollar may negatively impact net production revenue by decreasing the Canadian dollars received for a given U.S. dollar price. Conversely, a material decease in Canadian versus U.S. dollar values would reduce the Corporation's ability to develop the U.S. asset base. Each of these situations may negatively impact future dividends and the future value of the Corporation's reserves as determined by independent evaluators. We could be subject to unfavorable exchange rate changes to the extent of our investment in U.S. subsidiaries and to the extent that we have engaged, or in the future engage, in risk management activities related to foreign exchange rates, through entry into forward foreign exchange contracts or otherwise.
Competition in the oil and gas industry is intense, which may adversely affect our ability to compete.
The oil and natural gas industry is highly competitive. We compete for capital, acquisitions of reserves, undeveloped lands, skilled personnel, access to drilling rigs, service rigs and other equipment, access to processing facilities, pipeline and refining capacity and in many other respects with a substantial number of other organizations, many of which may have greater technical and financial resources than we do. Some of these organizations not only explore for, develop and produce oil and natural gas but also carry on refining operations and market oil and other products on a worldwide basis. As a result of these complementary activities, some of our competitors may have greater and more diverse competitive resources to draw on than we do. Given the highly competitive nature of the oil and natural gas industry, this could adversely affect the market price of our Common Shares and return of capital to Shareholders.
Risks associated with the production, gathering, transportation and sale of oil and natural gas could adversely affect net income and cash flows. We may not be insured against all of the operating risks to which our business is exposed.
The industry in which we operate exposes us to potential liabilities that may not be covered by insurance. Our operations are subject to all of the risks associated with the operation and development of oil and natural gas properties, including the drilling of oil and natural gas wells, and the production and transportation of oil and natural gas. These risks include encountering unexpected formations or pressures, premature declines of reservoirs, blow-outs, equipment failures and other accidents, cratering, sour gas releases, uncontrollable flows of oil, natural gas or well fluids, adverse weather conditions, pollution, other environmental risks, fires, spills and explosions. A number of these risks could result in personal injury, loss of life, or environmental and other damage to our property or the property of others and reputational loss. We cannot fully protect against all of these risks, nor are all of these risks insurable. We may become liable for damages arising from these events against which we cannot insure or against which we may elect not to insure because of high premium costs or other reasons. Any costs incurred to repair these damages or pay these liabilities would reduce funds available for payment of dividends to Shareholders. Additionally, the insurance market changes over time and, in the future, we may not be able to purchase insurance for all of the risks that we are currently able to insure against.
We are subject to complex laws that can affect the cost, manner or feasibility of doing business.
Crescent Point is subject to extensive and complex regulations and laws enforced by various regulatory agencies. These regulatory agencies include, in Canada, the AER, the Alberta EPA, the British Columbia Energy Regulator, the British Columbia Ministry of Environment and Climate Change Strategy, the SMER, Saskatchewan Ministry of Environment, the Canadian Energy Regulator, Environment and Climate Change Canada, Health Canada and Transport Canada. Additionally, the development or implementation of changes to land use activities, such as regional or subregional planning, may effect how we are able to use certain lands for oil and gas development. Crescent Point is also subject to regulation by other federal, provincial, state and local agencies. Regulations affect almost every aspect of Crescent Point's business and limit its ability to make and implement independent management decisions, including about business combinations, disposing of operating assets and engaging in transactions between Crescent Point and its affiliates.
Under these laws and regulations, we could be liable for personal injuries, property damage and other damages. Failure to comply with these laws and regulations also may result in the suspension or termination of our operations and subject us to administrative, civil and criminal penalties. Moreover, these laws and regulations could change in ways that could substantially increase our costs. Any such liabilities, penalties, suspensions, terminations or regulatory changes could materially and adversely affect our financial condition and results of operations.
Regulations and laws are subject to ongoing policy initiatives, and Crescent Point cannot predict the future course of regulations or legislation and their respective ultimate effects. Such changes could materially impact Crescent Point's business, financial position and results of operations.
For further discussion about the effect of environmental laws and regulations, see below "Our operations may incur substantial costs and liabilities to comply with environmental laws and regulations".
Our operations may incur substantial costs and liabilities to comply with environmental laws and regulations.
Many aspects of the oil and natural gas business present environmental risks and hazards, including the risk that Crescent Point may be in non-compliance with an environmental law, regulation, permit, license or other regulatory approval, possibly unintentionally or without knowledge. Such risks may expose Crescent Point to fines or penalties, suspension or revocation of regulatory permits, third party liabilities or to the requirement to remediate or carry out other actions, the costs of which could be material. The operational hazards associated with possible blowouts, accidents, oil spills, gas leaks, fires, explosions or other damage to a well, pipeline or facility may require Crescent Point to incur costs and delays to undertake corrective actions, and could result in penalties and fines and suspension or revocation of regulatory approvals or environmental or other damage for which Crescent Point could be liable. Oil and gas operations are also subject to specific operational risks which may have a material operational and financial impact on Crescent Point should they occur, such as drilling into unexpected formations or unexpected pressures, premature decline of reservoirs and water invasion into producing formations.
Crescent Point may also be subject to associated liabilities resulting from lawsuits alleging property damage or personal injury brought by private litigants related to the operation of Crescent Point's facilities or the land on which such facilities are located, regardless of whether Crescent Point leases or owns the facility, and regardless of whether such environmental conditions were created by Crescent Point, a prior owner or tenant, a third party or a neighbouring facility whose operations may have affected Crescent Point's facility or land. Such liabilities could have a material adverse effect on Crescent Point's business, financial position, operations, assets or future prospects.
Crescent Point also faces uncertainties related to future environmental laws and regulations affecting its business and operations. Existing environmental laws and regulations may be revised or interpreted more strictly, and new laws or regulations may be adopted or become applicable to Crescent Point, which may result in increased compliance costs or additional operating restrictions, each of which could reduce Crescent Point's earnings and adversely affect Crescent Point's business, financial position, operations, assets or future prospects. For example, if the Corporation did not qualify in 2023 for an exemption under the TIERS and OBPS programs in Alberta and Saskatchewan, respectively, the additional carbon compliance costs to the Corporation in Canada would have been, approximately, $66.5 million in 2023, which amount is calculated based on Scope 1 fuel combustion and flaring emissions at the applicable 2023 carbon pricing rate.
Compliance with environmental laws and regulations could materially increase our costs. We may incur substantial capital and operating costs to comply with increasingly complex laws covering the protection of the environment and human health and safety. In particular, we may be required to incur significant costs to comply with future federal GHG emissions reduction requirements or other GHG emissions regulations. See below "Climate change legislation or regulations restricting emissions of greenhouse gases could result in increased operating costs and reduced demand for oil and gas that we produce".
Although we record a provision in our consolidated financial statements relating to our estimated future abandonment and reclamation obligations, we cannot guarantee that we will be able to satisfy our actual future abandonment and reclamation obligations. In addition, estimates of the costs are subject to uncertainty associated with the method, timing and extent of future decommissioning activities. Although the Corporation maintains insurance consistent with prudent industry practice, we are not fully insured against certain environmental risks, including the impacts of climate change, either because such insurance is not available or because of high premium costs. In particular, insurance against risks from environmental pollution occurring over time (as opposed to sudden and catastrophic damages) is not available on economically reasonable terms.
Accordingly, our properties may be subject to liability due to hazards that cannot be insured against, or that have not been insured against due to prohibitive premium costs or for other reasons. It is also possible that changing regulatory requirements or emerging jurisprudence could render such insurance of less benefit to Crescent Point. Any site remediation, reclamation or abandonment costs actually incurred in the ordinary course of business in a specific period will be funded out of our reclamation budget and, if required, out of cash flow and, therefore, will reduce the amounts available for return of capital to Shareholders. Should we be unable to fully fund the cost of remedying an environmental problem, we might be required to suspend or terminate certain operations or enter into interim compliance measures pending completion of the required remedy.
Climate change legislation or regulations restricting emissions of greenhouse gases could result in increased operating costs and reduced demand for oil and gas that we produce.
Complying with climate change legislation and regulations has increased operating costs as we pay fuel charges imposed by such legislation and have undertaken initiatives to reduce GHG emissions. Additionally, complying with methane reduction regulations applicable to our business requires Crescent Point to incur additional operating costs in order to achieve compliance.
Changes to federal legislation, as well as legislation in Alberta and Saskatchewan require the restriction or reduction of GHG emissions or emissions intensity from our current and future operations and facilities, which may lead to increased operational costs associated with emission reductions, payments to technology or decarbonization funds, payments of carbon levies, the purchase and retirement of emission reductions, allowances or offset credits, or a combination of such actions. The required GHG reductions may not be technically or economically feasible for our operations and the failure to meet such emission reduction or emission intensity reduction requirements or other compliance mechanisms may materially adversely affect our business and result in fines, penalties and the suspension of some operations. Furthermore, equipment from suppliers which can meet future emission standards may not be available on an economic basis and other compliance methods of reducing emissions or emission intensity to levels required in the future may significantly increase our operating costs or reduce output. Emission reductions, allowances or offset credits may not be available on an economic basis. Additionally, changes in technology could decrease the demand for our products.
The current state of development of ongoing international climate initiatives and any related domestic actions make it difficult to assess the timing or effect on our operations or to predict with certainty the future costs that we may incur in order to comply with future international treaties or domestic United States regulations. Moreover, many experts believe climate change poses potential physical risks, including an increase in sea level and changes in weather conditions, such as an increase in precipitation and extreme weather events, including severe cold, wildfires, droughts and floods, which can result in damage to or destruction of infrastructure, facilities and equipment. In addition, warmer winters in some regions as a result of climate change could also decrease demand for natural gas. To the extent that such unfavorable weather conditions are realized due to climate change or otherwise, our operations may be adversely affected to a greater degree than we have previously experienced, including increased delays and costs. However, the uncertain nature of changes in extreme weather events (such as increased frequency, duration, and severity) and the long period of time over which any changes would take place make any estimations of future financial risk to our operations caused by these potential physical risks of climate change unreliable.
We may be unable to meet emissions targets.
We have set internal emissions reduction targets with respect to GHG emissions. There are substantial costs and operational changes required to meet such targets, and as such, we may be unable to finance the required changes to meet our emissions targets due to lack of capital for a variety of reasons, many of which are beyond our control. Additionally, we may be unable to adequately alter our operations in such a way as to meet our emissions targets by the stated dates or at all.
Changes in market-based factors may adversely affect the trading price of the Common Shares.
The market price of our Common Shares is sensitive to a variety of market-based factors including, but not limited to, commodity prices, interest rates, foreign exchange rates and the comparability of the Common Shares to other securities. Any changes in these market-based factors may adversely affect the trading price of the Common Shares.
Federal, provincial and local legislative and regulatory initiatives relating to hydraulic fracturing could result in increased costs and additional operating restrictions or delays.
Some of Crescent Point's operations use hydraulic fracturing, which involves the high pressure injection of fluids and sand down a well to fracture the reservoir and thereby stimulate the increased flow of oil or gas into the well bore. Hydraulic fracturing has been the subject of greater regulatory and public scrutiny and regulation in certain jurisdictions of the world, including some of the areas in which Crescent Point operates. In a limited number of areas, hydraulic fracturing has been banned pending public and scientific reviews or is subject to moratoria while regulators study the practice. Additionally, hydraulic fracturing has been found to induce seismicity, and the AER has developed monitoring and reporting requirements that companies must follow in certain areas of Alberta, and in certain cases, the AER may require that operations resulting in increased seismic activity be suspended and not resumed without AER approval. We may be required to expend additional costs to comply with future regulatory requirements with respect to hydraulic fracturing or, in the future, be unable to carry out hydraulic fracturing operations, thereby lessening the volume of oil and gas we could otherwise produce and this could have a material operational and financial impact on Crescent Point and adversely affect the market price of our Common Shares and dividends to Shareholders.
Our business and financial performance may be adversely affected by subsequent unavailability and unfavorable terms of water licenses.
Crescent Point utilizes fresh water in certain operations, including hydraulic fracturing operations, which water is obtained under licenses issued within each respective jurisdiction's regulations. If water use fees increase or a change under these licenses reduces the amount of water available for our use, production could decline or operating expenses could increase, both of which may have a material adverse effect on our business and financial performance. There can be no assurance that the licenses to withdraw water will not be rescinded, that additional conditions will not be added to these licenses or that the water licensed will be available. There is no assurance that if we require licenses or amendments to existing licenses, that these licenses or amendments will be granted on favorable terms. This may adversely affect our business, including the ability to operate our assets and execute development plans.
The Corporation's risk and/or cost of borrowing may be adversely affected by the uncertainty resulting from the Orphan Well Association v Grant Thornton Ltd. court decision.
On January 31, 2019, the Supreme Court of Canada released its decision in Orphan Well Association v Grant Thornton Ltd. (the "Redwater decision") overturning earlier decisions of the Alberta courts to hold that receivers and trustees can no longer avoid the AER legislated authority to: impose abandonment orders against licensees, or require a licensee to pay a security deposit before approving a transfer when such a licensee is subject to formal insolvency proceedings. As a result, any financial resources of a bankrupt licensee in Alberta may first be used to satisfy outstanding abandonment and reclamation obligations in respect of its unproductive assets. Remaining amounts, if any, will then satisfy the claims of secured creditors in accordance with the Bankruptcy and Insolvency Act. As a result of the Redwater decision, the provincial regulation of environmental liabilities and associated decommissioning liability in the oil and gas industry is undergoing changes. On January 1, 2023, SMER changed how it assesses the financial ability of operators/licensees to meet their abandonment, reclamation and other regulatory obligations and on December 1, 2021, the AER brought into force the new LLCM. The impact of any such regulatory measures by a provincial or federal government on the Corporation is uncertain at this time.
Additionally, some issuers have been required by lenders to include covenants with respect to the asset recovery obligations in the agreements that govern their borrowings (including credit facilities and other debt obligations) following the Redwater decision. To date, the Corporation has not been required by its lenders to include such provisions, however, there can be no certainty that the Corporation's lenders will not require such or other covenants and contractual terms, which in turn could cause the Corporation's risk and/or cost of borrowing to increase, possibly materially.
Safety requirements involving rail transportation may adversely affect us and our Shareholders.
In response to train derailments occurring in the United States and Canada in 2013, U.S. and Canadian regulators have implemented additional rules to address the safety risks of transporting crude oil by rail.
In Canada, amendments have been made to the Transportation of Dangerous Goods Regulations which adopt a new class of tank car for flammable liquid dangerous goods service and which require all new rail tank cars destined for flammable liquid service to be built to the new specifications. Certain older tank cars used to transport crude oil have been phased out. Further, shippers of crude oil by rail now must have in place an Emergency Response Assistance Plan approved by the Minister of Transportation in order to be able to provide assistance to responders in the event of an accident. Other amendments require the consigner of a shipment of crude oil by rail to properly classify the crude oil and to certify that the classification is correct. Additionally, Transport Canada has introduced requirements for railway companies to reduce the speed of trains carrying dangerous goods such as crude oil and to implement various other safe operating practices.
In the United States, the Department of Transportation has adopted regulations for the transportation of flammable liquids, which align with the standards adopted by Canada. Among other matters, the regulations require enhanced braking systems on trains transporting flammable liquids, restricts operating speeds, requires a risk assessment-based routing analysis, and mandates procedures for more accurate classification of crude oil.
These regulations and the adoption of any other regulations that impact the testing or rail transportation of crude oil could increase our costs of doing business and limit our ability to transport and sell our crude oil at favorable prices at market centers throughout Canada and the United States, the consequences of which could have a material adverse effect on our financial condition, results of operations and cash flows.
Income tax laws or other laws or government incentive programs or regulations relating to our industry may in the future be changed or interpreted in a manner that adversely affects us and our Shareholders.
Changes in tax and other laws may adversely affect the trading price of our Common Shares and return of capital to Shareholders. Tax authorities having jurisdiction over the Corporation or the Shareholders may disagree with the manner in which we calculate our income for tax purposes or could change their administrative practices to our detriment or the detriment of Shareholders.
The oil and gas industry is subject to extensive controls and regulations governing its operations (including land tenure, exploration, development, production, refining, transportation, and marketing) imposed by legislation enacted by various levels of government and with respect to pricing and taxation of oil and natural gas by agreements among the governments of Canada, the provinces, the United States, and the various states, all of which should be carefully considered by investors in the oil and gas industry. All of such controls, regulations and legislation are subject to revocation, amendment or administrative change, some of which have historically been material and in some cases materially adverse and there can be no assurance that there will not be further revocation, amendment or administrative change which will be materially adverse to our assets, reserves, financial condition or results of operations or prospects and our ability to return capital to Shareholders.
Royalty changes may adversely affect us.
Royalty frameworks, including rates and available incentive programs, may be reviewed and amended from time to time by the applicable federal, provincial, state or other governmental bodies or agencies having jurisdiction. In addition, the royalty rates applicable to the Corporation’s production of hydrocarbons may be impacted by changes in market prices for hydrocarbons, production volumes, and capital and operating costs. An increase in royalty rates would reduce the Corporation's cash flow and earnings, and could make future capital investments, or the Corporation's operations, less economic.
We are affected by seasonal weather patterns.
The level of activity in the oil and gas industry is influenced by seasonal weather patterns. Wet weather and spring thaw may make the ground unstable. Consequently, municipalities, provincial and state transportation departments enforce road bans that restrict the movement of rigs and other heavy equipment, thereby reducing activity levels. Also, certain oil and natural gas producing areas are located in areas that are inaccessible other than during the winter months because the ground surrounding the sites in these areas consists of swampy terrain. Seasonal factors, unexpected weather patterns, wildfires, floods and droughts may lead to declines in exploration and production activity and corresponding declines in the demand for crude oil and natural gas.
We may be adversely affected by extreme weather events.
Extreme weather events are an unpredictable risk. Wildfires can be caused by lightning, high temperatures, or by human activity and can spread because of wind and are otherwise encouraged by hot dry conditions. Floods can be caused by a high level of precipitation in a short period of time. Severe cold can cause water to freeze and expand leading to a chance that pipes can burst and valves may break. Wildfires, floods and severe cold can cause damage to or destroy infrastructure including roads, rail lines, and power transmission lines, cause damage to facilities and equipment, cause operational difficulties and access restrictions, lead to reduced operations or a cessation of operations in affected areas, and can cause supply chain disruptions affecting both our ability to market oil and gas and our ability to obtain goods and services required for our operations. Drought can lessen the availability of water required to conduct our operations. Extreme weather events could adversely affect our business and operations, however, due to the unpredictable nature of extreme weather events, it is not possible to determine how or to what extent our business or operations may be affected.
We may be subject to environmental non-governmental organization legal challenges.
Environmental non-governmental organizations have become more aggressive in pursuing legal challenges to oil and gas companies, drilling and pipeline projects. In turn, this could result in increased costs and additional operating restrictions or delays as well as the risks under "Risks Relating to Our Business - We may be Subject to Litigation." Investor sentiment towards fossil fuel development has been affected by a number of factors, including public perception, climate change, environmental impacts of operations, environmental damage resulting from accidental releases, responsibility for orphaned wells and Indigenous rights.
Investor sentiment towards fossil fuel development may not align with our business.
As a result of these and other concerns, some institutional, retail and governmental investors have announced that they will no longer fund or invest in oil and natural gas, or are reducing their investments in the same. Some institutional investors are also requesting that issuers develop and implement robust social, environmental and governance policies and practices, which may be more stringent than those which Crescent Point already has in place. Changing investor sentiment can make capital harder to access or more expensive, and may also have an effect on the value of our assets. It is not expected that changing investor sentiment will affect our operations in a manner materially different than they would affect other oil and gas entities of similar size.
Certain Risks for United States and other non-resident Shareholders
The ability of investors resident in the United States to enforce civil remedies is limited.
Most of our directors and officers and the representatives of the experts who provide services to us (such as our auditors and our independent reserve engineers), and all or a substantial portion of our assets and the assets of such persons are located outside the United States. As a result, it may be difficult for investors in the United States to effect service of process within the United States upon such directors, officers and representatives of experts who are not residents of the United States or to enforce against them judgments of the United States courts based upon civil liability under the United States federal securities laws or the securities laws of any state within the United States. There is doubt as to the enforceability in Canada against us or any of our directors, officers or representatives of experts who are not residents of the United States, in original actions or in actions for enforcement of judgments of United States courts of liabilities based solely upon the United States federal securities laws or securities laws of any state within the United States.
Canadian and United States practices differ in reporting reserves and production and our estimates may not be comparable to those of companies in the United States.
We report our production and reserve quantities in accordance with Canadian practices and specifically in accordance with NI 51-101. These practices are different from the practices used to report production and to estimate reserves in reports and other materials filed with the SEC by companies in the United States.
We incorporate additional information with respect to production and reserves which is either not required to be included or prohibited under rules of the SEC and practices in the United States. We follow the Canadian practice of reporting gross production and reserve volumes (before deduction of Crown and other royalties), however, we also follow the United States practice of separately reporting these volumes on a net basis (after the deduction of royalties and similar payments). We also follow the Canadian practice of using forecast prices and costs when we estimate our reserves, whereas, the SEC rules require that a trailing 12-month average price, calculated as the unweighted arithmetic average of the first-day-of-month for each month within the 12-month period to the end of the reporting period, and uninflated (constant) costs be utilized. The SEC permits, but does not require, the disclosure of reserves based on forecast prices and costs.
Reserve information contained herein include estimates of Proved and Proved plus Probable reserves. The SEC requires oil and gas issuers in their filings with the SEC to disclose only Proved reserves. The SEC permits, but does not require, the inclusion of estimates of Probable reserves in filings made with it by United States oil and gas companies. The SEC definitions of Proved reserves and Probable reserves are different than those in NI 51-101. As a consequence of the foregoing, our reserve estimates and production volumes in this AIF may not be comparable to those made by companies utilizing United States reporting and disclosure standards.
Shareholders who are non-residents of Canada may be subject to additional taxation.
The Tax Act imposes a withholding tax at the rate of 25% on dividends paid by us to Shareholders who are non-residents of Canada, unless the rate is reduced under the provisions of a tax treaty between Canada and the non-resident Shareholder's jurisdiction of residence. These withholding tax rates may change from time to time. Where the non-resident Shareholder is a United States resident entitled to benefits under the Canada-United States Income Tax Convention, 1980 and is the beneficial owner of the dividend, the rate of Canadian withholding tax applicable to dividends is generally reduced to 15%. Shareholders who are non-residents of Canada are encouraged to consult with their tax advisors for more information concerning additional taxation that may be applicable to them.
Shareholders who are non-residents of Canada may be subject to foreign exchange risk.
Our dividends are declared in Canadian dollars and converted to foreign denominated currencies at the spot exchange rate at the time of payment. As a consequence, investors are subject to foreign exchange risk. To the extent that the Canadian dollar strengthens with respect to their currency, the amount of the dividend will be reduced when converted to their home currency.
DIVIDENDS AND SHARE REPURCHASES
The Corporation has established a dividend policy of paying regular dividends to Shareholders. An objective of the Corporation's dividend policy is to provide Shareholders with relatively stable and predictable dividends. An additional objective is to retain a portion of cash flow to fund ongoing development and optimization projects designed to enhance the sustainability of the Corporation's cash flow. Commencing in 2019, the Corporation moved to a quarterly dividend, paid on the first business day of each quarter. Dividends are paid to Shareholders of record on the 15th day of the month prior to the payment date.
Additionally, as part of its return of capital framework that targets the return of up to 60% of the Corporation's excess cash flow, the Corporation, has and, in the future, may declare special dividends. Special dividends declared and paid in 2023 were $0.087 per Share.
The amount of cash dividends to be paid on the Common Shares, if any, will be subject to the discretion of the Board of Directors and may vary depending on a variety of factors, including the price of oil and gas, the prevailing economic and competitive environment, results of operations, debt and working capital levels, the taxability of Crescent Point, Crescent Point's ability to raise capital, the amount of capital expenditures and other conditions existing from time to time. There can be no guarantee that Crescent Point will maintain its dividend policy.
Although the Corporation strives to provide Shareholders with stable and predictable cash flows, the percentage of cash flow from operations paid to Shareholders may vary according to a number of factors, including, fluctuations in resources prices, exchange rates and production rates, reserves growth, the size of development drilling programs and the portion thereof funded from cash flow and the overall level of debt of the Corporation.
The agreements governing the Credit Facilities, Term Loan and Senior Guaranteed Notes provide that distributions to Shareholders and share repurchases are not permitted if the Corporation is in default under the agreements or the payment of such distribution would cause an event of default.
The following table sets forth the amount of cash dividends declared per Common Share by the Corporation for the periods indicated.
|
|
|
|
|
|
|
|
|
|
|
|
|
|
|
Dividends per Common Share ($) |
January 2021 |
– |
December 2021 |
0.0825 |
January 2022 |
– |
December 2022 |
0.3600 |
January 2023 |
– |
December 2023 |
0.3870 |
Normal Course Issuer Bid
On March 9, 2022, Crescent Point commenced the 2022 NCIB to purchase, for cancellation, up to 57,309,975 Common Shares, representing 10% of the Corporation's public float as at February 28, 2022. The 2022 NCIB expired on March 8, 2023. A total of 29,398,000 Common Shares were purchased under the 2022 NCIB.
On March 9, 2023, Crescent Point commenced the 2023 NCIB to purchase, for cancellation, up to 54,605,659 Common Shares, representing 10% of the Corporation's public float as at February 23, 2023. The 2023 NCIB is due to expire on March 8, 2024. As of February 16, 2024, the Corporation had purchased 30,775,500 Common Shares under the 2023 NCIB.
The objective of the 2022 NCIB and the 2023 NCIB was to return capital to Shareholders in a way that is accretive to both Shareholders and the Corporation. Purchases of Common Shares under the 2023 NCIB may be made through the facilities of the TSX or the NYSE, alternative trading systems by means of open market transactions, or by such other means as may be permitted by the TSX and applicable securities laws.
MARKET FOR SECURITIES
The outstanding Common Shares are traded on the TSX and the NYSE under the trading symbol "CPG". The following tables set forth the price range and trading volume of the Common Shares as reported by the TSX and NYSE for the periods indicated.
|
|
|
|
|
|
|
|
|
|
|
|
TSX |
High ($) |
Low ($) |
Volume (000's) |
| 2023 |
|
|
|
| January |
10.22 |
8.64 |
77,066 |
| February |
10.09 |
8.93 |
100,987 |
| March |
10.07 |
7.73 |
170,792 |
| April |
10.54 |
9.67 |
94,266 |
| May |
10.02 |
8.50 |
74,361 |
| June |
9.46 |
8.32 |
85,273 |
| July |
10.94 |
8.69 |
90,232 |
| August |
11.49 |
10.55 |
59,550 |
| September |
11.70 |
10.65 |
56,985 |
| October |
11.62 |
10.16 |
61,599 |
| November |
11.67 |
9.22 |
103,645 |
| December |
9.72 |
8.62 |
70,618 |
| 2024 |
|
|
|
| January |
9.48 |
8.51 |
60,207 |
| February 1 - 16 |
9.22 |
8.16 |
31,225 |
|
|
|
|
|
|
|
|
|
|
|
|
NYSE |
High (US$) |
Low (US$) |
Volume (000's) |
| 2023 |
|
|
|
| January |
7.67 |
6.39 |
103,313 |
| February |
7.57 |
6.59 |
121,827 |
| March |
7.40 |
5.59 |
164,215 |
| April |
7.87 |
7.08 |
85,216 |
| May |
7.40 |
6.26 |
73,222 |
| June |
7.08 |
6.30 |
76,271 |
| July |
8.29 |
6.50 |
70,229 |
| August |
8.57 |
7.81 |
62,699 |
| September |
8.59 |
7.90 |
56,839 |
| October |
8.49 |
7.40 |
77,938 |
| November |
8.53 |
6.70 |
101,748 |
| December |
7.23 |
6.34 |
92,036 |
| 2024 |
|
|
|
| January |
7.10 |
6.28 |
100,653 |
| February 1 - 16 |
6.84 |
6.04 |
69,915 |
CONFLICTS OF INTEREST
Circumstances may arise where members of the Board of Directors or officers of the Corporation are directors or officers of corporations which are in competition to the interests of the Corporation. No assurances can be given that opportunities identified by such Board members or officers will be provided to the Corporation. In accordance with the ABCA, a director or officer who is a party to a material contract or proposed material contract with the Corporation or is a director or an officer of or has a material interest in any person who is a party to a material contract or proposed material contract with the Corporation shall disclose to the Corporation the nature and extent of the director's or officer's interest. In addition, a director shall not vote on any resolution to approve a contract of the nature described except in limited circumstances. Management of the Corporation is not aware of any existing or potential material conflicts of interest between the Corporation or a subsidiary of the Corporation and a director or officer of the Corporation or any other subsidiary of the Corporation.
LEGAL PROCEEDINGS
There are no outstanding legal proceedings material to the Corporation to which we are a party or in respect of which any of our properties are subject, nor are any such proceedings known to be contemplated.
AUDIT COMMITTEE
General
The Corporation has established an Audit Committee (the "Audit Committee") comprised of four members: Mike Jackson (Chair), Francois Langlois, Myron M. Stadnyk and Mindy Wight each of whom is considered "independent" and "financially literate" within the meaning of National Instrument 52-110 – Audit Committees.
Mandate of the Audit Committee
The mandate of the Audit Committee is to assist the Board of Directors in its oversight of the integrity of the financial and related information of the Corporation and its subsidiaries and related entities, including the consolidated financial statements, internal controls and procedures for financial reporting and the processes for monitoring compliance with legal and regulatory requirements. In doing so, the Audit Committee oversees the audit efforts of our external auditors and, in that regard, is empowered to take such actions as it may deem necessary to satisfy itself that our external auditors are independent of us. It is the objective of the Audit Committee to have direct, open and frank communications throughout the year with management, other Committee chairs, the external auditors, and other key committee advisors or the Corporation's staff members, as applicable.
The Audit Committee's function is oversight. Management of the Corporation is responsible for the preparation, presentation and integrity of the consolidated financial statements of the Corporation. Management is responsible for maintaining appropriate accounting and financial reporting principles and policies as well as internal controls and procedures that provide for compliance with accounting standards and applicable laws and regulations. Additionally, the Audit Committee reviews the cyber risks facing the Corporation and any related policies for managing cyber risk, as well as the Corporation's enterprise risk management policy, processes and framework and the assessment of enterprise risk management effectiveness by internal audit.
While the Audit Committee has the responsibilities and powers set forth above, it is not the duty of the Audit Committee to plan or conduct audits or to determine whether the consolidated financial statements of the Corporation are complete and accurate and are in accordance with generally accepted accounting principles. This is the responsibility of management and the external auditors, on whom the members of the Committee are entitled to rely upon in good faith.
The Audit Committee Mandate is attached hereto as Appendix A.
Relevant Education and Experience of Audit Committee Members
The following is a brief summary of the education or experience of each member of the Audit Committee that is relevant to the performance of his or her responsibilities as a member of the Audit Committee, including any education or experience that has provided the member with an understanding of the accounting principles used by us to prepare our annual and interim consolidated financial statements.
|
|
|
|
|
|
Name of Audit
Committee Member |
Relevant Education and Experience |
Mike Jackson |
Mr. Mike Jackson worked in the banking sector from 1984 until his retirement in 2016. From 1997 to 2016, he was Managing Director in Scotiabank's Corporate & Investment Banking group focused on the oil & gas industry, including ten years heading the group. For the period 2006-2016, Mr. Jackson served as Financial Advisor to Boards/companies on M&A transactions aggregating over $28 billion. Mr. Jackson joined the Board of Crescent Point in November 2016. |
|
Mr. Jackson holds a Bachelor of Science degree and a Master of Business Administration, both from Dalhousie University and the ICD.D designation granted by the Institute of Corporate Directors. Additionally, Mr. Jackson completed the Executive Management Program at Queen's University. |
François Langlois |
Mr. Langlois is an oil and gas executive who brings over 35 years of domestic and international experience to the Crescent Point Board, most recently from his role as Senior Vice President, Exploration & Production with Suncor Energy Inc., where he was responsible for the financial and operating performance of the group from 2011 until his retirement in 2016. Prior thereto, he was Vice President, Unconventional Gas from 2009 to 2010 and held various roles with Petro-Canada from 1982 to 2009, most recently as Vice President, Western Canada Production & North American Exploration. |
|
Mr. Langlois holds a Bachelor Geological Engineering from Laval University (Quebec City) and the ICD.D designation granted by the Institute of Corporate Directors. |
Mindy Wight |
Ms. Mindy Wight brings over 15 years of tax and financial expertise in her current role of Chief Executive Officer for the Nch'kay Development Corporation, as well as holding the role as Treasurer of the Board of Directors. Prior to joining Nch'kay Development Corporation in November 2021, Ms. Wight held progressive tax roles at MNP LLP from 2016 to 2021 and most recently was a partner and National Leader of Indigenous Tax Services for the firm. Ms. Wight has also worked for two of the Big Four National accounting firms, the Chartered Accounting School of Business and the Canada Revenue Agency since graduating from the University of Northern British Columbia with a Bachelor of Commerce Degree, Accounting in 2007. Ms. Wight also possesses Chartered Professional Accountant, Chartered Accountant, and Certified Aboriginal Financial Manager designations. |
|
Ms. Wight has historically held Board positions as the Chair of the Board of Directors and Chair of the Finance and Audit Committee for the Nch'kay Development Corporation and was an Advisory Committee Member of the Budget and Financial Committee to the Squamish Nation. |
Myron M. Stadnyk |
Mr. Myron M. Stadnyk has over 35 years of oil and gas experience and is the former President and CEO of ARC Resources Ltd., retiring in 2020. During his tenure as CEO, and prior to that as COO, Mr. Stadnyk played a pivotal role in ARC's transformation from a Royalty trust to a leading Canadian producer. His extensive career also includes working for a major oil and gas company in both domestic and international operations. Mr. Stadnyk earned a Bachelor of Science in Mechanical Engineering from the University of Saskatchewan and is a graduate of the Harvard Business School Advanced Management Program. He holds an ICD.D designation and is a member of APEGA. |
|
Mr. Stadnyk formerly held a position on the Board of Directors at PrairieSky Royalty Ltd. and served as a Governor for CAPP for over a decade. Currently, Mr. Stadnyk is a board member of Vermilion Energy Inc. and serves on the Board of Trustees for the University of Saskatchewan Engineering Advancement Trust. |
External Auditor Services Fees
For services provided to the Corporation and its subsidiaries for the years ended December 31, 2023 and 2022 PricewaterhouseCoopers LLP billed approximately $1,656,373 and $998,961, respectively, as detailed below:
|
|
|
|
|
|
|
|
|
|
Year ended December 31 |
|
2023 |
2022 |
PricewaterhouseCoopers |
|
|
Audit fees |
$ |
1,457,676 |
|
$ |
952,778 |
|
Audit-related fees |
$ |
48,897 |
|
$ |
46,183 |
|
Tax fees |
— |
|
— |
|
| All other fees |
$ |
149,800 |
|
$ |
— |
|
Total |
$ |
1,656,373 |
|
$ |
998,961 |
|
The Chair of the Audit Committee has the authority to pre-approve non-audit services which may be required from time to time.
Audit Fees were paid, or are payable, for professional services rendered by the auditors for the audit of the annual financial statements and reviews of the quarterly financial statements, as well as services provided in connection with statutory and regulatory filings or engagements. Audit-related fees consist of the aggregate fees billed for assurance and related services that are reasonably related to the performance of the audit or review of the Corporation's financial statements and are not reported as Audit fees. The services in this category include participation fees levied by the Canadian Public Accountability Board. All Other Fees were for products or services provided by Crescent Point's auditors other than those described as Audit Fees and Audit-Related Fees. All services described beside the captions "Audit Fees", "Audit-Related Fees", and "All Other Fees" were approved by the Audit Committee in compliance with paragraph (c)(7)(i) of Rule 2-01 of Regulation S-X under the U.S. Securities and Exchange Act of 1934, as amended (the "Exchange Act"). None of the fees described above were approved by the Audit Committee pursuant to paragraph (c)(7)(i)(C) of Regulation S-X under the Exchange Act.
Audit Committee Oversight
At no time since the commencement of our most recently completed financial year, has a recommendation of the Audit Committee to nominate or compensate an external auditor not been adopted by the Board of Directors.
TRANSFER AGENT AND REGISTRARS
The transfer agent and registrar for our Common Shares is Computershare Trust Company of Canada in Calgary, Alberta.
AUDITOR
Our auditor is PricewaterhouseCoopers LLP, Chartered Professional Accountants, 3100, 111 – 5th Avenue S.W., Calgary, Alberta, T2P 5L3.
MATERIAL CONTRACTS
Set out below is the only agreement that may be considered material to us:
•Premium Dividend and Dividend Reinvestment Plan.
See "Additional Information Respecting Crescent Point – Premium Dividend and Dividend Reinvestment Plan".
INTERESTS OF EXPERTS
Audit of the consolidated financial statements and the effectiveness of internal control over financial reporting is conducted in accordance with PCAOB standards.
The Corporation’s independent registered public accounting firm is PricewaterhouseCoopers LLP, Chartered Professional Accountants, who have issued a Report of Independent Registered Public Accounting Firm dated February 28, 2024 in respect of the Corporation’s consolidated financial statements as at December 31, 2023 and December 31, 2022 and for each of the years ended December 31 and on the effectiveness of internal control over financial reporting as at December 31, 2023. PricewaterhouseCoopers LLP has advised that they are independent with respect to the Corporation within the meaning of the Rules of Professional Conduct of the Chartered Professional Accountants of Alberta and the rules of the US Securities and Exchange Commission (SEC) and the Public Company Accounting Oversight Board (PCAOB) on auditor independence.
Reserve estimates contained in this AIF are derived from reserve reports prepared by McDaniel. As of the date hereof, McDaniel, as a group, does not beneficially own, directly or indirectly, any Common Shares.
ADDITIONAL INFORMATION
Additional financial information is available on SEDAR+ at www.sedarplus.com, on EDGAR at www.sec.gov/edgar and on our website at www.crescentpointenergy.com.
Additional information including directors' and officers' remuneration and indebtedness, principal holders of the Corporation's securities, options to purchase securities and securities authorized for issuance under equity compensation plans, if applicable, is contained in our information circular in respect of the annual meeting of Shareholders held on May 18, 2023, which is available on SEDAR. Additional financial information is provided in our comparative consolidated financial statements for our most recently completed financial year ended December 31, 2023 and MD&A.
For additional copies of this AIF please contact:
Crescent Point Energy Corp.
2000, 585 – 8th Avenue, S.W.
Calgary, Alberta
T2P 1G1
Attention: Investor Relations
APPENDIX A
CRESCENT POINT ENERGY CORP.
AUDIT COMMITTEE MANDATE
CORPORATE POLICIES & PROCEDURES
I. THE BOARD OF DIRECTORS' MANDATE FOR THE AUDIT COMMITTEE
1.General
The Board of Directors (the "Board") has responsibility for the stewardship of Crescent Point Energy Corp. ("Crescent Point") and its subsidiaries or related entities (collectively referred to herein as the "Corporation"). To discharge that responsibility, the Board is obligated by the Business Corporations Act (Alberta) to supervise the management of the business and affairs of the Corporation. The Board's supervisory function involves Board oversight or monitoring of all significant aspects of the management of the Corporation's business and affairs.
Public financial reporting and disclosure by the Corporation are fundamental to the Corporation's business and affairs and to its status as a publicly listed enterprise. The objective of the Board's monitoring of the Corporation's financial reporting and disclosure is to gain reasonable assurance of the following (including, where advisable in the achievement of this objective, through appropriate consultation with senior management and the Corporation's external auditors):
(a)that the Corporation complies with all applicable laws, regulations, rules, policies and other requirement of governments, regulatory agencies and stock exchanges relating to financial reporting and disclosure;
(b)that the accounting principles, significant judgments and disclosures which underlie or are incorporated in the Corporation's consolidated financial statements are the most appropriate in the prevailing circumstances;
(c)that the Corporation's quarterly and annual consolidated financial statements and management's discussion and analysis, and the Corporation's Annual Information Forms ("AIF") are accurate within a reasonable level of materiality and present fairly the Corporation's financial position and performance in accordance with the recognition and measurement principles of International Financial Reporting Standards as issued by the International Accounting Standards Board ("IFRS"); and
(d)that appropriate information concerning the financial position and performance of the Corporation is disseminated to the public in a timely manner in accordance with corporate and securities law and with stock exchange regulations.
The Board is of the view that monitoring the Corporation's financial reporting and disclosure policies and procedures cannot be reliably met unless the following activities (the "Fundamental Activities") are conducted effectively:
(i)the Corporation's accounting functions are performed in accordance with a system of internal financial controls designed to capture and record properly and accurately all of the Corporation's financial transactions;
(ii)the internal financial controls are regularly assessed for effectiveness and efficiency;
(iii)the Corporation's accounting functions are performed in a manner sufficient to ensure the Corporation has established and continues to maintain disclosure controls and procedures and internal control over financial reporting that meet the requirements of applicable laws, rules and regulations and allows the Chief Executive Officer and the Chief Financial Officer to certify the same;
(iv)the Corporation's quarterly and annual consolidated financial statements are properly prepared by management to comply with IFRS; and
(v)the Corporation's quarterly and annual consolidated financial statements and Management Discussion and Analysis ("MD&A") are reported on by an external auditor appointed by the shareholders of the Corporation.
To assist the Board in monitoring the Corporation's financial reporting and disclosure and to conform to applicable corporate and securities law, including National Instrument 52-110 Audit Committees ("NI 52-110") (as implemented by the Canadian Securities Administrators and as amended from time to time) the Board has established the Audit Committee (the "Committee") of the Board.
2. Role of the Committee
The role of the Committee is to assist the Board in its oversight of: (i) the integrity of the financial and related information of the Corporation, including its consolidated financial statements, the internal controls and procedures for financial reporting and the processes for monitoring compliance with legal and regulatory requirements; (ii) the Corporation's supply chain management process and procedures; (iii) the Corporation's enterprise risk management policy and framework; and (iv) the independence, qualifications and performance of the external auditor of the Corporation. Management is responsible for establishing and maintaining those controls, procedures and processes and the Committee is appointed by the Board to review and monitor them.
The Committee has the authority to conduct any review or investigation appropriate to fulfilling its responsibilities. The Committee shall have unrestricted access to personnel and information, and any resources necessary to carry out its responsibility. In this regard, the Committee may direct internal audit personnel to particular areas of examination.
3. Composition of Committee
(a)The Committee shall be appointed annually by the Board and consist of at least three members (the "Members") from among the directors of the Corporation.
(b)Each Member must be an independent, non-executive director, free from any relationship that would interfere with the exercise of the Member's independent judgement. Members shall meet the independence and experience requirements set forth in NI 52-110 and of the regulatory bodies to which the Corporation is subject. Each Member shall be "financially literate", which means under NI 52-110 having the ability to read and understand a set of financial statements that present a breadth and level of complexity of finance and accounting issues that are generally comparable to the breadth and complexity of the issues that can reasonably be expected to be raised by the Corporation's financial statements at the time of the Member's appointment to the Committee. At least one Member shall have accounting or related financial management expertise and qualify as an "audit committee financial expert" or similar designation in accordance with the requirements of the regulatory bodies to which the Corporation is subject.
(c)Committee members may not, other than in their respective capacities as members of the Committee, the Board or any other committee of the Board, accept directly or indirectly any consulting, advisory or other compensatory fee from the Corporation or any subsidiary of the Corporation, or be an "affiliated person" (as such term is defined in the United States Securities Exchange Act of 1934, as amended, and the rules, if any, adopted by the U.S. Securities and Exchange Commission thereunder) of the Corporation or any subsidiary of the Corporation. For greater certainty, directors' fees and fixed amounts of compensation under a retirement plan (including deferred compensation) for prior service with the Corporation that are not contingent on continued service should be the only compensation a Committee member receives from the Corporation.
(d)At least one member shall have experience in the oil and gas industry.
(e)Committee members shall not simultaneously serve on the audit committees of more than two other public companies, unless the Board first determines that such simultaneous service will not impair the ability of the relevant members to effectively serve on the Committee, and required public disclosure is made.
(f)The Board shall designate the Chair of the Committee.
(g)The Chair of the Board shall be an ex officio member of the Committee and shall be entitled to attend all meetings of the Committee.
(h)In the event of either: (i) a vacancy arising in the Committee that reduces the size of the Committee to fewer than three members; or (ii) the loss of independence of any Member, the Committee will fill the vacancy or replace the Member that has lost independence, as applicable, within six weeks or by the following annual shareholders' meeting if sooner.
4. Reliance on Experts
In contributing to the Committee discharging its duties under this Mandate, each Member of the Committee shall be entitled to rely in good faith upon:
(a)consolidated financial statements of the Corporation represented to the Member by an officer of the Corporation or in a written report of the external auditors to present fairly the financial position of the Corporation in accordance with IFRS; and
(b)any report of a lawyer, accountant, engineer, appraiser or other person whose profession lends credibility to a statement made by any such person.
5. Limitations on The Committee's Duties
In contributing to the Committee discharging its duties under this Mandate, each Member shall be obliged only to exercise the care, diligence and skill that a reasonably prudent person would exercise in comparable circumstances. Nothing in this Mandate is intended, or may be construed, to impose on any Member a standard of care or diligence that is in any way more onerous or extensive than the standard to which all Board members are subject. The essence of the Committee's duties is monitoring and reviewing to gain reasonable assurance (but not to ensure) that the Fundamental Activities are being conducted effectively, that the objectives of the Corporation's financial reporting are being met and to enable the Committee to report thereon to the Board.
II. AUDIT COMMITTEE MANDATE
This Mandate outlines how the Committee will satisfy the requirements set forth by the Board in its mandate.
1. Operating Principles
The Committee shall fulfill its responsibilities within the context of the following principles.
Committee Values
The Committee expects the management of the Corporation to operate in compliance with corporate policies; to comply with laws and regulations governing the Corporation; and to maintain strong financial reporting and control processes.
Communications
The Committee and its Members expect to have direct, open and frank communications throughout the year with management, other Committee Chairs, the external auditors, and other key Committee advisors or Company staff members as applicable.
Delegation
The Committee may delegate, from time to time, to any person or committee of persons any of the Committee's responsibilities that may be lawfully delegated.
Annual Audit Committee Plan
The Committee, in consultation with management and the external auditors, shall develop an annual Audit Committee plan responsive to the Committee's responsibilities as set out in this Mandate. In addition, the Committee, in consultation with management and the external auditors, shall develop and participate in a process for review of important financial topics that have the potential to impact the Corporation's financial disclosure.
The plan will be focused primarily on the annual and interim consolidated financial statements and MD&A of the Corporation; however, the Committee may at its sole discretion, or the discretion of the Board, review such other matters as may be necessary to satisfy the requirements of this Mandate.
Committee Expectations and Information Needs
The Committee shall communicate its expectations to management and the external auditors with respect to the nature, timing and extent of its information needs. The Committee expects that written materials will be received from management and the external auditors at a reasonable time in advance of meeting dates.
Access to Independent Advisors
To assist the Committee in discharging its responsibilities, the Committee may at its discretion, in addition to the external auditors, at the expense of the Corporation, retain one or more persons, firms or corporations having special expertise.
Reporting to the Board, Shareholders and Others
The Committee, through its Chair, shall report after each Committee meeting to the Board at the Board's next regular meeting. In addition, the Committee shall prepare a report to shareholders or others, concerning the Committee's activities in the discharge of its responsibilities, when and as required by applicable laws, rules, policies or regulations.
Evaluation
The Committee will conduct and present to the Board an annual evaluation of the performance of the Committee and the adequacy of this Mandate and recommend any proposed changes to the Board for approval.
Access to the Committee
Representatives of the Auditor and management of the Corporation shall have access to the Committee each in absence of the other.
The External Auditors
The Committee expects that, in discharging their responsibilities to the shareholders, the external auditors shall be accountable to the Board through the Committee. The external auditors shall report all material issues or potentially material issues, either specific to the Corporation or to the financial reporting environment in general, to the Committee.
No Alteration
No alteration to the roles and responsibilities of the Committee shall be effective without the approval of the Board.
2. Operating Procedures
Meetings
The Committee shall meet at least four times annually, or more frequently as circumstances dictate. Meetings shall be held at the call of the Chair, upon the request of two (2) Members or at the request of the external auditors.
Quorum
A quorum shall be a majority of the Members.
Notice of Meeting
Notice of the time and place of every meeting shall be given in writing by any means of transmitted or recorded communication, including email or other electronic means that produces a written copy, to each Member of the Committee at least 24 hours prior to the time fixed for such meeting; provided however, that a Member may in any manner waive a notice of the meeting. Attendance of a Member at a meeting constitutes waiver of notice of the meeting, except where a Member attends a meeting for the express purpose of objecting to the transaction of any business on the grounds that the meeting is not lawfully called.
Meeting Agenda
Committee meeting agendas shall be the responsibility of the Chair of the Committee in consultation with other Members, senior management and the external auditors.
Procedure, Records and Reporting
Subject to any statute or the articles and by-laws of the Corporation, the Committee shall fix its own procedures at meetings, keep records of its proceedings and report to the Board when the Committee may deem appropriate (but not later than the next regularly scheduled meeting of the Board).
In Camera Meetings
At the discretion of the Committee, the Members shall meet in private session with the external auditors and with management only.
Referral to the Board
Any matter the Committee does not unanimously approve will be referred to the Board for consideration.
Secretary
Unless the Committee otherwise specifies, the Corporate Secretary (or the Associate General Counsel or other person authorized by the Corporate Secretary and acceptable to the Chair of the Committee) of the Corporation shall act as Secretary of all meetings of the Committee.
Acting Chair
In the absence of the Chair of the Committee, the Members shall appoint an acting Chair.
Minutes
A copy of the minutes of each meeting of the Committee shall be provided to each Member and to each director of the Corporation in a timely fashion.
Attendance at Meetings
The Chief Executive Officer, the Chief Financial Officer, the Senior Vice President, Finance and Treasurer and the internal audit staff are expected to be available to attend the Committee's meetings or portions thereof, and the Chief Executive Officer is entitled to attend all meetings of the Committee.
The Committee may, by specific invitation, have other resource persons in attendance.
The Committee shall have the right to determine who shall, and who shall not, be present at any time during a meeting of the Committee.
Directors, who are not members of the Committee, may attend Committee meetings, on an ad hoc basis, upon prior consultation and approval by the Committee Chair or by a majority of the members of the Committee.
3. Specific Responsibilities and Duties
To fulfill its responsibilities and duties, the Committee shall:
Financial Information and Reporting
(a)Review, prior to public release, the Corporation's annual and quarterly consolidated financial statements with management and the external auditors to gain reasonable assurance that the statements are accurate within reasonable levels of materiality, complete, represent fairly the Corporation's financial position and performance and are in accordance with IFRS and report thereon to the Board before such consolidated financial statements are approved by the Board;
(b)Receive from the external auditors reports on their review of the annual and quarterly consolidated financial statements;
(c)Receive from management a copy of the representation letter provided to the external auditors and receive from management any additional representations required by the Committee;
(d)Review, prior to public release, all news releases issued by the Corporation with respect to the Corporation's annual and quarterly consolidated financial statements; and
(e)Review, prior to public release, prospectuses, material change disclosures of a financial nature, management discussion and analysis, AIF and similar disclosure documents to be issued by the Corporation.
Accounting Policies
(a)Review with management and the external auditors the appropriateness of the Corporation's accounting policies, disclosures, reserves, key estimates and judgments, including changes or variations thereto;
(b)Obtain reasonable assurance that the accounting policies, disclosures, reserves, key estimates and judgments are in compliance with IFRS from management and external auditors and report thereon to the Board;
(c)Review with management and the external auditors the degree of conservatism of the Corporation's underlying accounting policies, key estimates and judgments and reserves along with quality of financial reporting; and
(d)Participate, if requested, in the resolution of disagreements between management and the external auditors.
Risk and Uncertainty
(a)Acknowledging that it is the responsibility of the Board, in consultation with management, to identify the principal business risks facing the Corporation, determine the Corporation's tolerance for risk and approve risk management policies, the Committee shall focus on financial risk and gain reasonable assurance that financial risk is being effectively managed or controlled by:
(i)reviewing with management the Corporation's tolerance for financial risks;
(ii)reviewing with management its assessment of the significant financial risks facing the Corporation;
(iii)reviewing with management the Corporation's policies and any proposed changes thereto for managing those significant financial risks; and
(iv)reviewing with management its plans, processes and programs to manage and control such risks.
(b)Review with management its assessment of the cyber risks facing the Corporation and any related policies and any proposed changes thereto for managing cyber risk;
(c)Review, at least biennially, review the enterprise risk management policy, processes and framework and the assessment of enterprise risk management effectiveness by internal audit;
(d)Annually review the report prepared in accordance with the Fighting Against Force Labour and Child Labour in Supply Chains Act on the steps the Corporation has taken during its previous financial year to prevent and reduce the risk that forced labour or child labour is used at any step in the Corporation's supply chain and recommend to the Board that the report be approved by the Board in discharging its duty under the Act;
(e)Review policies and compliance therewith that require significant actual or potential liabilities, contingent or otherwise, to be reported to the Board in a timely fashion;
(f)Review foreign currency, interest rate and commodity price risk mitigation strategies, including the use of derivative financial instruments;
(g)Review the adequacy of insurance coverages maintained by the Corporation; and
(h)Review regularly with management, the external auditors and the Corporation's legal counsel, any legal claim or other contingency, including tax assessments, that could have a material effect upon the financial position or operating results of the Corporation and the manner in which these matters have been disclosed in the consolidated financial statements.
Financial Controls and Control Deviations
(a)Review the plans of the external auditors to gain reasonable assurance that the evaluation and testing of internal financial controls is comprehensive, coordinated and cost effective;
(b)Receive regular reports from management and the external auditors on all significant deviations from IFRS or other Company internal control processes or indications which may suggest fraud and the corrective activity undertaken in respect thereto; and
(c)Institute a procedure that will permit any employee, including management employees, to bring to the attention of the Board or the Committee concerns relating to financial controls and reporting which are material in scope and which cannot be addressed, in the employee's judgment, through existing reporting structures in the Corporation.
Compliance with Laws and Regulations
(a)Receive and review regular reports from management and others (e.g. external auditors) with respect to the Corporation's compliance with laws and regulations having a material impact on the consolidated financial statements including:
(i)tax and financial reporting laws and regulations;
(ii)legal withholding requirements; and
(iii)other laws and regulations which expose directors to liability; and
(b)Review the filing status of the Corporation's tax returns and those of its subsidiaries or related entities.
Relationship and External Auditors
(a)Be directly responsible, in the Committee's capacity as a committee of the Board and subject to the rights of shareholders and applicable law, for the appointment, compensation, retention and oversight of the work of the external auditors (including resolution of disagreements between management and the external auditors regarding financial reporting) for the purpose of preparing or issuing an audit report, or performing other audit, review or attest services for the Corporation. The external auditors shall report directly to the Committee;
(b)Recommend to the Board the nomination of the external auditors;
(c)Pre-approve and recommend to the Board the remuneration and the terms of engagement of the external auditors as set forth in the Engagement Letter. The Chair of the Committee hereby has the authority to pre-approve non-audit services which may be required from time to time;
(d)Review the performance of the external auditors annually or more frequently as required;
(e)Receive annually from the external auditors an acknowledgement in writing that the shareholders, as represented by the Board and the Committee, are their primary client;
(f)Receive a report annually from the external auditors with respect to their independence, such report to include a disclosure of all engagements (and fees related thereto) for non-audit services by the Corporation;
(g)Review with the external auditors the scope of the audit, the areas of special emphasis to be addressed in the audit, and the materiality levels which the external auditors propose to employ;
(h)Meet with the external auditors at least once a year in the absence of management to determine, inter alia, that no management restrictions have been placed on the scope and extent of the audit examinations by the external auditors or the reporting of their findings to the Committee;
(i)Establish effective communication processes with management and the Corporation's external auditors to assist the Committee to monitor objectively the quality and effectiveness of the relationship among the external auditors, management and the Committee; and
(j)Establish a reporting relationship between the external auditors and the Committee such that the external auditors can bring directly to the Committee matters that, in the judgment of the external auditors, merit the Committee's attention. In particular, the external auditors will advise the Committee of any disagreements between management and the external auditors regarding financial reporting and how such disagreements were resolved.
Relationship with Internal Auditor
(a)Review the internal audit staff functions, including:
(i)the purpose, authority and organizational reporting lines;
(ii)the annual audit plan, budget and staffing; and
(iii)the appointment and compensation of any person with the responsibility for the Internal Audit; and
(b)Review, with the Chief Financial Officer, controller or others, as appropriate, the Corporation's internal system of audit controls and the results of internal audits.
Other Responsibilities and Procedures
(a)After consultation with the Chief Financial Officer, the Senior Vice President Finance and Treasurer and the external auditors, gain reasonable assurance, at least annually, of the quality and sufficiency of the Corporation's accounting and financial personnel and other resources;
(b)Investigate any matters that, in the Committee's discretion, fall within the Committee's duties;
(c)Determine the appropriate funding for payment by the Corporation of: (i) of compensation to the external auditors for the purpose of preparing or issuing an audit report or performing other audit, review or attest services for the Corporation, (ii) of compensation to any advisors employed by the Committee, and (iii) of ordinary administrative expenses of the Committee that are necessary or appropriate in carrying out its duties; and
(d)Perform such other functions as may, from time to time, be assigned to the Committee by the Board.
III. HIRING GUIDELINES FOR INDEPENDENT AUDITOR EMPLOYEES
1. Guidelines
The Committee has adopted the following guidelines regarding the hiring of any partner, employee, reviewing tax professional or other person providing audit assurance to the external auditor of the Corporation on any aspect of its certification of the Corporation's consolidated financial statements:
(a)No senior member of the audit team that is auditing a business of the Corporation can be hired into that business or into a position to which that business reports for a period of two years after the audit; and
(b)No former partner or employee of the external auditor may be made an officer of the Corporation or any of its subsidiaries for two years following association with the external auditor:
(i)The Chief Executive Officer must approve all office hires from the external auditor; and
(ii)The Chief Financial Officer must report annually to the Committee on any hires within these guidelines during the preceding year.
2. Audit Partner Rotation
The Committee will ensure that the head audit partner assigned by the external auditor to the Corporation, as well as the audit partner charged with reviewing the audit of the Corporation, are changed at least every five years.
3. Process for Handling Complaints about Accounting Matters
The Committee will establish the following procedures for the receipt and treatment of any complaint received by the Corporation, including confidential, anonymous submissions by employees of the Corporation and by third parties, regarding accounting, internal accounting controls, auditing or other matters and create a summary of any significant investigations regarding such matters:
(a)The Corporation will publish on its website special mail and e-mail addresses and a toll-free telephone number for receiving complaints regarding accounting, internal accounting controls, auditing matters and other matters;
(b)Copies of all complaints will be sent to the Chair of the Committee and to the Chair of the Board and to the Chair of those other committees of the Board responsible for the oversight of the subject matter of the complaint;
(c)Copies of complaints relating to accounting, internal accounting controls and auditing matters received will be sent to the Members of the Committee;
(d)All complaints will be investigated by the Corporation's finance and legal departments in the normal manner, except as otherwise directed by the Committee. The Committee may request that outside advisors be retained to investigate any complaint; and
(e)The status of each complaint will be reported on a quarterly basis to the Committee and, if the Committee so directs, to the full Board.
APPENDIX B
RESERVES COMMITTEE MANDATE
CORPORATE POLICIES & PROCEDURES
PURPOSE
The Reserves Committee (the "Committee") is appointed by the Board of Directors of Crescent Point Energy Corp. (the "Board") to assist the Board in fulfilling its responsibility for the stewardship of Crescent Point Energy Corp. ("Crescent Point") and its subsidiaries or related entities (collectively referred to herein as the "Corporation"). The Committee's primary duties and responsibilities are to assume responsibility for assisting the Board in respect of the annual independent review of Crescent Point's petroleum and natural gas reserves and reporting to the Board in respect thereof, including assisting the Board in meeting its obligations under National Instrument 51-101 - Standards of Disclosure for Oil and Gas Activities, (as implemented by the Canadian Securities Administrators and as amended from time to time) ("NI 51-101").
RESERVES COMMITTEE RESPONSIBILITIES AND DUTIES
The overall duties and responsibilities of the Committee shall be as follows:
(a)in conjunction with the Corporation's senior engineering management, meet with the independent evaluating engineers being considered for appointment to review their qualifications and independence to ensure the independent evaluating engineers being considered for appointment are technically qualified and competent, are independent of management and to establish the terms of their engagement;
(b)after consultation with the Corporation's senior engineering management, recommend to the Board the appointment of the independent evaluating engineers to assist the Corporation in the annual review of its petroleum and natural gas reserves;
(c)in consultation with the Corporation's senior engineering management determine the scope of the annual review of the petroleum and natural gas reserves by the independent evaluating engineers, having regard to the regulatory reporting requirements applicable to the Corporation, including those set forth in NI 51-101;
(d)review, with reasonable frequency, the Corporation's procedures for providing petroleum and natural gas reserves information to the qualified independent evaluating engineers who report on reserves data for the purposes of NI 51 - 101, and the information used by the independent evaluating engineers to enable the independent evaluating engineers to provide a report that will meet regulatory reporting requirements;
(e)in consultation with the Corporation's senior engineering management and the independent evaluating engineers:
◦determine whether any restrictions affect the ability of the independent evaluating engineers to report on reserve data without reservations; and
◦review the reserves data and the report of the independent evaluating engineers.
(f)ensure the disclosure to the public on the Corporation's petroleum and natural gas reserves is in compliance with regulatory requirements and make appropriate changes, reports or recommendations to the Board with respect to the procedures for such disclosure;
(g)review any proposal to change the independent evaluating engineers and/or resolve any differences between the independent evaluating engineers and management;
(h)meet on an annual basis with the Corporation's senior engineering management and/or the independent evaluating engineers of the Corporation to review and consider the evaluation of the Corporation's petroleum and natural gas reserves;
(i)meet separately with the independent evaluating engineers and/or senior engineering management when the Committee deems it desirable and advise the Board on the results of such meeting;
(j)coordinate meetings with the Audit Committee of the Corporation, the Corporation's senior engineering management, independent evaluating engineers and auditors as required to address matters of mutual concern in respect of the Corporation's evaluation of petroleum and natural gas reserves;
(k)review at least biennially this Committee mandate and recommend any changes to the Board; and
(l)to maintain minutes of meetings and periodically report to the Board on significant results of the foregoing activities.
COMMITTEE MEMBERS' DUTIES IN ADDITION TO THOSE OF DIRECTOR
The duties and responsibilities of a member of the Committee are in addition to those duties set out for a member of the Board.
REPORTING
The Committee shall report to the Board. The Committee shall provide the Board with a summary of all meetings held at a regularly scheduled meeting of the Board held following any Committee meetings.
COMPOSITION
The Committee will be comprised of at least three members, as determined by the Board. The Committee members shall satisfy the independence and experience requirements of applicable securities laws, rules, or guidelines, any applicable stock exchange requirements or guidelines and any other applicable regulatory rules. In particular, a majority of the members of the Committee shall be free from any relationship which could reasonably be expected to materially interfere with the member's independent judgment. Determinations as to whether a particular director satisfies the requirements for membership on the Committee shall be made by the full Board and shall be reviewed at least bi-annually.
The Chair of the Board shall be an ex officio member of the Committee and shall be entitled to attend all meetings of the Committee.
Committee members will include only duly-elected directors. Members of the Committee shall be appointed from time to time by the Board. Each member shall serve until such member's successor is appointed, unless such member resigns or is removed by the Board or such member otherwise ceases to be a director of the Corporation. If a member of the Committee ceases to be independent for reasons outside that member's reasonable control, the member shall immediately notify the Chair of the Board as to this fact and shall resign such member's position on the Committee on the earliest of (i) the appointment of such member's successor; (ii) the next annual meeting of shareholders of the Corporation; and (iii) the date that is six months from the occurrence of the event which caused the member to not be independent. The Board shall fill any vacancy if the membership of the Committee is less than three directors.
CHAIR
The Board shall appoint the Chair of the Committee or, if it does not do so, the members of the Committee may elect a Chair by a vote of a majority of the full Committee membership. The Chair shall be an independent director. If the Chair of the Committee is not present at any meeting of the Committee, one of the other members of the Committee present at the meeting shall be chosen to preside by a majority of the members of the Committee present at such meeting.
SECRETARY
The Corporate Secretary of the Corporation, the Associate General Counsel or such other person as the Corporate Secretary of the Corporation shall designate from time to time, shall be the Secretary of the Committee and shall keep minutes of the meetings of the Committee.
OPERATION OF COMMITTEE MEETINGS
The Committee shall have access to such officers and employees of the Corporation and to such information respecting the Corporation, as it considers necessary or advisable in order to perform its duties and responsibilities. The Committee has the authority to engage independent counsel and other advisors as it determines necessary to carry out its duties and to set and pay the compensation for any such counsel and advisors, such engagement to be for the Corporation's sole account and expense.
Committee meetings may, by agreement of the Chair of the Committee, be held in person, by means of teleconference or by a combination of any of the foregoing.
Meetings of the Committee shall be conducted as follows:
(1)The Committee shall meet at least two times annually at such times and at such locations as the Chair of the Committee shall determine. Any two members of the Committee may also request a meeting of the Committee.
(2)The quorum for meetings shall be a majority of the members of the Committee, present in person or by telephone or by other telecommunication device that permits all persons participating in the meeting to hear each other.
(3)The Chair shall, in consultation with management, establish the agenda for the meetings and instruct management to ensure that properly prepared agenda materials are circulated to the Committee with sufficient time for study prior to the meeting.
(4)Every question at a Committee meeting shall be decided by a majority of the votes cast.
(5)The Chief Executive Officer is expected to be available to attend the Committee's meetings or portions thereof. The Committee may, by specific invitation, have other resource persons in attendance. The Committee shall have the right to determine who shall, and who shall not, be present at any time during a meeting of the Committee, provided that the Chief Executive Officer of the Corporation is entitled to attend all meetings of the Committee. Directors, who are not members of the Committee, may attend Committee meetings on an ad hoc basis upon prior consultation and approval by the Committee Chair or by a majority of the members of the Committee.
(6)The Committee may delegate from time to time to any person or committee of persons any of the Committee's responsibilities that lawfully may be delegated.
(7)Minutes of each Committee meeting should be succinct yet comprehensive in describing substantive issues discussed by the Committee. However, they should clearly identify those items of responsibilities scheduled by the Committee for the meeting that have been discharged by the Committee and those items of responsibilities that are outstanding. Minutes of the Committee meeting shall be sent firstly to the Chair and next to all Committee members.
NOTICE OF MEETING
Notice of the time and place of each meeting may be given in writing, by electronic means, or orally to each member of the Committee at least 24 hours prior to the time fixed for such meeting.
A member may in any manner waive notice of the meeting. Attendance of a member at a meeting shall constitute waiver of notice of the meeting except where a member attends a meeting for the express purpose of objecting to the transaction of any business on the grounds that the meeting was not lawfully called.
MISCELLANEOUS
The Committee, with unanimity, may engage outside resources if deemed advisable. Lack of unanimity requires that the matter be referred to the Nominating and Corporate Governance Committee.
Appendix C
FORM 51-101F2
REPORT ON RESERVES DATA BY INDEPENDENT QUALIFIED RESERVES
EVALUATOR OR AUDITOR
To the Board of Directors of Crescent Point Energy Corp. (the "Company"):
1. We have evaluated the Company's reserves data as at December 31, 2023. The reserves data are estimates of proved reserves and probable reserves and related future net revenue as at December 31, 2023, estimated using forecast prices and costs.
2. The reserves data are the responsibility of the Company's management. Our responsibility is to express an opinion on the reserves data based on our evaluation.
3. We carried out our evaluation in accordance with standards set out in the Canadian Oil and Gas Evaluation Handbook as amended from time to time (the "COGE Handbook") maintained by the Society of Petroleum Evaluation Engineers (Calgary Chapter).
4. Those standards require that we plan and perform an evaluation to obtain reasonable assurance as to whether the reserves data are free of material misstatement. An evaluation also includes assessing whether the reserves data are in accordance with principles and definitions presented in the COGE Handbook.
5. The following table shows the net present value of future net revenue (before deduction of income taxes) attributed to proved + probable reserves, estimated using forecast prices and costs and calculated using a discount rate of 10 percent, included in the reserves data of the Company evaluated for the year ended December 31, 2023, and identifies the respective portions thereof that we have evaluated and reported on to the Company's Board of Directors:
|
|
|
|
|
|
|
|
|
|
|
|
|
|
|
|
|
|
|
|
|
|
|
|
Net Present Value of Future Net Revenue $M
(before income taxes, 10% discount rate) |
| Independent Qualified Reserves Evaluator or Auditor |
Effective Date of Evaluation Report |
Location of Reserves |
Audited |
Evaluated |
Reviewed |
Total |
| McDaniel |
December 31, 2023 |
Canada |
— |
16,023,933.4 |
— |
16,023,933.4 |
| McDaniel |
December 31, 2023 |
United States |
— |
0 |
— |
0 |
|
|
Total |
— |
16,023,933.4 |
— |
16,023,933.4 |
6. In our opinion, the reserves data respectively evaluated by us have, in all material respects, been determined and are in accordance with the COGE Handbook, consistently applied. We express no opinion on the reserves data that we reviewed but did not audit or evaluate.
7. We have no responsibility to update our report referred to in paragraph 5 for events and circumstances occurring after the effective date of our report.
8. Because the reserves data are based on judgements regarding future events, actual results will vary and the variations may be material.
Executed as to our report referred to above:
McDaniel & Associates Consultants Ltd.
ORIGINALLY SIGNED BY
Michael J. Verney, P.Eng.
Executive Vice President
Calgary, Alberta, Canada
February 7, 2024
Appendix D
REPORT OF MANAGEMENT AND DIRECTORS ON RESERVES DATA AND OTHER INFORMATION
Management of Crescent Point Energy Corp. (the "Corporation") are responsible for the preparation and disclosure of information with respect to the Corporation's oil and gas activities in accordance with securities regulatory requirements. This information includes reserves data.
McDaniel & Associates Consultants Ltd., an independent qualified reserves evaluator, has evaluated the Corporation's reserves data. The reports of the independent qualified reserves evaluator will be filed with securities regulatory authorities concurrently with this report.
The Reserves Committee of the board of directors of the Corporation has:
(a) reviewed the Corporation's procedures for providing information to the independent qualified reserves evaluator;
(b) met with the independent qualified reserves evaluator to determine whether any restrictions affected the ability of the independent qualified reserves evaluators to report without reservation; and
(c) reviewed the reserves data with management and the independent qualified reserves evaluator.
The Reserves Committee of the board of directors has reviewed the Corporation's procedures for assembling and reporting other information associated with oil and gas activities and has reviewed that information with management. The board of directors has, on the recommendation of the Reserves Committee, approved:
(a) the content and filing with securities regulatory authorities of Form 51-101F1 containing the reserves data and other oil and gas information;
(b) the filing of Form 51-101F2 which is the report of the independent qualified reserves evaluators on the reserves data; and
(c) the content and filing of this report.
Because the reserves data are based on judgments regarding future events, actual results will vary and the variations may be material.
|
|
|
|
|
|
|
|
|
| "Craig Bryksa" |
|
"Ryan Gritzfeldt" |
CRAIG BRYKSA
President and Chief Executive Officer |
|
RYAN GRITZFELDT
Chief Operating Officer |
|
|
|
| "Francois Langlois" |
|
"Barbara Munroe" |
FRANCOIS LANGLOIS
Director |
|
BARBARA MUNROE
Chair of the Board |
February 28, 2024