Document
UNITED STATES
SECURITIES AND EXCHANGE COMMISSION
Washington, D.C. 20549
FORM 6-K
REPORT OF FOREIGN PRIVATE ISSUER
PURSUANT TO RULE 13a-16 OR 15d-16 UNDER
THE SECURITIES EXCHANGE ACT OF 1934
For the month of February 2024
Commission File Number: 001-38353
PagSeguro Digital Ltd.
(Name of Registrant)
Conyers Trust Company (Cayman) Limited,
Cricket Square, Hutchins Drive, P.O. Box 2681,
Grand Cayman, KY1-1111, Cayman Islands
(Address of Principal Executive Office)
Indicate by check mark whether the registrant files or will file annual reports under cover of Form 20-F or Form 40-F.
Form 20-F ☒ Form 40-F ☐
Indicate by check mark if the registrant is submitting the Form 6-K in paper as permitted by Regulation S-T Rule 101(b)(1):
Yes ☐ No ☒
Indicate by check mark if the registrant is submitting the Form 6-K in paper as permitted by Regulation S-T Rule 101(b)(7):
Yes ☐ No ☒
PAGS reports Fourth Quarter 2023 Results
Net Income (Non-GAAP) of R$ 520 million, +26.6% y/y
Net Income (GAAP) of R$ 488 million, +19.7% y/y
São Paulo, February 28, 2024 – PagSeguro Digital Ltd. (“PAGS,” “PagBank” or “we”) announced today its fourth quarter results for the period ended December 31, 2023. The consolidated financial statements are presented in Reais (R$) and prepared in accordance with International Financial Reporting Standards (“IFRS”) as issued by the International Accounting Standards Board (“IASB”).
4Q23 Highlights
|
|
|
|
|
|
|
|
|
|
|
|
|
|
|
|
|
|
|
|
|
|
|
|
|
|
|
|
|
|
|
|
|
|
Total Finance Volume (TFV) |
|
|
|
Total Payment Volume (TPV) |
|
|
|
Total Banking Volume (TBV) |
|
|
|
|
|
|
|
|
|
|
|
|
|
|
|
|
|
|
|
|
|
|
|
|
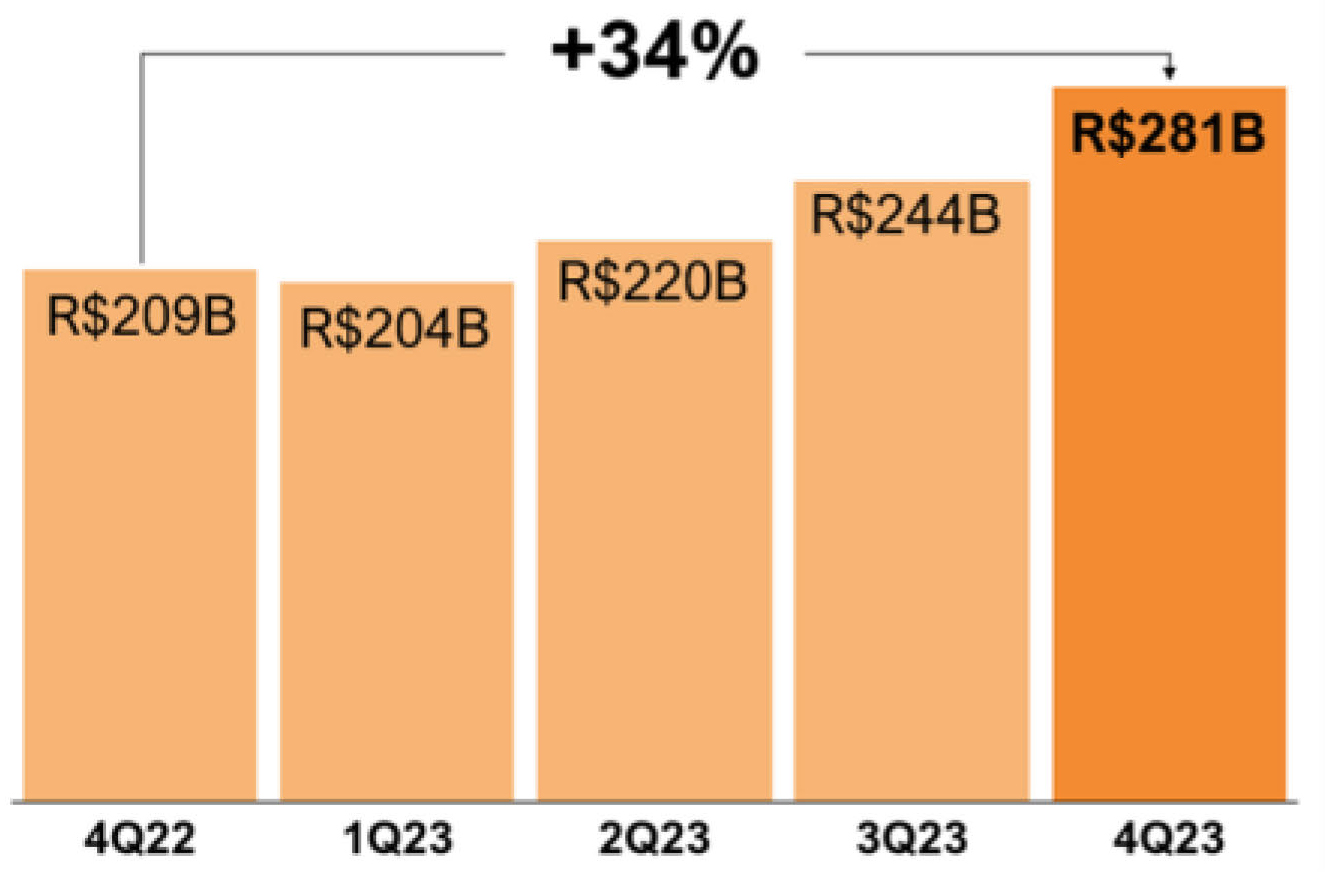
R$ 281 Billion |
|
|
|
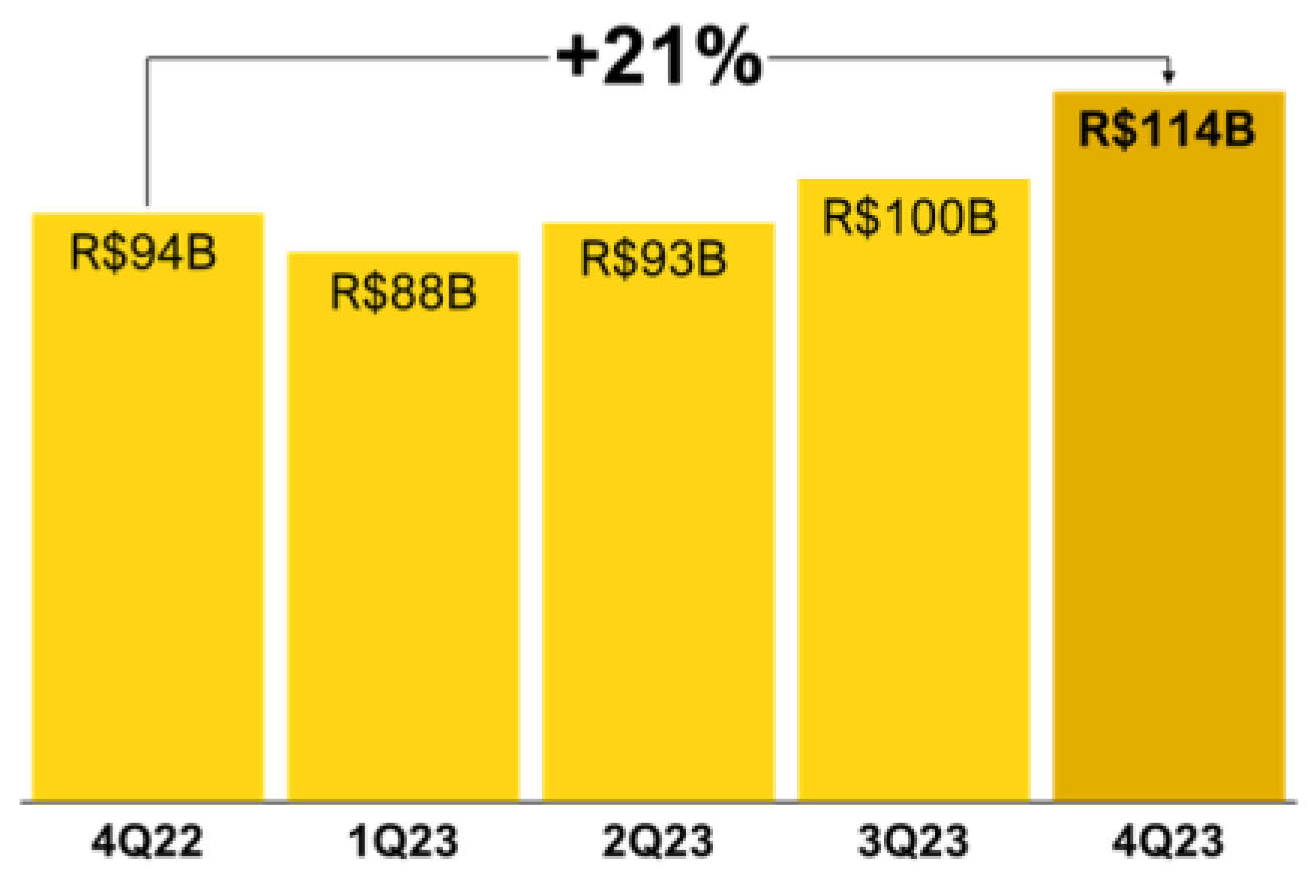
R$ 114 Billion |
|
|
|
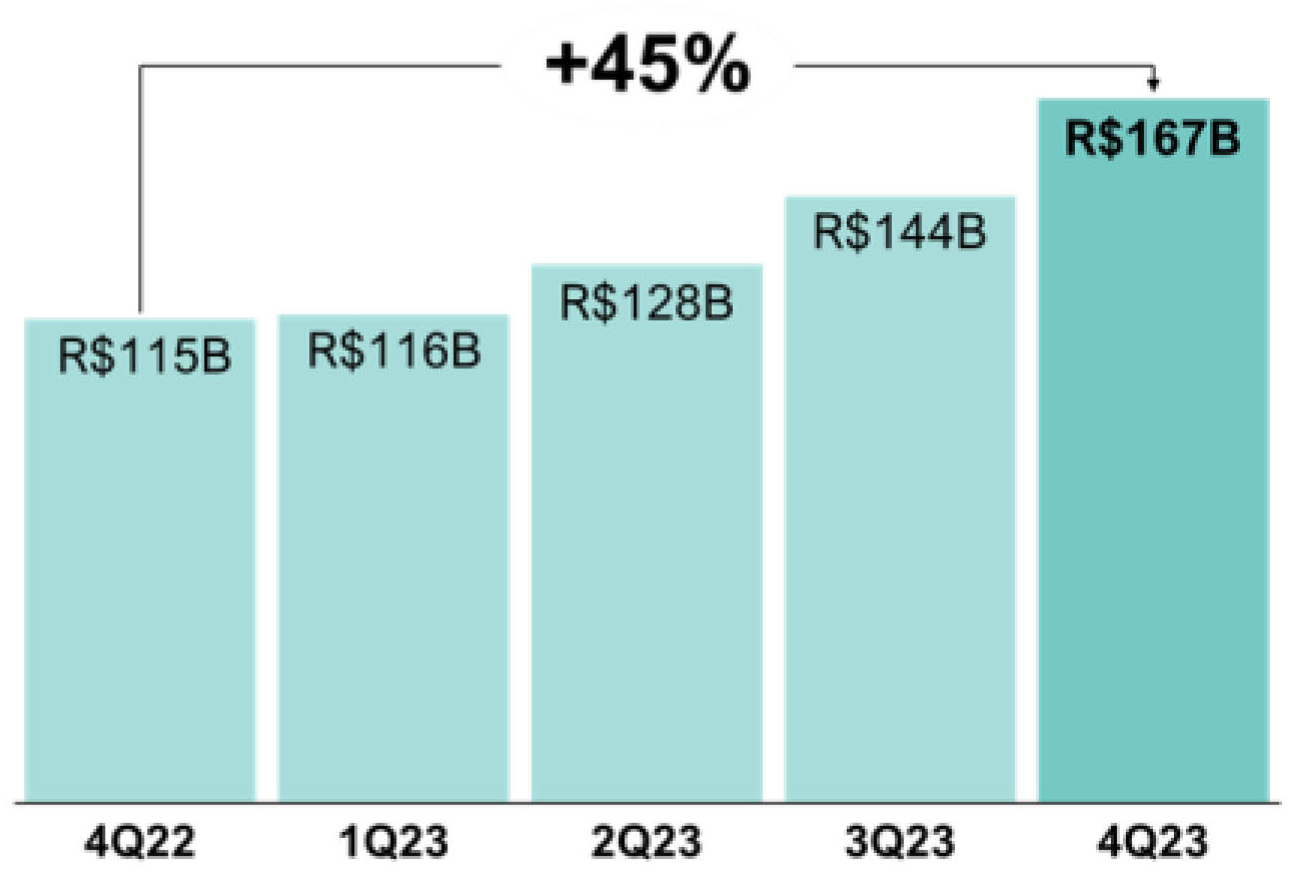
R$ 167 Billion |
|
|
|
|
|
|
|
|
|
|
|
|
|
|
|
|
|
|
|
|
|
|
|
|
|
|
|
|
|
|
|
|
|
|
|
|
|
|
|
|
|
|
|
|
|
|
|
|
|
|
|
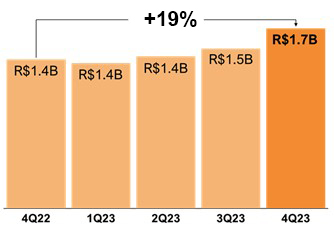
Gross Profit |
|
|
|
Payments | Gross Profit |
|
|
|
Financial Services | Gross Profit |
|
|
|
|
|
|
|
|
|
|
|
|
|
|
|
|
|
|
|
|
|
|
|
|
R$ 1.7 Billion |
|
|
|
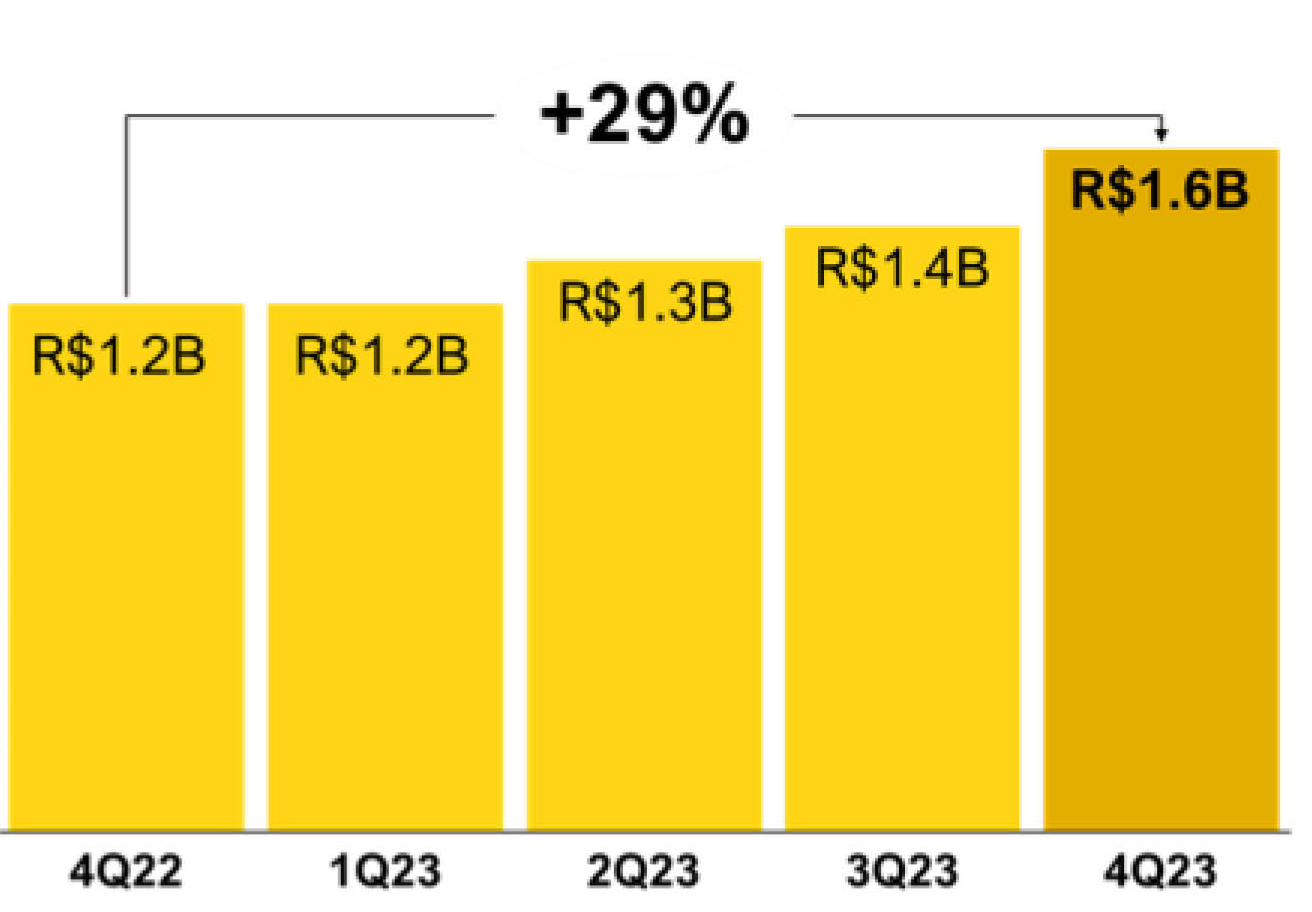
R$ 1.6 Billion |
|
|
|
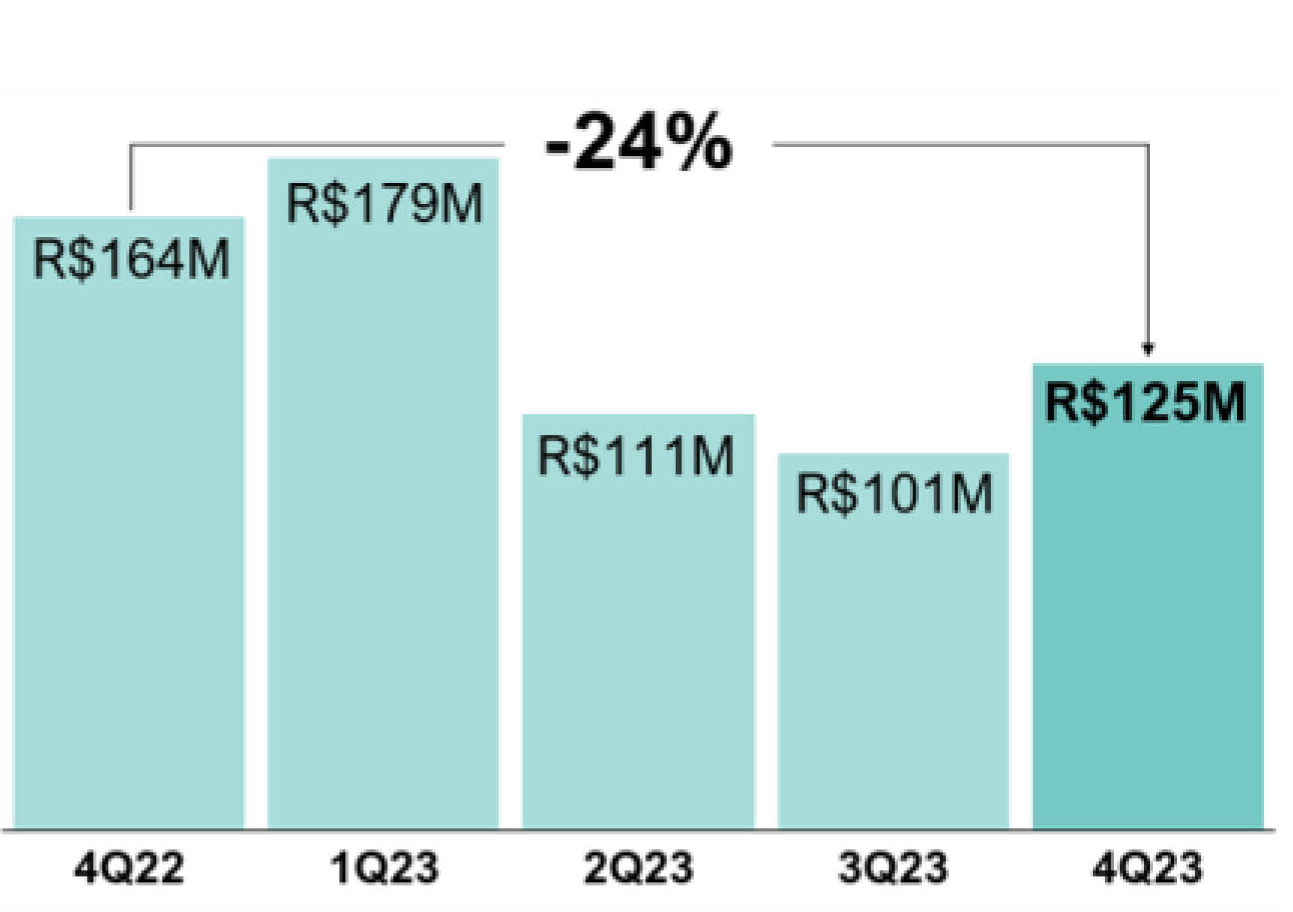
R$ 125 Million |
|
|
|
|
|
|
|
|
|
|
|
|
|
|
|
|
|
|
|
|
|
|
|
|
|
|
|
|
|
|
|
|
|
|
|
|
|
|
|
|
|
|
|
|
|
|
|
|
|
|
|
Net Income | Non-GAAP |
|
|
|
Payments | Adj. EBITDA |
|
|
|
Financial Services | Adj. EBITDA |
|
|
|
|
|
|
|
|
|
|
|
|
|
|
|
|
|
|
|
|
|
|
|
|
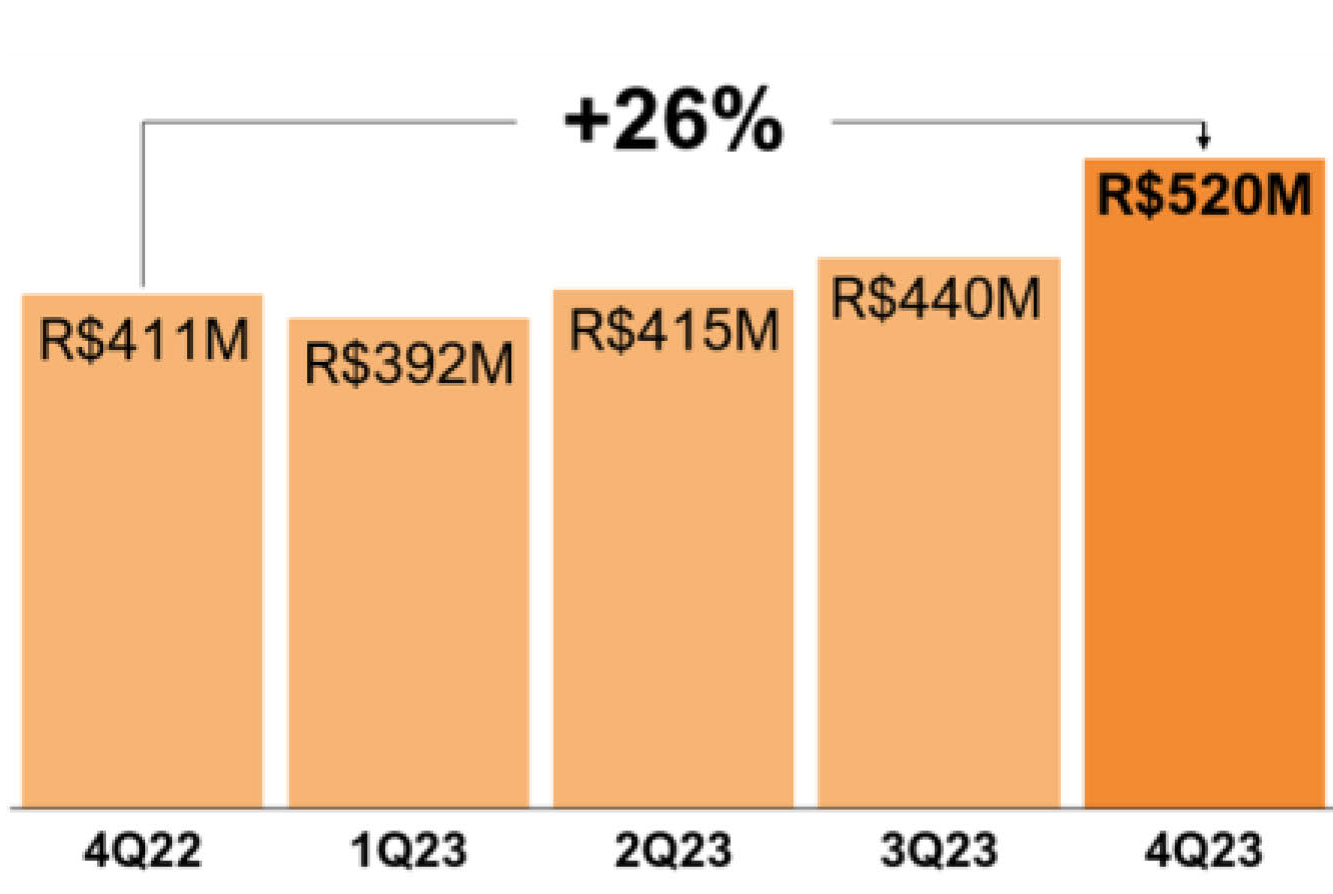
R$ 520 Million |
|
|
|
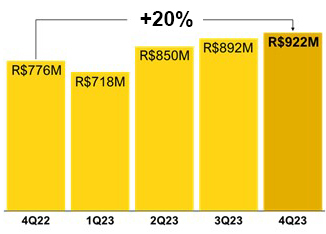
R$ 922 Million |
|
|
|
R$ 53 Million |
|
|
|
|
|
|
|
|
|
|
|
|
|
|
|
|
|
To our shareholders
As we post our results for the fourth quarter 2023, we are pleased to announce that 2023 was yet again an important chapter in advancing on our mission to make easier the financial lives of people and businesses in Brazil. In 2022, when my second letter was published here, I mentioned our historic milestone of surpassing R$ 1 trillion in financial transactions processed in 16 years of existence. In 2023, we processed almost R$ 1 trillion in financial transaction in one single year, revealing the strength of our products, the reliability of our IT infrastructure, and the compounding effect in our growth. Also, we were able to add more than 3 million new clients, surpassing 31 million PagBank clients by year-end, almost 15% of Brazilian population.
In Payments, our value proposition expanded beyond micro-merchants and the usage of POS devices. TPV grew +11% y/y in 2023, reaching R$ 394 billion, with the last quarter presenting stronger trends on TPV, growing +21% y/y in 4Q23, with a positive highlight of our performance in SMBs, which TPV grew +31% y/y in 4Q23. This was only possible due to our integrated strategy that combines financial services and payments in a unique way, instant settlement into PagBank account, the word-of-mouth effect, and the strengthening of our HUBs in different geographies in the country. Also, we concluded the integration of MOIP and revamped our cross-border payments unit under PagSeguro International brand, which has been contributing to the TPV growth in large accounts, with brick-and-mortar, online and omnichannel solutions. Our service levels have been consistently improving over the years, reflecting higher scores for our app and NPLs and stronger client engagement. Besides all the good news, micro-merchants, which are our natural call, grew +14% y/y in TPV in 4Q23, and now can count with tap on phone solution in their smartphones.
In banking, we delivered significant developments, such as the collection platform for merchants, which gathers cards payments, PIX and boletos in the same place, helping clients to manage their accounts receivables in the same interface. For SMBs, we launched settlement from different acquirers into PagBank account, approval profile, bank account for multiple users and payroll platform to manage salary transfers up to 2,000, everything fully embedded into our ecosystem, available through the app and through the internet banking interface. For consumers, we improved our investment platform, enhanced the credit card journey, and expanded the credit underwriting of payroll loans and FGTS advance. All these initiatives led to a Cash-in (PIX and wire transfers sent to PagBank account) of R$ 217 billion, which combined to TPV in merchant acquiring, led to the all-time high deposits level of R$ 27.6 billion, +33% y/y.
Consequently, Total Revenue got back to a health and positive level before our expectations, posting +10% y/y in the fourth quarter 2023, despite the holiday season which led to slightly lower take rates, wrapping up the year with almost R$ 16 billion. Our commitment to grow efficiently was supported by our funding strategy backed by deposits, our lower losses on the back of our successful initiatives to improve risk assessment and avoid chargebacks and credit losses, and a flattish OpEx, which led to higher margins quarter after quarter, leading net income (non-GAAP) to almost R$ 1.8 billion, being R$ 520 million only in the fourth quarter 2023, +27% y/y.
Our CapEx per Sales continued its downtrend in 2023, marking 12.5% vs. 30% in 2020, concluding an important milestone in our investment cycle, which should reach similar levels in comparison to the depreciation and amortization, unlocking additional operational leverage in our results and better cash earnings moving forward. Consequently, our net cash balance surpassed R$ 11 billion and our Cash + Financial Investments in our balance sheet grew +112% y/y, surpassing R$ 6 billion.
So, as we close the 2023 cycle, I am excited about 2024 and how our developments should continue to disrupt payments and financial services for every client in every region in Brazil. Our growth drivers for 2024 are crystal clear:
•Expanding payments penetration in all segments, combining acquiring and banking to reach the optimum balance between growth and profitability.
•Fostering growth in the domestic and cross-border online payments, to fully leverage our omnichannel platform capacity.
•Increasing the penetration of financial services in our 31 million clients (consumers + merchants) to diversify our revenues streams.
•Growing credit underwriting of secured products and our high yield savings accounts to stimulate the consumer segment expansion and diversification.
•Solidifying our fraud prevention and risk management capacities to reduce losses while providing seamless secure experiences to our customers.
Once again, we remain focused on pursuing technological disruptions, enhancing our financial ecosystem and portfolio of services and products, to make the financial lives of our clients easier and support the business success of our merchants.
Alexandre Magnani, Chief Executive Officer Selected Capsule of Income Statement Data1
|
|
|
|
|
|
|
|
|
|
|
|
|
|
|
|
|
|
|
|
|
|
|
|
|
|
|
| R$ Million |
4Q23 |
4Q22 |
Var. y/y |
3Q23 |
Var. q/q |
2023 |
2022 |
Var. y/y |
| Total Revenues and Income |
4,347 |
3,962 |
9.7% |
4,026 |
8.0% |
15,948 |
15,335 |
4.0% |
| (-) Other Financial Income |
(73) |
(43) |
68.8% |
(66) |
11.4% |
(268) |
(176) |
52.5% |
| (-) Transactions Costs |
(1,645) |
(1,478) |
11.3% |
(1,508) |
9.0% |
(5,956) |
(5,620) |
6.0% |
| Net Take Rate |
2,629 |
2,440 |
7.7% |
2,452 |
7.2% |
9,724 |
9,540 |
1.9% |
| (-) Financial Expenses |
(841) |
(855) |
-1.6% |
(820) |
2.6% |
(3,270) |
(3,152) |
3.7% |
| (-) Total Losses² |
(123) |
(192) |
-36.0% |
(165) |
-25.8% |
(536) |
(984) |
-45.6% |
| (+) FX Expenses |
9 |
15 |
-36.4% |
10 |
-5.1% |
45 |
49 |
-8.2% |
| Gross Profit |
1,675 |
1,409 |
18.9% |
1,477 |
13.4% |
5,964 |
5,453 |
9.4% |
| Payments |
1,550 |
1,245 |
24.5% |
1,376 |
12.6% |
5,449 |
5,058 |
7.7% |
| Financial Services |
125 |
164 |
-23.9% |
101 |
23.7% |
515 |
395 |
30.4% |
| (-) Operating Expenses |
(700) |
(621) |
12.7% |
(583) |
20.0% |
(2,459) |
(2,400) |
2.5% |
| Adj. EBITDA³ |
975 |
788 |
23.7% |
894 |
9.1% |
3,505 |
3,053 |
14.8% |
| Payments |
922 |
776 |
18.8% |
892 |
3.4% |
3,382 |
3,247 |
4.2% |
| Financial Services |
53 |
12 |
357.0% |
2 |
2333.8% |
123 |
(194) |
n.a. |
| (-) POS Write-off |
(57) |
(66) |
-13.4% |
(64) |
-10.9% |
(248) |
(200) |
23.8% |
| (-) D&A |
(349) |
(270) |
29.0% |
(329) |
6.0% |
(1,290) |
(1,080) |
19.4% |
| (+/-) Other Income (Expense), Net |
64 |
29 |
123.2% |
56 |
14.4% |
223 |
127 |
76.2% |
| EBT |
633 |
480 |
31.8% |
557 |
13.7% |
2,190 |
1,899 |
15.3% |
| (-) Income Tax and Social Contribution |
(112) |
(69) |
62.8% |
(117) |
-3.5% |
(422) |
(302) |
39.8% |
| Net Income | Non-GAAP |
520 |
411 |
26.6% |
440 |
18.2% |
1,768 |
1,597 |
10.7% |
| EPS | Non-GAAP4 |
R$ 1.63 |
R$ 1.25 |
30.6% |
1.36 |
20.0% |
R$ 5.46 |
R$ 4.85 |
12.5% |
| (-) Non-GAAP Effects |
(32) |
(4) |
787.1% |
(29) |
10.3% |
(114) |
(92) |
23.6% |
| Net Income | GAAP |
488 |
408 |
19.7% |
411 |
18.8% |
1,654 |
1,505 |
9.9% |
| EPS | GAAP4 |
R$ 1.53 |
R$ 1.24 |
23.5% |
R$ 1.27 |
20.6% |
R$ 5.10 |
R$ 4.57 |
11.7% |
| Cash Earnings | Adj. EBITDA (-) CapEx |
454 |
410 |
10.7% |
365 |
24.7% |
1,516 |
917 |
65.4% |
| Capital Expenditures (CapEx) |
521 |
378 |
37.8% |
529 |
-1.7% |
1,988 |
2,136 |
-6.9% |
1. This selected capsule income statement data is presented only to facilitate a general overview of highlights of our financial performance for the periods indicated for informational purposes. For our complete Income Statement information, see our consolidated financial statements prepared in accordance with IFRS as issued by the IASB, in our Form 6-K related to the Financial Statements, published on the date hereof;
2. Total Losses: Chargebacks and Expected Credit Losses;
3. Adj. EBITDA: EBITDA net of Financial Expenses;
4. Considering the Weighted Average Number of Diluted Common Shares:
4Q23: 319,083,950 shares
3Q23: 323,773,637 shares
4Q22: 327,110,295 shares
2023: 323,955,576 shares;
2022: 329,234,692 shares.
Key Performance Indicators
|
|
|
|
|
|
|
|
|
|
|
|
|
|
|
|
|
|
|
|
|
|
|
|
|
|
|
| KPIs |
4Q23 |
4Q22 |
Var. y/y |
3Q23 |
Var. q/q |
2023 |
2022 |
Var. y/y |
| ARPAC¹ |
|
|
|
|
|
|
|
|
| Payments |
R$ 2,191 |
R$ 1,893 |
15.7% |
R$ 2,080 |
5.3% |
R$ 2,275 |
R$ 1,991 |
14.3% |
| Financial Services |
R$ 66 |
R$ 95 |
-30.5% |
R$ 73 |
-10.2% |
R$ 66 |
R$ 95 |
-30.5% |
| Efficiency Ratio² |
15.6% |
16.7% |
(0.1) p.p. |
16.4% |
(0.0) p.p. |
15.9% |
19.3% |
(0.2) p.p. |
| Credit Portfolio | R$ Billion |
2.5 |
2.7 |
-7% |
2.5 |
-3% |
2.5 |
2.7 |
-7% |
| Total Deposits | R$ Billion |
27.6 |
20.7 |
33% |
21.6 |
28% |
27.6 |
20.7 |
33% |
1. ARPAC: Sum of LTM revenues / Average of active clients over the last 5 quarters;
2. Efficiency Ratio: Selling, Administrative and Other Expenses required for each amount of Total Revenue and Income generated.
Selected Capsule of Balance Sheet Data¹
|
|
|
|
|
|
|
|
|
|
|
|
|
|
|
|
|
|
|
|
|
|
|
|
|
|
|
| Balance Sheet | R$ Million |
|
|
|
4Q23 |
4Q22 |
Var. y/y |
3Q23 |
Var. q/q |
| Total Assets |
|
|
|
55,108 |
45,329 |
21.6% |
47,327 |
16.4% |
| Current Assets |
|
|
|
48,729 |
39,767 |
22.5% |
41,165 |
18.4% |
Cash and Financial Investments2 |
|
|
|
6,208 |
2,932 |
111.7% |
3,053 |
103.3% |
| Accounts Receivable |
|
|
|
41,757 |
36,249 |
15.2% |
37,521 |
11.3% |
Others3 |
|
|
|
764 |
586 |
30.4% |
591 |
29.4% |
| Non-current Assets |
|
|
|
6,379 |
5,562 |
14.7% |
6,162 |
3.5% |
| Accounts Receivable |
|
|
|
1,144 |
746 |
53.4% |
1,000 |
14.4% |
PP&E and Intangible Assets4 |
|
|
|
5,022 |
4,652 |
7.9% |
4,962 |
1.2% |
Others5 |
|
|
|
213 |
164 |
29.8% |
200 |
6.7% |
| Total Liabilities and Equity |
|
|
|
55,108 |
45,329 |
21.6% |
47,327 |
16.4% |
| Current Liabilities |
|
|
|
34,432 |
29,740 |
15.8% |
28,665 |
20.1% |
Accounts Payable6 |
|
|
|
9,966 |
9,321 |
6.9% |
9,052 |
10.1% |
| PagBank | Checking Accounts |
|
|
|
11,383 |
8,667 |
31.3% |
9,655 |
17.9% |
| PagBank | Savings Accounts and CDs |
|
|
|
11,365 |
10,101 |
12.5% |
8,577 |
32.5% |
| Borrowings |
|
|
|
189 |
0 |
n.a. |
193 |
-1.7% |
Others7 |
|
|
|
1,529 |
1,652 |
-7.4% |
1,189 |
28.6% |
| Non-current Liabilities |
|
|
|
7,435 |
3,747 |
98.4% |
5,793 |
28.3% |
Accounts Payable6 |
|
|
|
186 |
85 |
119.3% |
159 |
16.6% |
| PagBank | Savings Accounts and CDs |
|
|
|
4,823 |
1,895 |
154.6% |
3,337 |
44.5% |
Others8 |
|
|
|
2,427 |
1,767 |
37.3% |
2,297 |
5.6% |
| Equity |
|
|
|
13,241 |
11,842 |
11.8% |
12,868 |
2.9% |
| Retained Net Income |
|
|
|
7,891 |
6,237 |
26.5% |
7,403 |
6.6% |
| Capital |
|
|
|
5,350 |
5,605 |
-4.6% |
5,465 |
-2.1% |
Net Cash Balance9 |
|
|
|
11,155 |
9,836 |
13.4% |
10,573 |
5.5% |
1. This selected capsule balance sheet data is presented only to facilitate a general overview of the highlights of our financial performance for the periods indicated for informational purposes. For our complete Balance Sheet information, see our consolidated financial statements prepared in accordance with IFRS as issued by the IASB, in our Form 6-K related to the Financial Statements, published on the date hereof.
Balance Sheet Reconciliation:
2. Cash & Financial Investments: Cash and Cash Equivalents + Financial Investments;
3. Others: Inventories + Taxes Recoverable + Other Receivables + Receivables from Related Parties;
4. PP&E & Intangible Assets: Property and Equipment + Intangible Assets;
5. Others: Judicial Deposits + Prepaid Expenses + Deferred Income Tax and Social Contribution + Investments + Receivables from Related Parties;
6. Accounts Payable: Payables to third parties (including (i) transactions of sales and services to settle with merchants, net of PagSeguro’s revenue, (ii) the balance of client bank accounts that are invested by the client in Certificate of Deposits, and (iii) the balance of merchant payment accounts through which PagSeguro acquires treasury bonds to comply with certain requirements);
7. Others: Trade Payables + Payables to Related Parties + Derivative Financial Instruments + Salaries and Social Charges + Taxes and Contributions + Provision for Contingencies + Deferred Revenue + Other Liabilities;
8. Others: Deferred Income Tax and Social Contribution + Provision for Contingencies + Deferred Revenue + Other Liabilities;
9. Net Cash Balance: Cash and Cash Equivalents + Financial Investments + Current & Non-Current Account Receivables – Current & Non-Current Payables to Third Parties – Borrowings – Derivative Financial Investments – Current & Non-Current Deposits.
Capital Markets¹
|
|
|
|
|
|
|
|
|
|
|
|
|
|
|
|
|
|
|
|
|
|
|
|
|
|
|
| Capital Markets |
|
|
|
4Q23 |
4Q22 |
Var. y/y |
3Q23 |
Var. q/q |
| Market Cap |
|
|
|
|
|
|
|
|
| In BRL billion |
|
|
|
R$ |
19.40 |
|
R$ |
14.30 |
|
35.1 |
% |
R$ |
13.80 |
|
40.5 |
% |
| In USD billion |
|
|
|
$ |
4.00 |
|
$ |
2.70 |
|
45.6 |
% |
$ |
2.80 |
|
45.3 |
% |
| Stock Price |
|
|
|
|
|
|
|
|
| In BRL |
|
|
|
R$ |
60.37 |
|
R$ |
44.19 |
|
36.6 |
% |
R$ |
43.12 |
|
40.0 |
% |
| In USD |
|
|
|
$ |
12.47 |
|
$ |
8.47 |
|
47.2 |
% |
$ |
8.61 |
|
44.8 |
% |
| Book Value per Share |
|
|
|
|
|
|
|
|
| In BRL |
|
|
|
R$ |
41.28 |
|
R$ |
40.83 |
|
1.1 |
% |
R$ |
40.25 |
|
2.6 |
% |
| In USD |
|
|
|
$ |
8.53 |
|
$ |
7.83 |
|
9.0 |
% |
$ |
8.04 |
|
6.1 |
% |
1. As of December 31, 2023;
Brazilian Central Bank Currency Exchange Rate (PTAX) BRL/USD:
4Q23: R$ 4.8413
4Q22: R$ 5.2177
3Q23: R$ 5.0076
Operational Performance
Total Finance Volume
|
|
|
|
|
|
|
|
|
|
|
|
|
|
|
|
|
|
|
|
|
|
|
|
|
|
|
| R$ Million |
4Q23 |
4Q22 |
Var. y/y |
3Q23 |
Var. q/q |
2023 |
2022 |
Var. y/y |
| Total Finance Volume |
280,626 |
209,032 |
34.3% |
243,684 |
15.2% |
950,078 |
731,447 |
29.9% |
Total Payment Volume1 |
113,711 |
94,273 |
20.6% |
99,836 |
13.9% |
394,320 |
353,849 |
11.4% |
Total Banking Volume2 |
166,915 |
114,759 |
45.4% |
143,848 |
16.0% |
555,758 |
377,598 |
47.2% |
1. Total Payment Volume: includes debit cards, credit cards, prepaid cards, vouchers, boletos and PIX P2M (fee-based product);
2. Total Banking Volume: includes prepaid card top-ups, PagBank card issuing TPV (debit, credit, prepaid), mobile top-ups, wire transfers to third-parties, cash-in through boletos, bill payments, tax collections, P2P transactions, PIX P2P (no fee-based), credit underwriting, super app top-ups and GMV.
Total Finance Volume (TFV), formerly known as PAGS TPV, totaled R$ 280.6 billion, representing an increase of +34.3% vs. 4Q22 due to the growth in both Total Payment Volume and Total Banking Volume.
Total Payment Volume (TPV), formerly known as PagSeguro TPV, totaled R$ 113.7 billion, representing an increase of +20.6% vs. 4Q22 mainly due to the larger share of wallet driven by the cash conversion into electronic payments, maturation of the existing cohorts, and increasing productivity of our sales channels leading to a better performance in all merchants’ segments (micro-merchants, SMBs and large accounts).
Total Banking Volume (TBV), formerly known as PagBank TPV, totaled R$ 166.9 billion, representing an increase of +45.4% vs. 4Q22. This growth is mainly related to the increase in the engagement of our clients with our financial services, such as PIX, bill payments, mobile top-up, cards’ spending and credit underwriting.
PagBank Clients
|
|
|
|
|
|
|
|
|
|
|
|
|
|
|
|
|
|
|
|
|
|
|
|
|
|
|
| # Million |
|
|
|
4Q23 |
4Q22 |
Var. y/y |
3Q23 |
Var. q/q |
Total Clients1 |
|
|
|
31.1 |
27.7 |
12.2% |
30.2 |
3.0% |
Active Clients2 |
|
|
|
16.7 |
16.2 |
3.4% |
16.7 |
0.1% |
| Consumers |
|
|
|
10.7 |
9.7 |
9.6% |
10.6 |
0.7% |
| Merchants |
|
|
|
6.1 |
6.5 |
-5.9% |
6.1 |
-1.0% |
1. Total Clients: Number of bank accounts registered at Brazilian Central Bank;
2. Active Clients: Active merchants using one additional digital account feature/service beyond acquiring and consumers with a balance in their digital account on the last day of the month.
PagBank ended the quarter with 31.1 million clients, representing an increase of +12.2% vs. 4Q22, and Active Clients of 16.7 million, an increase of +3.4% vs. 4Q22. This increase is mainly related to higher penetration in the consumers segment which represents 64% of PagBank clients vs. 60% in 4Q22.
Active Merchants
|
|
|
|
|
|
|
|
|
|
|
|
|
|
|
|
|
|
|
|
|
|
|
|
|
|
|
| # Million |
4Q23 |
4Q22 |
Var. y/y |
3Q23 |
Var. q/q |
2023 |
2022 |
Var. y/y |
Active Merchants1 |
6.5 |
7.1 |
-7.6% |
6.7 |
-1.7% |
6.5 |
7.1 |
-7.6% |
Net Additions |
(0.1) |
(0.2) |
-51.7% |
(0.1) |
-2.0% |
(0.5) |
(0.6) |
-11.6% |
TPV per Merchant2 | R$ thousand |
17.2 |
13.1 |
31.6% |
14.9 |
23.7% |
57.9 |
50.0 |
15.9% |
1. Active Merchants: At least one transaction in the last twelve months;
2. TPV per Merchant: Amount of TPV divided by the average of active merchants during the period.
Active Merchants ended the quarter with 6.5 million, representing a decrease of -7.6% vs. 3Q23. Since early 2022, the company has been adopting a more selective go-to-market strategy focusing on clients with better unit economics, higher activation ratio, and higher engagement in financial services rather than just net adds. Additionally, we have been improving our onboarding and risk assessment procedures since early 2023 to reduce chargebacks and losses, which has been positively reflected in the evolution of our gross profit throughout 2023.
Credit Portfolio
|
|
|
|
|
|
|
|
|
|
|
|
|
|
|
|
|
|
|
|
|
|
|
|
|
|
|
| R$ Million |
|
|
|
4Q23 |
4Q22 |
Var. y/y |
3Q23 |
Var. q/q |
| Credit Portfolio |
|
|
|
2,529 |
2,721 |
-7.1% |
2,462 |
2.7% |
| Working Capital |
|
|
|
410 |
743 |
-44.9% |
471 |
-13.1% |
| Credit Card |
|
|
|
763 |
1,113 |
-31.4% |
816 |
-6.4% |
Payroll Loan + Others1 |
|
|
|
1,356 |
865 |
56.7% |
1,175 |
15.3% |
| Provision for Losses |
|
|
|
(585) |
(986) |
-40.6% |
(651) |
-10.0% |
| Working Capital |
|
|
|
(362) |
(522) |
-30.7% |
(387) |
-6.5% |
| Credit Card |
|
|
|
(185) |
(451) |
-58.9% |
(236) |
-21.5% |
Payroll Loan + Others1 |
|
|
|
(38) |
(12) |
208.5% |
(28) |
38.4% |
| Credit Portfolio, net |
|
|
|
1,943 |
1,735 |
12.0% |
1,811 |
7.3% |
1. Payroll Loan + Others: Refers to loan portfolios, including advance Brazil's Severance Indemnity Fund (FGTS) withdrawals and payroll loans to public sector employees and retirees.
|
|
|
|
|
|
|
|
|
|
|
|
|
|
|
|
|
|
|
|
|
|
|
|
|
|
|
| R$ Million |
|
|
|
4Q23 |
4Q22 |
Var. y/y |
3Q23 |
Var. q/q |
| Credit Portfolio |
|
|
|
2,529 |
2,721 |
-7.1% |
2,462 |
2.7% |
| Secured Products |
|
|
|
1,662 |
1,084 |
53.4% |
1,469 |
13.1% |
| % Credit Portfolio |
|
|
|
66% |
40% |
25.9 p.p. |
60% |
6.0 p.p. |
| Unsecured Products |
|
|
|
867 |
1,637 |
-47.0% |
993 |
-12.7% |
| % Credit Portfolio |
|
|
|
34% |
60% |
(25.9) p.p. |
40% |
(6.0) p.p. |
Credit Portfolio reached R$ 2.5 billion in 4Q23, representing a decrease of -7.1% vs. 4Q22, but an increase of +2.7% vs. 3Q23, mainly driven by our strategy to grow in secured products, which represented 66% of the portfolio, combined with the run-off of working capital loans and the write-offs of the working capital loans and payroll loans in 3Q23 and credit cards in 2Q23, according to the credit models update based on IFRS 9 and our tax planning.
Total Deposits
|
|
|
|
|
|
|
|
|
|
|
|
|
|
|
|
|
|
|
|
|
|
|
|
|
|
|
| R$ Million |
|
|
|
4Q23 |
4Q22 |
Var. y/y |
3Q23 |
Var. q/q |
| Total Deposits |
|
|
|
27,571 |
20,663 |
33.4% |
21,569 |
27.8% |
Average Percentage Yield (APY)1 |
|
|
|
94.4% |
96.4% |
(1.9) p.p. |
93.4% |
1.0 p.p. |
| Checking Accounts |
|
|
|
11,383 |
8,667 |
31.3% |
9,655 |
17.9% |
Average Percentage Yield (APY)1 |
|
|
|
72.0% |
69.0% |
3.0 p.p. |
72.0% |
0.0 p.p. |
| Merchant's Payment Accounts |
|
|
|
2,066 |
1,196 |
72.7% |
1,736 |
19.0% |
| High Yield Savings Accounts |
|
|
|
9,317 |
7,471 |
24.7% |
7,919 |
17.7% |
| Banking Issuances |
|
|
|
16,188 |
11,995 |
35.0% |
11,914 |
35.9% |
Average Percentage Yield (APY)1 |
|
|
|
110.2% |
116.1% |
(5.9) p.p. |
110.8% |
(0.6) p.p. |
| Certificate of Deposits |
|
|
|
13,062 |
9,806 |
33.2% |
9,583 |
36.3% |
| Interbank Deposits |
|
|
|
3,126 |
2,101 |
48.8% |
2,331 |
34.1% |
| Corporate Securities |
|
|
|
0 |
88 |
n.a. |
0 |
n.a. |
1. As % of CDI (Brazilian Interbank Rate).
Total Deposits reached R$ 27.6 billion, representing an increase of +33.4% vs. 4Q22. This increase was driven by the +31.3% y/y growth in Checking Accounts, reflecting the higher engagement of our clients with our products, and the seasonality of the holidays season. Banking issuances grew +35.0% vs. 4Q22, led by Certificate of Deposits issued to retail clients and institutional counterparties through our Treasury department during the period.
|
|
|
|
|
|
|
|
|
|
|
|
|
|
|
|
|
|
|
|
|
|
|
|
|
|
|
| Brazilian Interest Rates |
4Q23 |
4Q22 |
Var. y/y |
3Q23 |
Var. q/q |
2023 |
2022 |
Var. y/y |
| SELIC |
11.75% |
13.75% |
(2.0) p.p. |
12.75% |
(1.0) p.p. |
11.75% |
13.75% |
(2.0) p.p. |
| SELIC | Average |
12.33% |
13.75% |
(1.4) p.p. |
13.38% |
(1.0) p.p. |
13.31% |
12.55% |
(0.2) p.p. |
| CDI |
11.65% |
13.65% |
(2.0) p.p. |
12.65% |
(1.0) p.p. |
11.65% |
13.65% |
(2.0) p.p. |
| CDI | Average |
12.23% |
13.65% |
(1.4) p.p. |
13.28% |
(1.0) p.p. |
13.21% |
12.45% |
(0.2) p.p. |
Financial Performance
Total Revenue and Income
|
|
|
|
|
|
|
|
|
|
|
|
|
|
|
|
|
|
|
|
|
|
|
|
|
|
|
| Non-GAAP | R$ Million |
4Q23 |
4Q22 |
Var. y/y |
3Q23 |
Var. q/q |
2023 |
2022 |
Var. y/y |
Total Revenue and Income1 |
4,347 |
3,962 |
9.7% |
4,026 |
8.0% |
15,948 |
15,335 |
4.0% |
| Payments |
4,084 |
3,654 |
11.8% |
3,771 |
8.3% |
14,879 |
14,097 |
5.5% |
Financial Services2 |
253 |
362 |
-30.1% |
260 |
-2.8% |
1,087 |
1,414 |
-23.1% |
| Other Financial Income |
73 |
43 |
68.8% |
66 |
11.4% |
268 |
176 |
52.5% |
1. Including Other Financial Income;
2. Including Float, intercompany revenue from Payments’ business unit.
Total Revenue and Income reached R$ 4,347 million in 4Q23, representing an increase of +9.7% vs. 4Q22. The managerial breakdown of Payments, Financial Services and Other Financial Income differs from Total Revenue and Income amount due to the Float from Financial Services unit, which is an intercompany revenue from Merchant Acquiring funding, not accounted for Total Revenue and Income. Before 1Q23, Float from Checking Accounts Balance was partially booked in Payments. Going forward, 100% of Float will be fully booked in Financial Services, similar to other financial institutions. The main differences will be:
(i)Total Revenue and Income: The mismatch between Total Revenue and Income and the managerial Total Revenue and Income’s breakdown in Payments, Financial Services and Other Financial Income increase given the intercompany Float will no longer offset a portion of the Financial Expenses. In 4Q23, intercompany Float amounted to R$ 63 million vs. R$ 97 million in 4Q22 and R$ 71 million in 3Q23.
(ii)Payments: No change in revenue except for an increase in Financial Expenses, since the share of such expenses offset by the Float usually booked in Payments will no longer occur. Consequently, Gross Profit and Adj. EBITDA will decrease. In 4Q23, revenue from payments amounted to R$ 4,084 million, representing an increase of +11.8% y/y, mainly driven by TPV growth in all merchants’ segments.
(iii)Financial Services: An increase in Revenue since the Float will lead to a higher interest income. Consequently, Gross Profit and Adj. EBITDA will increase. In 4Q23, revenue from financial services amounted to R$ 253 million decreasing -30.1% y/y, mainly driven by the regulatory change that came into force on April 1, 2023, lowering the caps applicable to prepaid and debit cards, negatively impacting our revenue evolution.
For more details about Float accounting reconciliation between Financial Services and Payments, please refer to page 16.
|
|
|
|
|
|
|
|
|
|
|
|
|
|
|
|
|
|
|
|
|
|
|
|
|
|
|
| GAAP | R$ Million |
4Q23 |
4Q22 |
Var. y/y |
3Q23 |
Var. q/q |
2023 |
2022 |
Var. y/y |
| Total Revenue and Income |
4,347 |
3,962 |
9.7% |
4,026 |
8.0% |
15,948 |
15,335 |
4.0% |
| Transaction Activities and Other Services |
2,441 |
2,304 |
5.9% |
2,269 |
7.6% |
9,027 |
8,906 |
1.4% |
| Financial Income |
1,833 |
1,615 |
13.5% |
1,691 |
8.4% |
6,653 |
6,253 |
6.4% |
| Other Financial Income |
73 |
43 |
68.8% |
66 |
11.4% |
268 |
176 |
52.5% |
Total Revenue and Income performance is explained below:
(i)Transaction Activities and Other Services in 4Q23 amounted to R$ 2,441 million, representing an increase of +5.9% vs. 4Q22. This performance is mainly due to the TPV growth that was partially offset by the impact of the regulatory change on prepaid/debit cards that came into force on April 1, 2023, and the mix change in credit portfolio towards secured products with lower yields and longer duration in Financial Services.
(ii)Financial Income, which represents the discount fees we withhold from credit card transactions in installments for the early payment of Accounts Payable to Third Parties (merchants), reached R$ 1,833 million, representing an increase of +13.5% vs R$ 1,615 million in 4Q22, mainly due to the TPV growth.
(iii)Other Financial Income reached R$ 73 million in 4Q23, an increase of +68.8% vs. 4Q22, mainly due to the increase in interest accrued on a higher position of Cash & Financial Investments, which was +112%, or R$ 3,275 million, higher than 4Q22.
Total Costs and Expenses explained by function
|
|
|
|
|
|
|
|
|
|
|
|
|
|
|
|
|
|
|
|
|
|
|
|
|
|
|
| Non-GAAP | R$ Million |
4Q23 |
4Q22 |
Var. y/y |
3Q23 |
Var. q/q |
2023 |
2022 |
Var. y/y |
| Total Costs and Expenses |
(3,714) |
(3,482) |
6.7% |
(3,469) |
7.0% |
(13,758) |
(13,435) |
2.4% |
| Cost of Sales and Services |
(2,240) |
(1,974) |
13.5% |
(2,028) |
10.5% |
(8,115) |
(7,518) |
7.9% |
| Selling Expenses |
(411) |
(435) |
-5.7% |
(377) |
9.0% |
(1,423) |
(1,946) |
-26.8% |
| Administrative Expenses |
(107) |
(115) |
-6.5% |
(166) |
-35.1% |
(580) |
(544) |
6.6% |
| Financial Expenses |
(841) |
(855) |
-1.6% |
(820) |
2.6% |
(3,270) |
(3,152) |
3.7% |
| Other Expenses, Net |
(114) |
(103) |
10.9% |
(79) |
44.5% |
(369) |
(276) |
34.0% |
|
|
|
|
|
|
|
|
|
|
|
|
|
|
|
|
|
|
|
|
|
|
|
|
|
|
|
| GAAP | R$ Million |
4Q23 |
4Q22 |
Var. y/y |
3Q23 |
Var. q/q |
2023 |
2022 |
Var. y/y |
| Total Costs and Expenses |
(3,763) |
(3,487) |
7.9% |
(3,514) |
7.1% |
(13,931) |
(13,576) |
2.6% |
| Cost of Sales and Services |
(2,244) |
(1,969) |
14.0% |
(2,033) |
10.4% |
(8,133) |
(7,471) |
8.9% |
| Selling Expenses |
(412) |
(435) |
-5.3% |
(378) |
9.0% |
(1,430) |
(1,946) |
-26.5% |
| Administrative Expenses |
(152) |
(114) |
32.9% |
(206) |
-26.5% |
(733) |
(669) |
9.6% |
| Financial Expenses |
(841) |
(855) |
-1.6% |
(820) |
2.6% |
(3,270) |
(3,152) |
3.7% |
| Other Expenses, Net |
(114) |
(114) |
0.2% |
(76) |
49.6% |
(367) |
(338) |
8.4% |
Total Costs and Expenses, on a non-GAAP basis, amounted to R$ 3,714 million in the 4Q23, representing an increase of +6.7% from R$ 3,482 million in the 4Q22, mainly related to:
Cost of Sales and Services reached R$ 2,240 million in the 4Q23, representing an increase of +13.5% year-over-year, mainly due to the TPV growth, leading to higher interchange and card scheme fees. We also observed a higher POS depreciation and amortization of intangible assets due to past capital expenditures that were deployed to support our growth.
When excluding non-GAAP figures related to LTIP (long-term incentive plan), Cost of Sales and Services, on a GAAP basis, reached R$ 2,244 million, representing an increase of +14.0%, from R$ 1,969 million reported in 4Q22.
Selling Expenses totaled R$ 411 million, representing a decrease of -5.7% from R$ 435 million reported in the same period of 2022, mainly driven by lower losses (chargebacks and provisions for credit losses).
When excluding non-GAAP figures related to LTIP (long-term incentive plan), Selling Expenses reached R$ 412 million, representing a decrease of -5.3%, from R$ 435 million reported in 4Q22.
Administrative Expenses reached R$ 107 million, representing a decrease of -6.5% from R$ 115 million presented in 4Q22, mainly due to seasonal efficiencies captured in the quarter.
When excluding non-GAAP figures related to LTIP Costs and M&A, Administrative Expenses reached R$ 152 million, representing an increase of +32.9%, from R$ 114 million reported in 4Q22, mainly due to a reversal of R$ 42 million, related to lower share-based compensation in 4Q22.
Financial Expenses totaled R$ 841 million in 4Q23, representing a decrease of -1.6% vs. 4Q22, mainly due to a lower average cost of funding led by deposits growth, which posted a strong figure quarter-over-quarter, increasing its relevance in our funding strategy, and lower expenses related to the Brazilian Basic Interest Rate (SELIC) decrease, partially offset by TPV growth in the period.
Other Expenses, net reached R$ 114 million in 4Q23, representing an increase of +10.9% from expenses of R$ 103 million reported in 4Q22. When excluding non-GAAP figures, Other Expenses remained stable as compared to the prior corresponding period, mainly as a result of R$ 11 million of software impairment from acquired companies registered in the 4Q22.
On a GAAP basis, including LTIP, M&A and Other Expenses of R$ 49 million, Total Costs and Expenses amounted to R$ 3,763 million, representing an increase of +7.9% in comparison to the amount of R$ 3,714 million presented in 4Q22.
Total Costs and Expenses explained by nature
Transaction Costs
|
|
|
|
|
|
|
|
|
|
|
|
|
|
|
|
|
|
|
|
|
|
|
|
|
|
|
| Non-GAAP | R$ Million |
4Q23 |
4Q22 |
Var. y/y |
3Q23 |
Var. q/q |
2023 |
2022 |
Var. y/y |
| Transactions Costs |
(1,645) |
(1,478) |
11.3% |
(1,508) |
9.0% |
(5,956) |
(5,620) |
6.0% |
| % Total Revenue and Income |
37.8% |
37.3% |
0.5 p.p. |
37.5% |
0.4 p.p. |
37.3% |
36.6% |
1.2 p.p. |
| Interchange and Card Scheme Fee |
(1,629) |
(1,413) |
15.4% |
(1,450) |
12.4% |
(5,775) |
(5,388) |
7.2% |
| Others |
(15) |
(66) |
-76.9% |
(58) |
-74.0% |
(181) |
(232) |
-21.8% |
|
|
|
|
|
|
|
|
|
|
|
|
|
|
|
|
|
|
|
|
|
|
|
|
|
|
|
| GAAP | R$ Million |
4Q23 |
4Q22 |
Var. y/y |
3Q23 |
Var. q/q |
2023 |
2022 |
Var. y/y |
| Transactions Costs |
(1,645) |
(1,478) |
11.3% |
(1,508) |
9.0% |
(5,956) |
(5,567) |
7.0% |
| % Total Revenue and Income |
37.8% |
37.3% |
0.5 p.p. |
37.5% |
0.4 p.p. |
37.3% |
36.3% |
1.5 p.p. |
| Interchange and Card Scheme Fee |
(1,629) |
(1,413) |
15.4% |
(1,450) |
12.4% |
(5,775) |
(5,388) |
7.2% |
| Others |
(15) |
(66) |
-76.9% |
(58) |
-74.0% |
(181) |
(180) |
1.1% |
Transaction Costs, on a GAAP and a non-GAAP basis, totaled R$ 1,645 million, representing an increase of +11.3% from R$ 1,478 million in 4Q22. As a percentage of the Total Revenue and Income, Transaction Costs increased to 37.8% in 4Q23 vs. 37.3% in 4Q22, mainly driven by:
Interchange and Card Scheme Fees totaled R$ 1,629 million in 4Q23, representing an increase of +15.4% y/y, mainly driven by TPV growth partially offset by the impact of the regulatory changes on prepaid/debit cards that came into force on April 1, 2023; and
Other Costs decreased by -76.9% vs. 4Q22 to R$ 15 million, mainly due to efficiencies captured, mainly in logistics.
Net Take Rate
|
|
|
|
|
|
|
|
|
|
|
|
|
|
|
|
|
|
|
|
|
|
|
|
|
|
|
| GAAP | R$ Million |
4Q23 |
4Q22 |
Var. y/y |
3Q23 |
Var. q/q |
2023 |
2022 |
Var. y/y |
| Total Payment Volume |
113,711 |
94,273 |
20.6% |
99,836 |
13.9% |
394,320 |
353,849 |
11.4% |
| Gross Take Rate |
4,274 |
3,919 |
9.1% |
3,961 |
7.9% |
15,680 |
15,159 |
3.4% |
| % Total Payment Volume |
3.76% |
4.16% |
(0.40) p.p. |
3.97% |
(0.21) p.p. |
3.98% |
4.28% |
(0.53) p.p. |
| Transaction Activities and Other Services |
2,441 |
2,304 |
5.9% |
2,269 |
7.6% |
9,027 |
8,906 |
1.4% |
| Financial Income |
1,833 |
1,615 |
13.5% |
1,691 |
8.4% |
6,653 |
6,253 |
6.4% |
| Net Take Rate |
2,629 |
2,440 |
7.7% |
2,452 |
7.2% |
9,724 |
9,592 |
1.4% |
| % Total Payment Volume |
2.31% |
2.59% |
(0.28) p.p. |
2.46% |
(0.14) p.p. |
2.47% |
2.71% |
(0.40) p.p. |
| Transactions Costs |
(1,645) |
(1,478) |
11.3% |
(1,508) |
9.0% |
(5,956) |
(5,567) |
7.0% |
Net Take Rate totaled R$ 2,629 million in 4Q23, representing an increase of +7.7% vs. 4Q22, mainly due to TPV growth during the quarter, partially offset by the seasonality driving larger shares of debit cards and a change in the merchants’ mix with a larger presence of SMBs and Large Accounts.
Financial Expenses
|
|
|
|
|
|
|
|
|
|
|
|
|
|
|
|
|
|
|
|
|
|
|
|
|
|
|
| GAAP | R$ Million |
4Q23 |
4Q22 |
Var. y/y |
3Q23 |
Var. q/q |
2023 |
2022 |
Var. y/y |
| Financial Expenses |
(841) |
(855) |
-1.6% |
(820) |
2.6% |
(3,269) |
(3,152) |
3.7% |
| % Total Revenue and Income |
19.3% |
21.6% |
(2.2) p.p. |
20.4% |
(1.0) p.p. |
20.5% |
20.6% |
(0.1) p.p. |
| Securitization of Receivables |
(246) |
(216) |
13.9% |
(249) |
-1.1% |
(954) |
(1,233) |
-22.7% |
| Accrued Interest on Deposits and Others |
(595) |
(639) |
-6.8% |
(571) |
4.2% |
(2,316) |
(1,919) |
20.7% |
Financial Expenses totaled R$ 841 million in 4Q23, representing a decrease of -1.6% vs. 4Q22. As a percentage of Total Revenue and Income, Financial Expenses decreased to 19.3% in 4Q23 vs. 21.6% in 4Q22, mainly due to:
(i)Lower average cost of funding led by the growth in deposits, increasing its relevance in our funding strategy; and
(ii)Lower expenses related to the Brazilian Basic Interest Rate (SELIC) decrease.
Total Losses
|
|
|
|
|
|
|
|
|
|
|
|
|
|
|
|
|
|
|
|
|
|
|
|
|
|
|
| GAAP | R$ Million |
4Q23 |
4Q22 |
Var. y/y |
3Q23 |
Var. q/q |
2023 |
2022 |
Var. y/y |
| Total Losses¹ |
(123) |
(192) |
-36.0% |
(165) |
-25.8% |
(536) |
(984) |
-45.6% |
| % Total Revenue and Income |
2.8% |
4.8% |
(2.0) p.p. |
4.1% |
(1.3) p.p. |
3.4% |
6.4% |
(3.1) p.p. |
| Chargebacks |
(94) |
(107) |
-12.7% |
(131) |
-28.6% |
(427) |
(431) |
-1.0% |
| Expected Credit Losses (ECL) |
(29) |
(84) |
-65.8% |
(34) |
-15.3% |
(109) |
(554) |
-80.3% |
1. Review of accounting allocations that resulted in a negligible change between the chargeback and ECL lines in 3Q23 amounting R$ 5 million.
Total Losses reached R$ 123 million in 4Q23, representing a decrease of -36.0% vs. 4Q22. As a percentage of Total Revenues and Income, Total Losses decreased to 2.8% in 4Q23 vs. 4.8% in 4Q22. This decrease was mainly driven by the improved asset quality of our credit portfolio with increased exposure to secured products with low risk, demanding lower expected credit losses provisions. In addition, we also had lower chargebacks as a result of improvements in risk assessments.
Gross Profit
|
|
|
|
|
|
|
|
|
|
|
|
|
|
|
|
|
|
|
|
|
|
|
|
|
|
|
| Non-GAAP | R$ Million |
4Q23 |
4Q22 |
Var. y/y |
3Q23 |
Var. q/q |
2023 |
2022 |
Var. y/y |
| Gross Profit |
1,675 |
1,409 |
18.9% |
1,477 |
13.4% |
5,964 |
5,453 |
9.4% |
| % Total Revenue and Income |
38.5% |
35.6% |
3.0 p.p. |
36.7% |
1.8 p.p. |
37.4% |
35.6% |
1.8 p.p. |
| Payments |
1,550 |
1,245 |
24.5% |
1,376 |
12.6% |
5,449 |
5,058 |
7.7% |
| Financial Services |
125 |
164 |
-23.9% |
101 |
23.7% |
515 |
395 |
30.4% |
Gross Profit totaled R$ 1,675 million in 4Q23, representing an increase of +18.9% vs. 4Q22. This increase is mainly related to the increase in volumes, as showed, together with lower financial expenses and lower losses.
Operating Expenses
|
|
|
|
|
|
|
|
|
|
|
|
|
|
|
|
|
|
|
|
|
|
|
|
|
|
|
| Non-GAAP | R$ Million |
4Q23 |
4Q22 |
Var. y/y |
3Q23 |
Var. q/q |
2023 |
2022 |
Var. y/y |
| Operating Expenses |
(700) |
(621) |
12.7% |
(583) |
20.0% |
(2,459) |
(2,400) |
2.5% |
| % Total Revenue and Income |
16.1% |
15.7% |
0.4 p.p. |
14.5% |
1.6 p.p. |
15.4% |
15.6% |
(0.2) p.p. |
| Personnel Expenses |
(269) |
(249) |
7.7% |
(245) |
9.8% |
(1,012) |
(953) |
0.1 |
| Marketing and Advertising |
(194) |
(178) |
8.9% |
(140) |
38.5% |
(581) |
(718) |
-19.1% |
| Other Expenses (Income), Net |
(238) |
(194) |
22.6% |
(199) |
19.7% |
(866) |
(729) |
18.9% |
|
|
|
|
|
|
|
|
|
|
|
|
|
|
|
|
|
|
|
|
|
|
|
|
|
|
|
| GAAP | R$ Million |
4Q23 |
4Q22 |
Var. y/y |
3Q23 |
Var. q/q |
2023 |
2022 |
Var. y/y |
| Operating Expenses |
(732) |
(590) |
23.9% |
(610) |
19.9% |
(2,566) |
(2,542) |
1.0% |
| % Total Revenue and Income |
16.8% |
14.9% |
1.9 p.p. |
15.2% |
1.7 p.p. |
16.1% |
16.6% |
(0.5) p.p. |
| Personnel Expenses |
(300) |
(208) |
44.6% |
(274) |
9.4% |
(1,122) |
(1,033) |
0.1 |
| Marketing and Advertising |
(194) |
(178) |
8.9% |
(140) |
38.5% |
(581) |
(718) |
-19.1% |
| Other Expenses (Income), Net |
(238) |
(205) |
16.1% |
(196) |
21.2% |
(864) |
(792) |
9.1% |
Operating Expenses, on a Non-GAAP basis, which include Personnel Expenses, Marketing and Advertising and Other Expenses, totaled R$ 700 million, representing an increase +12.7% from R$ 621 million in 4Q22. As a percentage of Total Revenue and Income, Non-GAAP Operating Expenses represented 16.1% vs. 15.7% in 4Q22. These trends are mainly due to the following:
Personnel Expenses reached R$ 269 million, representing an increase of +7.7% vs. 4Q22, driven by the impact of our collective bargaining agreement and the increase in our salesforce during the period. When including non-GAAP Expenses of R$ 31 million, Personnel Expenses, on a GAAP basis, totaled R$ 300 million, representing an increase of +44.6% vs. 4Q22 due to the lower relevance of the long-term incentive plan given the current shares price level.
Marketing and Advertising totaled R$ 194 million in 4Q23, representing an increase of +8.9% vs. 4Q22, led by the strengthening of our marketing initiatives in the period, focusing on attracting new clients with better unit economics; and
Other Expenses reached R$ 238 million in 4Q23, representing an increase of +22.6% from R$ 194 million reported in 4Q22, mainly driven by software licenses and consulting services. For more information, refer to note 24 on our Form 6-K containing our 4Q23 Financial Statements furnished on the date hereof.
Operating Expenses, on a GAAP basis, totaled R$ 732 million, representing an increase of +23.9% from R$ 590 million in 4Q22. As a percentage of Total Revenue and Income, Operating Expenses represented 16.8% vs. 14.9% in 4Q22.
Adj. EBITDA, Capital Expenditures and Cash Earnings
|
|
|
|
|
|
|
|
|
|
|
|
|
|
|
|
|
|
|
|
|
|
|
|
|
|
|
| Non-GAAP | R$ Million |
4Q23 |
4Q22 |
Var. y/y |
3Q23 |
Var. q/q |
2023 |
2022 |
Var. y/y |
| Adj. EBITDA¹ |
975 |
788 |
23.7% |
894 |
9.1% |
3,505 |
3,053 |
14.8% |
| % Total Revenue and Income |
22.4% |
19.9% |
2.5 p.p. |
22.2% |
0.2 p.p. |
22.0% |
19.9% |
2.1 p.p. |
| Payments |
922 |
776 |
18.8% |
892 |
3.4% |
3,382 |
3,247 |
4.2% |
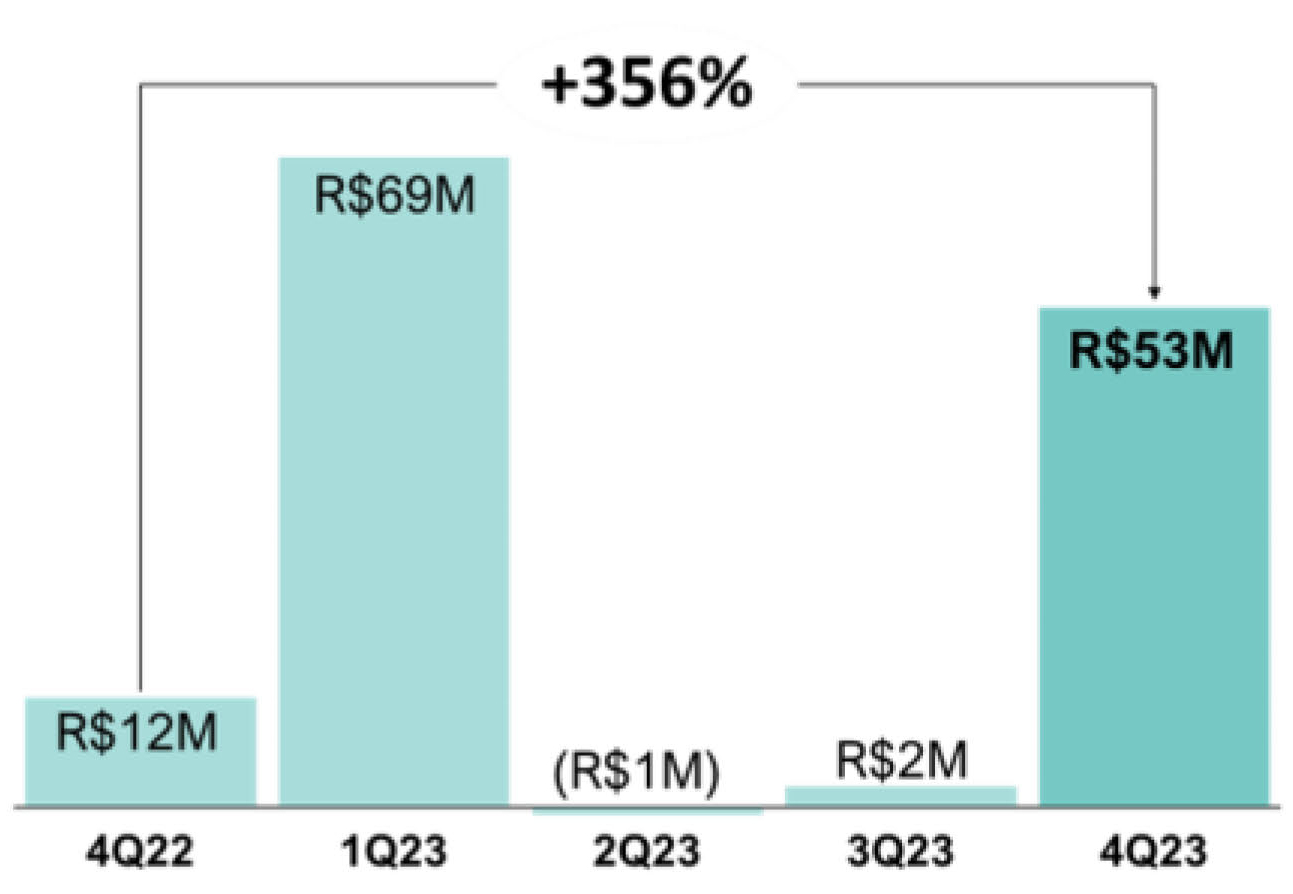
| Financial Services |
53 |
12 |
357.0% |
2 |
2333.8% |
123 |
(194) |
n.a. |
| Capital Expenditures (CapEx) |
521 |
378 |
37.8% |
529 |
-1.7% |
1,988 |
2,136 |
-6.9% |
| % Total Revenue and Income |
12.0% |
9.5% |
2.4 p.p. |
13.2% |
(1.2) p.p. |
12.5% |
13.9% |
(1.9) p.p. |
| Cash Earnings | Adj. EBITDA (-) CapEx |
454 |
410 |
10.7% |
365 |
24.7% |
1,516 |
917 |
65.4% |
1. Adj. EBITDA: GAAP Net Income + Income Tax and Social Contribution – Other Financial Income + POS Write-off + Depreciation and Amortization + FX Expenses + M&A Expenses + LTIP Expenses. Please see the Supplemental Information for a reconciliation of this adjusted financial measure
Adjusted EBITDA amounted to R$ 975 million in 4Q23, representing an increase of +23.7% vs. 4Q22, led by our gross profit evolution combined to the efficiencies observed in our operating expenses, resulting in higher margins.
Capital Expenditures amounted to R$ 521 million in 4Q23, representing an increase of +37.8% vs. 4Q22, mainly driven by our POS acquisitions and tech investments, along with the fact that our Capital Expenditures for 4Q22 was a particularly low amount of R$ 378 million as compared to prior periods. Despite Capital Expenditures as a percentage of Revenues increasing by +2.4 p.p. vs. 4Q22 to 12.0%, in FY2023 it decreased by -1.9 p.p. from 13.9% to 12.5%.
Cash Earnings amounted to R$ 454 million, representing an increase of +10.7% year-over-year, driven by better operating performance.
Depreciation and Amortization
|
|
|
|
|
|
|
|
|
|
|
|
|
|
|
|
|
|
|
|
|
|
|
|
|
|
|
| GAAP | R$ Million |
4Q23 |
4Q22 |
Var. y/y |
3Q23 |
Var. q/q |
2023 |
2022 |
Var. y/y |
| Depreciation and Amortization |
(366) |
(307) |
19.4% |
(346) |
5.7% |
(1,356) |
(1,131) |
19.9% |
| % Total Revenue and Income |
8.4% |
7.7% |
0.7 p.p. |
8.6% |
(0.2) p.p. |
8.5% |
7.4% |
1.1 p.p. |
|
|
|
|
|
|
|
|
|
|
|
|
|
|
|
|
|
|
|
|
|
|
|
|
|
|
|
| Non-GAAP | R$ Million |
4Q23 |
4Q22 |
Var. y/y |
3Q23 |
Var. q/q |
2023 |
2022 |
Var. y/y |
| Depreciation and Amortization |
(349) |
(270) |
29.0% |
(329) |
6.0% |
(1,290) |
(1,080) |
19.4% |
| % Total Revenue and Income |
8.0% |
6.8% |
1.2 p.p. |
8.2% |
(0.2) p.p. |
8.1% |
7.0% |
1.0 p.p. |
Depreciation and Amortization reached R$ 366 million, representing an increase of +19.4%, from R$ 307 million in 4Q22, mainly explained by:
(i)the depreciation of POS devices; and
(ii)the amortization of R&D investments, mainly related to product development and data security. These investments allow us to defer our tax liability through “Lei do Bem” (Technological Innovation Law).
When including non-GAAP Expenses of R$ 17 million, D&A, on a GAAP basis, totaled R$ 349 million, representing an increase of +29.0% vs. 4Q22 due to M&A expenses related to the fair value assets amortization.
POS Write-off
|
|
|
|
|
|
|
|
|
|
|
|
|
|
|
|
|
|
|
|
|
|
|
|
|
|
|
| GAAP | R$ Million |
4Q23 |
4Q22 |
Var. y/y |
3Q23 |
Var. q/q |
2023 |
2022 |
Var. y/y |
| POS Write-off |
(57) |
(66) |
-13.4% |
(64) |
-10.9% |
(248) |
(200) |
23.8% |
| % Total Revenue and Income |
1.3% |
1.7% |
(0.3) p.p. |
1.6% |
(0.3) p.p. |
1.6% |
1.3% |
0.2 p.p. |
In 4Q23, this value amounted to R$ 57 million, representing a decrease of -13.4% year-over-year. In September 2019, we changed our business model from selling POS devices to a subscription model to follow the industry’s best standards and to improve the merchant’s user experience in terms of:
(i)POS delivery for new merchants; and
(ii)POS maintenance and replacement for existing merchants.
At that time, we strategically prepared for the launch of our HUBs strategy to have the best SLAs in the market, providing a superior value proposition to focus not only on pricing (POS, MDR and prepayment) fee itself.
Between 2020 and 2021, the COVID-19 pandemic changed merchants’ transaction profile into the PAGS ecosystem, adding more complexity to understanding merchants’ engagement and activity levels. Now we have a better understanding of merchants’ activity, and we started to write-off POS devices beginning in the 2Q22.
Earnings Before Tax (EBT)
|
|
|
|
|
|
|
|
|
|
|
|
|
|
|
|
|
|
|
|
|
|
|
|
|
|
|
| Non-GAAP | R$ Million |
4Q23 |
4Q22 |
Var. y/y |
3Q23 |
Var. q/q |
2023 |
2022 |
Var. y/y |
| Earnings before Taxes (EBT) |
633 |
480 |
31.8% |
557 |
13.7% |
2,190 |
1,899 |
15.3% |
| % Total Revenue and Income |
14.6% |
12.1% |
2.4 p.p. |
13.8% |
0.7 p.p. |
13.7% |
12.4% |
1.3 p.p. |
|
|
|
|
|
|
|
|
|
|
|
|
|
|
|
|
|
|
|
|
|
|
|
|
|
|
|
| GAAP | R$ Million |
4Q23 |
4Q22 |
Var. y/y |
3Q23 |
Var. q/q |
2023 |
2022 |
Var. y/y |
| Earnings before Taxes (EBT) |
584 |
475 |
22.9% |
512 |
14.0% |
2,017 |
1,759 |
14.7% |
| % Total Revenue and Income |
13.4% |
12.0% |
1.4 p.p. |
12.7% |
0.7 p.p. |
12.6% |
11.5% |
1.2 p.p. |
Earnings before Tax amounted to R$ 633 million in 4Q23, representing an increase of +31.8% vs. 4Q22, reflecting the business growth in Payments and Financial Services, lower financial expenses, lower losses, and operational efficiencies partially offset by higher Depreciation and Amortization levels.
When including non-GAAP Expenses of R$ 49 million, Earnings before Tax, on a GAAP basis, totaled R$ 584 million, representing an increase of +22.9% vs. 4Q22.
Income Tax and Social Contribution Reconciliation
|
|
|
|
|
|
|
|
|
|
|
|
|
|
|
|
|
|
|
|
|
|
|
|
|
|
|
| GAAP | R$ Million |
4Q23 |
4Q22 |
Var. y/y |
3Q23 |
Var. q/q |
2023 |
2022 |
Var. y/y |
| Earnings before Taxes (EBT) |
584 |
475 |
22.9% |
512 |
14.0% |
2,017 |
1,759 |
14.7% |
| Statutory Rate |
34.0% |
34.0% |
0.0 p.p. |
34.0% |
0.0 p.p. |
34.0% |
34.0% |
(0.0) p.p. |
| Expected Income Tax Expenses |
(198) |
(161) |
22.9% |
(174) |
14.0% |
(686) |
(598) |
14.7% |
| Income Tax effect on: |
|
|
|
|
|
|
|
|
R&D and Tech Innovation Benefit1 |
44 |
80 |
-45.1% |
48 |
-9.0% |
193 |
255 |
-24.3% |
Taxation of Income abroad2 |
45 |
25 |
76.5% |
24 |
87.4% |
124 |
114 |
8.2% |
| Other |
14 |
(11) |
n.a. |
0 |
3361.7% |
5 |
(26) |
n.a. |
| Income Tax Expenses |
(96) |
(67) |
42.5% |
(101) |
-5.5% |
(363) |
(255) |
42.8% |
| Effective Tax Rate |
16.4% |
14.2% |
2.2 p.p. |
19.8% |
(3.4) p.p. |
18.0% |
14.5% |
3.5 p.p. |
| Current |
(25) |
(34) |
-27.7% |
(17) |
46.9% |
(102) |
(61) |
67.7% |
| Deferred |
(71) |
(33) |
115.2% |
(85) |
-16.0% |
(262) |
(194) |
35.0% |
1. Refers to the benefit granted by the Technological Innovation Law (“Lei do Bem”), which reduces the income tax charges, based on the amount invested by the PagSeguro Digital Ltd. On specific intangible assets. Please, see Note 12 in our Form 6-K related to the Financial Statements, published on the date hereof;
2. Some entities and investment funds adopt different taxation regimes according to the applicable rules in their jurisdictions.
Income Tax and Social Contribution amounted to an expense of R$ 96 million in 4Q23, representing an increase of +42.5% versus 4Q22. Effective Tax Rate (ETR) increased by +220 bps to 16.4% in 4Q23 from 14.2% in 4Q22, mainly driven by lower results in FIDC and lower Capital Expenditure deployments in 2023 vs. 2022 due to “Lei do Bem” eligibility. In both periods, the difference between the Effective Income Tax and Social Contribution Rate and the Rate computed by applying the Brazilian federal statutory rate was mainly related to:
(i)Technological Innovation Law (“Lei do Bem”), which reduces income tax charges based on investments made in innovation and technology, such as those made by PagSeguro Brazil, our Brazilian operating subsidiary; and
(ii)Taxation of Income abroad. Certain entities or investment funds adopt different taxation regimes in accordance with the applicable rules in their respective jurisdictions.
Net Income
|
|
|
|
|
|
|
|
|
|
|
|
|
|
|
|
|
|
|
|
|
|
|
|
|
|
|
| Non-GAAP | R$ Million |
4Q23 |
4Q22 |
Var. y/y |
3Q23 |
Var. q/q |
2023 |
2022 |
Var. y/y |
| Net Income |
520 |
411 |
26.6% |
440 |
18.2% |
1,768 |
1,597 |
10.7% |
| % Total Revenue and Income |
12.0% |
10.4% |
1.6 p.p. |
10.9% |
1.0 p.p. |
11.1% |
10.4% |
0.7 p.p. |
|
|
|
|
|
|
|
|
|
|
|
|
|
|
|
|
|
|
|
|
|
|
|
|
|
|
|
| GAAP | R$ Million |
4Q23 |
4Q22 |
Var. y/y |
3Q23 |
Var. q/q |
2023 |
2022 |
Var. y/y |
| Net Income |
488 |
408 |
19.7% |
411 |
18.8% |
1,654 |
1,505 |
9.9% |
| % Total Revenue and Income |
11.2% |
10.3% |
0.9 p.p. |
10.2% |
1.0 p.p. |
10.4% |
9.8% |
0.6 p.p. |
Net Income for the quarter amounted to R$ 520 million, representing an increase of +26.6%, from R$ 411 million reported in 4Q22.
Including Non-GAAP expenses of R$ 32 million, Net Income on GAAP basis totaled R$ 488 million, up +19.7% when compared to R$ 408 million reported in 4Q22.
Adj. EBITDA and Net Income (Non-GAAP) Reconciliation
|
|
|
|
|
|
|
|
|
|
|
|
|
|
|
|
|
|
|
|
|
|
|
|
|
|
|
|
|
|
| R$ Million |
|
1Q22 |
2Q22 |
3Q22 |
4Q22 |
1Q23 |
2Q23 |
3Q23 |
4Q23 |
| Net Income | GAAP |
|
350 |
367 |
380 |
408 |
370 |
385 |
411 |
488 |
| (+) Income Tax and Social Contribution |
|
67 |
76 |
45 |
67 |
66 |
100 |
101 |
96 |
(+) LTIP Expenses2 |
|
28 |
51 |
43 |
(42) |
19 |
30 |
30 |
32 |
| (+) POS Write-off |
|
0 |
93 |
41 |
66 |
62 |
65 |
64 |
57 |
| (+) Depreciation and Amortization |
|
249 |
281 |
294 |
307 |
317 |
326 |
346 |
366 |
| (-) Other Financial Income |
|
(42) |
(45) |
(46) |
(43) |
(65) |
(65) |
(66) |
(73) |
(+) M&A Expenses3 |
|
0 |
0 |
0 |
0 |
0 |
0 |
(3) |
0 |
| (+) FX Expenses |
|
13 |
9 |
12 |
15 |
17 |
9 |
10 |
9 |
(+) PagPhone realizable value reversal1 |
|
0 |
0 |
(53) |
0 |
0 |
0 |
0 |
0 |
(-) Software's disposals2 |
|
0 |
0 |
29 |
11 |
0 |
0 |
0 |
0 |
(-) Boleto Flex impairment2 |
|
0 |
0 |
13 |
0 |
0 |
0 |
0 |
0 |
(-) Agreement with POS supplier2 |
|
0 |
0 |
10 |
0 |
0 |
0 |
0 |
0 |
| Adj. EBITDA |
|
665 |
831 |
770 |
788 |
787 |
849 |
894 |
975 |
|
|
|
|
|
|
|
|
|
|
|
|
|
|
|
|
|
|
|
|
|
|
|
|
|
|
|
|
|
|
| R$ Million |
|
1Q22 |
2Q22 |
3Q22 |
4Q22 |
1Q23 |
2Q23 |
3Q23 |
4Q23 |
| Net Income | GAAP |
|
350 |
367 |
380 |
408 |
370 |
385 |
411 |
488 |
(+) LTIP Expenses2 |
|
28 |
51 |
43 |
(42) |
19 |
30 |
30 |
32 |
(+) M&A Expenses3 |
|
5 |
5 |
5 |
5 |
5 |
5 |
3 |
5 |
| (+) Income Tax and Social Contribution |
|
(11) |
(19) |
(16) |
(2) |
(11) |
(16) |
(15) |
(17) |
(+) PagPhone realizable value reversal1 |
|
0 |
0 |
(35) |
0 |
0 |
0 |
0 |
0 |
(-) Software's disposals2 |
|
0 |
0 |
19 |
11 |
0 |
0 |
0 |
0 |
(-) Boleto Flex impairment2 |
|
0 |
0 |
8 |
0 |
0 |
0 |
0 |
0 |
(-) Agreement with POS supplier2 |
|
0 |
0 |
7 |
0 |
0 |
0 |
0 |
0 |
| (+) Capitalized Expenses of platforms development |
0 |
0 |
0 |
32 |
10 |
11 |
12 |
13 |
| Net Income | Non-GAAP |
|
371 |
403 |
411 |
411 |
392 |
415 |
440 |
520 |
Total Costs and Expenses (Non-GAAP) are booked in:
1. Transaction Costs;
2. Operating Expenses;
3. Depreciation and Amortization.
Managerial Float Reconciliation1
|
|
|
|
|
|
|
|
|
|
|
|
|
|
|
|
|
|
|
|
|
|
|
|
|
|
|
|
|
|
| R$ Million |
|
1Q22 |
2Q22 |
3Q22 |
4Q22 |
1Q23 |
2Q23 |
3Q23 |
4Q23 |
| Total Revenue and Income |
|
3,427 |
3,911 |
4,035 |
3,962 |
3,750 |
3,826 |
4,026 |
4,347 |
| As previously reported |
|
|
|
|
|
|
|
|
|
| Payments |
|
3,125 |
3,606 |
3,712 |
3,654 |
3,449 |
3,339 |
3,771 |
4,104 |
| Financial Services |
|
305 |
314 |
339 |
329 |
298 |
447 |
219 |
169 |
| Other Financial Income |
|
42 |
45 |
46 |
43 |
65 |
65 |
66 |
73 |
| Float |
|
(44) |
(54) |
(62) |
(64) |
(62) |
(26) |
(29) |
– |
| Current classification |
|
|
|
|
|
|
|
|
|
| Payments |
|
3,125 |
3,606 |
3,712 |
3,654 |
3,449 |
3,575 |
3,771 |
4,084 |
| Financial Services |
|
333 |
344 |
376 |
362 |
331 |
243 |
260 |
253 |
| Other Financial Income |
|
42 |
45 |
46 |
43 |
65 |
65 |
66 |
73 |
| Float |
|
(72) |
(84) |
(99) |
(97) |
(95) |
(57) |
(71) |
(63) |
| Gross Profit |
|
1,225 |
1,434 |
1,384 |
1,409 |
1,374 |
1,438 |
1,477 |
1,675 |
| As previously reported |
|
|
|
|
|
|
|
|
|
| Payments |
|
1,205 |
1,393 |
1,308 |
1,278 |
1,228 |
1,225 |
1,417 |
1,624 |
| Financial Services |
|
20 |
41 |
76 |
131 |
147 |
213 |
59 |
41 |
| Current classification |
|
|
|
|
|
|
|
|
|
| Payments |
|
1,177 |
1,364 |
1,272 |
1,245 |
1,196 |
1,327 |
1,376 |
1,550 |
| Financial Services |
|
48 |
70 |
113 |
164 |
179 |
111 |
101 |
125 |
| Adj. EBITDA |
|
665 |
831 |
770 |
788 |
787 |
849 |
894 |
975 |
| As previously reported |
|
|
|
|
|
|
|
|
|
| Payments |
|
769 |
927 |
868 |
809 |
751 |
857 |
933 |
996 |
| Financial Services |
|
(104) |
(96) |
(99) |
(21) |
36 |
(9) |
(39) |
(30) |
| Current classification |
|
|
|
|
|
|
|
|
|
| Payments |
|
741 |
898 |
832 |
776 |
719 |
850 |
892 |
922 |
| Financial Services |
|
(76) |
(67) |
(62) |
12 |
68 |
(1) |
2 |
53 |
1. The observed increase in Financial Services revenues and decrease in Gross Profit/EBITDA in Payments is attributed to the revised float allocation: R$33M in 1Q23, R$33M in 4Q22 and R$28M in 1Q22.
Cash Flow Analysis
|
|
|
|
|
|
|
|
|
|
|
|
|
|
|
|
|
|
|
|
|
|
|
|
|
|
|
| GAAP | R$ Million |
4Q23 |
4Q22 |
Var. y/y |
3Q23 |
Var. q/q |
2023 |
2022 |
Var. y/y |
| Earnings before Taxes (EBT) |
584 |
475 |
22.9% |
512 |
14.0% |
2,017 |
1,759 |
14.7% |
| Expenses (Revenues) not affecting Cash |
843 |
146 |
479.0% |
826 |
2.1% |
2,977 |
3,172 |
-6.1% |
| Net Cash from Operating Activities |
2,165 |
1,960 |
10.5% |
972 |
122.7% |
4,000 |
3,549 |
12.7% |
| Net Cash from Investing Activities |
(1,086) |
(427) |
154.5% |
(503) |
115.7% |
(2,704) |
(2,185) |
23.8% |
| Net Cash from Financing Activities |
(155) |
(1,109) |
-86.0% |
(218) |
-29.1% |
(226) |
(1,330) |
-83.0% |
| Increase (Decrease) in Cash Position |
924 |
425 |
117.7% |
251 |
269.0% |
1,070 |
35 |
2980.5% |
| Cash Position at the beginning of the Period |
1,975 |
1,404 |
40.6% |
1,724 |
14.5% |
1,829 |
1,794 |
1.9% |
| Cash Position at the end of the Period |
2,899 |
1,829 |
58.5% |
1,975 |
46.8% |
2,899 |
1,829 |
58.5% |
Cash and Cash Equivalents at the end of 4Q23 amounted to R$ 2,899 million, representing an increase of R$ 1,070 million, up +58.5% year-over-year.
Expenses (Revenues) not affecting Cash amounted of R$ 843 million, representing an increase of R$ 697 million, up +479% year-over-year mainly driven by:
▪Lower Losses, mainly related to better fraud prevention actions related Total Payment Volume and more detailed credit analysis for credit operations.
▪Depreciation and Amortization growth due to the deployed capital expenditures in the last years;
▪Increase in the Interest accrued from Financial Assets and Liabilities related by the the deposits growth;
▪Increase in Disposal of Property, Equipment, and Intangible Assets, mainly explained by the write-offs of POS devices.
Net Cash provided by (used in) Operating Activities
|
|
|
|
|
|
|
|
|
|
|
|
|
|
|
|
|
|
|
|
|
|
|
|
|
|
|
| GAAP | R$ Million |
4Q23 |
4Q22 |
Var. y/y |
3Q23 |
Var. q/q |
2023 |
2022 |
Var. y/y |
| Net Cash from Operating Activities |
2,165 |
1,960 |
10.5% |
972 |
122.7% |
4,000 |
3,549 |
12.7% |
| Earnings before Income Taxes |
584 |
475 |
22.9% |
512 |
14.0% |
2,017 |
1,759 |
14.7% |
| Expenses (Revenues) not affecting Cash |
843 |
146 |
479.0% |
826 |
2.1% |
2,977 |
3,172 |
-6.1% |
| Changes in Operating Assets and Liabilities |
(84) |
1,162 |
n.a. |
(1,037) |
-91.9% |
(3,488) |
(3,998) |
-12.8% |
| Income Tax and Social Contribution paid |
(4) |
(3) |
22.2% |
(19) |
-79.0% |
(83) |
(90) |
-8.1% |
| Interest Income received |
826 |
181 |
357.5% |
690 |
19.6% |
2,576 |
2,706 |
-4.8% |
Net Cash provided in Operating Activities in 4Q23 totaled R$ 2,165 million, representing an increase of +10.5% vs. 4Q22.
The adjustments for changes in Operating Assets and Liabilities amounted to negative cash flow of R$ 84 million in 4Q23, mainly due to:
▪Accounts receivable, mainly related to receivables derived from transactions where we act as the financial intermediary in operations with the issuing banks, which is presented net of Transaction Costs and Financial Expenses we incur when we elect to receive early payment of the accounts receivable owed to us by card issuers, consists of the difference between the opening and closing balances of the Accounts Receivable item of Current Assets and Non-current Assets on our Balance Sheet;
▪Payables to third parties, which is presented net of Revenue from Transaction Activities and Financial Income we receive when merchants elect to receive early payments, consists of the difference between the opening and closing balances of the Payables to Third Parties item of Current Liabilities on our Balance Sheet;
▪Receivables from (Payables to) related Parties, consists of the difference between the opening and closing balances of the Payables to related Parties excluding Interest Paid, which are presented separately in the statement of Cash Flows;
▪Salaries and Social Charges consist of the amounts that were recorded on our Statement of Income, but which remained unpaid at the end of the period.
▪Trade Payables item consists of the difference between the opening and closing balances of trade payables, positively impacting the result.
▪Taxes and contributions item consists of sales taxes (ISS. ICMS. PIS and COFINS), positively impacting the result.
▪Financial Investments (mandatory guarantee) item consists of the minimum amount that we need to maintain as required by the Brazilian Central Bank. This item impacted negatively the fourth quarter ended December 31, 2023.
▪Taxes Recoverable item consists of withholding taxes and recoverable taxes on transaction activities and other services and purchase of POS devices. This item impacted negatively the cash flow in the fourth quarter.
▪Deposits consists of issued certificates of deposit excluding interest income paid to, which are presented separately in the statement of cash flows. This item impacted positively the cash flow in the fourth quarter.
▪We paid Income tax and social contribution in cash totaling R$ 4 million.
▪Interest Income received, net consisted of interest recorded under Accounts Receivable (monthly), which related to fees charged from merchants, considering the Brazilian monthly Interest Rate over PAGS Accounts Receivable and interest paid related to our deposits. Interest Income amounted to R$ 826 million.
Net Cash provided by (used in) Investing Activities
|
|
|
|
|
|
|
|
|
|
|
|
|
|
|
|
|
|
|
|
|
|
|
|
|
|
|
| GAAP | R$ Million |
4Q23 |
4Q22 |
Var. y/y |
3Q23 |
Var. q/q |
2023 |
2022 |
Var. y/y |
| Net Cash from Investing Activities |
(1,086) |
(427) |
154.5% |
(503) |
115.7% |
(2,704) |
(2,185) |
23.8% |
Amount paid on Acquisitions1 |
0 |
0 |
n.a. |
(31) |
n.a. |
(31) |
0 |
n.a. |
| Property and Equipment |
(259) |
(69) |
275.6% |
(266) |
-2.7% |
(952) |
(1,096) |
-13.2% |
| Intangible Assets |
(262) |
(309) |
-15.1% |
(262) |
0.2% |
(1,037) |
(1,040) |
-0.3% |
| Redemption (Acquisition) of Fin. Investments |
(564) |
(49) |
1062.5% |
56 |
n.a. |
(684) |
(48) |
1321.3% |
1. Net of Cash acquired.
Net Cash used in Investing Activities in 4Q23, totaled R$ 1,086 million, representing an increase of R$ 659 million, up +154.5% vs. 4Q22, mainly due to:
▪Purchases of Property and Equipment of R$ 259 million, representing an increase of +276% y/y.
▪Purchases and Development of Intangible Assets of R$ 262 million, representing a decrease of -15% y/y, in connection with purchases of third-party software and salaries and other amounts that we invested to develop software and technology internally, which we capitalize as intangible assets.
▪Redemption (Acquisition) of Financial Investments, which negatively impacted net cash used by investing activities.
Net Cash provided by (used in) Financing Activities
|
|
|
|
|
|
|
|
|
|
|
|
|
|
|
|
|
|
|
|
|
|
|
|
|
|
|
| GAAP | R$ Million |
4Q23 |
4Q22 |
Var. y/y |
3Q23 |
Var. q/q |
2023 |
2022 |
Var. y/y |
| Net Cash from Financing Activities |
(155) |
(1,109) |
-86.0% |
(218) |
-29.1% |
(226) |
(1,330) |
-83.0% |
| Proceeds from Borrowings |
0 |
0 |
n.a. |
0 |
n.a. |
300 |
250 |
20.0% |
| Payment of borrowings |
0 |
(963) |
n.a. |
(100) |
n.a. |
(100) |
(1,213) |
-91.8% |
| Payment of borrowings interests |
0 |
(42) |
n.a. |
(10) |
n.a. |
(10) |
(57) |
-83.1% |
| Acquisition of Treasury Shares |
(151) |
(100) |
51.2% |
(105) |
43.2% |
(399) |
(291) |
37.0% |
| Payment of Leases |
(4) |
(4) |
3.9% |
(4) |
17.6% |
(17) |
(18) |
-6.6% |
Net Cash used in Financing Activities in 4Q23, totaled a disbursement of R$ 155 million, down -86.0% year-over-year, mainly related to the acquisitions of treasury shares in the amount of R$ 151 million.
Appendix
Balance Sheet
|
|
|
|
|
|
|
|
|
|
|
|
|
|
|
|
|
|
|
|
|
|
|
|
|
|
|
| R$ Million |
|
|
|
4Q23 |
4Q22 |
Var. y/y |
3Q23 |
Var. q/q |
| Total Assets |
|
|
|
55,108 |
45,329 |
21.6% |
47,327 |
16.4% |
| Current Assets |
|
|
|
48,729 |
39,767 |
22.5% |
41,165 |
18.4% |
| Cash and Cash Equivalents |
|
|
|
2,899 |
1,829 |
58.5% |
1,975 |
46.8% |
| Financial Investments |
|
|
|
3,309 |
1,103 |
199.9% |
1,078 |
206.8% |
| Accounts Receivable |
|
|
|
41,757 |
36,249 |
15.2% |
37,521 |
11.3% |
| Derivative Financial Instruments |
|
|
|
0 |
0 |
n.a. |
0 |
n.a. |
| Receivables from Related Parties |
|
|
|
4 |
0 |
n.a. |
4 |
-2.1% |
| Inventories |
|
|
|
34 |
13 |
152.5% |
26 |
28.0% |
| Taxes Recoverable |
|
|
|
563 |
411 |
37.1% |
379 |
48.6% |
| Other Receivables |
|
|
|
163 |
162 |
0.5% |
181 |
-10.0% |
| Non-current Assets |
|
|
|
6,379 |
5,562 |
14.7% |
6,162 |
3.5% |
| Judicial Deposits |
|
|
|
51 |
45 |
13.7% |
50 |
2.7% |
| Accounts Receivable |
|
|
|
1,144 |
746 |
53.4% |
1,000 |
14.4% |
| Receivables from related parties |
|
|
|
28 |
0 |
n.a. |
28 |
-0.2% |
| Other receivables |
|
|
|
36 |
19 |
92.3% |
21 |
70.9% |
| Deferred Income Tax |
|
|
|
99 |
99 |
-0.6% |
102 |
-2.6% |
| Investment |
|
|
|
0 |
2 |
n.a. |
0 |
n.a. |
| Property and Equipment |
|
|
|
2,451 |
2,493 |
-1.7% |
2,478 |
-1.1% |
| Intangible Assets |
|
|
|
2,571 |
2,159 |
19.1% |
2,484 |
3.5% |
| Total Liabilities and Equity |
|
|
|
55,108 |
45,329 |
21.6% |
47,327 |
16.4% |
| Current Liabilities |
|
|
|
34,432 |
29,740 |
15.8% |
28,665 |
20.1% |
| Payables to Third Parties |
|
|
|
21,349 |
17,988 |
18.7% |
18,707 |
14.1% |
| Trade Payables |
|
|
|
514 |
449 |
14.4% |
439 |
17.0% |
| Payables to Related Parties |
|
|
|
135 |
594 |
-77.2% |
78 |
72.9% |
| Borrowings |
|
|
|
189 |
0 |
n.a. |
193 |
-1.7% |
| Derivative Financial Instruments |
|
|
|
41 |
22 |
83.7% |
28 |
45.8% |
| Deposits |
|
|
|
11,365 |
10,101 |
12.5% |
8,577 |
32.5% |
| Salaries and Social Charges |
|
|
|
345 |
293 |
17.9% |
334 |
3.4% |
| Taxes and Contributions |
|
|
|
241 |
90 |
168.1% |
83 |
190.2% |
| Provision for Contingencies |
|
|
|
91 |
46 |
97.9% |
70 |
30.4% |
| Deferred Revenue |
|
|
|
128 |
126 |
1.9% |
126 |
2.1% |
| Other Liabilities |
|
|
|
32 |
31 |
2.8% |
30 |
7.8% |
| Non-current Liabilities |
|
|
|
7,435 |
3,747 |
98.4% |
5,793 |
28.3% |
| Payables to Third Parties |
|
|
|
186 |
85 |
119.3% |
159 |
16.6% |
| Deferred Income Tax |
|
|
|
1,832 |
1,564 |
17.1% |
1,755 |
4.4% |
| Provision for Contingencies |
|
|
|
6 |
14 |
-60.1% |
6 |
-9.3% |
| Deposits |
|
|
|
4,823 |
1,895 |
154.6% |
3,337 |
44.5% |
| Deferred Revenue |
|
|
|
18 |
17 |
1.4% |
18 |
-1.9% |
| Payables to related parties |
|
|
|
341 |
0 |
n.a. |
284 |
20.2% |
| Other Liabilities |
|
|
|
230 |
171 |
34.1% |
233 |
-1.4% |
| Equity |
|
|
|
13,241 |
11,842 |
11.8% |
12,868 |
2.9% |
| Share Capital |
|
|
|
0 |
0 |
0.0% |
0 |
0.0% |
| Capital Reserve |
|
|
|
6,133 |
6,103 |
0.5% |
6,097 |
0.6% |
| Retained earnings |
|
|
|
7,891 |
6,237 |
26.5% |
7,403 |
6.6% |
| Treasury Shares |
|
|
|
(760) |
(475) |
59.9% |
(610) |
24.7% |
| Other Comprehensive Income |
|
|
|
(0) |
(0) |
242.3% |
(0) |
576.6% |
| Equity Valuation Adjustments |
|
|
|
(22) |
(22) |
0.0% |
(22) |
0.0% |
Basic and Diluted EPS | Fourth Quarter 2023
|
|
|
|
|
|
|
|
|
|
|
|
|
|
|
|
|
|
|
|
|
|
|
|
|
|
|
| GAAP | R$ million |
4Q23 |
4Q22 |
Var. y/y |
3Q23 |
Var. q/q |
2023 |
2022 |
Var. y/y |
| Net Income attributable to: |
|
|
|
|
|
|
|
|
| Owners of the Company |
488 |
408 |
19.7% |
411 |
18.8% |
1,654 |
1,505 |
9.9% |
| Non-controlling interests |
– |
– |
– |
– |
– |
– |
– |
– |
Outstanding Common Shares1 | # Million |
317.2 |
327.1 |
-3.0% |
321.8 |
-1.5% |
321.8 |
327.1 |
-1.6% |
Common Shares1 diluted | # Million |
319.1 |
329.2 |
-3.1% |
323.8 |
-1.4% |
324.0 |
329.2 |
-1.6% |
| Basic Earnings per Common Share |
R$ 1.54 |
R$ 1.25 |
23.5% |
R$ 1.28 |
20.6% |
R$ 5.14 |
R$ 4.60 |
11.7% |
| Diluted Earnings per Common Share |
R$ 1.53 |
R$ 1.24 |
23.5% |
R$ 1.27 |
20.6% |
R$ 5.10 |
R$ 4.57 |
11.7% |
1. Weighted average number.
Cash Flow
|
|
|
|
|
|
|
|
|
|
|
|
|
|
|
|
|
|
|
|
|
|
|
|
|
|
|
| GAAP | R$ Million |
4Q23 |
4Q22 |
Var. y/y |
3Q23 |
Var. q/q |
2023 |
2022 |
Var. y/y |
| Earnings before Income Taxes |
584 |
475 |
22.9% |
512 |
14.0% |
2,017 |
1,759 |
14.7% |
| Expenses (Revenues) not affecting Cash |
843 |
146 |
478.6% |
826 |
2.0% |
2,977 |
3,172 |
-6.1% |
| Depreciation and Amortization |
366 |
307 |
19.4% |
346 |
5.7% |
1,356 |
1,131 |
19.9% |
| Chargebacks |
123 |
192 |
-36.0% |
165 |
-25.8% |
536 |
984 |
-45.6% |
| Accrual of Provision for Contingencies |
36 |
9 |
284.8% |
10 |
257.9% |
59 |
37 |
58.8% |
| Reversal of Taxes and Contributions |
0 |
0 |
n.a. |
0 |
n.a. |
0 |
0 |
n.a. |
| Share based Long Term Incentive Plan |
35 |
14 |
151.7% |
36 |
-1.7% |
145 |
127 |
13.5% |
| Loss on Disposal: PP&E/Intangible Assets |
87 |
82 |
7.2% |
78 |
12.7% |
296 |
271 |
9.3% |
| Financial Instruments |
4 |
22 |
-84.2% |
8 |
-58.4% |
1 |
22 |
-95.4% |
| Interest Accrued |
193 |
(471) |
n.a. |
184 |
4.6% |
586 |
592 |
-1.1% |
| Other Financial Cost, Net |
(1) |
(9) |
-86.6% |
(2) |
-36.9% |
(2) |
6 |
n.a. |
| Changes in Operating Assets/Liabilities |
(84) |
1,162 |
n.a. |
(1,037) |
-91.9% |
(3,488) |
(3,998) |
-12.8% |
| Account Receivables |
(5,587) |
(2,898) |
92.8% |
(5,386) |
3.7% |
(10,531) |
(17,854) |
-41.0% |
| Financial Investments |
(1,504) |
52 |
n.a. |
16 |
n.a. |
(1,274) |
(157) |
709.4% |
| Inventories |
(7) |
39 |
n.a. |
7 |
n.a. |
(20) |
36 |
n.a. |
| Taxes Recoverable |
(166) |
51 |
n.a. |
59 |
n.a. |
(60) |
154 |
n.a. |
| Other Receivables |
(2) |
(12) |
-85.7% |
(23) |
-92.4% |
(10) |
26 |
n.a. |
| Deferred Revenue |
2 |
(7) |
n.a. |
1 |
304.6% |
2 |
(36) |
n.a. |
| Other Payables |
6 |
104 |
-94.6% |
(5) |
n.a. |
8 |
68 |
-87.8% |
| Payables to Third Parties |
2,662 |
3,723 |
-28.5% |
2,082 |
27.9% |
3,430 |
4,848 |
-29.2% |
| Trade Payables |
76 |
86 |
-11.8% |
(27) |
n.a. |
63 |
(134) |
n.a. |
| Receivables/Payables to Related Parties |
105 |
129 |
-18.4% |
110 |
-4.5% |
(192) |
10 |
n.a. |
| Deposits |
4,186 |
(91) |
n.a. |
2,075 |
101.7% |
4,945 |
9,006 |
-45.1% |
| Salaries and Social Charges |
11 |
(8) |
n.a. |
56 |
-79.8% |
51 |
33 |
55.7% |
| Taxes and Contributions |
151 |
2 |
n.a. |
0 |
n.a. |
127 |
26 |
392.8% |
| Provision for Contingencies |
(17) |
(7) |
143.8% |
(2) |
856.1% |
(29) |
(24) |
18.2% |
| Income Tax and Social Contribution paid |
(4) |
(3) |
22.2% |
(19) |
-79.0% |
(83) |
(90) |
-8.1% |
| Interest Income received |
826 |
181 |
357.5% |
690 |
19.6% |
2,576 |
2,706 |
-4.8% |
| Net Cash from Operating Activities |
2,165 |
1,960 |
10.5% |
973 |
122.5% |
4,000 |
3,549 |
12.7% |
| Amount paid on Acquisitions |
0 |
0 |
n.a. |
(31) |
n.a. |
(31) |
0 |
n.a. |
| Purchases of Property and Equipment |
(259) |
(69) |
275.6% |
(266) |
-2.7% |
(952) |
(1,096) |
-13.2% |
| Purchases of Intangible Assets |
(262) |
(309) |
-15.3% |
(262) |
-0.2% |
(1,037) |
(1,040) |
-0.3% |
| Acquisition of Financial Investments |
(564) |
(48) |
n.a. |
56 |
n.a. |
(684) |
(48) |
n.a. |
| Redemption of Financial Investments |
0 |
(0) |
n.a. |
0 |
n.a. |
0 |
0 |
n.a. |
| Net Cash from Investing Activities |
(1,085) |
(427) |
154.4% |
(504) |
115.4% |
(2,704) |
(2,185) |
23.8% |
| Payment of Borrowings |
0 |
(963) |
n.a. |
(100) |
n.a. |
(100) |
(1,213) |
-91.8% |
| Proceeds from Borrowings |
0 |
0 |
n.a. |
0 |
n.a. |
300 |
250 |
20.0% |
| Payment of Borrowings Interest |
0 |
(42) |
n.a. |
(10) |
n.a. |
(10) |
(57) |
-83.1% |
| Payment of Leases |
(4) |
(4) |
3.9% |
(4) |
17.6% |
(17) |
(18) |
-6.6% |
| Acquisition of Treasury Shares |
(151) |
(100) |
51.2% |
(105) |
43.2% |
(399) |
(291) |
37.0% |
| Capital Increase |
0 |
0 |
n.a. |
0 |
n.a. |
0 |
0 |
n.a. |
| Net Cash from Financing Activities |
(155) |
(1,109) |
-86.0% |
(218) |
-29.1% |
(226) |
(1,330) |
-83.0% |
| Increase (Decrease) in Cash Position |
924 |
425 |
117.7% |
251 |
269.0% |
1,070 |
35 |
2980.5% |
| Cash Position at the beginning of the Period |
1,975 |
1,404 |
40.6% |
1,724 |
14.5% |
1,829 |
1,794 |
1.9% |
| Cash Position at the end of the Period |
2,899 |
1,829 |
58.5% |
1,975 |
46.8% |
2,899 |
1,829 |
58.5% |
Non-GAAP disclosure
This press release includes certain non-GAAP measures. We present non-GAAP measures when we believe that the additional information is useful and meaningful to investors. These non-GAAP measures are provided to enhance investors' overall understanding of our current financial performance and its prospects for the future. Specifically, we believe the non-GAAP measures provide useful information to both management and investors by excluding certain expenses, gains and losses, as the case may be, that may not be indicative of our core operating results and business outlook.
These measures may be different from non-GAAP financial measures used by other companies. The presentation of this non-GAAP financial information, which is not prepared under any comprehensive set of accounting rules or principles, is not intended to be considered separately from, or as a substitute for, our financial information prepared and presented in accordance with IFRS as issued by the IASB. Non-GAAP measures have limitations in that they do not reflect all the amounts associated with our results of operations as determined in accordance with IFRS. These measures should only be used to evaluate our results of operations in conjunction with the corresponding GAAP measures.
Non-GAAP results consist of our GAAP results as adjusted to exclude the following items:
LTIP Expenses: This consists of expenses for equity awards under our two long-term incentive plans (LTIP and LTIP-Goals). We exclude LTIP expenses from our non-GAAP measures primarily because they are non-cash expenses and the related employer payroll taxes depend on our stock price and the timing and size of exercises and vesting of equity awards, over which management has limited to no control, and as such management does not believe these expenses correlate to the operation of our business.
M&A Expenses: This consists of expenses for mergers & acquisitions (“M&A”) transactions, including, among others, expenses for external consulting, accounting and legal services in connection with due diligence and negotiating M&A documentation for our acquisitions, as well as amortization and write-downs of the fair value of certain acquired assets. We exclude M&A expenses from our non-GAAP measures primarily because such expenses are non-recurring and do not correlate to the operation of our business.
Non-recurring Effects: This consists of one-time effects related to PagPhone sales, PagPhone inventory provisions, tax impairment, software disposals and development. We exclude non-recurring effects from our non-GAAP measures primarily because such items are non-recurring and do not correlate to the operation of our business.
Income Tax and Social Contribution on LTIP Expenses, M&A Expenses and Non-Recurring Adjustments: This represents the income tax effect related to the LTIP expenses, M&A expenses and non-recurring adjustments mentioned above.
For a reconciliation of these non-GAAP financial measures to the most directly comparable GAAP measures, see the tables elsewhere in this press release under the following headings: “Income Tax and Social Contribution Reconciliation,” “Adjusted EBITDA and Non-GAAP Net Income Reconciliation,” “Reconciliation of Basic and diluted EPS to non-GAAP Basic and diluted EPS” and “Reconciliation of GAAP Measures to non-GAAP Measures.”
Earnings Call
PagSeguro Digital Ltd. (NYSE: PAGS) will host a conference call and earnings webcast on February 28, 2024 at 5:00 pm ET.
Event Details
Webcast: https://mzgroup.zoom.us/webinar/register/WN_iih6dVktQqWgVe5FuHQHmQ#/registration
Contacts:
Investor Relations:
ir@pagseguro.com
investors.pagseguro.com
Media Press:
pagbank@xcom.net.br
Forward-Looking Statements
This press release includes “forward-looking statements” within the meaning of the U.S. federal securities laws. Statements contained herein that are not clearly historical in nature are forward-looking, and the words “anticipate,” “believe,” “continues,” “expect,” “estimate,” “intend,” “project” and similar expressions and future or conditional verbs such as “will,” “would,” “should,” “could,” “might,” “can,” “may,” or similar expressions are generally intended to identify forward-looking statements. We cannot guarantee that such statements will prove correct. These forward-looking statements speak only as of the date hereof and are based on our current plans, estimates of future events, expectations and trends (including trends related to the global and Brazilian economies and capital markets, as well as the continuing economic, financial, political and public health effects of the coronavirus, or the COVID-19, pandemic.) that affect or may affect our business, financial condition, results of operations, cash flow, liquidity, prospects and the trading price of our Class A common shares, and are subject to several known and unknown uncertainties and risks, many of which are beyond our control. As consequence, current plans, anticipated actions and future financial position and results of operations may differ significantly from those expressed in any forward-looking statements in this press release. You are cautioned not to unduly rely on such forward-looking statements when evaluating the information presented. In light of the risks and uncertainties described above, the future events and circumstances discussed in this press release might not occur and are not guarantees of future performance. Because of these uncertainties, you should not make any investment decision based upon these estimates and forward-looking statements. To obtain further information on factors that may lead to results different from those forecast by us, please consult the reports we file with the U.S. Securities and Exchange Commission (SEC) and in particular the factors discussed under “Forward-Looking Statements” and “Risk Factors” in our annual report on Form 20-F.

SIGNATURES
Pursuant to the requirements of the Securities Exchange Act of 1934, the registrant has duly caused this report to be signed on its behalf by the undersigned, thereunto duly authorized.
Date: February 28, 2024
|
|
|
|
|
|
|
|
|
|
PagSeguro Digital Ltd. |
|
|
|
By: |
/s/ Artur Schunck |
|
Name: |
Artur Schunck |
|
Title: |
Chief Financial Officer,
Chief Accounting Officer and
Investor Relations Officer |