Exhibit No. |
Description of Exhibit |
|||||||
| AMBIPAR EMERGENCY RESPONSE | ||||||||
| By: | /s/Thiago da Costa Silva | |||||||
| Name: | Thiago da Costa Silva | |||||||
| Title: | Director | |||||||

| BRL million | 3Q23 | 3Q22 | Chg. | 2Q23 | Chg. | 9M23* | 9M22 | Chg. | ||||||||||||||||||
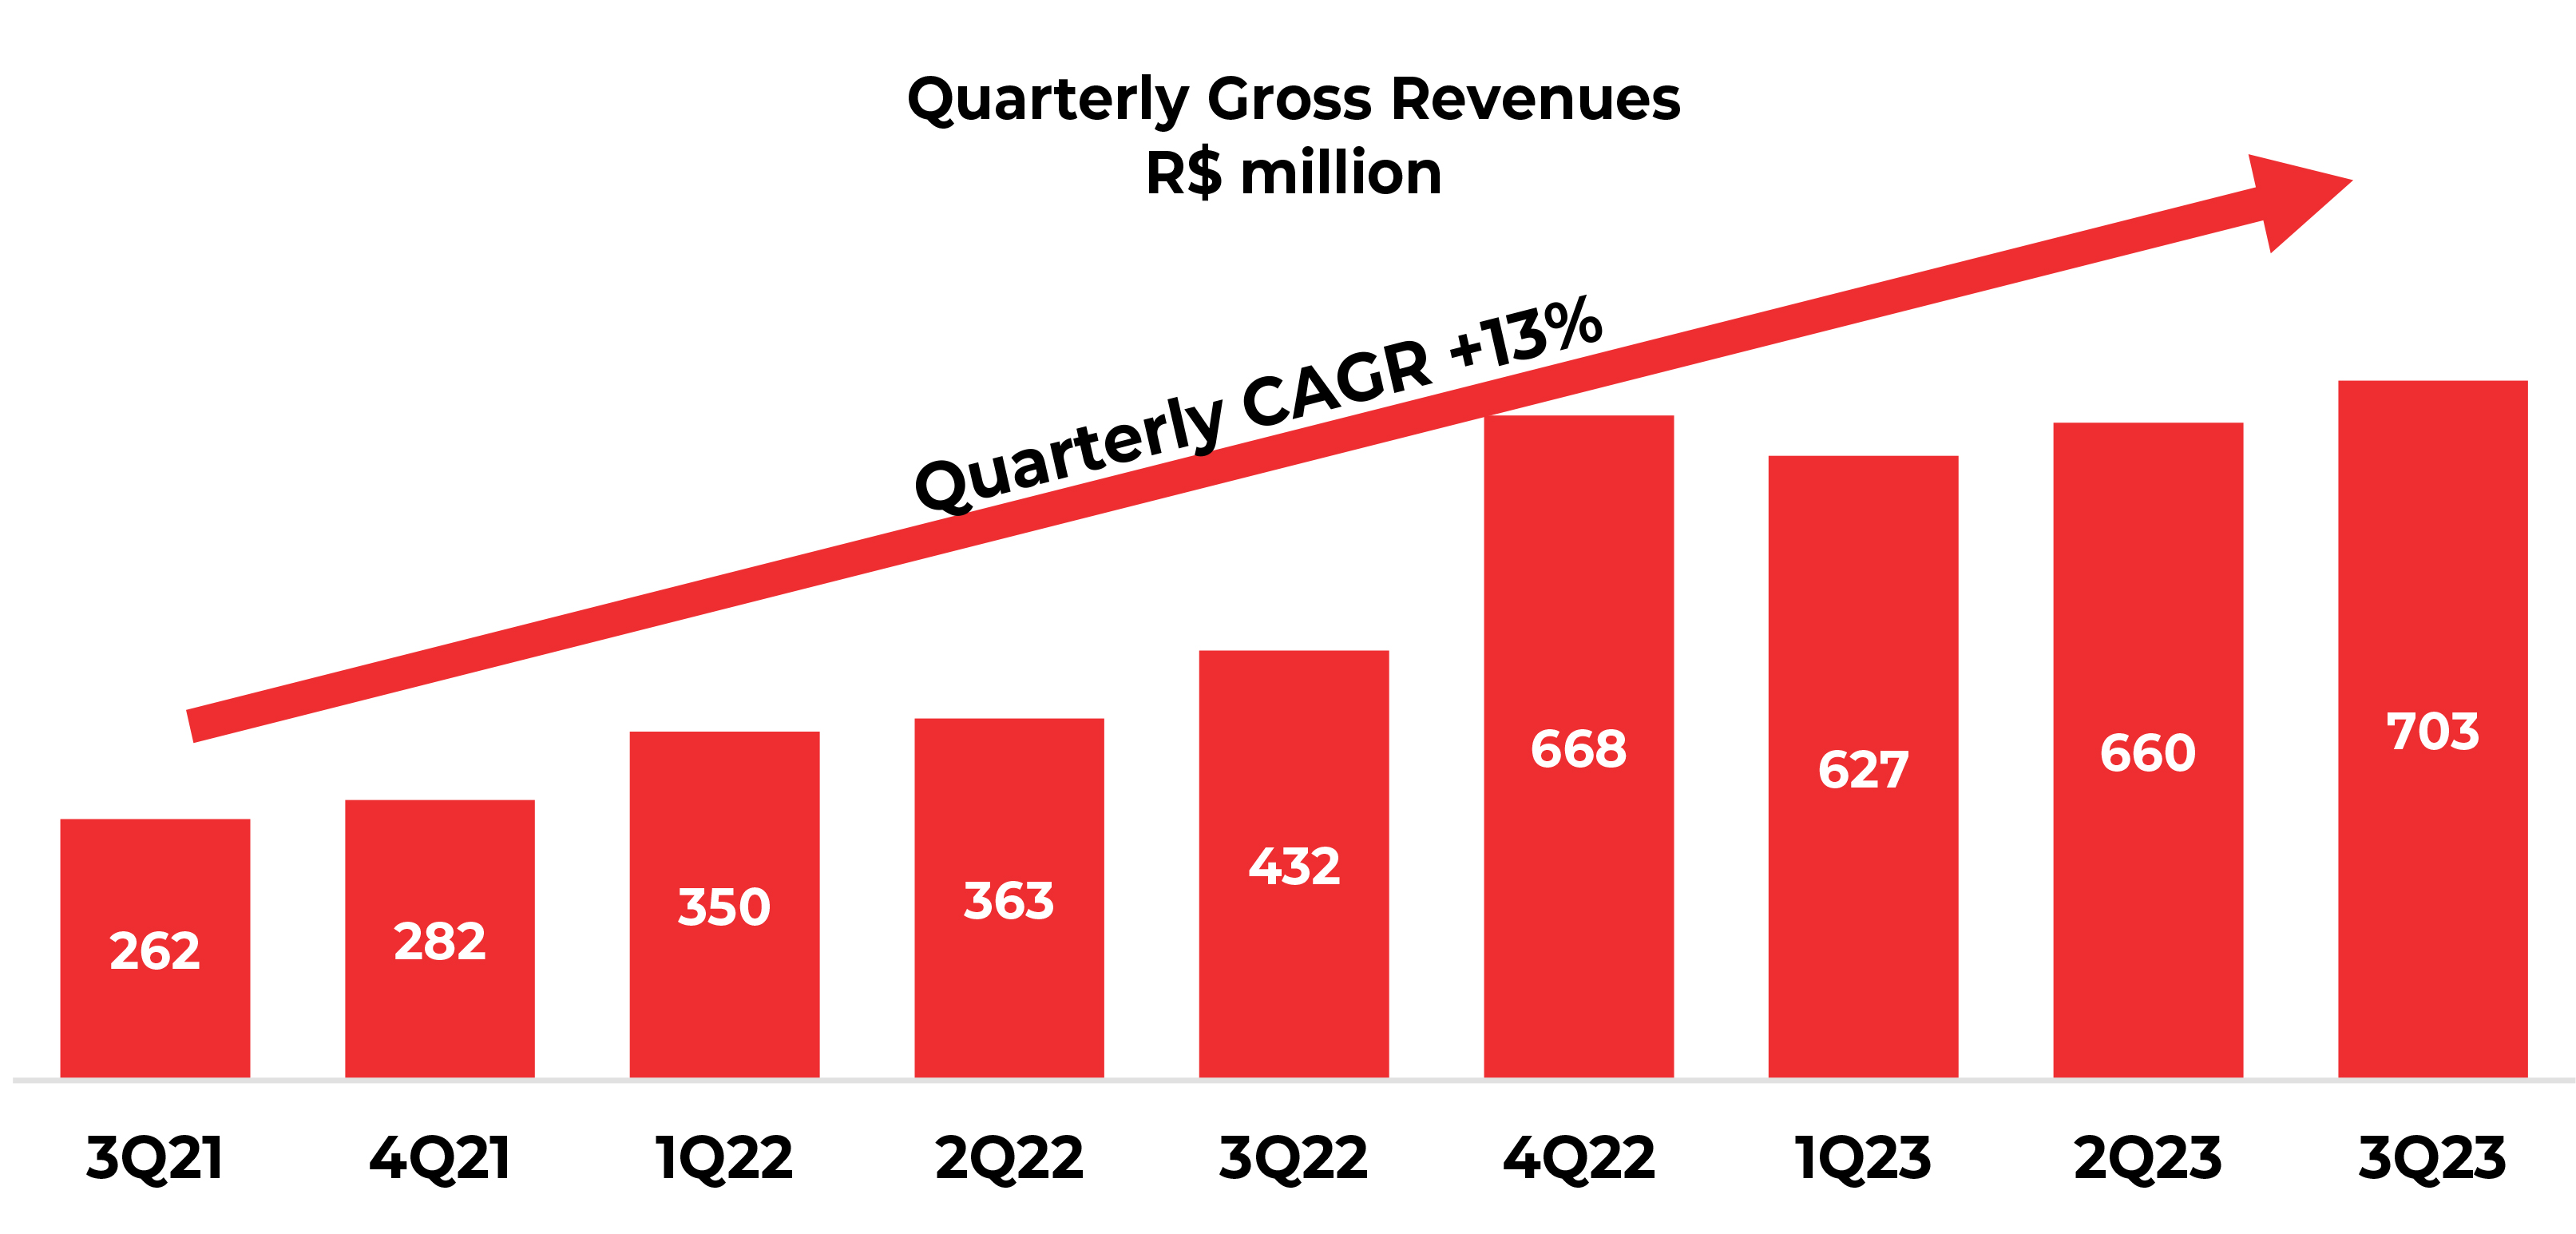
| GROSS REVENUE | 702.6 | 431.8 | 62.7% | 660.4 | 6.4% | 1,990.1 | 1,145.5 | 73.7% | ||||||||||||||||||
| DEDUCTIONS | -61.5 | -33.7 | 82.5% | -48.3 | 27.3% | -140.7 | -92.9 | 51.5% | ||||||||||||||||||
| NET REVENUE | 641.1 | 398.1 | 61.0% | 612.1 | 4.7% | 1,849.4 | 1,052.6 | 75.7% | ||||||||||||||||||
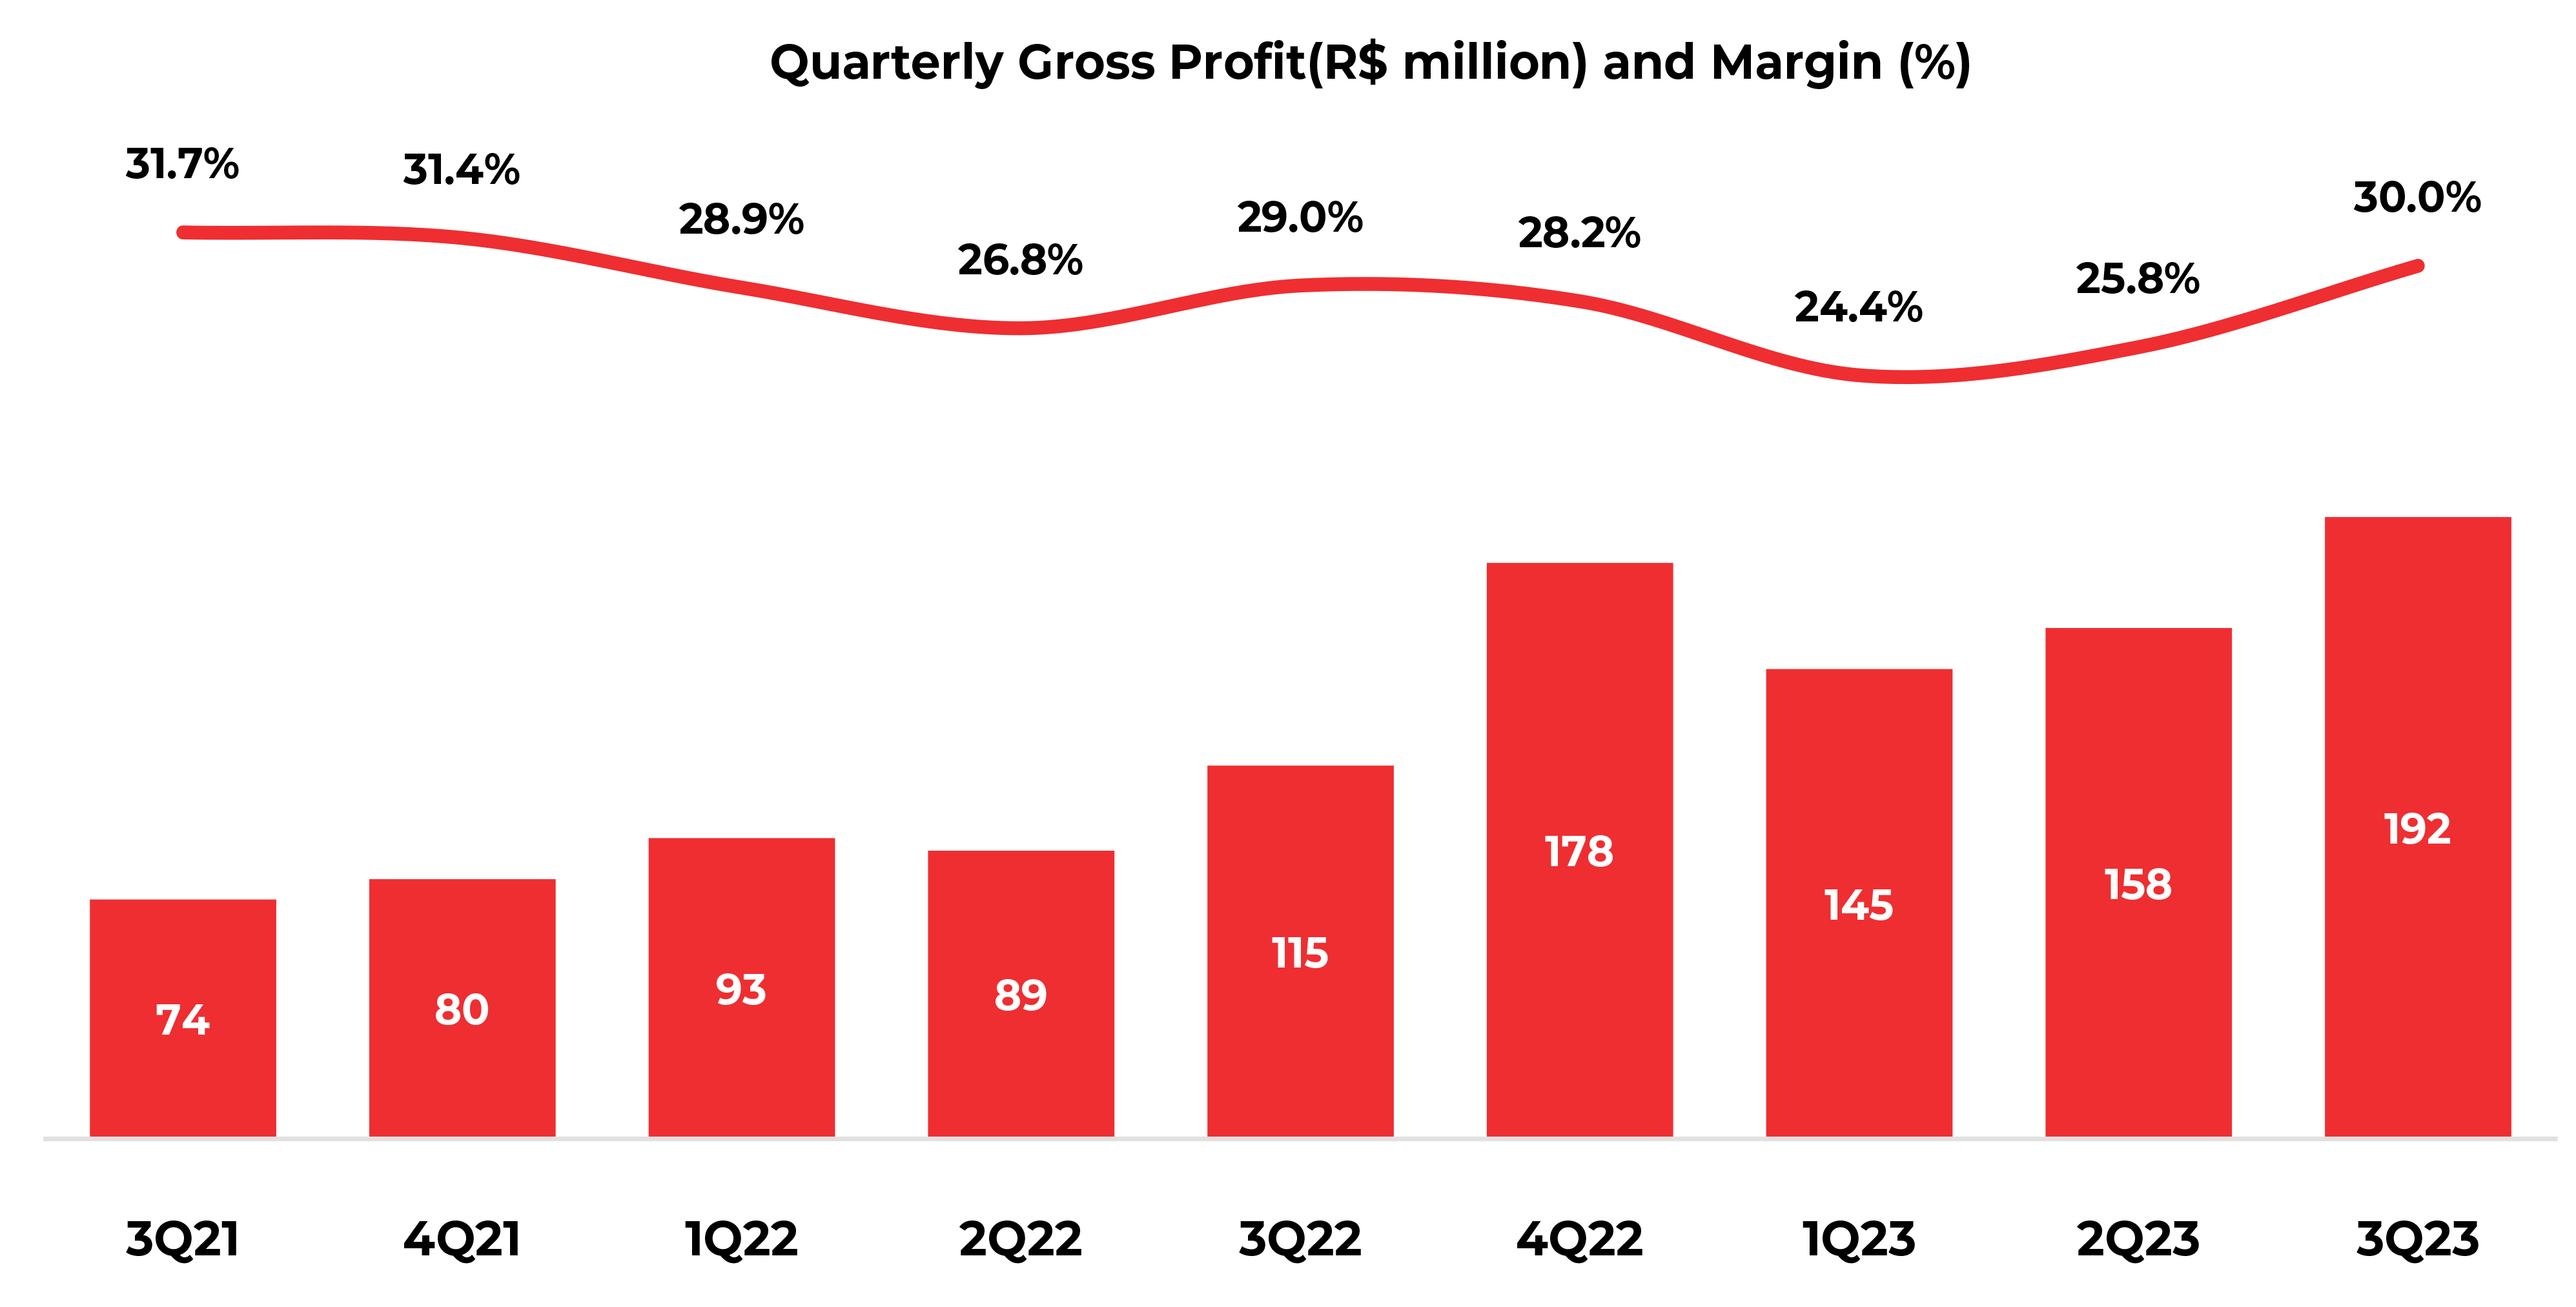
| GROSS PROFIT | 192.2 | 115.3 | 66.7% | 157.9 | 21.7% | 495.4 | 297.3 | 66.6% | ||||||||||||||||||
| GROSS MARGIN | 30.0% | 29.0% | 1.0 p.p. | 25.8% | 4.2 p.p. | 26.8% | 28.2% | -1.5 p.p. | ||||||||||||||||||
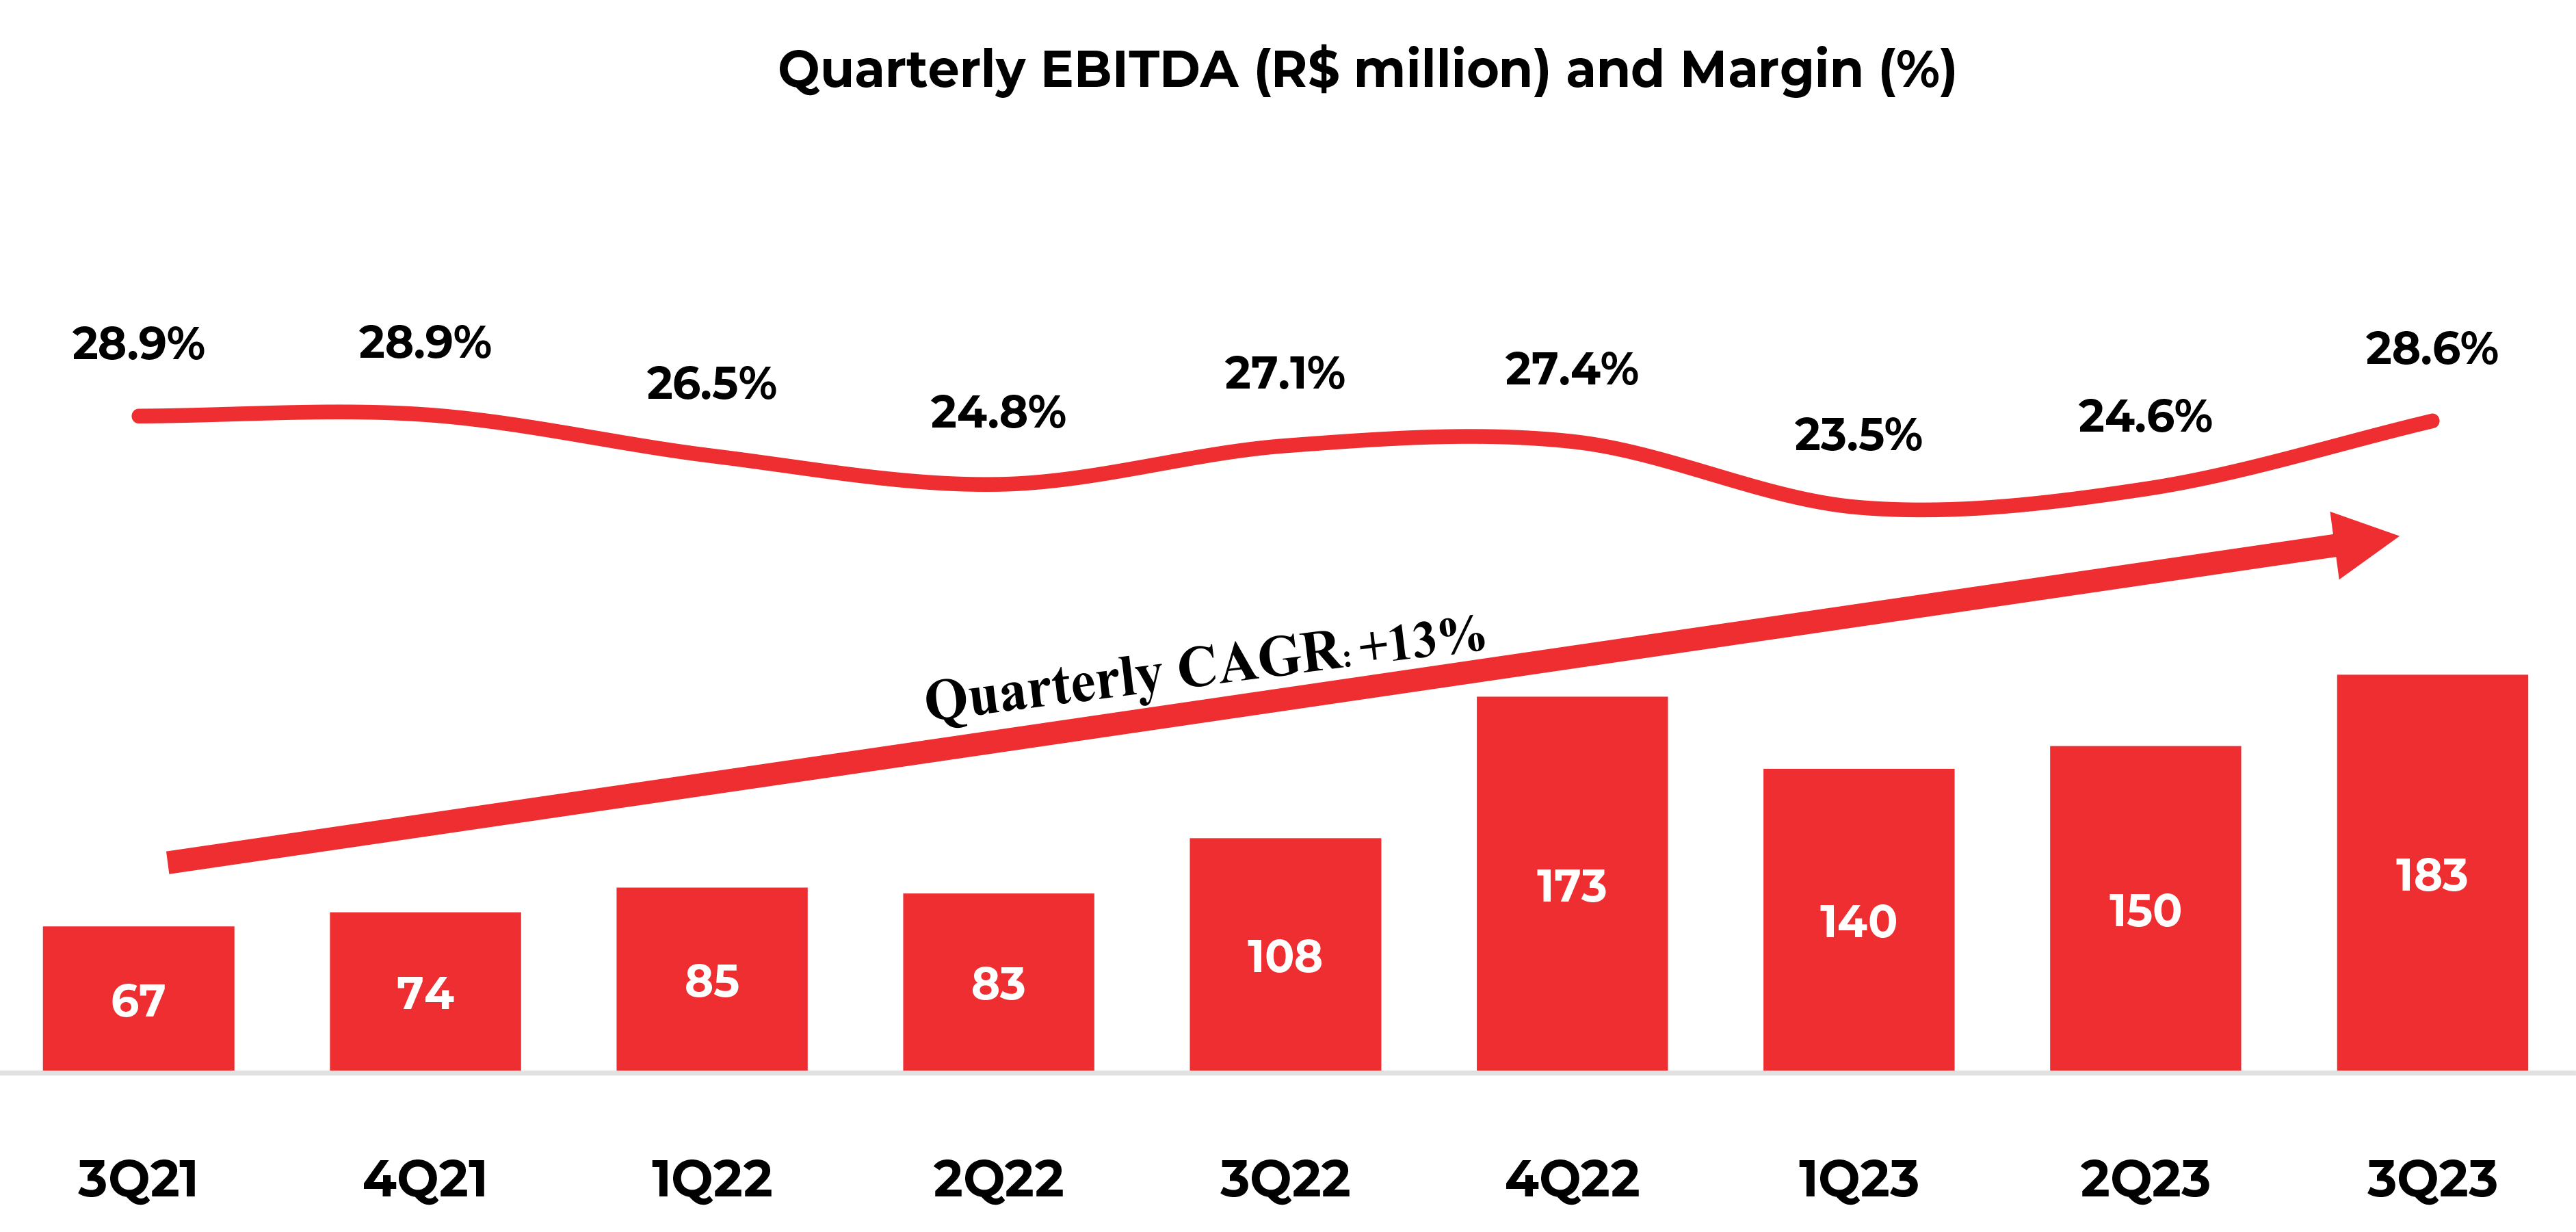
| EBITDA | 183.2 | 107.9 | 69.7% | 150.3 | 21.8% | 473.5 | 275.8 | 71.6% | ||||||||||||||||||
| EBITDA MARGIN | 28.6% | 27.1% | 1.5 p.p. | 24.6% | 4.0 p.p. | 25.6% | 26.2% | -0.6 p.p. | ||||||||||||||||||
| RESPONSE | ||||||||||||||||||||||||||||||||
| COMPOSITION OF GROSS REVENUE R$ million |
3Q21 | 4Q21 | 1Q22 | 2Q22 | 3Q22 | 4Q22 | 1Q23 | 2Q23 | 3Q23 | |||||||||||||||||||||||
| GROSS REVENUE | 262.4 | 281.5 | 350.4 | 363.3 | 431.8 | 667.8 | 627.1 | 660.4 | 702.6 | |||||||||||||||||||||||
| Brazil | 82.2 | 77.1 | 112.5 | 122.8 | 159.4 | 202.5 | 208.7 | 244.5 | 270.9 | |||||||||||||||||||||||
| International | 180.2 | 204.4 | 237.9 | 240.6 | 272.4 | 465.3 | 418.4 | 415.9 | 431.8 | |||||||||||||||||||||||
Latam (ex Brazil) |
47.7 | 50.1 | 57.9 | 58.7 | 44.1 | 50.3 | 55.8 | 54.3 | 61.7 | |||||||||||||||||||||||
Europe |
50.1 | 48.1 | 47.8 | 50.5 | 51.8 | 64.7 | 56.1 | 46.0 | 42.8 | |||||||||||||||||||||||
North America |
82.4 | 106.2 | 132.2 | 131.3 | 176.5 | 350.3 | 306.5 | 315.5 | 327.3 | |||||||||||||||||||||||
| COMPOSITION OF GROSS REVENUE R$ million |
3Q23 | 3Q22 | Chg. 3Q23 x3Q22 |
2Q23 | Chg. 3Q23 X2Q23 |
9M23 | 9M22 | Chg. 9M23 x 9M22 |
||||||||||||||||||
| RESPONSE | ||||||||||||||||||||||||||
| GROSS REVENUES | 702.6 | 431.8 | 62.7% | 660.4 | 6.4% | 1,990.1 | 1,145.5 | 73.7% | ||||||||||||||||||
| Brazil | 270.9 | 159.4 | 70.0% | 244.5 | 10.8% | 724.1 | 394.6 | 83.5% | ||||||||||||||||||
Subscriptions Brazil |
40.3 | 35.9 | 12.4% | 39.6 | 1.9% | 118.1 | 103.3 | 14.3% | ||||||||||||||||||
Services Brazil |
230.5 | 123.5 | 86.7% | 204.9 | 12.5% | 606.0 | 291.3 | 108.0% | ||||||||||||||||||
| Attended Services | 3Q22 | 4Q22 | 1Q23 | 2Q23 | 3Q23 | Chg. 3Q23 x3Q22 |
|||||||||||||||||
| Brazil | Gross Revenue (BRL Million) | 123.5 | 165.5 | 170.5 | 204.9 | 230.5 | 86.7% | ||||||||||||||||
| Number of Services Provided | 2,435 | 2,594 | 2,727 | 3,075 | 3,237 | 32.9% | |||||||||||||||||
| Average Ticket (BRL Thousand) | 50.7 | 63.8 | 62.5 | 66.6 | 71.2 | 40.4% | |||||||||||||||||
| COMPOSITION OF GROSS REVENUE R$ million |
3Q23 | 3Q22 | Chg. 3Q23 x3Q22 |
2Q23 | Chg. 3Q23 X2Q23 |
9M23 | 9M22 | Chg. 9M23 x 9M22 |
||||||||||||||||||
| RESPONSE | ||||||||||||||||||||||||||
| GROSS REVENUES | 702.6 | 431.8 | 62.7 | % | 660.4 | 6.4 | % | 1,990.1 | 1,145.5 | 73.7 | % | |||||||||||||||
| International | 431.8 | 272.4 | 58.5 | % | 415.9 | 3.8 | % | 1,266.1 | 750.8 | 68.6 | % | |||||||||||||||
| Latam (ex-Brazil) | 61.7 | 44.1 | 39.8 | % | 54.3 | 13.5 | % | 171.8 | 160.7 | 6.9 | % | |||||||||||||||
Subscriptions Latam |
35.8 | 34.6 | 3.7 | % | 34.6 | 3.6 | % | 106.5 | 100.2 | 6.3 | % | |||||||||||||||
Services Latam |
25.8 | 9.6 | 170.0 | % | 19.7 | 30.9 | % | 65.3 | 60.5 | 7.9 | % | |||||||||||||||
| Attended Services | 3Q22 | 4Q22 | 1Q23 | 2Q23 | 3Q23 | Chg. 3Q23 x3Q22 |
|||||||||||||||||
| Latam (Ex Brazil) |
Gross Revenue (BRL Million) | 9.6 | 14.8 | 19.7 | 19.7 | 25.8 | 170.0 | % | |||||||||||||||
| Number of Services Served | 80 | 104 | 95 | 90 | 102 | 27.5 | % | ||||||||||||||||
| Average Ticket (BRL Thousand) | 119.6 | 142.3 | 207.6 | 219.4 | 253.4 | 111.8 | % | ||||||||||||||||
| COMPOSITION OF GROSS REVENUE R$ million |
3Q23 | 3Q22 | Chg. 3Q23 x3Q22 |
2Q23 | Chg. 3Q23 X2Q23 |
9M23 | 9M22 | Chg. 9M23 x 9M22 |
||||||||||||||||||
| RESPONSE | ||||||||||||||||||||||||||
| GROSS REVENUES | 702.6 | 431.8 | 62.7 | % | 660.4 | 6.4 | % | 1,990.1 | 1,145.5 | 73.7 | % | |||||||||||||||
| International | 431.8 | 272.4 | 58.5 | % | 415.9 | 3.8 | % | 1,266.1 | 750.8 | 68.6 | % | |||||||||||||||
| Europe | 42.8 | 51.8 | -17.4 | % | 46.0 | -7.0 | % | 145.0 | 150.1 | -3.4 | % | |||||||||||||||
Subscriptions Europe |
4.3 | 3.7 | 16.4 | % | 4.6 | -5.4 | % | 13.7 | 11.1 | 23.6 | % | |||||||||||||||
Services Europe |
38.5 | 48.1 | -20.0 | % | 41.5 | -7.1 | % | 131.2 | 139.0 | -5.6 | % | |||||||||||||||
| Attended Services | 3Q22 | 4Q22 | 1Q23 | 2Q23 | 3Q23 | Chg. 3Q23 x3Q22 |
|||||||||||||||||
| Europe | Gross Revenue (BRL Million) | 48.1 | 60.0 | 51.3 | 41.5 | 38.5 | -20.0 | % | |||||||||||||||
| Number of Services Served | 5,922 | 5,974 | 5,947 | 5,798 | 5,854 | -1.1 | % | ||||||||||||||||
| Average Ticket (BRL Thousand) | 8.1 | 10.0 | 8.6 | 7.2 | 6.6 | -19.0 | % | ||||||||||||||||
| COMPOSITION OF GROSS REVENUE R$ million |
3Q23 | 3Q22 | Chg. 3Q23 x3Q22 |
2Q23 | Chg. 3Q23 X2Q23 |
9M23 | 9M22 | Chg. 9M23 x 9M22 |
||||||||||||||||||
| RESPONSE | ||||||||||||||||||||||||||
| GROSS REVENUES | 702.6 | 431.8 | 62.7 | % | 660.4 | 6.4 | % | 1,990.1 | 1,145.5 | 73.7 | % | |||||||||||||||
| International | 431.8 | 272.4 | 58.5 | % | 415.9 | 3.8 | % | 1,266.1 | 750.8 | 68.6 | % | |||||||||||||||
| North America | 327.3 | 176.5 | 85.5 | % | 315.5 | 3.7 | % | 949.3 | 440.0 | 115.7 | % | |||||||||||||||
| Attended Services | 3Q22 | 4Q22 | 1Q23 | 2Q23 | 3Q23 | Chg. 3Q23 x3Q22 |
|||||||||||||||||
| North America | Gross Revenue (BRL Million) | 176.5 | 350.3 | 306.5 | 315.5 | 327.3 | 85.5 | % | |||||||||||||||
| Number of Services Served | 2,991 | 3,117 | 3,228 | 3,660 | 3,751 | 25.4 | % | ||||||||||||||||
| Average Ticket (BRL Thousand) | 59.0 | 112.4 | 95.0 | 86.2 | 87.2 | 47.9 | % | ||||||||||||||||
| R$ million | 3Q23 | 3Q22 | Chg. | 2Q23 | Chg. | 9M23 | 9M22 | Chg. | ||||||||||||||||||
| Gross Revenues | 702.6 | 431.8 | 62.7 | % | 660.4 | 6.4 | % | 1,990.1 | 1,145.5 | 73.7 | % | |||||||||||||||
| Deductions | -61.5 | -33.7 | 82.5 | % | -48.3 | 27.3 | % | -140.7 | -92.9 | 51.5 | % | |||||||||||||||
| Net Revenues | 641.1 | 398.1 | 61.0 | % | 612.1 | 4.7 | % | 1,849.4 | 1,052.6 | 75.7 | % | |||||||||||||||
| % Deductions / Gross Revenues | -8.8 | % | -7.8 | % | -1.0 p.p. | -7.3 | % | -1.4 p.p. | -7.1 | % | -8.1 | % | 1.0 p.p. | |||||||||||||
| RESPONSE | |||||||||||||||||||||||||||||
COST OF SERVICES R$ million |
3Q23 | 3Q22 | Chg. | 2Q23 | Chg. | 9M23 | 9M22 | Chg. | |||||||||||||||||||||
| Personnel | 260.0 | 137.7 | 88.8% | 253.4 | 2.6% | 751.1 | 375.9 | 99.8% | |||||||||||||||||||||
| Third parties | 102.7 | 45.1 | 127.9% | 92.2 | 11.5% | 283.7 | 141.4 | 100.6% | |||||||||||||||||||||
| Maintenance | 22.7 | 15.5 | 46.2% | 24.7 | -8.3% | 67.2 | 30.2 | 122.7% | |||||||||||||||||||||
| Travel | 19.7 | 6.7 | 192.1% | 19.2 | 2.7% | 56.1 | 16.0 | 250.8% | |||||||||||||||||||||
| Freight | 1.2 | 1.3 | -6.9% | 0.8 | 53.3% | 3.5 | 3.6 | -4.2% | |||||||||||||||||||||
| Rentals | -21.2 | 3.3 | N.M. | 11.7 | N.M. | 1.3 | 22.4 | -94.4% | |||||||||||||||||||||
| Fuel | 16.1 | 19.8 | -18.4% | 12.8 | 26.4% | 41.5 | 50.7 | -18.1% | |||||||||||||||||||||
| Materials | 4.6 | 10.4 | -56.0% | 5.2 | -11.5% | 17.7 | 17.1 | 2.9% | |||||||||||||||||||||
| Telecommunications | 3.7 | 1.0 | 262.1% | 2.9 | 29.1% | 10.2 | 2.2 | 358.4% | |||||||||||||||||||||
| Marketing | 4.6 | 5.5 | -15.5% | 5.3 | -12.6% | 13.0 | 6.7 | 94.0% | |||||||||||||||||||||
| Taxes | 1.1 | 5.9 | -82.3% | 4.2 | -75.1% | 16.1 | 21.5 | -25.1% | |||||||||||||||||||||
| Others | 33.6 | 30.5 | 10.2% | 21.9 | 53.8% | 92.8 | 67.5 | 37.3% | |||||||||||||||||||||
| TOTAL | 448.8 | 282.8 | 58.7% | 454.1 | -1.2% | 1,354.0 | 755.3 | 79.3% | |||||||||||||||||||||
| RESPONSE | |||||||||||||||||||||||||||||
| COST OF SERVICES R$ million | 3Q21 | 4Q21 | 1Q22 | 2Q22 | 3Q22 | 4Q22 | 1Q23 | 2Q23 | 3Q23 | ||||||||||||||||||||
| Net Revenue | 233.4 | 255.6 | 321.9 | 332.6 | 398.1 | 632.3 | 596.3 | 612.1 | 641.1 | ||||||||||||||||||||
| Personnel | 91.3 | 96.4 | 118.0 | 120.2 | 137.7 | 271.5 | 237.6 | 253.4 | 260.0 | ||||||||||||||||||||
| Third parties | 28.8 | 27.7 | 46.8 | 49.5 | 45.1 | 69.0 | 88.8 | 92.2 | 102.7 | ||||||||||||||||||||
| Maintenance | 4.5 | 6.2 | 6.6 | 8.1 | 15.5 | 27.8 | 19.8 | 24.7 | 22.7 | ||||||||||||||||||||
| Travel | 3.8 | 4.3 | 4.6 | 4.6 | 6.7 | 17.2 | 17.2 | 19.2 | 19.7 | ||||||||||||||||||||
| Freight | 0.8 | 0.9 | 1.1 | 1.2 | 1.3 | 13.4 | 1.5 | 0.8 | 1.2 | ||||||||||||||||||||
| Rentals | 7.2 | 7.1 | 9.6 | 9.5 | 3.3 | 8.6 | 10.7 | 11.7 | -21.2 | ||||||||||||||||||||
| Fuel | 6.6 | 9.0 | 12.2 | 18.7 | 19.8 | 7.5 | 12.6 | 12.8 | 16.1 | ||||||||||||||||||||
| Materials | 3.2 | 3.5 | 3.3 | 3.5 | 10.4 | 5.2 | 7.9 | 5.2 | 4.6 | ||||||||||||||||||||
| Telecommunications | 0.5 | 0.7 | 0.7 | 0.6 | 1.0 | 4.2 | 3.7 | 2.9 | 3.7 | ||||||||||||||||||||
| Marketing | 0.3 | 1.5 | 0.5 | 0.7 | 5.5 | 4.1 | 3.1 | 5.3 | 4.6 | ||||||||||||||||||||
| Taxes | 3.6 | 3.7 | 9.3 | 6.2 | 5.9 | -1.3 | 10.8 | 4.2 | 1.1 | ||||||||||||||||||||
| Others | 9.0 | 14.4 | 16.3 | 20.8 | 30.5 | 27.0 | 37.3 | 21.9 | 33.6 | ||||||||||||||||||||
| Total | 159.4 | 175.3 | 229.0 | 243.6 | 282.8 | 454.2 | 451.0 | 454.1 | 448.8 | ||||||||||||||||||||
| RESPONSE | |||||||||||||||||||||||||||||
| COST OF SERVICES R$ million | 3Q21 | 4Q21 | 1Q22 | 2Q22 | 3Q22 | 4Q22 | 1Q23 | 2Q23 | 3Q23 | ||||||||||||||||||||
| Net Revenue | 233.4 | 255.6 | 321.9 | 332.6 | 398.1 | 632.3 | 596.3 | 612.1 | 641.1 | ||||||||||||||||||||
| Personnel | 39.1% | 37.7% | 36.7% | 36.1% | 34.6% | 42.9% | 39.9% | 41.4% | 40.6% | ||||||||||||||||||||
| Third parties | 12.4% | 10.9% | 14.5% | 14.9% | 11.3% | 10.9% | 14.9% | 15.1% | 16.0% | ||||||||||||||||||||
| Maintenance | 1.9% | 2.4% | 2.1% | 2.4% | 3.9% | 4.4% | 3.3% | 4.0% | 3.5% | ||||||||||||||||||||
| Travel | 1.6% | 1.7% | 1.4% | 1.4% | 1.7% | 2.7% | 2.9% | 3.1% | 3.1% | ||||||||||||||||||||
| Freight | 0.3% | 0.3% | 0.4% | 0.3% | 0.3% | 2.1% | 0.2% | 0.1% | 0.2% | ||||||||||||||||||||
| Rentals | 3.1% | 2.8% | 3.0% | 2.9% | 0.8% | 1.4% | 1.8% | 1.9% | -3.3% | ||||||||||||||||||||
| Fuel | 2.8% | 3.5% | 3.8% | 5.6% | 5.0% | 1.2% | 2.1% | 2.1% | 2.5% | ||||||||||||||||||||
| Materials | 1.3% | 1.4% | 1.0% | 1.1% | 2.6% | 0.8% | 1.3% | 0.8% | 0.7% | ||||||||||||||||||||
| Telecommunications | 0.2% | 0.3% | 0.2% | 0.2% | 0.3% | 0.7% | 0.6% | 0.5% | 0.6% | ||||||||||||||||||||
| Marketing | 0.1% | 0.6% | 0.2% | 0.2% | 1.4% | 0.6% | 0.5% | 0.9% | 0.7% | ||||||||||||||||||||
| Taxes | 1.5% | 1.4% | 2.9% | 1.9% | 1.5% | -0.2% | 1.8% | 0.7% | 0.2% | ||||||||||||||||||||
| Others | 3.9% | 5.6% | 5.1% | 6.2% | 7.7% | 4.3% | 6.3% | 3.6% | 5.2% | ||||||||||||||||||||
| Total | 68.3% | 68.6% | 71.1% | 73.2% | 71.0% | 71.8% | 75.6% | 74.2% | 70.0% | ||||||||||||||||||||
| Gross Margin | 31.7% | 31.4% | 28.9% | 26.8% | 29.0% | 28.2% | 24.4% | 25.8% | 30.0% | ||||||||||||||||||||
| R$ million | 3Q23 | 3Q22 | Var. | 2Q23 | Var. | 9M23 | 9M22 | Var. | ||||||||||||||||||
| Financial Results | -42.4 | -36.6 | 16.0% | -50.9 | -16.7% | -123.0 | -59.9 | 105.5% | ||||||||||||||||||
| Financial Expenses | -52.8 | -37.3 | 41.5% | -48.9 | 8.0% | -149.8 | -66.2 | 126.3% | ||||||||||||||||||
| Financial Income | 10.4 | 0.7 | 1,304.3% | -2.0 | N.M | 26.8 | 6.4 | 322.2% | ||||||||||||||||||
| R$ million | 3Q23 | 3Q22 | Var. | 2Q23 | Var. | 9M23 | 9M22 | Var. | ||||||||||||||||||
| Net Income | 53.7 | 35.0 | 53.2% | 47.1 | 14.0% | 33.2 | 117.4 | -71.8% | ||||||||||||||||||
| Net Margin | 8.4% | 8.8% | -0.4 p.p. | 7.7% | 0.7 p.p. | 1.8% | 11.2% | -9.4 p.p. | ||||||||||||||||||
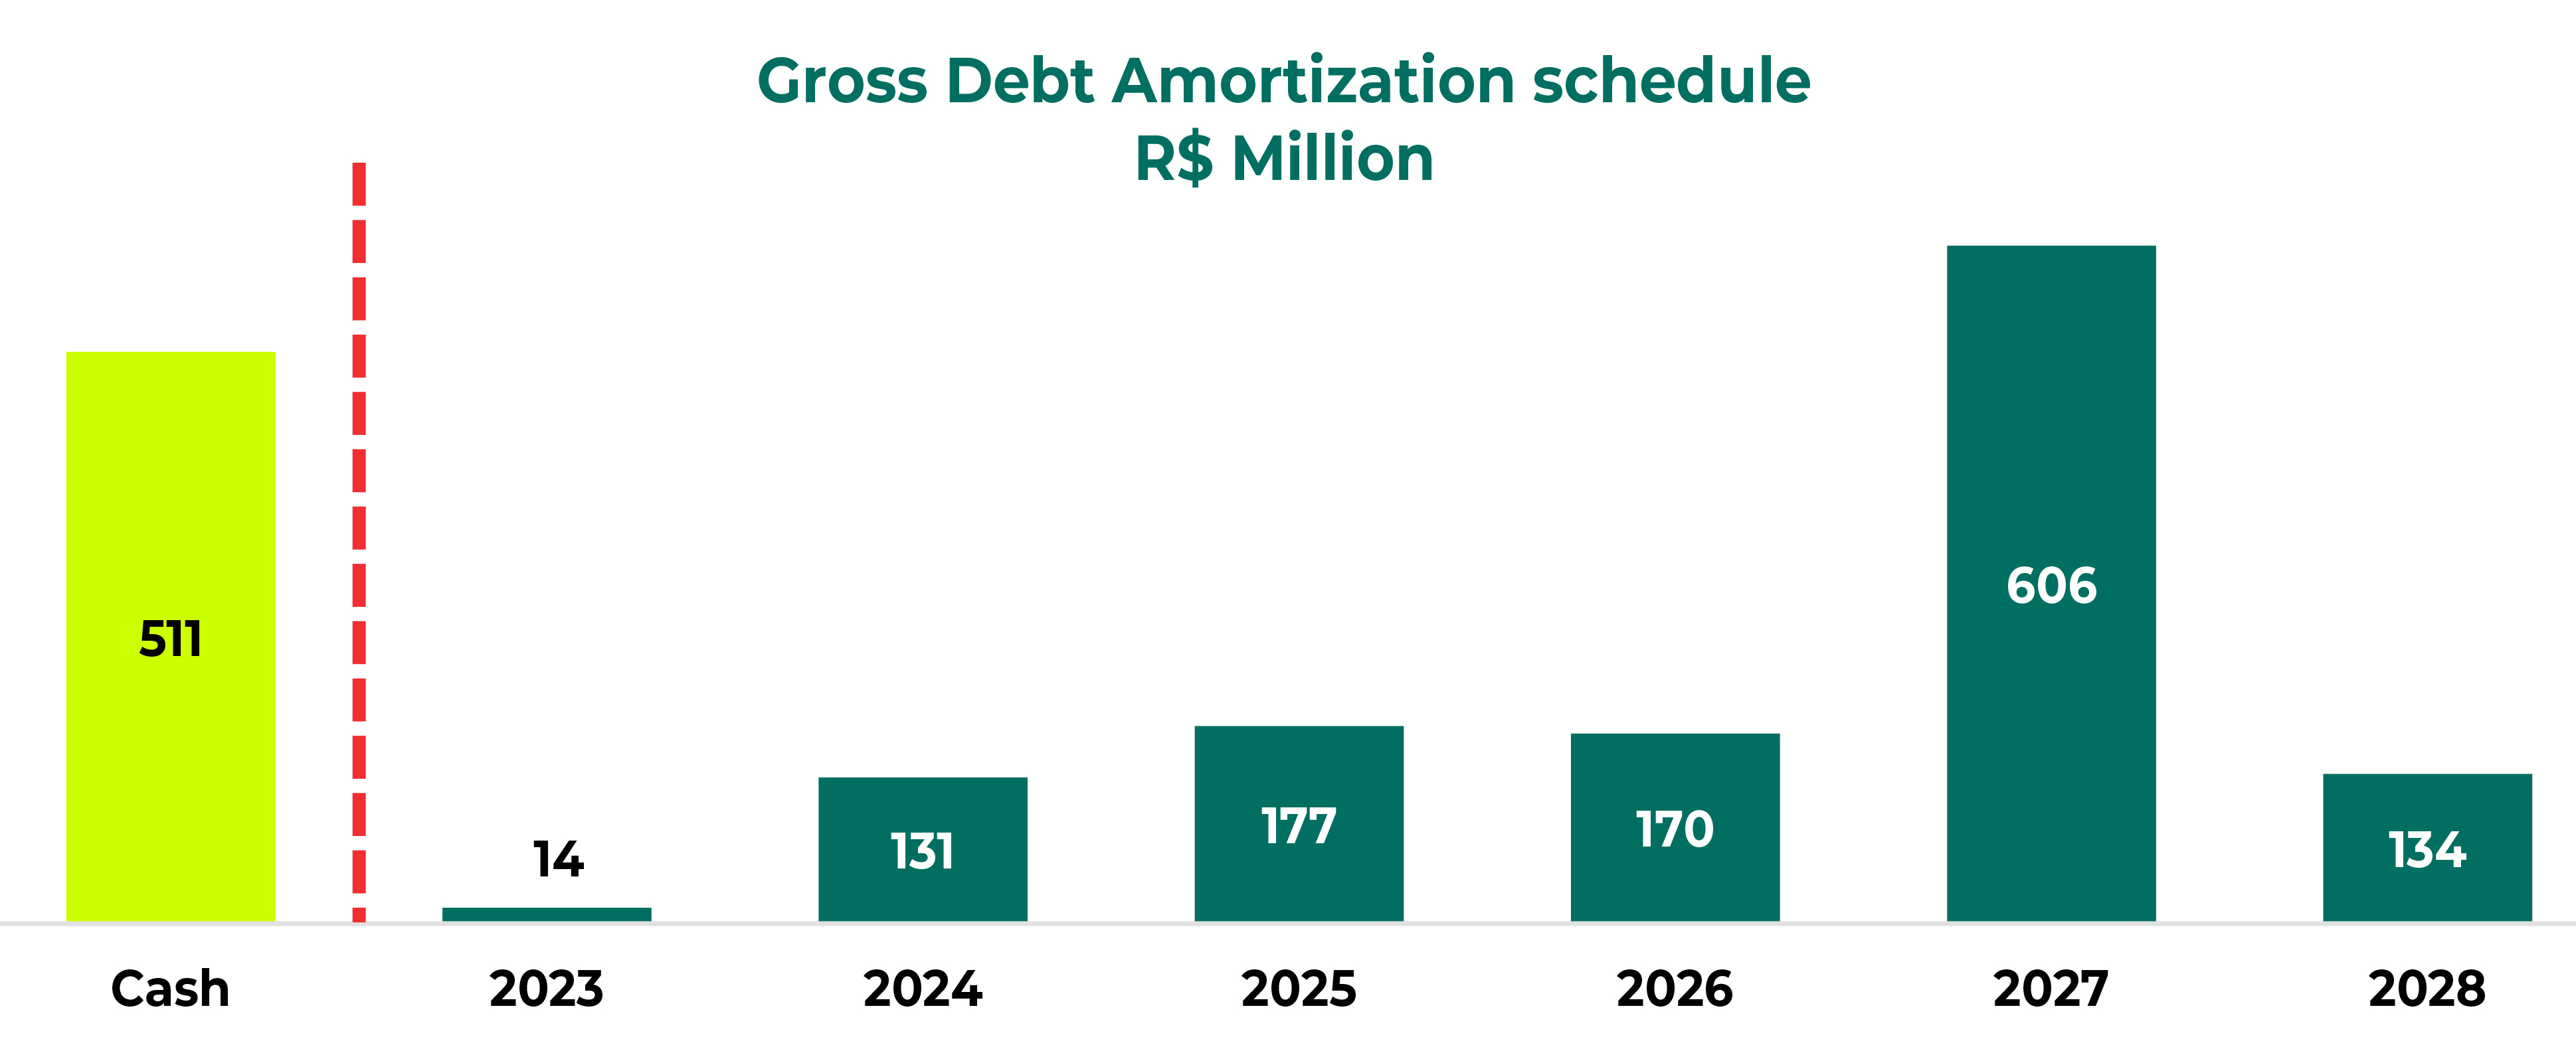
| R$ Million | 3Q23 | 4Q22 | ||||||
| Short Term | 114.4 | 151.8 | ||||||
Loans and financing |
56.8 | 67.7 | ||||||
Debentures |
57.6 | 84.2 | ||||||
| Long Term | 1,079.5 | 1,166.3 | ||||||
Loans and financing |
614.0 | 649.8 | ||||||
Debentures |
465.5 | 516.5 | ||||||
| Short Term | 10% | 12% | ||||||
| Long Term | 90% | 88% | ||||||
| Financial Gross Debt | 1,194.0 | 1,318.1 | ||||||
| Related Parties | 634.4 | 769.8 | ||||||
| Total Gross Debt | 1,828.3 | 2,087.9 | ||||||
| Financial Gross Debt R$ Million | Financial charges - % p.a. | Maturity | 3Q23 | 4Q22 | ||||||||||
| Working capital | 2.17%+CDI and 6.36% | August 2027 | 531.0 | 597.7 | ||||||||||
| Investment financing | 15.05% | June 2033 | 93.2 | 108.7 | ||||||||||
| Financial leases liabilities | 5.34% | September 2027 | 46.7 | 11.0 | ||||||||||
| Debentures | CDI + 2.65% and 3.5% | September 2028 | 523.2 | 600.7 | ||||||||||
| Total | 1,194.0 | 1,318.1 | ||||||||||||
| R$ Million | 3Q23 | 4Q22 | ||||||
| Financial Gross Debt | 1,194.0 | 1,318.1 | ||||||
| (-) Cash and equivalents | 510.9 | 271.6 | ||||||
| (=) Financial Net Debt based on Covenants criteria | 683.1 | 1,046.5 | ||||||
| Pro forma annualized EBITDA¹ | 732.7 | 691.9 | ||||||
| Financial Leverage (x) | 0.93 | 1.51 | ||||||
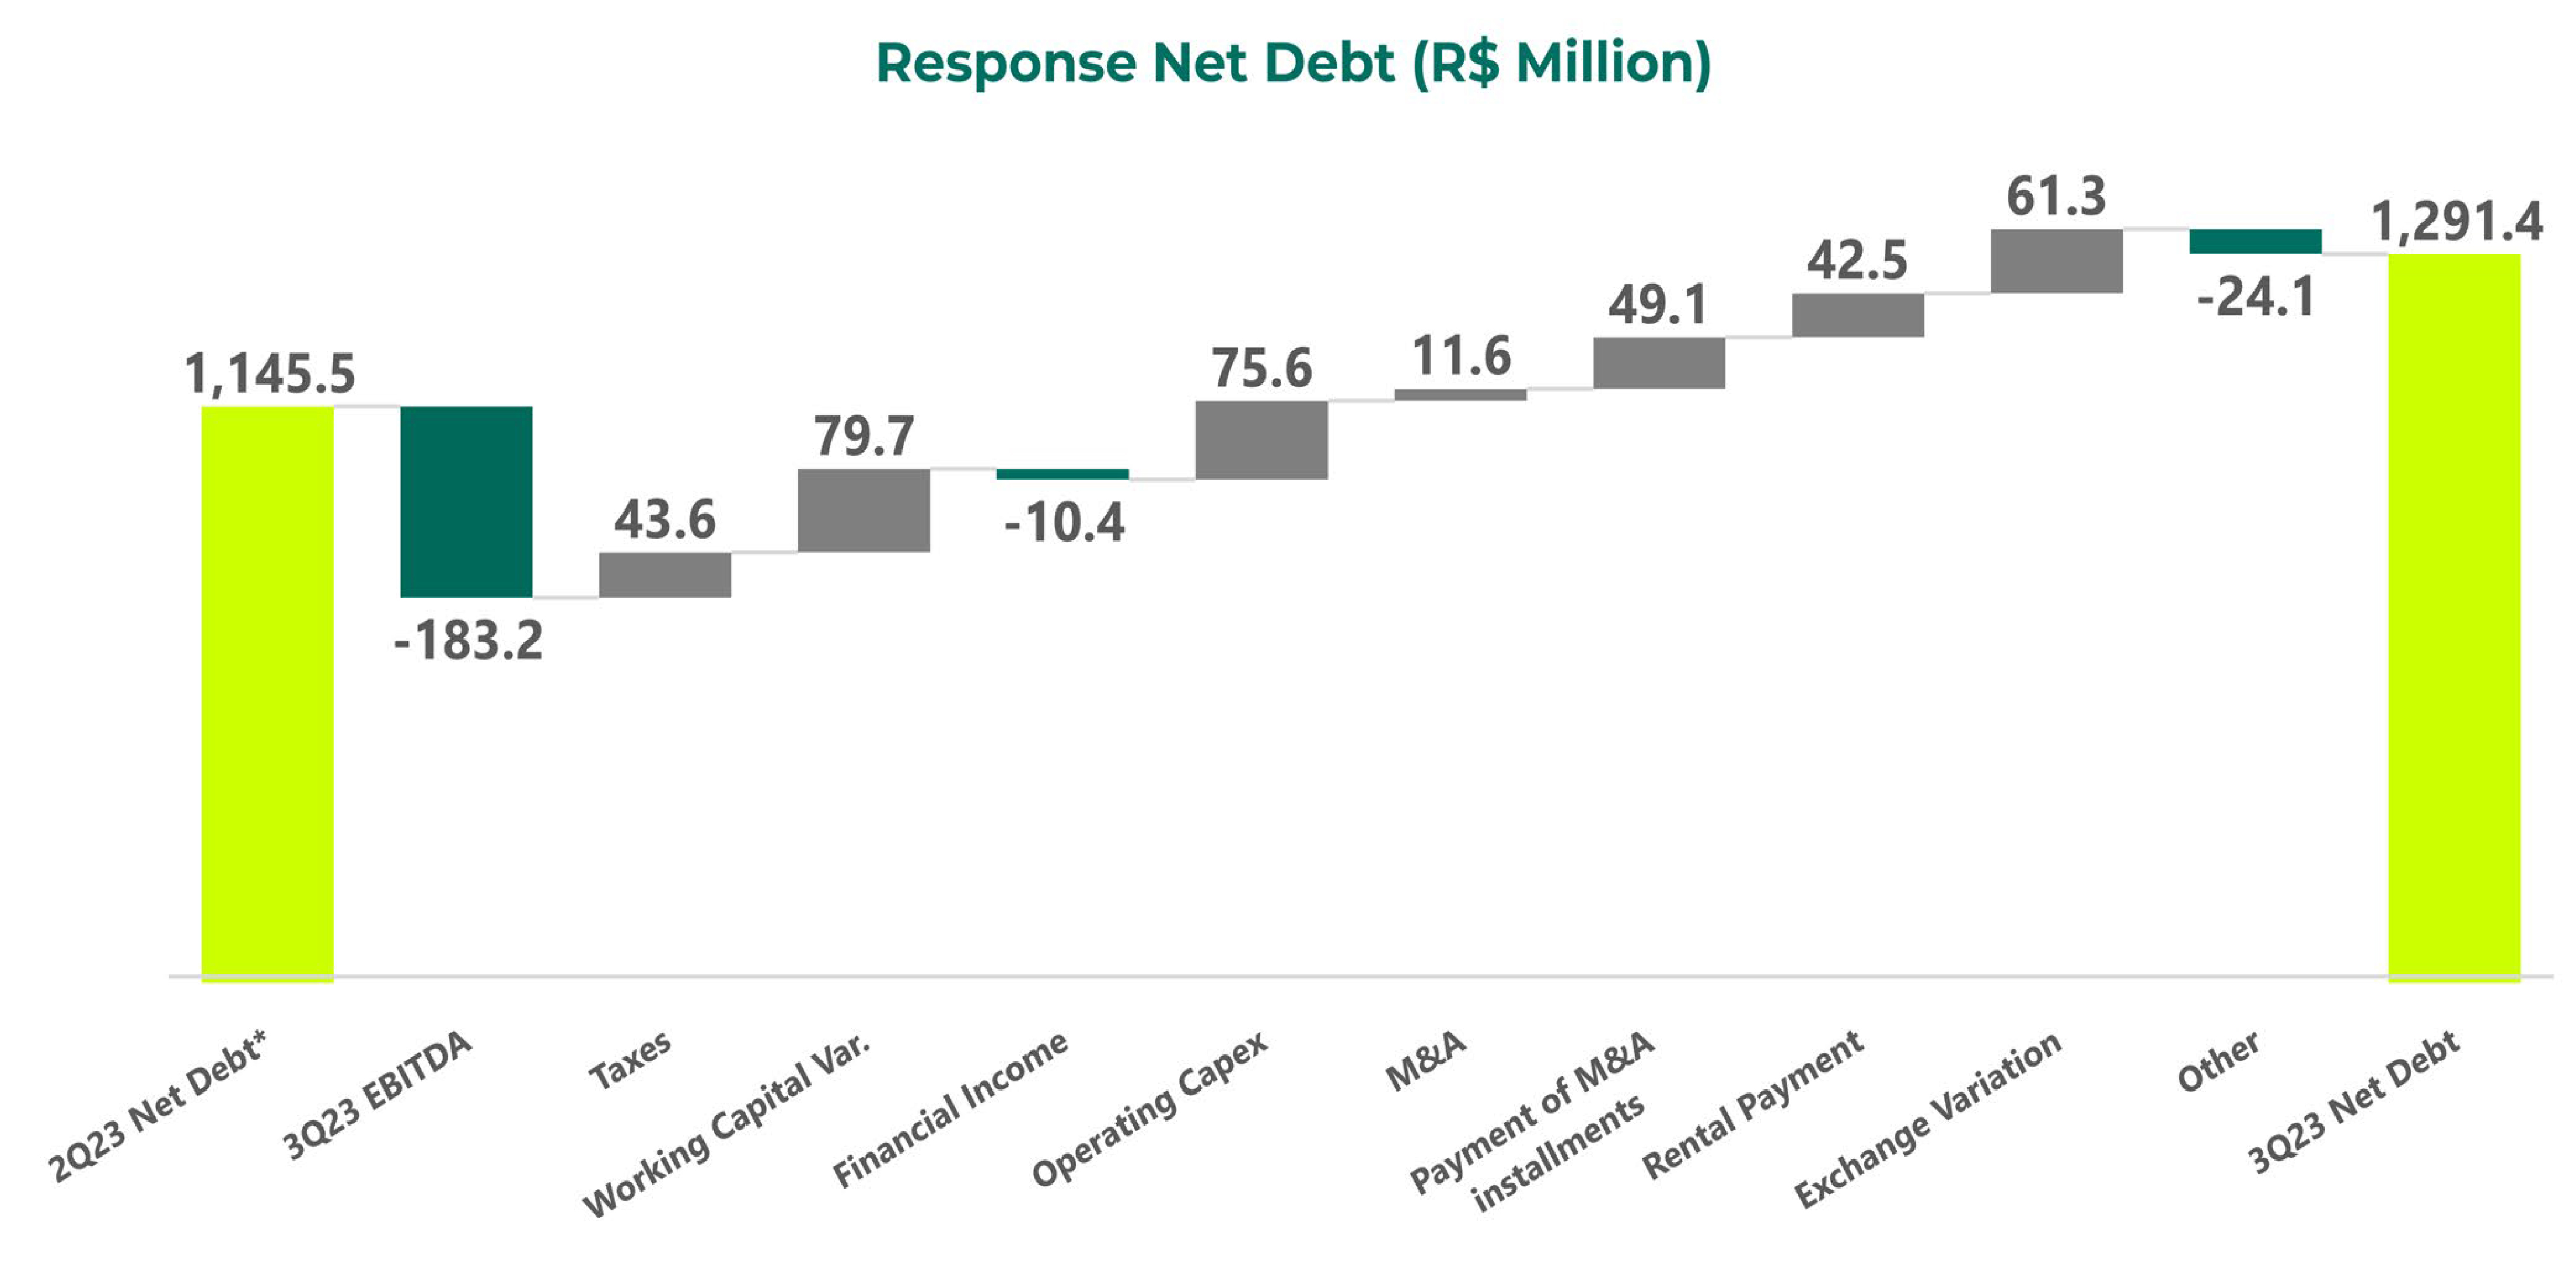
| (=) Net Debt Including Related Parties² | 1,291.4 | 1,790.1 | ||||||
| Pro forma annualized EBITDA¹ | 732.7 | 691.9 | ||||||
| Financial Leverage (x) | 1.76 | 2.59 | ||||||
| BRL million | 3Q23 LTM | 4Q22 LTM | Chg. 3Q23 LTM x 4Q22 LTM |
||||||||
| (+) EBIT | 486.9 | 336.8 | 44.6% | ||||||||
| (-) Tax¹ | -146.1 | -101.0 | 44.6% | ||||||||
| NOPAT | 340.8 | 235.7 | 44.6% | ||||||||
| (+) Average Shareholders' Equity | 916.4 | 385.1 | 138.0% | ||||||||
| (+) Average Net Debt | 1,249.8 | 907.8 | 37.7% | ||||||||
| Average Invested Capital | 2,166.1 | 1,292.9 | 67.5% | ||||||||
| (-) Average Intangible | 1,457.2 | 907.5 | 60.6% | ||||||||
| Average Invested Capital ex Intangible | 708.9 | 385.4 | 83.9% | ||||||||
| Operational ROIC² (%) | 48.1% | 61.2% | -13.1 p.p. | ||||||||
| ROIC (%) | 15.7% | 18.2% | -2.5 p.p. | ||||||||
| Additions to Fixed Assets R$ million |
3Q23 | 3Q22 | Chg. 3Q23 x3Q22 |
2Q23 | Chg. 3Q23 x 2Q23 |
9M23 | 9M22 | Chg. 9M23 x 9M22 |
||||||||||||||||||||||||||||||||||||||||||
(+) Response |
75.6 | 69.9 | 8.1% | 41.9 | 80.2% | 186.5 | 160.8 | 16.0% | ||||||||||||||||||||||||||||||||||||||||||
(+) Brazil |
45.4 | 52.3 | -13.2% | 11.6 | 292.2% | 100.8 | 111.1 | -9.3% | ||||||||||||||||||||||||||||||||||||||||||
(+) LATAM (ex-Brazil) |
15.8 | 0.7 | 2052.6% | 19.8 | -20.3% | 36.7 | 2.7 | 1262.8% | ||||||||||||||||||||||||||||||||||||||||||
(+) Europe |
1.4 | 2.4 | -44.2% | 1.8 | -26.4% | 5.0 | 6.1 | -17.3% | ||||||||||||||||||||||||||||||||||||||||||
(+) North America |
13.1 | 14.4 | -9.4% | 8.7 | 49.4% | 44.0 | 40.9 | 7.6% | ||||||||||||||||||||||||||||||||||||||||||
| Additions to Fixed Assets R$ million |
3Q21 | 4Q21 | 1Q22 | 2Q22 | 3Q22 | 4Q22 | 1Q23 | 2Q23 | 3Q23 | |||||||||||||||||||||||||||||||||||||||||
(+) Response |
46.2 | 12.9 | 64.8 | 26.1 | 69.9 | 72.5 | 69.0 | 41.9 | 75.6 | |||||||||||||||||||||||||||||||||||||||||
(+) Brazil |
32.5 | 7.1 | 49.9 | 8.9 | 52.3 | 37.9 | 43.8 | 11.6 | 45.4 | |||||||||||||||||||||||||||||||||||||||||
(+) LATAM (ex-Brazil) |
2.0 | 2.1 | 0.0 | 1.9 | 0.7 | 4.0 | 1.1 | 19.8 | 15.8 | |||||||||||||||||||||||||||||||||||||||||
(+) Europe |
2.6 | 2.8 | 3.2 | 0.5 | 2.4 | 2.1 | 1.8 | 1.8 | 1.4 | |||||||||||||||||||||||||||||||||||||||||
(+) North America |
9.2 | 0.9 | 11.8 | 14.7 | 14.4 | 28.5 | 22.2 | 8.7 | 13.1 | |||||||||||||||||||||||||||||||||||||||||
| 3Q23 | 9M23 | |||||||||||||
| Expansion and Maintenance Capex |
Capex
(R$ Million)
|
% Group Revenue |
Capex
(R$ Million)
|
% Group Revenue | ||||||||||
RESPONSE - Service Expansion |
39.6 | 3.4% | 101.9 | 2.9% | ||||||||||
Response Brazil |
23.9 | 2.0% | 55.8 | 1.6% | ||||||||||
Response Latam (Ex. Brazil) |
15.7 | 1.3% | 34.3 | 1.0% | ||||||||||
Response Europe |
0.0 | 0.0% | 0.3 | 0.0% | ||||||||||
Response North America |
0.0 | 0.0% | 11.5 | 0.3% | ||||||||||
RESPONSE - Service Maintenance |
36.0 | 3.0% | 84.8 | 2.4% | ||||||||||
Response Brazil |
21.5 | 1.8% | 45.1 | 1.3% | ||||||||||
Response Latam (Ex. Brazil) |
0.0 | 0.0% | 2.3 | 0.1% | ||||||||||
Response Europe |
1.4 | 0.1% | 4.8 | 0.1% | ||||||||||
Response North America |
13.1 | 1.1% | 32.5 | 0.9% | ||||||||||
| ASSETS BRL thousand |
09/30/2023 | 12/31/2022 | ||||||
| Cash and cash equivalents | 510,919 | 271,607 | ||||||
| Trade and other receivables | 795,622 | 711,892 | ||||||
| Current income tax and social contribution recoverable |
7,493 | 6,388 | ||||||
| Other taxes recoverable | 50,718 | 29,740 | ||||||
| Prepaid expenses | 33,526 | 37,806 | ||||||
| Advances to suppliers | 54,989 | 29,864 | ||||||
| Inventories | 35,677 | 18,128 | ||||||
| Dividends Receivable | – | – | ||||||
| Other accounts equivalents | 49,345 | 36,498 | ||||||
| Total current assets | 1,538,289 | 1,141,923 | ||||||
| Related parties loans | 26,025 | 26,180 | ||||||
| Non-current income tax and social contribuition recoverable | 2,854 | 2,854 | ||||||
| Non-current other taxes recoverable | 847 | 392 | ||||||
| Deferred taxes | 23,824 | 25,420 | ||||||
| Judicial deposits | 895 | 826 | ||||||
| Other accounts receivable | 33,295 | 37,599 | ||||||
| Investments | - | 7,620 | ||||||
| Property, plant and equipment | 692,552 | 516,081 | ||||||
| Right of use | 70,248 | 68,275 | ||||||
| Goodwill | 1,272,435 | 1,192,302 | ||||||
| Intangible assets | 376,868 | 420,197 | ||||||
| Total Non-current assets | 2,499,843 | 2,297,746 | ||||||
| Total assets | 4,038,132 | 3,439,669 | ||||||
| LIABILITIES AND SHAREHOLDERS EQUITY BRL thousand | 09/30/2023 | 12/31/2022 | ||||||
| Loans and financing | 56,819 | 67,656 | ||||||
| Debentures | 57,622 | 84,187 | ||||||
| Trade and other payables | 146,309 | 155,523 | ||||||
| Labor obligations | 89,151 | 114,941 | ||||||
| Dividends Payable | 42,074 | 76,909 | ||||||
| Current income tax and social contribution payable | 20,664 | 12,998 | ||||||
| Other tax payable | 30,863 | 33,719 | ||||||
| Obligations from acquisition of investment | 165,124 | 141,698 | ||||||
| Lease liabilities | 22,088 | 14,411 | ||||||
| Other bills to pay | 42,048 | 36,345 | ||||||
| Total current liabilities | 672,762 | 738,387 | ||||||
| Loans and financing | 614,005 | 649,762 | ||||||
| Debentures | 465,530 | 516,533 | ||||||
| Other taxes payable | 8,016 | 7,986 | ||||||
| Related parties loans | 634,356 | 769,792 | ||||||
| Provision for loss on investments | - | - | ||||||
| Deferred income tax and social contribution | 199,695 | 190,833 | ||||||
| Obligations from acquisition of investment | 49,591 | 81,728 | ||||||
| Provision for contingencies | 375 | 607 | ||||||
| Lease liabilities | 30,364 | 32,648 | ||||||
| Warrant and Earn-out | 38,243 | - | ||||||
| Other bills to pay | 10,326 | 4,305 | ||||||
| Total Non-current liabilities | 2,050,501 | 2,254,194 | ||||||
| Capital | 1,434,717 | 261,920 | ||||||
| Earn-out variation | (162) | - | ||||||
| Share issue expenses | - | - | ||||||
| Profit reserves | - | 302,817 | ||||||
| Capital transactions | (84,729) | (110,218) | ||||||
| Accumulated translation adjustment | (173,164) | (89,165) | ||||||
| Adjust previous exercises | - | - | ||||||
| Retained earnings | (32,022) | - | ||||||
| Equity attributable to owners of the group | 1,144,640 | 365,354 | ||||||
| Non-controlling interest | 170,229 | 81,734 | ||||||
| Total Equity | 1,314,869 | 447,088 | ||||||
| Total shareholders' equity and liabilities | 4,038,132 | 3,439,669 | ||||||
| R$ million | 3Q23 | 3Q22 | Chg | 2Q23 | Chg. | 9M23* | 9M22 | Chg. | ||||||||||||||||||
| Gross revenues | 702.6 |
431.8 |
62.7% |
660.4 |
6.4% |
1,990.1 |
1,145.5 |
73.7% |
||||||||||||||||||
| Deductions | -61.5 |
-33.7 |
82.7% |
-48.3 |
27.5% |
-140.7 |
-92.9 |
51.5% |
||||||||||||||||||
| Net Revenues | 641.1 |
398.1 |
61.0% |
612.1 |
4.7% |
1,849.4 |
1,052.6 |
75.7% |
||||||||||||||||||
| Cost of Services provided | -448.8 |
-282.8 |
58.7% |
-454.1 |
-1.2% |
-1,354.0 |
-755.3 |
79.3% |
||||||||||||||||||
| SG&A | -9.1 |
-7.4 |
22.2% |
-7.6 |
19.4% |
-21.9 |
-21.5 |
2.1% |
||||||||||||||||||
| EBITDA | 183.2 |
107.9 |
69.7% |
150.3 |
21.8% |
473.5 |
275.8 |
71.7% |
||||||||||||||||||
| EBITDA Margin (%) | 28.6% |
27.1% |
1.5 p.p. |
24.6% |
4.0 p.p. |
25.6% |
26.2% |
-0.6 p.p. |
||||||||||||||||||
| Financial Results | -42.4 |
-36.6 |
16.0% |
-50.9 |
-16.7% |
-123.0 |
-59.9 |
105.5% |
||||||||||||||||||
| Financial Expenses | -52.8 |
-37.3 |
41.5% |
-48.9 |
8.0% |
-149.8 |
-66.2 |
126.3% |
||||||||||||||||||
| Financial Income | 10.4 |
0.7 |
1,304.3% |
-2.0 |
-606.3% |
26.8 |
6.4 |
322.2% |
||||||||||||||||||
| Taxes | -35.5 |
-7.0 |
403.8% |
-15.1 |
135.8% |
-70.8 |
-27.0 |
162.5% |
||||||||||||||||||
| Current Taxes | -34.0 |
-9.0 |
278.6% |
-16.0 |
112.6% |
-63.6 |
-23.7 |
168.6% |
||||||||||||||||||
| Deferred Taxes | -1.5 |
1.9 |
-178.8% |
0.9 |
-263.6% |
-7.2 |
-3.3 |
119.0% |
||||||||||||||||||
| Net Income | 53.7 |
35.0 |
53.2% |
47.1 |
14.0% |
33.2 |
117.4 |
-71.8% |
||||||||||||||||||
| BRL thousand | 3Q23 | 3Q22 | 9M23 | 9M22 | ||||||||||
| Net income for the period | 53,683 | 35,035 | 33,161 | 117,417 | ||||||||||
| Adjustments to reconcile income to cash from (applied to) operations: | ||||||||||||||
| Depreciation and amortization | 51,583 | 29,311 | 124,673 | 71,575 | ||||||||||
| Expected credit losses | -201 | 28 | -216 | 0 | ||||||||||
| Residual value of written-off property, plant and equipment and intangible assets | 6,857 | -14,333 | 16,313 | 9,100 | ||||||||||
| Provision for contingencies | -7 | 819 | -232 | 675 | ||||||||||
| Income tax and social contribution - Deferred | 1,520 | -1,929 | 7,223 | 3,298 | ||||||||||
| Interest on loans and financing, debentures, leases and exchange rate variation | 43,637 | 75,633 | 121,686 | 55,272 | ||||||||||
| Changes in assets and liabilities: | ||||||||||||||
| Accounts receivable | -73,854 | -28,044 | -54,429 | -99,658 | ||||||||||
| Recoverable taxes | -12,911 | -178 | -20,455 | -133 | ||||||||||
| Prepaid expenses | -6,063 | -17,376 | 4,606 | -32,087 | ||||||||||
| Advances to suppliers | -552 | 7,785 | -2,747 | 33,033 | ||||||||||
| Inventories | 25,659 | -494 | -8,534 | -2,537 | ||||||||||
| Other accounts receivable | 136 | -18,700 | -6,883 | -5,977 | ||||||||||
| Suppliers | 0 | -16,528 | -42,424 | -13,119 | ||||||||||
| Salaries and social security charges | 9,682 | 10,131 | -28,646 | 19,631 | ||||||||||
| Taxes payable | 3,670 | 11,904 | 16,925 | 8,386 | ||||||||||
| Other accounts payable | -40,397 | 9,766 | -3,183 | -27,717 | ||||||||||
| Total | -94,630 | -41,734 | -145,770 | -120,178 | ||||||||||
| Cash generated from operating activities | 77,378 | 41,869 | 156,838 | 137,159 | ||||||||||
| Interest paid on loans and financing | -19,680 | -3,199 | -44,483 | -8,923 | ||||||||||
| Interest paid on debentures | -47,658 | -25,274 | -94,549 | -25,274 | ||||||||||
| Interest paid on leases | -981 | 513 | -2,392 | -672 | ||||||||||
| Income tax and social contribution | -6,176 | -10,966 | -18,330 | -11,561 | ||||||||||
| Total | -74,495 | -38,926 | -159,754 | -46,430 | ||||||||||
| Cash from (invested in) operations | 2,883 | 2,943 | -2,916 | 90,729 | ||||||||||
| Cash flow from investing activities | ||||||||||||||
| Cash spent on companies' acquisitions; net of cash received | -11,644 | -113,763 | -36,813 | -254,128 | ||||||||||
| Payment of obligations from acquisition of investments | -49,111 | -17,373 | -114,034 | -57,489 | ||||||||||
| Acquisition of property, plant and equipment and intangible assets | -54,853 | -28,452 | -163,808 | -107,167 | ||||||||||
| Net cash used in investing activities | -115,608 | -159,588 | -314,655 | -418,784 | ||||||||||
| Cash flow from financing activities | 0 | 0 | 0 | 0 | ||||||||||
| Attributed to shareholders | 0 | 0 | 0 | 0 | ||||||||||
| Profit distribution - prior periods | -8,789 | -314 | -56,689 | -314 | ||||||||||
| Increase in minority interest | 0 | 0 | 699,532 | 0 | ||||||||||
| Capital Increase | 0 | 0 | 0 | 0 | ||||||||||
| Attributed to financing | 0 | 0 | 0 | 0 | ||||||||||
| Related parties | 18,388 | 237,235 | 122,897 | 135,560 | ||||||||||
| Lease payments - Principal | -42,458 | -15,218 | -70,850 | -22,550 | ||||||||||
| Proceeds from loans and financing | 30,285 | 525,477 | 68,050 | 532,732 | ||||||||||
| Proceeds from debentures | -1,028 | 0 | 0 | 335,500 | ||||||||||
| Funding of debentures | -55,917 | 0 | -55,917 | 0 | ||||||||||
| Payments of loans and financing - Principal | -77,883 | -27,545 | -141,863 | -60,941 | ||||||||||
| Payment of Share Issuance Costs | 0 | 234 | 0 | -5,065 | ||||||||||
| Net cash generated from financing activities | -137,402 | 719,869 | 565,160 | 914,922 | ||||||||||
| Increase (decrease) in cash and cash equivalents | -250,127 | 563,224 | 247,589 | 586,867 | ||||||||||
| Exchange rate change in cash and cash equivalents | 61,299 | -52,354 | -8,277 | -37,685 | ||||||||||
| Cash and cash equivalents at the beginning of the period | 699,747 | 157,230 | 271,607 | 118,918 | ||||||||||
| Cash and cash equivalents at the end of the period | 510,919 | 668,100 | 510,919 | 668,100 | ||||||||||
| R$ Million | 3Q23 | 4Q22 | ||||||
| (+) Short Term Loans and financing | 56.8 | 67.7 | ||||||
| (+) Short Term Debentures | 57.6 | 84.2 | ||||||
| (+) Long Term Loans and financing | 614.0 | 649.8 | ||||||
| (+) Long Term Debentures | 465.5 | 516.5 | ||||||
| Financial Gross Debt | 1,194.0 | 1,318.1 | ||||||
| (-) Cash and equivalents | 510.9 | 271.6 | ||||||
| (=) Financial Net Debt based on Covenants | 683.1 | 1,046.5 | ||||||
(/) Pro forma annualized EBITDA1 |
732.7 | 691.9 | ||||||
Financial Leverage (x) |
0.93 | 1.51 | ||||||
| Financial Gross Debt | 1,194.0 | 1,318.1 | ||||||
| (+) Related Parties Loans | 634.4 | 769.8 | ||||||
| Total Gross Debt | 1,828.3 | 2,087.9 | ||||||
| (-) Cash and equivalents | 510.9 | 271.6 | ||||||
| (-) Related Parties Assets | 26.0 | 26.2 | ||||||
| (=) Net Debt Including Related Parties | 1,291.4 | 1,790.1 | ||||||
(/) Pro forma annualized EBITDA1 |
732.7 | 691.9 | ||||||
| Financial Leverage Including Related Parties (x) | 1.76 | 2.59 | ||||||
| R$ Million | 3Q23 | 3Q22 | 9M23 | 9M22 | ||||||||||
| Profit for period | 53.7 | 35.0 | 33.2 | 117.4 | ||||||||||
| (+) Income tax and social contribution | -35.5 | -7.0 | -70.8 | -27.0 | ||||||||||
| (+) Financial Results | -42.4 | -36.6 | -123.0 | -59.9 | ||||||||||
| (+) Depreciation and amortization expenses | -51.6 | -34.9 | -124.7 | -77.2 | ||||||||||
| (+) NYSE American Listing expenses | - | - | -121.9 | - | ||||||||||
| EBITDA (a) | 183.2 | 107.9 | 473.5 | 275.8 | ||||||||||
| Net revenue (b) | 641.1 | 398.1 | 1,849.4 | 1,052.6 | ||||||||||
| EBITDA Margin (a)/(b) | 28.6% | 27.1% | 25.6% | 26.2% | ||||||||||
| R$ Million | 3Q23 | 3Q22 | 9M23 | 9M22 | ||||||||||
| Net revenue (a) | 641.1 | 398.1 | 1,849.4 | 1,052.6 | ||||||||||
| Cost of Services provided | ||||||||||||||
| Personnel | -260.0 | -137.7 | -751.1 | -375.9 | ||||||||||
| Third parties | -102.7 | -45.1 | -283.7 | -141.4 | ||||||||||
| Fuel | -16.1 | -19.8 | -41.5 | -50.7 | ||||||||||
| Freights | -1.2 | -1.3 | -3.5 | -3.6 | ||||||||||
| Maintenance | -22.7 | -15.5 | -67.2 | -30.2 | ||||||||||
| Taxes | -1.1 | -5.9 | -16.1 | -21.5 | ||||||||||
| Marketing | -4.6 | -5.5 | -13.0 | -6.7 | ||||||||||
| Materials | -4.6 | -10.4 | -17.7 | -17.1 | ||||||||||
| Telecommunications | -3.7 | -1.0 | -10.2 | -2.2 | ||||||||||
| Travel | -19.7 | -6.7 | -56.1 | -16.0 | ||||||||||
| Depreciation | -51.6 | -34.9 | -124.7 | -77.2 | ||||||||||
| Rents | 21.2 | -3.3 | -1.3 | -22.4 | ||||||||||
| Others | -42.7 | -37.9 | -236.6 | -89.0 | ||||||||||
| Total Cost of Services provided | -509.5 | -325.0 | -1,622.5 | -854.0 | ||||||||||
| (-) SG&A | -9.1 | -7.4 | -21.9 | -21.5 | ||||||||||
| (-) Depreciation | -51.6 | -34.9 | -124.7 | -77.2 | ||||||||||
(-) NYSE American Listing expenses |
0.0 | 0.0 | -121.9 | 0.0 | ||||||||||
| Cost of Services provided (cash) (b) | -448.8 | -282.8 | -1,354.0 | -755.3 | ||||||||||
| Gross Profit (a)+(b) | 192.2 | 115.3 | 495.4 | 297.3 | ||||||||||
| Gross Margin | 30.0% | 29.0% | 26.8% | 28.2% | ||||||||||
| R$ Million | 3Q23 LTM |
4Q22 LTM |
3Q23 (A) |
2Q23 (B) |
1Q23 (C) |
4Q22 (D) |
3Q22 (E) |
2Q22
(F)
|
1Q22 (G) |
4Q21 (H) |
||||||||||||||||||||||
| Operating profit² | 486.9 | 336.8 | 131.6 | 113.0 | 103.3 | 138.1 | 73.0 | 61.4 | 64.2 | 73.9 | ||||||||||||||||||||||
Income tax adjustment 1,2 |
(146.1) | (101.0) | (39.5) | (33.9) | (31.0) | (41.4) | (21.9) | (18.4) | (19.2) | (22.2) | ||||||||||||||||||||||
Net operating profit after tax (a)2 |
340.8 | 235.7 | 92.1 | 79.1 | 72.3 | 96.7 | 51.1 | 43.0 | 44.9 | 51.7 | ||||||||||||||||||||||
Total Shareholders’ equity 3 |
916.4 | 385.1 | 1,314.9 | 1,179.7 | 1,204.4 | 447.1 | 435.8 | 387.1 | 317.6 | 337.9 | ||||||||||||||||||||||
(+) Financial Gross Debt 3 |
1,211.7 | 907.8 | 1,194.0 | 1,256.4 | 1,092.8 | 1,790.1 | 929.0 | 679.9 | 656.2 | 483.8 | ||||||||||||||||||||||
(-) Cash and cash equivalents 3 |
575.6 | 270.3 | 510.9 | 691.8 | 735.4 | 271.6 | 668.1 | 157.2 | 135.8 | 118.9 | ||||||||||||||||||||||
(+) Related parties loans (current and non-current) 3 |
642.8 | 509.2 | 634.4 | 606.8 | 607.2 | 769.8 | 595.5 | 365.1 | 333.3 | 482.2 | ||||||||||||||||||||||
(-) Related parties assets 3 |
29.1 | 35.5 | 26.0 | 25.9 | 26.0 | 26.2 | 41.6 | 41.0 | 34.1 | 34.7 | ||||||||||||||||||||||
| Invested capital (b) | 2,166.1 | 1,292.9 | 2,606.3 | 1,558.1 | 1,573.8 | 1,612.5 | 892.3 | 730.2 | 707.1 | 595.4 | ||||||||||||||||||||||
| ROIC (a)/(b) | 15.7% | 18.2% | ||||||||||||||||||||||||||||||
(-) Goodwill 3 |
1,138.8 | 811.2 | 1,272.4 | 1,188.9 | 1,178.8 | 1,192.3 | 861.6 | 720.3 | 696.6 | 584.9 | ||||||||||||||||||||||
(-) Intangibles assets 3 |
318.4 | 96.4 | 376.9 | 369.3 | 395.0 | 420.2 | 30.7 | 9.9 | 10.4 | 10.5 | ||||||||||||||||||||||
| Invested capital ex Goodwill and intangible assets (c) | 708.9 | 385.4 | 957.0 | 767.1 | 723.3 | 624.7 | 472.5 | 336.7 | 266.7 | 226.4 | ||||||||||||||||||||||
| ROIC (a)/(c) | 48.1% | 61.2% | ||||||||||||||||||||||||||||||