WASHINGTON, D.C. 20549
EASTERN BANKSHARES, INC.
Check the appropriate box below if the Form 8-K filing is intended to simultaneously satisfy the filing obligation of the Registrant under any of the following provisions:
Indicate by check mark whether the Registrant is an emerging growth company as defined in Rule 405 of the Securities Act of 1933 (§230.405 of this chapter) or Rule 12b-2 of the Securities Exchange Act of 1934 (§240.12b-2 of this chapter).
Item 8.01. Other Events.
Eastern Bankshares, Inc., a Massachusetts corporation (the “Company”), is filing this Current Report on Form 8-K (this “Form 8-K”) to reflect certain changes described below with respect to the financial information contained in the Company’s Annual Report on Form 10-K for the year ended December 31, 2022 (the “2022 Form 10-K”), which was filed with the Securities Exchange Commission (the “SEC”) on February 24, 2023. The information in this Form 8-K is not an amendment to or restatement of the 2022 Form 10-K.
As previously disclosed in the Company’s Current Report on Form 8-K filed with the SEC on October 31, 2023, the Company and its subsidiary, Eastern Bank, completed on October 31, 2023, the sale (the “Asset Sale”) of Eastern Bank’s insurance operations, which conducted business under the name Eastern Insurance Group LLC (“EIG”), to Arthur J. Gallagher Risk Management Services, LLC (“Gallagher”). In September 2023, following the approval by the Company’s board of directors of a definitive agreement with Gallagher for the Asset Sale, the Company, in accordance with Generally Accepted Accounting Principles, classified EIG’s operations as held for sale and discontinued in all material respects, and accordingly the Company is recasting prior period information to remove the results of operations of the disposed business from the results of the Company’s continuing operations. The Company first reported the EIG operations as discontinued in the Company’s Quarterly Report on Form 10-Q for the quarter ended September 30, 2023, filed with the SEC on November 3, 2023.
The Company is recasting the presentation of its financial information for all periods presented in the 2022 Form 10-K to present the EIG operations as discontinued in all material respects and accordingly also is revising certain other disclosures contained in the 2022 Form 10-K to present operations related to the EIG business as discontinued operations. Included within Exhibit 99.1 to this Form 8-K and incorporated herein are the following items from the 2022 Form 10-K, each recast to reflect the impact of EIG’s discontinued operations on the Company’s consolidated financial information and certain related disclosures:
d.Part II, Item 7 – Management’s Discussion and Analysis of Financial Condition and Results of Operations
Finally, the Company is filing with this Form 8-K the Report of Independent Registered Public Accounting Firm on the Company’s consolidated financial statements for the year ended December 31, 2022, which is unchanged from the 2022 Form 10-K, other than the dual date to reflect the recast of those financial statements to reflect EIG’s discontinued operations and to reflect subsequent events which occurred subsequent to the original issuance of the 2022 Form 10-K.
This Form 8-K does not revise or update any section or subsection of the 2022 Form 10-K other than as expressly noted above. Moreover, in order to preserve the nature and character of the disclosures set forth in such items as originally filed in the 2022 Form 10-K, no attempt has been made in this Form 8-K, and it should not be read, to modify or update disclosures as presented in the 2022 Form 10-K to reflect events or occurrences after the date of the filing of the 2022 Form 10-K, except for (i) matters relating specifically to the recasting of the presentation described above and (ii) the information presented in Note 27 Subsequent Events to the Company’s recast financial statements for the year ended December 31, 2022 filed as part of Exhibit 99.1 to this Form 8-K. Without limiting the foregoing disclaimer, this Form 8-K does not purport to update the 2022 Form 10-K for any information, uncertainties, transactions, risks, events or trends occurring, or known to management as of the filing of this Form 8-K. Therefore, this Form 8-K (including Exhibit 99.1) should be read in conjunction with the 2022 Form 10-K and the Company’s filings made with the SEC subsequent to the filing of the 2022 Form 10-K, including, without limitation, the Company’s Quarterly Reports on Form 10-Q for the quarters ended March 31, 2023, June 30, 2023, and September 30, 2023.
Item 9.01 Financial Statements and Exhibits.
(d) Exhibits.
Pursuant to the requirements of the Securities Exchange Act of 1934, as amended, the Registrant has duly caused this report to be signed on its behalf by the undersigned, hereunto duly authorized.
http://fasb.org/us-gaap/2023#AccountingStandardsUpdate201602Memberhttp://fasb.org/us-gaap/2023#AccountingStandardsUpdate201613MemberP7Yhttp://fasb.org/us-gaap/2023#OtherAssetshttp://fasb.org/us-gaap/2023#OtherAssetshttp://fasb.org/us-gaap/2023#OtherAssetshttp://fasb.org/us-gaap/2023#OtherAssetshttp://fasb.org/us-gaap/2023#OtherAssetshttp://fasb.org/us-gaap/2023#OtherLiabilitieshttp://fasb.org/us-gaap/2023#OtherLiabilitieshttp://fasb.org/us-gaap/2023#OtherLiabilitieshttp://fasb.org/us-gaap/2023#OtherLiabilities8104.56.56845810http://fasb.org/us-gaap/2023#OtherNoninterestExpensehttp://fasb.org/us-gaap/2023#OtherNoninterestExpensehttp://fasb.org/us-gaap/2023#OtherNoninterestExpenseP3Yhttp://fasb.org/us-gaap/2023#InterestIncomeExpenseNethttp://fasb.org/us-gaap/2023#InterestIncomeExpenseNethttp://fasb.org/us-gaap/2023#InterestIncomeExpenseNethttp://fasb.org/us-gaap/2023#OtherAssetshttp://fasb.org/us-gaap/2023#OtherAssetshttp://fasb.org/us-gaap/2023#OtherLiabilitieshttp://fasb.org/us-gaap/2023#OtherLiabilitieshttp://fasb.org/us-gaap/2023#NoninterestIncomeOtherhttp://fasb.org/us-gaap/2023#NoninterestIncomeOtherhttp://fasb.org/us-gaap/2023#NoninterestIncomeOther0001810546TRUE00018105462023-11-082023-11-0800018105462022-12-31iso4217:USD00018105462021-12-310001810546us-gaap:CommercialAndIndustrialSectorMemberus-gaap:CommercialPortfolioSegmentMember2022-12-310001810546us-gaap:CommercialAndIndustrialSectorMemberus-gaap:CommercialPortfolioSegmentMember2021-12-310001810546us-gaap:CommercialPortfolioSegmentMemberus-gaap:CommercialRealEstateMember2022-12-310001810546us-gaap:CommercialPortfolioSegmentMemberus-gaap:CommercialRealEstateMember2021-12-310001810546us-gaap:CommercialPortfolioSegmentMemberus-gaap:ConstructionLoansMember2022-12-310001810546us-gaap:CommercialPortfolioSegmentMemberus-gaap:ConstructionLoansMember2021-12-310001810546us-gaap:CommercialPortfolioSegmentMemberebc:BusinessBankingLoanMember2022-12-310001810546us-gaap:CommercialPortfolioSegmentMemberebc:BusinessBankingLoanMember2021-12-310001810546us-gaap:ResidentialMortgageMemberus-gaap:ResidentialPortfolioSegmentMember2022-12-310001810546us-gaap:ResidentialMortgageMemberus-gaap:ResidentialPortfolioSegmentMember2021-12-310001810546us-gaap:HomeEquityLoanMemberus-gaap:ConsumerPortfolioSegmentMember2022-12-310001810546us-gaap:HomeEquityLoanMemberus-gaap:ConsumerPortfolioSegmentMember2021-12-310001810546ebc:OtherConsumerLoansMemberus-gaap:ConsumerPortfolioSegmentMember2022-12-310001810546ebc:OtherConsumerLoansMemberus-gaap:ConsumerPortfolioSegmentMember2021-12-31iso4217:USDxbrli:sharesxbrli:shares00018105462022-01-012022-12-3100018105462021-01-012021-12-3100018105462020-01-012020-12-310001810546us-gaap:CommonStockMember2019-12-310001810546us-gaap:AdditionalPaidInCapitalMember2019-12-310001810546us-gaap:RetainedEarningsMember2019-12-310001810546us-gaap:AccumulatedOtherComprehensiveIncomeMember2019-12-310001810546us-gaap:DeferredCompensationShareBasedPaymentsMember2019-12-3100018105462019-12-3100018105462019-01-012019-12-310001810546srt:CumulativeEffectPeriodOfAdoptionAdjustmentMemberus-gaap:RetainedEarningsMember2019-12-310001810546srt:CumulativeEffectPeriodOfAdoptionAdjustmentMember2019-12-310001810546us-gaap:RetainedEarningsMember2020-01-012020-12-310001810546us-gaap:AccumulatedOtherComprehensiveIncomeMember2020-01-012020-12-310001810546us-gaap:CommonStockMember2020-01-012020-12-310001810546us-gaap:AdditionalPaidInCapitalMember2020-01-012020-12-310001810546us-gaap:DeferredCompensationShareBasedPaymentsMember2020-01-012020-12-310001810546us-gaap:CommonStockMember2020-12-310001810546us-gaap:AdditionalPaidInCapitalMember2020-12-310001810546us-gaap:RetainedEarningsMember2020-12-310001810546us-gaap:AccumulatedOtherComprehensiveIncomeMember2020-12-310001810546us-gaap:DeferredCompensationShareBasedPaymentsMember2020-12-3100018105462020-12-310001810546us-gaap:RetainedEarningsMember2021-01-012021-12-310001810546us-gaap:CommonStockMember2021-01-012021-12-310001810546us-gaap:AdditionalPaidInCapitalMember2021-01-012021-12-310001810546us-gaap:AccumulatedOtherComprehensiveIncomeMember2021-01-012021-12-310001810546us-gaap:DeferredCompensationShareBasedPaymentsMember2021-01-012021-12-310001810546us-gaap:CommonStockMember2021-12-310001810546us-gaap:AdditionalPaidInCapitalMember2021-12-310001810546us-gaap:RetainedEarningsMember2021-12-310001810546us-gaap:AccumulatedOtherComprehensiveIncomeMember2021-12-310001810546us-gaap:DeferredCompensationShareBasedPaymentsMember2021-12-310001810546srt:CumulativeEffectPeriodOfAdoptionAdjustmentMemberus-gaap:RetainedEarningsMember2021-12-310001810546srt:CumulativeEffectPeriodOfAdoptionAdjustmentMember2021-12-310001810546us-gaap:RetainedEarningsMember2022-01-012022-12-310001810546us-gaap:CommonStockMember2022-01-012022-12-310001810546us-gaap:AdditionalPaidInCapitalMember2022-01-012022-12-310001810546us-gaap:AccumulatedOtherComprehensiveIncomeMember2022-01-012022-12-310001810546us-gaap:DeferredCompensationShareBasedPaymentsMember2022-01-012022-12-310001810546us-gaap:CommonStockMember2022-12-310001810546us-gaap:AdditionalPaidInCapitalMember2022-12-310001810546us-gaap:RetainedEarningsMember2022-12-310001810546us-gaap:AccumulatedOtherComprehensiveIncomeMember2022-12-310001810546us-gaap:DeferredCompensationShareBasedPaymentsMember2022-12-310001810546srt:CumulativeEffectPeriodOfAdoptionAdjustmentMember2022-01-010001810546srt:CumulativeEffectPeriodOfAdoptionAdjustmentMember2022-01-012022-01-0100018105462020-10-142020-10-14xbrli:pure0001810546ebc:PublicStockOfferingMember2020-10-142020-10-140001810546ebc:PublicStockOfferingMember2020-10-140001810546us-gaap:EmployeeStockMember2020-10-142020-10-140001810546ebc:CharitableContributionMember2020-10-152020-10-1500018105462020-10-1600018105462022-01-01ebc:reporting_unit0001810546us-gaap:CoreDepositsMembersrt:MinimumMember2022-12-310001810546us-gaap:CoreDepositsMembersrt:MaximumMember2022-12-31ebc:planebc:segment0001810546srt:CumulativeEffectPeriodOfAdoptionAdjustmentMemberus-gaap:AccountingStandardsUpdate201613Memberus-gaap:RetainedEarningsMember2022-01-010001810546srt:CumulativeEffectPeriodOfAdoptionAdjustmentMemberus-gaap:AccountingStandardsUpdate201613Member2022-01-012022-01-010001810546ebc:CenturyBancorpIncMember2021-11-120001810546ebc:CenturyBancorpIncMember2021-11-122021-11-120001810546ebc:CenturyBancorpIncMember2021-11-120001810546us-gaap:FinancialAssetAcquiredWithCreditDeteriorationMemberebc:CenturyBancorpIncMember2021-11-12ebc:office00018105462021-11-12ebc:branch0001810546ebc:CenturyBancorpIncMember2021-11-122021-11-12ebc:lease_obligation0001810546us-gaap:CoreDepositsMemberebc:CenturyBancorpIncMember2021-11-120001810546us-gaap:CoreDepositsMemberebc:CenturyBancorpIncMember2021-11-122021-11-120001810546ebc:CenturyBancorpIncMember2021-01-012021-12-310001810546ebc:LaborAndRelatedExpenseMember2021-01-012021-12-310001810546ebc:OccupancyNetMember2021-01-012021-12-310001810546ebc:InformationTechnologyAndDataProcessingMember2021-01-012021-12-310001810546ebc:ProfessionalFeesMember2021-01-012021-12-310001810546us-gaap:OtherExpenseMember2021-01-012021-12-310001810546ebc:CenturyBancorpIncMember2020-01-012020-12-310001810546us-gaap:MortgageBackedSecuritiesIssuedByUSGovernmentSponsoredEnterprisesMember2022-12-310001810546ebc:CommercialMortgageBackedSecuritiesIssuedByUSGovernmentSponsoredEnterprisesMember2022-12-310001810546us-gaap:USGovernmentAgenciesDebtSecuritiesMember2022-12-310001810546us-gaap:USTreasurySecuritiesMember2022-12-310001810546us-gaap:USStatesAndPoliticalSubdivisionsMember2022-12-310001810546us-gaap:OtherDebtSecuritiesMember2022-12-310001810546us-gaap:MortgageBackedSecuritiesIssuedByUSGovernmentSponsoredEnterprisesMember2021-12-310001810546ebc:CommercialMortgageBackedSecuritiesIssuedByUSGovernmentSponsoredEnterprisesMember2021-12-310001810546us-gaap:USGovernmentAgenciesDebtSecuritiesMember2021-12-310001810546us-gaap:USTreasurySecuritiesMember2021-12-310001810546us-gaap:USStatesAndPoliticalSubdivisionsMember2021-12-310001810546ebc:SmallBusinessAdministrationPooledSecuritiesMember2021-12-310001810546us-gaap:OtherDebtSecuritiesMember2021-12-31ebc:holding0001810546ebc:CallableSecuritiesMember2022-12-310001810546ebc:CallableSecuritiesMember2021-12-310001810546us-gaap:CommercialPortfolioSegmentMemberebc:BusinessBankingMember2022-12-310001810546us-gaap:CommercialPortfolioSegmentMemberebc:BusinessBankingMember2021-12-310001810546ebc:OtherConsumerMemberus-gaap:ConsumerPortfolioSegmentMember2022-12-310001810546ebc:OtherConsumerMemberus-gaap:ConsumerPortfolioSegmentMember2021-12-310001810546us-gaap:ConsumerPortfolioSegmentMemberus-gaap:AutomobileLoanMember2022-12-310001810546us-gaap:ConsumerPortfolioSegmentMemberus-gaap:AutomobileLoanMember2021-12-310001810546us-gaap:AssetPledgedAsCollateralMemberus-gaap:FederalHomeLoanBankAdvancesMember2022-12-310001810546us-gaap:AssetPledgedAsCollateralMemberus-gaap:FederalHomeLoanBankAdvancesMember2021-12-310001810546us-gaap:FederalHomeLoanBankAdvancesMember2022-12-310001810546us-gaap:FederalHomeLoanBankAdvancesMember2021-12-310001810546us-gaap:FederalReserveBankAdvancesMemberus-gaap:AssetPledgedAsCollateralMember2022-12-310001810546us-gaap:FederalReserveBankAdvancesMemberus-gaap:AssetPledgedAsCollateralMember2021-12-310001810546us-gaap:FederalReserveBankAdvancesMember2021-12-310001810546us-gaap:FederalReserveBankAdvancesMember2022-12-310001810546ebc:OtherClassOfFinancingReceivableMember2021-12-310001810546us-gaap:CommercialPortfolioSegmentMemberus-gaap:CommercialAndIndustrialSectorMembersrt:CumulativeEffectPeriodOfAdoptionAdjustmentMember2021-12-310001810546us-gaap:CommercialPortfolioSegmentMemberus-gaap:CommercialRealEstateMembersrt:CumulativeEffectPeriodOfAdoptionAdjustmentMember2021-12-310001810546us-gaap:CommercialPortfolioSegmentMembersrt:CumulativeEffectPeriodOfAdoptionAdjustmentMemberus-gaap:ConstructionLoansMember2021-12-310001810546us-gaap:CommercialPortfolioSegmentMemberebc:BusinessBankingMembersrt:CumulativeEffectPeriodOfAdoptionAdjustmentMember2021-12-310001810546srt:CumulativeEffectPeriodOfAdoptionAdjustmentMemberus-gaap:ResidentialMortgageMemberus-gaap:ResidentialPortfolioSegmentMember2021-12-310001810546us-gaap:HomeEquityLoanMembersrt:CumulativeEffectPeriodOfAdoptionAdjustmentMemberus-gaap:ConsumerPortfolioSegmentMember2021-12-310001810546srt:CumulativeEffectPeriodOfAdoptionAdjustmentMemberus-gaap:ConsumerPortfolioSegmentMemberebc:OtherConsumerMember2021-12-310001810546ebc:OtherClassOfFinancingReceivableMembersrt:CumulativeEffectPeriodOfAdoptionAdjustmentMember2021-12-310001810546us-gaap:CommercialAndIndustrialSectorMemberus-gaap:CommercialPortfolioSegmentMember2022-01-012022-12-310001810546us-gaap:CommercialPortfolioSegmentMemberus-gaap:CommercialRealEstateMember2022-01-012022-12-310001810546us-gaap:CommercialPortfolioSegmentMemberus-gaap:ConstructionLoansMember2022-01-012022-12-310001810546us-gaap:CommercialPortfolioSegmentMemberebc:BusinessBankingMember2022-01-012022-12-310001810546us-gaap:ResidentialMortgageMemberus-gaap:ResidentialPortfolioSegmentMember2022-01-012022-12-310001810546us-gaap:HomeEquityLoanMemberus-gaap:ConsumerPortfolioSegmentMember2022-01-012022-12-310001810546ebc:OtherConsumerMemberus-gaap:ConsumerPortfolioSegmentMember2022-01-012022-12-310001810546ebc:OtherClassOfFinancingReceivableMember2022-01-012022-12-310001810546ebc:OtherClassOfFinancingReceivableMember2022-12-310001810546srt:CumulativeEffectPeriodOfAdoptionAdjustedBalanceMember2022-01-0100018105462022-01-022022-12-310001810546srt:CumulativeEffectPeriodOfAdoptionAdjustmentMemberus-gaap:UnfundedLoanCommitmentMember2022-01-010001810546us-gaap:UnfundedLoanCommitmentMember2022-01-010001810546us-gaap:UnfundedLoanCommitmentMember2022-12-310001810546us-gaap:LineOfCreditMemberebc:BusinessBankingMemberebc:UnratedMember2022-12-310001810546us-gaap:CommercialAndIndustrialSectorMemberus-gaap:LineOfCreditMemberebc:UnratedMember2022-12-310001810546us-gaap:CommercialPortfolioSegmentMemberus-gaap:CommercialAndIndustrialSectorMemberus-gaap:PassMember2022-12-310001810546us-gaap:CommercialPortfolioSegmentMemberus-gaap:CommercialAndIndustrialSectorMemberus-gaap:SpecialMentionMember2022-12-310001810546us-gaap:CommercialPortfolioSegmentMemberus-gaap:CommercialAndIndustrialSectorMemberus-gaap:SubstandardMember2022-12-310001810546us-gaap:CommercialPortfolioSegmentMemberus-gaap:CommercialAndIndustrialSectorMemberus-gaap:DoubtfulMember2022-12-310001810546us-gaap:CommercialPortfolioSegmentMemberus-gaap:CommercialAndIndustrialSectorMemberus-gaap:UnlikelyToBeCollectedFinancingReceivableMember2022-12-310001810546us-gaap:CommercialPortfolioSegmentMemberus-gaap:CommercialRealEstateMemberus-gaap:PassMember2022-12-310001810546us-gaap:CommercialPortfolioSegmentMemberus-gaap:CommercialRealEstateMemberus-gaap:SpecialMentionMember2022-12-310001810546us-gaap:CommercialPortfolioSegmentMemberus-gaap:CommercialRealEstateMemberus-gaap:SubstandardMember2022-12-310001810546us-gaap:CommercialPortfolioSegmentMemberus-gaap:CommercialRealEstateMemberus-gaap:DoubtfulMember2022-12-310001810546us-gaap:CommercialPortfolioSegmentMemberus-gaap:CommercialRealEstateMemberus-gaap:UnlikelyToBeCollectedFinancingReceivableMember2022-12-310001810546us-gaap:CommercialPortfolioSegmentMemberus-gaap:ConstructionLoansMemberus-gaap:PassMember2022-12-310001810546us-gaap:CommercialPortfolioSegmentMemberus-gaap:SpecialMentionMemberus-gaap:ConstructionLoansMember2022-12-310001810546us-gaap:CommercialPortfolioSegmentMemberus-gaap:SubstandardMemberus-gaap:ConstructionLoansMember2022-12-310001810546us-gaap:CommercialPortfolioSegmentMemberus-gaap:ConstructionLoansMemberus-gaap:DoubtfulMember2022-12-310001810546us-gaap:CommercialPortfolioSegmentMemberus-gaap:UnlikelyToBeCollectedFinancingReceivableMemberus-gaap:ConstructionLoansMember2022-12-310001810546us-gaap:CommercialPortfolioSegmentMemberebc:BusinessBankingMemberus-gaap:PassMember2022-12-310001810546us-gaap:CommercialPortfolioSegmentMemberebc:BusinessBankingMemberus-gaap:SpecialMentionMember2022-12-310001810546us-gaap:CommercialPortfolioSegmentMemberebc:BusinessBankingMemberus-gaap:SubstandardMember2022-12-310001810546us-gaap:CommercialPortfolioSegmentMemberebc:BusinessBankingMemberus-gaap:DoubtfulMember2022-12-310001810546us-gaap:CommercialPortfolioSegmentMemberebc:BusinessBankingMemberus-gaap:UnlikelyToBeCollectedFinancingReceivableMember2022-12-310001810546ebc:FinancialAssetNotPastDueAccruingMemberus-gaap:ResidentialMortgageMemberus-gaap:ResidentialPortfolioSegmentMember2022-12-310001810546ebc:FinancialAsset30To89DaysPastDueAccruingMemberus-gaap:ResidentialMortgageMemberus-gaap:ResidentialPortfolioSegmentMember2022-12-310001810546ebc:FinancialAssetEqualToOrGreaterThan90DaysPastDueAccruingMemberus-gaap:ResidentialMortgageMemberus-gaap:ResidentialPortfolioSegmentMember2022-12-310001810546ebc:NonAccrualMemberus-gaap:ResidentialMortgageMemberus-gaap:ResidentialPortfolioSegmentMember2022-12-310001810546us-gaap:HomeEquityLoanMemberus-gaap:ConsumerPortfolioSegmentMemberebc:FinancialAssetNotPastDueAccruingMember2022-12-310001810546us-gaap:HomeEquityLoanMemberus-gaap:ConsumerPortfolioSegmentMemberebc:FinancialAsset30To89DaysPastDueAccruingMember2022-12-310001810546us-gaap:HomeEquityLoanMemberus-gaap:ConsumerPortfolioSegmentMemberebc:FinancialAssetEqualToOrGreaterThan90DaysPastDueAccruingMember2022-12-310001810546us-gaap:HomeEquityLoanMemberus-gaap:ConsumerPortfolioSegmentMemberebc:NonAccrualMember2022-12-310001810546us-gaap:ConsumerPortfolioSegmentMemberebc:OtherConsumerMemberebc:FinancialAssetNotPastDueAccruingMember2022-12-310001810546us-gaap:ConsumerPortfolioSegmentMemberebc:FinancialAsset30To89DaysPastDueAccruingMemberebc:OtherConsumerMember2022-12-310001810546us-gaap:ConsumerPortfolioSegmentMemberebc:OtherConsumerMemberebc:FinancialAssetEqualToOrGreaterThan90DaysPastDueAccruingMember2022-12-310001810546us-gaap:ConsumerPortfolioSegmentMemberebc:NonAccrualMemberebc:OtherConsumerMember2022-12-310001810546us-gaap:CommercialPortfolioSegmentMemberus-gaap:CommercialAndIndustrialSectorMemberebc:UnratedMemberus-gaap:NonperformingFinancingReceivableMemberebc:PaycheckProtectionProgramMember2022-12-310001810546us-gaap:CommercialPortfolioSegmentMemberebc:BusinessBankingMemberebc:UnratedMemberus-gaap:NonperformingFinancingReceivableMemberebc:PaycheckProtectionProgramMember2022-12-310001810546us-gaap:CommercialPortfolioSegmentMemberus-gaap:CommercialAndIndustrialSectorMemberus-gaap:FinancingReceivables30To59DaysPastDueMember2022-12-310001810546us-gaap:CommercialPortfolioSegmentMemberus-gaap:CommercialAndIndustrialSectorMemberus-gaap:FinancingReceivables60To89DaysPastDueMember2022-12-310001810546us-gaap:CommercialPortfolioSegmentMemberus-gaap:CommercialAndIndustrialSectorMemberus-gaap:FinancingReceivablesEqualToGreaterThan90DaysPastDueMember2022-12-310001810546us-gaap:CommercialPortfolioSegmentMemberus-gaap:CommercialAndIndustrialSectorMemberus-gaap:FinancialAssetPastDueMember2022-12-310001810546us-gaap:CommercialPortfolioSegmentMemberus-gaap:CommercialAndIndustrialSectorMemberus-gaap:FinancialAssetNotPastDueMember2022-12-310001810546us-gaap:CommercialPortfolioSegmentMemberus-gaap:CommercialRealEstateMemberus-gaap:FinancingReceivables30To59DaysPastDueMember2022-12-310001810546us-gaap:CommercialPortfolioSegmentMemberus-gaap:CommercialRealEstateMemberus-gaap:FinancingReceivables60To89DaysPastDueMember2022-12-310001810546us-gaap:CommercialPortfolioSegmentMemberus-gaap:CommercialRealEstateMemberus-gaap:FinancingReceivablesEqualToGreaterThan90DaysPastDueMember2022-12-310001810546us-gaap:CommercialPortfolioSegmentMemberus-gaap:CommercialRealEstateMemberus-gaap:FinancialAssetPastDueMember2022-12-310001810546us-gaap:CommercialPortfolioSegmentMemberus-gaap:FinancialAssetNotPastDueMemberus-gaap:CommercialRealEstateMember2022-12-310001810546us-gaap:CommercialPortfolioSegmentMemberus-gaap:FinancingReceivables30To59DaysPastDueMemberus-gaap:ConstructionLoansMember2022-12-310001810546us-gaap:CommercialPortfolioSegmentMemberus-gaap:FinancingReceivables60To89DaysPastDueMemberus-gaap:ConstructionLoansMember2022-12-310001810546us-gaap:CommercialPortfolioSegmentMemberus-gaap:FinancingReceivablesEqualToGreaterThan90DaysPastDueMemberus-gaap:ConstructionLoansMember2022-12-310001810546us-gaap:CommercialPortfolioSegmentMemberus-gaap:FinancialAssetPastDueMemberus-gaap:ConstructionLoansMember2022-12-310001810546us-gaap:CommercialPortfolioSegmentMemberus-gaap:FinancialAssetNotPastDueMemberus-gaap:ConstructionLoansMember2022-12-310001810546us-gaap:CommercialPortfolioSegmentMemberebc:BusinessBankingMemberus-gaap:FinancingReceivables30To59DaysPastDueMember2022-12-310001810546us-gaap:CommercialPortfolioSegmentMemberus-gaap:FinancingReceivables60To89DaysPastDueMemberebc:BusinessBankingMember2022-12-310001810546us-gaap:CommercialPortfolioSegmentMemberebc:BusinessBankingMemberus-gaap:FinancingReceivablesEqualToGreaterThan90DaysPastDueMember2022-12-310001810546us-gaap:CommercialPortfolioSegmentMemberus-gaap:FinancialAssetPastDueMemberebc:BusinessBankingMember2022-12-310001810546us-gaap:CommercialPortfolioSegmentMemberus-gaap:FinancialAssetNotPastDueMemberebc:BusinessBankingMember2022-12-310001810546us-gaap:FinancingReceivables30To59DaysPastDueMemberus-gaap:ResidentialMortgageMemberus-gaap:ResidentialPortfolioSegmentMember2022-12-310001810546us-gaap:FinancingReceivables60To89DaysPastDueMemberus-gaap:ResidentialMortgageMemberus-gaap:ResidentialPortfolioSegmentMember2022-12-310001810546us-gaap:FinancingReceivablesEqualToGreaterThan90DaysPastDueMemberus-gaap:ResidentialMortgageMemberus-gaap:ResidentialPortfolioSegmentMember2022-12-310001810546us-gaap:FinancialAssetPastDueMemberus-gaap:ResidentialMortgageMemberus-gaap:ResidentialPortfolioSegmentMember2022-12-310001810546us-gaap:FinancialAssetNotPastDueMemberus-gaap:ResidentialMortgageMemberus-gaap:ResidentialPortfolioSegmentMember2022-12-310001810546us-gaap:HomeEquityLoanMemberus-gaap:ConsumerPortfolioSegmentMemberus-gaap:FinancingReceivables30To59DaysPastDueMember2022-12-310001810546us-gaap:FinancingReceivables60To89DaysPastDueMemberus-gaap:HomeEquityLoanMemberus-gaap:ConsumerPortfolioSegmentMember2022-12-310001810546us-gaap:HomeEquityLoanMemberus-gaap:ConsumerPortfolioSegmentMemberus-gaap:FinancingReceivablesEqualToGreaterThan90DaysPastDueMember2022-12-310001810546us-gaap:HomeEquityLoanMemberus-gaap:FinancialAssetPastDueMemberus-gaap:ConsumerPortfolioSegmentMember2022-12-310001810546us-gaap:FinancialAssetNotPastDueMemberus-gaap:HomeEquityLoanMemberus-gaap:ConsumerPortfolioSegmentMember2022-12-310001810546us-gaap:ConsumerPortfolioSegmentMemberus-gaap:FinancingReceivables30To59DaysPastDueMemberebc:OtherConsumerMember2022-12-310001810546us-gaap:FinancingReceivables60To89DaysPastDueMemberus-gaap:ConsumerPortfolioSegmentMemberebc:OtherConsumerMember2022-12-310001810546us-gaap:ConsumerPortfolioSegmentMemberebc:OtherConsumerMemberus-gaap:FinancingReceivablesEqualToGreaterThan90DaysPastDueMember2022-12-310001810546us-gaap:FinancialAssetPastDueMemberus-gaap:ConsumerPortfolioSegmentMemberebc:OtherConsumerMember2022-12-310001810546us-gaap:FinancialAssetNotPastDueMemberus-gaap:ConsumerPortfolioSegmentMemberebc:OtherConsumerMember2022-12-310001810546us-gaap:FinancingReceivables30To59DaysPastDueMember2022-12-310001810546us-gaap:FinancingReceivables60To89DaysPastDueMember2022-12-310001810546us-gaap:FinancingReceivablesEqualToGreaterThan90DaysPastDueMember2022-12-310001810546us-gaap:FinancialAssetPastDueMember2022-12-310001810546us-gaap:FinancialAssetNotPastDueMember2022-12-310001810546us-gaap:CommercialPortfolioSegmentMemberus-gaap:CommercialAndIndustrialSectorMemberus-gaap:FinancingReceivables30To59DaysPastDueMember2021-12-310001810546us-gaap:CommercialPortfolioSegmentMemberus-gaap:CommercialAndIndustrialSectorMemberus-gaap:FinancingReceivables60To89DaysPastDueMember2021-12-310001810546us-gaap:CommercialPortfolioSegmentMemberus-gaap:CommercialAndIndustrialSectorMemberus-gaap:FinancingReceivablesEqualToGreaterThan90DaysPastDueMember2021-12-310001810546us-gaap:CommercialPortfolioSegmentMemberus-gaap:CommercialAndIndustrialSectorMemberus-gaap:FinancialAssetPastDueMember2021-12-310001810546us-gaap:CommercialPortfolioSegmentMemberus-gaap:CommercialAndIndustrialSectorMemberus-gaap:FinancialAssetNotPastDueMember2021-12-310001810546us-gaap:CommercialPortfolioSegmentMemberus-gaap:CommercialRealEstateMemberus-gaap:FinancingReceivables30To59DaysPastDueMember2021-12-310001810546us-gaap:CommercialPortfolioSegmentMemberus-gaap:CommercialRealEstateMemberus-gaap:FinancingReceivables60To89DaysPastDueMember2021-12-310001810546us-gaap:CommercialPortfolioSegmentMemberus-gaap:CommercialRealEstateMemberus-gaap:FinancingReceivablesEqualToGreaterThan90DaysPastDueMember2021-12-310001810546us-gaap:CommercialPortfolioSegmentMemberus-gaap:CommercialRealEstateMemberus-gaap:FinancialAssetPastDueMember2021-12-310001810546us-gaap:CommercialPortfolioSegmentMemberus-gaap:FinancialAssetNotPastDueMemberus-gaap:CommercialRealEstateMember2021-12-310001810546us-gaap:CommercialPortfolioSegmentMemberus-gaap:FinancingReceivables30To59DaysPastDueMemberus-gaap:ConstructionLoansMember2021-12-310001810546us-gaap:CommercialPortfolioSegmentMemberus-gaap:FinancingReceivables60To89DaysPastDueMemberus-gaap:ConstructionLoansMember2021-12-310001810546us-gaap:CommercialPortfolioSegmentMemberus-gaap:FinancingReceivablesEqualToGreaterThan90DaysPastDueMemberus-gaap:ConstructionLoansMember2021-12-310001810546us-gaap:CommercialPortfolioSegmentMemberus-gaap:FinancialAssetPastDueMemberus-gaap:ConstructionLoansMember2021-12-310001810546us-gaap:CommercialPortfolioSegmentMemberus-gaap:FinancialAssetNotPastDueMemberus-gaap:ConstructionLoansMember2021-12-310001810546us-gaap:CommercialPortfolioSegmentMemberebc:BusinessBankingMemberus-gaap:FinancingReceivables30To59DaysPastDueMember2021-12-310001810546us-gaap:CommercialPortfolioSegmentMemberus-gaap:FinancingReceivables60To89DaysPastDueMemberebc:BusinessBankingMember2021-12-310001810546us-gaap:CommercialPortfolioSegmentMemberebc:BusinessBankingMemberus-gaap:FinancingReceivablesEqualToGreaterThan90DaysPastDueMember2021-12-310001810546us-gaap:CommercialPortfolioSegmentMemberus-gaap:FinancialAssetPastDueMemberebc:BusinessBankingMember2021-12-310001810546us-gaap:CommercialPortfolioSegmentMemberus-gaap:FinancialAssetNotPastDueMemberebc:BusinessBankingMember2021-12-310001810546us-gaap:FinancingReceivables30To59DaysPastDueMemberus-gaap:ResidentialMortgageMemberus-gaap:ResidentialPortfolioSegmentMember2021-12-310001810546us-gaap:FinancingReceivables60To89DaysPastDueMemberus-gaap:ResidentialMortgageMemberus-gaap:ResidentialPortfolioSegmentMember2021-12-310001810546us-gaap:FinancingReceivablesEqualToGreaterThan90DaysPastDueMemberus-gaap:ResidentialMortgageMemberus-gaap:ResidentialPortfolioSegmentMember2021-12-310001810546us-gaap:FinancialAssetPastDueMemberus-gaap:ResidentialMortgageMemberus-gaap:ResidentialPortfolioSegmentMember2021-12-310001810546us-gaap:FinancialAssetNotPastDueMemberus-gaap:ResidentialMortgageMemberus-gaap:ResidentialPortfolioSegmentMember2021-12-310001810546us-gaap:HomeEquityLoanMemberus-gaap:ConsumerPortfolioSegmentMemberus-gaap:FinancingReceivables30To59DaysPastDueMember2021-12-310001810546us-gaap:FinancingReceivables60To89DaysPastDueMemberus-gaap:HomeEquityLoanMemberus-gaap:ConsumerPortfolioSegmentMember2021-12-310001810546us-gaap:HomeEquityLoanMemberus-gaap:ConsumerPortfolioSegmentMemberus-gaap:FinancingReceivablesEqualToGreaterThan90DaysPastDueMember2021-12-310001810546us-gaap:HomeEquityLoanMemberus-gaap:FinancialAssetPastDueMemberus-gaap:ConsumerPortfolioSegmentMember2021-12-310001810546us-gaap:FinancialAssetNotPastDueMemberus-gaap:HomeEquityLoanMemberus-gaap:ConsumerPortfolioSegmentMember2021-12-310001810546us-gaap:ConsumerPortfolioSegmentMemberus-gaap:FinancingReceivables30To59DaysPastDueMemberebc:OtherConsumerMember2021-12-310001810546us-gaap:FinancingReceivables60To89DaysPastDueMemberus-gaap:ConsumerPortfolioSegmentMemberebc:OtherConsumerMember2021-12-310001810546us-gaap:ConsumerPortfolioSegmentMemberebc:OtherConsumerMemberus-gaap:FinancingReceivablesEqualToGreaterThan90DaysPastDueMember2021-12-310001810546us-gaap:FinancialAssetPastDueMemberus-gaap:ConsumerPortfolioSegmentMemberebc:OtherConsumerMember2021-12-310001810546us-gaap:FinancialAssetNotPastDueMemberus-gaap:ConsumerPortfolioSegmentMemberebc:OtherConsumerMember2021-12-310001810546us-gaap:FinancingReceivables30To59DaysPastDueMember2021-12-310001810546us-gaap:FinancingReceivables60To89DaysPastDueMember2021-12-310001810546us-gaap:FinancingReceivablesEqualToGreaterThan90DaysPastDueMember2021-12-310001810546us-gaap:FinancialAssetPastDueMember2021-12-310001810546us-gaap:FinancialAssetNotPastDueMember2021-12-310001810546us-gaap:ResidentialPortfolioSegmentMember2022-12-310001810546us-gaap:ResidentialPortfolioSegmentMember2021-12-310001810546us-gaap:CommercialPortfolioSegmentMember2022-12-310001810546us-gaap:CommercialPortfolioSegmentMember2021-12-310001810546us-gaap:CommercialPortfolioSegmentMemberus-gaap:CommercialAndIndustrialSectorMemberebc:ContractualObligationModificationMemberus-gaap:SpecialMentionMemberebc:TroubledDebtRestructuringAccrualLoansMember2022-01-012022-12-31ebc:loan0001810546us-gaap:CommercialPortfolioSegmentMemberus-gaap:CommercialAndIndustrialSectorMemberebc:ContractualObligationModificationMemberus-gaap:SpecialMentionMemberebc:TroubledDebtRestructuringAccrualLoansMember2022-12-310001810546us-gaap:CommercialPortfolioSegmentMemberus-gaap:CommercialAndIndustrialSectorMemberebc:ContractualObligationModificationMemberus-gaap:SpecialMentionMemberebc:TroubledDebtSecuritiesNonaccrualLoansMember2022-01-012022-12-310001810546us-gaap:CommercialPortfolioSegmentMemberus-gaap:CommercialAndIndustrialSectorMemberebc:ContractualObligationModificationMemberus-gaap:SpecialMentionMemberebc:TroubledDebtSecuritiesNonaccrualLoansMember2022-12-310001810546us-gaap:CommercialPortfolioSegmentMemberebc:BusinessBankingMemberebc:ContractualObligationModificationMemberus-gaap:SpecialMentionMemberebc:TroubledDebtRestructuringAccrualLoansMember2022-01-012022-12-310001810546us-gaap:CommercialPortfolioSegmentMemberebc:BusinessBankingMemberebc:ContractualObligationModificationMemberus-gaap:SpecialMentionMemberebc:TroubledDebtRestructuringAccrualLoansMember2022-12-310001810546us-gaap:CommercialPortfolioSegmentMemberebc:BusinessBankingMemberebc:ContractualObligationModificationMemberus-gaap:SpecialMentionMemberebc:TroubledDebtSecuritiesNonaccrualLoansMember2022-01-012022-12-310001810546us-gaap:CommercialPortfolioSegmentMemberebc:BusinessBankingMemberebc:ContractualObligationModificationMemberus-gaap:SpecialMentionMemberebc:TroubledDebtSecuritiesNonaccrualLoansMember2022-12-310001810546ebc:ContractualObligationModificationMemberus-gaap:SpecialMentionMemberebc:TroubledDebtRestructuringAccrualLoansMemberus-gaap:ResidentialMortgageMemberus-gaap:ResidentialPortfolioSegmentMember2022-01-012022-12-310001810546ebc:ContractualObligationModificationMemberus-gaap:SpecialMentionMemberebc:TroubledDebtRestructuringAccrualLoansMemberus-gaap:ResidentialMortgageMemberus-gaap:ResidentialPortfolioSegmentMember2022-12-310001810546ebc:ContractualObligationModificationMemberus-gaap:SpecialMentionMemberus-gaap:ResidentialMortgageMemberus-gaap:ResidentialPortfolioSegmentMemberebc:TroubledDebtSecuritiesNonaccrualLoansMember2022-01-012022-12-310001810546ebc:ContractualObligationModificationMemberus-gaap:SpecialMentionMemberus-gaap:ResidentialMortgageMemberus-gaap:ResidentialPortfolioSegmentMemberebc:TroubledDebtSecuritiesNonaccrualLoansMember2022-12-310001810546us-gaap:HomeEquityLoanMemberebc:ContractualObligationModificationMemberus-gaap:ConsumerPortfolioSegmentMemberus-gaap:SpecialMentionMemberebc:TroubledDebtRestructuringAccrualLoansMember2022-01-012022-12-310001810546us-gaap:HomeEquityLoanMemberebc:ContractualObligationModificationMemberus-gaap:ConsumerPortfolioSegmentMemberus-gaap:SpecialMentionMemberebc:TroubledDebtRestructuringAccrualLoansMember2022-12-310001810546us-gaap:HomeEquityLoanMemberebc:ContractualObligationModificationMemberus-gaap:ConsumerPortfolioSegmentMemberus-gaap:SpecialMentionMemberebc:TroubledDebtSecuritiesNonaccrualLoansMember2022-01-012022-12-310001810546us-gaap:HomeEquityLoanMemberebc:ContractualObligationModificationMemberus-gaap:ConsumerPortfolioSegmentMemberus-gaap:SpecialMentionMemberebc:TroubledDebtSecuritiesNonaccrualLoansMember2022-12-310001810546ebc:ContractualObligationModificationMemberus-gaap:ConsumerPortfolioSegmentMemberebc:OtherConsumerMemberus-gaap:SpecialMentionMemberebc:TroubledDebtRestructuringAccrualLoansMember2022-01-012022-12-310001810546ebc:ContractualObligationModificationMemberus-gaap:ConsumerPortfolioSegmentMemberebc:OtherConsumerMemberus-gaap:SpecialMentionMemberebc:TroubledDebtRestructuringAccrualLoansMember2022-12-310001810546ebc:ContractualObligationModificationMemberus-gaap:ConsumerPortfolioSegmentMemberebc:OtherConsumerMemberus-gaap:SpecialMentionMemberebc:TroubledDebtSecuritiesNonaccrualLoansMember2022-01-012022-12-310001810546ebc:ContractualObligationModificationMemberus-gaap:ConsumerPortfolioSegmentMemberebc:OtherConsumerMemberus-gaap:SpecialMentionMemberebc:TroubledDebtSecuritiesNonaccrualLoansMember2022-12-310001810546ebc:ContractualObligationModificationMemberus-gaap:SpecialMentionMemberebc:TroubledDebtRestructuringAccrualLoansMember2022-01-012022-12-310001810546ebc:ContractualObligationModificationMemberus-gaap:SpecialMentionMemberebc:TroubledDebtRestructuringAccrualLoansMember2022-12-310001810546ebc:ContractualObligationModificationMemberus-gaap:SpecialMentionMemberebc:TroubledDebtSecuritiesNonaccrualLoansMember2022-01-012022-12-31ebc:contract0001810546ebc:ContractualObligationModificationMemberus-gaap:SpecialMentionMemberebc:TroubledDebtSecuritiesNonaccrualLoansMember2022-12-310001810546us-gaap:CommercialPortfolioSegmentMemberus-gaap:CommercialAndIndustrialSectorMemberebc:ContractualObligationModificationMemberus-gaap:SpecialMentionMemberebc:TroubledDebtRestructuringAccrualLoansMember2021-01-012021-12-310001810546us-gaap:CommercialPortfolioSegmentMemberus-gaap:CommercialAndIndustrialSectorMemberebc:ContractualObligationModificationMemberus-gaap:SpecialMentionMemberebc:TroubledDebtRestructuringAccrualLoansMember2021-12-310001810546us-gaap:CommercialPortfolioSegmentMemberus-gaap:CommercialAndIndustrialSectorMemberebc:ContractualObligationModificationMemberus-gaap:SpecialMentionMemberebc:TroubledDebtSecuritiesNonaccrualLoansMember2021-01-012021-12-310001810546us-gaap:CommercialPortfolioSegmentMemberus-gaap:CommercialAndIndustrialSectorMemberebc:ContractualObligationModificationMemberus-gaap:SpecialMentionMemberebc:TroubledDebtSecuritiesNonaccrualLoansMember2021-12-310001810546us-gaap:CommercialAndIndustrialSectorMemberus-gaap:CommercialPortfolioSegmentMember2021-01-012021-12-310001810546us-gaap:CommercialPortfolioSegmentMemberus-gaap:CommercialRealEstateMemberebc:ContractualObligationModificationMemberus-gaap:SpecialMentionMemberebc:TroubledDebtRestructuringAccrualLoansMember2021-01-012021-12-310001810546us-gaap:CommercialPortfolioSegmentMemberus-gaap:CommercialRealEstateMemberebc:ContractualObligationModificationMemberus-gaap:SpecialMentionMemberebc:TroubledDebtRestructuringAccrualLoansMember2021-12-310001810546us-gaap:CommercialPortfolioSegmentMemberus-gaap:CommercialRealEstateMemberebc:ContractualObligationModificationMemberus-gaap:SpecialMentionMemberebc:TroubledDebtSecuritiesNonaccrualLoansMember2021-01-012021-12-310001810546us-gaap:CommercialPortfolioSegmentMemberus-gaap:CommercialRealEstateMemberebc:ContractualObligationModificationMemberus-gaap:SpecialMentionMemberebc:TroubledDebtSecuritiesNonaccrualLoansMember2021-12-310001810546us-gaap:CommercialPortfolioSegmentMemberus-gaap:CommercialRealEstateMember2021-01-012021-12-310001810546us-gaap:CommercialPortfolioSegmentMemberebc:BusinessBankingMemberebc:ContractualObligationModificationMemberus-gaap:SpecialMentionMemberebc:TroubledDebtRestructuringAccrualLoansMember2021-01-012021-12-310001810546us-gaap:CommercialPortfolioSegmentMemberebc:BusinessBankingMemberebc:ContractualObligationModificationMemberus-gaap:SpecialMentionMemberebc:TroubledDebtRestructuringAccrualLoansMember2021-12-310001810546us-gaap:CommercialPortfolioSegmentMemberebc:BusinessBankingMemberebc:ContractualObligationModificationMemberus-gaap:SpecialMentionMemberebc:TroubledDebtSecuritiesNonaccrualLoansMember2021-01-012021-12-310001810546us-gaap:CommercialPortfolioSegmentMemberebc:BusinessBankingMemberebc:ContractualObligationModificationMemberus-gaap:SpecialMentionMemberebc:TroubledDebtSecuritiesNonaccrualLoansMember2021-12-310001810546us-gaap:CommercialPortfolioSegmentMemberebc:BusinessBankingMember2021-01-012021-12-310001810546ebc:ContractualObligationModificationMemberus-gaap:SpecialMentionMemberebc:TroubledDebtRestructuringAccrualLoansMemberus-gaap:ResidentialMortgageMemberus-gaap:ResidentialPortfolioSegmentMember2021-01-012021-12-310001810546ebc:ContractualObligationModificationMemberus-gaap:SpecialMentionMemberebc:TroubledDebtRestructuringAccrualLoansMemberus-gaap:ResidentialMortgageMemberus-gaap:ResidentialPortfolioSegmentMember2021-12-310001810546ebc:ContractualObligationModificationMemberus-gaap:SpecialMentionMemberus-gaap:ResidentialMortgageMemberus-gaap:ResidentialPortfolioSegmentMemberebc:TroubledDebtSecuritiesNonaccrualLoansMember2021-01-012021-12-310001810546ebc:ContractualObligationModificationMemberus-gaap:SpecialMentionMemberus-gaap:ResidentialMortgageMemberus-gaap:ResidentialPortfolioSegmentMemberebc:TroubledDebtSecuritiesNonaccrualLoansMember2021-12-310001810546us-gaap:ResidentialMortgageMemberus-gaap:ResidentialPortfolioSegmentMember2021-01-012021-12-310001810546us-gaap:HomeEquityLoanMemberebc:ContractualObligationModificationMemberus-gaap:ConsumerPortfolioSegmentMemberus-gaap:SpecialMentionMemberebc:TroubledDebtRestructuringAccrualLoansMember2021-01-012021-12-310001810546us-gaap:HomeEquityLoanMemberebc:ContractualObligationModificationMemberus-gaap:ConsumerPortfolioSegmentMemberus-gaap:SpecialMentionMemberebc:TroubledDebtRestructuringAccrualLoansMember2021-12-310001810546us-gaap:HomeEquityLoanMemberebc:ContractualObligationModificationMemberus-gaap:ConsumerPortfolioSegmentMemberus-gaap:SpecialMentionMemberebc:TroubledDebtSecuritiesNonaccrualLoansMember2021-01-012021-12-310001810546us-gaap:HomeEquityLoanMemberebc:ContractualObligationModificationMemberus-gaap:ConsumerPortfolioSegmentMemberus-gaap:SpecialMentionMemberebc:TroubledDebtSecuritiesNonaccrualLoansMember2021-12-310001810546us-gaap:HomeEquityLoanMemberus-gaap:ConsumerPortfolioSegmentMember2021-01-012021-12-310001810546ebc:ContractualObligationModificationMemberus-gaap:ConsumerPortfolioSegmentMemberebc:OtherConsumerMemberus-gaap:SpecialMentionMemberebc:TroubledDebtRestructuringAccrualLoansMember2021-01-012021-12-310001810546ebc:ContractualObligationModificationMemberus-gaap:ConsumerPortfolioSegmentMemberebc:OtherConsumerMemberus-gaap:SpecialMentionMemberebc:TroubledDebtRestructuringAccrualLoansMember2021-12-310001810546ebc:ContractualObligationModificationMemberus-gaap:ConsumerPortfolioSegmentMemberebc:OtherConsumerMemberus-gaap:SpecialMentionMemberebc:TroubledDebtSecuritiesNonaccrualLoansMember2021-01-012021-12-310001810546ebc:ContractualObligationModificationMemberus-gaap:ConsumerPortfolioSegmentMemberebc:OtherConsumerMemberus-gaap:SpecialMentionMemberebc:TroubledDebtSecuritiesNonaccrualLoansMember2021-12-310001810546ebc:OtherConsumerMemberus-gaap:ConsumerPortfolioSegmentMember2021-01-012021-12-310001810546ebc:ContractualObligationModificationMemberus-gaap:SpecialMentionMemberebc:TroubledDebtRestructuringAccrualLoansMember2021-01-012021-12-310001810546ebc:ContractualObligationModificationMemberus-gaap:SpecialMentionMemberebc:TroubledDebtRestructuringAccrualLoansMember2021-12-310001810546ebc:ContractualObligationModificationMemberus-gaap:SpecialMentionMemberebc:TroubledDebtSecuritiesNonaccrualLoansMember2021-01-012021-12-310001810546ebc:ContractualObligationModificationMemberus-gaap:SpecialMentionMemberebc:TroubledDebtSecuritiesNonaccrualLoansMember2021-12-310001810546us-gaap:CommercialAndIndustrialSectorMemberus-gaap:CommercialPortfolioSegmentMember2020-01-012020-12-310001810546us-gaap:CommercialPortfolioSegmentMemberus-gaap:CommercialRealEstateMember2020-01-012020-12-310001810546us-gaap:CommercialPortfolioSegmentMemberebc:BusinessBankingMember2020-01-012020-12-310001810546us-gaap:ResidentialMortgageMemberus-gaap:ResidentialPortfolioSegmentMember2020-01-012020-12-310001810546us-gaap:HomeEquityLoanMemberus-gaap:ConsumerPortfolioSegmentMember2020-01-012020-12-310001810546ebc:OtherConsumerMemberus-gaap:ConsumerPortfolioSegmentMember2020-01-012020-12-310001810546ebc:PrincipalAndInterestDeferredMember2022-01-012022-12-310001810546ebc:PrincipalAndInterestDeferredMember2021-01-012021-12-310001810546ebc:PrincipalAndInterestDeferredMember2020-01-012020-12-310001810546ebc:ExtendedMaturityAndInterestOnlyPrincipalDeferredMember2022-01-012022-12-310001810546ebc:ExtendedMaturityAndInterestOnlyPrincipalDeferredMember2021-01-012021-12-310001810546ebc:ExtendedMaturityAndInterestOnlyPrincipalDeferredMember2020-01-012020-12-310001810546ebc:CovenantModificationMember2022-01-012022-12-310001810546ebc:CovenantModificationMember2021-01-012021-12-310001810546ebc:CovenantModificationMember2020-01-012020-12-310001810546ebc:InterestOrPrincipalDeferredMember2022-01-012022-12-310001810546ebc:InterestOrPrincipalDeferredMember2021-01-012021-12-310001810546ebc:InterestOrPrincipalDeferredMember2020-01-012020-12-310001810546ebc:AdjustedInterestRateAndExtendedMaturityMember2022-01-012022-12-310001810546ebc:AdjustedInterestRateAndExtendedMaturityMember2021-01-012021-12-310001810546ebc:AdjustedInterestRateAndExtendedMaturityMember2020-01-012020-12-310001810546us-gaap:ExtendedMaturityMember2022-01-012022-12-310001810546us-gaap:ExtendedMaturityMember2021-01-012021-12-310001810546us-gaap:ExtendedMaturityMember2020-01-012020-12-310001810546ebc:CourtOrderedConcessionMember2022-01-012022-12-310001810546ebc:CourtOrderedConcessionMember2021-01-012021-12-310001810546ebc:CourtOrderedConcessionMember2020-01-012020-12-310001810546ebc:OtherLoanRestructuringModificationMember2022-01-012022-12-310001810546ebc:OtherLoanRestructuringModificationMember2021-01-012021-12-310001810546ebc:OtherLoanRestructuringModificationMember2020-01-012020-12-310001810546us-gaap:CommercialPortfolioSegmentMemberus-gaap:CommercialAndIndustrialSectorMemberus-gaap:LoanParticipationsAndAssignmentsMember2022-12-310001810546us-gaap:CommercialPortfolioSegmentMemberus-gaap:CommercialAndIndustrialSectorMemberus-gaap:LoanParticipationsAndAssignmentsMember2022-01-012022-12-310001810546us-gaap:CommercialPortfolioSegmentMemberus-gaap:CommercialAndIndustrialSectorMemberus-gaap:LoanParticipationsAndAssignmentsMember2021-12-310001810546us-gaap:CommercialPortfolioSegmentMemberus-gaap:CommercialAndIndustrialSectorMemberus-gaap:LoanParticipationsAndAssignmentsMember2021-01-012021-12-310001810546us-gaap:CommercialPortfolioSegmentMemberus-gaap:CommercialRealEstateMemberus-gaap:LoanParticipationsAndAssignmentsMember2022-12-310001810546us-gaap:CommercialPortfolioSegmentMemberus-gaap:CommercialRealEstateMemberus-gaap:LoanParticipationsAndAssignmentsMember2022-01-012022-12-310001810546us-gaap:CommercialPortfolioSegmentMemberus-gaap:CommercialRealEstateMemberus-gaap:LoanParticipationsAndAssignmentsMember2021-12-310001810546us-gaap:CommercialPortfolioSegmentMemberus-gaap:CommercialRealEstateMemberus-gaap:LoanParticipationsAndAssignmentsMember2021-01-012021-12-310001810546us-gaap:CommercialPortfolioSegmentMemberus-gaap:LoanParticipationsAndAssignmentsMemberus-gaap:ConstructionLoansMember2022-12-310001810546us-gaap:CommercialPortfolioSegmentMemberus-gaap:LoanParticipationsAndAssignmentsMemberus-gaap:ConstructionLoansMember2022-01-012022-12-310001810546us-gaap:CommercialPortfolioSegmentMemberus-gaap:LoanParticipationsAndAssignmentsMemberus-gaap:ConstructionLoansMember2021-12-310001810546us-gaap:CommercialPortfolioSegmentMemberus-gaap:LoanParticipationsAndAssignmentsMemberus-gaap:ConstructionLoansMember2021-01-012021-12-310001810546us-gaap:CommercialPortfolioSegmentMemberebc:BusinessBankingMemberus-gaap:LoanParticipationsAndAssignmentsMember2022-12-310001810546us-gaap:CommercialPortfolioSegmentMemberebc:BusinessBankingMemberus-gaap:LoanParticipationsAndAssignmentsMember2022-01-012022-12-310001810546us-gaap:CommercialPortfolioSegmentMemberebc:BusinessBankingMemberus-gaap:LoanParticipationsAndAssignmentsMember2021-12-310001810546us-gaap:CommercialPortfolioSegmentMemberebc:BusinessBankingMemberus-gaap:LoanParticipationsAndAssignmentsMember2021-01-012021-12-310001810546us-gaap:LoanParticipationsAndAssignmentsMember2022-12-310001810546us-gaap:LoanParticipationsAndAssignmentsMember2022-01-012022-12-310001810546us-gaap:LoanParticipationsAndAssignmentsMember2021-12-310001810546us-gaap:LoanParticipationsAndAssignmentsMember2021-01-012021-12-310001810546us-gaap:CommercialAndIndustrialSectorMemberus-gaap:CommercialPortfolioSegmentMember2020-12-310001810546us-gaap:CommercialPortfolioSegmentMemberus-gaap:CommercialRealEstateMember2020-12-310001810546us-gaap:CommercialPortfolioSegmentMemberus-gaap:ConstructionLoansMember2020-12-310001810546us-gaap:CommercialPortfolioSegmentMemberebc:BusinessBankingMember2020-12-310001810546us-gaap:ResidentialMortgageMemberus-gaap:ResidentialPortfolioSegmentMember2020-12-310001810546us-gaap:HomeEquityLoanMemberus-gaap:ConsumerPortfolioSegmentMember2020-12-310001810546ebc:OtherConsumerMemberus-gaap:ConsumerPortfolioSegmentMember2020-12-310001810546ebc:OtherClassOfFinancingReceivableMember2020-12-310001810546us-gaap:CommercialPortfolioSegmentMemberus-gaap:ConstructionLoansMember2021-01-012021-12-310001810546ebc:OtherClassOfFinancingReceivableMember2021-01-012021-12-310001810546us-gaap:CommercialPortfolioSegmentMemberus-gaap:CommercialAndIndustrialSectorMemberebc:UnratedMemberus-gaap:NonperformingFinancingReceivableMember2021-12-310001810546us-gaap:CommercialPortfolioSegmentMemberus-gaap:CommercialRealEstateMemberebc:UnratedMemberus-gaap:NonperformingFinancingReceivableMember2021-12-310001810546us-gaap:CommercialPortfolioSegmentMemberebc:UnratedMemberus-gaap:NonperformingFinancingReceivableMemberus-gaap:ConstructionLoansMember2021-12-310001810546us-gaap:CommercialPortfolioSegmentMemberebc:BusinessBankingMemberebc:UnratedMemberus-gaap:NonperformingFinancingReceivableMember2021-12-310001810546ebc:UnratedMemberus-gaap:NonperformingFinancingReceivableMember2021-12-310001810546us-gaap:CommercialPortfolioSegmentMemberus-gaap:CommercialAndIndustrialSectorMemberus-gaap:NonperformingFinancingReceivableMemberus-gaap:PassMember2021-12-310001810546us-gaap:CommercialPortfolioSegmentMemberus-gaap:CommercialRealEstateMemberus-gaap:NonperformingFinancingReceivableMemberus-gaap:PassMember2021-12-310001810546us-gaap:CommercialPortfolioSegmentMemberus-gaap:NonperformingFinancingReceivableMemberus-gaap:ConstructionLoansMemberus-gaap:PassMember2021-12-310001810546us-gaap:CommercialPortfolioSegmentMemberebc:BusinessBankingMemberus-gaap:NonperformingFinancingReceivableMemberus-gaap:PassMember2021-12-310001810546us-gaap:NonperformingFinancingReceivableMemberus-gaap:PassMember2021-12-310001810546us-gaap:CommercialPortfolioSegmentMemberus-gaap:CommercialAndIndustrialSectorMemberus-gaap:SpecialMentionMemberus-gaap:NonperformingFinancingReceivableMember2021-12-310001810546us-gaap:CommercialPortfolioSegmentMemberus-gaap:CommercialRealEstateMemberus-gaap:SpecialMentionMemberus-gaap:NonperformingFinancingReceivableMember2021-12-310001810546us-gaap:CommercialPortfolioSegmentMemberus-gaap:SpecialMentionMemberus-gaap:NonperformingFinancingReceivableMemberus-gaap:ConstructionLoansMember2021-12-310001810546us-gaap:CommercialPortfolioSegmentMemberebc:BusinessBankingMemberus-gaap:SpecialMentionMemberus-gaap:NonperformingFinancingReceivableMember2021-12-310001810546us-gaap:SpecialMentionMemberus-gaap:NonperformingFinancingReceivableMember2021-12-310001810546us-gaap:CommercialPortfolioSegmentMemberus-gaap:CommercialAndIndustrialSectorMemberus-gaap:SubstandardMemberus-gaap:NonperformingFinancingReceivableMember2021-12-310001810546us-gaap:CommercialPortfolioSegmentMemberus-gaap:CommercialRealEstateMemberus-gaap:SubstandardMemberus-gaap:NonperformingFinancingReceivableMember2021-12-310001810546us-gaap:CommercialPortfolioSegmentMemberus-gaap:SubstandardMemberus-gaap:NonperformingFinancingReceivableMemberus-gaap:ConstructionLoansMember2021-12-310001810546us-gaap:CommercialPortfolioSegmentMemberebc:BusinessBankingMemberus-gaap:SubstandardMemberus-gaap:NonperformingFinancingReceivableMember2021-12-310001810546us-gaap:SubstandardMemberus-gaap:NonperformingFinancingReceivableMember2021-12-310001810546us-gaap:CommercialPortfolioSegmentMemberus-gaap:CommercialAndIndustrialSectorMemberus-gaap:NonperformingFinancingReceivableMemberus-gaap:DoubtfulMember2021-12-310001810546us-gaap:CommercialPortfolioSegmentMemberus-gaap:CommercialRealEstateMemberus-gaap:NonperformingFinancingReceivableMemberus-gaap:DoubtfulMember2021-12-310001810546us-gaap:CommercialPortfolioSegmentMemberus-gaap:NonperformingFinancingReceivableMemberus-gaap:ConstructionLoansMemberus-gaap:DoubtfulMember2021-12-310001810546us-gaap:CommercialPortfolioSegmentMemberebc:BusinessBankingMemberus-gaap:NonperformingFinancingReceivableMemberus-gaap:DoubtfulMember2021-12-310001810546us-gaap:NonperformingFinancingReceivableMemberus-gaap:DoubtfulMember2021-12-310001810546us-gaap:CommercialPortfolioSegmentMemberus-gaap:CommercialAndIndustrialSectorMemberus-gaap:UnlikelyToBeCollectedFinancingReceivableMemberus-gaap:NonperformingFinancingReceivableMember2021-12-310001810546us-gaap:CommercialPortfolioSegmentMemberus-gaap:CommercialRealEstateMemberus-gaap:UnlikelyToBeCollectedFinancingReceivableMemberus-gaap:NonperformingFinancingReceivableMember2021-12-310001810546us-gaap:CommercialPortfolioSegmentMemberus-gaap:UnlikelyToBeCollectedFinancingReceivableMemberus-gaap:NonperformingFinancingReceivableMemberus-gaap:ConstructionLoansMember2021-12-310001810546us-gaap:CommercialPortfolioSegmentMemberebc:BusinessBankingMemberus-gaap:UnlikelyToBeCollectedFinancingReceivableMemberus-gaap:NonperformingFinancingReceivableMember2021-12-310001810546us-gaap:UnlikelyToBeCollectedFinancingReceivableMemberus-gaap:NonperformingFinancingReceivableMember2021-12-310001810546us-gaap:CommercialPortfolioSegmentMemberus-gaap:CommercialAndIndustrialSectorMemberus-gaap:NonperformingFinancingReceivableMember2021-12-310001810546us-gaap:CommercialPortfolioSegmentMemberus-gaap:CommercialRealEstateMemberus-gaap:NonperformingFinancingReceivableMember2021-12-310001810546us-gaap:CommercialPortfolioSegmentMemberus-gaap:NonperformingFinancingReceivableMemberus-gaap:ConstructionLoansMember2021-12-310001810546us-gaap:CommercialPortfolioSegmentMemberebc:BusinessBankingMemberus-gaap:NonperformingFinancingReceivableMember2021-12-310001810546us-gaap:NonperformingFinancingReceivableMember2021-12-310001810546us-gaap:CommercialPortfolioSegmentMemberus-gaap:CommercialAndIndustrialSectorMemberebc:UnratedMemberus-gaap:NonperformingFinancingReceivableMemberebc:PaycheckProtectionProgramMember2021-12-310001810546us-gaap:CommercialPortfolioSegmentMemberebc:BusinessBankingMemberebc:UnratedMemberus-gaap:NonperformingFinancingReceivableMemberebc:PaycheckProtectionProgramMember2021-12-310001810546us-gaap:EstimateOfFairValueFairValueDisclosureMember2021-01-012021-12-310001810546us-gaap:CarryingReportedAmountFairValueDisclosureMember2021-01-012021-12-310001810546us-gaap:LandMember2022-12-310001810546us-gaap:LandMember2021-12-310001810546us-gaap:BuildingMember2022-12-310001810546us-gaap:BuildingMember2021-12-310001810546srt:MinimumMemberus-gaap:BuildingMember2022-12-310001810546us-gaap:BuildingMembersrt:MaximumMember2022-12-310001810546us-gaap:EquipmentMember2022-12-310001810546us-gaap:EquipmentMember2021-12-310001810546srt:MinimumMemberus-gaap:EquipmentMember2022-12-310001810546us-gaap:EquipmentMembersrt:MaximumMember2022-12-310001810546us-gaap:LeaseholdImprovementsMember2022-12-310001810546us-gaap:LeaseholdImprovementsMember2021-12-310001810546srt:MinimumMemberus-gaap:LeaseholdImprovementsMember2022-12-310001810546srt:MaximumMemberus-gaap:LeaseholdImprovementsMember2022-12-310001810546ebc:CenturyBancorpIncMember2021-12-31ebc:property0001810546us-gaap:DisposalGroupHeldForSaleOrDisposedOfBySaleNotDiscontinuedOperationsMember2022-01-012022-12-310001810546us-gaap:DisposalGroupHeldForSaleOrDisposedOfBySaleNotDiscontinuedOperationsMember2021-01-012021-12-310001810546srt:MinimumMember2022-12-310001810546srt:MaximumMember2022-12-31ebc:extension0001810546ebc:CenturyBancorpIncMember2022-01-012022-12-31ebc:lease0001810546ebc:OperatingLeaseRightOfUseAssetsLeaseTerminationMember2021-01-012021-12-31ebc:location0001810546ebc:OperatingLeaseRightOfUseAssetsLeaseAbandonmentMember2021-01-012021-12-310001810546ebc:OperatingLeaseRightOfUseAssetsSubleaseMember2021-01-012021-12-310001810546ebc:BankingBusinessSegmentMember2022-12-310001810546ebc:BankingBusinessSegmentMember2021-12-310001810546us-gaap:CoreDepositsMemberebc:BankingBusinessSegmentMember2022-12-310001810546us-gaap:CoreDepositsMemberebc:BankingBusinessSegmentMember2021-12-310001810546ebc:BankingBusinessSegmentMember2020-12-310001810546ebc:BankingBusinessSegmentMember2022-01-012022-12-310001810546ebc:BankingBusinessSegmentMember2021-01-012021-12-310001810546us-gaap:CoreDepositsMember2022-12-310001810546us-gaap:CoreDepositsMember2021-12-310001810546us-gaap:FederalReserveBankAdvancesMember2022-12-310001810546us-gaap:FederalReserveBankAdvancesMember2021-12-310001810546us-gaap:FederalFundsPurchasedMember2022-01-012022-12-310001810546us-gaap:FederalFundsPurchasedMember2021-01-012021-12-310001810546us-gaap:FederalFundsPurchasedMember2020-01-012020-12-310001810546us-gaap:FederalHomeLoanBankAdvancesMember2022-01-012022-12-310001810546us-gaap:FederalHomeLoanBankAdvancesMember2021-01-012021-12-310001810546us-gaap:FederalHomeLoanBankAdvancesMember2020-01-012020-12-310001810546ebc:EscrowDepositsOfBorrowersMember2022-01-012022-12-310001810546ebc:EscrowDepositsOfBorrowersMember2021-01-012021-12-310001810546ebc:EscrowDepositsOfBorrowersMember2020-01-012020-12-310001810546ebc:InterestRateSwapCollateralFundsMember2022-01-012022-12-310001810546ebc:InterestRateSwapCollateralFundsMember2021-01-012021-12-310001810546ebc:InterestRateSwapCollateralFundsMember2020-01-012020-12-310001810546srt:FederalHomeLoanBankOfBostonMember2022-12-310001810546srt:FederalHomeLoanBankOfBostonMember2021-12-310001810546srt:FederalHomeLoanBankOfBostonMemberebc:LongTermFederalHomeLoanBankAdvancesMember2022-12-310001810546srt:FederalHomeLoanBankOfBostonMemberebc:LongTermFederalHomeLoanBankAdvancesMember2021-12-310001810546srt:FederalHomeLoanBankOfBostonMemberus-gaap:FederalHomeLoanBankAdvancesMemberus-gaap:ResidentialMortgageBackedSecuritiesMember2022-12-310001810546srt:FederalHomeLoanBankOfBostonMemberus-gaap:FederalHomeLoanBankAdvancesMemberus-gaap:CommercialMortgageBackedSecuritiesMember2022-12-310001810546srt:FederalHomeLoanBankOfBostonMemberus-gaap:FederalHomeLoanBankAdvancesMemberus-gaap:ResidentialMortgageBackedSecuritiesMember2021-12-310001810546srt:FederalHomeLoanBankOfBostonMemberus-gaap:FederalHomeLoanBankAdvancesMemberus-gaap:CommercialMortgageBackedSecuritiesMember2021-12-310001810546srt:FederalHomeLoanBankOfBostonMemberus-gaap:FederalHomeLoanBankAdvancesMember2022-12-310001810546srt:FederalHomeLoanBankOfBostonMemberus-gaap:FederalHomeLoanBankAdvancesMember2021-12-3100018105462022-10-012022-12-310001810546us-gaap:SegmentDiscontinuedOperationsMember2022-12-310001810546us-gaap:SegmentDiscontinuedOperationsMember2021-12-310001810546us-gaap:StateAndLocalJurisdictionMember2022-12-310001810546us-gaap:StateAndLocalJurisdictionMember2021-12-310001810546us-gaap:StateAndLocalJurisdictionMember2022-01-012022-12-310001810546us-gaap:DomesticCountryMember2022-01-012022-12-310001810546us-gaap:DomesticCountryMember2021-01-012021-12-310001810546ebc:LowIncomeHousingTaxCreditAndOtherTaxCreditInvestmentsMember2022-01-012022-12-310001810546us-gaap:RenewableEnergyProgramMember2022-12-310001810546us-gaap:RenewableEnergyProgramMember2021-12-310001810546ebc:LowIncomeHousingTaxCreditAndOtherTaxCreditInvestmentsMember2020-01-012020-12-310001810546ebc:LowIncomeHousingTaxCreditAndOtherTaxCreditInvestmentsMember2021-01-012021-12-3100018105462021-11-122021-11-1200018105462022-09-0700018105462022-09-072022-09-0700018105462021-12-012021-12-3100018105462022-01-012022-01-3100018105462022-01-3100018105462022-02-012022-02-2800018105462022-02-2800018105462022-03-012022-03-3100018105462022-03-3100018105462022-04-012022-04-3000018105462022-04-3000018105462022-05-012022-05-3100018105462022-05-3100018105462022-06-012022-06-3000018105462022-06-3000018105462022-07-012022-07-3100018105462022-07-3100018105462022-08-012022-08-3100018105462022-08-3100018105462022-09-012022-09-3000018105462022-09-3000018105462022-10-012022-10-3100018105462022-10-3100018105462022-11-012022-11-3000018105462022-11-3000018105462022-12-012022-12-3100018105462022-01-012022-03-3100018105462022-04-012022-06-3000018105462022-07-012022-09-3000018105462021-01-012021-03-3100018105462021-04-012021-06-3000018105462021-07-012021-09-3000018105462021-10-012021-12-310001810546us-gaap:PensionPlansDefinedBenefitMemberus-gaap:QualifiedPlanMember2022-01-012022-12-31utr:H0001810546us-gaap:PensionPlansDefinedBenefitMemberus-gaap:QualifiedPlanMember2020-10-310001810546us-gaap:PensionPlansDefinedBenefitMemberus-gaap:NonqualifiedPlanMember2020-11-010001810546srt:MinimumMemberus-gaap:DefinedBenefitPlanEquitySecuritiesMember2022-12-310001810546us-gaap:DefinedBenefitPlanEquitySecuritiesMembersrt:MaximumMember2022-12-310001810546srt:MinimumMemberus-gaap:FixedIncomeSecuritiesMember2022-12-310001810546us-gaap:FixedIncomeSecuritiesMembersrt:MaximumMember2022-12-310001810546srt:MinimumMemberus-gaap:HedgeFundsMember2022-12-310001810546us-gaap:HedgeFundsMembersrt:MaximumMember2022-12-310001810546us-gaap:PensionPlansDefinedBenefitMember2021-12-310001810546us-gaap:PensionPlansDefinedBenefitMember2020-12-310001810546us-gaap:PensionPlansDefinedBenefitMember2019-12-310001810546us-gaap:PensionPlansDefinedBenefitMember2022-01-012022-12-310001810546us-gaap:PensionPlansDefinedBenefitMember2021-01-012021-12-310001810546us-gaap:PensionPlansDefinedBenefitMember2020-01-012020-12-310001810546us-gaap:PensionPlansDefinedBenefitMember2022-12-310001810546ebc:BenefitEqualizationPlanMemberus-gaap:PensionPlansDefinedBenefitMember2022-12-310001810546ebc:BenefitEqualizationPlanMemberus-gaap:PensionPlansDefinedBenefitMember2021-12-310001810546ebc:DefinedBenefitSupplementalExecutiveRetirementPlanMemberus-gaap:SupplementalEmployeeRetirementPlanDefinedBenefitMember2022-12-310001810546ebc:DefinedBenefitSupplementalExecutiveRetirementPlanMemberus-gaap:SupplementalEmployeeRetirementPlanDefinedBenefitMember2021-12-310001810546ebc:OutsideDirectorsRetainerContinuancePlanMemberus-gaap:PensionPlansDefinedBenefitMember2022-12-310001810546ebc:OutsideDirectorsRetainerContinuancePlanMemberus-gaap:PensionPlansDefinedBenefitMember2021-12-310001810546ebc:BenefitEqualizationPlanMemberus-gaap:PensionPlansDefinedBenefitMember2022-01-012022-12-310001810546ebc:BenefitEqualizationPlanMemberus-gaap:PensionPlansDefinedBenefitMember2021-01-012021-12-310001810546ebc:BenefitEqualizationPlanMemberus-gaap:PensionPlansDefinedBenefitMember2020-01-012020-12-310001810546ebc:DefinedBenefitSupplementalExecutiveRetirementPlanMemberus-gaap:SupplementalEmployeeRetirementPlanDefinedBenefitMember2022-01-012022-12-310001810546ebc:DefinedBenefitSupplementalExecutiveRetirementPlanMemberus-gaap:SupplementalEmployeeRetirementPlanDefinedBenefitMember2021-01-012021-12-310001810546ebc:DefinedBenefitSupplementalExecutiveRetirementPlanMemberus-gaap:SupplementalEmployeeRetirementPlanDefinedBenefitMember2020-01-012020-12-310001810546ebc:OutsideDirectorsRetainerContinuancePlanMemberus-gaap:PensionPlansDefinedBenefitMember2022-01-012022-12-310001810546ebc:OutsideDirectorsRetainerContinuancePlanMemberus-gaap:PensionPlansDefinedBenefitMember2021-01-012021-12-310001810546ebc:OutsideDirectorsRetainerContinuancePlanMemberus-gaap:PensionPlansDefinedBenefitMember2020-01-012020-12-310001810546us-gaap:AssetManagementArrangementMember2022-12-310001810546us-gaap:AssetManagementArrangementMember2021-12-310001810546us-gaap:AssetManagementArrangementMember2020-12-310001810546us-gaap:AssetManagementArrangementMember2022-01-012022-12-310001810546us-gaap:AssetManagementArrangementMember2021-01-012021-12-310001810546us-gaap:DiscontinuedOperationsHeldforsaleMemberebc:InsuranceBusinessMember2022-01-012022-12-310001810546us-gaap:DiscontinuedOperationsHeldforsaleMemberebc:InsuranceBusinessMember2021-01-012021-12-310001810546us-gaap:DiscontinuedOperationsHeldforsaleMemberebc:InsuranceBusinessMember2020-01-012020-12-3100018105462020-10-140001810546ebc:EmployeeStockOwnershipPlanESOPTimePeriodOneMember2022-12-310001810546ebc:EmployeeStockOwnershipPlanESOPTimePeriodTwoMember2022-12-310001810546ebc:DefinedContributionSupplementalExecutiveRetirementPlanMemberus-gaap:SupplementalEmployeeRetirementPlanDefinedBenefitMember2022-01-012022-12-310001810546ebc:DefinedContributionSupplementalExecutiveRetirementPlanMemberus-gaap:SupplementalEmployeeRetirementPlanDefinedBenefitMember2021-01-012021-12-310001810546ebc:DefinedContributionSupplementalExecutiveRetirementPlanMemberus-gaap:SupplementalEmployeeRetirementPlanDefinedBenefitMember2020-01-012020-12-310001810546ebc:DefinedBenefitSupplementalExecutiveRetirementPlanMemberus-gaap:VariableInterestEntityPrimaryBeneficiaryMemberus-gaap:NonqualifiedPlanMemberus-gaap:SupplementalEmployeeRetirementPlanDefinedBenefitMember2022-12-310001810546ebc:DefinedBenefitSupplementalExecutiveRetirementPlanMemberus-gaap:VariableInterestEntityPrimaryBeneficiaryMemberus-gaap:NonqualifiedPlanMemberus-gaap:SupplementalEmployeeRetirementPlanDefinedBenefitMember2021-12-310001810546ebc:BenefitEqualizationPlanMemberus-gaap:PensionPlansDefinedBenefitMemberus-gaap:VariableInterestEntityPrimaryBeneficiaryMemberus-gaap:NonqualifiedPlanMember2022-12-310001810546ebc:BenefitEqualizationPlanMemberus-gaap:PensionPlansDefinedBenefitMemberus-gaap:VariableInterestEntityPrimaryBeneficiaryMemberus-gaap:NonqualifiedPlanMember2021-12-310001810546us-gaap:PensionPlansDefinedBenefitMemberebc:OutsideDirectorsRetainerContinuancePlanMemberus-gaap:VariableInterestEntityPrimaryBeneficiaryMemberus-gaap:NonqualifiedPlanMember2022-12-310001810546us-gaap:PensionPlansDefinedBenefitMemberebc:OutsideDirectorsRetainerContinuancePlanMemberus-gaap:VariableInterestEntityPrimaryBeneficiaryMemberus-gaap:NonqualifiedPlanMember2021-12-310001810546us-gaap:VariableInterestEntityPrimaryBeneficiaryMemberebc:DefinedContributionSupplementalExecutiveRetirementPlanMemberus-gaap:NonqualifiedPlanMemberus-gaap:SupplementalEmployeeRetirementPlanDefinedBenefitMember2022-12-310001810546us-gaap:VariableInterestEntityPrimaryBeneficiaryMemberebc:DefinedContributionSupplementalExecutiveRetirementPlanMemberus-gaap:NonqualifiedPlanMemberus-gaap:SupplementalEmployeeRetirementPlanDefinedBenefitMember2021-12-310001810546us-gaap:DeferredCompensationShareBasedPaymentsMemberus-gaap:VariableInterestEntityPrimaryBeneficiaryMemberus-gaap:NonqualifiedPlanMember2022-12-310001810546us-gaap:DeferredCompensationShareBasedPaymentsMemberus-gaap:VariableInterestEntityPrimaryBeneficiaryMemberus-gaap:NonqualifiedPlanMember2021-12-310001810546us-gaap:VariableInterestEntityPrimaryBeneficiaryMemberus-gaap:NonqualifiedPlanMember2022-12-310001810546us-gaap:VariableInterestEntityPrimaryBeneficiaryMemberus-gaap:NonqualifiedPlanMember2021-12-310001810546us-gaap:CashAndCashEquivalentsMemberus-gaap:VariableInterestEntityPrimaryBeneficiaryMember2022-12-310001810546us-gaap:CashAndCashEquivalentsMemberus-gaap:VariableInterestEntityPrimaryBeneficiaryMember2021-12-310001810546us-gaap:EquitySecuritiesMemberus-gaap:VariableInterestEntityPrimaryBeneficiaryMember2022-12-310001810546us-gaap:EquitySecuritiesMemberus-gaap:VariableInterestEntityPrimaryBeneficiaryMember2021-12-310001810546us-gaap:FixedIncomeSecuritiesMemberus-gaap:VariableInterestEntityPrimaryBeneficiaryMember2022-12-310001810546us-gaap:FixedIncomeSecuritiesMemberus-gaap:VariableInterestEntityPrimaryBeneficiaryMember2021-12-310001810546us-gaap:VariableInterestEntityPrimaryBeneficiaryMember2022-12-310001810546us-gaap:VariableInterestEntityPrimaryBeneficiaryMember2021-12-310001810546us-gaap:EquitySecuritiesMember2022-12-310001810546us-gaap:EquitySecuritiesMember2021-12-310001810546ebc:EasternBanksharesInc2021EquityIncentivePlanMember2021-11-290001810546ebc:EasternBanksharesInc2021EquityIncentivePlanMemberus-gaap:RestrictedStockUnitsRSUMember2021-11-290001810546us-gaap:EmployeeStockOptionMemberebc:EasternBanksharesInc2021EquityIncentivePlanMember2021-11-2900018105462021-11-290001810546ebc:EasternBanksharesInc2021EquityIncentivePlanMemberus-gaap:RestrictedStockMember2021-11-292021-11-290001810546us-gaap:EmployeeStockOptionMemberebc:EasternBanksharesInc2021EquityIncentivePlanMember2021-11-292021-11-290001810546us-gaap:RestrictedStockUnitsRSUMember2022-03-012022-03-010001810546srt:MinimumMemberebc:EasternBanksharesInc2021EquityIncentivePlanMemberus-gaap:RestrictedStockUnitsRSUMember2022-03-012022-03-010001810546ebc:EasternBanksharesInc2021EquityIncentivePlanMemberus-gaap:RestrictedStockUnitsRSUMembersrt:MaximumMember2022-03-012022-03-010001810546us-gaap:PerformanceSharesMember2022-03-012022-03-010001810546us-gaap:RestrictedStockMember2022-05-172022-05-170001810546ebc:EasternBanksharesInc2021EquityIncentivePlanMemberus-gaap:RestrictedStockMember2022-05-172022-05-170001810546ebc:EasternBanksharesInc2021EquityIncentivePlanMemberus-gaap:RestrictedStockUnitsRSUMember2022-12-310001810546ebc:EasternBanksharesInc2021EquityIncentivePlanMemberus-gaap:RestrictedStockUnitsRSUMember2021-12-310001810546us-gaap:EmployeeStockOptionMemberebc:EasternBanksharesInc2021EquityIncentivePlanMember2022-12-310001810546us-gaap:EmployeeStockOptionMemberebc:EasternBanksharesInc2021EquityIncentivePlanMember2021-12-310001810546us-gaap:EmployeeStockOptionMemberebc:EasternBanksharesInc2021EquityIncentivePlanMember2021-11-292021-12-310001810546us-gaap:EmployeeStockOptionMemberebc:EasternBanksharesInc2021EquityIncentivePlanMember2021-11-292022-12-310001810546us-gaap:RestrictedStockMember2021-12-310001810546us-gaap:RestrictedStockMember2020-12-310001810546us-gaap:RestrictedStockMember2022-01-012022-12-310001810546us-gaap:RestrictedStockMember2021-01-012021-12-310001810546us-gaap:RestrictedStockMember2022-12-310001810546us-gaap:RestrictedStockUnitsRSUMember2021-12-310001810546us-gaap:RestrictedStockUnitsRSUMember2020-12-310001810546us-gaap:RestrictedStockUnitsRSUMember2022-01-012022-12-310001810546us-gaap:RestrictedStockUnitsRSUMember2021-01-012021-12-310001810546us-gaap:RestrictedStockUnitsRSUMember2022-12-310001810546us-gaap:PerformanceSharesMember2021-12-310001810546us-gaap:PerformanceSharesMember2020-12-310001810546us-gaap:PerformanceSharesMember2022-01-012022-12-310001810546us-gaap:PerformanceSharesMember2021-01-012021-12-310001810546us-gaap:PerformanceSharesMember2022-12-310001810546ebc:EasternBanksharesInc2021EquityIncentivePlanMemberus-gaap:RestrictedStockUnitsRSUMember2021-11-292022-12-310001810546ebc:EasternBanksharesInc2021EquityIncentivePlanMemberus-gaap:RestrictedStockUnitsRSUMember2021-11-292021-12-310001810546ebc:EasternBanksharesInc2021EquityIncentivePlanMember2022-01-012022-12-310001810546ebc:EasternBanksharesInc2021EquityIncentivePlanMember2021-01-012021-12-310001810546ebc:EasternBanksharesInc2021EquityIncentivePlanMemberus-gaap:RestrictedStockUnitsRSUMember2022-01-012022-12-310001810546ebc:EasternBanksharesInc2021EquityIncentivePlanMemberus-gaap:RestrictedStockUnitsRSUMember2021-01-012021-12-310001810546us-gaap:CommitmentsToExtendCreditMember2022-12-310001810546us-gaap:CommitmentsToExtendCreditMember2021-12-310001810546us-gaap:StandbyLettersOfCreditMember2022-12-310001810546us-gaap:StandbyLettersOfCreditMember2021-12-310001810546ebc:ForwardCommitmentsToSellLoansMember2022-12-310001810546ebc:ForwardCommitmentsToSellLoansMember2021-12-31ebc:settlement0001810546us-gaap:DesignatedAsHedgingInstrumentMemberus-gaap:InterestRateSwapMember2022-12-310001810546us-gaap:DesignatedAsHedgingInstrumentMemberus-gaap:InterestRateSwapMember2022-01-012022-12-310001810546ebc:ActiveCashFlowHedgesMemberus-gaap:InterestIncomeMember2022-12-310001810546ebc:AccumulatedGainLossNetTerminatedCashFlowHedgeParentMember2021-12-310001810546ebc:AccumulatedGainLossNetTerminatedCashFlowHedgeParentMember2020-12-310001810546ebc:AccumulatedGainLossNetTerminatedCashFlowHedgeParentMember2019-12-310001810546ebc:AccumulatedGainLossNetTerminatedCashFlowHedgeParentMember2022-12-310001810546ebc:TerminationOfCashFlowHedgesMemberus-gaap:InterestIncomeMember2022-12-310001810546us-gaap:InterestRateSwapMemberus-gaap:NondesignatedMember2022-12-310001810546us-gaap:NondesignatedMemberebc:RiskParticipationAgreementsMember2022-12-310001810546ebc:ForeignExchangeCurrencyContractsMatchedBookCustomerMemberus-gaap:NondesignatedMember2022-12-310001810546ebc:ForeignExchangeCurrencyContractsForeignCurrencyLoanMemberus-gaap:NondesignatedMember2022-12-310001810546us-gaap:InterestRateSwapMemberus-gaap:NondesignatedMember2021-12-310001810546us-gaap:NondesignatedMemberebc:RiskParticipationAgreementsMember2021-12-310001810546ebc:ForeignExchangeCurrencyContractsMatchedBookCustomerMemberus-gaap:NondesignatedMember2021-12-310001810546ebc:ForeignExchangeCurrencyContractsForeignCurrencyLoanMemberus-gaap:NondesignatedMember2021-12-310001810546us-gaap:OtherAssetsMember2022-12-310001810546us-gaap:OtherAssetsMember2021-12-310001810546us-gaap:OtherLiabilitiesMember2022-12-310001810546us-gaap:OtherLiabilitiesMember2021-12-310001810546us-gaap:OtherAssetsMemberebc:RiskParticipationAgreementsMember2022-12-310001810546us-gaap:OtherAssetsMemberebc:RiskParticipationAgreementsMember2021-12-310001810546us-gaap:OtherLiabilitiesMemberebc:RiskParticipationAgreementsMember2022-12-310001810546us-gaap:OtherLiabilitiesMemberebc:RiskParticipationAgreementsMember2021-12-310001810546ebc:ForeignExchangeCurrencyContractsMatchedBookCustomerMemberus-gaap:OtherAssetsMember2022-12-310001810546ebc:ForeignExchangeCurrencyContractsMatchedBookCustomerMemberus-gaap:OtherAssetsMember2021-12-310001810546ebc:ForeignExchangeCurrencyContractsMatchedBookCustomerMemberus-gaap:OtherLiabilitiesMember2022-12-310001810546ebc:ForeignExchangeCurrencyContractsMatchedBookCustomerMemberus-gaap:OtherLiabilitiesMember2021-12-310001810546ebc:ForeignExchangeCurrencyContractsForeignCurrencyLoanMemberus-gaap:OtherAssetsMember2022-12-310001810546ebc:ForeignExchangeCurrencyContractsForeignCurrencyLoanMemberus-gaap:OtherAssetsMember2021-12-310001810546ebc:ForeignExchangeCurrencyContractsForeignCurrencyLoanMemberus-gaap:OtherLiabilitiesMember2022-12-310001810546ebc:ForeignExchangeCurrencyContractsForeignCurrencyLoanMemberus-gaap:OtherLiabilitiesMember2021-12-310001810546us-gaap:InterestIncomeMember2022-10-012022-12-310001810546us-gaap:InterestIncomeMember2021-10-012021-12-310001810546us-gaap:InterestIncomeMember2020-01-012020-12-310001810546us-gaap:NetInvestmentHedgingMemberus-gaap:InterestIncomeMember2022-10-012022-12-310001810546us-gaap:NetInvestmentHedgingMemberus-gaap:InterestIncomeMember2021-10-012021-12-310001810546us-gaap:NetInvestmentHedgingMemberus-gaap:InterestIncomeMember2020-01-012020-12-310001810546us-gaap:OtherIncomeMember2022-10-012022-12-310001810546us-gaap:OtherIncomeMember2021-10-012021-12-310001810546us-gaap:OtherIncomeMember2020-01-012020-12-310001810546us-gaap:InterestIncomeMemberus-gaap:InterestRateSwapMember2022-10-012022-12-310001810546us-gaap:InterestIncomeMemberus-gaap:InterestRateSwapMember2021-10-012021-12-310001810546us-gaap:InterestIncomeMemberus-gaap:InterestRateSwapMember2020-01-012020-12-310001810546us-gaap:InterestIncomeMemberebc:RiskParticipationAgreementsMember2022-10-012022-12-310001810546us-gaap:InterestIncomeMemberebc:RiskParticipationAgreementsMember2021-10-012021-12-310001810546us-gaap:InterestIncomeMemberebc:RiskParticipationAgreementsMember2020-01-012020-12-310001810546ebc:ForeignExchangeCurrencyContractsMatchedBookCustomerMemberus-gaap:OtherIncomeMember2022-10-012022-12-310001810546ebc:ForeignExchangeCurrencyContractsMatchedBookCustomerMemberus-gaap:OtherIncomeMember2021-10-012021-12-310001810546ebc:ForeignExchangeCurrencyContractsMatchedBookCustomerMemberus-gaap:OtherIncomeMember2020-01-012020-12-310001810546ebc:ForeignExchangeCurrencyContractsForeignCurrencyLoanMemberus-gaap:OtherIncomeMember2022-10-012022-12-310001810546ebc:ForeignExchangeCurrencyContractsForeignCurrencyLoanMemberus-gaap:OtherIncomeMember2021-10-012021-12-310001810546ebc:ForeignExchangeCurrencyContractsForeignCurrencyLoanMemberus-gaap:OtherIncomeMember2020-01-012020-12-310001810546ebc:ClearedDerivativeTransactionMemberebc:RestrictedAssetsMemberus-gaap:CashAndCashEquivalentsMember2022-12-310001810546ebc:ClearedDerivativeTransactionMemberebc:RestrictedAssetsMemberus-gaap:AvailableforsaleSecuritiesMember2021-12-310001810546ebc:NonClearedDerivativeTransactionsMemberebc:CustomerRelatedInterestRateSwapDerivativesMember2022-12-310001810546ebc:NonClearedDerivativeTransactionsMemberebc:CustomerRelatedInterestRateSwapDerivativesMember2021-12-310001810546ebc:NonClearedDerivativeTransactionsMemberebc:CustomerRelatedInterestRateSwapDerivativesMemberus-gaap:CashAndCashEquivalentsMember2022-12-310001810546ebc:NonClearedDerivativeTransactionsMemberebc:CustomerRelatedInterestRateSwapDerivativesMemberus-gaap:AvailableforsaleSecuritiesMember2021-12-310001810546us-gaap:LoanOriginationCommitmentsMember2022-12-310001810546us-gaap:LoanOriginationCommitmentsMember2021-12-310001810546us-gaap:ForwardContractsMember2022-12-310001810546us-gaap:ForwardContractsMember2021-12-310001810546us-gaap:InterestRateSwapMember2022-12-310001810546us-gaap:IndividuallyImmaterialCounterpartiesMemberus-gaap:InterestRateSwapMember2022-12-310001810546us-gaap:IndividuallyImmaterialCounterpartiesMemberebc:RiskParticipationAgreementsMember2022-12-310001810546ebc:ForeignExchangeCurrencyContractsMatchedBookCustomerMemberus-gaap:IndividuallyImmaterialCounterpartiesMember2022-12-310001810546ebc:ForeignExchangeCurrencyContractsForeignCurrencyLoanMember2022-12-310001810546us-gaap:IndividuallyImmaterialCounterpartiesMember2022-12-310001810546ebc:ForeignExchangeCurrencyContractsForeignCurrencyLoanMemberus-gaap:IndividuallyImmaterialCounterpartiesMember2022-12-310001810546us-gaap:IndividuallyImmaterialCounterpartiesMemberus-gaap:InterestRateSwapMember2021-12-310001810546us-gaap:IndividuallyImmaterialCounterpartiesMemberebc:RiskParticipationAgreementsMember2021-12-310001810546ebc:ForeignExchangeCurrencyContractsMatchedBookCustomerMemberus-gaap:IndividuallyImmaterialCounterpartiesMember2021-12-310001810546ebc:ForeignExchangeCurrencyContractsForeignCurrencyLoanMember2021-12-310001810546us-gaap:IndividuallyImmaterialCounterpartiesMember2021-12-310001810546ebc:ForeignExchangeCurrencyContractsForeignCurrencyLoanMemberus-gaap:IndividuallyImmaterialCounterpartiesMember2021-12-310001810546us-gaap:CarryingReportedAmountFairValueDisclosureMembersrt:MaximumMember2022-01-012022-12-310001810546ebc:MutualFundsMemberus-gaap:FairValueInputsLevel1Member2022-12-310001810546ebc:MutualFundsMemberus-gaap:FairValueInputsLevel1Member2021-12-310001810546us-gaap:FairValueMeasurementsRecurringMemberus-gaap:MortgageBackedSecuritiesIssuedByUSGovernmentSponsoredEnterprisesMember2022-12-310001810546us-gaap:FairValueMeasurementsRecurringMemberus-gaap:FairValueInputsLevel1Memberus-gaap:MortgageBackedSecuritiesIssuedByUSGovernmentSponsoredEnterprisesMember2022-12-310001810546us-gaap:FairValueMeasurementsRecurringMemberus-gaap:FairValueInputsLevel2Memberus-gaap:MortgageBackedSecuritiesIssuedByUSGovernmentSponsoredEnterprisesMember2022-12-310001810546us-gaap:FairValueInputsLevel3Memberus-gaap:FairValueMeasurementsRecurringMemberus-gaap:MortgageBackedSecuritiesIssuedByUSGovernmentSponsoredEnterprisesMember2022-12-310001810546ebc:CommercialMortgageBackedSecuritiesIssuedByUSGovernmentSponsoredEnterprisesMemberus-gaap:FairValueMeasurementsRecurringMember2022-12-310001810546ebc:CommercialMortgageBackedSecuritiesIssuedByUSGovernmentSponsoredEnterprisesMemberus-gaap:FairValueMeasurementsRecurringMemberus-gaap:FairValueInputsLevel1Member2022-12-310001810546ebc:CommercialMortgageBackedSecuritiesIssuedByUSGovernmentSponsoredEnterprisesMemberus-gaap:FairValueMeasurementsRecurringMemberus-gaap:FairValueInputsLevel2Member2022-12-310001810546us-gaap:FairValueInputsLevel3Memberebc:CommercialMortgageBackedSecuritiesIssuedByUSGovernmentSponsoredEnterprisesMemberus-gaap:FairValueMeasurementsRecurringMember2022-12-310001810546us-gaap:FairValueMeasurementsRecurringMemberus-gaap:USGovernmentAgenciesDebtSecuritiesMember2022-12-310001810546us-gaap:FairValueMeasurementsRecurringMemberus-gaap:FairValueInputsLevel1Memberus-gaap:USGovernmentAgenciesDebtSecuritiesMember2022-12-310001810546us-gaap:FairValueMeasurementsRecurringMemberus-gaap:USGovernmentAgenciesDebtSecuritiesMemberus-gaap:FairValueInputsLevel2Member2022-12-310001810546us-gaap:FairValueInputsLevel3Memberus-gaap:FairValueMeasurementsRecurringMemberus-gaap:USGovernmentAgenciesDebtSecuritiesMember2022-12-310001810546us-gaap:USTreasurySecuritiesMemberus-gaap:FairValueMeasurementsRecurringMember2022-12-310001810546us-gaap:USTreasurySecuritiesMemberus-gaap:FairValueMeasurementsRecurringMemberus-gaap:FairValueInputsLevel1Member2022-12-310001810546us-gaap:USTreasurySecuritiesMemberus-gaap:FairValueMeasurementsRecurringMemberus-gaap:FairValueInputsLevel2Member2022-12-310001810546us-gaap:FairValueInputsLevel3Memberus-gaap:USTreasurySecuritiesMemberus-gaap:FairValueMeasurementsRecurringMember2022-12-310001810546us-gaap:MunicipalBondsMemberus-gaap:FairValueMeasurementsRecurringMember2022-12-310001810546us-gaap:MunicipalBondsMemberus-gaap:FairValueMeasurementsRecurringMemberus-gaap:FairValueInputsLevel1Member2022-12-310001810546us-gaap:MunicipalBondsMemberus-gaap:FairValueMeasurementsRecurringMemberus-gaap:FairValueInputsLevel2Member2022-12-310001810546us-gaap:FairValueInputsLevel3Memberus-gaap:MunicipalBondsMemberus-gaap:FairValueMeasurementsRecurringMember2022-12-310001810546us-gaap:OtherDebtSecuritiesMemberus-gaap:FairValueMeasurementsRecurringMember2022-12-310001810546us-gaap:OtherDebtSecuritiesMemberus-gaap:FairValueMeasurementsRecurringMemberus-gaap:FairValueInputsLevel1Member2022-12-310001810546us-gaap:OtherDebtSecuritiesMemberus-gaap:FairValueMeasurementsRecurringMemberus-gaap:FairValueInputsLevel2Member2022-12-310001810546us-gaap:FairValueInputsLevel3Memberus-gaap:OtherDebtSecuritiesMemberus-gaap:FairValueMeasurementsRecurringMember2022-12-310001810546us-gaap:FairValueMeasurementsRecurringMember2022-12-310001810546us-gaap:FairValueMeasurementsRecurringMemberus-gaap:FairValueInputsLevel1Member2022-12-310001810546us-gaap:FairValueMeasurementsRecurringMemberus-gaap:FairValueInputsLevel2Member2022-12-310001810546us-gaap:FairValueInputsLevel3Memberus-gaap:FairValueMeasurementsRecurringMember2022-12-310001810546us-gaap:DesignatedAsHedgingInstrumentMemberus-gaap:FairValueMeasurementsRecurringMember2022-12-310001810546us-gaap:DesignatedAsHedgingInstrumentMemberus-gaap:FairValueMeasurementsRecurringMemberus-gaap:FairValueInputsLevel1Member2022-12-310001810546us-gaap:DesignatedAsHedgingInstrumentMemberus-gaap:FairValueMeasurementsRecurringMemberus-gaap:FairValueInputsLevel2Member2022-12-310001810546us-gaap:FairValueInputsLevel3Memberus-gaap:DesignatedAsHedgingInstrumentMemberus-gaap:FairValueMeasurementsRecurringMember2022-12-310001810546us-gaap:FairValueMeasurementsRecurringMemberus-gaap:NondesignatedMember2022-12-310001810546us-gaap:FairValueMeasurementsRecurringMemberus-gaap:FairValueInputsLevel1Memberus-gaap:NondesignatedMember2022-12-310001810546us-gaap:FairValueMeasurementsRecurringMemberus-gaap:FairValueInputsLevel2Memberus-gaap:NondesignatedMember2022-12-310001810546us-gaap:FairValueInputsLevel3Memberus-gaap:FairValueMeasurementsRecurringMemberus-gaap:NondesignatedMember2022-12-310001810546us-gaap:FairValueMeasurementsRecurringMemberus-gaap:MortgageBackedSecuritiesIssuedByUSGovernmentSponsoredEnterprisesMember2021-12-310001810546us-gaap:FairValueMeasurementsRecurringMemberus-gaap:FairValueInputsLevel1Memberus-gaap:MortgageBackedSecuritiesIssuedByUSGovernmentSponsoredEnterprisesMember2021-12-310001810546us-gaap:FairValueMeasurementsRecurringMemberus-gaap:FairValueInputsLevel2Memberus-gaap:MortgageBackedSecuritiesIssuedByUSGovernmentSponsoredEnterprisesMember2021-12-310001810546us-gaap:FairValueInputsLevel3Memberus-gaap:FairValueMeasurementsRecurringMemberus-gaap:MortgageBackedSecuritiesIssuedByUSGovernmentSponsoredEnterprisesMember2021-12-310001810546ebc:CommercialMortgageBackedSecuritiesIssuedByUSGovernmentSponsoredEnterprisesMemberus-gaap:FairValueMeasurementsRecurringMember2021-12-310001810546ebc:CommercialMortgageBackedSecuritiesIssuedByUSGovernmentSponsoredEnterprisesMemberus-gaap:FairValueMeasurementsRecurringMemberus-gaap:FairValueInputsLevel1Member2021-12-310001810546ebc:CommercialMortgageBackedSecuritiesIssuedByUSGovernmentSponsoredEnterprisesMemberus-gaap:FairValueMeasurementsRecurringMemberus-gaap:FairValueInputsLevel2Member2021-12-310001810546us-gaap:FairValueInputsLevel3Memberebc:CommercialMortgageBackedSecuritiesIssuedByUSGovernmentSponsoredEnterprisesMemberus-gaap:FairValueMeasurementsRecurringMember2021-12-310001810546us-gaap:FairValueMeasurementsRecurringMemberus-gaap:USGovernmentAgenciesDebtSecuritiesMember2021-12-310001810546us-gaap:FairValueMeasurementsRecurringMemberus-gaap:FairValueInputsLevel1Memberus-gaap:USGovernmentAgenciesDebtSecuritiesMember2021-12-310001810546us-gaap:FairValueMeasurementsRecurringMemberus-gaap:USGovernmentAgenciesDebtSecuritiesMemberus-gaap:FairValueInputsLevel2Member2021-12-310001810546us-gaap:FairValueInputsLevel3Memberus-gaap:FairValueMeasurementsRecurringMemberus-gaap:USGovernmentAgenciesDebtSecuritiesMember2021-12-310001810546us-gaap:USTreasurySecuritiesMemberus-gaap:FairValueMeasurementsRecurringMember2021-12-310001810546us-gaap:USTreasurySecuritiesMemberus-gaap:FairValueMeasurementsRecurringMemberus-gaap:FairValueInputsLevel1Member2021-12-310001810546us-gaap:USTreasurySecuritiesMemberus-gaap:FairValueMeasurementsRecurringMemberus-gaap:FairValueInputsLevel2Member2021-12-310001810546us-gaap:FairValueInputsLevel3Memberus-gaap:USTreasurySecuritiesMemberus-gaap:FairValueMeasurementsRecurringMember2021-12-310001810546us-gaap:MunicipalBondsMemberus-gaap:FairValueMeasurementsRecurringMember2021-12-310001810546us-gaap:MunicipalBondsMemberus-gaap:FairValueMeasurementsRecurringMemberus-gaap:FairValueInputsLevel1Member2021-12-310001810546us-gaap:MunicipalBondsMemberus-gaap:FairValueMeasurementsRecurringMemberus-gaap:FairValueInputsLevel2Member2021-12-310001810546us-gaap:FairValueInputsLevel3Memberus-gaap:MunicipalBondsMemberus-gaap:FairValueMeasurementsRecurringMember2021-12-310001810546ebc:SmallBusinessAdministrationPooledSecuritiesMemberus-gaap:FairValueMeasurementsRecurringMember2021-12-310001810546ebc:SmallBusinessAdministrationPooledSecuritiesMemberus-gaap:FairValueMeasurementsRecurringMemberus-gaap:FairValueInputsLevel1Member2021-12-310001810546ebc:SmallBusinessAdministrationPooledSecuritiesMemberus-gaap:FairValueMeasurementsRecurringMemberus-gaap:FairValueInputsLevel2Member2021-12-310001810546us-gaap:FairValueInputsLevel3Memberebc:SmallBusinessAdministrationPooledSecuritiesMemberus-gaap:FairValueMeasurementsRecurringMember2021-12-310001810546us-gaap:OtherDebtSecuritiesMemberus-gaap:FairValueMeasurementsRecurringMember2021-12-310001810546us-gaap:OtherDebtSecuritiesMemberus-gaap:FairValueMeasurementsRecurringMemberus-gaap:FairValueInputsLevel1Member2021-12-310001810546us-gaap:OtherDebtSecuritiesMemberus-gaap:FairValueMeasurementsRecurringMemberus-gaap:FairValueInputsLevel2Member2021-12-310001810546us-gaap:FairValueInputsLevel3Memberus-gaap:OtherDebtSecuritiesMemberus-gaap:FairValueMeasurementsRecurringMember2021-12-310001810546us-gaap:FairValueMeasurementsRecurringMember2021-12-310001810546us-gaap:FairValueMeasurementsRecurringMemberus-gaap:FairValueInputsLevel1Member2021-12-310001810546us-gaap:FairValueMeasurementsRecurringMemberus-gaap:FairValueInputsLevel2Member2021-12-310001810546us-gaap:FairValueInputsLevel3Memberus-gaap:FairValueMeasurementsRecurringMember2021-12-310001810546us-gaap:FairValueMeasurementsNonrecurringMember2022-12-310001810546us-gaap:FairValueInputsLevel1Memberus-gaap:FairValueMeasurementsNonrecurringMember2022-12-310001810546us-gaap:FairValueMeasurementsNonrecurringMemberus-gaap:FairValueInputsLevel2Member2022-12-310001810546us-gaap:FairValueInputsLevel3Memberus-gaap:FairValueMeasurementsNonrecurringMember2022-12-310001810546us-gaap:FairValueMeasurementsNonrecurringMember2021-12-310001810546us-gaap:FairValueInputsLevel1Member2021-12-310001810546us-gaap:FairValueInputsLevel2Member2021-12-310001810546us-gaap:FairValueInputsLevel3Memberus-gaap:FairValueMeasurementsNonrecurringMember2021-12-310001810546us-gaap:CarryingReportedAmountFairValueDisclosureMemberus-gaap:MortgageBackedSecuritiesIssuedByUSGovernmentSponsoredEnterprisesMember2022-12-310001810546us-gaap:MortgageBackedSecuritiesIssuedByUSGovernmentSponsoredEnterprisesMemberus-gaap:EstimateOfFairValueFairValueDisclosureMember2022-12-310001810546us-gaap:FairValueInputsLevel1Memberus-gaap:MortgageBackedSecuritiesIssuedByUSGovernmentSponsoredEnterprisesMember2022-12-310001810546us-gaap:FairValueInputsLevel2Memberus-gaap:MortgageBackedSecuritiesIssuedByUSGovernmentSponsoredEnterprisesMember2022-12-310001810546us-gaap:FairValueInputsLevel3Memberus-gaap:MortgageBackedSecuritiesIssuedByUSGovernmentSponsoredEnterprisesMember2022-12-310001810546ebc:CommercialMortgageBackedSecuritiesIssuedByUSGovernmentSponsoredEnterprisesMemberus-gaap:CarryingReportedAmountFairValueDisclosureMember2022-12-310001810546ebc:CommercialMortgageBackedSecuritiesIssuedByUSGovernmentSponsoredEnterprisesMemberus-gaap:EstimateOfFairValueFairValueDisclosureMember2022-12-310001810546ebc:CommercialMortgageBackedSecuritiesIssuedByUSGovernmentSponsoredEnterprisesMemberus-gaap:FairValueInputsLevel1Member2022-12-310001810546ebc:CommercialMortgageBackedSecuritiesIssuedByUSGovernmentSponsoredEnterprisesMemberus-gaap:FairValueInputsLevel2Member2022-12-310001810546us-gaap:FairValueInputsLevel3Memberebc:CommercialMortgageBackedSecuritiesIssuedByUSGovernmentSponsoredEnterprisesMember2022-12-310001810546us-gaap:CarryingReportedAmountFairValueDisclosureMember2022-12-310001810546us-gaap:EstimateOfFairValueFairValueDisclosureMember2022-12-310001810546us-gaap:FairValueInputsLevel1Member2022-12-310001810546us-gaap:FairValueInputsLevel2Member2022-12-310001810546us-gaap:FairValueInputsLevel3Member2022-12-310001810546us-gaap:CarryingReportedAmountFairValueDisclosureMember2021-12-310001810546us-gaap:EstimateOfFairValueFairValueDisclosureMember2021-12-310001810546us-gaap:FairValueInputsLevel3Member2021-12-310001810546ebc:ServiceChargeOnDepositAccountsMember2022-01-012022-12-310001810546ebc:ServiceChargeOnDepositAccountsMember2021-01-012021-12-310001810546ebc:ServiceChargeOnDepositAccountsMember2020-01-012020-12-310001810546ebc:TrustAndInvestmentAdvisoryFeesMember2022-01-012022-12-310001810546ebc:TrustAndInvestmentAdvisoryFeesMember2021-01-012021-12-310001810546ebc:TrustAndInvestmentAdvisoryFeesMember2020-01-012020-12-310001810546ebc:DebtCardProcessingFeesMember2022-01-012022-12-310001810546ebc:DebtCardProcessingFeesMember2021-01-012021-12-310001810546ebc:DebtCardProcessingFeesMember2020-01-012020-12-310001810546ebc:OtherNonInterestIncomeMember2022-01-012022-12-310001810546ebc:OtherNonInterestIncomeMember2021-01-012021-12-310001810546ebc:OtherNonInterestIncomeMember2020-01-012020-12-310001810546ebc:CashManagementFeesMember2022-12-310001810546ebc:CashManagementFeesMember2021-12-310001810546us-gaap:DebitCardMember2021-12-310001810546us-gaap:DebitCardMember2022-12-310001810546us-gaap:AccumulatedNetUnrealizedInvestmentGainLossMember2022-01-012022-12-310001810546us-gaap:AccumulatedGainLossNetCashFlowHedgeParentMember2022-01-012022-12-310001810546us-gaap:AccumulatedDefinedBenefitPlansAdjustmentNetUnamortizedGainLossMember2022-01-012022-12-310001810546ebc:AccumulatedDefinedBenefitPlansAdjustmentAmortizationOfActuarialLossAttributableToParentMember2022-01-012022-12-310001810546us-gaap:AccumulatedDefinedBenefitPlansAdjustmentNetTransitionAssetObligationMember2022-01-012022-12-310001810546us-gaap:AccumulatedDefinedBenefitPlansAdjustmentNetPriorServiceCostCreditMember2022-01-012022-12-310001810546us-gaap:AccumulatedDefinedBenefitPlansAdjustmentMember2022-01-012022-12-310001810546us-gaap:AccumulatedNetUnrealizedInvestmentGainLossMember2021-01-012021-12-310001810546us-gaap:AccumulatedGainLossNetCashFlowHedgeParentMember2021-01-012021-12-310001810546us-gaap:AccumulatedDefinedBenefitPlansAdjustmentNetUnamortizedGainLossMember2021-01-012021-12-310001810546ebc:AccumulatedDefinedBenefitPlansAdjustmentAmortizationOfActuarialLossAttributableToParentMember2021-01-012021-12-310001810546us-gaap:AccumulatedDefinedBenefitPlansAdjustmentNetTransitionAssetObligationMember2021-01-012021-12-310001810546us-gaap:AccumulatedDefinedBenefitPlansAdjustmentNetPriorServiceCostCreditMember2021-01-012021-12-310001810546us-gaap:AccumulatedDefinedBenefitPlansAdjustmentMember2021-01-012021-12-310001810546us-gaap:AccumulatedNetUnrealizedInvestmentGainLossMember2020-01-012020-12-310001810546us-gaap:AccumulatedGainLossNetCashFlowHedgeParentMember2020-01-012020-12-310001810546us-gaap:AccumulatedDefinedBenefitPlansAdjustmentNetUnamortizedGainLossMember2020-01-012020-12-310001810546ebc:AccumulatedDefinedBenefitPlansAdjustmentAmortizationOfActuarialLossAttributableToParentMember2020-01-012020-12-310001810546us-gaap:AccumulatedDefinedBenefitPlansAdjustmentNetTransitionAssetObligationMember2020-01-012020-12-310001810546us-gaap:AccumulatedDefinedBenefitPlansAdjustmentNetPriorServiceCostCreditMember2020-01-012020-12-310001810546us-gaap:AccumulatedDefinedBenefitPlansAdjustmentMember2020-01-012020-12-310001810546us-gaap:InterestRateSwapMember2022-01-012022-12-310001810546us-gaap:InterestRateSwapMember2021-01-012021-12-310001810546us-gaap:InterestRateSwapMember2020-01-012020-12-310001810546us-gaap:AvailableforsaleSecuritiesMemberus-gaap:AccumulatedNetUnrealizedInvestmentGainLossMember2019-12-310001810546us-gaap:AccumulatedGainLossNetCashFlowHedgeParentMemberus-gaap:CashFlowHedgingMember2019-12-310001810546us-gaap:AccumulatedDefinedBenefitPlansAdjustmentMember2019-12-310001810546us-gaap:AvailableforsaleSecuritiesMemberus-gaap:AccumulatedNetUnrealizedInvestmentGainLossMember2020-01-012020-12-310001810546us-gaap:AccumulatedGainLossNetCashFlowHedgeParentMemberus-gaap:CashFlowHedgingMember2020-01-012020-12-310001810546us-gaap:AvailableforsaleSecuritiesMemberus-gaap:AccumulatedNetUnrealizedInvestmentGainLossMember2020-12-310001810546us-gaap:AccumulatedGainLossNetCashFlowHedgeParentMemberus-gaap:CashFlowHedgingMember2020-12-310001810546us-gaap:AccumulatedDefinedBenefitPlansAdjustmentMember2020-12-310001810546us-gaap:AvailableforsaleSecuritiesMemberus-gaap:AccumulatedNetUnrealizedInvestmentGainLossMember2021-01-012021-12-310001810546us-gaap:AccumulatedGainLossNetCashFlowHedgeParentMemberus-gaap:CashFlowHedgingMember2021-01-012021-12-310001810546us-gaap:AvailableforsaleSecuritiesMemberus-gaap:AccumulatedNetUnrealizedInvestmentGainLossMember2021-12-310001810546us-gaap:AccumulatedGainLossNetCashFlowHedgeParentMemberus-gaap:CashFlowHedgingMember2021-12-310001810546us-gaap:AccumulatedDefinedBenefitPlansAdjustmentMember2021-12-310001810546us-gaap:AvailableforsaleSecuritiesMemberus-gaap:AccumulatedNetUnrealizedInvestmentGainLossMember2022-01-012022-12-310001810546us-gaap:AccumulatedGainLossNetCashFlowHedgeParentMemberus-gaap:CashFlowHedgingMember2022-01-012022-12-310001810546us-gaap:AvailableforsaleSecuritiesMemberus-gaap:AccumulatedNetUnrealizedInvestmentGainLossMember2022-12-310001810546us-gaap:AccumulatedGainLossNetCashFlowHedgeParentMemberus-gaap:CashFlowHedgingMember2022-12-310001810546us-gaap:AccumulatedDefinedBenefitPlansAdjustmentMember2022-12-310001810546us-gaap:AccumulatedDefinedBenefitPlansAdjustmentNetGainLossIncludingPortionAttributableToNoncontrollingInterestMemberus-gaap:ReclassificationOutOfAccumulatedOtherComprehensiveIncomeMember2022-01-012022-12-310001810546us-gaap:AccumulatedDefinedBenefitPlansAdjustmentNetGainLossIncludingPortionAttributableToNoncontrollingInterestMemberus-gaap:ReclassificationOutOfAccumulatedOtherComprehensiveIncomeMember2021-01-012021-12-310001810546us-gaap:AccumulatedDefinedBenefitPlansAdjustmentNetGainLossIncludingPortionAttributableToNoncontrollingInterestMemberus-gaap:ReclassificationOutOfAccumulatedOtherComprehensiveIncomeMember2020-01-012020-12-310001810546us-gaap:AccumulatedGainLossCashFlowHedgeIncludingNoncontrollingInterestMemberus-gaap:ReclassificationOutOfAccumulatedOtherComprehensiveIncomeMember2022-01-012022-12-310001810546us-gaap:AccumulatedGainLossCashFlowHedgeIncludingNoncontrollingInterestMemberus-gaap:ReclassificationOutOfAccumulatedOtherComprehensiveIncomeMember2021-01-012021-12-310001810546us-gaap:AccumulatedGainLossCashFlowHedgeIncludingNoncontrollingInterestMemberus-gaap:ReclassificationOutOfAccumulatedOtherComprehensiveIncomeMember2020-01-012020-12-310001810546us-gaap:AccumulatedDefinedBenefitPlansAdjustmentIncludingPortionAttributableToNoncontrollingInterestMemberus-gaap:ReclassificationOutOfAccumulatedOtherComprehensiveIncomeMember2022-01-012022-12-310001810546us-gaap:AccumulatedDefinedBenefitPlansAdjustmentIncludingPortionAttributableToNoncontrollingInterestMemberus-gaap:ReclassificationOutOfAccumulatedOtherComprehensiveIncomeMember2021-01-012021-12-310001810546us-gaap:AccumulatedDefinedBenefitPlansAdjustmentIncludingPortionAttributableToNoncontrollingInterestMemberus-gaap:ReclassificationOutOfAccumulatedOtherComprehensiveIncomeMember2020-01-012020-12-310001810546us-gaap:AccumulatedDefinedBenefitPlansAdjustmentNetPriorServiceIncludingPortionAttributableToNoncontrollingInterestMemberus-gaap:ReclassificationOutOfAccumulatedOtherComprehensiveIncomeMember2022-01-012022-12-310001810546us-gaap:AccumulatedDefinedBenefitPlansAdjustmentNetPriorServiceIncludingPortionAttributableToNoncontrollingInterestMemberus-gaap:ReclassificationOutOfAccumulatedOtherComprehensiveIncomeMember2021-01-012021-12-310001810546us-gaap:AccumulatedDefinedBenefitPlansAdjustmentNetPriorServiceIncludingPortionAttributableToNoncontrollingInterestMemberus-gaap:ReclassificationOutOfAccumulatedOtherComprehensiveIncomeMember2020-01-012020-12-310001810546us-gaap:ReclassificationOutOfAccumulatedOtherComprehensiveIncomeMember2022-01-012022-12-310001810546us-gaap:ReclassificationOutOfAccumulatedOtherComprehensiveIncomeMember2021-01-012021-12-310001810546us-gaap:ReclassificationOutOfAccumulatedOtherComprehensiveIncomeMember2020-01-012020-12-310001810546us-gaap:DiscontinuedOperationsHeldforsaleMemberebc:InsuranceBusinessMember2023-09-190001810546us-gaap:DiscontinuedOperationsHeldforsaleMemberebc:InsuranceBusinessMember2022-12-310001810546us-gaap:DiscontinuedOperationsHeldforsaleMemberebc:InsuranceBusinessMember2021-12-310001810546ebc:DisposalGroupNotDiscontinuedOperationsTransferrableUponSaleToEntityMemberebc:InsuranceBusinessMember2022-12-310001810546ebc:DisposalGroupNotDiscontinuedOperationsTransferrableUponSaleToEntityMemberebc:InsuranceBusinessMember2021-12-310001810546ebc:DisposalGroupNotDiscontinuedOperationsTransferrableUponSaleToEntityMemberebc:InsuranceBusinessMember2022-01-012022-12-310001810546ebc:DisposalGroupNotDiscontinuedOperationsTransferrableUponSaleToEntityMemberebc:InsuranceBusinessMember2021-01-012021-12-310001810546ebc:DisposalGroupNotDiscontinuedOperationsTransferrableUponSaleToEntityMemberebc:InsuranceBusinessMember2020-01-012020-12-310001810546us-gaap:DiscontinuedOperationsHeldforsaleMemberebc:InsuranceBusinessMember2023-09-300001810546ebc:InsuranceAgencyAcquisitionMember2022-01-012022-12-31ebc:business0001810546ebc:InsuranceAgencyAcquisitionOneMember2022-01-012022-12-310001810546ebc:InsuranceAgencyAcquisitionTwoMember2022-01-012022-12-310001810546us-gaap:CustomerListsMemberebc:InsuranceAgencyAcquisitionMember2022-12-310001810546ebc:InsuranceAgencyAcquisitionMemberus-gaap:NoncompeteAgreementsMember2022-12-310001810546ebc:InsuranceAgencyAcquisitionMember2022-12-310001810546ebc:InsuranceAgencyAcquisitionOneMember2022-12-310001810546ebc:InsuranceAgencyAcquisitionTwoMember2022-12-310001810546srt:MinimumMemberebc:InsuranceAgencyAcquisitionOneMember2022-12-310001810546ebc:InsuranceAgencyAcquisitionOneMembersrt:MaximumMember2022-12-310001810546ebc:InsuranceAgencyAcquisitionTwoMembersrt:MaximumMember2022-12-310001810546ebc:InsuranceAgencyAcquisitionMember2021-01-012021-12-310001810546ebc:InsuranceAgencyAcquisitionOneMember2021-01-012021-12-310001810546ebc:InsuranceAgencyAcquisitionTwoMember2021-01-012021-12-310001810546us-gaap:CustomerListsMemberebc:InsuranceAgencyAcquisitionMember2021-12-310001810546ebc:InsuranceAgencyAcquisitionMemberus-gaap:NoncompeteAgreementsMember2021-12-310001810546ebc:InsuranceAgencyAcquisitionMember2021-12-310001810546srt:ParentCompanyMember2022-12-310001810546srt:ParentCompanyMember2021-12-310001810546srt:ConsolidationEliminationsMember2022-12-310001810546srt:ConsolidationEliminationsMember2021-12-310001810546us-gaap:ParentMember2022-01-012022-12-310001810546us-gaap:ParentMember2021-01-012021-12-310001810546us-gaap:ParentMember2020-01-012020-12-310001810546us-gaap:ParentMember2021-12-310001810546us-gaap:ParentMember2020-12-310001810546us-gaap:ParentMember2019-12-310001810546us-gaap:ParentMember2022-12-3100018105462023-03-012023-03-3100018105462023-03-3100018105462023-01-012023-03-310001810546ebc:CambridgeBancorpAndCambridgeTrustCompanyMembersrt:ScenarioForecastMember2024-01-012024-03-310001810546ebc:CambridgeBancorpAndCambridgeTrustCompanyMembersrt:ScenarioForecastMember2024-03-310001810546us-gaap:DiscontinuedOperationsHeldforsaleMemberebc:InsuranceBusinessMember2023-10-310001810546us-gaap:DiscontinuedOperationsHeldforsaleMemberebc:InsuranceBusinessMember2023-10-312023-10-310001810546srt:MinimumMemberus-gaap:DiscontinuedOperationsHeldforsaleMemberebc:InsuranceBusinessMember2023-11-080001810546us-gaap:DiscontinuedOperationsHeldforsaleMembersrt:MaximumMemberebc:InsuranceBusinessMember2023-11-080001810546us-gaap:DiscontinuedOperationsHeldforsaleMemberebc:InsuranceBusinessMember2023-07-012023-09-30
EXPLANATORY NOTE
Eastern Bankshares, Inc. (the “Company”) is filing this Exhibit 99.1 to its Current Report on Form 8-K (including this Exhibit 99.1, the “Form 8-K”) solely to recast certain financial information and related disclosures included in the Company’s Current Report on Form 10-K for the fiscal year ended December 31, 2022, originally filed with the United States (“U.S.”) Securities and Exchange Commission (the “SEC”) on February 24, 2023 (the “2022 Form 10-K”).
Discontinued Operations
On September 19, 2023, the Company announced that it had entered into an agreement with Arthur J. Gallagher & Co. (“Gallagher”) to sell substantially all of the assets and transfer substantially all of the liabilities of its insurance agency business, which conducts business under the name Eastern Insurance Group, LLC (“Eastern Insurance Group”), in exchange for cash consideration. On October 31, 2023, the Company completed the sale of its insurance agency business to Gallagher. Substantially all of the historical results of our previously reported insurance agency business segment have been reflected as discontinued operations in our recast consolidated financial statements for all periods presented herein, including, as of December 31, 2022 and 2021, the assets and liabilities associated with the discontinued operations being classified as assets and liabilities of discontinued operations in our Consolidated Balance Sheets. Refer to Note 24, “Discontinued Operations” within the Notes to the Consolidated Financial Statements included in Item 8 in this Current Report on Form 8-K for additional information.
Disclaimer
This Current Report on Form 8-K does not revise or update any section or subsection of the 2022 Form 10-K other than as expressly noted above. Moreover, in order to preserve the nature and character of the disclosures set forth in such items as originally filed in the 2022 Form 10-K, no attempt has been made in this Current Report on Form 8-K, and it should not be read, to modify or update disclosures as presented in the 2022 Form 10-K to reflect events or occurrences after the date of the filing of the 2022 Form 10-K, except for (i) matters relating specifically to the recasting of the presentation described above and (ii) the information presented in Note 27 Subsequent Events to the Company’s recast financial statements for the year ended December 31, 2022 included as Part II, Item 8 of this Current Report on Form 8-K. Without limiting the foregoing disclaimer, this Current Report on Form 8-K does not purport to update the 2022 Form 10-K for any information, uncertainties, transactions, risks, events or trends occurring, or known to management as of the filing of this Current Report on Form 8-K. Therefore, this Form 8-K (including Exhibit 99.1) should be read in conjunction with the 2022 Form 10-K and the Company’s filings made with the SEC subsequent to the filing of the 2022 Form 10-K, including, without limitation, the Company’s Quarterly Reports on Form 10-Q for the quarters ended March 31, 2023, June 30, 2023, and September 30, 2023.
Index
|
|
|
|
|
|
|
|
|
|
|
PAGE |
|
|
|
|
|
| Item 1. |
|
|
|
|
|
| Item 1A. |
|
|
|
|
|
| Item 2. |
|
|
| PART II |
|
|
|
|
| Item 7. |
|
|
|
|
|
| Item 8. |
|
|
|
|
|
|
Consolidated Statements of Income |
|
|
|
|
|
|
|
|
|
|
|
|
|
FORWARD-LOOKING STATEMENTS
When we use the terms “we”, “us”, “our,” and the “Company,” we mean Eastern Bankshares, Inc., a Massachusetts corporation, and its consolidated subsidiaries, taken as a whole, unless the context otherwise indicates.
Certain statements contained in this Current Report on Form 8-K that are not historical facts may be considered forward-looking statements within the meaning of Section 27A of the Securities Act of 1933, as amended, and Section 21E of the Securities Exchange Act of 1934, as amended (the “Exchange Act”) and are intended to be covered by the safe harbor provisions of the Private Securities Litigation Reform Act of 1995. These statements, which are based on certain current assumptions and describe our future plans, strategies and expectations, can generally be identified by the use of the words “may,” “will,” “should,” “could,” “would,” “plan,” “potential,” “estimate,” “project,” “believe,” “intend,” “anticipate,” “expect,” “target” and similar expressions.
Forward-looking statements are based on the current assumptions and beliefs of management and are only expectations of future results. The Company’s actual results could differ materially from those projected in the forward-looking statements as a result of, among others, factors:
•the ongoing negative impacts and disruptions of the novel coronavirus (“COVID-19”) pandemic on our employees, customers, business operations, credit quality, financial position, liquidity and results of operations;
•general business and economic conditions on a national basis and in the local markets in which the Company operates;
•changes in customer behavior;
•changes in regional, national or international macroeconomic conditions, including especially changes in inflation, recessionary pressures or interest rates in the United States;
•the possibility that future credit losses, loan defaults and charge-off rates are higher than expected due to changes in economic assumptions or adverse economic developments;
•turbulence in the capital and debt markets;
•decreases in the value of securities and other assets;
•decreases in deposit levels necessitating increased borrowing to fund loans and investments;
•competitive pressures from other financial institutions;
•operational risks including, but not limited to, cybersecurity incidents, fraud, natural disasters and future pandemics;
•changes in regulation;
•changes in accounting standards and practices;
•the risk that goodwill and intangibles recorded in our financial statements will become impaired;
•risks related to the implementation of acquisitions, dispositions, and restructurings, including the risk that acquisitions may not produce results at levels or within time frames originally anticipated;
•the risk that we may not be successful in the implementation of our business strategy;
•changes in assumptions used in making such forward-looking statements; and
•other risks and uncertainties detailed in Part I, Item 1A “Risk Factors” of this Current Report on Form 8-K.
Forward-looking statements speak only as of the date on which they are made. The Company does not undertake any obligation to update any forward-looking statement to reflect circumstances or events that occur after the date the forward-looking statements are made.
PART I
ITEM 1. BUSINESS
General Corporate Overview
Eastern Bankshares, Inc., a Massachusetts corporation, which we sometimes refer to as the “Company,” is a bank holding company headquartered in Boston, Massachusetts that was incorporated under Massachusetts law in 2020. We are the sole shareholder of Eastern Bank, which we sometimes refer to as the “Bank,” a Massachusetts-chartered bank founded in 1818. Through the Bank and its wholly owned subsidiary, Eastern Insurance Group LLC (“Eastern Insurance Group”), we provide a variety of banking, trust and investment, and insurance services. As of December 31, 2022, we had two reportable business segments: banking and insurance agency. In the third quarter of 2023, we announced the sale of substantially all of the assets and transfer of substantially all of the liabilities of our insurance agency business. We completed the sale on October 31, 2023. Financial information attributed to our insurance agency business has been recast to reflect discontinued operations as of December 31, 2022 and 2021, and we have deleted or modified non-financial disclosures in this Item 1 relating to our insurance agency business. As of December 31, 2022, we had total consolidated assets of $22.6 billion, total gross loans of $13.6 billion, total deposits of $19.0 billion and total shareholders’ equity of $2.5 billion. We are subject to comprehensive regulation and examination by the Massachusetts Commissioner of Banks, the Federal Deposit Insurance Corporation (“FDIC”), the Federal Reserve Board and the Consumer Financial Protection Bureau.
Our diversified products and services include lending, deposit, wealth management and insurance products. Deposits obtained through the branch banking network have traditionally been the principal source of funds for use in lending and for other general business purposes. We offer a range of demand deposit accounts, interest checking accounts, money market accounts, savings accounts and time certificates of deposit accounts. Our lending focuses on the following loan categories: commercial and industrial, including our Asset Based Lending Portfolio, commercial real estate, commercial construction, small business banking, residential real estate and home equity loans. Through Eastern Bank’s wealth management offering, we provide a wide range of trust services. Eastern Insurance Group acts as an agent in offering insurance solutions for clients with personal, commercial or employee benefits-related insurance needs. In addition, we offer automated lock box collection services, cash management services and account reconciliation services to our corporate and institutional customers, as well as cash management services to our municipal clients.
The only entity controlled directly by Eastern Bankshares, Inc. is Eastern Bank, which is a wholly owned subsidiary. Eastern Bank controls five active subsidiaries in addition to Eastern Insurance Group LLC, as follows:
1.Broadway Securities Corporation, a wholly owned subsidiary engaged in buying, selling, dealing in and holding securities and in holding industrial revenue bonds (“IRBs”);
2.Market Street Securities Corporation, a wholly owned subsidiary engaged in buying, selling, dealing in and holding securities;
3.Real/Property Services, Inc., a wholly owned subsidiary that provides real estate services to Eastern Bank;
4.Millennium Corporation, a wholly owned subsidiary engaged in holding IRBs; and
5.Shared Value Investments LLC, a wholly owned subsidiary that invests in low income housing and other tax credit investments.
Market Area and Competition
Our primary market consists of the greater Boston area, specifically eastern and central Massachusetts, southern New Hampshire, including the seacoast region, and northern Rhode Island.
The statistical area used for government data gathering purposes that aligns most closely with our lending area is known as the Boston–Worcester–Providence combined statistical area, or CSA. In addition to greater Boston, this area includes the metropolitan areas of Manchester, New Hampshire; Worcester, Massachusetts; and Providence, Rhode Island. It also includes the Cape Cod region of Massachusetts. With an estimated population of 8.4 million, the Boston–Worcester–Providence CSA is the sixth largest CSA in the United States based upon 2021 population data.
We believe the Boston–Worcester–Providence CSA provides a well-diversified and resilient economic base. There are approximately 3.3 million households in the Boston–Worcester–Providence CSA with an average of 2.5 persons per household. Median household income in 2021 for the Boston–Worcester–Providence CSA was approximately $91,000 compared to $70,000 for the United States as a whole. The estimated median age of the population in the Boston–Worcester–Providence CSA is 40.2 years, compared to 38.8 years for the United States as a whole. For the eleven counties in eastern Massachusetts and southern New Hampshire in which our branches are located and from which we gather most of our deposits, the average unemployment rate as of December 2022 was 3.0%, as compared to 3.3% for the United States as a whole.
For the statistical area consisting of Boston and Cambridge, Massachusetts, and Nashua, New Hampshire, which is a subset of the Boston–Worcester–Providence CSA, the unemployment rate as of November 2022, the most recent date for which data was available, was 2.7%, according to the U.S. Bureau of Labor Statistics.
Home to over 100 colleges and universities, including nationally and internationally recognized institutions such as Boston College, Boston University, Brown University, Harvard University, Massachusetts Institute of Technology, Northeastern University, Wellesley College and Worcester Polytechnic Institute, the Boston–Worcester–Providence CSA includes many employers in what often is referred to as the “knowledge-based economy” that relies on highly-educated employees, professionals and entrepreneurs. Approximately 45.3% of the population in the Boston–Worcester–Providence CSA age 25 or older has at least a bachelor’s degree, compared to 35.0% for the United States as a whole as of December 31, 2022. Major employment sectors range from education, services, manufacturing and wholesale and retail trade, to finance, technology and health care. Seven of the ten largest employers in the Boston metropolitan statistical area (“MSA”) are hospitals. Professional, scientific, and technical services, which covers a variety of industries including computer systems design, scientific research and development, management consulting, architecture and law, comprise the second largest share of the Boston MSA employers.
The financial services industry in general and in our market in particular is highly competitive. We face significant competition in gathering deposits and originating loans. Our most direct competition for deposits has historically come from banking institutions operating in our primary market area. Based on data from the FDIC as of June 30, 2022 (the latest date for which information is available), we had a weighted average deposit market share of 5.4% for the seven separate banking markets tracked by the Federal Reserve Board in which we have at least one branch. In the Boston market, which accounted for 94.9% of our deposits as of June 30, 2022, our market share was 3.5%, representing the fifth largest deposit share in that market. We also face competition for deposits from other financial services companies such as securities brokerage firms, credit unions, insurance companies and money market funds.
In consumer banking, the industry has become increasingly dependent on and oriented towards technology-driven delivery systems, permitting transactions to be conducted through a wide variety of online and mobile channels. In addition, technology has lowered the barriers to entry and made it possible for non-bank institutions to attract funds and provide lending and other financial services in our market despite not having a physical presence here. Given their lower cost structure, non-bank institutions that choose to solicit deposits primarily through digital platforms often are able to offer rates on deposit products that are higher than average for retail banking institutions with a traditional branch footprint, such as us. The primary factors driving competition for consumer loans and deposits are interest rates, fees charged, customer service levels, convenience, including branch location and hours of operation, and the range of products and services offered.
There is similarly intense competition in commercial banking, particularly for quality loan originations, from traditional banking institutions such as large regional banks, as well as commercial finance companies, leasing companies, insurance companies and other non-bank lenders, and institutional investors including collateralized loan obligation managers. Some larger competitors, including some of the largest banks in the United States, have a significant and, in many cases, growing presence in our market area, may offer a broader array of products and, due to their asset size, may sometimes be in a position to hold more exposure on their own balance sheets. We compete on a number of factors including, among others, customer service, quality of execution, range of products offered, price and reputation. We expect competition to continue to increase, especially as a result of regulatory and technological changes, the continuing trend of consolidation in the financial services industry, and the Federal Open Market Committee’s (the “FOMC’s”) monetary policy, including increases to the federal funds rate, which have recently lead to increased competition for customer deposits. Increased competition for deposits and the origination of loans could limit our growth in the future.
Recent Acquisitions
Bank Acquisitions
During the past two decades, we have been able to expand our banking business through a combination of internal or “organic” growth complemented by opportunistic strategic transactions. Since 1997, we have completed eight mergers or acquisitions of banking businesses. Most recently, on November 12, 2021, we acquired Century Bancorp, Inc. (“Century”), which operated 29 banking offices in 21 cities and towns in Massachusetts and southern New Hampshire, as of September 30, 2021, for $641.9 million in cash. Century had total assets of approximately $6.8 billion at the time of our acquisition, at fair value and excluding goodwill and intangible assets.
Business Strategy
Our goal is to enhance our position as one of the leading community banking institutions in our market, providing a broad array of banking and other financial services to retail, commercial and small business customers. In recent years, we have focused significant effort on and invested heavily in our infrastructure to create sophisticated and competitive products and services, a strong, experienced work force, and awareness of our banking brand.
We also plan to grow by acquisition.
As a result, we believe we are well positioned to capitalize on the opportunities available in our market by focusing on the following core strategies.
Develop new customer relationships and deepen existing relationships. We seek to expand our market share in existing and contiguous markets across our businesses by leveraging our distinctive brand and delivering a diverse suite of tailored, high-quality solutions through a consultative, relationship-based approach reinforced by superior customer service. We believe this will result in disciplined growth of low-cost deposits, loans with attractive risk-adjusted returns and a steady stream of fee income. Our relationship-based approach has enabled us to achieve disciplined organic growth over time, and we expect this trend to continue. We believe our support of our small business and non-profit customers in obtaining funding under the Paycheck Protection Program, also known as “PPP,” demonstrated both our commitment and capacity to meet our customers’ needs, even in the most challenging circumstance. The PPP was created by the Coronavirus Aid, Relief, and Economic Security Act (the “CARES Act”) and was first launched in April 2020. We disbursed a total of $1.7 billion of loans to approximately 15,500 borrowers under the PPP of the CARES Act. The vast majority of our PPP borrowers were existing commercial and small business borrowers, non-profit customers, retail banking customers and clients of Eastern Wealth Management and Eastern Insurance Group. Please refer to the subsection of this Current Report on Form 8-K titled “Business—Lending Activities—Small Business Loans” for a summary description of PPP lending as relevant to Eastern Bank.
Pursue opportunistic acquisitions. We have pursued and intend to continue to prudently pursue opportunities to acquire banks in our existing and contiguous markets that we believe will create attractive financial returns. Our focus is primarily on franchises that enhance our funding profile, product capabilities or geographic density, while maintaining an acceptable risk profile. We believe the vital need to make increasingly significant technological investments has greatly amplified the importance of scale in banking. We believe that as a result of our initial public offering (“IPO”), which was completed in October 2020, we are well-positioned as a consolidator in the banking market because of our financial strength, reputation and culture as evidenced by our recent acquisition of Century in November 2021. In addition, we intend to continue to pursue opportunistic acquisitions of additional insurance agencies in existing and contiguous markets.
Leverage technology to enhance customer experience and drive operating efficiencies. We have made significant investments in our technology to ensure we can deliver high-quality, innovative products and services to our customers. We are committed to regularly investing in technology and data analytics, as we are positioning our franchise for the future. We believe these investments will differentiate us with our target customers and provide a scalable platform, which will generate significant operating leverage as we grow over time.
Maintain and grow our experienced, diverse and customer focused employee base. We have an established corporate culture based on personal accountability, high ethical standards and a commitment to training and career development. We will look to opportunistically hire talented bankers and employees with a continued emphasis on recruiting highly motivated, diverse managers and employees who can establish and maintain long-term customer relationships that are key to our business, brand and culture.
Manage risk to navigate a range of economic environments. We believe that our conservative credit culture, strong capital and sources of liquidity, and our deep client relationships are key to our long-term financial success. We believe that stable long-term growth and profitability are the result of building strong customer relationships one at a time while maintaining rigorous credit discipline. We supplement our conservative risk culture with a rigorous and continuous enterprise risk management program. Recession expectations in 2022 for future periods, supported by high inflation, rising interest rates, lingering supply chain difficulties, and softer labor market dynamics, has resulted and is continuing to result in material uncertainty in the near- and medium-term future. We believe we are enduring this period of stress from a position of strength, which allows us to maintain a strong balance sheet while still supporting our customers and communities in need.
Lending Activities
Lending Activities
We use funds obtained from deposits, including brokered certificates of deposit, as well as funds obtained from the Federal Home Loan Bank (“FHLB”) of Boston (“FHLBB”) advances and Federal funds, primarily to originate loans and to invest in securities. We believe the portfolio is well diversified with approximately 860 commercial relationships at December 31, 2022. Our lending area mainly consists of the greater Boston area, specifically eastern and central Massachusetts, southern New Hampshire, including the seacoast region, and northern Rhode Island. In connection with our acquisition of Century, we acquired loans which are outside of our traditional lending area. Such loans will run-off over time as we are not actively pursuing lending activities in such areas. As of December 31, 2022, the remaining recorded investment balance of loans acquired in connection with our Century acquisition and which were outside of our traditional lending area was $411.6 million.
During the year ended December 31, 2022, we purchased mortgage loans, specifically one- to four-family residential real estate loans, a portion of which are outside of our traditional lending area. Loans purchased were subject to the same underwriting criteria as those loans originated directly by us. During the year ended December 31, 2022, we purchased $380.2 million of residential real estate loans, of which $175.1 million were outside of our traditional lending area.
Our lending focuses on the following categories of loans:
Commercial and Industrial Loans. We offer a broad range of products, including lines of credit and term loans. We primarily target companies and institutions with annual revenues of $10 million to $500 million and strive to serve as the lead bank for customers with multi-product, long-term, profitable relationships with an emphasis on building long-term relationships. In addition, we participate in the syndicated loan market, club lending transactions and the Shared National Credit Program (“SNC Program”), which is comprised of loans and commitments to extend credit aggregating more than $100 million or more at origination and shared by three or more unaffiliated supervised institutions.
Loans in this category consist of lines of credit and term loans extended to businesses and corporate enterprises for the purpose of financing working capital, facilitating equipment purchases and facilitating acquisitions. As of December 31, 2022, we had total commercial and industrial loans of $3.2 billion, representing 23.2% of our total loans.
The primary risk associated with commercial and industrial loans is the ability of borrowers to achieve business results consistent with those projected at origination. For commercial and industrial loans, our primary focus is middle-market companies located in the markets we serve. Loans are extended on both a secured and unsecured basis, according to the credit profile of the customer, at both fixed interest rates and variable interest rates at varying spreads over the London Interbank Offered Rate (“LIBOR”), Secured Overnight Financing Rate (“SOFR”), and Prime rate. See “Risk Factors—Changes to and replacement of LIBOR may adversely affect our business, financial condition, and results of operations” in Part I, Item 1A of this Current Report on Form 8-K for more information about the potential impact to our business. The average tenor of our commercial and industrial portfolio varies according to market conditions but at December 31, 2022 it was 5.7 years.
In managing the commercial and industrial loan portfolio, we focus on the size of the customer’s lending relationship, which we view as the aggregate amount of all loans and loan commitments outstanding to a commercial borrower and any related borrowers or guarantors. The average commercial and industrial lending relationship by balance at December 31, 2022 was $2.3 million. At December 31, 2022, our ten largest commercial and industrial lending relationships, including relationships with combined commercial and industrial and owner-occupied commercial real estate exposure (e.g., combination of outstanding principal balance and undrawn commitment amount), had an average exposure of $68.9 million and ranged in exposure size from $62.2 million to $80.4 million.
Approximately 66.6% of our commercial and industrial loan exposure at December 31, 2022 was to customers headquartered within our primary lending market, which consists of eastern and central Massachusetts, southern New Hampshire, including the seacoast region, and northern Rhode Island, although we participate in the syndicated loan market and the SNC Program. Our regulators and Eastern Bank consider a SNC to be any loan or loan commitment for which the commitment amount is equal to or greater than $100 million, in aggregate; and which is shared by three or more federally supervised unaffiliated institutions under a formal lending agreement; or a portion of which is sold to two or more federally supervised unaffiliated institutions, with the purchasing institutions assuming their pro rata share of the credit risk. As of December 31, 2022, our commercial and industrial SNC Program portfolio totaled $685.8 million, or 21.9%, of our commercial and industrial portfolio, and 37.3% of our commercial and industrial SNC Program portfolio were loans to borrowers headquartered in our primary lending market.
Our commercial and industrial portfolio also includes our Asset Based Lending Portfolio (“ABL Portfolio”), IRBs, and a portion of our PPP loans. IRBs are municipal bonds issued to finance major capital projects and the majority of our IRB portfolio is in educational and other non-profit sectors. As of December 31, 2022, our ABL, commercial and industrial IRB, and commercial and industrial PPP portfolios totaled $208.8 million, $1.0 billion, and $3.6 million, respectively.
Commercial Real Estate Loans. Loans in this category include mortgage loans and lines of credit on commercial real estate, both investment and owner occupied. Property types financed include office, industrial, multi-family, affordable housing, retail, hotel and other type properties.
As of December 31, 2022, we had total commercial real estate loans of $5.2 billion, representing 38.0% of our total loans. As of December 31, 2022, owner occupied loans totaled $917.2 million, representing 17.8%, of our commercial real estate loans. Collateral values are established by independent third-party appraisals and evaluations. The primary repayment sources include operating income generated by the real estate, permanent debt refinancing and/or proceeds from the sale of the real estate.
Our commercial real estate loan portfolio includes IRB loans of $608.0 million, or 11.8% of our commercial real estate portfolio, as of December 31, 2022.
The average outstanding loan balance in our commercial real estate portfolio was approximately $3.5 million as of December 31, 2022, although we originate commercial real estate loans with balances significantly larger than this average. At December 31, 2022, our ten largest commercial real estate loans had an average exposure of $33.7 million, ranging from $27.0 million to $38.5 million.
We focus our commercial real estate lending on properties within our primary market area but will originate commercial real estate loans on properties located outside this area based on an established relationship with a strong borrower. We intend to continue to grow our commercial real estate loan portfolio while maintaining prudent underwriting standards. In addition to originating these loans, we also participate in commercial real estate loans with other financial institutions. Such participations are underwritten in accordance with our policies before we will participate in such loans.
We originate a variety of fixed- and adjustable-rate commercial real estate loans with terms and amortization periods generally up to 30 years, which may include balloon loans. Interest rates and payments on most of our adjustable-rate loans are set based upon the 30-day LIBOR or SOFR index plus a margin. See “Risk Factors—Changes to and replacement of LIBOR may adversely affect our business, financial condition, and results of operations” in Part I, Item 1A of this Current Report on Form 8-K for more information about the potential impact to our business.
If we foreclose on a commercial real estate loan, the marketing and liquidation period to convert the real estate asset to cash can be a lengthy process with substantial holding costs. In addition, vacancies, deferred maintenance, repairs and market stigma can result in prospective buyers expecting sale price concessions to offset their real or perceived economic losses for the time it takes them to return the property to profitability. Depending on the individual circumstances, initial charge-offs and subsequent losses on commercial real estate loans can be unpredictable and substantial.
Commercial Construction Loans. Loans in this category include construction project financing and are comprised of commercial real estate, business banking and residential loans for the purpose of constructing and developing real estate. Substantially all of our commercial construction portfolio is in commercial real estate.
As of December 31, 2022, we had total commercial construction loans of $336.3 million, representing 2.5% of our total loans. The majority of the loans in this category, measured by the outstanding loan balance as of December 31, 2022, are secured by properties located in our primary lending area. At December 31, 2022, our ten largest construction loans had an average exposure of $27.4 million, ranging from $24.0 million to $34.0 million.
Most of our construction loans are interest-only loans that provide for the payment of interest during the construction phase, which is usually up to 36 months, although the terms of some construction loans are extended, generally for periods of six to 12 months. At the end of the construction phase, the loan may convert to a permanent mortgage loan or the loan may be paid in full. Loans generally can be made with a maximum loan-to-value ratio of 75% of the appraised market value upon completion of the project. When appropriate to the underwriting, a “discounted cash flow analysis” is utilized. Before making a commitment to fund a construction loan, we require an appraisal of the property by an independent licensed appraiser for construction and land development loans in excess of $500,000. For larger loans, we also will generally require an inspection of the property by an Eastern Bank-appointed construction engineer before disbursement of funds during the term of the construction loan.
Land development loans and IRB loans within the construction portfolio totaled $24.3 million and $36.9 million as of December 31, 2022, respectively.
Small Business Loans. This category, which we refer to as “business banking,” is comprised of loans to small businesses with exposures of under $1.0 million and small investment real estate projects with exposures of under $3.0 million. These loans are separate and distinct from our commercial and industrial and commercial real estate portfolios described above due to the size of the loans.
As of December 31, 2022, we had total business banking loans of $1.1 billion, representing 8.0% of our total loans. In this category, commercial and industrial loans and commercial real estate loans totaled $208.4 million and $882.1 million, respectively, as of December 31, 2022. Business banking originations include traditionally underwritten loans as well as partially automated scored loans. Our proprietary decision matrix, which includes a number of quantitative factors including, but not limited to, a guarantor’s credit score, industry risk, and time in business, is used to determine whether to make business banking loans.
A portion of our small business loans are guaranteed by the U.S. Small Business Administration (“SBA”), through the SBA 7(a) loan program. The SBA 7(a) loan program supports, through a United States Government guarantee, some portion of the traditional commercial loan underwriting that might not be fully covered absent the guarantee. Eastern Bank is a preferred lender under the SBA’s Preferred Lender Program, which allows expedited underwriting and approval of SBA 7(a) Loans.
For 2009-2022, Eastern Bank was distinguished as the highest producer of SBA 7(a) loans, in terms of loan volume, in Massachusetts. As of December 31, 2022, our SBA portfolio held approximately 1,800 loans with $119.6 million outstanding.
Our PPP loans are included in our commercial and industrial loans portfolio, as previously indicated, and in our business banking portfolio. As of December 31, 2022, the amount of PPP loans included in our business banking portfolio was $6.2 million.
One- to Four-Family Residential Real Estate Loans. Our one- to four-family residential real estate loan portfolio consists of mortgage loans that enable borrowers to purchase or refinance existing homes, most of which serve as the primary residence of the owner.
As of December 31, 2022, we had total residential loans of $2.5 billion, representing 18.1% of our total loans. Underwriting considerations include, among others, income sources and their reliability, willingness to repay as evidenced by credit repayment history, financial resources including cash reserves and the value of the collateral. We maintain policy standards for minimum credit score and cash reserves and maximum loan to value consistent with a “prime” portfolio. Collateral consists of mortgage liens on residential dwellings. We do not originate or purchase sub-prime or other high-risk loans.
Our one-to four-family residential real estate loans generally do not have prepayment penalties. We generally do not offer loans with negative amortization and do not offer interest-only one- to four-family residential real estate loans, although we may provide for interest-only payments with respect to loan modifications.
Through a team of approximately 15 licensed mortgage loan officers, we originate residential loans either for sale to investors or to retain in our loan portfolio. Decisions about whether to sell or retain residential loans are made based on the interest rate characteristics, pricing for loans in the secondary mortgage market, competitive factors and our capital needs, although we generally retain non-conforming residential loans in our portfolio. Since 2016, we have outsourced to an independent party the processing, underwriting (using our criteria) and closing of residential loans originated by our mortgage loan officers. During the year ended December 31, 2022, residential real estate mortgage originations were $524.6 million, of which $60.3 million were sold on the secondary markets. We generally do not continue to service residential loans that we sell in the secondary market.
At December 31, 2022, our ten largest one- to four-family residential real estate loans had an average balance of $2.4 million, ranging from $2.2 million to $2.7 million.
As previously indicated, we began purchasing mortgage loans, specifically one- to four-family residential mortgages, during the year ended December 31, 2022. Loans purchased were subject to the same underwriting criteria as those loans originated directly by us.
Home Equity Loans and Lines of Credit. Loans in this category consist of home equity lines of credit and home equity loans. We offer home equity lines of credit with cumulative loan-to-value ratios generally up to 80%, when taking into account both the balance of the home equity line of credit and first mortgage loan. We maintain policy standards for minimum credit score and cash reserves and maximum loan-to-value ratios consistent with a “prime” portfolio. For home equity loans and lines of credit originated in 2022, the average Fair Isaac Corporation (“FICO”) score was 771.
As of December 31, 2022, we had total consumer home equity loans of $1.2 billion, representing 8.8% of our total loans. Home equity lines of credit are granted for ten years with monthly interest-only repayment requirements. Home equity lines of credit can be converted to term loans that are fully amortized. Underwriting considerations are materially consistent with those utilized in the residential real estate category. Collateral consists of a senior or subordinate lien on owner-occupied residential property.
Other Consumer Loans. Loans in this category consist of unsecured personal lines of credit, overdraft protection, automobile loans, home improvement loans, airplane loans and other personal loans.
As of December 31, 2022, we had total other consumer loans of $194.1 million, representing 1.4% of our total loans. Our policy and underwriting considerations in this category include, among others: income sources and reliability, credit histories, term of repayment and collateral value, as applicable.
Loan Sales and Purchases
We generally originate commercial loans for our portfolio, although we sell participation interests in commercial and industrial loans and commercial real estate loans to local financial institutions, primarily on the portion of loans exceeding our borrowing limits.
We began purchasing mortgage loans, specifically one- to four-family residential mortgages, during the year ended December 31, 2022. Loans purchased were subject to the same underwriting criteria as those loans originated directly by us. During the year ended December 31, 2022, we purchased $380.2 million of residential real estate loans. We purchase loan participations from other financial institutions and during the year ended December 31, 2022, we purchased $650.5 million of loan participations. As of December 31, 2022, we held loan participation interests, including SNCs, totaling $1.5 billion in loans originated by other lenders, consisting of $1.0 billion of commercial and industrial loan participations, $422.0 million of commercial real estate loan participations, $96.1 million of commercial construction loan participations, and less than $0.1 million of business banking loan participations.
Loan Approval Procedures and Authority
Our lending activities follow written, non-discriminatory, underwriting standards and loan origination procedures established by Eastern Bank’s Board of Directors and management. Eastern Bank’s Board of Directors has delegated loan approval authority to certain officers up to prescribed limits, depending on the officer’s experience, the type of loan and whether the loan is secured or unsecured. Loans to commercial relationships of $3.0 million and above require approval by credit managers. Loans to commercial relationships greater than $5.0 million and up to our internal loans-to-one relationship limitation require approval by management’s Credit Committee. All business banking loans under $1.5 million are approved by credit officers, and all business banking loans over $1.5 million are approved by the Credit Committee. Loan policy exceptions are fully disclosed to the approving authority, either an individual officer or the appropriate management or Credit Committee prior to approval. Exceptions are reported to the Risk Management Committee of the Board of Directors quarterly.
Loans-to-One Borrower Limit and Loan Category Concentration
The maximum amount that we may lend to one borrower and its related entities generally is limited, by statute, to 20% of our capital, which is defined under Massachusetts law as the sum of our capital shares, surplus account and undivided profits. At December 31, 2022, our regulatory limit on loans-to-one borrower was $494.4 million.
As of December 31, 2022, our internal limits on loans-to-one borrower (and related entities), all of which are subject to industry-specific sub-limits, were:
•$50.0 million for commercial real estate loans;
•$125.0 million for commercial real estate relationships;
•$50.0 million for commercial and industrial relationships, including loans to non-profit entities;
•$75.0 million for loans to education entities with a risk rating between 1 and 7;
•$50.0 million for loans to education entities with a risk rating of 8 and above;
•$75.0 million for loans to healthcare entities with a risk rating between 1 and 4; and
•$50.0 million for loans the healthcare entities with a risk rating of 5 and above;
Aggregate exposure limits can be increased up to 10% on an exception basis with the approval of the Credit Committee, including the approval of the Chief Credit Officer and the Chief Commercial Banking Officer.
Investment Activities
Our securities portfolio consists primarily of government-sponsored residential mortgage-backed securities (which includes collateralized mortgage obligations), government-sponsored commercial mortgage-backed securities (which includes collateralized mortgage obligations), U.S. Agency bonds, U.S. Treasury securities, state and municipal bonds and obligations, and other debt securities. We view our securities portfolio as a source of income and liquidity. Interest and principal payments generated from securities provide a source of liquidity to fund loans and meet short-term cash needs. The Risk Management Committee of the Board of Directors is responsible for approving and overseeing our investment policy, which it reviews at least annually. This policy dictates that investment decisions be made based on the safety of the investment, liquidity requirements, potential returns and market risk considerations. At December 31, 2022, our securities totaled $7.2 billion, and generated interest and dividends of 20.8% of total interest income for the year ended December 31, 2022. On at least a quarterly basis, we assess our securities portfolio for expected credit losses in accordance with the current expected credit losses (“CECL”) methodology, with separate approaches depending on whether a security is classified as available for sale or held to maturity.
Sources of Funds
Deposits and other interest-bearing liabilities. At December 31, 2022, total deposits were $19.0 billion. Deposits originating through our branch banking network have traditionally been the principal source of our funds for use in lending and for other general business purposes. We offer a range of demand deposits, interest checking, money market accounts, savings accounts and time certificates of deposit. Interest rates on deposits are based on factors that include loan demand, deposit maturities, alternative costs of funds, and interest rates offered by competing financial institutions in our market area. We believe we have been able to attract and maintain satisfactory levels of deposits based on the level of service we provide to our customers, the convenience of our banking locations, our electronic banking options, and our interest rates, all of which are generally competitive with those of competing financial institutions.
We also participate in the IntraFi Network, which allows us to provide access to multi-million dollar FDIC deposit insurance protection on deposits for consumers, businesses and public entities. We can elect to sell or repurchase this funding as reciprocal deposits from other IntraFi Network banks depending on funding needs. As of December 31, 2022, we had repurchased $665.0 million reciprocal deposits from other IntraFi Network banks and had no additional capacity. In addition, we may purchase brokered deposits as an additional source of funds. During the year ended December 31, 2022 we purchased brokered certificates of deposit which amounted to $928.6 million as of December 31, 2022.
Borrowings. At December 31, 2022, total borrowings were $740.8 million. Borrowings consist of both short-term and long-term borrowings and primarily consist of FHLB advances. Borrowings provide us with one source of funding. Maintaining available borrowing capacity with the FHLB provides us with a contingent source of liquidity.
Eastern Bank is a member of the FHLB of Boston. The primary reason for our FHLBB membership is to gain access to a reliable source of wholesale funding, particularly term funding, as a tool to manage liquidity and interest rate risk. As a member of the FHLBB, we are required to purchase shares in the FHLBB. Accordingly, we had invested $41.4 million in shares of the FHLBB and had $704.1 million outstanding in FHLBB borrowings with original maturities ranging from 1 week to 20 years at December 31, 2022. In addition, we had $2.0 billion of borrowing capacity remaining with the FHLBB at December 31, 2022.
See Note 11, “Borrowed Funds” within the Notes to the Consolidated Financial Statements included in Item 8 in this Current Report on Form 8-K for more information regarding borrowings.
Eastern Wealth Management
Through Eastern Bank’s wealth management division, we offer a range of trust services, including managing customer investments, serving as custodian for customer assets, and providing other fiduciary services including serving as trustee and personal representative of estates. Our clients include individuals, trusts, businesses, employer-sponsored retirement plans and charitable organizations. Services offered include financial planning and portfolio management. At December 31, 2022, Eastern Bank held $2.9 billion of assets in a fiduciary, custodial or agency capacity for customers. These assets are not assets of Eastern Bank and therefore are not included in the Consolidated Balance Sheets included in this Current Report on Form 8-K. Eastern Wealth Management had 49 full-time equivalent employees as of December 31, 2022 and revenue of $23.6 million or approximately 30.7% of noninterest income during the year ended December 31, 2022.
Regulation
We are subject to the extensive regulatory framework applicable to bank holding companies, bank subsidiaries and their affiliates. This framework is intended primarily for the protection of depositors, the FDIC’s Deposit Insurance Fund and the banking system as a whole, and generally is not intended for the protection of shareholders or other investors. Described below are the material elements of selected laws and regulations applicable to us, the Bank, our subsidiaries and our affiliates. These descriptions are not intended to be complete and are qualified in their entirety by reference to the full text of the statutes and regulations described.
General
Eastern Bank is a Massachusetts-chartered non-member bank. Eastern Bank’s deposits are insured up to applicable limits by the FDIC. Eastern Bank is subject to extensive regulation by the Massachusetts Commissioner of Banks, as its chartering authority, and by the FDIC, as its primary federal regulator. Eastern Bank is required to file reports with, and is periodically examined by, the Massachusetts Commissioner of Banks and the FDIC concerning its activities and financial condition and must obtain regulatory approvals prior to entering into certain transactions, including, but not limited to, mergers with or acquisitions of other financial institutions. Eastern Bank is a member of the FHLBB.
Eastern Bank is subject to federal and state regulation and supervision that establishes a comprehensive framework of activities in which an insured state-chartered bank can engage and is intended primarily for the protection of depositors and borrowers and, for purposes of the FDIC, the protection of the deposit insurance fund.
The statutory regulatory structure also gives both federal and state regulatory authorities extensive discretion in connection with their supervisory and enforcement activities and examination policies, including policies with respect to the classification of assets and the establishment of adequate loan loss reserves for regulatory purposes.
As a bank holding company, Eastern Bankshares, Inc. is required to comply with the rules and regulations of the Federal Reserve Board. It is required to file certain reports with the Federal Reserve Board and is subject to examination by and subject to the enforcement authority of the Federal Reserve Board. Eastern Bankshares, Inc. is also subject to examination by the Massachusetts Commissioner of Banks. In addition, Eastern Bankshares, Inc. is subject to the rules and regulations of the U.S. Securities and Exchange Commission (the “SEC”) under the federal securities laws.
Any change in applicable laws or regulations could have a material adverse impact on the operations and financial performance of Eastern Bankshares, Inc. and Eastern Bank. In addition, Eastern Bankshares, Inc. and Eastern Bank are affected by the monetary and fiscal policies of the United States Government, including the Federal Reserve Board. In view of changing conditions in the national economy and in the financial markets, it is impossible for management to accurately predict future changes in monetary policy or the effect such changes may have on the business or financial condition of Eastern Bankshares, Inc. and Eastern Bank.
Set forth below is a brief description of material regulatory requirements that are applicable to Eastern Bank and Eastern Bankshares, Inc. The description is limited to certain material aspects of the statutes and regulations addressed, and is not intended to be a complete description of such statutes and regulations and their effects on Eastern Bank and Eastern Bankshares, Inc.
Massachusetts Banking Laws and Supervision
Eastern Bank, as a Massachusetts-chartered bank, is regulated and supervised by the Massachusetts Commissioner of Banks. The Massachusetts Commissioner of Banks is required to regularly examine each state-chartered bank. The approval of the Massachusetts Commissioner of Banks is required to establish or close branches, to merge with another bank, to issue shares and to undertake certain other activities. Any Massachusetts bank that does not operate in accordance with the regulations, policies and directives of the Massachusetts Commissioner of Banks may be sanctioned. The Massachusetts Commissioner of Banks may suspend or remove directors or officers of a Massachusetts-chartered bank who have violated the law, conducted a bank’s business in a manner that is unsafe, unsound or contrary to the depositors’ interests, or been negligent in the performance of their duties. In addition, the Massachusetts Commissioner of Banks has the authority to appoint the FDIC as a receiver or conservator if the Massachusetts Commissioner of Banks or the FDIC determine that we are conducting our business in an unsafe or unauthorized manner, and under certain other circumstances.
The powers that Massachusetts-chartered banks can exercise under these laws include, but are not limited to, the following:
Lending Activities. A Massachusetts-chartered bank may make a wide variety of mortgage loans including fixed-rate loans, adjustable-rate loans, variable-rate loans, participation loans, graduated payment loans, construction and development loans, condominium and co-operative loans, second mortgage loans and other types of loans that may be made in accordance with applicable regulations. Commercial loans may be made to corporations and other commercial enterprises with or without security. Consumer and personal loans may also be made with or without security.
Insurance Sales. Massachusetts-chartered banks may engage in insurance sales activities if the Massachusetts Commissioner of Banks has approved a plan of operation for insurance activities and the bank obtains a license from the Massachusetts Division of Insurance. Massachusetts-chartered banks may be licensed directly or indirectly through an affiliate or a subsidiary corporation established for this purpose. Eastern Bank has received approval for insurance sales activities, and offers a variety of personal and business insurance products and services through its wholly-owned subsidiary, Eastern Insurance Group, a licensed insurance agency. Eastern Insurance Group has also obtained all licenses required by various state insurance regulatory authorities in other states that license, regulate and supervise insurance producers, brokers and agents. Substantially all of the historical results of our previously reported insurance agency business segment have been reflected as discontinued operations in our recast consolidated financial statements for all periods presented herein, including, as of December 31, 2022 and 2021, substantially all of the assets and liabilities associated with the insurance agency business being classified as assets and liabilities of discontinued operations in our Consolidated Balance Sheets. Refer to Note 24, “Discontinued Operations” within the Notes to the Consolidated Financial Statements included in Item 8 in this Current Report on Form 8-K for additional information.
Investment Activities. In general and subject to constraints under federal law, Massachusetts-chartered banks may invest in preferred and common shares of any corporation organized under the laws of the United States or any state provided such investments do not involve control of any corporation and do not, in the aggregate, exceed 4.0% of the bank’s deposits and have separate authority to invest up to 15% of the bank’s assets in shares listed on a national share exchange in the United States.
Massachusetts-chartered banks may additionally invest an amount equal to 1.0% of their deposits in shares of Massachusetts corporations or companies with substantial employment in Massachusetts which have pledged to the Massachusetts Commissioner of Banks that such monies will be used for further development within Massachusetts. At the present time, Eastern Bank has the grandfathered authority under state law to invest in equity securities. However, such investment authority is constrained by federal law. See the subsection titled “—Federal Bank Regulation—Investment Activities” for such federal restrictions.
Dividends. Massachusetts-chartered banks may declare from net profits cash dividends not more frequently than quarterly and non-cash dividends at any time. No dividends may be declared, credited or paid if the bank’s capital is impaired. Massachusetts-chartered banks with outstanding preferred stock may not, without the prior approval of the Massachusetts Commissioner of Banks, declare dividends on its common stock without also declaring dividends on the preferred stock. The approval of the Massachusetts Commissioner of Banks is required if the total of all dividends declared in any calendar year exceeds the total of its net profits for that year combined with its retained net profits of the preceding two years, less any required transfer to surplus or a fund for the retirement of any preferred shares. Net profits for this purpose means the remainder of all earnings from current operations plus actual recoveries on loans and investments and other assets after deducting current operating expenses, actual losses, accrued dividends on preferred shares, if any, and all federal and state taxes.
Liquidation Account Effect on Dividends. As a result of the conversion of Eastern Bank Corporation, the predecessor holding company of Eastern Bank, from a mutual into a stock holding company in connection with our IPO (the “Conversion”), Eastern Bankshares, Inc. may not declare or pay a cash dividend on, or repurchase any of its capital shares if the effect thereof would cause its net worth to be reduced below (i) the amount required for the liquidation account established by Eastern Bankshares, Inc. in connection with the IPO (“Liquidation Account”) or (ii) the regulatory capital requirements of Eastern Bankshares, Inc. (to the extent applicable).
The Liquidation Account was designed to provide payments to depositors of their liquidation interests, if any, in the end of a liquidation of (a) Eastern Bankshares, Inc. and Eastern Bank, or (b) Eastern Bank. Under the plan of conversion of Eastern Bank Corporation in connection with the Conversion, eligible account holders received an interest in a liquidation account maintained by Eastern Bankshares, Inc. in an amount equal to (i) Eastern Bank Corporation’s ownership interest in Eastern Bank’s total shareholders’ equity as of the date of the latest statement of financial condition included in our IPO prospectus, plus (ii) the value of the net assets of Eastern Bank Corporation as of the date of the latest statement of financial condition of Eastern Bank Corporation prior to the consummation of the conversion (excluding its ownership of Eastern Bank). Eastern Bank Corporation’s plan of conversion also provided for the establishment of a parallel liquidation account maintained at Eastern Bank to support Eastern Bankshares, Inc.’s liquidation account in the event Eastern Bankshares, Inc. does not have sufficient assets to fund its obligations under Eastern Bankshares, Inc.’s liquidation account. Eastern Bankshares, Inc. and Eastern Bank hold the Liquidation Account for the benefit of eligible account holders who have continued to maintain deposits in Eastern Bank following completion of the conversion.
Share Repurchases. Eastern Bankshares, Inc. may not repurchase any of its capital stock if the effect thereof would cause its net worth to be reduced below (i) the amount required for the Liquidation Account or (ii) the regulatory capital requirements of Eastern Bankshares, Inc. (to the extent applicable). In addition, under Massachusetts regulations, Eastern Bankshares, Inc. may not repurchase shares of its common stock during the first three years following the completion of the IPO, except to fund tax-qualified or non-tax-qualified employee stock benefit plans, or except in amounts not greater than 5% of our outstanding shares of common stock where compelling and valid business reasons are established to the satisfaction of the Massachusetts Commissioner of Banks.
On November 12, 2021, we received a notice of non-objection from the Federal Reserve Board to our first proposed share repurchase program. Our authorization to repurchase shares under this program, which was approved by our Board of Directors, was limited to 9,337,900 shares, which represented 5% of our then-outstanding shares of common stock, over a 12-month period. The program was further limited to $225.0 million through November 30, 2022. We completed the repurchase of the total number of shares authorized through this program during the year ended December 31, 2022.
On September 7, 2022, we announced receipt of a notice of non-objection from the Federal Reserve Board for a new share repurchase program. The program, which authorizes the purchase of up to 8,900,000 shares, or 5.0% of our then-outstanding shares of common stock over a 12-month period, is limited to $200.0 million through August 31, 2023.
Protection of Personal Information. Massachusetts has adopted statutory and regulatory requirements intended to protect personal information. The requirements are similar to federal laws such as the Gramm-Leach-Bliley Act, discussed below under “—Federal Bank Regulation—Privacy Regulations.” They require organizations to establish written information security programs to prevent identity theft and other fraud. The Massachusetts regulation also contains technology system security requirements, especially for the encryption of personal information sent over wireless or public networks or stored on portable devices.
Parity Powers. Massachusetts-chartered banks may, in accordance with Massachusetts law, exercise any power and engage in any activity that has been authorized for national banks, federal thrifts or state banks in a state other than Massachusetts, provided that the activity is permissible under applicable federal law and not specifically prohibited by Massachusetts law. Such powers and activities must be subject to the same limitations and restrictions imposed on the national bank, federal thrift or out-of-state bank that exercised the power or activity. A Massachusetts bank may exercise such powers, and engage in such activities by providing 30 days’ advanced written notice to the Massachusetts Commissioner of Banks.
Loans to One Borrower Limitations. Massachusetts banking law grants broad lending authority. However, with certain limited exceptions, total obligations of one borrower and related interests to a bank may not exceed 20.0% of the total of the bank’s capital, which is defined under Massachusetts law as the sum of the bank’s capital shares, surplus account and undivided profits.
Loans to a Bank’s Insiders. Under Massachusetts law, a Massachusetts-chartered bank must comply with Regulation O of the Federal Reserve Board and the Massachusetts Commissioner of Banks retains examination and enforcement authority to ensure compliance. Regulation O generally requires that extensions of credit to insiders:
•be made on terms that are substantially the same as, and follow credit underwriting procedures that are not less stringent than, those prevailing for comparable transactions with unaffiliated persons and that do not involve more than the normal risk of repayment or present other unfavorable features;
•not exceed certain limitations on the amount of credit extended to such persons, individually and in the aggregate, which limits are based, in part, on the amount of the Massachusetts financial institution’s capital; and
•meet other definitional and procedural requirements as specified in the regulation.
Regulatory Enforcement Authority. Any Massachusetts-chartered bank that does not operate in accordance with the regulations, policies and directives of the Massachusetts Commissioner of Banks may be subject to sanctions for non-compliance, including seizure of the property and business of the bank, imposition of a conservatorship or revocation of its charter. The Massachusetts Commissioner of Banks may, under certain circumstances, suspend or remove officers or directors who have violated the law, conducted the bank’s business in a manner which is unsafe, unsound or contrary to the depositors’ interests or been negligent in the performance of their duties. In addition, upon finding that a bank has engaged in an unfair or deceptive act or practice, the Massachusetts Commissioner of Banks may issue an order to cease and desist and impose a fine on the bank concerned. Massachusetts consumer protection and civil rights statutes applicable to Eastern Bank permit private individual and class action lawsuits and provide for the rescission of consumer transactions, including loans, and the recovery of statutory and punitive damage and attorney’s fees in the case of certain violations of those statutes.
Massachusetts has other statutes and regulations that are similar to the federal provisions discussed below.
Federal Bank Regulation
Capital Requirements. Federal regulations require FDIC-insured depository institutions, such as Eastern Bank, to meet several minimum capital standards: a common equity Tier 1 capital to risk-based assets ratio of 4.5%, a Tier 1 capital to risk-based assets ratio of 6.0%, a total capital to risk-based assets ratio of 8.0%, and a Tier 1 capital to average assets leverage ratio of 4.0%. The Federal Reserve has substantially identical requirements for the holding company. For further discussion of these requirements, see Note 16, "Minimum Capital Requirements" within the Notes to the Consolidated Financial Statements included in Item 8 in this Current Report on Form 8-K.
For purposes of the regulatory capital requirements, common equity Tier 1 capital is generally defined as common shareholders’ equity and retained earnings. Tier 1 capital is generally defined as common equity Tier 1 and additional Tier 1 capital. Additional Tier 1 capital includes certain noncumulative perpetual preferred shares and related surplus and minority interests in equity accounts of consolidated subsidiaries. Total capital includes Tier 1 capital (common equity Tier 1 capital plus additional Tier 1 capital) and Tier 2 capital. Tier 2 capital is comprised of capital instruments and related surplus, meeting specified requirements, and may include cumulative preferred shares and long-term perpetual preferred shares, mandatory convertible securities, intermediate preferred shares and subordinated debt. Also included in Tier 2 capital is the allowance for loan and lease losses limited to a maximum of 1.25% of risk-weighted assets. As permitted by applicable capital regulations, we have opted out of the requirement to include Accumulated Other Comprehensive Income (“AOCI”) in our regulatory capital determinations. Calculation of all types of regulatory capital is subject to deductions and adjustments specified in the regulations.
In determining the amount of risk-weighted assets for purposes of calculating risk-based capital ratios, all assets, including certain off-balance sheet assets (e.g., recourse obligations, direct credit substitutes, residual interests) are multiplied by a risk weight factor assigned by the regulations based on the risks believed inherent in the type of asset. Higher levels of capital are required for asset categories believed to present greater risk. For example, a risk weight of 0% is assigned to cash and certain United States government securities, a risk weight of 50% is generally assigned to prudently underwritten first lien one to four- family residential mortgages, a risk weight of 100% is assigned to commercial and consumer loans, a risk weight of 150% is assigned to certain past due loans and a risk weight of up to 600% is assigned to permissible equity interests, depending on certain specified factors.
In addition to establishing the minimum regulatory capital requirements, the regulations limit capital distributions and certain discretionary bonus payments to management if the institution does not hold a “capital conservation buffer” in an amount of 2.5% or greater, on top of the minimum risk-based capital ratios. For banking organizations seeking to avoid the limitations on capital distributions and discretionary bonus payments, the capital conservation buffer effectively increases the minimum common equity Tier 1 capital ratio to 7.0%, the minimum Tier 1 capital ratio to 8.5%, and the minimum total capital ratio to 10.5%. At December 31, 2022, Eastern Bank exceeded the regulatory requirement for the capital conservation buffer.
The FDIC Improvement Act required each federal banking agency to revise its risk-based capital standards for insured institutions to ensure that those standards take adequate account of interest-rate risk, concentration of credit risk, and the risk of nontraditional activities, as well as to reflect the actual performance and expected risk of loss on multi-family residential loans. The FDIC, along with the other federal banking agencies, adopted a regulation providing that the agencies will take into account the exposure of a bank’s capital and economic value to changes in interest rate risk in assessing a bank’s capital adequacy. The FDIC also has authority to establish individual minimum capital requirements in appropriate cases upon determination that an institution’s capital level is, or is likely to become, inadequate in light of the particular circumstances.
Standards for Safety and Soundness. As required by statute, the federal banking agencies adopted final regulations and Interagency Guidelines Establishing Standards for Safety and Soundness to implement safety and soundness standards. The guidelines set forth the safety and soundness standards that the federal banking agencies use to identify and address problems at insured depository institutions before capital becomes impaired. The guidelines address internal controls and information systems, internal audit systems, credit underwriting, loan documentation, interest rate exposure, asset growth, asset quality, earnings and compensation, fees and benefits. The agencies have also established standards for safeguarding customer information. If the appropriate federal banking agency determines that an institution fails to meet any standard prescribed by the guidelines, the agency may require the institution to submit to the agency an acceptable plan to achieve compliance with the standard.
Investment Activities. All state-chartered FDIC-insured banks, including Massachusetts-chartered banks, are generally limited in their investment activities to principal and equity investments of the type and in the amount authorized for national banks, notwithstanding state law, subject to certain exceptions. For example, state-chartered banks may, with FDIC approval, continue to exercise state authority that was in existence as of September 30, 1991, to invest in common or preferred shares listed on a national securities exchange and in the shares of an investment company registered under the Investment Company Act of 1940, as amended. The maximum permissible investment is 100% of Tier 1 Capital, as specified by the FDIC’s regulations, or the maximum amount permitted by Massachusetts law, whichever is less.
In addition, the FDIC is authorized to permit such a state bank to engage as principal in state-authorized activities or investments not permissible for national banks (other than non-subsidiary equity investments) if it meets all applicable capital requirements and the FDIC determines that such activities or investments do not pose a significant risk to the Deposit Insurance Fund. The FDIC has adopted procedures for institutions seeking approval to engage in such activities or investments. In addition, a nonmember bank may control a subsidiary that engages in activities as principal that would only be permitted for a national bank to conduct in a “financial subsidiary” if a bank meets specified conditions and deducts its investment in the subsidiary for regulatory capital purposes.
Interstate Banking and Branching. Federal law permits well capitalized and well managed bank holding companies to acquire banks in any state, subject to Federal Reserve Board approval, certain concentration limits and other specified conditions. Interstate mergers of banks are also authorized, subject to regulatory approval and other specified conditions. In addition, amendments adopted as part of the Dodd-Frank Act permit banks to establish de novo branches on an interstate basis to the extent that branching is authorized by the law of the host state for the banks chartered by that state.
Prompt Corrective Regulatory Action. Federal law requires, among other things, that federal bank regulatory authorities take “prompt corrective action” with respect to banks that do not meet minimum capital requirements. For these purposes, the law establishes five capital categories: well capitalized, adequately capitalized, undercapitalized, significantly undercapitalized and critically undercapitalized.
The FDIC has adopted regulations to implement the prompt corrective action legislation. An institution is deemed to be “well capitalized” if it has a total risk-based capital ratio of 10.0% or greater, a Tier 1 risk-based capital ratio of 8.0% or greater, a common equity Tier 1 ratio of 6.5% or greater and a leverage ratio of 5.0% or greater. An institution is “adequately capitalized” if it has a total risk-based capital ratio of 8.0% or greater, a Tier 1 risk-based capital ratio of 6.0% or greater, a common equity Tier 1 ratio of 4.5% or greater and a leverage ratio of 4.0% or greater. An institution is “undercapitalized” if it has a total risk-based capital ratio of less than 8.0%, a Tier 1 risk-based capital ratio of less than 6.0%, a common equity Tier 1 ratio of less than 4.5% or a leverage ratio of less than 4.0%.
An institution is deemed to be “significantly undercapitalized” if it has a total risk-based capital ratio of less than 6.0%, a Tier 1 risk-based capital ratio of less than 4.0%, a common equity Tier 1 ratio of less than 3.0% or a leverage ratio of less than 3.0%. An institution is considered to be “critically undercapitalized” if it has a ratio of tangible equity (as defined in the regulations) to total assets that is equal to or less than 2.0%. As of December 31, 2022, Eastern Bank was a “well capitalized” institution under FDIC regulations.
At each successive lower capital category, an insured depository institution is subject to more restrictions and prohibitions, including restrictions on growth, restrictions on interest rates paid on deposits, restrictions or prohibitions on payment of dividends, and restrictions on the acceptance of brokered deposits. Furthermore, if an insured depository institution is classified in one of the undercapitalized categories, it is required to submit a capital restoration plan to the appropriate federal banking agency, and the holding company must guarantee the performance of that plan. Based upon its capital levels, a bank that is classified as well-capitalized, adequately capitalized, or undercapitalized may be treated as though it were in the next lower capital category if the appropriate federal banking agency, after notice and opportunity for hearing, determines that an unsafe or unsound condition, or an unsafe or unsound practice, warrants such treatment. An undercapitalized bank’s compliance with a capital restoration plan is required to be guaranteed by any company that controls the undercapitalized institution in an amount equal to the lesser of 5.0% of the institution’s total assets when deemed undercapitalized or the amount necessary to achieve the status of adequately capitalized. If an “undercapitalized” bank fails to submit an acceptable plan, it is treated as if it is “significantly undercapitalized.” “Significantly undercapitalized” banks must comply with one or more of a number of additional restrictions, including but not limited to an order by the FDIC to sell sufficient voting shares to become adequately capitalized, requirements to reduce total assets, cease receipt of deposits from correspondent banks or dismiss directors or officers, and restrictions on interest rates paid on deposits, compensation of executive officers and capital distributions by the parent holding company. “Critically undercapitalized” institutions are subject to additional measures including, subject to a narrow exception, the appointment of a receiver or conservator within 270 days after it obtains such status.
Transaction with Affiliates and Regulation W of the Federal Reserve Board Regulations. Transactions between banks and their affiliates are governed by federal law. An affiliate of a bank is any company or entity that controls, is controlled by or is under common control with the bank. In a holding company context, the parent bank holding company and any companies which are controlled by such parent holding company are affiliates of the bank (although subsidiaries of the bank itself, except financial subsidiaries, are generally not considered affiliates). Generally, Section 23A of the Federal Reserve Act and the Federal Reserve Board’s Regulation W limit the extent to which the bank or its subsidiaries may engage in “covered transactions” with any one affiliate to an amount equal to 10.0% of such institution’s capital shares and surplus, and with all such transactions with all affiliates to an amount equal to 20.0% of such institution’s capital shares and surplus. Section 23B applies to “covered transactions” as well as to certain other transactions and requires that all such transactions be on terms substantially the same, or at least as favorable, to the institution or subsidiary as those provided to a non-affiliate. The term “covered transaction” includes the making of loans to, purchase of assets from, and issuance of a guarantee to an affiliate, and other similar transactions. Section 23B transactions also include the provision of services and the sale of assets by a bank to an affiliate. In addition, loans or other extensions of credit by the financial institution to the affiliate are required to be collateralized in accordance with the requirements set forth in Section 23A of the Federal Reserve Act.
Sections 22(h) and (g) of the Federal Reserve Act place restrictions on loans to a bank’s insiders, i.e., executive officers, directors and principal shareholders. Under Section 22(h) of the Federal Reserve Act, loans to a director, an executive officer and to a greater than 10.0% shareholder of a financial institution, and certain affiliated interests of these, together with all other outstanding loans to such person and affiliated interests, may not exceed specified limits. Section 22(h) of the Federal Reserve Act also requires that loans to directors, executive officers and principal shareholders be made on terms and conditions substantially the same as offered in comparable transactions to persons who are not insiders and also requires prior board approval for certain loans. In addition, the aggregate amount of extensions of credit by a financial institution to insiders cannot exceed the institution’s unimpaired capital and surplus. Section 22(g) of the Federal Reserve Act places additional restrictions on loans to executive officers.
Enforcement. The FDIC has extensive enforcement authority over insured state-chartered banks, including Eastern Bank. The enforcement authority includes, among other things, the ability to assess civil money penalties, issue cease and desist orders, remove directors and officers and prohibit institution affiliated parties from banking. In general, these enforcement actions may be initiated in response to violations of laws and regulations, breaches of fiduciary duty and unsafe or unsound practices. The FDIC is required, with certain exceptions, to appoint a receiver or conservator for an insured state nonmember bank if that bank was “critically undercapitalized” on average during the calendar quarter beginning 270 days after the date on which the institution became “critically undercapitalized.” The FDIC may also appoint itself as conservator or receiver for an insured state non-member bank under specified circumstances, including: insolvency; substantial dissipation of assets or earnings through violations of law or unsafe or unsound practices; existence of an unsafe or unsound condition to transact business; insufficient capital; or the incurrence of losses that will deplete substantially all of the institution’s capital with no reasonable prospect of replenishment without federal assistance.
Federal Insurance of Deposit Accounts. Eastern Bank is a member of the Deposit Insurance Fund, which is administered by the FDIC. The Deposit Insurance Fund provides deposit insurance of $250,000 per depositor, per insured bank, for each of the eight ownership categories defined by the FDIC, provided that the requirements for each ownership category are met.
The FDIC assesses deposit insurance premiums on each insured institution quarterly based on risk characteristics of the institution. As a bank with assets of more than $10 billion, Eastern Bank is subject to a deposit assessment based on a scorecard issued by the FDIC. This scorecard considers, among other things, Eastern Bank’s rating under the Federal Financial Institutions Examination Council’s Uniform Financial Institutions Rating System, or CAMELS rating, results of asset-related stress testing and funding-related stress, as well as our use of core deposits, among other things. Depending on the results of Eastern Bank’s performance under that scorecard, the total base assessment rate is between 1.5 and 40 basis points. The FDIC Board of Directors may also impose special assessments under stressed circumstances.
The FDIC has authority to increase insurance assessments. A significant increase in insurance premiums would likely have an adverse effect on the operating expenses and results of operations of Eastern Bank. Future insurance assessment rates cannot be predicted.
Insurance of deposits may be terminated by the FDIC upon a finding that the institution has engaged in unsafe or unsound practices, is in an unsafe or unsound condition to continue operations or has violated any applicable law, regulation, rule order or regulatory condition imposed in writing. We do not know of any practice, condition or violation that might lead to termination of deposit insurance.
Privacy Regulations. FDIC regulations generally require that Eastern Bank disclose its privacy policy, including identifying with whom it shares a customer’s “non-public personal information,” to customers at the time of establishing the customer relationship and annually thereafter. In addition, Eastern Bank is required to provide its customers with the ability to “opt-out” of having their personal information shared with unaffiliated third parties and not to disclose account numbers or access codes to non-affiliated third parties for marketing purposes. Eastern Bank currently has a privacy protection policy in place and believes that such policy is in compliance with the regulations.
Community Reinvestment Act. Under the Community Reinvestment Act, or CRA, as implemented by FDIC regulations, Eastern Bank as a non-member bank has a continuing and affirmative obligation, consistent with its safe and sound operation, to help meet the credit needs of its entire community, including low- and moderate-income neighborhoods. The CRA does not establish specific lending requirements or programs for financial institutions nor does it limit an institution’s discretion to develop the types of products and services that it believes are best suited to its particular community, consistent with the CRA. The CRA does require the FDIC, in connection with its examination of a non-member bank, to assess the institution’s record of meeting the credit needs of its community and to take such record into account in its evaluation of certain applications by such institution, including applications to acquire branches and other financial institutions. The CRA requires the FDIC to provide a written evaluation of an institution’s CRA performance utilizing a four-tiered descriptive rating system. Eastern Bank’s most recently published FDIC CRA performance rating was “Outstanding.”
Massachusetts has its own statutory counterpart to the CRA which is also applicable to Eastern Bank. The Massachusetts version is generally similar to the CRA but utilizes a five-tiered descriptive rating system. Massachusetts law requires the Massachusetts Commissioner of Banks to consider, but not be limited to, a bank’s record of performance under Massachusetts law in considering any application by the bank to establish a branch or other deposit-taking facility, to relocate an office or to merge or consolidate with or acquire the assets and assume the liabilities of any other banking institution. Eastern Bank’s most recent 2022 CRA performance rating under Massachusetts law was “Outstanding.”
On December 14, 2021, The Office of the Comptroller of the Currency issued a final rule to rescind its June 2020 Community Reinvestment Act (CRA) rule and replace it with a rule based on the rules adopted jointly by the Federal banking agencies in 1995, as amended. The OCC’s action facilitates the planned future issuance of updated interagency CRA rules with the Federal Reserve Board and FDIC to modernize the CRA regulatory framework and promote consistency for all insured depository institutions. It is unclear whether or when a final rule will be promulgated. It is also unclear whether the Massachusetts Commissioner of Banks will adopt corresponding changes to its CRA regulations, which apply to all Massachusetts-chartered banks, including Eastern Bank.
Compensation Practices. Our compensation practices are subject to oversight by the Federal Reserve Board and the FDIC. The federal banking regulators have provided guidance designed to ensure that incentive compensation arrangements at banking organizations take into account risk and are consistent with safe and sound practices. The guidance sets forth the following three key principles with respect to incentive compensation arrangements: (i) the arrangements should provide employees with incentives that appropriately balance risk and financial results in a manner that does not encourage employees to expose their organizations to imprudent risk; (ii) the arrangements should be compatible with effective controls and risk management; and (iii) the arrangements should be supported by strong corporate governance.
The guidance provides that supervisory findings with respect to incentive compensation will be incorporated, as appropriate, into the organization’s supervisory ratings, which can affect its ability to make acquisitions or perform other actions. The guidance also provides that enforcement actions may be taken against a banking organization if its incentive compensation arrangements or related risk management, control or governance processes pose a risk to the organization’s safety and financial weakness. The federal banking agencies have yet to adopt regulations implementing the executive compensation provisions of the Dodd Frank Act. In August 2022, the SEC adopted new rules requiring public companies to disclose in future proxy statements the relationship between executive pay and company financial performance. Among other items, the new rules require: (1) tabular disclosure of compensation actually paid to certain executive officers, along with certain company and peer performance metrics; (2) a graphical or narrative explanation of the relationship between compensation paid and applicable performance measures; and (3) a tabular list of financial performance measures applied to executive compensation for the most recent fiscal year.
Consumer Protection and Fair Lending Regulations. Massachusetts-chartered banks are subject to a variety of federal and Massachusetts statutes and regulations that are intended to protect consumers and prohibit discrimination in the granting of credit. These statutes and regulations provide for a range of sanctions for non-compliance with their terms, including imposition of administrative fines and remedial orders, and referral to the Attorney General for prosecution of a civil action for actual and punitive damages and injunctive relief. Certain of these statutes authorize private individual and class action lawsuits and the award of actual, statutory and punitive damages and attorneys’ fees for certain types of violations.
Consumer Financial Protection Bureau Supervision. With total assets in excess of $10 billion, Eastern Bank is classified as a large bank and therefore is subject to direct supervision and examination by the Consumer Financial Protection Bureau (the “CFPB”) for compliance with federal consumer financial law under Title X of the Dodd-Frank Act.
USA PATRIOT Act. Eastern Bank is subject to the USA PATRIOT Act, which gave federal agencies additional powers to address terrorist threats through enhanced domestic security measures, expanded surveillance powers, increased information sharing, and broadened anti-money laundering requirements. By way of amendments to the Bank Secrecy Act, Title III of the USA PATRIOT Act provided measures intended to encourage information sharing among bank regulatory agencies and law enforcement bodies. Further, certain provisions of Title III impose affirmative obligations on a broad range of financial institutions, including banks, thrifts, brokers, dealers, credit unions, money transfer agents, and parties registered under the Commodity Exchange Act.
CARES Act. Eastern Bank has been impacted by provisions of the Coronavirus Aid, Relief, and Economic Security Act, or CARES Act, containing, among other provisions, certain temporary regulatory forbearance measures applicable during the COVID-19 pandemic state of emergency and temporary relief from troubled debt restructurings.
Consolidated Appropriations Act. Eastern Bank has been impacted by provisions of the Consolidated Appropriations Act, which was enacted on December 27, 2020. These provisions extend certain provisions related to the COVID-19 pandemic in the United States (which were due to expire) and provides additional emergency relief to individuals and businesses. Included within the provisions of the Consolidated Appropriations Act was the extension of Section 4013 of the CARES Act to January 1, 2022, which provided relief from a requirement to evaluate loans that had received COVID-19 modifications to determine if the loans required troubled debt restructuring (“TDR”) treatment provided certain criteria were met. Accordingly, we applied the TDR relief granted pursuant to such section to any qualifying loan modifications executed during the allowable time period.
Other Regulations
Interest and other charges collected or contracted for by Eastern Bank are subject to state usury laws and federal laws concerning interest rates. Loan operations are also subject to state and federal laws applicable to credit transactions, such as the:
•Home Mortgage Disclosure Act of 1975, requiring financial institutions to provide information to enable the public and public officials to determine whether a financial institution is fulfilling its obligation to help meet the housing needs of the community it serves;
•Equal Credit Opportunity Act, prohibiting discrimination on the basis of race, creed or other prohibited factors in extending credit;
•Fair Credit Reporting Act of 1978, governing the use and provision of information to credit reporting agencies;
•Massachusetts Debt Collection Regulations, establishing standards, by defining unfair or deceptive acts or practices, for the collection of debts from persons within the Commonwealth of Massachusetts and the General Laws of Massachusetts, Chapter 167E, which governs Eastern Bank’s lending powers; and
•Rules and regulations of the various federal and state agencies charged with the responsibility of implementing such federal and state laws.
The deposit operations of Eastern Bank also are subject to, among others, the:
•Right to Financial Privacy Act, which imposes a duty to maintain confidentiality of consumer financial records and prescribes procedures for complying with administrative subpoenas of financial records;
•Check Clearing for the 21st Century Act (also known as “Check 21”), which gives “substitute checks,” such as digital check images and copies made from that image, the same legal standing as the original paper check;
•Electronic Funds Transfer Act and Regulation E promulgated thereunder, which govern automatic deposits to and withdrawals from deposit accounts and customers’ rights and liabilities arising from the use of automated teller machines and other electronic banking services; and
•General Laws of Massachusetts, Chapter 167D, which governs deposit powers.
Federal Reserve System
Historically, the Federal Reserve Board regulations required depository institutions to maintain interest-earning reserves against their transaction accounts. However, in March of 2020, the Federal Reserve Board eliminated reserve requirements and therefore there was no minimum reserve requirement as of December 31, 2022. The Federal Reserve Board has stated that it has no plans to re-impose reserve requirements. However, they may adjust reserve requirement ratios in the future if conditions warrant. The annual interest rate on reserve balances was 4.40% as of December 31, 2022.
Federal Home Loan Bank System
Eastern Bank is a member of the Federal Home Loan Bank System, which consists of 11 regional Federal Home Loan Banks. The FHLB provides a central credit facility primarily for member institutions. Members of the FHLB are required to acquire and hold shares of capital shares in the FHLB bank of which they are a member. Eastern Bank acquired capital shares in the FHLBB and was in compliance with this requirement at December 31, 2022. Based on redemption provisions of the FHLBB, the shares have no quoted market value and are carried at cost. Eastern Bank reviews for impairment based on the ultimate recoverability of the cost basis of the FHLBB shares. As of December 31, 2022, no impairment had been recognized.
At its discretion, the FHLBB may declare dividends on the shares. The FHLBs are required to contribute a percentage of their net earnings towards funds for affordable housing programs. These requirements could reduce the amount of dividends that the FHLBs pay to their members and result in the FHLBs imposing a higher rate of interest on advances to their members. Dividend income from the FHLB during the year ended December 31, 2022 was $0.3 million. There can be no assurance that such dividends will continue in the future.
Holding Company Regulation
Eastern Bankshares, Inc. is subject to examination, regulation, and periodic reporting under the Bank Holding Company Act of 1956, as amended, as administered by the Federal Reserve Board. Eastern Bankshares, Inc. is required to obtain the prior approval of the Federal Reserve Board to acquire all, or substantially all, of the assets of any bank or bank holding company. Prior Federal Reserve Board approval would be required for Eastern Bankshares, Inc. to acquire direct or indirect ownership or control of any voting securities of any bank or bank holding company if, after such acquisition, it would, directly or indirectly, own or control more than 5% of any class of voting shares of the bank or bank holding company. In addition to the approval of the Federal Reserve Board, prior approval may also be necessary from other agencies having supervisory jurisdiction over the bank to be acquired before any bank acquisition can be completed.
A bank holding company is generally prohibited from engaging in non-banking activities, or acquiring direct or indirect control of more than 5% of the voting securities of any company engaged in non-banking activities. One of the principal exceptions to this prohibition is for activities found by the Federal Reserve Board to be so closely related to banking or managing or controlling banks as to be a proper incident thereto. Some of the principal activities that the Federal Reserve Board has determined by regulation to be so closely related to banking are: (i) making or servicing loans; (ii) performing certain data processing services; (iii) providing discount brokerage services; (iv) acting as fiduciary, investment or financial advisor; (v) leasing personal or real property; (vi) making investments in corporations or projects designed primarily to promote community welfare; and (vii) acquiring a savings and loan association whose direct and indirect activities are limited to those permitted for bank holding companies.
The Gramm-Leach-Bliley Act of 1999 authorized a bank holding company that meets specified conditions, including being “well-capitalized” and “well managed,” to opt to become a “financial holding company” and thereby engage in a broader array of financial activities than previously permitted.
Such activities can include insurance underwriting and investment banking. Eastern Bankshares, Inc. has no present plan or intent to elect to become a financial holding company.
Eastern Bankshares, Inc. is subject to the Federal Reserve Board’s capital adequacy guidelines for bank holding companies (on a consolidated basis) which have historically been similar to, though less stringent than, those of the FDIC for Eastern Bank. The Dodd-Frank Act, however, required the Federal Reserve Board to promulgate consolidated capital requirements for depository institution holding companies that are no less stringent, both quantitatively and in terms of components of capital, than those applicable to the depository institutions themselves. Consolidated regulatory capital requirements identical to those applicable to the subsidiary banks apply to bank holding companies.
A bank holding company is generally required to give the Federal Reserve Board prior written notice of any purchase or redemption of then outstanding equity securities if the gross consideration for the purchase or redemption, when combined with the net consideration paid for all such purchases or redemptions during the preceding 12 months, is equal to 10% or more of its consolidated net worth. The Federal Reserve Board may disapprove such a purchase or redemption if it determines that the proposal would constitute an unsafe and unsound practice, or would violate any law, regulation, Federal Reserve Board order or directive, or any condition imposed by, or written agreement with, the Federal Reserve Board. There is an exception to this approval requirement for well-capitalized bank holding companies that meet certain other conditions.
The Federal Reserve Board has issued a policy statement regarding capital distributions, including dividends, by bank holding companies. In general, the Federal Reserve Board’s policies provide that dividends should be paid only out of current earnings and only if the prospective rate of earnings retention by the bank holding company appears consistent with the organization’s capital needs, asset quality and overall financial condition. The Federal Reserve Board’s policies also require that a bank holding company serve as a source of financial strength to its subsidiary banks by standing ready to use available resources to provide adequate capital funds to those banks during periods of financial stress or adversity and by maintaining the financial flexibility and capital-raising capacity to obtain additional resources for assisting its subsidiary banks where necessary. The Dodd-Frank Act codified the source of strength doctrine. Under the prompt corrective action laws, the ability of a bank holding company to pay dividends may be restricted if a subsidiary bank becomes undercapitalized. In addition, the Federal Reserve Board has issued guidance that requires consultation with the agency prior to a bank holding company’s payment of dividends or repurchase of shares under certain circumstances. These regulatory policies could affect the ability of Eastern Bankshares, Inc. to pay dividends, repurchase its shares or otherwise engage in capital distributions.
Under the Federal Deposit Insurance Act, depository institutions are liable to the FDIC for losses suffered or anticipated by the FDIC in connection with the default of a commonly controlled depository institution or any assistance provided by the FDIC to such an institution in danger of default. Eastern Bankshares, Inc. does not control two depository institutions that would subject it to the cross-guarantee provisions of the Federal Deposit Insurance Act.
The status of Eastern Bankshares, Inc. as a registered bank holding company under the Bank Holding Company Act will not exempt it from certain federal and state laws and regulations applicable to corporations generally, including, without limitation, certain provisions of the federal securities laws.
Massachusetts Holding Company Regulation. Under the Massachusetts banking laws, a company owning or controlling two or more banking institutions is regulated as a bank holding company. The term “company” is defined by the Massachusetts banking laws similarly to the definition of “company” under the Bank Holding Company Act. Each Massachusetts bank holding company: (i) must obtain the approval of the Massachusetts Board of Bank Incorporation before engaging in certain transactions, such as the acquisition of more than 5% of the voting shares of another banking institution; (ii) must register, and file reports, with the Massachusetts Commissioner of Banks; and (iii) is subject to examination by the Massachusetts Commissioner of Banks. As of the date of this Current Report on Form 8-K, Eastern Bankshares, Inc. is not a “bank holding company” under the Massachusetts banking laws, because Eastern Bank is our sole bank subsidiary.
Regulation of Eastern Insurance Group LLC
Eastern Insurance Group LLC is subject to regulation and supervision by the Massachusetts Division of Insurance, and various state insurance regulatory authorities in other states that license, regulate and supervise insurance producers, brokers and agents. Substantially all of the historical results of our previously reported insurance agency segment have been reflected as discontinued operations in our recast consolidated financial statements for all periods presented herein, including, as of December 31, 2022 and 2021, substantially all of the assets and certain liabilities associated with the insurance agency business being classified as assets and liabilities of discontinued operations in our Consolidated Balance Sheets. Refer to Note 24, “Discontinued Operations” within the Notes to the Consolidated Financial Statements included in Item 8 in this Current Report on Form 8-K for additional information.
Federal Securities Laws
The class of common stock of Eastern Bankshares, Inc. is registered with the Securities and Exchange Commission under the Exchange Act, and therefore Eastern Bankshares Inc. and our shareholders are subject to the information, proxy solicitation, insider trading restrictions and other requirements under the Exchange Act.
The registration under the Securities Act of 1933 of shares of common stock issued in Eastern Bankshares, Inc.’s IPO under the Securities Act of 1933, as amended (“Securities Act”) does not cover the resale of those shares. Shares of common stock purchased by persons who are not affiliates of Eastern Bankshares, Inc. may be resold without registration. Shares purchased by an affiliate of Eastern Bankshares, Inc. are subject to the resale restrictions of Rule 144 under the Securities Act (“Rule 144”). If Eastern Bankshares, Inc. meets the current public information requirements of Rule 144, each affiliate of Eastern Bankshares, Inc. that complies with the other conditions of Rule 144, including those that require the affiliate’s sale to be aggregated with those of other persons, would be able to sell in the public market, without registration, a number of shares not to exceed, in any three-month period, the greater of 1% of the outstanding shares of Eastern Bankshares, Inc., or the average weekly volume of trading in the shares during the preceding four calendar weeks. In the future, Eastern Bankshares, Inc. may permit affiliates to have their shares registered for sale under the Securities Act.
In December 2021, the SEC proposed rules related to corporate share repurchase programs, which include extensive disclosure requirements for public companies that engage in share repurchasing. Our future share repurchase programs will likely be subject to these or other share repurchase disclosure requirements. The proposed rules would require an issuer to provide a new Form SR disclosing the amount of purchased shares, share price, and other information on the first business day following the execution date. The proposed amendments also would enhance existing periodic disclosure requirements requiring an issuer to disclose: the objective or rationale for the share repurchases and the process or criteria used to determine the repurchase amounts; any policies and procedures relating to purchases and sales of the issuer’s securities by its officers and directors during a repurchase program, including any restriction on such transactions; and whether the issuer is making its repurchases pursuant to a plan that it intends to satisfy the affirmative defense conditions of Exchange Act Rule 10b5-1(c) and/or the conditions of the Exchange Act Rule 10b-18 non-exclusive safe harbor.
Sarbanes-Oxley Act of 2002
The Sarbanes-Oxley Act of 2002 is intended to improve corporate responsibility, to provide for enhanced penalties for accounting and auditing improprieties at publicly traded companies, and to protect investors by improving the accuracy and reliability of corporate disclosures pursuant to federal securities laws. We have policies, procedures and systems designed to comply with these regulations, and we review and document such policies, procedures and systems to ensure continued compliance with these regulations.
Change in Control Regulations
Under the Change in Bank Control Act, no person, or group of persons acting in concert, may acquire control of a bank holding company such as Eastern Bankshares, Inc. unless the Federal Reserve Board has been given 60 days’ prior written notice and not disapproved the proposed acquisition. The Federal Reserve Board considers several factors in evaluating a notice, including the financial and managerial resources of the acquirer and competitive effects. Control, as defined under the applicable regulations, means the power, directly or indirectly, to direct the management or policies of us or to vote 25% or more of any class of voting securities of ours. Acquisition of more than 10% of any class of a bank holding company’s voting securities constitutes a rebuttable presumption of control under certain circumstances, including where, as will be the case with Eastern Bankshares, Inc., the issuer has registered securities under Section 12 of the Exchange Act. Substantially similar requirements are imposed under Massachusetts law with respect to the acquisition of control, directly or indirectly, of Eastern Bank.
In addition, federal regulations provide that no company may acquire control (as defined in the Bank Holding Company Act) of a bank holding company without the prior approval of the Federal Reserve Board. Any company that acquires such control becomes a “bank holding company” subject to registration, examination and regulation by the Federal Reserve Board.
Through October 14, 2023, no person may acquire beneficial ownership of more than 10% of our common stock without prior approval of the Federal Reserve Board and the Massachusetts Commissioner of Banks. If any person exceeds this 10% beneficial ownership threshold, shares in excess of 10% will not be counted as shares entitled to vote through October 14, 2023.
Legal and Regulatory Proceedings
We operate in a legal and regulatory environment that exposes us to potentially significant risks. In addition to the matters described below, in the normal course of business, we are named, from time to time, as a defendant in various legal actions, including class actions and other individual litigation matters, arising in connection with our activities as a banking institution, including with respect to allegations of unfair or deceptive business practices and our role in administering trusts for which we are a trustee alone or with others.
We also face legal exposure associated with employment actions, which at times can result in matters against Eastern Bank before the Massachusetts Commission Against Discrimination or the U.S. Equal Employment Opportunity Commission. Actual or threatened legal actions against us include claims for substantial amounts of compensatory damages, claims for intermediate amounts of compensatory damages and claims for punitive damages. Compliance with all applicable laws and regulations involves a significant investment in time and resources. Any new laws or regulations applicable to our business, any changes to existing laws or regulations, or any changes to the interpretations or enforcement of those laws or regulations, may affect our operations and/or financial condition. For additional information, see Note 18, “Commitments and Contingencies” within the Notes to the Consolidated Financial Statements included in Item 8 in this Current Report on Form 8-K.
In part as a result of the extensive regulation, supervision and examination of our business described elsewhere in this Current Report on Form 8-K, we are also involved, from time to time, in other reviews, investigations and proceedings (both formal and informal) by governmental and self-regulatory agencies regarding our business, certain of which may result in adverse judgments, settlements, fines, penalties, public or private censure, increased costs, required remediation, restriction on business activities or other impacts on us.
We contest liability and the amount of damages as appropriate in each pending matter. Where available information indicates that it is probable a liability has been incurred at the date of the Consolidated Financial Statements and we can reasonably estimate the amount of that loss, we accrue the estimated loss as a charge to income.
In many proceedings, however, it is inherently difficult to determine whether any loss is probable or even possible or to estimate the amount of any loss. We cannot predict with certainty if, how or when such proceedings will be resolved or what the eventual settlement, fine, penalty or other relief, if any, may be, particularly for proceedings that are in their early stages of development or where plaintiffs seek substantial or indeterminate damages. Numerous issues may need to be resolved before liability can be reasonably estimated, including through potentially lengthy discovery and determination of important factual matters, determination of issues related to class certification and the calculation of damages and by addressing novel or unsettled legal questions relevant to the proceedings in question.
The activities of Eastern Bank, including with respect to disclosures about and implementation of numerous consumer products, are subject to various laws and numerous regulations, including those related to unfair or deceptive acts or practices. If Eastern Bank is found to have violated one or more consumer protection laws, it may be required to pay restitution to certain affected customers in connection with certain of these practices. In addition, Eastern Bank may face formal administrative enforcement actions from its federal and other governmental supervisory agencies, including the assessment of civil monetary penalties and restitution, relating to consumer products, and could also face potential civil litigation. For further information regarding risks related to regulatory actions and litigation, please refer to “Risk Factors—Risks Related to Our Business—Operational risks are inherent in our businesses,” “Risk Factors—Risks Related to Regulations” in Part I, Item 1A of this Current Report on Form 8-K.
Human Capital Management
The following information excludes employees of Eastern Insurance Group, substantially all of the assets and certain liabilities of which are included in discontinued operations.
Diversity, Equity & Inclusion (DE&I)
The Company, which employed 1,744 employees as of December 31, 2022, including 1,564 full-time employees, is deeply committed to having a diverse workforce reflective of the communities we serve, where all feel included and supported. We seek to build and sustain diversity, equity and inclusion (“DEI”) as a critical aspect of our work and workplace environment, which we believe makes us a better employer, provider of services to our customers, member of our communities and investment for our shareholders.
The Company has long been committed to and recognized as a leader in DEI, as evidenced by:
•Our diverse Board of Directors. DEI starts with our diverse Board of Directors, which has long been led by professionals of color, including Lead Director Deborah Jackson. Overall, 45% of our Board of Directors is comprised of women and people of color.
•Our DEI Governance. Each committee of the Board, including the Compensation and Human Capital Management, Nominating and Governance, Audit and Risk Management Committees, has oversight of aspects of the Company’s DEI strategic priorities. We also have a DEI Executive Committee led by the CEO, as well as a DEI Steering Committee comprised of executives, leaders of our employee resource groups and outside professionals.
•Our diverse leadership team. Our Management Committee, which runs the Company, is comprised of 13 executives, about 46% of whom are women or people of color, including our President, Quincy Miller, and Sujata Yadav, Executive Vice President and Chief Marketing Officer and the first woman of color to serve on this leadership team.
•Our history. Our first customer was a woman, and for over 200 years women have played a key role in our Company’s success. Women comprise 65% of our total workforce.
•Our record of being and recognition as a DEI leader. In 2022, we were recognized as a “Best Place to Work” for LGBTQ+ equality by the Human Rights Campaign for the ninth consecutive year. We were the first company in the country to sign the Gay and Lesbian Alliance Against Defamation’s amicus brief that asked the U.S. Supreme Court to strike down the Defense of Marriage Act. We offer comprehensive transgender-inclusive healthcare coverage, including coverage for treatments and services related to sex affirmation or reassignment. We also are a founding member of the Massachusetts LGBT Chamber of Commerce and the LGBT Business Network, working to promote opportunities for LGBT-owned businesses, corporations and professionals.
•Our 11 employee resource groups (“ERGs”). Each group has an executive sponsor and serves as a source of support and inclusion for colleagues. The groups also provide guidance to leadership, with ERG leaders serving on our DEI Steering Committee. ERG highlights in 2022 include:
◦Our disAbility Advocacy Alliance facilitated a discussion with education law experts to help colleagues advocate for educational support and service for family members with special education needs;
◦Our Latinos In Action group led a number of colleague development sessions, including roundtables that celebrated diversity, inclusion and intersectionality;
◦Our Parents Network organized a live session led by experts on mental health to address the challenges of parenting children whose mental health has been affected by the pandemic;
◦As part of our Black History Month celebration, our Black Professional Alliance group held a panel discussion with leaders from King Boston, the Black Economic Council of MA and the New Commonwealth Racial Equity and Social Justice Fund, moderated by President Quincy Miller, to discuss Martin Luther King Jr.’s roots in Boston and the groundbreaking work these organizations perform;
◦Our Young Professionals Group, in collaboration with Latinos in Action, sponsored a peer mentoring program.
•The ERGs reflect the diversity of our workforce and the communities we serve, and include:
◦Asian American Professional Collective;
◦Black Professional Alliance;
◦Latinos in Action;
◦disAbility Advocacy Alliance;
◦Equality Under the Blue (LGBTQ+);
◦Sustainability Network (environment);
◦Heart of Eastern (volunteerism);
◦Parenting Networking Group;
◦Military Veterans and Families Network;
◦Women’s Interest Network; and
◦Young Professionals Network.
We are proud of our longstanding commitment to DEI. Yet, we also recognize that we have more work to do to improve DEI, including at senior leadership levels. In 2022, we continued to implement our “Road to Equity” action plan that was launched in 2021, which reflects efforts to increase DEI across the Company, including talent acquisition, retention and development, supplier diversity, products and services, and philanthropic support from the Eastern Bank Foundation. In 2022, our senior management set key objectives to help drive an enhanced focus on DEI, including measuring and reporting progress on quantitative DEI goals related to human capital management, supplier diversity and philanthropic spend in underserved communities. We also continued to invest in programs and trainings to further support the Road to Equity. Eastern Insurance Group launched a Career Development Rotational Program providing diverse talent opportunities in the insurance sector.
Our Commercial Credit Training Program enhanced its focus on serving as an on-ramp into Commercial Lending and Credit for women and people of color, who are underrepresented in these divisions at our Company. Supplier diversity goals were tracked across all divisions in our Company while we formed a team to focus on business products and services related to historically underserved business owners.
Management partners with external organizations to develop diverse candidate pipelines, regularly reports on diverse hiring to the Board of Directors and the Compensation and Human Capital Management Committee, and has a talent acquisition team comprised of diverse colleagues. In 2022, despite a competitive labor market, we achieved record racial diversity hiring, with 49% of new hires racially diverse. Also in 2022, 61% of new hires were women. Our hiring at the Vice President and above level continues to be a focus area. In 2022, 27% of our hires at those senior levels were diverse, and 41% were women.
We provide DEI training across all divisions with the assistance and leadership of experienced external DEI professionals. This has included mandatory training on our DEI strategy for all employees; a live facilitated discussion called Understanding Racism offered to all employees; and a pilot focused on understanding and preventing microaggressions.
Demographics
The tables below depict our demographics as of December 31, 2022 for our Board of Directors, our Management Committee (which consists of our most senior executive leaders), our total workforce, and new hires in 2022:
2022 Board of Directors
|
|
|
|
|
|
|
|
|
|
|
|
|
|
|
|
|
|
|
|
|
|
|
|
|
|
|
|
|
|
|
|
|
|
|
|
|
|
|
|
|
|
|
|
|
|
|
|
|
|
|
|
|
|
|
|
|
|
|
|
|
|
|
|
|
|
|
Gender |
|
Race & Ethnicity |
|
Female |
|
Male |
|
Not Disclosed |
|
Total |
|
Asian |
|
Black |
|
Latinx |
|
Not Disclosed |
|
Other POC |
|
White |
|
Total |
Count |
3 |
|
8 |
|
— |
|
11 |
|
1 |
|
1 |
|
1 |
|
— |
|
— |
|
8 |
|
11 |
Percentage |
27.3% |
|
72.7% |
|
—% |
|
100.0% |
|
9.1% |
|
9.1% |
|
9.1% |
|
—% |
|
—% |
|
72.7% |
|
100.0% |
2022 Management Committee
|
|
|
|
|
|
|
|
|
|
|
|
|
|
|
|
|
|
|
|
|
|
|
|
|
|
|
|
|
|
|
|
|
|
|
|
|
|
|
|
|
|
|
|
|
|
|
|
|
|
|
|
|
|
|
|
|
|
|
|
|
|
|
|
|
|
|
Gender |
|
Race & Ethnicity |
|
Female |
|
Male |
|
Not Disclosed |
|
Total |
|
Asian |
|
Black |
|
Latinx |
|
Not Disclosed |
|
Other POC |
|
White |
|
Total |
Count |
5 |
|
8 |
|
— |
|
13 |
|
1 |
|
1 |
|
— |
|
— |
|
— |
|
11 |
|
13 |
Percentage |
38.5% |
|
61.5% |
|
—% |
|
100.0% |
|
7.7% |
|
7.7% |
|
—% |
|
—% |
|
—% |
|
84.6% |
|
100.0% |
2022 Total Workforce
|
|
|
|
|
|
|
|
|
|
|
|
|
|
|
|
|
|
|
|
|
|
|
|
|
|
|
|
|
|
|
|
|
|
|
|
|
|
|
|
|
|
|
|
|
|
|
|
|
|
|
|
|
|
|
|
|
|
|
|
|
|
|
|
|
|
|
Gender |
|
Race & Ethnicity |
|
Female |
|
Male |
|
Non-binary |
|
Total |
|
Asian |
|
Black |
|
Latinx |
|
Not Disclosed |
|
Other POC |
|
White |
|
Total |
Count |
1,140 |
|
601 |
|
3 |
|
1,744 |
|
167 |
|
134 |
|
233 |
|
32 |
|
33 |
|
1,145 |
|
1,744 |
Percentage |
65.3% |
|
34.5% |
|
0.2% |
|
100.0% |
|
9.6% |
|
7.7% |
|
13.4% |
|
1.8% |
|
1.9% |
|
65.6% |
|
100.0% |
2022 New Hires (2022 new hires employed as of 12/31/22)
|
|
|
|
|
|
|
|
|
|
|
|
|
|
|
|
|
|
|
|
|
|
|
|
|
|
|
|
|
|
|
|
|
|
|
|
|
|
|
|
|
|
|
|
|
|
|
|
|
|
|
|
|
|
|
|
|
|
|
|
|
|
|
|
|
|
|
Gender |
|
Race & Ethnicity |
|
Female |
|
Male |
|
Not Disclosed |
|
Total |
|
Asian |
|
Black |
|
Latinx |
|
Not Disclosed |
|
Other POC |
|
White |
|
Total |
Count |
205 |
|
132 |
|
— |
|
337 |
|
39 |
|
43 |
|
43 |
|
5 |
|
35 |
|
172 |
|
337 |
Percentage |
60.8% |
|
39.2% |
|
—% |
|
100.0% |
|
11.5% |
|
12.8% |
|
12.8% |
|
1.5% |
|
10.4% |
|
51.0% |
|
100.0% |
Pay & Benefits
Our compensation and benefits programs are designed to attract, motivate and retain talent to achieve short-term and long-term goals through the implementation of sound compensation principles and policies. For compensation, this includes paying for performance, and ensuring equity, fairness and nondiscrimination in pay as well as compensation risk mitigation. To help ensure pay equity, we conduct pay equity analyses on an annual basis with the assistance of external advisors. We also seek fairness in total compensation by utilizing market data, conducting internal compensation comparison analyses and engaging expert independent compensation and benefits consulting firms for industry benchmarking.
We believe we offer an attractive and competitive benefits program that focuses on overall wellness in all areas of life, with a variety of options to enhance employee choice. Our benefits include: health, dental and vision coverage; paid parental leave and other paid time off; short and long term disability benefits; health and flexible spending accounts; tuition reimbursement; Employee Assistance Program; and wellness programming. Among other benefits, in 2022, we offered our employees three separate retirement benefits: a defined pension benefit plan, a 401(k) contribution, and an employee stock ownership plan (“ESOP”) through which Company stock is allocated to all eligible employees (based on age and hours worked).
COVID-19 Response
As we continued to navigate the challenges of the COVID-19 pandemic through 2022, we continued to be guided by our “people first” philosophy that we believe has served our Company, colleagues, communities and shareholders well. Our cross-functional pandemic response team continued to prioritize keeping our essential, onsite, customer facing colleagues as safe as possible while continuing to serve our customers’ needs. In 2022, we:
•continued to staff a dedicated COVID-19 hotline to help colleagues report positive cases and obtain support around illness and return to work;
•increased colleague communications around COVID-19 protocols to ensure employees understood best practices around COVID-19 risk mitigation; quarantines; vaccinations, boosters and general CDC guidance;
•continued to pay employees who could not work due to COVID-19-related illness and for time needed to get vaccinated without requiring employees to use their sick or personal time;
•instituted, for the second consecutive year, increased carryover of 2021 unused vacation time to offer more flexibility to colleagues to take time off in 2022; and
•provided rapid antigen tests to employees who work on-site in our branches and lockbox location.
Employee Well Being
Given our 2020 IPO, 2021 acquisition of Century, the adjustment to COVID-19, and other large strategic matters, we have asked our employees for a tremendous commitment to their jobs over the last three years. In addition, more than half of our colleagues have continued to work remotely and may have less ability to separate work from home. We have also experienced higher than usual turnover in a competitive labor market. To help address these challenges, we focused on burnout amongst our employees in 2022. We enhanced our wellness offerings, including mental health support. We facilitated “healing circles” led by mental health experts to help colleagues process racial traumas and incidents of hate and gun violence. To assist with talent attraction and retention, and to further support employee well-being, we increased minimum vacation time from two to three weeks, which provided more time off for about 400 employees (33% of our non-exempt population), many of whom work in customer-facing or on-site positions. To provide employees with additional downtime, we closed on the day after Thanksgiving for a second annual Company-wide “day of rest”. We offered live trainings on remote work best practices to help hybrid employees better balance work with life. In 2022, we also continued to support a fund that provides cash grants to eligible employees experiencing an unexpected financial hardship.
Employee Engagement
We are dedicated to engaging our workforce to better understand how we can improve our culture and workplace. In 2022, we virtually hosted eight Town Hall meetings, led by the CEO. At each meeting, employees were able to ask questions anonymously and engage directly with the CEO and Management Committee members.
We also engage our employees through more formal measures. Annually, we engage an independent third party consultant to conduct an employee engagement survey, and based on employee feedback, management identifies areas to address. In 2022, 92% of employees responded to the survey, with an overall engagement score of 86%. Notably, 87% of respondents reported that they are proud to work for our Company and 87% reported that the Company has created an environment where people with diverse backgrounds can succeed.
We enhanced our onboarding program to ensure that new colleagues more quickly acclimate into our Company, culture and their role. Our CEO holds small group sessions with new employees to strengthen their ties to leadership and the Company. We use onboarding and offboarding engagement surveys. For onboarding, we engage with newly hired employees at the 30 day and 90 day marks to understand how they are integrating into the Company and how the Company can improve the onboarding process. For offboarding, we survey colleagues to better understand why they left the Company. We believe these efforts will provide data that can help us improve the overall employee experience at our Company and deepen engagement and retention. In 2022, we continued supporting our employees’ commitment to engage with the communities by offering paid time off to volunteer.
We were named for the sixth consecutive year among the top 10 most charitable organizations in Massachusetts by the Boston Business Journal.
Turnover
Our Company experienced an increase in employee turnover in 2022, which management believes reflects the competitive labor market within our geographic footprint. To help alleviate the staffing stresses caused by this turnover, we engaged third parties to support talent acquisition in higher turnover divisions.
We also increased the number of weeks of vacation we offer (from two weeks to three) to help attract more talent in this competitive environment and retain the talent we have. We also focused on development plans for high performing talent, with an emphasis on retention risk mitigation. Finally, our succession planning, particularly at Eastern Insurance Group and in our Commercial Lending Group, has enabled us to transition our next generation of leaders, with five new members joining the Management Committee in March of 2022.
Intellectual Property
We protect our intellectual property rights by applying for and obtaining trademarks and service marks when appropriate. We believe that our name, our marks and our logo have significant value and are important to our operations, and we rely on protection of this intellectual property to maintain our competitive position. We monitor our trademarks and vigorously oppose the infringement of any of our marks as appropriate.
Available Information
We file annual, quarterly, and current reports, proxy statements and other information required by the Securities Exchange Act of 1934, as amended (“Exchange Act”), with the Securities and Exchange Commission (“SEC”). Our SEC filings are available to the public from the SEC’s internet site at www.SEC.gov.
We post the following filings to investor.easternbank.com as soon as reasonably practicable after they are electronically filed with or furnished to the SEC: our annual reports on Form 10-K, our proxy statements, our quarterly reports on Form 10-Q, our current reports on Form 8-K and any amendments to those reports filed or furnished pursuant to Section 13(a) or 15(d) of the Exchange Act. Paper copies of all such filings are available free of charge by request via email (investor.relations@easternbank.com), telephone (781-598-7920) or mail (Eastern Bankshares, Inc. Investor Relations at 265 Franklin Street, Boston, MA 02110). The information contained or incorporated on our website is not a part of this Current Report on Form 8-K.
We may use our website as a means of disclosing material information and for complying with our disclosure obligations under Regulation Fair Disclosure promulgated by the SEC. These disclosures are included on our website in the “Investor Relations” or “News” sections. Accordingly, investors should monitor these portions of our website, in addition to following the Company’s press releases, SEC filings, public conference calls and webcasts.
ITEM 1A. RISK FACTORS
We are subject to a number of risks potentially affecting our business, financial condition, results of operations and cash flows. As a company offering banking and other financial services, certain elements of risk are inherent in our transactions and operations and are present in the business decisions we make. We, therefore, encounter risk as part of the normal course of our business, and we design risk management processes to help manage these risks. Our success is dependent on our ability to identify, understand and manage the risks presented by our business activities so that we can appropriately balance revenue generation and profitability. These risks include, but are not limited to, credit risk, market risks, liquidity risks, interest rate risks, operational risks, model risks, technology, regulatory and legal risks, and strategic and reputational risks. We discuss our principal risk management processes and, in appropriate places, related historical performance in the “Management’s Discussion and Analysis of Financial Condition and Results of Operations” section of this Current Report on Form 8-K.
You should carefully consider the following risk factors that may affect our business, future operating results and financial condition, as well as the other information set forth in this Current Report on Form 8-K, before making a decision to invest in our common stock. If any of the following risks actually occur, our business, financial condition or results of operations would likely be materially adversely affected. In such case, the trading price of our common stock would likely decline due to any of these risks, and you may lose all or part of your investment. The following risks are not the only risks we face. Additional risks that are not presently known or that we presently deem to be immaterial also could have a material adverse effect on our financial condition, results of operations and business.
Summary of Material Risk Factors
This section summarizes some of the risks potentially affecting our business, financial condition, results of operations and cash flows. These risks and others are discussed in more detail further below in this section. You should consider this summary together with the more detailed information provided below.
As further discussed in Note 24, “Discontinued Operations” within the Notes to the Consolidated Financial Statements included in Item 8 in this Current Report on Form 8-K, the Company entered into an agreement on September 19, 2023, to sell substantially all of the assets and transfer substantially all of the liabilities of its insurance agency business to Gallagher, and it completed the sale of the insurance operations on October 31, 2023. The risk factors presented in this Current Report on Form 8-K have accordingly been updated to remove references to certain risks specific to the insurance agency business.
The COVID-19 pandemic’s impact on businesses and consumers in our market area has had, and we may continue to have, a material adverse effect on our business, financial condition, results of operations and cash flows.
•Since March 2020, the COVID-19 pandemic, as well as governmental and private sector responses to it, have had a severe impact in our markets. The impact and severity of subsequent strains of COVID-19 on the economy and our business are impossible to predict.
•The continuation of the COVID-19 pandemic may continue to result in adverse economic conditions in our market that could have a significant adverse effect on our business, financial condition, results of operations and cash flows, including by:
◦reducing demand for products and services from our customers, and
◦causing greater than average recognition of credit losses and increases in our allowance for loan losses, especially if our business customers continue to experience reduced demand for their products and services
•Our commercial and small business borrowers operating businesses such as hotels, inns, restaurants and retail stores that depend primarily upon customers patronizing their businesses in person were adversely impacted by the effects of the COVID-19 pandemic, and we expect some of these effects to persist into 2023.
•The increase in remote and hybrid work arrangements has resulted and could continue to result in reduced demand for office space in our market, and such reduction in demand has adversely affected and could continue to adversely affect both the value of the collateral securing some of our commercial real estate loans and the demand by developers and other borrowers for new commercial real estate loans.
•It may be challenging for us to grow our core business while the COVID-19 pandemic continues or if the recovery from the COVID-19 pandemic continues to be erratic.
There are various risks associated with our acquisition growth strategy, any of which could have a material adverse effect on our business.
•We operate in a competitive market and may be unable to successfully identify acquisition opportunities or compete for attractive acquisition targets.
•We may be unsuccessful in realizing the expected benefits of an acquired business, including failure to retain key employees or customers, incurrence of unexpected difficulty or expense in integrating operations, technologies or customers, assumption of significant (and potentially unknown) liabilities, and inexperience with the products and/or geographies offered by the acquired business, all of which could divert our management’s attention away from other business concerns and/or negatively impact our financial results.
Various risks, including risks associated with changes in interest rates, loan losses, cybersecurity and regulatory compliance, are inherent in our business and our industry generally.
•Recent and anticipated future increases in interest rates have had and will likely continue to have a material effect on many areas of our business, including on our net interest income, deposit costs, and loan volume and delinquency, and they may have an adverse effect on our operating results.
•The fair value of our investments, including our securities portfolio, has declined due to the recent increases in interest rates and may continue to decline, adversely impacting shareholders’ equity.
•Interest rate increases, competition from other banks, and other factors adversely affect our liquidity, and our operating results may be impacted by these factors and by measures we undertake to manage our liquidity position.
•The geographic concentration of our loan portfolio and lending activities in eastern Massachusetts and southern and coastal New Hampshire makes us vulnerable to a downturn in our local economy.
•Commercial loans, including those secured by commercial real estate, are generally riskier than other types of loans and constitute a significant portion of our loan and lease portfolio.
•If our allowance for loan losses is insufficient to cover actual loan losses, our earnings and capital could decrease.
•Replacement of the LIBOR benchmark interest rate with a substitute index may adversely affect our results of operations, including by causing us to incur significant expenses in effecting the transition, changes to loan balances, and disputes or litigation with customers.
•Technology has lowered barriers to entry in the financial services sector, making it possible for non-banks to offer products and services, such as loans and payment services, that traditionally were banking products, and also making it possible for technology companies to compete with financial institutions in providing electronic, internet-based, and mobile phone-based financial solutions.
•We face progressively increasing security risks to our information databases, including information we maintain relating to our customers, as precautions taken by us and our vendors may not be completely effective to prevent unauthorized access, human error, phishing attacks or other forms of social engineering and other events that could impact the security, reliability, confidentiality, integrity and availability of our systems or those of our vendors.
•We face significant legal risks, both from regulatory investigations and proceedings and from private actions brought against us.
•Operational risk and losses can result from internal and external fraud; errors by employees or third parties; failure to document transactions properly or to obtain proper authorization; failure to comply with applicable regulatory requirements and conduct of business rules; equipment failures, including those caused by natural disasters or by electrical, telecommunications or other essential utility outages; business continuity and data security system failures, including those caused by computer viruses, cyber-attacks or unforeseen problems encountered while implementing major new computer systems or upgrades to existing systems; or the inadequacy or failure of systems and controls, including those of our suppliers or counterparties.
•Our business is subject to extensive state and federal regulations, which often limit or restrict our activities and may impose material financial requirements or limitations on the conduct of our business.
•We are subject to capital and liquidity standards that require banks and bank holding companies to maintain more and higher quality capital and greater liquidity than has historically been the case.
•We are subject to numerous laws designed to protect consumers, including the Community Reinvestment Act and fair lending laws, and failure to comply with these laws could lead to a wide variety of sanctions.
•We may incur fines, penalties and other negative consequences from regulatory violations, possibly even inadvertent or unintentional violations.
•We may be unable to disclose some restrictions or limitations on our operations imposed by our regulators.
•To the extent that we acquire other companies, our business may be negatively impacted by certain risks inherent with such acquisitions.
•Our stock-based benefit plan, which we adopted in 2021, has increased and is expected to continue to increase our annual compensation and benefit expenses related to awards granted to participants under such plan.
Certain provisions of our articles of organization, as well as state and federal banking laws, may make our stock a less attractive investment compared to the stock of peer companies.
•Through October 14, 2023, no person may acquire beneficial ownership of more than 10% of our common stock without prior approval of the Federal Reserve Board and the Massachusetts Commissioner of Banks. If any person exceeds this 10% beneficial ownership threshold, shares in excess of 10% will not be counted as shares entitled to vote through October 14, 2023. After that date, any holder of shares in excess of the 10% threshold will be entitled to cast only one one-hundredth (1/100th) of a vote per share for each share in excess of the 10% threshold.
•Our articles of organization provide that state and federal courts located in Massachusetts will be the exclusive forum for substantially all disputes between us and our shareholders, which could limit our shareholders’ ability to obtain a favorable judicial forum for disputes with us or our directors, officers or employees.
•The market price of our stock value may be negatively affected by applicable regulations that restrict the level of stock that we may repurchase through October 14, 2023.
* * *
Risks potentially affecting our business, financial condition, results of operations and cash flows
You should carefully consider the following risk factors that may affect our business, future operating results and financial condition, as well as the other information set forth in this Current Report on Form 8-K, before making an investment decision regarding our common stock. The following risks are not the only risks we face. Additional risks that are not presently known or that we presently deem to be immaterial also could have a material adverse effect on our financial condition, results of operations and business. Please refer to the note at the beginning of this section for important caveats related to the following risk factors.
Risks Related to the COVID-19 Pandemic and Associated Economic Slowdown
The duration and severity of the COVID-19 pandemic in 2023 and beyond, including the potential for resurgences and the impact of new variants, are impossible to predict. The COVID-19 pandemic, including associated governmental and private sector responses, has had, and may continue to have, a material adverse effect on our business, financial condition, results of operations and cash flows, as discussed below.
The COVID-19 pandemic and governmental and private sector action in response to the COVID-19 pandemic have had a material adverse effect on the global, national and local economies, and on our business, financial condition, results of operations and cash flows, and it remains premature to predict if or when economic activity will revert to the level that existed before the spread of COVID-19.
We are unable to predict how the governmental and private sector action will evolve in 2023 in response to the COVID-19 pandemic in our markets.
Our commercial and small business borrowers that operate businesses such as hotels, inns, restaurants and retail stores that depend primarily upon customers patronizing their businesses in person were adversely affected by reduced commercial and social interactions, and we expect some of these effects to persist. In addition, our commercial real estate borrowers with properties whose value is tied to customer patronage may experience significant decreases in their property values.
As a result of the dramatic decline in cash flow that many of our commercial and commercial real estate borrowers have experienced and may continue to experience as a result of the COVID-19 pandemic, many of those borrowers have sought and may continue to seek payment deferments on their indebtedness.
The effects of the COVID-19 pandemic in our market area reduced cash flow for many of our commercial and commercial real estate borrowers. Borrowers have sought and may continue to seek payment deferments on their indebtedness.
Eastern Bank has worked with borrowers throughout the COVID-19 pandemic to negotiate loan modifications or forbearance arrangements that reduce or defer the monthly payments due to Eastern Bank. See “Management’s Discussion and Analysis of Financial Condition and Results of Operations” in this Current Report on Form 8-K for additional information regarding loan modifications for the year ended December 31, 2022. Although many of the borrowers whose loans we modified resumed making timely loan payments, it is possible that some of those borrowers, as well as some of our borrowers whose loans were previously not modified, may seek future modifications.
The increase in remote and hybrid work may result in reduced demand for office space in our market, and such reduction in demand may adversely affect both the value of the collateral securing some of our commercial real estate loans and the demand by developers and other borrowers for new commercial real estate loans.
The COVID-19 pandemic caused many employers to shift to remote and/or hybrid workforce arrangements in which employees work from their homes instead of going into their employers’ offices. Remote and/or hybrid work patterns may have long-term implications for how many businesses successfully operate and, in turn, their need for leased office space. A reduction in the need for office space could result in a reduction in our loan demand and/or in our customers’ ability to repay their loans, which, in turn, may have an adverse effect on our business and results of operations. Additionally, any material reduction in the demand for these categories of commercial office space in our market could adversely affect both the value of the collateral securing a portion of our commercial real estate loans and the demand by developers and other borrowers for new commercial real estate loans, which, in turn, may have a negative impact on our business and financial results.
We have experienced and may continue to experience greater than usual credit costs in the future if the effect of the COVID-19 pandemic in our market continues.
The COVID-19 pandemic initially caused us to experience greater than usual credit costs. We initially increased our provision for loan losses in 2020 following the onset of the COVID-19 pandemic. We may still experience additional credit costs in the future if the economic effect of the continuing COVID-19 pandemic in our market worsens.
The associated economic impacts of the COVID-19 pandemic may have other adverse effects on our operating results beyond the year ended December 31, 2022.
Other factors that may have an adverse effect on our operating results include:
•possible constraints on liquidity and capital, due to supporting client activities, increased competition, or regulatory actions, and
•potential losses in our investment securities portfolio due to volatility in the financial markets.
In addition, because both the COVID-19 pandemic and the associated economic impacts are unprecedented, it has been and may continue to be challenging for management to make certain judgments and estimates that are material to our business while the COVID-19 pandemic continues, such as the current value of commercial real estate collateral, that are material to our Consolidated Financial Statements.
Risks Related to Our Acquisition Strategy
Our future results will suffer if we do not effectively manage our expanded operations following the Century Merger.
Following the Century Merger in November 2021, the size and operational scope of our business increased significantly beyond its prior size and scope. The Century Merger increased our asset size and the breadth and complexity of our business with the addition of new business lines in which we had not previously engaged, and exposure to industry sectors, such as higher education, which we have not historically served. The size and scope of our commercial loan and lease portfolio has also increased in size as a result of the Century Merger. The commercial loan portfolio we acquired from Century includes loans that are concentrated in industry sectors (such as higher education and nonprofit organizations) that are relatively new to us. Some such loans are of greater size than the typical size of commercial loans that we have made in recent years. Our future success depends, in part, upon our ability to manage this expanded business, which poses substantial challenges for our management, including challenges related to the management and monitoring of new operations and associated increased costs and complexity.
There can be no assurances that we will be successful in this regard or that we will realize the expected operating efficiencies, cost savings and other benefits that were anticipated from the Century Merger.
We may be unsuccessful identifying and competing for acquisitions.
We continuously look for acquisition opportunities of banks, financial institutions and insurance agencies that meet our criteria, some of which may be material to our business and financial performance and could involve significant cash expenditures or result in a material increase in the number of shares of our common stock that are outstanding. We face competition from other financial services institutions, some of which may have greater financial resources than us, when considering acquisition opportunities. Accordingly, attractive opportunities may not be available to us, and there can be no assurance that we will be successful in identifying, completing or integrating future acquisitions. We may not be able to acquire other institutions on acceptable terms. The ability to grow may be limited if we are unable to successfully make acquisitions in the future.
To the extent that we acquire other companies, our business may be negatively impacted by certain risks inherent with such acquisitions.
We have acquired and will continue to consider the acquisition of other financial services companies. A significant component of our business strategy is to grow through acquisitions of other financial institutions, including banks and insurance agencies, or business lines as opportunities arise. Although we have been successful with this strategy in the past, we may not be able to grow our business in the future through acquisitions for a number of reasons, including:
•Competition with other prospective buyers resulting in our inability to complete an acquisition or in our paying a substantial premium over the fair value of the net assets of the acquired business;
•Inability to obtain regulatory approvals;
•Potential difficulties and/or unexpected expenses relating to the integration of the operations, technologies, products and the key employees of the acquired business, resulting in the diversion of resources from the operation of our existing business;
•Acquisitions of new lines of business may present risks that are different in kind or degree compared to those that we are accustomed to managing, requiring us to implement new or enhance existing procedures and controls and diverting resources from the operation of our existing business;
•Inability to maintain existing customers of the acquired business or to sell the products and services of the acquired business to our existing customers;
•Inability to retain key management of the acquired business;
•Assumption of or potential exposure to significant liabilities of the acquired business, some of which may be unknown or contingent at the time of acquisition, including, without limitation, liabilities for regulatory and compliance issues;
•Exposure to potential asset quality issues of the acquired business;
•Failure to mitigate deposit erosion or loan quality deterioration at the acquired business;
•Potential changes in banking or tax laws or regulations that may affect the acquired business;
•Inability to improve the revenues and profitability or realize the cost savings and synergies expected of the acquired business;
•Potential future impairment of the value of goodwill and intangible assets acquired; and
•Identification of internal control deficiencies of the acquired business.
All of these and other potential risks may serve as a diversion of our management’s attention from other business concerns, and any of these factors could have a material adverse effect on our business. Acquisitions typically involve the payment of a premium over book and market values, and therefore, some dilution of our tangible book value and net income per share may occur in connection with any future transaction.
The consummation of a merger will be contingent upon the satisfaction of a number of conditions, including regulatory approvals, that may be outside of our control and that we and our merger partner may be unable to satisfy or obtain or which may delay the consummation of such merger or result in the imposition of conditions that could reduce the anticipated benefits from the merger or cause the parties to abandon the merger.
The consummation of a merger is contingent upon the satisfaction of a number of conditions, some of which are beyond our control and that of a merger partner, including, among others, the receipt of required regulatory approvals and approval of shareholders.
These conditions to the closing of a merger may not be fulfilled in a timely manner or at all, and, accordingly, a prospective merger may be delayed substantially or may not be completed. In addition, the parties to the merger agreement will likely have the contractual right to decide to terminate a merger agreement at any time, or in certain other circumstances, either mutually or individually.
As a condition to granting required regulatory approvals, governmental entities may impose conditions, limitations or costs, require divestitures or place restrictions on our conduct after the closing of a merger. Such conditions or changes and the process of obtaining regulatory approvals could, among other things, have the effect of delaying completion of a merger or of imposing additional costs or limitations on us following a merger, any of which may have an adverse effect on us following such merger.
The degree of scrutiny that bank regulators give to bank mergers can change from time to time. We are unable to predict whether any change bank regulators may adopt, will have a material adverse effect on our ability to acquire or merge with banking companies in our market area.
Risks Related to Our Business and Our Industry Generally
Changes in interest rates have impacted and may continue to impact our profitability.
Net interest income historically has been, and we anticipate that it will remain, a significant component of our total revenue. A high percentage of our assets and liabilities have been and will continue to be in the form of interest-bearing or interest-related instruments. Thus, changes in interest rates have impacted and may continue to impact many areas of our business, including net interest income, deposit costs, and loan volume and delinquency. Interest rates are highly sensitive to many factors that are beyond our control, including global, national, regional and local economic conditions, the effects of disease pandemics such as COVID-19, competitive pressures, and policies of various governmental and regulatory agencies and, in particular, the FOMC. Changes in interest rates have influenced and could continue to influence the interest we receive on loans and securities and the amount of interest we pay on deposits and borrowings, our ability to originate loans and obtain deposits, and the fair value of our financial assets and liabilities. If the interest rates on our interest-bearing liabilities increase at a faster pace than the interest rates on our interest earning assets, our net interest income may decline and, with it, a decline in our earnings may occur. Our net interest income and our earnings would be similarly affected if the interest rates on our interest earning assets declined at a faster pace than the interest rates on our interest-bearing liabilities.
The FOMC raised the target range for the federal funds rate seven times in 2022, and, additional rate increases may occur if inflation pressures remain elevated or intensify. Aggressive increases to the target range for the federal funds rate, combined with ongoing geopolitical instability, could raise the risk of an economic recession and responsive measures, including a reduction of the federal funds rate. Any such downturn, especially domestically and in the markets in which we operate, may adversely affect our asset quality, deposit levels, loan demand and results of operations.
Higher interest rates generally are associated with a lower volume of loan originations and refinancings, while lower interest rates are usually associated with higher loan originations and refinancings. Our ability to generate gains on sales of mortgage loans is significantly dependent on the level of originations. Cash flows are affected by changes in market interest rates. Generally, in rising interest rate environments, loan prepayment rates are likely to decline, and in falling interest rate environments, loan prepayment rates are likely to increase. A significant amount of our commercial and industrial and commercial real estate, including multi-family residential real estate loans, are adjustable-rate loans and an increase in the general level of interest rates may adversely affect the ability of borrowers, especially those with adjustable rate loans, to pay their loan obligations. Changes in interest rates, prepayment speeds and other factors may also cause the value of our loans held for sale to change.
Although we have implemented risk management strategies, such as hedging certain loans indexed to a market rate that are expected to reprice with the federal funds rate by using interest rate swaps, as well as policies and procedures designed to manage the risks associated with changes in market interest rates, changes in interest rates have had and may continue to have an adverse effect on our operating results and financial condition.
If our ongoing assumptions regarding borrower or depositor behavior or overall economic conditions are significantly different than we anticipate, then our risk mitigation may be insufficient to protect against interest rate risk and our operating results and financial condition would be adversely affected.
If our allowance for loan losses is insufficient to cover loan losses, our earnings and capital could decrease.
At December 31, 2022, our allowance for loan losses was $142.2 million, or 1.05% of total loans, compared to $97.8 million, or 0.80% of total loans, at December 31, 2021. We make various assumptions and judgments about the collectability of our loan portfolio, including the creditworthiness of our borrowers and the value of the real estate and other assets serving as collateral for many of our loans. In determining the amount of the allowance for loan losses, we review our loans, loss and delinquency experience, and commercial and commercial real estate peer data and we evaluate other factors including, among other things, current and expected future economic conditions. If our assumptions are incorrect, or if delinquencies or non-performing loans increase, our allowance for loan losses may not be sufficient to cover losses inherent in our loan portfolio, which would require additions to our allowance, which could materially decrease our net income.
In addition, our federal and state regulators, as an integral part of their examination process, periodically review our allowance for loan losses and may require us to increase the allowance by recognizing additional provisions for loan losses charged to income, or to charge-off loans, which, net of any recoveries, would decrease the allowance for loan losses. Any such additional provision for loan losses or net increase in charge-offs could have a material adverse effect on our financial condition and results of operations.
The geographic concentration of our loan portfolio and lending activities makes us vulnerable to a downturn in the local economy.
We primarily serve individuals, businesses and municipalities located in eastern and central Massachusetts, including the greater Boston metropolitan area, southern New Hampshire, including its coastal region, and northern Rhode Island. At December 31, 2022, approximately $9.1 billion, or 91.2% of our total loans secured by real estate were secured by real estate located in this market area. Therefore, our success is largely dependent on the economic conditions, including employment levels, population growth, income levels, savings trends and government policies, in this market area. Weaker economic conditions caused by recessions, unemployment, inflation, a decline in real estate values or other factors beyond our control may adversely affect the ability of our borrowers to service their debt obligations and could result in higher loan and lease losses and lower net income for us.
Although there is not a single employer or industry in our market area on which a significant number of our customers are dependent, a substantial portion of our loan portfolio is composed of loans secured by real estate property located in the greater Boston metropolitan area. This makes us vulnerable to a downturn in the local economy and real estate markets. Decreases in local real estate values caused by economic conditions or other events could adversely affect the value of the property used as collateral for our loans, which could cause us to realize a loss in the event of a foreclosure.
A worsening of business and economic conditions generally or specifically in the principal markets in which we conduct business could have adverse effects on our business, including the following:
•A decrease in the demand for, or the availability of, loans and other products and services offered by us;
•A decrease in the value of our loans held for sale or other assets secured by residential or commercial real estate;
•An impairment of certain intangible assets, such as goodwill;
•A decrease in interest income from variable rate loans due to declines in interest rates; and
•An increase in the number of clients and counterparties who become delinquent, file for protection under bankruptcy laws or default on their loans or other obligations to us, which could result in a higher level of non-performing assets, net charge-offs, provisions for loan losses, and valuation adjustments on loans held for sale.
Moreover, a significant decline in general economic conditions, caused by inflation, recession, acts of terrorism, an outbreak of hostilities or other international or domestic calamities, unemployment, public health crises or other factors beyond our control could further impact these local economic conditions and could further negatively affect the financial results of our banking operations. In addition, deflationary pressures, if present, while possibly lowering our operating costs, could have a significant negative effect on our borrowers, especially our business borrowers, and the values of underlying collateral securing loans, which could negatively affect our financial performance. In the event of severely adverse business and economic conditions generally or specifically in the principal markets in which we conduct business, there can be no assurance that the federal government and the Federal Reserve Board would intervene. If economic conditions worsen or volatility increases, our business, financial condition and results of operations could be materially adversely affected. For more information about our market area, please see the section of this Current Report on Form 8-K titled “Business.”
We are a community bank and our ability to manage reputational risk is critical to attracting and maintaining customers, investors and employees and to the success of our business, and the failure to do so may materially adversely affect our performance.
We are a community bank and our reputation is one of the most valuable components of our business. A key component of our business strategy is to rely on our reputation for customer service and knowledge of local markets to expand our presence by capturing new business opportunities from existing and prospective customers in our market area.
As a community bank, we strive to conduct our business in a manner that enhances our reputation. This is done, in part, by recruiting, hiring and retaining employees who share our core values of being an integral part of the communities we serve, delivering superior service to our customers and caring about our customers and associates. If our reputation is negatively affected by the actions of our employees, by our inability to conduct our operations in a manner that is appealing to current or prospective customers, or by events beyond our control, our business and operating results may be adversely affected.
Threats to our reputation can come from many sources, including adverse sentiment about financial institutions generally, the perception of unethical practices, employee misconduct, failure to deliver minimum standards of service or quality, compliance deficiencies, cybersecurity breaches and questionable or fraudulent activities of our customers. We have policies and procedures in place to protect our reputation and promote ethical conduct, but these policies and procedures may not be fully effective. Negative publicity regarding our business, employees, or customers, with or without merit, may result in the loss of customers and employees, costly litigation and increased governmental regulation, all of which could adversely affect our operating results.
We face continuing and growing security risks to our information data bases, including information we maintain relating to our customers.
We are subject to certain operational risks, including data processing system failures and errors, inadequate or failed internal processes, customer or employee fraud and catastrophic failures resulting from terrorist acts or natural disasters. In the ordinary course of business, we rely on electronic communications and information systems to conduct our business and to store sensitive data, including financial information regarding customers. Our electronic communications and information systems infrastructure, as well as the systems infrastructures of the vendors we use to meet our data processing and communication needs, are inherently vulnerable to unauthorized access, human error, computer viruses, denial-of-service attacks, malicious code, spam attacks, phishing, ransomware or other forms of social engineering and other events that could impact the security, reliability, confidentiality, integrity and availability of our systems or those of our vendors. Financial services institutions and companies engaged in data processing have reported breaches in the security of their websites or other systems, some of which have involved sophisticated and targeted attacks intended to obtain unauthorized access to confidential information, destroy data, disable or degrade service or sabotage systems, often through the introduction of computer viruses or malware, cyber-attacks and other means. Denial of service attacks have been launched against a number of large financial services institutions. Hacking and identity theft risks, in particular, could cause serious reputational harm. Cyber threats are rapidly evolving, and we may not be able to anticipate or prevent all such attacks. Although to date we have not experienced any material losses relating to cyber-attacks or other information security breaches, there can be no assurance that we will not suffer such losses in the future. No matter how well designed or implemented our controls are, we will not be able to anticipate all security breaches of these types, and we may not be able to implement effective preventive measures against such security breaches in a timely manner. A failure or circumvention of our security systems could have a material adverse effect on our business operations and financial condition.
We regularly assess and test our security systems and disaster preparedness, including back-up systems, but the risks are substantially escalating. We are not able to fully protect against these events given the rapid evolution of new vulnerabilities, the complex and distributed nature of our systems, our interdependence on the systems of other companies and the increased sophistication of potential attack vectors and methods against our systems. As a result, cybersecurity and the continued enhancement of our controls and processes to protect our systems, data and networks from attacks, unauthorized access or significant damage remain a priority. Accordingly, we may be required to expend additional resources to enhance our protective measures or to investigate and remediate any information security vulnerabilities or exposures. Any breach of our system security could result in disruption of our operations, unauthorized access to confidential customer information, significant regulatory costs, such as enforcement actions and/or the imposition of civil money penalties, litigation exposure and other possible damages, loss or liability. Such costs or losses could exceed the amount of available insurance coverage, if any, and would adversely affect our earnings. Also, any failure to prevent a security breach or to quickly and effectively deal with such a breach could cause reputational harm, negatively impact customer confidence, undermine our ability to attract and keep customers, and possibly result in regulatory sanctions.
We rely on third-party vendors, which could expose us to additional cybersecurity risks.
Third-party vendors provide key components of our business infrastructure, including certain data processing and information services. Third parties may transmit confidential, propriety information on our behalf. Although we require third-party providers to maintain certain levels of information security, such providers may remain vulnerable to operational and technology vulnerabilities, including cyber-attacks, security breaches, unauthorized access, breaches, fraud, phishing attacks, misuse, computer viruses, or other malicious attacks, which could result in unauthorized access, misuse, loss or destruction of data, an interruption in service or other similar events that may impact our business. Although we may contractually limit liability in connection with attacks against third-party providers, we remain exposed to the risk of loss associated with such vendors. In addition, a number of our vendors are large national entities with dominant market presence in their respective fields.
Their services could prove difficult to replace in a timely manner if a failure or other service interruption were to occur. We cannot predict the costs or time that would be required to find an alternative service provider. Failures of certain vendors to provide contracted services could adversely affect our ability to deliver products and services to customers and cause us to incur significant expenses.
Industry competition may adversely affect our degree of success.
Our profitability depends on our ability to compete successfully. We operate in a highly competitive industry that could become even more competitive as a result of legislative, regulatory and technological changes, as well as continued industry consolidation. This consolidation may produce larger, better capitalized and more geographically diverse companies that are capable of offering a wider array of financial products and services at more competitive prices.
In our market areas, we face competition from other commercial banks, savings and loan associations, tax-exempt credit unions, financial technology companies (“fintechs”), internet banks, finance companies, mutual funds, insurance companies, brokerage and investment banking firms, mortgage companies and other financial intermediaries that offer similar services. Some of our non-bank competitors are not subject to the same extensive regulations we are and, therefore, may have greater flexibility or lower costs in competing for business.
Our ability to compete successfully depends on a number of additional factors, including customer convenience, quality of service, personal contacts, pricing and range of products. If we are unable to successfully compete for new customers and to retain our current customers, our business, financial condition or results of operations may be adversely affected, perhaps materially. In particular, if we experience an outflow of deposits as a result of our customers seeking investments with higher yields or greater financial stability, we may be forced to rely more heavily on borrowings and other sources of funding to operate our business and meet withdrawal demands, thereby adversely affecting our net interest margin and financial performance. In addition, we may not be able to effectively implement new technology-driven products and services or be successful in marketing these products and services to our customers. As a result, our ability to effectively compete to retain or acquire new business may be impaired, and our business, financial condition or results of operations may be adversely affected.
Technology has lowered barriers to entry and made it possible for non-banks to offer products and services, such as loans and payment services, that traditionally were banking products, and made it possible for technology companies to compete with financial institutions in providing electronic, internet-based, and mobile phone-based financial solutions.
Competition with non-banks, including technology companies, to provide financial products and services is intensifying. In particular, the activity of fintechs has grown significantly over recent years and is expected to continue to grow. Fintechs have and may continue to offer bank or bank-like products. The federal and state bank regulatory agencies have demonstrated a willingness to charter non-traditional bank charter applicants, such as fintechs, which increases competition in the industry. In addition, other fintechs have partnered with existing banks to allow them to offer deposit products to their customers under current and proposed interagency guidelines on third party relationships. Regulatory changes, such as revisions to the FDIC’s rules on brokered deposits intended to reflect recent technological changes and innovations, may also make it easier for fintechs to partner with banks and offer deposit products. In addition to fintechs, the large technology companies have begun to make efforts toward providing financial services directly to their customers and are expected to continue to explore new ways to do so. Many of these companies, including our competitors, have fewer regulatory constraints, and some have lower cost structures, in part due to lack of physical locations and regulatory compliance costs. Some of these companies also have greater resources to invest in technological improvements than we currently have.
In addition to external competition, the financial services industry, including the banking sector, is continually undergoing rapid technological change with frequent introductions of new technology-driven products and services. In addition, new, unexpected technological changes could have a disruptive effect on the way banks offer products and services. We believe our success depends, to a great extent, on our ability to use technology to offer products and services that provide convenience to customers and to create additional efficiencies in our operations. However, we may not be able to, among other things, keep up with the rapid pace of technological changes, effectively implement new technology-driven products and services or be successful in marketing these products and services to our customers. As a result, our ability to compete effectively to attract or retain new business may be impaired, and our business, financial condition or results of operations may be adversely affected.
We may not be able to successfully execute our strategic plan or achieve our performance targets.
An important goal of our strategic plan is expanding our profitable loan and deposit market share through both organic growth and opportunistic strategic transactions. (For a more complete discussion of our strategic plan, please see the section of this Current Report on Form 8-K titled “Business.”) It is possible that one or more factors, including factors outside of our control, may hinder or prevent us from achieving our growth objectives. Our key assumptions include:
•that we will be able to attract and retain the requisite number of skilled and qualified personnel required to increase our loan origination volume, especially in our commercial banking portfolios. The marketplace for skilled personnel is competitive, which means hiring, training and retaining skilled personnel is costly and challenging and we may not be able to increase the number of our loan professionals sufficiently to achieve our loan origination targets successfully;
•that we will be able to fund asset growth by growing deposits with our overall cost of funds at a rate consistent with our expectations;
•that we will be able to successfully identify and purchase high-quality interest-earning assets that perform over time in accordance with our expectations; and
•that there will be no material change in competitive dynamics, including as a result of our seeking to increase market share.
If one or more of our assumptions prove incorrect, we may not be able to successfully execute our strategic plan, we may never achieve our indicative performance targets and any shortfall may be material.
Our business strategy includes projected growth in our core businesses, and our financial condition and results of operations could be negatively affected if we fail to grow or fail to manage our growth effectively.
We expect to continue to experience growth in the amount of our assets, the level of our deposits and the scale of our operations. Achieving our growth targets requires us to attract customers that currently bank at other financial institutions in our market, thereby increasing our share of the market. Our ability to successfully grow will depend on a variety of factors, including our customers’ ability to meet their obligations to us, our ability to attract and retain experienced bankers and insurance agents, the continued availability of desirable business opportunities, the competitive responses from other financial institutions in our market areas and our ability to manage our growth. Growth opportunities may not be available, or we may not be able to manage our growth successfully. If we do not manage our growth effectively, our financial condition and operating results could be negatively affected.
We could fail to attract, retain or motivate highly skilled and qualified personnel, including our senior management, other key employees or members of our Board, which could impair our ability to successfully execute our strategic plan and otherwise adversely affect our business.
A cornerstone of our strategic plan involves retaining as well as hiring highly skilled and qualified personnel. Accordingly, our ability to implement our strategic plan and our future success depends on our ability to attract, retain and motivate highly skilled and qualified personnel, including our senior management and other key employees and directors. The disruption of the labor market caused by COVID-19 has created additional uncertainty with respect to our current and future workforce. The failure to attract or retain, including as a result of an untimely death or illness of key personnel, or ability to replace a sufficient number of appropriately skilled and key personnel, could place us at a significant competitive disadvantage and prevent us from successfully implementing our strategy, which could impair our ability to implement our strategic plan successfully, achieve our performance targets and otherwise have a material adverse effect on our business, financial condition and results of operations.
Limitations on the manner in which regulated financial institutions, such as us, can compensate their officers and employees, including those contained in pending rule proposals implementing requirements of Section 956 of the Dodd-Frank Act, may make it more difficult for such institutions to compete for talent with financial institutions and other companies not subject to these or similar limitations. If we are unable to compete effectively, our business, financial condition and results of operations could be adversely affected, perhaps materially.
The fair value of Eastern Bank’s investments has declined and could decline further due to a variety of factors.
Most of Eastern Bank’s investment securities portfolio is designated as available-for-sale. Accordingly, unrealized gains and losses, net of tax, in the estimated fair value of the available-for-sale portfolio is recorded as other comprehensive income, a separate component of shareholders’ equity. Due to the recent increases in interest rates, the fair value of Eastern Bank’s investment portfolio has declined, causing a corresponding decline in shareholders’ equity. If interest rates rise further, the fair value of our investment portfolio may further decline and contribute to a further corresponding decline in shareholders’ equity. Management believes that several factors will affect the fair values of the investment portfolio, including, but not limited to, changes in interest rates or expectations of changes, the degree of volatility in the securities markets, inflation rates or expectations of inflation and the slope of the interest rate yield curve.
In addition, unrealized losses on investment securities may result from changes in credit spreads and liquidity issues in the marketplace, along with changes in the credit profile of individual securities issuers. Under accounting principles generally accepted in the United States (“GAAP”), we are required to review our investment portfolio periodically for the presence of credit-related impairment of our investment securities, taking into consideration current market conditions, the extent and nature of changes in fair value, issuer rating changes and trends, volatility of earnings, current analysts’ evaluations, and our ability and intent to hold investments until a recovery in fair value, as well as other factors.
Adverse developments with respect to one or more of the foregoing factors may require us to measure and recognize an allowance for credit losses in a future period, with the resulting provision for credit losses recognized as a charge to our earnings. Subsequent valuations, in light of management’s evaluation of the factors prevailing at that time, may result in significant changes in the values of these securities in future periods. Any of these factors could require us to recognize an impairment in the value of our investment securities portfolio, which could have an adverse effect on our results of operations in future periods.
Commercial loans, including those secured by commercial real estate, are generally riskier than other types of loans and constitute a significant portion of our loan and lease portfolio.
Our commercial loan and lease portfolio, including those secured by commercial real estate but excluding PPP, comprised $9.7 billion, or 71.8% of our total loans at December 31, 2022 (excluding PPP loans). Commercial loans generally carry larger balances and involve a higher risk of nonpayment or late payment than residential mortgage loans. Most of the commercial loans are secured by borrower business assets such as accounts receivable, inventory, equipment and other fixed assets. Compared to real estate, these types of collateral are more difficult to monitor, harder to value, may depreciate more rapidly and may not be as readily saleable if repossessed. Repayment of commercial and industrial loans is largely dependent on the business and financial condition of borrowers. Business cash flows are dependent on the demand for the products and services offered by the borrower’s business. Such demand may be reduced when economic conditions are weak or when the products and services offered are viewed as less valuable than those offered by competitors. In addition, some of our commercial real estate loans are not fully amortizing and contain large balloon payments upon maturity. These balloon payments may require the borrower to either sell or refinance the underlying property in order to make the balloon payment, which may increase the risk of default or non-payment. In addition, because of the risks associated with commercial loans, including the economic stress in our market due to the COVID-19 pandemic, we may experience higher rates of default than if the portfolio were more heavily weighted toward residential mortgage loans. Higher rates of default could have an adverse effect on our financial condition and results of operations. Further, if we foreclose on commercial collateral, our holding period for the collateral may be longer than for one- to four-family residential real estate loans because there are fewer potential purchasers of the collateral, which can result in substantial holding costs. In addition, vacancies, deferred maintenance, repairs and market stigma can result in prospective buyers expecting sale price concessions to offset their real or perceived economic losses for the time it takes them to return the property to profitability.
We are subject to environmental liability risk associated with real estate lending activities.
A significant portion of our loan portfolio is secured by real estate, and we could become subject to environmental liabilities with respect to one or more of these properties. At December 31, 2022, $10.0 billion, or 74.0% of our total loans, comprised loans secured by real estate. During the ordinary course of business, we may foreclose on and take title to properties securing defaulted loans. In doing so, there is a risk that hazardous or toxic substances could be found on these properties. If so, we may be liable for remediation costs, as well as for personal injury and property damage, civil fines and criminal penalties regardless of when the hazardous conditions or toxic substances first affected the property. Environmental laws may require us to incur substantial expenses to address unknown liabilities and may materially reduce the affected property’s value or limit our ability to use or sell the affected property. In addition, future laws or more stringent interpretations or enforcement policies with respect to existing laws may increase our exposure to environmental liability, and we may not have adequate remedies against the prior owner or other responsible parties and could find it difficult or impossible to sell the affected properties. Although management has implemented policies and procedures to mitigate this risk, they may not be sufficient in all instances to detect all potential environmental hazards. The remediation costs and any other financial liabilities associated with an environmental hazard could have a material adverse effect on our financial condition and results of operations.
Our business may be adversely affected by credit risks associated with residential property.
At December 31, 2022, loans secured by one- to four-family residential real estate were $3.8 billion, or 28.1% of total loans. Loans secured by one- to four-family residential real estate include residential real estate mortgages, home equity loans and lines and investment real estate loans secured by one- to four-family residential properties. At December 31, 2022,$164.3 million of one- to four-family residential real estate loans were part of the commercial loan portfolio. One- to four-family residential mortgage lending, whether owner occupied or non-owner occupied, is generally sensitive to regional and local economic conditions that significantly impact the ability of borrowers to meet their loan payment obligations. Declines in real estate values could cause some of our residential mortgages to be inadequately collateralized, which would expose us to a greater risk of loss if we seek to recover on defaulted loans by selling the real estate collateral. Residential loans with combined higher loan-to-value ratios are more sensitive to declining property values than those with lower combined loan-to-value ratios and, therefore, may experience a higher incidence of default and severity of losses. In addition, if the borrowers sell their homes, they may be unable to repay their loans in full from the sale proceeds. For those home equity loans and lines of credit secured by a second mortgage, it is unlikely that we will be successful in recovering all or a portion of our loan proceeds in the event of default unless we are prepared to repay the first mortgage loan and such repayment and the costs associated with a foreclosure are justified by the value of the property. For these reasons, we may experience higher rates of delinquencies, default and losses on our home equity loans, which could have a material adverse effect on our financial condition and results of operations.
A portion of our loan portfolio consists of loan participations, which may have a higher risk of loss than loans we originate because we are not the lead lender and we have limited control over credit monitoring.
We routinely purchase loan participations. Although we underwrite these loan participations consistent with our general underwriting criteria, loan participations may have a higher risk of loss than loans we originate because we rely on the lead lender to disclose relevant financial information on a timely basis. Moreover, our decision regarding the classification of a loan participation and loan loss provisions associated with a loan participation is made in part based upon information provided by the lead lender. A lead lender also may not monitor a participation loan in the same manner as we would for loans that we originate. At December 31, 2022, we held loan participation interests in commercial and industrial, commercial real estate, commercial construction and business banking loans totaling $1.5 billion.
Changes to and replacement of LIBOR may adversely affect our business, financial condition, and results of operations.
We have certain floating rate loans for which the interest rate is calculated based upon one of various indices commonly known as the London Interbank Offered Rate applicable to loans denominated in U.S. dollars (“USD LIBOR”). We have entered into interest rate swap arrangements with customers that are indexed to USD LIBOR. In 2017, the Financial Conduct Authority (“FCA”), a regulator of financial services firms and financial markets in the United Kingdom, stated that it planned to phase out regulatory oversight of USD LIBOR (and other LIBOR indices) by no longer compelling panel banks to submit estimated borrowing costs. The FCA indicated that it would support the USD LIBOR indices generally only through 2021 and, with respect to certain USD LIBOR indices, only through June 2023, to allow for an orderly transition to alternative reference rates.
In June 2017, the Alternative Reference Rates Committee (the “ARRC”) convened by the Federal Reserve Board and Federal Reserve Bank of New York designated the Secured Overnight Financing Rate (“SOFR”), with certain adjustments, as its recommended alternative to USD LIBOR. Regulators, industry groups and the ARRC have published recommended fallback language for USD LIBOR-linked financial instruments, identified recommended alternatives for USD LIBOR (e.g., SOFR, as adjusted) and proposed implementation of the recommended alternatives in financial instruments indexed to USD LIBOR. It is possible that differences between USD LIBOR and SOFR, as adjusted, or other alternatives may result in changes to the mark-to-market value of each affected transaction. Payments under contracts linked to alternative indices may differ from those linked to USD LIBOR, as the rates under alternative indices are calculated differently.
The Company has established a working group to guide the transition and is continuing to assess its LIBOR-related contracts and amend agreements where necessary to permit application of an alternative index. The Company is also transitioning its future floating rate loan, interest rate swap arrangement, and other applicable contracts to alternative reference rates. The implementation of a substitute index for the calculation of interest rates may result in our incurring significant expenses in effecting the transition, changes to loan balances, and disputes or litigation with customers, which could have an adverse effect on our results of operations. In addition, uncertainty as to the nature of such changes may adversely affect the market for or value of loans, derivatives, investment securities and other financial obligations held by or due to Eastern Bank and could adversely impact our financial condition or results of operations.
Hedging against interest rate exposure may adversely affect our earnings.
We employ techniques that limit, or “hedge,” the adverse effects of changing interest rates on our loan portfolios. We also engage in hedging strategies with respect to arrangements where our customers swap floating interest rate obligations for fixed interest rate obligations, or vice versa. Our hedging activity varies based on the level and volatility of interest rates and other changing market conditions. These techniques may include purchasing or selling futures contracts, purchasing put and call options on securities or securities underlying futures contracts, or entering into other mortgage-backed derivatives. There are, however, no perfect hedging strategies, and interest rate hedging may fail to protect us from loss. Moreover, hedging activities could result in losses if the event against which we hedge does not occur. Additionally, interest rate hedging could fail to protect us or adversely affect us because, among other things:
•available interest rate hedging may not correspond directly with the interest rate risk for which protection is sought, including, for example, an interest rated based upon adjusted SOFR, as discussed above;
•the duration of the hedge may not match the duration of the related liability;
•the party owing money in the hedging transaction may default on its obligation to pay;
•the credit quality of the party owing money on the hedge may be downgraded to such an extent that it impairs our ability to sell or assign our side of the hedging transaction;
•the value of derivatives used for hedging may be adjusted from time to time in accordance with accounting rules to reflect changes in fair value; and/or
•downward adjustments, or “mark-to-market” losses, would reduce our shareholders’ equity.
New lines of business or new products and services may subject us to additional risks.
From time to time, we may implement new lines of business or offer new products and services within existing lines of business. In addition, we will continue to make investments in research, development, and marketing for new products and services. There are substantial risks and uncertainties associated with these efforts, particularly in instances where the markets are not fully developed. In developing and marketing new lines of business and/or new products and services we may invest significant time and resources. Initial timetables for the development and introduction of new lines of business and/or new products or services may not be achieved, and price and profitability targets may not prove feasible. Furthermore, if customers do not perceive our new offerings as providing significant value, they may fail to accept our new products and services. External factors, such as compliance with regulations, competitive alternatives and shifting market preferences, may also impact the successful implementation of a new line of business or a new product or service. Furthermore, the burden on management and our information technology of introducing any new line of business and/or new product or service could have a significant impact on the effectiveness of our system of internal controls. Failure to successfully manage these risks in the development and implementation of new lines of business or new products or services could have a material adverse effect on our business, financial condition and results of operations.
We may be required to write down goodwill and other acquisition-related identifiable intangible assets.
When we acquire a business, a portion of the purchase price of the acquisition may be allocated to goodwill and other identifiable intangible assets. The excess of the purchase price over the fair value of the net identifiable tangible and intangible assets acquired determines the amount of the purchase price that is allocated to goodwill acquired. As of December 31, 2022, and giving effect to the presentation of certain assets and liabilities of our insurance agency business as a discontinued operation, goodwill and other identifiable intangible assets were $568.0 million. Under current accounting guidance, if we determine that goodwill or intangible assets are impaired, we would be required to write down the value of these assets. We conduct an annual review to determine whether goodwill and other identifiable intangible assets are impaired. We conduct a quarterly review for indicators of impairment of goodwill and other identifiable intangible assets. Our management recently completed these reviews and concluded that no impairment charge was necessary for the year ended December 31, 2022. We cannot provide assurance whether we will be required to take an impairment charge in the future. Any impairment charge would have a negative effect on our shareholders’ equity and financial results and may cause a decline in our stock price.
We may need to raise additional capital in the future, but that capital may not be available when it is needed, or the cost of that capital may be very high.
Our regulators require us to maintain adequate levels of capital to support our operations, which may result in our need to raise additional capital to support continued growth. Our ability to raise additional capital, if needed, will depend on conditions in the capital markets at that time, which are outside our control, and on our financial condition and performance. Accordingly, we may not be able to raise additional capital if needed on terms that are acceptable to us, or at all. If we cannot raise additional capital when needed, our operations could be materially impaired, and our financial condition and liquidity could be materially and adversely affected. In addition, if we are unable to raise additional capital when required by the Massachusetts Commissioner of Banks, FDIC and/or the Federal Reserve Board, we may be subject to adverse regulatory action.
If we raise capital through the issuance of additional of common stock or other securities, it would dilute the ownership interests of existing shareholders and may dilute the per share value of our common stock. New investors may also have rights, preferences and privileges senior to our current shareholders.
We face significant legal risks, both from regulatory investigations and proceedings and from private actions brought against us.
From time to time we are named as a defendant or are otherwise involved in various legal proceedings, including class actions and other litigation or disputes with third parties. There is no assurance that litigation with private parties will not increase in the future. Actions against us may result in judgments, settlements, fines, penalties or other results adverse to us, which could materially adversely affect our business, financial condition or results of operations, or cause serious reputational harm to us. As a participant in the financial services industry, it is likely that we could continue to experience a high level of litigation related to our businesses and operations. There could be substantial cost and management diversion in such litigation and proceedings, and any adverse determination could have a materially adverse effect on our business, brand or image, or our financial condition and results of our operations.
Our businesses and operations are also subject to increasing regulatory oversight and scrutiny, which may lead to additional regulatory investigations or enforcement actions. These and other initiatives from federal and state officials may subject us to further judgments, settlements, fines or penalties, or cause us to be required to restructure our operations and activities, all of which could lead to reputational issues, or higher operational costs, thereby reducing our revenue. Please see the sections of this Current Report on Form 8-K titled “Business—Supervision and Regulation,” and “Legal Proceedings” for more information.
Our insurance coverage may be inadequate or expensive.
We are subject to claims in the ordinary course of business. It is not always possible to prevent or detect activities giving rise to claims, and the precautions we take may not be effective in all cases. We maintain an insurance coverage program that provides limited coverage for some, but not all, potential risks and liabilities associated with our business. We may not obtain insurance if we believe the cost of available insurance is excessive relative to the risks presented. As a result of market conditions, premiums and deductibles for certain insurance policies can increase substantially, and in some instances, certain insurance may become unavailable or available only for reduced amounts of coverage. As a result, we may not be able to renew our existing insurance policies or procure other desirable insurance on commercially reasonable terms, if at all. In addition, certain risks generally are not fully insurable. Even where insurance coverage applies, insurers may contest their obligations to make payments. Our financial condition, results of operations and cash flows could be materially and adversely affected by losses and liabilities from uninsured or under-insured events, as well as by delays in the payment of insurance proceeds, or the failure by insurers to make payments.
The loss of deposits or a change in deposit mix could increase our cost of funding and our funding sources may prove insufficient to replace deposits at maturity and support our future growth.
Our funding costs have increased materially beginning in 2022 and may continue to increase if our deposits decline and we are forced to replace them with more expensive sources of funding, if clients shift their deposits into higher cost products, or if we need to raise interest rates to avoid losing deposits. Increases to the federal funds rate, and competitor and customer responses to those increases, have caused and we anticipate will continue to cause competitive pressures to increase our deposit interest rates. The reduction in our overall level of deposits would increase the extent to which we rely on other, more expensive sources for funding, including Federal Home Loan Bank advances and brokered deposits, which would reduce our operating results.
In order for Eastern Bank to maintain sufficient cash flow, we must maintain sufficient funds to respond to the needs of depositors and borrowers. As a part of our liquidity management, we use a number of funding sources in addition to core deposit growth and repayments and maturities of loans and investments. These additional sources consist primarily of Federal Home Loan Bank advances, proceeds from the sale of loans or investments, federal funds purchased and brokered deposits. As we continue to grow, or as competitive pressures increase with regard to core funding sources, we are likely to become more dependent on these additional sources. Adverse operating results or changes in industry conditions could lead to difficulty or an inability in accessing these additional funding sources. Our financial flexibility will be severely constrained if we are unable to maintain our access to funding or if adequate financing is not available to accommodate future growth at acceptable interest rates. If we are required to rely more heavily on more expensive funding sources to support future growth, our revenues may not increase proportionately to cover our costs. In this case, our operating margins and results of operations would be adversely affected.
Various factors beyond our control, including interest rate increases and competition from banks and other financial institutions, adversely affect our liquidity.
Liquidity describes our ability to meet financial needs that arise in the normal course of our business, including deposit withdrawals and anticipated loan fundings, as well as current and planned expenditures. Our primary sources of liquidity are deposits, principal and interest payments on loans and securities, and proceeds from calls, maturities and sales of securities. The significant increases in market interest rates beginning in 2022 have contributed and may continue to contribute to a decline in our core deposits as customers seek higher interest rates from sources such as non-bank money market funds and bank competitors. We have undertaken and may continue to undertake measures to mitigate market-wide competitive deposit pressures or interest rate uncertainty or to otherwise manage our liquidity position. These have included and may continue to include accessing alternative funding sources, such as FHLBB advances and brokered certificates of deposit, as noted above.
Our investment portfolio also provides a potential source of liquidity that we have from time to time elected to and may continue to access. Due to the increase in interest rates, the fair value of our available for sale investment portfolio has declined in value since our initial purchase, resulting in a net unrealized loss position. If we elected to sell such investment securities, we would recognize a loss and take a charge to our operating results in the quarter in which a decision to sell such securities is made. Additionally, a majority of our available for sale investment securities would generate a capital loss or gain upon their sale. Capital losses are only deductible to the extent we are able to record capital gains during the applicable tax carryback and carryforward periods for federal tax purposes, and capital losses may not be carried back or carried forward for Massachusetts state tax purposes.
If we are unable to offset capital losses from the sale of securities, if any, with capital gains, the tax benefit associated with such sale would be less than the amount reflected as a deferred tax asset in our financial statements.
Deterioration in the performance or financial position of the Federal Home Loan Bank of Boston might restrict the Federal Home Loan Bank of Boston’s ability to meet the funding needs of its members, cause a suspension of its dividend and cause its stock to be determined to be impaired.
Significant components of Eastern Bank’s liquidity needs are met through its access to funding pursuant to its membership in the Federal Home Loan Bank of Boston. The Federal Home Loan Bank of Boston is a cooperative that provides services to its member banking institutions. The primary reason for joining the Federal Home Loan Bank of Boston is to obtain funding. The purchase of stock in the Federal Home Loan Bank of Boston is a requirement for a member to gain access to funding. Any deterioration in the Federal Home Loan Bank of Boston’s performance or financial condition may affect our ability to access funding and/or require us to deem the required investment in Federal Home Loan Bank of Boston stock to be impaired. If we are not able to access funding through the Federal Home Loan Bank of Boston, we may not be able to meet our liquidity needs, or we may need to rely more heavily on more expensive funding sources, either of which could have an adverse effect on our results of operations or financial condition. Similarly, if we deem all or part of our investment in Federal Home Loan Bank of Boston stock impaired, such action could have a material adverse effect on our results of operations or financial condition.
We may not be able to successfully implement future information technology system enhancements, or such implementations could be delayed materially, which could adversely affect our business operations and profitability.
We invest significant resources in information technology system enhancements in order to provide functionality and security at an appropriate level. We may not be able to successfully implement and integrate future system enhancements, or such implementations could be delayed materially, which could adversely impact the ability to provide timely and accurate financial information in compliance with legal and regulatory requirements, which in turn could result in sanctions from regulatory authorities. Such sanctions could include fines and suspension of trading in our stock, among others. In addition, future system enhancements could have higher than expected costs and/or result in operating inefficiencies, which could increase the costs associated with the implementation as well as ongoing operations.
Failure to properly utilize system enhancements that are implemented in the future could result in impairment charges that adversely impact our financial condition and results of operations and could result in significant costs to remediate or replace the defective components. In addition, we may incur significant training, licensing, maintenance, consulting and amortization expenses during and after systems implementations, and any such costs may continue for an extended period of time.
We rely on other companies to provide key components of our business infrastructure.
Third-party vendors provide key components of our business infrastructure such as internet connections, network access and core application processing. While we believe we have selected these third-party vendors carefully, we do not control their actions. We cannot assure that our third-party service providers will be able to continue to provide their services in an efficient, cost effective manner, if at all, or that they will be able to adequately expand their services to meet our needs. Any problems caused by these third-parties, including an interruption in service, or as a result of their not providing us their services for any reason or their performing their services poorly, and our inability to make alternative arrangements in a timely manner, could cause a disruption to our business and could adversely affect our ability to deliver products and services to our customers or otherwise conduct our business efficiently and effectively. Replacing these third-party vendors could also entail significant delay and expense. We cannot predict the costs or time that would be required to find an alternative vendor.
Operational risks are inherent in our businesses.
Our enterprise risk management framework seeks to achieve an appropriate balance between risk and return, which is critical to optimizing shareholder value. We have established processes and procedures intended to identify, measure, monitor, report and analyze the types of risk to which we are subject, including credit, liquidity, operational, regulatory compliance and reputational. However, as with any risk management framework, there are inherent limitations to our risk management strategies as there may exist, or develop in the future, risks that we have not appropriately anticipated or identified. If our risk management framework proves ineffective, we could suffer unexpected losses and our business and results of operations could be materially adversely affected.
In addition to the necessity of maintaining our enterprise risk management framework, our operations depend on our ability to process a very large number of transactions efficiently and accurately while complying with applicable laws and regulations. Operational risk and losses can result from internal and external fraud; errors by employees or third parties; failure to document transactions properly or to obtain proper authorization; failure to comply with applicable regulatory requirements and conduct of business rules; equipment failures, including those caused by natural disasters or by electrical, telecommunications or other essential utility outages; business continuity and data security system failures, including those caused by computer viruses, cyber-attacks or unforeseen problems encountered while implementing major new computer systems or upgrades to existing systems; or the inadequacy or failure of systems and controls, including those of our suppliers or counterparties.
Although we have implemented risk controls and loss mitigation actions, and substantial resources are devoted to developing efficient procedures, identifying and rectifying weaknesses in existing procedures and training staff, it is not possible to be certain that such actions have been or will be effective in controlling each of the operational risks we face. Any weakness in these systems or controls, or any violation or alleged violation of such laws or regulations, could result in increased regulatory supervision, enforcement actions and other disciplinary action, and have an adverse impact on our business, results of operations, reputation and ability to obtain future regulatory approvals, including those necessary to complete mergers or other acquisitions.
Changes in management’s estimates and assumptions may have a material impact on our Consolidated Financial Statements and our financial condition or operating results.
In preparing our Consolidated Financial Statements included in this Current Report on Form 8-K, and those that will be included in periodic reports that we will file in the future under the Securities Exchange Act of 1934, our management is required to make estimates and assumptions as of a specified date. These estimates and assumptions are based on management’s best estimates and experience as of that date and are subject to substantial risk and uncertainty. Materially different results may occur as circumstances change and additional information becomes known. Areas requiring significant estimates and assumptions by management include our valuation of our retirement plans and pension benefits, our determination of our income tax provision, our evaluation of the adequacy of our allowance for loan losses, and our evaluation of our securities portfolio. Please see the section of this Current Report on Form 8-K titled “Management’s Discussion and Analysis of Financial Condition and Results of Operations—Critical Accounting Policies and Estimates” for more information and Note 2, “Summary of Significant Accounting Policies” within the Notes to the Consolidated Financial Statements included in Item 8 in this Current Report on Form 8-K.
Our internal controls, procedures and policies may fail or be circumvented.
Management regularly reviews and updates our internal controls and corporate governance policies and procedures. Any system of controls, however well-designed and operated, is based in part on certain assumptions and can provide only reasonable, not absolute, assurances that the objectives of the system are met. Our shift to a remote working model due to the COVID-19 pandemic has required us to modify some of these controls, which are approved in advance by management and reviewed by the financial reporting internal controls manager and through internal audits. Similar to our other systems of controls, these modifications can provide only reasonable assurances that the objectives of the system are being met. Any failure or circumvention of the controls and procedures or failure to comply with regulations related to controls and procedures could have a material adverse effect on our business, results of operations and financial condition.
We maintain a significant investment in projects that generate tax credits, which we may not be able to fully utilize, or, if utilized, may be subject to recapture or restructuring.
As part of Eastern Bank’s community reinvestment initiatives, we invest in qualified affordable housing projects and other tax credit investment projects. Eastern Bank receives low-income housing tax credits, investment tax credits, rehabilitation tax credits and other tax credits as a result of its investments in these limited partnership investments. At December 31, 2022, we maintained investments of approximately $131.3 million in entities for which we receive allocations of tax credits, excluding investments of approximately $3.9 million in qualified zone academy bond investments, which we utilize to offset our income tax liability. We recorded the benefit of $7.3 million in credits for the year ended December 31, 2022. We intend to utilize all tax credits, as of December 31, 2022, to offset income tax liability. Substantially all of these tax credits are related to development projects that are subject to ongoing compliance requirements over certain periods of time to fully realize their value. If these projects are not operated in full compliance with the required terms, the tax credits could be subject to recapture or restructuring. Further, we may not be able to utilize any future tax credits. If we are unable to utilize our tax credits or, if our tax credits are subject to recapture or restructuring, it could have a material adverse effect on our business, financial condition and results of operations.
We depend on the accuracy and completeness of information about clients and counterparties.
In deciding whether to extend credit or enter into other transactions with customers and counterparties, we rely on information furnished by or on behalf of customers and counterparties, including financial statements and other financial information. We also may rely on representations of customers and counterparties as to the accuracy and completeness of that information and, with respect to financial statements, on reports of independent auditors. If any of such information is incorrect, then the creditworthiness of our customers and counterparties may be misrepresented, which would increase our credit risk and expose us to possible write-downs and losses.
We may not be able to successfully manage our intellectual property and may be subject to infringement claims.
We rely on a combination of owned and licensed trademarks, service marks, trade names, logos and other intellectual property rights. Third parties may challenge, invalidate, infringe or misappropriate our intellectual property, or such intellectual property may not be sufficient to provide us with competitive advantages, which could result in costly redesign efforts, discontinuance of certain services or other competitive harm. In addition, certain aspects of our business and our services rely on technologies licensed by third parties, and we may not be able to obtain or continue to obtain licenses and technologies from these third parties on reasonable terms or at all. The loss or diminution of our intellectual property protection or the inability to obtain third-party intellectual property could harm our business and ability to compete.
We may also be subject to costly litigation in the event our services infringe upon or otherwise violate a third party’s proprietary rights. Third parties may have, or may eventually be granted, intellectual property rights, including trademarks, that could be infringed by our services or other aspects of our business. Third parties have made, and may make, claims of infringement against us with respect to our services or business. Any claim from third parties may result in a limitation on our ability to use the intellectual property subject to these claims. Even if we believe that intellectual property related claims are without merit, defending against such claims is time consuming and expensive and could result in the diversion of the time and attention of our management and employees. Claims of intellectual property infringement also might require us to redesign affected services, enter into costly settlement or license agreements, pay costly damage awards, or face a temporary or permanent injunction prohibiting us from marketing or selling certain of our services. Any intellectual property related dispute or litigation could have a material adverse effect on our business, financial condition and results of operations.
Our business may be adversely affected by conditions in the financial markets and by economic conditions generally.
Weakness in the U.S. economy may adversely affect, our business. A deterioration of business and economic conditions has adversely affected, and could in the future adversely affect the credit quality of our loans, results of operations and financial condition. Increases in loan delinquencies and default rates could adversely impact our loan charge-offs and provision for loan and lease losses. Deterioration or defaults made by issuers of the underlying collateral of our investment securities may cause additional credit-related other-than-temporary impairment charges to our income statement. Our ability to borrow from other financial institutions or to access the debt or equity capital markets on favorable terms or at all could be adversely affected by disruptions in the capital markets or other events, including actions by rating agencies and deteriorating investor expectations.
In addition to these specific effects, widespread adverse economic conditions that could affect us include:
•Reduced consumer spending;
•Increased unemployment;
•Lower wage income levels;
•Declines in the market value of residential and commercial real estate;
•Inflation or deflation;
•Fluctuations in the value of the U.S. dollar;
•Volatility in short-term and long-term interest rates (for more information regarding the potential effect of fluctuating interest rates, see “Changes in interest rates may have an adverse effect on our profitability.”); and
•Higher bankruptcy filings.
Climate change, natural disasters, public health crises, geopolitical developments, acts of terrorism and other external events could harm our business.
Natural disasters can disrupt our operations, result in damage to our properties, reduce or destroy the value of the collateral for our loans and negatively affect the economies in which we operate, which could have a material adverse effect on our results of operations and financial condition. A significant natural disaster, such as a hurricane, earthquake, fire or flood, could have a material adverse impact on our local market area and ability to conduct business, and our insurance coverage may be insufficient to compensate for losses that may occur. Public health crises, such as pandemics and epidemics, such as the global outbreak of COVID-19, domestic or geopolitical crises, such as terrorism, military conflict, the ongoing war between Russia and Ukraine, other wars or the perception that hostilities may be imminent, political instability or civil unrest, or other conflict, human error or other events outside of our control, could cause disruptions to our business or the United States economy as a whole, and our business and operating results could suffer. The occurrence of any such event could have a material adverse effect on our business, operations and financial condition.
Climate change may worsen the severity and impact of future hurricanes, earthquakes, fires, floods and other extreme weather-related events that could cause disruption to our business and operations. Chronic results of climate change such as shifting weather patterns could also cause disruption to our business and operations.
Changes in accounting standards can be difficult to predict and can materially impact how we record and report our financial condition and results of operations.
Our accounting policies and methods are fundamental to how we record and report our financial condition and results of operations. From time to time, the Financial Accounting Standards Board changes the financial accounting and reporting principles that govern the preparation of our financial statements. These changes can be hard to anticipate and implement and can materially impact how we record and report our financial condition and results of operations. In some cases, we could be required to apply a new or revised standard retroactively, resulting in our restating prior period financial statements. Additionally, significant changes to accounting standards may require costly technology changes, additional training and personnel, and other expense that will negatively impact our operating results.
The financial weakness of other financial institutions could adversely affect us.
Our ability to engage in routine funding transactions could be adversely affected by the actions and commercial financial weakness of other financial institutions. Financial services institutions are interconnected as a result of trading, clearing, counterparty and other relationships. We have exposure to many different counterparties, and we routinely execute transactions with counterparties in the financial industry, including brokers and dealers, other commercial banks, investment banks, mutual and hedge funds, and other financial institutions. As a result, defaults by, or even rumors or questions about, one or more financial services institutions, or the financial services industry generally, could lead to market-wide liquidity problems and losses or defaults by us or by other institutions and organizations. Many of these transactions expose us to credit risk in the event of default of our counterparty or client. In addition, our credit risk may be exacerbated when the collateral held by us cannot be liquidated or is liquidated at prices not sufficient to recover the full amount of the financial instrument exposure due to us. There is no assurance that any such losses would not materially and adversely affect our results of operations.
Market changes may adversely affect demand for our services and impact results of operations.
Channels for servicing our customers are evolving rapidly, with less reliance on traditional branch facilities, more use of online and mobile banking, and increased demand for universal bankers and other relationship managers who can service multiples product lines. We compete with larger providers who are rapidly evolving their service channels and escalating the costs of evolving the service process. We have a process for evaluating the profitability of our branch system and other office and operational facilities. The identification of unprofitable operations and facilities can lead to restructuring charges and introduce the risk of disruptions to revenues and customer relationships.
Changes in the equity markets could materially affect the level of assets under management and the demand for fee-based services.
Economic downturns could affect the volume of revenue from and demand for fee-based services. Revenue from Eastern Bank’s wealth management division depends in large part on the level of assets under management and administration. Market volatility and the potential of such volatility to lead customers to liquidate investments, as well as lower asset values, could reduce the level of assets under management and administration and thereby decrease our investment management revenue.
Our return on equity may be relatively low for the foreseeable future compared to our publicly traded peer companies. This could negatively affect the trading price of our shares of common stock.
Net income divided by average shareholders’ equity, known as “return on equity,” is a ratio many investors use to compare the performance of financial institutions. Our return on equity may be relatively low compared to our publicly traded peers until we are able to leverage the additional capital we raised in our 2020 IPO. Our return on equity will also be negatively affected by added expenses associated with our employee stock ownership plan and the stock-based benefit plans adopted in 2021. Until we can increase our net interest income and non-interest income and leverage the capital raised in the offering, we expect our return on equity to be relatively low for the foreseeable future compared to our publicly traded peer companies. A relatively low return on equity may negatively affect the market price of our shares of common stock.
Rising sea levels projected for the coastal regions of Massachusetts and New Hampshire could adversely affect our business.
We believe that progressively rising sea levels will be an area of risk over time for the coastal regions of Massachusetts and New Hampshire in our market, both as the frequency and severity of extreme weather events increase and as currently inhabited property and land parcels are exposed to episodic flooding and routinely higher tides. As a city, Boston was ranked the world’s eighth most vulnerable to floods among 136 coastal cities by a 2013 study produced by the Organization for Economic Cooperation and Development. According to a 2016 report sponsored in part by the City of Boston, sea levels in Boston, which rose approximately nine inches relative to land during the twentieth century, may rise another eight inches by 2030, and by 2050, the sea level in Boston may be as much as 1.5 feet higher than it was in 2000.
The increase in the relative sea level in Boston and other coastal regions of Massachusetts and New Hampshire in our market is expected to result in higher coastal surges during storm events and, when considered with projected increases in precipitation intensities, an increase in stormwater flooding. These effects in Boston and similar conditions elsewhere in our market area may adversely affect the value of commercial and residential properties that secure some of our loans and may adversely affect economic develop in portions of our market area.
Societal responses to climate change could adversely affect our business and performance, including indirectly through impacts on our customers.
Concerns over the long-term impacts of climate change have led and will continue to lead to governmental efforts around the world to mitigate those impacts. Consumers and businesses also may change their behavior on their own as a result of these concerns. Eastern Bank and its customers will need to respond to new laws and regulations as well as consumer and business preferences resulting from climate change concerns. We and our customers may face cost increases, asset value reductions, operating process changes, and the like. The impact on our customers will likely vary depending on their specific attributes, including reliance on or role in carbon intensive activities. Among the impacts to Eastern Bank could be a drop in demand for our products and services, particularly in certain sectors. In addition, we could face reductions in creditworthiness on the part of some customers or in the value of assets securing loans. Our efforts to take these risks into account in making lending and other decisions, including by increasing our business with climate-friendly companies, may not be effective in protecting us from the negative impact of new laws and regulations or changes in consumer or business behavior.
We are subject to environmental, social and governance risks that could adversely affect our reputation and the trading price of our common stock.
We are subject to a variety of environmental, social and governance risks that arise out of the set of concerns that together comprise what have become commonly known as “ESG matters.” Risks arising from ESG matters may adversely affect, among other things, our reputation and the trading price of our common stock.
As a financial institution with a diverse base of customers, vendors and suppliers, we may face potential negative publicity based on the identity of those we choose to do business with and the public’s (or certain segments of the public’s) view of those customers, vendors and suppliers. This negative publicity may be driven by adverse news coverage in traditional media and may also be spread through the use of social media platforms. If our relationships with our customers, vendors and suppliers were to become the subject of such negative publicity, our ability to attract and retain customers and employees may be negatively impacted and our stock price may also be impacted.
Additionally, many investors now consider how corporations are addressing ESG matters when making investment decisions. For example, certain investors incorporate the business risks of climate change and the adequacy of companies’ responses to climate change and other ESG matters as part of their investment theses. These shifts in investing priorities may result in adverse effects on the trading price of our common stock if investors determine that we do not sufficiently address ESG matters in accordance with their standards or other third-party standards for evaluating ESG matters.
Further, our regulators, including the Securities and Exchange Commission, may adopt regulations related to ESG matters that could require the collection, assessment, and reporting of extensive data, including emissions-related data, in categories and formats that are novel to us. Although we have begun considering and developing various measures to address potential future regulatory requirements, these measures may not be sufficient in every instance to ensure full compliance with such requirements.
Risks Related to Regulations
Monetary policies and regulations of the Federal Reserve Board could adversely affect our business, financial condition and results of operations.
In addition to being affected by general economic conditions, our earnings and growth are affected by the monetary and related policies of the Federal Reserve Board. An important function of the Federal Reserve Board is to regulate the money supply and credit conditions. Among the instruments used by the Federal Reserve Board to implement these objectives are open market purchases and sales of U.S. government securities, adjustments of the discount rate and changes in banks’ reserve requirements against bank deposits and the interest rate paid on such reserves. These instruments are used in varying combinations to influence overall economic growth and the distribution of credit, bank loans, investments and deposits. Their use also affects interest rates charged on loans or paid on deposits.
The monetary and related policies of the Federal Reserve Board have had a significant effect on the operating results of financial institutions in the past and are expected to continue to do so in the future. Changes in any of these policies are influenced by macroeconomic conditions and other factors that are beyond Eastern Bank’s control and the effects of such policies upon our business, financial condition and results of operations cannot be predicted.
Our business is highly regulated, which could limit or restrict our activities and impose financial requirements or limitations on the conduct of our business.
Eastern Bank and Eastern Bankshares, Inc. are subject to extensive regulation, supervision and examination by the Massachusetts Commissioner of Banks, the FDIC, the Federal Reserve Board and the Consumer Financial Protection Bureau. Federal and state laws and regulations govern numerous matters affecting us, including changes in the ownership or control of banks and bank holding companies, maintenance of adequate capital and the financial condition of a financial institution, permissible types, amounts and terms of extensions of credit and investments, permissible non-banking activities, the level of reserves against deposits and restrictions on stock repurchases and dividend payments. The FDIC and the Massachusetts Commissioner of Banks have the power to issue cease and desist orders to prevent or remedy unsafe or unsound practices or violations of law by banks subject to their regulation, and the Federal Reserve Board possesses similar powers with respect to bank holding companies and their subsidiary banks. These and other restrictions limit the manner in which we and Eastern Bank may conduct business and obtain financing.
The laws, rules, regulations, and supervisory guidance and policies applicable to us are subject to modification and change. Changes to statutes, regulations, or regulatory policies, including changes in interpretation or implementation of statutes, regulations or policies, could affect us in substantial and unpredictable ways. Such changes could subject us to additional costs, limit the types of financial services and products we may offer, and/or increase the ability of non-banks to offer competing financial services and products, among other things. Failure to comply with laws, regulations, or policies could result in sanctions by regulatory agencies, civil money penalties, and/or reputation damage, which could have a material adverse effect on our business, financial condition, and results of operations. See the section of this Current Report on Form 8-K titled “Business—Supervision and Regulation” for a discussion of the regulations to which we are subject.
Regulatory authorities have extensive discretion in their supervisory and enforcement activities, including the imposition of restrictions on our operations, the classification of our assets and determination of the level of our allowance for loan losses. These regulations, along with the currently existing tax, accounting, securities, insurance, monetary laws, rules, standards, policies and interpretations control the methods by which financial institutions conduct business, implement strategic initiatives and tax compliance, and govern financial reporting and disclosures. Any change in such regulation and oversight, whether in the form of regulatory policy, regulations, legislation or supervisory action, may have a material impact on our operations.
In addition, changes in the legal and regulatory framework under which we operate require us to update our information systems to ensure compliance. Our need to review and evaluate the impact of ongoing rule proposals, final rules and implementation guidance from regulators further complicates the development and implementation of new information systems for our business. Also, our regulators expect us to perform increased due diligence and ongoing monitoring of third-party vendor relationships, thus increasing the scope of management involvement and decreasing the efficiency otherwise resulting from our relationships with third-party technology providers.
Presidential appointees to the independent bank regulatory agencies may adopt new regulatory policies and pursue different bank supervisory priorities. We are unable to predict whether changes in the policies and priorities of independent bank regulatory agencies will have a material adverse effect on our business, financial condition, and results of operations.
We are subject to capital and liquidity standards that require banks and bank holding companies to maintain more and higher quality capital and greater liquidity than has historically been the case.
New capital requirements which were fully phased-in as of January 1, 2019, require bank holding companies and their bank subsidiaries to maintain substantially higher levels of capital as a percentage of their assets, with a greater emphasis on common equity as opposed to other components of capital. The need to maintain more and higher quality capital, as well as greater liquidity, and generally increased regulatory scrutiny with respect to capital levels, may at some point limit our business activities, including lending, and our ability to expand. It could also result in our taking steps to increase our regulatory capital and may dilute shareholder value or limit our ability to pay dividends or otherwise return capital to our investors through stock repurchases.
We are subject to numerous laws designed to protect consumers, including the Community Reinvestment Act and fair lending laws, and failure to comply with these laws could lead to a wide variety of sanctions.
The Community Reinvestment Act, the Equal Credit Opportunity Act, the Fair Housing Act, and other fair lending laws and regulations impose community investment and nondiscriminatory lending requirements on financial institutions. The Consumer Financial Protection Bureau, the Department of Justice and other federal and state agencies are responsible for enforcing these federal laws and regulations and comparable state provisions. A successful regulatory challenge to an institution’s performance under the Community Reinvestment Act, the Equal Credit Opportunity Act, the Fair Housing Act or other fair lending laws and regulations could result in a wide variety of sanctions, including damages and civil money penalties, injunctive relief, restrictions on mergers and acquisitions, restrictions on expansion and restrictions on entering new business lines.
Private parties may also have the ability to challenge an institution’s performance under fair lending laws in private class action litigation. Such actions could have a material adverse effect on our business, financial condition and results of operations.
Various federal banking agencies are considering changes to their respective Community Reinvestment Act regulations. We are unable to predict whether any of those changes will be adopted and, if so, whether they will have a material adverse effect on our business.
We may incur fines, penalties and other negative consequences from regulatory violations, possibly even inadvertent or unintentional violations.
The financial services industry is subject to intense scrutiny from bank supervisors in the examination process and aggressive enforcement of federal and state regulations, particularly with respect to mortgage-related practices and other consumer compliance matters, and compliance with anti-money laundering, Bank Secrecy Act and Office of Foreign Assets Control regulations, and economic sanctions against certain foreign countries and nationals. Enforcement actions may be initiated for violations of laws and regulations and unsafe or unsound practices. We maintain systems and procedures designed to ensure that we comply with applicable laws and regulations; however, some legal/regulatory frameworks provide for the imposition of fines or penalties for noncompliance even though the noncompliance was inadvertent or unintentional and even though there were in place at the time systems and procedures designed to ensure compliance. Failure to comply with these and other regulations, and supervisory expectations related thereto, may result in fines, penalties, lawsuits, regulatory sanctions, reputation damage or restrictions on our business.
Non-compliance with the USA PATRIOT Act, Bank Secrecy Act or other laws and regulations could result in fines or sanctions.
The USA PATRIOT and Bank Secrecy Acts require financial institutions to develop programs to prevent financial institutions from being used for money laundering and terrorist activities. If such activities are detected, financial institutions are obligated to file suspicious activity reports with the U.S. Treasury’s Office of Financial Crimes Enforcement Network. These rules require financial institutions to establish procedures for identifying and verifying the identity of customers seeking to open new financial accounts. Failure to comply with these regulations could result in fines or sanctions, including restrictions on conducting acquisitions or establishing new branches. Although we have developed policies and procedures designed to assist in compliance with these laws and regulations, these policies and procedures may not be effective in preventing violations of these laws and regulations.
An increase in FDIC insurance assessments could significantly increase our expenses.
The Dodd-Frank Act eliminated the maximum Deposit Insurance Fund (“DIF”) ratio of 1.5% of estimated deposits, and the FDIC has established a long-term ratio of 2.0%. In September 2020, the FDIC adopted a restoration plan designed to ensure that the DIF reserve ratio reaches 1.35% by September 2028. On September 30, 2021, the Deposit Insurance Fund reserve ratio was 1.27%. In October 2022, the FDIC increased the initial base deposit insurance assessment rate schedules for all FDIC insured depository institutions by 2 basis points, beginning with the quarterly assessment period ending March 31, 2023. The new assessment rate schedules will remain in effect unless and until the DIF reserve ratio meets or exceeds 2%, absent further FDIC action. In addition, if our regulators issue downgraded ratings of Eastern Bank in connection with their examinations, the FDIC could impose significant additional fees and assessments on us.
We may be unable to disclose some restrictions or limitations on our operations imposed by our regulators.
Bank regulatory agencies have the authority to take supervisory actions that restrict or limit a financial institution’s activities. In some instances, we are not permitted to publicly disclose these actions. In addition, as part of our regular examination process, our and our banking subsidiary’s respective regulators may advise us to operate under various restrictions as a prudential matter. Any such actions or restrictions, if and in whatever manner imposed, could adversely affect our costs and revenues. Moreover, efforts to comply with any such nonpublic supervisory actions or restrictions may require material investments in additional resources and systems, as well as a significant commitment of managerial time and attention. As a result, such supervisory actions or restrictions, if and in whatever manner imposed, could have a material adverse effect on our business and results of operations; and, in certain instances, we may not be able to publicly disclose these matters.
We could be required to act as a “source of strength” to our banking subsidiaries, which would have a material adverse effect on our business, financial condition and results of operations.
Federal Reserve Board policy historically required bank holding companies such as Eastern Bankshares, Inc. to act as a source of financial and managerial strength to their subsidiary banks. The Dodd-Frank Act codified this policy as a statutory requirement. This support may be required by the Federal Reserve Board at times when Eastern Bankshares, Inc.
might otherwise determine not to provide it or when doing so might not otherwise be in the interests of the shareholders or creditors of Eastern Bankshares, Inc., and may include one or more of the following:
• Any extension of credit from Eastern Bankshares, Inc. to Eastern Bank or any other bank subsidiary that is included in the relevant bank’s capital would be subordinate in right of payment to depositors and certain other indebtedness of such subsidiary banks.
• In the event of a bank holding company’s bankruptcy, any commitment that the bank holding company had been required to make to a federal bank regulatory agency to maintain the capital of a subsidiary bank will be assumed by the bankruptcy trustee and entitled to priority of payment.
• In certain circumstances if we have two or more bank subsidiaries, one bank subsidiary could be assessed for losses incurred by another bank subsidiary. In addition, in the event of impairment of the capital stock of one of our banking subsidiaries, Eastern Bankshares, Inc., as our banking subsidiary’s shareholder, could be required to pay such deficiency.
Laws and regulations regarding privacy and data protection could have a material impact on our results of operations.
We currently are subject to state and federal rules regarding privacy and data protection, such as the Massachusetts data security law (Standards for the Protection of Personal Information of Residents of the Commonwealth). Our growth and expansion into a variety of new fields may potentially involve new U.S.-based regulatory issues/requirements including, for example, the New York Department of Financial Services Cybersecurity Regulation or the California Consumer Privacy Act (“CCPA”). In addition, one or more members of the European Union (the “EU”) may take the position that we are subject to the EU General Data Protection Regulation (“GDPR”) because some of our customers are or may become residents of EU states while maintaining account relationships with us. The potential costs of compliance with or imposed by new or existing laws and regulations and policies that are applicable to us may affect the use of our products and services and could have a material adverse impact on our results of operations.
Changes in tax laws and regulations and differences in interpretation of tax laws and regulations may adversely affect our financial statements and our operating results.
From time to time, local, state or federal tax authorities change tax laws and regulations, which may result in a decrease or increase to our deferred tax asset. Local, state or federal tax authorities may interpret laws and regulations differently than we do and challenge tax positions that we have taken on tax returns. This may result in differences in the treatment of revenues, deductions, credits and/or differences in the timing of these items. The differences in treatment may result in payment of additional taxes, interest, penalties or litigation costs that could have a material adverse effect on our operating results.
Due to Section 162(m) of the Internal Revenue Code, we may not be able to deduct all of the compensation of some executives, including executives of companies we may acquire in the future.
Section 162(m) of the Internal Revenue Code generally limits to $1 million annual deductions for compensation paid to “covered employees” of any “publicly held corporation.” A “publicly held corporation” includes any company, such as Eastern Bankshares, Inc., that issues securities required to be registered under Section 12 of the Securities Exchange Act of 1934 or companies required to file reports under Section 15(d) of the Exchange Act, determined as of the last day of the company’s taxable year. We expect that as a publicly held corporation, the deductibility of compensation to our covered employees will be similarly limited. Pursuant to proposed U.S. Treasury regulations issued on December 20, 2019 clarifying the changes made to Section 162(m) by the Tax Cuts and Jobs Act and the initial guidance provided by the IRS in Notice 2018-68 that was issued in August 2018, the definition of “covered employees” generally includes anyone who served as the principal executive officer (“PEO”) or principal financial officer (“PFO”) at any time during the taxable year; the three highest compensated executive officers (other than the PEO or PFO), determined under SEC rules; and any individual who was a covered employee, including of a “predecessor company,” at any point during a taxable year beginning on or after January 1, 2017, even after the employee terminates employment. We expect that in most if not all cases a publicly traded company that we might acquire in the future will be a “predecessor company.” Accordingly, we expect that the number of our covered employees will increase if Eastern acquires one or more publicly held corporations in the future.
As a result of the foregoing, Section 162(m) limited the deductibility of compensation to our covered employees to $1 million for the year ended December 31, 2022, and assuming no change in applicable law, we expect that we will not be able to deduct all of the compensation paid in future years where Eastern qualifies as a “publicly held corporation.” Losing deductions under Section 162(m) could increase our income taxes and reduce our net income. A reduction in net income could negatively affect the price of Eastern Bankshares, Inc. stock.
Regulatory developments could adversely affect our business by increasing our costs and thereby making our business less profitable.
Our profitability may be adversely affected by current and future rulemaking and enforcement activity by the various federal, state and self-regulatory organizations to which we are subject. Regulations can adversely affect our compliance costs and other non-interest expenses, and failure to comply with regulations could subject us to regulatory actions or litigation, which could have a material adverse effect on our business, results of operations, or financial condition.
New laws, rules and regulations, or changes to the interpretation or enforcement of existing laws, rules or regulations, from time to time could increase our expenses, causing our recent historical expenses not to be indicative of future expenses, and could result in limitations on the lines of business we conduct or plan to conduct, modifications to our current or future business practices, and increased capital requirements. For example, the SEC and our banking regulators have proposed climate-related disclosure requirements and principles for climate-related financial risk management, respectively. We expect that these developments could negatively impact our results, including by increasing our legal, compliance, and information technology expenditures and could result in other costs, as well as greater risks of lawsuits and enforcement activity by regulators. These changes may also affect the array of products and services we offer to our customers.
It is unclear how and whether our regulators, including the SEC, FDIC, other banking regulators and other state insurance regulators may respond to, or enforce elements of, these new regulations or develop their own similar laws and regulations. The impacts, degree and timing of the effect of applicable laws, future regulations and industry principles on our business cannot now be anticipated and may have further impacts on our products and services and the results of operations.
Risks Related to Stock-Based Benefit Plans
Our stock-based benefit plans have increased and will continue to increase our expenses and reduce our income.
In 2021, we adopted the Equity Plan, which will increase our annual compensation and benefit expenses related to awards granted to participants under such plan. The actual amount of these new stock-related compensation and benefit expenses will depend on the number of awards actually granted under the Equity Plan, the fair market value of the awards on the date of grant, the vesting period, and other factors which we cannot predict at this time.
In addition, we recognize compensation expense monthly for our employee stock ownership plan when shares are committed to be released to participants’ accounts, and we recognize compensation expense for restricted stock awards, performance stock units and restricted stock units over the vesting period of awards made to recipients. We anticipate that in 2023, our incremental compensation expense for shares purchased in our IPO by the ESOP and for the Equity Plan will significantly increase our overall compensation expense as compared to prior years.
If we are not able to comply with the requirements of Section 404 of the Sarbanes-Oxley Act in a timely and capable manner, we may be subject to adverse regulatory consequences and there could be a negative reaction in the financial markets due to a loss of investor confidence in us and the reliability of our financial statements.
We ceased being an emerging growth company on December 31, 2021, and therefore Section 404(b) of the Sarbanes-Oxley Act is now applicable to us. Accordingly, our management is now required to conduct an annual assessment of the effectiveness of our internal control over financial reporting and include a report on these internal controls in the annual reports we will file with the SEC on Form 10-K. Our independent registered public accounting firm is required to formally attest to the effectiveness of our internal controls. This requires significant documentation of our policies, procedures and systems, review of that documentation by our internal auditing and accounting staff and our outside independent registered public accounting firm, and testing of our internal control over financial reporting by our internal auditing and accounting staff and our outside independent registered public accounting firm. This process involves considerable time and attention, strains our internal resources, and increases our operating costs. We have experienced and may continue to experience higher than anticipated operating expenses and outside auditor fees during the implementation of these changes and thereafter. If our independent registered public accounting firm is unable to express an opinion as to the effectiveness of our internal control over financial reporting, investors may lose confidence in the accuracy and completeness of our financial reports and the market price of our common stock could be negatively affected, and we could become subject to investigations by Nasdaq, the SEC or other regulatory authorities, which could require additional financial and management resources.
Risks Related to Our Articles of Organization and State and Federal Banking Laws
Various factors may make takeover attempts more difficult to achieve.
Certain provisions of our articles of organization and state and federal banking laws, including regulatory approval requirements, could make it more difficult for a third party to acquire control of Eastern Bankshares, Inc. without our Board of Directors’ approval.
Under regulations applicable to our IPO, no person may acquire beneficial ownership of more than 10% of our common stock before October 15, 2023 without prior approval of the Federal Reserve Board and the Massachusetts Commissioner of Banks. If any person exceeds this 10% beneficial ownership threshold, shares in excess of 10% will not be counted as shares entitled to vote during the three-year period ending October 14, 2023. After that three-year period, the holder of shares in excess of the 10% threshold will be entitled to cast only one one-hundredth (1/100) of a vote per share for each share in excess of the 10% threshold. Under federal law, subject to certain exemptions, a person, entity or group must notify the Federal Reserve Board before acquiring control of a bank holding company. Acquisition of 10% or more of any class of voting stock of a bank holding company, including shares of our common stock, creates a rebuttable presumption that the acquirer “controls” the bank holding company. Also, a bank holding company must obtain the prior approval of the Federal Reserve Board before, among other things, acquiring direct or indirect ownership or control of more than 5% of any class of voting shares of any bank, including Eastern Bank, and certain non-bank companies.
There also are provisions in our articles of organization that may be used to delay or block a takeover attempt, including, among others, a provision that prohibits any person from casting a full vote for any shares of common stock exceeding the 10% threshold, as described above; the prohibition on removal of directors without cause; and the required approval of at least 80% of the voting power of the shares then-outstanding entitled to vote for business combination transactions with interested shareholders. Additionally, our Board of Directors is currently classified, with directors serving three-year staggered terms. However, the classified structure is being phased out, and by our 2027 annual meeting of stockholders, directors will be elected for annual terms. Furthermore, shares of restricted stock, restricted stock units or stock options that we may grant to employees and directors, stock ownership by our management and directors, employment agreements and/or change in control agreements that we have entered into with our executive officers and other factors may make it more expensive for companies or persons to acquire control of Eastern Bankshares, Inc. Taken as a whole, these statutory provisions and provisions in our articles of organization could result in our being less attractive to a potential acquirer and thus could adversely affect the market price of our common stock.
The articles of organization of Eastern Bankshares, Inc. provide that state and federal courts located in Massachusetts will be the exclusive forum for substantially all disputes between us and our shareholders, which could limit our shareholders’ ability to obtain a favorable judicial forum for disputes with us or our directors, officers or employees.
The articles of organization of Eastern Bankshares, Inc. provide that state and federal courts located in Massachusetts will be the exclusive forum for substantially all disputes between us and our shareholders, which could limit our shareholders’ ability to obtain a favorable judicial forum for disputes with us or our directors, officers or employees. The articles of organization of Eastern Bankshares, Inc. provide that, unless we consent in writing to the selection of an alternative forum, the Business Litigation Session of the Suffolk County Superior Court (the “BLS”) (1) is the sole and exclusive forum for any derivative action or proceeding brought on behalf of Eastern Bankshares, Inc., any action asserting a claim of breach of a fiduciary duty, any action asserting a claim arising pursuant to any provision of Massachusetts corporate law, or any action asserting a claim governed by the internal affairs doctrine, and (2) is a concurrent jurisdiction for any claim arising under the Securities Act of 1933 or the rules and regulations thereunder. The articles of organization also provide that the exclusive forum provision does not apply to any claim for which the federal courts have exclusive jurisdiction, including all suits brought to enforce any liability or duty created by the Exchange Act or the rules and regulations thereunder. The choice of forum provision may limit a shareholder’s ability to bring a claim in a judicial forum that the shareholder finds favorable for disputes with us or our directors and officers or other employees, which may discourage such lawsuits against us and our directors, officers and other employees. Alternatively, if a court were to find the choice of forum provision contained in our articles of organization to be inapplicable or unenforceable in an action, we may incur additional costs associated with resolving such action in other jurisdictions, which could adversely affect our business and financial condition.
The market price of our stock value may be negatively affected by applicable regulations that restrict stock repurchases by us.
Massachusetts regulations prohibit us from repurchasing shares of our common stock through October 14, 2023 (i.e., during the first three years following the completion of our IPO), except to fund tax-qualified or nontax-qualified employee stock benefit plans, or except in amounts not greater than 5% of our outstanding shares of common stock then outstanding.
Our repurchase of shares of common stock is also subject to Federal Reserve Board policy related to repurchases of shares by depository institution holding companies. To date, we have received two notices of non-objection to proposed share repurchase programs, one allowing the purchase of up to 9,337,900 shares, which we completed in the third quarter of 2022; and one allowing the purchase of up to up to 8,900,000 shares through August 31, 2023. The outstanding repurchase program, which is limited to $200.0 million, may be modified or terminated by our Board of Directors at any time. In addition, the Federal Reserve Board could subsequently limit or prohibit our repurchase of common stock if we experience a material adverse change in our financial condition or results of operations.
ITEM 2. PROPERTIES
At December 31, 2022, we conducted our banking business through our corporate headquarters in Boston, Massachusetts and 98 branch offices located in eastern Massachusetts and southern New Hampshire. In addition, Eastern Bank occupies two administrative/operational offices, in Lynn and Brockton, Massachusetts. Eastern Insurance Group LLC, substantially all of the assets and certain liabilities of which are included in discontinued operations, operates through 21 non-branch offices including offices in eastern Massachusetts, and one office in Providence, Rhode Island. At December 31, 2022, we leased 81 of our offices, and the total net book value of our land, buildings, furniture, fixtures and equipment was $62.5 million.
PART II
ITEM 7. MANAGEMENT’S DISCUSSION AND ANALYSIS OF FINANCIAL CONDITION AND RESULTS OF OPERATIONS
The following discussion should be read in conjunction with the Consolidated Financial Statements and notes thereto appearing elsewhere in this Current Report on Form 8-K. In addition to historical data, this discussion contains forward-looking statements about our business, results of operations, cash flows, financial condition and prospects based on current expectations that involve risks, uncertainties and assumptions. Our actual results may differ materially from those in this discussion as a result of various factors, including, but not limited to, those discussed under Part I, Item 1A, “Risk Factors” appearing elsewhere in this Current Report on Form 8-K.
Overview
We are a bank holding company, and our principal subsidiary, Eastern Bank, is a Massachusetts-chartered bank that has served the banking needs of our customers since 1818. Our business philosophy is to operate as a diversified financial services enterprise providing a broad array of banking and other financial services primarily to retail, commercial and small business customers. We had total assets of $22.6 billion and $23.5 billion at December 31, 2022 and 2021, respectively. We are subject to comprehensive regulation and examination by the Massachusetts Commissioner of Banks, the Federal Deposit Insurance Corporation (“FDIC”), the Federal Reserve Board and the Consumer Financial Protection Bureau. Our banking business consists of a full range of banking, lending (commercial, residential and consumer), savings and small business offerings, including our wealth management and trust operations that we conduct through our Eastern Wealth Management division.
In recent years, we managed our business under two business segments: our banking business and our insurance agency business. On September 19, 2023, we entered into an agreement to sell our insurance agency business and, consequently, reclassified substantially all of the related assets and certain liabilities to “assets and liabilities of discontinued operations,” respectively, on our Consolidated Balance Sheets and the results of discontinued operations were reclassified to “net income from discontinued operations” on our Consolidated Statements of Income. For additional discussion of discontinued operations, refer to Note 24, “Discontinued Operations” within the Notes to the Consolidated Financial Statements included in Item 8 in this Current Report on Form 8-K. The following discussion excludes the results of discontinued operations, unless otherwise indicated.
Net income from continuing operations for the year ended December 31, 2022, computed in accordance with GAAP, was $186.5 million, as compared to $145.5 million for the year ended December 31, 2021, representing an increase of 28.2%. This increase was primarily due to an increase in net interest income. Our net interest income increased primarily due to an increase in our average interest-earning assets, which was primarily the result of our 2021 acquisition of Century. Refer to the “Results of Operations” section below for further discussion. Net income from continuing operations for the year ended December 31, 2022 and 2021 included items that our management considers non-core, which management excludes for purposes of assessing our operating net income, a non-GAAP financial measure. Operating net income for the year ended December 31, 2022 was $199.9 million compared to $157.1 million for the year ended December 31, 2021. This increase was largely driven by the aforementioned change in average interest-earning assets. Refer to the “Outlook and Trends” section below for further discussion. Refer to the “Non-GAAP Financial Measures” below for a reconciliation of net operating earnings to GAAP net income.
The following chart shows our basic earnings per share from continuing operations on a GAAP and operating (non-GAAP) basis over the past three years (refer to the “Non-GAAP Financial Measures” section below for a reconciliation of GAAP earnings to operating earnings):
Earnings per share from continuing operations, on a GAAP basis, increased from $0.85 for the year ended December 31, 2021 to $1.13 for the year ended December 31, 2022 a 32.9% increase. The increase was primarily due to an increase in net interest income and a decrease in the average number of common shares outstanding. The decrease in the average number of common shares outstanding was attributable to share repurchases in connection with our previously announced share repurchase programs.
The following chart shows our efficiency ratio on a GAAP and operating (non-GAAP) basis over the past five years (refer to the “Non-GAAP Financial Measures” section below for additional information on the determination of each measure):
The GAAP efficiency ratio and non-GAAP operating efficiency ratio for the year ended December 31, 2022 decreased compared to the ratios for the year ended December 31, 2021. The decreases were primarily attributable to increased net interest income, which resulted in a margin of increase in total revenue that exceeded the rates at which noninterest expense increased and noninterest income decreased for the same periods. Refer to the“Results of Operations” section below for additional discussion of the changes in net interest income, noninterest income and noninterest expense.
Outlook and Trends
Sale of Insurance Operations
On September 19, 2023, we announced that we had entered into an agreement with a third-party insurance company to sell substantially all of the assets and transfer certain liabilities of our insurance agency business for gross purchase price of $515.0 million, subject to customary post-closing working capital adjustments. Management made the decision to sell the insurance agency business to recognize the valuation premium of the business, while allowing us to focus on growth and strategic initiatives of our core banking business. The sale closed on October 31, 2023. The proceeds from the sale will primarily be used to pay down our short-term FHLB borrowings. Refer to Note 24, “Discontinued Operations” and Note 27, “Subsequent Events” within the Notes to the Consolidated Financial Statements included in Item 8 in this Current Report on Form 8-K for additional discussion.
Interest Rates
We believe that increases in the federal funds rate we expect to occur in the first half of 2023 will reduce our net interest income in 2023 as the increases in interest-bearing liability costs are anticipated to exceed the increase in yield on interest-earning assets. Beginning in March 2022, the FOMC voted to increase the federal funds rate multiple times from a range of 0.00% to 0.25% to a range of 4.50% to 4.75% on February 1, 2023, when the FOMC stated that it “anticipates that ongoing increases in the target range [for the federal funds rate] will be appropriate in order to attain a stance of monetary policy that is sufficiently restrictive to return inflation to 2 percent over time.”
Inevitably, not all of our interest rate-sensitive assets and liabilities will re-price simultaneously and in equal volume in response to changes in the federal funds rate, and therefore the potential for interest rate exposure exists. Management believes that several factors will affect the actual impact of interest rate changes on our balance sheet and operating results, including, but not limited to, actual changes in interest rates or expectations of future changes, the degree of volatility in the securities markets, inflation rates or expectations of inflation, and the slope of the interest rate yield curve.
We attempt to manage interest rate risk by identifying, quantifying, and, where appropriate, hedging our exposure. Approximately 34% of the outstanding principal balance of our loans as of December 31, 2022 was indexed to a market rate that is expected to reprice along with the federal funds rate. As rates have risen and the shape of the yield curve changed during the year ended December 31, 2022, a portion of these loans have been hedged using interest rate swaps to convert the floating rate interest receipts to a fixed rate. The notional amount of floating rate loans swapped totaled $2.4 billion as of December 31, 2022, representing approximately 18% of the outstanding principal balance of our loans at that date. For more detail regarding such hedging financial instruments, refer to Note 19, “Derivative Financial Instruments” within the Notes to the Consolidated Financial Statements included in Item 8 in this Current Report on Form 8-K. We anticipate that an increase in market interest rates, whether due to an increase in the federal funds rate or otherwise, will decrease the fair value of those interest rate swaps and consequently reduce the positive impact on our net interest income that an interest rate increase would otherwise have. Refer to the section titled “Management of Market Risk” within this Item 7 for additional discussion including the estimated change to our net interest income under interest rate risk measurement methodologies that use a variety of hypothetical scenarios assuming immediate and parallel changes in interest rates that may not reflect the manner in which actual yields and costs respond to changes in market interest rates.
Paycheck Protection Program Loans
We are a participating lender in the SBA’s Paycheck Protection Program, or PPP. We concluded PPP loan originations in the second quarter of 2021 as the SBA announced in May 2021 that PPP funds were exhausted. The majority of our PPP borrowers are existing commercial and small business borrowers, non-profit customers, retail banking customers and clients of our Eastern Wealth Management division and Eastern Insurance Group. As of December 31, 2022 and 2021, the remaining balance of our PPP loans was $9.8 million and $331.4 million, respectively. Net PPP loan fee accretion (fee accretion less cost amortization) for all PPP loans decreased by $25.3 million, or 73.8%, to $9.0 million for the year ended December 31, 2022 from $34.3 million for the year ended December 31, 2021. Our net interest margin was adversely affected as a result of the decline in net fee accretion, which is associated with the decreased volume of PPP loan payoffs. The impact to our net interest margin resulting from the decline in net PPP loan fee accretion during the year ended December 31, 2022 compared to the year ended December 31, 2021 was 0.25% (change computed based upon average total loans for the year ended December 31, 2021).
Non-GAAP Financial Measures
We present certain non-GAAP financial measures, which management uses to evaluate our performance, and which exclude the effects of certain transactions, non-cash items and GAAP adjustments that we believe are unrelated to our core business and are therefore not necessarily indicative of our current performance or financial position. Management believes excluding these items facilitates greater visibility for investors into our core businesses as well as underlying trends that may, to some extent, be obscured by inclusion of such items in the corresponding GAAP financial measures.
There are items in our financial statements that impact our results but which we believe are unrelated to our core business. Accordingly, we present operating net income, noninterest income on an operating basis, noninterest expense on an operating basis, total operating revenue, operating earnings per share, operating net income to average tangible shareholders’ equity, tangible book value per share, and the operating efficiency ratio, each of which excludes the impact of such items because we believe such exclusion can provide greater visibility into our core business and underlying trends. Such items that we do not consider to be core to our business include (i) income and expenses from investments held in rabbi trusts, (ii) gains and losses on sales of securities available for sale, net, (iii) gains and losses on the sale of other assets, (iv) rabbi trust employee benefits, (v) impairment charges on tax credit investments and associated tax credit benefits, (vi) expenses indirectly associated with our IPO, (vii) other real estate owned (“OREO”) gains, (viii) merger and acquisition expenses, (ix) the stock donation to the Eastern Bank Foundation (the “Foundation”) in connection with our mutual-to-stock conversion and IPO, (x) settlement of putative consumer class action litigation matters related to overdraft and non-sufficient fund fees, and associated settlement expenses, and (xi) the non-cash pension settlement charge recognized related to our Defined Benefit Plan. Except as otherwise indicated, the information presented within this section excludes discontinued operations. Refer to Note 24, “Discontinued Operations” within the Notes to the Audited Consolidated Financial Statements included in Part II, Item 8 in this Current Report on Form 8-K for further discussion regarding discontinued operations.
We also present tangible shareholders’ equity, tangible assets, the ratio of tangible shareholders’ equity to tangible assets, average tangible shareholders’ equity, the ratios of net income and operating net income to average tangible shareholders’ equity and tangible book value per share, each of which excludes the impact of goodwill and other intangible assets, as we believe these financial measures provide investors with the ability to further assess our performance, identify trends in our core business and provide a comparison of our capital adequacy to other companies. We have included the tangible ratios because management believes that investors may find it useful to have access to the same analytical tools used by management to assess performance and identify trends.
Our non-GAAP financial measures should not be considered as an alternative or substitute to GAAP net income from continuing operations, or as an indication of our cash flows from operating activities, a measure of our liquidity or an indication of funds available for our cash needs. An item which we consider to be non-core and exclude when computing these non-GAAP financial measures can be of substantial importance to our results for any particular period. In addition, our methodology for calculating non-GAAP financial measures may differ from the methodologies employed by other companies to calculate the same or similar performance measures and, accordingly, our reported non-GAAP financial measures may not be comparable to the same or similar performance measures reported by other companies.
The following table summarizes the impact of non-core items recorded for the time periods indicated below and reconciles them to the most directly comparable GAAP financial measure.
|
|
|
|
|
|
|
|
|
|
|
|
|
|
|
|
|
|
|
For the Year Ended December 31, |
|
2022 |
|
2021 |
|
2020 |
|
(Dollars in thousands, except per share data) |
| Net income from continuing operations (GAAP) |
$ |
186,511 |
|
|
$ |
145,531 |
|
|
$ |
8,861 |
|
| Non-GAAP adjustments: |
|
|
|
|
|
| Add: |
|
|
|
|
|
| Noninterest income components: |
|
|
|
|
|
| Losses (income) from investments held in rabbi trusts |
10,762 |
|
|
(10,217) |
|
|
(10,337) |
|
| Losses (gains) on sales of securities available for sale, net |
3,157 |
|
|
(1,166) |
|
|
(288) |
|
| (Gains) losses on sales of other assets |
(1,365) |
|
|
(26) |
|
|
136 |
|
| Noninterest expense components: |
|
|
|
|
|
| Rabbi trust employee benefit (income) expense |
(5,161) |
|
|
5,515 |
|
|
4,789 |
|
| Impairment (reversal) charge on tax credit investments |
— |
|
|
(170) |
|
|
10,779 |
|
| Indirect IPO costs (1) |
— |
|
|
— |
|
|
1,199 |
|
| Gain on sale of other real estate owned |
— |
|
|
(87) |
|
|
(606) |
|
| Merger and acquisition expenses (2) |
— |
|
|
35,456 |
|
|
— |
|
| Settlement and expenses for putative consumer class action matters |
— |
|
|
3,325 |
|
|
— |
|
| Defined Benefit Plan settlement loss (3) |
12,045 |
|
|
— |
|
|
— |
|
| Stock donation to the Eastern Bank Foundation |
— |
|
|
— |
|
|
91,287 |
|
| Total impact of non-GAAP adjustments |
19,438 |
|
|
32,630 |
|
|
96,959 |
|
Less net tax benefit associated with non-GAAP adjustment (4) |
6,047 |
|
|
21,021 |
|
|
17,544 |
|
| Non-GAAP adjustments, net of tax |
$ |
13,391 |
|
|
$ |
11,609 |
|
|
$ |
79,415 |
|
Operating net income (non-GAAP) |
$ |
199,902 |
|
|
$ |
157,140 |
|
|
$ |
88,276 |
|
|
|
|
|
|
|
| Weighted average common shares outstanding during the period: |
|
|
|
|
|
| Basic |
165,510,357 |
|
172,192,336 |
|
|
171,812,535 |
|
| Diluted |
165,648,571 |
|
172,252,057 |
|
|
171,812,535 |
|
|
|
|
|
|
|
| Earnings per share from continuing operations, basic |
$ |
1.13 |
|
|
$ |
0.85 |
|
|
$ |
0.05 |
|
| Earnings per share from continuing operations, diluted |
$ |
1.13 |
|
|
$ |
0.85 |
|
|
$ |
0.05 |
|
|
|
|
|
|
|
| Operating earnings per share, basic (non-GAAP) |
$ |
1.21 |
|
|
$ |
0.91 |
|
|
$ |
0.51 |
|
| Operating earnings per share, diluted (non-GAAP) |
$ |
1.21 |
|
|
$ |
0.91 |
|
|
$ |
0.51 |
|
(1)Reflects costs associated with the IPO that are indirectly related to the IPO and were not recorded as a reduction of capital.
(2)Comprised of merger and acquisition expenses incurred related to our acquisition of Century. Merger and acquisition expenses previously reported for the years ended December 31, 2022, 2021 and 2020 related to acquisitions by Eastern Insurance Group were excluded from the above table as they were reclassified to discontinued operations. Refer to Note 24, “Discontinued Operations” within the Notes to the Consolidated Financial Statements included in this Part II, Item 8 for additional discussion.
(3)Represents a non-cash settlement charge related to the Defined Benefit Plan. For additional information regarding this charge, refer to Note 17, “Employee Benefits” within the Notes to the Consolidated Financial Statements included in Item 8 in this Current Report on Form 8-K.
(4)The net tax benefit associated with these items is determined by assessing whether each item is included or excluded from net taxable income from continuing operations and applying our combined statutory tax rate only to those items included in net taxable income from continuing operations. The net tax benefit amount for the years ended December 31, 2022 and 2021 reflects the impact of the reversal of a $12.0 million valuation allowance associated with the stock donation to the Eastern Bank Foundation in the amounts of $0.7 million and $11.3 million, respectively. The reversal of the valuation allowance in each period was considered appropriate based upon our determination of the realizability of such deductions for tax purposes at that time.
The following table summarizes the impact of non-core items with respect to our total revenue, noninterest income, noninterest expense and the efficiency ratio, which reconciles to the most directly comparable respective GAAP financial measure, for the periods indicated:
|
|
|
|
|
|
|
|
|
|
|
|
|
|
|
|
|
|
|
|
|
|
|
|
|
|
|
|
|
|
|
For the Year Ended December 31, |
|
2022 |
|
2021 |
|
2020 |
|
2019 |
|
2018 |
|
(Dollars in thousands) |
| Net interest income (GAAP) |
$ |
568,054 |
|
|
$ |
429,827 |
|
|
$ |
401,251 |
|
|
$ |
411,264 |
|
|
$ |
390,044 |
|
| Add: |
|
|
|
|
|
|
|
|
|
| Tax-equivalent adjustment (non-GAAP)(2) |
12,736 |
|
|
6,093 |
|
|
5,472 |
|
|
5,254 |
|
|
5,696 |
|
| Fully-taxable equivalent net interest income (non-GAAP) |
580,790 |
|
|
435,920 |
|
|
406,723 |
|
|
416,518 |
|
|
395,740 |
|
| Noninterest income (GAAP) |
76,750 |
|
|
97,437 |
|
|
83,679 |
|
|
91,476 |
|
|
87,109 |
|
| Less: |
|
|
|
|
|
|
|
|
|
| (Losses) income from investments held in rabbi trusts |
(10,762) |
|
|
10,217 |
|
|
10,337 |
|
|
9,866 |
|
|
(1,542) |
|
| (Losses) gains on sales of securities available for sale, net |
(3,157) |
|
|
1,166 |
|
|
288 |
|
|
2,016 |
|
|
50 |
|
| Gains (losses) on sales of other assets |
1,365 |
|
|
26 |
|
|
(136) |
|
|
(131) |
|
|
625 |
|
| Noninterest income on an operating basis (non-GAAP) |
89,304 |
|
|
86,028 |
|
|
73,190 |
|
|
79,725 |
|
|
87,976 |
|
| Noninterest expense (GAAP) |
$ |
388,649 |
|
|
$ |
360,955 |
|
|
$ |
429,491 |
|
|
$ |
336,412 |
|
|
$ |
324,240 |
|
| Less: |
|
|
|
|
|
|
|
|
|
| Rabbi trust employee benefit (income) expense |
(5,161) |
|
|
5,515 |
|
|
4,789 |
|
|
4,604 |
|
|
(847) |
|
| Impairment (reversal) charge on tax credit investments |
— |
|
|
(170) |
|
|
10,779 |
|
|
— |
|
|
— |
|
| Indirect IPO costs (1) |
— |
|
|
— |
|
|
1,199 |
|
|
— |
|
|
— |
|
| Merger and acquisition expenses (3) |
— |
|
|
35,456 |
|
|
— |
|
|
— |
|
|
— |
|
| Settlement and expenses for putative consumer class action matters |
— |
|
|
3,325 |
|
|
— |
|
|
— |
|
|
— |
|
| Defined Benefit Plan settlement loss |
12,045 |
|
|
— |
|
|
— |
|
|
— |
|
|
— |
|
| Stock donation to the Eastern Bank Foundation |
— |
|
|
— |
|
|
91,287 |
|
|
— |
|
|
— |
|
| Plus: |
|
|
|
|
|
|
|
|
|
| Gain on sale of other real estate owned |
— |
|
|
87 |
|
|
606 |
|
|
— |
|
|
— |
|
| Noninterest expense on an operating basis (non-GAAP) |
$ |
381,765 |
|
|
$ |
316,916 |
|
|
$ |
322,043 |
|
|
$ |
331,808 |
|
|
$ |
325,087 |
|
| Total revenue (GAAP) |
$ |
644,804 |
|
|
$ |
527,264 |
|
|
$ |
484,930 |
|
|
$ |
502,740 |
|
|
$ |
477,153 |
|
| Total operating revenue (non-GAAP) |
$ |
670,094 |
|
|
$ |
521,948 |
|
|
$ |
479,913 |
|
|
$ |
496,243 |
|
|
$ |
483,716 |
|
| Ratios |
|
|
|
|
|
|
|
|
|
| Efficiency ratio (GAAP) |
60.27 |
% |
|
68.46 |
% |
|
88.57 |
% |
|
66.92 |
% |
|
67.95 |
% |
| Operating efficiency ratio (non-GAAP) |
56.97 |
% |
|
60.72 |
% |
|
67.10 |
% |
|
66.86 |
% |
|
67.21 |
% |
(1)Reflects costs associated with the IPO that are indirectly related to the IPO and were not recorded as a reduction of capital.
(2)Interest income on tax-exempt loans and investment securities has been adjusted to an FTE basis using a marginal tax rate of 21.6% for the year ended December 31, 2022, 21.0% for the year ended December 31, 2021, 21.8% for the year ended December 31, 2020, 21.8% for the year ended December 31, 2019, and 21.7% for the year ended December 31, 2018.
(3)Comprised of merger and acquisition expenses incurred related to our acquisition of Century. Merger and acquisition expenses previously reported for the years ended December 31, 2022, 2021, 2020 and 2018 related to acquisitions by Eastern Insurance Group were excluded from the above table as they were reclassified to discontinued operations. Refer
to Note 24, “Discontinued Operations” within the Notes to the Consolidated Financial Statements included in this Part II, Item 8 for additional discussion.
The following table summarizes the calculation of our tangible shareholders’ equity, tangible assets, the ratio of tangible shareholders’ equity to tangible assets, and tangible book value per share, which reconciles to the most directly comparable respective GAAP measure, as of the dates indicated:
|
|
|
|
|
|
|
|
|
|
|
|
|
|
|
|
|
|
|
|
|
|
|
|
|
|
|
|
|
|
|
As of December 31, |
|
2022 |
|
2021 |
|
2020 |
|
2019 |
|
2018 |
|
(Dollars in thousands, except per share data) |
| Tangible shareholders’ equity: |
|
|
|
|
|
|
|
|
|
| Total shareholders’ equity (GAAP) |
$ |
2,471,790 |
|
|
$ |
3,406,352 |
|
|
$ |
3,428,052 |
|
|
$ |
1,600,153 |
|
|
$ |
1,433,141 |
|
| Less: Goodwill and other intangibles (1) |
661,126 |
|
|
649,703 |
|
|
376,534 |
|
|
377,734 |
|
|
381,276 |
|
| Tangible shareholders’ equity (non-GAAP) |
1,810,664 |
|
|
2,756,649 |
|
|
3,051,518 |
|
|
1,222,419 |
|
|
1,051,865 |
|
| Tangible assets: |
|
|
|
|
|
|
|
|
|
| Total assets (GAAP) |
22,646,858 |
|
|
23,512,128 |
|
|
15,964,190 |
|
|
11,628,775 |
|
|
11,372,287 |
|
| Less: Goodwill and other intangibles |
661,126 |
|
|
649,703 |
|
|
376,534 |
|
|
377,734 |
|
|
381,276 |
|
| Tangible assets (non-GAAP) |
$ |
21,985,732 |
|
|
$ |
22,862,425 |
|
|
$ |
15,587,656 |
|
|
$ |
11,251,041 |
|
|
$ |
10,991,011 |
|
| Shareholders’ equity to assets ratio (GAAP) |
10.9 |
% |
|
14.5 |
% |
|
21.5 |
% |
|
13.8 |
% |
|
12.6 |
% |
| Tangible shareholders’ equity to tangible assets ratio (non-GAAP) |
8.2 |
% |
|
12.1 |
% |
|
19.6 |
% |
|
10.9 |
% |
|
9.6 |
% |
| Book value per share: |
|
|
|
|
|
|
|
|
|
| Common shares issued and outstanding |
176,172,073 |
|
|
186,305,332 |
|
|
186,758,154 |
|
|
— |
|
|
— |
|
| Book value per share (GAAP) |
$ |
14.03 |
|
|
$ |
18.28 |
|
|
$ |
18.36 |
|
|
$ |
— |
|
|
$ |
— |
|
| Tangible book value per share (non-GAAP) |
$ |
10.28 |
|
|
$ |
14.80 |
|
|
$ |
16.34 |
|
|
$ |
— |
|
|
$ |
— |
|
(1)Includes goodwill and other intangibles included in assets of discontinued operations within the Company's Consolidated Balance Sheets.
The following table summarizes the calculation of our average tangible shareholders’ equity and ratio of net income from continuing operations and operating net income to average tangible shareholders’ equity (“operating return on average tangible shareholders’ equity”), which reconciles to the most directly comparable GAAP measure, for the periods indicated:
|
|
|
|
|
|
|
|
|
|
|
|
|
|
|
|
|
|
|
|
|
|
|
|
|
|
|
|
|
|
|
As of December 31, |
|
2022 |
|
2021 |
|
2020 |
|
2019 |
|
2018 |
|
(Dollars in thousands) |
| Net income from continuing operations (GAAP) |
$ |
186,511 |
|
|
$ |
145,531 |
|
|
$ |
8,861 |
|
|
$ |
124,736 |
|
|
$ |
108,337 |
|
| Operating net income (non-GAAP) (1) |
199,902 |
|
|
157,140 |
|
|
88,276 |
|
|
119,450 |
|
|
108,526 |
|
| Average tangible shareholders’ equity: |
|
|
|
|
|
|
|
|
|
| Average total shareholders’ equity (GAAP) |
$ |
2,831,533 |
|
|
$ |
3,424,570 |
|
|
$ |
2,040,156 |
|
|
$ |
1,543,191 |
|
|
$ |
1,360,562 |
|
| Less: Average goodwill and other intangibles (2) |
655,653 |
|
|
414,441 |
|
|
376,706 |
|
|
379,615 |
|
|
380,304 |
|
| Average tangible shareholders’ equity (non-GAAP) |
$ |
2,175,880 |
|
|
$ |
3,010,129 |
|
|
$ |
1,663,450 |
|
|
$ |
1,163,576 |
|
|
$ |
980,258 |
|
| Ratios: |
|
|
|
|
|
|
|
|
|
| Return on average total shareholders’ equity (GAAP) |
6.59 |
% |
|
4.25 |
% |
|
0.43 |
% |
|
8.08 |
% |
|
7.96 |
% |
| Return on average tangible shareholders’ equity (non-GAAP) |
8.57 |
% |
|
4.83 |
% |
|
0.53 |
% |
|
10.72 |
% |
|
11.05 |
% |
| Operating return on average tangible shareholders’ equity (non-GAAP) |
9.19 |
% |
|
5.22 |
% |
|
5.31 |
% |
|
10.27 |
% |
|
11.07 |
% |
(1)Refer to the table above within this “Non-GAAP Financial Measures” section for a reconciliation of operating net income to net income from continuing operations.
(2)Includes goodwill and other intangibles included in assets of discontinued operations within the Company’s Consolidated Balance Sheets.
Financial Position
The information presented within this section excludes discontinued operations. Refer to Note 24, “Discontinued Operations” within the Notes to the Consolidated Financial Statements included in Item 8 in this Current Report on Form 8-K for further discussion regarding discontinued operations.
Summary of Financial Position
|
|
|
|
|
|
|
|
|
|
|
|
|
|
|
|
|
|
|
|
|
|
|
|
|
As of December 31, |
|
Change |
|
2022 |
|
2021 |
Amount ($) |
|
Percentage (%) |
|
|
|
(Dollars in thousands) |
|
|
| Cash and cash equivalents |
$ |
169,505 |
|
|
$ |
1,231,792 |
|
|
$ |
(1,062,287) |
|
|
(86.2) |
% |
| Securities available for sale |
6,690,778 |
|
|
8,511,224 |
|
|
(1,820,446) |
|
|
(21.4) |
% |
| Securities held to maturity |
476,647 |
|
|
— |
|
|
476,647 |
|
|
100.0 |
% |
| Loans, net of allowance for loan losses |
13,420,317 |
|
|
12,157,281 |
|
|
1,263,036 |
|
|
10.4 |
% |
| Federal Home Loan Bank stock |
41,363 |
|
|
10,904 |
|
|
30,459 |
|
|
279.3 |
% |
| Goodwill and other intangible assets |
568,009 |
|
|
569,207 |
|
|
(1,198) |
|
|
(0.2) |
% |
| Deposits |
18,974,359 |
|
|
19,628,311 |
|
|
(653,952) |
|
|
(3.3) |
% |
| Borrowed funds |
740,828 |
|
|
34,278 |
|
|
706,550 |
|
|
2,061.2 |
% |
Cash and cash equivalents
Total cash and cash equivalents decreased by $1.1 billion, or 86.2%, to $169.5 million at December 31, 2022 from $1.2 billion at December 31, 2021. This decrease was primarily due to an increase in gross loans of $1.3 billion, a decrease in total customer deposits of $654.0 million, net of purchases of brokered certificates of deposit, and share repurchases of $201.6 million. These items were partially offset by net cash inflows related to increased borrowed funds of $706.6 million and net cash inflows related to AFS and HTM securities of $263.7 million during the year ended December 31, 2022. For further discussion of the change in deposits, refer to the later “Deposits” section in this Item 7. For further discussion of the change in loans, refer to the later “Loans” section in this Item 7. For more information regarding our share repurchase programs, refer to Note 15, “Shareholders’ Equity” within the Notes to the Consolidated Financial Statements included in Part II, Item 8 in this Current Report on Form 8-K. For further discussion of the change in securities, refer to the later “Securities” section in this Item 7. For further discussion of the change in borrowed funds, refer to the later “Borrowed Funds” section in this Item 7.
Securities
Our current investment policy authorizes us to invest in various types of investment securities and liquid assets, including U.S. Treasury obligations, securities of government-sponsored enterprises, mortgage-backed securities, collateralized mortgage obligations, corporate notes, asset-backed securities and municipal securities. The Risk Management Committee of our Board of Directors is responsible for approving and overseeing our investment policy, which it reviews at least annually. This policy dictates that investment decisions be made based on the safety of the investment, liquidity requirements, potential returns and market risk considerations. We do not engage in any investment hedging activities or trading activities, nor do we purchase any high-risk investment products. We typically invest in the following types of securities:
U.S. government securities: At December 31, 2022 our U.S. government securities consisted of U.S. Agency bonds and U.S. Treasury securities. At December 31, 2021, our U.S. government securities consisted of U.S. Agency bonds, U.S. Treasury securities and Small Business Administration pooled securities. We maintain these investments, to the extent appropriate, for liquidity purposes, at zero risk weighting for capital purposes, and as collateral for interest rate derivative positions. U.S. Agency bonds include securities issued by Fannie Mae, Freddie Mac, the FHLB, and the Federal Farm Credit Bureau.
Mortgage-backed securities: We invest in residential and commercial mortgage-backed securities insured or guaranteed by Freddie Mac, Ginnie Mae or Fannie Mae, including collateralized mortgage obligations. We have not purchased any privately-issued mortgage-backed securities. We invest in mortgage-backed securities to achieve a positive interest rate spread with minimal administrative expense, and to lower our credit risk as a result of the guarantees provided by Freddie Mac, Ginnie Mae or Fannie Mae.
Investments in residential mortgage-backed securities involve a risk that actual payments will be greater or less than the prepayment rate estimated at the time of purchase, which may require adjustments to the amortization of any premium or accretion of any discount relating to such interests, thereby affecting the net yield on our securities. We periodically review current prepayment speeds to determine whether prepayment estimates require modification that could cause amortization or accretion adjustments. There is also reinvestment risk associated with the cash flows from such securities. In addition, the market value of such securities may be adversely affected by changes in interest rates.
State and municipal securities: We invest in fixed rate investment grade bonds issued primarily by municipalities in our local communities within Massachusetts and by the Commonwealth of Massachusetts. The market value of these securities may be affected by call options, long dated maturities, general market liquidity and credit factors.
The following table shows the fair value of our securities by investment category as of the dates indicated:
Securities Portfolio Composition
|
|
|
|
|
|
|
|
|
|
|
|
|
As of December 31, |
|
2022 |
|
2021 |
|
(In thousands) |
| Available for sale securities, at fair value: |
|
|
|
| Government-sponsored residential mortgage-backed securities |
$ |
4,111,908 |
|
|
$ |
5,524,708 |
|
| Government-sponsored commercial mortgage-backed securities |
1,348,954 |
|
|
1,408,868 |
|
| U.S. Agency bonds |
952,482 |
|
|
1,175,014 |
|
| U.S. Treasury securities |
93,057 |
|
|
88,605 |
|
| State and municipal bonds and obligations |
183,092 |
|
|
280,329 |
|
| Small business administration pooled securities |
— |
|
|
32,103 |
|
| Other debt securities |
1,285 |
|
|
1,597 |
|
| Total available for sale securities, at fair value |
6,690,778 |
|
|
8,511,224 |
|
| Held to maturity securities, at amortized cost: |
|
|
|
| Government-sponsored residential mortgage-backed securities |
276,493 |
|
|
— |
|
| Government-sponsored commercial mortgage-backed securities |
200,154 |
|
|
— |
|
| Total held to maturity securities, at amortized cost |
476,647 |
|
|
— |
|
| Total |
$ |
7,167,425 |
|
|
$ |
8,511,224 |
|
Our securities portfolio has decreased $1.3 billion, or 15.8%, to $7.2 billion at December 31, 2022 from $8.5 billion at December 31, 2021. This decrease was primarily due to a decrease in the fair value of AFS securities, sales of AFS securities, and maturities and principal paydowns of our AFS and held to maturity (“HTM”) securities. Partially offsetting this activity were AFS and HTM security purchases during the year ended December 31, 2022:
•At December 31, 2022, the unrealized loss on AFS securities was $1.1 billion compared to an unrealized loss of $0.1 billion at December 31, 2021, representing a $1.1 billion decrease in the fair value of such securities. The change from December 31, 2021 to December 31, 2022 is primarily driven by rising market rates of interest.
•AFS securities sales totaled $431.2 million during the year ended December 31, 2022. AFS and HTM security maturities and principal paydowns totaled $1.0 billion and $17.4 million, respectively, during the year ended December 31, 2022.
•Partially offsetting the decrease in the securities portfolio from December 31, 2021 to December 31, 2022 were purchases of AFS and HTM securities of $740.8 million and $493.7 million, respectively, during the year ended December 31, 2022.
We did not have trading investments at December 31, 2022 and 2021.
A portion of our securities portfolio continues to be tax-exempt. Investments in federally tax-exempt securities totaled $182.9 million at December 31, 2022 compared to $279.8 million at December 31, 2021.
Our AFS securities are carried at fair value and are categorized within the fair value hierarchy based on the observability of model inputs. Securities which require inputs that are both significant to the fair value measurement and unobservable are classified as Level 3 within the fair value hierarchy. As of both December 31, 2022 and 2021, we had no securities categorized as Level 3 within the fair value hierarchy.
Maturities of our securities portfolio are based on the final contractual payment dates, and do not reflect the effect of scheduled principal repayments, prepayments, or early redemptions that may occur.
The following tables show contractual maturities of our AFS and HTM securities and weighted average yields at and for the period ended December 31, 2022 and contractual maturities of our AFS securities and weighted average yields at and for the period ended December 31, 2021. Weighted average yields in the tables below have been calculated based on the amortized cost of the security:
Securities Portfolio, Weighted-Average Yield
|
|
|
|
|
|
|
|
|
|
|
|
|
|
|
|
|
|
|
|
|
|
|
|
|
|
|
|
|
|
|
Securities Maturing as of December 31, 2022 (1) |
|
Within One
Year |
|
After One Year But Within Five Years |
|
After Five Years But Within Ten Years |
|
After Ten
Years |
|
Total |
| Available for sale securities: |
|
|
|
|
|
|
|
|
|
| Government-sponsored residential mortgage-backed securities |
— |
% |
|
2.27 |
% |
|
1.00 |
% |
|
1.53 |
% |
|
1.45 |
% |
| Government-sponsored commercial mortgage-backed securities |
— |
|
|
1.29 |
|
|
1.51 |
|
|
1.94 |
|
|
1.68 |
|
| U.S. Agency bonds |
— |
|
|
0.79 |
|
|
0.97 |
|
|
— |
|
|
0.82 |
|
| U.S. Treasury securities |
— |
|
|
1.97 |
|
|
— |
|
|
— |
|
|
1.97 |
|
| State and municipal bonds and obligations |
1.22 |
|
|
2.26 |
|
|
3.17 |
|
|
4.05 |
|
|
3.66 |
|
| Other debt securities |
0.84 |
|
|
— |
|
|
— |
|
|
— |
|
|
0.84 |
|
| Total available for sale securities |
0.89 |
|
|
1.02 |
|
|
1.25 |
|
|
1.66 |
|
|
1.47 |
|
| Held to maturity securities: |
|
|
|
|
|
|
|
|
|
| Government-sponsored residential mortgage-backed securities |
— |
|
|
— |
|
|
— |
|
|
2.86 |
|
|
2.86 |
|
| Government-sponsored commercial mortgage-backed securities |
— |
|
|
— |
|
|
2.23 |
|
|
— |
|
|
2.23 |
|
| Total held to maturity securities |
— |
|
|
— |
|
|
2.23 |
|
|
2.86 |
|
|
2.59 |
|
| Total |
0.89 |
% |
|
1.02 |
% |
|
1.36 |
% |
|
1.72 |
% |
|
1.54 |
% |
|
|
|
|
|
|
|
|
|
|
|
|
|
|
|
|
|
|
|
|
|
|
|
|
|
|
|
|
|
|
|
Securities Maturing as of December 31, 2021 (1) |
|
Within One
Year |
|
After One Year But Within Five Years |
|
After Five Years But Within Ten Years |
|
After Ten
Years |
|
Total |
| Available for sale securities: |
|
|
|
|
|
|
|
|
|
| Government-sponsored residential mortgage-backed securities |
— |
% |
|
2.64 |
% |
|
1.01 |
% |
|
1.44 |
% |
|
1.38 |
% |
| Government-sponsored commercial mortgage-backed securities |
— |
|
|
1.14 |
|
|
1.20 |
|
|
1.95 |
|
|
1.67 |
|
| U.S. Agency bonds |
1.11 |
|
|
0.73 |
|
|
1.00 |
|
|
— |
|
|
0.88 |
|
| U.S. Treasury securities |
0.15 |
|
|
0.78 |
|
|
— |
|
|
— |
|
|
0.50 |
|
| State and municipal bonds and obligations (2) |
(1.24) |
|
|
2.46 |
|
|
3.17 |
|
|
4.04 |
|
|
3.48 |
|
| Small business administration pooled securities |
— |
|
|
1.72 |
|
|
— |
|
|
1.93 |
|
|
1.90 |
|
| Other debt securities |
1.01 |
|
|
0.84 |
|
|
— |
|
|
— |
|
|
0.87 |
|
| Total |
0.10 |
% |
|
0.95 |
% |
|
1.12 |
% |
|
1.60 |
% |
|
1.42 |
% |
(1)Investment security weighted-average yields were calculated on a level-yield basis by weighting the tax equivalent yield for each security type by the book value of each maturity.
(2)The negative yield indicated in the “Within One Year” category is the result of premium amortization that is in excess of earned income.
The yield on tax-exempt obligations of states and political subdivisions has been adjusted to a FTE basis by adjusting tax-exempt income upward by an amount equivalent to the prevailing federal income taxes that would have been paid if the income had been fully taxable.
Loans
The following table shows the composition of our loan portfolio, by category, as of the dates indicated and net PPP loan activity for the year ended December 31, 2022:
|
|
|
|
|
|
|
|
|
|
|
|
|
|
|
|
|
|
|
|
|
|
|
|
|
|
|
|
|
|
|
|
|
|
|
|
|
As of December 31, |
|
|
|
|
|
Change (excluding net PPP loan activity) |
|
2022 |
|
2021 |
|
Change ($) |
PPP Loan Activity, net |
|
Change ($) |
|
Percentage (%) |
|
(Dollars in thousands) |
| Commercial and industrial |
$ |
3,150,946 |
|
|
$ |
2,960,527 |
|
|
$ |
190,419 |
|
|
$ |
(109,213) |
|
|
$ |
299,632 |
|
|
10.1 |
% |
| Commercial real estate |
5,155,323 |
|
|
4,522,513 |
|
|
632,810 |
|
|
— |
|
|
632,810 |
|
|
14.0 |
% |
| Commercial construction |
336,276 |
|
|
222,328 |
|
|
113,948 |
|
|
— |
|
|
113,948 |
|
|
51.3 |
% |
| Business banking |
1,090,492 |
|
|
1,334,694 |
|
|
(244,202) |
|
|
(212,331) |
|
|
(31,871) |
|
|
(2.4) |
% |
| Residential real estate |
2,460,849 |
|
|
1,926,810 |
|
|
534,039 |
|
|
— |
|
|
534,039 |
|
|
27.7 |
% |
| Consumer home equity |
1,187,547 |
|
|
1,100,153 |
|
|
87,394 |
|
|
— |
|
|
87,394 |
|
|
7.9 |
% |
| Other consumer |
194,098 |
|
|
214,485 |
|
|
(20,387) |
|
|
— |
|
|
(20,387) |
|
|
(9.5) |
% |
| Total gross loans (1) |
$ |
13,575,531 |
|
|
$ |
12,281,510 |
|
|
$ |
1,294,021 |
|
|
$ |
(321,544) |
|
|
$ |
1,615,565 |
|
|
13.2 |
% |
(1)Amounts presented exclude unamortized premiums, unearned discounts and deferred fees and costs.
We consider our loan portfolio to be relatively diversified by borrower and industry. Our loans increased $1.3 billion, or 10.5%, to $13.6 billion at December 31, 2022 from $12.3 billion at December 31, 2021. The increase as of December 31, 2022 was primarily due to increases in our commercial real estate, residential real estate, and commercial and industrial portfolio balances, partially offset by a decrease in our business banking portfolio, as further noted below:
•Our commercial real estate portfolio increased by $632.8 million from December 31, 2021 to December 31, 2022 which was primarily attributable to an increase of $622.0 million in commercial real estate investment loan balances. Such loans represent loans secured by commercial real estate that are non-owner-occupied. The increase in such loan balances was primarily due to management’s active focus on originating loans collateralized by industrial/warehouse and multi-family property types, which are included in the commercial real estate investment loan category, due to management’s stable outlook as it relates to the credit performance of such loans.
•Our residential real estate portfolio increased by 534.0 million from December 31, 2021 to December 31, 2022 primarily due to the purchase of $380.2 million residential real estate loans from a third party during the year ended December 31, 2022. Also contributing to the overall increase in the balance of our residential real estate loans was a reduction in the volume of loan sales, which was precipitated by rising market rates of interest, and led to us retaining more of our residential real estate mortgage loan originations.
•Our commercial and industrial portfolio, excluding PPP loan balances, increased by $299.6 million, which was primarily attributable to an increase of $291.7 million in commercial and industrial participation loans during the year ended December 31, 2022. The majority of the increase in participation loans was in our SNC portfolio, which increased $205.0 million during the year ended December 31, 2022. The increase in such loan balances was primarily due to management’s active focus in increasing our exposures related to such arrangements due to strong historical credit performance and management’s stable outlook as it relates to the future credit performance of such loans. Partially offsetting this increase was a $109.2 million decrease in commercial and industrial PPP loan balances during the year ended December 31, 2022 as such loans were paid off or forgiven by the SBA resulting in a net portfolio increase of $190.4 million.
•Our business banking portfolio decreased by $244.2 million primarily as a result of a $212.4 million decrease in business banking PPP loan balances during the year ended December 31, 2022 as such loans were paid off or forgiven by the SBA.
We believe that our commercial loan portfolio composition is relatively diversified in terms of industry sectors, property types and various lending specialties. As of December 31, 2022, the amortized cost balances of concentrations in our commercial loan portfolios were as follows:
|
|
|
|
|
|
|
|
|
|
|
|
|
Commercial and Industrial |
|
Balance |
|
Percentage (%) |
|
(Dollars in thousands) |
| Educational services |
$ |
773,680 |
|
|
24.7 |
% |
| Professional, scientific, and technical services |
324,681 |
|
|
10.4 |
% |
| Finance and insurance |
303,024 |
|
|
9.7 |
% |
| Wholesale trade |
278,944 |
|
|
8.9 |
% |
| Accomodation |
199,353 |
|
|
6.4 |
% |
| Healthcare |
197,684 |
|
|
6.3 |
% |
| Transportation |
185,925 |
|
|
5.9 |
% |
| Manufacturing |
176,993 |
|
|
5.7 |
% |
| Admin support |
159,967 |
|
|
5.1 |
% |
| Real estate |
113,947 |
|
|
3.6 |
% |
| Other industries |
418,330 |
|
|
13.3 |
% |
| Total portfolio |
$ |
3,132,528 |
|
|
100.0 |
% |
|
|
|
|
|
|
|
|
|
|
|
|
|
Commercial Real Estate |
|
Balance |
|
Percentage (%) |
|
(Dollars in thousands) |
| Multi-family |
$ |
1,212,944 |
|
|
23.5 |
% |
| Industrial/warehouse |
546,660 |
|
|
10.6 |
% |
| Retail |
509,651 |
|
|
9.9 |
% |
| Office |
441,910 |
|
|
8.6 |
% |
| Mixed use - retail/office |
428,650 |
|
|
8.3 |
% |
| Mixed use - retail/multi-family |
357,127 |
|
|
6.9 |
% |
| School |
351,581 |
|
|
6.8 |
% |
| Affordable housing |
319,681 |
|
|
6.2 |
% |
| Self storage |
186,253 |
|
|
3.6 |
% |
| Other property types |
796,906 |
|
|
15.6 |
% |
| Total portfolio |
$ |
5,151,363 |
|
|
100.0 |
% |
|
|
|
|
|
|
|
|
|
|
|
|
|
Commercial Construction |
|
Balance |
|
Percentage (%) |
|
(Dollars in thousands) |
| Affordable housing |
$ |
85,802 |
|
|
25.7 |
% |
| Multi-family |
82,875 |
|
|
24.8 |
% |
| Industrial/warehouse |
54,772 |
|
|
16.4 |
% |
| Mixed use - retail/multi-family |
26,150 |
|
|
7.8 |
% |
| For sale housing |
20,646 |
|
|
6.2 |
% |
| Assisted living |
14,767 |
|
|
4.4 |
% |
| Office |
10,255 |
|
|
3.1 |
% |
| Retail |
9,082 |
|
|
2.7 |
% |
| 1-4 family |
7,575 |
|
|
2.3 |
% |
| Service station |
6,375 |
|
|
1.9 |
% |
| Other property types |
15,960 |
|
|
4.7 |
% |
| Total portfolio |
$ |
334,259 |
|
|
100.0 |
% |
We believe that the loan to value ratio (“LTV”) is an important factor in monitoring the risk characteristics of our loans secured by real estate. The following tables show the distribution of loan balances, on an amortized cost basis, by LTV and year of origination for each of our portfolios of loans, including those acquired from Century, secured by real estate as of December 31, 2022:
|
|
|
|
|
|
|
|
|
|
|
|
|
|
|
|
|
|
|
|
|
|
|
|
|
|
|
|
|
|
|
|
|
|
|
|
|
|
|
|
Balance of Commercial Real Estate Loans Originated During the Year Ended December 31, |
|
|
2022 |
|
2021 |
|
2020 |
|
2019 |
|
2018 |
|
2017 and Prior |
Total |
| Current LTV (1) |
(Dollars in thousands) |
| Not available (2) |
$ |
26,231 |
|
|
$ |
34,682 |
|
|
$ |
3,594 |
|
|
$ |
33,701 |
|
|
$ |
16,111 |
|
|
$ |
83,179 |
|
$ |
197,498 |
|
| 50.00% or lower |
528,843 |
|
|
208,311 |
|
|
259,368 |
|
|
166,600 |
|
|
162,811 |
|
|
517,976 |
|
1,843,909 |
|
| 50.01% - 69.99% |
646,235 |
|
|
417,407 |
|
|
226,378 |
|
|
349,793 |
|
|
283,041 |
|
|
372,933 |
|
2,295,787 |
|
| 70.00% - 79.99% |
230,141 |
|
|
162,053 |
|
|
89,088 |
|
|
58,293 |
|
|
39,787 |
|
|
41,458 |
|
620,820 |
|
| 80.00% - 89.99% (3) |
52,027 |
|
|
13,068 |
|
|
— |
|
|
2,426 |
|
|
1,424 |
|
|
1,157 |
|
70,102 |
|
| 90.00% or higher |
61,449 |
|
|
6,370 |
|
|
14,327 |
|
|
— |
|
|
— |
|
|
41,101 |
|
123,247 |
|
| Total |
$ |
1,544,926 |
|
|
$ |
841,891 |
|
|
$ |
592,755 |
|
|
$ |
610,813 |
|
|
$ |
503,174 |
|
|
$ |
1,057,804 |
|
$ |
5,151,363 |
|
| Average LTV |
58.74 |
% |
|
57.08 |
% |
|
51.72 |
% |
|
52.68 |
% |
|
53.91 |
% |
|
45.03 |
% |
53.79 |
% |
|
|
|
|
|
|
|
|
|
|
|
|
|
|
|
|
|
|
|
|
|
|
|
|
|
|
|
|
|
|
|
|
|
|
|
|
|
|
|
|
|
|
|
Balance of Residential Real Estate Loans Originated During the Year Ended December 31, |
|
|
|
2022 |
|
2021 |
|
2020 |
|
2019 |
|
2018 |
|
2017 and Prior |
|
Total |
| Current LTV (1) |
(Dollars in thousands) |
| Not available (2) |
$ |
2,926 |
|
|
$ |
118 |
|
|
$ |
893 |
|
|
$ |
— |
|
|
$ |
— |
|
|
$ |
13,638 |
|
|
$ |
17,575 |
|
| 50.00% or lower |
65,099 |
|
|
172,890 |
|
|
81,685 |
|
|
26,678 |
|
|
21,196 |
|
|
159,541 |
|
|
527,089 |
|
| 50.01% - 69.99% |
110,503 |
|
|
259,847 |
|
|
148,747 |
|
|
30,546 |
|
|
21,890 |
|
|
164,443 |
|
|
735,976 |
|
| 70.00% - 79.99% |
271,503 |
|
|
169,608 |
|
|
100,406 |
|
|
29,310 |
|
|
13,531 |
|
|
75,190 |
|
|
659,548 |
|
| 80.00% - 89.99% |
233,927 |
|
|
59,104 |
|
|
33,932 |
|
|
9,832 |
|
|
12,917 |
|
|
37,755 |
|
|
387,467 |
|
| 90.00% or higher |
82,136 |
|
|
40,862 |
|
|
17,988 |
|
|
7,381 |
|
|
1,134 |
|
|
2,899 |
|
|
152,400 |
|
| Total |
$ |
766,094 |
|
|
$ |
702,429 |
|
|
$ |
383,651 |
|
|
$ |
103,747 |
|
|
$ |
70,668 |
|
|
$ |
453,466 |
|
|
$ |
2,480,055 |
|
| Average LTV |
76.11 |
% |
|
62.43 |
% |
|
63.02 |
% |
|
63.03 |
% |
|
60.32 |
% |
|
55.58 |
% |
|
65.46 |
% |
|
|
|
|
|
|
|
|
|
|
|
|
|
|
|
|
|
|
|
|
|
|
|
|
|
|
|
|
|
|
|
|
|
|
|
|
|
|
|
|
|
|
|
Balance of Consumer Home Equity Loans Originated During the Year Ended December 31, |
|
|
|
2022 |
|
2021 |
|
2020 |
|
2019 |
|
2018 |
|
2017 and Prior |
|
Total |
| Current LTV (1) |
(Dollars in thousands) |
| Not available (2) |
$ |
275,299 |
|
|
$ |
208,698 |
|
|
$ |
25,507 |
|
|
$ |
37,073 |
|
|
$ |
30,187 |
|
|
$ |
211,075 |
|
|
$ |
787,839 |
|
| 50.00% or lower |
4,395 |
|
|
569 |
|
|
29,419 |
|
|
24,721 |
|
|
26,031 |
|
|
34,509 |
|
|
119,644 |
|
| 50.01% - 69.99% |
6,905 |
|
|
797 |
|
|
35,253 |
|
|
23,826 |
|
|
20,586 |
|
|
37,167 |
|
|
124,534 |
|
| 70.00% - 79.99% |
5,133 |
|
|
587 |
|
|
14,580 |
|
|
27,194 |
|
|
20,771 |
|
|
36,918 |
|
|
105,183 |
|
| 80.00% - 89.99% |
2,909 |
|
|
762 |
|
|
6,204 |
|
|
12,594 |
|
|
8,490 |
|
|
22,628 |
|
|
53,587 |
|
| 90.00% or higher |
— |
|
|
— |
|
|
— |
|
|
— |
|
|
— |
|
|
520 |
|
|
520 |
|
| Total |
$ |
294,641 |
|
|
$ |
211,413 |
|
|
$ |
110,963 |
|
|
$ |
125,408 |
|
|
$ |
106,065 |
|
|
$ |
342,817 |
|
|
$ |
1,191,307 |
|
| Average LTV |
61.32 |
% |
|
63.28 |
% |
|
55.56 |
% |
|
60.65 |
% |
|
57.99 |
% |
|
61.96 |
% |
|
59.55 |
% |
(1)Current LTV is calculated based upon exposure amount and the most recently available appraisal value as of the reporting period.
(2)Insufficient data available to calculate LTV.
(3)We generally require an LTV of 80% or less on new CRE loan originations. Certain CRE loans with LTVs greater than 80% may have additional collateral pledged which is not included in the computation of the amounts stated.
The maturity distribution of our loan portfolio is one factor used by management to evaluate the risk characteristics of our loan portfolio. The following table shows the maturity distribution of our loans, on a gross basis, as of December 31, 2022:
Scheduled Contractual Loan Maturity
|
|
|
|
|
|
|
|
|
|
|
|
|
|
|
|
|
|
|
|
|
|
|
|
|
|
|
|
|
|
|
One Year or Less (1) |
|
One to Five Years |
|
Five to Fifteen Years |
|
After Fifteen Years |
|
Total |
|
(In thousands) |
| Commercial and industrial |
$ |
324,458 |
|
|
$ |
1,195,402 |
|
|
$ |
672,359 |
|
|
$ |
958,727 |
|
|
$ |
3,150,946 |
|
| Commercial real estate |
227,408 |
|
|
1,299,723 |
|
|
3,215,683 |
|
|
412,509 |
|
|
5,155,323 |
|
| Commercial construction |
44,985 |
|
|
161,635 |
|
|
119,570 |
|
|
10,086 |
|
|
336,276 |
|
| Business banking |
124,912 |
|
|
268,262 |
|
|
659,813 |
|
|
37,505 |
|
|
1,090,492 |
|
| Residential real estate |
671 |
|
|
12,731 |
|
|
295,898 |
|
|
2,151,549 |
|
|
2,460,849 |
|
| Consumer home equity |
1,657 |
|
|
17,943 |
|
|
216,407 |
|
|
951,540 |
|
|
1,187,547 |
|
| Other consumer |
26,987 |
|
|
83,395 |
|
|
79,606 |
|
|
4,110 |
|
|
194,098 |
|
| Total loans |
$ |
751,078 |
|
|
$ |
3,039,091 |
|
|
$ |
5,259,336 |
|
|
$ |
4,526,026 |
|
|
$ |
13,575,531 |
|
(1)Includes demand loans, or loans without a stated maturity.
The interest rate risk of our loan portfolio is an important element in the management of net interest margin. We attempt to manage the relationship between the interest rate sensitivity of our assets and liabilities to produce an effective interest differential that is not significantly impacted by changes in the level of interest rates. The following table shows the interest rate risk of our loans, on a gross basis, due one year after December 31, 2022:
Loan Interest Rate Risk
|
|
|
|
|
|
|
|
|
|
|
|
|
|
|
|
|
|
|
Due after December 31, 2023 |
|
Fixed |
|
Adjustable |
|
Total |
|
(In thousands) |
| Commercial and industrial |
$ |
830,924 |
|
|
$ |
1,995,564 |
|
|
$ |
2,826,488 |
|
| Commercial real estate |
2,188,212 |
|
|
2,739,703 |
|
|
4,927,915 |
|
| Commercial construction |
220,927 |
|
|
70,364 |
|
|
291,291 |
|
| Business banking |
263,466 |
|
|
702,114 |
|
|
965,580 |
|
| Residential real estate |
2,000,810 |
|
|
459,368 |
|
|
2,460,178 |
|
| Consumer home equity |
202,215 |
|
|
983,675 |
|
|
1,185,890 |
|
| Other consumer |
164,260 |
|
|
2,851 |
|
|
167,111 |
|
| Total loans |
$ |
5,870,814 |
|
|
$ |
6,953,639 |
|
|
$ |
12,824,453 |
|
Asset quality. We continually monitor the asset quality of our loan portfolio utilizing portfolio scorecards and various credit quality indicators. Based on this process, loans meeting certain criteria are categorized as delinquent or non-performing and further assessed to determine if non-accrual status is appropriate.
For the commercial portfolio, which includes our commercial and industrial, commercial real estate, commercial construction and business banking loans, we monitor credit quality using a risk rating scale, which assigns a risk-grade to each borrower based on a number of quantitative and qualitative factors associated with a commercial loan transaction. Management utilizes a loan risk rating methodology based on a 15-point scale with the assistance of risk rating scorecard tools. Pass grades are 0-10 and non-pass categories, which align with regulatory guidelines, are: special mention (11), substandard (12), doubtful (13) and loss (14).
Risk rating assignment is determined using one of 15 separate scorecards developed for distinctive portfolio segments based on common attributes. Key factors include: industry and market conditions, position within the industry, earnings trends, operating cash flow, asset/liability values, debt capacity, guarantor strength, management and controls, financial reporting, collateral and other considerations.
Special mention, substandard and doubtful loans totaled 2.2% and 5.8% of total commercial loans outstanding at December 31, 2022 and 2021, respectively. This decrease was driven by risk rating upgrades in the construction and commercial and industrial portfolios.
Our philosophy toward managing our loan portfolios is predicated upon careful monitoring, which stresses early detection and response to delinquent and default situations. We seek to make arrangements to resolve any delinquent or default situation over the shortest possible time frame.
For the retail portfolio, which includes residential real estate, consumer home equity, and other consumer portfolios, we monitor credit quality using the borrower’s FICO score. As of December 31, 2022, 72.3% of retail borrowers, based on loan balance, have a FICO score of 740 or greater. The following table shows the balances by borrowers' current FICO scores as of the dates indicated:
|
|
|
|
|
|
|
|
|
|
|
|
|
|
|
|
|
|
|
|
|
|
|
|
|
|
|
|
|
|
|
|
|
|
|
|
|
As of December 31, 2022 |
|
As of December 31, 2021 |
|
Residential
Real Estate |
|
Consumer
Home Equity |
|
Other
Consumer |
|
Residential
Real Estate |
|
Consumer
Home Equity |
|
Other
Consumer |
Current FICO (1) |
(Dollars in thousands) |
|
(Dollars in thousands) |
| Not available (2) |
$ |
5,195 |
|
|
$ |
15,284 |
|
|
$ |
27,400 |
|
|
$ |
3,954 |
|
|
$ |
1,122 |
|
|
$ |
27,448 |
|
| 640 or lower |
54,268 |
|
|
37,538 |
|
|
4,406 |
|
|
49,112 |
|
|
39,446 |
|
|
7,680 |
|
641 – 699 |
193,215 |
|
|
114,751 |
|
|
13,026 |
|
|
184,740 |
|
|
106,621 |
|
|
18,078 |
|
700 – 739 |
381,018 |
|
|
200,397 |
|
|
21,139 |
|
|
307,162 |
|
|
173,617 |
|
|
27,739 |
|
| 740 or higher |
1,846,359 |
|
|
823,337 |
|
|
111,807 |
|
|
1,381,842 |
|
|
779,347 |
|
|
133,539 |
|
| Total |
$ |
2,480,055 |
|
|
$ |
1,191,307 |
|
|
$ |
177,778 |
|
|
$ |
1,926,810 |
|
|
$ |
1,100,153 |
|
|
$ |
214,485 |
|
| Average FICO |
767.3 |
|
763.3 |
|
772.2 |
|
764.7 |
|
764.5 |
|
765.7 |
(1)Borrower FICO scores are updated on a semi-annual basis, and the most recent update occurred in August 2022.
(2)Insufficient data available to report.
The delinquency rate of our total loan portfolio decreased to 0.50% at December 31, 2022 from 0.65% at December 31, 2021.
The following table provides details regarding our delinquency rates as of the dates indicated:
Loan Delinquency Rates
|
|
|
|
|
|
|
|
|
|
|
|
|
Delinquency Rate as of December 31, (1) (2) |
|
2022 |
|
2021 |
| Commercial and industrial |
0.12 |
% |
|
0.06 |
% |
| Commercial real estate |
— |
% |
|
0.60 |
% |
| Commercial construction |
— |
% |
|
— |
% |
| Business banking |
1.00 |
% |
|
0.86 |
% |
| Residential real estate |
1.46 |
% |
|
1.38 |
% |
| Consumer home equity |
1.33 |
% |
|
0.90 |
% |
| Other consumer |
0.63 |
% |
|
1.23 |
% |
| Total |
0.50 |
% |
|
0.65 |
% |
(1)In the calculation of the delinquency rate as of December 31, 2022 and 2021, the total amount of loans outstanding includes $9.8 million and $331.4 million, respectively, of PPP loans.
(2)Delinquency rates as of December 31, 2022 were computed based upon amortized cost balances while delinquency rates as of December 31, 2021 were computed based upon recorded investment balances. The effect on the above delinquency rates of the difference in methodology is not significant.
As a general rule, loans more than 90 days past due with respect to principal or interest are classified as non-accrual loans. However, based on our assessment of collateral and/or payment prospects, certain loans that are more than 90 days past due may be kept on an accruing status. Income accruals are suspended on all non-accrual loans and all previously accrued and uncollected interest is reversed against current income. A loan is expected to remain on non-accrual status until it becomes current with respect to principal and interest, the loan is liquidated, or the loan is determined to be uncollectible and is charged-off against the allowance for loan losses.
Non-performing assets (“NPAs”) are comprised of non-performing loans (“NPLs”), OREO and non-performing securities. NPLs consist of non-accrual loans and loans that are more than 90 days past due but still accruing interest. OREO consists of real estate properties, which primarily serve as collateral to secure our loans, that we control due to foreclosure. These properties are recorded at the fair value less estimated costs to sell on the date we obtain control. Any write-downs to the cost of the related asset upon transfer to OREO to reflect the asset at fair value less estimated costs to sell is recorded through the allowance for loan losses.
NPLs increased $3.6 million, or 10%, to $38.6 million at December 31, 2022 from $35.0 million at December 31, 2021. NPLs as a percentage of total loans decreased to 0.28% at December 31, 2022 from 0.29% at December 31, 2021. Refer to the later “Allowance for Credit Losses” section in this Item 7 for a discussion of the change in non-accrual loans which comprise our NPLs as of December 31, 2022. As of December 31, 2021, NPLs included loans that were past due 90 days or more and still accruing which were comprised solely of purchased credit impaired (“PCI”) loans. PCI loans were not subject to classification as non-accrual in the same manner as originated loans as their interest income related to the accretable yield recognized and not to contractual interest payments at the loan level. In connection with our adoption of ASU 2016-13 on January 1, 2022, all PCI loans are now considered purchased credit deteriorated (“PCD”) loans. Interest income recognition for PCD loans is consistent with originated loans and, therefore, PCD loans cease accruing interest at 90 days past due unless management believes that the applicable collateral held by the Company is clearly sufficient and in full satisfaction of both principal and interest. There were no PCD or originated loans at December 31, 2022 that were past due 90 days or more and still accruing.
The total amount of interest recorded on NPLs was not significant for both the years ended December 31, 2022 and 2021. The gross interest income that would have been recorded under the original terms of those loans if they had been performing amounted to $3.9 million and $3.2 million for the years ended December 31, 2022 and 2021, respectively.
In the course of resolving NPLs, we may choose to restructure the contractual terms of certain loans. We attempt to work-out alternative payment schedules with the borrowers in order to avoid foreclosure actions. We review each loan that is modified to identify whether a TDR has occurred. TDRs involve situations in which, for economic or legal reasons related to the borrower’s financial difficulties, we grant a concession to the borrower that we would not otherwise consider. As noted within Note 5, “Loans and Allowance for Credit Losses” within the Notes to the Consolidated Financial Statements included in Part II, Item 8 in this Current Report on Form 8-K, loan modifications made in response to the COVID-19 pandemic that met the criteria of either Section 4013 of the CARES Act or the Interagency Statement on Loan Modifications and Reporting for Financial Institutions Working with Customers Affected by the Coronavirus (Revised) are not deemed TDRs. This election afforded by the CARES Act and Interagency guidance expired on January 1, 2022.
In cases where a borrower experiences financial difficulties and we make certain concessionary modifications to contractual terms, the loan is classified as a TDR. Loans modified during the year ended December 31, 2022 and 2021 which were determined to be TDRs were $12.6 million (post modification balance) and $0.8 million (post modification balance), respectively. The Company executed 51 and 5 TDRs during the years ended December 31, 2022 and 2021, respectively. As discussed further in the “COVID-19 Modifications” section below, we elected to apply the treatment of modifications to borrowers impacted by the COVID-19 pandemic afforded by the CARES Act and the Interagency Statement on Loan Modifications and Reporting for Financial Institutions Working with Customers Affected by the Coronavirus (Revised) which resulted in such loans not being deemed TDRs. This election, which expired on January 1, 2022, contributed to a significant decline in new TDRs during the years ended December 31, 2021 and 2020. Consequently, modifications designated as TDRs increased during the year ended December 31, 2022 as we are no longer executing COVID-19 modifications. The overall increase in TDR loans modified during the aforementioned periods consisted of an increase of $8.2 million and $3.6 million in commercial and consumer loan TDR modifications, respectively. One loan totaling $1.0 million that was modified during the preceding 12 months subsequently defaulted during the year ended December 31, 2022. No loans were modified during the preceding 12 months which subsequently defaulted during the year ended December 31, 2021.
It is our policy to have any restructured loans that are on non-accrual status prior to being modified remain on non-accrual status for approximately six months subsequent to being modified before we consider its return to accrual status. If the restructured loan is on accrual status prior to being modified, we review it to determine if the modified loan should remain on accrual status.
PCD loans are loans that we acquired that have shown evidence of deterioration of credit quality since origination and, therefore, it was deemed unlikely that all contractually required payments would be collected upon the acquisition date. We consider factors such as payment history, collateral values and accrual status when determining whether there was evidence of deterioration at the acquisition date. As of December 31, 2022, the carrying amount of PCD loans was $56.6 million. As discussed further below, we adopted ASU 2016-13, commonly referred to as CECL, on January 1, 2022. Prior to such adoption, our acquired loans that exhibited evidence of deterioration of credit quality since origination were designated as PCI loans. As of December 31, 2021, the carrying amount of PCI loans was $69.6 million.
COVID-19 Modifications. In light of the COVID-19 pandemic, we implemented loan modification programs for our borrowers that allowed for either full payment deferrals (both interest and principal) or deferral of principal only. These modifications met the criteria of either Section 4013 of the CARES Act or the Interagency Statement on Loan Modifications and Reporting for Financial Institutions Working with Customers Affected by the Coronavirus (Revised) and therefore are not deemed TDRs. We have deemed these modified loans “COVID-19 modifications.”
The Appropriations Act, which was enacted on December 27, 2020, extended certain expiring tax provisions related to the COVID-19 pandemic in the United States and provided additional emergency relief to individuals and businesses. Included within the provisions of the Appropriations Act is the extension of Section 4013 of the CARES Act to January 1, 2022. As such, we applied CARES Act TDR relief to any qualifying loan modifications executed during the allowable time period.
The following table presents the balance of loans that received a COVID-19 modification and have not yet resumed repayment as of December 31, 2022 and 2021 and excludes loans acquired from Century:
|
|
|
|
|
|
|
|
|
|
|
|
|
|
|
|
|
|
|
|
|
|
|
|
|
Remaining COVID-19 Modifications
as of December 31, 2022 (1)
|
|
Remaining COVID-19 Modifications
as of December 31, 2021 (1)
|
|
Balance |
|
% of Total Portfolio |
|
Balance |
|
% of Total Portfolio |
|
(Dollars in thousands) |
| Commercial and industrial |
$ |
— |
|
|
0.0 |
% |
|
$ |
4,548 |
|
|
0.2 |
% |
| Commercial real estate |
12,826 |
|
|
0.3 |
% |
|
93,519 |
|
|
2.1 |
% |
| Commercial construction |
— |
|
|
— |
% |
|
— |
|
|
— |
% |
| Business banking |
— |
|
|
0.0 |
% |
|
649 |
|
|
0.1 |
% |
| Residential real estate |
262 |
|
|
0.0 |
% |
|
5,870 |
|
|
0.3 |
% |
| Consumer home equity |
— |
|
|
— |
% |
|
1,365 |
|
|
0.1 |
% |
| Other consumer |
— |
|
|
0.0 |
% |
|
706 |
|
|
0.3 |
% |
Total (2) |
$ |
13,088 |
|
|
0.1 |
% |
|
$ |
106,657 |
|
|
0.9 |
% |
(1)Remaining COVID-19 modifications reflect only those loans which underwent a modification and have not yet resumed payment. We define a modified loan to have resumed payment if it is one month past the modification end date and not more than 30 days past due.
(2)As of December 31, 2022 and 2021, remaining COVID-19 modifications included $12.8 million and $71.0 million, respectively, of loans to borrowers in the hotel industry.
As of December 31, 2022 and 2021, the aggregate amount of loans that received a COVID-19 modification and have become a non-performing loan after the respective deferral period was $4.4 million and $4.7 million, respectively.
Potential Problem Loans. In the normal course of business, we become aware of possible credit problems in which borrowers exhibit potential for the inability to comply with the contractual terms of their loans, but which currently do not yet meet the criteria for classification as NPLs. These loans were neither delinquent nor on non-accrual status. At December 31, 2022 and 2021, our potential problem loans, or loans with potential weaknesses that were not included in the non-accrual loans or in the loans 90 days or more past due categories, totaled $187.0 million and $470.9 million, respectively.
Allowance for credit losses. Because we continued to qualify for emerging growth company (“EGC”) status under the Jumpstart Our Business (“JOBS”) Act until December 31, 2021, we were permitted to delay adoption of the CECL standard until the earlier of the date at which non-public business entities are required to adopt the standard and the date that we ceased to be an EGC. Included in the Appropriations Act was an extension of the adoption date to the earlier of January 1, 2022 or 60 days after the date on which the COVID-19 national emergency terminated. We elected this extension and, accordingly, adopted the CECL standard on January 1, 2022. As of December 31, 2021, we followed the incurred loss allowance GAAP accounting model.
For the purpose of estimating our allowance for loan losses, we segregate the loan portfolio into loan categories, for loans that share similar risk characteristics, that possess unique risk characteristics such as loan purpose, repayment source, and collateral that are considered when determining the appropriate level of the allowance for loan losses for each category. Loans that do not share similar risk characteristics with other loans are evaluated individually.
While we use available information to recognize losses on loans, future additions or subtractions to/from the allowance for loan losses may be necessary based on changes in NPLs, changes in economic conditions, or other reasons. Additionally, various regulatory agencies, as an integral part of our examination process, periodically assess the adequacy of the allowance for loan losses to assess whether the allowance for loan losses was determined in accordance with GAAP and applicable guidance.
We perform an evaluation of our allowance for loan losses on a regular basis (at least quarterly), and establish the allowance for loan losses based upon an evaluation of our loan categories, as each possess unique risk characteristics that are considered when determining the appropriate level of allowance for loan losses, including:
•known increases within each category;
•certain higher risk classes of loans, or pledged collateral;
•historical loan loss experience within each category;
•results of any independent review and evaluation of the category’s credit quality;
•trends in volume, maturity and composition of each category;
•volume and trends in delinquencies and non-accruals;
•national and local economic conditions and downturns in specific local industries;
•corporate goals and objectives;
•lending policies and procedures, including underwriting standards and collection, charge-off and recovery practices; and
•current and forecasted banking industry conditions, as well as the regulatory and competitive environment.
Loans are evaluated on a regular basis by management. Expected lifetime losses are estimated on a collective basis for loans sharing similar risk characteristics and are determined using a quantitative model combined with an assessment of certain qualitative factors designed to address forecast risk and model risk inherent in the quantitative model output. For commercial and industrial, commercial real estate, commercial construction and business banking portfolios, the quantitative model uses a loan rating system which is comprised of management’s determination of probability of default, or “PD,” loss given default, or “LGD” and exposure at default, or “EAD,” which are derived from historical loss experience and other factors. For residential real estate, consumer home equity and other consumer portfolios, our quantitative model uses historical loss experience.
The allowance for loan losses is allocated to loan categories using both a formula-based approach and an analysis of certain individual loans for impairment. We use a methodology to systematically estimate the amount of expected credit loss in the loan portfolio. Under our current methodology, the allowance for loan losses contains reserves related to loans for which the related allowance for loan losses is determined on individual loan basis and on a collective basis, and other qualitative components.
In the ordinary course of business, we enter into commitments to extend credit and standby letters of credit. Such financial instruments are recorded in the financial statements when they become payable. The credit risk associated with these commitments is evaluated in a manner similar to the reserving method for loans receivable previously described. The reserve for unfunded lending commitments is included in other liabilities in the Consolidated Balance Sheets.
The allowance for loan losses increased by $44.4 million, or 45.4%, to $142.2 million, or 1.05% of total loans, at December 31, 2022 from $97.8 million, or 0.80% of total loans at December 31, 2021. The increase in the allowance for loan losses was primarily a result of our adoption of CECL, as previously described above, and increased loan balances, as previously described above. The additional reserves required as a result of our adoption of CECL were primarily attributable to the loans we acquired in connection with our acquisition of Century which were recorded at fair value at the time of acquisition. Under ASU 2016-13, the credit mark that is a component of the day-one fair value adjustment on acquired loans cannot be considered in the allowance computation, whereas under the incurred loss model, the credit mark could be considered for reserve determination purposes. In connection with our adoption of this standard, we recorded an increase to the allowance for loan losses of $27.1 million which represented the one-time cumulative-effect adjustment.
For additional discussion of our allowance for credit losses measurement methodology, see Note 2, “Summary of Significant Accounting Policies” and Note 5, “Loans and Allowance for Loan Losses” within the Notes to the Consolidated Financial Statements included in Part II, Item 8 in this Current Report on Form 8-K. For additional discussion of the change in allowance for loan losses, refer to the later “Provision for Loan Losses,” included in the “Results of Operations” section within this Item 7. For discussion of our previous methodology for estimating the allowance for loan losses, refer to Note 6, “Loans and Allowance for Loan Losses” within the Notes to the Consolidated Financial Statements included in Part II, Item 8 in this Current Report on Form 8-K and Note 2, “Summary of Significant Accounting Policies” included in Part II, Item 8 of the 2021 Form 10-K.
The following table summarizes credit ratios for the periods presented:
Credit Ratios
|
|
|
|
|
|
|
|
|
|
|
|
|
|
|
|
|
|
|
|
|
|
|
|
|
|
|
|
|
|
|
For the Year Ended December 31, |
|
2022 |
|
2021 |
|
2020 |
|
2019 |
|
2018 |
|
(Dollars in thousands) |
| Net loan charge-offs (recoveries): |
|
|
|
|
|
|
|
|
|
| Commercial and industrial |
$ |
(1,053) |
|
$ |
623 |
|
$ |
992 |
|
$ |
(2,625) |
|
$ |
893 |
| Commercial real estate |
(91) |
|
243 |
|
(206) |
|
(12) |
|
(83) |
| Commercial construction |
— |
|
— |
|
— |
|
— |
|
— |
| Business banking |
223 |
|
3,567 |
|
4,855 |
|
5,370 |
|
5,970 |
| Residential real estate |
(94) |
|
(87) |
|
(125) |
|
(39) |
|
(125) |
| Consumer home equity |
(23) |
|
(161) |
|
421 |
|
153 |
|
225 |
| Other consumer |
1,625 |
|
1,373 |
|
2,129 |
|
1,811 |
|
1,676 |
| Total net loan charge-offs (recoveries) |
$ |
587 |
|
$ |
5,558 |
|
$ |
8,066 |
|
$ |
4,658 |
|
$ |
8,556 |
| Average loans: |
|
|
|
|
|
|
|
|
|
| Commercial and industrial |
$ |
2,944,064 |
|
$ |
2,015,665 |
|
$ |
2,053,093 |
|
$ |
1,419,875 |
|
$ |
1,185,224 |
| Commercial real estate |
4,886,951 |
|
3,960,818 |
|
3,654,887 |
|
3,667,147 |
|
3,402,560 |
| Commercial construction |
294,805 |
|
191,771 |
|
226,286 |
|
263,736 |
|
327,781 |
| Business banking |
1,021,720 |
|
1,241,770 |
|
1,079,779 |
|
738,652 |
|
738,122 |
| Residential real estate |
2,063,193 |
|
1,508,796 |
|
1,398,337 |
|
1,438,775 |
|
1,357,116 |
| Consumer home equity |
1,129,757 |
|
869,110 |
|
902,634 |
|
948,089 |
|
934,681 |
| Other consumer |
197,659 |
|
233,932 |
|
334,257 |
|
471,602 |
|
619,406 |
| Average total loans (1) |
$ |
12,538,149 |
|
$ |
10,021,862 |
|
$ |
9,649,273 |
|
$ |
8,947,876 |
|
$ |
8,564,890 |
| Total net charge-offs (recoveries) to average total loans outstanding during the period |
|
|
|
|
|
|
|
|
|
| Commercial and industrial |
(0.04) |
% |
|
0.03 |
% |
|
0.05 |
% |
|
(0.18) |
% |
|
0.08 |
% |
| Commercial real estate |
0.00 |
|
|
0.01 |
|
|
(0.01) |
|
|
0.00 |
|
|
0.00 |
|
| Commercial construction |
— |
|
|
— |
|
|
— |
|
|
— |
|
|
— |
|
| Business banking |
0.02 |
|
|
0.29 |
|
|
0.45 |
|
|
0.73 |
|
|
0.81 |
|
| Residential real estate |
0.00 |
|
|
(0.01) |
|
|
(0.01) |
|
|
0.00 |
|
|
(0.01) |
|
| Consumer home equity |
0.00 |
|
|
(0.02) |
|
|
0.05 |
|
|
0.02 |
|
|
0.02 |
|
| Other consumer |
0.82 |
|
|
0.59 |
|
|
0.64 |
|
|
0.38 |
|
|
0.27 |
|
| Total net charge-offs (recoveries) to average total loans outstanding during the period |
0.00 |
% |
|
0.06 |
% |
|
0.08 |
% |
|
0.05 |
% |
|
0.10 |
% |
| Total loans |
$ |
13,575,531 |
|
$ |
12,281,510 |
|
$ |
9,730,525 |
|
$ |
8,987,046 |
|
$ |
8,856,003 |
| Total non-accrual loans |
$ |
38,604 |
|
$ |
32,993 |
|
$ |
41,005 |
|
$ |
42,451 |
|
$ |
26,172 |
| Allowance for loan losses |
$ |
142,211 |
|
$ |
97,787 |
|
$ |
113,031 |
|
$ |
82,297 |
|
$ |
80,655 |
| Allowance for loan losses as a percent of total loans |
1.05 |
% |
|
0.80 |
% |
|
1.16 |
% |
|
0.92 |
% |
|
0.91 |
% |
| Non-accrual loans as a percent of total loans |
0.28 |
% |
|
0.27 |
% |
|
0.42 |
% |
|
0.47 |
% |
|
0.30 |
% |
| Allowance for loan losses as a percent of non-accrual loans |
368.38 |
% |
|
296.39 |
% |
|
275.65 |
% |
|
193.86 |
% |
|
308.17 |
% |
(1)Average loan balances exclude loans held for sale.
Non-accrual loans increased $5.6 million, or 17%, to $38.6 million at December 31, 2022 from $33.0 million at December 31, 2021, primarily due to increases in non-accrual loans in our residential real estate and consumer home equity portfolios of $3.1 million and $2.3 million, respectively. Non-accrual residential real estate and consumer home equity loans increased primarily due to several loans moving to non-accrual status which had been acquired in connection with our acquisition of Century.
The following tables sets forth the allocation of the allowance for loan losses by loan categories listed in loan portfolio composition and the related loan balances as a percentage of total loans as of the dates indicated:
Summary of Allocation of Allowance for Loan Losses
|
|
|
|
|
|
|
|
|
|
|
|
|
|
|
|
|
|
|
|
|
|
|
|
|
|
|
|
|
|
|
|
|
|
|
|
|
As of December 31, |
|
2022 |
|
2021 |
|
Allowance for Loan Losses |
|
Percent of Allowance in Category to Total Allocated Allowance |
|
Percent of Loans in Category
to Total
Loans |
|
Allowance for Loan Losses |
|
Percent of Allowance in Category to Total Allocated Allowance |
|
Percent of Loans in Category
to Total
Loans |
|
(Dollars in thousands) |
Commercial and industrial (1) |
$ |
26,859 |
|
|
18.89 |
% |
|
23.21 |
% |
|
$ |
18,018 |
|
|
18.43 |
% |
|
24.10 |
% |
| Commercial real estate |
54,730 |
|
|
38.49 |
% |
|
37.97 |
% |
|
52,373 |
|
|
53.56 |
% |
|
36.82 |
% |
| Commercial construction |
7,085 |
|
|
4.98 |
% |
|
2.48 |
% |
|
2,585 |
|
|
2.64 |
% |
|
1.81 |
% |
Business banking (1) |
16,189 |
|
|
11.38 |
% |
|
8.03 |
% |
|
10,983 |
|
|
11.23 |
% |
|
10.87 |
% |
| Residential real estate |
28,129 |
|
|
19.78 |
% |
|
18.13 |
% |
|
6,556 |
|
|
6.70 |
% |
|
15.69 |
% |
| Consumer home equity |
6,454 |
|
|
4.54 |
% |
|
8.75 |
% |
|
3,722 |
|
|
3.81 |
% |
|
8.96 |
% |
| Other consumer |
2,765 |
|
|
1.94 |
% |
|
1.43 |
% |
|
3,308 |
|
|
3.38 |
% |
|
1.75 |
% |
| Other |
— |
|
|
— |
% |
|
— |
% |
|
242 |
|
|
0.25 |
% |
|
— |
% |
| Total |
$ |
142,211 |
|
|
100.00 |
% |
|
100.00 |
% |
|
$ |
97,787 |
|
|
100.00 |
% |
|
100.00 |
% |
|
|
|
|
|
|
|
|
|
|
|
|
|
|
|
|
|
|
|
|
|
|
|
|
|
|
|
|
|
|
|
|
|
|
|
|
|
|
|
|
|
|
|
|
|
|
|
|
|
|
|
|
|
|
|
As of December 31, |
|
2020 |
|
2019 |
|
2018 |
|
Allowance for Loan Losses |
|
Percent of Allowance in Category to Total Allocated Allowance |
|
Percent of Loans in Category
to Total
Loans |
|
Allowance for Loan Losses |
|
Percent of Allowance in Category to Total Allocated Allowance |
|
Percent of Loans in Category
to Total
Loans |
|
Allowance for Loan Losses |
|
Percent of Allowance in Category to Total Allocated Allowance |
|
Percent of Loans in Category
to Total
Loans |
|
(Dollars in thousands) |
| Commercial and industrial (1) |
$ |
26,617 |
|
|
23.54 |
% |
|
20.51 |
% |
|
$ |
20,919 |
|
|
25.42 |
% |
|
18.27 |
% |
|
$ |
19,321 |
|
|
23.96 |
% |
|
18.73 |
% |
| Commercial real estate |
54,569 |
|
|
48.28 |
% |
|
36.73 |
% |
|
34,730 |
|
|
42.20 |
% |
|
39.34 |
% |
|
32,400 |
|
|
40.17 |
% |
|
36.26 |
% |
| Commercial construction |
4,553 |
|
|
4.03 |
% |
|
3.14 |
% |
|
3,424 |
|
|
4.16 |
% |
|
3.05 |
% |
|
4,606 |
|
|
5.71 |
% |
|
3.53 |
% |
| Business banking (1) |
13,152 |
|
|
11.64 |
% |
|
13.76 |
% |
|
8,260 |
|
|
10.04 |
% |
|
8.58 |
% |
|
8,167 |
|
|
10.13 |
% |
|
8.37 |
% |
| Residential real estate |
6,435 |
|
|
5.69 |
% |
|
14.09 |
% |
|
6,380 |
|
|
7.75 |
% |
|
15.90 |
% |
|
7,059 |
|
|
8.75 |
% |
|
16.16 |
% |
| Consumer home equity |
3,744 |
|
|
3.31 |
% |
|
8.92 |
% |
|
4,027 |
|
|
4.89 |
% |
|
10.38 |
% |
|
4,113 |
|
|
5.10 |
% |
|
10.72 |
% |
| Other consumer |
3,467 |
|
|
3.07 |
% |
|
2.85 |
% |
|
4,173 |
|
|
5.07 |
% |
|
4.48 |
% |
|
4,600 |
|
|
5.70 |
% |
|
6.23 |
% |
| Other |
494 |
|
|
0.44 |
% |
|
— |
% |
|
384 |
|
|
0.47 |
% |
|
— |
% |
|
389 |
|
|
0.48 |
% |
|
— |
% |
| Total |
$ |
113,031 |
|
|
100.00 |
% |
|
100.00 |
% |
|
$ |
82,297 |
|
|
100.00 |
% |
|
100.00 |
% |
|
$ |
80,655 |
|
|
100.00 |
% |
|
100.00 |
% |
(1)PPP loans are included within these portfolios as of December 31, 2022, December 31, 2021, and December 31, 2020; however, as of each such date, no allowance for loan losses was recorded on these loans due to the SBA guarantee of 100% of the loans.
To determine if a loan should be charged-off, all possible sources of repayment are analyzed. Possible sources of repayment include the potential for future cash flows, liquidation of the collateral and the strength of co-makers or guarantors. When available information confirms that specific loans or portions thereof are uncollectible, these amounts are promptly charged-off against the allowance for loan losses and any recoveries of such previously charged-off amounts are credited to the allowance for loan losses.
Regardless of whether a loan is unsecured or collateralized, we charge off the amount of any confirmed loan loss in the period when the loans, or portions of loans, are deemed uncollectible. For troubled, collateral-dependent loans, loss confirming events may include an appraisal or other valuation that reflects a shortfall between the value of the collateral and the carrying value of the loan or receivable, or a deficiency balance following the sale of the collateral.
For additional information regarding our allowance for loan losses, see Note 5, “Loans and Allowance for Credit Losses” within the Notes to the Consolidated Financial Statements included in Item 8 in this Current Report on Form 8-K.
Federal Home Loan Bank stock
The FHLBB is a cooperative that provides services to its member banking institutions. The primary reason for our membership in the FHLBB is to gain access to a reliable source of wholesale funding and as a tool to manage interest rate risk. The purchase of stock in the FHLB is a requirement for a member to gain access to funding. We purchase and/or are subject to redemption of FHLBB stock proportional to the volume of funding received and view the holdings as a necessary long-term investment for the purpose of balance sheet liquidity and not for investment return.
We held an investment in the FHLBB of $41.4 million and $10.9 million at December 31, 2022 and 2021, respectively. The amount of stock we are required to purchase is in proportional to our FHLB borrowings and level of total assets. Accordingly, the increase in the FHLB stock is due to increased borrowing.
Goodwill and other intangible assets
The balance of our goodwill and core deposit intangible asset was $568.0 million and $569.2 million at December 31, 2022 and 2021, respectively, which excludes goodwill and other intangible assets included in discontinued operations. For discussion of the impairment testing performed as of December 31, 2022, see Note 9,“Goodwill and Other Intangibles” within the Notes to the Consolidated Financial Statements included in Part II, Item 8 in this Current Report on Form 8-K. We did not record any impairment to our goodwill or other intangible assets during the years ended December 31, 2022 and 2021. We will continue to assess our goodwill and other intangible assets to determine if impairments are necessary.
Deposits and other interest-bearing liabilities
Deposits originating within the markets we serve continue to be our primary source of funding our earning assets. We have been able to compete effectively for deposits in our primary market areas. The distribution and market share of deposits by type of deposit and by type of depositor are important considerations in our assessment of the stability of our fund sources and our access to additional funds. Furthermore, we shift the mix and maturity of the deposits depending on economic conditions and loan and investment policies in an attempt, within set policies, to minimize cost and maximize net interest margin. In addition, we may occasionally raise funds through the use of brokered deposits.
The following table presents our deposits as of the dates presented:
Components of Deposits
|
|
|
|
|
|
|
|
|
|
|
|
|
|
|
|
|
|
|
|
|
|
|
|
|
As of December 31, |
|
Change |
|
Change |
|
2022 |
|
2021 |
Amount ($) |
|
Amount (%) |
|
(Dollars in thousands) |
| Demand |
$ |
6,240,637 |
|
|
$ |
7,020,864 |
|
|
$ |
(780,227) |
|
|
(11.1) |
% |
| Interest checking |
4,568,122 |
|
|
4,478,566 |
|
|
89,556 |
|
|
2.0 |
% |
| Savings |
1,831,123 |
|
|
2,077,495 |
|
|
(246,372) |
|
|
(11.9) |
% |
| Money market investments |
4,710,095 |
|
|
5,525,005 |
|
|
(814,910) |
|
|
(14.7) |
% |
| Certificates of deposit (2) |
1,624,382 |
|
|
526,381 |
|
|
1,098,001 |
|
|
208.6 |
% |
| Total deposits |
$ |
18,974,359 |
|
|
$ |
19,628,311 |
|
|
$ |
(653,952) |
|
|
(3.3) |
% |
(1)The Bank’s estimate of total uninsured deposits was $9.0 billion and $11.0 billion at December 31, 2022 and December 31, 2021, respectively.
(2)Brokered deposits are included in certificates of deposits and amounted to $928.6 million at December 31, 2022. As of December 31, 2021, we had purchased no brokered certificates of deposit.
Deposits decreased by $0.7 billion, or 3.3%, to $19.0 billion at December 31, 2022 from $19.6 billion at December 31, 2021. This decrease was primarily the result of a decrease in money market investments of $0.8 billion, a decrease in demand deposits of $0.8 billion, and a decrease in savings deposits of $0.2 billion. These decreases were partially offset by an increase of $1.1 billion in certificates of deposit. The overall decrease is primarily due to a runoff of higher cost deposits acquired in connection with our acquisition of Century, the runoff of government stimulus funds which had been deposited by our customers, higher market rates resulting in greater industry-wide competition for deposits, and a transfer of deposits during the second quarter of 2022. On January 14, 2022, we announced we had entered into an asset purchase agreement for the transfer of our cannabis-related and money service business deposits relationships, which we acquired from Century, to Needham Bank. On April 1, 2022, we completed the transfer of such deposits, which was subject to a post-transfer settlement period of 60 days. The total amount transferred, which includes amounts transferred during the post-transfer settlement period, was $278.0 million. Partially offsetting these decreases was an increase of $1.1 billion in certificates of deposit which was primarily attributable to the purchase of $928.6 million of brokered certificates of deposit during the year ended December 31, 2022.
The following table presents the classification of deposits on an average basis for the years indicated:
Classification of Deposits on an Average Basis
|
|
|
|
|
|
|
|
|
|
|
|
|
|
|
|
|
|
|
|
|
|
|
|
|
|
|
|
|
|
|
|
|
|
|
|
|
For the Year Ended December 31, |
|
2022 |
|
2021 |
|
2020 |
|
Average
Amount |
|
Average
Rate |
|
Average
Amount |
|
Average
Rate |
|
Average
Amount |
|
Average
Rate |
|
(Dollars in thousands) |
| Demand |
$ |
6,647,518 |
|
|
— |
% |
|
$ |
5,547,615 |
|
|
— |
% |
|
$ |
4,535,066 |
|
|
— |
% |
| Interest checking |
4,890,709 |
|
|
0.24 |
% |
|
2,866,091 |
|
|
0.07 |
% |
|
2,227,185 |
|
|
0.09 |
% |
| Savings |
2,015,651 |
|
|
0.01 |
% |
|
1,483,271 |
|
|
0.02 |
% |
|
1,123,584 |
|
|
0.02 |
% |
| Money market investments |
5,057,445 |
|
|
0.27 |
% |
|
3,870,712 |
|
|
0.06 |
% |
|
3,212,752 |
|
|
0.23 |
% |
| Certificates of deposit |
463,261 |
|
|
0.70 |
% |
|
280,141 |
|
|
0.21 |
% |
|
300,381 |
|
|
0.52 |
% |
| Total deposits |
$ |
19,074,584 |
|
|
0.15 |
% |
|
$ |
14,047,830 |
|
|
0.04 |
% |
|
$ |
11,398,968 |
|
|
0.10 |
% |
Other time deposits in excess of the FDIC insurance limit of $250,000, including certificates of deposits as of the dates indicated had maturities as follows:
Maturities of Time Certificates of Deposit $250,000 and Over
|
|
|
|
|
|
|
|
|
|
|
|
|
As of December 31, |
|
2022 |
|
2021 |
| Maturing in |
(In thousands) |
| Three months or less |
$ |
39,322 |
|
|
$ |
113,019 |
|
| Over three months through six months |
45,053 |
|
|
53,899 |
|
| Over six months through twelve months |
149,107 |
|
|
33,295 |
|
| Over twelve months |
5,569 |
|
|
23,827 |
|
| Total |
$ |
239,051 |
|
|
$ |
224,040 |
|
Borrowings
Our borrowings may consist of both short-term and long-term borrowings and provide us with sources of funding. Maintaining available borrowing capacity provides us with a contingent source of liquidity.
Our total borrowings increased by $706.6 million to $740.8 million at December 31, 2022 compared to $34.3 million at December 31, 2021. The increase was primarily due to an increase in FHLB advances, which we borrowed primarily to fund loan originations. The increase was also due, in part, to an increase in interest rate swap collateral funds, which represents collateral posted to us by our financial institution counterparties for over-the-counter interest rate swaps. At December 31, 2021, our financial institution counterparties were not required to post collateral to us due to the low level of market interest rates. Conversely, at December 31, 2022, following increases in market interest rates during the year ended December 31, 2022, our financial institution counterparties were required to post collateral to us of $14.4 million.
The following table sets forth information concerning balances on our borrowings as of the dates indicated:
Borrowings by Category
|
|
|
|
|
|
|
|
|
|
|
|
|
|
|
|
|
|
|
As of December 31, |
|
Change |
|
2022 |
|
2021 |
|
Amount ($) |
|
(In thousands) |
| Federal Home Loan Bank short-term advances |
$ |
691,297 |
|
|
$ |
17 |
|
|
$ |
691,280 |
|
| Escrow deposits of borrowers |
22,314 |
|
|
20,258 |
|
|
2,056 |
|
| Interest rate swap collateral funds |
14,430 |
|
|
— |
|
|
14,430 |
|
| Federal Home Loan Bank long-term advances |
12,787 |
|
|
14,003 |
|
|
(1,216) |
|
| Total |
$ |
740,828 |
|
|
$ |
34,278 |
|
|
$ |
706,550 |
|
Results of Operations
The information presented within this section excludes discontinued operations. Refer to Note 24, “Discontinued Operations” within the Notes to the Audited Consolidated Financial Statements included in Part II, Item 8 in this Current Report on Form 8-K for further discussion regarding discontinued operations.
Summary of Results of Operations
|
|
|
|
|
|
|
|
|
|
|
|
|
|
|
|
|
|
|
|
|
|
|
|
|
For the Year Ended December 31, |
|
Change |
|
2022 |
|
2021 |
|
Amount ($) |
|
Percentage (%) |
|
(Dollars in thousands) |
| Interest and dividend income |
$ |
605,181 |
|
|
$ |
435,159 |
|
|
$ |
170,022 |
|
|
39.1 |
% |
| Interest expense |
37,127 |
|
|
5,332 |
|
|
31,795 |
|
|
596.3 |
% |
| Net interest income |
568,054 |
|
|
429,827 |
|
|
138,227 |
|
|
32.2 |
% |
| Provision for (release of) allowance for loan losses |
17,925 |
|
|
(9,686) |
|
|
27,611 |
|
|
(285.1) |
% |
| Noninterest income |
76,750 |
|
|
97,437 |
|
|
(20,687) |
|
|
(21.2) |
% |
| Noninterest expense |
388,649 |
|
|
360,955 |
|
|
27,694 |
|
|
7.7 |
% |
| Income tax expense |
51,719 |
|
|
30,464 |
|
|
21,255 |
|
|
69.8 |
% |
| Net income |
$ |
186,511 |
|
|
$ |
145,531 |
|
|
$ |
40,980 |
|
|
28.2 |
% |
Comparison of the Years Ended December 31, 2022 and 2021
Interest and Dividend Income
Interest and dividend income increased by $170.0 million, or 39.1%, to $605.2 million during the year ended December 31, 2022 from $435.2 million during the year ended December 31, 2021. This increase was primarily a result of our acquisition of Century on November 12, 2021, which added approximately $6.6 billion in interest-earning assets. Overall, the average balance of our interest-earning assets increased $4.9 billion, or 29.6%, to $21.6 billion as of December 31, 2022 compared to $16.7 billion as of December 31, 2021, reflecting the addition of Century assets. Also contributing to the increase in interest and dividend income was an increase in the yield on average interest-earning assets which increased by 22 basis points to 2.86% during the year ended December 31, 2022. Our yields on loans and securities are generally presented on an FTE basis where the embedded tax benefit on loans or securities are calculated and added to the yield. Management believes that this presentation allows for better comparability between institutions with different tax structures.
•Interest income on securities and other short-term investments increased $61.6 million, or 91.1%, to $129.1 million for the year ended December 31, 2022 compared to $67.6 million for the year ended December 31, 2021. The increase in interest income on securities was primarily due to an increase in the average balance and yield of such securities. The average balance of our securities increased $2.4 billion, or 36.3%, to $9.1 billion as of December 31, 2022 compared to $6.7 billion as of December 31, 2021, which was primarily due to securities acquired in connection with our acquisition of Century of $3.1 billion partially offset by a net reduction in the balance of securities as a result of security sales, maturities and principal paydowns in excess of security purchases during the year ended December 31, 2022. The yield on our securities increased 40 basis points during the year ended December 31, 2022 in comparison to the year ended December 31, 2021. This increase is due primarily to HTM securities purchased at higher interest rates as well as an increase in yields on other short-term investments, the latter of which is due to increases in the rate received on reserve balances held at the Federal Reserve Bank of Boston, commensurate with increases in the federal funds rate.
•Interest income on loans increased by $108.5 million, or 29.5%, to $476.0 million during the year ended December 31, 2022 from $367.6 million during the year ended December 31, 2021. The increase in interest income on our loans was primarily due to an increase in the average balance of loans and an increase in the yield on loans partially offset by a decrease in net accretion of PPP loan deferred fees and costs. The average balance of our loans increased $2.5 billion, or 25.1%, to $12.5 billion during the year ended December 31, 2022 from $10.0 billion during the year ended December 31, 2021, which was primarily due to loans acquired in connection with our acquisition of Century of $2.9 billion. The FTE yield on average loans increased 17 basis points to 3.88% during the year ended December 31, 2022. The slight increase in loan yields was primarily due to increases in market rates of interest and was partially offset by a decrease in net accretion of PPP loan deferred fees and costs which decreased $25.3 million to $9.0 million during year ended December 31, 2022 from $34.3 million during the year ended December 31, 2021.
Interest Expense
Interest expense increased $31.8 million, or 596.3%, to $37.1 million during the year ended December 31, 2022 from $5.3 million during the year ended December 31, 2021. The increase was attributable to increases in both deposit interest expense and borrowings interest expense.
•Interest expense on our interest-bearing deposits increased by $23.5 million, or 453.9%, to $28.6 million during the year ended December 31, 2022 from $5.2 million during the year ended December 31, 2021. This increase was due to an increase in rates paid on deposits and due to an increase in average interest-bearing deposits. Rates paid on interest-bearing deposits increased by 17 basis points to 0.23% during the year ended December 31, 2022 from 0.06% during the year ended December 31, 2021, which were increased in response to an increase in market rates of interest. Average interest-bearing deposits increased $3.9 billion, or 46.2%, to $12.4 billion for the year ended December 31, 2022 from $8.5 billion for the year ended December 31, 2021 which was primarily due to our acquisition of Century which added approximately $4.4 billion in interest-bearing deposits.
•Interest expense on borrowed funds increased by $8.3 million to $8.5 million during the year ended December 31, 2022 from $0.2 million during the year ended December 31, 2021 which was primarily attributable to an increase in the average balance. Average borrowed funds increased by $230.1 million, or 868.6%, to $256.6 million for the year ended December 31, 2022 from $26.5 million for the year ended December 31, 2021, due to an increase in FHLB advances, which we borrowed to fund loan originations.
Net Interest Income
Net interest income increased by $138.2 million, or 32.2%, to $568.1 million during the year ended December 31, 2022, from $429.8 million during the year ended December 31, 2021. Net interest income increased due to an increase in yields on interest-earning assets which exceeded the increase in the costs of interest-bearing liabilities. Also contributing to the increase in net interest income was an increase in net interest-earning assets of $0.8 billion, or 9.6%, to $8.9 billion during the year ended December 31, 2022 from $8.2 billion during the year ended December 31, 2021.
The following chart shows our net interest margin over the past five annual periods including and excluding net PPP loan fee accretion:
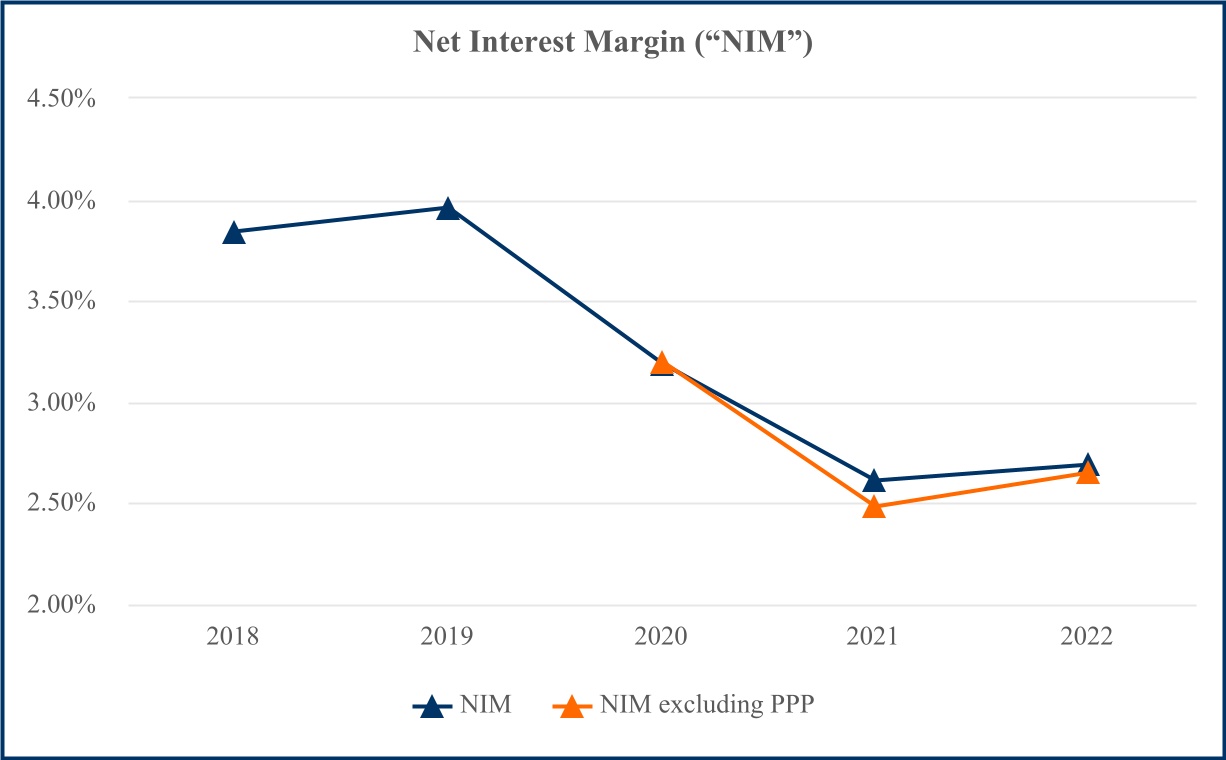
Net interest margin is determined by dividing FTE net interest income by average-earning assets. For purposes of the following discussion, income from tax-exempt loans and investment securities has been adjusted to an FTE basis, using a marginal tax rate of 21.6% for the year ended December 31, 2022, 21.0% for the year ended December 31, 2021 and 21.8% for the year ended December 31, 2020. Net interest margin, including PPP loan interest income, increased 8 basis points to 2.69% during the year ended December 31, 2022, from 2.61% during the year ended December 31, 2021. The increase in net interest margin for the year ended December 31, 2022 was primarily due to an increase in market rates of interest and was partially offset by a decline in PPP net fee accretion of $25.3 million in comparison to the year ended December 31, 2021. For additional discussion of the decline in the PPP loan net fee accretion and increased interest rates, refer to the earlier “Outlook and Trends” section within this Item 7.
The following tables set forth average balance sheet items, average yields and costs, and certain other information for the periods indicated. All average balances in the table reflect daily average balances. Non-accrual loans were included in the computation of average balances but have been reflected in the table as loans carrying a zero yield. The yields set forth below include the effect of deferred fees, discounts and premiums that are amortized or accreted to interest income or expense.
Average Balances, Interest Earned/Paid, & Average Yields/Costs
|
|
|
|
|
|
|
|
|
|
|
|
|
|
|
|
|
|
|
|
|
|
|
|
|
|
|
|
|
|
|
|
|
|
|
|
|
|
|
|
|
|
|
|
|
|
|
|
|
|
|
|
|
|
|
As of and for the Year Ended December 31, |
|
2022 |
|
2021 |
|
2020 |
|
Average
Outstanding
Balance |
|
Interest |
|
Average
Yield /Cost |
|
Average
Outstanding
Balance |
|
Interest |
|
Average
Yield /Cost |
|
Average
Outstanding
Balance |
|
Interest |
|
Average
Yield /Cost |
|
(Dollars in thousands) |
| Interest-earning assets: |
|
|
|
|
|
|
|
|
|
|
|
|
|
|
|
|
|
| Loans (1): |
|
|
|
|
|
|
|
|
|
|
|
|
|
|
|
|
|
| Residential |
$ |
2,064,609 |
|
|
$ |
63,803 |
|
|
3.09 |
% |
|
$ |
1,510,703 |
|
|
$ |
47,143 |
|
|
3.12 |
% |
|
$ |
1,400,907 |
|
|
$ |
49,767 |
|
|
3.55 |
% |
| Commercial |
9,147,540 |
|
|
366,097 |
|
|
4.00 |
% |
|
7,410,024 |
|
|
288,557 |
|
|
3.89 |
% |
|
7,014,044 |
|
|
281,816 |
|
|
4.02 |
% |
| Consumer |
1,327,417 |
|
|
56,965 |
|
|
4.29 |
% |
|
1,103,042 |
|
|
36,019 |
|
|
3.27 |
% |
|
1,236,893 |
|
|
43,729 |
|
|
3.54 |
% |
| Total loans |
12,539,566 |
|
|
486,865 |
|
|
3.88 |
% |
|
10,023,769 |
|
|
371,719 |
|
|
3.71 |
% |
|
9,651,844 |
|
|
375,312 |
|
|
3.89 |
% |
| Non-taxable investment securities |
253,651 |
|
|
9,091 |
|
|
3.58 |
% |
|
260,399 |
|
|
9,335 |
|
|
3.58 |
% |
|
265,511 |
|
|
9,899 |
|
|
3.73 |
% |
| Taxable investment securities |
8,413,217 |
|
|
118,690 |
|
|
1.41 |
% |
|
4,890,737 |
|
|
58,312 |
|
|
1.19 |
% |
|
1,560,610 |
|
|
31,831 |
|
|
2.04 |
% |
| Other short-term investments |
420,834 |
|
|
3,271 |
|
|
0.78 |
% |
|
1,514,351 |
|
|
1,886 |
|
|
0.12 |
% |
|
1,288,714 |
|
|
1,758 |
|
|
0.14 |
% |
| Total interest-earning assets |
21,627,268 |
|
|
617,917 |
|
|
2.86 |
% |
|
16,689,256 |
|
|
441,252 |
|
|
2.64 |
% |
|
12,766,679 |
|
|
418,800 |
|
|
3.28 |
% |
| Non-interest-earning assets |
986,865 |
|
|
|
|
|
|
1,173,830 |
|
|
|
|
|
|
1,097,064 |
|
|
|
|
|
| Total assets |
$ |
22,614,133 |
|
|
|
|
|
|
$ |
17,863,086 |
|
|
|
|
|
|
$ |
13,863,743 |
|
|
|
|
|
| Interest-bearing liabilities: |
|
|
|
|
|
|
|
|
|
|
|
|
|
|
|
|
|
| Deposits: |
|
|
|
|
|
|
|
|
|
|
|
|
|
|
|
|
|
| Savings accounts |
$ |
2,015,651 |
|
|
$ |
209 |
|
|
0.01 |
% |
|
$ |
1,483,271 |
|
|
$ |
230 |
|
|
0.02 |
% |
|
$ |
1,123,584 |
|
|
$ |
242 |
|
|
0.02 |
% |
| Interest checking accounts |
4,890,709 |
|
|
11,675 |
|
|
0.24 |
% |
|
2,866,091 |
|
|
1,997 |
|
|
0.07 |
% |
|
2,227,185 |
|
|
2,033 |
|
|
0.09 |
% |
| Money market investments |
5,057,445 |
|
|
13,479 |
|
|
0.27 |
% |
|
3,870,712 |
|
|
2,342 |
|
|
0.06 |
% |
|
3,212,752 |
|
|
7,492 |
|
|
0.23 |
% |
| Time accounts |
463,261 |
|
|
3,258 |
|
|
0.70 |
% |
|
280,141 |
|
|
598 |
|
|
0.21 |
% |
|
300,381 |
|
|
1,548 |
|
|
0.52 |
% |
| Total interest-bearing deposits |
12,427,066 |
|
|
28,621 |
|
|
0.23 |
% |
|
8,500,215 |
|
|
5,167 |
|
|
0.06 |
% |
|
6,863,902 |
|
|
11,315 |
|
|
0.16 |
% |
| Federal funds purchased (7) |
964 |
|
|
24 |
|
|
2.49 |
% |
|
— |
|
|
— |
|
|
— |
% |
|
45,204 |
|
|
570 |
|
|
1.26 |
% |
| Other borrowings |
255,668 |
|
|
8,482 |
|
|
3.32 |
% |
|
26,495 |
|
|
165 |
|
|
0.62 |
% |
|
26,897 |
|
|
192 |
|
|
0.71 |
% |
| Total interest-bearing liabilities |
12,683,698 |
|
|
37,127 |
|
|
0.29 |
% |
|
8,526,710 |
|
|
5,332 |
|
|
0.06 |
% |
|
6,936,003 |
|
|
12,077 |
|
|
0.17 |
% |
| Demand accounts |
6,647,518 |
|
|
|
|
|
|
5,547,615 |
|
|
|
|
|
|
4,535,066 |
|
|
|
|
|
| Other noninterest-bearing liabilities |
451,384 |
|
|
|
|
|
|
364,191 |
|
|
|
|
|
|
352,518 |
|
|
|
|
|
| Total liabilities |
19,782,600 |
|
|
|
|
|
|
14,438,516 |
|
|
|
|
|
|
11,823,587 |
|
|
|
|
|
| Shareholders’ equity |
2,831,533 |
|
|
|
|
|
|
3,424,570 |
|
|
|
|
|
|
2,040,156 |
|
|
|
|
|
| Total liabilities and shareholders’ equity |
$ |
22,614,133 |
|
|
|
|
|
|
$ |
17,863,086 |
|
|
|
|
|
|
$ |
13,863,743 |
|
|
|
|
|
| Net interest income - FTE |
|
|
$ |
580,790 |
|
|
|
|
|
|
$ |
435,920 |
|
|
|
|
|
|
$ |
406,723 |
|
|
|
| Net interest rate spread (2) |
|
|
|
|
2.57 |
% |
|
|
|
|
|
2.58 |
% |
|
|
|
|
|
3.11 |
% |
| Net interest-earning assets (3) |
$ |
8,943,570 |
|
|
|
|
|
|
$ |
8,162,546 |
|
|
|
|
|
|
$ |
5,830,676 |
|
|
|
|
|
| Net interest margin - FTE (4) |
|
|
|
|
2.69 |
% |
|
|
|
|
|
2.61 |
% |
|
|
|
|
|
3.19 |
% |
| Average interest-earning assets to interest-bearing liabilities |
170.51 |
% |
|
|
|
|
|
195.73 |
% |
|
|
|
|
|
184.06 |
% |
|
|
|
|
| Return on average assets (5) |
0.88 |
% |
|
|
|
|
|
0.87 |
% |
|
|
|
|
|
0.16 |
% |
|
|
|
|
| Return on average equity (6) |
7.05 |
% |
|
|
|
|
|
4.52 |
% |
|
|
|
|
|
1.11 |
% |
|
|
|
|
| Noninterest expenses to average assets (8) |
2.08 |
% |
|
|
|
|
|
2.49 |
% |
|
|
|
|
|
3.64 |
% |
|
|
|
|
(1)Non-accrual loans are included in Loans.
(2)Net interest rate spread represents the difference between the weighted average yield on interest-earning assets and the weighted average cost of interest-bearing liabilities.
(3)Net interest-earning assets represent total interest-earning assets less total interest-bearing liabilities.
(4)Net interest margin - FTE represents fully-taxable equivalent net interest income divided by average total interest-earning assets. Refer to the earlier “Non-GAAP Financial Measures” section within this Item 7 for additional information.
(5)Represents net income, including net income from discontinued operations, divided by average total assets.
(6)Represents net income, including net income from discontinued operations, divided by average equity.
(7)Federal funds purchased and the related interest expense for the 2020 period primarily related to federal funds purchased for correspondent bank customers.
(8)Includes noninterest expenses included in results of discontinued operations. Refer to Note 24, “Discontinued Operations” within the Notes to the Unaudited Consolidated Financial Statements included in Part II, Item 8 in this Current Report on Form 8-K for such amounts.
The following table presents, on a tax equivalent basis, the effects of changing rates and volumes on our net interest income for the periods indicated. The rate column shows the effects attributable to changes in rate (changes in rate multiplied by prior volume). The volume column shows the effects attributable to changes in volume (changes in volume multiplied by prior rate). The total column represents the sum of the prior columns. For purposes of this table, changes attributable to both rate and volume, which cannot be segregated, have been allocated proportionately based on the changes due to rate and the changes due to volume.
Rate and Volume Analysis
|
|
|
|
|
|
|
|
|
|
|
|
|
|
|
|
|
|
|
|
|
|
|
|
|
|
|
|
|
|
|
|
|
|
|
|
|
For the Year Ended December 31, 2022 vs. 2021 |
|
For the Year Ended December 31, 2021 vs. 2020 |
|
Increase (Decrease) Due to |
|
Total
Increase (Decrease) |
|
Increase (Decrease) Due to |
|
Total
Increase (Decrease) |
|
Rate |
|
Volume |
|
|
Rate |
|
Volume |
|
|
(In thousands) |
| Interest-earning assets: |
|
|
|
|
|
|
|
|
|
|
|
| Loans |
|
|
|
|
|
|
|
|
|
|
|
| Residential |
$ |
(462) |
|
|
$ |
17,122 |
|
|
$ |
16,660 |
|
|
$ |
(6,339) |
|
|
$ |
3,715 |
|
|
$ |
(2,624) |
|
| Commercial |
8,201 |
|
|
69,339 |
|
|
77,540 |
|
|
(8,852) |
|
|
15,593 |
|
|
6,741 |
|
| Consumer |
12,715 |
|
|
8,231 |
|
|
20,946 |
|
|
(3,190) |
|
|
(4,520) |
|
|
(7,710) |
|
| Total loans |
20,454 |
|
|
94,692 |
|
|
115,146 |
|
|
(18,381) |
|
|
14,788 |
|
|
(3,593) |
|
| Non-taxable investment securities |
(2) |
|
|
(242) |
|
|
(244) |
|
|
(376) |
|
|
(188) |
|
|
(564) |
|
| Taxable investment securities |
12,245 |
|
|
48,133 |
|
|
60,378 |
|
|
(17,822) |
|
|
44,303 |
|
|
26,481 |
|
| Other short-term investments |
3,611 |
|
|
(2,226) |
|
|
1,385 |
|
|
(162) |
|
|
290 |
|
|
128 |
|
| Total interest-earning assets |
$ |
36,308 |
|
|
$ |
140,357 |
|
|
$ |
176,665 |
|
|
$ |
(36,741) |
|
|
$ |
59,193 |
|
|
$ |
22,452 |
|
| Interest-bearing liabilities: |
|
|
|
|
|
|
|
|
|
|
|
| Deposits: |
|
|
|
|
|
|
|
|
|
|
|
| Savings accounts |
$ |
(89) |
|
|
$ |
68 |
|
|
$ |
(21) |
|
|
$ |
(78) |
|
|
$ |
66 |
|
|
$ |
(12) |
|
| Interest checking accounts |
7,496 |
|
|
2,182 |
|
|
9,678 |
|
|
(544) |
|
|
508 |
|
|
(36) |
|
| Money market investments |
10,217 |
|
|
920 |
|
|
11,137 |
|
|
(6,438) |
|
|
1,288 |
|
|
(5,150) |
|
| Time accounts |
2,070 |
|
|
590 |
|
|
2,660 |
|
|
(852) |
|
|
(98) |
|
|
(950) |
|
| Total interest-bearing deposits |
19,694 |
|
|
3,760 |
|
|
23,454 |
|
|
(7,912) |
|
|
1,764 |
|
|
(6,148) |
|
| Federal funds purchased |
— |
|
|
24 |
|
|
24 |
|
|
— |
|
|
(570) |
|
|
(570) |
|
| Other borrowings |
2,773 |
|
|
5,544 |
|
|
8,317 |
|
|
(24) |
|
|
(3) |
|
|
(27) |
|
| Total interest-bearing liabilities |
22,467 |
|
|
9,328 |
|
|
31,795 |
|
|
(7,936) |
|
|
1,191 |
|
|
(6,745) |
|
| Change in net interest income |
$ |
13,841 |
|
|
$ |
131,029 |
|
|
$ |
144,870 |
|
|
$ |
(28,805) |
|
|
$ |
58,002 |
|
|
$ |
29,197 |
|
The following chart shows the composition of our quarterly average interest-earning assets for the past five quarters:
Provision for Loan Losses
The provision for loan losses represents the charge to expense that is required to maintain an appropriate level of allowance for loan losses. During the year ended December 31, 2021, management determined the allowance for loan losses in accordance with ASC 450, “Contingencies” and ASC 310, “Receivables” (i.e., prior to our adoption of ASU 2016-13).
We recorded a provision for loan losses of $17.9 million for the year ended December 31, 2022, compared to a release of $9.7 million for the year ended December 31, 2021. Management determined a provision to be necessary primarily due to increased loan balances. Also contributing to the provision for the year ended December 31, 2022 was an increase in the overall reserve rate. The reserve rate increased by 25 basis points to 1.05% at December 31, 2022 from 0.80% at December 31, 2021. We recorded a transition adjustment in connection with our adoption of ASU 2016-13 on January 1, 2022 of $27.1 million which resulted in an increase in the reserve rate to 1.02% at that time based upon loan balances as of December 31, 2021. Subsequently, the reserve rate further increased by 3 basis points to 1.05% as of December 31, 2022 which was the result of changes in macroeconomic conditions.
To determine our allowance for loan losses as of December 31, 2022 and the provision for loan losses for the year ended December 31, 2022, we used the Oxford Economics December 31, 2022 Baseline forecast (“the forecast”) to generate our modeled expected losses by loan portfolio in order to reflect management’s reasonable expectations of current and future economic conditions. The forecast assumed the U.S. economy will enter a recession in the second quarter of 2023, reflecting the combination of persistently high inflation, aggressive Federal Reserve monetary policy tightening, slower global gross domestic product (“GDP”) activity, and weaker corporate earnings, all of which are expected to adversely impact consumers’ and businesses’ willingness to spend. Primary macroeconomic assumptions included in management’s evaluation of the adequacy of the allowance for loan losses included continued low, but rising, unemployment rates which are expected to continue to rise until their peak in early 2024, and a peak-to-trough decline in GDP of 1.2%. Further, the forecast assumed that the FOMC will continue to raise interest rates into early 2023 following its most recent December 2022 increase but then remain flat into early 2024. For additional discussion of our allowance for credit losses measurement methodology, see Note 2, “Summary of Significant Accounting Policies” and Note 5, “Loans and Allowance for Loan Losses” within the Notes to the Consolidated Financial Statements included in Item 8 in this Current Report on Form 8-K. For discussion of our previous methodology for estimating the allowance for loan losses, refer to Note 6, “Loans and Allowance for Loan Losses” within the Notes to the Consolidated Financial Statements included in Item 8 in this Current Report on Form 8-K and Note 2, “Summary of Significant Accounting Policies” within the Notes to the Consolidated Financial Statements included in Part II, Item 8 of our Annual Report on Form 10-K for the fiscal year ended December 31, 2021 (“2021 Form 10-K”).
Our periodic evaluation of the appropriate allowance for loan losses considers the risk characteristics of the loan portfolio, current economic conditions, and trends in loan delinquencies and charge-offs.
Noninterest Income
The following table sets forth information regarding noninterest income for the periods shown:
Noninterest Income
|
|
|
|
|
|
|
|
|
|
|
|
|
|
|
|
|
|
|
|
|
|
|
|
|
For the Year Ended December 31, |
|
Change |
|
2022 |
|
2021 |
|
Amount |
|
% |
|
(Dollars in thousands) |
| Service charges on deposit accounts |
$ |
30,392 |
|
|
$ |
24,271 |
|
|
$ |
6,121 |
|
|
25.2 |
% |
| Trust and investment advisory fees |
23,593 |
|
|
24,588 |
|
|
(995) |
|
|
(4.0) |
% |
| Debit card processing fees |
12,644 |
|
|
12,118 |
|
|
526 |
|
|
4.3 |
% |
| Interest rate swap income |
6,009 |
|
|
5,634 |
|
|
375 |
|
|
6.7 |
% |
| (Losses) income from investments held in rabbi trusts |
(10,762) |
|
|
10,217 |
|
|
(20,979) |
|
|
(205.3) |
% |
| Gains on sales of mortgage loans held for sale, net |
248 |
|
|
3,605 |
|
|
(3,357) |
|
|
(93.1) |
% |
| (Losses) gains on sales of securities available for sale, net |
(3,157) |
|
|
1,166 |
|
|
(4,323) |
|
|
(370.8) |
% |
| Other |
17,783 |
|
|
15,838 |
|
|
1,945 |
|
|
12.3 |
% |
| Total noninterest income |
$ |
76,750 |
|
|
$ |
97,437 |
|
|
$ |
(20,687) |
|
|
(21.2) |
% |
Noninterest income decreased by $20.7 million, or 21.2%, to $76.8 million for the year ended December 31, 2022 from $97.4 million for the year ended December 31, 2021. The decrease was primarily due to a $21.0 million decrease in income from investments held in rabbi trusts which resulted from a current period net loss from such investments, a $4.3 million decrease in gains on sales of securities available for sale which resulted from a current period net loss from such sales compared to a net gain in the comparative prior period, and a $3.4 million decrease in net gains on sales of mortgage loans. These decreases were partially offset by a $6.1 million increase in service charges on deposit accounts.
•Income from investments held in rabbi trusts decreased to a net loss primarily as a result of an unfavorable mark-to-market adjustment on equity securities held in these accounts resulting from a decline in the market value of equity securities held in rabbi trusts.
•Gains on sales of securities available for sale, net, decreased to a net loss due to the decision by management to sell certain available for sale securities during the year ended December 31, 2022, a portion of which were acquired in connection with our acquisition of Century and were in a net unrealized loss position at the time of sale.
•Net gains resulting from the sale of mortgage loans held for sale decreased due to a reduction in the volume of our mortgage loan sales on the secondary market which was primarily due to rising market rates of interest.
•Service charges on deposit accounts increased primarily as a result of increased corporate account analysis charges as a result of greater commercial deposit customer activity. The increased customer deposit activity is primarily attributable to our acquisition of Century.
Noninterest Expense
The following table sets forth information regarding noninterest expense for the periods shown:
Noninterest Expense
|
|
|
|
|
|
|
|
|
|
|
|
|
|
|
|
|
|
|
|
|
|
|
|
|
|
|
|
|
|
|
|
|
|
|
|
|
For the Year Ended December 31, |
|
Change |
|
Century Merger & Acquisition Expenses (1) |
|
Change Excluding Merger & Acquisition Expenses (1) |
|
2022 |
|
2021 |
|
Amount |
|
% |
|
|
|
(Dollars in thousands) |
| Salaries and employee benefits |
$ |
233,097 |
|
|
$ |
227,624 |
|
|
$ |
5,473 |
|
|
2.4 |
% |
|
$ |
15,947 |
|
|
$ |
21,420 |
|
| Office occupancy and equipment |
37,445 |
|
|
37,261 |
|
|
184 |
|
|
0.5 |
% |
|
7,198 |
|
|
7,382 |
|
| Data processing |
52,938 |
|
|
46,415 |
|
|
6,523 |
|
|
14.1 |
% |
|
1,286 |
|
|
7,809 |
|
| Professional services |
15,805 |
|
|
21,283 |
|
|
(5,478) |
|
|
(25.7) |
% |
|
9,223 |
|
|
3,745 |
|
| Marketing |
9,294 |
|
|
8,500 |
|
|
794 |
|
|
9.3 |
% |
|
— |
|
|
794 |
|
| Loan expenses |
6,384 |
|
|
9,114 |
|
|
(2,730) |
|
|
(30.0) |
% |
|
— |
|
|
(2,730) |
|
| FDIC insurance |
6,250 |
|
|
4,226 |
|
|
2,024 |
|
|
47.9 |
% |
|
— |
|
|
2,024 |
|
| Amortization of intangible assets |
1,198 |
|
|
219 |
|
|
979 |
|
|
447.0 |
% |
|
— |
|
|
979 |
|
| Other |
26,238 |
|
|
6,313 |
|
|
19,925 |
|
|
315.6 |
% |
|
1,802 |
|
|
21,727 |
|
| Total noninterest expense |
$ |
388,649 |
|
|
$ |
360,955 |
|
|
$ |
27,694 |
|
|
7.7 |
% |
|
$ |
35,456 |
|
|
$ |
63,150 |
|
(1)We recorded merger and acquisition expenses of $35.5 million during the year ended December 31, 2021 related to our acquisition of Century. These merger and acquisition expenses were deducted from the corresponding financial statement line items in the above table to compute the related change excluding such expenses for purposes of the below discussion.
Noninterest expense increased by $27.7 million, or 7.7%, to $388.6 million during the year ended December 31, 2022 from $361.0 million during the year ended December 31, 2021. The increase was primarily due to the following financial statement line items (changes excluding merger and acquisition expenses included in such financial statement line items): an $21.4 million increase in salaries and employee benefits, an $21.7 million increase in other noninterest expenses, an $7.8 million increase in data processing, and an $7.4 million increase in office occupancy and equipment. Partially offsetting these increases was a decrease in merger and acquisition expenses of $35.5 million. No merger and acquisition expenses were incurred during the year ended December 31, 2022 within continuing operations.
•Salaries and employee benefits, excluding merger and acquisition expenses, increased primarily due to salaries and wages for newly hired employees and former employees of Century who were retained following the acquisition. In addition, share-based compensation, which is related to restricted stock awards (“RSAs”) granted in the fourth quarter of 2021 and second quarter of 2022 and awards of restricted stock units (“RSUs”) and performance stock units (“PSUs”) granted in the first quarter of 2022, increased $10.3 million. The increase is due to a full year of expense recognized during the year ended December 31, 2022 related to RSAs granted in 2021 and a partial year of expense during the year ended December 31, 2022 related to RSAs, RSUs and PSUs granted in 2022. During the year ended December 31, 2021, we recognized expense related to RSAs for approximately one month as such awards were granted on November 30, 2021. As of December 31, 2021, we had not granted any awards of RSUs or PSUs. Lastly, our deferrals of loan origination-related costs decreased by $9.9 million, resulting in a corresponding increase in salaries and employee benefits expenses. These increases were partially offset by a decrease of $10.7 million in benefit expense related to our defined contribution supplemental executive retirement plan (“DC SERP”). Participant benefits are adjusted based upon deemed investment performance. Accordingly, such investments experienced a decline in value during the year ended December 31, 2022 resulting in a corresponding decrease in the related benefit expense.
•Other noninterest expenses, excluding merger and acquisition expenses, increased primarily due to a pension settlement-related expense recorded during the year ended December 31, 2022 of $12.0 million related to the Defined Benefit Plan. For additional information regarding this charge, refer to Note 17, “Employee Benefits” within the Notes to the Consolidated Financial Statements included in Item 8 in this Current Report on Form 8-K. Also contributing to the overall increase was an $2.2 million increase in liability insurance expense, which was primarily due to regular insurance rate premium increases and our acquisition of Century, which increased the number of our properties and, therefore, the scope of our required insurance coverage, a $1.9 million increase in customer bad check losses during the year ended December 31, 2022 compared to the year ended December 31, 2021, consistent with a nationwide increase in mail-based check fraud, and a $1.5 million increase in our provision for off-balance sheet credit exposures which was primarily due to an increase in unfunded loan commitments. Partially offsetting these items was a decrease of $3.3 million in legal expenses associated with the settlement of two putative consumer class action litigation matters related to overdraft and non-sufficient funds fees. The accrual for such expenses was initially recorded during the second quarter of 2021 and final settlement of the legal matters occurred during the first quarter of 2022. For additional information, refer to Note 18, “Commitments and Contingencies” within the Notes to the Consolidated Financial Statements included in Item 8 in this Current Report on Form 8-K.
•Data processing expenses, excluding merger and acquisition expenses, are primarily comprised of costs associated with the processing of customer transactions including loans and deposits and are partially impacted by fluctuations in related transaction volume. Such expenses increased during the year ended December 31, 2022 from the year ended December 31, 2021 primarily due to our acquisition of Century in the fourth quarter of 2021 which resulted in the acquisition of additional loan and deposit customers.
•Office occupancy and equipment, excluding merger and acquisition expenses, increased during the year ended December 31, 2022 as compared to the year ended December 31, 2021 primarily due to the addition of properties resulting from our acquisition of Century and which included a $2.1 million increase in depreciation expense, and lease impairment charges of $0.6 million, which were due to an early termination of a lease acquired from Century.
•Merger and acquisition expenses decreased $35.5 million from the year ended December 31, 2021 to the year ended December 31, 2022. No merger and acquisition expenses were incurred during the year ended December 31, 2022 within continuing operations. In connection with our acquisition of Century, which we completed on November 12, 2021, we incurred merger and acquisition costs of $35.5 million during the year ended December 31, 2021. For additional information on our acquisition of Century, see Note 3, “Mergers and Acquisitions” within the Notes to the Consolidated Financial Statements included in Item 8 in this Current Report on Form 8-K.
Income Taxes
We recognize the tax effect of all income and expense transactions in each year’s consolidated statements of income, regardless of the year in which the transactions are reported for income tax purposes. The following table sets forth information regarding our tax provision and applicable tax rates for the periods indicated:
Tax Provision and Applicable Tax Rates
|
|
|
|
|
|
|
|
|
|
|
|
|
For the Year Ended December 31, |
|
2022 |
|
2021 |
|
(Dollars in thousands) |
| Combined federal and state income tax provisions |
$ |
51,719 |
|
|
$ |
30,464 |
|
| Effective income tax rates |
21.7 |
% |
|
17.3 |
% |
| Blended statutory tax rate |
28.1 |
% |
|
28.1 |
% |
Income tax expense increased by $21.3 million to $51.7 million in the year ended December 31, 2022 from $30.5 million in the year ended December 31, 2021. The increase in income tax expense was due primarily to higher pre-tax income during the year ended December 31, 2022 compared to the year ended December 31, 2021 and an increase in our effective income tax rate. The increase in our effective income tax rate was due primarily to a partial release of $11.3 million during the year ended December 31, 2021 related to a valuation allowance established as of December 31, 2020 against our charitable contribution carryover deferred tax asset in connection with our 2020 charitable contribution to the Eastern Bank Foundation compared to a release of $0.7 million during the year ended December 31, 2022. For additional information related to our income taxes see Note 12, “Income Taxes” and Note 14, “Low Income Housing Tax Credits and Other Tax Credit Investments” within the Notes to the Consolidated Financial Statements included in Item 8 in this Current Report on Form 8-K.
Critical Accounting Policies and Estimates
Our discussion and analysis of our financial condition and results of operations is based upon our Consolidated Financial Statements, which have been prepared in accordance with GAAP. The preparation of these financial statements requires us to make estimates, judgments and assumptions that affect the reported amounts of assets and liabilities and the disclosure of contingent assets and liabilities at the date of the financial statements and the reported amounts of income and expenses during the reporting periods. On an ongoing basis, we evaluate our estimates and assumptions. Our actual results could differ from these estimates.
While our significant accounting policies are discussed in detail in Note 2, “Summary of Significant Accounting Policies” within the Notes to the Consolidated Financial Statements included in Item 8 in this Current Report on Form 8-K, we believe that the following accounting policies are those most critical to the judgments and estimates used in the preparation of our financial statements.
Allowance for Loan Losses. Through December 31, 2021, the allowance for loan losses represented management’s best estimate of incurred probable losses in our loan portfolios based upon management’s assessment of various factors, including the risk characteristics of our loan portfolio, current economic conditions, and trends in loan delinquencies and charge-offs. Our methodology for determining the qualitative component through December 31, 2021 included an assessment of factors affecting the determination of incurred losses in the loan portfolio. Such factors included trends in economic conditions, loan growth, credit underwriting policy exceptions, regulatory and audit findings, and peer comparisons, among others. Upon adoption of ASU 2016-13, effective January 1, 2022, we changed our reserve methodology to estimate expected credit losses over the contractual life of loans and leases. The allowance for credit losses, or ACL, is established to provide for our current estimate of expected lifetime credit losses on loans measured at amortized cost and unfunded lending commitments at the balance sheet date and is established through a provision for credit losses charged to net income.
Management uses a methodology to systematically estimate the amount of expected lifetime losses in the portfolio. Expected lifetime losses are estimated on a collective basis for loans sharing similar risk characteristics and are determined using a quantitative model combined with an assessment of certain qualitative factors designed to address forecast risk and model risk inherent in the quantitative model output. For commercial and industrial, commercial real estate, commercial construction and business banking portfolios, the quantitative model uses a loan rating system which is comprised of management’s determination of a financial asset’s probability of default (“PD”), loss given default (“LGD”) and exposure at default (“EAD”), which are derived from historical loss experience and other factors. For residential real estate, consumer home equity and other consumer portfolios, our quantitative model uses historical loss experience.
The quantitative model estimates expected credit losses using loan level data over the estimated life of the exposure, considering the effect of prepayments. Economic forecasts, one of the most significant judgments influencing the ACL, are incorporated into the estimate over a reasonable and supportable forecast period of eight quarters, beyond which is a reversion to our historical loss average which occurs over a period of four quarters.
Management’s estimate of the ACL as of December 31, 2022 was supported, in part, by Oxford Economic’s, December 2022 Baseline forecast (“the forecast”). The forecast assumed the U.S. economy will enter a recession in the second quarter of 2023, reflecting the combination of persistently high inflation, aggressive Federal Reserve monetary policy tightening, slower GDP activity, and weaker corporate earnings, all of which are expected to adversely impact consumers’ and businesses’ willingness to spend. Primary macroeconomic assumptions included in management’s evaluation of the adequacy of the allowance for loan losses included continued low, but rising, unemployment rates which are expected to continue to rise until their peak in early 2024, and a peak-to-trough decline in GDP of 1.2%. Further, the forecast assumed that the FOMC will continue to raise interest rates into early 2023 following its December 2022 increase but then remain flat into early 2024. Changes in the economic forecast could significantly affect the estimated credit losses which could potentially lead to materially different reserve amounts from one reporting period to the next.
To illustrate the sensitivity of the modeled result to the impact of a hypothetical change in the economic forecast, management calculated the allowance for loan losses assuming the downside economic forecast scenario and, separately, the upside economic forecast scenario were used. The downside scenario assumed the US economy will enter a recession in the first quarter of 2023 and experience a decline in GDP of 3.2% peak-to-trough. Use of the downside scenario would have resulted in an incremental increase in the allowance for loan losses of approximately $10.4 million as of December 31, 2022. The upside scenario assumed GDP growth of 1.4% in 2023, 1.9% in 2024 and sustained recovery. Use of the upside scenario would have resulted in an incremental decrease in the allowance for loan losses of approximately $3.1 million as of December 31, 2022.
For additional information on our allowance for loan losses, refer to Note 5, “Loans and Allowance for Loan Losses” within the Notes to the Consolidated Financial Statements included in Item 8 in this Current Report on Form 8-K.
Income Taxes. We account for income taxes by establishing deferred tax assets and liabilities for the temporary differences between the accounting basis and the tax basis of our assets and liabilities at enacted tax rates. We make significant judgments regarding the amount and timing of recognition of deferred tax assets and liabilities. This requires subjective projections of future taxable income resulting from interest on loans and securities, as well as noninterest income. A valuation allowance is established if it is considered more likely than not that all or a portion of the deferred tax assets will not be realized. Interest and penalties paid on the underpayment of income taxes are classified as income tax expense.
We periodically evaluate the potential uncertainty of our tax positions as to whether it is more likely than not its position would be upheld upon examination by the appropriate taxing authority. The tax position is measured at the largest amount of benefit that we believe is greater than 50% likely of being realized upon settlement.
For additional information on our income taxes, refer to Note 12, “Income Taxes” within the Notes to the Consolidated Financial Statements included in Item 8 in this Current Report on Form 8-K.
Pension and other Post Retirement Benefit Plans. For information regarding our pension and other postretirement benefit plans including our pension contributions, investment strategies, assumptions, the change in benefit obligation and related plan assets, pension funding requirements and future net benefit payments, refer to Note 2, “Summary of Significant Accounting Policies” and Note 17, “Employee Benefits” within the Notes to the Consolidated Financial Statements included in Item 8 in this Current Report on Form 8-K.
Our defined benefit pension plans are accounted for on an actuarial basis, which requires the selection of various assumptions, including an expected long-term rate of return on plan assets for our Qualified Defined Benefit Pension Plan (“Defined Benefit Plan”), a discount rate, lump sum conversion rates, compensation and benefit limitation increase assumptions, mortality rates of participants and expectation of mortality improvement. The expected long-term rate of return on plan assets that is utilized in determining Defined Benefit Plan pension expense is derived from periodic studies, which include a review of asset allocation strategies, investment policy, amount and types of expenses that will be paid from the Defined Benefit Plan, and the expected long-term return for the Defined Benefit Plan using recent forward looking capital market assumptions published by leading financial organizations. While the studies give appropriate consideration to recent plan performance and historical returns, the assumptions are primarily long-term, prospective rates of return.
An investment policy study was completed for the Defined Benefit Pension Plan as of December 31, 2022. As a result of the study, it was determined that the weighted-average long-term rate of return on assets in effect at December 31, 2021 of 7.00%, should be increased to 7.50% at December 31, 2022.
Another key assumption in determining net pension expense is the assumed discount rate used to discount plan obligations. We estimate the assumed discount rate for all pension plans using a cash flow matching approach, which uses projected cash flows matched to spot rates along the Financial Times Stock Exchange (“FTSE”) above-median yield curve to determine the weighted-average discount rate for the calculation of the present value of cash flows. We apply the individual annual yield curve rates instead of the assumed discount rate to determine the service cost and interest cost, which more specifically links the cash flows related to service cost and interest cost to bonds maturing in their year of payment.
For our Defined Benefit Plan and the Non-Qualified Benefit Equalization Plan, the interest rates used to convert annuities to the actuarial equivalent lump sum amounts were selected based on the applicable segment rates under Internal Revenue Code Section 417(e) for the plan year beginning on November 1, 2022.
The Society of Actuaries (“SOA”) most recently issued mortality improvement tables during the year ended December 31, 2021. We reviewed our recent mortality experience and we determined our current mortality assumptions were appropriate to measure our pension plan obligations as of December 31, 2022.
Significant differences in actual experience or significant changes in assumptions may materially affect the pension obligations. The effects of actual results differing from assumptions and the changing of assumptions are included in unamortized net actuarial gains and losses that are subject to amortization to pension expense over future periods. The unamortized pre-tax actuarial loss on all of our pension plans was $99.0 million and $128.4 million at December 31, 2022 and December 31, 2021, respectively. The year-over-year change was primarily due to an increase in discount rate assumptions used for determining the benefit obligation and lump sum conversion rates.
The overfunded status of all of our pension plans improved during the year ended December 31, 2022 to $56.8 million from $44.5 million primarily due to: (i) the favorable effect of an increase in discount rates of $97.6 million; (ii) the favorable effect of an increase in lump sum conversion rates of $39.3 million; and (iii) changes in other actuarial assumptions and demographic data updates; partially offset by (iv) the unfavorable effect of increased service and interest costs of $4.6 million; and (v) actual pension plan investment returns less than expected of $127.0 million.
The following table illustrates the sensitivity to a change in certain assumptions for the pension plans, holding all other assumptions constant:
|
|
|
|
|
|
|
|
|
|
|
|
|
Effect on 2023 Pension Expense |
|
Effect on December 31, 2022 Pension Benefit Obligation |
|
(in thousands) |
| 25 basis point decrease in discount rate |
$ |
539 |
|
|
$ |
7,786 |
|
| 25 basis point increase in discount rate |
(519) |
|
|
(7,472) |
|
| 25 basis point decrease in expected rate of return on plan assets |
1,005 |
|
|
N/A |
| 25 basis point increase in expected rate of return on plan assets |
(1,005) |
|
|
N/A |
| 25 basis point decrease in lump sum conversion rates |
494 |
|
|
3,558 |
|
| 25 basis point increase in lump sum conversion rates |
(472) |
|
|
(3,404) |
|
Recent Accounting Pronouncements
In October 2021, the FASB issued ASU 2021-08, Business Combinations (Topic 805): Accounting for Contract Assets and Contract Liabilities from Contracts with Customers (“ASU 2021-08”). This update modifies how an acquiring entity measures contract assets and contract liabilities of an acquiree in a business combination in accordance with Topic 606. The amendments in this update require the acquiring entity in a business combination to account for revenue contracts as if they had originated the contract and assess how the acquiree accounted for the contract under Topic 606. ASU 2021-08 improves comparability of recognition and measurement of revenue contracts with customers both before and after a business combination. For public business entities, the amendments in this update are effective for fiscal years beginning after December 15, 2022. For all other entities, the amendments are effective for fiscal years beginning after December 15, 2023. The amendments in this update should be applied prospectively to business combinations occurring on or after the effective date of the amendments with early adoption permitted. We expect the adoption of this standard will not have a material impact on our Consolidated Financial Statements.
In March 2022, the FASB issued ASU 2022-02, Financial Instruments–Credit Losses (Topic 326): Troubled Debt Restructurings and Vintage Disclosures (“ASU 2022-02”). The amendments in this update eliminate the accounting guidance on troubled debt restructurings (“TDRs”) for creditors in ASC 310-40 and amends the guidance on vintage disclosures, referenced in ASC 326-20-50, to require disclosure of current-period gross write-offs by year of origination. This update supersedes the existing accounting guidance for TDRs in ASC 310-40 in its entirety and requires entities to evaluate all receivable modifications under existing accounting guidance in ASC 310-20 to determine whether a modification made to a borrower results in a new loan or a continuation of an existing loan. In addition to the elimination of TDR accounting guidance, entities that adopt this update will no longer consider renewals, modifications and extensions that result from reasonably expected TDRs in their calculation of the allowance for credit losses. Further, if an entity employs a discounted cash flow method to calculate the allowance for credit losses, it will be required to use a post-modification-derived effective interest rate as part of its calculation. The update also requires new disclosures for receivables for which there has been a modification in their contractual cash flows resulting from borrowers experiencing financial difficulties. For public business entities, the amendments in this update are effective for fiscal years beginning after December 15, 2022, including interim periods within those fiscal years. Entities may elect to apply the updated guidance on TDR recognition and measurement by using a modified retrospective transition method. The amendments on TDR disclosures and vintage disclosures should be adopted prospectively. On January 1, 2023, we adopted this standard using the modified retrospective method with respect to the updated guidance on TDR recognition and measurement and the prospective approach with regard to the TDR and vintage disclosures. The adoption of this standard did not have a material impact on our Consolidated Financial Statements.
In March 2023, the FASB issued ASU 2023-02, Investments–Equity Method and Joint Ventures (Topic 323): Accounting for Investments in Tax Credit Structures Using the Proportional Amortization Method (“ASU 2023-02”). This update permits reporting entities to elect to account for their tax equity investments, regardless of the tax credit program from which the income tax credits are received, using the proportional amortization method if the following conditions are met:
1.It is probable that the income tax credits allocable to the tax equity investor will be available.
2.The tax equity investor does not have the ability to exercise significant influence over the operating and financial policies of the underlying project.
3.Substantially all of the projected benefits are from income tax credits and other income tax benefits. Projected benefits include income tax credits, other income tax benefits, and other non-income-tax-related benefits. The projected benefits are determined on a discounted basis, using a discount rate that is consistent with the cash flow assumptions used by the tax equity investor in making its decision to invest in the project.
4.The tax equity investor’s projected yield based solely on the cash flows from the income tax credits and other income tax benefits is positive.
5.The tax equity investor is a limited liability investor in the limited liability entity for both legal and tax purposes, and the tax equity investor’s liability is limited to its capital investment.
Under existing accounting standards, the proportional amortization method is allowable only for equity investments in low-income-housing tax credit structures. Under the proportional amortization method, an entity amortizes the initial cost of the investment in proportion to the income tax credits and other income tax benefits received and recognizes the net amortization and income tax credits and other income tax benefits in the income statement as a component of income tax expense (benefit). Updates made by ASU 2023-02 allow a reporting entity to make an accounting policy election to apply the proportional amortization method on a tax-credit-program-by-tax-credit-program basis. We had previously made an accounting policy election to account for our investments in low-income-housing tax credit investments using the proportional amortization method. This election was made upon our adoption of ASU 2014-01, Investments–Equity Method and Joint Ventures (Topic 323): Accounting for Investments in Qualified Affordable Housing Projects, which introduced the option to apply proportional amortization to low-income-housing tax credit investments. For public business entities, the amendments in ASU 2023-02 are effective for fiscal years beginning after December 15, 2023, including interim periods within those fiscal years. Early adoption is permitted for all entities in an interim period. We expect the adoption of this standard will not have a material impact on our Consolidated Financial Statements.
In October 2023, the FASB issued ASU 2023-06, Disclosure Improvements–Codification Amendments in Response to the SEC’s Disclosure Update and Simplification Initiative (“ASU 2023-06”). The amendments in this update modify the disclosure or presentation requirements for a variety of topics in the codification. Certain amendments represent clarifications to or technical corrections of the current requirements. The following is a summary of the topics included in the update and which pertain to the Company:
1.Statement of cash flows (Topic 230): Requires an accounting policy disclosure in annual periods of where cash flows associated with derivative instruments and their related gains and loses are presented in the statement of cash flows;
2.Accounting changes and error corrections (Topic 250): Requires that when there has been a change in the reporting entity, the entity disclose any material prior-period adjustment and the effect of the adjustment on retained earnings in interim financial statements;
3.Earnings per share (Topic 260): Requires disclosure of the methods used in the diluted earnings-per-share computation for each dilutive security and clarifies that certain disclosures should be made during interim periods, and amends illustrative guidance to illustrate disclosure of the methods used in the diluted earnings per share computation;
4.Commitments (Topic 440): Requires disclosure of assets mortgaged, pledged, or otherwise subject to lien and the obligations collateralized; and
5.Debt (Topic 470): Requires disclosure of amounts and terms of unused lines of credit and unfunded commitments and the weighted-average interest rate on outstanding short-term borrowings.
For public business entities, the amendments in ASU 2023-06 are effective on the date which the SEC’s removal of that related disclosure from Regulation S-X or Regulation S-K becomes effective. If by June 30, 2027, the SEC has not removed the applicable requirement from Regulation and S-X or Regulation S-K, the pending content of the related amendment will be removed from the codification and will not become effective for any entity. Early adoption is not permitted and the amendments are required to be applied on a prospective basis. We expect the adoption of this standard will not have a material impact on our Consolidated Financial Statements.
For a description of recent accounting pronouncements that may affect our financial position or results of operations, refer to Note 2, “Summary of Significant Accounting Policies” within the Notes to the Consolidated Financial Statements included in Item 8 in this Current Report on Form 8-K.
Management of Market Risk
General. Market risk is the sensitivity of the net present value of assets and liabilities and/or income to changes in interest rates, foreign exchange rates, commodity prices and other market-driven rates or prices. Interest rate sensitivity is the most significant market risk to which we are exposed. Interest rate risk is the sensitivity of the net present value of assets and liabilities and/or income to changes in interest rates. Changes in interest rates, as well as fluctuations in the level and duration of assets and liabilities, affect net interest income, our primary source of income. Interest rate risk arises directly from our core banking activities. In addition to directly impacting net interest income, changes in the level of interest rates can also affect the amount of loans originated, the timing of cash flows on loans and securities, and the fair value of securities and derivatives, as well as other effects.
The primary goal of interest rate risk management is to control this risk within limits approved by the Risk Management Committee of our Board of Directors.
These limits reflect our tolerance for interest rate risk over both short-term and long-term horizons. We attempt to manage interest rate risk by identifying, quantifying, and where appropriate, hedging our exposure. If assets and liabilities do not re-price simultaneously and in equal volume, the potential for interest rate exposure exists. Our objective is to maintain stability in the growth of net interest income through the maintenance of an appropriate mix of interest-earning assets and interest-bearing liabilities and, when necessary and within limits that management determines to be prudent, through the use of off-balance sheet hedging instruments including, but not limited to, interest rate swaps, floors and caps.
Net Interest Income. We analyze our sensitivity to changes in interest rates through a net interest income model. We estimate what our net interest income would be for a 12-month period assuming no changes in interest rates. We then estimate what the net interest income would be for the same period under the assumption that market rates increase or decrease instantaneously by +200, +300, +400, -100 and -200 basis point increments, with changes in interest rates representing immediate and permanent, parallel shifts in the yield curve. A basis point equals one-hundredth of one percent, and 100 basis points equals one percent. An increase in interest rates from 3% to 4% would mean, for example, a 100 basis point increase in the “Changes in Interest Rates” column below. The model requires that interest rates remain positive for all points along the yield curve for each rate scenario which may preclude the modeling of certain falling rate scenarios during periods of lower market interest rates. The relatively low level of market interest rates prevalent at December 31, 2021 precluded the modeling of certain falling rate scenarios. We do not model negative interest rate scenarios.
The tables below set forth, as of December 31, 2022 and 2021, the calculation of the estimated changes in our net interest income on an FTE basis that would result from the designated immediate changes in market interest rates:
Interest Rate Sensitivity
|
|
|
|
|
|
|
|
|
|
|
|
|
|
|
|
|
As of December 31, 2022 |
Change in
Interest Rates
(basis points) |
|
Net Interest
Income Year 1
Forecast |
|
Year 1
Change from
Level |
|
|
(Dollars in thousands) |
| 400 |
|
$ |
528,247 |
|
|
(8.4)% |
| 300 |
|
539,739 |
|
|
(6.4)% |
| 200 |
|
552,231 |
|
|
(4.2)% |
| Flat |
|
576,477 |
|
|
—% |
| (100) |
|
585,728 |
|
|
1.6% |
| (200) |
|
586,771 |
|
|
1.8% |
|
|
|
|
|
|
|
As of December 31, 2021 |
|
Change in
Interest Rates
(basis points) (1)
|
|
Net Interest
Income Year 1
Forecast |
|
Year 1
Change from
Level |
|
|
(Dollars in thousands) |
| 400 |
|
$ |
663,207 |
|
|
30.2% |
| 300 |
|
624,384 |
|
|
22.6% |
| 200 |
|
586,319 |
|
|
15.1% |
| Flat |
|
509,379 |
|
|
—% |
| (100) |
|
479,489 |
|
|
(5.9)% |
(1)Assumes an immediate uniform change in interest rates at all maturities, except in the down 100 basis points scenario, where rates are floored at zero at all maturities.
As of December 31, 2022, our models, as indicated above, show a decline in our net interest income in rising rate scenarios and an increase in our net interest income in falling rate scenarios. In the rising rate scenarios, interest expense is expected to rise at a faster rate than interest income due, in part, to the extension of asset duration from our interest rate swap portfolio designated as cash flow hedges and the reduction of liability duration due to the increase in short term certificates of deposit and borrowings. Conversely, in the declining rate scenarios, the reduction in interest expense exceeds the reduction in interest income.
The tables above indicate that at December 31, 2022 and December 31, 2021, in the event of an instantaneous parallel 200 basis points increase in rates, we would have experienced a 4.2% decrease and a 15.1% increase, respectively, in net interest income on an FTE basis, and in the event of an instantaneous 100 basis points decrease in interest rates, we would have experienced a 1.6% increase and a 5.9% decrease at December 31, 2022 and December 31, 2021, respectively, in net interest income, on an FTE basis. We also modeled an instantaneous 200 basis point decrease in interest rates at December 31, 2022, the results of which showed we would have experienced a 1.8% increase in net interest income, on an FTE basis. We did not model an instantaneous 200 basis points decrease in interest rates at December 31, 2021 given the relatively low level of interest rates. Management may use investment strategy, loan and deposit pricing, non-core funding strategies, and interest rate derivative financial instruments, within internal policy guidelines, to manage interest rate risk as part of our asset/liability strategy. These derivatives provide significant protection against falling interest rates. For additional information related to our interest rate derivative financial instruments, see Note 19, “Derivative Financial Instruments” within the Notes to the Consolidated Financial Statements included in Part II, Item 8 in this Current Report on Form 8-K
Economic Value of Equity Analysis. We also analyze the sensitivity of our financial condition in interest rates through our economic value of equity (“EVE”) model. This analysis calculates the difference between the present value of expected cash flows from assets and liabilities assuming various changes in current interest rates.
The table below represents an analysis of our interest rate risk as measured by the estimated changes in our EVE, resulting from an instantaneous and sustained parallel shift in the yield curve (+200, +300, +400 basis points and -100, -200 basis points) at December 31, 2022 and (+200, +300, +400 basis points and -100 basis points) December 31, 2021. The model requires that interest rates remain positive for all points along the yield curve for each rate scenario which may preclude the modeling of certain falling rate scenarios during periods of lower market interest rates. The relatively low level of interest rates prevalent at December 31, 2021 precluded the modeling of certain falling rate scenarios, including negative interest rates.
Our earnings are not directly or materially impacted by movements in foreign currency rates or commodity prices. Movements in equity prices may have a modest impact on earnings by affecting the volume of activity or the amount of fees from investment-related business lines and by affecting the amount of unrealized gains and losses from securities held in rabbi trusts which are partially offset by a corresponding but opposite impact to the amount of employee benefit expense associated with the change in value of plan assets.
EVE Interest Rate Sensitivity
|
|
|
|
|
|
|
|
|
|
|
|
|
|
|
|
|
|
|
|
|
|
|
|
|
|
|
Change in Interest
Rates (basis points) |
|
Estimated EVE (2) |
|
As of December 31, 2022 |
|
EVE as a
Percentage of
Total Assets (3) |
|
Estimated Increase (Decrease) in EVE from Level |
|
|
|
Amount |
|
Percent |
|
|
|
(Dollars in thousands) |
| 400 |
|
$ |
3,691,963 |
|
|
$ |
(691,696) |
|
|
(15.8) |
% |
|
18.48 |
% |
| 300 |
|
3,834,512 |
|
|
(549,147) |
|
|
(12.5) |
% |
|
18.72 |
% |
| 200 |
|
4,007,265 |
|
|
(376,394) |
|
|
(8.6) |
% |
|
19.04 |
% |
| Flat |
|
4,383,659 |
|
|
— |
|
|
— |
|
|
19.66 |
% |
| (100) |
|
4,527,743 |
|
|
144,084 |
|
|
3.3 |
% |
|
19.74 |
% |
| (200) |
|
4,620,994 |
|
|
237,335 |
|
|
5.4 |
% |
|
19.61 |
% |
|
|
|
|
|
|
|
|
|
|
|
|
|
|
|
|
|
|
|
|
|
|
|
|
|
|
|
Change in Interest
Rate (basis points) (1) |
|
Estimated EVE (2) |
|
As of December 31, 2021 |
|
EVE as a
Percentage of
Total Assets (3) |
|
Estimated Increase (Decrease) in EVE from Level |
|
|
|
Amount ($) |
|
Percent (%) |
|
|
|
(Dollars in thousands) |
| 400 |
|
$ |
4,573,359 |
|
|
$ |
27,408 |
|
|
0.6 |
% |
|
21.30 |
% |
| 300 |
|
4,565,019 |
|
|
19,068 |
|
|
0.4 |
% |
|
20.80 |
% |
| 200 |
|
4,589,035 |
|
|
43,084 |
|
|
0.9 |
% |
|
20.39 |
% |
| Flat |
|
4,545,951 |
|
|
— |
|
|
— |
|
|
17.06 |
% |
| (100) |
|
4,270,433 |
|
|
(275,518) |
|
|
(6.1) |
% |
|
17.75 |
% |
(1)Assumes an immediate uniform change in interest rates at all maturities, except in the down 100 basis points scenario, where rates are floored at zero at all maturities.
(2)EVE is the discounted present value of expected cash flows from assets, liabilities and off-balance sheet contracts.
(3)Present value of assets represents the discounted present value of incoming cash flows on interest-earning assets.
Certain shortcomings are inherent in the interest rate risk measurement methodologies underlying the data presented in the tables in this section. Modeling changes require making certain assumptions that may or may not reflect the manner in which actual yields and costs respond to changes in market interest rates.
For example, the models assume that the composition of our interest-sensitive assets and liabilities existing at the beginning of a period remains constant over the period being measured and assume that a particular change in interest rates is reflected uniformly across the yield curve regardless of the duration or repricing of specific assets and liabilities. Accordingly, although the tables provide an indication of our interest rate risk exposure at a particular point in time, such measurements are not intended to and do not provide a precise forecast of the effect of changes in market interest rates, and actual results may differ.
Liquidity, Capital Resources, Contractual Obligations, Commitments and Contingencies
Liquidity. Liquidity describes our ability to meet the financial obligations that arise in the normal course of business. Liquidity is primarily needed to meet deposit withdrawals and anticipated loan fundings, as well as current and planned expenditures. We seek to maintain sources of liquidity that are deep and diversified and that may be used during the normal course of business as well as on a contingency basis.
Our primary sources of funds are deposits, principal and interest payments on loans and securities, and proceeds from calls, maturities and sales of securities, subject to market conditions. While maturities and scheduled amortization of loans and securities are predictable sources of funds, deposit flows and loan and securities prepayments are greatly influenced by general interest rates, economic conditions, and competition. Our most liquid assets are unencumbered cash and due from banks and securities classified as available for sale, which could be liquidated, subject to market conditions. In the future, our liquidity position will be affected by the level of customer deposits and payments, as well as acquisitions, dividends, and share repurchases in which we may engage. For the next twelve months, we believe that our existing resources, including our capacity to use brokered deposits and wholesale borrowings, will be sufficient to meet the liquidity and capital requirements of our operations. We may elect to raise additional capital through the sale of additional equity or debt financing to fund business activities such as strategic acquisitions, share repurchases, or other purposes beyond the next twelve months.
At December 31, 2022, we had $169.5 million of cash and cash equivalents, a decrease of $1.1 billion from $1.2 billion at December 31, 2021. The reduction in cash levels was due primarily to a $1.3 billion increase in total loans, on a gross basis, and a $654.0 million decrease in total deposits. Advances from the FHLBB were used to support ongoing operations and totaled $704.1 million at December 31, 2022.
We participate in the IntraFi Network, which allows us to provide access to multi-million dollar FDIC deposit insurance protection on customer deposits for consumers, businesses and public entities. We can elect to sell or repurchase this funding as reciprocal deposits from other IntraFi Network banks depending on our funding needs. At December 31, 2022, we had no IntraFi Network one-way sell deposits. At December 31, 2021, we had $520.5 million of IntraFi Network one-way sell deposits. At December 31, 2022, we had repurchased $665.0 million of previously sold reciprocal deposits. At December 31, 2021, no amounts were repurchased of previously sold reciprocal deposits. The additional capacity of $520.5 million at December 31, 2021 was considered a source of liquidity.
Although customer deposits remain our preferred source of funds, maintaining additional sources of liquidity is part of our prudent liquidity risk management practices. We have the ability to borrow from the FHLBB. At December 31, 2022, we had $704.1 million in outstanding advances and the ability to borrow up to an additional $2.0 billion. We also have the ability to borrow from the Federal Reserve Bank of Boston. At December 31, 2022, we had a $538.9 million collateralized line of credit from the Federal Reserve Bank of Boston with no outstanding balance. In addition, we are able to acquire brokered deposits at our discretion to raise additional funds. At December 31, 2022, we had $928.6 million in brokered certificates of deposit of which $40.5 million were IntraFi Network deposits and which are excluded from the Intrafi Network reciprocal deposits shown in the table below.
On September 19, 2023, we announced that we had entered into an agreement with Gallagher to sell our insurance agency business for a gross purchase price of $515.0 million, subject to customary post-closing working capital adjustments. We plan to use the proceeds from the sale to pay down our short-term FHLB borrowings. For further discussion refer to “Outlook and Trends” within this Item 7 and Note 24, “Discontinued Operations” and Note 27, “Subsequent Events” within the Notes to the Consolidated Financial Statements included in Item 8 in this Current Report on Form 8-K for additional discussion.
Sources of Liquidity
|
|
|
|
|
|
|
|
|
|
|
|
|
|
|
|
|
|
|
|
|
|
|
|
|
As of December 31, |
|
2022 |
|
2021 |
|
Outstanding |
|
Additional
Capacity |
|
Outstanding |
|
Additional
Capacity |
|
|
|
(In thousands) |
|
|
| IntraFi Network reciprocal deposits |
$ |
664,971 |
|
|
$ |
— |
|
|
$ |
— |
|
|
$ |
520,461 |
|
| Brokered certificates of deposit (1) |
928,648 |
|
|
— |
|
|
— |
|
|
— |
|
| Federal Home Loan Bank (2) |
704,084 |
|
|
1,976,166 |
|
|
14,020 |
|
|
1,839,540 |
|
| Federal Reserve Bank of Boston (3) |
— |
|
|
538,894 |
|
|
— |
|
|
456,148 |
|
| Total |
$ |
2,297,703 |
|
|
$ |
2,515,060 |
|
|
$ |
14,020 |
|
|
$ |
2,816,149 |
|
(1)The additional borrowing capacity has not been assessed for this category.
(2)As of December 31, 2022 and December 31, 2021, loans have been pledged to the FHLBB with a carrying value of $3.9 billion and $2.6 billion, respectively, to secure our total borrowing capacity.
(3)Loans with a carrying value of $1.1 billion and $0.8 billion at December 31, 2022 and 2021, respectively, have been pledged to the Federal Reserve Bank of Boston resulting in this additional unused borrowing capacity.
We believe that advanced preparation, early detection, and prompt responses can avoid, minimize, or shorten potential liquidity crises. Our Board of Directors and our management’s Asset Liability Committee have put a liquidity contingency plan in place to establish methods for assessing and monitoring risk levels, as well as potential responses during unanticipated stress events. As part of our risk management framework, we perform periodic liquidity stress testing to assess our need for liquid assets as well as backup sources of liquidity.
Capital Resources. We are subject to various regulatory capital requirements administered by the Massachusetts Commissioner of Banks, the FDIC and the Federal Reserve (with respect to our consolidated capital requirements). At December 31, 2022 and 2021, we exceeded all applicable regulatory capital requirements, and were considered “well capitalized” under regulatory guidelines. For additional information regarding our regulatory capital requirements, refer to Note 16, “Minimum Regulatory Capital Requirements” within the Notes to the Consolidated Financial Statements included in Item 8 in this Current Report on Form 8-K.
Contractual Obligations, Commitments and Contingencies. In the ordinary course of our operations, we enter into certain contractual obligations. Such obligations include operating leases for premises and equipment, agreements with respect to borrowed funds and deposit liabilities. The amounts below assume the contractual obligations and commitments will run through the end of the applicable term and, as such, do not include early termination fees or penalties where applicable.
The following table summarizes our short-term (e.g. maturity of one year or less) and long-term (e.g. maturity of greater than one year) contractual obligations, other commitments and contingencies at December 31, 2022.
|
|
|
|
|
|
|
|
|
|
|
|
|
|
|
|
|
|
|
One Year or Less |
|
After One Year |
|
Total |
|
(In thousands) |
| Commitments to extend credit (1) |
$ |
977,827 |
|
|
$ |
4,702,611 |
|
|
$ |
5,680,438 |
|
| Standby letters of credit |
59,126 |
|
|
6,028 |
|
|
65,154 |
|
| Operating lease obligations |
14,858 |
|
|
28,212 |
|
|
43,070 |
|
| FHLB advances |
691,297 |
|
|
12,787 |
|
|
704,084 |
|
| Forward commitments to sell loans |
10,008 |
|
|
— |
|
|
10,008 |
|
| Total |
$ |
1,753,116 |
|
|
$ |
4,749,638 |
|
|
$ |
6,502,754 |
|
(1)Unused commitments that are deemed to be unconditionally cancellable are included in the less than one year category in the above table. Commitments to extend credit was comprised of $3.4 billion of commitments under commercial loans and lines of credit (including $713.3 million of unadvanced portions of construction loans), $2.0 billion of commitments under home equity loans and lines of credit, $198.6 million in overdraft coverage commitments, $24.9 million of unfunded commitments related to residential real estate loans and $56.1 million in other consumer loans and lines of credit as of December 31, 2022.
ITEM 8. FINANCIAL STATEMENTS
Report of Independent Registered Public Accounting Firm
To the Shareholders and the Board of Directors of Eastern Bankshares, Inc.
Opinion on the Financial Statements
We have audited the accompanying consolidated balance sheets of Eastern Bankshares, Inc. (the Company) as of December 31, 2022 and 2021, the related consolidated statements of income, comprehensive income, changes in shareholders' equity and cash flows for each of the three years in the period ended December 31, 2022, and the related notes (collectively referred to as the “consolidated financial statements”). In our opinion, the consolidated financial statements present fairly, in all material respects, the financial position of the Company at December 31, 2022 and 2021, and the results of its operations and its cash flows for each of the three years in the period ended December 31, 2022, in conformity with U.S. generally accepted accounting principles.
We also have audited, in accordance with the standards of the Public Company Accounting Oversight Board (United States) (PCAOB), the Company's internal control over financial reporting as of December 31, 2022, based on criteria established in Internal Control-Integrated Framework issued by the Committee of Sponsoring Organizations of the Treadway Commission (2013 framework) and our report dated February 24, 2023 expressed an unqualified opinion thereon.
Adoption of ASU No. 2016-13
As discussed in Note 2 to the consolidated financial statements, the Company changed its method of accounting for credit losses in 2022 due to the adoption of Accounting Standards Update (ASU) No. 2016-13, Financial Instruments – Credit Losses (Topic 326): Measurement of Credit Losses on Financial Instruments, and the related amendments. See below for discussion of our related critical audit matter.
Basis for Opinion
These financial statements are the responsibility of the Company's management. Our responsibility is to express an opinion on the Company’s financial statements based on our audits. We are a public accounting firm registered with the PCAOB and are required to be independent with respect to the Company in accordance with the U.S. federal securities laws and the applicable rules and regulations of the Securities and Exchange Commission and the PCAOB.
We conducted our audits in accordance with the standards of the PCAOB. Those standards require that we plan and perform the audit to obtain reasonable assurance about whether the financial statements are free of material misstatement, whether due to error or fraud. Our audits included performing procedures to assess the risks of material misstatement of the financial statements, whether due to error or fraud, and performing procedures that respond to those risks. Such procedures included examining, on a test basis, evidence regarding the amounts and disclosures in the financial statements. Our audits also included evaluating the accounting principles used and significant estimates made by management, as well as evaluating the overall presentation of the financial statements. We believe that our audits provide a reasonable basis for our opinion.
Critical Audit Matter
The critical audit matter communicated below is a matter arising from the current period audit of the financial statements that was communicated or required to be communicated to the audit committee and that: (1) relates to accounts or disclosures that are material to the financial statements and (2) involved especially challenging, subjective, or complex judgments. The communication of the critical audit matter does not alter in any way our opinion on the consolidated financial statements, taken as a whole, and we are not, by communicating the critical audit matter below, providing a separate opinion on the critical audit matter or on the account or disclosures to which it relates.
|
|
|
|
|
|
|
Allowance for loan losses |
|
|
| Description of the matter |
The Company’s loan portfolio totaled $13.6 billion as of December 31, 2022. As of December 31, 2022, management established an allowance for loan losses of $142.2 million. As described in Note 2 and Note 5 to the consolidated financial statements, the Company uses its allowance methodology to systematically estimate the amount of expected lifetime losses in the loan portfolio. Expected lifetime losses are estimated on a collective basis for loans sharing similar risk characteristics and are determined using a quantitative model based on management’s determination of a loan’s probability of default, loss given default and exposure at default, which are derived from the Company’s historical loss experience, industry loss experience and other factors, adjusted for economic forecasts. The quantitative model is combined with an assessment of certain qualitative factors designed to address forecast risk and model risk inherent in the quantitative model output.
Auditing the Company’s allowance for loan losses was complex due to the quantitative modeling used and involved subjective judgment to evaluate management’s assessment of qualitative factors in determining adjustments to the quantitative model output.
|
|
|
| How we addressed the matter in our audit |
We obtained an understanding, evaluated the design, and tested the operating effectiveness of controls over the Company’s allowance for loan losses process, which included, among others, controls over the appropriateness of the methodology, the development, operation and monitoring of the quantitative model, management’s review of the qualitative adjustments to the quantitative model output and overall model result.
With the assistance of EY Specialists, we tested management’s quantitative model including evaluating the model validation procedures performed over conceptual soundness of model methodology, assessing model governance policies and procedures, and assessing the conceptual soundness of the Company’s qualitative factor framework utilized in determining the overall allowance for loan losses.
To test the qualitative risk factors, among other procedures, we assessed management’s methodology and considered whether relevant risks were reflected in the models and whether adjustments to the model output were appropriate. We tested the completeness, accuracy and relevance of the underlying data used to estimate the qualitative adjustments. We evaluated whether qualitative adjustments were reasonable based on changes in economic conditions, the loan portfolio, management’s policies and procedures, external legal and regulatory factors, and lending personnel. We tested whether management’s final qualitative factor weighting was consistent with the external and internal evidence obtained. Further, we performed an independent search for the existence of new or contrary information relating to risks impacting the qualitative adjustments to validate that management’s considerations were appropriate. Additionally, we performed an analysis examining quarter-over-quarter changes to the Company’s qualitative factor adjustments to test reasonableness and timing of changes to the Company’s qualitative factors.
|
/s/ Ernst & Young LLP
We have served as the Company’s auditor since 2002.
Boston, Massachusetts
February 24, 2023,
except for the presentation of discontinued operations for the insurance agency business as described in Note 24 and for subsequent events as described in Note 27, as to which the date is
November 8, 2023
EASTERN BANKSHARES, INC.
CONSOLIDATED BALANCE SHEETS
|
|
|
|
|
|
|
|
|
|
|
|
|
As of December 31, |
| (In thousands, except per share data) |
2022 |
|
2021 |
| ASSETS |
|
|
|
| Cash and due from banks |
$ |
106,040 |
|
|
$ |
144,634 |
|
| Short-term investments |
63,465 |
|
|
1,087,158 |
|
| Cash and cash equivalents |
169,505 |
|
|
1,231,792 |
|
| Securities: |
|
|
|
Available for sale (amortized cost $7,825,435 and $8,587,179, respectively) |
6,690,778 |
|
|
8,511,224 |
|
Held to maturity (fair value $423,226 and $0, respectively) |
476,647 |
|
|
— |
|
| Total securities |
7,167,425 |
|
|
8,511,224 |
|
| Loans held for sale |
4,543 |
|
|
1,206 |
|
| Loans: |
|
|
|
| Commercial and industrial |
3,150,946 |
|
|
2,960,527 |
|
| Commercial real estate |
5,155,323 |
|
|
4,522,513 |
|
| Commercial construction |
336,276 |
|
|
222,328 |
|
| Business banking |
1,090,492 |
|
|
1,334,694 |
|
| Residential real estate |
2,460,849 |
|
|
1,926,810 |
|
| Consumer home equity |
1,187,547 |
|
|
1,100,153 |
|
| Other consumer |
194,098 |
|
|
214,485 |
|
| Total loans |
13,575,531 |
|
|
12,281,510 |
|
| Allowance for loan losses |
(142,211) |
|
|
(97,787) |
|
| Unamortized premiums, net of unearned discounts and deferred fees, net of costs |
(13,003) |
|
|
(26,442) |
|
| Net loans |
13,420,317 |
|
|
12,157,281 |
|
| Federal Home Loan Bank stock, at cost |
41,363 |
|
|
10,904 |
|
| Premises and equipment |
62,493 |
|
|
80,555 |
|
| Bank-owned life insurance |
160,790 |
|
|
157,091 |
|
| Goodwill and other intangibles, net |
568,009 |
|
|
569,207 |
|
| Deferred income taxes, net |
331,963 |
|
|
76,089 |
|
| Prepaid expenses |
165,368 |
|
|
178,803 |
|
| Other assets |
426,863 |
|
|
423,958 |
|
| Assets of discontinued operations |
128,219 |
|
|
114,018 |
|
| Total assets |
$ |
22,646,858 |
|
|
$ |
23,512,128 |
|
| LIABILITIES AND EQUITY |
|
|
|
| Deposits: |
|
|
|
| Demand |
$ |
6,240,637 |
|
|
$ |
7,020,864 |
|
| Interest checking accounts |
4,568,122 |
|
|
4,478,566 |
|
| Savings accounts |
1,831,123 |
|
|
2,077,495 |
|
| Money market investment |
4,710,095 |
|
|
5,525,005 |
|
| Certificates of deposit |
1,624,382 |
|
|
526,381 |
|
| Total deposits |
18,974,359 |
|
|
19,628,311 |
|
| Borrowed funds: |
|
|
|
| Short-term Federal Home Loan Bank advances |
691,297 |
|
|
17 |
|
| Escrow deposits of borrowers |
22,314 |
|
|
20,258 |
|
| Interest rate swap collateral funds |
14,430 |
|
|
— |
|
| Long-term Federal Home Loan Bank advances |
12,787 |
|
|
14,003 |
|
| Total borrowed funds |
740,828 |
|
|
34,278 |
|
| Other liabilities |
424,951 |
|
|
411,965 |
|
| Liabilities of discontinued operations |
34,930 |
|
|
31,222 |
|
| Total liabilities |
20,175,068 |
|
|
20,105,776 |
|
| Commitments and contingencies (see Note 18) |
— |
|
|
— |
|
| Shareholders’ equity |
|
|
|
Common shares, $0.01 par value, 1,000,000,000 shares authorized; 176,172,073 and 186,305,332 shares issued and outstanding at December 31, 2022 and 2021, respectively |
1,762 |
|
|
1,863 |
|
| Additional paid in capital |
1,649,141 |
|
|
1,835,241 |
|
| Unallocated common shares held by the Employee Stock Ownership Plan |
(137,696) |
|
|
(142,709) |
|
| Retained earnings |
1,881,775 |
|
|
1,768,653 |
|
| Accumulated other comprehensive income, net of tax |
(923,192) |
|
|
(56,696) |
|
| Total shareholders’ equity |
2,471,790 |
|
|
3,406,352 |
|
| Total liabilities and shareholders’ equity |
$ |
22,646,858 |
|
|
$ |
23,512,128 |
|
The accompanying notes are an integral part of these Consolidated Financial Statements.
EASTERN BANKSHARES, INC.
CONSOLIDATED STATEMENTS OF INCOME
|
|
|
|
|
|
|
|
|
|
|
|
|
|
|
|
|
|
|
For the Year Ended December 31, |
|
2022 |
|
2021 |
|
2020 |
|
(In thousands, except per share data) |
| Interest and dividend income: |
|
|
|
|
|
| Interest and fees on loans |
$ |
476,041 |
|
|
$ |
367,585 |
|
|
$ |
372,152 |
|
| Taxable interest and dividends on available for sale securities |
118,690 |
|
|
58,312 |
|
|
31,825 |
|
| Non-taxable interest and dividends on available for sale securities |
7,179 |
|
|
7,376 |
|
|
7,588 |
|
| Interest on federal funds sold and other short-term investments |
3,271 |
|
|
1,886 |
|
|
1,757 |
|
| Interest and dividends on trading securities |
— |
|
|
— |
|
|
6 |
|
| Total interest and dividend income |
605,181 |
|
|
435,159 |
|
|
413,328 |
|
| Interest expense: |
|
|
|
|
|
| Interest on deposits |
28,621 |
|
|
5,167 |
|
|
11,315 |
|
| Interest on borrowings |
8,506 |
|
|
165 |
|
|
762 |
|
| Total interest expense |
37,127 |
|
|
5,332 |
|
|
12,077 |
|
| Net interest income |
568,054 |
|
|
429,827 |
|
|
401,251 |
|
| Provision for (release of) allowance for loan losses |
17,925 |
|
|
(9,686) |
|
|
38,800 |
|
| Net interest income after provision for (release of) loan losses |
550,129 |
|
|
439,513 |
|
|
362,451 |
|
| Noninterest income: |
|
|
|
|
|
| Service charges on deposit accounts |
30,392 |
|
|
24,271 |
|
|
21,560 |
|
| Trust and investment advisory fees |
23,593 |
|
|
24,588 |
|
|
21,102 |
|
| Debit card processing fees |
12,644 |
|
|
12,118 |
|
|
10,277 |
|
| Interest rate swap income (losses) |
6,009 |
|
|
5,634 |
|
|
(1,381) |
|
| (Losses) income from investments held in rabbi trusts |
(10,762) |
|
|
10,217 |
|
|
10,337 |
|
| Losses on trading securities, net |
— |
|
|
— |
|
|
(4) |
|
| Gains on sales of mortgage loans held for sale, net |
248 |
|
|
3,605 |
|
|
7,066 |
|
| (Losses) gains on sales of securities available for sale, net |
(3,157) |
|
|
1,166 |
|
|
288 |
|
| Other |
17,783 |
|
|
15,838 |
|
|
14,434 |
|
| Total noninterest income |
76,750 |
|
|
97,437 |
|
|
83,679 |
|
| Noninterest expense: |
|
|
|
|
|
| Salaries and employee benefits |
233,097 |
|
|
227,624 |
|
|
201,234 |
|
| Office occupancy and equipment |
37,445 |
|
|
37,261 |
|
|
30,620 |
|
| Data processing |
52,938 |
|
|
46,415 |
|
|
41,210 |
|
| Professional services |
15,805 |
|
|
21,283 |
|
|
15,675 |
|
| Charitable contributions |
— |
|
|
— |
|
|
95,272 |
|
| Marketing |
9,294 |
|
|
8,500 |
|
|
8,727 |
|
| Loan expenses |
6,384 |
|
|
9,114 |
|
|
9,184 |
|
| FDIC insurance |
6,250 |
|
|
4,226 |
|
|
3,734 |
|
| Amortization of intangible assets |
1,198 |
|
|
219 |
|
|
596 |
|
| Other |
26,238 |
|
|
6,313 |
|
|
23,239 |
|
| Total noninterest expense |
388,649 |
|
|
360,955 |
|
|
429,491 |
|
| Income from continuing operations before income tax expense |
238,230 |
|
|
175,995 |
|
|
16,639 |
|
| Income tax expense |
51,719 |
|
|
30,464 |
|
|
7,778 |
|
| Net income from continuing operations |
$ |
186,511 |
|
|
$ |
145,531 |
|
|
$ |
8,861 |
|
| Net income from discontinued operations |
$ |
13,248 |
|
|
$ |
9,134 |
|
|
$ |
13,877 |
|
| Net income |
$ |
199,759 |
|
|
$ |
154,665 |
|
|
$ |
22,738 |
|
| Basic earnings per share |
|
|
|
|
|
| Basic earnings per share from continuing operations |
$ |
1.13 |
|
|
$ |
0.85 |
|
|
$ |
0.05 |
|
| Basic earnings per share from discontinued operations |
0.08 |
|
|
0.05 |
|
|
0.08 |
|
| Basic earnings per share |
$ |
1.21 |
|
|
$ |
0.90 |
|
|
$ |
0.13 |
|
| Diluted earnings per share |
|
|
|
|
|
| Diluted earnings per share from continuing operations |
$ |
1.13 |
|
|
$ |
0.85 |
|
|
$ |
0.05 |
|
| Diluted earnings per share from discontinued operations |
0.08 |
|
|
0.05 |
|
|
0.08 |
|
| Diluted earnings per share |
$ |
1.21 |
|
|
$ |
0.90 |
|
|
$ |
0.13 |
|
The accompanying notes are an integral part of these Consolidated Financial Statements.
EASTERN BANKSHARES, INC.
CONSOLIDATED STATEMENTS OF COMPREHENSIVE INCOME
|
|
|
|
|
|
|
|
|
|
|
|
|
|
|
|
|
|
|
For the Year Ended December 31, |
|
2022 |
|
2021 |
|
2020 |
|
(In thousands) |
| Net income |
$ |
199,759 |
|
|
$ |
154,665 |
|
|
$ |
22,738 |
|
| Other comprehensive (loss) income, net of tax: |
|
|
|
|
|
| Net change in fair value of securities available for sale |
(821,570) |
|
|
(104,258) |
|
|
23,874 |
|
| Net change in fair value of cash flow hedges |
(57,520) |
|
|
(22,454) |
|
|
14,191 |
|
Net change in other comprehensive income for defined benefit postretirement plans |
12,594 |
|
|
15,782 |
|
|
60,016 |
|
| Total other comprehensive (loss) income |
(866,496) |
|
|
(110,930) |
|
|
98,081 |
|
| Total comprehensive (loss) income |
$ |
(666,737) |
|
|
$ |
43,735 |
|
|
$ |
120,819 |
|
The accompanying notes are an integral part of these Consolidated Financial Statements.
EASTERN BANKSHARES, INC.
CONSOLIDATED STATEMENTS OF CHANGES IN SHAREHOLDERS’ EQUITY
|
|
|
|
|
|
|
|
|
|
|
|
|
|
|
|
|
|
|
|
|
|
|
|
|
|
|
|
|
|
|
|
|
|
|
|
|
|
|
|
|
|
|
Shares of Common Stock Outstanding |
|
Common Stock |
|
Additional Paid in Capital |
|
Retained
Earnings |
|
Accumulated
Other
Comprehensive
Income |
|
Unallocated Common Stock Held by ESOP |
|
Total |
|
(In thousands, except share data) |
| Balance at December 31, 2019 |
— |
|
|
$ |
— |
|
|
$ |
— |
|
|
$ |
1,644,000 |
|
|
$ |
(43,847) |
|
|
$ |
— |
|
|
$ |
1,600,153 |
|
Cumulative effect accounting adjustment (1) |
— |
|
|
— |
|
|
— |
|
|
(1,131) |
|
|
— |
|
|
— |
|
|
(1,131) |
|
| Net income |
— |
|
|
— |
|
|
— |
|
|
22,738 |
|
|
— |
|
|
— |
|
|
22,738 |
|
| Other comprehensive income, net of tax |
— |
|
|
— |
|
|
— |
|
|
— |
|
|
98,081 |
|
|
— |
|
|
98,081 |
|
Proceeds of stock offering and issuance of common shares (net of costs of $28.9 million) |
179,287,828 |
|
|
1,793 |
|
|
1,762,187 |
|
|
— |
|
|
— |
|
|
— |
|
|
1,763,980 |
|
| Issuance of common shares donated to the Eastern Bank Foundation |
7,470,326 |
|
|
75 |
|
|
91,212 |
|
|
— |
|
|
— |
|
|
— |
|
|
91,287 |
|
Purchase of common shares by the ESOP (14,940,652 shares) |
— |
|
|
— |
|
|
— |
|
|
— |
|
|
— |
|
|
(149,407) |
|
|
(149,407) |
|
| ESOP shares committed to be released |
— |
|
|
— |
|
|
669 |
|
|
— |
|
|
— |
|
|
1,682 |
|
|
2,351 |
|
| Balance at December 31, 2020 |
186,758,154 |
|
|
1,868 |
|
|
1,854,068 |
|
|
1,665,607 |
|
|
54,234 |
|
|
(147,725) |
|
|
3,428,052 |
|
| Dividends to common shareholders |
— |
|
|
— |
|
|
— |
|
|
(51,619) |
|
|
— |
|
|
— |
|
|
(51,619) |
|
| Repurchased common stock |
(1,135,878) |
|
|
(12) |
|
|
(23,212) |
|
|
— |
|
|
— |
|
|
— |
|
|
(23,224) |
|
| Issuance of restricted stock awards |
683,056 |
|
|
7 |
|
|
(7) |
|
|
— |
|
|
— |
|
|
— |
|
|
— |
|
| Net income |
— |
|
|
— |
|
|
— |
|
|
154,665 |
|
|
— |
|
|
— |
|
|
154,665 |
|
| Other comprehensive income, net of tax |
— |
|
|
— |
|
|
— |
|
|
— |
|
|
(110,930) |
|
|
— |
|
|
(110,930) |
|
| ESOP shares committed to be released |
— |
|
|
— |
|
|
4,392 |
|
|
— |
|
|
— |
|
|
5,016 |
|
|
9,408 |
|
| Balance at December 31, 2021 |
186,305,332 |
|
|
1,863 |
|
|
1,835,241 |
|
|
1,768,653 |
|
|
(56,696) |
|
|
(142,709) |
|
|
3,406,352 |
|
Cumulative effect accounting adjustment (2) |
— |
|
|
— |
|
|
— |
|
|
(20,098) |
|
|
— |
|
|
— |
|
|
(20,098) |
|
| Dividends to common shareholders |
— |
|
|
— |
|
|
— |
|
|
(66,539) |
|
|
— |
|
|
— |
|
|
(66,539) |
|
| Repurchased common stock |
(10,112,272) |
|
|
(101) |
|
|
(201,517) |
|
|
— |
|
|
— |
|
|
— |
|
|
(201,618) |
|
| Issuance of restricted stock awards |
31,559 |
|
|
1 |
|
|
(1) |
|
|
— |
|
|
— |
|
|
— |
|
|
— |
|
| Unvested restricted stock awards forfeited and subsequently cancelled |
(52,546) |
|
|
(1) |
|
|
1 |
|
|
|
|
|
|
|
|
— |
|
| Share-based compensation |
— |
|
|
— |
|
|
10,507 |
|
|
— |
|
|
— |
|
|
— |
|
|
10,507 |
|
| Net income |
— |
|
|
— |
|
|
— |
|
|
199,759 |
|
|
— |
|
|
— |
|
|
199,759 |
|
| Other comprehensive income, net of tax |
— |
|
|
— |
|
|
— |
|
|
— |
|
|
(866,496) |
|
|
— |
|
|
(866,496) |
|
| ESOP shares committed to be released |
— |
|
|
— |
|
|
4,910 |
|
|
— |
|
|
— |
|
|
5,013 |
|
|
9,923 |
|
| Balance at December 31, 2022 |
176,172,073 |
|
|
$ |
1,762 |
|
|
$ |
1,649,141 |
|
|
$ |
1,881,775 |
|
|
$ |
(923,192) |
|
|
$ |
(137,696) |
|
|
$ |
2,471,790 |
|
(1)Represents cumulative impact on retained earnings pursuant to the Company’s adoption of Accounting Standards Update 2016-02 Leases. The transition adjustment to the opening balance of retained earnings on January 1, 2020 amounted to $1.1 million, net of tax, related to an incremental accrued rent adjustment calculated as a result of electing the hindsight practical expedient.
(2)Represents gross transition adjustment amount of $28.0 million, net of taxes of $7.9 million, to reflect the cumulative impact on retained earnings pursuant to the Company’s adoption of Accounting Standards Update 2016-13 Financial Instruments–Credit Losses on Financial Instruments and relevant amendments. Refer to Note 5, “Loans and Allowance for Credit Losses” within the Notes to the Consolidated Financial Statements included in this Item 8 in this Current Report on Form 8-K for additional discussion.
The accompanying notes are an integral part of these Consolidated Financial Statements.
EASTERN BANKSHARES, INC.
CONSOLIDATED STATEMENTS OF CASH FLOWS
|
|
|
|
|
|
|
|
|
|
|
|
|
|
|
|
|
|
|
For the Year Ended December 31, |
| (In thousands) |
2022 |
|
2021 |
|
2020 |
| Operating activities |
|
|
|
|
|
| Net income from continuing operations |
$ |
186,511 |
|
|
$ |
145,531 |
|
|
$ |
8,861 |
|
| Net income from discontinued operations |
13,248 |
|
|
9,134 |
|
|
13,877 |
|
| Net income |
199,759 |
|
|
154,665 |
|
|
22,738 |
|
| Adjustments to reconcile net income to net cash provided by operating activities |
|
|
|
|
|
| Provision for (release of) allowance for loan losses |
17,925 |
|
|
(9,686) |
|
|
38,800 |
|
| Depreciation and amortization |
11,985 |
|
|
11,900 |
|
|
13,387 |
|
| Accretion of deferred loan fees and premiums, net |
(1,441) |
|
|
(27,991) |
|
|
(14,574) |
|
| Deferred income tax expense (benefit) |
5,262 |
|
|
(5,663) |
|
|
(20,800) |
|
| Amortization of investment security premiums and discounts, net |
18,274 |
|
|
16,713 |
|
|
5,585 |
|
| Right-of-use asset amortization |
11,432 |
|
|
10,982 |
|
|
10,349 |
|
| Share-based compensation |
10,507 |
|
|
— |
|
|
— |
|
| Increase in cash surrender value of bank-owned life insurance |
(3,699) |
|
|
(2,348) |
|
|
(2,188) |
|
| Loss (gain) on life insurance benefits |
663 |
|
|
(1,813) |
|
|
(174) |
|
| Loss (gain) on sales of securities available for sale, net |
3,157 |
|
|
(1,166) |
|
|
(288) |
|
| (Gain) loss on sales of bank premises and equipment, net |
(1,412) |
|
|
4,715 |
|
|
73 |
|
| Loss on lease termination/modification, net |
593 |
|
|
2,582 |
|
|
— |
|
| Amortization of gains from terminated interest rate swaps |
(10,193) |
|
|
(31,234) |
|
|
(15,889) |
|
| ESOP expense |
9,923 |
|
|
9,408 |
|
|
2,351 |
|
Issuance of common shares donated to the Eastern Bank Foundation (1) |
— |
|
|
— |
|
|
91,287 |
|
| Other |
17 |
|
|
(106) |
|
|
(587) |
|
| Change in: |
|
|
|
|
|
| Trading securities |
— |
|
|
— |
|
|
961 |
|
| Loans held for sale |
(3,354) |
|
|
(47) |
|
|
(1,133) |
|
| Prepaid pension expense |
4,338 |
|
|
1,130 |
|
|
(24,055) |
|
| Other assets |
5,431 |
|
|
62,380 |
|
|
(85,365) |
|
| Other liabilities |
(52,800) |
|
|
(16,132) |
|
|
46,074 |
|
| Net cash provided by operating activities - continuing operations |
213,119 |
|
|
169,155 |
|
|
52,675 |
|
| Net cash provided by operating activities - discontinued operations |
16,823 |
|
|
5,335 |
|
|
17,176 |
|
| Net cash provided by operating activities |
229,942 |
|
|
174,490 |
|
|
69,851 |
|
| Investing activities |
|
|
|
|
|
| Proceeds from sales of securities available for sale |
431,193 |
|
|
23,798 |
|
|
9,097 |
|
| Proceeds from maturities and principal paydowns of securities available for sale |
1,049,522 |
|
|
939,575 |
|
|
452,392 |
|
| Purchases of securities available for sale |
(740,770) |
|
|
(3,323,893) |
|
|
(2,111,773) |
|
| Proceeds from maturities and principal paydowns of securities held to maturity |
17,399 |
|
|
— |
|
|
— |
|
| Purchases of securities held to maturity |
(493,678) |
|
|
— |
|
|
— |
|
| Proceeds from sale of Federal Home Loan Bank stock |
63,715 |
|
|
6,692 |
|
|
749 |
|
| Purchases of Federal Home Loan Bank stock |
(94,174) |
|
|
(2,101) |
|
|
(527) |
|
| Contributions to low income housing tax credit investments |
(19,487) |
|
|
(11,379) |
|
|
(12,372) |
|
| Contributions to other equity investments |
(788) |
|
|
(2,519) |
|
|
(4,395) |
|
| Distributions from other equity investments |
1,170 |
|
|
337 |
|
|
201 |
|
| Proceeds from life insurance policies |
20,446 |
|
|
— |
|
|
1,347 |
|
| Net (increase) decrease in outstanding loans, excluding loan purchases |
(926,255) |
|
|
380,807 |
|
|
(719,041) |
|
| Purchases of loans |
(380,234) |
|
|
— |
|
|
— |
|
| Acquisitions, net of cash and cash equivalents acquired |
— |
|
|
(9,085) |
|
|
— |
|
| Purchased banking premises and equipment, net |
(8,627) |
|
|
(5,728) |
|
|
(4,806) |
|
| Proceeds from sale of bank premises and equipment |
17,313 |
|
|
21,981 |
|
|
— |
|
| Proceeds from sale of other real estate owned |
— |
|
|
125 |
|
|
646 |
|
| Net cash used in investing activities - continuing operations |
(1,063,255) |
|
|
(1,981,390) |
|
|
(2,388,482) |
|
| Net cash used in investing activities - discontinued operations |
(13,400) |
|
|
(4,354) |
|
|
(1,701) |
|
| Net cash used in investing activities |
(1,076,655) |
|
|
(1,985,744) |
|
|
(2,390,183) |
|
| Financing activities |
|
|
|
|
|
| Net (decrease) increase in demand, savings, interest checking, and money market investment deposit accounts |
(1,751,953) |
|
|
1,155,868 |
|
|
2,674,672 |
|
|
|
|
|
|
|
|
|
|
|
|
|
|
|
|
|
|
|
| Net increase (decrease) in time deposits |
1,098,001 |
|
|
(58,144) |
|
|
(70,280) |
|
| Net increase (decrease) in borrowed funds |
706,550 |
|
|
2,580 |
|
|
(207,346) |
|
Repayment of acquired subordinated debentures (3) |
— |
|
|
(36,277) |
|
|
— |
|
| Proceeds from issuance of common shares |
— |
|
|
— |
|
|
1,792,878 |
|
| Purchase of shares by the ESOP |
— |
|
|
— |
|
|
(149,407) |
|
| Payment of deferred offering costs |
— |
|
|
— |
|
|
(28,552) |
|
| Payments for repurchases of common stock |
(201,618) |
|
|
(23,224) |
|
|
— |
|
| Dividends declared and paid to common shareholders |
(65,886) |
|
|
(51,564) |
|
|
— |
|
| Net cash (used in) provided by financing activities - continuing operations |
(214,906) |
|
|
989,239 |
|
|
4,011,965 |
|
| Net cash used in financing activities - discontinued operations |
(668) |
|
|
(263) |
|
|
(165) |
|
| Net cash (used in) provided by financing activities |
(215,574) |
|
|
988,976 |
|
|
4,011,800 |
|
| Net (decrease) increase in cash, cash equivalents, and restricted cash |
(1,062,287) |
|
|
(822,278) |
|
|
1,691,468 |
|
| Cash, cash equivalents, and restricted cash at beginning of period |
1,231,792 |
|
|
2,054,070 |
|
|
362,602 |
|
| Cash, cash equivalents, and restricted cash at end of period |
$ |
169,505 |
|
|
$ |
1,231,792 |
|
|
$ |
2,054,070 |
|
| Supplemental disclosure of cash flow information |
|
|
|
|
|
| Cash paid during the period for: |
|
|
|
|
|
| Interest paid |
$ |
35,241 |
|
|
$ |
5,354 |
|
|
$ |
13,684 |
|
| Income taxes |
41,751 |
|
|
43,299 |
|
|
35,128 |
|
| Non-cash activities |
|
|
|
|
|
| Net increase in capital commitments relating to low income housing tax credit projects |
$ |
55,233 |
|
|
$ |
28,291 |
|
|
$ |
25,816 |
|
Net decrease in operating lease right-of-use assets and operating lease liabilities relating to lease remeasurements (see Note 8, “Leases” within the Notes to the Consolidated Financial Statements) |
14,836 |
|
|
— |
|
|
— |
|
Maturity of acquired securities sold under agreements to repurchase (2) |
— |
|
|
274,982 |
|
|
— |
|
| Initial recognition of operating lease right-of-use assets upon adoption of ASU 2016-02 |
— |
|
|
— |
|
|
92,948 |
|
| Initial recognition of operating lease liabilities upon adoption of ASU 2016-02 |
— |
|
|
— |
|
|
96,426 |
|
(1)Represents a non-cash common stock donation of 7,470,326 shares at a fair value of $91.3 million to the Eastern Bank Foundation. The donation is included in charitable contributions as a non-interest expense in the Consolidated Income Statement for the year ended December 31, 2020.
(2)Includes non-cash item representing maturity of acquired securities sold under agreements to repurchase which were converted to deposits upon maturity.
(3)The Company deposited funds into escrow prior to the Century acquisition date to pay the balance of subordinated debentures assumed in the Century acquisition which was considered to be a defeasance of the debt. Accordingly, Century recorded a payable to the Company in the amount of the escrow deposit and the Company recorded a receivable from Century in the same amount. The payable was reclassified to other assets upon acquisition and is reflected as such balance in the summary of net assets acquired included in Note 3 to the Consolidated Financial Statements. Subsequent to the closing of the acquisition and prior to December 31, 2021, the amounts placed in escrow were disbursed to the holders of the subordinated debentures resulting in a full pay-off of the outstanding balance of the debt.
The accompanying notes are an integral part of these Consolidated Financial Statements.
EASTERN BANKSHARES, INC.
NOTES TO CONSOLIDATED FINANCIAL STATEMENTS
1. Corporate Structure and Nature of Operations; Conversion and Reorganization; Basis of Presentation
Corporate Structure and Nature of Operations
Eastern Bankshares, Inc., a Massachusetts corporation (the “Company”), is a bank holding company. Through its wholly-owned subsidiaries, Eastern Bank (the “Bank”) and Eastern Insurance Group LLC (“Eastern Insurance Group”), the Company provides a variety of banking services, and trust and investment services through its full-service bank branches and, as of December 31, 2022, insurance services through its full-service insurance offices, located primarily in eastern Massachusetts, southern and coastal New Hampshire and Rhode Island. Eastern Insurance Group is a wholly-owned subsidiary of the Bank. On September 19, 2023, the Company and the Bank entered into an asset purchase agreement in which Arthur J. Gallagher & Co. (“Gallagher”) agreed to purchase substantially all of Eastern Insurance Group’s assets for cash consideration and to assume certain liabilities. On October 31, 2023, the Company completed its sale of its insurance agency business to Gallagher. Refer to Note 24, “Discontinued Operations” for further discussion regarding discontinued operations.
The activities of the Company are subject to the regulatory supervision of the Board of Governors of the Federal Reserve System (“Federal Reserve”). The activities of the Bank are subject to the regulatory supervision of the Massachusetts Commissioner of Banks, the Federal Deposit Insurance Corporation (“FDIC”) and the Consumer Financial Protection Bureau (“CFPB”). The Company and the activities of the Bank and its subsidiaries are also subject to various Massachusetts, New Hampshire and Rhode Island business, banking and, through October 31, 2023, insurance regulations.
Conversion and Reorganization
Pursuant to a Plan of Conversion (the “Plan”), Eastern Bank Corporation, the predecessor of the Company, reorganized from a mutual holding company into a publicly traded stock form of organization on October 14, 2020. In connection with the reorganization, Eastern Bank Corporation transferred to the Company 100% of Eastern Bank’s common stock, and immediately thereafter merged into the Company.
Pursuant to the Plan, the Company sold 179,287,828 shares of common stock in a public offering at $10.00 per share, including 14,940,652 shares of common stock purchased by the Bank’s employee stock ownership plan (the “ESOP”), for gross offering proceeds of approximately $1,792,878,000. The Company completed the offering on October 14, 2020. Effective as of October 15, 2020, the Company donated 7,470,326 shares of common stock to the Eastern Bank Charitable Foundation (now known as the Eastern Bank Foundation, or the “Foundation”). A total of 186,758,154 shares of common stock of the Company were issued and outstanding immediately after the donation to the Foundation. The purchase of common stock by the ESOP was financed by a loan from the Company.
Pursuant to the Plan, eligible account holders have received an interest in a liquidation account maintained by the Company in an amount equal to (i) Eastern Bank Corporation’s ownership interest in the Bank’s total shareholders’ equity as of March 31, 2020, the date of the latest statement of financial position included in the latest prospectus filed with the U.S. Securities and Exchange Commission (“SEC”) for the Company's initial public offering (“IPO”), plus (ii) the value of the net assets of Eastern Bank Corporation as of March 31, 2020 (excluding its ownership of Eastern Bank). Also pursuant to the Plan, a parallel liquidation account maintained at the Bank was established to support the Company’s liquidation account in the event the Company does not have sufficient assets to fund its obligations under its liquidation account. The Company and the Bank hold the liquidation accounts for the benefit of eligible account holders who continue to maintain deposits in the Bank. The Company is not permitted to pay dividends on its capital stock if the shareholders’ equity of the Company would be reduced below the amount of the liquidation account. The liquidation account will be reduced annually to the extent that eligible account holders have reduced their qualifying deposits. Subsequent increases will not restore an eligible account holder’s interest in the liquidation accounts. In the event of a complete liquidation of the Bank, and only in such event, each account holder will be entitled to receive a distribution from the liquidation account in an amount proportionate to the adjusted qualifying account balances then held. See “Regulation—Liquidation Account Effect on Dividends” included in Item 1 in this Current Report on Form 8-K.
Basis of Presentation
The Company’s Consolidated Financial Statements have been prepared in conformity with accounting principles generally accepted in the United States (“GAAP”) as set forth by the Financial Accounting Standards Board (“FASB”) and its Accounting Standards Codification (“ASC”) and Accounting Standards Updates (“ASU”) as well as the rules and interpretive releases of the SEC under the authority of federal securities laws.
The Consolidated Financial Statements include the accounts of the Company, its wholly-owned subsidiaries, and entities in which it holds a controlling financial interest through being the primary beneficiary or through holding a majority of the voting interest. All intercompany accounts and transactions have been eliminated in consolidation.
Certain previously reported amounts have been reclassified to conform to the current year’s presentation which includes:
•certain loan servicing-related costs have been reclassified from professional services to loan expense; and
•operational losses have been reclassified to other non-interest expense.
As a result of the decision to sell substantially all of the assets and transfer certain liabilities of Eastern Insurance Group, the Company reclassified certain amounts previously reported including:
•certain assets and liabilities previously reported in the insurance agency business were reclassified to assets and liabilities of discontinued operations, respectively, on the Consolidated Balance Sheets;
•certain components of noninterest income and noninterest expense, including the associated income tax effects, previously reported in the insurance agency business were reclassified to net income from discontinued operations on the Consolidated Statements of Income; and
•certain operating, investing, and financing cash flows previously reported on their applicable lines within the Consolidated Statements of Cash Flows were reclassified to cash flows used in/provided by operating activities of, investment activities of and financing activities of discontinued operations, respectively.
2. Summary of Significant Accounting Policies
Use of Estimates
In preparing the Consolidated Financial Statements in conformity with GAAP, management is required to make estimates and assumptions that affect the reported amounts of assets and liabilities as of the date of the balance sheets and income and expenses for the periods reported. Actual results could differ from those estimates based on changing conditions, including economic conditions and future events. Material estimates that are particularly susceptible to change relate to the determination of the allowance for loan losses, valuation and fair value measurements, allowance for credit losses on investment securities, the liabilities for benefit obligations (particularly pensions), the provision for income taxes and impairment of goodwill and other intangibles.
Cash and Cash Equivalents
Cash and cash equivalents include cash on hand and amounts due from banks, federal funds sold, and other short-term investments including restricted cash pledged, all of which have an original maturity of 90 days or less. Cash and cash equivalents includes $1.0 million and $21.3 million of restricted cash pledged as collateral at December 31, 2022 and 2021, respectively, which for purposes of the Company’s Consolidated Statements of Cash Flows, is included in cash, cash equivalents and restricted cash.
Securities
Debt securities are classified at the time of purchase as either “trading,” “available for sale” (“AFS”) or “held to maturity” (“HTM”). Equity securities are measured at fair value with changes in the fair value recognized through net income. Debt securities that are bought and held principally for the purpose of resale in the near term are classified as trading securities and recorded at fair value, with subsequent changes in fair value included in net income. Debt securities that the Company has the positive intent and the ability to hold to maturity are classified as HTM securities and recorded at amortized cost.
Debt securities not classified as either trading or HTM are classified as AFS and recorded at fair value, with changes in fair value excluded from net income and reported in other comprehensive income, net of related tax. Amortization of premiums and accretion of discounts are computed using the effective interest rate method.
ASU 2016-13 made targeted changes to ASC 320 to eliminate the concept of “other than temporary” from the impairment loss estimation model for AFS securities. A summary of the changes made by the Company to the existing impairment model (previously referred to as the “OTTI” model) as a result of adoption of ASU 2016-13 is as follows:
•The use of an allowance approach, rather than a permanent write-down of a security’s cost basis upon determination of an impairment loss.
•The amount of the allowance is limited to the amount at which the security’s fair value is less than its amortized cost basis.
•The Company may not consider the length of time a security’s fair value has been less than amortized cost.
•The Company may not consider recoveries in fair value after the balance sheet date when assessing whether a credit loss exists.
The Company’s AFS securities are carried at fair value. For AFS securities in an unrealized loss position, management will first evaluate whether there is intent to sell a security, or if it is more likely than not that the Company will be required to sell a security prior to anticipated recovery of its amortized cost basis. If either of these criteria are met, the Company will record a write-down of the security’s amortized cost basis to fair value through income. For those AFS securities which do not meet the intent or requirement to sell criteria, management will evaluate whether the decline in fair value is a result of credit related matters or other factors. In performing this assessment, management considers the creditworthiness of the issuer including whether the security is guaranteed by the U.S. federal government or other government agency, the extent to which fair value is less than amortized cost, and changes in credit rating during the period, among other factors. If this assessment indicates the existence of credit losses, an allowance for credit losses will be established, as determined by a discounted cash flow analysis. To the extent the estimated cash flows do not support the amortized cost, the deficiency is considered to be due to credit loss and is recognized in earnings.
Changes in the allowance for credit losses are recorded as a provision for (or reversal of) credit loss expense. Losses are charged against the allowance when the security is determined to be uncollectible, or when either of the aforementioned criteria surrounding intent or requirement to sell have been met. On January 1, 2022, the date on which the Company adopted ASU 2016-13, no allowance for credit losses was recorded for AFS securities.
Gains and losses on sales of securities are recognized at the time of sale on the specific-identification basis.
Prior to the adoption of ASU 2016-13, management evaluated impaired securities for other-than-temporary impairment (“OTTI”) at least on a quarterly basis, and more frequently when economic or market concerns warranted such evaluation. Consideration was given to the length of time and the extent to which the fair value was less than cost, current market conditions, the financial condition and near-term prospects of the issuer, performance of collateral underlying the securities, the ratings of the individual securities, the interest rate environment, the Company’s intent to sell the security or whether it was more likely than not that the Company would be required to sell the debt security before its anticipated recovery, as well as other qualitative factors.
If a decline in fair value below the amortized cost basis of an investment was judged to be other than temporary, the investment was written down to fair value. The portion of the impairment related to credit losses was included in net income, and the portion of the impairment related to other factors was included in other comprehensive income.
Refer to Note 4, “Securities” for additional information regarding the measurement of impairment losses on AFS securities.
Allowance for Credit Losses - Held to Maturity Securities
The Company measures expected credit losses on HTM securities on a collective basis by major security type which, as of December 31, 2022, included government-sponsored residential and commercial mortgage-backed securities. Securities in the Company’s HTM portfolio are guaranteed by either the U.S. federal government or other government sponsored agencies with a long history of no credit losses. As a result, management has determined that these securities have a zero loss expectation and therefore does not record an allowance for credit losses on these securities. The Company held no securities classified as HTM at December 31, 2021. Refer to Note 4, “Securities” for additional information regarding the measurement of credit losses on HTM securities.
Loans
Loans are reported at their principal amount outstanding, net of deferred loan fees and costs and any unearned discount or unamortized premium for acquired loans. Unearned discount and unamortized premium are accreted and amortized, respectively, to interest and dividend income on a basis that results in level rates of return over the terms of the loans. For originated loans, origination fees and related direct incremental origination costs are offset, and the resulting net amount is deferred and amortized over the life of the related loans using the effective interest method, assuming a certain level of prepayments. When loans are sold or repaid, the unamortized fees and costs are recorded to interest and dividend income. Interest income on loans is accrued based upon the daily principal amount outstanding except for loans on non-accrual status. For acquired loans, interest income is also accrued based upon the daily principal amount outstanding and is adjusted further by the accretion of any discount or amortization of any premium associated with the loan.
Non-performing Loans (“NPLs”)
Non-accrual Loans
Interest accruals are generally discontinued when management has determined that the borrower may be unable to meet contractual obligations and/or when loans are 90 days or more past due. Exceptions may be made if management believes that collateral held by the Company is clearly sufficient and in full satisfaction of both principal and interest. When a loan is placed on non-accrual, all interest previously accrued but not collected is reversed against current period income and amortization of deferred loan fees and costs is discontinued. Interest received on non-accrual loans is either applied against principal or reported as income according to management’s judgment as to the collectability of principal. Non-accrual loans may be returned to an accrual status when principal and interest payments are no longer delinquent, and the risk characteristics of the loan have improved to the extent that there no longer exists a concern as to the collectability of principal and interest. Loans are considered past due based upon the number of days delinquent according to their contractual terms. Non-accrual loans and loans that are more than 90 days past due but still accruing interest are considered NPLs.
Loans Individually Assessed for Impairment
ASU 2016-13 indicates that a loan should be measured for impairment individually if that loan shares no similar risk characteristics with other loans. For the Company, loans which have been identified as those to be individually assessed for impairment under CECL include loans that do not share similar risk characteristics with other loans in the corresponding reserve segment. Characteristics of loans meeting this definition may include, but are not limited to:
•Loans previously restructured and determined to be TDR loans;
•Loans on non-accrual status; and
•Loans with a risk rating of 12 under the Company’s risk rating scale, substandard (well-defined weakness) or worse.
Collateral-Dependent Loans
Management considers a loan to be collateral-dependent when foreclosure of the underlying collateral is probable. In addition, in accordance with ASU 2016-13, the Company elected to apply the collateral-dependent practical expedient whereby the Company measures expected credit losses using the fair value of the collateral, less any estimated costs to sell, when foreclosure is not probable but repayment of the loan is expected to be provided substantially through the operation or sale of the collateral, and the borrower is experiencing financial difficulty.
Troubled Debt Restructured Loans
In cases where a borrower experiences financial difficulties and the Company makes certain concessionary modifications to contractual terms, the loan is classified as a TDR. Modifications may include adjustments to interest rates, extensions of maturity, consumer loans where the borrower’s obligations have been effectively discharged through Chapter 7 bankruptcy and the borrower has not reaffirmed the debt to the Company, and other actions intended to minimize economic loss and avoid foreclosure or repossession of collateral. Prior to the Company’s adoption of ASU 2016-13, all TDR loans were subject to a specific review for impairment loss each period beginning in the period in which the modification was executed. Subsequent to the adoption of ASU 2016-13, management identifies loans as TDR loans when it has a reasonable expectation that it will execute a TDR modification with a borrower. In addition, subsequent to adoption of ASU 2016-13, management estimates expected credit losses on a collective basis if a group of TDR loans share similar risk characteristics. If a TDR loan’s risk characteristics are not similar to those of any of the Company’s other TDR loans, expected credit losses on the TDR loan are measured individually. The impairment analysis discounts the present value of the anticipated cash flows by the loan’s contractual rate of interest in effect prior to the loan’s modification or the fair value of collateral if the loan is collateral dependent. The amount of credit loss, if any, is recorded as a specific loss allocation to each individual loan or as a loss allocation to the pool of loans, for those loans for which credit loss is measured on a collective basis, in the allowance for credit losses. Any commercial (commercial and industrial, commercial real estate, commercial construction, and business banking loans) or residential loan that has been classified as a TDR and which subsequently defaults is reviewed to determine if the loan should be deemed collateral-dependent. In such an instance, any shortfall between the value of the collateral and the book value of the loan is determined by measuring the recorded investment in the loan against the fair value of the collateral less costs to sell.
The Company’s policy is to retain any restructured loan, which is on non-accrual status prior to being modified, on non-accrual status for approximately six months subsequent to being modified before the Company considers its return to accrual status. If the restructured loan is on accrual status prior to being modified, the Company reviews it to determine if the modified loan should remain on accrual status.
Purchased Credit-Deteriorated Loans
The Company applied the prospective transition approach with respect to PCD assets upon adoption of ASU 2016-13. Under this approach, loans previously determined to be PCI loans are considered to be PCD loans as of January 1, 2022. PCD loans are acquired individual loans (or acquired groups of loans with similar risk characteristics) that, as of the date of acquisition, have experienced a more-than-insignificant deterioration in credit quality since origination, as determined by the Company’s assessment. A PCD loan is recorded at its purchase price plus the allowance for loan losses expected at the time of acquisition, or “gross up” of the amortized cost basis, if any. Changes in the current estimate of the allowance for loan losses subsequent to acquisition from the estimated allowance previously recorded are recognized in the income statement as provision for credit losses or reversal of provision for credit losses in subsequent periods as they arise. A purchased loan that does not qualify as a PCD asset is accounted for similar to the Company’s method of accounting for originated assets, whereby an allowance for loan losses is recognized with a corresponding increase to the income statement provision for loan losses. Evidence that purchased loans, measured at amortized cost, have more-than-insignificant deterioration in credit quality since origination and, therefore meet the PCD definition, may include past-due status, non-accrual status, risk rating and other standard indicators (i.e., TDRs, charge-offs, bankruptcy).
Allowance for Credit Losses
Through December 31, 2021, the allowance for loan losses represented management’s best estimate of incurred probable losses in the Company’s loan portfolios based upon management’s assessment of various factors, including the risk characteristics of its loan portfolio, current economic conditions, and trends in loan delinquencies and charge-offs. The Company’s methodology for determining the qualitative component through December 31, 2021 included an assessment of factors affecting the determination of incurred losses in the loan portfolio. Such factors included trends in economic conditions, loan growth, credit underwriting policy exceptions, regulatory and audit findings, and peer comparisons, among others. Upon adoption of ASU 2016-13, effective January 1, 2022, the Company changed its reserve methodology to estimate expected credit losses over the contractual life of loans and leases.
The allowance for credit losses, or “ACL,” is established to provide for the Company’s current estimate of expected lifetime credit losses on loans measured at amortized cost and unfunded lending commitments at the balance sheet date and is established through a provision for credit losses charged to net income. Credit losses are charged directly to the ACL. Subsequent recoveries, if any, are credited to the ACL. Commercial and residential loans are charged-off in the period in which they are deemed uncollectible. Delinquent loans in these product types are subject to ongoing review and analysis to determine if a charge-off in the current period is appropriate. For consumer finance loans, policies and procedures exist that require charge-off consideration upon a certain triggering event depending on the product type. Charge-off triggers include: 120 days delinquent for automobile, home equity, and other consumer loans with the exception of cash reserve loans for which the trigger is 150 days delinquent; death of the borrower; or Chapter 7 bankruptcy. In addition to those events, the charge-off determination includes other loan quality indicators, such as collateral position and adequacy or the presence of other repayment sources.
The ACL is evaluated on a regular basis by management. Management uses a methodology to systematically estimate the amount of expected lifetime losses in the portfolio. Expected lifetime losses are estimated on a collective basis for loans sharing similar risk characteristics and are determined using a quantitative model combined with an assessment of certain qualitative factors designed to address forecast risk and model risk inherent in the quantitative model output. For commercial and industrial, commercial real estate, commercial construction and business banking portfolios, the quantitative model uses a loan rating system which is comprised of management’s determination of a financial asset’s probability of default (“PD”), loss given default (“LGD”) and exposure at default (“EAD”), which are derived from both the Company’s and industry historical loss experience and other factors. For residential real estate, consumer home equity and other consumer portfolios, the Company’s quantitative model uses historical loss experience.
The quantitative model estimates expected credit losses using loan level data over the estimated life of the exposure, considering the effect of prepayments. Economic forecasts are incorporated into the estimate over a reasonable and supportable forecast period, beyond which is a reversion to the Company’s and/or industry historical loss average. Management has determined that a reasonable and supportable forecast period of eight quarters, and a straight-line reversion period of four quarters, are appropriate forecast periods for purposes of estimating expected credit losses. As described above, quantitative model results are adjusted for risk factors not considered within the model but which are relevant in estimating the expected credit losses within the loan portfolio. The qualitative risk factors impacting the expected risk of loss within the loan portfolio include the following:
•Lending policies and procedures, including underwriting standards and collection, charge-off and recovery practices;
•Nature and volume of the portfolio;
•Volume and severity of past-due, non-accrual and classified loans;
•The value of the underlying collateral for loans that are not collateral dependent;
•Concentrations of credit risk;
•Model and data limitations; and
•Other external factors, such as changes in legal, regulatory or competitive environments.
Loans that do not share similar risk characteristics with any pools of assets are subject to individual evaluation and are removed from the collectively assessed pools. For loans that are individually evaluated, the Company uses either a discounted cash flow (“DCF”) approach or, for loans deemed to be collateral dependent or when foreclosure is probable, a fair value of collateral approach.
Accrued interest receivable amounts are excluded from balances of loans held at amortized cost and are included within other assets on the consolidated balance sheet. Management has elected not to measure an allowance for credit losses on these amounts as the Company employs a timely write-off policy. Consistent with the Company's policy for non-accrual loans, accrued interest receivable is typically written off when loans reach 90 days past due and are placed on non-accrual status.
In the ordinary course of business, the Company enters into commitments to extend credit and standby letters of credit. Such financial instruments are recorded in the financial statements when they become payable. The credit risk associated with these commitments is evaluated in a manner similar to the reserving method for loans receivable previously described. The reserve for unfunded lending commitments is included in other liabilities in the Consolidated Balance Sheets.
Additionally, various regulatory agencies, as an integral part of the Company’s examination process, periodically assess the appropriateness of the allowance for credit losses and may require the Company to increase its allowance for loan losses or recognize further loan charge-offs, in accordance with GAAP.
Refer to Note 5, “Loans and Allowance for Credit Losses” for additional information regarding the Company’s measurement of credit losses on loans receivable and off-balance sheet commitments to lend as of December 31, 2022. For comparative allowance for loan loss information for which ASC 450, “Contingencies” and ASC 310, “Receivables” were applied (i.e., prior to the Company’s adoption of the CECL methodology previously described), refer to Note 6, “Loans and Allowance for Loan Losses.”
Mortgage Banking Activities
Mortgage loans held for sale to the secondary market are carried at the lower of cost or estimated market value on an individual loan basis. The Company enters into commitments to fund residential mortgage loans with an offsetting forward commitment to sell them in the secondary markets in order to mitigate interest rate risk. Gains or losses on sales of mortgage loans are recognized in the consolidated statements of income at the time of sale. Interest income is recognized on loans held for sale between the time the loan is funded and the loan is sold. Direct loan origination costs and fees are deferred upon origination and are recognized in the consolidated statements of income on the date of sale.
Other Real Estate Owned
OREO consists of properties and other assets acquired through foreclosure proceedings or acceptance of a deed in lieu of foreclosure. OREO is recorded in other assets in the Consolidated Balance Sheets, on an individual asset basis at the fair value less estimated costs to sell on the date control is obtained. Any write-downs to the cost of the related asset upon transfer to OREO to reflect the asset at fair value less estimated costs to sell is recorded through the allowance for loan losses. The Company relies primarily on third-party valuation information from certified appraisers and values are generally based upon recent appraisals of the underlying collateral, brokers’ opinions based upon recent sales of comparable properties, estimated equipment auction or liquidation values, income capitalization, or a combination of income capitalization and comparable sales. As of December 31, 2022 and 2021, the Company’s OREO was immaterial.
Federal Home Loan Bank Stock
The Company, as a member of the Federal Home Loan Bank (“FHLB”) of Boston (“FHLBB”), is required to maintain an investment in capital stock of the FHLB. Based on redemption provisions, the stock has no quoted market value and is carried at cost.
Premises and Equipment
Land is carried at cost. Buildings, leasehold improvements and equipment are stated at cost less accumulated depreciation and amortization. Depreciation is computed using the straight-line method over the estimated useful lives of the related assets.
Leasehold improvements are amortized over the shorter of the lease terms or the estimated lives of the improvements. Expected lease terms include lease options to the extent that the exercise of such options is reasonably assured.
Banking premises and equipment held for sale are carried at the lower of cost or estimated fair value, less estimated costs to sell.
Goodwill and Other Intangible Assets
Acquisitions of businesses are accounted for using the acquisition method of accounting. Accordingly, the net assets of the companies acquired are recorded at their fair values at the date of acquisition. Goodwill represents the excess of purchase price over the fair value of net assets acquired. Other intangible assets represent acquired assets that lack physical substance but can be distinguished from goodwill because of contractual or other legal rights, or because the asset is capable of being sold or exchanged either on its own, or in combination with a related contract, asset, or liability.
The Company evaluates goodwill for impairment at least annually, during the third quarter, or more often if warranted, using a quantitative impairment approach. The quantitative impairment test compares the book value to the fair value of each reporting unit. If the book value exceeds the fair value, an impairment is charged to net income. As of December 31, 2022, management identified two reporting units for purposes of testing goodwill for impairment: the banking business and the insurance agency business.
Other intangible assets, all of which are definite-lived, are stated at cost less accumulated amortization. The Company evaluates other intangible assets for impairment whenever events or changes in circumstances indicate that the carrying value of the asset may not be fully recovered. The Company considers factors including, but not limited to, changes in legal factors and business climate that could affect the value of the intangible asset. Any impairment losses are charged to net income. The Company amortizes other intangible assets over their respective estimated useful lives. The estimated useful lives of core deposit identifiable intangible assets fall within a range of seven to ten years. The Company reassesses the useful lives of other intangible assets at least annually, or more frequently based on specific events or changes in circumstances.
Retirement Plans
The Company provides benefits to its employees and executive officers through various retirement plans, including a defined benefit plan, a defined benefit supplemental executive retirement plan, a defined contribution plan, a benefit equalization plan, and an outside directors’ retainer continuance plan.
Effective November 1, 2020, the defined benefit plan (“Defined Benefit Plan”) and the benefit equalization plan (“BEP”) were amended to convert the plans from a traditional final average earnings plan design to a cash balance plan design. Benefits earned under the final average earnings plan design were frozen at October 31, 2020. Starting November 1, 2020, future benefits are earned under the cash balance plan design.
The defined benefit plan benefits are provided through membership in the Savings Banks Employees’ Retirement Association (“SBERA”). The Defined Benefit Plan is a noncontributory, defined benefit plan. Under the final average earnings plan design, benefits became fully vested after three years of eligible service for individuals employed on or before October 31, 1989. For individuals employed subsequent to October 31, 1989 and who were already in the Defined Benefit Plan as of November 1, 2020, benefits became fully vested after five years of eligible service. Under the cash balance plan design and for employees who were not already in the Defined Benefit Plan as of November 1, 2020, benefits become fully vested after three years of eligible service. The annual contribution to the Defined Benefit Plan is based upon standards established by the Pension Protection Act. The contribution is based on an actuarial method intended to provide not only for benefits attributable to service to date, but also for those expected to be earned in the future.
The Company also has an unfunded Defined Benefit Supplemental Executive Retirement Plan (“DB SERP”) that provides certain retired officers with defined pension benefits in excess of qualified plan limits imposed by U.S. federal tax law. The DB SERP has a plan year end of December 31.
The Company’s BEP, which is an unfunded plan, provides retirement benefits to certain employees whose retirement benefits under the Defined Benefit Plan are limited per the Internal Revenue Code. The BEP has a plan year end of October 31.
The Company also has an unfunded Outside Directors’ Retainer Continuance Plan (“ODRCP”) that provides pension benefits to outside directors who retire from service. The Outside Directors’ Retainer Continuance Plan has a plan year end of December 31. Effective December 31, 2020, the Company closed the ODRCP to new participants and froze benefit accruals for active participants.
Plan assets are invested in various investment funds and held at fair value which generally represents observable market prices. Pension liability is determined based on the actuarial cost method factoring in assumptions such as salary increases, expected retirement date, mortality rate, and employee turnover.
The actuarial cost method used to compute the pension liabilities and related expense is the projected unit credit method. The projected benefit obligation is principally determined based on the present value of the projected benefit distributions at an assumed discount rate (which is the rate at which the projected benefit obligation could be effectively settled as of the measurement date). The discount rate which is utilized is determined using the spot rate approach whereby the individual spot rates on the Financial Times and Stock Exchange (“FTSE”) above-median yield curve are applied to each corresponding year’s projected cash flow used to measure the respective plan’s service cost and interest cost. Periodic pension expense (or income) includes service costs, interest costs based on the assumed discount rate, the expected return on plan assets, if applicable, based on the market value of assets and amortization of actuarial gains and losses. Net periodic benefit cost excluding service cost is included within other noninterest expense in the consolidated statements of income. Service cost for all plans except the ODRCP is included in salaries and employee benefits in the consolidated statements of income. Service cost for the ODRCP is included in professional services in the consolidated statements of income. Service costs related to the Defined Benefit Plan and BEP and which are related to employees of Eastern Insurance Group, are included in discontinued operations. The amortization of actuarial gains and losses for the DB SERP and ODRCP is determined using the 10% corridor minimum amortization approach and is taken over the average remaining future service of the plan participants for the ODRCP, and over the average remaining future life expectancy of plan participants for the DB SERP. The amortization of actuarial gains and losses for the Defined Benefit Plan and BEP is determined without using the 10% corridor minimum amortization approach and is taken over the average remaining future service of the plan participants. The overfunded or underfunded status of the plans is recorded as an asset or liability on the Consolidated Balance Sheets, with changes in that status recognized through other comprehensive income, net of related taxes. Funded status represents the difference between the projected benefit obligation of the plan and the market value of the plan’s assets.
Employee Tax Deferred Incentive Plan
The Company has an employee tax deferred incentive plan (“401(k) plan”) under which the Company makes voluntary contributions within certain limitations. All employees who meet specified age and length of service requirements are eligible to participate in the 401(k) plan. The amount contributed by the Company is included in salaries and employee benefits expense.
Defined Contribution Supplemental Executive Retirement Plan
The Company has a defined contribution supplemental executive retirement plan (“DC SERP”), which allows certain senior officers to earn benefits calculated as a percentage of their compensation. The participant benefits are adjusted based upon a deemed investment performance of measurement funds selected by the participant. These measurement funds are for tracking purposes and are used only to track the performance of a mutual fund, market index, savings instrument, or other designated investment or portfolio of investments. Effective December 31, 2021, the Company closed the DC SERP to new participants and froze benefit accruals for active participants.
Deferred Compensation
The Company sponsors three plans which allow for elective compensation deferrals by directors, former trustees, and certain senior-level employees. Each plan allows its participants to designate deemed investments for deferred amounts from certain options which include diversified choices, such as exchange traded funds and mutual funds. Portfolios with various risk profiles are available to participants with the approval of the Compensation Committee. The Company purchases and sells investments which track the deemed investment choices, so that it has available funds to meet its payment liabilities. Deferred amounts, adjusted for deemed investment performance, are paid at the time of a participant designated date or event, such as separation from service, death, or disability. The total amounts due to participants under these plans are included in other liabilities on the Company’s Consolidated Balance Sheets.
Employee Stock Ownership Plan (“ESOP”)
ESOP shares are shown as a reduction of equity and are presented in the consolidated statements of shareholders’ equity as unallocated common stock held by ESOP. Compensation expense for the Company’s ESOP is recorded at an amount equal to the shares committed to be allocated by the ESOP multiplied by the average fair market value of the shares during the year. The Company recognizes compensation expense ratably over the year based upon the Company’s estimate of the number of shares committed to be allocated by the ESOP. When the shares are committed to be released, unallocated common stock held by ESOP is reduced by the cost of the ESOP shares released and the difference between the average fair market value and the cost of the shares committed to be allocated by the ESOP is recorded as an adjustment to additional paid-in capital. The Company’s ESOP is classified as an internally leveraged plan as defined by ASC 718, “Compensation-Stock Compensation.” Accordingly, the loan receivable from the ESOP is not reported as an asset nor is the Company’s guarantee to fund the ESOP reported as a liability on the Company’s consolidated balance sheet.
Share-Based Compensation
The Company measures share-based compensation on the grant date fair value on a straight-line basis over the vesting period during which an employee is required to provide services in exchange for the award; the requisite service period. The Company uses various pricing models to estimate the fair value of stock awards granted. The Company measures the fair value of the restricted stock using the closing market price of the Company’s common stock on the date of grant. The Company records compensation expense equal to the grant date fair value of the Company’s restricted stock with a corresponding increase in equity. Reductions in compensation expense associated with forfeited awards are accounted for as incurred. Upon vesting, the tax effect of the difference between the fair value of the award and the recorded expense is recognized as a component of income tax expense. Refer to Note 17, “Employee Benefits” for additional information regarding the Company’s shares-based compensation plan.
Variable Interest Entities (“VIE”) and Voting Interest Entities (“VOE”)
The Company is involved in the normal course of business with various types of special purpose entities, some of which meet the definition for VIEs and VOEs.
VIEs are entities that possess any of the following characteristics: 1) the total equity investment at risk is insufficient to permit the legal entity to finance its activities without additional subordinated financial support from other parties; 2) as a group, the holders of the equity investment at risk lack any of the characteristics of a controlling financial interest; or 3) the equity investors’ voting rights are not proportional to the economics, and substantially all of the activities of the entity either involve or are conducted on behalf of an investor that has disproportionately few voting rights. The Company consolidates entities deemed to be VIEs when it, or a wholly-owned subsidiary, is determined to be the primary beneficiary. The primary beneficiary analysis is a qualitative analysis based on power and economics. An enterprise has a controlling financial interest in a VIE if it has both 1) the power to direct the activities of a VIE that most significantly impact the VIE’s economic performance and 2) the obligation to absorb losses of the VIE that potentially could be significant to the VIE or the right to receive benefits from the VIE that potentially could be significant to the VIE.
VOEs are entities in which the total equity investment at risk is sufficient to enable the entity to finance itself independently and provides the equity holders with the obligation to absorb losses, the right to receive residual returns and the right to make decisions about the entity’s activities. The Company generally consolidates VOEs when it, or a wholly-owned subsidiary, holds the majority of the voting interest in the VOE.
Rabbi Trusts
The Company established rabbi trusts to meet its obligations under certain executive non-qualified retirement benefits and deferred compensation plans and to mitigate the expense volatility of the aforementioned retirement plans. The rabbi trusts are considered VIEs as the equity investment at risk is insufficient to permit the trust to finance its activities without additional subordinated financial support from the Company. The Company is considered the primary beneficiary of the rabbi trusts as it has the power to direct the activities of the rabbi trusts that significantly affect the rabbi trust’s economic performance and it has the obligation to absorb losses of the rabbi trusts that could potentially be significant to the rabbi trusts by virtue of its contingent call options on the rabbi trust’s assets in the event of the Company’s bankruptcy. As the primary beneficiary of these VIEs, the Company consolidates the rabbi trust investments. In general, the rabbi trust investments and any earnings received thereon are accumulated, reinvested and used exclusively for trust purposes. These rabbi trust investments consist primarily of cash and cash equivalents, U.S. government agency obligations, equity securities, mutual funds and other exchange-traded funds, and are recorded at fair value in the Company’s Consolidated Balance Sheets. Changes in fair value are recorded in noninterest income in the Consolidated Statements of Income. These rabbi trust assets are included within other assets in the Company’s Consolidated Balance Sheets.
Tax Credit Investment
Through a wholly-owned subsidiary, the Company was the sole member of a tax credit investment company through which it consolidated a community development entity (“CDE”) that was considered a VIE. The CDE was considered a VIE because as a group, the holders of the equity investment at risk lacked any of the characteristics of a controlling financial interest. The tax credit investment company was considered the primary beneficiary of the CDE as it had the power to direct the activities of a VIE that most significantly impact the VIEs economic performance and the obligation to absorb losses of and the right to receive benefits from the VIE that potentially could be significant to the VIE. As of December 31, 2022, the Company no longer had a legal interest in this tax credit investment company.
Bank Owned Life Insurance
The Company holds bank-owned life insurance on the lives of certain participating executives, primarily as a result of mergers and acquisitions. The amount reported as an asset on the Consolidated Balance Sheets is the sum of the cash surrender values reported to the Company by the various insurance carriers.
Certain policies are split-dollar life insurance policies whereby the Company recognizes a liability for the postretirement benefit related to the arrangement. This postretirement benefit is included in other liabilities on the Consolidated Balance Sheets.
Income Taxes
The Company accounts for income taxes under the asset and liability method. Under this method, deferred tax assets and liabilities are established for the temporary differences between the accounting basis and the tax basis of the Company’s assets and liabilities at enacted tax rates expected to be in effect when the amounts related to such temporary differences are realized or settled. A valuation allowance is established if it is considered more likely than not that all or a portion of the deferred tax assets will not be realized. Interest and penalties paid on the underpayment of income taxes are classified as income tax expense.
The Company periodically evaluates the potential uncertainty of its tax positions as to whether it is more likely than not its position would be upheld upon examination by the appropriate taxing authority. A tax position that meets the more-likely-than-not recognition threshold is measured to determine the amount of benefit to recognize in the Consolidated Financial Statements. The tax position is measured at the largest amount of benefit that management believes is greater than 50% likely of being realized upon settlement.
Low Income Housing Tax Credits and Other Tax Credit Investments
As part of its community reinvestment initiatives, the Company primarily invests in qualified affordable housing projects in addition to other tax credit investment projects. The Company receives low-income housing tax credits, investment tax credits, rehabilitation tax credits, solar tax credits and other tax credits as a result of its investments in these limited partnership investments.
The Company accounts for its investments in qualified affordable housing projects using the proportional amortization method and amortizes the initial cost of the investment in proportion to the tax credits and other tax benefits allocated to the Company. The amortization of the excess of the carrying amount of the investment over its estimated residual value is included as a component of income tax expense. At investment inception, the Company records a liability for the committed amount of the investment; this liability is reduced as contributions are made.
The Company evaluates investments in tax credit investment companies for consolidation based on the variable or voting interest entity guidance, as appropriate. Other tax credit investment projects are accounted for using either the cost method or equity method.
Advertising Costs
All advertising costs are expensed in the period in which they are incurred. Advertising costs were not significant for any periods presented.
Insurance Commissions
As of and for the year ended December 31, 2022, the Company acted as an agent in offering property, casualty, and life and health insurance to both consumer and commercial customers through Eastern Insurance Group LLC. Insurance commissions consisted of the several types of insurance revenue related to insurance policy sales. The Company earned a fixed commission on the sale of these insurance products and services and occasionally earned a bonus commission if certain volume thresholds were met. The Company recognized insurance commission revenues as performance obligations of underlying agreements were satisfied, which was typically the effective date of the insurance policy. Additionally, for certain types of insurance products, the Company earned and recognized revenue related to the annual residual commissions commensurate with annual premiums being paid. The Company’s contracts typically contained a single, material distinct performance obligation, therefore the Company did not estimate standalone selling prices as the entire transaction price was allocated to the single performance obligation.
The Company also earned profit sharing revenue from insurers whom they place into business. Such revenues were considered performance bonuses based upon certain performance metrics. This amount could vary from period to period and was difficult to predict. Therefore, the Company did not recognize revenue until it had concluded that a significant revenue reversal would not occur in future periods.
Refer to Note 24, “Discontinued Operations” for additional information regarding the Company’s insurance commissions.
Trust Operations
The Bank is a full-service trust company that provides a wide range of trust services to customers that includes managing customer investments, safekeeping customer assets, supplying disbursement services, and providing other fiduciary services. Trust assets held in a fiduciary or agency capacity for customers are not included in the accompanying Consolidated Balance Sheets as they are not assets of the Company. The fees charged are variable based on various factors such as the Company’s responsibility, the type of account, and account size. Customers are also charged a base fee which is prorated over a twelve-month period. Fees for additional or special services are generally fixed in nature and are charged as services are rendered. Revenue from administrative and management activities associated with these assets is recognized as performance obligations of underlying agreements are satisfied.
Derivative Financial Instruments
Derivative instruments are carried at fair value in the Company’s Consolidated Financial Statements. The accounting for changes in the fair value of a derivative instrument is determined by whether it has been designated and qualifies as part of a hedging relationship, and further, by the type of hedging relationship. At the inception of a hedge, the Company documents certain items, including, but not limited to, the following: the relationship between hedging instruments and hedged items, the Company’s risk management objectives, hedging strategies, and the evaluation of hedge transaction effectiveness. Documentation includes linking all derivatives that are designated as hedges to specific assets or liabilities on the balance sheet or to specific forecasted transactions.
The Company’s derivative instruments that are designated and qualify for hedge accounting are classified as cash flow hedges (i.e., hedging the exposure to variability in expected future cash flows associated with a recognized asset or liability, or a forecasted transaction). As such, changes in the fair value of the designated hedging instrument that is included in the assessment of hedge effectiveness are recorded in other comprehensive income and reclassified into net income in the same period or periods during which the hedged forecasted transaction affects net income. Such reclassifications shall be presented in the same income statement line item as the net income effect of the hedged item. If the hedging instrument is not highly effective at achieving offsetting cash flows attributable to the revised contractually specified interest rate(s), hedge accounting will be discontinued. At that time, accumulated other comprehensive income would be frozen and amortized, as long as the forecasted transactions are still probable of occurring. If a cash flow hedge is terminated, hedge accounting treatment would be retained, and accumulated other comprehensive income would be frozen and amortized, as long as the forecasted transactions are still probable of occurring.
The Company’s derivative instruments not designated as hedging instruments are recorded at fair value and changes in fair value are recognized in other noninterest income. Derivative instruments not designated as hedging instruments include interest rate swaps, foreign exchange contracts offered to commercial customers to assist them in meeting their financing and investing objectives for their risk management purposes, and risk participation agreements entered into as financial guarantees of performance on customer-related interest rate swap derivatives. The interest rate and foreign exchange risks associated with customer interest rate swaps and foreign exchange contracts are mitigated by entering into similar derivatives having offsetting terms with correspondent bank counterparties.
All derivative financial instruments eligible for clearing are cleared through the Chicago Mercantile Exchange (“CME”). In accordance with its amended rulebook, CME legally characterizes variation margin payments made to and received from the CME as settlement of derivatives rather than as collateral against derivatives.
Fair Value Measurements
ASC 820 “Fair Value Measurements and Disclosures” (“ASC 820”) defines fair value as the price that would be received to sell an asset or paid to transfer a liability in an orderly transaction between market participants on the measurement date. A fair value measurement assumes that the transaction to sell the asset or transfer the liability occurs in the principal market for the asset or liability or, in the absence of a principal market, the most advantageous market. An orderly transaction is a transaction that assumes exposure to the market for a period prior to the measurement date. Market participants are buyers and sellers in the principal market that are independent, knowledgeable, able and willing to transact. ASC 820 also establishes a fair value hierarchy that prioritizes the inputs to valuation techniques used to measure fair value. The hierarchy gives the highest priority to unadjusted quoted prices in active markets for identical assets or liabilities (Level 1 measurements), and the lowest priority to unobservable inputs (Level 3 measurements). The three levels of the fair value hierarchy are described below:
Level 1 – Inputs are quoted prices (unadjusted) in active markets for identical assets or liabilities that the reporting entity has the ability to access at the measurement date.
Level 2 – Valuations based on quoted prices in markets that are not active or for which all significant inputs are observable, either directly or indirectly.
Level 3 – Prices or valuations that require unobservable inputs that reflect the Company’s own assumptions that are significant to the fair value measurement.
To the extent that valuation is based on models or inputs that are less observable or unobservable in the market, the determination of fair value requires more judgment. Accordingly, the degree of judgment exercised by the Company in determining fair value is greatest for instruments categorized in Level 3. A financial instrument’s level within the fair value hierarchy is based on the lowest level of any input that is significant to the fair value measurement.
Leases
The Company leases certain office space and equipment under various non-cancelable operating leases, some of which have renewal options to extend lease terms. At lease inception, the Company evaluates the lease terms to determine if the lease should be classified as an operating lease or a finance lease and recognizes a right of use (“ROU”) asset and corresponding lease liability. The Company makes the decision on whether to renew an option to extend a lease by considering various factors. The Company will recognize an adjustment to its ROU asset and lease liability when lease agreements are amended and executed. The discount rate used in determining the present value of lease payments is based on the Company’s incremental borrowing rate for borrowings with terms similar to each lease at commencement date. The Company has lease agreements with lease and non-lease components, which are generally accounted for as a single lease component. The Company has elected the short-term lease recognition exemption for all leases that qualify.
Common Share Repurchases
Shares repurchased by the Company under the Company's share repurchase program have been classified as authorized but unissued shares. The cost of shares repurchased by the Company has been accounted for as a reduction to common stock and additional paid in capital balances. Massachusetts state law calls for repurchased shares to be classified as authorized but unissued shares. U.S. GAAP states that the accounting for share repurchases shall conform to state law where applicable.
Earnings Per Share
Basic earnings per share represents income available to common shareholders divided by the weighted-average number of common shares outstanding during the period. Unallocated ESOP shares are not deemed outstanding for earnings per share calculations. ESOP shares committed to be released are considered to be outstanding for purposes of the earnings per share computation. ESOP shares that have not been legally released, but that relate to employee services rendered during an accounting period (interim or annual) ending before the related debt service payment is made, are considered committed to be released. Diluted earnings per share reflects additional common shares that would have been outstanding if dilutive potential common shares had been issued, as well as any adjustment to income that would result from the assumed issuance. Potential common shares that may be issued by the Company relate to outstanding stock awards and are determined using the treasury stock method.
Segment Reporting
An operating segment is defined as a component of a business for which separate financial information is available that is evaluated regularly by the chief operating decision-maker (“CODM”) in deciding how to allocate resources and evaluate performance. The Company has determined that its CODM is its President and Chief Executive Officer. As of December 31, 2022, the Company had two reportable segments: its banking business, which consists of a full range of banking lending, savings, and small business offerings, and its wealth management and trust operations; and its insurance agency business, which consists of insurance-related activities. Substantially all of the assets and certain liabilities of the insurance agency business were reclassified to discontinued operations as a result of the decision to sell such assets and liabilities to Gallagher. As such, disclosures required pursuant to ASC 280, Segment Reporting, were replaced with disclosures required pursuant to ASC 205-20, Discontinued Operations. Refer to Note 24, “Discontinued Operations” for further discussion regarding discontinued operations.
Recent Accounting Pronouncements
Until December 31, 2021, the Company had qualified as an emerging growth company under the Jumpstart Our Business Act of 2012 (“JOBS Act”) and had elected to defer the adoption of new or revised accounting standards until the earlier of the nonpublic company effective dates and the date on which the Company ceased to qualify as an emerging growth company.
Relevant standards that were recently issued but not yet adopted as of December 31, 2022:
In October 2021, the FASB issued ASU 2021-08, Business Combinations (Topic 805): Accounting for Contract Assets and Contract Liabilities from Contracts with Customers (“ASU 2021-08”). This update modifies how an acquiring entity measures contract assets and contract liabilities of an acquiree in a business combination in accordance with Topic 606. The amendments in this update require the acquiring entity in a business combination to account for revenue contracts as if they had originated the contract and assess how the acquiree accounted for the contract under Topic 606. ASU 2021-08 improves comparability of recognition and measurement of revenue contracts with customers both before and after a business combination. For public business entities, the amendments in this update are effective for fiscal years beginning after December 15, 2022. For all other entities, the amendments are effective for fiscal years beginning after December 15, 2023. The amendments in this update should be applied prospectively to business combinations occurring on or after the effective date of the amendments with early adoption permitted. The adoption of this standard did not have a material impact on the Company’s Consolidated Financial Statements.
In March 2022, the FASB issued ASU 2022-02, Financial Instruments–Credit Losses (Topic 326): Troubled Debt Restructurings and Vintage Disclosures (“ASU 2022-02”). The amendments in this update eliminate the accounting guidance on troubled debt restructurings (“TDRs”) for creditors in ASC 310-40 and amends the guidance on vintage disclosures, referenced in ASC 326-20-50, to require disclosure of current-period gross write-offs by year of origination. This update supersedes the existing accounting guidance for TDRs in ASC 310-40 in its entirety and requires entities to evaluate all receivable modifications under existing accounting guidance in ASC 310-20 to determine whether a modification made to a borrower results in a new loan or a continuation of an existing loan. In addition to the elimination of TDR accounting guidance, entities that adopt this update will no longer consider renewals, modifications and extensions that result from reasonably expected TDRs in their calculation of the allowance for credit losses. Further, if an entity employs a discounted cash flow method to calculate the allowance for credit losses, it will be required to use a post-modification-derived effective interest rate as part of its calculation. The update also requires new disclosures for receivables for which there has been a modification in their contractual cash flows resulting from borrowers experiencing financial difficulties. For public business entities, the amendments in this update are effective for fiscal years beginning after December 15, 2022, including interim periods within those fiscal years. Entities may elect to apply the updated guidance on TDR recognition and measurement by using a modified retrospective transition method. The amendments on TDR disclosures and vintage disclosures should be adopted prospectively. On January 1, 2023, the Company adopted this standard using the modified retrospective method with respect to the updated guidance on TDR recognition and measurement and the prospective approach with regard to the TDR and vintage disclosures. The adoption of this standard did not have a material impact on the Company’s Consolidated Financial Statements.
In March 2023, the FASB issued ASU 2023-02, Investments–Equity Method and Joint Ventures (Topic 323): Accounting for Investments in Tax Credit Structures Using the Proportional Amortization Method (“ASU 2023-02”). This update permits reporting entities to elect to account for their tax equity investments, regardless of the tax credit program from which the income tax credits are received, using the proportional amortization method if the following conditions are met:
1.It is probable that the income tax credits allocable to the tax equity investor will be available.
2.The tax equity investor does not have the ability to exercise significant influence over the operating and financial policies of the underlying project.
3.Substantially all of the projected benefits are from income tax credits and other income tax benefits. Projected benefits include income tax credits, other income tax benefits, and other non-income-tax-related benefits. The projected benefits are determined on a discounted basis, using a discount rate that is consistent with the cash flow assumptions used by the tax equity investor in making its decision to invest in the project.
4.The tax equity investor’s projected yield based solely on the cash flows from the income tax credits and other income tax benefits is positive.
5.The tax equity investor is a limited liability investor in the limited liability entity for both legal and tax purposes, and the tax equity investor’s liability is limited to its capital investment.
Under existing accounting standards, the proportional amortization method is allowable only for equity investments in low-income-housing tax credit structures. Under the proportional amortization method, an entity amortizes the initial cost of the investment in proportion to the income tax credits and other income tax benefits received and recognizes the net amortization and income tax credits and other income tax benefits in the income statement as a component of income tax expense (benefit).
Updates made by ASU 2023-02 allow a reporting entity to make an accounting policy election to apply the proportional amortization method on a tax-credit-program-by-tax-credit-program basis. The Company had previously made an accounting policy election to account for its investments in low-income-housing tax credit investments using the proportional amortization method. This election was made upon the Company’s adoption of ASU 2014-01, Investments–Equity Method and Joint Ventures (Topic 323): Accounting for Investments in Qualified Affordable Housing Projects, which introduced the option to apply proportional amortization to low-income-housing tax credit investments. For public business entities, the amendments in ASU 2023-02 are effective for fiscal years beginning after December 15, 2023, including interim periods within those fiscal years. Early adoption is permitted for all entities in an interim period. The Company expects the adoption of this standard will not have a material impact on its Consolidated Financial Statements.
In October 2023, the FASB issued ASU 2023-06, Disclosure Improvements–Codification Amendments in Response to the SEC’s Disclosure Update and Simplification Initiative (“ASU 2023-06”). The amendments in this update modify the disclosure or presentation requirements for a variety of topics in the codification. Certain amendments represent clarifications to or technical corrections of the current requirements. The following is a summary of the topics included in the update and which pertain to the Company:
1.Statement of cash flows (Topic 230): Requires an accounting policy disclosure in annual periods of where cash flows associated with derivative instruments and their related gains and loses are presented in the statement of cash flows;
2.Accounting changes and error corrections (Topic 250): Requires that when there has been a change in the reporting entity, the entity disclose any material prior-period adjustment and the effect of the adjustment on retained earnings in interim financial statements;
3.Earnings per share (Topic 260): Requires disclosure of the methods used in the diluted earnings-per-share computation for each dilutive security and clarifies that certain disclosures should be made during interim periods, and amends illustrative guidance to illustrate disclosure of the methods used in the diluted earnings per share computation;
4.Commitments (Topic 440): Requires disclosure of assets mortgaged, pledged, or otherwise subject to lien and the obligations collateralized; and
5.Debt (Topic 470): Requires disclosure of amounts and terms of unused lines of credit and unfunded commitments and the weighted-average interest rate on outstanding short-term borrowings.
For public business entities, the amendments in ASU 2023-06 are effective on the date which the SEC’s removal of that related disclosure from Regulation S-X or Regulation S-K becomes effective. If by June 30, 2027, the SEC has not removed the applicable requirement from Regulation and S-X or Regulation S-K, the pending content of the related amendment will be removed from the codification and will not become effective for any entity. Early adoption is not permitted and the amendments are required to be applied on a prospective basis. The Company expects the adoption of this standard will not have a material impact on its Consolidated Financial Statements.
Relevant standards that were adopted during the year ended December 31, 2022:
In June 2016, the FASB issued ASU 2016-13, Financial Instruments–Credit Losses on Financial Instruments and relevant amendments (Topic 326) (“ASU 2016-13”). This update was created to replace the then-current GAAP method of calculating credit losses. Specifically, the standard replaced the previous incurred loss impairment guidance by requiring immediate recognition of expected credit losses. For financial assets carried at amortized cost that are held at the reporting date (including trade and other receivables, loans and commitments, held-to-maturity debt securities and other financial assets), credit losses are measured based on historical experience, current conditions and reasonable supportable forecasts. The standard also amends previous impairment guidance for available for sale securities, in which credit losses are recorded as an allowance versus a write-down of the amortized cost basis of the security. It also allows for a reversal of impairment loss when the credit of the issuer improves. The guidance requires a cumulative effect of the initial application to be recognized in retained earnings at the date of initial application.
In November 2018, the FASB issued ASU 2018-19, Codification Improvements to Topic 326, Financial Instruments – Credit Losses (“ASU 2018-19”). The amendments in ASU 2018-19 were intended to clarify that receivables arising from operating leases are not within the scope of Subtopic 326-20. Instead, impairment of receivables arising from operating leases should be accounted for in accordance with Topic 842, Leases. In November 2019, the FASB issued ASU 2019-11, Codification Improvements to Topic 326, Financial Instruments – Credit Losses. This update requires entities to include expected recoveries of the amortized cost basis previously written off or expected to be written off in the valuation account for purchased financial assets with credit deterioration. In addition, the amendments in this update clarify and improve various aspects of the guidance for ASU 2016-13.
On January 1, 2022, the Company adopted ASUs 2016-13, 2018-19 and 2019-11 (codified in ASC 326, “Financial Instruments-Credit Losses”), which replaced the incurred loss methodology (codified in ASC 450, “Contingencies,” ASC 310, “Receivables” and ASC 320, “Debt Securities”) with an expected loss methodology that is referred to as current expected credit losses methodology (“CECL methodology”). The Company adopted ASU 2016-13 using the modified retrospective method for all financial assets measured at amortized cost and off-balance sheet credit exposures by means of a cumulative-effect adjustment to the opening retained earnings balance on the Company’s consolidated balance sheet as of the Company’s date of adoption of January 1, 2022. Accordingly, results for reporting periods beginning after December 31, 2021 are presented under ASU 2016-13, while prior period amounts continue to be reported in accordance with previously applicable GAAP. The Company recorded a net decrease to retained earnings of $20.1 million, net of deferred taxes of $7.9 million, as of January 1, 2022, for the cumulative effect of adopting ASU 2016-13. The Company adopted ASU 2016-13 using the prospective transition approach for purchased credit-deteriorated (“PCD”) financial assets that were previously classified as purchased credit-impaired (“PCI”) financial assets and accounted for under ASC 310-30. In accordance with ASU 2016-13, the Company did not reassess whether its assets previously classified as PCI assets met the criteria of PCD assets as of the date of adoption. Rather, loans previously determined to be PCI loans are considered to be PCD loans as of January 1, 2022. On January 1, 2022, the amortized cost basis of the PCD assets was adjusted to reflect the addition of the allowance for loan losses on PCD loans. The remaining noncredit discount will be accreted into the Company’s interest income at the then-effective interest rate as of January 1, 2022. The amount of the adjustment for PCD assets was not material to the Company.
In March 2020, the FASB issued ASU 2020-4, Reference Rate Reform (Topic 848): Facilitation of the Effects of Reference Rate Reform on Financial Reporting (“ASU 2020-04”). This update addresses optional expedients and exceptions for applying GAAP to certain contracts, hedging relationships, and other transactions affected by reference rate reform if certain criteria are met. The new guidance applies only to contracts, hedging relationships, and other transactions that reference the London Interbank Offered Rate (“LIBOR”) or another reference rate expected to be discontinued because of reference rate reform. The expedients and exceptions provided by the amendments do not apply to contract modifications made and hedging relationships that exist as of December 31, 2022, for which an entity has elected certain optional expedients for and that are retained through the end of the hedging relationship. For public and nonpublic entities, the guidance is effective as of March 12, 2020 through December 31, 2022 and does not apply to contract modifications made after December 31, 2022. The Company performed a review its contracts and existing processes to assess the risks and potential impact of the transition away from LIBOR and noted no material impact to the Company’s Consolidated Financial Statements as of December 31, 2022.
In December 2022, the FASB issued ASU 2022-06, Reference Rate Reform (Topic 848): Deferral of the Sunset Date of Topic 848 (“ASU 2022-06”). This update defers the sunset date of Topic 848 from December 31, 2022 to December 31, 2024, after which entities will no longer be permitted to apply the relief of Topic 848. The adoption of this standard as of December 31, 2022 did not have a material impact on the Company's Consolidated Financial Statements.
3. Mergers and Acquisitions
The information presented within this Note excludes discontinued operations. Refer to Note 24, “Discontinued Operations” for further discussion regarding discontinued operations.
On November 12, 2021, the Company completed its acquisition of Century Bancorp, Inc. (“Century”). Under the terms of the Merger Agreement, each holder of Century Class A and B common stock received a cash payment of $115.28 per share. The total consideration paid in the acquisition of Century was $641.9 million in cash. In connection with the acquisition, Century Bank and Trust Company, a wholly owned subsidiary of Century, was merged with and into the Bank. The acquisition added $7.1 billion to total assets, including goodwill and intangible assets, $2.9 billion to total loans, which included PCI loans totaling $67.3 million and $6.1 billion to total deposits, and added 29 full-service banking offices in Massachusetts, as of the date of closing.
The acquisition was accounted for under the acquisition method of accounting in accordance with ASC Topic 805, Business Combinations. Under this method of accounting, the respective assets acquired and liabilities assumed were recorded at their estimated fair values. The excess of consideration paid over the estimated fair value of the net assets acquired totaled $259.0 million and was recorded as goodwill. The results of Century’s operations were included in the Company’s Consolidated Financial Statements subsequent to the acquisition date.
The calculation of goodwill was subject to change for up to one year after the closing date of the transaction as additional information relative to closing date estimates and uncertainties became available. As of December 31, 2022, the Company finalized its analysis of these assets and liabilities and no adjustments to the recorded carrying values were considered necessary.
The following table summarizes the estimated fair values of the assets acquired and the liabilities assumed at the date of acquisition from Century:
|
|
|
|
|
|
|
Net Assets Acquired at Fair Value |
|
(In thousands) |
| Assets |
|
| Cash and due from banks |
$ |
56,831 |
|
| Short-term investments |
575,953 |
|
| Investment securities |
3,117,022 |
|
| Loans |
2,906,491 |
|
| FHLB stock |
6,690 |
|
| Premises and equipment |
64,521 |
|
| Bank owned life insurance |
95,478 |
|
| Goodwill |
259,024 |
|
| Core deposit intangible |
11,633 |
|
| Other assets |
18,915 |
|
| Total assets acquired |
7,112,558 |
|
| Liabilities |
|
| Deposits |
6,099,821 |
|
| Securities sold under agreements to repurchase |
274,982 |
|
| Escrow deposits of borrowers |
3,649 |
|
| Other liabilities |
92,237 |
|
| Total liabilities assumed |
6,470,689 |
|
| Purchase price |
$ |
641,869 |
|
Fair Value Measurement of Assets Assumed and Liabilities Assumed
The methods used to determine the fair value of the assets acquired and liabilities assumed in the Century acquisition were as follows:
Investment Securities
The estimated fair values of the available for sale debt securities and held-to-maturity debt securities, primarily comprised of U.S. Government agency mortgage-backed securities, U.S. government agencies, Small Business Administration (“SBA”) pooled securities, and municipal bonds carried on Century’s balance sheet, was confirmed using open market pricing provided by multiple independent securities brokers. Based upon management’s determination, a fair value adjustment of $(37.3) million, reflecting a net discount, was recorded on acquired securities and reflects the net unrealized loss position of such securities at the date of acquisition. Securities acquired that were classified on Century’s balance sheet as held-to-maturity were reclassified as available for sale upon acquisition, reflecting management’s intent with respect to such securities.
Loans
Loans acquired in the Century acquisition were recorded at fair value, and there was no carryover of the allowance for loan losses. The fair value of the loans acquired from Century was determined using market participant assumptions in estimating the amount and timing of both principal and interest cash flows expected to be collected, as adjusted for an estimate of future credit losses and prepayments, and then applying a market-based discount rate to those cash flows. Management retained a third-party valuation specialist to assist with the determination of future credit losses, prepayments and a market-based discount rate, the results of which were reviewed by management. A fair value adjustment of $(13.3) million, reflecting a net discount, was recorded on the loans acquired in this transaction and was due primarily to anticipated credit loss, as well as considerations for liquidity and market interest rates.
A portion of the acquired loans exhibited evidence of more-than-insignificant deterioration in credit quality since origination and thus were reviewed to determine if any loans would be deemed PCI. The following is a summary of the PCI loans identified as a result of the review performed as of the date acquired:
|
|
|
|
|
|
|
As of November 12, 2021 |
|
(In thousands) |
| Contractually required principal and interest at acquisition (1) |
$ |
82,900 |
|
| Contractual cash flows not expected to be collected |
6,746 |
|
| Expected cash flows at acquisition |
76,154 |
|
| Interest component of expected cash flows |
8,896 |
|
| Basis in PCI loans at acquisition - estimated fair value |
$ |
67,258 |
|
(1)Contractually required principal and interest at acquisition includes interest not expected to be collected due to estimated prepayments.
Premises and Equipment
The Company acquired 29 branches from Century as of the date of closing, 13 of which were owned premises. The fair value of properties acquired was derived by valuations prepared by an independent third party utilizing a combination of the cost approach and the sales comparison approach to value the property as improved.
Included in the acquired premises and equipment of $64.5 million was real estate previously owned by Century and located at 400 Mystic Avenue, Medford, Massachusetts (the “400 Mystic Parcel”). On September 30, 2021, the Company executed a definitive Purchase and Sale Agreement that provided for Eastern Bank to sell the 400 Mystic Parcel, where Century maintained its executive offices. The purchase price for the 400 Mystic Parcel was $20.5 million in cash payable at the closing of the sale which occurred in the mid-fourth quarter of 2021 after the Company completed the acquisition. The fair value of the property was initially recorded at an amount equal to the agreed upon purchase price. Accordingly, no gain or loss was recognized as a result of the sale.
Leases
As part of the Century acquisition the Company added 20 lease obligations. The Company recorded a $13.9 million right-of-use asset and lease liability for these lease obligations.
Core Deposit Intangible
The fair value of the core deposit intangible was determined based on a discounted cash flow analysis using a discount rate commensurate with market participants. To calculate cash flows, deposit account servicing costs (net of deposit fee income) and interest expense on deposits were compared to the cost of alternative funding sources available through FHLBB borrowing rates and national brokered CD offering rates. The projected cash flows were developed using projected deposit attrition rates. Management retained a third-party valuation specialist to assist with the determination of projected cash flows, the results of which were reviewed by management. The core deposit intangible totaled $11.6 million and is being amortized on a straight-line basis over its estimated useful life of approximately 10 years.
Goodwill
The calculation of goodwill was subject to change for up to one year after the date of acquisition as additional information relative to the closing date estimates and uncertainties became available. As the Company finalized its review of the acquired assets and liabilities, certain adjustments to the recorded carrying values could have been required. No adjustments were considered necessary in connection with this review. The goodwill is evaluated annually for impairment. The goodwill is not deductible for tax purposes.
Bank Owned Life Insurance (“BOLI”)
Century’s BOLI cash surrender value was $95.5 million with no fair value adjustment.
Time Deposits
The fair value adjustment for time deposits represents a discount from the value of the contractual repayments of fixed-maturity deposits using prevailing market interest rates for similar-term time deposits. The time deposit discount of approximately $1.8 million is being amortized into income on a level yield amortization method over the contractual life of the deposits.
Securities Sold Under Agreements to Repurchase
Acquired securities sold under agreements to repurchase were $275.0 million with no fair value adjustment as the fair value approximates carrying value. Such agreements reached their maturity prior to December 31, 2021. Accordingly, the Company had no obligations related to securities sold under agreements to repurchase as of December 31, 2021. Securities sold under agreements to repurchase were customer-related and were converted to deposits upon maturity.
Escrow Deposits of Borrowers
Century’s escrow deposits of borrowers was $3.6 million with no fair value adjustment.
Merger-Related Expenses
The Company recorded merger and acquisition expenses of $35.5 million during the year ended December 31, 2021 related to the Century acquisition. These merger and acquisition expenses were included in the following line items of the consolidated statements of income:
|
|
|
|
|
|
|
For the Year Ended December 31, 2021 |
|
(In thousands) |
| Salaries and employee benefits |
$ |
15,947 |
|
| Office occupancy and equipment |
7,198 |
|
| Data processing |
1,286 |
|
| Professional services |
9,223 |
|
| Other |
1,802 |
|
|
$ |
35,456 |
|
The following table presents certain unaudited pro forma information for the years ended December 31, 2021 and 2020. This unaudited estimated pro forma financial information was calculated as if Century had been acquired as of the beginning of the year prior to the date of acquisition. This unaudited pro forma information combines the historical results of Century with the Company’s consolidated historical results and includes certain adjustments reflecting the estimated impact of certain fair value adjustments for the respective periods. The pro forma information is not indicative of what would have occurred had the acquisition occurred as of the beginning of the year prior to the acquisition. The unaudited pro forma information does not consider any changes to the provision for loan losses resulting from recording loan assets at fair value, cost savings, or business synergies. As a result, actual amounts would have differed from the unaudited pro forma information presented.
|
|
|
|
|
|
|
|
|
|
|
|
|
Unaudited Pro Forma Financial Information for the Years Ended December 31, 2021 |
|
2021 |
|
2020 |
|
(In thousands) |
| Net interest income |
$ |
522,621 |
|
|
$ |
502,853 |
|
| Net income |
174,603 |
|
|
61,858 |
|
Financial results of Century from the date of acquisition through December 31, 2021 are not presented as management considers the determination of such amounts to be impracticable.
4. Securities
Available for Sale Securities
The amortized cost, gross unrealized gains and losses, and fair value of available for sale securities as of the dates indicated were as follows:
|
|
|
|
|
|
|
|
|
|
|
|
|
|
|
|
|
|
|
|
|
|
|
|
|
|
|
|
|
|
|
As of December 31, 2022 |
|
Amortized
Cost |
|
Unrealized
Gains |
|
Unrealized
Losses |
|
Allowance for Credit Losses |
|
Fair
Value |
|
(In thousands) |
| Debt securities: |
|
|
|
|
|
|
|
|
|
| Government-sponsored residential mortgage-backed securities |
$ |
4,855,763 |
|
|
$ |
— |
|
|
$ |
(743,855) |
|
|
$ |
— |
|
|
$ |
4,111,908 |
|
| Government-sponsored commercial mortgage-backed securities |
1,570,119 |
|
|
— |
|
|
(221,165) |
|
|
— |
|
|
1,348,954 |
|
| U.S. Agency bonds |
1,100,891 |
|
|
— |
|
|
(148,409) |
|
|
— |
|
|
952,482 |
|
| U.S. Treasury securities |
99,324 |
|
|
— |
|
|
(6,267) |
|
|
— |
|
|
93,057 |
|
| State and municipal bonds and obligations |
198,039 |
|
|
9 |
|
|
(14,956) |
|
|
— |
|
|
183,092 |
|
| Other debt securities |
1,299 |
|
|
— |
|
|
(14) |
|
|
— |
|
|
1,285 |
|
|
$ |
7,825,435 |
|
|
$ |
9 |
|
|
$ |
(1,134,666) |
|
|
$ |
— |
|
|
$ |
6,690,778 |
|
|
|
|
|
|
|
|
|
|
|
|
|
|
|
|
|
|
|
|
|
|
|
|
|
|
As of December 31, 2021 |
|
Amortized
Cost |
|
Unrealized
Gains |
|
Unrealized
Losses |
|
Fair
Value |
|
(In thousands) |
| Debt securities: |
|
|
|
|
|
|
|
| Government-sponsored residential mortgage-backed securities |
$ |
5,577,292 |
|
|
$ |
17,918 |
|
|
$ |
(70,502) |
|
|
$ |
5,524,708 |
|
| Government-sponsored commercial mortgage-backed securities |
1,420,748 |
|
|
760 |
|
|
(12,640) |
|
|
1,408,868 |
|
| U.S. Agency bonds |
1,202,377 |
|
|
1,067 |
|
|
(28,430) |
|
|
1,175,014 |
|
| U.S. Treasury securities |
89,434 |
|
|
5 |
|
|
(834) |
|
|
88,605 |
|
| State and municipal bonds and obligations |
263,910 |
|
|
16,460 |
|
|
(41) |
|
|
280,329 |
|
| Small Business Administration pooled securities |
31,821 |
|
|
282 |
|
|
— |
|
|
32,103 |
|
| Other debt securities |
1,597 |
|
|
— |
|
|
— |
|
|
1,597 |
|
|
$ |
8,587,179 |
|
|
$ |
36,492 |
|
|
$ |
(112,447) |
|
|
$ |
8,511,224 |
|
The Company did not record a provision for credit losses on any AFS securities during the year ended December 31, 2022. Accrued interest receivable on AFS securities totaled $12.9 million and $14.3 million as of December 31, 2022 and December 31, 2021, respectively, and is included within other assets on the Consolidated Balance Sheets. The Company did not record any write-offs of accrued interest income on AFS securities during the year ended December 31, 2022. No AFS securities held by the Company were delinquent on contractual payments as of December 31, 2022, nor were any such securities placed on non-accrual status for the period then ended.
As of December 31, 2022 and 2021, the Company had no investments in obligations of individual states, counties, or municipalities which exceeded 10% of consolidated shareholders’ equity.
The following table summarizes gross realized gains and losses from sales of AFS securities for the periods indicated:
|
|
|
|
|
|
|
|
|
|
|
|
|
|
|
|
|
|
|
For the Years Ended December 31, |
|
2022 |
|
2021 |
|
2020 |
|
(In thousands) |
| Gross realized gains from sales of AFS securities |
$ |
1,775 |
|
|
$ |
1,166 |
|
|
$ |
288 |
|
| Gross realized losses from sales of AFS securities |
(4,932) |
|
|
— |
|
|
— |
|
| Net (losses) gains from sales of AFS securities |
$ |
(3,157) |
|
|
$ |
1,166 |
|
|
$ |
288 |
|
Prior to the Company’s adoption of ASU 2016-13, management prepared an estimate of the Company’s expected cash flows for AFS investment securities that potentially may be deemed to have been an OTTI. This estimate began with the contractual cash flows of the security which was then reduced by an estimate of probable credit losses associated with the security.
When estimating the extent of probable losses on the securities, management considered the credit quality and the ability to pay of the underlying issuers. Indicators of diminished credit quality of the issuers included defaults, interest deferrals, or “payments in kind.” Management also considered those factors listed in the “Investments – Debt and Equity Securities” topic of the FASB ASC when estimating the ultimate realizability of the cash flows for each individual security.
The resulting estimate of expected cash flows after considering credit was then subject to a present value computation using a discount rate equal to the current yield used to accrete the beneficial interest or the effective interest rate implicit in the security at the date of acquisition. If the present value of the estimated expected cash flows was less than the current amortized cost basis, an OTTI was considered to have occurred and the security was written down to the fair value indicated by the cash flow analysis. As part of the analysis, management considered whether it intended to sell the security or whether it was more than likely that it would be required to sell the security before the expected recovery of its amortized cost basis. There was no OTTI recorded during the years ended December 31, 2021 and 2020.
Information pertaining to AFS securities with gross unrealized losses as of December 31, 2022, for which the Company did not recognize a provision for credit losses under CECL, and as of December 31, 2021, for which the Company did not deem to be OTTI under its prior methodology, aggregated by investment category and length of time that individual securities have been in a continuous loss position, follows:
|
|
|
|
|
|
|
|
|
|
|
|
|
|
|
|
|
|
|
|
|
|
|
|
|
|
|
|
|
|
|
|
|
|
|
|
|
|
|
|
|
|
|
As of December 31, 2022 |
|
|
|
Less than 12 Months |
|
12 Months or Longer |
|
Total |
|
# of
Holdings |
|
Gross
Unrealized
Losses |
|
Fair
Value |
|
Gross
Unrealized
Losses |
|
Fair
Value |
|
Gross
Unrealized
Losses |
|
Fair
Value |
|
(Dollars in thousands) |
| Government-sponsored residential mortgage-backed securities |
322 |
|
$ |
42,196 |
|
|
$ |
435,690 |
|
|
$ |
701,659 |
|
|
$ |
3,676,218 |
|
|
$ |
743,855 |
|
|
$ |
4,111,908 |
|
| Government-sponsored commercial mortgage-backed securities |
199 |
|
38,944 |
|
|
300,476 |
|
|
182,221 |
|
|
1,048,478 |
|
|
221,165 |
|
|
1,348,954 |
|
| U.S. Agency bonds |
37 |
|
645 |
|
|
4,145 |
|
|
147,764 |
|
|
948,337 |
|
|
148,409 |
|
|
952,482 |
|
| U.S. Treasury securities |
5 |
|
1,311 |
|
|
48,451 |
|
|
4,956 |
|
|
44,606 |
|
|
6,267 |
|
|
93,057 |
|
| State and municipal bonds and obligations |
237 |
|
14,942 |
|
|
179,614 |
|
|
14 |
|
|
225 |
|
|
14,956 |
|
|
179,839 |
|
| Other debt securities |
2 |
|
— |
|
|
— |
|
|
14 |
|
|
1,285 |
|
|
14 |
|
|
1,285 |
|
|
802 |
|
$ |
98,038 |
|
|
$ |
968,376 |
|
|
$ |
1,036,628 |
|
|
$ |
5,719,149 |
|
|
$ |
1,134,666 |
|
|
$ |
6,687,525 |
|
|
|
|
|
|
|
|
|
|
|
|
|
|
|
|
|
|
|
|
|
|
|
|
|
|
|
|
|
|
|
|
|
|
|
|
|
|
|
|
|
|
|
|
As of December 31, 2021 |
|
|
|
Less than 12 Months |
|
12 Months or Longer |
|
Total |
|
# of
Holdings |
|
Gross
Unrealized
Losses |
|
Fair
Value |
|
Gross
Unrealized
Losses |
|
Fair
Value |
|
Gross
Unrealized
Losses |
|
Fair
Value |
|
(Dollars in thousands) |
| Government-sponsored residential mortgage-backed securities |
264 |
|
$ |
70,502 |
|
|
$ |
4,615,457 |
|
|
$ |
— |
|
|
$ |
— |
|
|
$ |
70,502 |
|
|
$ |
4,615,457 |
|
| Government-sponsored commercial mortgage-backed securities |
165 |
|
12,218 |
|
|
1,102,444 |
|
|
422 |
|
|
15,682 |
|
|
12,640 |
|
|
1,118,126 |
|
| U.S. Agency bonds |
27 |
|
2,169 |
|
|
191,222 |
|
|
26,261 |
|
|
794,353 |
|
|
28,430 |
|
|
985,575 |
|
| U.S. Treasury securities |
3 |
|
834 |
|
|
78,588 |
|
|
— |
|
|
— |
|
|
834 |
|
|
78,588 |
|
| State and municipal bonds and obligations |
11 |
|
41 |
|
|
5,436 |
|
|
— |
|
|
— |
|
|
41 |
|
|
5,436 |
|
|
470 |
|
$ |
85,764 |
|
|
$ |
5,993,147 |
|
|
$ |
26,683 |
|
|
$ |
810,035 |
|
|
$ |
112,447 |
|
|
$ |
6,803,182 |
|
As of December 31, 2022, the Company does not intend to sell these investments and has determined based upon available evidence that it is more likely than not that the Company will not be required to sell each security before the expected recovery of its amortized cost basis. As a result, the Company did not recognize an ACL on these investments as of December 31, 2022. As it relates to AFS securities with gross unrealized losses as of December 31, 2021, the Company did not consider these investments to be OTTI under its prior methodology. The Company made this determination by reviewing various qualitative and quantitative factors regarding each investment category, such as current market conditions, extent and nature of changes in fair value, issuer rating changes and trends, and volatility of earnings.
As a result of the Company’s review of these qualitative and quantitative factors, the causes of the impairments listed in the tables above by category are as follows as of December 31, 2022 and 2021:
•Government-sponsored residential mortgage-backed securities – The securities with unrealized losses in this portfolio have contractual terms that generally do not permit the issuer to settle the security at a price less than the current par value of the investment. The decline in market value of these securities is attributable to changes in interest rates and not credit quality. Additionally, these securities are implicitly guaranteed by the U.S. government or one of its agencies.
•Government-sponsored commercial mortgage-backed securities – The securities with unrealized losses in this portfolio have contractual terms that generally do not permit the issuer to settle the security at a price less than the current par value of the investment. The decline in market value of these securities is attributable to changes in interest rates and not credit quality. Additionally, these securities are implicitly guaranteed by the U.S. government or one of its agencies.
•U.S. Agency bonds – The securities with unrealized losses in this portfolio have contractual terms that generally do not permit the issuer to settle the security at a price less than the current par value of the investment. The decline in market value of these securities is attributable to changes in interest rates and not credit quality. Additionally, these securities are implicitly guaranteed by the U.S. government or one of its agencies.
•U.S. Treasury securities – The securities with unrealized losses in this portfolio have contractual terms that generally do not permit the issuer to settle the security at a price less than the current par value of the investment. The decline in market value of these securities is attributable to changes in interest rates and not credit quality. Additionally, these securities are implicitly guaranteed by the U.S. government or one of its agencies.
•State and municipal bonds and obligations – The securities with unrealized losses in this portfolio have contractual terms that generally do not permit the issuer to settle the security at a price less than the current par value of the investment. The decline in market value of these securities is attributable to changes in interest rates and not credit quality.
•Other debt securities – This securities portfolio consists of two foreign debt securities which are performing in accordance with the terms of the respective contractual agreements. The decline in market value of these securities is attributable to changes in interest rates and not credit quality.
Held to Maturity Securities
The amortized cost, gross unrealized gains and losses, and fair value of HTM securities as of December 31, 2022 were as follows:
|
|
|
|
|
|
|
|
|
|
|
|
|
|
|
|
|
|
|
|
|
|
|
|
|
|
|
|
|
|
|
As of December 31, 2022 |
|
Amortized
Cost |
|
Unrealized
Gains |
|
Unrealized
Losses |
|
Allowance for Credit Losses |
|
Fair
Value |
|
(In thousands) |
| Debt securities: |
|
|
|
|
|
|
|
|
|
| Government-sponsored residential mortgage-backed securities |
$ |
276,493 |
|
|
$ |
— |
|
|
$ |
(30,150) |
|
|
$ |
— |
|
|
$ |
246,343 |
|
| Government-sponsored commercial mortgage-backed securities |
200,154 |
|
|
— |
|
|
(23,271) |
|
|
— |
|
|
176,883 |
|
|
$ |
476,647 |
|
|
$ |
— |
|
|
$ |
(53,421) |
|
|
$ |
— |
|
|
$ |
423,226 |
|
The Company held no HTM securities as of December 31, 2021.
The Company did not record a provision for estimated credit losses on any HTM securities during the year ended December 31, 2022. The accrued interest receivable on HTM securities totaled $1.0 million as of December 31, 2022 and is included within other assets on the Consolidated Balance Sheets. The Company did not record any write-offs of accrued interest receivable on HTM securities during the year ended December 31, 2022. No HTM securities held by the Company were delinquent on contractual payments as of December 31, 2022, nor were any such securities placed on non-accrual status for the period then ended.
Available for Sale and Held to Maturity Securities Contractual Maturity
The amortized cost and estimated fair value of AFS and HTM securities by scheduled contractual maturities as of dates indicated were as follows:
|
|
|
|
|
|
|
|
|
|
|
|
|
|
|
|
|
|
|
|
|
|
|
|
|
|
|
|
|
|
|
|
|
|
|
|
|
|
|
|
|
|
|
|
|
|
|
|
|
|
|
|
|
|
|
|
|
|
|
|
|
As of December 31, 2022 |
|
Due in one year or less |
|
Due after one year to five years |
|
Due after five to ten years |
|
Due after ten years |
|
Total |
|
Amortized Cost |
|
Fair Value |
|
Amortized Cost |
|
Fair Value |
|
Amortized Cost |
|
Fair Value |
|
Amortized Cost |
|
Fair Value |
|
Amortized Cost |
|
Fair Value |
|
(In thousands) |
| AFS securities |
|
|
|
|
|
|
|
|
|
|
|
|
|
|
|
|
|
|
|
| Government-sponsored residential mortgage-backed securities |
$ |
— |
|
|
$ |
— |
|
|
$ |
21,221 |
|
|
$ |
20,284 |
|
|
$ |
727,908 |
|
|
$ |
648,132 |
|
|
$ |
4,106,634 |
|
|
$ |
3,443,492 |
|
|
$ |
4,855,763 |
|
|
$ |
4,111,908 |
|
| Government-sponsored commercial mortgage-backed securities |
— |
|
|
— |
|
|
191,762 |
|
|
171,992 |
|
|
649,659 |
|
|
556,641 |
|
|
728,698 |
|
|
620,321 |
|
|
1,570,119 |
|
|
1,348,954 |
|
| U.S. Agency bonds |
— |
|
|
— |
|
|
877,371 |
|
|
767,464 |
|
|
223,520 |
|
|
185,018 |
|
|
— |
|
|
— |
|
|
1,100,891 |
|
|
952,482 |
|
| U.S. Treasury securities |
— |
|
|
— |
|
|
99,324 |
|
|
93,057 |
|
|
— |
|
|
— |
|
|
— |
|
|
— |
|
|
99,324 |
|
|
93,057 |
|
| State and municipal bonds and obligations |
213 |
|
|
209 |
|
|
22,100 |
|
|
21,283 |
|
|
42,554 |
|
|
40,970 |
|
|
133,172 |
|
|
120,630 |
|
|
198,039 |
|
|
183,092 |
|
| Other debt securities |
1,299 |
|
|
1,285 |
|
|
— |
|
|
— |
|
|
— |
|
|
— |
|
|
— |
|
|
— |
|
|
1,299 |
|
|
1,285 |
|
| Total available for sale securities |
1,512 |
|
|
1,494 |
|
|
1,211,778 |
|
|
1,074,080 |
|
|
1,643,641 |
|
|
1,430,761 |
|
|
4,968,504 |
|
|
4,184,443 |
|
|
7,825,435 |
|
|
6,690,778 |
|
| HTM securities |
|
|
|
|
|
|
|
|
|
|
|
|
|
|
|
|
|
|
|
| Government-sponsored residential mortgage-backed securities |
0 |
|
|
0 |
|
|
0 |
|
|
0 |
|
|
0 |
|
|
0 |
|
|
276,493 |
|
|
246,343 |
|
|
276,493 |
|
|
246,343 |
|
| Government-sponsored commercial mortgage-backed securities |
0 |
|
|
0 |
|
|
0 |
|
|
0 |
|
|
200,154 |
|
|
176,883 |
|
|
0 |
|
|
0 |
|
|
200,154 |
|
|
176,883 |
|
| Total held to maturity securities |
0 |
|
|
0 |
|
|
0 |
|
|
0 |
|
|
200,154 |
|
|
176,883 |
|
|
276,493 |
|
|
246,343 |
|
|
476,647 |
|
|
423,226 |
|
| Total |
$ |
1,512 |
|
|
$ |
1,494 |
|
|
$ |
1,211,778 |
|
|
$ |
1,074,080 |
|
|
$ |
1,843,795 |
|
|
$ |
1,607,644 |
|
|
$ |
5,244,997 |
|
|
$ |
4,430,786 |
|
|
$ |
8,302,082 |
|
|
$ |
7,114,004 |
|
|
|
|
|
|
|
|
|
|
|
|
|
|
|
|
|
|
|
|
|
|
|
|
|
|
|
|
|
|
|
|
|
|
|
|
|
|
|
|
|
|
|
|
|
|
|
|
|
|
|
|
|
|
|
|
|
|
|
|
|
|
As of December 31, 2021 |
|
Due in one year or less |
|
Due after one year to five years |
|
Due after five to ten years |
|
Due after ten years |
|
Total |
|
Amortized Cost |
|
Fair Value |
|
Amortized Cost |
|
Fair Value |
|
Amortized Cost |
|
Fair Value |
|
Amortized Cost |
|
Fair Value |
|
Amortized Cost |
|
Fair Value |
|
(In Thousands) |
| Government-sponsored residential mortgage-backed securities |
$ |
— |
|
|
$ |
— |
|
|
$ |
24,935 |
|
|
$ |
25,962 |
|
|
$ |
899,169 |
|
|
$ |
892,029 |
|
|
$ |
4,653,188 |
|
|
$ |
4,606,717 |
|
|
$ |
5,577,292 |
|
|
$ |
5,524,708 |
|
| Government-sponsored commercial mortgage-backed securities |
— |
|
|
— |
|
|
139,095 |
|
|
137,755 |
|
|
387,177 |
|
|
378,414 |
|
|
894,476 |
|
|
892,699 |
|
|
1,420,748 |
|
|
1,408,868 |
|
| U.S. Agency bonds |
5,508 |
|
|
5,515 |
|
|
531,821 |
|
|
520,935 |
|
|
665,048 |
|
|
648,564 |
|
|
— |
|
|
— |
|
|
1,202,377 |
|
|
1,175,014 |
|
| U.S. Treasury securities |
40,010 |
|
|
40,001 |
|
|
49,424 |
|
|
48,604 |
|
|
— |
|
|
— |
|
|
— |
|
|
— |
|
|
89,434 |
|
|
88,605 |
|
| State and municipal bonds and obligations |
6,137 |
|
|
6,116 |
|
|
33,692 |
|
|
34,704 |
|
|
72,226 |
|
|
75,416 |
|
|
151,855 |
|
|
164,093 |
|
|
263,910 |
|
|
280,329 |
|
| Small Business Administration pooled securities |
— |
|
|
— |
|
|
4,062 |
|
|
4,092 |
|
|
— |
|
|
— |
|
|
27,759 |
|
|
28,011 |
|
|
31,821 |
|
|
32,103 |
|
| Other debt securities |
300 |
|
|
300 |
|
|
1,297 |
|
|
1,297 |
|
|
— |
|
|
— |
|
|
— |
|
|
— |
|
|
1,597 |
|
|
1,597 |
|
| Total |
$ |
51,955 |
|
|
$ |
51,932 |
|
|
$ |
784,326 |
|
|
$ |
773,349 |
|
|
$ |
2,023,620 |
|
|
$ |
1,994,423 |
|
|
$ |
5,727,278 |
|
|
$ |
5,691,520 |
|
|
$ |
8,587,179 |
|
|
$ |
8,511,224 |
|
Mortgage-backed securities include investments in securities that are insured or guaranteed by Freddie Mac, Ginnie Mae or Fannie Mae. Mortgage-backed securities are purchased to achieve positive interest rate spread with minimal administrative expense, and to lower the Company’s credit risk. Mortgage-backed securities and callable securities are shown at their contractual maturity dates. However, both are expected to have shorter average lives due to expected prepayments and callable features, respectively. Included in the above maturity tables as of December 31, 2022 and 2021 were $0.9 billion, and $1.1 billion, respectively, of callable securities at fair value.
5. Loans and Allowance for Credit Losses
Loans
The following table provides a summary of the Company’s loan portfolio as of the dates indicated:
|
|
|
|
|
|
|
|
|
|
|
|
|
As of December 31, |
|
2022 |
|
2021 |
|
(In thousands) |
| Commercial and industrial |
$ |
3,150,946 |
|
|
$ |
2,960,527 |
|
| Commercial real estate |
5,155,323 |
|
|
4,522,513 |
|
| Commercial construction |
336,276 |
|
|
222,328 |
|
| Business banking |
1,090,492 |
|
|
1,334,694 |
|
| Residential real estate |
2,460,849 |
|
|
1,926,810 |
|
| Consumer home equity |
1,187,547 |
|
|
1,100,153 |
|
| Other consumer (2) |
194,098 |
|
|
214,485 |
|
| Gross loans before unamortized premiums, unearned discounts and deferred fees and costs |
13,575,531 |
|
|
12,281,510 |
|
| Allowance for loan losses (1) |
(142,211) |
|
|
(97,787) |
|
| Unamortized premiums, net of unearned discounts and deferred fees, net of costs |
(13,003) |
|
|
(26,442) |
|
| Loans after the allowance for loan losses, unamortized premiums, unearned discounts and deferred fees and costs |
$ |
13,420,317 |
|
|
$ |
12,157,281 |
|
(1)The Company adopted ASU 2016-13 on January 1, 2022 with a modified retrospective approach. Accordingly, at December 31, 2022 the allowance for loan losses was determined in accordance with ASC 326, “Financial Instruments-Credit Losses” and ASC 310, “Receivables,” as amended. At December 31, 2021 the allowance for loan losses was determined in accordance with ASC 450, “Contingencies” and ASC 310, “Receivables.”
(2)Automobile loans are included in the other consumer portfolio above and amounted to $18.1 million and $53.3 million at December 31, 2022 and December 31, 2021, respectively.
There are no other loan categories that exceed 10% of total loans not already reflected in the preceding table.
The Company’s lending activities are conducted principally in the New England area with the exception of its Shared National Credit Program (“SNC Program”) portfolio and certain purchased loans. The Company participates in the SNC Program in an effort to improve its industry and geographical diversification. The SNC Program portfolio is included in the Company’s commercial and industrial portfolio. The SNC Program portfolio is defined as loan syndications with exposure over $100 million and with three or more lenders participating.
Most loans originated by the Company are either collateralized by real estate or other assets or guaranteed by federal and local governmental authorities. The ability and willingness of the single-family residential and consumer borrowers to honor their repayment commitments is generally dependent on the level of overall economic activity within the borrowers’ geographic areas and real estate values. The ability and willingness of commercial real estate, commercial and industrial, and construction loan borrowers to honor their repayment commitments is generally dependent on the health of the real estate economy in the borrowers’ geographic areas and the general economy.
Loans Pledged as Collateral
The carrying value of loans pledged to secure advances from the FHLBB were $3.9 billion and $2.6 billion at December 31, 2022 and 2021, respectively. The balance of funds borrowed from the FHLBB were $704.1 million and $14.0 million at December 31, 2022 and 2021, respectively.
The carrying value of loans pledged to secure advances from the Federal Reserve Bank (“FRB”) were $1.1 billion and $784.0 million at December 31, 2022 and 2021, respectively. There were no funds borrowed from the FRB outstanding at December 31, 2022 and 2021.
Serviced Loans
At December 31, 2022 and 2021, mortgage loans partially or wholly-owned by others and serviced by the Company amounted to approximately $84.0 million and $95.8 million, respectively.
Purchased Loans
The Company began purchasing mortgage loans during the year ended December 31, 2022. Loans purchased were subject to the same underwriting criteria as those loans originated directly by the Company. During the year ended December 31, 2022, the Company purchased $380.2 million of residential real estate loans.
Allowance for Loan Losses
The allowance for loan losses is established to provide for management’s estimate of expected lifetime credit losses on loans measured at amortized cost at the balance sheet date and is established through a provision for loan losses charged to net income. Charge-offs, net of recoveries, are charged directly to the allowance for loan losses. Commercial and residential loans are charged-off in the period in which they are deemed uncollectible. Delinquent loans in these product types are subject to ongoing review and analysis to determine if a charge-off in the current period is appropriate. For consumer loans, policies and procedures exist that require charge-off consideration upon a certain triggering event depending on the product type.
The following table summarizes the change in the allowance for loan losses by loan category for the year ended December 31, 2022:
|
|
|
|
|
|
|
|
|
|
|
|
|
|
|
|
|
|
|
|
|
|
|
|
|
|
|
|
|
|
|
|
|
|
|
|
|
|
|
|
|
|
|
|
|
|
|
|
|
|
|
|
|
|
|
For the Year Ended December 31, 2022 |
|
Commercial
and
Industrial |
|
Commercial
Real Estate |
|
Commercial
Construction |
|
Business
Banking |
|
Residential
Real Estate |
|
Consumer
Home Equity |
|
Other
Consumer |
|
Other |
|
Total |
|
(In thousands) |
| Allowance for loan losses: |
|
|
|
|
|
|
|
|
|
|
|
|
|
|
|
|
|
| Beginning balance |
$ |
18,018 |
|
|
$ |
52,373 |
|
|
$ |
2,585 |
|
|
$ |
10,983 |
|
|
$ |
6,556 |
|
|
$ |
3,722 |
|
|
$ |
3,308 |
|
|
$ |
242 |
|
|
$ |
97,787 |
|
| Cumulative effect of change in accounting principle (1) |
11,533 |
|
|
(6,655) |
|
|
1,485 |
|
|
6,160 |
|
|
13,489 |
|
|
1,857 |
|
|
(541) |
|
|
(242) |
|
|
27,086 |
|
| Charge-offs |
(269) |
|
|
— |
|
|
— |
|
|
(2,292) |
|
|
— |
|
|
(1) |
|
|
(2,269) |
|
|
— |
|
|
(4,831) |
|
| Recoveries |
1,322 |
|
|
91 |
|
|
— |
|
|
2,069 |
|
|
94 |
|
|
24 |
|
|
644 |
|
|
— |
|
|
4,244 |
|
| Provision (release) |
(3,745) |
|
|
8,921 |
|
|
3,015 |
|
|
(731) |
|
|
7,990 |
|
|
852 |
|
|
1,623 |
|
|
— |
|
|
17,925 |
|
| Ending balance (2) |
$ |
26,859 |
|
|
$ |
54,730 |
|
|
$ |
7,085 |
|
|
$ |
16,189 |
|
|
$ |
28,129 |
|
|
$ |
6,454 |
|
|
$ |
2,765 |
|
|
$ |
0 |
|
|
$ |
142,211 |
|
(1)Represents the adjustment needed to reflect the cumulative day one impact pursuant to the Company’s adoption of ASU 2016-13 (i.e., cumulative effect adjustment related to the adoption of ASU 2016-13 as of January 1, 2022). The adjustment represents a $27.1 million increase to the allowance attributable to the change in accounting methodology for estimating the allowance for loan losses resulting from the Company’s adoption of the standard. The adjustment also includes the adjustment needed to reflect the day one reclassification of the Company’s PCI loan balances to PCD and the associated gross-up of $0.1 million, pursuant to the Company’s adoption of ASU 2016-13.
(2)The balance of accrued interest receivable excluded from amortized cost and the calculation of the allowance for loan losses amounted to $45.2 million at December 31, 2022.
The allowance for loan losses increased by $44.4 million to $142.2 million at December 31, 2022 from $97.8 million at December 31, 2021 and the allowance for loans losses as a percentage of total loans (“reserve rate”) increased by 25 basis points to 1.05% at December 31, 2022 from 0.80% at December 31, 2021. The increase was partially due to the $27.1 million transition adjustment recorded upon adoption of ASU 2016-13 which is further described above. The transition adjustment increased the allowance for loan losses to $124.9 million as of January 1, 2022 which resulted in an increase in the allowance for loans losses as a percentage of total loans (“reserve rate”) to 1.02% at that time based upon loan balances as of December 31, 2021. Subsequently, the allowance for loan losses increased by $17.3 million as of December 31, 2022 and the reserve rate increased three basis points to 1.05% at December 31, 2022. The increase in the reserve amount subsequent to the transition adjustment was primarily due to increased loan balances. The increase in the reserve rate subsequent to the transition adjustment was primarily due to changes in macroeconomic conditions. Management used the Oxford Economics Baseline forecast (“the forecast”) for each respective date in determining its estimate of current expected credit losses. The forecast at December 31, 2022 assumed a high likelihood of the U.S. economy entering a recession in the second quarter of 2023 while the forecast at December 31, 2021 assumed more stable economic conditions based upon facts and circumstances observed by management at that time. As a result of the more adverse forecasted economic conditions as of December 31, 2022, management determined that an increase to the reserve rate was appropriate.
Reserve for Unfunded Commitments
Management evaluates the need for a reserve on unfunded lending commitments in a manner consistent with loans held for investment. Upon adoption of ASU 2016-13 on January 1, 2022, the Company recorded a transition adjustment related to the reserve for unfunded lending commitments of $1.0 million, resulting in a total reserve for unfunded lending commitments of $11.1 million as of January 1, 2022. As of December 31, 2022, the Company’s reserve for unfunded lending commitments was $13.2 million which is recorded within other liabilities.
Portfolio Segmentation
Management uses a methodology to systematically estimate the amount of expected losses in each segment of loans in the Company’s portfolio. Commercial and industrial business banking, investment commercial real estate, and commercial and industrial loans are evaluated based upon loan-level risk characteristics, historical losses and other factors which form the basis for estimating expected losses. Other portfolios, including owner occupied commercial real estate (which includes business banking owner occupied commercial real estate), commercial construction, residential mortgages, home equity and consumer loans, are analyzed as groups taking into account delinquency ratios, and the Company’s and peer banks’ historical loss experience. For the purposes of estimating the allowance for loan losses, management segregates the loan portfolio into loan categories that share similar risk characteristics such as the purpose of the loan, repayment source, and collateral. These characteristics are considered when determining the appropriate level of the allowance for each category. Some examples of these risk characteristics unique to each loan category include:
Commercial Lending
Commercial and industrial: The primary risk associated with commercial and industrial loans is the ability of borrowers to achieve business results consistent with those projected at origination. Collateral frequently consists of a first lien position on business assets including, but not limited to, accounts receivable, inventory, aircraft and equipment. The primary repayment source is operating cash flow and, secondarily, the liquidation of assets. Under its lending guidelines, the Company generally requires a corporate or personal guarantee from individuals that hold material ownership in the borrowing entity when the loan-to-value of a commercial and industrial loan is in excess of a specified threshold.
Commercial real estate: Collateral values are established by independent third-party appraisals and evaluations. Primary repayment sources include operating income generated by the real estate, permanent debt refinancing, sale of the real estate and, secondarily, liquidation of the collateral. Under its lending guidelines, the Company generally requires a corporate or personal guarantee from individuals that hold material ownership in the borrowing entity when the loan-to-value of a commercial real estate loan is in excess of a specified threshold.
Commercial construction: These loans are generally considered to present a higher degree of risk than other real estate loans and may be affected by a variety of factors, such as adverse changes in interest rates and the borrower’s ability to control costs and adhere to time schedules. Construction loans are underwritten utilizing feasibility studies, independent appraisal reviews, sensitivity analysis of absorption and lease rates and financial analysis of the developers and property owners. Construction loans are generally based upon estimates of costs and value associated with the completed project. Construction loan repayment is substantially dependent on the ability of the borrower to complete the project and obtain permanent financing.
Business banking: These loans are typically secured by all business assets or commercial real estate. Business banking originations include traditionally underwritten loans as well as partially automated scored loans. Business banking scored loans are determined by utilizing the Company’s proprietary decision matrix that has a number of quantitative factors including, but not limited to, a guarantor’s credit score, industry risk, and time in business. The Company also engages in Small Business Association (“SBA”) lending, both in the business banking and commercial banking divisions. The SBA guarantees reduce the Company’s loss due to default and are considered a credit enhancement to the loan structure.
Residential Lending
These loans are made to borrowers who demonstrate the ability to repay principal and interest on a monthly basis. Underwriting considerations include, among others, income sources and their reliability, willingness to repay as evidenced by credit repayment history, financial resources (including cash reserves) and the value of the collateral. The Company maintains policy standards for minimum credit score and cash reserves and maximum loan-to-value consistent with a “prime” portfolio. Collateral consists of mortgage liens on 1-4 family residential dwellings. The policy standards applied to loans originated by the Company are the same as those applied to purchased loans. The Company does not originate or purchase sub-prime or other high-risk loans. Residential loans are originated either for sale to investors or retained in the Company’s loan portfolio. Decisions about whether to sell or retain residential loans are made based on the interest rate characteristics, pricing for loans in the secondary mortgage market, competitive factors and the Company’s capital needs.
Consumer Lending
Consumer home equity: Home equity lines of credit are granted for ten years with monthly interest-only repayment requirements. Full principal repayment is required at the end of the ten-year draw period. Home equity loans are term loans that require the monthly payment of principal and interest such that the loan will be fully amortized at maturity. Underwriting considerations are materially consistent with those utilized in residential real estate. Collateral consists of a senior or subordinate lien on owner-occupied residential property.
Other consumer: The Company’s policy and underwriting in this category, which is comprised primarily of home improvement, automobile and aircraft loans, include the following factors, among others: income sources and reliability, credit histories, term of repayment, and collateral value, as applicable. These are typically granted on an unsecured basis, with the exception of aircraft and automobile loans.
Credit Quality
Commercial Lending Credit Quality
The credit quality of the Company’s commercial loan portfolio is actively monitored and supported by a comprehensive credit approval process and all large dollar transactions are sent for approval to a committee of seasoned business line and credit professionals. The Company maintains an independent credit risk review function that reports directly to the Risk Management Committee of the Board of Directors. Credits that demonstrate significant deterioration in credit quality are transferred to a specialized group of experienced officers for individual attention.
The Company monitors credit quality indicators and utilizes portfolio scorecards to assess the risk of its commercial portfolio. Specifically, the Company utilizes a 15-point credit risk-rating system to manage risk and identify potential problem loans. Under this point system, risk-rating assignments are based upon a number of quantitative and qualitative factors that are under continual review. Factors include cash flow, collateral coverage, liquidity, leverage, position within the industry, internal controls and management, financial reporting, and other considerations. Commercial loan risk ratings are (re)evaluated for each loan at least once-per-year. The risk-rating categories under the credit risk-rating system are defined as follows:
0 Risk Rating- Unrated
Certain segments of the portfolios are not rated. These segments include aircraft loans, business banking scored loan products, and other commercial loans managed by exception. Loans within this unrated loan segment are monitored by delinquency status; and for lines of credit greater than $100,000 in exposure, an annual review is conducted which includes the review of the business score and loan and deposit account performance. The Company supplements performance data with current business credit scores for the business banking portfolio on a quarterly basis. Unrated commercial and business banking loans are generally restricted to commercial exposure of less than $1.5 million. Loans included in this category generally are not required to provide regular financial reporting or regular covenant monitoring.
For purposes of estimating the allowance for loan losses, unrated loans are considered in the same manner as pass rated loans.
1-10 Risk Rating – Pass
Loans with a risk rating of 1-10 are classified as “Pass” and are comprised of loans that range from “substantially risk free” which indicates borrowers of unquestioned credit standing, well-established national companies with a very strong financial condition, and loans fully secured by policy conforming cash levels, through “low pass” which indicates acceptable rated loans that may be experiencing weak cash flow, impending lease rollover or minor liquidity concerns.
11 Risk Rating – Special Mention (Potential Weakness)
Loans to borrowers in this category exhibit potential weaknesses or downward trends deserving management’s close attention. While potentially weak, no loss of principal or interest is envisioned. Included in this category are borrowers who are performing as agreed, are weak when compared to industry standards, may be experiencing an interim loss and may be in declining industries. An element of asset quality, financial flexibility or management is below average. The Company does not consider borrowers within this category as new business prospects. Borrowers rated special mention may find it difficult to obtain alternative financing from traditional bank sources.
12 Risk Rating – Substandard (Well-Defined Weakness)
Loans with a risk-rating of 12 exhibit well-defined weaknesses that, if not corrected, may jeopardize the orderly liquidation of the debt. A loan is classified as substandard if it is inadequately protected by the repayment capacity of the obligor or by the collateral pledged. Specifically, repayment under market rates and terms, or by the requirements under the existing loan documents, is in jeopardy, but no loss of principal or interest is envisioned. There is a possibility that a partial loss of principal and/or interest will occur in the future if the deficiencies are not corrected. Loss potential, while existing in the aggregate portfolio of substandard assets, does not have to exist in individual assets classified as substandard. Non-accrual is possible, but not mandatory, in this class.
13 Risk Rating – Doubtful (Loss Probable)
Loans classified as doubtful have comparable weaknesses as found in the loans classified as substandard, with the added provision that such weaknesses make collection of the debt in full (based on currently existing facts, conditions and values) highly questionable and improbable. Serious problems exist such that a partial loss of principal is likely. The probability of loss exists, but because of reasonably specific pending factors that may work to strengthen the credit, estimated losses are deferred until a more exact status can be determined. Specific reserves will be the amount identified after specific review. Non-accrual is mandatory in this class.
14 Risk Rating – Loss
Loans to borrowers in this category are deemed incapable of repayment. Loans to such borrowers are considered uncollectible and of such little value that continuance as active assets of the Company is not warranted. This classification does not mean that the loans have no recovery or salvage value, but rather, it is not practical or desirable to defer writing off these assets even though partial recovery may occur in the future. Loans in this category have a recorded investment of $0 at the time of the downgrade.
Residential and Consumer Lending Credit Quality
For the Company’s residential and consumer portfolios, the quality of the loan is best indicated by the repayment performance of an individual borrower. Updated appraisals, broker opinions of value and other collateral valuation methods are employed in the residential and consumer portfolios, typically for credits that are deteriorating. Delinquency status is determined using payment performance, while accrual status may be determined using a combination of payment performance, expected borrower viability and collateral value. Delinquent consumer loans are handled by a team of seasoned collection specialists.
The following table details the amortized cost balances of the Company’s loan portfolios, presented by credit quality indicator and origination year as of December 31, 2022:
|
|
|
|
|
|
|
|
|
|
|
|
|
|
|
|
|
|
|
|
|
|
|
|
|
|
|
|
|
|
|
|
|
|
|
|
|
|
|
|
|
|
|
|
|
|
|
|
|
|
|
|
|
|
|
2022 |
|
2021 |
|
2020 |
|
2019 |
|
2018 |
|
Prior |
|
Revolving Loans |
|
Revolving Loans Converted to Term Loans (1) |
|
Total |
|
(In thousands) |
| Commercial and industrial |
|
|
|
|
|
|
|
|
|
|
|
|
|
|
|
|
|
| Pass |
$ |
778,144 |
|
|
$ |
479,317 |
|
|
$ |
415,990 |
|
|
$ |
199,865 |
|
|
$ |
100,716 |
|
|
$ |
639,825 |
|
|
$ |
473,148 |
|
|
$ |
50 |
|
|
$ |
3,087,055 |
|
| Special Mention |
2,298 |
|
|
1,307 |
|
|
7,267 |
|
|
4,841 |
|
|
147 |
|
|
— |
|
|
1,196 |
|
|
670 |
|
|
17,726 |
|
| Substandard |
294 |
|
|
4,954 |
|
|
2,644 |
|
|
46 |
|
|
2,598 |
|
|
7,854 |
|
|
485 |
|
|
346 |
|
|
19,221 |
|
| Doubtful |
— |
|
|
5,249 |
|
|
— |
|
|
— |
|
|
— |
|
|
23 |
|
|
3,254 |
|
|
— |
|
|
8,526 |
|
| Loss |
— |
|
|
— |
|
|
— |
|
|
— |
|
|
— |
|
|
— |
|
|
— |
|
|
— |
|
|
— |
|
| Total commercial and industrial |
780,736 |
|
|
490,827 |
|
|
425,901 |
|
|
204,752 |
|
|
103,461 |
|
|
647,702 |
|
|
478,083 |
|
|
1,066 |
|
|
3,132,528 |
|
|
|
|
|
|
|
|
|
|
|
|
|
|
|
|
|
|
|
| Commercial real estate |
|
|
|
|
|
|
|
|
|
|
|
|
|
|
|
|
|
| Pass |
1,510,675 |
|
|
825,620 |
|
|
586,567 |
|
|
581,840 |
|
|
461,296 |
|
|
1,006,160 |
|
|
52,590 |
|
|
4,187 |
|
|
5,028,935 |
|
| Special Mention |
— |
|
|
— |
|
|
771 |
|
|
4,204 |
|
|
15,366 |
|
|
12,255 |
|
|
— |
|
|
— |
|
|
32,596 |
|
| Substandard |
— |
|
|
— |
|
|
2,621 |
|
|
19,796 |
|
|
24,532 |
|
|
34,883 |
|
|
8,000 |
|
|
— |
|
|
89,832 |
|
| Doubtful |
— |
|
|
— |
|
|
— |
|
|
— |
|
|
— |
|
|
— |
|
|
— |
|
|
— |
|
|
— |
|
| Loss |
— |
|
|
— |
|
|
— |
|
|
— |
|
|
— |
|
|
— |
|
|
— |
|
|
— |
|
|
— |
|
| Total commercial real estate |
1,510,675 |
|
|
825,620 |
|
|
589,959 |
|
|
605,840 |
|
|
501,194 |
|
|
1,053,298 |
|
|
60,590 |
|
|
4,187 |
|
|
5,151,363 |
|
|
|
|
|
|
|
|
|
|
|
|
|
|
|
|
|
|
|
| Commercial construction |
|
|
|
|
|
|
|
|
|
|
|
|
|
|
|
|
|
| Pass |
91,397 |
|
|
178,648 |
|
|
28,956 |
|
|
20,767 |
|
|
— |
|
|
— |
|
|
12,130 |
|
|
— |
|
|
331,898 |
|
| Special Mention |
— |
|
|
— |
|
|
2,361 |
|
|
— |
|
|
— |
|
|
— |
|
|
— |
|
|
— |
|
|
2,361 |
|
| Substandard |
— |
|
|
— |
|
|
— |
|
|
— |
|
|
— |
|
|
— |
|
|
— |
|
|
— |
|
|
— |
|
| Doubtful |
— |
|
|
— |
|
|
— |
|
|
— |
|
|
— |
|
|
— |
|
|
— |
|
|
— |
|
|
— |
|
| Loss |
— |
|
|
— |
|
|
— |
|
|
— |
|
|
— |
|
|
— |
|
|
— |
|
|
— |
|
|
— |
|
| Total commercial construction |
91,397 |
|
|
178,648 |
|
|
31,317 |
|
|
20,767 |
|
|
— |
|
|
— |
|
|
12,130 |
|
|
— |
|
|
334,259 |
|
|
|
|
|
|
|
|
|
|
|
|
|
|
|
|
|
|
|
| Business banking |
|
|
|
|
|
|
|
|
|
|
|
|
|
|
|
|
|
| Pass |
178,806 |
|
|
202,230 |
|
|
170,088 |
|
|
128,282 |
|
|
59,452 |
|
|
233,484 |
|
|
78,080 |
|
|
4,770 |
|
|
1,055,192 |
|
| Special Mention |
— |
|
|
991 |
|
|
4,635 |
|
|
4,605 |
|
|
3,740 |
|
|
7,584 |
|
|
145 |
|
|
— |
|
|
21,700 |
|
|
|
|
|
|
|
|
|
|
|
|
|
|
|
|
|
|
|
|
|
|
|
|
|
|
|
|
|
|
|
|
|
|
|
|
|
|
|
|
|
|
|
|
|
|
|
|
|
|
|
|
|
|
|
| Substandard |
— |
|
|
3,482 |
|
|
1,424 |
|
|
2,663 |
|
|
570 |
|
|
7,505 |
|
|
2,230 |
|
|
221 |
|
|
18,095 |
|
| Doubtful |
— |
|
|
— |
|
|
— |
|
|
181 |
|
|
— |
|
|
70 |
|
|
— |
|
|
— |
|
|
251 |
|
| Loss |
— |
|
|
— |
|
|
— |
|
|
— |
|
|
— |
|
|
— |
|
|
— |
|
|
— |
|
|
— |
|
| Total business banking |
178,806 |
|
|
206,703 |
|
|
176,147 |
|
|
135,731 |
|
|
63,762 |
|
|
248,643 |
|
|
80,455 |
|
|
4,991 |
|
|
1,095,238 |
|
|
|
|
|
|
|
|
|
|
|
|
|
|
|
|
|
|
|
| Residential real estate |
|
|
|
|
|
|
|
|
|
|
|
|
|
|
|
|
|
| Current and accruing |
761,442 |
|
|
696,959 |
|
|
382,262 |
|
|
99,494 |
|
|
66,702 |
|
|
434,720 |
|
|
— |
|
|
— |
|
|
2,441,579 |
|
| 30-89 days past due and accruing |
4,652 |
|
|
5,470 |
|
|
1,245 |
|
|
2,762 |
|
|
2,951 |
|
|
11,646 |
|
|
— |
|
|
— |
|
|
28,726 |
|
| Loans 90 days or more past due and still accruing |
— |
|
|
— |
|
|
— |
|
|
— |
|
|
— |
|
|
— |
|
|
— |
|
|
— |
|
|
— |
|
| Non-accrual |
— |
|
|
— |
|
|
144 |
|
|
1,491 |
|
|
1,015 |
|
|
7,100 |
|
|
— |
|
|
— |
|
|
9,750 |
|
| Total residential real estate |
766,094 |
|
|
702,429 |
|
|
383,651 |
|
|
103,747 |
|
|
70,668 |
|
|
453,466 |
|
|
— |
|
|
— |
|
|
2,480,055 |
|
|
|
|
|
|
|
|
|
|
|
|
|
|
|
|
|
|
|
| Consumer home equity |
|
|
|
|
|
|
|
|
|
|
|
|
|
|
|
|
|
| Current and accruing |
97,395 |
|
|
10,774 |
|
|
5,840 |
|
|
5,015 |
|
|
21,092 |
|
|
73,927 |
|
|
953,829 |
|
|
7,320 |
|
|
1,175,192 |
|
| 30-89 days past due and accruing |
559 |
|
|
— |
|
|
— |
|
|
— |
|
|
72 |
|
|
944 |
|
|
7,239 |
|
|
247 |
|
|
9,061 |
|
| Loans 90 days or more past due and still accruing |
— |
|
|
— |
|
|
— |
|
|
— |
|
|
— |
|
|
— |
|
|
— |
|
|
— |
|
|
— |
|
| Non-accrual |
— |
|
|
— |
|
|
— |
|
|
61 |
|
|
274 |
|
|
1,303 |
|
|
5,120 |
|
|
296 |
|
|
7,054 |
|
| Total consumer home equity |
97,954 |
|
|
10,774 |
|
|
5,840 |
|
|
5,076 |
|
|
21,438 |
|
|
76,174 |
|
|
966,188 |
|
|
7,863 |
|
|
1,191,307 |
|
|
|
|
|
|
|
|
|
|
|
|
|
|
|
|
|
|
|
| Other consumer |
|
|
|
|
|
|
|
|
|
|
|
|
|
|
|
|
|
| Current and accruing |
55,414 |
|
|
32,390 |
|
|
17,641 |
|
|
18,298 |
|
|
18,832 |
|
|
16,603 |
|
|
17,476 |
|
|
— |
|
|
176,654 |
|
| 30-89 days past due and accruing |
143 |
|
|
68 |
|
|
43 |
|
|
61 |
|
|
240 |
|
|
178 |
|
|
58 |
|
|
7 |
|
|
798 |
|
| Loans 90 days or more past due and still accruing |
— |
|
|
— |
|
|
— |
|
|
— |
|
|
— |
|
|
— |
|
|
— |
|
|
— |
|
|
— |
|
| Non-accrual |
31 |
|
|
93 |
|
|
39 |
|
|
2 |
|
|
92 |
|
|
44 |
|
|
15 |
|
|
10 |
|
|
326 |
|
| Total other consumer |
55,588 |
|
|
32,551 |
|
|
17,723 |
|
|
18,361 |
|
|
19,164 |
|
|
16,825 |
|
|
17,549 |
|
|
17 |
|
|
177,778 |
|
|
|
|
|
|
|
|
|
|
|
|
|
|
|
|
|
|
|
| Total |
$ |
3,481,250 |
|
|
$ |
2,447,552 |
|
|
$ |
1,630,538 |
|
|
$ |
1,094,274 |
|
|
$ |
779,687 |
|
|
$ |
2,496,108 |
|
|
$ |
1,614,995 |
|
|
$ |
18,124 |
|
|
$ |
13,562,528 |
|
(1)The amounts presented represent the amortized cost as of December 31, 2022 of revolving loans that were converted to term loans during the year ended December 31, 2022.
Paycheck Protection Program (“PPP”) loans are included within the unrated category of the commercial and industrial and business banking portfolios in the table above. Commercial and industrial PPP and business banking PPP loans amounted to $3.6 million and $6.2 million, respectively, at December 31, 2022. The Company does not have an allowance for loan losses for PPP loans as they are 100% guaranteed by the SBA.
Asset Quality
The Company manages its loan portfolio with careful monitoring. As a general rule, loans more than 90 days past due with respect to principal and interest are classified as non-accrual loans. Exceptions may be made if management believes that collateral held by the Company is clearly sufficient and in full satisfaction of both principal and interest. The Company may also use discretion regarding other loans over 90 days delinquent if the loan is well secured and in the process of collection. Non-accrual loans and loans that are more than 90 days past due but still accruing interest are considered non-performing loans.
Non-accrual loans may be returned to an accrual status when principal and interest payments are no longer delinquent, and the risk characteristics of the loan have improved to the extent that there no longer exists a concern as to the collectability of principal and interest. Loans are considered past due based upon the number of days delinquent according to their contractual terms.
A loan is expected to remain on non-accrual status until it becomes current with respect to principal and interest, the loan is liquidated, or the loan is determined to be uncollectible and is charged-off against the allowance for loan losses.
The following tables show the age analysis of past due loans as of the dates indicated:
|
|
|
|
|
|
|
|
|
|
|
|
|
|
|
|
|
|
|
|
|
|
|
|
|
|
|
|
|
|
|
|
|
|
|
|
|
As of December 31, 2022 |
|
30-59
Days Past
Due |
|
60-89
Days Past
Due |
|
90 or More
Days Past
Due |
|
Total Past
Due |
|
Current |
|
Total
Loans |
|
(In thousands) |
| Commercial and industrial |
$ |
1,300 |
|
|
$ |
385 |
|
|
$ |
2,074 |
|
|
$ |
3,759 |
|
|
$ |
3,128,769 |
|
|
$ |
3,132,528 |
|
| Commercial real estate |
— |
|
|
— |
|
|
— |
|
|
— |
|
|
5,151,363 |
|
|
5,151,363 |
|
| Commercial construction |
— |
|
|
— |
|
|
— |
|
|
— |
|
|
334,259 |
|
|
334,259 |
|
| Business banking |
6,642 |
|
|
845 |
|
|
3,517 |
|
|
11,004 |
|
|
1,084,234 |
|
|
1,095,238 |
|
| Residential real estate |
25,877 |
|
|
3,852 |
|
|
6,456 |
|
|
36,185 |
|
|
2,443,870 |
|
|
2,480,055 |
|
| Consumer home equity |
8,262 |
|
|
1,108 |
|
|
6,525 |
|
|
15,895 |
|
|
1,175,412 |
|
|
1,191,307 |
|
| Other consumer |
634 |
|
|
170 |
|
|
320 |
|
|
1,124 |
|
|
176,654 |
|
|
177,778 |
|
| Total |
$ |
42,715 |
|
|
$ |
6,360 |
|
|
$ |
18,892 |
|
|
$ |
67,967 |
|
|
$ |
13,494,561 |
|
|
$ |
13,562,528 |
|
|
|
|
|
|
|
|
|
|
|
|
|
|
|
|
|
|
|
|
|
|
|
|
|
|
|
|
|
|
|
|
|
|
|
|
|
|
As of December 31, 2021 |
|
30-59
Days Past
Due |
|
60-89
Days Past
Due |
|
90 or More
Days Past
Due |
|
Total Past
Due |
|
Current |
|
Total
Loans |
|
(In thousands) |
| Commercial and industrial |
$ |
45 |
|
|
$ |
31 |
|
|
$ |
1,672 |
|
|
$ |
1,748 |
|
|
$ |
2,958,779 |
|
|
$ |
2,960,527 |
|
| Commercial real estate |
25,931 |
|
|
— |
|
|
1,196 |
|
|
27,127 |
|
|
4,495,386 |
|
|
4,522,513 |
|
| Commercial construction |
— |
|
|
— |
|
|
— |
|
|
— |
|
|
222,328 |
|
|
222,328 |
|
| Business banking |
5,043 |
|
|
1,793 |
|
|
4,640 |
|
|
11,476 |
|
|
1,323,218 |
|
|
1,334,694 |
|
| Residential real estate |
17,523 |
|
|
3,511 |
|
|
5,543 |
|
|
26,577 |
|
|
1,900,233 |
|
|
1,926,810 |
|
| Consumer home equity |
3,774 |
|
|
1,510 |
|
|
4,571 |
|
|
9,855 |
|
|
1,090,298 |
|
|
1,100,153 |
|
| Other consumer |
1,194 |
|
|
548 |
|
|
889 |
|
|
2,631 |
|
|
211,854 |
|
|
214,485 |
|
| Total |
$ |
53,510 |
|
|
$ |
7,393 |
|
|
$ |
18,511 |
|
|
$ |
79,414 |
|
|
$ |
12,202,096 |
|
|
$ |
12,281,510 |
|
The following table presents information regarding non-accrual loans as of the dates indicated:
|
|
|
|
|
|
|
|
|
|
|
|
|
|
|
|
|
|
|
|
|
|
|
|
|
|
|
|
|
|
|
|
|
|
|
|
|
As of December 31, 2022 |
|
As of December 31, 2021 |
|
Non-Accrual Loans With ACL |
|
Non-Accrual Loans Without ACL (3) |
|
Total Non-Accrual Loans |
|
Amortized Cost of Loans >90 DPD and Still Accruing (2) |
|
Total Non-Accrual Loans (1) |
|
Recorded Investment >90 DPD and Still Accruing |
|
(In thousands) |
|
|
| Commercial and industrial |
$ |
3,270 |
|
|
$ |
10,707 |
|
|
$ |
13,977 |
|
|
$ |
— |
|
|
$ |
12,400 |
|
|
$ |
— |
|
| Commercial real estate |
— |
|
|
— |
|
|
— |
|
|
— |
|
|
— |
|
|
1,196 |
|
| Commercial construction |
— |
|
|
— |
|
|
— |
|
|
— |
|
|
— |
|
|
— |
|
| Business banking |
5,844 |
|
|
1,653 |
|
|
7,497 |
|
|
— |
|
|
8,230 |
|
|
— |
|
| Residential real estate |
9,750 |
|
|
— |
|
|
9,750 |
|
|
— |
|
|
6,681 |
|
|
769 |
|
| Consumer home equity |
7,054 |
|
|
— |
|
|
7,054 |
|
|
— |
|
|
4,732 |
|
|
25 |
|
| Other consumer |
326 |
|
|
— |
|
|
326 |
|
|
— |
|
|
950 |
|
|
— |
|
| Total non-accrual loans |
$ |
26,244 |
|
|
$ |
12,360 |
|
|
$ |
38,604 |
|
|
$ |
— |
|
|
$ |
32,993 |
|
|
$ |
1,990 |
|
(1)The amounts presented represent the recorded investment balance of loans as of December 31, 2021.
(2)“DPD” indicated in the table above refers to “days past due.”
(3)The loans on non-accrual status and without an ACL as of December 31, 2022, were primarily comprised of collateral dependent loans for which the fair value of the underlying loan collateral exceeded the loan carrying value.
The amount of interest income recognized on non-accrual loans during the year ended December 31, 2022 was not significant.
It is the Company’s policy to reverse any accrued interest when a loan is put on non-accrual status and, generally, to record any payments received from a borrower related to a loan on non-accrual status as a reduction of the amortized cost basis of the loan. Accrued interest reversed against interest income for the year ended December 31, 2022 was insignificant.
For collateral values for residential mortgage and home equity loans, the Company relies primarily upon third-party valuation information from certified appraisers and values are generally based upon recent appraisals of the underlying collateral, brokers’ opinions based upon recent sales of comparable properties, or estimated auction or liquidation values less estimated costs to sell. As of both December 31, 2022 and December 31, 2021, the Company had collateral-dependent residential mortgage and home equity loans totaling $0.6 million.
For collateral-dependent commercial loans, the amount of the allowance for loan losses is individually assessed based upon the fair value of the collateral. Various types of collateral are used, including real estate, inventory, equipment, accounts receivable, securities and cash, among others. For commercial real estate loans, the Company relies primarily upon third-party valuation information from certified appraisers and values are generally based upon recent appraisals of the underlying collateral, brokers’ opinions based upon recent sales of comparable properties, estimated equipment auction or liquidation values, income capitalization, or a combination of income capitalization and comparable sales. As of December 31, 2022 and December 31, 2021, the Company had collateral-dependent commercial loans totaling $16.2 million and $13.1 million, respectively.
Appraisals for all loan types are obtained at the time of loan origination as part of the loan approval process and are updated at the time of a loan modification and/or refinance and as considered necessary by management for impairment review purposes. In addition, appraisals are updated as required by regulatory pronouncements.
As of both December 31, 2022 and December 31, 2021, the Company had no residential real estate held in other real estate owned (“OREO”). As of both December 31, 2022 and December 31, 2021, there were no mortgage loans collateralized by residential real estate property for which formal foreclosure proceedings were in-process.
Troubled Debt Restructurings (“TDR”)
As described previously in Note 2, “Summary of Significant Accounting Policies,” in cases where a borrower experiences financial difficulty and the Company makes certain concessionary modifications to contractual terms, the loan is classified as a TDR. The process through which management identifies loans as TDR loans, the methodology employed to record any loan losses, and the calculation of any shortfall on collateral dependent loans, is also described within Note 2, “Summary of Significant Accounting Policies.”
In response to the novel coronavirus (“COVID-19”) pandemic, the Company has granted loan modifications to allow deferral of payments for borrowers negatively impacted by the COVID-19 pandemic. Modifications granted to customers allowed for full payment deferrals (principal and interest) or deferral of only principal payments. These modifications with active deferrals met the criteria of either Section 4013 of the Coronavirus Aid, Relief, and Economic Security Act (the “CARES Act”) or the Interagency Statement on Loan Modifications and Reporting for Financial Institutions Working with Customers Affected by the Coronavirus (Revised) at the time of such modification, and therefore are not deemed TDRs. Additionally, loans that are performing in accordance with the contractual terms of the modification are not reflected as being past due and therefore are not impacting non-accrual or delinquency totals as of December 31, 2022 and December 31, 2021. The Company continued to accrue interest on these COVID-19 modified loans and evaluated the deferred interest for collectability as of December 31, 2022 and December 31, 2021.
The Consolidated Appropriations Act, which was enacted on December 27, 2020, extended certain provisions related to the COVID-19 pandemic in the United States (which were due to expire) and provided additional emergency relief to individuals and businesses. Included within the provisions of the Consolidated Appropriations Act was the extension to January 1, 2022 of Section 4013 of the CARES Act, which provided relief from a requirement to evaluate loans that had received a COVID-19 modification to determine if the loans required TDR treatment, provided certain criteria were met. As such, the Company applied the TDR relief granted pursuant to such section to any qualifying loan modification executed during the allowable time period.
The Company’s policy is to have any TDR loan which is on non-accrual status prior to being modified remain on non-accrual status for approximately six months subsequent to being modified before management considers its return to accrual status. If the TDR loan is on accrual status prior to being modified, it is reviewed to determine if the modified loan should remain on accrual status.
TDR loan information as of December 31, 2021 and the period then ended was prepared in accordance with GAAP effective for the Company as of December 31, 2021, or prior to the Company’s adoption of ASU 2016-13.
The following table shows the TDR loans on accrual and non-accrual status as of the dates indicated:
|
|
|
|
|
|
|
|
|
|
|
|
|
|
|
|
|
|
|
|
|
|
|
|
|
|
|
|
|
|
|
|
|
|
|
|
|
As of December 31, 2022 |
|
TDRs on Accrual Status |
|
TDRs on Non-accrual Status |
|
Total TDRs |
|
Number of Loans |
|
Balance of
Loans |
|
Number of
Loans |
|
Balance of
Loans |
|
Number of
Loans |
|
Balance of
Loans |
|
(Dollars in thousands) |
| Commercial and industrial |
2 |
|
|
$ |
4,449 |
|
|
9 |
|
|
$ |
11,317 |
|
|
11 |
|
|
$ |
15,766 |
|
| Business banking |
11 |
|
|
4,124 |
|
|
22 |
|
|
2,101 |
|
|
33 |
|
|
6,225 |
|
| Residential real estate |
114 |
|
|
17,618 |
|
|
28 |
|
|
4,016 |
|
|
142 |
|
|
21,634 |
|
| Consumer home equity |
51 |
|
|
2,632 |
|
|
19 |
|
|
1,917 |
|
|
70 |
|
|
4,549 |
|
| Other consumer |
1 |
|
|
11 |
|
|
— |
|
|
— |
|
|
1 |
|
|
11 |
|
| Total |
179 |
|
|
$ |
28,834 |
|
|
78 |
|
|
$ |
19,351 |
|
|
257 |
|
|
$ |
48,185 |
|
|
|
|
|
|
|
|
|
|
|
|
|
|
|
|
|
|
|
|
|
|
|
|
|
|
|
|
|
|
|
|
|
|
|
|
|
|
As of December 31, 2021 |
|
TDRs on Accrual Status |
|
TDRs on Non-accrual Status |
|
Total TDRs |
|
Number of Loans |
|
Balance of
Loans |
|
Number of Loans |
|
Balance of
Loans |
|
Number of Loans |
|
Balance of
Loans |
|
(Dollars in thousands) |
| Commercial and industrial |
1 |
|
|
$ |
3,745 |
|
|
6 |
|
|
$ |
9,983 |
|
|
7 |
|
|
$ |
13,728 |
|
| Commercial real estate |
1 |
|
|
3,520 |
|
|
— |
|
|
— |
|
|
1 |
|
|
3,520 |
|
| Business banking |
5 |
|
|
3,830 |
|
|
3 |
|
|
383 |
|
|
8 |
|
|
4,213 |
|
| Residential real estate |
121 |
|
|
19,119 |
|
|
27 |
|
|
3,015 |
|
|
148 |
|
|
22,134 |
|
| Consumer home equity |
67 |
|
|
3,104 |
|
|
16 |
|
|
818 |
|
|
83 |
|
|
3,922 |
|
| Other consumer |
2 |
|
|
18 |
|
|
— |
|
|
— |
|
|
2 |
|
|
18 |
|
| Total (1) |
197 |
|
|
$ |
33,336 |
|
|
52 |
|
|
$ |
14,199 |
|
|
249 |
|
|
$ |
47,535 |
|
(1)The amounts presented in the table above represent the recorded investment balance of loans as of December 31, 2021.
The amount of allowance for loan losses associated with the TDRs was $1.8 million and $3.4 million at December 31, 2022 and 2021, respectively. There were no additional commitments to lend to borrowers who have been party to a TDR as of December 31, 2022 and 2021.
The following tables show the modifications which occurred during the periods and the change in the recorded investment subsequent to the modifications occurring:
|
|
|
|
|
|
|
|
|
|
|
|
|
|
|
|
|
|
|
|
|
|
|
|
|
|
|
|
|
|
|
|
|
|
|
|
|
|
|
|
|
|
|
|
|
|
|
|
|
|
|
|
|
|
|
For the Year Ended December 31, |
|
2022 |
|
2021 |
|
2020 |
|
Number
of
Contracts |
|
Pre-
Modification
Outstanding
Recorded
Investment |
|
Post-
Modification
Outstanding
Recorded
Investment (1) |
|
Number
of
Contracts |
|
Pre-
Modification
Outstanding
Recorded
Investment |
|
Post-
Modification
Outstanding
Recorded
Investment
(1) |
|
Number
of
Contracts |
|
Pre-
Modification
Outstanding
Recorded
Investment |
|
Post-
Modification
Outstanding
Recorded
Investment
(1) |
|
(Dollars in thousands) |
| Commercial and industrial |
4 |
|
|
$ |
5,415 |
|
|
$ |
5,415 |
|
|
— |
|
|
$ |
— |
|
|
$ |
— |
|
|
1 |
|
|
$ |
140 |
|
|
$ |
140 |
|
| Commercial real estate |
— |
|
|
— |
|
|
— |
|
|
— |
|
|
— |
|
|
— |
|
|
1 |
|
|
506 |
|
|
506 |
|
| Business banking |
30 |
|
|
2,779 |
|
|
2,798 |
|
|
— |
|
|
— |
|
|
— |
|
|
6 |
|
|
1,642 |
|
|
1,642 |
|
| Residential real estate |
10 |
|
|
2,842 |
|
|
2,842 |
|
|
2 |
|
|
498 |
|
|
498 |
|
|
6 |
|
|
920 |
|
|
920 |
|
| Consumer home equity |
7 |
|
|
1,535 |
|
|
1,535 |
|
|
3 |
|
|
300 |
|
|
300 |
|
|
22 |
|
|
969 |
|
|
973 |
|
| Other consumer |
— |
|
|
— |
|
|
— |
|
|
— |
|
|
— |
|
|
— |
|
|
4 |
|
|
58 |
|
|
58 |
|
| Total |
51 |
|
|
$ |
12,571 |
|
|
$ |
12,590 |
|
|
5 |
|
|
$ |
798 |
|
|
$ |
798 |
|
|
40 |
|
|
$ |
4,235 |
|
|
$ |
4,239 |
|
(1)The post-modification balances represent the balance of the loan on the date of modification. These amounts may show an increase when modification includes capitalization of interest.
At December 31, 2022 and 2021, the outstanding recorded investment of loans that were new TDR loans during the period was $11.0 million and $0.8 million, respectively. The difference between such balances reported on an amortized cost basis and recorded investment basis at both December 31, 2022 and 2021 was not significant.
The following table shows the Company’s post-modification balance of TDRs listed by type of modification during the periods indicated:
|
|
|
|
|
|
|
|
|
|
|
|
|
|
|
|
|
|
|
For the Year Ended December 31, |
|
2022 |
|
2021 |
|
2020 |
|
(In thousands) |
| Principal and interest deferred |
$ |
3,353 |
|
|
$ |
— |
|
|
$ |
422 |
|
| Extended maturity and interest only/principal deferred |
2,997 |
|
|
— |
|
|
427 |
|
| Covenant modification |
2,418 |
|
|
— |
|
|
— |
|
| Interest only/principal deferred |
1,499 |
|
|
— |
|
|
1,305 |
|
| Adjusted interest rate and extended maturity |
1,088 |
|
|
— |
|
|
— |
|
| Extended maturity |
1,011 |
|
|
200 |
|
|
35 |
|
| Court-ordered concession |
— |
|
|
396 |
|
|
1,995 |
|
| Other |
224 |
|
|
202 |
|
|
55 |
|
| Total |
$ |
12,590 |
|
|
$ |
798 |
|
|
$ |
4,239 |
|
The following table shows the number of loans and the recorded investment amount of those loans, as of the respective date, that have been modified during the prior 12 months which have subsequently defaulted during the periods indicated. The Company considers a loan to have defaulted when it reaches 90 days past due or is transferred to non-accrual:
|
|
|
|
|
|
|
|
|
|
|
|
|
|
|
|
|
|
|
|
|
|
|
|
|
|
|
|
|
|
|
|
|
|
|
|
|
For the Year Ended December 31, |
|
2022 |
|
2021 |
|
2020 |
|
Number of
Contracts |
|
Recorded
Investment |
|
Number of
Contracts |
|
Recorded
Investment |
|
Number of
Contracts |
|
Recorded
Investment |
|
(Dollars in thousands) |
Troubled debt restructurings that subsequently defaulted (1): |
|
|
|
|
|
|
|
|
|
|
|
| Consumer home equity |
1 |
|
|
$ |
988 |
|
|
— |
|
|
$ |
— |
|
|
1 |
|
|
$ |
40 |
|
| Total |
1 |
|
|
$ |
988 |
|
|
— |
|
|
$ |
— |
|
|
1 |
|
|
$ |
40 |
|
(1)This table does not reflect any TDRs which were fully charged off, paid off, or otherwise settled during the period.
During the years ended December 31, 2022 and 2021, no amounts were charged-off on TDRs modified in the prior 12 months. During the year ended December 31, 2020, there were $0.2 million in charge-offs on TDRs modified in the prior 12 months.
Loan Participations
The Company occasionally purchases commercial loan participations, or participates in syndications through the SNC Program. These participations meet the same underwriting, credit and portfolio management standards as the Company’s other loans and are applied against the same criteria to determine the allowance for loan losses as other loans.
The following table summarizes the Company’s loan participations:
|
|
|
|
|
|
|
|
|
|
|
|
|
|
|
|
|
|
|
|
|
|
|
|
|
|
|
|
|
|
|
|
|
|
|
|
|
As of and for the Year Ended December 31, |
|
2022 |
|
2021 |
|
Balance |
|
Non-performing
Loan Rate
(%) |
|
Gross
Charge-offs |
|
Balance |
|
Non-performing
Loan Rate
(%) |
|
Gross
Charge-offs |
|
(Dollars in thousands) |
Commercial and industrial |
$ |
1,024,131 |
|
|
0.83 |
% |
|
$ |
— |
|
|
$ |
732,425 |
|
|
1.36 |
% |
|
$ |
— |
|
| Commercial real estate |
422,042 |
|
|
0.00 |
% |
|
— |
|
|
362,898 |
|
|
0.00 |
% |
|
— |
|
| Commercial construction |
96,134 |
|
|
0.00 |
% |
|
— |
|
|
37,081 |
|
|
0.00 |
% |
|
— |
|
| Business banking |
51 |
|
|
0.00 |
% |
|
3 |
|
|
98 |
|
|
0.00 |
% |
|
— |
|
Total loan participations |
$ |
1,542,358 |
|
|
0.55 |
% |
|
$ |
3 |
|
|
$ |
1,132,502 |
|
|
0.88 |
% |
|
$ |
— |
|
6. Loans and Allowance for Loan Losses
Allowance for Loan Losses
As described in Note 2, “Summary of Significant Accounting Policies,” the Company adopted ASU 2016-13 effective January 1, 2022. The Company has included comparative prior period disclosures of its allowance for loan losses which were prepared in accordance with ASC 450, “Contingencies” and ASC 310, “Receivables” (i.e., prior to the Company’s adoption of ASU 2016-13). Refer to the Company’s 2021 Form 10-K for significant accounting policies related to the Company’s allowance for loan losses as of December 31, 2021. A discussion of the Company’s calculation of its allowance for loan losses for such prior periods follows.
The allowance for loan losses was established to provide for probable losses incurred in the Company’s loan portfolio at the balance sheet date and was established through a provision for loan losses charged to net income. Charge-offs, net of recoveries, were charged directly to the allowance. Commercial and residential loans were charged-off in the period in which they were deemed uncollectible. Delinquent loans in these product types were subject to ongoing review and analysis to determine if a charge-off in the current period was appropriate. For consumer loans, policies and procedures existed that required charge-off consideration upon a certain triggering event depending on the product type.
Management used a methodology to systematically estimate the amount of losses incurred in the portfolio. Commercial real estate, commercial and industrial, commercial construction and business banking loans were evaluated using a loan rating system, historical losses and other factors which formed the basis for estimating incurred losses. Portfolios of more homogeneous populations of loans, including residential mortgages and consumer loans, were analyzed as groups taking into account delinquency ratios, historical loss experience and charge-offs. For the purpose of estimating the allowance for loan losses, management segregated the loan portfolio into the categories noted in the credit quality tables presented in the “Credit Quality” section below. Each of these loan categories possessed unique risk characteristics such as the purpose of the loan, repayment source, and collateral. These characteristics were considered when determining the appropriate level of the allowance for each category. The Company’s historical approach to loan portfolio segmentation by risk characteristics and monitoring of credit quality for commercial loans under previous accounting guidance was consistent with that applied under the newly adopted CECL standard. See Note 5, “Loans and Allowance for Credit Losses” for further discussion regarding the Company’s policies for loan segmentation and credit monitoring.
The following table summarizes the change in allowance for loan losses by loan category for the year ended December 31, 2021:
|
|
|
|
|
|
|
|
|
|
|
|
|
|
|
|
|
|
|
|
|
|
|
|
|
|
|
|
|
|
|
|
|
|
|
|
|
|
|
|
|
|
|
|
|
|
|
|
|
|
|
|
|
|
|
For the Year Ended December 31, 2021 |
|
Commercial
and
Industrial |
|
Commercial
Real Estate |
|
Commercial
Construction |
|
Business
Banking |
|
Residential
Real Estate |
|
Consumer
Home Equity |
|
Other
Consumer |
|
Other |
|
Total |
|
(In thousands) |
| Allowance for loan losses: |
|
|
|
|
|
|
|
|
|
|
|
|
|
|
|
|
|
| Beginning balance |
$ |
26,617 |
|
|
$ |
54,569 |
|
|
$ |
4,553 |
|
|
$ |
13,152 |
|
|
$ |
6,435 |
|
|
$ |
3,744 |
|
|
$ |
3,467 |
|
|
$ |
494 |
|
|
$ |
113,031 |
|
| Charge-offs |
(1,558) |
|
|
(247) |
|
|
— |
|
|
(5,091) |
|
|
(35) |
|
|
(24) |
|
|
(2,047) |
|
|
— |
|
|
(9,002) |
|
| Recoveries |
935 |
|
|
4 |
|
|
— |
|
|
1,524 |
|
|
122 |
|
|
185 |
|
|
674 |
|
|
— |
|
|
3,444 |
|
| (Release of) Provision |
(7,976) |
|
|
(1,953) |
|
|
(1,968) |
|
|
1,398 |
|
|
34 |
|
|
(183) |
|
|
1,214 |
|
|
(252) |
|
|
(9,686) |
|
Ending balance |
$ |
18,018 |
|
|
$ |
52,373 |
|
|
$ |
2,585 |
|
|
$ |
10,983 |
|
|
$ |
6,556 |
|
|
$ |
3,722 |
|
|
$ |
3,308 |
|
|
$ |
242 |
|
|
$ |
97,787 |
|
The following table bifurcates the amount of loans and the allowance for loan losses allocated to each loan category based on the type of impairment analysis as of December 31, 2021:
|
|
|
|
|
|
|
|
|
|
|
|
|
|
|
|
|
|
|
|
|
|
|
|
|
|
|
|
|
|
|
|
|
|
|
|
|
|
|
|
|
|
|
|
|
|
|
|
|
|
|
|
|
|
|
As of December 31, 2021 |
|
Commercial
and
Industrial |
|
Commercial
Real Estate |
|
Commercial
Construction |
|
Business
Banking |
|
Residential
Real Estate |
|
Consumer
Home Equity |
|
Other
Consumer |
|
Other |
|
Total |
|
(In thousands) |
| Allowance for loan losses ending balance: |
|
|
|
|
|
|
|
|
|
|
|
|
|
|
|
|
|
| Individually evaluated for impairment |
$ |
1,540 |
|
|
$ |
— |
|
|
$ |
— |
|
|
$ |
450 |
|
|
$ |
1,549 |
|
|
$ |
270 |
|
|
$ |
161 |
|
|
$ |
— |
|
|
$ |
3,970 |
|
| Acquired with deteriorated credit quality |
5 |
|
|
298 |
|
|
— |
|
|
— |
|
|
243 |
|
|
— |
|
|
— |
|
|
— |
|
|
546 |
|
| Collectively evaluated for impairment |
16,473 |
|
|
52,075 |
|
|
2,585 |
|
|
10,533 |
|
|
4,764 |
|
|
3,452 |
|
|
3,147 |
|
|
242 |
|
|
93,271 |
|
| Total allowance for loan losses by group |
$ |
18,018 |
|
|
$ |
52,373 |
|
|
$ |
2,585 |
|
|
$ |
10,983 |
|
|
$ |
6,556 |
|
|
$ |
3,722 |
|
|
$ |
3,308 |
|
|
$ |
242 |
|
|
$ |
97,787 |
|
| Loans ending balance: |
|
|
|
|
|
|
|
|
|
|
|
|
|
|
|
|
|
| Individually evaluated for impairment |
$ |
16,145 |
|
|
$ |
3,520 |
|
|
$ |
— |
|
|
$ |
12,060 |
|
|
$ |
22,378 |
|
|
$ |
3,922 |
|
|
$ |
179 |
|
|
$ |
— |
|
|
$ |
58,204 |
|
| Acquired with deteriorated credit quality |
19,028 |
|
|
47,553 |
|
|
— |
|
|
— |
|
|
3,058 |
|
|
— |
|
|
— |
|
|
— |
|
|
69,639 |
|
| Collectively evaluated for impairment |
2,925,354 |
|
|
4,471,440 |
|
|
222,328 |
|
|
1,322,634 |
|
|
1,901,374 |
|
|
1,096,231 |
|
|
214,306 |
|
|
— |
|
|
12,153,667 |
|
| Total loans by group |
$ |
2,960,527 |
|
|
$ |
4,522,513 |
|
|
$ |
222,328 |
|
|
$ |
1,334,694 |
|
|
$ |
1,926,810 |
|
|
$ |
1,100,153 |
|
|
$ |
214,485 |
|
|
$ |
— |
|
|
$ |
12,281,510 |
|
Credit Quality
The following table details the internal risk-rating categories for the Company’s commercial and industrial, commercial real estate, commercial construction and business banking portfolios:
|
|
|
|
|
|
|
|
|
|
|
|
|
|
|
|
|
|
|
|
|
|
|
|
|
|
|
|
|
|
|
|
|
|
|
As of December 31, 2021 |
| Category |
|
Commercial and
Industrial |
|
Commercial
Real Estate |
|
Commercial
Construction |
|
Business
Banking |
|
Total |
|
|
(In thousands) |
| Unrated |
|
$ |
171,537 |
|
|
$ |
4,378 |
|
|
$ |
— |
|
|
$ |
696,629 |
|
|
$ |
872,544 |
|
| Pass |
|
2,656,873 |
|
|
4,199,803 |
|
|
213,744 |
|
|
569,956 |
|
|
7,640,376 |
|
| Special mention |
|
70,141 |
|
|
104,517 |
|
|
1,889 |
|
|
50,085 |
|
|
226,632 |
|
| Substandard |
|
50,339 |
|
|
213,815 |
|
|
6,695 |
|
|
17,814 |
|
|
288,663 |
|
| Doubtful |
|
11,637 |
|
|
— |
|
|
— |
|
|
210 |
|
|
11,847 |
|
| Loss |
|
— |
|
|
— |
|
|
— |
|
|
— |
|
|
— |
|
| Total |
|
$ |
2,960,527 |
|
|
$ |
4,522,513 |
|
|
$ |
222,328 |
|
|
$ |
1,334,694 |
|
|
$ |
9,040,062 |
|
PPP loans are included within the unrated category of the commercial and industrial and business banking portfolios in the table above. Commercial and industrial PPP and business banking PPP loans amounted to $112.8 million and $218.6 million, respectively, at December 31, 2021. The Company does not have an allowance for loan losses for PPP loans as they are 100% guaranteed by the SBA.
Impaired Loans
Under previous accounting guidance, impaired loans consisted of all loans for which management had determined it was probable that the Company would be unable to collect all amounts due according to the contractual terms of the loan agreements. Factors considered by management in determining impairment included payment status, collateral value, and the probability of collecting scheduled principal and interest payments when due.
The Company measured impairment of loans using a discounted cash flow method, the loan’s observable market price, or the fair value of the collateral if the loan was collateral dependent. The Company defined the population of impaired loans to include certain non-accrual loans, TDR loans, and residential and home equity loans that had been partially charged off.
The following table summarizes the Company’s impaired loans by loan portfolio as of December 31, 2021:
|
|
|
|
|
|
|
|
|
|
|
|
|
|
|
|
|
|
|
As of December 31, 2021 |
|
Recorded
Investment |
|
Unpaid
Principal
Balance |
|
Related
Allowance |
|
(In thousands) |
| With no related allowance recorded: |
|
|
|
|
|
| Commercial and industrial |
$ |
12,309 |
|
|
$ |
13,212 |
|
|
$ |
— |
|
| Commercial real estate |
3,520 |
|
|
3,520 |
|
|
— |
|
| Business banking |
4,199 |
|
|
5,069 |
|
|
— |
|
| Residential real estate |
11,217 |
|
|
12,587 |
|
|
— |
|
| Consumer home equity |
1,924 |
|
|
1,924 |
|
|
— |
|
| Other consumer |
18 |
|
|
18 |
|
|
— |
|
| Sub-total |
33,187 |
|
|
36,330 |
|
|
— |
|
| With an allowance recorded: |
|
|
|
|
|
| Commercial and industrial |
3,836 |
|
|
4,226 |
|
|
1,540 |
|
| Commercial real estate |
— |
|
|
— |
|
|
— |
|
| Business banking |
7,861 |
|
|
11,240 |
|
|
450 |
|
| Residential real estate |
11,161 |
|
|
11,161 |
|
|
1,549 |
|
| Consumer home equity |
1,998 |
|
|
1,998 |
|
|
270 |
|
| Other consumer |
161 |
|
|
161 |
|
|
161 |
|
| Sub-total |
25,017 |
|
|
28,786 |
|
|
3,970 |
|
| Total |
$ |
58,204 |
|
|
$ |
65,116 |
|
|
$ |
3,970 |
|
The following table displays information regarding interest income recognized on impaired loans, by portfolio, for the years ended December 31, 2021 and 2020:
|
|
|
|
|
|
|
|
|
|
|
|
|
|
|
|
|
|
|
|
|
|
|
|
|
For the Years Ended December 31, |
|
2021 |
|
2020 |
|
Average
Recorded
Investment |
|
Total
Interest
Recognized |
|
Average
Recorded
Investment |
|
Total
Interest
Recognized |
|
(In thousands) |
| With no allowance recorded: |
|
|
|
|
|
|
|
| Commercial and industrial |
$ |
11,813 |
|
|
$ |
161 |
|
|
$ |
12,941 |
|
|
$ |
206 |
|
| Commercial real estate |
3,916 |
|
|
178 |
|
|
5,124 |
|
|
179 |
|
| Business banking |
4,352 |
|
|
99 |
|
|
3,008 |
|
|
92 |
|
| Residential real estate |
12,506 |
|
|
456 |
|
|
14,654 |
|
|
589 |
|
| Consumer home equity |
2,027 |
|
|
62 |
|
|
3,299 |
|
|
87 |
|
| Other consumer |
23 |
|
|
— |
|
|
36 |
|
|
1 |
|
| Sub-total |
34,637 |
|
|
956 |
|
|
39,062 |
|
|
1,154 |
|
| With an allowance recorded: |
|
|
|
|
|
|
|
| Commercial and industrial |
7,229 |
|
|
— |
|
|
7,947 |
|
|
— |
|
| Commercial real estate |
926 |
|
|
— |
|
|
644 |
|
|
— |
|
| Business banking |
13,027 |
|
|
57 |
|
|
13,663 |
|
|
62 |
|
| Residential real estate |
12,322 |
|
|
474 |
|
|
12,194 |
|
|
521 |
|
| Consumer home equity |
2,106 |
|
|
65 |
|
|
2,334 |
|
|
77 |
|
| Other consumer |
63 |
|
|
— |
|
|
— |
|
|
— |
|
| Sub-total |
35,673 |
|
|
596 |
|
|
36,782 |
|
|
660 |
|
| Total |
$ |
70,310 |
|
|
$ |
1,552 |
|
|
$ |
75,844 |
|
|
$ |
1,814 |
|
Purchased Credit Impaired Loans
The following table displays the outstanding and carrying amounts of PCI loans as of December 31, 2021 :
|
|
|
|
|
|
|
As of December 31, 2021 |
|
(In thousands) |
| Outstanding balance |
$ |
78,074 |
|
| Carrying amount |
69,639 |
|
Under previous accounting guidance, the excess of cash flows expected to be collected over the carrying amount of the loans, referred to as the “accretable yield,” was accreted into interest income over the life of the loans using the effective yield method. The following table summarizes activity in the accretable yield for the PCI loan portfolio:
|
|
|
|
|
|
|
|
|
|
|
|
|
For the Years Ended December 31, |
|
2021 |
2020 |
|
(In thousands) |
| Balance at beginning of period |
$ |
2,495 |
|
|
$ |
3,923 |
|
| Acquisition |
8,896 |
|
|
— |
|
| Accretion |
(1,194) |
|
|
(1,374) |
|
| Other change in expected cash flows |
(1,475) |
|
|
(185) |
|
| Reclassification from non-accretable difference for loans with improved cash flows |
1,649 |
|
|
131 |
|
| Balance at end of period |
$ |
10,371 |
|
|
$ |
2,495 |
|
The estimate of cash flows expected to be collected was regularly re-assessed subsequent to acquisition. A decrease in expected cash flows in subsequent periods may have indicated that the loan was impaired which would require the establishment of an allowance for loan losses by a charge to the provision for loan losses. An increase in expected cash flows in subsequent periods served, first, to reduce any previously established allowance for loan losses by the increase in the present value of cash flows expected to be collected, and resulted in a recalculation of the amount of accretable yield for the loan. The adjustment of accretable yield due to an increase in expected cash flows was accounted for as a change in estimate. The additional cash flows expected to be collected were reclassified from the non-accretable difference to the accretable yield, and the amount of periodic accretion was adjusted accordingly over the remaining life of the loans.
7. Premises and Equipment
The information presented within this Note excludes discontinued operations. Refer to Note 24, “Discontinued Operations” for further discussion regarding discontinued operations.
The following table summarizes the Company’s premises and equipment as of the dates indicated:
|
|
|
|
|
|
|
|
|
|
|
|
|
|
|
|
|
|
|
As of December 31, |
|
Estimated |
|
2022 |
|
2021 |
|
Useful Life |
|
(In thousands) |
|
(In years) |
| Premises and equipment used in operations: |
|
|
|
|
|
| Land |
$ |
12,585 |
|
|
$ |
12,814 |
|
|
N/A |
| Buildings |
70,771 |
|
|
71,415 |
|
|
5-30 |
| Equipment |
35,085 |
|
|
46,324 |
|
|
3-5 |
| Leasehold improvements |
36,424 |
|
|
42,156 |
|
|
5-25 |
| Total cost |
154,865 |
|
|
172,709 |
|
|
|
| Accumulated depreciation |
(92,372) |
|
|
(107,282) |
|
|
|
| Premises and equipment used in operations, net |
62,493 |
|
|
65,427 |
|
|
|
| Premises and equipment held for sale |
— |
|
|
15,128 |
|
|
|
| Net premises and equipment (1) |
$ |
62,493 |
|
|
$ |
80,555 |
|
|
|
(1)In connection with the Company’s acquisition of Century, the Company acquired $64.5 million in premises and equipment.
The Company recorded depreciation expense related to premises and equipment of $10.7 million, $11.6 million, and $12.7 million during the years ended December 31, 2022, 2021, and 2020, respectively.
During the year ended December 31, 2022, no properties were transferred to held for sale. During the year ended December 31, 2022, the Company sold five properties, four of which were acquired in connection with the Company’s acquisition of Century. The properties sold during year ended December 31, 2022 were included in premises and equipment held for sale as of December 31, 2021. The aggregate proceeds from such sales of premises and equipment were $17.3 million. In connection with these sales, the Company recognized a gain on sale of $1.4 million, which is included in other non-interest income in the Consolidated Statements of Income.
Properties transferred to held for sale during the year ended December 31, 2021 amounted to $37.6 million, which included five branch locations, of which four were acquired in connection with the Company’s acquisition of Century. The Company recorded a $1.2 million loss, representing estimated costs to sell, on properties transferred to held for sale during the year ended December 31, 2021. During the year ended December 31, 2021, the Company sold three properties, two of which were acquired in connection with the Company’s acquisition of Century and one of which was included in premises held for sale as of December 31, 2020. The aggregate proceeds from sales of premises and equipment were $22.0 million during the year ended December 31, 2021. In connection with these sales, the Company recognized no significant gain or loss. No premises and equipment was transferred to held for sale or sold during the year ended December 31, 2020.
8. Leases
The Company leases certain office space and equipment under various non-cancelable operating leases. These leases have original terms ranging from 1 year to 25 years. Operating lease liabilities and ROU assets are recognized at the lease commencement date based upon the present value of the future minimum lease payments over the lease term. Operating lease liabilities are recorded within other liabilities and ROU assets are recorded within other assets in the Company’s Consolidated Balance Sheets. The information presented within this Note excludes discontinued operations. Refer to Note 24, “Discontinued Operations” for further discussion regarding discontinued operations.
As of the dates indicated, the Company had the following related to operating leases:
|
|
|
|
|
|
|
|
|
|
|
|
|
As of December 31, 2022 |
|
As of December 31, 2021 |
|
(In thousands) |
| Right-of-use assets |
$ |
48,817 |
|
|
$ |
74,092 |
|
| Lease liabilities |
52,105 |
|
|
78,977 |
|
Finance leases are not material. Finance lease liabilities are recorded within other liabilities and finance ROU assets are recorded within other assets in the Company’s Consolidated Balance Sheets.
The following table is a summary of the Company’s components of net lease cost for the periods indicated:
|
|
|
|
|
|
|
|
|
|
|
|
|
|
|
|
|
|
|
For the Year Ended December 31, |
|
2022 |
|
2021 |
|
2020 |
|
(In thousands) |
| Operating lease cost |
$ |
12,716 |
|
|
$ |
12,559 |
|
|
$ |
12,360 |
|
| Finance lease cost |
309 |
|
|
160 |
|
|
60 |
|
| Variable lease cost |
2,547 |
|
|
2,012 |
|
|
1,889 |
|
| Total lease cost |
$ |
15,572 |
|
|
$ |
14,731 |
|
|
$ |
14,309 |
|
During the years ended December 31, 2022, 2021, and 2020 the Company made $15.2 million, $13.6 million, and $12.2 million in cash payments for operating and finance leases, respectively.
Supplemental balance sheet information related to operating leases as of the dates indicated is as follows:
|
|
|
|
|
|
|
|
|
|
|
|
|
As of December 31, 2022 |
|
As of December 31, 2021 |
| Weighted-average remaining lease term (in years) |
7.25 |
|
7.89 |
| Weighted-average discount rate |
2.62 |
% |
|
2.52 |
% |
The following table sets forth the undiscounted cash flows of base rent related to operating leases outstanding as of December 31, 2022 with payments scheduled over the next five years and thereafter, including a reconciliation to the operating lease liability recognized in other liabilities in the Company’s Consolidated Balance Sheets:
|
|
|
|
|
|
|
As of December 31, 2022 |
| Year |
(In thousands) |
| 2023 |
$ |
12,472 |
|
| 2024 |
9,774 |
|
| 2025 |
7,804 |
|
| 2026 |
6,763 |
|
| 2027 |
5,602 |
|
| Thereafter |
15,075 |
|
| Total minimum lease payments |
57,490 |
|
| Less: amount representing interest |
5,385 |
|
| Present value of future minimum lease payments |
$ |
52,105 |
|
Lease Modifications and Terminations:
During the year ended December 31, 2022, management determined not to exercise a future lease term extension option related to three leases, which had previously been included in its determination of future lease payments, to exercise a future lease term extension option related to two leases, which had not previously been included in its determination of future lease payments, and to terminate four leases. Accordingly, the Company remeasured the present value of the future lease payments related to such leases which resulted in a net reduction of the lease liabilities and a corresponding net reduction of the lease ROU assets of $14.8 million. In connection with the lease terminations, the Company recorded an impairment charge of $0.6 million.
During the year ended December 31, 2021, management made the decision to terminate four leases, one of which was acquired in connection with the Company’s acquisition of Century. Accordingly, the Company remeasured the ROU assets and lease liabilities which resulted in acceleration of the ROU asset amortization. The additional amortization recorded as a result of the acceleration was $1.7 million during the year ended December 31, 2021. These leases were terminated during the year ended December 31, 2022.
Lease Abandonments:
As of December 31, 2021, management made the decision to close three leased locations. Management performed an analysis pursuant to ASC 360, “Property, Plant, and Equipment,” (“ASC 360” ) and determined that such closures represented lease abandonments. As a result of that analysis, the Company recognized an impairment charge on these leases of $0.3 million. During the year ended December 31, 2022, there were no lease abandonments.
Sub-leases:
As of December 31, 2021, management made the decision to and was pursuing the sublet of five leases, two of which were acquired in connection with the Company’s acquisition of Century. In connection with this decision, management performed a recoverability analysis pursuant to ASC 360. As a result of that analysis, the Company recorded an impairment charge of $0.5 million. During the year ended December 31, 2022, there were no additional lease sublets.
9. Goodwill and Other Intangibles
The table below sets forth the carrying amount of goodwill and other intangible assets, net of accumulated amortization, for the banking business as of the dates indicated below. The information presented within this Note excludes discontinued operations. Refer to Note 24, “Discontinued Operations” for further discussion regarding discontinued operations.
|
|
|
|
|
|
|
|
|
|
|
|
|
As of December 31, 2022 |
|
As of December 31, 2021 |
|
(In thousands) |
| Balances not subject to amortization |
|
|
|
| Goodwill |
$ |
557,635 |
|
|
$ |
557,635 |
|
| Balances subject to amortization |
|
|
|
| Core deposits |
10,374 |
|
|
11,572 |
|
| Total goodwill and other intangible assets |
$ |
568,009 |
|
|
$ |
569,207 |
|
The changes in the carrying value of goodwill for the banking business for the periods indicated were as follows:
|
|
|
|
|
|
|
|
|
|
|
|
|
For the Year Ended December 31, 2022 |
|
For the Year Ended December 31, 2021 |
|
(In thousands) |
| Balance at beginning of year |
$ |
557,635 |
|
|
$ |
298,611 |
|
| Goodwill recorded during the year (1) |
— |
|
|
259,024 |
|
| Goodwill disposed of during the year |
— |
|
|
— |
|
| Balance at end of year |
$ |
557,635 |
|
|
$ |
557,635 |
|
(1)The goodwill recorded during the year ended December 31, 2021 relates to the acquisition of Century. For additional information refer to Note 3, Mergers and Acquisitions.
The following table sets forth the carrying amount of the Company’s core deposit intangible asset, net of accumulated amortization, for the banking business as of the dates indicated below:
|
|
|
|
|
|
|
|
|
|
|
|
|
|
|
|
|
|
|
|
|
|
|
|
|
|
|
|
|
|
|
|
|
|
|
|
|
As of December 31, |
|
2022 |
|
2021 |
|
Gross Carrying Amount |
|
Accumulated Amortization |
|
Net
Carrying
Amount |
|
Gross Carrying Amount |
|
Accumulated Amortization |
|
Net
Carrying
Amount |
|
(In thousands) |
| Core deposit intangible |
$ |
15,969 |
|
|
$ |
(5,595) |
|
|
$ |
10,374 |
|
|
$ |
18,212 |
|
|
$ |
(6,640) |
|
|
$ |
11,572 |
|
| Total |
$ |
15,969 |
|
|
$ |
(5,595) |
|
|
$ |
10,374 |
|
|
$ |
18,212 |
|
|
$ |
(6,640) |
|
|
$ |
11,572 |
|
The Company quantitatively assesses goodwill for impairment at the reporting unit level on an annual basis or sooner if an event occurs or circumstances change which might indicate that the fair value of a reporting unit is below its carrying amount. As of December 31, 2022, the Company identified and assigned goodwill to two reporting units - the banking business and insurance agency business. As a result of the decision to sell the insurance agency business, the assets and liabilities of the insurance agency segment were classified as held for sale and, accordingly, are presented as assets and liabilities of discontinued operations on the Consolidated Balance Sheets. As of December 31, 2022, the quantitative assessment for the banking business was most recently performed as of September 30, 2022. The assessment for the banking business included a market capitalization analysis, as well as a comparison of the banking business’s book value to the implied fair value using a pricing multiple of the Company’s tangible book value. The Company considered the economic conditions for the period including the potential impact of the COVID-19 pandemic as it pertains to the goodwill above and determined that there was no indication of impairment related to goodwill during the year ended December 31, 2022. Additionally, the Company did not record any impairment charges during the years ended December 31, 2021 and 2020.
The amortization expense of the Company’s core deposit intangible asset was $1.2 million, $0.2 million, and $0.6 million during the years ended December 31, 2022, 2021, and 2020, respectively.
The original amortization period and remaining useful life of the Company’s core deposit intangible asset is 10.0 years and 8.9 years, respectively.
The estimated amortization expense related to the Company’s core deposit intangible asset for each of the five succeeding years and thereafter is as follows:
|
|
|
|
|
|
| Year |
(In thousands) |
| 2023 |
$ |
1,163 |
|
| 2024 |
1,163 |
|
| 2025 |
1,163 |
|
| 2026 |
1,163 |
|
| 2027 |
1,163 |
|
| Thereafter |
4,559 |
|
| Total amortization expense |
$ |
10,374 |
|
Other intangible assets are reviewed for impairment whenever events or changes in circumstances indicate that the carrying amount of the assets may not be recoverable. The Company considered the economic conditions for the period, including the potential impact of the COVID-19 pandemic, as it pertains to these intangible assets and determined that there was no indication of impairment related to the core deposit intangible asset during the year ended December 31, 2022.
Additionally, the Company did not record any impairment charges during the years ended December 31, 2021 and 2020.
10. Deposits
The Company has established overnight programs which sweep certain demand and interest checking accounts into money market investment accounts. Reported deposit balances do not reflect the impact of the overnight sweep programs. At December 31, 2022 and 2021, the Company swept $9.5 billion, and $10.5 billion, respectively, from demand deposit and interest checking balances into money market investments.
At December 31, 2022 and 2021, the Company had a balance of $2.3 million and $1.6 million, respectively, in overdrafts. Overdrafts are included in loans in the Consolidated Balance Sheets.
The following table summarizes certificate of deposits by maturity at December 31, 2022:
|
|
|
|
|
|
|
|
|
|
|
|
|
Balance |
|
Percentage of Total |
| Year |
(Dollars in thousands) |
| 2023 |
$ |
1,575,617 |
|
|
97.0 |
% |
| 2024 |
30,617 |
|
|
1.9 |
% |
| 2025 |
9,297 |
|
|
0.6 |
% |
| 2026 |
5,092 |
|
|
0.3 |
% |
| 2027 |
3,726 |
|
|
0.2 |
% |
| Thereafter |
33 |
|
|
0.0 |
% |
| Total certificates of deposit |
$ |
1,624,382 |
|
|
100.0 |
% |
At December 31, 2022 and 2021, securities with a carrying value of $437.9 million and $2.2 billion, respectively, were pledged to secure public deposits and for other purposes required by law. At December 31, 2022 and 2021, securities pledged as collateral for deposits included Eastern Wealth Management cash accounts and municipal accounts. During the first quarter of 2022, the Company eliminated certain pledging arrangements acquired from Century which resulted in the decrease in securities pledged at December 31, 2022 compared to December 31, 2021.
The FDIC offers insurance coverage on deposits up to the federally insured limit of $250,000. The amount of time deposits equal to or greater than $250,000, as of December 31, 2022 and 2021, was $239.1 million and $224.0 million, respectively.
Included in the certificates of deposit balances above were $928.6 million of brokered certificates of deposit at December 31, 2022.
11. Borrowed Funds
Borrowed funds were comprised of the following:
|
|
|
|
|
|
|
|
|
|
|
|
|
As of December 31, |
|
2022 |
|
2021 |
|
(In thousands) |
| Short-term FHLB advances |
$ |
691,297 |
|
|
$ |
17 |
|
| Escrow deposits of borrowers |
22,314 |
|
|
20,258 |
|
| Interest rate swap collateral funds |
14,430 |
|
|
— |
|
| Long-term FHLB advances |
12,787 |
|
|
14,003 |
|
| Total borrowed funds |
$ |
740,828 |
|
|
$ |
34,278 |
|
At December 31, 2022 and 2021, the Company had available and unused borrowing capacity of approximately $538.9 million and $455.3 million, respectively, at the Federal Reserve Discount Window.
Interest expense on borrowed funds was as follows:
|
|
|
|
|
|
|
|
|
|
|
|
|
|
|
|
|
|
|
For the Year Ended December 31, |
|
2022 |
|
2021 |
|
2020 |
|
(In thousands) |
| Federal funds purchased |
$ |
24 |
|
|
$ |
— |
|
|
$ |
570 |
|
| Federal Home Loan Bank advances |
8,263 |
|
|
163 |
|
|
190 |
|
| Escrow deposits of borrowers |
3 |
|
|
2 |
|
|
2 |
|
| Interest rate swap collateral funds |
216 |
|
|
— |
|
|
— |
|
| Total interest expense on borrowed funds |
$ |
8,506 |
|
|
$ |
165 |
|
|
$ |
762 |
|
A summary of FHLBB advances by maturities were as follows:
|
|
|
|
|
|
|
|
|
|
|
|
|
|
|
|
|
|
|
|
|
|
|
|
|
As of December 31, |
|
2022 |
|
2021 |
|
Amount |
|
Weighted Average
Interest Rate |
|
Amount |
|
Weighted Average
Interest Rate |
|
(Dollars in thousands) |
| Within one year |
$ |
691,297 |
|
|
4.36 |
% |
|
$ |
17 |
|
|
0.14 |
% |
| Over one year to three years |
2,835 |
|
|
0.86 |
% |
|
1,488 |
|
|
0.32 |
% |
| Over three years to five years |
2,534 |
|
|
1.89 |
% |
|
2,854 |
|
|
1.10 |
% |
| Over five years |
7,418 |
|
|
0.94 |
% |
|
9,661 |
|
|
1.24 |
% |
| Total Federal Home Loan Bank advances (1) |
$ |
704,084 |
|
|
4.30 |
% |
|
$ |
14,020 |
|
|
1.11 |
% |
(1)The weighted average interest rate of long-term FHLB advances as of both December 31, 2022 and December 31, 2021 was 1.11%.
At December 31, 2022 and 2021, advances from the FHLBB were secured by stock in the FHLBB, residential real estate loans and commercial real estate loans. The collateral value of residential real estate and commercial real estate loans securing these advances was $1.5 billion and $1.2 billion, respectively, at December 31, 2022, and $1.0 billion and $888.3 million, respectively, at December 31, 2021. At December 31, 2022 and 2021, the Bank had available and unused borrowing capacity with the FHLBB of approximately $2.0 billion and $1.8 billion, respectively.
As a member of the FHLBB, the Company is required to hold FHLBB stock. At December 31, 2022 and 2021, the Company had investments in the FHLBB of $41.4 million and $10.9 million, respectively. At its discretion, the FHLBB may declare dividends on the stock. Included in other noninterest income in the Consolidated Statements of Income are dividends received of $0.3 million, $0.2 million, and $0.4 million during the years ended December 31, 2022, 2021, and 2020, respectively.
12. Income Taxes
The following table sets forth information regarding the Company’s tax provision and applicable tax rates for the periods indicated (income from continuing and discontinued operations before income tax expense was included for purposes of determining the Company’s effective tax rate for the periods shown):
|
|
|
|
|
|
|
|
|
|
|
|
|
|
|
|
|
|
|
For the Year Ended December 31, |
|
2022 |
|
2021 |
|
2020 |
|
(Dollars in thousands) |
| Combined federal and state income tax expense - continuing operations |
$ |
51,719 |
|
|
$ |
30,464 |
|
|
$ |
7,778 |
|
| Combined federal and state income tax expense - discontinued operations |
5,210 |
|
|
3,583 |
|
|
5,385 |
|
| Total combined federal and state income tax expense |
$ |
56,929 |
|
|
$ |
34,047 |
|
|
$ |
13,163 |
|
|
|
|
|
|
|
| Income from continuing operations before income tax expense |
$ |
238,230 |
|
|
$ |
175,995 |
|
|
$ |
16,639 |
|
| Income from discontinued operations before income tax expense |
18,458 |
|
|
12,717 |
|
|
19,262 |
|
| Total income before income tax expense |
$ |
256,688 |
|
|
$ |
188,712 |
|
|
$ |
35,901 |
|
|
|
|
|
|
|
| Effective income tax rates |
22.18 |
% |
|
18.04 |
% |
|
36.67 |
% |
The Company’s provision for income taxes was $56.9 million, $34.0 million and $13.2 million for the years ended December 31, 2022, 2021, and 2020, respectively. The Company’s effective tax rate was 22.2% and was higher than the effective tax rate of 18.0% for the prior year ending December 31, 2021. The increase in income tax expense during the year ended December 31, 2022 compared to the year ended December 31, 2021, was primarily due to higher income before income tax expense and an increase in the effective tax rate. The increase in the effective tax rate resulted primarily from a partial release of $11.3 million during the year ended December 31, 2021 related to a valuation allowance established as of December 31, 2020 against the Company’s charitable contribution carryover deferred tax asset in connection with the Company’s 2020 charitable contribution to the Eastern Bank Foundation compared to a release of $0.7 million during the year ended December 31, 2022. Also contributing to the increase in the effective tax rate, was a decrease of the impact on the effective rate related to favorable permanent differences, including investment tax credits and tax-exempt income, resulting from higher income before income tax expense. The increase was partially offset by an increase in tax-exempt income resulting from the Company’s acquisition of Century and the release of uncertain tax positions of $2.1 million in the fourth quarter of 2022.
The provision for income taxes is comprised of the following components:
|
|
|
|
|
|
|
|
|
|
|
|
|
|
|
|
|
|
|
For the Year Ended December 31, |
|
2022 |
|
2021 |
|
2020 |
|
(In thousands) |
| Current tax expense: |
|
|
|
|
|
| Federal |
$ |
39,453 |
|
|
$ |
26,114 |
|
|
$ |
23,002 |
|
| State |
11,453 |
|
|
13,246 |
|
|
10,520 |
|
| Total current tax expense |
50,906 |
|
|
39,360 |
|
|
33,522 |
|
| Deferred tax expense (benefit): |
|
|
|
|
|
| Federal |
3,244 |
|
|
(7,747) |
|
|
(13,736) |
|
| State |
2,779 |
|
|
2,434 |
|
|
(6,623) |
|
| Total deferred tax expense (benefit) |
6,023 |
|
|
(5,313) |
|
|
(20,359) |
|
| Total income tax expense |
$ |
56,929 |
|
|
$ |
34,047 |
|
|
$ |
13,163 |
|
A reconciliation of the U.S. federal statutory rate to the Company’s effective income tax rate is detailed below:
|
|
|
|
|
|
|
|
|
|
|
|
|
|
|
|
|
|
|
|
|
|
|
|
|
|
|
|
|
|
|
|
|
|
|
|
|
For the Year Ended December 31, |
|
2022 |
|
2021 |
|
2020 |
|
(Dollars in thousands) |
| Income tax expense at statutory rate |
$ |
53,904 |
|
|
21.00 |
% |
|
$ |
39,630 |
|
21.00 |
% |
|
$ |
7,539 |
|
|
21.00 |
% |
| Increase (decrease) resulting from: |
|
|
|
|
|
|
|
|
|
|
|
| State income tax, net of federal tax benefit |
11,244 |
|
|
4.38 |
% |
|
12,387 |
|
6.56 |
% |
|
43 |
|
|
0.12 |
% |
| Valuation allowance |
(700) |
|
|
(0.27) |
% |
|
(11,300) |
|
|
(5.99) |
% |
|
12,000 |
|
|
33.43 |
% |
| Amortization of qualified low-income housing investments |
7,503 |
|
|
2.92 |
% |
|
5,753 |
|
3.05 |
% |
|
4,977 |
|
|
13.86 |
% |
| Tax credits |
(7,300) |
|
|
(2.84) |
% |
|
(6,539) |
|
(3.46) |
% |
|
(7,085) |
|
|
(19.73) |
% |
| Tax-exempt income |
(10,298) |
|
|
(4.01) |
% |
|
(5,665) |
|
(3.00) |
% |
|
(4,091) |
|
|
(11.40) |
% |
| Other, net |
2,576 |
|
|
1.00 |
% |
|
(219) |
|
(0.12) |
% |
|
(220) |
|
|
(0.61) |
% |
| Actual income tax expense |
$ |
56,929 |
|
|
22.18 |
% |
|
$ |
34,047 |
|
18.04 |
% |
|
$ |
13,163 |
|
|
36.67 |
% |
Significant components of the Company’s deferred tax assets and deferred tax liabilities, which includes deferred tax assets and deferred tax liabilities included in discontinued operations, are presented below:
|
|
|
|
|
|
|
|
|
|
|
|
|
As of December 31, |
|
2022 |
|
2021 |
|
(In thousands) |
| Deferred tax assets: |
|
|
|
| Unrealized loss on available for sale securities |
$ |
254,502 |
|
|
$ |
17,370 |
|
| Allowance for loan losses |
43,686 |
|
|
30,335 |
|
| Cash flow hedges |
18,192 |
|
|
— |
|
| Leases |
17,447 |
|
|
25,389 |
|
| Charitable contribution limitation carryover |
12,273 |
|
|
18,278 |
|
| Investment losses |
7,918 |
|
|
10,680 |
|
| Accrued expenses |
6,294 |
|
|
6,888 |
|
| Fixed assets |
4,287 |
|
|
3,799 |
|
| Loan basis difference fair value adjustments |
4,009 |
|
|
3,949 |
|
| Employee benefits |
354 |
|
|
13,996 |
|
| PPP loans fee income |
58 |
|
|
2,967 |
|
| Other |
2,083 |
|
|
1,783 |
|
| Total deferred tax assets before valuation allowance |
371,103 |
|
|
135,434 |
|
| Valuation allowance |
— |
|
|
(700) |
|
| Total deferred tax assets |
371,103 |
|
|
134,734 |
|
| Deferred tax liabilities: |
|
|
|
| Amortization of intangibles |
17,565 |
|
|
17,339 |
|
| Lease obligation |
16,383 |
|
|
23,849 |
|
| Partnerships |
2,340 |
|
|
3,324 |
|
| Trading securities |
938 |
|
|
6,482 |
|
| Cash flow hedges |
— |
|
|
2,878 |
|
| Other |
2,229 |
|
|
4,327 |
|
| Total deferred tax liabilities |
39,455 |
|
|
58,199 |
|
| Net deferred income tax assets |
$ |
331,648 |
|
|
$ |
76,535 |
|
Significant components of the Company’s deferred tax assets and deferred tax liabilities, which are included in discontinued operations and which are included in the amounts presented in the table above, are presented below:
|
|
|
|
|
|
|
|
|
|
|
|
|
As of December 31, |
|
2022 |
|
2021 |
|
(In thousands) |
| Deferred tax assets: |
|
|
|
| Leases |
$ |
2,589 |
|
|
$ |
2,928 |
|
| Accrued expenses |
868 |
|
|
897 |
|
| Total deferred tax assets |
3,457 |
|
|
3,825 |
|
| Deferred tax liabilities: |
|
|
|
| Amortization of intangibles |
1,126 |
|
|
550 |
|
| Leases |
2,450 |
|
|
2,762 |
|
| Other |
196 |
|
|
67 |
|
| Total deferred tax liabilities |
3,772 |
|
|
3,379 |
|
| Net deferred income tax (liabilities) assets |
$ |
(315) |
|
|
$ |
446 |
|
The Company assesses the realizability of deferred tax assets and whether it is more likely than not that all or a portion of the deferred tax assets will be realized. The Company considers projections of future taxable income during the periods in which deferred tax assets and liabilities are scheduled to reverse. Additionally, in determining the availability of operating loss carrybacks and other tax attributes, both projected future taxable income and tax planning strategies are considered in making this assessment. As of December 31, 2020, the Company had established a valuation allowance of $12.0 million related to the $91.3 million stock donation and the $3.7 million cash contribution to the Eastern Bank Foundation. Based upon the level of available historical taxable income and projections for future taxable income over the periods for which the deferred tax assets are realizable, a release of $11.3 million was recorded during the year ended December 31, 2021. As of December 31, 2022, management made a similar determination and, accordingly, recorded a release of $0.7 million during the year then ended. As of December 31, 2022, management believes it is more likely than not that the Company will realize the entirety of its net deferred tax assets.
Management performed an evaluation of the Company’s uncertain tax positions as of December 31, 2022 and 2021 and determined that liabilities for unrecognized tax benefits of $6.0 million and $8.2 million, respectively, was needed related to state tax positions. The decrease was primarily due to a reversal of $2.3 million recognized during the year ended December 31, 2022.
The following table presents a reconciliation of the beginning and ending amount of unrecognized tax benefits:
|
|
|
|
|
|
|
|
|
|
|
|
|
|
|
|
|
For the Years Ended December 31, |
|
|
2022 |
|
2021 |
|
|
(In thousands) |
| Beginning |
|
$ |
7,923 |
|
|
$ |
— |
|
| Additions based on tax positions related to the current year |
|
— |
|
|
— |
|
| Additions for tax positions of prior years |
|
— |
|
|
7,923 |
|
| Reductions related to settlements with taxing authorities |
|
— |
|
|
— |
|
| Reductions as a result of a lapse of the applicable statute of limitations |
|
(2,141) |
|
|
— |
|
| Ending |
|
$ |
5,782 |
|
|
$ |
7,923 |
|
The amount that would reduce the effective tax rate, if recognized, is $6.0 million. The reduction in the effective tax rate is inclusive of the federal benefit for unrecognized state tax benefits, and accrued interest and penalties. The entire balance of unrecognized tax benefits, if recognized, would favorably affect the Company’s effective income tax rate. The Company recognizes penalties and accrued interest related to unrecognized tax benefits in tax expense. Accrued penalties and interest amounted to $1.5 million and $2.0 million at December 31, 2022 and 2021, respectively. The change in accrued penalties and interest for the current year impacted the Consolidated Statements of Income as a component of income tax expense by $0.5 million. During the year ended December 31, 2022, $2.1 million of unrecognized state tax benefits and $0.6 million of interest and penalties reversed upon expiration of the statute of limitations for the tax year to which the reserve was related.
Management anticipates that approximately $2.3 million of unrecognized state tax benefits and $0.7 million of interest and penalties will reverse in 2023 upon expiration of the statute of limitations for the tax year to which the reserve is related.
The Company had no net operating loss carryforwards for federal or state income tax purposes at December 31, 2022 and 2021, respectively.
At December 31, 2022, the Bank’s federal pre-1988 reserve, for which no federal income tax provision has been made, was approximately $20.8 million. Under current federal law, these reserves are subject to recapture into taxable income, should the Company make non-dividend distributions, make distributions in excess of earnings and profits retained, as defined, or cease to maintain a banking type charter. A deferred tax liability is not recognized for the base year amount unless it becomes apparent that those temporary differences will reverse into taxable income in the foreseeable future. No deferred tax liability has been established as these two events are not expected to occur in the foreseeable future.
The Company’s primary banking activities are in the states of Massachusetts, New Hampshire and Rhode Island; however, the Company also files additional state corporate income and/or franchise tax returns in states in which the Company has a filing requirement. The methods of filing, and the methods for calculating taxable and apportionable income, vary depending upon the laws of the taxing jurisdiction.
The Company is subject to routine audits of its tax returns by the Internal Revenue Service and various state taxing authorities. The Company is no longer subject to federal and state income tax examinations by tax authorities for years before 2019.
The Company invests in low-income affordable housing and renewable energy projects which provide the Company with tax benefits, including tax credits, generally over a period of approximately 5-15 years. When permissible, the Company accounts for its investments in Low Income Housing Tax Credit (“LIHTC”) projects using the proportional amortization method, under which it amortizes the initial cost of the investment in proportion to the amount of the tax credits and other tax benefits received and recognizes that amortization as a component of income tax expense. The net investment performance in the housing projects is included in other assets. The Company will continue to use the proportional amortization method on any new qualifying LIHTC investments. During the years ended December 31, 2022 and 2021, the Company generated federal tax credits primarily from LIHTC investments of $7.3 million and $6.5 million, respectively. During the years ended December 31, 2022 and 2021, the Company generated state tax credits from LIHTC investments of less than $0.1 million. The Company treats the investment tax credits received as a reduction of federal income taxes for the year in which the credit arises using the flow-through method (i.e., the credit flows directly through the statement of income in the year of purchase). For additional information on these investments, refer to Note 14, “Low Income Housing Tax Credits and Other Tax Credit Investments.”
13. Earnings Per Share (“EPS”)
Basic EPS represents income available to common shareholders divided by the weighted-average number of common shares outstanding during the year. Diluted EPS reflects the potential dilution that could occur if securities or other contracts to issue common shares (such as stock options) were exercised or converted into additional common shares that would then share in the earnings of the Company. Diluted EPS is computed by dividing net income attributable to common shareholders by the weighted-average number of common shares outstanding for the year, plus the effect of potential dilutive common share equivalents computed using the treasury stock method. There were no securities that had a dilutive effect during the year ended December 31, 2020. Shares held by the ESOP that have not been allocated or committed to be allocated to employees in accordance with the terms of the ESOP, referred to as “unallocated ESOP shares,” are not deemed outstanding for earnings per share calculations.
|
|
|
|
|
|
|
|
|
|
|
|
|
|
|
|
|
|
|
For the Year Ended December 31, |
|
2022 |
|
2021 |
|
2020 |
|
(Dollars in thousands, except per share data) |
| Net income applicable to common shares: |
|
|
|
|
|
| Net income from continuing operations |
$ |
186,511 |
|
|
$ |
145,531 |
|
|
$ |
8,861 |
|
| Net income from discontinued operations |
13,248 |
|
|
9,134 |
|
|
13,877 |
|
| Total net income |
$ |
199,759 |
|
|
$ |
154,665 |
|
|
$ |
22,738 |
|
|
|
|
|
|
|
| Average number of common shares outstanding |
179,529,613 |
|
|
186,713,020 |
|
|
186,663,593 |
|
| Less: Average unallocated ESOP shares |
(14,019,256) |
|
|
(14,520,684) |
|
|
(14,851,058) |
|
| Average number of common shares outstanding used to calculate basic earnings per common share |
165,510,357 |
|
172,192,336 |
|
171,812,535 |
|
| Common stock equivalents - restricted stock awards and units |
138,214 |
|
|
59,721 |
|
|
— |
|
| Average number of common shares outstanding used to calculate diluted earnings per common share |
165,648,571 |
|
172,252,057 |
|
171,812,535 |
|
|
|
|
|
|
|
| Basic earnings per share |
|
|
|
|
|
| Basic earnings per share from continuing operations |
$ |
1.13 |
|
|
$ |
0.85 |
|
|
$ |
0.05 |
|
| Basic earnings per share from discontinued operations |
0.08 |
|
|
0.05 |
|
|
0.08 |
|
| Basic earnings per share |
$ |
1.21 |
|
|
$ |
0.90 |
|
|
$ |
0.13 |
|
|
|
|
|
|
|
| Diluted earnings per share |
|
|
|
|
|
| Diluted earnings per share from continuing operations |
$ |
1.13 |
|
|
$ |
0.85 |
|
|
$ |
0.05 |
|
| Diluted earnings per share from discontinued operations |
0.08 |
|
|
0.05 |
|
|
0.08 |
|
| Diluted earnings per share |
$ |
1.21 |
|
|
$ |
0.90 |
|
|
$ |
0.13 |
|
14. Low Income Housing Tax Credits and Other Tax Credit Investments
The Community Reinvestment Act (“CRA”) encourages banks to meet the credit needs of their communities for housing and other purposes, particularly in neighborhoods with low or moderate income. The Company has primarily invested in separate LIHTC projects, also referred to as qualified affordable housing projects, which provide the Company with tax credits and operating loss tax benefits over a period of 15 years. The return on these investments is generally generated through tax credits and tax losses. In addition to LIHTC projects, the Company invests in new market tax credit projects that qualify for CRA credits and eligible projects that qualify for renewable energy and historic tax credits.
As of December 31, 2022 and 2021, the Company had $131.3 million and $83.8 million, respectively, in tax credit investments that were included in other assets in the Consolidated Balance Sheets.
When permissible, the Company accounts for its investments in LIHTC projects using the proportional amortization method, under which it amortizes the initial cost of the investment in proportion to the amount of the tax credits and other tax benefits received and recognizes that amortization as a component of income tax expense. The net investment in the housing projects is included in other assets in the Consolidated Balance Sheets. The Company will continue to use the proportional amortization method on any new qualifying LIHTC investments.
The following table presents the Company’s investments in LIHTC projects using the proportional amortization method as of the dates indicated:
|
|
|
|
|
|
|
|
|
|
|
|
|
As of December 31, |
|
2022 |
|
2021 |
|
(In thousands) |
| Current recorded investment included in other assets |
$ |
128,765 |
|
|
$ |
81,035 |
|
Commitments to fund qualified affordable housing projects included in recorded investment noted above |
84,145 |
|
|
48,399 |
|
The following table presents additional information related to the Company’s investments in LIHTC projects for the periods indicated:
|
|
|
|
|
|
|
|
|
|
|
|
|
|
|
|
|
|
|
For the Year Ended December 31, |
|
2022 |
|
2021 |
|
2020 |
|
(In thousands) |
| Tax credits and other tax benefits recognized |
$ |
9,146 |
|
|
$ |
6,484 |
|
|
$ |
5,033 |
|
Amortization expense included in income tax expense |
7,503 |
|
|
5,753 |
|
|
4,977 |
|
The Company accounts for certain other investments in renewable energy projects using the equity method of accounting. These investments in renewable energy projects are included in other assets on the Consolidated Balance Sheets and totaled $2.6 million and $2.8 million at December 31, 2022 and 2021, respectively. There were no outstanding commitments related to these investments as of both December 31, 2022 and December 31, 2021.
During the year ended December 31, 2020, in reviewing its tax credit equity investments for impairment, the Company identified an immaterial correction to the investment balances related to prior periods. During the year ended December 31, 2020, the Company wrote off $7.6 million of the tax credit equity investment balances as a component of noninterest expense and other assets to reflect the remaining benefits from these investments. Management evaluated the correction in relation to the year ended December 31, 2020, which is when the correction was recorded, as well as the preceding periods in which it originated. Management believes this correction is immaterial to both the previous consolidated quarterly and annual financial statements. During the years ended December 31, 2022 and 2021, the Company performed a similar review and, accordingly, recorded a net recovery of an impairment of $0.2 million during the year ended December 31, 2021. Management evaluated the correction in relation to such periods during which the correction was recorded, as well as the preceding periods in which it originated. Management believes the correction is immaterial to the previous consolidated quarterly and annual financial statements. The Company did not record any net recovery or a write-down related to impairment of tax credit equity investment balances during the year ended December 31, 2022.
15. Shareholders’ Equity
Share Repurchases
On November 12, 2021, the Company announced receipt of a notice of non-objection from the Board of Governors of the Federal Reserve System to its previously announced share repurchase program which was approved by the Company’s Board of Directors on October 1, 2021. The program authorized the purchase of up to 9,337,900 shares, or 5% of the Company’s then-outstanding shares of common stock over a 12-month period. The program was limited to $225.0 million through November 30, 2022. The Company completed the repurchase of the total number of shares authorized through this program during the third quarter of 2022.
On September 7, 2022, the Company announced receipt of a notice of non-objection from the Board of Governors of the Federal Reserve System for a new share repurchase program. The program, which authorizes the purchase of up to 8,900,000 shares, or 5% of the Company’s then-outstanding shares of common stock over a 12-month period, is limited to $200.0 million through August 31, 2023.
Repurchases are made at management’s discretion from time to time at prices management considers to be attractive and in the best interests of both the Company and its shareholders, subject to the availability of shares, general market conditions, the trading price of the shares, alternative uses for capital, and the Company’s financial performance. Repurchases may be suspended, terminated or modified by the Company at any time for any reason.
Information regarding the shares repurchased under the plans is presented in the following table:
|
|
|
|
|
|
|
|
|
|
|
|
|
|
|
|
|
|
|
|
|
|
|
|
| Period |
Total Number of Shares Repurchased |
|
Average Price Paid per Share |
|
Total Number of Shares Repurchased as Part of the Share Repurchase Programs |
|
Maximum Number of Shares That May Yet Be Purchased Under the Share Repurchase Programs |
| December 1, 2021 - December 31, 2021 |
1,135,878 |
|
$ |
20.42 |
|
|
1,135,878 |
|
8,202,022 |
January 1, 2022 – January 31, 2022 |
987,526 |
|
21.02 |
|
|
2,123,404 |
|
7,214,496 |
February 1, 2022 – February 28, 2022 |
1,109,697 |
|
21.08 |
|
|
3,233,101 |
|
6,104,799 |
March 1, 2022 – March 31, 2022 |
769,398 |
|
21.31 |
|
|
4,002,499 |
|
5,335,401 |
| April 1, 2022 - April 30, 2022 |
1,194,185 |
|
20.19 |
|
|
5,196,684 |
|
|
4,141,216 |
|
| May 1, 2022 - May 31, 2022 |
1,880,381 |
|
18.93 |
|
|
7,077,065 |
|
|
2,260,835 |
|
| June 1, 2022 - June 30, 2022 |
1,141,903 |
|
18.78 |
|
|
8,218,968 |
|
|
1,118,932 |
|
| July 1, 2022 - July 31, 2022 |
909,785 |
|
|
19.02 |
|
|
9,128,753 |
|
|
209,147 |
|
| August 1, 2022 - August 31, 2022 |
0 |
|
|
— |
|
|
9,128,753 |
|
|
209,147 |
|
| September 1, 2022 - September 30, 2022 |
571,463 |
|
|
20.33 |
|
|
9,700,216 |
|
|
8,537,684 |
|
| October 1, 2022 - October 31, 2022 |
1,094,049 |
|
|
20.32 |
|
|
10,794,265 |
|
|
7,443,635 |
|
| November 1, 2022 - November 30, 2022 |
453,885 |
|
|
18.91 |
|
|
11,248,150 |
|
|
6,989,750 |
|
| December 1, 2022 – December 31, 2022 |
0 |
|
|
— |
|
|
11,248,150 |
|
|
6,989,750 |
|
Dividends
Information regarding dividends declared and paid is presented in the following table:
|
|
|
|
|
|
|
|
|
|
|
|
|
|
|
|
|
|
|
Dividends Declared per Share |
|
Dividends Declared |
|
Dividends Paid |
|
(In millions, except per share data) |
| Three Months Ended March 31, 2022 |
$ |
0.10 |
|
|
$ |
17.1 |
|
|
$ |
16.9 |
|
| Three Months Ended June 30, 2022 |
$ |
0.10 |
|
|
$ |
16.7 |
|
|
$ |
16.5 |
|
| Three Months Ended September 30, 2022 |
$ |
0.10 |
|
|
$ |
16.5 |
|
|
$ |
16.3 |
|
| Three Months Ended December 31, 2022 |
$ |
0.10 |
|
|
$ |
16.3 |
|
|
$ |
16.1 |
|
|
|
|
|
|
|
| Three Months Ended March 31, 2021 |
$ |
0.06 |
|
|
$ |
10.3 |
|
|
$ |
10.3 |
|
| Three Months Ended June 30, 2021 |
$ |
0.08 |
|
|
$ |
13.8 |
|
|
$ |
13.8 |
|
| Three Months Ended September 30, 2021 |
$ |
0.08 |
|
|
$ |
13.8 |
|
|
$ |
13.8 |
|
| Three Months Ended December 31, 2021 |
$ |
0.08 |
|
|
$ |
13.7 |
|
|
$ |
13.7 |
|
16. Minimum Regulatory Capital Requirements
The Company is subject to various regulatory capital requirements administered by federal banking agencies, including U.S. Basel III. Failure to meet minimum capital requirements can initiate certain mandatory, and possibly additional discretionary, actions by regulators that, if undertaken, could have a direct material effect on the Company’s Consolidated Financial Statements. Under capital adequacy guidelines and the regulatory framework for prompt corrective action, the Company must meet specific capital guidelines that involve quantitative measures of the Company’s assets, liabilities, and certain off-balance sheet items as calculated under regulatory accounting practices. The Company’s capital amounts and classification are also subject to qualitative judgements by the regulators about components, risk weightings, and other factors.
Quantitative measures established by the regulators to ensure capital adequacy require the Company to maintain minimum capital amounts and ratios. All banking companies are required to have total regulatory capital of at least 8% of risk-weighted assets, common equity Tier 1 capital of at least 4.5% of risk-weighted assets, core capital (“Tier 1”) of at least 6% of risk-weighted assets, and a minimum Tier 1 leverage ratio of 4% of adjusted average assets.
As of December 31, 2022 and 2021, the Company was categorized as “well-capitalized” based on the regulatory framework for prompt corrective action. To be categorized as well-capitalized, the Company must maintain (1) a minimum total regulatory capital ratio of 10%; (2) a minimum common equity Tier 1 capital ratio of 6.5%; (3) a minimum Tier 1 capital ratio of 8% and (4) a minimum Tier 1 leverage ratio of 5%.
Management believes that the Company met all capital adequacy requirements to which it is subject as of December 31, 2022 and 2021. There have been no conditions or events that management believes would cause a change in the Company’s categorization.
The Company’s actual capital amounts and ratios are presented in the following table:
|
|
|
|
|
|
|
|
|
|
|
|
|
|
|
|
|
|
|
|
|
|
|
|
|
|
|
|
|
|
|
|
|
|
|
|
|
|
|
|
|
|
|
|
|
|
Actual |
|
For Capital Adequacy |
|
To Be Well-
Capitalized Under Prompt Corrective Action Provisions |
|
Amount |
|
Ratio |
|
Amount |
|
Ratio |
|
Amount |
|
Ratio |
|
(Dollars in thousands) |
| As of December 31, 2022 |
|
|
|
|
|
|
|
|
|
|
|
|
|
|
| Total regulatory capital (to risk-weighted assets) |
$ |
2,906,742 |
|
|
17.89 |
% |
|
$ |
1,299,657 |
|
|
≥8 |
% |
|
$ |
1,624,571 |
|
|
≥10 |
% |
| Common equity Tier 1 capital (to risk-weighted assets) |
2,751,694 |
|
|
16.94 |
|
|
731,057 |
|
|
≥4.5 |
|
|
1,055,971 |
|
|
≥6.5 |
|
| Tier 1 capital (to risk-weighted assets) |
2,751,694 |
|
|
16.94 |
|
|
974,743 |
|
|
≥6 |
|
|
1,299,657 |
|
|
≥8 |
|
| Tier 1 capital (to average assets) leverage |
2,751,694 |
|
|
12.03 |
|
|
915,233 |
|
|
≥4 |
|
|
1,144,041 |
|
|
≥5 |
|
| As of December 31, 2021 |
|
|
|
|
|
|
|
|
|
|
|
|
|
|
| Total regulatory capital (to risk-weighted assets) |
$ |
2,939,016 |
|
|
19.77 |
% |
|
$ |
1,189,466 |
|
|
>8 |
% |
|
$ |
1,486,832 |
|
|
>10 |
% |
| Common equity Tier 1 capital (to risk-weighted assets) |
2,831,102 |
|
|
19.04 |
|
|
669,075 |
|
|
4.5 |
|
|
966,441 |
|
|
6.5 |
|
| Tier 1 capital (to risk-weighted assets) |
2,831,102 |
|
|
19.04 |
|
|
892,099 |
|
|
6 |
|
|
1,189,466 |
|
|
8 |
|
| Tier 1 capital (to average assets) leverage |
2,831,102 |
|
|
13.96 |
|
|
811,000 |
|
|
4 |
|
|
1,013,750 |
|
|
5 |
|
The Company is subject to various capital requirements in connection with seller/servicer agreements that have been entered into with secondary market investors. Failure to maintain minimum capital requirements could result in an inability to originate and service loans for the respective investor and, therefore, could have a direct material effect on the Company’s financial statements. Management believes that the Company met all capital requirements in connection with seller/servicer agreements as of December 31, 2022 and 2021.
17. Employee Benefits
Conversion of Defined Benefit Pension Plan and Benefit Equalization Plan to Cash Balance Plan Design
Effective November 1, 2020, each of the Qualified Defined Benefit Pension Plan (“Defined Benefit Plan”) and the Non-Qualified Benefit Equalization Plan, referred to as the BEP, sponsored by the Company were amended to convert the plans from a traditional final average earnings plan design to a cash balance plan design. Benefits earned under the final average earnings plan design were frozen at October 31, 2020. Starting November 1, 2020, future benefits are earned under the cash balance plan design. Under the cash balance plan design, hypothetical account balances are established for each participant and pension benefits are generally stated as the lump sum amount in that hypothetical account. Contribution credits equal to a percentage of a participant’s annual compensation (if the participant works at least 1,000 hours during the year) and interest credits equal to the greater of the 30-Year Treasury rate for September preceding the current plan year or 3.5% are added to a participant’s account each year. For employees hired prior to November 1, 2020, annual contribution credits generally increase as the participant remains employed with the Company. Employees hired on and after November 1, 2020 receive annual contribution credits equal to 5% of annual compensation, with no future increases. Notwithstanding the preceding sentence, since a cash balance plan is a defined benefit plan, the annual retirement benefit payable at normal retirement (age 65) is an annuity, which is the actuarial equivalent of the participant’s account balance under the cash balance plan design, plus their frozen benefit under the final average earnings plan design. However, under the Defined Benefit Plan, participants may elect, with the consent of their spouses if they are married, to have the benefits distributed as a lump sum rather than an annuity. The lump sum is equal to the sum of the actuarial equivalent of their frozen benefit under the final average earnings plan design, plus their cash balance account. Under the BEP, benefits are generally only payable as a lump sum, which is equal to the sum of the actuarial equivalent of their frozen benefit under the final average earnings plan design, plus their cash balance account.
Pension Plans
The Company provides pension benefits for its employees using a noncontributory, qualified defined benefit plan, through membership in the Savings Banks Employees Retirement Association (“SBERA”). The Company’s employees become eligible after attaining age 21 and completing one year of service. Under the final average earnings plan design, benefits became fully vested after three years of eligible service for individuals employed on or before October 31, 1989. For individuals employed subsequent to October 31, 1989 and who were already in the Defined Benefit Plan as of November 1, 2020, benefits became fully vested after five years of eligible service. Under the new cash balance plan design and for employees who were not already in the Defined Benefit Plan as of November 1, 2020, benefits become fully vested after three years of eligible service. The Company’s annual contribution to the plan is based upon standards established by the Pension Protection Act. The contribution is based on an actuarial method intended to provide not only for benefits attributable to service to date, but also for those expected to be earned in the future. SBERA offers a common and collective trust as the underlying investment structure for pension plans participating in the association. The target allocation mix for the common and collective trust portfolio calls for an equity-based investment deployment range of 49% to 63% of total common and collective trust portfolio assets. The remainder of the common and collective trust’s portfolio is allocated to fixed income securities with a target range of 28% to 42% and other investments, including global asset allocation and hedge funds, from 3% to 15%. The Trustees of SBERA, through the Association’s Investment Committee, select investment managers for the common and collective trust portfolio. A professional investment advisory firm is retained by the Investment Committee to provide allocation analysis, performance measurement and to assist with manager searches. The overall investment objective is to diversify investments across a spectrum of investment types to limit risks from large market swings. The Defined Benefit Plan has a plan year end of October 31.
In connection with the Company’s acquisition of Century during the year ended December 31, 2021, the Company acquired Century’s Qualified Defined Benefit Pension Plan. At the time of the acquisition, the plan was frozen to new participants, which had occurred in 2006, and all participants in the plan were fully vested. Additionally, all Century employees retained following the acquisition were eligible to join the Company’s Defined Benefit Plan to the extent that eligibility requirements were satisfied based upon such employees’ prior service with Century.
The Company has an unfunded Defined Benefit Supplemental Executive Retirement Plan (“DB SERP”) that provides certain retired officers with defined pension benefits in excess of qualified plan limits imposed by U.S. federal tax law. The DB SERP has a plan year end of December 31. In connection with the Company’s acquisition of Century, the Company acquired Century’s Supplemental Executive Insurance/Retirement Plan (the “Supplemental Plan”). Upon completion of the acquisition, the Supplemental Plan was merged for accounting purposes only into the Company’s DB SERP, but it continues to be administered according to its terms. Further, the plan document of the Century Supplemental Plan contained change in control provisions which became effective upon the Company’s acquisition of Century. Accordingly, all participants of the Century Supplemental Plan were deemed to be fully vested upon the closing of the acquisition.
The Company has an unfunded Benefit Equalization Plan (“BEP”) to provide retirement benefits to certain employees whose retirement benefits under the Defined Benefit Plan are limited per the Internal Revenue Code. The BEP has a plan year end of October 31. In connection with the Company’s acquisition of Century, any Century employee retained following the acquisition and whose retirement benefits under the Defined Benefit Plan are limited per the Internal Revenue Code were added to the BEP. Additionally, such Century employees were credited for prior service with Century for purposes of determining vesting and eligibility pursuant to the BEP.
The Company also has an unfunded Outside Directors’ Retainer Continuance Plan (“ODRCP”) that provides pension benefits to outside directors who retire from service. The ODRCP has a plan year end of December 31. Effective December 31, 2020, the Company closed the ODRCP to new participants and froze benefit accruals for active participants.
Obligations and Funded Status
The funded status and amounts recognized in the Company’s Consolidated Financial Statements for the Defined Benefit Plan, the DB SERP, the BEP and the ODRCP are set forth in the following table:
|
|
|
|
|
|
|
|
|
|
|
|
|
|
|
|
|
|
|
As of and for the Year Ended December 31, |
|
2022 |
|
2021 |
|
2020 |
|
(In thousands) |
| Change in benefit obligation: |
|
|
|
|
|
| Benefit obligation at beginning of the year |
$ |
501,507 |
|
|
$ |
361,147 |
|
|
$ |
396,769 |
|
| Service cost (1) |
31,382 |
|
|
31,660 |
|
|
25,970 |
|
| Interest cost |
10,582 |
|
|
5,694 |
|
|
9,657 |
|
| Amendments |
— |
|
|
(1,106) |
|
|
(133,439) |
|
| Actuarial (gain) loss |
(133,282) |
|
|
(1,697) |
|
|
78,095 |
|
| Acquisitions |
— |
|
|
125,854 |
|
|
— |
|
| Benefits paid |
(47,659) |
|
|
(20,045) |
|
|
(15,905) |
|
| Benefit obligation at end of the year |
$ |
362,530 |
|
|
$ |
501,507 |
|
|
$ |
361,147 |
|
|
|
|
|
|
|
| Change in plan assets: |
|
|
|
|
|
| Fair value of plan assets at beginning of year |
$ |
546,056 |
|
|
$ |
449,643 |
|
|
$ |
378,879 |
|
| Actual return on plan assets |
(91,474) |
|
|
50,879 |
|
|
48,895 |
|
| Acquisitions |
— |
|
|
63,468 |
|
|
— |
|
| Employer contribution |
12,443 |
|
|
2,111 |
|
|
37,773 |
|
| Benefits paid |
(47,659) |
|
|
(20,045) |
|
|
(15,904) |
|
| Fair value of plan assets at end of year |
419,366 |
|
|
546,056 |
|
|
449,643 |
|
| Overfunded status |
$ |
56,836 |
|
|
$ |
44,549 |
|
|
$ |
88,496 |
|
|
|
|
|
|
|
| Reconciliation of funding status: |
|
|
|
|
|
| Past service credit |
$ |
108,909 |
|
|
$ |
120,792 |
|
|
$ |
131,482 |
|
| Unrecognized net loss |
(99,002) |
|
|
(128,402) |
|
|
(161,045) |
|
| Prepaid benefit cost |
46,929 |
|
|
52,159 |
|
|
118,059 |
|
| Overfunded status |
$ |
56,836 |
|
|
$ |
44,549 |
|
|
$ |
88,496 |
|
|
|
|
|
|
|
| Accumulated benefit obligation |
$ |
362,530 |
|
|
$ |
501,507 |
|
|
$ |
361,147 |
|
|
|
|
|
|
|
| Amounts recognized in accumulated other comprehensive income (“AOCI”), net of tax: |
|
|
|
|
|
| Unrecognized past service credit |
$ |
78,295 |
|
|
$ |
86,837 |
|
|
$ |
94,522 |
|
| Unrecognized net loss |
(71,172) |
|
|
(92,308) |
|
|
(115,775) |
|
| Net amount |
$ |
7,123 |
|
|
$ |
(5,471) |
|
|
$ |
(21,253) |
|
(1)Includes service costs related to employees of our insurance agency business. Refer to the later discussion within the “Components of Net Periodic Benefit Cost” section within this Note for further discussion.
In accordance with the Pension Protection Act, the Company was not required to make any contributions to the Defined Benefit Plan for the plan year beginning November 1, 2021. However, the Company made a discretionary contribution to the Defined Benefit Plan of $7.2 million during the year ended December 31, 2022. Similarly, in accordance with the Pension Protection Act, the Company was not required to make any contributions to the Defined Benefit Plan for the plan year beginning November 1, 2020. Accordingly, during the year ended December 31, 2021, there were no contributions to the Defined Benefit Plan. The Company expects to make no contribution during the plan year beginning November 1, 2022.
The net actuarial gain of $133.3 million during the year ended December 31, 2022 was primarily attributable to an increase in the discount rate assumptions used for determining the benefit obligation which was partially offset by lower returns on plan assets than initially expected. The net actuarial gain of $1.7 million during the year ended December 31, 2021 was primarily attributable to higher returns on plan assets than initially expected and an increase in the discount rate assumptions which were partially offset by changes in demographic assumptions and in the participant mortality rate assumption. The net actuarial loss of $78.1 million during the year ended December 31, 2020 was primarily attributable to a decrease in the discount rate assumptions used for determining the benefit obligation in that year from the corresponding prior year.
Actuarial Assumptions
The assumptions used in determining the benefit obligations at December 31, 2022 and 2021 were as follows:
|
|
|
|
|
|
|
|
|
|
|
|
|
|
|
|
|
|
|
|
|
|
|
|
|
|
|
|
|
|
|
|
|
|
|
|
|
|
|
|
|
|
|
|
|
|
|
|
|
DB Plan |
|
BEP |
|
DB SERP |
|
ODRCP |
|
As of December 31, |
|
As of December 31, |
|
As of December 31, |
|
As of December 31, |
|
2022 |
|
2021 |
|
2022 |
|
2021 |
|
2022 |
|
2021 |
|
2022 |
|
2021 |
| Discount rate |
5.18 |
% |
|
2.65 |
% |
|
5.07 |
% |
|
2.32 |
% |
|
5.18 |
% |
|
2.68 |
% |
|
5.13 |
% |
|
2.32 |
% |
| Rate of increase in compensation levels |
4.50 |
% |
|
4.50 |
% |
|
4.50 |
% |
|
4.50 |
% |
|
— |
% |
|
— |
% |
|
— |
% |
|
— |
% |
| Interest rate credit for determining projected cash balance |
3.55 |
% |
|
3.50 |
% |
|
3.55 |
% |
|
3.50 |
% |
|
— |
% |
|
— |
% |
|
— |
% |
|
— |
% |
The assumptions used in determining the net periodic benefit cost for the years ended December 31, 2022, 2021, and 2020 were as follows:
|
|
|
|
|
|
|
|
|
|
|
|
|
|
|
|
|
|
|
DB Plan |
|
For the Year Ended December 31, |
|
2022 |
|
2021 |
|
2020 |
| Discount rate - benefit cost |
2.65 |
% |
|
2.26 |
% |
|
3.16 |
% |
| Rate of compensation increase |
4.50 |
% |
|
5.25 |
% |
|
5.25 |
% |
| Expected rate of return on plan assets |
7.00 |
% |
|
7.50 |
% |
|
7.50 |
% |
| Interest rate credit for determining projected cash balance |
3.50 |
% |
|
3.50 |
% |
|
3.50 |
% |
|
|
|
|
|
|
|
|
|
|
|
|
|
|
|
|
|
|
|
BEP |
|
For the Year Ended December 31, |
|
2022 |
|
2021 |
|
2020 |
| Discount rate - benefit cost |
2.32 |
% |
|
1.77 |
% |
|
3.15 |
% |
| Rate of compensation increase |
4.50 |
% |
|
5.25 |
% |
|
5.25 |
% |
| Interest rate credit for determining projected cash balance |
3.50 |
% |
|
3.50 |
% |
|
3.50 |
% |
|
|
|
|
|
|
|
|
|
|
|
|
|
|
|
|
|
|
|
DB SERP |
|
For the Year Ended December 31, |
|
2022 |
|
2021 |
|
2020 |
| Discount rate - benefit cost |
2.68 |
% |
|
1.63 |
% |
|
2.72 |
% |
|
|
|
|
|
|
|
|
|
|
|
|
|
|
|
|
|
|
|
ODRCP |
|
For the Year Ended December 31, |
|
2022 |
|
2021 |
|
2020 |
| Discount rate - benefit cost |
2.32 |
% |
|
1.81 |
% |
|
2.86 |
% |
| Rate of compensation increase |
— |
% |
|
— |
% |
|
3.00 |
% |
In general, the Company has selected its assumptions with respect to the expected long-term rate of return based on prevailing yields on high quality fixed income investments increased by a premium for equity return expectations.
To determine the discount rate used in calculating the benefit obligation and the benefit cost for all of its defined benefit plans, the Company uses the spot rate approach whereby the individual spot rates on the FTSE above-median yield curve are applied to each corresponding year’s projected cash flow used to measure the respective plan’s service cost and interest cost.
Plan Assets
The Company owns a percentage of the SBERA defined benefit common collective trust. Based upon this ownership percentage, plan assets managed by SBERA on behalf of the Company amounted to $419.4 million and $546.1 million at December 31, 2022 and 2021, respectively. Investments held by the common collective trust include Level 1, 2 and 3 assets such as: collective funds, equity securities, mutual funds, hedge funds and short-term investments. The Fair Value Measurements and Disclosures Topic of the FASB ASC stipulates that an asset’s fair value measurement level within the fair value hierarchy is based on the lowest level of any input that is significant to the fair value measurement. As such, the Company classifies its interest in the common collective trust as a Level 3 asset.
The table below presents a reconciliation of the Company’s interest in the SBERA common collective trust during the years indicated:
|
|
|
|
|
|
|
|
|
|
|
|
|
For the Year Ended December 31, |
|
2022 |
|
2021 |
|
(In thousands) |
| Balance at beginning of year |
$ |
546,056 |
|
|
$ |
449,643 |
|
| Net realized and unrealized gains and (losses) |
(91,474) |
|
|
50,878 |
|
| Contributions |
7,222 |
|
|
— |
|
| Benefits paid |
(42,438) |
|
|
(17,934) |
|
| Acquisition |
— |
|
|
63,469 |
|
| Balance at end of year |
$ |
419,366 |
|
|
$ |
546,056 |
|
Components of Net Periodic Benefit Cost
The components of net pension expense for the plans for the periods indicated are as follows:
|
|
|
|
|
|
|
|
|
|
|
|
|
|
|
|
|
|
|
For the Year Ended December 31, |
|
2022 |
|
2021 |
|
2020 |
|
(In thousands) |
| Components of net periodic benefit cost: |
|
|
|
|
|
| Service cost (1) |
$ |
31,382 |
|
|
$ |
31,660 |
|
|
$ |
25,970 |
|
| Interest cost |
10,582 |
|
|
5,694 |
|
|
9,657 |
|
| Expected return on plan assets |
(35,486) |
|
|
(33,333) |
|
|
(29,610) |
|
| Past service credit |
(11,882) |
|
|
(11,796) |
|
|
(1,931) |
|
| Recognized net actuarial loss |
11,032 |
|
|
13,400 |
|
|
10,787 |
|
| Settlements |
12,045 |
|
|
— |
|
|
— |
|
| Net periodic benefit cost |
$ |
17,673 |
|
|
$ |
5,625 |
|
|
$ |
14,873 |
|
(1)Includes service costs related to employees of our insurance agency business. Such service costs were included in net income from discontinued operations as such costs will not continue to be incurred by the Company following the sale of the insurance agency business. All other costs included in the determination of the benefit obligation for the Defined Benefit Plan and the BEP were included in net income from continuing operations as the Bank will assume the related liability upon dissolution of Eastern Insurance Group following the sale of the insurance agency business. Service costs included in net income from discontinued operations and included in the above table were $7.5 million, $7.7 million, and $6.2 million for the years ended December 31, 2022, 2021, and 2020, respectively.
Except as noted above, service costs for the Defined Benefit Plan, the BEP, and the DB SERP are recognized within salaries and employee benefits in the consolidated statement of income. Service costs for the ODRCP are recognized within professional services in the consolidated statement of income. The remaining components of net periodic benefit cost are recognized in other noninterest expense in the consolidated statement of income.
Pension Settlement
As a practical expedient, ASC 715, “Compensation–Retirement Benefits,” permits employers to not apply pension plan settlement accounting and to treat settlement transactions as normal benefit payments if the cost of all settlements in the year is less than or equal to the sum of the service cost and interest cost components of net periodic benefit cost. The Company has elected this practical expedient.
During the year ended December 31, 2022, lump sum payments from the Defined Benefit Plan exceeded the sum of the service cost and interest cost components (the “threshold”) of the Defined Benefit Plan’s net periodic pension cost. ASC 715-20, “Compensation-Retirement Benefits - Defined Benefit Plans,” requires that upon determining it is probable that such threshold will be met, an entity shall immediately recognize in earnings a pro rata portion of the aggregate unamortized gain or loss (e.g., “non-cash settlement charge”). In accordance with the applicable accounting guidance, the Company elected to apply a practical expedient to remeasure the plan assets and obligations as of the nearest month-end date upon the triggering of the previously mentioned threshold. Accordingly, the Company performed a remeasurement as of October 31, 2022 and, subsequently, as of December 31, 2022. The Company determined, with assistance from its actuaries, the amount of the resulting non-cash settlement charge to be a loss of $12.0 million which was recorded in other noninterest expense in the consolidated statement of income.
Benefits expected to be paid
The following table summarizes estimated benefits to be paid from the Defined Benefit Plan and BEP for the plan years beginning on November 1, and the DB SERP and ODRCP for the plan years beginning January 1:
|
|
|
|
|
|
| Year |
(In thousands) |
| 2023 |
$ |
45,367 |
|
| 2024 |
34,286 |
|
| 2025 |
37,454 |
|
| 2026 |
38,296 |
|
| 2027 |
37,915 |
|
| In aggregate for 2028-2032 |
202,187 |
|
Employee Tax Deferred Incentive Plan
The Company has an employee tax deferred incentive plan, otherwise known as a 401(k) plan, under which the Company makes voluntary contributions within certain limitations. All employees who meet specified age and length of service requirements are eligible to participate in the 401(k) plan. The amount contributed by the Company is included in salaries and employee benefits expense. The amounts contributed to the plan for the years ended December 31, 2022, 2021, and 2020, were $5.0 million, $4.6 million and $4.4 million, respectively.
Employee Stock Ownership Plan
As part of the IPO completed on October 14, 2020, the Company established a tax-qualified Employee Stock Ownership Plan to provide eligible employees the opportunity to own Company shares. The ESOP borrowed $149.4 million from the Company to purchase 14,940,652 common shares during the IPO and in the open market. The loan is payable in annual installments over 30 years at an interest rate equal to the Prime rate as published in the The Wall Street Journal. As the loan is repaid to the Company, shares are released and allocated proportionally to eligible participants on the basis of each participant’s proportional share of compensation relative to the compensation of all participants. The unallocated ESOP shares are pledged as collateral on the loan.
The Company accounts for its ESOP in accordance with FASB ASC 718-40, "Compensation – Stock Compensation". Under this guidance, unreleased shares are deducted from shareholders’ equity as unearned ESOP shares in the accompanying Consolidated Balance Sheets. The Company recognizes compensation expense equal to the fair value of the ESOP shares during the periods in which they are committed to be released. To the extent that the fair value of the Company’s ESOP shares differs from the cost of such shares, the difference will be credited or debited to equity. As the loan is internally leveraged, the loan receivable from the ESOP to the Company is not reported as an asset nor is the debt of the ESOP shown as a liability in the Company’s Consolidated Balance Sheets. Dividends on unallocated shares are used to pay the ESOP debt.
Total compensation expense recognized in connection with the ESOP was $9.9 million for the year ended December 31, 2022, compared to $9.4 million and $2.4 million recognized during the years ended December 31, 2021 and 2020, respectively. The ESOP made a loan payment during the year ended December 31, 2022 of $7.9 million, of which $3.2 million was allocated to the principal portion of the payment and $4.7 million was allocated to the interest portion of the payment. The ESOP made a loan payment during the year ended December 31, 2021 of $7.9 million, of which $3.0 million was allocated to the principal portion of the payment and $4.9 million was allocated to the interest portion of the payment.
The ESOP made an upfront principal payment of $1.0 million on the loan during year ended year ended December 31, 2020 which resulted in the release and allocation of 63,690 shares and compensation expense of $0.9 million. The Company recorded additional compensation expense of $1.5 million related to the accrual of the loan payment during the year ended December 31, 2020.
The number of shares committed to be released per year is 501,426 through 2049 and 231,124 in the year 2050.
The following table presents share information held by the ESOP:
|
|
|
|
|
|
|
|
|
|
|
|
|
As of December 31, |
|
2022 |
|
2021 |
|
(Dollars in thousands) |
| Allocated shares |
1,046,850 |
|
565,134 |
|
| Shares committed to be released |
104,464 |
|
104,464 |
|
| Unallocated shares (suspense shares) |
13,769,628 |
|
14,271,054 |
|
| Total shares |
14,920,942 |
|
14,940,652 |
|
| Fair value of unallocated shares |
$ |
237,526 |
|
|
$ |
287,847 |
|
Defined Contribution Supplemental Executive Retirement Plan
The Company’s DC SERP, a defined contribution supplemental executive retirement plan, allows certain senior officers to earn benefits calculated as a percentage of their compensation. The participant benefits are adjusted based upon a deemed investment performance of measurement funds selected by the participant. These measurement funds are for tracking purposes and are used only to track the performance of a mutual fund, market index, savings instrument, or other designated investment or portfolio of investments. The Company recorded expense related to the DC SERP of $0.4 million, $0.9 million and $0.9 million in the years ended December 31, 2022, 2021, and 2020, respectively. The total amount due to participants under this plan was included in other liabilities on the Company’s balance sheets and amounted to $17.3 million and $33.4 million at December 31, 2022 and 2021, respectively. Effective December 31, 2021, the Company closed the DC SERP to new participants and froze benefit accruals for active participants.
Deferred Compensation Plans
The Company sponsors three plans which allow for elective compensation deferrals by directors, former trustees, and certain senior-level employees. Each plan allows its participants to designate deemed investments for deferred amounts from certain options which include diversified choices, such as exchange traded funds and mutual funds. Portfolios with various risk profiles are available to participants with the approval of the Compensation Committee of the Board of Directors. The Company purchases and sells investments which track the deemed investment choices, so that it has available funds to meet its payment liabilities. Deferred amounts, adjusted for deemed investment performance, are paid at the time of a participant designated date or event, such as separation from service, death, or disability. The total amounts due to participants under the three plans were included in other liabilities on the Company’s Consolidated Balance Sheets and amounted to $25.4 million and $31.5 million at December 31, 2022 and 2021, respectively.
Rabbi Trust Variable Interest Entity
The Company established rabbi trusts to meet its obligations under certain executive non-qualified retirement benefits and deferred compensation plans and to mitigate the expense volatility of the aforementioned retirement plans. The rabbi trusts are considered a VIEs as the equity investment at risk is insufficient to permit the trusts to finance their activities without additional subordinated financial support from the Company. The Company is considered the primary beneficiary of the rabbi trusts as it has the power to direct the activities of the rabbi trusts that significantly affect the rabbi trusts’ economic performance and it has the obligation to absorb losses of the rabbi trusts that could potentially be significant to the rabbi trusts by virtue of its contingent call options on the rabbi trusts’ assets in the event of the Company’s bankruptcy. As the primary beneficiary of these VIEs, the Company consolidates the rabbi trust investments. In general, the rabbi trust investments and any earnings received thereon are accumulated, reinvested and used exclusively for trust purposes. These rabbi trust investments consist primarily of cash and cash equivalents, U.S. government agency obligations, equity securities, mutual funds and other exchange-traded funds, and are recorded at fair value in other assets in the Company’s Consolidated Balance Sheets. Changes in fair value are recorded in noninterest income.
Assets held in rabbi trust accounts by plan type, at fair value, were as follows:
|
|
|
|
|
|
|
|
|
|
|
|
|
As of December 31, |
|
2022 |
|
2021 |
|
(In thousands) |
| DB SERP |
$ |
17,209 |
|
|
$ |
20,810 |
|
| BEP |
11,734 |
|
|
13,202 |
|
| ODRCP |
3,670 |
|
|
4,316 |
|
| DC SERP |
17,764 |
|
|
34,002 |
|
| Deferred compensation plans |
25,909 |
|
|
32,042 |
|
| Total rabbi trust assets |
$ |
76,286 |
|
|
$ |
104,372 |
|
The following tables present the book value, net unrealized gain or loss, and market value of assets held in rabbi trust accounts by asset type:
|
|
|
|
|
|
|
|
|
|
|
|
|
|
|
|
|
|
|
|
|
|
|
|
|
|
|
|
|
|
|
|
|
|
|
|
|
As of December 31, 2022 |
|
As of December 31, 2021 |
|
Book Value |
|
Unrealized
Gain/(Loss) |
|
Fair Value |
|
Book Value |
|
Unrealized
Gain |
|
Fair Value |
| Asset Type |
(In thousands) |
| Cash and cash equivalents |
$ |
5,575 |
|
$ |
— |
|
$ |
5,575 |
|
$ |
4,494 |
|
|
$ |
— |
|
|
$ |
4,494 |
|
| Equities (1) |
60,056 |
|
3,626 |
|
63,682 |
|
67,401 |
|
|
24,295 |
|
|
91,696 |
|
| Fixed income |
7,799 |
|
(770) |
|
7,029 |
|
8,126 |
|
|
56 |
|
|
8,182 |
|
| Total assets |
$ |
73,430 |
|
$ |
2,856 |
|
$ |
76,286 |
|
$ |
80,021 |
|
|
$ |
24,351 |
|
|
$ |
104,372 |
|
(1)Equities include mutual funds and other exchange-traded funds.
The Company had equity securities held in rabbi trust accounts of $63.7 million and $91.7 million as of December 31, 2022 and 2021, respectively. Included in the equity securities presented in the tables above are exchange-traded mutual funds which had a net asset value of $38.9 million and $58.1 million as of December 31, 2022 and 2021, respectively.
Share-Based Compensation Plan
On November 29, 2021, the shareholders of the Company approved the Eastern Bankshares, Inc. 2021 Equity Incentive Plan (the “2021 Plan”). The 2021 Plan provides for the issuance of up to 26,146,141 shares of common stock pursuant to grants of restricted stock, restricted stock units (“RSUs”), non-qualified stock options and incentive stock options, any or all of which can be granted with performance-based vesting conditions. Under the 2021 Plan, 7,470,326 shares may be issued as restricted stock or RSUs, including those issued as performance shares and performance share units (“PSUs”), and 18,675,815 shares may be issued upon the exercise of stock options. These shares may be awarded from the Company’s authorized but unissued shares. However, the 2021 Plan permits the grant of additional awards of restricted stock or RSUs above the aforementioned limit, provided that, for each additional share of restricted stock or RSU awarded in excess of such limit, the pool of shares available to be issued upon the exercise of stock options will be reduced by three shares. Pursuant to the terms of the 2021 Plan, each of the Company’s non-employee directors were automatically granted awards of restricted stock on November 30, 2021. Such restricted stock awards vest pro-rata on an annual basis over a five-year period. The maximum term for stock options is ten years.
On March 1, 2022, the Company granted to all of the Company’s executive officers and certain other employees a total of 978,364 RSUs, which vest pro-rata on an annual basis over a period of three or five years, and a total of 533,676 PSUs, for which vesting is contingent upon the Compensation Committee of the Board of Director’s certification, after the conclusion of a three-year period, that the Company has attained a threshold level of certain performance criteria over such period. On May 17, 2022, the Company granted a total of 31,559 shares of restricted stock to the Company’s non-employee directors which vest after approximately one year from the date of grant. As of December 31, 2022 and 2021, there were 5,302,256 shares and 6,787,270 shares that remained available for issuance as restricted stock or RSU awards, respectively, and 18,675,815 shares that remain available for issuance upon the exercise of stock options at both dates. As of both December 31, 2022 and 2021, no stock options had been awarded under the 2021 Plan.
The following table summarizes the Company’s restricted stock award activity for the periods indicated:
|
|
|
|
|
|
|
|
|
|
|
|
|
|
|
|
|
|
|
|
|
|
|
|
|
For the Years Ended December 31, |
|
2022 |
|
2021 |
| Restricted Stock Awards |
Number of Shares |
|
Weighted-Average Grant Price Per Share |
|
Number of Shares |
|
Weighted-Average Grant Price Per Share |
| Non-vested restricted stock at beginning of year |
683,056 |
|
$ |
20.13 |
|
|
— |
|
$ |
— |
|
| Granted |
31,559 |
|
19.17 |
|
|
683,056 |
|
20.13 |
|
| Vested |
(136,609) |
|
20.13 |
|
|
— |
|
— |
|
| Forfeited |
(52,546) |
|
20.08 |
|
|
— |
|
— |
|
| Non-vested restricted stock at end of year |
525,460 |
|
$ |
20.08 |
|
|
683,056 |
|
$ |
20.13 |
|
The following table summarizes the Company’s restricted stock unit activity for the periods indicated:
|
|
|
|
|
|
|
|
|
|
|
|
|
|
|
|
|
|
|
|
|
|
|
|
|
For the Years Ended December 31, |
|
2022 |
|
2021 |
| Restricted Stock Units |
Number of Shares |
|
Weighted-Average Grant Price Per Share |
|
Number of Shares |
|
Weighted-Average Grant Price Per Share |
| Non-vested restricted stock at beginning of year |
— |
|
$ |
— |
|
|
— |
|
$ |
— |
|
| Granted |
978,364 |
|
21.08 |
|
|
— |
|
— |
|
| Forfeited |
(6,039) |
|
21.08 |
|
|
— |
|
— |
|
| Non-vested restricted stock at end of year |
972,325 |
|
$ |
21.08 |
|
|
— |
|
$ |
— |
|
The following table summarizes the Company’s performance stock unit activity for the periods indicated:
|
|
|
|
|
|
|
|
|
|
|
|
|
|
|
|
|
|
|
|
|
|
|
|
|
For the Years Ended December 31, |
|
2022 |
|
2021 |
| Performance Stock Units |
Number of Shares |
|
Weighted-Average Grant Price Per Share |
|
Number of Shares |
|
Weighted-Average Grant Price Per Share |
| Non-vested restricted stock at beginning of year |
— |
|
$ |
— |
|
|
— |
|
$ |
— |
|
| Granted |
533,676 |
|
21.12 |
|
|
— |
|
— |
|
| Non-vested restricted stock at end of year |
533,676 |
|
$ |
21.12 |
|
|
— |
|
$ |
— |
|
As of December 31, 2022, no RSU or PSU awards had vested. As of December 31, 2021, no awards had vested.
For the year ended December 31, 2022, share-based compensation expense under the 2021 Plan and the related tax benefit totaled $10.5 million and less than $3.0 million, respectively. For the year ended December 31, 2021, share-based compensation expense under the 2021 Plan and the related tax benefit totaled $0.2 million and less than $0.1 million, respectively.
As of December 31, 2022 and 2021, there was $34.6 million and $13.5 million, respectively, of total unrecognized compensation expense related to non-vested restricted stock granted and issued under the 2021 Plan. As of December 31, 2022, this cost is expected to be recognized over a weighted average remaining period of approximately 3.3 years. As of December 31, 2021, this cost was expected to be recognized over a weighted average remaining period of approximately 4.9 years.
18. Commitments and Contingencies
Financial Instruments with Off-Balance Sheet Risk
In order to meet the financing needs of its customers and to reduce its own exposure to fluctuations in interest rates, the Company is party to financial instruments with off-balance sheet risk in the normal course of business. These financial instruments include commitments to extend credit, standby letters of credit, and forward commitments to sell loans, all of which involve, to varying degrees, elements of credit and interest rate risk in excess of the amount recognized in the Consolidated Balance Sheets. The contract or notional amounts of those instruments reflect the extent of involvement the Company has in each particular class of financial instruments.
Substantially all of the Company’s commitments to extend credit, which normally have fixed expiration dates or termination clauses, are contingent upon customers maintaining specific credit standards at the time of loan funding. Standby letters of credit are conditional commitments issued by the Company to guarantee the performance of a customer to a third party. In the event the customer does not perform in accordance with the terms of agreement with the third party, the Company would be required to fund the commitment. The maximum potential amount of future payments the Company could be required to make is represented by the contractual amount of the commitment. The credit risk involved in issuing letters of credit is essentially the same as that involved in extending loan facilities to customers. For forward loan sale commitments, the contract or notional amount does not represent exposure to credit loss. The Company does not sell loans with recourse.
The following table summarizes the above financial instruments as of the dates indicated:
|
|
|
|
|
|
|
|
|
|
|
|
|
As of December 31, |
|
2022 |
|
2021 |
|
(In Thousands) |
| Commitments to extend credit |
$ |
5,680,438 |
|
|
$ |
5,175,521 |
|
| Standby letters of credit |
65,154 |
|
|
65,602 |
|
| Forward commitments to sell loans |
10,008 |
|
|
24,440 |
|
Other Contingencies
The Company has been named a defendant in various legal proceedings arising in the normal course of business. Set out below are descriptions of significant legal matters involving the Company and its subsidiaries. In the opinion of management, and taking into account the advice of legal counsel, the ultimate resolution of these proceedings will not have a material effect on the Company’s Consolidated Financial Statements.
In the second quarter of 2021, the Company entered into a preliminary settlement of two purported class action matters concerning overdraft and nonsufficient funds fees. The matters were filed in the Massachusetts Superior Court in November 2019 and April 2021, respectively, and were consolidated into one matter for final settlement purposes. The matters were settled during the first quarter of 2022 and the total settlement expense, including related costs, was $3.3 million. The Company incurred no costs in 2022 related to these matters as the total settlement expense had been accrued in 2021 when management determined the loss contingency to be both probable and estimable. The Company’s regulators conducted inquiries and reviewed data related to one of these class action matters and, in February 2022, made an additional request for data and notified management that they may require additional restitution for certain matters associated with the nonsufficient funds fees matter. Based on this discussion, management believed that a loss contingency for this restitution was probable but was not able to determine a reasonable estimate for the loss. However, later during the first quarter of 2022, the Company was informed by its regulators that no additional remediation on this issue would be required. As a result, as of December 31, 2022, management no longer believes that a loss contingency for restitution associated with this issue is probable.
As a member of the Federal Reserve System, the Bank is required to maintain certain reserves of vault cash and/or deposits with the Federal Reserve Bank of Boston. However, in response to the COVID-19 pandemic, the Federal Reserve temporarily eliminated reserve requirements and therefore there was no minimum reserve requirement as of December 31, 2022 and 2021.
19. Derivative Financial Instruments
The Company uses derivative financial instruments to manage its interest rate risk resulting from the differences in the amount, timing, and duration of known or expected cash receipts and known or expected cash payments. Additionally, the Company enters into interest rate derivatives and foreign exchange contracts to accommodate the business requirements of its customers (“customer-related positions”) and risk participation agreements entered into as financial guarantees of performance on customer-related interest rate swap derivatives.
The Company also enters into residential mortgage loan commitments to fund mortgage loans at specified rates and times in the future and enters into forward sale commitments to sell such residential mortgage loans at specified prices and times in the future, both of which are considered derivative instruments. Derivative instruments are carried at fair value in the Company’s Consolidated Financial Statements. The accounting for changes in the fair value of a derivative instrument is dependent upon whether or not the instrument qualifies as a hedge for accounting purposes, and further, by the type of hedging relationship.
By using derivatives, the Company is exposed to credit risk to the extent that counterparties to the derivative contracts do not perform as required. Should a counterparty fail to perform under the terms of a derivative contract, the Company’s credit exposure on interest rate swaps is limited to the net positive fair value and accrued interest of all swaps with each counterparty plus any initial margin collateral posted. The Company seeks to minimize counterparty credit risk through credit approvals, limits, monitoring procedures, and obtaining collateral, where appropriate. As such, management believes the risk of incurring credit losses on derivative contracts with those counterparties is remote. The Company’s discounting methodology and interest calculation of cash margin uses the Secured Overnight Financing Rate, or SOFR, for U.S. dollar cleared interest rate swaps.
Interest Rate Positions
An interest rate swap is an agreement whereby one party agrees to pay a floating rate of interest on a notional principal amount in exchange for receiving a fixed rate of interest on the same notional amount, for a predetermined period of time, from a second party. The amounts relating to the notional principal amount are not actually exchanged. The Company has entered into interest rate swaps in which it pays floating and receives fixed interest in order to manage its interest rate risk exposure to the variability in interest cash flows on certain floating-rate loans. Such interest rate swaps include those which effectively convert the floating rate one-month LIBOR, SOFR or overnight indexed swap rate, or prime rate interest payments received on the loans to a fixed rate and consequently reduce the Company’s exposure to variability in short-term interest rates. For interest rate swaps that are accounted for as cash flow hedges, changes in fair value are included in other comprehensive income and reclassified into net income in the same period or periods during which the hedged forecasted transaction affects net income. The following table reflects the Company’s derivative positions as of December 31, 2022 for interest rate swaps which qualify as cash flow hedges for accounting purposes:
|
|
|
|
|
|
|
|
|
|
|
|
|
|
|
|
|
|
|
|
|
|
|
|
|
|
|
|
|
|
|
|
|
|
|
Weighted Average Rate |
|
|
|
Notional
Amount |
|
Weighted Average
Maturity |
|
Current
Rate Paid |
|
Receive Fixed
Swap Rate |
|
Fair Value (1) |
|
(In thousands) |
|
(In Years) |
|
|
|
|
|
(In thousands) |
| Interest rate swaps on loans |
$ |
2,400,000 |
|
|
4.57 |
|
4.07 |
% |
|
3.02 |
% |
|
$ |
(2,401) |
|
| Total |
$ |
2,400,000 |
|
|
|
|
|
|
|
|
$ |
(2,401) |
|
(1)The fair value included a net accrued interest payable balance of $1.5 million as of December 31, 2022. In addition, the fair value includes netting adjustments which represent the amounts recorded to convert derivative assets and liabilities cleared through the CME from a gross basis to a net basis in accordance with applicable accounting guidance.
As of December 31, 2021, the Company did not have any active interest rate swaps which qualified as cash flow hedges for accounting purposes.
The maximum amount of time over which the Company is currently hedging its exposure to the variability in future cash flows of forecasted transactions related to the receipt of variable interest on existing financial instruments is five years.
The Company expects approximately $42.0 million will be reclassified into interest income, as a reduction of such income, from other comprehensive income related to the Company’s active cash flow hedges in the next 12 months as of December 31, 2022. The reclassification is due to anticipated net payments on the swaps based upon the forward curve as of December 31, 2022.
Due to the phase-out, and eventual discontinuation, of the LIBOR, central clearinghouses have begun to transition to alternative rates for valuation purposes. As of October 16, 2020, the Company changed its valuation methodology to reflect changes made by the Chicago Mercantile Exchange (“CME”), through which the Company clears derivative financial instruments that are eligible for clearing. The changes from the CME changed the discounting methodology and interest calculation of cash margin from Overnight Index Swap to SOFR for U.S. dollar cleared interest rate swaps. The Company believes that its improvements to its valuation methodology will result in valuations for cleared interest rate swaps that better reflect prices obtainable in the markets in which the Company transacts. The changes in valuation methodology are applied prospectively as a change in accounting estimate and are immaterial to the Company’s Consolidated Financial Statements.
The Company discontinues cash flow hedge accounting if it is probable that the forecasted hedged transactions will not occur in the initially identified time period. At such time, the associated gains and losses deferred in accumulated other comprehensive income (“AOCI”) are reclassified immediately into earnings and any subsequent changes in the fair value of such derivatives are recognized directly in earnings.
The following table presents the pre-tax impact of terminated cash flow hedges on AOCI for the periods indicated:
|
|
|
|
|
|
|
|
|
|
|
|
|
|
|
|
|
|
|
Year Ended December 31, |
|
2022 |
|
2021 |
|
2020 |
|
(In thousands) |
| Unrealized gains on terminated hedges included in AOCI — January 1 |
$ |
10,239 |
|
|
$ |
41,473 |
|
|
$ |
— |
|
| Unrealized gains on terminated hedges arising during the period |
— |
|
|
— |
|
|
57,362 |
|
| Reclassification adjustments for amortization of unrealized (gains) into net interest income |
(10,193) |
|
|
(31,234) |
|
|
(15,889) |
|
| Unrealized gains on terminated hedges included in AOCI — December 31 |
$ |
46 |
|
|
$ |
10,239 |
|
|
$ |
41,473 |
|
The balance of terminated cash flow hedges in AOCI will be amortized into earnings through January 2023. The Company expects less than $0.1 million to be reclassified into interest income from other comprehensive income related to the Company’s terminated cash flow hedges in the next 12 months as of December 31, 2022.
Customer-Related Positions
Interest rate swaps offered to commercial customers do not qualify as hedges for accounting purposes. These swaps allow the Company to retain variable rate commercial loans while allowing the commercial customer to synthetically fix the loan rate by entering into a variable-to-fixed rate interest rate swap. The Company believes that its exposure to commercial customer derivatives is limited to non-performance by either the customer or the dealer because these contracts are simultaneously matched at inception with an offsetting transaction.
Risk participation agreements are entered into as financial guarantees of performance on interest rate swap derivatives. The purchased (asset) or sold (liability) guarantee allow the Company to participate-out (fee paid) or participate-in (fee received) the risk associated with certain derivative positions executed with the borrower by the lead bank in a customer-related interest rate swap derivative.
Foreign exchange contracts consist of those offered to commercial customers and those entered into to hedge the Company’s foreign currency risk associated with a foreign-currency loan. Neither qualifies as a hedge for accounting purposes. These commercial customer derivatives are offset with matching derivatives with correspondent-bank counterparties in order to minimize foreign exchange rate risk to the Company. Exposure with respect to these derivatives is largely limited to non-performance by either the customer or the other counterparty. Neither the Company nor the correspondent-bank counterparty are required to post collateral but each has established foreign-currency transaction limits to manage the exposure risk. The Company requires its customers to post collateral to minimize risk exposure.
The following tables present the Company’s customer-related derivative positions as of the dates indicated below for those derivatives not designated as hedging:
|
|
|
|
|
|
|
|
|
|
|
|
|
As of December 31, 2022 |
|
Number of Positions |
|
Total Notional |
|
(Dollars in thousands) |
| Interest rate swaps |
382 |
|
$ |
2,404,003 |
|
| Risk participation agreements |
63 |
|
241,029 |
|
| Foreign exchange contracts: |
|
|
|
| Matched commercial customer book |
32 |
|
7,877 |
|
| Foreign currency loan |
5 |
|
13,948 |
|
|
|
|
|
|
|
|
|
|
|
|
|
|
As of December 31, 2021 |
|
Number of Positions |
|
Total Notional |
|
(Dollars in thousands) |
| Interest rate swaps |
494 |
|
|
$ |
3,009,150 |
|
| Risk participation agreements |
64 |
|
|
238,772 |
|
| Foreign exchange contracts: |
|
|
|
| Matched commercial customer book |
72 |
|
|
7,922 |
|
| Foreign currency loan |
6 |
|
|
10,830 |
|
The level of interest rate swaps, risk participation agreements and foreign currency exchange contracts at the end of each period noted above was commensurate with the activity throughout those periods.
The table below presents the fair value of the Company’s derivative financial instruments, as well as their classification on the Consolidated Balance Sheets for the periods indicated:
|
|
|
|
|
|
|
|
|
|
|
|
|
|
|
|
|
|
|
|
|
|
|
|
|
|
|
|
|
|
|
|
|
|
|
|
|
Asset Derivatives |
|
Liability Derivatives |
|
Balance Sheet
Location |
|
Fair Value at December 31,
2022 |
|
Fair Value at December 31,
2021 |
|
Balance Sheet
Location |
|
Fair Value at December 31,
2022 |
|
Fair Value at December 31,
2021 |
|
(In thousands) |
| Derivatives designated as hedging instruments |
|
|
|
|
|
|
|
|
|
|
|
| Interest rate swaps |
Other assets |
|
$ |
16 |
|
|
$ |
— |
|
|
Other liabilities |
|
$ |
2,417 |
|
|
$ |
— |
|
| Derivatives not designated as hedging instruments |
|
|
|
|
|
|
|
|
|
|
|
| Customer-related positions: |
|
|
|
|
|
|
|
|
|
|
|
| Interest rate swaps |
Other assets |
|
$ |
23,567 |
|
|
$ |
64,338 |
|
|
Other liabilities |
|
$ |
78,577 |
|
|
$ |
17,880 |
|
| Risk participation agreements |
Other assets |
|
78 |
|
|
315 |
|
|
Other liabilities |
|
130 |
|
|
580 |
|
| Foreign currency exchange contracts — matched customer book |
Other assets |
|
198 |
|
|
61 |
|
|
Other liabilities |
|
205 |
|
|
46 |
|
| Foreign currency exchange contracts — foreign currency loan |
Other assets |
|
2 |
|
|
— |
|
|
Other liabilities |
|
93 |
|
|
87 |
|
|
|
|
$ |
23,845 |
|
|
$ |
64,714 |
|
|
|
|
$ |
79,005 |
|
|
$ |
18,593 |
|
| Total |
|
|
$ |
23,861 |
|
|
$ |
64,714 |
|
|
|
|
$ |
81,422 |
|
|
$ |
18,593 |
|
There were no derivatives designated as hedging instruments at December 31, 2021.
The table below presents the net effect of the Company’s derivative financial instruments on the Consolidated Statements of Income as well as the effect of the Company’s derivative financial instruments included in other comprehensive income (“OCI”) as follows:
|
|
|
|
|
|
|
|
|
|
|
|
|
|
|
|
|
|
|
For the Year Ended December 31, |
|
2022 |
|
2021 |
|
2020 |
|
(In thousands) |
| Derivatives designated as hedges: |
|
|
|
|
|
| Gain in OCI on derivatives |
$ |
(69,010) |
|
|
$ |
— |
|
|
$ |
46,871 |
|
Gain reclassified from OCI into interest income (effective portion) |
$ |
9,580 |
|
|
$ |
31,234 |
|
|
$ |
27,131 |
|
Gain recognized in income on derivatives (ineffective portion and amount excluded from effectiveness test) |
|
|
|
|
|
| Interest income |
$ |
— |
|
|
$ |
— |
|
|
$ |
— |
|
| Other income |
— |
|
|
— |
|
|
— |
|
| Total |
$ |
— |
|
|
$ |
— |
|
|
$ |
— |
|
| Derivatives not designated as hedges: |
|
|
|
|
|
| Customer-related positions: |
|
|
|
|
|
| Gain (loss) recognized in interest rate swap income |
$ |
4,324 |
|
|
$ |
4,962 |
|
|
$ |
(3,812) |
|
| Gain (loss) recognized in interest rate swap income for risk participation agreements |
213 |
|
|
243 |
|
|
(384) |
|
Gain (loss) recognized in other income for foreign currency exchange contracts: |
|
|
|
|
|
| Matched commercial customer book |
(22) |
|
|
1 |
|
|
(28) |
|
| Foreign currency loan |
(4) |
|
|
(27) |
|
|
143 |
|
| Total gain (loss) for derivatives not designated as hedges |
$ |
4,511 |
|
|
$ |
5,179 |
|
|
$ |
(4,081) |
|
The Company has agreements with its customer-related interest rate swap derivative counterparties that contain a provision whereby if the Company defaults on any of its indebtedness, including default where repayment of the indebtedness has not been accelerated by the lender, then the Company could also be declared in default on its derivative obligations.
The Company also has agreements with certain of its customer-related interest rate swap derivative correspondent-bank counterparties that contain a provision whereby if the Company fails to maintain its status as a well-capitalized institution, then the counterparty could terminate the derivative positions and the Company would be required to settle its obligations under the agreements.
The Company’s exposure related to its customer-related interest rate swap derivative consists of exposure on cleared derivative transactions and exposure on non-cleared derivative transactions.
Cleared derivative transactions are with CME and exposure is settled to market daily, with additional credit exposure related to initial-margin collateral pledged to CME at trade execution. At December 31, 2022, the Company had no exposure to CME for settled variation margin in excess of the customer-related and non-customer-related interest rate swap termination values. At December 31, 2021, the Company had exposure to CME for settled variation margin in excess of the customer-related and non-customer-related interest rate swap termination values of $0.4 million. In addition, at December 31, 2022 and 2021, the Company had posted initial-margin collateral in the form of U.S. Treasury notes amounting to $84.1 million and $48.9 million, respectively, to CME for these derivatives. The U.S. Treasury notes were considered restricted assets and were included in available for sale securities on the Company’s Consolidated Balance Sheets.
At December 31, 2022, there were no interest rate swap derivatives with credit-risk contingent features in a net liability position. At December 31, 2021, the fair value of interest rate swap derivatives with credit-risk related contingent features that were in a net liability position, which includes accrued interest but excludes any adjustment for non-performance risk, totaled $13.7 million. The Company has minimum collateral posting thresholds with its customer-related interest rate swap derivative correspondent-bank counterparties to the extent that the Company has a liability position with the correspondent-bank counterparties. At December 31, 2022 and 2021, the Company had posted collateral in the form of cash amounting to $1.0 million and $21.3 million, respectively, which was considered to be a restricted asset and was included in other short-term investments within the Company’s Consolidated Balance Sheets. If the Company had breached any of these provisions at December 31, 2022 or 2021, it would have been required to settle its obligations under the agreements at the termination value.
In addition, the Company had cross-default provisions with its commercial customer loan agreements which provide cross-collateralization with the customer loan collateral.
Mortgage Banking Derivatives
The Company enters into residential mortgage loan commitments in connection with its consumer mortgage banking activities to fund mortgage loans at specified rates and times in the future. In addition, the Company enters into forward sale commitments to sell such residential mortgage loans at specified prices and times in the future. These commitments are short-term in nature and generally expire in 30 to 60 days. The residential mortgage loan commitments that relate to the origination of mortgage loans that will be held for sale and the related forward sale commitments are considered derivative instruments under ASC Topic 815, “Derivatives and Hedging” and are reported at fair value. Changes in fair value are reported in earnings and included in other non-interest income on the Consolidated Statements of Income. As of December 31, 2022 and December 31, 2021, the Company had an outstanding notional balance of residential mortgage loan origination commitments of $8.3 million and $31.9 million, respectively, and forward sale commitments of $10.0 million and $24.4 million, respectively. During the years ended December 31, 2022, 2021 and 2020, the Company recorded net (losses)/gains related to the change in fair value of commitments to originate and sell mortgage loans of $(0.2) million, $(0.7) million and $0.9 million, respectively. The aggregate fair value of the Company’s mortgage banking derivative asset and liability as of December 31, 2022 was $0.1 million and $0.1 million, respectively. The aggregate fair value of the Company’s mortgage banking derivative asset and liability as of December 31, 2021 was $0.3 million and $0.1 million, respectively. Mortgage banking derivative assets and liabilities are included in other assets and other liabilities, respectively, on the Consolidated Balance Sheets. Residential mortgages sold are generally sold with servicing rights released. Mortgage banking derivatives do not qualify as hedges for accounting purposes.
20. Balance Sheet Offsetting
Certain financial instruments, including derivatives, may be eligible for offset in the Consolidated Balance Sheets and/or subject to master netting arrangements or similar agreements. The Company’s derivative transactions with upstream financial institution counterparties are generally executed under International Swaps and Derivative Association master agreements which include “right of set-off” provisions. In such cases there is generally a legally enforceable right to offset recognized amounts. However, the Company does not offset fair value amounts recognized for derivative instruments. The Company nets the amount recognized for the right to reclaim cash collateral against the obligation to return cash collateral arising from derivative instruments executed with the same counterparty under a master netting arrangement. Collateral legally required to be maintained at dealer banks by the Company is monitored and adjusted as necessary. As of December 31, 2022 and 2021, it was determined that no additional collateral would have to be posted to immediately settle these instruments.
The following tables present the Company’s asset and liability positions that were eligible for offset and the potential effect of netting arrangements on its financial position, as of the dates indicated:
|
|
|
|
|
|
|
|
|
|
|
|
|
|
|
|
|
|
|
|
|
|
|
|
|
|
|
|
|
|
|
|
|
|
|
|
|
As of December 31, 2022 |
|
Gross
Amounts
Recognized |
|
Gross
Amounts
Offset in the
Statement of
Financial
Position |
|
Net
Amounts
Presented in
the Statement
of Financial
Position |
|
Gross Amounts Not Offset
in the Statement of
Financial Position |
|
Net
Amount |
|
|
|
|
Financial
Instruments |
|
Collateral
Pledged
(Received) |
|
|
(In thousands) |
| Derivative Assets |
|
|
|
|
|
|
|
|
|
|
|
| Interest rate swaps designated as cash flow hedges |
$ |
16 |
|
|
$ |
— |
|
|
$ |
16 |
|
|
$ |
— |
|
|
$ |
— |
|
|
$ |
16 |
|
| Customer-related positions: |
|
|
|
|
|
|
|
|
|
|
|
| Interest rate swaps |
23,567 |
|
|
— |
|
|
23,567 |
|
|
381 |
|
|
(14,430) |
|
|
8,756 |
|
| Risk participation agreements |
78 |
|
|
— |
|
|
78 |
|
|
— |
|
|
— |
|
|
78 |
|
| Foreign currency exchange contracts – matched customer book |
198 |
|
|
— |
|
|
198 |
|
|
— |
|
|
— |
|
|
198 |
|
| Foreign currency exchange contracts – foreign currency loan |
2 |
|
|
— |
|
|
2 |
|
|
— |
|
|
— |
|
|
2 |
|
|
$ |
23,861 |
|
|
$ |
— |
|
|
$ |
23,861 |
|
|
$ |
381 |
|
|
$ |
(14,430) |
|
|
$ |
9,050 |
|
| Derivative Liabilities |
|
|
|
|
|
|
|
|
|
|
|
| Interest rate swaps designated as cash flow hedges |
$ |
2,417 |
|
|
$ |
— |
|
|
$ |
2,417 |
|
|
$ |
— |
|
|
$ |
2,417 |
|
|
$ |
— |
|
| Customer-related positions: |
|
|
|
|
|
|
|
|
|
|
|
| Interest rate swaps |
78,577 |
|
|
— |
|
|
78,577 |
|
|
381 |
|
|
— |
|
|
78,196 |
|
| Risk participation agreements |
130 |
|
|
— |
|
|
130 |
|
|
— |
|
|
— |
|
|
130 |
|
| Foreign currency exchange contracts – matched customer book |
205 |
|
|
— |
|
|
205 |
|
|
— |
|
|
— |
|
|
205 |
|
| Foreign currency exchange contracts – foreign currency loan |
93 |
|
|
— |
|
|
93 |
|
|
— |
|
|
— |
|
|
93 |
|
|
$ |
81,422 |
|
|
$ |
— |
|
|
$ |
81,422 |
|
|
$ |
381 |
|
|
$ |
2,417 |
|
|
$ |
78,624 |
|
|
|
|
|
|
|
|
|
|
|
|
|
|
|
|
|
|
|
|
|
|
|
|
|
|
|
|
|
|
|
|
|
|
|
|
|
|
As of December 31, 2021 |
|
Gross
Amounts
Recognized |
|
Gross
Amounts
Offset in the
Statement of
Financial
Position |
|
Net
Amounts
Presented in
the Statement
of Financial
Position |
|
Gross Amounts Not Offset
in the Statement of
Financial Position |
|
Net
Amount |
|
|
|
|
Financial
Instruments |
|
Collateral
Pledged
(Received) |
|
|
(In thousands) |
| Derivative Assets |
|
|
|
|
|
|
|
|
|
|
|
| Customer-related positions: |
|
|
|
|
|
|
|
|
|
|
|
| Interest rate swaps |
$ |
64,338 |
|
|
$ |
— |
|
|
$ |
64,338 |
|
|
$ |
1,440 |
|
|
$ |
— |
|
|
$ |
62,898 |
|
| Risk participation agreements |
315 |
|
|
— |
|
|
315 |
|
|
— |
|
|
— |
|
|
315 |
|
| Foreign currency exchange contracts – matched customer book |
61 |
|
|
— |
|
|
61 |
|
|
— |
|
|
— |
|
|
61 |
|
| Foreign currency exchange contracts – foreign currency loan |
— |
|
|
— |
|
|
— |
|
|
— |
|
|
— |
|
|
— |
|
|
$ |
64,714 |
|
|
$ |
— |
|
|
$ |
64,714 |
|
|
$ |
1,440 |
|
|
$ |
— |
|
|
$ |
63,274 |
|
| Derivative Liabilities |
|
|
|
|
|
|
|
|
|
|
|
| Customer-related positions: |
|
|
|
|
|
|
|
|
|
|
|
| Interest rate swaps |
$ |
17,880 |
|
|
$ |
— |
|
|
$ |
17,880 |
|
|
$ |
1,440 |
|
|
$ |
16,440 |
|
|
$ |
— |
|
| Risk participation agreements |
580 |
|
|
— |
|
|
580 |
|
|
— |
|
|
— |
|
|
580 |
|
| Foreign currency exchange contracts – matched customer book |
46 |
|
|
— |
|
|
46 |
|
|
— |
|
|
— |
|
|
46 |
|
| Foreign currency exchange contracts – foreign currency loan |
87 |
|
|
— |
|
|
87 |
|
|
— |
|
|
— |
|
|
87 |
|
|
$ |
18,593 |
|
|
$ |
— |
|
|
$ |
18,593 |
|
|
$ |
1,440 |
|
|
$ |
16,440 |
|
|
$ |
713 |
|
21. Fair Value of Assets and Liabilities
The Company uses fair value measurements to record adjustments to certain assets and liabilities and to determine fair value disclosures. The fair value of a financial instrument is the price that would be received to sell an asset or paid to transfer a liability in an orderly transaction between market participants at the measurement date. Fair value is best determined based upon quoted market prices. However, in many instances, there are no quoted market prices for the Company’s various financial instruments. In cases where quoted market prices are not available, fair values are based on estimates using present value or other valuation techniques. Those techniques are significantly affected by the assumptions used, including the discount rate and estimates of future cash flows. Accordingly, the fair value estimates may not be realized in an immediate settlement of the instrument.
Fair value is a market-based measure considered from the perspective of a market participant rather than an entity-specific measure. Therefore, even when market assumptions are not readily available, the Company’s own assumptions are set to reflect those that the Company believes market participants would use in pricing the asset or liability at the measurement date. The Company uses prices and inputs that are current as of the measurement date, including during periods of market dislocation. In periods of market dislocation, the observability of prices and inputs may be reduced for many instruments. This condition could cause an instrument to be reclassified from Level 1 to Level 2 or from Level 2 to Level 3.
Fair value estimates are made at a specific point in time, based on relevant market information and information about the financial instrument. These estimates do not reflect any premium or discount that could result from offering for sale at one time the Company’s entire holdings of a particular financial instrument. Because no active market exists for a portion of the Company’s financial instruments, fair value estimates are based on judgements regarding future expected loss experience, current economic conditions, risk characteristics of various financial instruments, and other factors. These estimates are subjective in nature and involve uncertainties and matters of significant judgement, and therefore cannot be determined with precision. Changes in assumptions could significantly affect these estimates.
The following methods and assumptions were used by the Company in estimating fair value disclosures:
Cash and Cash Equivalents
For these financial instruments, which have original maturities of 90 days or less, their carrying amounts reported in the Consolidated Balance Sheets approximate fair value.
Securities
Securities consisted of U.S. Treasury securities, U.S. Agency bonds (including SBA pooled securities), U.S. government-sponsored residential and commercial mortgage-backed securities, state and municipal bonds, and other debt securities. AFS securities are recorded at fair value.
The Company’s U.S. Treasury securities are traded on active markets and therefore these securities were classified as Level 1.
The fair value of U.S. Agency bonds, including Small Business Administration pooled securities, were evaluated using relevant trade data, benchmark quotes and spreads obtained from publicly available trade data, and generated on a price, yield or spread basis as determined by the observed market data. Therefore, these securities were categorized as Level 2 given the use of observable inputs.
The fair value of U.S. government-sponsored residential and commercial mortgage-backed securities were estimated using either a matrix or benchmarks. The inputs used include benchmark yields, reported trades, broker/dealer quotes, and issuer spreads. Therefore, these securities were categorized as Level 2 given the use of observable inputs.
The fair value of state and municipal bonds were estimated using a valuation matrix with inputs including observable bond interest rate tables, recent transactions, and yield relationships. Therefore, these securities were categorized as Level 2 given the use of observable inputs.
The fair value of other debt securities were estimated using a valuation matrix with inputs including observable bond interest rate tables, recent transactions, and yield relationships. Therefore, these securities were categorized as Level 2 given the use of observable inputs.
Fair value was based on the value of one unit without regard to any premium or discount that may result from concentrations of ownership of a financial instrument, possible tax ramifications, or estimated transaction costs. The estimated fair value of the Company’s securities available for sale, by type, is disclosed in Note 4, “Securities.”
Loans Held for Sale
Fair value of loans held for sale, whose carrying amounts approximate fair value, was estimated using the anticipated market price based upon pricing indications provided by investor banks. These assets were classified as Level 2 given the use of observable inputs.
Loans
The fair value of commercial construction, commercial and industrial lines of credit, and certain other consumer loans was estimated by discounting the contractual cash flows using interest rates currently being offered for loans with similar terms to borrowers of similar credit quality.
For commercial, commercial real estate, residential real estate, automobile, and consumer home equity loans, fair value was estimated by discounting contractual cash flows adjusted for prepayment estimates using interest rates currently being offered for loans with similar terms to borrowers of similar credit quality.
The fair value of PPP loans, which are fully guaranteed by the SBA, approximates the carrying amount.
Loans are classified as Level 3 since the valuation methodology utilizes significant unobservable inputs. Loans that are deemed to be collateral-dependent, as described in Note 2, “Summary of Significant Accounting Policies” were recorded at the fair value of the underlying collateral.
FHLB Stock
The fair value of FHLB stock approximates the carrying amount based on the redemption provisions of the FHLB. These assets were classified as Level 2.
Rabbi Trust Investments
Rabbi trust investments consisted primarily of cash and cash equivalents, U.S. government agency obligations, equity securities, mutual funds and other exchange-traded funds, and were recorded at fair value and included in other assets. The purpose of these rabbi trust investments is to fund certain executive non-qualified retirement benefits and deferred compensation.
The fair value of other U.S. government agency obligations were estimated using either a matrix or benchmarks. The inputs used include benchmark yields, reported trades, broker/dealer quotes, and issuer spreads. These securities were categorized as Level 2 given the use of observable inputs. The equity securities, mutual funds and other exchange-traded funds were valued based on quoted prices from the market. The equities, mutual funds and exchange-traded funds traded in an active market were categorized as Level 1 as they were valued based upon quoted prices from the market. Mutual funds at net asset value amounted to $38.9 million and $58.1 million at December 31, 2022 and 2021, respectively. There were no redemption restrictions on these mutual funds at the end of any period presented.
Bank-Owned Life Insurance
The fair value of bank-owned life insurance was based upon quotations received from bank-owned life insurance dealers. These assets were classified as Level 2 given the use of observable inputs.
Deposits
The fair value of deposits with no stated maturity, such as noninterest-bearing demand deposits, savings and interest checking accounts, and money market accounts, was equal to their carrying amount. The fair value of time deposits was based on the discounted value of contractual cash flows using current market interest rates. Deposits were classified as Level 2 given the use of observable market inputs.
The fair value estimates of deposits do not include the benefit that results from the low-cost funding provided by the deposit liabilities compared to the cost of borrowing funds in the wholesale market (core deposit intangibles).
FHLB Advances
The fair value of FHLB advances was based on the discounted value of contractual cash flows. The discount rates used are representative of approximate rates currently offered on instruments with similar remaining maturities. FHLB advances were classified as Level 2.
Escrow Deposits of Borrowers
The fair value of escrow deposits of borrowers, which have no stated maturity, approximates the carrying amount. Escrow deposits of borrowers were classified as Level 2.
Interest Rate Swap Collateral Funds
The fair value of interest rate swap collateral funds approximates the carrying amount. Interest rate swap collateral funds were classified as Level 2.
Interest Rate Swaps
The fair value of interest rate swaps was determined using discounted cash flow analysis on the expected cash flows of the interest rate swaps. This analysis reflects the contractual terms of the interest rate swaps, including the period of maturity, and uses observable market-based inputs, including interest rate curves and implied volatility. In addition, for customer-related interest rate swaps, the analysis reflects a credit valuation adjustment to reflect the Company’s own non-performance risk and the respective counterparty’s non-performance risk in the fair value measurements. The majority of inputs used to value the Company’s interest rate swaps fall within Level 2 of the fair value hierarchy, but the credit valuation adjustments associated with the interest rate swaps utilize Level 3 inputs, such as estimates of current credit spreads to evaluate the likelihood of default by the Company and its counterparties. However, at December 31, 2022 and 2021, the impact of the Level 3 inputs on the overall valuation of the interest rate swaps was deemed insignificant to the overall valuation. As a result, the interest rate swaps were categorized as Level 2 within the fair value hierarchy.
Risk Participations
The fair value of risk participations was determined based upon the total expected exposure of the derivative which considers the present value of cash flows discounted using market-based inputs and were therefore categorized as Level 2 within the fair value hierarchy. The fair value also included a credit valuation adjustment which evaluates the credit risk of its counterparties by considering factors such as the likelihood of default by the counterparties, its net exposures, the remaining contractual life, as well as the amount of collateral securing the position. The change in value of derivative assets and liabilities attributable to credit risk was not significant during the reported periods.
Foreign Currency Forward Contracts
The fair values of foreign currency forward contracts were based upon the remaining expiration period of the contracts and bid quotations received from foreign exchange contract dealers and were categorized as Level 2 within the fair value hierarchy.
Mortgage Derivatives
The fair value of mortgage derivatives was determined based upon current market prices for similar assets in the secondary market and therefore are classified as Level 2 within the fair value hierarchy.
Fair Value of Assets and Liabilities Measured on a Recurring Basis
The following tables present the balances of assets and liabilities measured at fair value on a recurring basis as of December 31, 2022 and 2021:
|
|
|
|
|
|
|
|
|
|
|
|
|
|
|
|
|
|
|
|
|
|
|
|
|
|
|
Fair Value Measurements at Reporting Date Using |
|
Balance as of December 31, 2022 |
|
Quoted Prices in
Active Markets
for Identical
Assets (Level 1) |
|
Significant
Other
Observable
Inputs (Level 2) |
|
Significant
Unobservable
Inputs (Level 3) |
| Description |
|
|
|
|
(In thousands) |
| Assets |
|
|
|
|
|
|
|
| Securities available for sale |
|
|
|
|
|
|
|
| Government-sponsored residential mortgage-backed securities |
$ |
4,111,908 |
|
|
$ |
— |
|
|
$ |
4,111,908 |
|
|
$ |
— |
|
| Government-sponsored commercial mortgage-backed securities |
1,348,954 |
|
|
— |
|
|
1,348,954 |
|
|
— |
|
| U.S. Agency bonds |
952,482 |
|
|
— |
|
|
952,482 |
|
|
— |
|
| U.S. Treasury securities |
93,057 |
|
|
93,057 |
|
|
— |
|
|
— |
|
| State and municipal bonds and obligations |
183,092 |
|
|
— |
|
|
183,092 |
|
|
— |
|
| Other debt securities |
1,285 |
|
|
— |
|
|
1,285 |
|
|
— |
|
| Rabbi trust investments |
76,286 |
|
|
69,257 |
|
|
7,029 |
|
|
— |
|
| Loans held for sale |
4,543 |
|
|
— |
|
|
4,543 |
|
|
— |
|
| Interest rate swap contracts |
|
|
|
|
|
|
|
| Cash flow hedges - interest rate positions |
16 |
|
|
— |
|
|
16 |
|
|
— |
|
| Customer-related positions |
23,567 |
|
|
— |
|
|
23,567 |
|
|
— |
|
| Risk participation agreements |
78 |
|
|
— |
|
|
78 |
|
|
— |
|
| Foreign currency forward contracts |
|
|
|
|
|
|
|
| Matched customer book |
198 |
|
|
— |
|
|
198 |
|
|
— |
|
| Foreign currency loan |
2 |
|
|
— |
|
|
2 |
|
|
— |
|
| Mortgage derivatives |
62 |
|
|
— |
|
|
62 |
|
|
— |
|
| Total |
$ |
6,795,530 |
|
|
$ |
162,314 |
|
|
$ |
6,633,216 |
|
|
$ |
— |
|
| Liabilities |
|
|
|
|
|
|
|
| Interest rate swap contracts |
|
|
|
|
|
|
|
| Cash flow hedges - interest rate positions |
$ |
2,417 |
|
|
$ |
— |
|
|
$ |
2,417 |
|
|
$ |
— |
|
| Customer-related positions |
78,577 |
|
|
— |
|
|
78,577 |
|
|
— |
|
| Risk participation agreements |
130 |
|
|
— |
|
|
130 |
|
|
— |
|
| Foreign currency forward contracts |
|
|
|
|
|
|
|
| Matched customer book |
205 |
|
|
— |
|
|
205 |
|
|
— |
|
| Foreign currency loan |
93 |
|
|
— |
|
|
93 |
|
|
— |
|
| Mortgage derivatives |
58 |
|
|
— |
|
|
58 |
|
|
— |
|
| Total |
$ |
81,480 |
|
|
$ |
— |
|
|
$ |
81,480 |
|
|
$ |
— |
|
|
|
|
|
|
|
|
|
|
|
|
|
|
|
|
|
|
|
|
|
|
|
|
|
|
|
|
Fair Value Measurements at Reporting Date Using |
| Description |
Balance as of December 31, 2021 |
|
Quoted Prices in
Active Markets
for Identical
Assets (Level 1) |
|
Significant
Other
Observable
Inputs (Level 2) |
|
Significant
Unobservable
Inputs (Level 3) |
|
(In thousands) |
| Assets |
|
|
|
|
|
|
|
| Securities available for sale |
|
|
|
|
|
|
|
| Government-sponsored residential mortgage-backed securities |
$ |
5,524,708 |
|
|
$ |
— |
|
|
$ |
5,524,708 |
|
|
$ |
— |
|
| Government-sponsored commercial mortgage-backed securities |
1,408,868 |
|
|
— |
|
|
1,408,868 |
|
|
— |
|
| U.S. Agency bonds |
1,175,014 |
|
|
— |
|
|
1,175,014 |
|
|
— |
|
| U.S. Treasury securities |
88,605 |
|
|
88,605 |
|
|
— |
|
|
— |
|
| State and municipal bonds and obligations |
280,329 |
|
|
— |
|
|
280,329 |
|
|
— |
|
| Small Business Administration pooled securities |
32,103 |
|
|
— |
|
|
32,103 |
|
|
— |
|
| Other debt securities |
1,597 |
|
|
— |
|
|
1,597 |
|
|
|
| Rabbi trust investments |
104,372 |
|
|
96,190 |
|
|
8,182 |
|
|
— |
|
| Loans held for sale |
1,206 |
|
|
— |
|
|
1,206 |
|
|
— |
|
| Interest rate swap contracts |
|
|
|
|
|
|
|
| Customer-related positions |
64,338 |
|
|
— |
|
|
64,338 |
|
|
— |
|
| Risk participation agreements |
315 |
|
|
— |
|
|
315 |
|
|
— |
|
| Foreign currency forward contracts |
|
|
|
|
|
|
|
| Matched customer book |
61 |
|
|
— |
|
|
61 |
|
|
— |
|
| Foreign currency loan |
— |
|
|
— |
|
|
— |
|
|
— |
|
| Mortgage derivatives |
256 |
|
|
— |
|
|
256 |
|
|
— |
|
| Total |
$ |
8,681,772 |
|
|
$ |
184,795 |
|
|
$ |
8,496,977 |
|
|
$ |
— |
|
| Liabilities |
|
|
|
|
|
|
|
| Interest rate swap contracts |
|
|
|
|
|
|
|
| Customer-related positions |
$ |
17,880 |
|
|
$ |
— |
|
|
$ |
17,880 |
|
|
$ |
— |
|
| Risk participation agreements |
580 |
|
|
— |
|
|
580 |
|
|
— |
|
| Foreign currency forward contracts |
|
|
|
|
|
|
|
| Matched customer book |
46 |
|
|
— |
|
|
46 |
|
|
— |
|
| Foreign currency loan |
87 |
|
|
— |
|
|
87 |
|
|
— |
|
| Mortgage derivatives |
16 |
|
|
— |
|
|
16 |
|
|
— |
|
| Total |
$ |
18,609 |
|
|
$ |
— |
|
|
$ |
18,609 |
|
|
$ |
— |
|
There were no transfers to or from Level 1, 2 and 3 during the years ended December 31, 2022 and 2021.
The Company held no assets or liabilities measured at fair value on a recurring basis using significant unobservable inputs (Level 3) as of December 31, 2022 or December 31, 2021.
Fair Value of Assets and Liabilities Measured on a Nonrecurring Basis
The Company may also be required, from time to time, to measure certain other assets on a nonrecurring basis in accordance with generally accepted accounting principles. The following tables summarize the fair value of assets and liabilities measured at fair value on a nonrecurring basis, as of December 31, 2022 and 2021.
|
|
|
|
|
|
|
|
|
|
|
|
|
|
|
|
|
|
|
|
|
|
|
|
|
|
|
Fair Value Measurements at Reporting Date Using |
| Description |
Balance as of December 31, 2022 |
|
Quoted Prices
in Active
Markets for
Identical Assets
(Level 1) |
|
Significant
Other
Observable
Inputs (Level 2) |
|
Significant
Unobservable
Inputs (Level 3) |
|
(In thousands) |
| Assets |
|
|
|
|
|
|
|
| Individually assessed collateral-dependent loans whose fair value is based upon appraisals |
$ |
16,432 |
|
|
$ |
— |
|
|
$ |
— |
|
|
$ |
16,432 |
|
|
|
|
|
|
|
|
|
|
|
|
|
|
|
|
|
|
|
|
|
|
|
|
|
|
|
|
Fair Value Measurements at Reporting Date Using |
| Description |
Balance as of December 31, 2021 |
|
Quoted Prices
in Active
Markets for
Identical Assets
(Level 1) |
|
Significant
Other
Observable
Inputs (Level 2) |
|
Significant
Unobservable
Inputs (Level 3) |
|
(In thousands) |
| Assets |
|
|
|
|
|
|
|
Collateral-dependent impaired loans whose fair value is based upon appraisals |
$ |
12,068 |
|
|
$ |
— |
|
|
$ |
— |
|
|
$ |
12,068 |
|
For the valuation of the collateral-dependent loans, the Company relies primarily on third-party valuation information from certified appraisers and values are generally based upon recent appraisals of the underlying collateral, brokers’ opinions based upon recent sales of comparable properties, estimated equipment auction or liquidation values, income capitalization, or a combination of income capitalization and comparable sales. Depending on the type of underlying collateral, valuations may be adjusted by management for qualitative factors such as economic factors and estimated liquidation expenses. The range of these possible adjustments may vary. Refer to Note 2, “Summary of Significant Accounting Policies” and Note 5, “Loans and Allowance for Credit Losses” for further discussion regarding the Company’s adoption of ASU 2016-13 and the effect of that adoption on the management’s process for estimating the allowance for loan losses.
Loans for which a reserve was established based upon expected cash flows discounted at the loan’s effective interest rate are not deemed to be measured at fair value.
Disclosures about Fair Value of Financial Instruments
The estimated fair values and related carrying amounts for assets and liabilities for which fair value is only disclosed are shown below as of the dates indicated:
|
|
|
|
|
|
|
|
|
|
|
|
|
|
|
|
|
|
|
|
|
|
|
|
|
|
|
|
|
|
|
|
|
|
|
Fair Value Measurements at Reporting Date Using |
|
Carrying Value as of December 31, 2022 |
|
Fair Value as of December 31, 2022 |
|
Quoted Prices
in Active
Markets for
Identical Assets
(Level 1) |
|
Significant
Other
Observable
Inputs (Level 2) |
|
Significant
Unobservable
Inputs (Level 3) |
|
(In thousands) |
| Assets |
|
|
|
|
|
|
|
|
|
| Held to maturity securities: |
|
|
|
|
|
|
|
|
|
| Government-sponsored residential mortgage-backed securities |
$ |
276,493 |
|
|
$ |
246,343 |
|
|
$ |
— |
|
|
$ |
246,343 |
|
|
$ |
— |
|
| Government-sponsored commercial mortgage-backed securities |
200,154 |
|
|
176,883 |
|
|
— |
|
|
176,883 |
|
|
— |
|
| Loans, net of allowance for loan losses |
13,420,317 |
|
|
13,149,096 |
|
|
— |
|
|
— |
|
|
13,149,096 |
|
| FHLB stock |
41,363 |
|
|
41,363 |
|
|
— |
|
|
41,363 |
|
|
— |
|
| Bank-owned life insurance |
160,790 |
|
|
160,790 |
|
|
— |
|
|
160,790 |
|
|
— |
|
| Liabilities |
|
|
|
|
|
|
|
|
|
| Deposits |
$ |
18,974,359 |
|
|
$ |
18,960,407 |
|
|
$ |
— |
|
|
$ |
18,960,407 |
|
|
$ |
— |
|
| FHLB advances |
704,084 |
|
|
702,954 |
|
|
— |
|
|
702,954 |
|
|
— |
|
| Escrow deposits of borrowers |
22,314 |
|
|
22,314 |
|
|
— |
|
|
22,314 |
|
|
— |
|
| Interest rate swap collateral funds |
14,430 |
|
|
14,430 |
|
|
— |
|
|
14,430 |
|
|
— |
|
|
|
|
|
|
|
|
|
|
|
|
|
|
|
|
|
|
|
|
|
|
|
|
|
|
|
|
|
|
|
|
|
|
|
Fair Value Measurements at Reporting Date Using |
|
Carrying Value as of December 31, 2021 |
|
Fair Value as of December 31, 2021 |
|
Quoted Prices
in Active
Markets for
Identical Assets
(Level 1) |
|
Significant
Other
Observable
Inputs (Level 2) |
|
Significant
Unobservable
Inputs (Level 3) |
|
(In thousands) |
| Assets |
|
|
|
|
|
|
|
|
|
| Loans, net of allowance for loan losses |
$ |
12,157,281 |
|
|
$ |
12,282,323 |
|
|
$ |
— |
|
|
$ |
— |
|
|
$ |
12,282,323 |
|
| FHLB stock |
10,904 |
|
|
10,904 |
|
|
— |
|
|
10,904 |
|
|
— |
|
| Bank-owned life insurance |
157,091 |
|
|
157,091 |
|
|
— |
|
|
157,091 |
|
|
— |
|
| Liabilities |
|
|
|
|
|
|
|
|
|
| Deposits |
$ |
19,628,311 |
|
|
$ |
19,626,376 |
|
|
$ |
— |
|
|
$ |
19,626,376 |
|
|
$ |
— |
|
| FHLB advances |
14,020 |
|
|
13,558 |
|
|
— |
|
|
13,558 |
|
|
— |
|
| Escrow deposits of borrowers |
20,258 |
|
|
20,258 |
|
|
— |
|
|
20,258 |
|
|
— |
|
This summary excludes certain financial assets and liabilities for which the carrying value approximates fair value. For financial assets, these may include cash and due from banks, federal funds sold and short-term investments. For financial liabilities, these may include federal funds purchased. These instruments would all be considered to be classified as Level 1 within the fair value hierarchy. Also excluded from the summary are financial instruments measured at fair value on a recurring and nonrecurring basis, as previously described.
22. Revenue from Contracts with Customers
Revenue from contracts with customers within the scope of ASC 606, Revenue from Contracts with Customers (Topic 606) (“ASC 606”) is recognized when control of goods or services is transferred to the customer, in an amount that reflects the consideration to which the entity expects to be entitled in exchange for those goods and services. The Company considers the terms of the contract and all relevant facts and circumstances when applying this guidance. The Company measures revenue and timing of recognition by applying the following five steps:
1.Identify the contract(s) with the customers.
2.Identify the performance obligations.
3.Determine the transaction price.
4.Allocate the transaction price to the performance obligations.
5.Recognize revenue when (or as) the entity satisfies a performance obligation.
The Company accounts for a contract when it has approval and commitment from both parties, the rights of the parties are identified, payment terms are identified, the contract has commercial substance and collectability of consideration is probable.
The information presented within this Note excludes discontinued operations. Refer to Note 24, “Discontinued Operations” for further discussion regarding discontinued operations.
Performance obligations
The Company’s performance obligations are generally satisfied either at a point in time or over time, as services are rendered. Unsatisfied performance obligations at the report date are not material to the Company’s Consolidated Financial Statements.
A portion of the Company's noninterest income is derived from contracts with customers within the scope of ASC 606. The Company has disaggregated such revenues by type of service, as presented in the table below. These categories reflect how the nature, amount, timing, and uncertainty of revenue and cash flows are affected by economic factors.
|
|
|
|
|
|
|
|
|
|
|
|
|
|
|
|
|
|
|
For the Year Ended December 31, |
|
2022 |
|
2021 |
|
2020 |
|
(In thousands) |
| Service charges on deposit accounts |
$ |
30,392 |
|
|
$ |
24,271 |
|
|
$ |
21,560 |
|
| Trust and investment advisory fees |
23,593 |
|
|
24,588 |
|
|
21,102 |
|
| Debit card processing fees |
12,644 |
|
|
12,118 |
|
|
10,277 |
|
| Other non-interest income |
10,670 |
|
|
8,446 |
|
|
7,228 |
|
| Total noninterest income in-scope of ASC 606 |
77,299 |
|
|
69,423 |
|
|
60,167 |
|
| Total noninterest (loss) income out-of-scope of ASC 606 |
(549) |
|
|
28,014 |
|
|
23,512 |
|
| Total noninterest income |
$ |
76,750 |
|
|
$ |
97,437 |
|
|
$ |
83,679 |
|
Additional information related to each of the revenue streams is further noted below.
Deposit Service Charges
The Company offers various deposit account products to its customers governed by specific deposit agreements applicable to either personal customers or business customers. These agreements identify the general conditions and obligations of both parties and include standard information regarding deposit account-related fees.
Deposit account services include providing access to deposit accounts as well as access to the various deposit transactional services of the Company. These transactional services are primarily those that are identified in the standard fee schedule, and include, but are not limited to, services such as overdraft protection, wire transfer, and check collection. The Company may charge monthly fixed service fees associated with the customer having access to the deposit account as well as separate fixed fees associated with and at the time specific transactions are entered into by the customer. As such, the Company considers that its performance obligations are fulfilled when customers are provided deposit account access or when the requested deposit transaction is completed.
Cash management services are a subset of the deposit service charges revenue stream. These services include automated clearing house, or ACH, transaction processing, positive pay, lockbox, and remote deposit services. These services are also governed by separate agreements entered into by the customer. The fee arrangement for these services is structured as a fixed fee per transaction which may be offset by earnings credits. An earnings credit is a discount that a customer receives based upon the investable balance in the applicable covered deposit account(s) for a given month. Earnings credits are only good for the given month. That is, if cash management fees for a given month are less than the month’s earnings credit, the remainder of the credit does not carry over to the following month. Cash management fees are recognized as revenue in the month that the services are provided. Cash management fees earned but not yet received amounted to $2.1 million and $1.8 million as of December 31, 2022 and 2021 respectively, and were included in other assets.
Trust and Investment Advisory Fees
The Company offers investment management and trust services to individuals, institutions, small businesses and charitable institutions. Each investment management product is governed by its own contract along with a separate identifiable fee schedule unique to that product. The Company also offers additional services, such as estate settlement, financial planning, tax services, and other special services quoted at the customer’s request.
The asset management and/or custody fees are primarily based upon a percentage of the monthly valuation of the principal assets in the customer’s account. Customers are also charged a base fee which is prorated over a twelve-month period. Fees for additional or special services are generally fixed in nature and are charged as services are rendered. All revenue is recognized in correlation to the monthly management fee determinations or as transactional services are provided.
Debit Card Processing Fees
The Company provides debit cards to its customers which are authorized and settled through various card payment networks, and in exchange, the Company earns revenue as determined by each payment network’s interchange program. Regardless of the network that is utilized to authorize and settle the payment, the merchant that provides the product or service to the debit card holder is ultimately responsible for the interchange payment to the Company. Debit card processing fees are recognized as card transactions are settled within each network. Debit card processing fees earned but not yet received amounted to $0.3 million as of both December 31, 2022 and 2021 and were included in other assets.
Other Noninterest Income
The Company earns various types of other noninterest income that have been aggregated into one general revenue stream in the table noted above. Noninterest income includes, but is not limited to, the following types of revenue with customers: safe deposit rent, ATM surcharge fees and customer checkbook fees. Individually, these sources of noninterest income are not material.
23. Other Comprehensive Income
The following tables present a reconciliation of the changes in the components of other comprehensive income (loss) for the dates indicated including the amount of income tax benefit (expense) allocated to each component of other comprehensive (loss) income:
|
|
|
|
|
|
|
|
|
|
|
|
|
|
|
|
|
|
|
For the Year Ended December 31, 2022 |
|
Pre Tax
Amount |
|
Tax Benefit (Expense) |
|
After Tax
Amount |
|
(In thousands) |
| Unrealized losses on securities available for sale: |
|
|
|
|
|
| Change in fair value of securities available for sale |
$ |
(1,061,859) |
|
|
$ |
238,005 |
|
|
$ |
(823,854) |
|
| Less: reclassification adjustment for losses included in net income |
(3,157) |
|
|
873 |
|
|
(2,284) |
|
| Net change in fair value of securities available for sale |
(1,058,702) |
|
|
237,132 |
|
|
(821,570) |
|
| Unrealized losses on cash flow hedges: |
|
|
|
|
|
Change in fair value of cash flow hedges(1) |
(69,010) |
|
|
18,377 |
|
|
(50,633) |
|
Less: net cash flow hedge gains reclassified into interest income(1) |
9,580 |
|
|
(2,693) |
|
|
6,887 |
|
| Net change in fair value of cash flow hedges |
(78,590) |
|
|
21,070 |
|
|
(57,520) |
|
| Defined benefit pension plans: |
|
|
|
|
|
| Change in actuarial net loss |
6,323 |
|
|
(1,777) |
|
|
4,546 |
|
| Less: amortization of actuarial net loss |
(11,032) |
|
|
3,101 |
|
|
(7,931) |
|
| Less: Defined Benefit Plan settlement loss |
(12,045) |
|
|
3,386 |
|
|
(8,659) |
|
| Less: net accretion of prior service credit |
11,882 |
|
|
(3,340) |
|
|
8,542 |
|
| Net change in other comprehensive income for defined benefit pension plans |
17,518 |
|
|
(4,924) |
|
|
12,594 |
|
| Total other comprehensive loss |
$ |
(1,119,774) |
|
|
$ |
253,278 |
|
|
$ |
(866,496) |
|
|
|
|
|
|
|
|
|
|
|
|
|
|
|
|
|
|
|
|
For the Year Ended December 31, 2021 |
|
Pre Tax
Amount |
|
Tax Benefit (Expense) |
|
After Tax
Amount |
|
(In thousands) |
| Unrealized (losses) gains on securities available for sale: |
|
|
|
|
|
| Change in fair value of securities available for sale |
$ |
(133,466) |
|
|
$ |
30,117 |
|
|
$ |
(103,349) |
|
| Less: reclassification adjustment for gains included in net income |
1,166 |
|
|
(257) |
|
|
909 |
|
| Net change in fair value of securities available for sale |
(134,632) |
|
|
30,374 |
|
|
(104,258) |
|
| Unrealized gains on cash flow hedges: |
|
|
|
|
|
Change in fair value of cash flow hedges(1) |
— |
|
|
— |
|
|
— |
|
Less: net cash flow hedge gains reclassified into interest income(1) |
31,234 |
|
|
(8,780) |
|
|
22,454 |
|
| Net change in fair value of cash flow hedges |
(31,234) |
|
|
8,780 |
|
|
(22,454) |
|
| Defined benefit pension plans: |
|
|
|
|
|
| Change in actuarial net gain |
19,243 |
|
|
(5,409) |
|
|
13,834 |
|
| Less: amortization of actuarial net loss |
(13,400) |
|
|
3,767 |
|
|
(9,633) |
|
| Plan amendment - Century acquisition lump sum distribution option |
1,106 |
|
|
(311) |
|
|
795 |
|
| Less: net accretion of prior service credit |
11,796 |
|
|
(3,316) |
|
|
8,480 |
|
| Net change in other comprehensive income for defined benefit pension plans |
21,953 |
|
|
(6,171) |
|
|
15,782 |
|
| Total other comprehensive loss |
$ |
(143,913) |
|
|
$ |
32,983 |
|
|
$ |
(110,930) |
|
|
|
|
|
|
|
|
|
|
|
|
|
|
|
|
|
|
|
|
For the Year Ended December 31, 2020 |
|
Pre Tax
Amount |
|
Tax (Expense)
Benefit |
|
After Tax
Amount |
|
(Dollars in thousands) |
| Unrealized gains on securities available for sale: |
|
|
|
|
|
| Change in fair value of securities available for sale |
$ |
30,926 |
|
|
$ |
(6,828) |
|
|
$ |
24,098 |
|
| Less: reclassification adjustment for gains included in net income |
288 |
|
|
(64) |
|
|
224 |
|
| Net change in fair value of securities available for sale |
30,638 |
|
|
(6,764) |
|
|
23,874 |
|
| Unrealized gains (losses) on cash flow hedges: |
|
|
|
|
|
Change in fair value of cash flow hedges(1) |
46,871 |
|
|
(13,175) |
|
|
33,696 |
|
Less: net cash flow hedge gains reclassified into interest income(1) |
27,131 |
|
|
(7,626) |
|
|
19,505 |
|
| Net change in fair value of cash flow hedges |
19,740 |
|
|
(5,549) |
|
|
14,191 |
|
| Defined benefit pension plans: |
|
|
|
|
|
| Change in actuarial net gain |
(58,811) |
|
|
16,532 |
|
|
(42,279) |
|
| Less: amortization of actuarial net loss |
(10,787) |
|
|
3,033 |
|
|
(7,754) |
|
| Plan amendment - prior service credit |
133,439 |
|
|
(37,510) |
|
|
95,929 |
|
| Less: net accretion of prior service credit |
1,931 |
|
|
(543) |
|
|
1,388 |
|
| Net change in other comprehensive income for defined benefit pension plans |
83,484 |
|
|
(23,468) |
|
|
60,016 |
|
| Total other comprehensive income |
$ |
133,862 |
|
|
$ |
(35,781) |
|
|
$ |
98,081 |
|
(1)Includes amortization of $7.3 million, $22.5 million, and $11.4 million for the years ended December 31, 2022, 2021, and 2020, respectively, of the remaining balance of realized but unrecognized gains, net of tax, from the termination of interest rate swaps. The total realized gain of $41.2 million, net of tax, will be recognized in earnings through January 2023. The balance of this gain had amortized to less than $0.1 million, $7.4 million, and $29.8 million, net of tax, at December 31, 2022, December 31, 2021, and December 31, 2020, respectively.
The following table illustrates the changes in the balances of each component of accumulated other comprehensive income (loss), net of tax:
|
|
|
|
|
|
|
|
|
|
|
|
|
|
|
|
|
|
|
|
|
|
|
|
|
Unrealized
(Losses) and
Gains on
Available for
Sale Securities |
|
Unrealized
(Losses) and Gains on
Cash Flow
Hedges |
|
Defined Benefit
Pension Plans |
|
Total |
|
(In thousands) |
| Beginning balance: January 1, 2020 |
$ |
21,798 |
|
|
$ |
15,624 |
|
|
$ |
(81,269) |
|
|
$ |
(43,847) |
|
| Other comprehensive income before reclassifications |
24,098 |
|
|
33,696 |
|
|
53,650 |
|
|
111,444 |
|
| Less: Amounts reclassified from accumulated other comprehensive income |
224 |
|
|
19,505 |
|
|
(6,366) |
|
|
13,363 |
|
| Net current-period other comprehensive income |
23,874 |
|
|
14,191 |
|
|
60,016 |
|
|
98,081 |
|
| Ending balance: December 31, 2020 |
$ |
45,672 |
|
|
$ |
29,815 |
|
|
$ |
(21,253) |
|
|
$ |
54,234 |
|
| Other comprehensive (loss) income before reclassifications |
(103,349) |
|
|
— |
|
|
14,629 |
|
|
(88,720) |
|
| Less: Amounts reclassified from accumulated other comprehensive income |
909 |
|
|
22,454 |
|
|
(1,153) |
|
|
22,210 |
|
| Net current-period other comprehensive (loss) income |
(104,258) |
|
|
(22,454) |
|
|
15,782 |
|
|
(110,930) |
|
| Ending balance: December 31, 2021 |
$ |
(58,586) |
|
|
$ |
7,361 |
|
|
$ |
(5,471) |
|
|
$ |
(56,696) |
|
| Other comprehensive (loss) income before reclassifications |
(823,854) |
|
|
(50,633) |
|
|
4,546 |
|
|
(869,941) |
|
| Less: Amounts reclassified from accumulated other comprehensive income |
(2,284) |
|
|
6,887 |
|
|
(8,048) |
|
|
(3,445) |
|
| Net current-period other comprehensive (loss) income |
(821,570) |
|
|
(57,520) |
|
|
12,594 |
|
|
(866,496) |
|
| Ending balance: December 31, 2022 |
$ |
(880,156) |
|
|
$ |
(50,159) |
|
|
$ |
7,123 |
|
|
$ |
(923,192) |
|
The following table illustrates the significant amounts reclassified out of each component of accumulated other comprehensive (loss)/income, net of tax:
|
|
|
|
|
|
|
|
|
|
|
|
|
|
|
|
|
|
|
|
|
|
|
|
|
|
|
|
|
Year Ended December 31, |
|
|
| Details about Accumulated Other Comprehensive (Loss)/Income Components |
|
2022 |
|
2021 |
|
2020 |
|
Affected Line Item in the Statement Where Net Income is Presented |
|
|
(In thousands) |
|
|
| Unrealized (losses) and gains on available-for-sale securities |
|
$ |
(3,157) |
|
|
$ |
1,166 |
|
|
$ |
288 |
|
|
(Losses) gains on sales of securities available for sale, net |
|
|
(3,157) |
|
|
1,166 |
|
|
288 |
|
|
Total before tax |
|
|
873 |
|
|
(257) |
|
|
(64) |
|
|
Tax benefit or (expense) |
|
|
$ |
(2,284) |
|
|
$ |
909 |
|
|
$ |
224 |
|
|
Net of tax |
| Unrealized gains on cash flow hedges |
|
$ |
9,580 |
|
|
$ |
31,234 |
|
|
$ |
27,131 |
|
|
Interest income |
|
|
9,580 |
|
|
31,234 |
|
|
27,131 |
|
|
Total before tax |
|
|
(2,693) |
|
|
(8,780) |
|
|
(7,626) |
|
|
Tax expense |
|
|
$ |
6,887 |
|
|
$ |
22,454 |
|
|
$ |
19,505 |
|
|
Net of tax |
| Amortization of defined benefit pension items |
|
$ |
(23,077) |
|
|
$ |
(13,400) |
|
|
$ |
(10,787) |
|
|
Net periodic pension cost - see Note 17 |
| Accretion of prior service credit |
|
11,882 |
|
|
11,796 |
|
|
1,931 |
|
|
Net periodic pension cost - see Note 17 |
|
|
(11,195) |
|
|
(1,604) |
|
|
(8,856) |
|
|
Total before tax |
|
|
3,147 |
|
|
451 |
|
|
2,490 |
|
|
Tax benefit |
|
|
$ |
(8,048) |
|
|
$ |
(1,153) |
|
|
$ |
(6,366) |
|
|
Net of tax |
| Total reclassifications for the period |
|
$ |
(3,445) |
|
|
$ |
22,210 |
|
|
$ |
13,363 |
|
|
|
24. Discontinued Operations
On September 19, 2023, the Company announced that it had entered into an asset purchase agreement (“the agreement”) with Arthur J. Gallagher & Co. (“Gallagher”) to sell substantially all of the assets of its insurance agency business for a gross purchase price of $515.0 million. The agreement also provides for the assumption of certain liabilities of the insurance agency business by Gallagher. Management made the decision to sell certain assets of its insurance agency business to recognize the valuation premium of the business, while allowing the Company to focus on growth and strategic initiatives of its core banking business. Refer to Note 27, “Subsequent Events” for additional discussion.
In September 2023, following the approval of the sale by the Company’s board of directors, the Company reclassified substantially all of the assets and certain liabilities of its insurance agency business as held for sale in connection with a planned disposition of the business. A business is classified as held for sale when management, having the authority to approve the action, commits to a plan to sell the business, the sale is probable to occur during the next 12 months at a price that is reasonable in relation to its current fair value, and certain other criteria are met. In accordance with ASC 205, Presentation of Financial Statements, the Company classifies operations as discontinued when they meet all the criteria to be classified as held for sale and when the sale represents a strategic shift that will have a major impact on the Company’s financial condition and results of operations. Accordingly, the Consolidated Balance Sheets, Consolidated Statements of Income, and Consolidated Statements of Cash flows present discontinued operations for the current period and were adjusted on a retrospective basis for prior periods.
The following is a summary of the assets and liabilities of the discontinued insurance agency business as of December 31, 2022 and December 31, 2021:
|
|
|
|
|
|
|
|
|
|
|
|
|
December 31, 2022 |
|
December 31, 2021 |
|
(In thousands) |
| Assets |
|
|
|
| Premises and equipment |
$ |
163 |
|
|
$ |
429 |
|
| Goodwill and intangibles, net |
93,117 |
|
|
80,496 |
|
| Deferred income taxes, net |
(315) |
|
|
446 |
|
| Prepaid expenses |
532 |
|
|
527 |
|
| Other assets |
34,722 |
|
|
32,120 |
|
| Total assets |
$ |
128,219 |
|
|
$ |
114,018 |
|
| Liabilities |
|
|
|
| Other liabilities |
$ |
34,930 |
|
|
$ |
31,222 |
|
| Total liabilities |
$ |
34,930 |
|
|
$ |
31,222 |
|
Certain assets and liabilities previously reported as assets and liabilities of the insurance agency business will not be disposed of and will be transferred into the Bank upon dissolution of Eastern Insurance Group following the asset sale. The following is a summary of such assets and liabilities as of December 31, 2022 and 2021:
|
|
|
|
|
|
|
|
|
|
|
|
|
December 31, 2022 |
|
December 31, 2021 |
|
(In thousands) |
| Assets |
|
|
|
| Cash |
$ |
66,507 |
|
|
$ |
69,161 |
|
| Premises and equipment (1) |
1,792 |
|
|
1,884 |
|
| Bank-owned life insurance |
2,066 |
|
|
2,012 |
|
| Deferred income taxes |
3,662 |
|
|
315 |
|
| Other assets (2) |
12,944 |
|
|
17,377 |
|
| Total assets |
$ |
86,971 |
|
|
$ |
90,749 |
|
| Liabilities |
|
|
|
| Other liabilities (3) |
$ |
14,013 |
|
|
$ |
18,497 |
|
| Total liabilities |
$ |
14,013 |
|
|
$ |
18,497 |
|
(1)Includes buildings and related improvements.
(2)Primarily includes assets held in rabbi trusts and the ROU asset associated with one lease which will be assumed by the Bank upon dissolution of Eastern Insurance Group following the sale.
(3)Primarily includes employee post-retirement liabilities and the lease liability associated with one lease which will be assumed by the Bank upon dissolution of Eastern Insurance Group following the sale.
The following presents operating results of the discontinued insurance agency business for the periods indicated:
|
|
|
|
|
|
|
|
|
|
|
|
|
|
|
|
|
|
|
For the Years Ended December 31, |
|
2022 |
|
2021 |
|
2020 |
|
(In thousands) |
| Noninterest income: |
|
|
|
|
|
| Insurance commissions |
$ |
99,887 |
|
|
$ |
95,164 |
|
|
$ |
95,195 |
|
| Other noninterest income |
179 |
|
|
1,014 |
|
|
199 |
|
| Total noninterest income |
100,066 |
|
|
96,178 |
|
|
95,394 |
|
| Noninterest expense: |
|
|
|
|
|
| Salaries and employee benefits |
65,089 |
|
|
68,292 |
|
|
60,593 |
|
| Office occupancy and equipment |
3,319 |
|
|
3,204 |
|
|
3,176 |
|
| Data processing |
4,335 |
|
|
4,424 |
|
|
4,049 |
|
| Professional services |
1,009 |
|
|
596 |
|
|
770 |
|
| Marketing expenses |
246 |
|
|
241 |
|
|
152 |
|
| Amortization of intangible assets |
2,666 |
|
|
2,293 |
|
|
2,261 |
|
| Other |
4,944 |
|
|
4,411 |
|
|
5,131 |
|
| Total noninterest expense |
81,608 |
|
|
83,461 |
|
|
76,132 |
|
| Income from discontinued operations before income tax expense |
18,458 |
|
|
12,717 |
|
|
19,262 |
|
| Income tax expense |
5,210 |
|
|
3,583 |
|
|
5,385 |
|
| Income from discontinued operations, net of taxes |
$ |
13,248 |
|
|
$ |
9,134 |
|
|
$ |
13,877 |
|
Certain income and expense amounts were excluded from discontinued operations as they relate to assets and liabilities which will not be assumed by Gallagher. The following is a summary of such items and the corresponding income tax effect for the periods indicated:
|
|
|
|
|
|
|
|
|
|
|
|
|
|
|
|
|
|
|
Years Ended December 31, |
|
2022 |
|
2021 |
|
2020 |
|
(In thousands) |
| Noninterest income: |
|
|
|
|
|
| (Losses) income from investments held in rabbi trusts |
$ |
(1,305) |
|
|
$ |
937 |
|
|
$ |
1,293 |
|
| Other noninterest income (1) |
54 |
|
|
52 |
|
|
52 |
|
| Total noninterest income |
(1,251) |
|
|
989 |
|
|
1,345 |
|
| Noninterest expense: |
|
|
|
|
|
| Salaries and employee benefits (2) |
(1,292) |
|
|
967 |
|
|
1,098 |
|
| Office occupancy and equipment (3) |
499 |
|
|
501 |
|
|
511 |
|
| Other (4) |
2,396 |
|
|
(2,151) |
|
|
64 |
|
| Total noninterest expense |
1,603 |
|
|
(683) |
|
|
1,673 |
|
| (Loss) income before income tax expense |
(2,854) |
|
|
1,672 |
|
|
(328) |
|
| Income tax (benefit) expense |
(802) |
|
|
470 |
|
|
(92) |
|
| Net (loss) income |
(2,052) |
|
|
1,202 |
|
|
(236) |
|
(1)Includes income on Company-owned life insurance policies which will not be disposed of and will be transferred into the Bank upon dissolution of Eastern Insurance Group.
(2)Includes expenses, which were a net credit for the year ended December 31, 2022, associated with certain employee post-retirement benefit plan expenses.
(3)Includes depreciation expense associated with buildings and related improvements and ROU asset amortization related to one lease which will not be disposed of and will be transferred into the Bank upon dissolution of Eastern Insurance Group.
(4)Includes intercompany expenses and other credits associated with the Defined Benefit Plan and BEP. Components of net periodic benefit cost associated with the Defined Benefit Plan and BEP and included in other noninterest expense above were a net credit for the periods presented.
Continuing Involvement
Pursuant to the agreement, the Company will perform certain transitional services to Gallagher for up to 6 months following the closing of the sale. Such services include certain information and technology support and human resources support. The Company will be compensated for such services on a monthly basis and estimates the total compensation to be $1.0 million over the six month period plus reimbursement of any amounts paid by the Company in connection with its performance of the transitional services.
Leases
The amounts of ROU asset and lease liability of leases included in assets and liabilities of discontinued operations and which will either be assumed by Gallagher or terminated by the Company were $8.7 million and $9.2 million, respectively, at December 31, 2022 and $9.8 million and $10.4 million, respectively, at December 31, 2021. The Company retained one lease for which Eastern Insurance Group was lessee at the time of closing. The lease will be partially sublet to Gallagher and transferred to the Bank upon dissolution of Eastern Insurance Group following the sale. The ROU asset and lease liability for such lease was $1.9 million and $2.2 million, respectively, at December 31, 2022 and $2.3 million and $2.5 million, respectively, at December 31, 2021.
Revenue Recognition - Insurance Commissions
The Company currently acts as an agent in offering property, casualty, and life and health insurance to both commercial and consumer customers though Eastern Insurance Group. The Company may also earn additional commissions from the insurers based upon meeting certain criteria, such as premium levels, growth rates, new business volume and loss experience. The Company recognizes commission revenues when earned based upon the effective date of the policy or when services are rendered. Certain revenues are deferred to reflect delivery of services over the contract period. Upon the transfer of Eastern Insurance Group’s assets to Arthur J. Gallagher & Co., which occurred on October 31, 2023, the Company ceased to offer insurance products and services and thus no longer receives insurance-related commissions and revenues. The Company earns a fixed commission rate on the sales of these products and services.
Commissions are earned on the contract effective date and generally are based upon a percentage of premiums for insurance coverage. Commission rates depend upon a large number of factors, including the type of risk being placed, the particular underwriting enterprise’s demand, the expected loss experience of the particular risk coverage, and historical benchmarks surrounding the level of effort necessary for the Company to place and service the insurance contract. The vast majority of the Company’s services and revenues are associated with the placement of an insurance contract. Insurance commissions earned but not yet received amounted to $15.1 million and $15.6 million as of December 31, 2022 and December 31, 2021, respectively, and were included in assets of discontinued operations on the Consolidated Balance Sheets.
The Company also earns profit-sharing revenues, also referred to as contingency revenue, from the insurers with whom the Company places business. These profit-sharing revenues are performance bonuses from the insurers based upon certain performance metrics such as floors on written premiums, loss rates, and growth rates. These amounts are in excess of the commission revenues discussed above, and not all business placed with underwriting enterprises is eligible for contingent revenues. Contingent revenues are variable and generally based upon the Company’s expectation of the ultimate profit-sharing revenue amounts to be earned and can vary from period to period. The Company’s contracts are generally calendar year contracts whereby revenues from underwriting enterprises are received in the calendar year following placement, generally the first and second quarters, after verification of the performance indicators outlined in the contracts. Accordingly, during each reporting period, management must make its best estimate of the amounts that have been earned using historical averages and other factors to project revenues. The Company bases its estimates each period on a contract-by-contract basis. As estimates may change significantly from period to period, the Company does not recognize this revenue until it has concluded that, based on all the facts and information available, it is probable that a significant revenue reversal will not occur in future periods.
Insurance Agency Acquisitions
During the year ended December 31, 2022, the Company completed acquisitions of two insurance agencies for cash consideration of $5.2 million and $8.2 million, respectively, for aggregate total cash consideration of $13.4 million. Both acquisitions were categorized as business combinations and were accounted for using the acquisition method. The following table summarizes the aggregate estimated fair value of the assets acquired and liabilities assumed for these acquisitions:
|
|
|
|
|
|
|
Acquisition Date Balance |
|
(In thousands) |
| Assets acquired: |
|
| Customer list intangible |
$ |
6,120 |
|
| Non-compete intangible |
440 |
|
| Other |
40 |
|
| Total assets acquired |
6,600 |
|
| Consideration: |
|
| Total cash paid |
(13,400) |
|
| Contingent consideration |
(1,926) |
|
| Other liabilities assumed |
— |
|
| Total fair value of consideration |
(15,326) |
|
| Goodwill |
$ |
8,726 |
|
In connection with these acquisitions, the Company recorded contingent consideration liabilities related to attainment of revenue targets over a period of time after the respective acquisition dates. The amounts of contingent consideration liabilities recorded were based upon management’s best estimate of possible outcomes as of the date of the respective acquisitions. The Company recorded contingent consideration liabilities of $0.7 million and $1.2 million and per the purchase agreements, the payouts ranged from $0 to $0.8 million and $0 to $1.4 million, respectively. During the year ended December 31, 2022, the Company did not have any material charges to expense or payments to adjust the acquisition-related contingent consideration liabilities recorded.
For tax purposes, the acquisitions were considered asset acquisitions and as such, the amortization of goodwill and intangible assets is deductible for tax purposes. Acquisition-related legal and professional fee costs of $0.3 million were charged to expense during the year ended December 31, 2022, and were included in the professional services line item of the consolidated statements of income. These acquisitions were not considered significant to the Company’s Consolidated Financial Statements and, therefore, pro forma data and certain other disclosures have been excluded.
During the year ended December 31, 2021, the Company completed acquisitions of two insurance agencies for cash consideration of $0.5 million and $3.9 million, respectively, for aggregate total cash consideration of $4.4 million. Both acquisitions were categorized as business combinations and were accounted for using the acquisition method. The following table summarizes the aggregate estimated fair value of the assets acquired and liabilities assumed for these acquisitions:
|
|
|
|
|
|
|
Acquisition Date Balance |
|
(In thousands) |
| Assets acquired: |
|
| Customer list intangible |
$ |
1,860 |
|
| Non-compete intangible |
170 |
|
| Other |
133 |
|
| Total assets acquired |
2,163 |
|
| Consideration: |
|
| Total cash paid |
(4,354) |
|
| Contingent consideration |
(449) |
|
| Other liabilities assumed |
(355) |
|
| Total fair value of consideration |
(5,158) |
|
| Goodwill |
$ |
2,995 |
|
In connection with one of these acquisitions, the Company recorded a contingent consideration liability related to attainment of revenue targets over a period of time after the acquisition date. The amount of contingent consideration liability recorded was based upon management’s best estimate of possible outcomes as of the date of acquisition. The Company recorded a contingent consideration liability of $0.4 million, and per the purchase agreement, the payout ranged from $0 to $0.5 million. During the year ended December 31, 2021, the Company did not have any material charges to expense or payments to adjust the acquisition-related contingent consideration liability recorded.
For tax purposes, the acquisitions were considered asset acquisitions and as such, the amortization of goodwill and intangible assets is deductible for tax purposes. Acquisition-related legal and professional fee costs of less than $0.1 million were charged to expense during the year ended December 31, 2021, and were included in the professional services line item of the Consolidated Statements of Income. These acquisitions were not considered significant to the Company’s Consolidated Financial Statements and, therefore, pro forma data and certain other disclosures have been excluded.
25. Parent Company Financial Statements
Condensed financial information relative to Eastern Bankshares Inc.'s (“the parent company”) balance sheets at December 31, 2022 and 2021 and the related statements of income and cash flows for the years ended December 31, 2022, 2021 and 2020 are presented below. The statement of shareholders’ equity is not presented below as the parent company’s shareholders’ equity is that of the consolidated Company.
|
|
|
|
|
|
|
|
|
|
|
|
| BALANCE SHEETS |
|
As of December 31, |
|
2022 |
|
2021 |
|
(In thousands) |
| Assets |
|
|
|
Cash and cash equivalents(1) |
$ |
126,441 |
|
|
$ |
134,671 |
|
| Goodwill and other intangibles, net |
744 |
|
|
744 |
|
| Deferred income taxes, net |
13,182 |
|
|
17,974 |
|
| Investment in subsidiaries |
2,327,521 |
|
|
3,250,133 |
|
| Other assets |
4,557 |
|
|
3,080 |
|
| Total assets |
$ |
2,472,445 |
|
|
$ |
3,406,602 |
|
| Liabilities and shareholders’ equity |
|
|
|
| Other liabilities |
$ |
655 |
|
|
$ |
250 |
|
| Total liabilities |
655 |
|
|
250 |
|
| Shareholders’ equity |
2,471,790 |
|
|
3,406,352 |
|
| Total liabilities and shareholders’ equity |
$ |
2,472,445 |
|
|
$ |
3,406,602 |
|
(1)Includes $125.0 million and $133.5 that is eliminated in consolidation as of December 31, 2022 and 2021, respectively.
|
|
|
|
|
|
|
|
|
|
|
|
|
|
|
|
|
|
| STATEMENTS OF INCOME |
|
For the Year Ended December 31, |
|
2022 |
|
2021 |
|
2020 |
|
(In thousands) |
| Income |
|
|
|
|
|
| Interest income |
$ |
15 |
|
|
$ |
— |
|
|
$ |
— |
|
| Total income |
15 |
|
|
— |
|
|
— |
|
| Expenses |
|
|
|
|
|
| Professional services |
899 |
|
|
7,393 |
|
|
1,485 |
|
| Charitable contributions |
— |
|
|
— |
|
|
91,287 |
|
| Other |
3,070 |
|
|
222 |
|
|
151 |
|
| Total expenses |
3,969 |
|
|
7,615 |
|
|
92,923 |
|
| Loss before income taxes and equity in undistributed income of subsidiaries |
(3,954) |
|
|
(7,615) |
|
|
(92,923) |
|
| Income tax expense (benefit) |
269 |
|
|
(11,344) |
|
|
(13,933) |
|
| (Loss) income before equity in undistributed income of subsidiaries |
(4,223) |
|
|
3,729 |
|
|
(78,990) |
|
| Equity in undistributed income of subsidiaries |
203,982 |
|
|
150,936 |
|
|
101,728 |
|
| Net income |
$ |
199,759 |
|
|
$ |
154,665 |
|
|
$ |
22,738 |
|
|
|
|
|
|
|
|
|
|
|
|
|
|
|
|
|
|
|
| STATEMENTS OF CASH FLOWS |
|
For the Year Ended December 31, |
|
2022 |
|
2021 |
|
2020 |
|
(In thousands) |
| Cash flows provided by operating activities |
|
|
|
|
|
| Net income |
$ |
199,759 |
|
|
$ |
154,665 |
|
|
$ |
22,738 |
|
| Adjustments to reconcile net income to cash provided by operating activities |
|
|
|
|
|
| Equity in undistributed income of subsidiaries |
(203,982) |
|
|
(150,936) |
|
|
(101,728) |
|
| Issuance of common shares donated to the Eastern Bank Foundation |
— |
|
|
— |
|
|
91,287 |
|
| Share-based compensation |
10,507 |
|
|
— |
|
|
— |
|
| ESOP expense |
9,923 |
|
|
9,408 |
|
|
2,351 |
|
| Change in: |
|
|
|
|
|
| Deferred income taxes, net |
4,792 |
|
|
(7,157) |
|
|
(10,817) |
|
| Other, net |
(937) |
|
|
(388) |
|
|
(350) |
|
| Net cash provided by operating activities |
20,062 |
|
|
5,592 |
|
|
3,481 |
|
| Cash flows provided by (used in) investing activities |
|
|
|
|
|
| Investment in Eastern Bank |
— |
|
|
— |
|
|
(882,096) |
|
| Cash paid for acquisition, net of cash acquired |
— |
|
|
(640,890) |
|
|
— |
|
| Return of investments in subsidiary |
240,000 |
|
|
140,000 |
|
|
— |
|
| Contributions to other equity investments |
(788) |
|
|
— |
|
|
— |
|
| Net cash provided by (used in) investing activities |
239,212 |
|
|
(500,890) |
|
|
(882,096) |
|
| Cash flows (used in) provided by financing activities |
|
|
|
|
|
| Proceeds from issuance of common shares |
— |
|
|
— |
|
|
1,792,878 |
|
| Purchase of shares by ESOP |
— |
|
|
— |
|
|
(149,407) |
|
| Payments for deferred offering costs |
— |
|
|
— |
|
|
(28,552) |
|
Payment of subordinated debentures assumed in business combination (1) |
— |
|
|
(36,277) |
|
|
— |
|
| Payments for shares repurchased under share repurchase plans |
(201,618) |
|
|
(23,224) |
|
|
— |
|
| Dividends declared and paid to common shareholders |
(65,886) |
|
|
(51,564) |
|
|
— |
|
| Net cash (used in) provided by financing activities |
(267,504) |
|
|
(111,065) |
|
|
1,614,919 |
|
| Net (decrease) increase in cash and cash equivalents |
(8,230) |
|
|
(606,363) |
|
|
736,304 |
|
| Cash and cash equivalents at beginning of year |
134,671 |
|
|
741,034 |
|
|
4,730 |
|
| Cash and cash equivalents at end of year |
$ |
126,441 |
|
|
$ |
134,671 |
|
|
$ |
741,034 |
|
(1)The Company deposited funds into escrow prior to the Century acquisition date to pay the balance of subordinated debentures assumed in the Century acquisition which was considered to be defeasance of the debt. Accordingly, Century recorded a payable to the Company in the amount of the escrow deposit and the Company recorded a receivable from Century in the same amount. The payable was reclassified to other assets upon acquisition and is reflected as such balance in the summary of net assets acquired included in Note 3 to the Consolidated Financial Statements. Subsequent to the closing of the acquisition and prior to December 31, 2021, the amounts placed in escrow were disbursed to the holders of the subordinated debentures resulting in a full pay-off of the outstanding balance of the debt.
26. Related Parties
The Company has, and expects to have in the future, related party transactions in the ordinary course of business. The transactions include, but are not limited to, lending activities and deposit services with directors and executive officers of the Company and their affiliates. Based on the Company’s assessment, such transactions are consistent with prudent banking practices and are within applicable banking regulations. During the years ended December 31, 2022, 2021 and 2020, no such transactions involved amounts in excess of 5% of the Company’s total shareholders’ equity.
27. Subsequent Events
Balance Sheet Repositioning–Securities Sales
In March 2023, the Company completed a balance sheet repositioning by selling lower yielding AFS securities for aggregate proceeds of $1.9 billion. The securities were sold at a loss of $333.2 million. The proceeds from the sale of such securities have been used to increase cash levels and may be used to reduce wholesale funds over time.
The Company established a $17.4 million valuation allowance against the capital loss carryforward deferred tax asset which resulted from the sale of securities for the amount of deferred tax asset management believed was not more-likely-than-not to be realized. As a result of the execution of the agreement to sell the Company’s insurance agency business in September 2023 and the determination of the resulting capital gain, management determined it to be more-likely-than-not that the Company will realize federal capital losses related to the securities sale. Consequently, the Company reversed the associated federal valuation allowance previously established as management had determined it was more-likely-than-not that the entirety of the federal deferred tax asset related to the loss on such securities sales would be realized.
Liquidation of Market Street Securities Corporation (“MSSC”)
During the first quarter of 2023, the Company liquidated MSSC, a wholly owned subsidiary, and transferred all of MSSC’s assets to Eastern Bank. In connection with the liquidation and subsequent transfer of securities previously held by MSSC to Eastern Bank, the Company recognized an additional deferred income tax benefit of $23.7 million during the first quarter of 2023. This deferred income tax benefit resulted from a state tax rate change applied to the deferred tax asset related to the securities transferred to Eastern Bank.
Cambridge Merger
On September 19, 2023, the Company announced it had entered into a definitive merger agreement with Cambridge Bancorp and Cambridge Trust Company (“Cambridge”) pursuant to which the Company will acquire Cambridge through a merger, with the Company as the surviving entity, and Cambridge will merge with and into Eastern Bankshares, Inc. (the “Merger Agreement”). Under the Merger Agreement, each share of stock of Cambridge will be exchanged for 4.956 shares of the Company’s common stock. The transaction is intended to qualify as a tax-free reorganization for federal income tax purposes and provide Cambridge shareholders with a tax-free exchange for the Company’s common stock consideration they will receive in the merger. The Company anticipates issuing approximately 39.4 million shares of the Company’s common stock in the merger. Based upon the closing price of $13.41 per share of the Company’s common stock on September 18, 2023, the transaction is valued at approximately $528.1 million. The closing of the Cambridge acquisition, which is expected to occur in the first quarter of 2024, remains subject to required Eastern Bankshares, Inc. shareholder approval, Cambridge shareholder approval, regulatory approvals and satisfaction of other customary closing conditions set forth in the Merger Agreement.
Sale of Insurance Operations
On September 19, 2023, the Company announced it had entered into a definitive asset purchase agreement with Arthur J. Gallagher & Co. (“Gallagher”) under which Gallagher agreed to purchase for cash the Company’s insurance agency business. On October 31, 2023, the Company completed the sale of its insurance agency business for net cash consideration of $498.1 million, subject to customary post-closing working capital adjustments. The net cash proceeds include the gross purchase price pursuant to the agreement of $515.0 million and an estimated working capital adjustment of $4.2 million, which were reduced by transaction expenses of $17.0 million and the settlement of certain obligations of the Company primarily related to employee post-retirement liabilities that originated prior to closing of $4.1 million. In addition, the Company transferred $7.4 million in fiduciary cash to Gallagher upon closing which is not included in the amount of net cash consideration of $498.1 million. In connection with the sale, the Company recognized a gain on sale of approximately $389.3 million, which is subject to certain post-closing adjustments related to working capital and transaction expenses. Refer to Note 24, “Discontinued Operations” for additional information regarding the Company’s sale of its insurance agency business. In addition, the Company recognized indirect noninterest expenses associated with the sale of approximately $24.2 million.
In connection with the sale of its insurance agency business, the Company amended its Defined Benefit Plan and BEP (the “Plans”), as well as the ESOP, to allow for accelerated vesting for all employees of the insurance agency business and several employees of the Bank transitioning to Gallagher who are participating in the Plan. In addition, the amendments included an amendment to the vesting criteria for the BEP whereby all participants have been credited with service vesting in the same manner and vest according to the same three year cliff vesting schedule as provided under the Defined Benefit Plan. In addition, in accordance with ASC 715-20, “Compensation-Retirement Benefits - Defined Benefit Plans,” the Company recognized a curtailment gain upon completion of the sale of the insurance agency business associated with the prior service credits attributable to the employees of the insurance agency business, all of which transferred to Gallagher. As of the date of this Current Report on Form 8-K, management estimates the amount of such non-cash settlement credit to be a gain within the range of $13.0 million and $18.0 million, representing the combined effect of the amendments to the Defined Benefit Plan and BEP.
In connection with its sale of its insurance agency business, the Company remeasured the present value of the future lease payments related to each lease for which Eastern Insurance Group is the lessee which resulted in a net reduction of the lease liabilities and a corresponding net reduction of the lease ROU assets of $6.4 million which was recorded in the third quarter of 2023. The Company recorded an impairment charge of $2.0 million in the third quarter of 2023 related to leases which will be early terminated following the closing of the sale. The impairment charge was included in net (loss) income from discontinued operations.